QTLs for pre- and postweaning body weight and body composition in selected mice
17
QTLs for pre- and postweaning body weight and body composition in selected mice Gudrun A. Brockmann, 1,2 Ersin Karatayli, 1 Chris S. Haley, 3 Ulla Renne, 1 Oswald J. Rottmann, 4 Steffanie Karle 1 1 Research Institute for the Biology of Farm Animals, 18196 Dummerstorf, Germany 2 Institute for Animal Sciences, Humboldt-University Berlin, 10115 Berlin, Germany 3 Roslin Institute (Edinburgh), Roslin, Midlothian EH25 9PS, United Kingdom 4 Department of Animal Science, Technical University Muenchen-Weihenstephan, 85402 Thalhausen VTH, Germany Received: 4 June 2003 / Accepted: 7 April 2004 Abstract In an intercross between the high-body-weight- selected mouse line NMRI8 and the inbred line DBA/2, we analyzed genetic effects on growth during the suckling period and after weaning during the juvenile phase of development. QTL mapping results indicated that a switch of gene activation might occur at the age of three weeks when animals are weaned. We found QTLs for body weight with major effects at the age of two and three weeks when animals are fed by their mothers, and QTLs with highest effects after weaning when animals have to live on their own under ad libitum access to food. Specific epistatic effects on body weight at two and three weeks and epistatic interaction influenc- ing growth after weaning support this finding. QTL effects explained the greatest variance during pu- berty when animals grow fastest and become fertile. In the present study, all except one QTL effect for early body weight had dominance variance compo- nents. These might result from direct single-locus- dominant allelic expression, but also from the identified epistatic interaction between different QTLs that we have found for body weight at all ages. Beside body weight, body composition traits (muscle weight, reproductive fat weight, weight of inner or- gans) were analyzed. Sex-dimorphic QTLs were found for body weight and fat deposition. The iden- tified early-growth QTLs could be the target of epi- genetic modifications which might influence body weight at later ages. The identification of factors controlling body weight, fatness, and muscle development in mice is of basic interest for a better understanding of growth regu- lation, nutrient turnover, and energy partitioning in humans and farm animals. Although rare cases of monogenic control of these traits are known, most growth- and obesity-related phenotypes are complex traits and genetically determined by many genes. Therefore, polygenic models are used to aid dissec- tion of the molecular nature of such traits. Body weight and composition are traits that are easy to measure, thus, these traits have been used repeatedly to select mice of preferred phenotypes. As a result of selection from heterogeneous base popu- lations, several different mouse strains have been generated with extremely high or low body weights (Bunger et al. 2001). The resulting phenotypic dif- ferences between such long-term selected mouse lines are controlled by multiple genes. Depending on the genetic variability in the base population of the selection experiment, the specific selection criteri- on, and the selection procedure (e.g., population size and strength of selection), the growth-selected mouse lines differ not only phenotypically but also in their specific set of genes and gene variants con- tributing to the selection response. Thus, every cross between different mouse lines may reveal a different set of quantitative trait loci (QTLs) contributing to variation in that specific combination of genomes. The main advantages of selected mouse strains are the extreme phenotypes with respect to body weight and the enrichment of most gene variants contrib- Correspondence to: G.A. Brockmann, Unit Breeding Biology and Molecular Genetics, Institute for Animal Sciences, Humboldt- University, Invalidenstrasse 42, 10115 Berlin, Germany, E-mail: [email protected] DOI: 10.1007/s00335-004-3026-4 Volume 15, 593–609 (2004) ȑ Springer-Verlag New York, LLC 2004 593
-
Upload
independent -
Category
Documents
-
view
3 -
download
0
Transcript of QTLs for pre- and postweaning body weight and body composition in selected mice

QTLs for pre- and postweaning body weight and bodycomposition in selected mice
Gudrun A. Brockmann,1,2 Ersin Karatayli,1 Chris S. Haley,3 Ulla Renne,1
Oswald J. Rottmann,4 Steffanie Karle1
1Research Institute for the Biology of Farm Animals, 18196 Dummerstorf, Germany2Institute for Animal Sciences, Humboldt-University Berlin, 10115 Berlin, Germany3Roslin Institute (Edinburgh), Roslin, Midlothian EH25 9PS, United Kingdom4Department of Animal Science, Technical University Muenchen-Weihenstephan, 85402 Thalhausen VTH, Germany
Received: 4 June 2003 / Accepted: 7 April 2004
Abstract
In an intercross between the high-body-weight-selected mouse line NMRI8 and the inbred lineDBA/2, we analyzed genetic effects on growth duringthe suckling period and after weaning during thejuvenile phase of development. QTL mapping resultsindicated that a switch of gene activation mightoccur at the age of three weeks when animals areweaned. We found QTLs for body weight with majoreffects at the age of two and three weekswhen animals are fed by their mothers, and QTLswith highest effects after weaning when animalshave to live on their own under ad libitum access tofood. Specific epistatic effects on body weight at twoand three weeks and epistatic interaction influenc-ing growth after weaning support this finding. QTLeffects explained the greatest variance during pu-berty when animals grow fastest and become fertile.In the present study, all except one QTL effect forearly body weight had dominance variance compo-nents. These might result from direct single-locus-dominant allelic expression, but also from theidentified epistatic interaction between differentQTLs that we have found for body weight at all ages.Beside body weight, body composition traits (muscleweight, reproductive fat weight, weight of inner or-gans) were analyzed. Sex-dimorphic QTLs werefound for body weight and fat deposition. The iden-tified early-growth QTLs could be the target of epi-
genetic modifications which might influence bodyweight at later ages.
The identification of factors controlling body weight,fatness, and muscle development in mice is of basicinterest for a better understanding of growth regu-lation, nutrient turnover, and energy partitioning inhumans and farm animals. Although rare cases ofmonogenic control of these traits are known, mostgrowth- and obesity-related phenotypes are complextraits and genetically determined by many genes.Therefore, polygenic models are used to aid dissec-tion of the molecular nature of such traits.
Body weight and composition are traits that areeasy to measure, thus, these traits have been usedrepeatedly to select mice of preferred phenotypes. Asa result of selection from heterogeneous base popu-lations, several different mouse strains have beengenerated with extremely high or low body weights(Bunger et al. 2001). The resulting phenotypic dif-ferences between such long-term selected mouselines are controlled by multiple genes. Depending onthe genetic variability in the base population of theselection experiment, the specific selection criteri-on, and the selection procedure (e.g., population sizeand strength of selection), the growth-selectedmouse lines differ not only phenotypically but alsoin their specific set of genes and gene variants con-tributing to the selection response. Thus, every crossbetween different mouse lines may reveal a differentset of quantitative trait loci (QTLs) contributing tovariation in that specific combination of genomes.The main advantages of selected mouse strains arethe extreme phenotypes with respect to body weightand the enrichment of most gene variants contrib-
Correspondence to: G.A. Brockmann, Unit Breeding Biology andMolecular Genetics, Institute for Animal Sciences, Humboldt-University, Invalidenstrasse 42, 10115 Berlin, Germany, E-mail:[email protected]
DOI: 10.1007/s00335-004-3026-4 � Volume 15, 593–609 (2004) � � Springer-Verlag New York, LLC 2004 593

uting to the selection response in the population,which increases the power of QTL detection.Therefore, long-term selected mouse strains, and, inparticular, inbred lines derived from these selectionstrains, offer the possibility to identify individualgenes affecting the extreme phenotypes and to elu-cidate the complex net of gene actions contributingto high body weight.
During ontogenetic development, several differ-ent genes are transcriptionally activated or inacti-vated to enhance growth during the fetal, postnatal,juvenile, and adult phases. Concerning growth, inparticular, body weight and obesity, gene expressionmight be influenced by epigenetic mechanisms suchas a response to diet during early development(Reifsnyder et al. 2000; Jaenisch and Bird 2003), Theidentification of QTLs acting at different growthphases is a primary step in the study of the gene–environment interaction, which might influencebody weight and obesity at later ages. In the past,diverse growth-selected mouse strains as well as dif-ferent inbred strains of mice have been crossed inexperiments to map QTLs for body weight, obesity,body composition, and heat loss (reviewed byBrockmann and Bevova 2002). In most experiments,body weight and, in particular, obesity have beenanalyzed at ages between six weeks and eightmonths. So far, little has been known about earlygrowth regulation during the postnatal and juvenileage. Recently, the genetic determination of earlymurine growth at the age of 1–10 weeks has beenexamined in crosses between LG/J and SM/J mouselines which had been selected for large and smallbody weights (Cheverud et al. 1996, 2001; Vaughnet al. 1999). In this study, we present results of aQTL search for age-dependent QTLs for body weightduring the suckling period until the age of threeweeks and during the postweaning period until theage of six weeks, and for fatness and carcass compo-sition traits at the age of six weeks when animals arefertile. For linkage analyses to map QTLs, we havegenerated an intercross between the high-body-weight selected mouse strain NMRI8 (Butler andPirchner 1983) and the unselected control mousestrain DBA/2.
Materials and methods
Mouse strains. The mouse strain NMRI8 has beenselected for high body weight at the age of eightweeks from the outbred strain NMRI8 at the Tech-nical University Munich–Weihenstephan, Freising,Germany (Butler and Pirchner 1983). Selection wascarried out in a small population of eight breeding
pairs following the strategy of mass selection. In1995, the selection strain NMRI8 was transferredto the Research Institute for the Biology of FarmAnimals. Mice of the inbred strain DBA/2 werebought from Harlan Nederland (DBA/2O1aHsd,Harlan Nederland, Horst).
Pedigree structure. QTL analysis was per-formed using a pedigree of F2 intercross design. Itwas established by crossing one female of the high-growth selection strain NMRI8 to one male of thecontrast strain DBA/2. A pedigree with a total of 275F2 offspring was generated by repeated mating of theparents and subsequently of repeated mating withinsubfamilies of 7 pairs of F1 offspring. Mating wasinitially at the age of ten weeks and repeated after sixweeks.
Animal husbandry. Animals were kept in asemibarrier system. The light cycle was 12 hourslight:12 hours dark. Animals were fed ad libitumwith a breeding diet containing 12.5 MJ/kg meta-bolic energy with an average content of 22.5% crudeprotein, 5.0% crude fat, 4.5% crude fiber, 6.5% crudeash, 13.5% water, 48.0% N-free extract, vitamins,trace elements, amino acids, and minerals (Altromindiet 1314). All mice were kept in macrolon cagestype II with a 350-cm2 floor space.
Phenotypic traits. For the analysis of age-de-pendent QTL effects, the body weights (BW) weremeasured in nonfasted animals weekly between theage of two and six weeks. The examination of bodycomposition traits was performed in 42-day-old micebetween 9 and 12 a.m. After decapitation, thereproductive fat weight (RFW) was obtained bymeasuring the testicular fat pads in males and theperimetrial fat pads in females. The reproductive fatpercentage (RFP) was determined by the ratio ofthe reproductive fat weight and the body weight.Furthermore, the weights of quadriceps (musculusrectus femulus, m. vastus intermedius, m. vastuslateralis, m. vastus medialis) (MW), liver (LW),kidney (KW), and spleen (SW) were recorded. For thecharacterization of the two parental strains of thecross-bred population, 14–15 animals of NMRI8 and9–18 mice of DBA/2 were analyzed for their bodyweights at different ages and for the determinationof body composition traits. In addition, 5–7 maleF1 animals were analyzed.
Statistical tests. Animals of the mouse linesNMRI and DBA/2, F1 and F2 animals were analyzedfor basic statistics and t-tests were performed tocompare F1 and F2 animals. The linkage analysis in
594 G.A. BROCKMANN ET AL.: EARLY BODY WEIGHT QTLS
the F2 pedigree NMRI8 · DBA/2 was carried out witha set of 92 microsatellite markers (Table 1). Initially,a pedigree-specific marker map was built with theprogram CRIMAP (Lander and Green 1987). Themarker D8Mit121 was reassigned to Chr 9 at 21 cM(Brockmann et al. 2000) and marker D13Mit221 toChr 19 at 44 cM.
As the generated map was consistent with thepublished map, we used the marker distances of theconsensus map of mouse genome (Dietrich et al.1996) for the mapping QTLs in the NMRI8 · DBA/2population. This allowed the direct incorporation ofidentified QTL positions to the consensus map in themouse Genome Database (MGD) (Mouse GenomeInformatics website, The Jackson Laboratory, BarHarbor, ME; http://www.informatics.jax.org/). Thedifferences between use of the consensus map and thepedigree-specific map slightly change F-values andestimates but do not change the results in principle.
For the analysis of the pedigree, initially the in-fluences of sex, parity (5 classes), subfamily (i.e., F2
animals from the same pair of F1 parents—7 classes),and pup size (number of offspring per litter—3 class-es) were estimated for every trait via variance analy-sis (SAS 1989). All factors were found to be significantand so were included as fixed effects in the linkageanalysis. QTL analyses were performed by multipleregression (Haley et al. 1994). The procedure has beendescribed in detail previously (Brockmann et al.2000). Briefly, initially the standard interval mappingmodel was used with a single QTL on the linkagegroup. Once a single QTL on a chromosome had beenidentified, the presence of a second QTL was inves-tigated by performing a grid search at 1-cM intervals.The two-QTLs model was accepted if there was asignificant improvement over the best possible one-QTL model at the nominal p < 0.05 using a varianceratio (F) test with 3 degrees of freedom (for the addi-tional additive and dominance effect and positionestimated for the second QTL). The obtained esti-mates were revised by fitting QTLs as backgroundgenetic effects on other linkage groups, as suggestedby Zeng (1993) and Jansen (1993). Background geneticeffects were included as cofactors for all loci showingeffects at the suggestive level of significance. The sexchromosome was analyzed as a pseudoautosomalchromosome, as all markers were located in that re-gion. In additional analyses, body weight was intro-duced as a covariate in the analysis of reproductive fatweight and muscle weight to examine the depend-ence between these traits. The joint effect of allidentified QTLs for a trait (i.e., variance explained ofthe F2) was estimated as reduction of the residualmean square in the one-QTL analysis fitting all QTLsin comparison with no QTL fitted. Where a QTL was
identified, the interaction of the QTL effects withintrapedigree subfamily and sex was tested by com-paring a model with no QTL interaction with one fora QTL at the same position including the interactionand constructing a specific F test for the significanceof the interaction (Knott et al. 1998). The interactionswere accepted as significant at the nominal level ofp < 0.05.
The experiment-specific empirical thresholdvalues of the test statistics from the regressionanalysis were estimated with the permutation testproposed by Churchill and Doerge (1994). Onethousand replicates were performed with a 1-cM stepsize. Previous experience has shown that thresholdsderived by permutation analysis for different traitssuch as those analyzed here are very similar.Therefore, we have used a common set of thresholdsderived from permutation analysis of body weightfor all traits. Levels for genomewide highly signifi-cant (p = 0.01) and significant (p = 0.05) linkage wereused (Lander and Kruglyak 1995). The chromosome-wise 0.05 significance levels were taken as ge-nomewide thresholds for suggestive linkage. Weused the one-LOD drop to provide an indicativesupport interval for all genomewide suggestiveQTLs. Gene symbols were assigned to QTLs ex-ceeding the genomewide significance thresholds (p <0.05 corresponding to F = 7.7 in our experiment). Aformal test of pleiotropy was not performed.
For the examination of epistatic interactionbetween chromosomal regions, we used the generallinear model of variance analysis (SAS 1989). Allmarkers were included in the analyses, i.e., thoselocated in QTL regions as well as those outsidechromosomal regions that have an effect on growthand body composition. The model of variance anal-ysis included the effects of sex, subfamily, parity,pup size, the single effects of the QTL identified forthe specific trait at two selected loci, and the inter-action between these two specific loci. In the inter-action analysis, two degrees of freedom were used foreach marker fitted and four degrees of freedom forthe interaction between two markers. Because 4186independent multiple tests with 92 markers werecarried out [92 · (91/2)], we used p < 0.0001 as astringent threshold for our test statistics. As wewanted to elucidate any interaction that could be ofbiological relevance, we report all results at p < 0.001as relatively relaxed threshold for the acceptanceof interaction. We estimated the effect of an inter-action on the phenotypic F2 variance as reductionof residual sum of squares with and without inclu-sion of the marke*marker interaction in the regres-sion model. For the analysis of the summed neteffects of interaction, the model included all fixed
G.A. BROCKMANN ET AL.: EARLY BODY WEIGHT QTLS 595

effects and either the direct effects of all QTLs aloneor the direct effects of all QTLs and all interac-tion effects between pairs of QTLs. The resultingreduction of residual sum of squares was takenas the estimate for the summed net effect of inter-action.
Results
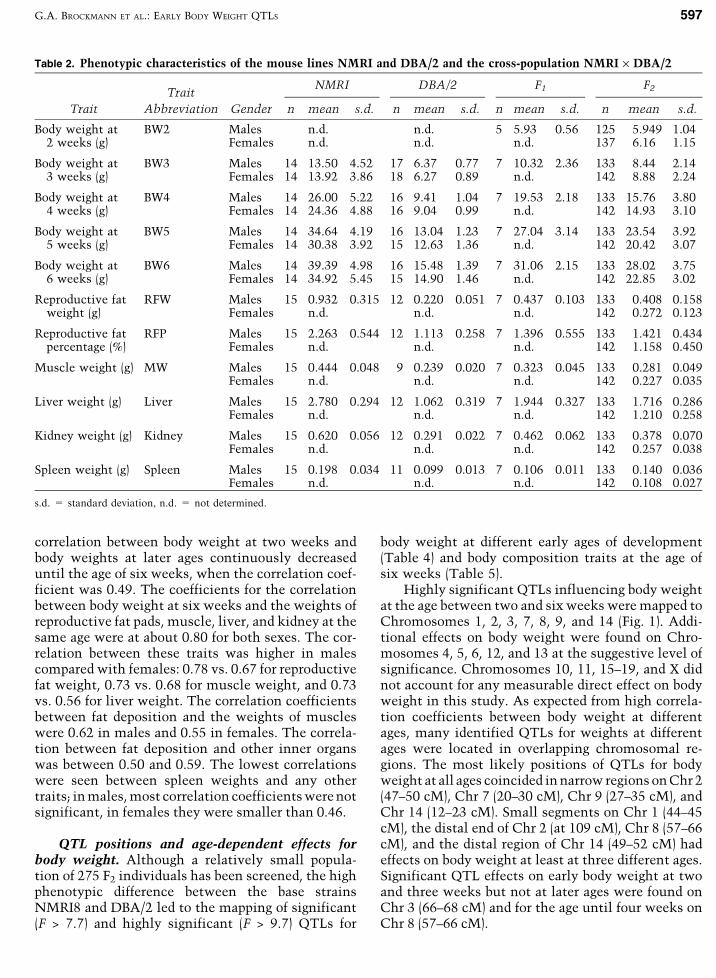
Characterization of mouse lines. The high-body-weight-selected mouse line NMRI8 was 2.5 times asheavy (39 g vs. 15 g) as the unselected control mouseline DBA/2 at the age of six weeks. The two mouselines differed in body weight by 1.5, 3.2, 5.2, and 4.8standard deviations at the ages of three, four, five,and six weeks, respectively. The reproductive fatweight was 4.2 times higher in NMRI8 mice com-pared with DBA/2 mice at the age of six weeks,corresponding to a 100% increase of the reproductivefat percentage in selected mice. Consistent with theincrease in body weight, the weights of muscle andinner organs were about twice as high in selectedcompared with control mice (Table 2).
Characterization of the cross-bred population.The phenotypic means and standard deviations forbody weight and body composition traits of the F1 andF2 populations are shown in Table 2. F1 males weresignificantly heavier than F2 males at all ages except attwo weeks. In correspondence with this, the bodyweight at six weeks and the weights of muscle, liver,and kidney were significantly bigger in F1 comparedwith F2 males, while the opposite was found for spleenweights, respectively (Table 2). The F1 males hadhigher mean body weights as intermediate relative tothe parental strains at the age between three and sixweeks, while the reproductive fat weights were re-duced in F1 males compared with the mean value be-tween the two base lines. The shifts of mean valuestoward thebody weightof theselection line NMRI andtoward the lower fat deposition in line DBA/2 suggestthe presence of heterosis in heterozygous animals.
Correlation coefficients between all measuredgrowth traits in the F2 population are given in Table 3.Within the F2 population, the correlations betweenbody weights recorded in intervals of one week weregenerally 0.80 or higher in males than in females. The
Table 1. Map of informative markers for the cross NMRI8 · DBA/2
Chr Marker cM Chr Marker cM Chr Marker cM
1 D1Mit68 9 6 D6Mit l38 0.68 12 D12Mit46 16D1Mit236 25.7 D6Mit223 19 D12Mit36 28D1Mit46 43.1 D6Mit17 30.5 D12Mit194 45DlMit49 54.5 D6Mit149 46.3 D12Mit141 55D1Mit217 63.1 7 D7Mit21 0.5 13 D13Mit55 6D1Mit33 81.6 D7Mit26 24 D13Mit202 47D1Mit16 87.2 D7Mit250 37 D13Mit130 61D1Mit36 92.3 D7Mit253 52.8 D13Mit78 75D1Mit293 109.6 D7Mit259 72.4 14 D14Mit11 3
2 D2Mit6 9 8 D8Mit4 14 D14Mit257 16.5D2Mit81 13 D8Mit249 37 D14Mit87 28.5D2Mit151 18 D8Mit45 40 D14Mit162 44D2Mit92 40 D8Mit245 72 D14Mit165 52D2Mit447 60.1 9 D9Mit64 7 15 D15Mit12 6.4D2Mit266 109 D8Mit121* 21 D15Mit184 25.4
3 D3Mit151 18.5 D9Mit 229 28 D15Mit37 48.5D3Mit73 39.7 D9Mit136 54 D15Mit193 57.9D3Mit42 58.8 10 D10Mit188 4 16 D16Mit146 16.9D3Mit59 84.1 D10Mit16 16 D16Mit5 38
4 D4Mit196 12.1 D10Mit15 32 17 D17Mit113 6.5D4Mit140 28.6 D10Mit186 40 D17Mit49 23.2D4Mit205 45.2 D10Mit73 62 D17Mit39 45.3D4Mit37 56.5 11 D11Mit71 1 D17Mit123 56.7D4Mit54 66 D11Mit19 14 18 D18MU60 16D4Mit42 81 D11Mit310 25 D18Mit152 37
5 D5Mit61 8 D11Mit5 37 19 D19Mit68 6D5Mit66 17 D11Mit120 47.51 D19Mit30 20D5Mit15 39 D11Mit326 49 D13Mit221* 44D5Mit24 60 D11Mit179 52 D19Mit71 54D5Mit95 68 D11Mit125 62 X DXMit119 28.4D5Mit221 80 D11Mit100 68 DXMit95 43
*Marker D8Mit121 was mapped to Chr 9 and D13Mit221 to Chr 19.
596 G.A. BROCKMANN ET AL.: EARLY BODY WEIGHT QTLS
correlation between body weight at two weeks andbody weights at later ages continuously decreaseduntil the age of six weeks, when the correlation coef-ficient was 0.49. The coefficients for the correlationbetween body weight at six weeks and the weights ofreproductive fat pads, muscle, liver, and kidney at thesame age were at about 0.80 for both sexes. The cor-relation between these traits was higher in malescompared with females: 0.78 vs. 0.67 for reproductivefat weight, 0.73 vs. 0.68 for muscle weight, and 0.73vs. 0.56 for liver weight. The correlation coefficientsbetween fat deposition and the weights of muscleswere 0.62 in males and 0.55 in females. The correla-tion between fat deposition and other inner organswas between 0.50 and 0.59. The lowest correlationswere seen between spleen weights and any othertraits; in males, most correlation coefficients were notsignificant, in females they were smaller than 0.46.
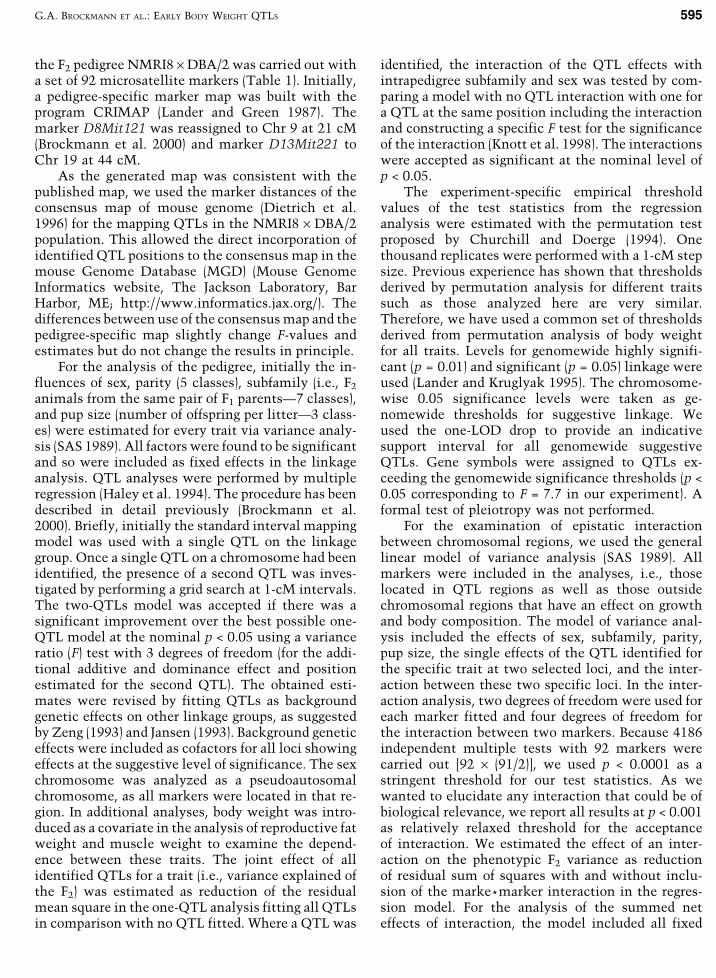
QTL positions and age-dependent effects forbody weight. Although a relatively small popula-tion of 275 F2 individuals has been screened, the highphenotypic difference between the base strainsNMRI8 and DBA/2 led to the mapping of significant(F > 7.7) and highly significant (F > 9.7) QTLs for
body weight at different early ages of development(Table 4) and body composition traits at the age ofsix weeks (Table 5).
Highly significant QTLs influencing body weightat the age between two and six weeks were mapped toChromosomes 1, 2, 3, 7, 8, 9, and 14 (Fig. 1). Addi-tional effects on body weight were found on Chro-mosomes 4, 5, 6, 12, and 13 at the suggestive level ofsignificance. Chromosomes 10, 11, 15–19, and X didnot account for any measurable direct effect on bodyweight in this study. As expected from high correla-tion coefficients between body weight at differentages, many identified QTLs for weights at differentages were located in overlapping chromosomal re-gions. The most likely positions of QTLs for bodyweight at all ages coincided in narrow regions on Chr 2(47–50 cM), Chr 7 (20–30 cM), Chr 9 (27–35 cM), andChr 14 (12–23 cM). Small segments on Chr 1 (44–45cM), the distal end of Chr 2 (at 109 cM), Chr 8 (57–66cM), and the distal region of Chr 14 (49–52 cM) hadeffects on body weight at least at three different ages.Significant QTL effects on early body weight at twoand three weeks but not at later ages were found onChr 3 (66–68 cM) and for the age until four weeks onChr 8 (57–66 cM).
Table 2. Phenotypic characteristics of the mouse lines NMRI and DBA/2 and the cross-population NMRI · DBA/2
TraitNMRI DBA/2 F1 F2
Trait Abbreviation Gender n mean s.d. n mean s.d. n mean s.d. n mean s.d.
Body weight at BW2 Males n.d. n.d. 5 5.93 0.56 125 5.949 1.042 weeks (g) Females n.d. n.d. n.d. 137 6.16 1.15
Body weight at BW3 Males 14 13.50 4.52 17 6.37 0.77 7 10.32 2.36 133 8.44 2.143 weeks (g) Females 14 13.92 3.86 18 6.27 0.89 n.d. 142 8.88 2.24
Body weight at BW4 Males 14 26.00 5.22 16 9.41 1.04 7 19.53 2.18 133 15.76 3.804 weeks (g) Females 14 24.36 4.88 16 9.04 0.99 n.d. 142 14.93 3.10
Body weight at BW5 Males 14 34.64 4.19 16 13.04 1.23 7 27.04 3.14 133 23.54 3.925 weeks (g) Females 14 30.38 3.92 15 12.63 1.36 n.d. 142 20.42 3.07
Body weight at BW6 Males 14 39.39 4.98 16 15.48 1.39 7 31.06 2.15 133 28.02 3.756 weeks (g) Females 14 34.92 5.45 15 14.90 1.46 n.d. 142 22.85 3.02
Reproductive fat RFW Males 15 0.932 0.315 12 0.220 0.051 7 0.437 0.103 133 0.408 0.158weight (g) Females n.d. n.d. n.d. 142 0.272 0.123
Reproductive fat RFP Males 15 2.263 0.544 12 1.113 0.258 7 1.396 0.555 133 1.421 0.434percentage (%) Females n.d. n.d. n.d. 142 1.158 0.450
Muscle weight (g) MW Males 15 0.444 0.048 9 0.239 0.020 7 0.323 0.045 133 0.281 0.049Females n.d. n.d. n.d. 142 0.227 0.035
Liver weight (g) Liver Males 15 2.780 0.294 12 1.062 0.319 7 1.944 0.327 133 1.716 0.286Females n.d. n.d. n.d. 142 1.210 0.258
Kidney weight (g) Kidney Males 15 0.620 0.056 12 0.291 0.022 7 0.462 0.062 133 0.378 0.070Females n.d. n.d. n.d. 142 0.257 0.038
Spleen weight (g) Spleen Males 15 0.198 0.034 11 0.099 0.013 7 0.106 0.011 133 0.140 0.036Females n.d. n.d. n.d. 142 0.108 0.027
s.d. = standard deviation, n.d. = not determined.
G.A. BROCKMANN ET AL.: EARLY BODY WEIGHT QTLS 597

The effects of most QTLs had additive anddominance components. Only the QTL region onChr 1 at 44–45 cM and the QTLs on Chr 7 had pre-dominantly additive genetic effects, while the QTLeffects on Chr 2 were predominantly dominant.Positive additive and dominance effects reflect alarger size for the NMRI allele. Most body weightQTLs had positive effects of the allele originatingfrom the high-body-weight-selected mouse lineNMRI8 and negative effects of the DBA/2 allele.However, the NMRI QTL alleles in the distal regionof Chr 2 and on Chr 5 had positive additive andnegative dominance effects, and the effects of theNMRI QTL alleles on Chromosomes 3 and 14 hadnegative additive and positive dominance compo-nents.
The magnitudes of the QTL effects changed withage. The strongest effects on body weight wereidentified on Chromosomes 14, 7, and 1, where QTLeffects accounted for up to 16.21% of the corre-sponding phenotypic F2 variance. The search formultiple QTLs in a linkage group provided signifi-cant evidence (p < 0.05) for two different regions in-fluencing body weight on Chr 14. An 11-cM region
with most likely QTL positions between 12 and 23cM from the centromere had significant influenceon body weight at all recorded ages, and anotherchromosomal interval between 49 and 52 cM alsoinfluenced body weight at all ages, except threeweeks, when the test statistic for two QTLs failedthe significance threshold of p < 0.05. The regionbetween 12 and 23 cM harbored QTLs for bodyweight with highest effects at three (Bwnd3wk2),four (Bwnd4wk7), and five weeks (Bwnd5wk6) of ageaccounting for 16.21%, 13.23%, and 13.85% of thephenotypic variance in the F2 population, respec-tively. The genetic effect of the NMRI8 allele in thischromosomal region was highly dominant withnegative additive effects on body weight in all agegroups. The effects of the QTLs in the distal QTLregion of Chromosome 14 on growth were dominantand positive for the NMRI8 allele.
Evidence for a highly significant additive effecton body weight was found on Chr 7. The narrowchromosomal region between 20 and 30 cM harboredmost likely QTL positions for body weight at all ageswith highest effects on body weight at four and fiveweeks, accounting for 11.02% and 13.32% of the
Table 3. Pearson’s correlation coefficients for all traits analyzed in the F2 population
BW2 BW3 BW4 BW5 BW6 RFW RFP MW Liver Kidney Spleen
BW2 Males 1 0.8323 0.7802 0.6670 0.4944 0.4988 0.4671 0.5387 0.2427 0.3055 n.s.Females 1
BW3 Males 0.8053 1 0.7998 0.6657 0.4753 0.5019 0.4735 0.5661 0.2204*** 0.3007 n.sFemales 0.8514 1
BW4 Males 0.8200 0.8228 1 0.8699 0.6744 0.6518 0.5669 0.7488 0.4483 0.5538 0.1506*Females 0.7974 0.8359 1
BW5 Males 0.7933 0.7815 0.9317 1 0.8772 0.7926 0.6616 0.8564 0.6897 0.7841 0.3195Females 0.7668 0.8054 0.8718 1
BW6 Males 0.7114 0.7030 0.8151 0.8896 1 0.7936 0.5918 0.8018 0.7975 0.8578 0.5282Females 0.6871 0.6782 0.6986 0.8351 1
RFW Males 0.6071 0.6165 0.7138 0.7763 0.7854 1 0.9465 0.6820 0.6570 0.6587 0.3332Females 0.6073 0.6215 0.6132 0.7038 0.6720 1
RFP Males 0.5080 0.5199 0.6095 0.6721 0.6072 0.9589 1 0.5507 0.5093 0.4782 0.1972***Females 0.5240 0.5358 0.5170 0.5843 0.5000 0.9683 1
MW Males 0.7260 0.7270 0.8590 0.8640 0.7337 0.6188 0.5368 1 0.6530 0.7757 0.3441Females 0.6856 0.7834 0.7526 0.7615 0.6803 0.5486 0.4581 1
Liver Males 0.5052 0.4346 0.5874 0.6783 0.7353 0.5862 0.4648 0.5438 1 0.8111 0.4662Females 0.3428 0.3767 0.4160 0.5378 0.5624 0.5021 0.4437 0.3725 1
Kidney Males 0.6467 0.6018 0.7388 0.8191 0.8066 0.5654 0.4236 0.7099 0.6757 1 0.4698Females 0.5090 0.5719 0.6492 0.7244 0.7051 0.5642 0.4633 0.5991 0.5823 1
Spleen Males n.s. n.s. n.s. n.s. 0.3051*** n.s. n.s. n.s. 0.1855* n.s. 1Females 0.1996* n.s. 0.1816* 0.2701*** 0.4403 0.2391** n.s. 0.2792*** 0.3198 0.4603 1
Trait abbreviations are given in Table 2. Body weights were measured at the ages of three, four, five, and six weeks. All other traits were recorded atthe age of six weeks. Above the diagonal, Pearson’s correlation coefficients are given for all animals independent of sex; below the diagonal,Pearson’s correlation coefficients are given for males and females separately.Significance levels are *p < 0.05, **p < 0.01, ***p < 0.001, no asterisk p < 0.0001, n.s. = not significant at p > 0.05.
598 G.A. BROCKMANN ET AL.: EARLY BODY WEIGHT QTLS

Table 4. Most likely positions and effects of QTLs for body weight at different ages
QTLpositiona 5% F-ratio F-ratio
c
Additiveeffect
Dominanceeffect
% F2
Chr (cM) Trait thresholdsb 1 vs. 0 QTL Sexd a s.e. d s.e. variancee Symbolf
1 44 (14;75) BW5(g) 5.4 12.2 1.18 0.24 0.028 0.34 8.90 Bwnd5wk144 (33;53) BW4(g) 18.3 1.36 0.23 )0.072 0.32 12.90 Bwnd4wk145 (18;77) BW3(g) 6.3 0.53 0.14 0.03 0.20 9.26
m 1.03 0.21 )0.24 0.31f 0.07 0.21 0.21 0.30
72 (56;89) BW6(g) 11.6 1.15 0.27 )1.14 0.42 8.66 Bwnd6wk12 47 (29;67) BW3(g) 4.7 6.8 0.08 0.17 0.93 0.26 5.19
47 (31;57) BW6(g) 12.7 0.92 0.28 1.59 0.43 9.38 Bwnd6wk248 (29;105) BW4(g) 9.2 0.39 0.27 1.57 0.40 6.90 Bwnd4wk250 (31;95) BW2(g) 8.3 )0.12 0.09 0.52 0.13 6.69 Bwnd2wk150 (32;105) BW5(g) 9.9 0.51 0.29 1.68 0.42 7.37 Bwnd5wk2109 (83;114) BW4(g) 7.0 0.43 0.22 )1.04 0.32 5.38109 (84;114) BW5(g) 8.1 0.67 0.23 )0.99 0.33 6.12 Bwnd5wk3109 (88;114) BW2(g) 8.4 0.06 0.07 )0.43 0.10 6.78 Bwnd2wk2
3 66 (26;95) BW3(g) 4.9 5.4 )0.33 0.17 0.73 0.28 4.1768 (48;79) BW2(g) 10.1 )0.23 0.087 0.56 0.16 8.00 Bwnd2wk3
4 63 (0;84) BW6(g) 4.7 5.2 0.81 0.27 0.43 0.39 4.085 68 (63;98) BW6(g) 4.9 7.0 0.69 0.26 )0.90 0.36 5.366 24 (0;73) BW2(g) 4.6 5.6 0.26 0.08 0.13 0.11 8.84
m 0.45 0.12 )0.11 0.17f 0.07 0.11 0.38 0.16
29 (0;43) BW6(g) 5.0 0.78 0.26 0.25 0.25 3.897 20 (1;34) BW4(g) 4.7 15.3 1.29 0.23 0.01 0.35 11.02 Bwnd4wk3
26 (0;41) BW2(g) 11.7 0.38 0.08 0.06 0.12 9.19 Bwnd2wk427 (0;48) BW3(g) 7.6 0.49 0.15 0.50 0.24 5.7429 (19;39) BW5(g) 19.1 1.56 0.26 0.33 0.40 13.32 Bwnd5wk430 (0;58) BW6(g) 9.4 1.05 0.27 0.72 0.41 7.13 Bwnd6wk3
8 57 (0;84) BW2(g) 4.9 8.8 0.35 0.09 0.29 0.15 7.04 Bwnd2wk566 (0;84) BW4 (g) 7.8 0.70 0.23 0.90 0.33 5.96 Bwnd4wk466 (44;84) BW3(g) 10.0 0.55 0.15 0.61 0.21 7.42 Bwnd3wk1
9 27 (8;41) BW2(g) 4.1 8.9 0.21 0.08 0.36 0.11 7.10 Bwnd2wk628 (15;40) BW6(g) 10.1 0.86 0.25 0.97 0.34 7.60 Bwnd6wk430 (17;42) BW5(g) 11.0 0.72 0.25 1.36 0.36 8.11 Bwnd5wk533 (18;43) BW4(g) 13.1 0.74 0.25 1.60 0.38 9.56 Bwnd4wk535 (13;84) BW3(g) 6.8 0.46 0.16 0.63 0.26 5.19
12 16 (0;51) BW4(g) 4.4 4.6 0.46 0.21 0.62 0.31 3.5913 52 (18;75) BW3(g) 4.5 5.2 )0.37 0.16 0.45 0.24 4.03
75 (52;75) BW6(g) 5.3 0.55 0.24 0.87 0.35 4.1314 12 (7;26) BW4(g) 4.6 18.8 )0.99 0.28 1.96 0.40 13.23 Bwnd4wk6
13 (8;25) BW5(g) 20.0 )1.17 0.29 1.97 0.41 13.85 Bwnd5wk614 (4;34) BW2(g) 6.9 )0.12 0.09 0.42 0.12 5.6015 (6;28) BW6(g) 8.7 )0.53 0.29 1.45 0.39 6.64 Bwnd6wk523 (16;34) BW3(g) 24.1 )0.54 0.15 1.43 0.23 16.21 Bwnd3wk249 (23;70) BW4(g) 9.1 )0.21 0.26 1.45 0.34 6.87 Bwnd4wk750 (25;70) BW5(g) 7.7 0.14 0.27 1.40 0.36 5.82 Bwnd5wk752 (28;70) BW6(g) 5.7 0.39 0.27 0.96 0.35 4.0052 (44;70) BW2(g) 7.7 )0.16 0.08 0.37 0.11 6.18 Bwnd2wk7
Trait abbreviations are given in Table 2.aThe most likely locations are given as distance from the centromere. One)LOD drop confidence intervals are given in parentheses.bThe chromosomewise 1%, 5%, and 10% F)value thresholds were estimated via permutation analyses. The genomewide 1% and 5% F)valuethresholds are 9.7 and 7.7, respectively. Highly significant F)values are marked as bold and significant F)values are bold and italic.cHighly significant F)values are labeled bold. At loci where QTL effects were sex specific (p < 0.05), below the joint estimate over both sexesestimates are given separately for males and females.dm = male, f = female.eThe QTL effects are given as reduction of the residual sum of squares fitting 1 vs. 0 QTLs.fQTL symbols are given for significant and highly significant QTLs (Mouse Genome Database, http://www.ncbi.nlm.nih.gov/LocusLink/).
G.A. BROCKMANN ET AL.: EARLY BODY WEIGHT QTLS 599
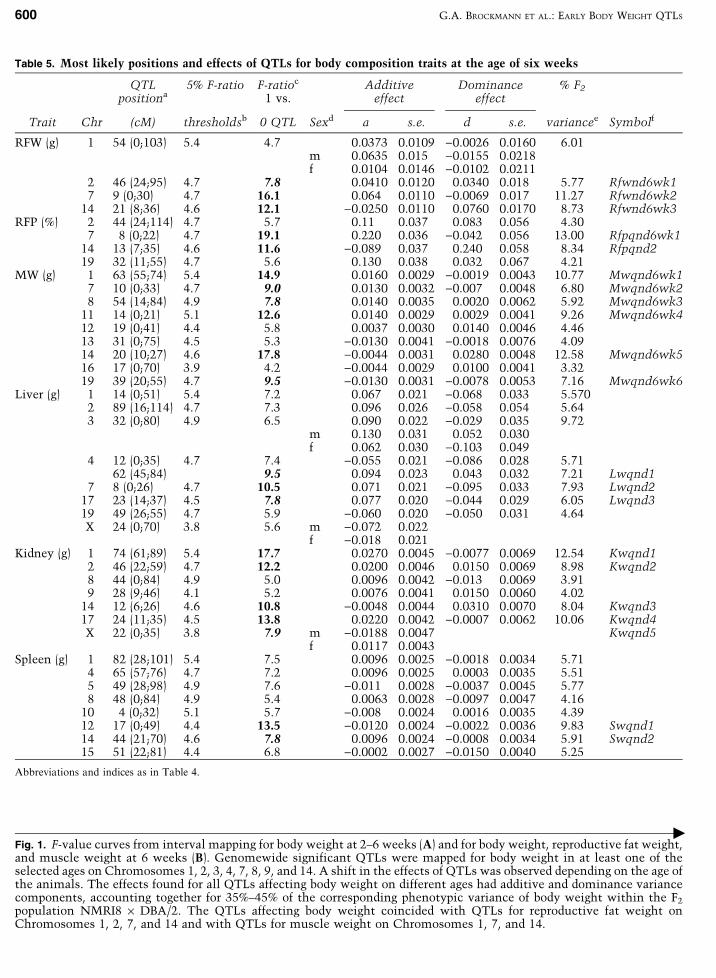
Table 5. Most likely positions and effects of QTLs for body composition traits at the age of six weeks
QTLpositiona
5% F-ratio F-ratioc
1 vs.Additive
effectDominance
effect% F2
Trait Chr (cM) thresholdsb 0 QTL Sexd a s.e. d s.e. variancee Symbolf
RFW (g) 1 54 (0;103) 5.4 4.7 0.0373 0.0109 )0.0026 0.0160 6.01m 0.0635 0.015 )0.0155 0.0218f 0.0104 0.0146 )0.0102 0.0211
2 46 (24;95) 4.7 7.8 0.0410 0.0120 0.0340 0.018 5.77 Rfwnd6wk17 9 (0;30) 4.7 16.1 0.064 0.0110 )0.0069 0.017 11.27 Rfwnd6wk2
14 21 (8;36) 4.6 12.1 )0.0250 0.0110 0.0760 0.0170 8.73 Rfwnd6wk3RFP (%) 2 44 (24;114) 4.7 5.7 0.11 0.037 0.083 0.056 4.30
7 8 (0;22) 4.7 19.1 0.220 0.036 )0.042 0.056 13.00 Rfpqnd6wk114 13 (7;35) 4.6 11.6 )0.089 0.037 0.240 0.058 8.34 Rfpqnd219 32 (11;55) 4.7 5.6 0.130 0.038 0.032 0.067 4.21
MW (g) 1 63 (55;74) 5.4 14.9 0.0160 0.0029 )0.0019 0.0043 10.77 Mwqnd6wk17 10 (0;33) 4.7 9.0 0.0130 0.0032 )0.007 0.0048 6.80 Mwqnd6wk28 54 (14;84) 4.9 7.8 0.0140 0.0035 0.0020 0.0062 5.92 Mwqnd6wk3
11 14 (0;21) 5.1 12.6 0.0140 0.0029 0.0029 0.0041 9.26 Mwqnd6wk412 19 (0;41) 4.4 5.8 0.0037 0.0030 0.0140 0.0046 4.4613 31 (0;75) 4.5 5.3 )0.0130 0.0041 )0.0018 0.0076 4.0914 20 (10;27) 4.6 17.8 )0.0044 0.0031 0.0280 0.0048 12.58 Mwqnd6wk516 17 (0;70) 3.9 4.2 )0.0044 0.0029 0.0100 0.0041 3.3219 39 (20;55) 4.7 9.5 )0.0130 0.0031 )0.0078 0.0053 7.16 Mwqnd6wk6
Liver (g) 1 14 (0;51) 5.4 7.2 0.067 0.021 )0.068 0.033 5.5702 89 (16;114) 4.7 7.3 0.096 0.026 )0.058 0.054 5.643 32 (0;80) 4.9 6.5 0.090 0.022 )0.029 0.035 9.72
m 0.130 0.031 0.052 0.030f 0.062 0.030 )0.103 0.049
4 12 (0;35) 4.7 7.4 )0.055 0.021 )0.086 0.028 5.7162 (45;84) 9.5 0.094 0.023 0.043 0.032 7.21 Lwqnd1
7 8 (0;26) 4.7 10.5 0.071 0.021 )0.095 0.033 7.93 Lwqnd217 23 (14;37) 4.5 7.8 0.077 0.020 )0.044 0.029 6.05 Lwqnd319 49 (26;55) 4.7 5.9 )0.060 0.020 )0.050 0.031 4.64X 24 (0;70) 3.8 5.6 m )0.072 0.022
f )0.018 0.021Kidney (g) 1 74 (61;89) 5.4 17.7 0.0270 0.0045 )0.0077 0.0069 12.54 Kwqnd1
2 46 (22;59) 4.7 12.2 0.0200 0.0046 0.0150 0.0069 8.98 Kwqnd28 44 (0;84) 4.9 5.0 0.0096 0.0042 )0.013 0.0069 3.919 28 (9;46) 4.1 5.2 0.0076 0.0041 0.0150 0.0060 4.02
14 12 (6;26) 4.6 10.8 )0.0048 0.0044 0.0310 0.0070 8.04 Kwqnd317 24 (11;35) 4.5 13.8 0.0220 0.0042 )0.0007 0.0062 10.06 Kwqnd4X 22 (0;35) 3.8 7.9 m )0.0188 0.0047 Kwqnd5
f 0.0117 0.0043Spleen (g) 1 82 (28;101) 5.4 7.5 0.0096 0.0025 )0.0018 0.0034 5.71
4 65 (57;76) 4.7 7.2 0.0096 0.0025 0.0003 0.0035 5.515 49 (28;98) 4.9 7.6 )0.011 0.0028 )0.0037 0.0045 5.778 48 (0;84) 4.9 5.4 0.0063 0.0028 )0.0097 0.0047 4.16
10 4 (0;32) 5.1 5.7 )0.008 0.0024 0.0016 0.0035 4.3912 17 (0;49) 4.4 13.5 )0.0120 0.0024 )0.0022 0.0036 9.83 Swqnd114 44 (21;70) 4.6 7.8 0.0096 0.0024 )0.0008 0.0034 5.91 Swqnd215 51 (22;81) 4.4 6.8 )0.0002 0.0027 )0.0150 0.0040 5.25
Abbreviations and indices as in Table 4.
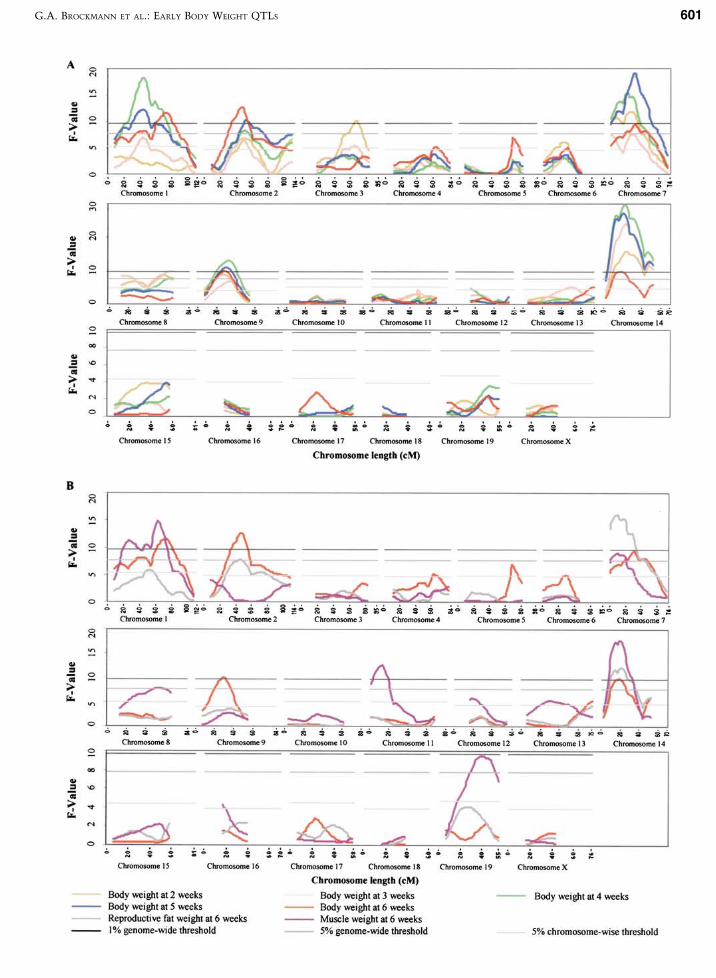
Fig. 1. F-value curves from interval mapping for body weight at 2–6 weeks (A) and for body weight, reproductive fat weight,and muscle weight at 6 weeks (B). Genomewide significant QTLs were mapped for body weight in at least one of theselected ages on Chromosomes 1, 2, 3, 4, 7, 8, 9, and 14. A shift in the effects of QTLs was observed depending on the age ofthe animals. The effects found for all QTLs affecting body weight on different ages had additive and dominance variancecomponents, accounting together for 35%–45% of the corresponding phenotypic variance of body weight within the F2
population NMRI8 · DBA/2. The QTLs affecting body weight coincided with QTLs for reproductive fat weight onChromosomes 1, 2, 7, and 14 and with QTLs for muscle weight on Chromosomes 1, 7, and 14.
c
600 G.A. BROCKMANN ET AL.: EARLY BODY WEIGHT QTLS
G.A. BROCKMANN ET AL.: EARLY BODY WEIGHT QTLS 601

Tab
le6.
Th
ein
flu
ence
of
inte
ract
ion
bet
wee
ndif
fere
nt
chro
moso
mal
par
tson
body
wei
ght,
fat
dep
osi
tion
,an
dm
usc
lew
eigh
t
D2Mit6
D2Mit151
D3Mit73
D4Mit205
D4Mit37
D4Mit54
D5Mit15
D8Mit45
D9Mit64
D10Mit16
D12Mit36
D12Mit194
D13Mit202
D15Mit193
D18Mit60
D19Mit71
Mar
ker
cM
918
39.7
45.2
56.5
66
39
40
716
28
45
47
57.9
16
54
QT
Ls
——
BW
3,
Liv
er
BW
6,
Liv
er
BW
6,
Liv
er,
Sple
en
BW
6,
Liv
er,
Sple
en
—B
W2,
BW
3,
BW
4,
MW
,K
idn
ey,
Sple
en
BW
2,
Kid
ney
Sple
en
BW
4,
MW
,Sple
en
BW
4,
Sple
en
BW
3,
MW
Sple
en
—M
W,
RFP
,L
iver
D1M
it49
54.5
BW
3,
BW
4,
BW
5,
RFW
,M
W
BW
4(7
.1)
BW
5(7
.7)
Bw
6(6
.0)
RFW
(5.6
)R
FP
(6.1
)D
1M
it217
63.1
BW
3,
BW
5,
BW
6,
MW
,R
FW
,Sple
en
,K
idn
ey
MW
(75)
D5M
it24
60
BW
6,
Sple
en
RFW
(7.8
)
RFP
(8.1
)D
6M
it17
30.5
BW
2,
BW
6B
W3
(7.5
)
BW
5(6
.4)
D7M
it253
52.8
BW
6M
W(7
.8)
BW
4(6
.1)
BW
6(6
.0)
RFW
(7.4
)R
FP
(5.9
)D
11M
it71
1M
WB
W4
(5.4
)B
W5
(5.9
)B
W6
(5.9
)R
FW
(7.6
)R
FP
(5.7
)D
11M
it310
25
MW
BW
4(7
.5)
BW
2(8
.9)
BW
5(9
.0)
BW
3(5
.6)
BW
6(5
.6)
MW
(7.0
)
602 G.A. BROCKMANN ET AL.: EARLY BODY WEIGHT QTLS
D11M
it15
37
—B
W2
(8.1
)D
11M
it326
49
—B
W2
(7.3
)R
FW
(7.3
)B
W3
(7.9
)R
FP
(8.1
)B
W4
(6.1
)B
W5
(5.4
)R
FW
(7.2
)R
FP
(7.3
)D
11M
it25
62
—B
W2
(7.7
)B
W3
(8.5
)B
W4
(5.3
)B
W5
(5.5
)B
W6
(5.8
)D
11M
it100
68
—B
W2
(6.6
)B
W3
(5.6
)B
W4
(9.6
)B
W5
(8.3
)B
W6
(7.1
)R
FW
(5.6
)M
W(7
.0)
D14M
it11
3R
FW
,R
FP
RFW
(6.7
)
RFP
(7.5
)D
14M
it257
16.5
BW
2,
BW
3,
BW
4,
BW
5,
BW
6,
MW
,R
FW
,R
FP
,K
idn
ey
RFP
(8.1
)R
FW
(7.2
)B
W4
(7.8
)B
W5
(6.7
)M
W(6
.1)
D16M
it146
16.9
MW
BW
2(6
.0)
BW
2(8
.8)
BW
5(6
.4)
MW
(5.5
)B
W6
(8.2
)M
W(6
.7)
D17M
it49
23.2
Liv
er,
Kid
ney
BW
4(6
.6)
BW
5(7
.7)
MW
(7.9
)
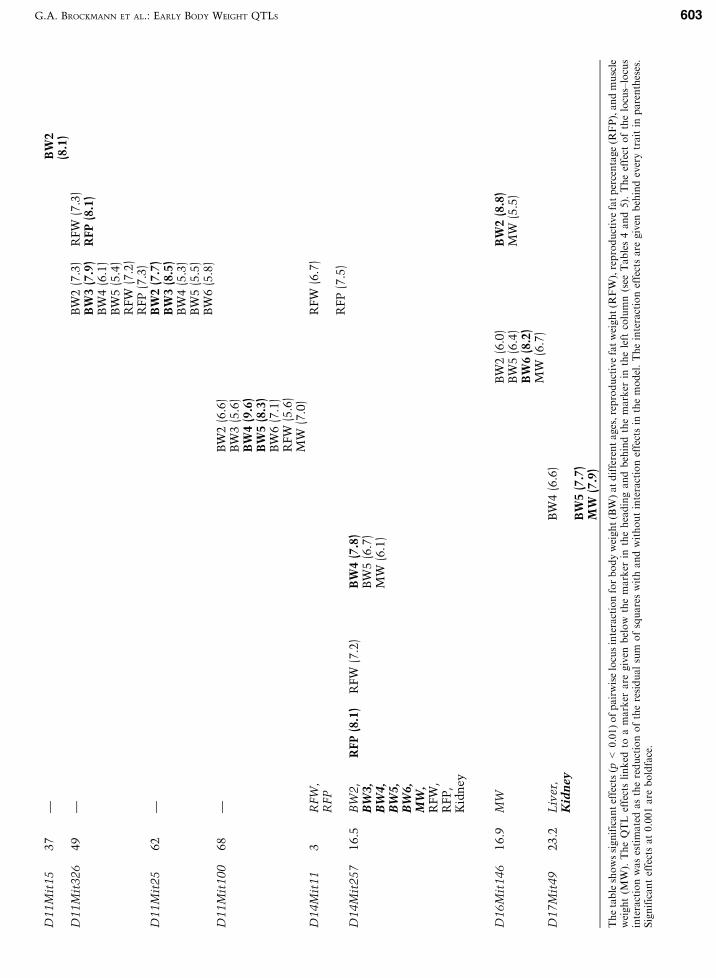
Thetableshowssignificanteffects(p<0.01)ofpairwiselocusinteractionforbodyweight(BW)atdifferentages,reproductivefatweight(RFW),reproductivefatpercentage(RFP),andmuscle
weight(MW).TheQTLeffectslinked
toamarkeraregiven
belowthemarkerintheheadingandbehindthemarkerintheleftcolumn(seeTables4and5).Theeffectofthelocus–locus
interactionwasestimatedasthereductionoftheresidualsumofsquareswithandwithoutinteractioneffectsinthemodel.Theinteractioneffectsaregivenbehindeverytraitinparentheses.
Significanteffectsat0.001areboldface.
G.A. BROCKMANN ET AL.: EARLY BODY WEIGHT QTLS 603

phenotypic F2 variance, respectively. The confidenceintervals for the detected QTLs and the F-valuecurves across the chromosome pertaining to bodyweight at different ages showed a shift toward thedistal chromosomal end which might be a hint ofdifferent genes being active at different ages. How-ever, the statistical test for two QTLs on the chro-mosome was not significant.
Other highly significant additive effects on bodyweight were found on Chr 1 at 44 cM accounting for12.90% and 8.90% of the corresponding phenotypicF2 variance at the age of four and five weeks, re-spectively. The same chromosomal region alsohad influence on body weight at three weeks (peakF-value at 45 cM). A QTL for body weight at sixweeks was mapped to a second chromosomal regionwith the most likely position at 72 cM. This QTLhad positive additive and negative dominance com-ponents. Although the shapes of the F-value curvesfor body weight at four, five, and six weeks of age
across the chromosome might hint that there aretwo or more QTLs on Chr 1, the statistical test formultiple QTLs in a linkage group did not exceed thesignificance threshold of 0.05.
In the middle of Chr 1 at the most likely positionof 45 cM, a sex-dimorphic QTL has been found (p <0.05) that influences early body weight at threeweeks. The sex-influenced QTL effect was additivein males (1.03 ± 0.21 g). The gene(s) underlying theQTL effect did not seem to be expressed in femalesas no significant effect has been found in this gender.Another sex-specific QTL effect was found on Chr 6at 24 cM for body weight at two weeks. The NMRI8allele effect was additive and increasing in males(0.45 ± 0.12 g) and dominant and increasing infemales (0.38 ± 0.16 g).
Beside Chr 14, significant evidence for two QTLson a chromosome was also found on Chr 2 (p < 0.05).The two regions between 47 and 50 cM and the endof the Chr 2 at 109 cM had opposite effects on body
Fig. 2. Exemplary profiles of epistatic interactions. D represents the DBA/2 allele, N the NMRI allele. Symbols: Bodyweight at 2 weeks (¤), 4 weeks (m), 6 weeks (*), muscle weight (d), reproductive fat weight (j) and reproductive fatpercentage (u). Epistatic interaction between two QTLs for body weight with effect on reproductive fat weight andpercentage (A), epistatic interaction between QTLs affecting organ weights and early growth having effect on muscleweight (B). Interaction between two loci having no direct effect on body weight or composition, but affecting body weightsat all ages (C) as well as fat and muscle weights at 6 weeks (D).
604 G.A. BROCKMANN ET AL.: EARLY BODY WEIGHT QTLS

weight. The NMRI8 allele of the QTLs in the middleregion of the chromosome had positive dominanceeffect, while the QTLs at the end of the chromosomehad negative dominance effect. The effects on bodyweight in the middle of the chromosome were biggerthan in the distal chromosomal region at all ages;therefore, the net effect of the whole NMRI8 chro-mosome was positive.
The summed net effect of all QTLs affectingbody weight at different ages accounted for 35.7%–45.2% of the phenotypic F2 variance. The highestsummed net effects were estimated for body weightat the age of four weeks.
QTL positions and effects for reproductive fatweight, muscle weight, and weights of inner organsat the age of six weeks. Fat tissues, muscle, andinner organs contributed to body weight and werehighly correlated. Therefore, we expected chromo-somal loci that have pleiotropic effects on bodyweight and body composition traits or cosegregationof loci to contribute to body weight variation andvariation in muscle weight, reproductive fat weight,and the weights of inner organs.
QTLs affecting reproductive fat weight weremapped to Chr 1 at 54 cM, Chr 2 at 46 cM (Rfwnd6wk1), Chr 7 at 9 cM (Rfwnd6wk2), and Chr 14 at21 cM (Rfwnd6wk3). All these chromosomal re-gions coincided with QTLs that also had effect onbody weight. The genetic effects of the QTLs onChromosomes 7 and 14 on reproductive fat weightwere highly significant accounting for 11.27% and8.73% of the corresponding F2 variance, respective-ly. They were concordant with the increasing ef-fects of the NMRI8 allele on body weight: additivefor Chr 7 and dominant with negative additivecomponents for Chr 14. The suggestive reproduc-tive fat weight QTL on Chr 1 at the most likelyposition of 54 cM had significantly different effectsin males and females (p < 0.05). The effects on re-productive fat weight were concordant with the sex-specific effects of the body weight QTL which waslocated an estimated 9 cM away. In males, the QTLeffect was additive (0.0635 ± 0.015 g), while the ef-fect was not significant in females. The summedeffect of all identified QTLs responsible for fat de-position in reproductive fat pads was 25.3% of thevariance in the F2 population. The QTLs for repro-ductive fat weight on Chromosomes 2, 7, and 14also had an effect on reproductive fat percentage.Another suggestive QTL for reproductive fat per-centage was found on Chr 19. The summed neteffect of the QTLs affecting reproductive fat per-centage accounted for 24.9% of the phenotypic F2
variance.
Significant QTLs for muscle weight were identi-fied on Chromosomes 1, 7, 8, 11, 14, and 19. Thebiggest effects on muscle weight were found on Chr 1at 63 cM and Chr 14 at 20 cM accounting for 10.77%and 12.58% of the phenotypic F2 variance, respec-tively. Suggestive muscle weight QTLs were foundon Chromosomes 12, 13, and 16. The QTLs affectingmuscle weight on Chr 1 (Mwqnd6wk1 at 63 cM), theproximal part of Chr 7 (Mwqnd6wk2 at 10 cM), Chr 8(Mwqnd6wk3 at 54 cM), Chr 12 (19 cM) and Chr 14(Mwqnd6wk5 at 20 cM) coincided with QTLs formwqne6wks body weight. The muscle weight QTLson Chromosomes 11 (Mwqnd6wk4 at 14 cM), 13, 16,and 19 (Mwqnd6wk6 at 39 cM) obviously contribut-ed specifically to the development of the quadricepswithout having general effect on body weight untilsix weeks. The inclusion of body weight at six weeksas covariate in the linkage analysis did not influencethe muscle weight QTL effects and locations onthese chromosomes. Most QTL effects on muscleweight were additive. The QTLs on Chromosomes12, 14, and 16 had dominance effects on muscleweight. The dominance effect on muscle weight ofMwqnd6wk5 on Chr 14 was consistent with thedominance effect of the same chromosomal region onbody weight. Together, genomewide identified QTLsfor muscle weight accounted for 40.0% of the phen-otypic F2 variance.
Significant QTLs influencing the growth of innerorgans were identified for liver weights on Chro-mosomes 4, 7, and 17, for kidney weights on Chro-mosomes 1, 2, 14, 17, and X, and for spleen weightson Chr 12. QTLs for the weights of inner organscoincided with QTLs for body weight on manychromosomes. The inclusion of body weight ascovariate in the linkage analysis showed that theQTLs for organ weights contributed to the effects ofbody weight QTLs. Organ-specific growth effectswere found on Chr 3 at 28 cM and on Chr 4 at 12 cMfor liver weight, on Chr 17 at 23 and an 24 cM and onChr X at 24 and 22 cM for both liver and kidneyweights, respectively. Specific effects for spleenweight were found on Chr 5 at 49 cM, on Chr 10 at 4cM, and on Chr 15 at 51 cM. The summed net effectsof all identified QTLs for the weights of liver, kid-ney, and spleen accounted for 35.8%, 36.5%, and 29.9% of the corresponding phenotypic F2 variance forthe weights of inner organs (Table 5).
Interaction between chromosomal seg-ments. Table 6 shows the results of the pairwiseanalysis of interaction between chromosomal re-gions significantly (p < 0.001) influencing the phe-notypic F2 variance of body weight, muscle weight,and fat deposition. In most cases where interaction
G.A. BROCKMANN ET AL.: EARLY BODY WEIGHT QTLS 605

for one trait was identified at p < 0.001 between twoloci, interaction effects were also found for corre-lated traits at p < 0.01. The effects of individuallocus*locus interactions accounted for 4.9%–9.6% ofthe phenotypic F2 variance of the correspondingtraits. As we have included all markers in thisanalysis (markers which are linked to QTLs andmarkers which are not located in QTL regions), wehave detected interaction between QTL regions aswell as interaction between chromosomal regions,which have not directly accounted for the pheno-typic variance in the QTL mapping study. Thesummed epistatic effects accounted for 16.6%–39.9%of the phenotypic F2 variance of body weight at dif-ferent ages, fat deposition, and muscle weights.Direct QTL effects and epistatic interaction togetheraccounted for about half of the phenotypic F2 vari-ance of body weight at three and four weeks, repro-ductive fat weight, reproductive fat percentage, andmuscle weight, and for 72.9% and 72.7% of thephenotypic F2 variance of body weight at five and sixweeks, respectively (Table 7).
Most interactions between chromosomal regionshad general effects on body weight at different ages.The interaction effects can be discriminated intoeffects influencing all traits (D11Mit100*D10Mit16),specific effects on muscle weight (D1Mit217*D18Mit60, D7Mit253 * D2Mit6, D11Mit310 *D2Mit151, D14Mit257 * D8Mit145 * D12Mit194,D16Mit146 * D15Mit193, D17Mit49 * D9Mit64),and specific effects on fat deposition (D5Mit24 *D4Mit205, D11Mit326 * D15Mit193, D14Mit11 *D13Mit202, D14Mit257 * D3Mit73, D1Mit49 *D4Mit54, D7Mit253 * D12Mit36, D11Mit71 *D5Mit15, D11Mit326 * D13Mit202). The greatestand most significant (p = 0.00006) interaction effecthas been identified for body weight at four weeksbetween the distal part of Chr 11 and the proximalpart of Chr 10 (D11Mit100 * D10Mit16) accountingfor 9.6% of the corresponding phenotypic F2 vari-ance. The same interaction also had an effect onbody weight at all other ages, as well as on repro-ductive fat and muscle weights. It was the only in-teraction between genome regions that had an effecton both fatness and muscle weight. Interestingly,the two interacting chromosomal regions did notshow direct QTL effects on the analyzed traits. Inparticular, Chr 11, which harbored only the muscleweight QTL Mwqndbwk4 at 16 cM, contributed toepistatic effects across the whole chromosome byinteracting with genes on seven other chromosomes.Different parts of Chr 11 contributed to the traitvariation in the F2 population, suggesting that thereare different genes on Chr 11 playing a role in growthand body composition in the analyzed cross even if
no significant direct QTL effect has been foundduring the analyzed age period.
Regions on Chromosomes 1, 4, 8, 11, and 14harboring highly significant QTLs for growth andbody composition had additional effects on thesetraits when interacting with genes on other chro-mosomes. In contrast, the strong QTL region on Chr7 did not show any epistatic effect.
The analysis of epistatic effects provided evi-dence for age-controlled different regulation ofgrowth. The interactions D11Mit310 * D4Mit37 andD11Mit37 * D19Mit71 had an effect only on earlybody weight between two and three weeks beforeweaning, while interactions D1Mit49 * D4Mit54,D7Mit253 * D12Mit36, D11Mit71 * D5Mit15,D11mit310 * D2Mit151, D14Mit257 * D8Mit45, andD17Mit49 * D9Mit64 had effects on body weight atlater ages.
Discussion
In the cross between the high-body-weight-selectedmouse line NMRI8 and the inbred line DBA/2, ninechromosomal regions were identified with effectson body weight. Among them were three narrowchromosomal regions (Chr 1, Chr 7, Chr 14), whichalso had effects on fat deposition and muscle de-velopment. In addition to the body weight QTLs,two chromosomal regions were found with signifi-cant influence on muscle weight. The QTLs dis-covered in this study result from gene variants,which differ between the two strains NMRI8 andDBA/2. This study clearly shows that the mouseline NMRI8 is another polygenic model for theanalysis of body weight control. Compared withother high-growth-selected mouse models (Brock-mann et al. 1998, 2000; Cheverud et al. 1996, 2001;Keightley et al. 1996; Moody et al 1999; Morris etal. 1999; Vaugn et al. 1999), the high-body-weigh-selected line NMRI8 is characterized by a relativelysmall number of chromosomal regions harboringQTLs with relatively high effects on the phenotypicF2 variance, up to 16.2% compared with 6–8% inother studies (reviewed by Brockmann and Bevova2002). The positions of QTLs identified in the pre-sent cross coincided with QTL positions for bodyweight and obesity from other crosses and withhomologous regions of human and other species(Chagnon et al. 2003). That is not surprising, asalmost all chromosomes harbor several differentQTLs influencing body weight. Interestingly, inmany different studies only a single QTL for growthhas been assigned to Chr 10 (Vaughn et al. 1999),and only a few have been mapped to Chromosomes16–19. This general finding has been confirmed by
606 G.A. BROCKMANN ET AL.: EARLY BODY WEIGHT QTLS

our study. This pattern of distribution of QTLsmight support the hypothesis of partial clustering ofgenes contributing to growth and obesity control(Hurst et al. 2002).
Most QTLs that contributed to body weightregulation had effects on body weight during thewhole developmental phase between two and sixweeks of age. A closer look at the genetic effects ofthe different QTLs shows that they changed withage. As maternal effects substantially influencepreweaning growth, we have removed environmen-tal maternal effects by the inclusion of subfamily(mating pair) and pup size as fixed effects in theanalyses. The indications for changing patterns ofQTL expression with age is in agreement with re-sults of Cheverud et al. (1996), Vaughn et al. (1999),and Morris et al. (1999). Our data provided evidencefor two different ways of body weight regulationduring early growth. First, the QTL mapping resultsindicated that a switch of gene activation mightoccur at the age of three weeks when animals areweaned. We have found two classes of QTLs for bodyweight, those with major effects at the age of twoand three weeks as well as gene–gene interactionpreferentially affecting body weight before weaningwhen animals are fed by their mothers, and QTLswith highest effects after weaning when animalshave to live on their own under ad libitum access tofood. Specific epistatic effects on body weight at twoand three weeks and epistatic interaction influenc-ing growth after weaning support this finding. Sec-ond, the finding that the estimated additive anddominance effects on body weight were highestduring the post weaning period at the age of four andfive weeks suggests a concerted control of these
genes. The age between four and five weeks is theperiod of puberty when animals grow fastest. TheQTLs having maximal phenotypic effects on bodyweight during this ontogenetic phase are likely ac-tivated directly by sexual hormones or indirectly viafactors which are the target of hormonal stimuli andwhich subsequently induce the ontogenetic switchof gene activity during puberty.
The change of gene activity might be geneticallydetermined during ontogenesis and these genescould be controlled by different nutrient sources andcomposition before and after weaning. Thus, thedifferent QTL effects might result from geneticallydetermined gene–diet interaction. From differentstudies in humans and animals, we know that nu-trition during the fetal development and eating be-havior at childhood might genetically imprint geneactivities which could be responsible for eating be-havior, preferences for specific nutrients, specificpathways, and becoming fat or staying lean inadulthood (Reifsnyder et al. 2000; Jaenisch and Bird2003). The genes that we mapped and that have aneffect on body weight in the pre- and post weaningperiods could potentially be genes that underlie suchepigenetic modifications.
In our study, all except one QTL for early bodyweight had dominance variance components. Theseresults confirm the findings of Vaughn et al. (1999)and Morris et al. (1999) that, in particular, QTLs forearly growth have dominance effects. Recently, thesame phenomenon has been found for early growthQTLs in chicken (Carlborg et al. 2003). The simul-taneous detection of additive and dominance effectsof a QTL, as detected, for example, for the highlysignificant QTLs on Chromosomes 9 and l4, might
Table 7. Account of QTL effects to the phenotypic F2 variance
TraitJoined net
effect of QTLsa (%)Joined net effect
of interactionb (%)
Joined net effect ofQTLs and interaction
togetherc (%)
Body weight at 2 weeks 39.5 32.4 60.1Body weight at 3 weeks 35.7 16.6 51.1Body weight at 4 weeks 45.2 31.5 51.1Body weight at 5 weeks 40.4 37.1 72.9Body weight at 6 weeks 39.7 35.5 72.7Reproductive fat weight 25.3 39.6 51.8Reproductive fatpercentage
24.9 39.9 52.2
Muscle weight 40.0 29.2 50.6Liver weight 35.8 n.d. n.d.Kidney weight 36.5 n.d. n.d.Spleen weight 29.9 n.d. n.d.
The net effect is given as reduction of the residual sum of squares with and without inclusion of all QTLs, all interactions, or all QTLs andinteractions together in the analysis.aThe estimates for the joined net effect of all QTLs result from multipoint linkage analysis using the most likely QTL position.bThe estimates for the joined net effect of interaction and cof QTLs and interaction together result from the analysis using the marker positions nextto the most likely QTL positions found via linkage analysis. n.d. = not determined.
G.A. BROCKMANN ET AL.: EARLY BODY WEIGHT QTLS 607
result from direct single-locus-dominant allelic ex-pression, but also from the identified epistatic inter-action between different QTLs that we found forbody weight at all ages. Cheverud and Routman(1995) proposed that regulatory epistatic interactioncan make substantial contributions to the pheno-typic dominance variance components. The presenceof additive and dominance variance may also be ahint of the occurrence of more than one mutation inthe affected gene influencing body weight, especiallyif no epistatic interaction has been found as, for ex-ample, for the body weight QTLs in the distal regionof Chr 2. Recently, Omholt et al. (2000) demonstratedthat genetic dominance may be an intra- as well as aninterlocus interaction phenomenon, which mightresult from either feedback- or downstream-mediatedepistasis. In our analyses, the experimental finding ofthe highly significant body weight QTLs on Chr 7,which were the only QTLs with strong additive butno dominance effects and which did not contribute toany epistatic interaction with other genome region,additionally supports this concept.
The correlation we observed between bodyweight, fatness, muscle weight, and the develop-ment of organs was derived from six-weeks-old miceand is, therefore, valid for young postpuberbal ani-mals. The coincidence of QTL positions for differenttraits in narrow chromosomal regions indicates thateither body weight QTLs might have pleiotropic ef-fects on fat deposition, muscle, and organ weights orthat the QTLs represent the effect of linked coex-pressed genes. QTLs with simultaneous effects onbody and fat weights or on body and muscle weightsmay result from genes specifically influencing fat orprotein accretion, respectively. QTLs affecting fatand muscle weight could result from a pleiotropicgene effect regulating both fat deposition and proteinturnover. The finding that the pattern of genetic ef-fects is generally the same for the QTLs for body, fat,and muscle weights in narrow regions on Chrs l, 7,and 14 supports the assumption of pleiotropy.
The fat QTLs that we identified in this studycoincide with the position of chromosomal regionsthat have an effect on fatness in other mouse lines aswell as in humans (Chagnon et al. 2003). The mostlikely position of the strong QTL effect on Chr 7 inour cross coincides with the position of the pfatplocus with the fat-associated ATPase as the majorcandidate gene for the QTL effect (Dhar et al. 2000).Because the effect of the fat QTL on Chr 7 accountedfor 13% of the reproductive fat percentage in the F2
population, the isolation of the underlying genemight be feasible.
From the quantitative change of the magnitudeof the effects of the identified body weight QTLs, we
suggest that the underlying genetic polymorphismsthat are responsible for the observed effects mightcontinuously regulate gene activity rather thanswitch them on or off. Under the hypothesis thathigher phenotypic effects result from increased ordecreased gene activity, genomewide comparativeanalyses of transcript amounts between the basestrains support efficiently the selection of positionalcandidate genes. The knowledge of age-dependentQTL effects can be used for the targeted search forpositional candidate genes underlying the identifiedQTLs. By the examination of animals at the age ofhighest QTL effect, the differences in gene expres-sion on the level of RNA or protein between founderlines can be maximized.
Acknowledgments
The German Research Foundation, Grant No. BR1285/4, and the H. Wilhelm Schaumann Stiftungsupported this work. C.S.H. acknowledges supportfrom the BBSRC (Biotechnology and Biological Sci-ences Research Council). Excellent technical assist-ance was provided by Hannelore Tychsen for DNApreparation and genotyping.
References
1. Brockmann GA, Bevova MR (2002) Using mousemodels to dissect the genetics of obesity. Trends Genet18, 367–376
2. Brockmann GA, Haley C, Renne U, Knott SA, Schw-erin M (1998) QTLs affecting body weight and fatnessfrom a mouse line selected for high growth. Genetics150, 369–381
3. Brockmann GA, Kratzsch J, Haley CS, Renne U,Schwerin M, et al. (2000) Single QTL effects, epistasis,and pleiotropy account for two-thirds of the pheno-typic F2 variance of growth and obesity in DU6i ·DBA/2 mice. Genome Res 10, 1941–1957
4. Brockmann GA, Haley CS, Wolf E, Karle S, Kratzsch J,et al. (2001) Genome-wide search for loci controllingserum IGF binding protein levels of mice. FASEB J 15,978–987
5. Bunger L, Laidlaw A, Bulfield G, Eisen EJ, Medrano JF,et al. (2001) Inbred lines of mice derived from long-term growth selected lines: unique resources formapping growth genes. Mamm Genome 12, 678–686
6. Butler I, Pirchner F (1983) Effectiveness of withinfamily and individual selection for increased 3 to 5weeks body weight gain in different mouse popula-tions. Zuchtungskunde 55, 241–246
7. Carlborg O, Kerje S, Schutz K, Jacobsson L, Jensen P,et al. (2003) A global search reveals epistatic interac-tion between QTL for early growth in the chicken.Genome Res 13, 413–421
608 G.A. BROCKMANN ET AL.: EARLY BODY WEIGHT QTLS

8. Chagnon YC, Rankinen T, Snyder EE, Weisnagel SJ,Perusse L, et al. (2003) The human obesity gene map:the 2002 update. Obes Res 11, 313–367
9. Cheverud JM, Routman EJ (1995) Epistasis and itscontribution to genetic variance components. Genet-ics 139, 1455–1461
10. Cheverud JM, Routman EJ, Duarte FA, van Swinder-en B, Cothran K, et al. (1996) Quantitative trait locifor murine growth. Genetics 142, 1305–1319
11. Cheverud JM, Vaughn TT, Pletscher LS, Peripato AC,Adams ES, et al. (2001) Genetic architecture of adi-posity in the cross of LG/J and SM/J inbred mice.Mamm Genome 12, 3–12
12. Churchill GA, Doerge RW (1994) Empirical thresholdvalues for quantitative trait mapping. Genetics 138,963–971
13. Dhar M, Webb LS, Smith L, Hauser L, Johnson D, et al.(2000) A novel ATPase on mouse Chr 7 is a candidategene for increased body fat. Physiol Genomics 4, 93–100
14. Dietrich WF, Miller J, Steen R, Merchant MA, Dam-ron–Boles D, et al. (1996) A comprehensive geneticmap of the mouse genome. Nature 380, 149–152
15. Haley CS, Knott SA, Elsen LM (1994) Mapping quan-titative trait loci in crosses between outbred lines us-ing least squares. Genetics 136, 1195–1207
16. Hurst LD, Williams EJ, Pal C (2002) Natural selectionpromotes the conservation of linkage of co-expressedgenes. Trends Genet 18, 604–606
17. Jaenisch R, Bird A (2003) Epigenetic regulation ofgene expression: how the genome integrates intrinsicand environmental signals. Nat Genet 33 Suppl, 245–254
18. Jansen RC (1993) Interval mapping of multiple quan-titative trait loci. Genetics 135, 205–211
19. Keightley PD, Hardge T, May L, Bulfield G (1996) Agenetic map of quantitative trait loci for body weightin the mouse. Genetics 142, 227–235
20. Knott SA, Marklund L, Haley CS, Andersson K, DaviesW, et al. (1998) Multiple marker mapping of quanti-tative trait loci in an outbred cross between wild boarand Large White pigs. Genetics 149, 1069–1080
21. Lander E, Green P (1987) Construction of multilocusgenetic linkage maps in humans. Proc Nat Acad SciUSA 84, 2363–2367
22. Lander E, Kruglyak L (1995) Genetic dissection ofcomplex traits: guidelines for interpreting and report-ing linkage results. Nat Genet 11, 241–247
23. Moody DE, Pomp D, Nielsen MK, Van Vleck LD(1999) Identification of quantitative trait loci influ-encing traits related to energy balance in selection andinbred lines of mice. Genetics 152, 699–711
24. Morris KH, Ishikawa A, Keightley PD (1999) Quanti-tative trait loci for growth traits in C57BL/6J · DBA/2Jmice. Mamm Genome 10, 225–228
25. Omholt SW, Plahte E, Oyehaug L, Xiang K (2000) Generegulatory networks generating the phenomena of ad-ditivity, dominance and epistasis. Genetics 155, 969–980
26. Reifsnyder PC, Churchill G, Leiter EH (2000) Maternalenvironment and genotype interact to establish dia-besity in mice. Genome Res 10, 1568–1578
27. Institute SAS (1989) SAS/STAT User’s Guide, Version6, 4th ed Cary, NC, SAS Institute Inc.
28. Vaughn TT, Pletscher LS, Peripato A, King–Ellison K,Adams E, et al. (1999) Mapping quantitative trait locifor murine growth—a closer look at genetic architec-ture. Genet Res 74, 313–322
29. Wade CM, Kulbokas EJ 3rd, Kirby AW, Zody MC,Mullikin JC, et al. (2002) The mosaic structure ofvariation in the laboratory mouse genome. Nature 420,574–578
30. Zeng Z-B (1993) Theoretical basis for separation ofmultiple linked gene effects in mapping quantita-tive trait loci. Proc Natl Acad Sci USA 90, 10972–10976
G.A. BROCKMANN ET AL.: EARLY BODY WEIGHT QTLS 609