Mapping QTLs controlling fruit quality in peach ( Prunus persica (L.) Batsch)
14
Theor Appl Genet (1999) 98 : 18—31 ( Springer-Verlag 1999 E. Dirlewanger · A. Moing · C. Rothan L. Svanella · V. Pronier · A. Guye C. Plomion · R. Monet Mapping QTLs controlling fruit quality in peach (Prunus persica (L.) Batsch) Received: 10 October 1997 /Accepted: 18 August 1998 Abstract The organoleptic quality of fleshy fruits is in a large part defined by their composition of soluble sugars and organic acids. An F 2 population issuing from a cross between two peach varieties, ‘Ferjalou Jalousia’, a non-acid peach, and ‘Fantasia’, an acid nectarine, was analysed over 2 successive years for agronomic characters and for molecular-marker (isoenzymes, RFLPs, RAPDs, IMAs and AFLPs) segregations. Blooming and maturity dates, as well as productivity, were noted for each tree. Four fruits per tree were analysed at maturity for fresh weight, colour, pH, titratable acidity, soluble-solids content (SSC), acid (malic, citric and quinic acids) and sugar (sucrose, glu- cose, fructose, sorbitol) contents. QTLs were detected for all fruit components analysed, except for fruit col- our. The QTLs for nearly all components were present on two linkage groups. For productivity, fresh weight, pH, quinic acid, sucrose and sorbitol content, all the detected QTLs displayed the same effect as the parental phenotypes. By contrast, for maturity date, titratable acidity, malic and citric acids and fructose, some QTLs displayed the same effect as the parental phenotypes while others displayed the opposite effect. The fraction of the total variation in each trait throughout the population explained by the QTLs was very high and reached more than 90% for some characters. For most Communicated by M. A. Saghai Maroof E. Dirlewanger ( ) · A. Moing · L. Svanella · V. Pronier A. Guye · R. Monet INRA, Unite´ de Recherche sur les Espe`ces Fruitie`res et la Vigne, Centre de Bordeaux, BP 81, 33883 Villenave d’Ornon cedex, France Fax:#335 56 84 30 83 C. Rothan INRA, Station de Physiologie Ve´ ge´ tale, Centre de Bordeaux, BP 81, 33883 Villenave d’Ornon cedex, France C. Plomion INRA, Laboratoire de Ge´ne´tique et Ame´lioration des Arbres Forestiers, BP45, F-33610 Cestas, France of the characters analysed, epistasis was observed between QTLs. Key words Fruit quality · Organic acids · Sugars · Genetic linkage map · Quantitative trait loci (QTLs) · Peach (Prunus persica) Introduction Fruit producers must satisfy consumers by producing fruits of good flavour, colour and texture and must also provide marketers with fruits resistant to mechanical damage. In peach production, where the turnover of new cultivars is very rapid, size, firmness and appear- ance have now been improved through selection and have now reached an excellent level. On the other hand, flavour maintenance or improvement has been much slower to respond because this character is complex and difficult to control. The biological and genetic bases of fruit quality are still poorly known (Tucker 1993). The variation in fruit quality at harvest is related to a large number of interrelated factors (Ge´nard and Bruchou 1992). However, acid and sugar content and composition are major determinants of peach quality. The sugar-acid ratio is thus commonly used as a quality index (Robertson et al. 1989; Bassi and Selli 1990). Three organic acids are predominant in peach fruit: malic, citric and quinic (Byrne et al. 1991). Malic acid is the most abundant at maturity (50 — 60% of total organic acids), citric (20 — 25%) and quinic (20 — 25%) being present in lower quantities. The soluble sugars present in peach are sucrose, fructose, glucose and sorbitol. Sucrose is the predominant soluble sugar at maturity (54 — 75% of total soluble carbohydrates) while sorbitol accumulates at very low levels (4 — 11%). Glu- cose (9 — 21%) and fructose (3 — 25%) reach similar levels (Yoshida 1970; Meredith et al. 1989; Bassi and Selli 1990). The fruits with a ‘non-acid’ character are character- ised at maturity by a pH higher than 4.0, a titratable
-
Upload
independent -
Category
Documents
-
view
0 -
download
0
Transcript of Mapping QTLs controlling fruit quality in peach ( Prunus persica (L.) Batsch)

Theor Appl Genet (1999) 98 : 18—31 ( Springer-Verlag 1999
E. Dirlewanger · A. Moing · C. RothanL. Svanella · V. Pronier · A. GuyeC. Plomion · R. Monet
Mapping QTLs controlling fruit quality in peach (Prunus persica (L.) Batsch)
Received: 10 October 1997 /Accepted: 18 August 1998
Abstract The organoleptic quality of fleshy fruits is ina large part defined by their composition of solublesugars and organic acids. An F
2population issuing
from a cross between two peach varieties, ‘FerjalouJalousia’, a non-acid peach, and ‘Fantasia’, an acidnectarine, was analysed over 2 successive years foragronomic characters and for molecular-marker(isoenzymes, RFLPs, RAPDs, IMAs and AFLPs)segregations. Blooming and maturity dates, as well asproductivity, were noted for each tree. Four fruits pertree were analysed at maturity for fresh weight, colour,pH, titratable acidity, soluble-solids content (SSC), acid(malic, citric and quinic acids) and sugar (sucrose, glu-cose, fructose, sorbitol) contents. QTLs were detectedfor all fruit components analysed, except for fruit col-our. The QTLs for nearly all components were presenton two linkage groups. For productivity, fresh weight,pH, quinic acid, sucrose and sorbitol content, all thedetected QTLs displayed the same effect as the parentalphenotypes. By contrast, for maturity date, titratableacidity, malic and citric acids and fructose, some QTLsdisplayed the same effect as the parental phenotypeswhile others displayed the opposite effect. The fractionof the total variation in each trait throughout thepopulation explained by the QTLs was very high andreached more than 90% for some characters. For most
Communicated by M. A. Saghai Maroof
E. Dirlewanger ( ) · A. Moing · L. Svanella · V. PronierA. Guye · R. MonetINRA, Unite de Recherche sur les Especes Fruitieres et la Vigne,Centre de Bordeaux, BP 81, 33883 Villenave d’Ornon cedex, FranceFax:#335 56 84 30 83
C. RothanINRA, Station de Physiologie Vegetale, Centre de Bordeaux, BP 81,33883 Villenave d’Ornon cedex, France
C. PlomionINRA, Laboratoire de Genetique et Amelioration des ArbresForestiers, BP45, F-33610 Cestas, France
of the characters analysed, epistasis was observedbetween QTLs.
Key words Fruit quality · Organic acids · Sugars ·Genetic linkage map · Quantitative trait loci (QTLs) ·Peach (Prunus persica)
Introduction
Fruit producers must satisfy consumers by producingfruits of good flavour, colour and texture and must alsoprovide marketers with fruits resistant to mechanicaldamage. In peach production, where the turnover ofnew cultivars is very rapid, size, firmness and appear-ance have now been improved through selection andhave now reached an excellent level. On the other hand,flavour maintenance or improvement has been muchslower to respond because this character is complexand difficult to control. The biological and geneticbases of fruit quality are still poorly known (Tucker1993). The variation in fruit quality at harvest is relatedto a large number of interrelated factors (Genardand Bruchou 1992). However, acid and sugar contentand composition are major determinants of peachquality. The sugar-acid ratio is thus commonly used asa quality index (Robertson et al. 1989; Bassi and Selli1990). Three organic acids are predominant in peachfruit: malic, citric and quinic (Byrne et al. 1991). Malicacid is the most abundant at maturity (50—60% of totalorganic acids), citric (20—25%) and quinic (20—25%)being present in lower quantities. The soluble sugarspresent in peach are sucrose, fructose, glucose andsorbitol. Sucrose is the predominant soluble sugar atmaturity (54—75% of total soluble carbohydrates) whilesorbitol accumulates at very low levels (4—11%). Glu-cose (9—21%) and fructose (3—25%) reach similar levels(Yoshida 1970; Meredith et al. 1989; Bassi and Selli 1990).
The fruits with a ‘non-acid’ character are character-ised at maturity by a pH higher than 4.0, a titratable

acidity lower than 40 milli-equivalents per litre anda soluble-solids content in the same range of magnitudeas ‘acid’ fruits (Yoshida 1970; Monet 1979). The malicacid content in some ‘non-acid’ fruit varieties seems tobe low (Byrne et al. 1991; Moing et al. 1997) and thehypothesis that, contrary to other fruits, this acid is notaccumulated in the ‘non-acid’ fruit at maturity has beensuggested by Monet (1979). The determinism of thischaracter was reported to be controlled by a singledominant gene D (Yoshiba 1970; Monet 1979). Thisgene was located on a genetic linkage map constructedby using the progeny of a cross between two peachvarieties, one with ‘non-acid’ fruit and the other withnormal ‘acid’ fruit (Dirlewanger et al. 1998). The mapcovers 712 cM and includes 249 markers: involvingfour agronomic characters [male sterility (ps), flat (S-)or round fruit (ss), peach (G-) or nectarine (gg) and‘non-acid’ (D-) or ‘normal’ fruit (dd)], one isoenzyme, 47RFLPs, 82 RAPDs, six IMAs and 109 AFLPs. Accord-ing to the previous estimated size of the peach genome,between 550 and 740 cM (Dirlewanger et al. 1996),which is in agreement with a previous map (Foolad et al.1995), this map covers almost the entire genome.
The reduction of fruit quality into a number of ele-mentary components has a practical objective, i.e. themarker-assisted selection of fruit with desirable tastecharacteristics, and a fundamental objective, which isan understanding of the molecular bases of quality. Insome other fruits, particularly in tomato, QTLs con-trolling soluble-solids content have already been detec-ted (Osborn et al. 1987; Paterson et al. 1988; Tanksleyand Hewitt 1988; Garvey and Hewitt 1992), but as yetno similar approach has been reported for peach fruit.Moreover, in most of the published work related toQTLs, their location is still imprecise and their functionalrole remains unknown. When genes of known functionare cloned, possible effects of their polymorphism onthe variability of certain phenotypic traits can be exam-ined. The ‘candidate gene’ strategy has been success-fully used in maize for detecting genes controlling grainstarch and protein content (Edwards et al. 1992), car-bon-enzyme activities and carbohydrate concentrationinvolved in early growth variability (Causse et al. 1995).
The aim of the present study was to identify QTLsfor the major components of fruit quality in peach, bymeasuring several tree characters possibly interferingwith fruit quality, such as blooming date, fruit maturitydate and the fruit main sugar and organic-acid con-tents. Furthermore, we tried to identify genes control-ling the above mentioned agronomic characters usinga candidate gene approach.
Materials and methods
Population development
In 1988, ‘Ferjalou Jalousia’, a peach variety producing ‘non-acid’ flatfruit, was pollinated with pollen from ‘Fantasia’, an acid nectarine.
Table 1 Fruit characteristics of ‘Ferjalou Jalousia’ and ‘Fantasia’ atmaturity, and of the F
1individual which was self-pollinated to give
the F2
population measured in 1995. Mean$standard deviation offour fruits. Fresh weight corresponds to the entire fruit. The othermeasurements were made on fruit juice
Traits ‘Ferjalou ‘Fantasia’ F1
Jalousia’
Fresh weight (g) 111.5$8.8 199.5$8.8 136.7$17.8pH 4.9$0.1 3.6$0.04 4.5$0.1Titratable acidity (mEq/l) 27.5$2.5 148.1$16.0 40.0$3.1Soluble-solids content (%) 15.6$0.7 15.8$0.4 12.2$0.4Malic acid (g/l) 2.4$0.4 6.9$0.4 2.2$0.2Citric acid (g/l) 0.4$0.1 2.9$0.4 0.6$0.1Quinic acid (g/l) 1.2$0.2 2.1$0.2 1.1$0.2Sucrose (g/l) 81.3$6.2 59.2$5.6 72.9$2.5Glucose (g/l) 11.2$1.2 12.6$1.8 4.9$0.4Fructose (g/l) 8.4$1.2 10.2$1.5 7.0$0.3Sorbitol (g/l) 1.3$0.4 2.8$1.2 0.7$0.3
In 1992, a hybrid with low-acidity fruits was self-pollinated, produ-cing an F
2population of 63 trees. The seedlings were germinated
in vitro, transferred to the greenhouse and transplanted in theorchard in 1993. ‘Ferjalou Jalousia’, ‘Fantasia’ and the F
1parent
of the F2
offspring were grafted onto ‘Rubira’ rootstock. ‘FerjalouJalousia’ and ‘Fantasia’ were cultivated outdoors in containers. TheF1
parent was transplanted to the orchard near the F2
offspring in1993. The trees were grown in a rich sandy loam soil, under a typicaloceanic climate, 45 km South of Bordeaux (45°N). An open-vasetraining system with light winter pruning and a 5 m]2m spacingwas adopted. Hand thinning was carried out to reduce fruit load onthe heavily loaded trees. Pest control was performed as usual forpeach. The F
2trees and the grafted F
1parent were analysed, when
they were 3 and 4 years old (in 1995 and 1996), for several tree andfruit agronomic characters. The fruit characteristics at maturity ofthe parents and of the F
1individual which was self-pollinated to
produce the F2
population, measured in 1995, are summarised inTable 1. The maturity for each tree was determined according to thesoftning of flesh. For ‘Ferjalou Jalousia’, ‘Fantasia’ and for theF1
individual, the pH was 4.9, 3.6 and 4.5, respectively. Acid concen-trations were much higher in ‘Fantasia’ than in ‘Ferjalou Jalousia’.By contrast, sugar concentrations in ‘Ferjalou Jalousia’ were slightlyhigher than in ‘Fantasia’.
Genotyping
For each F2
tree, the agronomic characters segregating as simplecharacters were noted, i.e. male sterility, flat and round fruit, peachor nectarine and ‘non acid’ or ‘normal’ fruit (Dirlewanger et al. 1998).For the last character, although no formal taste analysis by a panelwas performed, the acidity of the fruit was roughly estimated on onefruit per tree by one person.
For molecular-marker analyses, isoenzymes, RFLPs, RAPDs andAFLPs were employed to elaborate the linkage maps (Dirlewangeret al. 1998). The different molecular marker procedures are describedin Dirlewanger et al. (1998). Several probe sources were used forRFLP analyses: genomic or cDNA probes of several Prunus species(P. persica, P. amygdalus, P. avium, P. ferganensis) as well as probescorresponding to genes putatively involved in the control of peachfruit development and composition in terms of sugars and acids. Thelatter were obtained from a differential screening of a peach fruitcDNA library between two early growth development stages of the‘Fantasia’ variety (probes named PC) (Rothan et al. 1997). Wesequenced some of them and located them on the genetic linkagemap [(e.g. the phosphoenolpyruvate carboxylase (PEPc) candidate
19

gene for organic acid content, involved in the synthesis of the majororganic acids (Blanke and Lentz 1989), a S28 ribosomal protein(S28) and a gene homologous to a tagged sequence of rice (EST-rice)]. The details of the map construction are described inDirlewanger et al. (1998).
Quantitative characters
Quantitative characters were measured for 2 successive years, in1995 and 1996, with the exception of fruit colour which was mea-sured only in the 2nd year. The blooming date, when all the flowersare open, the maturity date, corresponding to the beginning of fleshsoftening, and the tree productivity were all noted. For productivity,trees were given a score ranging from 0 (no or very few fruits on thetree) to 5 (large number of fruits). For all the fruit characteristics,four fruits per tree were analysed separately. Skin colour and freshweight were measured only at maturity. Skin colour was evaluatedby dividing the surface area of the fruit into ten regions: 0 was givento the yellow regions and 1 to the red regions. The pH and titratableacidity were measured in fruit juice extracted with a hand press andcentrifuged at 700 g for 10 min. The supernatant was used crude forpH measurement with a pH electrode, and diluted with de-ionizedwater for titration to an end pH of 8.3 with 0.1 N NaOH. Thesoluble-solid content (SSC) of the juice was determined with a handrefractometer. Five-hundred microliters of juice were rapidly fixedwith ethanol at 80°C (ethanol : juice, 80 : 20, v/v) for further metab-olite analysis. Organic-acid and sugar contents were measured in thefruit juice using HPLC. Soluble sugars were purified and analysedby HPLC with refractive-index detection, as described by Moinget al. (1992). Organic acids were analysed without purification, usinganion exchange HPLC (IonPac AS-11 4 mm column and ATCpre-column from Dionex Corporation, Sunnywale Calif., USA). Elu-tion was done with de-gassed NaOH solutions containing 16% (v/v)methanol with a 2 ml min~1 flow and according to the followinggradient: 0 to 5 min, 0.5 to 4.2 mM NaOH; 5 to 15 min, 4.2 to37.5 mM NaOH; and 17 min, 37.5 mM NaOH. Acid detection wascarried out using a PED2 conductivity detector from the DionexCorporation after anion chemical suppression with H
2SO
4. Sugar
and organic-acid quantification were done with Millenium softwarefrom Waters (Milford Mass., USA) using standards from Sigma(St Louis Mo., USA).
Statistical analysis
A two-way analysis of variance was employed to test the significanceof the effects due to genotype, year and their interaction. It wasperformed with the ‘GLM’ procedure of Statistical Analysis Systemsoftware (SAS Institute Inc., Cary, N.C., USA). Correlations betweencharacters were calculated using the ‘CORR’ procedure of SAS. TheSpearman coefficient was also calculated. QTL analyses were per-formed using Mapmaker/QTL 1.1 (Lincoln et al. 1992 a, b) andQGENE 2.23,5/96 (Nelson 1997). In order to clarify if MAP-MAKER/QTL 1.1 can be used with data including dominant andco-dominant markers, three sets of data were analysed: (1) one setincluded co-dominant markers and dominant markers well disper-sed throughout the map, (2) another set included only the co-domi-nant markers; with this set of data the map was only partiallyrepresented, and (3) the last set included the previous co-dominantmarkers and some additional ones resulting from the re-coding oftrans-dominant linked marker (TDLM) pairs (trans referring to therepulsion linkage phase) as a ‘‘co-dominant megalocus’’, as recom-mend by Plomion et al. (1996). A threshold LOD score value of 2.5was chosen for declaring the existence of a QTL. However, whena QTL was detected for a character in one year with a LOD'2.5and in the other year with a 2(LOD(2.5 in the same region,the latter was taken into account. The ratio of dominance (d) to
additivity (a) was used to determine the mode of gene action basedon the criteria of Stuber et al. (1987): d/a"0—0.20, additive (A);d/a"0.20—0.80, partial dominance (PD), d/a"0.80—1.20, domi-nance (D); d/a'1.20, overdominance (OD). The interactions be-tween QTLs were tested with QGENE 2.23,5/96 using only themarkers of the third set of data.
Results and discussion
Phenotypic distribution and correlation betweencharacters
No significant difference between years (P'0.05) wasobserved for titratable acidity, malic acid and glucosecontent (Table 2). On the other hand, significant meandifferences (P(0.05) were observed for all the othercharacters. In 1996, F
2fruits presented a lower mean
fresh weight, a lower pH and soluble-solids content,less quinic acid and sorbitol and more citric acid, suc-rose and fructose. In peach fruit, a year effect has beenreported for SSC, citric acid, fructose and sorbitol(Brooks et al. 1993). Due to highly significant geno-type]year interactions for all traits, the data from1995 and 1996 were analysed separately.
As previously reported, malic acid was the predomi-nant organic acid (Table 2). Citric- and quinic-acidcontents were about three-times lower, citric-acid con-tent being slightly higher than that of quinic acid.Among sugars, sucrose presented the highest concen-tration and sorbitol the lowest one (Table 2). Theglucose content of fruit was not significantly differentbetween the 2 years, in contrast with fructose whosecontent was respectively lower and higher than those ofglucose in 1995 and 1996.
The distributions of the different characters werevery similar for the 2 years. Therefore, only those ob-tained in 1995 are shown in Figs. 1 and 2. For bloomingand maturity dates, zero corresponds to the earliest treeof the F
2progeny (19 March for blooming date and 29
June for maturity date). Several characters present
Table 2 Mean values of the F2
individuals for the fruit charactersmeasured in 1995 and 1996
Traits Year Year effectprob(F
1995 1996
Fresh weight (g) 138.0 111.1 0.0001pH 4.13 3.88 0.0001Titratable acidity (mEq/l) 72.3 74.1 0.6401Soluble-solids content (%) 12.2 10.7 0.0001Malic acid (g/l) 3.77 3.61 0.3696Citric acid (g/l) 1.40 1.67 0.0094Quinic acid (g/l) 1.28 1.09 0.0001Sucrose (g/l) 64.6 71.1 0.0003Glucose (g/l) 10.1 10.3 0.5395Fructose (g/l) 8.6 13.0 0.0001Sorbitol (g/l) 1.39 1.02 0.0019
20

Fig. 1a–g Distribution of phenotypes for agronomic charactersmeasured in 1995 on the F
2progeny. a Blooming date (zero corres-
ponds to the earliest tree of the F2
progeny: 19 March). b Maturitydate (zero corresponds to the maturity date of the earliest tree of theF2
progeny: 29 June). c Productivity [trees were given a scoreranging from 0 (no or very few fruits) to 5 (large number of fruits)].d Fresh weight. e pH. f Titratable acidity. g Soluble solids. Thevalues of the parents ‘Ferjalou Jalousia’ (J), ‘Fantasia’ (F) and of theF1
individual (F1) are indicated by arrows
a typical normal distribution, i.e. blooming date(Fig. 1 a), fresh fruit weight (Fig. 1 d), quinic acid(Fig. 2 c), sucrose (Fig. 2 d) and glucose (Fig. 2 e) con-tents. For pH (Fig. 1 e), titratable acidity (Fig. 1 f ),malic- (Fig. 2 a) and citric-acid (Fig. 2b) contents, a bi-modal distribution was observed. For pH, this result isin agreement with the segregation of the ‘non-acid’ fruitcharacter: 1/4 with pH(4 for acid fruits and 3/4 withpH'4 for ‘non-acid’ fruits.
The Spearman correlation coefficients between traitsare shown in Table 3. Blooming date was significantlynegatively correlated with malic-acid content (r"!0.29,P(0.05 in 1995): early blooming trees have fruitscontaining more malic acid. Maturity date was posit-ively correlated with fresh weight (r"0.32, P(0.05 in1995), titratable acidity (r"0.29, P(0.05 in 1995),SSC (r"0.39, P(0.01 in 1995) and fruit sugar con-tents [sucrose (r"0.35, P(0.05 in 1996), glucose
(r"0.68, P(0.01 in 1996), fructose (r"0.48 in 1995and r"0.73 in 1996 with P(0.01) and sorbitol(r"0.47 in 1995 and 0.63 in 1996 with P(0.01)].Fruit colour was significantly correlated with all char-acters. Titratable acidity and pH were highly negativelycorrelated. As previously suspected, pH was negativelycorrelated with all the acid concentrations, except withquinic acid in 1996, but also with glucose, fructose andsorbitol contents. pH was positively correlated withsucrose content. Acid contents were positively corre-lated, especially malic- and citric-acid contents(r"0.70 in 1995, r"0.61 in 1996 with P(0.01). Sol-uble solids content was highly correlated with sucroseconcentration (r"0.60 in 1995, r"0.73 in 1996 withP(0.01), because sucrose is the main component ofsoluble solids, and citric-acid content was negativelycorrelated with sucrose content (r"!0.55 in 1995,r"!0.48 in 1996 with P(0.01). Similar results were
21

Fig. 2a–g Distribution of phenotypes for acids and sugars measuredin 1995 on the F
2progeny. a Malic acid. b Citric acid. c Quince acid.
d Sucrose. e Glucose. f Fructose. g Sorbitol. The values of theparents ‘Ferjalou Jalousia’ (J), ‘Fantasia’ (F) and of the F
1individual
(F1) are indicated by arrows
previously reported by Genard and Bruchou (1992).For sugars, the highest correlation was between glucoseand fructose (r"0.78 in 1995, r"0.90 in 1996 withP(0.01).
QTL detection
The results obtained with the first set of data includingco-dominant and dominant markers well dispersedthroughout the map are summarised in Table 4 and inFig. 3. QTLs were detected for all the quantitativecharacters analysed, except for skin colour. With thesecond set of data, including only the co-dominantmarkers, all the QTLs previously detected within theregion covered by these markers were detected againand their effects and positions were exactly the same asthose calculated with the first set of data. With the third
set of data, including co-dominant markers and TDLMpairs covering nearly all the map, the same results as forthe first set of data were obtained. This suggests thatMAPMAKER/QTL can be used with both dominantand co-dominant markers. This is due to the fact thatQTL effects are calculated at the position of the LODpeak and not at the nearest marker.
The limited size of the F2
implies that only QTLswith large effects could reach statistical significance(Andersson et al. 1994). For this reason, the number ofQTLs found must be considered as a minimal estimate.The threshold we chose results from a compromisebetween preserving a sufficient power and limiting therisk of false-positives. On linkage groups 5 and 6, QTLsfor nearly all characters were detected. Moreover,QTLs for several traits were detected in the same re-gion. These may correspond to distinct closely linkedQTLs or to only one QTL with a pleiotropic effect on
22
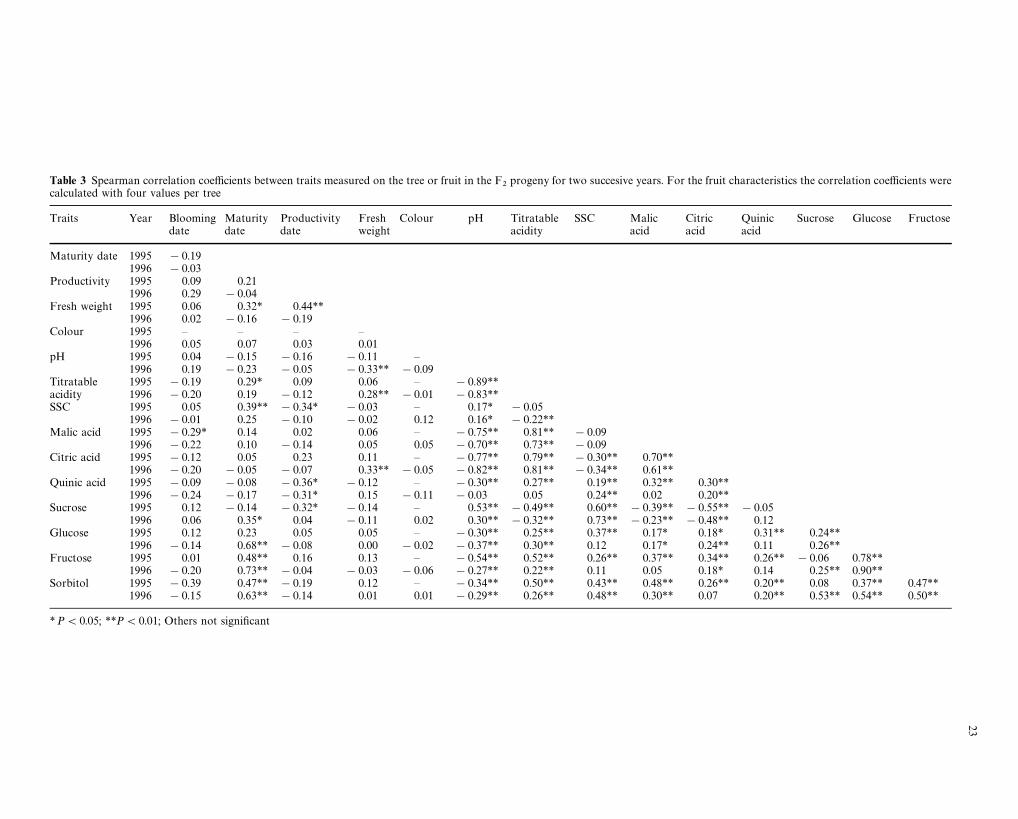
Table 3 Spearman correlation coefficients between traits measured on the tree or fruit in the F2
progeny for two succesive years. For the fruit characteristics the correlation coefficients werecalculated with four values per tree
Traits Year Blooming Maturity Productivity Fresh Colour pH Titratable SSC Malic Citric Quinic Sucrose Glucose Fructosedate date date weight acidity acid acid acid
Maturity date 1995 !0.191996 !0.03
Productivity 1995 0.09 0.211996 0.29 !0.04
Fresh weight 1995 0.06 0.32* 0.44**1996 0.02 !0.16 !0.19
Colour 1995 — — — —1996 0.05 0.07 0.03 0.01
pH 1995 0.04 !0.15 !0.16 !0.11 —1996 0.19 !0.23 !0.05 !0.33** !0.09
Titratable 1995 !0.19 0.29* 0.09 0.06 — !0.89**acidity 1996 !0.20 0.19 !0.12 0.28** !0.01 !0.83**SSC 1995 0.05 0.39** !0.34* !0.03 — 0.17* !0.05
1996 !0.01 0.25 !0.10 !0.02 0.12 0.16* !0.22**Malic acid 1995 !0.29* 0.14 0.02 0.06 — !0.75** 0.81** !0.09
1996 !0.22 0.10 !0.14 0.05 0.05 !0.70** 0.73** !0.09Citric acid 1995 !0.12 0.05 0.23 0.11 — !0.77** 0.79** !0.30** 0.70**
1996 !0.20 !0.05 !0.07 0.33** !0.05 !0.82** 0.81** !0.34** 0.61**Quinic acid 1995 !0.09 !0.08 !0.36* !0.12 — !0.30** 0.27** 0.19** 0.32** 0.30**
1996 !0.24 !0.17 !0.31* 0.15 !0.11 !0.03 0.05 0.24** 0.02 0.20**Sucrose 1995 0.12 !0.14 !0.32* !0.14 — 0.53** !0.49** 0.60** !0.39** !0.55** !0.05
1996 0.06 0.35* 0.04 !0.11 0.02 0.30** !0.32** 0.73** !0.23** !0.48** 0.12Glucose 1995 0.12 0.23 0.05 0.05 — !0.30** 0.25** 0.37** 0.17* 0.18* 0.31** 0.24**
1996 !0.14 0.68** !0.08 0.00 !0.02 !0.37** 0.30** 0.12 0.17* 0.24** 0.11 0.26**Fructose 1995 0.01 0.48** 0.16 0.13 — !0.54** 0.52** 0.26** 0.37** 0.34** 0.26** !0.06 0.78**
1996 !0.20 0.73** !0.04 !0.03 !0.06 !0.27** 0.22** 0.11 0.05 0.18* 0.14 0.25** 0.90**Sorbitol 1995 !0.39 0.47** !0.19 0.12 — !0.34** 0.50** 0.43** 0.48** 0.26** 0.20** 0.08 0.37** 0.47**
1996 !0.15 0.63** !0.14 0.01 0.01 !0.29** 0.26** 0.48** 0.30** 0.07 0.20** 0.53** 0.54** 0.50**
*P(0.05; **P(0.01; Others not significant
23

Table 4 Linkage group locations, effects and modes of gene action of individual QTLs detected using Mapmaker/QTL with a minimum LOD score threshold of 2.5. LG"linkage groupreferring to the map, Dist" QTL position described by the distance (cM) from the ‘top’ of the linkage group. R2"fraction of the total variation explained by the QTL. a"additiveeffect expressed as the effect of substituting a ‘Ferjalou Jalousia’ allele (J) for a ‘Fantasia’ allele (F). d"dominance effect of the ‘Ferjalou Jalousia’ allele to a ‘Fantasia’ allele. d/a"ratio ofthe dominance to additive effects. The explanation for the mode of gene action of QTLs was given in the text. Direc."the direction of additive effect on the phenotype
Trait Year LG R2 LOD F/F J/F J/J Gene action
Location Dist a d d/a Mode Direc.
Blooming date (100%) 1995 2 18 27.4 4.1 17.8 16.4 15.0 !1.4 0.0 0.0 A F1996 7 10 20.5 3.0 22.2 23.0 24.4 1.1 !0.3 !0.3 PD J
Maturity date 1995 3 0 24.3 2.8 41.9 34.5 21.6 !10.1 2.7 !0.3 PD F4 2 61.7 8.6 17.3 32.2 45.9 14.3 0.6 0.0 A J¹ 64.6 9.4
1996 3 0 21.3 2.3 46.1 41.6 29.6 !8.3 3.7 !0.4 PD F4 2 60.3 7.5 26.5 37.5 51.5 12.5 !1.5 !0.1 A J¹ 66.5 8.2
Productivity 1995 6 91 76.0 18.8 2.9 2.0 0.1 !1.4 0.5 !0.3 PD F9 13 62.3 2.6 2.1 2.4 0.3 !0.9 1.2 !1.3 OD F¹ 75.8 18.9
1996 1 114 62.0 3.4 3.0 3.3 0.3 !1.4 1.7 !1.2 D F6 90 72.9 17.8 3.4 3.4 0.4 !1.4 1.5 !1.1 D F9 4 76.2 7.7 2.9 3.5 0.3 !1.3 1.9 !1.5 OD F¹ 75.6 18.3
Fresh weight 1995 6 95 47.8 5.2 166.9 153.5 100.9 !33.0 !20.5 0.6 PD F1996 6 92 22.6 2.6 128.0 99.0 99.3 !14.4 !14.6 1.0 D F
pH 1995 5 9 69.7 11.8 3.57 4.24 4.45 0.4 0.3 0.6 PD J6 8 79.0 5.7 3.61 4.44 3.85 0.1 0.7 5.9 OD J8 31 73.3 3.1 3.59 4.47 3.95 0.2 0.7 3.9 OD J¹ 86.8 15.7
1996 5 9 52.6 7.7 3.40 4.02 4.19 0.4 0.2 0.6 PD J6 6 68.5 3.8 3.50 4.23 3.64 0.1 0.7 9.4 OD J¹ 88.3 11.4
Titratable acidity 1995 1 106 85.6 6.1 58.5 47.0 129.3 35.4 !46.9 !1.3 OD J5 8 87.0 17.3 129.0 50.4 47.0 !41.1 !37.6 0.9 D F6 16 84.1 6.4 127.8 46.0 82.5 !21.3 !60.5 2.8 OD F¹ 99.2 28.15
1996 1 108 73.9 3.2 62.7 55.4 124.1 30.7 !38.0 1.2 D J5 8 78.5 10.0 124.8 59.9 51.2 !36.8 !28.1 0.8 PD F6 8 81.6 7.0 120.6 51.5 102.2 !9.1 !59.9 6.5 OD F¹ 99.5 22.2
24

Table 4 Continued
Trait Year LG R2 LOD F/F J/F J/J Gene action
Location Dist a d d/a Mode Direc.
Soluble-solids content 1995 4 6 32.7 3.9 10.7 12.4 12.8 1.1 0.6 0.5 PD J1996 6 94 35.7 3.7 9.8 11.3 9.6 !0.1 1.6 !16 OD F
Malic acid 1995 1 106 74.7 4.2 3.45 2.62 6.57 1.6 !2.4 !1.5 OD J5 32 78.0 12.1 6.47 2.86 2.57 !1.9 !1.7 0.8 PD F6 7 78.6 5.4 6.02 3.28 5.50 !0.3 !3.3 12.8 OD F¹ 99.5 25.0
1996 5 26 57.0 8.6 4.88 3.13 2.80 !1.0 !0.7 0.7 PD F6 7 70.0 3.8 4.95 2.71 4.93 0.0 !2.2 — OD —¹ 87.4 12.2
Citric acid 1995 5 9 81.7 14.0 2.82 0.84 0.86 !1.0 !1.0 1.0 D F6 6 74.8 4.8 2.92 0.84 1.46 !0.7 !1.3 1.8 OD F9 6 71.8 4.1 1.30 0.86 2.87 0.8 —1.3 —1.5 OD J¹ 96.1 17.2
1996 5 9 57.6 8.7 2.84 1.36 1.10 !0.9 !0.6 0.7 PD F6 9 68.8 3.7 2.71 1.09 1.77 !0.5 —1.1 2.4 OD F¹ 78.9 9.3
Quinic acid 1995 1 43 24.4 2.5 1.20 1.44 1.04 !0.1 0.3 4.0 OD F
Sucrose 1995 5 9 34.2 4.2 53.2 68.0 68.0 7.3 8.1 1.1 D J1996 5 43 25.5 2.8 59.9 77.7 79.3 8.1 9.7 1.2 D J
6 95 36.2 3.6 59.9 80.0 63.5 1.8 18.3 10.2 OD J¹ 50.2 6.0
Glucose 1996 8 3 29.5 3.3 12.00 11.50 8.10 !1.9 0.8 !0.4 PD F
Fructose 1995 3 54 42.1 3.0 11.68 7.85 7.98 !1.9 !2.0 1.1 D F4 11 25.1 2.8 6.69 8.78 9.49 1.5 0.6 0.4 PD J5 37 26.0 2.9 10.23 8.05 7.51 !1.4 !0.8 0.6 PD F¹ 77.8 10.2
1996 4 0 35.6 4.2 9.62 12.34 15.06 2.7 0.7 0.2 A J8 6 36.5 4.5 15.70 13.64 9.88 !2.9 0.8 0.3 PD F¹ 85.7 11.9
Sorbitol 1995 1 108 62.9 3.3 0.96 1.18 4.32 1.7 !1.5 !0.9 D J6 10 49.9 6.2 0.82 1.40 4.62 1.9 —1.3 !0.7 PD J¹ 83.5 10.6
1996 6 4 69.7 2.6 1.92 0.62 1.81 0.0 !1.2 — OD —
25

Table 5 Interaction between markers located on distinct linkagegroups detected using QGENEsoftware. Only pairs of markers withthe highest F value of the two-way interaction are reported here.F-threshold for significance of single marker (one way ANOVA):
7.00, corresponding P-value for single test: 0.001852. F-threshold forsignificance of a two-way interaction:12, corresponding P-value forsingle test 1/1000
Trait Year Significant marker Interaction
Marker Group Marker Group F P
Blooming date 1995 AC31 2 AC47 1 39.52 0.00000,, ,, AG56 3 77.63 0.00000,, ,, AG21c 5 74.94 0.00000I6 2 2CC133 4 60.31 0.00000
Maturity date 1995 CC133 4 AG56 3 15.31 0.00033,, ,, PC2 6 42.12 0.00000U9 4 S28 7 16.26 0.00027
1996 CC133 4 AG56 3 30.03 0.00000,, ,, PC2 6 36.18 0.00000,, ,, FG42 7 19.00 0.00012PC1 4 AC9 5 14.65 0.00045
Productivity 1995 PC2 6 AC-CA2/R01-1.0 1 12.82 0.000691996 PC2 6 AC-CA2/R01-1.0 1 18.06 0.00008
,, ,, O6 2 13.35 0.00056,, ,, FG68 7 29.02 0.00000PC60 6 AA-CG6/AA-CAC7 5 13.08 0.00063
Fresh weight 1995 PC2 6 AC-CA2/R01-1.0 1 15.98 0.00025,, ,, AA-CAC8/AB04-2.0 3 29.91 0.00000,, ,, Q4cod 8 21;75 0.00003PGL1 6 AG12 4 21.24 0.00004,, ,, FG34 5 13.03 0.00086,, ,, FG42 7 24.23 0.00002
pH 1995 AC9 5 FG83 1 265.81 0.00000,, ,, AG106 3 295.70 0.00000,, ,, PC1 4 203.02 0.00000,, ,, FG25 6 327.00 0.00000,, ,, FG6 7 266.3 0.00000X2 5 I8 2 114.22 0.00000
1996 AC9 5 FG83 1 126.85 0.00000,, ,, AG106 3 169.76 0.00000,, ,, PC1 4 124.08 0.00000,, ,, PGL1 6 50.43 0.00000,, ,, FG6 7 143.26 0.00000X2 5 I8 2 105.97 0.00000
Titratable acidity 1995 AC9 5 PC26 1 60.28 0.00000,, ,, I6 2 15.78 0.00029,, ,, AG56 3 23.71 0.00002,, ,, PC1 4 77.29 0.00000,, ,, PGL1 6 18.02 0.00000,, ,, FG68 7 40.64 0.00000
1996 AC9 5 AG9 1 14.19 0.00055,, ,, PC1 4 15.79 0.00033,, ,, FG68 7 18.53 0.00009
Soluble-solids content 1995 AC-CAG5/AA-CG3 4 AG56 3 102.72 0.00000,, ,, PC2 6 284.69 0.00000PC1 4 AC9 5 38.72 0.00000,, ,, FG42 7 37.56 0.00000
1996 PC2 6 AC-CA2/R01-1.0 1 254.73 0.00000,, ,, PC80 2 118.05 0.00000,, ,, AA-CAC8/AB04-2.0 3 225.32 0.00000,, ,, X04-0.6/I18-0.7 4 78.91 0.00000,, ,, AG104 7 286.40 0.00000,, ,, Q4cod 8 305.12 0.00000
26

Table 5 Continued
Trait Year Significant marker Interaction
Marker Group Marker Group F P
Malic acid 1995 AC9 5 PC26 1 53.80 0.00000,, ,, AG56 3 21.77 0.00003,, ,, X04—0.6/I18—0.7 4 24.02 0.00001,, ,, FG68 7 30.97 0.00000
1996 AA-CG6/AA-CAC7 5 AG9 1 15.81 0.00029,, ,, AG56 3 38.02 0.00000,, ,, FG25 6 17.59 0.00017AC9 5 PC1 4 13.10 0.00090
Citric acid 1995 AC9 5 AC47 1 21.97 0.00004,, ,, FG10 2 18.18 0.00011,, ,, AG106 3 22.05 0.00003,, ,, X4/I18 4 28.06 0.00000,, ,, PGL1 6 16.54 0.00029,, ,, AC-CAG3/X13-0.8 7 26.71 0.00001,, ,, Q4cod 8 21.31 0.00004
1996 AC9 5 AG12 4 15.94 0.00029,, ,, FG68 7 20.51 0.00005
Sucrose 1995 AA-CG6/AA-CAC7 5 AC47 1 36.45 0.00000AC9 5 PC60 6 51.95 0.00000,, ,, FG68 7 36.53 0.00000
1996 PC2 6 AC-CA2/R01-1.0 1 87.67 0.00000,, ,, AA-CAC8/AB04-2.0 3 90.25 0.00000,, ,, X4/I18 4 23.95 0.00000,, ,, AG104 7 75.63 0.00000,, ,, Q4cod 8 99.44 0.00000
Glucose 1996 FG40 8 FG22 3 21.58 0.00004
Fructose 1995 AC-CAG5/AA-CG3 4 AG56 3 25.27 0.00001,, ,, PC2 6 40.40 0.00000
1996 CC113 4 AG56 3 28.83 0.00000,, ,, PC2 6 32.05 0.00000,, ,, FG42 7 13.12 0.00097FG40 8 FG83 1 15.99 0.00029,, ,, FG22 3 32.46 0.00000,, ,, ESTrice 6 12.42 0.00110FG215 8 R6cod 5 17.48 0.00014
Sorbitol 1995 ESTrice 6 PC26 1 19.61 0.00007,, ,, AC31 2 17.92 0.00012,, ,, CC63 7 12.75 0.00094
a single gene acting upon several quantitative charac-ters involved in the same metabolic pathway. This typeof result has previously been observed on tomato chro-mosome 6 where the same QTL was apparently ob-served for fruit mass, pH and solid concentration(Paterson et al. 1988). The apparent co-location ofQTLs for fruit pH and sugars found in tomato was alsofound in peach. A physiological interpretation for thissituation has previously been reported (Prioul et al.1997): a QTL for a proton-driven translocation ofcarbohydrate from the cytosol into the vacuole, or forthe proton pump, is likely to affect both pH and solublesugars. On linkage group 5, QTLs were located nearthe D gene controlling the ‘non-acid’ fruit character,including QTLs for pH and titratable acidity in agree-ment with the perception of acidity in the mouth. Onlinkage group 6 the two distal regions of the linkagegroup were involved in QTLs. Near the S gene, which is
a dominant gene controlling fruit shape, i.e. flat orround (Lesley 1940), QTLs for fresh weight and pro-ductivity were detected. This is in agreement with thefact that flat fruits are generally lower in weight thanround fruits. Moreover, evidence is given here that treeswith flat fruit are less productive. QTLs controllingmalic, citric acid and sorbitol contents were all locatedin the upper region of the linkage group.
For the pH of the juice, QTLs were detected onlinkage group 5, as was expected, but also on linkagegroups 6 and 8. The last one was detected only for the1995 data. The QTLs on groups 5 and 6 presentedexactly the same location in 1995 and 1996. They allproduce effects in the same direction as the parentalphenotypes: the ‘Ferjalou Jalousia’ alleles increasedthe pH of the juice. However, surprisingly, the QTLon linkage group 5 (R2"69.7 in 1995 and 52.6 in1996) had a lower effect than the QTL on linkage
27

28

group 6 (R2"79.0 in 1995 and R2"68.5 in 1996). Thetotal variance of the character explained by the QTLsfor pH was similar for each year, i.e. R2"86.8 in 1995and 88.3 in 1996. These results demonstrate that the pHof the juice presents a complex determinism with atleast two major regions involved. In tomato, six QTLsfor fruit pH were mapped and accounted for 48% of thephenotypic variance (Paterson et al. 1988).
For titratable acidity, three QTLs were detected onlinkage groups 1, 5 and 6. Those on linkage groups5 and 6 produced an effects in the same direction as theparental phenotypes: the ‘Fantasia’ alleles increasedthe titratable acidity of the fruit. They were located inthe same region as the QTL detected for pH. The QTLon linkage group 1 produced an effect in the oppositedirection. This provides a demonstration of transgress-ion and indicates that some F
2individuals or cultivars
having alleles at the three QTLs producing effects inthe same direction may exhibit more extreme pheno-types than the parental lines. The total variance of thecharacter explained by the three QTLs was very high(R2"99.2 in 1995 and 99.5 in 1996). For malic-acidconcentration, similar results were obtained. QTLs onlinkage groups 1, 5 and 6 were detected displaying thesame effect as those for titratable acidity. For citric-acidconcentration, QTLs were detected on linkage groups5 and 6 but also on group 9. For pH, titratable acidity,malic and citric acids, each of the QTLs had a verypronounced effect. These results lead to several mainconclusions which are applicable to other QTL analyses:(1) a small number of Mendelian factors can explaina large part of the genetic variance, and (2) traits for differentcharacters frequently seem to share common QTLs.
For quinic acid and for sugars, an annual effect wasobserved, suggesting a high environmental influence onthe expression of the character. The R2 and LOD scorevalues for these characters were much lower than forthe others.
Interactions between markers were detected formany quantitative characters. The results obtained
b&&&&&&&&&&&&&&&&&&&&&&&&&&&&
Fig. 3 Localisation of QTLs controlling fruit-quality componentsanalysed for 2 successive years (1995 and 1996): blooming date (Blo),maturity date (Mat), tree productivity (Pro), fruit fresh weight (Fwei),pH, titratable acidity (¹itac), soluble-solids content (SSC), malic(Mal), citric (Cit), quinic (Qui) acid contents and sucrose (Suc),glucose (Glu), fructose (Fru), sorbitol (Sor) contents. Only linkagegroups including QTLs are represented. Loci are listed on the rightof each linkage group. Not all of the markers located on the linkagemap are indicated: for co-segregating markers only one was repre-sented. Genes controlling agronomic characters or corresponding tocandidate genes are indicated in red. Molecular markers presentinga deviation from the expected Mendelian ratio are noted with anasterisk. With respect to QTL localisation the highest probability isindicated by a horizontal line and the confidence interval by a verticalline. QTLs were detected using MAPMAKER/QTL. QTLs in-dicated in brackets present a 2.0(LOD(2.5, for the othersLOD'2.5. The sign # or ! indicates that the allele whichincreases the trait values is in the ‘Ferjalou Jalousia’ or in the‘Fantasia’ parent respectively. The asterisk indicates that the QTLdisplays the opposite effect to the parental one
using QGENE software are summarised in Table 5. Asthe F
2population was small (63 individuals) the effect
of the interaction was not reported here because theestimation was not precise enough. For pH, exactly thesame interactions were observed for both years.Markers on linkage group 5 interact with markers onall the other linkage groups except for group 8. Most ofthe interactions observed for pH were also observed fortitratable acidity, malic and citric acids. The samemarkers (AC9), located on linkage group 5, interactwith other markers located on several linkage groupsfor pH, titratable acidity, malic and citric acids and forsucrose concentration.
The candidate-gene approach
Eight putative candidate genes were located on themap: two with a known function [the PEPc (Group 3)the S28 ribosomal protein (Group 7)] and seven ob-tained from the differential screening of a peach fruitcDNA library at early growth stages: PC26 (Group 1),PC80 (Group 2), PC1 (Group 4), PC2, PC21, PC60 andESTrice (Group 6) (Fig. 3). Only the PC2 clone wasfound close to the QTLs controlling fruit fresh weight,productivity, SSC and sucrose content. The PEPc wasnot located in the QTL region of any acid concentra-tion. This suggests that this enzyme is not directlyinvolved in the variation in acid content of the acid-lessmutant analysed. One reason for this might be thatPEPc is a highly regulated enzyme (Chollet et al. 1996).Other known genes involved in fruit sugar metabolism,such as sorbitol dehydrogenase and acid invertase(Yamaki and Ishikawa 1986; Moriguchi et al. 1990), orin the degradation of organic acids, such as malatedehydrogenase (Taureilles-Saurel et al. 1995) and malicenzyme (Ruffner et al. 1984), should be tested. Genesinvolved in the storage of organic acids in the vacuole,such as those responsible for tonoplastic H`-ATPaseand pyrophosphatase (Davies 1997), could also bevaluable candidate genes. Unfortunately, the gene(s)responsible for tonoplastic malate transport througha malate transporter or a malate-selective anionchannel remain(s) unknown (Cheffings et al. 1997).
Conclusion
The ‘non-acid’ character of peach fruit, as perceivedin the mouth, is segregates like a monogenic dominantcharacter, as previously reported (Yoshida 1970;Monet 1979). However, at least two QTLs for the pH offruit juice, with similar high effects, were detected ondifferent linkage groups for the 2 years of observation.These results indicate that the ‘non-acid’ fruit characteris correlated with other characters besides the fruit pH.The perception of acidity in the mouth depends notonly on the acid concentration but also on the type of
29

acid (Pangborn 1963). The concentration and type ofsugars can also interfere with acid perception (Bassiand Selli 1990). It is therefore not surprising that QTLswere detected for citric and malic acids and for sucrosenear the D gene controlling the ‘non-acid’ character.Consequently, to improve the fruit organoleptic qual-ity, the QTLs associated with the different acid andsugar contents must be taken into account.
For productivity, fresh weight, pH, quinic acid, suc-rose and sorbitol contents all the detected QTLs dis-played effects in the same direction as the parentalphenotypes. In contrast, for maturity date, titratableacidity, SSC, malic and citric acids, glucose and fruc-tose, some QTLs displayed effects in both directions.For these characters it will be possible to select cul-tivars with higher values than the parent.
Except for fruit colour, QTLs for all the fruit compo-nents analysed were detected. Fruit colour was notcorrelated with any other character. A maximum ofthree QTLs was detected for each character. The frac-tion of the total variation in each trait throughout thepopulation explained by QTLs was very high andreached more than 90% for some characters, sugges-ting that effective selection can occur with few markers.
On two linkage groups, QTLs for nearly all thecomponents were present. This suggests that someQTLs may have a pleitropic effect. Some genes in thisregion could be involved in several metabolic path-ways. Another hypothesis would be that these tworegions include two cluster of genes involved in differ-ent pathways, as is frequently the case for disease resist-ance genes (Paran and Michelmore 1993; Ma et al. 1994).
Epistatic interactions between QTLs revealed a com-plex network, particularly between the genes control-ling pH and titratable acidity. These results indicatethat they act not only in an additive manner but also ininteraction; for example, as limiting factors of a particu-lar metabolic pathway.
Acknowledgements This work was supported by funds from theEuropean Community in the context of the Prunus mapping project(AIR3-CT93-1585), INRA (AIP Genome des Plantes Cultivees andAIP ‘AGRAF’) and the Aquitaine Region program ‘Detection degenes d’interet ecologique et economique chez les arbres forestiers etfruitiers’. We thank the ‘‘Les Jarres’’ INRA Experimental Stationteam in Toulenne for growing the plant material in their orchard.
References
Andersson L, Haley CS, Ellegren H (1994) Genetic mapping ofquantitative trait loci for growth and fatness in pigs. Science263 : 1771—1774
Bassi D, Selli R (1990) Evaluation of fruit quality in peach andapricot. Adv Hort Sci 4 : 107—112
Blanke MM, Lentz F (1989) Fruit photosynthesis. Plant Cell En-viron 12 : 31—46
Brooks SJ, Moore JN, Murphy JB (1993) Quantitative and qualitat-ive changes in sugar content of peach genotypes [Prunus persica(L.) Batsch]. J Am Soc Hort Sci 118 : 97—100
Byrne DH, Nikolic AN, Burns EE (1991) Variability in sugars, acids,firmness, and colour characteristics of 12 peach genotypes. J AmSoc Hort Sci 116 : 1004—1006
Causse M, Rocher JP, Henry AM, Charcosset A, Prioul JL, deVienne D (1995) Genetic dissection of the relationship betweencarbon metabolism and early growth in maize, with emphasis onkey-enzyme loci. Mol Breed 1 : 259—272
Cheffings CM, Pantoja O, Ashcroft FM, Smith JAC (1997) Malatetransport and vacuolar ion channels in CAM plants. J Exp Bot,Special Issue 48 : 623—631
Chollet R, Vidal J, O’Leary MH (1996) Phosphoenolpyruvate car-boxylase: a ubiquitous, highly regulated enzyme in plants. AnnuRev Plant Physiol Plant Mol Biol 47 : 273—298
Davies JM (1997) Vacuolar energization: pumps, shunts and stress.J Exp Bot 48 : 633—641
Dirlewanger E, Pascal T, Zuger C, Kervella J (1996) Analysis ofmolecular markers associated with powdery mildew resistancegenes in peach [Prunus persica (L.) Batsch]]Prunus davidianahybrids. Theor Appl Genet 93 : 909—919
Dirlewanger E, Pronier V, Parvery C, Rothan C, Guy A, MonetR (1998) Genetic linkage map of peach. Theor Appl Genet97 : 888—895
Edwards MD, Helentjaris T, Wright S, Stuber CW (1992) Molecularmarker-facilitated investigations of quantitative trait loci inmaize. Theor Appl Genet 83 : 765—774
Foolad MR, Arulsekar S, Becerra V, Bliss FA (1995) A genetic mapof Prunus based on an interspecific cross between peach andalmond. Theor Appl Genet 91 : 262—269
Garvey TC, Hewitt JD (1992) Use of molecular markers to locatequantitative trait loci linked to high soluble-solids content ina hybrid of ¸ycopersicon cheesmanii. J Am Soc Hort Sci117 : 497—499
Genard M, Bruchou C (1992) Multivariate analysis of within-treefactors accounting for the variation of peach fruit quality. SciHort 52 : 37—51
Lesley JW (1940) A genetic study of saucer fruit shape and othercharacters in the peach. Proc Am Soc Hort Sci 37 : 218—222
Lincoln S, Daly M, Lander E (1992 a) Mapping genes controllingquantitative traits with Mapmaker/QTL 1.1. Whitehead Insti-tute Technical Report, 2ed edn
Lincoln S, Daly M, Lander E (1992 b) Constructing genetic mapswith Mapmaker/EXP 3.0. Whitehead Institute Technical Report,3rd edn
Ma ZQ, Sorrells ME, Tanksley SD (1994). RFLP markers linked topowdery mildew resistance genes Pm1, Pm2, Pm3, and Pm4 inwheat. Genome 37 : 871—875
Meredith FI, Robertson JA, Horvat RJ (1989) Changes in physicaland chemical parameters associated with quality and post-harvest ripening of ‘Harvester’ peaches. J Agric Food Chem37 : 1210—1214
Moing A, Carbonne F, Rashad MH, Gaudillere JP (1992) Carbonfluxes in mature peach leaves. Plant Physiol 100 : 1878—1884
Moing A, Rothan C, Svanella L, Just D, Diakou P, Rolin D,Gaudillere JP, R Monet (1997) Organic acid metabolismduring the fruit development of two peach cultivars. Acta Hort465 : 425—432
Monet R (1979) Genetic transmission of the ’non-acid’ character.Incidence on selection for quality. In: InRA (ed), Eucarpia Sym-posium on Tree Fruit Breeding, Angers, pp 273—276
Moriguchi T, Sanada T, Yamaki S (1990) Seasonal fluctuations ofsome enzymes relating to sucrose and sorbitol metabolism inpeach fruit. J Am Soc Hort Sci 115 : 278—281
Nelson JC (1997) QGENE: software for marker-based genomicanalysis and breeding. Mol Breed 3 : 239—245
Osborn TC, Alexander DC, Fobes JF (1987) Identification of restric-tion fragment length polymorphisms linked to genes controllingsoluble-solids content in tomato fruit. Theor Appl Genet 73 :350—356
Pangborn RM (1963) Relative taste intensities of selected sugars andorganic acids. J Food Sci 28 : 726—733
30

Paran I, Michelmore RW (1993) Development of reliable PCR-based markers linked to downy mildew resistance genes in let-tuce. Theor Appl Genet 85 : 985—993
Paterson AH, Lander ES, Hewitt JD, Peterson S, Lincoln SE,Tanksley SD (1988) Resolution of quantitative traits intoMendelian factors by using a complete linkage map of restrictionfragment length polymorphisms. Nature 335 : 721—726
Plomion C, Liu BH, O’Malley DM (1996) Genetic analysis usingtrans-dominant linked markers in an F
2family. Theor Appl
Genet 93 : 1083—1089Prioul JL, Quarrie S, Causse M, de Vienne D (1997) Dissecting
complex physiological functions through the use of molecularquantitative genetics. J Exp Bot 48 : 1151—1163
Robertson JA, Meredith FI, Russell RB, Scorza R (1989) Physical,chemical and sensory evaluation of high- and low-qualitypeaches. Acta Hort 254 : 155—159
Rothan C, Moing A, Just D, Dirlewanger E, Svanella L, GaudillereJP, Monet R (1997) Isolation and characterization of cDNAsdifferentially expressed during the early development of peachfruit. Acta Hort 465 : 99—105
Ruffner HP, Possner D, Brem S, Rast DM (1984) The physiologicalrole of malic enzyme in grape ripening. Planta 160 : 444—448
Stuber CW, Edwards MD, Wendel JF (1987) Molecular marker-facilitated investigation of quantitative trait loci in maize. II. Factorsinfluencing yield and its component traits. Crop Sci 27 : 639—648
Tanksley SD, Hewitt J (1988) Use of molecular markers in breedingfor soluble-solids content in tomato — a re-examination. TheorAppl Genet 75 : 811—823
Taureilles-Saurel C, Romieu CG, Robin JP, Flanzy C (1995) Grape(»itis vinifera L.) malate dehydrogenase. II. Characterization ofthe major mitochondrial and cytosolic isoforms and their role inripening. Am J Enol Vitic 46 : 29—36
Tucker GA (1993) Introduction. In: Seymour GB, Taylor JE, TuckerGA (eds) Biochemistry of fruit ripening. Chapman and Hall,London, pp 3—43
Yamaki S, Ishikawa K (1986) Roles of four sorbitol-related enzymesand invertase in the seasonal alteration of sugar metabolism inapple tissue. J Amer Soc Hortic Sci 111 : 134—137
Yoshida M (1970) Genetical studies on the fruit quality of peachvarieties. Bull Hort Res Sta A9 Japon: 1—15
31