Mapping QTLs controlling fruit quality in peach ( Prunus persica (L.) Batsch)
Upload
independentCategory
view
3download
0
A RAD Tag Derived Marker Based Eggplant Linkage Mapand the Location of QTLs Determining AnthocyaninPigmentationLorenzo Barchi1, Sergio Lanteri1, Ezio Portis1*, Giampiero Vale2,3, Andrea Volante2, Laura Pulcini4,
Tommaso Ciriaci4, Nazareno Acciarri4, Valeria Barbierato5, Laura Toppino5, Giuseppe Leonardo Rotino5
1 DIVAPRA Plant Genetics and Breeding, University of Torino, Grugliasco, Torino, Italy, 2 CRA-GPG Genomic Research Centre, Fiorenzuola d’Arda, Piacenza, Italy, 3 CRA-RIS,
Rice Research Unit, Vercelli, Italy, 4 CRA-ORA Research Unit for Vegetable Crops, Monsampolo del Tronto, Ascoli Piceno, Italy, 5 CRA-ORL Research Unit for Vegetable
Crops, Montanaso Lombardo, Lodi, Italy
Abstract
Both inter- and intra-specific maps have been developed in eggplant (Solanum melongena L.). The former benefit from anenhanced frequency of marker polymorphism, but their relevance to marker-assisted crop breeding is limited. Combiningthe restriction-site associated DNA strategy with high throughput sequencing has facilitated the discovery of a largenumber of functional single nucleotide polymorphism (SNP) markers discriminating between the two eggplant mappingpopulation parental lines ‘305E40’ and ‘67/3’. A set of 347 de novo SNPs, together with 84 anchoring markers, were appliedto the F2 mapping population bred from the cross ‘305E40’ x ‘67/3’ to construct a linkage map. In all, 415 of the 431 markerswere assembled into twelve major and one minor linkage group, spanning 1,390 cM, and the inclusion of establishedmarkers allowed each linkage group to be assigned to one of the 12 eggplant chromosomes. The map was then used todiscover the genetic basis of seven traits associated with anthocyanin content. Each of the traits proved to be controlled bybetween one and six quantitative trait loci (QTL), of which at least one was a major QTL. Exploitation of syntenicrelationships between the eggplant and tomato genomes facilitated the identification of potential candidate genes for theeggplant QTLs related to anthocyanin accumulation. The intra-specific linkage map should have utility for elucidating thegenetic basis of other phenotypic traits in eggplant.
Citation: Barchi L, Lanteri S, Portis E, Vale G, Volante A, et al. (2012) A RAD Tag Derived Marker Based Eggplant Linkage Map and the Location of QTLsDetermining Anthocyanin Pigmentation. PLoS ONE 7(8): e43740. doi:10.1371/journal.pone.0043740
Editor: Gustavo Bonaventure, Max Planck Institute for Chemical Ecology, Germany
Received June 1, 2012; Accepted July 23, 2012; Published August 17, 2012
Copyright: � 2012 Barchi et al. This is an open-access article distributed under the terms of the Creative Commons Attribution License, which permitsunrestricted use, distribution, and reproduction in any medium, provided the original author and source are credited.
Funding: This research was partially supported by the Italian Ministry of Agricultural Alimentary and Forest Politics in the framework of ‘‘PROM’’, ‘‘ESPLORA’’ and‘‘AGRONANOTECH’’ projects. The funders had no role in study design, data collection and analysis, decision to publish, or preparation of the manuscript.
Competing Interests: The authors have declared that no competing interests exist.
* E-mail: [email protected]
Introduction
The eggplant (Solanum melongena L.) is the third most important
solanaceous crop (after potato and tomato, see http://faostat.fao.
org), with a global production level in 2010 of ,41.8Mt. It is an
important vegetable in south Asia, the Middle and Near East,
Africa and Southern Europe [1]. Its fruit shape varies from round
to elongated, and is a good source of dietary minerals and
vitamins. Despite the economic and nutritional importance of
eggplant, its genome organization is much less well explored than
that of the other solanaceous crops tomato and potato, for which a
complete genomic sequence is now available (http://solgenomics.
net/genomes). The eggplant is an autogamous diploid (2n = 2x
= 24), with a haploid DNA content of 1.2pg [2], equivalent to a
genome size of 1.1Gbp, analogous to the one of tomato
(,950 Mbp) and potato (,850 Mbp), and about one third of
the genome of sweet pepper. The earliest linkage map constructed
for eggplant was based on the RFLP genotyping of a small F2
population bred from the interspecific cross S. linneanum x S.
melongena [3]; this map has since been updated by Wu et al. [4] by
the addition of a set of conserved orthologous markers. The
earliest purely intraspecific map was based on various PCR-based
markers [5,6], and was later supplemented by a large number of
additional microsatellite loci to give an overall map length of
959 cM [7]. The most recently published intraspecific map
(1,285 cM) was developed from two F2 populations using a
mixture of microsatellites and gene-based markers, mostly derived
from putative orthologs among eggplant, tomato and potato [8].
The latter map has been exploited to map quantitative trait loci
(QTL) associated with parthenocarpy [9].
The Barchi et al. [10] intraspecific F2 mapping population is
based on 238 markers, and spans 719 cM. Its value lies in its
parental lines having been subjected to a large-scale single
nucleotide polymorphism (SNP) discovery exercise, achieved by
combining the ‘‘Restriction-site Associated DNA’’ (RAD, [11])
method with high throughput Illumina DNA sequencing [12].
The resulting sequence dataset consists of ,45,000 non-redundant
sequences, of which ,29% are putative coding sequences; ,30%
of the sequences are informative between the parental pair,
yielding a resource of ,10,000 SNPs, almost nearly 1,000 indels
and 1,800 putative microsatellites. The high throughput sequenc-
ing of the RAD tags enabled the development of useful markers for
extending the current knowledge of the genome organization of
PLOS ONE | www.plosone.org 1 August 2012 | Volume 7 | Issue 8 | e43740

eggplant and for carrying out comparative genomic analyses
within the Solanaceae family.
Here we report the construction of a new intraspecific eggplant
linkage map, mostly based on RAD tag derived SNP markers. The
resulting map was used to identify a number of QTLs underlying
anthocyanin pigmentation.
Methods
PermissionNo specific permits were required for the described field studies,
which took place in two experimental fields at the CRA-ORL in
Montanaso Lombardo and CRA-ORA in Monsampolo del
Tronto. These field plots were used by the authors of this paper
affiliated to the aforementioned institution (LP, TC, NA, VB, LT
and GLR) for field trials for phenotypic characterization of
eggplant mapping populations.
Plant materials and DNA isolationA population of 156 F2 plants was bred from the cross ‘305E40’
x ‘67/3’, breeding lines which differ from one another with respect
to a number of key agronomic traits. The highly homozygous
female parent (‘305E40’) forms a pink corolla and produces long,
highly pigmented dark purple fruit. The line was derived from a
somatic hybrid between the cultivar ‘Dourga’ and S. aethiopicum. Its
pedigree also includes cvs. ‘DR2’ and ‘Tal1/1’ [13,14]. ‘67/3’
produces more anthocyanin than ‘305E40’ in its leaves and stems,
its corolla colour is violet, and it produces round, violet coloured
fruit. The line is an F8 selection from the intra-specific cross cv.
‘Purpura’ x cv. ‘CIN2’. DNA samples were extracted from young
leaves, using the GenEluteTM Plant Genomic DNA Miniprep kit
(Sigma, St. Louis, MO), following the manufacturer’s protocol.
Marker data generation, map construction and BLASTsearch
The mapping population was genotyped with respect to 472
markers, comprising 388 SNPs, 43 microsatellites, three CAPS,11
RFLPs and 27 COSII markers. Of the SNPs, 384 were those
selected by Barchi et al. [12] from RAD tag derived sequence.
Genotyping was achieved using the GoldenGate assay (Illumina,
San Diego, CA), UC Davis Genome Center with automatic allele
calling implemented with GenCall software (Illumina). Two of the
F2 progeny were represented twice in each genotyping assay to
provide an internal control. The remaining four SNP assays lay
within sequences which were differentially expressed following
inoculation with the fungal pathogen Fusarium oxysporum f.sp.
melongenae [15,16], with the genotyping effected via the high
resolution melting (HRM) technique [17] and ran in a Rotor-
Gene 6000 (Corbett Research, Mortlake, NSW, Australia) PCR
machine. Of the microsatellite markers, 29 were taken from
Nunome et al. [6,7], 12 from Vilanova et al. [18] and one each
from Stagel et al [19] and Frary et al. [20]. Microsatellite
amplicons were separated on a LI-COR Gene ReadIR 4200
device, as described by Barchi et al. [10]. The three CAPS
markers were all tightly linked to the Rfo-sa1 gene, which confers
resistance to F. oxysporum f.sp. melongenae [14]; the amplicons were
separated on an AdvanCETM FS96 capillary electrophoresis
system (Advanced Analytical Technologies). The tomato RFLP
loci [3] were assayed according to Bernatzky and Tanksley [21],
while the COSII markers were developed by Wu et al. [22].
Differences between observed and expected segregation ratios
were assessed using a x2 test. Only markers associated with a x2
value # x2a= 0.1, or slightly deviating from expectation (x2
a= 0.1,
x2 # x2a= 0.01) were considered, provided that their inclusion did
not alter the local marker order. Loci suffering from significant
segregation distortion (x2 value . x2a= 0.01), and any for which 30
or more of the 156 progeny were not successfully genotyped were
excluded. JoinMap v4.0 software [23] was used to construct the
map, based on a LOD threshold of 4.0. To determine marker
order within a linkage group (LG), the JoinMap parameters were
set at Rec = 0.40, LOD = 1.0 and Jump = 5. Map distances were
converted to centiMorgans (cM) using the Kosambi mapping
function [24]. According to the known map locations of the RFLP,
microsatellite and COSII markers, LGs were assigned to
chromosome, and named E01 to E12. The quality of the map
was first checked by using the nearest neighbour stress parameter
in Joinmap, then by manual inspection to minimize the number of
double recombination events, and finally by estimating pairwise
recombination fractions using the R/QTL software package [25].
A blastN search of SNP, RFLP and COSII markers was made
against the SL2.40 genome build published by the International
Tomato Annotation Group (http://solgenomics.net/); for the
RAD-derived SNPs, a 0.6 ratio between the number of identities
and the query length was used as a cut off. A blastX search was
carried out against the NCBI protein database, adopting a
threshold of e–15. Finally, a blastN search was conducted of all
the markers represented on the Fukuoka et al. [8] map to identify
any in common between the two maps.
Phenotypic traits evaluation, data and QTL analysesThe mapping population, along with both of the parental lines
and their F1 hybrid, were field grown both in northern and
southern Italian locations [Montanaso Lombardo (ML: 45 209N, 9
269E) and Monsampolo del Tronto (MT: 42 539N; 13 479E)] in
2009. In both trials, the material was arranged as a set of two
randomized complete blocks with four replicate plants per entry
per block (for the F2 individuals, replicates were achieved by
establishing vegetative cuttings). The traits assayed were: adaxial
leaf lamina anthocyanin (adlan), stem anthocyanin (stean), abaxial
leaf lamina anthocyanin (ablan), calyx anthocyanin (calan), corolla
colour (corcol), leaf venation anthocyanin (lvean) and fruit
peduncle anthocyanin (pedan). Six of the seven traits were scaled
from 0 to 3, while corcol was scored on a 1–5 scale, with ‘‘1’’
representing pink, ‘‘2’’ dark pink, ‘‘3’’ light violet, ‘‘4’’ violet-pink
and ‘‘5’’ violet. Statistical analyses were performed using R
software [26]. A conventional analysis of variance was applied to
estimate genotypic/environmental effects based on the linear
model Yij = m + gi + bj + eij, where m, g, b and e represented,
respectively, the overall mean, the genotypic effect, the block effect
and the error. Based on the F2, the broad-sense heritability (h2BS)
values were calculated as s2G/( s2
G + s2E/n), where s2
G
represented the variance in g and s2E the residual variance and n
the number of blocks. Correlations between traits were estimated
using the Spearman coefficient, and normality, kurtosis and
skewness assessed with the Shapiro-Wilks test (a= 0.05). Segrega-
tion was considered as transgressive where at least one F2
individual recorded a trait value higher or lower by at least two
standard deviations than, respectively, the higher or lower scoring
parental line.
Both interval [27] and MQM [28–30] mapping, as implement-
ed in MapQTL v5 [31],were used for QTL detection. Putative
QTLs were first identified using interval mapping, after which one
linked marker per putative QTL was treated as a co-factor to
represent genetic background control in the approximate multiple
QTL model. Co-factor selection and MQM analysis were
repeated until no new QTL could be identified. LOD thresholds
for declaring a QTL to be significant at the 5% genome-wide
probability level were established empirically by applying 1,000
RAD Tag Marker Based Eggplant Map and QTL Analysis
PLOS ONE | www.plosone.org 2 August 2012 | Volume 7 | Issue 8 | e43740

permutations per trait [32]. Additive and dominance genetic
effects, as well as the proportion of the variance explained by each
QTL (PVE) were obtained from the final multiple QTL model.
MapChart v2.1 software [33] was used to produce visualization of
chromosomes and QTLs.
Results
Linkage analysisOf the 384 SNPs included in the GoldenGate assay, 343
produced non-ambiguous data; the two replicated individuals
included as internal controls produced completely consistent allele
calls. The frequency of missed calls was on average 0.2%, with an
extreme frequency of 5% occurring in one of the F2 segregants.
Segregation was skewed (x2 . x2a= 0.01) for only 13 markers (seven
SNPs, four microsatellites, one RFLP and one COSII), but in no
case was the distortion enough (x2 . x2a= 0.01) to discard the data.
The genotype data relating to the 431 informative markers were
assembled into 12 major and one minor (5 markers) LG,
comprising 415 loci (Table 1 and Fig. 1). The remaining 16 loci
were associated as triplets (four SNPs and five microsatellites) or
were unlinked; five of the microsatellites and two of the HRM
markers were assigned to an LG but not ordered in the map. The
location of the RFLP, microsatellite and COSII loci established
from prior maps [3–7] allowed each LG to be assigned to one of
the 12 eggplant chromosomes; the chromosome E08 map was
formed by an unmerged major and minor LG (Fig. 1). The overall
length of the map was 1,390 cM, with individual chromosomes
ranging in length between 80.2 cM (E07) and 136.5 cM (E03); the
number of loci per chromosome was highest in E02 (66) and lowest
in E11 (22) (Table 1). The genome-wide mean inter-locus
separation (discounting completely co-segregating ones) was
3.8 cM, varying from 2.0 cM (E02) to 7.0 cM (E12). An inspection
of the pairwise recombination fractions revealed a well defined
diagonal, implying that adjacent loci had the highest LOD; this
confirmed the robustness of the linkage map.
A blastN search against the tomato genome revealed that 223 of
the 339 SNP loci (listed in Table S1) satisfied the cut off criterion
applied, and thus, together with the RFLP and COSII markers
(for a total of 261 loci), were suitable for assessing synteny and
collinearity between the eggplant and tomato genomes. All major
established syntenic relationships between the two genomes [4,8]
were confirmed (Fig. S1). Only 15 markers mapped to non-
homologous tomato chromosomes (Table 2). When the RAD-
derived SNP containing sequences were subjected to a blastN
search of the Fukuoka et al. [8] loci, only two (31763_PstI_L370
and 18675_PstI_L403) could be associated (the former with
SOL1236, mapping to chromosome E10 and the latter with
est_cal05h22 on E07) (Fig. S2).
Phenotypic variation and inter-trait correlationsA summary of the phenotypic performance and the derived h2
BS
values are listed in Table 3. The parental lines contrasted for each
of the traits, as expected. 9305E409 produced less anthocyanin
than ‘67/3’ in its leaves and stems, and its corolla was pink to dark
pink (967/39s was violet). The F1 hybrid’s phenotype was
intermediate between the two parents, except with respect to
lvean, for which it more resembled ‘67/3’ in both MT and ML.
Transgression among the F2 progeny was noted for pedan (six
plants) in ML, and for adlan (six plants), stean (two plants) and
lvean (two plants) in MT. In each case the transgression involved a
lower level of pigmentation than in ‘305E40’. h2BS was overall
high, ranging from 0.71 (lveanML) to 0.99 (pedanML) (Table 3).
Significant inter-trait correlations were detected both within and
across locations (Table 4). The least well correlated traits were
adlan and corcol in MT (r2 = +0.23), and the most highly
correlated were stean and calan in ML, and stean and lvean in
MT (+0.86). The performance with respect to each trait was highly
correlated between the two locations.
QTL detection and candidate gene analysisSeparate QTL analyses were performed for each location,
resulting in the detection of 21 QTLs in ML and 18 in MT
distributed over eight chromosomes (Table 5). QTL clusters were
apparent on chromosomes E05, E06 and E10 (Fig. 1). Chromo-
some E05 harboured coincident major QTLs responsible for the
expression of stean, lvean and corcol in both locations, while
coincident major QTLs for all traits (except for corcol in ML)
mapped to a site on chromosome E10. Some minor and location-
specific QTLs were also found. Between one and six QTLs per
trait was detected. Although the PVE ranged from 1.5%
(pedanE01.ML) to 77.2% (lveanE10.MT), at least one major
QTL (PVE values .10% and a LOD score .20) and one minor
QTL could be identified for each trait – with the sole exception of
corcol in ML, for which only one QTL could be mapped. The
largest single QTL effect was associated with pedanE10a.ML
(76.4% of the PVE). With the exceptions of steanE02.MT,
pedanE12 b.ML and pedanE01.ML, all the positive alleles
(increased anthocyanin content) derived from 967/39. The additive
effects of all the QTLs were significant at p,0.05.
A blastX search of the NCBI non-redundant protein database
carried out for the seven marker loci on E10 and the two on E05
linked to the QTLs (Table 6), failed to highlight any known genes
or transcription factors involved in anthocyanin synthesis (for a
schematic view in tomato see AL-SANE et al. [34]). A blastN search
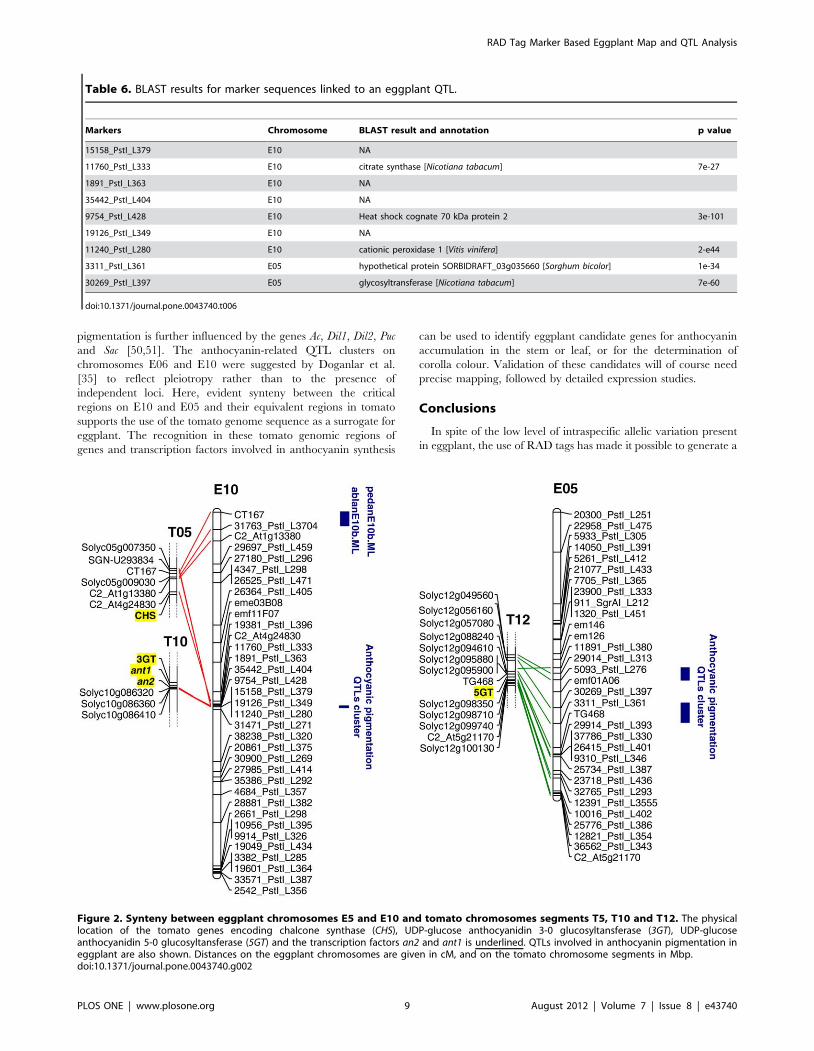
of the tomato genome sequence using the sequences of the loci
mapping closest to the E10 ablan QTL (in MT) and adlan (both
MT and ML) identified homologous sequences present on
chromosome T10, while sequences mapping in the vicinity of
the stean, calan and ablan QTLs detected in ML, and the lvean
and pedan QTLs on chromosome E10 identified sequences
present on chromosome T5 (Fig. 2). This confirmed the suggestion
that chromosome E10 is a mosaic, composed of segments
homologous to parts of chromosomes T5, T10 and T12 [4,8].
Similarly, chromosome E05 appears to be a mosaic of chromo-
some T5 and T12 segments.
To identify candidate genes underlying the eggplant E10 and
E5 QTLs for anthocyanin accumulation identified in the present
work, we investigate the available tomato sequence (Lycopersicon
esculentum genome sequence build 2.40; http://solgenomics.net/
organism/Solanum_lycopersicum/genome) in the tomato syntenic
regions to search for genes and transcription factors known to be
involved in anthocyanins pathways (Fig 2). Among the tomato
genes / transcription factors involved in anthocyanin synthesis, the
gene encoding chalcone synthase (CHS) gene is located on T5,
distal to the region homologous to the chromosome E10 region
harbouring QTLs for stean, calan, lvean and pedan
(1891_PstI_L363 and 35442_PstI_L404). The gene encoding
UDP glucose anthocyanidin 3-0 glucosyltansferase (3GT), an2
and ant1 are all located on chromosome T10, proximal to the E10
region containing 15158_PstI_L379 (linked to an ablan QTL in
MT and an adlan QTL detected in both locations). With respect
to corcol, Doganlar et al. [35] were able to identify a QTL on
chromosome E05. Aligning the two maps showed that this QTL
did not coincide with either corcolE05.ML or corcolE05.MT (data
not shown). A blastN search using the sequences of the loci most
closely linked to the chromosome E05 corcol QTL did however
reveal a syntenic locus on tomato chromosome T12, in a region
RAD Tag Marker Based Eggplant Map and QTL Analysis
PLOS ONE | www.plosone.org 3 August 2012 | Volume 7 | Issue 8 | e43740

harbouring the gene encoding the anthocyanin synthesis-associat-
ed enzyme UDP glucose anthocyanidin 5-0 glucosyltansferase
(GT) (Fig. 2).
Discussion
Genetic map constructionEggplant remains a ‘‘genomic orphan species’’ having enjoyed
very little investment to date in genome sequencing and molecular
genetics. A robust linkage map represents the springboard for
genomic investigation and targeted breeding. As in many crop
species, the level of intraspecific polymorphism present in eggplant
is low [19]. The same mapping population utilized here had been
previously used to assign 348 markers (mostly AFLP loci) to 12
major LGs, but the map suffered from extensive marker clustering,
particularly on the LG corresponding to chromosome E2
[10].Current DNA sequencing technologies have substantially
lowered the cost of sequence acquisition, while the development of
automated SNP platforms has revolutionized genotyping. The
RAD tag approach has therefore allowed for the definition of a
large number of SNP loci [12], a proportion of which were
incorporated in the GoldenGate SNP array used here. As a result,
the AFLP data have become redundant and they have been
discarded for the development of the present map.
The mapping population proved to be largely free of
segregation distortion, with only 4% of the markers showing
evidence of skewing (and none needing to be discarded on account
of severe distortion). The global genetic length defined by the map
was 1,390 cM, a length not dissimilar to that obtained by both Wu
et al. [4] and Fukuoka et al. [8], but considerably longer than the
AFLP-based one we previously constructed [10]. The 13 LGs
Figure 1. Linkage map of eggplant and graphical representation of the QTLs detected. A) chromosomes E01 to E06; B) chromosomes E07to E12. Marker names are shown to the right of each chromosome, with map distances (in cM) shown on the left. Map positions of the QTL identifiedon each chromosome (or LG) are also given on the right. The length of the vertical bars represents the confidence interval of the QTL (LODmax-1interval). QTL shown in blue were detected only at ML, and those in red only at MT.doi:10.1371/journal.pone.0043740.g001
RAD Tag Marker Based Eggplant Map and QTL Analysis
PLOS ONE | www.plosone.org 4 August 2012 | Volume 7 | Issue 8 | e43740

identified were assignable to the full complement of 12 chromo-
somes. Only E08 chromosome featured more than one LG; this
assignment was made possible by the presence of two SSR
markers, (i.e. emi03M03 and ecm023,) previously reported to be
on the same chromosome by both Nunome et al. [7] and Fukuoka
et al.[8]. The use of common (RFLP and COSII) markers allowed
for the full alignment of the current map with the one developed
by Wu et al. [4], while the position of microsatellite and COSII
markers (and two SNP loci) helped achieve the alignment with the
Fukuoka et al. [8] map for all but one of the chromosomes (E12)
(Fig. S2). The microsatellite locus emd18B04 was assigned to E12,
but is given as being on E09 by Fukuoka et al. [8]; this discrepancy
could reflect genetic differences between the pairs of mapping
parents, and/or may have arisen as a statistical artefact, reflecting
a non-identical choice of mapping parameters.
The positions of the homologues of the SNP, RFLP and COSII
loci in the tomato genome agreed well with previous analyses
[4,8]. The 15 markers which appeared to break synteny may
reflect the outcome of transposon-mediated transposition, as has
been recorded in both eggplant and pepper [4,36].
Mapping the QTLs underlying anthocyanin pigmentationThe genetic basis of anthocyanin synthesis and accumulation
has been widely explored in the Solanaceae [37–43]. Anthocyanins
are involved in floral pigmentation, protection against UV light
induced injury [44–46], tolerance of low temperature, nutrient
deficiency and defence against pathogen attack [47–49]. As part of
the human diet, they are recognized as having anti-inflammatory
and antioxidant properties [38]. The genetic control of the
accumulation and distribution of anthocyanin in eggplant was long
thought to be complex [50,51], involving at least three major and
five minor loci; epistatic interactions and/or pleiotropic effects
have also been implicated. The advent of marker-based linkage
maps has begun to clarify the situation, with the first report of a
QTL influencing anthocyanin content having been provided by
Doganlar et al. [35]. Based on the current map, it has been
possible to identify a number of QTLs underlying anthocyanin
accumulation in several tissues / organs. The cluster of QTLs
assigned to chromosome E10 is likely the same as that proposed by
Doganlar et al. [35]. The location of the phenotyping trials did not
greatly influence the outcomes (in other words, there was only a
minor component of GxE variation present), with the performance
of the parents and their F1 being very similar in each of the two
environments. The high h2BS value associated with all the traits
along with the correlated trait performances between the two sites
can be taken as evidence that soil and climate variation – to the
extent that the two sites differed for these – had little influence on
the phenotypic outcome. The h2BS values were higher than 80%
for all the traits; only for lvean it was markedly higher in ML (0.93)
than in MT (0.71) as in the latter location an higher phenotypic
Table 1. Parameters associated with the framework eggplant genetic map.
ChromosomeLength(in cM)
Number ofmarkers
Averagedensity(cM)
Gaps(.10 cM)
Gaps(.15 cM) RAD tag SNP HRM SSR CAPs RFLP COSII
E01 129.2 29 4.61 2 1 25 3 1
E02 115.3 66 2.02 2 1 55 3 3 1 4
E03 136.5 37 4.01 1 1 30 4 1 2
E04 119.5 30 4.27 2 2 22 1 3 4
E05 101.4 32 3.76 1 1 27 3 1 1
E06 152.1 37 4.35 2 1 29 2 3 3
E07 80.2 25 3.64 2 0 19 3 3
E08 91.4 38 2.69 2 0 32 1 3 1 1
E09 124.2 39 3.65 2 0 34 2 1 2
E10 129.1 35 4.45 1 3 30 2 1 2
E11 84.3 22 4.68 2 1 16 2 1 3
E12 126.6 25 7.03 3 2 20 3 2
Average 115.8 34.6 3.82
Total 1389.7 415 339 2 33 3 11 27
doi:10.1371/journal.pone.0043740.t001
Table 2. Loss of synteny between eggplant and tomato.
Eggplant chromosome Marker name Tomato chromosome
E01 28908_PstI_L324 T04
E02 11363_PstI_L344 T00
E04 32672_PstI_L304 T07
30804_PstI_L374 T08
E06 C2_At1g44446 T11
E09 3525_PstI_L303 T07
23589_PstI_L280 T06
33608_PstI_L213 T03
7976_PstI_L234 T02
34459_PstI_L314 T07
E10 11240_PstI_L280 T00
E12 6719_PstI_L347 T10
18908_PstI_L337 T02
15702_PstI_L354 T04
27752_PstI_L387 T09
The table lists the15 loci which mapped to non-homogous locations ineggplant and tomato.doi:10.1371/journal.pone.0043740.t002
RAD Tag Marker Based Eggplant Map and QTL Analysis
PLOS ONE | www.plosone.org 5 August 2012 | Volume 7 | Issue 8 | e43740

Ta
ble
3.
Tra
itm
ean
s,st
and
ard
de
viat
ion
s(S
D),
coe
ffic
ien
tso
fva
riat
ion
(cv)
and
bro
adse
nse
he
rita
bili
tyfo
rth
etr
aits
.
Tra
itco
de
En
vir
on
me
nt
Pa
ren
tsm
ea
ns±
SD
Sig
nif
ica
nt
me
an
dif
fere
nce
am
on
gp
are
nta
lv
alu
es
(wil
cox
on
test
)F
1
F2
po
pu
lati
on
me
an
±S
Dcv
Sk
ew
ne
ssS
EK
urt
osi
sS
EH
eri
tab
ilit
y
30
5E
40
67
/3
Ad
axia
lle
afla
min
aan
tho
cyan
inad
lan
ML
06
036
0Y
es:
p,
0.0
51
.56
01
.576
0.9
20
.58
0.0
20
.20
21
.26
0.3
90
.93
MT
0.5
60
36
0Y
es:
p,
0.0
51
.56
01
.56
0.8
30
.55
0.2
30
.19
21
.19
0.3
90
.92
Ste
man
tho
cyan
inst
ean
ML
1.2
56
0.2
936
0Y
es:
p,
0.0
52
.26
0.3
2.4
60
.52
0.2
22
0.5
40
.20
20
.78
0.3
90
.89
MT
16
036
0Y
es:
p,
0.0
52
.256
0.3
52
.326
0.5
20
.22
20
.78
0.1
90
.20
0.3
90
.82
Ab
axia
lle
afla
min
aan
tho
cyan
inab
lan
ML
0.3
76
0.2
52
.756
0.2
9Y
es:
p,
0.0
51
.756
0.2
1.3
76
0.7
0.5
10
.23
0.2
02
1.1
00
.39
0.8
5
MT
0.5
60
36
0Y
es:
p,
0.0
526
01
.56
0.6
10
.41
0.0
10
.19
20
.90
0.3
90
.82
Cal
yxan
tho
cyan
inca
lan
ML
1.1
26
0.2
536
0Y
es:
p,
0.0
51
.86
32
.26
0.5
50
.25
20
.43
0.2
02
0.7
10
.39
0.9
0
MT
0.7
56
0.3
536
0Y
es:
p,
0.0
51
.756
0.3
52
.026
0.6
80
.34
20
.63
0.1
92
0.6
40
.39
0.8
8
Co
rolla
colo
ur
corc
ol
ML
16
056
0Y
es:
p,
0.0
53
.96
0.1
53
.956
1.6
10
.41
21
.12
0.2
02
0.5
80
.39
0.9
4
MT
16
056
0Y
es:
p,
0.0
546
03
.576
1.6
0.4
52
0.6
90
.19
21
.12
0.3
90
.84
Ve
nat
ion
anth
ocy
anin
lve
anM
L0
.56
0.2
36
0Y
es:
p,
0.0
536
0.5
2.0
26
0.7
50
.37
20
.52
0.2
02
0.9
20
.39
0.9
3
MT
0.5
60
2.5
60
.7Y
es:
p,
0.0
52
.56
0.7
11
.96
0.7
70
.41
20
.52
0.1
92
0.9
90
.39
0.7
1
Fru
itp
ed
un
cle
anth
ocy
anin
pe
dan
ML
0.5
60
36
0Y
es:
p,
0.0
526
02
.056
0.9
0.4
42
0.6
90
.19
21
.03
0.3
90
.99
MT
06
036
0Y
es:
p,
0.0
52
.56
0.5
1.6
16
0.9
10
.57
20
.30
0.1
92
1.2
90
.39
0.9
3
Ske
wn
ess
and
kurt
osi
s(w
ith
the
irst
and
ard
err
ors
(SE)
)ar
eal
solis
ted
.d
oi:1
0.1
37
1/j
ou
rnal
.po
ne
.00
43
74
0.t
00
3
RAD Tag Marker Based Eggplant Map and QTL Analysis
PLOS ONE | www.plosone.org 6 August 2012 | Volume 7 | Issue 8 | e43740

variation was detected. Heritability values for some of the traits in
study have been recently reported [52].
Transgression was rare, and always in the direction of the less
pigmented parent (305E40). As previously reported [53], trans-
gressive genotypes outcome from the combination of alleles from
both parents that have effect on the same direction. The effect of
such allele combinations was tested regarding the graphical
genotypes at the detected QTLs of transgressive individuals. The
two transgressive individuals with respect to stean and lvean QTLs
in MT carried marker alleles inherited from different parents, both
acting to decreasing the expression of the trait. However, the
transgressive individuals for adlan at MT and pedan at ML were
not found to completely pyramide known alleles responsible to
increase the traits, implying that some minor QTLs still remain to
be identified.
Collard et al. [54] have suggested that a QTL should only be
classified as ‘‘major’’ if it can account for .10% of the PVE. A
more nuanced definition of ‘‘major’’ requires that the QTL can be
shown to be stable across multiple seasons/locations [55–57].
Among the 21 QTLs identified in ML and the 18 in MT, at least
one major QTL per trait was identified. The LOD score
associated with the least convincing of these was 23.3 (abla-
nE10.MT) and the most convincing was 73.2 (pedanE10a.ML);
the PVE varied from ,46% (steanE10.MT) to ,77% (lvea-
nE10.MT). Their key role and stability is respectively confirmed
by the high PVE and from their localization in the same
chromosome region in both locations. The stability of some of
these QTLs is promising in terms of using them in the context of
marker-assisted selection.
Anthocyanin pigmentation in eggplant, at least in the cross used
for mapping, is controlled by loci on chromosomes E05, E06 and
E10. The region between 68 and 70 cM of E10 (defined by seven
marker loci) is particularly prominent for anthocyanin production
and accumulation throughout the plant (except in the corolla).
The major site for corcol was within a ,13 cM region of
chromosome E05 (defined by two marker loci) which harboured
both major QTLs expressed in both locations and minor QTLs
responsible for lvean (in both locations) and pedan (just in MT).
The implication is that the corcol trait is controlled by one or more
genes which are not directly responsible for pigmentation of the
leaf, stem or calyx. Since both parental lines produce anthocyanin
pigmented fruits, no detectable variation in fruit pigmentation was
observed in the F2 progeny.
QTLs linked to related traits have a tendency to co-localize
[35]. This situation arose on E10, where QTLs for six of the seven
traits all mapped to the same region. The exception was corcol,
where the largest QTL mapped to chromosome E05 in the vicinity
of RFLP marker TG468. The minor QTLs detected were
concentrated on chromosomes E05, E06, E08 and E10. Some
were expressed in both locations (e.g. adlanE06, steanE05,
calanE05, calanE06, lveanE05 and pedanE05), while others were
location-specific (e.g. adlanE05.MT or steanE02.MT). Two pairs
of such QTLs (calanE05.MT / calanE05.ML and pedanE05.MT
/ pedanE05.ML) mapped to the same chromosome in both
locations, but not to a comparable intra-chromosomal position.
Synteny and putative orthologous QTLs in otherSolanaceae genomes
Most of the genetic analysis relating to anthocyanin pigmenta-
tion in the Solanaceae has been carried out to date in potato, pepper
and tomato. In the former, van Eck et al. [42,58] were able to
identify four loci (P, I, R and F ) required for anthocyanin synthesis
in the tuber’s skin and flowers. In pepper, the gene A (which is a
component of the anthocyanin synthesis pathway) was shown by
Borovsky et al [37] to encode a MYB transcription factor
homologous to petunia an2. In tomato, 13 genes related to
anthocyanin synthesis have been described by De Jong et al. [41].
The gene encoding chalcone synthase has been mapped to T5 in
the vicinity of the RFLP locus TG60 and several genes have been
mapped to T10, underlining the extent of synteny shown by this
genomic region across Solanaceae family. These data enabled both
candidate orthologues for three of the above potato genes to be
proposed, and for predictions to be made with regard to
orthologue identity in tomato (ag locus [59]), pepper (A locus
[39] ) and petunia, (an2 [60]).
In eggplant, it was suggested many years ago that anthocyanin
production, distribution and accumulation are primarily under the
control of the genes D, P and Y, and that the intensity of
Table 4. Inter-trait Spearman correlations assessed in the mapping population.
Trait Environment Adlan Stean Ablan Calan Corcol Lvean Pedan
Adlan ML 0,92 0,78 0,83 0,83 0,35 0,80 0,79
MT 0,71 0,83 0,74 0,23 0,79 0,76
Stean ML 0,80 0,67 0,86 0,45 0,84 0,76
MT 0,70 0,78 0,43 0,86 0,74
Ablan ML 0,83 0,75 0,26 0,69 0,69
MT 0,77 0,33 0,78 0,71
Calan ML 0,83 0,41 0,85 0,78
MT 0,34 0,85 0,74
Corcol ML 0,68 0,40 0,32
MT 0,41 0,42
Lvean ML 0,89 0,83
MT 0,84
Pedan ML 0,87
MT
The values in diagonal represent correlations of the same trait between the two environments. All correlations were significant (p,0.05).doi:10.1371/journal.pone.0043740.t004
RAD Tag Marker Based Eggplant Map and QTL Analysis
PLOS ONE | www.plosone.org 7 August 2012 | Volume 7 | Issue 8 | e43740

Ta
ble
5.
QT
Lsd
ete
cte
din
the
map
pin
gp
op
ula
tio
n.
Tra
itco
de
Mo
nta
na
soL
om
ba
rdo
(ML
)M
on
sam
po
lod
el
Tro
nto
(MT
)
GW
QT
LC
hro
mP
osi
tio
n(c
M)
Lo
cus
LO
DC
IP
VE
AD
GW
QT
LC
hro
mP
osi
tio
n(c
M)
Lo
cus
LO
DC
IP
VE
AD
Ad
lan
3.9
3.9
adla
nE0
5.M
T5
57
.38
32
90
14
_P
stI_
L31
35
.94
55
.5–
59
.44
.22
0.1
82
0.2
81
adla
nE0
6.M
L6
15
1.4
83
62
72
_P
stI_
L41
17
.93
14
22
15
28
.00
20
.28
20
.28
7ad
lan
E06
.MT
61
52
.12
53
03
20
_P
stI_
L25
15
.66
15
1–
15
24
20
.22
62
0.0
11
adla
nE0
8.M
T8
1.1
44
27
69
2_
Pst
I_L4
17
5.4
40
.5–
23
.82
0.1
76
0.2
46
adla
nE1
0.M
L1
06
9.3
91
51
58
_P
stI_
L37
93
6.9
86
9.1
–6
9.9
60
.60
20
.94
80
.06
0ad
lan
E10
.MT
10
69
.39
15
15
8_
Pst
I_L3
79
44
.96
69
.1–
69
.96
0.9
20
.86
52
0.0
49
Ste
an3
.93
.9st
ean
E02
.MT
27
1.0
52
95
27
_P
stI_
L45
94
.92
68
.7–
73
4.4
00
.15
12
0.0
15
ste
anE0
5.M
L5
69
.73
30
26
9_
Pst
I_L3
97
14
.59
68
–7
51
4.8
02
0.2
51
0.2
34
ste
anE0
5.M
T5
69
.73
30
26
9_
Pst
I_L3
97
14
.95
67
–7
41
5.7
02
0.2
72
0.2
00
ste
anE1
0.M
L1
06
8.9
21
89
1_
Pst
I_L3
63
36
.60
68
.1–
69
53
.60
20
.48
70
.25
2st
ean
E10
.MT
10
68
.92
18
91
_P
stI_
L36
33
2.5
06
8.1
–6
94
5.6
02
0.4
47
0.2
59
Ab
lan
3.8
abla
nE0
6.M
L6
15
1.4
82
36
27
2_
Pst
I_L4
11
8.2
11
42
–1
52
8.7
02
0.2
09
0.2
59
3.8
abla
nE0
8.M
T8
1.1
42
76
92
_P
stI_
L41
74
.26
0–
1.5
6.3
02
0.2
16
0.0
97
abla
nE1
0a.
ML
10
68
.92
15
15
8_
Pst
I_L3
79
29
.89
69
.1–
69
.94
5.2
02
0.6
42
20
.00
4ab
lan
E10
.MT
10
68
.58
11
76
0_
Pst
I_L3
33
23
.16
7.5
–6
9.3
46
.02
0.5
52
0.0
71
abla
nE1
0b
.ML
10
0C
T1
67
6.5
90
–5
6.8
02
0.2
55
20
.10
1
abla
nE1
1.M
L1
18
3.2
75
TG
37
04
.51
71
–8
34
.50
20
.17
70
.22
7
Cal
an3
.8ca
lan
E05
.ML
57
5.3
03
31
1_
Pst
I_L3
61
12
.39
70
–8
08
.80
20
.21
30
.14
73
.8ca
lan
E05
.MT
55
9.8
15
09
3_
Pst
I_L2
76
5.3
25
8–
63
3.4
20
.17
40
.09
5
cala
nE0
6.M
L6
15
1.4
83
62
72
_P
stI_
L41
14
.48
13
8–
15
1.7
2.7
02
0.0
94
0.1
17
cala
nE0
6.M
T6
15
2.1
33
03
20
_P
stI_
L25
14
.15
15
1–
15
22
.62
0.1
31
0.0
97
cala
nE0
8.M
L8
27
.53
CSM
45
.11
25
–2
83
.40
20
.11
20
.13
0
cala
nE1
0.M
L1
06
8.9
21
89
1_
Pst
I_L3
63
47
.53
68
–6
96
1.0
02
0.5
53
0.2
90
cala
nE1
0.M
T1
06
8.9
21
89
1_
Pst
I_L3
63
52
.25
68
–6
97
4.1
20
.73
60
.43
0
Co
rco
l4
.5co
rco
lE0
5.M
L5
75
.30
33
11
_P
stI_
L36
13
4.0
87
0–
83
63
.70
21
.54
51
.49
04
.0co
rco
lE0
5.M
T5
75
.30
33
11
_P
stI_
L36
13
2.6
77
0–
78
57
.30
21
.53
91
.22
7
corc
olE
10
.MT
10
69
.13
35
44
2_
Pst
I_L4
04
4.0
86
8–
69
4.5
02
0.4
24
0.2
53
Lve
an3
.7lv
ean
E05
.ML
57
5.3
03
31
1_
Pst
I_L3
61
13
.71
71
–8
27
.80
20
.27
40
.18
93
.9lv
ean
E05
.MT
57
5.3
03
31
1_
Pst
I_L3
61
10
.01
69
–8
15
.10
20
.22
60
.16
2
lve
anE1
0.M
L1
06
9.1
33
54
42
_P
stI_
L40
45
8.9
46
8.6
–6
9.1
73
.90
20
.83
30
.39
8lv
ean
E10
.MT
10
68
.92
18
91
_P
stI_
L36
36
1.8
06
8.5
–6
97
7.2
02
0.8
69
0.4
45
Pe
dan
4.2
pe
dan
E01
.ML
11
18
.30
10
04
1_
Pst
I_L3
64
4.6
91
17
–1
21
1.5
00
.06
72
0.1
91
3.8
pe
dan
E05
.ML
55
9.8
15
09
3_
Pst
I_L2
76
5.9
55
7–
62
1.9
02
0.1
10
0.2
27
pe
dan
E05
.MT
57
5.3
03
31
1_
Pst
I_L3
61
5.5
76
9.7
–8
34
.00
20
.22
10
.22
2
pe
dan
E10
a.M
L1
06
9.1
33
54
42
_P
stI_
L40
47
3.2
06
9.1
–6
9.2
76
.40
21
.02
90
.55
1p
ed
anE1
0.M
T1
06
9.1
33
54
42
_P
stI_
L40
44
8.3
26
8.9
–6
9.1
70
.70
20
.99
80
.40
4
pe
dan
E10
b.M
L1
00
.00
CT
16
76
.33
0–
42
.00
20
.19
12
0.0
39
pe
dan
E12
a.M
L1
21
06
.73
14
13
3_
Pst
I_L3
16
7.1
29
5–
11
12
.30
20
.19
00
.02
0
pe
dan
E12
b.M
L1
23
0.2
3C
2_
At1
g1
91
30
5.7
32
8–
35
1.8
00
.18
10
.03
2
For
eac
htr
ait
the
ge
no
me
-wid
eLO
Dth
resh
old
s(G
W)
atp
=0
.05
(as
de
term
ine
dfr
om
1,0
00
pe
rmu
tati
on
s)is
ind
icat
ed
.T
he
clo
sest
map
pin
gm
arke
rto
eac
hQ
TL
and
wh
ich
par
en
tco
ntr
ibu
ted
po
siti
vely
toth
etr
ait
are
ind
icat
ed
,al
on
gw
ith
the
LOD
valu
eo
fth
eQ
TL,
the
con
fid
en
cein
terv
al(C
I),
the
pe
rce
nta
ge
of
vari
atio
ne
xpla
ine
d(P
VE)
and
the
add
itiv
e(A
)/d
om
inan
ce(D
)co
ntr
ibu
tio
n.
do
i:10
.13
71
/jo
urn
al.p
on
e.0
04
37
40
.t0
05
RAD Tag Marker Based Eggplant Map and QTL Analysis
PLOS ONE | www.plosone.org 8 August 2012 | Volume 7 | Issue 8 | e43740
pigmentation is further influenced by the genes Ac, Dil1, Dil2, Puc
and Sac [50,51]. The anthocyanin-related QTL clusters on
chromosomes E06 and E10 were suggested by Doganlar et al.
[35] to reflect pleiotropy rather than to the presence of
independent loci. Here, evident synteny between the critical
regions on E10 and E05 and their equivalent regions in tomato
supports the use of the tomato genome sequence as a surrogate for
eggplant. The recognition in these tomato genomic regions of
genes and transcription factors involved in anthocyanin synthesis
can be used to identify eggplant candidate genes for anthocyanin
accumulation in the stem or leaf, or for the determination of
corolla colour. Validation of these candidates will of course need
precise mapping, followed by detailed expression studies.
Conclusions
In spite of the low level of intraspecific allelic variation present
in eggplant, the use of RAD tags has made it possible to generate a
Table 6. BLAST results for marker sequences linked to an eggplant QTL.
Markers Chromosome BLAST result and annotation p value
15158_PstI_L379 E10 NA
11760_PstI_L333 E10 citrate synthase [Nicotiana tabacum] 7e-27
1891_PstI_L363 E10 NA
35442_PstI_L404 E10 NA
9754_PstI_L428 E10 Heat shock cognate 70 kDa protein 2 3e-101
19126_PstI_L349 E10 NA
11240_PstI_L280 E10 cationic peroxidase 1 [Vitis vinifera] 2-e44
3311_PstI_L361 E05 hypothetical protein SORBIDRAFT_03g035660 [Sorghum bicolor] 1e-34
30269_PstI_L397 E05 glycosyltransferase [Nicotiana tabacum] 7e-60
doi:10.1371/journal.pone.0043740.t006
Figure 2. Synteny between eggplant chromosomes E5 and E10 and tomato chromosomes segments T5, T10 and T12. The physicallocation of the tomato genes encoding chalcone synthase (CHS), UDP-glucose anthocyanidin 3-0 glucosyltansferase (3GT), UDP-glucoseanthocyanidin 5-0 glucosyltansferase (5GT) and the transcription factors an2 and ant1 is underlined. QTLs involved in anthocyanin pigmentation ineggplant are also shown. Distances on the eggplant chromosomes are given in cM, and on the tomato chromosome segments in Mbp.doi:10.1371/journal.pone.0043740.g002
RAD Tag Marker Based Eggplant Map and QTL Analysis
PLOS ONE | www.plosone.org 9 August 2012 | Volume 7 | Issue 8 | e43740

large set of informative SNP markers. The length of the newly
developed map, and the inferred syntenic relationships between
the eggplant and the tomato genomes were largely consistent with
the conclusions drawn by Fukuoka et al. [8] and by Wu et al. [4].
A number of major QTLs have been located, which together
explain the majority of the phenotypic variance shown by the
mapping population for each trait. This exercise confirmed the
reliability of our map for the future identification of the genetic
bases of breeding traits for marker assisted selection programmes.
Synteny with tomato should allow the ready identification of
candidate orthologues for the chromosome E10 and E05 QTLs
related to anthocyanin accumulation. The expanded genetic map
should also be useful for further QTL and candidate gene
discovery.
Supporting Information
Figure S1 Comparative maps and syntenic relation-ships between eggplant and tomato chromosomes. Each
eggplant chromosome (in white) and its corresponding tomato
physical chromosome (in yellow) are connected by solid lines (in
green). Distances on the eggplant chromosomes are given in cM,
and on the tomato chromosome segments in Mbp.
(PDF)
Figure S2 Eggplant maps alignment. Alignment of the
current genetic map (white chromosome, in the middle) with that
constructed by Fukuoka et al [8] (in blue, on the right) and the
ones from Wu et al. [4] (in yellow, on the left). Markers shared by
maps are shown and their positions connected by a line.
(PDF)
Table S1 Parameters associated to the 261 loci used forsynteny and collinearity between the eggplant andtomato genomes.
(XLSX)
Acknowledgments
The authors thank Mr. Grazioli Gianni and Mr. Elia Leone (CRA-ORL)
for the production and maintenance of cuttings in the glasshouse and for
the technical practices in the field for eggplant production.
Author Contributions
Conceived and designed the experiments: SL GLR. Analyzed the data: LB
EP. Contributed reagents/materials/analysis tools: NA LT GLR. Wrote
the paper: LB SL EP GV LT. Performed the molecular experiments: LB
GV AV LT. Performed the field experiments: LP TC NA VB LT GLR.
References
1. Polignano G, Uggenti P, Bisignano V, Della Gatta C (2010) Genetic divergence
analysis in eggplant (Solanum melongena L.) and allied species. Genetic Resources
and Crop Evolution 57: 171–181.
2. Arumuganathan K, Earle E (1991) Nuclear DNA content of some important
plant species. Plant Molecular Biology Reporter 9: 208–218.
3. Doganlar S, Frary A, Daunay M, Lester R, Tanksley S (2002) A comparative
genetic linkage map of eggplant (Solanum melongena) and its implications for
genome evolution in the Solanaceae. Genetics 161: 1697–1711.
4. Wu F, Eannetta N, Xu Y, Tanksley S (2009) A detailed synteny map of the
eggplant genome based on conserved ortholog set II (COSII) markers.
Theoretical and Applied Genetics 118: 927–935.
5. Nunome T, Ishiguro K, Yoshida T, Hirai M (2001) Mapping of fruit shape and
color development traits in eggplant (Solanum melongena L.) based on RAPD and
AFLP markers. Breeding science 51: 19–26.
6. Nunome T, Suwabe K, Iketani H, Hirai M (2003) Identification and
characterization of microsatellites in eggplant. Plant Breeding 122: 256–262.
7. Nunome T, Negoro S, Kono I, Kanamori H, Miyatake K, et al. (2009)
Development of SSR markers derived from SSR-enriched genomic library of
eggplant (Solanum melongena L.). Theoretical and Applied Genetics 119: 1143–
1153.
8. Fukuoka H, Miyatake K, Nunome T, Negoro S, Shirasawa K, et al. (2012)
Development of gene-based markers and construction of an integrated linkage
map in eggplant by using Solanum orthologous (SOL) gene sets. Theoretical and
Applied Genetics 125: 47–56.
9. Miyatake K, Saito T, Negoro S, Yamaguchi H, Nunome T, et al. (2012)
Development of selective markers linked to a major QTL for parthenocarpy in
eggplant (Solanum melongena L.). Theoretical and Applied Genetics 124: 1403–
1413.
10. Barchi L, Lanteri S, Portis E, Stagel A, Vale G, et al. (2010) Segregation
distortion and linkage analysis in eggplant (Solanum melongena L.). Genome 53:
805–815.
11. Miller MR, Dunham JP, Amores A, Cresko WA, Johnson EA (2007) Rapid and
cost-effective polymorphism identification and genotyping using restriction site
associated DNA (RAD) markers. Genome Research 17: 240–248.
12. Barchi L, Lanteri S, Portis E, Acquadro A, Vale G, et al. (2011) Identification of
SNP and SSR markers in eggplant using RAD tag sequencing. BMC Genomics
12: 304.
13. Rizza F, Mennella G, Collonnier C, Shiachakr D, Kashyap V, et al. (2002)
Androgenic dihaploids from somatic hybrids between Solanum melongena and S.
aethiopicum group gilo as a source of resistance to Fusarium oxysporum f. sp
melongenae. Plant Cell Reports 20: 1022–1032.
14. Toppino L, Vale G, Rotino G (2008) Inheritance of Fusarium wilt resistance
introgressed from Solanum aethiopicum Gilo and Aculeatum groups into cultivated
eggplant (S. melongena) and development of associated PCR-based markers.
Molecular Breeding 22: 237–250.
15. Toppino L, Rotino GL, Francese G, D’Alessandro A, Vale GP, et al. (2010)
Biochemical and molecular analyses of RFO-sa 1 resistant eggplant interaction
with Fusarium oxysporum f.sp. melongenae and/or Verticillium dahliae. Advances in
Genetics and Breeding of Capsicum and Eggplant. 241–248.
16. Barbierato V, Tononi P, Toppino L, Delledonne M, Rotino GL (2011)
Microarray analysis of gene expression variation in eggplant rots subjected to
inoculation with Fusarium oxysporum and Verticillium dahliae. In: Proc of the Joint
Meeting AGI-SIBV-SIGA, Assisi 2011.
17. Wittwer CT, Reed GH, Gundry CN, Vandersteen JG, Pryor RJ (2003) High-
Resolution Genotyping by Amplicon Melting Analysis Using LCGreen. Clin
Chem 49: 853–860.
18. Vilanova S, Manzur J, Prohens J (2011) Development and characterization of
genomic simple sequence repeat markers in eggplant and their application to the
study of diversity and relationships in a collection of different cultivar types and
origins. Molecular Breeding: online first DOI: 10.1007/s11032-011-9650-2.
19. Stagel A, Portis E, Toppino L, Rotino G, Lanteri S (2008) Gene-based
microsatellite development for mapping and phylogeny studies in eggplant.
BMC Genomics 9: 357.
20. Frary A, Xu Y, Liu J, Mitchell S, Tedeschi E, et al. (2005) Development of a set
of PCR-based anchor markers encompassing the tomato genome and evaluation
of their usefulness for genetics and breeding experiments. Theoretical and
Applied Genetics 111: 291–312.
21. Bernatzky R, Tanksley S (1986) Toward a Saturated Linkage Map in Tomato
Based on Isozymes and Random CdnaSequences. Genetics 112: 887–898.
22. Wu F, Mueller L, Crouzillat D, Petiard V, Tanksley S (2006) Combining
bioinformatics and phylogenetics to identify large sets of single-copy orthologous
genes (COSII) for comparative, evolutionary and systematic studies: A test case
in the euasterid plant clade. Genetics 174: 1407–1420.
23. van Ooijen J (2006) JoinMap H 4, Software for the calculation of genetic linkage
maps in experimental populations. Kyazma B.V., Wageningen, Netherlands.
24. Kosambi D (1944) The estimation of map distance from recombination values.
Annals of Eugenics. 172–175.
25. Broman KW, Wu H, Sen S, Churchill GA (2003) R/QTL: QTL mapping in
experimental crosses. Bioinformatics 19: 889–890.
26. Team RDC (2009) R: A Language and Environment for Statistical Computing.
27. Lander E, Botstein D (1989) Mapping mendelian factors underlying quantitative
traits using RFLP linkage maps. Genetics 121: 185–199.
28. Jansen R (1993) Interval mapping of multiple quantitative trait loci. Genetics
135: 205–211.
29. Jansen R (1994) Controlling the type-i and type-ii errors in mapping quantitative
trait loci. Genetics 138: 871–881.
30. Jansen R, Stam P (1994) High-resolution of quantitative traits into multiple loci
via interval mapping. Genetics 136: 1447–1455.
31. Van Ooijen JW (2004) MapQTL 5, software for the mapping of quantitative
trait loci in experimental populations. Wageningen (The Netherlands):
Kyazma B V.
32. Churchill GA, Doerge RW (1994) Empirical Threshold Values for Quantitative
Trait Mapping. Genetics 138: 963–971.
33. Voorrips R (2002) MapChart: software for the graphical presentation of linkage
maps and QTLs. Journal of Heredity 93: 77–78.
34. Al-sane KO, Povero G, Perata P (2011) Anthocyanin tomato mutants: Overview
and characterization of an anthocyanin-less somaclonal mutant. Plant
RAD Tag Marker Based Eggplant Map and QTL Analysis
PLOS ONE | www.plosone.org 10 August 2012 | Volume 7 | Issue 8 | e43740

Biosystems - An International Journal Dealing with all Aspects of Plant Biology
145: 436–444.35. Doganlar S, Frary A, Daunay M, Lester R, Tanksley S (2002) Conservation of
gene function in the Solanaceae as revealed by comparative mapping of
domestication traits in eggplant. Genetics 161: 1713–1726.36. Wu F, Eannetta N, Xu Y, Durrett R, Mazourek M, et al. (2009) A COSII
genetic map of the pepper genome provides a detailed picture of synteny withtomato and new insights into recent chromosome evolution in the genus
Capsicum. Theoretical and Applied Genetics 118: 1279–1293.
37. Borovsky Y, Oren-Shamir M, Ovadia R, Jong W, Paran I (2004) The A locusthat controls anthocyanin accumulation in pepper encodes a MYB transcription
factor homologous to Anthocyanin2 of Petunia. Theoretical and AppliedGenetics 109: 23–29.
38. Bovy A, Schijlen E, Hall R (2007) Metabolic engineering of flavonoids in tomato(Solanum lycopersicum): the potential for metabolomics. Metabolomics 3: 399–412.
39. Chaim AC, Borovsky YB, De Jong WDJ, Paran IP (2003) Linkage of the A locus
for the presence of anthocyanin and fs10.1, a major fruit-shape QTL in pepper.Theoretical and Applied Genetics 106: 889–894.
40. Gonzali S, Mazzucato A, Perata P (2009) Purple as a tomato: towards highanthocyanin tomatoes. Trends in Plant Science 14: 237–241.
41. Jong WS, Eannetta NT, Jong DM, Bodis M (2004) Candidate gene analysis of
anthocyanin pigmentation loci in the Solanaceae. Theoretical and AppliedGenetics 108: 423–432.
42. van Eck HJ, Jacobs JME, Dijk J, Stiekema WJ, Jacobsen E (1993) Identificationand mapping of three flower colour loci of potato (S. tuberosum L.) by RFLP
analysis. Theoretical and Applied Genetics 86: 295–300.43. van Eck HJ, Jacobs JME, van den Berg PMMM, Stiekema WJ, Jacobsen E
(1994) The inheritance of anthocyanin pigmentation in potato (Solanum tuberosum
L.) and mapping of tuber skin colour loci using RFLPs. Heredity 73: 410–421.44. Gould K, Lister C (2006) Flavonoid function in plants. Flavonoids: Chemistry,
Biochemistry and Applications: 397–441.45. Koes R, Verweij W, Quattrocchio F (2005) Flavonoids: a colorful model for the
regulation and evolution of biochemical pathways. Trends Plant Science 10:
236–242.46. Peters D, Constabel C (2002) Molecular analysis of herbivore-induced
condensed tannin synthesis: cloning and expression of dihydroflavonol reductasefrom trembling aspen (Populus tremuloides). Plant Journal 32: 701–712.
47. Chalker-Scott L (1999) Environmental significance of anthocyanins in plant
stress responses. Photochem Photobiol 70: 1–9.48. Hernandez I, Alegre L, Van Breusegem F, Munne-Bosch S (2009) How relevant
are flavonoids as antioxidants in plants? Trends Plant Science 14: 125–132.
49. Dixon RA, Paiva NL (1995) Stress-Induced Phenylpropanoid Metabolism. ThePlant Cell Online 7: 1085–1097.
50. Tatebe T (1939) On inheritance of color in Solanum melongena L. The JapaneseJournal of Genetics 15: 261–271.
51. Tigchelaar EC, Janick J, Erickson HT (1968) The genetics of anthocyanin
coloration in eggplant (Solanum melongena L.). Genetics 60: 475–491.52. Prohens J, Plazas M, Raigon M, Seguı-Simarro J, Stommel J, et al. (2012)
Characterization of interspecific hybrids and first backcross generations fromcrosses between two cultivated eggplants (Solanum melongena and;S. aethiopicum
Kumba group) and implications for eggplant breeding. Euphytica 186: 517–538.53. deVicente MC, Tanksley SD (1993) QTL Analysis of Transgressive Segregation
in an Interspecific Tomato Cross. Genetics 134: 585–596.
54. Collard B, Jahufer M, Brouwer J, Pang E (2005) An introduction to markers,quantitative trait loci (QTL) mapping and marker-assisted selection for crop
improvement: The basic concepts. Euphytica 142: 169–196.55. Li Z, Jakkula L, Hussey RS, Tamulonis JP, Boerma HR (2001) SSR mapping
and confirmation of the QTL from PI96354 conditioning soybean resistance to
southern root-knot nematode. Theoretical and Applied Genetics 103: 1167–1173.
56. Lindhout P (2002) The perspectives of polygenic resistance in breeding fordurable disease resistance. Euphytica 124: 217–226.
57. Pilet-Nayel MP-N, Muehlbauer FM, McGee RM, Kraft JK, Baranger AB, et al.(2002) Quantitative trait loci for partial resistance to Aphanomyces root rot in pea.
Theoretical and Applied Genetics 106: 28–39.
58. Van Eck H, Jacobs J, Stam P, Ton J, Stiekema W, et al. (1994) Multiple allelesfor tuber shape in diploid potato detected by qualitative and quantitative genetic
analysis using RFLPs. Genetics 137: 303–309.59. Tanksley S, Ganal M, Prince J, Vicente M, Bonierbale M, et al. (1992) High
density molecular linkage maps of the tomato and potato genomes. Genetics
132: 1141–1160.60. Quattrocchio F, Wing J, van der Woude K, Souer E, de Vetten N, et al. (1999)
Molecular analysis of the anthocyanin2 gene of petunia and its role in theevolution of flower color. The Plant Cell 11: 1433–1444.
RAD Tag Marker Based Eggplant Map and QTL Analysis
PLOS ONE | www.plosone.org 11 August 2012 | Volume 7 | Issue 8 | e43740
Copyright © 2022 FDOKUMEN