Novel major QTLs associated with low soil phosphorus ...
13
RESEARCH ARTICLE Novel major QTLs associated with low soil phosphorus tolerance identified from the Indian rice landrace, Wazuhophek Ravindra Ramrao Kale 1,2☯ , Ch. V. Durga Rani 1☯ , M. Anila 2☯ , H. K. Mahadeva Swamy 3☯ , V. P. Bhadana 4☯ *, P. Senguttuvel 2 , D. SubrahmanyamID 2 , M. Ayyappa Dass 2 , K. Swapnil 2 , M. S. Anantha 2 , E. Punniakotti 2 , B. Laxmi Prasanna 1 , G. Rekha 2 , P. Sinha 2 , M. B. V. N. Kousik 2 , T. Dilip 2 , S. K. Hajira 2 , P. Brajendra 2 , S. K. Mangrauthia 2 , C. Gireesh 2 , Mangaldeep Tuti 2 , R. Mahendrakumar 2 , Jitendra Giri 5 , Pawandeep Singh 5 , R. M. SundaramID 2☯ * 1 Institute of Biotechnology, The Professor Jayashankar Telangana State Agricultural University, Rajendranagar, Hyderabad, India, 2 Indian Council of Agricultural Research -Indian Institute of Rice Research, Rajendranagar, Hyderabad, India, 3 Indian Council of Agricultural Research—Sugarcane Breeding Institute, Coimbatore, India, 4 Indian Council of Agricultural Research -Indian Institute of Agricultural Biotechnology, Ranchi, India, 5 Department of Biotechnology - National Institute of Plant Genome Research, New Delhi, India ☯ These authors contributed equally to this work. * [email protected], [email protected] (RMS); [email protected] (VPB) Abstract With an objective of mapping novel low soil P (Phosphorus) tolerance loci in the non-Pup1 type donor rice line, Wazuhophek, we screened a recombinant inbred line (RIL) mapping population consisting of 330 lines derived from the cross Wazuhophek x Improved Samba Mahsuri (which is highly sensitive to low soil P) in a plot with low soil P for tolerance associ- ated traits. Molecular mapping with SSR markers revealed a total of 16 QTLs (seven major and nine minor QTLs), which are associated with low soil P tolerance related traits. Interest- ingly, a QTL hotspot, harbouring 10 out of 16 QTLs were identified on the short arm of chro- mosome 8 (flanked by the makers RM22554 and RM80005). Five major QTLs explaining phenotypic variance to an extent of 15.28%, 17.25%, 21.84%, 20.23%, and 18.50%, associ- ated with the traits, plant height, shoot length, the number of productive tillers, panicle length and yield, respectively, were located in the hotspot. Two major QTLs located on chromo- some 1, associated with the traits, total biomass and root to shoot ratio, explaining 15.44% and 15.44% phenotypic variance, respectively were also identified. Complex epistatic inter- actions were observed among the traits, grain yield per plant, days to 50% flowering, dry shoot weight, and P content of the seed. In-silico analysis of genomic regions flanking the major QTLs revealed the presence of key putative candidate genes, possibly associated with tolerance. PLOS ONE PLOS ONE | https://doi.org/10.1371/journal.pone.0254526 July 15, 2021 1 / 13 a1111111111 a1111111111 a1111111111 a1111111111 a1111111111 OPEN ACCESS Citation: Kale RR, Durga Rani C.V, Anila M, Mahadeva Swamy HK, Bhadana VP, Senguttuvel P, et al. (2021) Novel major QTLs associated with low soil phosphorus tolerance identified from the Indian rice landrace, Wazuhophek. PLoS ONE 16(7): e0254526. https://doi.org/10.1371/journal. pone.0254526 Editor: Swarup Kumar Parida, National Institute for Plant Genome Research, INDIA Received: February 5, 2021 Accepted: June 28, 2021 Published: July 15, 2021 Copyright: © 2021 Kale et al. This is an open access article distributed under the terms of the Creative Commons Attribution License, which permits unrestricted use, distribution, and reproduction in any medium, provided the original author and source are credited. Data Availability Statement: All relevant data are within the manuscript and its Supporting Information files. Funding: Author initial:- R.R.Kale, Grant number:- CSIR JRF (09/891(0004)/2015EMR-I, Funder Name:- Council of Scientific & Industrial Research (CSIR)-Human Resource Development Group (HRDG), URL of funder website:- https://www. csirhrdg.res.in/Home/Index/1/Home/1459/1, The funders had no role in study design, data collection
-
Upload
khangminh22 -
Category
Documents
-
view
0 -
download
0
Transcript of Novel major QTLs associated with low soil phosphorus ...

RESEARCH ARTICLE
Novel major QTLs associated with low soil
phosphorus tolerance identified from the
Indian rice landrace, Wazuhophek
Ravindra Ramrao Kale1,2☯, Ch. V. Durga Rani1☯, M. Anila2☯, H. K. Mahadeva Swamy3☯, V.
P. Bhadana4☯*, P. Senguttuvel2, D. SubrahmanyamID2, M. Ayyappa Dass2, K. Swapnil2, M.
S. Anantha2, E. Punniakotti2, B. Laxmi Prasanna1, G. Rekha2, P. Sinha2, M. B. V.
N. Kousik2, T. Dilip2, S. K. Hajira2, P. Brajendra2, S. K. Mangrauthia2, C. Gireesh2,
Mangaldeep Tuti2, R. Mahendrakumar2, Jitendra Giri5, Pawandeep Singh5, R.
M. SundaramID2☯*
1 Institute of Biotechnology, The Professor Jayashankar Telangana State Agricultural University,
Rajendranagar, Hyderabad, India, 2 Indian Council of Agricultural Research -Indian Institute of Rice
Research, Rajendranagar, Hyderabad, India, 3 Indian Council of Agricultural Research—Sugarcane
Breeding Institute, Coimbatore, India, 4 Indian Council of Agricultural Research -Indian Institute of
Agricultural Biotechnology, Ranchi, India, 5 Department of Biotechnology - National Institute of Plant
Genome Research, New Delhi, India
☯ These authors contributed equally to this work.
* [email protected], [email protected] (RMS); [email protected] (VPB)
Abstract
With an objective of mapping novel low soil P (Phosphorus) tolerance loci in the non-Pup1
type donor rice line, Wazuhophek, we screened a recombinant inbred line (RIL) mapping
population consisting of 330 lines derived from the cross Wazuhophek x Improved Samba
Mahsuri (which is highly sensitive to low soil P) in a plot with low soil P for tolerance associ-
ated traits. Molecular mapping with SSR markers revealed a total of 16 QTLs (seven major
and nine minor QTLs), which are associated with low soil P tolerance related traits. Interest-
ingly, a QTL hotspot, harbouring 10 out of 16 QTLs were identified on the short arm of chro-
mosome 8 (flanked by the makers RM22554 and RM80005). Five major QTLs explaining
phenotypic variance to an extent of 15.28%, 17.25%, 21.84%, 20.23%, and 18.50%, associ-
ated with the traits, plant height, shoot length, the number of productive tillers, panicle length
and yield, respectively, were located in the hotspot. Two major QTLs located on chromo-
some 1, associated with the traits, total biomass and root to shoot ratio, explaining 15.44%
and 15.44% phenotypic variance, respectively were also identified. Complex epistatic inter-
actions were observed among the traits, grain yield per plant, days to 50% flowering, dry
shoot weight, and P content of the seed. In-silico analysis of genomic regions flanking the
major QTLs revealed the presence of key putative candidate genes, possibly associated
with tolerance.
PLOS ONE
PLOS ONE | https://doi.org/10.1371/journal.pone.0254526 July 15, 2021 1 / 13
a1111111111
a1111111111
a1111111111
a1111111111
a1111111111
OPEN ACCESS
Citation: Kale RR, Durga Rani C.V, Anila M,
Mahadeva Swamy HK, Bhadana VP, Senguttuvel P,
et al. (2021) Novel major QTLs associated with low
soil phosphorus tolerance identified from the
Indian rice landrace, Wazuhophek. PLoS ONE
16(7): e0254526. https://doi.org/10.1371/journal.
pone.0254526
Editor: Swarup Kumar Parida, National Institute for
Plant Genome Research, INDIA
Received: February 5, 2021
Accepted: June 28, 2021
Published: July 15, 2021
Copyright: © 2021 Kale et al. This is an open
access article distributed under the terms of the
Creative Commons Attribution License, which
permits unrestricted use, distribution, and
reproduction in any medium, provided the original
author and source are credited.
Data Availability Statement: All relevant data are
within the manuscript and its Supporting
Information files.
Funding: Author initial:- R.R.Kale, Grant number:-
CSIR JRF (09/891(0004)/2015EMR-I, Funder
Name:- Council of Scientific & Industrial Research
(CSIR)-Human Resource Development Group
(HRDG), URL of funder website:- https://www.
csirhrdg.res.in/Home/Index/1/Home/1459/1, The
funders had no role in study design, data collection

Introduction
Rice is one of the world’s most important and principal cereal crops and more than half of
the global population derive their calorific requirements from it. Reduced availability of
water and arable land, the constant threat of biotic and abiotic stresses and adverse effects
of a rapidly changing climate, nutrient-deficient soils, etc. are some of the major threats to
rice production and food security [1]. Phosphorous (P) is an essential nutrient for all living
organisms including rice. P deficiency in soil is one of the major limitations of rice produc-
tion as it significantly affects rice growth and development in terms of reduced plant
growth, reduced root development, lesser number of productive tillers, higher spikelet ste-
rility, delayed flowering and increased root elongation [2, 3]. It is predicted that the annual
increase in P fertilizer consumption will be 20 million tons by 2030 and the P fertilizer
sources are finite [4]. Cultivated plants use only 20–30% of the applied phosphorus-fertili-
sers, while rest is rapidly immobilized owing to fixation and microbial activity [5]. In acidic
soils, free iron and aluminium oxides bind to native and applied P, whereas in calcareous
soils, the abundant calcium and magnesium compounds bind inorganic phosphates (Pi)
making it unavailable to plants [6]. Plants cope with low P in the soil by developing adap-
tive changes at morphological, physiological, biochemical and molecular levels for
enhanced Pi uptake or increased internal P-use-efficiency for which basic mechanisms are
P-acquisition-efficiency (P uptake) and internal P-use-efficiency (PUE). Low P tolerance is
a complex quantitative trait [7]. Fortunately, rice germplasm have significant variations for
the traits related to low soil P tolerance and associated adaptive mechanisms of rice plant to
low-Pi stress, thus allowing the designing of effective breeding and genetic engineering
strategies to produce low P tolerant or P use efficient rice lines [8]. A major QTL associated
with low soil P tolerance, named Pup1 explaining upto 80% phenotypic variation, was iden-
tified earlier on chromosome12 of the Indian rice landrace, Kasalath [9]. Later on Pup1 was
fine-mapped and the causative gene underlying Pup1 was identified as, OsPSTOL1 (encod-
ing a protein kinase) [10]. In search of novel sources of low soil P tolerance (i.e. other than
Pup1), we earlier carried out the genotypic and phenotypic screening of Indian rice germ-
plasm for low soil P. This effort culminated in the identification of a rice line from North-
East part of India, named Wazuhophek, which showed excellent tolerance to low soil P and
was devoid of Pup1 [3]. We designed and carried out this study intending to establish the
genetic basis of tolerance to low soil P in Wazuhophek and undertake molecular mapping
of tolerance associated loci using a recombinant inbred line mapping population developed
from the cross between Wazuhophek (low soil P tolerant) and Improved Samba Mahsuri
(low soil P sensitive).
Material and methods
Plant materials
Wazuhophek, a landrace from North-Eastern part of India, which has been reported to possess
excellent tolerance to low soil P and is devoid of the well-known low soil P tolerance QTL,
Pup1 [3] was used as one of the parents for crossing with Improved Samba Mahsuri (ISM), a
low soil P sensitive rice variety. ISM is a high-yielding, fine-grain type rice variety, possessing
low glycemic index (GI), developed through the process of marker-assisted backcross breeding
and possesses three major bacterial blight resistance genes viz., Xa21, xa13, and xa5 in the
genetic background of the Indian mega-variety of rice, Samba Mahsuri [11]. A recombinant
inbred line (RIL) population consisting of 330 lines was developed at ICAR-Indian Institute of
Rice Research (ICAR-IIRR), Hyderabad, by advancing the F2 plants derived from the cross
PLOS ONE Novel major QTLs associated with low soil phosphorus tolerance
PLOS ONE | https://doi.org/10.1371/journal.pone.0254526 July 15, 2021 2 / 13
and analysis, decision to publish, or preparation of
the manuscript.
Competing interests: The authors have declared
that no competing interests exist.

Wazuhophek and ISM through single seed descent (SSD) method. A sub-set of the above said
population consisting of 112 RILs (at F6 generation) was used for molecular mapping of the
loci associated with low P tolerance traits in Wazuhophek.
Evaluation of mapping population for low P tolerance and agro-
morphological traits
Seedlings were raised using wet bed nursery. The 21 days old seedlings of RILs were trans-
planted in the low P soil plot (available Phosphorus < 2 kg ha-1) [12] along with the donor and
recipient parents and the check variety, Swarna, a low soil P tolerant line, possessing Pup1 [12]
for evaluation of agro-morphological traits [3]. The experiment was conducted in RBD with
three replications, the seedlings were planted by spacing of 20 X 15 cm, plants were applied
with basal application of N, K, Fe and Zn followed by top dressing N at maximum tillering
stage, and no phosphatic fertilizer was applied during the entire crop season. The available soil
P levels were monitored during transplanting, maximum tillering and grain maturity stages.
Observations were recorded for traits affected by low soil P like days to 50% flowering (DFF),
plant height (PH), number of productive tillers (NPT), panicle length (PL), shoot length (SL),
1000 grain weight, grain yield per plant, P content in grains and traits helpful in imparting low
soil P tolerance like root growth, root volume, root to shoot ratio, biomass were recorded [3].
Three plants were selected randomly which represent the entire line and mean data was sub-
jected to statistical analysis using SAS 9.2 (SAS version 9.2 software package (SAS Institute,
Inc.; Cary, NC). Correlation among the agro-morphological traits was analysed using open-
source statistical software ’R’ version 3.6.3 (R Core Team, 2016).
DNA isolation and genotyping
DNA was isolated from the parents and the RILs using the CTAB protocol [13]. A set of 587
hyper-variable rice microsatellite markers (i.e. rice SSR markers; details available at https://
archive.gramene.org/markers/microsat/all-ssr.html) were used to check polymorphism
between donor parent, Wazuhophek and recipient parent ISM. Out which a total of 78 paren-
tal polymorphic SSR markers, which are distributed evenly across the rice genome were
selected and used for molecular mapping. PCR reactions were performed in a final volume of
20μl [3].
Mapping of genomic regions associated with low soil P tolerance to identify
closely linked genes/QTLs and data analysis
Linkage analysis and map construction was performed using the genotype data derived from
78 parental polymorphic SSR markers distributed across the 12 chromosomes of rice (with an
average distance of ~ 5 Mb between the markers) along with the phenotype data derived from
the selected 112 RILs under low soil P condition, using the software program QTL IciMapping
version 4.0 [14]. The map distances were converted into cM, using the Kosambi function [15].
Three steps, namely grouping, ordering, and rippling was followed in order, after which output
command was given and the complete linkage map was obtained. QTL analysis was performed
using ICIM (inclusive composite interval mapping) for molecular mapping of the low soil P
tolerance associated loci. LOD score of 2.5 was set as a threshold for the identification of QTLs
with significant effects. Nomenclature for QTL was followed as described earlier [16]. A QTL
contributing more than 15% of the total phenotypic variance on the trait was considered as
major effect QTL [17].
PLOS ONE Novel major QTLs associated with low soil phosphorus tolerance
PLOS ONE | https://doi.org/10.1371/journal.pone.0254526 July 15, 2021 3 / 13
In-silico identification of putative candidate genes associated with low soil
P tolerance using mapping data
To analyse the putative candidate genes present in the chromosomal regions associated with
low soil P tolerance, information from the genomic intervals underlying the major QTLs iden-
tified in this study was used for in-silico analysis with the databases, viz., RAP-DB (https://
rapdb.dna.affrc.go.jp/), QTARO database (http://qtaro.abr.affrc.go.jp/) and Rice genome
annotation project (http://rice.plantbiology.msu.edu/). The genes were grouped according to
their annotation.
Results
Phenotypic variations for low soil P tolerance in the parents and RILs
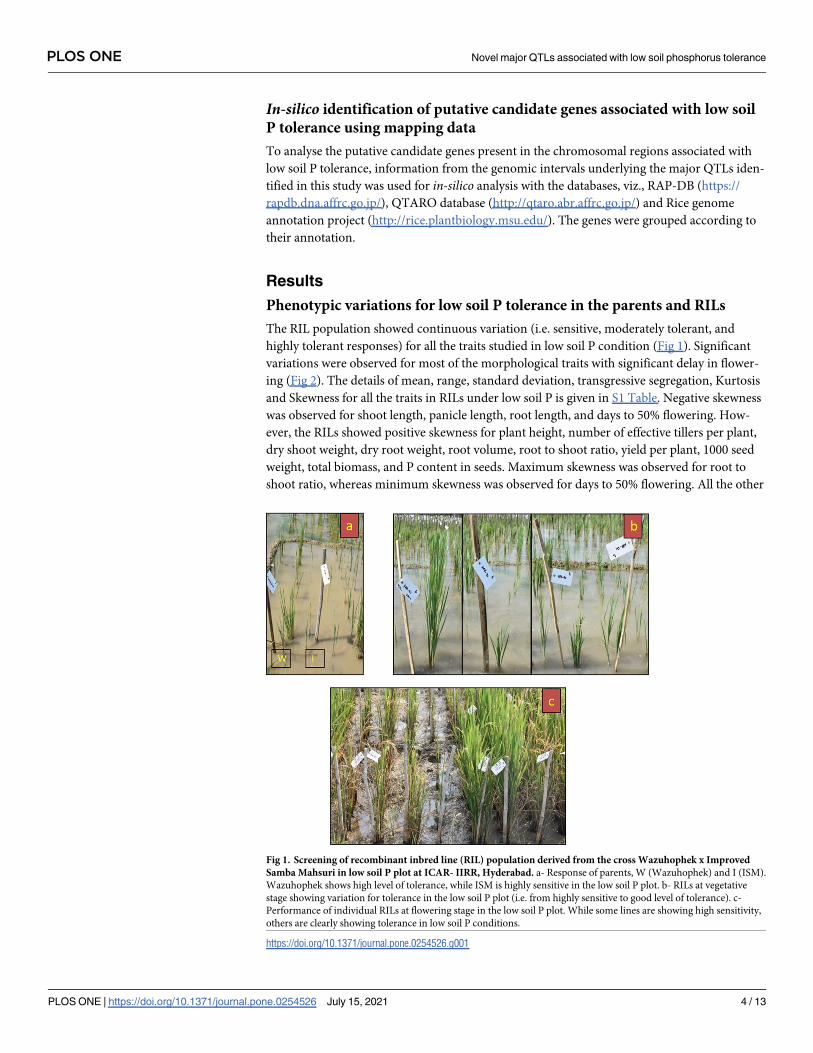
The RIL population showed continuous variation (i.e. sensitive, moderately tolerant, and
highly tolerant responses) for all the traits studied in low soil P condition (Fig 1). Significant
variations were observed for most of the morphological traits with significant delay in flower-
ing (Fig 2). The details of mean, range, standard deviation, transgressive segregation, Kurtosis
and Skewness for all the traits in RILs under low soil P is given in S1 Table. Negative skewness
was observed for shoot length, panicle length, root length, and days to 50% flowering. How-
ever, the RILs showed positive skewness for plant height, number of effective tillers per plant,
dry shoot weight, dry root weight, root volume, root to shoot ratio, yield per plant, 1000 seed
weight, total biomass, and P content in seeds. Maximum skewness was observed for root to
shoot ratio, whereas minimum skewness was observed for days to 50% flowering. All the other
Fig 1. Screening of recombinant inbred line (RIL) population derived from the cross Wazuhophek x Improved
Samba Mahsuri in low soil P plot at ICAR- IIRR, Hyderabad. a- Response of parents, W (Wazuhophek) and I (ISM).
Wazuhophek shows high level of tolerance, while ISM is highly sensitive in the low soil P plot. b- RILs at vegetative
stage showing variation for tolerance in the low soil P plot (i.e. from highly sensitive to good level of tolerance). c-
Performance of individual RILs at flowering stage in the low soil P plot. While some lines are showing high sensitivity,
others are clearly showing tolerance in low soil P conditions.
https://doi.org/10.1371/journal.pone.0254526.g001
PLOS ONE Novel major QTLs associated with low soil phosphorus tolerance
PLOS ONE | https://doi.org/10.1371/journal.pone.0254526 July 15, 2021 4 / 13
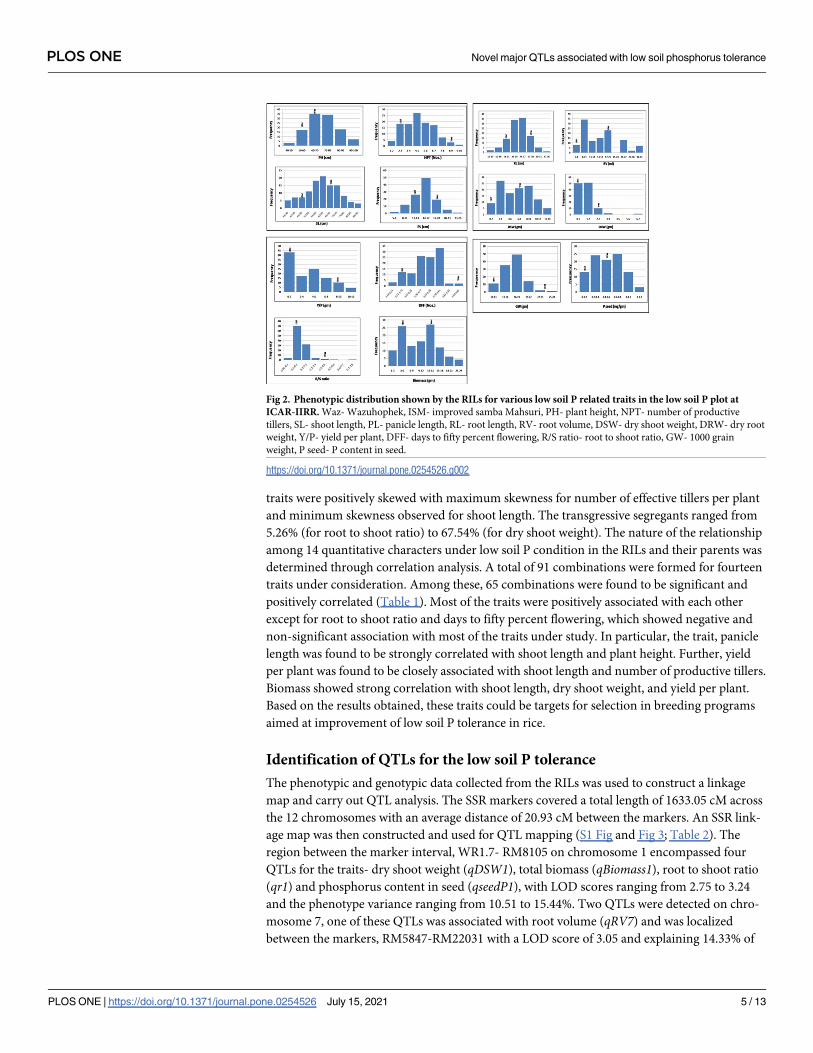
traits were positively skewed with maximum skewness for number of effective tillers per plant
and minimum skewness observed for shoot length. The transgressive segregants ranged from
5.26% (for root to shoot ratio) to 67.54% (for dry shoot weight). The nature of the relationship
among 14 quantitative characters under low soil P condition in the RILs and their parents was
determined through correlation analysis. A total of 91 combinations were formed for fourteen
traits under consideration. Among these, 65 combinations were found to be significant and
positively correlated (Table 1). Most of the traits were positively associated with each other
except for root to shoot ratio and days to fifty percent flowering, which showed negative and
non-significant association with most of the traits under study. In particular, the trait, panicle
length was found to be strongly correlated with shoot length and plant height. Further, yield
per plant was found to be closely associated with shoot length and number of productive tillers.
Biomass showed strong correlation with shoot length, dry shoot weight, and yield per plant.
Based on the results obtained, these traits could be targets for selection in breeding programs
aimed at improvement of low soil P tolerance in rice.
Identification of QTLs for the low soil P tolerance
The phenotypic and genotypic data collected from the RILs was used to construct a linkage
map and carry out QTL analysis. The SSR markers covered a total length of 1633.05 cM across
the 12 chromosomes with an average distance of 20.93 cM between the markers. An SSR link-
age map was then constructed and used for QTL mapping (S1 Fig and Fig 3; Table 2). The
region between the marker interval, WR1.7- RM8105 on chromosome 1 encompassed four
QTLs for the traits- dry shoot weight (qDSW1), total biomass (qBiomass1), root to shoot ratio
(qr1) and phosphorus content in seed (qseedP1), with LOD scores ranging from 2.75 to 3.24
and the phenotype variance ranging from 10.51 to 15.44%. Two QTLs were detected on chro-
mosome 7, one of these QTLs was associated with root volume (qRV7) and was localized
between the markers, RM5847-RM22031 with a LOD score of 3.05 and explaining 14.33% of
Fig 2. Phenotypic distribution shown by the RILs for various low soil P related traits in the low soil P plot at
ICAR-IIRR. Waz- Wazuhophek, ISM- improved samba Mahsuri, PH- plant height, NPT- number of productive
tillers, SL- shoot length, PL- panicle length, RL- root length, RV- root volume, DSW- dry shoot weight, DRW- dry root
weight, Y/P- yield per plant, DFF- days to fifty percent flowering, R/S ratio- root to shoot ratio, GW- 1000 grain
weight, P seed- P content in seed.
https://doi.org/10.1371/journal.pone.0254526.g002
PLOS ONE Novel major QTLs associated with low soil phosphorus tolerance
PLOS ONE | https://doi.org/10.1371/journal.pone.0254526 July 15, 2021 5 / 13
the phenotype variance. The other QTL on chromosome 7 was for P content in seed (denoted
as qSP7) and was located between the markers, RM21521-RM21103 with a LOD score of 2.87,
accounting for 10.01% to the phenotypic variation. Most of the major QTLs, including those
for yield and other key agro-morphological traits, were located on chromosome 8, between the
markers, RM22554 and RM8005. Thus, this region may be considered as a QTL hot-spot. A
total of ten QTLs were detected in this marker interval for different traits related to low soil P
tolerance, such as plant height (qPH-8), shoot length (qSL-8), number of productive tillers
(qNPT-8), panicle length (qPL-8), grain yield per plant, dry shoot weight (qDSW-8), root vol-
ume (qRV-8), total biomass (qBiomass-8), root to shoot ratio (qr-8), P content of seed (qseedP-
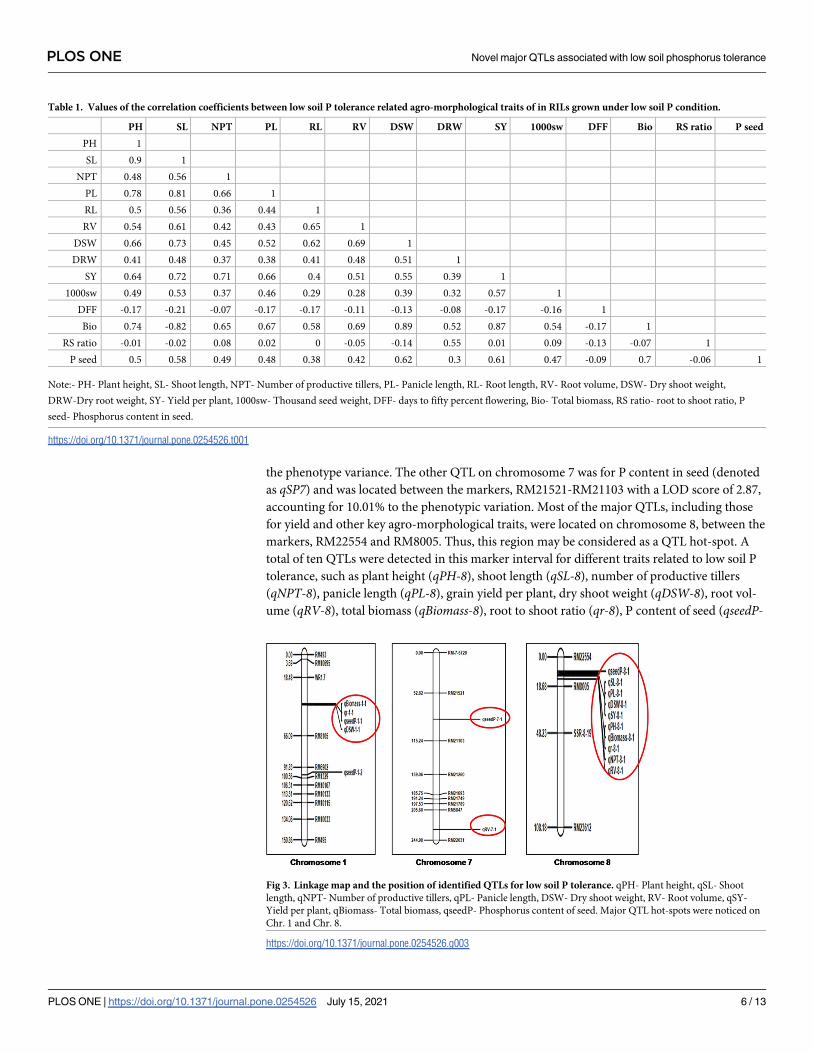
Table 1. Values of the correlation coefficients between low soil P tolerance related agro-morphological traits of in RILs grown under low soil P condition.
PH SL NPT PL RL RV DSW DRW SY 1000sw DFF Bio RS ratio P seed
PH 1
SL 0.9 1
NPT 0.48 0.56 1
PL 0.78 0.81 0.66 1
RL 0.5 0.56 0.36 0.44 1
RV 0.54 0.61 0.42 0.43 0.65 1
DSW 0.66 0.73 0.45 0.52 0.62 0.69 1
DRW 0.41 0.48 0.37 0.38 0.41 0.48 0.51 1
SY 0.64 0.72 0.71 0.66 0.4 0.51 0.55 0.39 1
1000sw 0.49 0.53 0.37 0.46 0.29 0.28 0.39 0.32 0.57 1
DFF -0.17 -0.21 -0.07 -0.17 -0.17 -0.11 -0.13 -0.08 -0.17 -0.16 1
Bio 0.74 -0.82 0.65 0.67 0.58 0.69 0.89 0.52 0.87 0.54 -0.17 1
RS ratio -0.01 -0.02 0.08 0.02 0 -0.05 -0.14 0.55 0.01 0.09 -0.13 -0.07 1
P seed 0.5 0.58 0.49 0.48 0.38 0.42 0.62 0.3 0.61 0.47 -0.09 0.7 -0.06 1
Note:- PH- Plant height, SL- Shoot length, NPT- Number of productive tillers, PL- Panicle length, RL- Root length, RV- Root volume, DSW- Dry shoot weight,
DRW-Dry root weight, SY- Yield per plant, 1000sw- Thousand seed weight, DFF- days to fifty percent flowering, Bio- Total biomass, RS ratio- root to shoot ratio, P
seed- Phosphorus content in seed.
https://doi.org/10.1371/journal.pone.0254526.t001
Fig 3. Linkage map and the position of identified QTLs for low soil P tolerance. qPH- Plant height, qSL- Shoot
length, qNPT- Number of productive tillers, qPL- Panicle length, DSW- Dry shoot weight, RV- Root volume, qSY-
Yield per plant, qBiomass- Total biomass, qseedP- Phosphorus content of seed. Major QTL hot-spots were noticed on
Chr. 1 and Chr. 8.
https://doi.org/10.1371/journal.pone.0254526.g003
PLOS ONE Novel major QTLs associated with low soil phosphorus tolerance
PLOS ONE | https://doi.org/10.1371/journal.pone.0254526 July 15, 2021 6 / 13
8) with LOD score ranging from 2.75 to 6.02, contributing 2.25 to 21.84% of phenotype vari-
ance. Out of seven major QTLs identified in the current study, five were located on chromo-
some 8 in the above mentioned marker interval and they were associated with the traits- plant
height (denoted as qPH-8) [LOD: 4.22 and PVE: 15.28%], shoot length (qSL-8) [LOD: 3.32 and
PVE: 17.25%], number of productive tillers (qNPT-8) [LOD: 6.02 and PVE: 21.84%], panicle
length (qPL-8) [LOD: 5.97 and PVE: 20.23%] and grain yield per plant (qSY-8) [LOD: 5.50 and
PVE: 18.50%]. The other two major QTLs were identified on chromosome 1 for biomass
(qBiomass-1) [LOD: 3.10 and PVE: 15.44%] and root to shoot ratio (qr) [LOD: 3.10 and PVE:
15.44%].
Epistatic interaction among the QTLs
A total of four significant epistatic interactions were observed for different component traits
associated with tolerance to low soil P. The genomic region on chromosome 8, between the
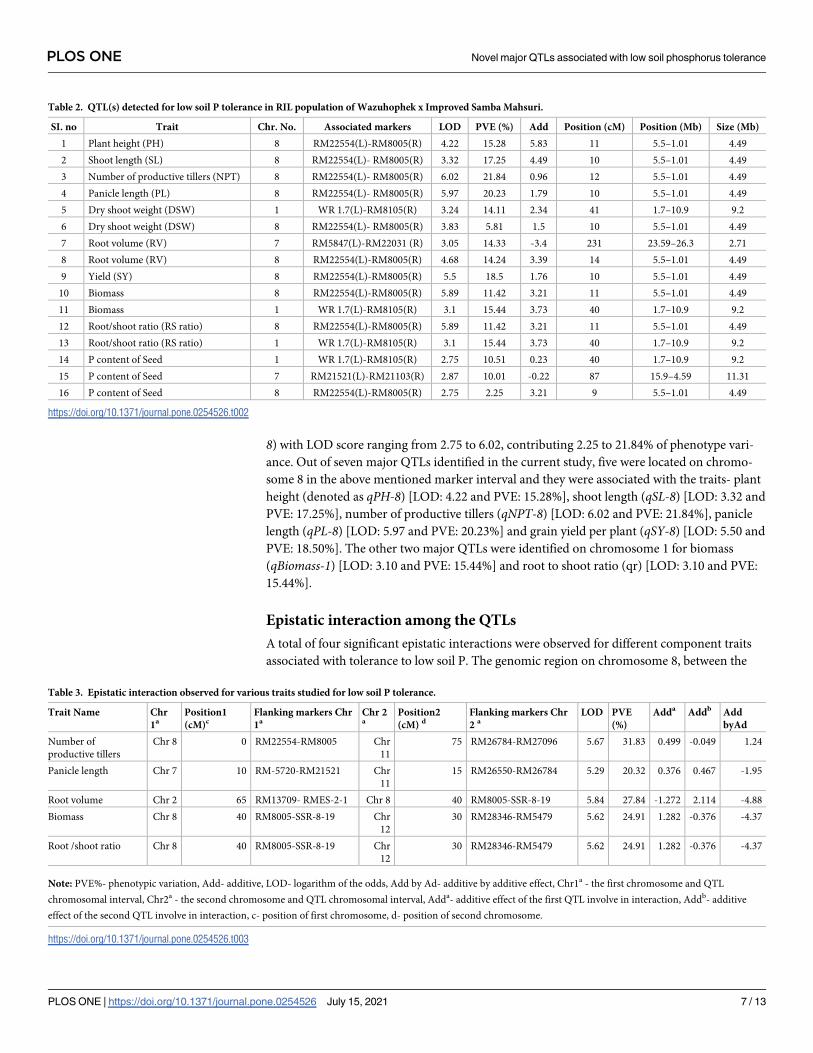
Table 2. QTL(s) detected for low soil P tolerance in RIL population of Wazuhophek x Improved Samba Mahsuri.
SI. no Trait Chr. No. Associated markers LOD PVE (%) Add Position (cM) Position (Mb) Size (Mb)
1 Plant height (PH) 8 RM22554(L)-RM8005(R) 4.22 15.28 5.83 11 5.5–1.01 4.49
2 Shoot length (SL) 8 RM22554(L)- RM8005(R) 3.32 17.25 4.49 10 5.5–1.01 4.49
3 Number of productive tillers (NPT) 8 RM22554(L)- RM8005(R) 6.02 21.84 0.96 12 5.5–1.01 4.49
4 Panicle length (PL) 8 RM22554(L)- RM8005(R) 5.97 20.23 1.79 10 5.5–1.01 4.49
5 Dry shoot weight (DSW) 1 WR 1.7(L)-RM8105(R) 3.24 14.11 2.34 41 1.7–10.9 9.2
6 Dry shoot weight (DSW) 8 RM22554(L)- RM8005(R) 3.83 5.81 1.5 10 5.5–1.01 4.49
7 Root volume (RV) 7 RM5847(L)-RM22031 (R) 3.05 14.33 -3.4 231 23.59–26.3 2.71
8 Root volume (RV) 8 RM22554(L)-RM8005(R) 4.68 14.24 3.39 14 5.5–1.01 4.49
9 Yield (SY) 8 RM22554(L)-RM8005(R) 5.5 18.5 1.76 10 5.5–1.01 4.49
10 Biomass 8 RM22554(L)-RM8005(R) 5.89 11.42 3.21 11 5.5–1.01 4.49
11 Biomass 1 WR 1.7(L)-RM8105(R) 3.1 15.44 3.73 40 1.7–10.9 9.2
12 Root/shoot ratio (RS ratio) 8 RM22554(L)-RM8005(R) 5.89 11.42 3.21 11 5.5–1.01 4.49
13 Root/shoot ratio (RS ratio) 1 WR 1.7(L)-RM8105(R) 3.1 15.44 3.73 40 1.7–10.9 9.2
14 P content of Seed 1 WR 1.7(L)-RM8105(R) 2.75 10.51 0.23 40 1.7–10.9 9.2
15 P content of Seed 7 RM21521(L)-RM21103(R) 2.87 10.01 -0.22 87 15.9–4.59 11.31
16 P content of Seed 8 RM22554(L)-RM8005(R) 2.75 2.25 3.21 9 5.5–1.01 4.49
https://doi.org/10.1371/journal.pone.0254526.t002
Table 3. Epistatic interaction observed for various traits studied for low soil P tolerance.
Trait Name Chr
1aPosition1
(cM)cFlanking markers Chr
1aChr 2a
Position2
(cM) dFlanking markers Chr
2 aLOD PVE
(%)
Adda Addb Add
byAd
Number of
productive tillers
Chr 8 0 RM22554-RM8005 Chr
11
75 RM26784-RM27096 5.67 31.83 0.499 -0.049 1.24
Panicle length Chr 7 10 RM-5720-RM21521 Chr
11
15 RM26550-RM26784 5.29 20.32 0.376 0.467 -1.95
Root volume Chr 2 65 RM13709- RMES-2-1 Chr 8 40 RM8005-SSR-8-19 5.84 27.84 -1.272 2.114 -4.88
Biomass Chr 8 40 RM8005-SSR-8-19 Chr
12
30 RM28346-RM5479 5.62 24.91 1.282 -0.376 -4.37
Root /shoot ratio Chr 8 40 RM8005-SSR-8-19 Chr
12
30 RM28346-RM5479 5.62 24.91 1.282 -0.376 -4.37
Note: PVE%- phenotypic variation, Add- additive, LOD- logarithm of the odds, Add by Ad- additive by additive effect, Chr1a - the first chromosome and QTL
chromosomal interval, Chr2a - the second chromosome and QTL chromosomal interval, Adda- additive effect of the first QTL involve in interaction, Addb- additive
effect of the second QTL involve in interaction, c- position of first chromosome, d- position of second chromosome.
https://doi.org/10.1371/journal.pone.0254526.t003
PLOS ONE Novel major QTLs associated with low soil phosphorus tolerance
PLOS ONE | https://doi.org/10.1371/journal.pone.0254526 July 15, 2021 7 / 13
marker interval of RM22554 and RM8005 (which is a QTL hot-spot) showed epistatic interac-
tion for the number of productive tillers with the region on chromosome 11, located between
the marker interval of RM26784 and RM27096 and this interaction contributed to 31.82% of
phenotypic variation. For the trait panicle length, epistatic interaction was observed between
genomic region on chromosome 7, flanked by the marker, RM5720 and RM21521 with geno-
mic region on chromosome 11, located between the marker interval of RM26550 and
RM26784 with 20.31% phenotypic variation. Another epistatic interaction was observed
between the genomic regions on chromosome 2 (flanked by marker interval, RM13709 and
RMES-2-1) and the genomic region on chromosome 8 (flanked by the marker interval,
RM8005 and SSR-8-19) for the trait, root volume, with a phenotypic variation of 27.83%. A
fourth significant epistatic interaction observed for the traits biomass and root to shoot ratio
between the genomic region on chromosome 8 (flanked by the marker interval, RM8005 and
SSR-8-19) and the genomic region on chromosome 12 (flanked by the marker interval,
RM28346 and RM5479) and this interaction contributed to 24.90% of the phenotypic variation
(S2 Fig; Table 3).
In-silico analysis of the genomic region spanning the major QTLs for
identification of putative candidate genes
In-silico identification of the genes present within the QTL interval on chromosome 1
(between the markers, WR 1.7 and RM 8105), revealed a total of 1339 genes encoding various
biological functions. Among them, 14 genes related to either phosphorus uptake or its utiliza-
tion were identified (S2 Table). Four of these genes are associated with auxin response and
may be related to root and cell growth. Other genes encode proteins of important functions
like acid phosphatase activity and related activities. A total of 10 QTLs were identified in the
genomic region (between the marker interval of RM22554 and RM8005) flanking the QTL
hotspot on chromosome 8. In-silico analysis of QTL hot-spot resulted in the identification of a
total of 538 genes. Among them, eight genes were found to be related to P uptake or utilization,
and others were related to genes encoding protein containing Myb, Zinc-finger domain, and
acid phosphatase or vanadium-dependent haloperoxidase related family proteins (S3 Table).
Discussion
Significant phenotypic variation has been observed in rice for different traits related to produc-
tivity under low soil P conditions, indicating the possibility of increasing rice production in P
poor soils [18–20]. Breeders are attempting to develop rice cultivars tolerant to soil P-defi-
ciency using the recently discovered and well characterized major QTL, Pup1 [10, 21] and
some success has been witnessed in this direction [12, 22, 23]. However, Pup1 is the only
major QTL associated with low soil P tolerance identified so far and there is an imminent need
to identify additional, novel, non-Pup1 type QTLs (and the genes underlying them) associated
with low P tolerance in rice. It is expected that such efforts will provide scope for developing
better low soil P tolerant varieties and possibly reduce application of P fertilizers in rice.
Through an earlier study [3], we identified a novel rice line, named Wazuhophek, which exhib-
ited excellent tolerance to low soil P levels and was devoid of Pup1 (S3 Fig). We hypothesized
that Wazuhophek might have novel mechanism(s) of tolerance to low soil P and may harbor
novel genes/QTLs associated with tolerance, with potential utility in breeding. Hence, we
developed a RIL population from Wazuhophek and used it for molecular mapping in the pres-
ent study.
Even though the number of markers used in this study and their density was considerably
lesser as compared to some previous studies [24, 25], we were successful in identifying at least
PLOS ONE Novel major QTLs associated with low soil phosphorus tolerance
PLOS ONE | https://doi.org/10.1371/journal.pone.0254526 July 15, 2021 8 / 13
seven major QTLs associated with different component traits of tolerance to low soil P, includ-
ing yield under low soil P. This was possible due to intensive phenotyping carried out under
natural field conditions coupled with molecular mapping using reasonably uniformly distrib-
uted set of rice SSR markers and deployment of a mapping population of optimal size.
Continuous distribution of phenotypic frequency of different traits associated with toler-
ance supports the quantitative inheritance of the traits associated with tolerance to low soil P
in Wazuhophek. We observed that low soil P-deficiency resulted in reduced shoot growth
based on low phenotypic values for traits like plant height, shoot dry weight, and total dry
weight, similar to the earlier report [24] and also in some of our earlier studies related to low
soil P tolerance [3, 26]. A near-normal platykurtic distribution observed for most of the traits
analyzed in this study suggests that there is a high frequency of RILs with intermediate pheno-
type and hence the component traits associated with low soil P tolerance is indeed controlled
by multiple loci (i.e. polygenic inheritance).
Similar to previous reports [8, 20, 27], in this study also, RILs with more productive tillers
per plant showed enhanced P deficiency tolerance. A correlation analysis was performed to
understand the nature of the relationship among the 14 quantitative characters, under low P
soil. Most of the component traits were correlated with each other and the genetic loci control-
ling these traits were in close proximity as reported previously [9, 24, 28, 29]. Root dry weight
and shoot dry weight showed relatively high correlation under low P condition and the num-
ber of productive tillers showed significant and positive association with root dry weight and
shoot dry weight and biomass as reported earlier [27]. Root length was significantly correlated
with root volume, root dry weight, and biomass, and plant height showed significantly positive
association with root volume, root dry weight, and biomass. These results are as per the earlier
report [24, 25]. Grain yield per plant displayed significant and positive association with root
length and 1000 grain weight and similar observations were reported earlier [30] in rice under
drought stress condition. Most of the tolerant RILs had more root elongation and more num-
ber of tillers compared to the other lines, as also noted in an earlier study [31].
RIL mapping populations, which are a series of homozygous lines, are the most commonly
used populations for reliable QTL mapping [32] as plants within a line will not show any dif-
ference and are expected to be homogenous. Earlier studies have identified QTLs related to
low soil P tolerance on chromosome 1 [25, 33]. In the present study a total of four co-located
QTLs were detected on chromosome 1, out of which two were minor QTLs for the traits, dry
shoot weight (qDSW1) (PVE-14.11%) and P content in seed (qSP1) (PVE-10.51) and the other
two were major QTLs for the traits, total biomass (qBiomass1) (PVE-15.44%) and root to
shoot ratio (qr1) (PVE-15.44%), located between the marker intervals of WR1.7- RM8105
(Table 2). A two-year field experiment under low P conditions has carried out and three yield
associated and eight phosphorus use efficiency-related traits were investigated in this study
and nine QTLs were identified for different traits, including a major one for PUE on chromo-
some 1 [33]. The QTL for biomass and P content of seed identified on chromosome 1 in this
study is at a location which is different from that of the major QTL identified earlier [33]. In
another study [25] backcross introgression lines (BILs) derived from an inter-specific cross
(Oryza sativa L. and O. rufipogon Griff.) used for molecular mapping of P deficiency tolerance
related traits and identified QTLs on chromosome 1 for relative root dry weight, relative shoot
dry weight, relative root length, relative shoot fresh weight and relative total biomass dry
weight. Additional QTLs on Chromosome 1 have been identified for P deficiency related traits
like relative total dry weight and P-deficiency induced activity of acid phosphatase [24, 34].
However, all these QTLs identified earlier were mapped at locations on chromosome 1, which
is different from the location of QTLs identified in this study. In earlier studies, QTLs respon-
sible for traits associated with tolerance to low soil P conditions have been identified on
PLOS ONE Novel major QTLs associated with low soil phosphorus tolerance
PLOS ONE | https://doi.org/10.1371/journal.pone.0254526 July 15, 2021 9 / 13

chromosome 8 [25, 33]. Among them, one of the QTLs was associated with relative root dry
weight with LOD score of 2.53 and it contributed for 6.13% of phenotypic variation [25]. Fur-
ther, two QTLs were identified on Chromosome 8 for P translocation and P translocation effi-
ciency and they contributing for 5% and 7.5% of phenotypic variation, respectively [33].
However, none of the earlier identified QTLs on chromosome 8 are at location similar to the
QTL hotspot identified on Chr. 8 in this study. Hence, the QTLs identified in the hotspot in
our study can be considered novel and they will certainly be useful in breeding for low soil P
tolerance, as the LOD and PVE values are considerably higher as compared to those identified
in earlier studies.
Epistasis is defined as the deviation from the sum of the independent effect of individual
genes controlling quantitative traits. It is a non-allelic interaction that may change the magni-
tude of the phenotypic expression of the QTLs by suppressing/enhancing the expression of the
interacting genes [35, 36]. In the current study, negative epistatic interactions were observed
for panicle length, root volume, biomass and root to shoot ratio, whereas number of produc-
tive tillers exhibited positive epistatic interaction (Table 3). Very few epistatic interactions
have been observed in the present study, which may be due to background noise interference.
Four out of five epistatic interactions were specific for the genomic region located on Chromo-
some 8 flanked by the markers RM22554, RM8005, and SSR-8-19, which indicates the active
involvement of this hotspot region with low P soil deficiency tolerance (Table 3; S2 Fig).
In order to identify key putatively expressed candidate genes in the genomic region span-
ning the major QTLs, we carried out in silico analysis. We identified some genes of interest
and they may be possibly related to P uptake and utilization in rice. These genes include genes
related to auxin responsive activity, acid phosphatase activity, protein with the SPX domain,
WD40 protein and SHR transcription factors which contribute to morphological and physio-
logical changes in plants involved in low soil P tolerance which also reported in earlier studies
[37–40].These genes need to be cloned and further to draw any meaningful conclusions about
their possible role in low soil P tolerance in Wazuhophek. In previous study Nagina22 mutants
screened under low P and alternative wet and dry condition to identify marker associated with
yield traits under these conditions and the selected mutants and associated markers identified
in this study can be used for breeding programme and gene discovery for low soil P tolerance
and alternative wet and dry condition [41]. In conclusion, this study has identified seven
major and nine minor effect QTLs and a major QTL hotspot on chromosome 8 for low soil P
tolerance from the donor, Wazuhophek and they are different from the QTLs associated with
the trait discovered in earlier studies. Fine-structure mapping of the major QTL hot-spot
region identified in this study using high-throughput SNP markers coupled with in-silico can-
didate gene identification in the fine-mapped region and their analysis and characterization
using QTL-NILs will offer further insights into the molecular mechanisms associated with the
tolerance to low soil P in Wazuhophek. Further, the major QTLs/QTL hot-spot region identi-
fied from the present study on chromosome 8 can be transferred into elite rice varieties, which
are sensitive to low soil P levels, through marker-assisted breeding along with the other major
QTL, Pup1 to enhance the level of tolerance and to improve P-use-efficiency. In addition RILs
with novel QTL for low P tolerance can also be used in various crossing programs.
Supporting information
S1 Fig. Linkage map and the position of identified QTL for low soil P tolerance.
(TIF)
S2 Fig. Epistatic interaction observed for various traits studied for low soil P tolerance.
NPT- number of productive tillers, PL- panicle length, RV- root volume, root/shoot- root to
PLOS ONE Novel major QTLs associated with low soil phosphorus tolerance
PLOS ONE | https://doi.org/10.1371/journal.pone.0254526 July 15, 2021 10 / 13
shoot ratio.
(TIF)
S3 Fig. Haplotype information of chromosome 12 in respective to Pup1/non Pup1 allele.
A:- chromosomal region of chromosome 12 other than Pup1 allele, K:- Kasalath specific Pup1allele, N:- Improved samba Mahsuri/ Wazuhophek specific non Pup1 allele.
(TIF)
S1 Table. Descriptive statistical data of yield and yield related traits obtained under low
soil P condition.
(DOC)
S2 Table. List of annotated genes present within QTL intervals on chromosome 1, related
to phosphorus utilization and uptake.
(DOC)
S3 Table. List of annotated genes present within QTL intervals on chromosome 8, related
to phosphorus utilization and uptake.
(DOC)
Acknowledgments
The authors are thankful to the Director of ICAR-Indian Institute of Rice Research for con-
tributing the required lab facilities and Institute of biotechnology PJTSAU, Telangana for pro-
viding the facilities and encouragement.
Author Contributions
Conceptualization: Ravindra Ramrao Kale, Ch. V. Durga Rani, V. P. Bhadana, R. M.
Sundaram.
Data curation: Ravindra Ramrao Kale, M. Anila, H. K. Mahadeva Swamy, P. Senguttuvel, M.
Ayyappa Dass, R. M. Sundaram.
Formal analysis: Ravindra Ramrao Kale, M. Anila, H. K. Mahadeva Swamy, P. Senguttuvel, D.
Subrahmanyam, K. Swapnil, M. S. Anantha, B. Laxmi Prasanna, G. Rekha, P. Sinha, S. K.
Hajira, P. Brajendra, Pawandeep Singh, R. M. Sundaram.
Investigation: Ravindra Ramrao Kale, M. Ayyappa Dass, K. Swapnil, E. Punniakotti, B. Laxmi
Prasanna, G. Rekha, P. Sinha, M. B. V. N. Kousik, T. Dilip, S. K. Hajira, R. M. Sundaram.
Methodology: Ravindra Ramrao Kale.
Resources: V. P. Bhadana, M. S. Anantha, P. Brajendra, Mangaldeep Tuti, R. Mahendrakumar,
R. M. Sundaram.
Supervision: Ch. V. Durga Rani, M. Anila, P. Senguttuvel, D. Subrahmanyam, P. Brajendra,
C. Gireesh, R. Mahendrakumar, Jitendra Giri, R. M. Sundaram.
Writing – original draft: Ravindra Ramrao Kale, R. M. Sundaram.
Writing – review & editing: Ravindra Ramrao Kale, Ch. V. Durga Rani, M. Anila, H. K.
Mahadeva Swamy, V. P. Bhadana, S. K. Mangrauthia, Jitendra Giri, Pawandeep Singh, R.
M. Sundaram.
PLOS ONE Novel major QTLs associated with low soil phosphorus tolerance
PLOS ONE | https://doi.org/10.1371/journal.pone.0254526 July 15, 2021 11 / 13

References1. Khush GS. What it will take to feed 5.0 billion rice consumers in 2030. Plant Molecular Biology. 2005;
59: 1–6. https://doi.org/10.1007/s11103-005-2159-5 PMID: 16217597
2. Dobermann A, Fairhurst T. Rice: Nutrient disorders & nutrient management. Handbook series. Pot-
ash& Phosphate Institute (PPI), Potash & Phosphate Institute of Canada (PPIC) and International Rice
Research Institute. 2000; 191.
3. Swamy Mahadeva HK, Anila M, Kale RR, Bhadana VP, Anantha MS, Brajendra P, et al. Phenotypic
and molecular characterization of rice germplasm lines and identification of novel source for low soil
phosphorus tolerance in rice. Euphytica. 2019; 215:18.
4. Vance CP, Uhde-Stone C, Allan DL. Phosphorus acquisition and use: critical adaptations by plants for
securing a non-renewable resource. New Phytologist. 2003; 157:423–47.
5. Lo´pez-Arredondo DL, Leyva-Gonz´alez MA, Gonz´alez-Morales SI, Lo´pezBucio J, Herrera-Estrella L.
Phosphate Nutrition: Improving LowPhosphate Tolerance in Crops. Annual Review of Plant Biology.
2014; 65:95–123. https://doi.org/10.1146/annurev-arplant-050213-035949 PMID: 24579991
6. Hinsinger P. Bioavailability of soil inorganic P in the rhizosphere as affected by root-induced chemical
changes: a review. Plant Soil. 2001; 237:173–81.
7. Tyagi W, Rai M, Dohling AK. Haplotype analysis for Pup1 locus in rice genotypes of North-Eastern and
Eastern India to identify suitable donors tolerant to low phosphorus. SABRAO Journal of Breeding and
Genetics. 2012; 44:398–405.
8. Wissuwa M, Ae N. Genotypic variation for tolerance to phosphorus deficiency in rice and the potential
for its exploitation in rice improvement. Plant Breeding.2001; 120: 43–48.
9. Wissuwa M, Yano M, Ae N. Mapping of QTLs for phosphorus deficiency tolerance in rice (Oryza sativa
L.). Theoretical and Applied Genetics. 1998; 97:777–783.
10. Gamuyao R, Chin HJ, Tanaka JP, Pesaresi P, Catausan S, Dalid C, et al. The protein kinase Pstol1
from traditional rice confers tolerance of phosphorus deficiency. Nature. 2012; 88:535–541. https://doi.
org/10.1038/nature11346 PMID: 22914168
11. Sundaram RM, Vishnupriya MR, Biradar SK, Laha GS, Reddy AG, Rani NS, et al. Marker assisted intro-
gression of bacterial blight resistance in Samba Mahsuri, an elite indica rice variety. Euphytica. 2008;
160:411–422
12. Anila M, Mahadeva Swamy H K, Kale R R, Bhadana VP, Anantha MS, Brajendra, et al. Breeding lines
of the Indian mega-rice variety, MTU 1010, possessing protein kinase OsPSTOL (Pup1), show better
root system architecture and higher yield in soils with low phosphorus. Mol Breeding. 2018; 38:147.
13. Murray MG, Thompson WF. Rapid isolation of high molecular weight plant DNA. Nucleic Acids
Research. 1980; 8:4321. https://doi.org/10.1093/nar/8.19.4321 PMID: 7433111
14. Meng L, Li H, Zhan L, Wang J. QTL IciMapping: Integrated software for genetic linkage map construc-
tion and quantitative trait locus mapping in biparental populations. The Crop Journal. 2015; 3(3):269–
283.
15. Kosambi DD. The estimation of map distances from recombination values. Annals of Eugenics. 1944;
12: 172–175.
16. McCouch SR, Cho YG, Yano M, Paul E, Blinstrub M. Report on QTL nomenclature. Rice Genetics
News letter. 1997; 14: 11–13.
17. Liu J, Shikano T, Leinonen T, Cano JM, Li MH, Merila J. Identification of Major and Minor QTL for Eco-
logically Important Morphological Traits in Three-Spined Sticklebacks (Gasterosteus aculeatus) G3
(Bethesda). 2014; 4(4): 595–604. https://doi.org/10.1534/g3.114.010389 PMID: 24531726
18. Fageria NK, Wright RJ, Baligar VC. Rice cultivar evaluation for phosphorus use efficiency. Journal of
Plant Nutrition and Soil Science. 1988; 111:105–109.
19. Akinrinde EA, Gaizer T. Differences in the performance and phosphorus use efficiency of some tropical
rice (Oryza sativa L.) varieties. Pakistan Journal of Nutrition. 2006; 5(3): 206–211.
20. Aluwihare C, Ishan M, Chamikara MDM, Weebadde CK, Sirisena DN, Samarasinghe WLGet al. Char-
acterization and selection of phosphorus deficiency tolerant rice genotypes in Sri Lanka. Rice Science.
2016; 23(4):184–195.
21. Wissuwa M, Wegner J, Ae N, Yano M. Substitution mapping of Pup1: a major QTL increasing phospho-
rus uptake of rice from a phosphorus-deficient soil. Theoretical and Applied Genetics. 2002; 105:890–
897. https://doi.org/10.1007/s00122-002-1051-9 PMID: 12582914
22. Chin JH, Gamuyao, Dalid C, Bustamam M, Prasetiyono J, Moeljopawiro S, et al. Developing rice with
high yield under phosphorus deficiency: Pup1 sequence to application1. Plant Physiology. 2011; 156
(3): 1202–1216. https://doi.org/10.1104/pp.111.175471 PMID: 21602323
PLOS ONE Novel major QTLs associated with low soil phosphorus tolerance
PLOS ONE | https://doi.org/10.1371/journal.pone.0254526 July 15, 2021 12 / 13
23. Chithrameenal K, Alagarasan G, Raveendran M, Robin S, Meena S, Ramanathan A, et al. Genetic
enhancement of phosphorus starvation tolerance through marker assisted introgression of OsPSTOL1
gene in rice genotypes harbouring bacterial blight and blast resistance.PLoSONE.2018; 13(9):
e0204144. https://doi.org/10.1371/journal.pone.0204144 PMID: 30260973
24. Li Z, Xie Y, Dai A, Liu L. Root and shoot traits responses to phosphorus deficiency and QTL analysis at
seedling stage using introgression lines of rice. Journal of Genetics and Genomics. 2009; 36:173–183.
https://doi.org/10.1016/S1673-8527(08)60104-6 PMID: 19302973
25. Luo X, Liu J, Dai L, Zhang F, Wan Y, Xie J. Linkage map construction and QTL identification of P-defi-
ciency tolerance in Oryza rufipogon Griff. at early seedling stage. Euphytica. 2017; 213:96.
26. Kale RR, Anila M, Mahadeva Swamy HK, Bhadana VP, Durga Rani ChV, Senguttuve P, et al. Morpho-
logical and molecular screening of rice germplasm lines for low soil P tolerance. Journal of Plant Bio-
chemistry and Biotechnology. 2020; https://doi.org/10.1007/s13562-020-00586-5
27. Chankaew S, Monkham T, Pinta W, Sanitchon J, Kaewpradit W, Srinives P. Screening Tolerance to
Phosphorus Deficiency and Validation of Phosphorus Uptake 1 (Pup1) Gene- Linked Markers in Thai
Indigenous Upland Rice Germplasm. Agronomy2019; 9:81.
28. Fageria NK, Santos AB. Rice and common bean growth and nutrient concentration as influenced by alu-
minium on an acid lowland soil. Journal of Plant Nutrition. 1998; 21:903–912.
29. Zhang Y, Anis GB, Wang R, Wu W, Yu N, Shen X, et al. Genetic dissection of QTL against phosphate
deficiency in the hybrid rice ‘Xieuoy9308’. Plant Growth Regulator. 2017; 1–11.
30. Haider Z, Khan S, Zia S. Correlation and Path Coefficient Analysis of Yield Components in Rice (Oryza
sativa L.) Under Simulated Drought Stress Condition. American-Eurasian J. Agric. & Environ. Sci.
2012; 12 (1):100–104.
31. Shimizu A, Kato K, Komatsu A, Motomura K, Ikehashi H. Genetic analysis of root elongation induced by
phosphorus deficiency in rice (Oryza Sativa L.): fin QTL mapping and multivariate analysis of related
traits. Theoretical and Applied Genetics. 2008; 117:987–996. https://doi.org/10.1007/s00122-008-
0838-8 PMID: 18641966
32. Qu Y, Mu P, Zhang H, Chen CY, Gao Y, Tian Y, et al. Mapping QTL of root morphological traits at differ-
ent growth stages in rice. Genetica. 2008; 133: 187–200. https://doi.org/10.1007/s10709-007-9199-5
PMID: 17823843
33. Wang K, Cui K, Liu G, Xie W, Yu H, Pan J, et al. Identification of quantitative trait loci for phosphorus
use efficiency traits in rice using a high density SNP map. BMC Genetics. 2014; 15:155. https://doi.org/
10.1186/s12863-014-0155-y PMID: 25551672
34. Hu B, Wu P, Liao CY, Zhang WP, Ni JJ. QTLs and epistasis underlying activity of acid phosphatase
undr phosphorus sufficient and deficient condition in rice (Oryza sativa L.). Plant and Soil. 2001;
230:99–105.
35. Mackay IJ, Bansept-Basler P, Barber T, Bentley AR, Cockram J, Gosman N, et al. An eight-parent mul-
tiparent advanced generation inter-cross population for winter-sown wheat: creation, properties, and
validation. G3 (Bethesda). 2014; 4(9): 1603–1610. https://doi.org/10.1534/g3.114.012963 PMID:
25237112
36. Rahman MA, Bimpong IK, Bizimana JB, Pascual ED, Arceta M, Mallikarjuna Swamy B P, et al. Mapping
QTLs using a novel source of salinity tolerance from Hasawi and their interaction with environments in
rice. Rice (N Y) 2017; 10: 47. https://doi.org/10.1186/s12284-017-0186-x PMID: 29098463
37. Wang Z, Han H, Huang H, Duan K, Zhongchang W, Wu P. Regulation of OsSPX1 and OsSPX3 on
Expression of OsSPX domain Genes and Pi starvation SIGNALING in Rice. Journal of Integrative Plant
Biology. 2009; 51(7): 663–674. https://doi.org/10.1111/j.1744-7909.2009.00834.x PMID: 19566645
38. Kong D, Li M, Dong Z, Ji H, Li X. Identification of TaWD40D, a wheat WD40 repeat-containing protein
that is associated with plant tolerance to abiotic stresses. Plant Cell Report. 2015; 34(3):395–410.
https://doi.org/10.1007/s00299-014-1717-1 PMID: 25447637
39. Guerriero G, Hausman JF, Ezcurra I. WD40-Repeat Proteins in Plant Cell Wall Formation: Current Evi-
dence and Research Prospects. Frontiers of Plant Science. 2015; 6:1112. https://doi.org/10.3389/fpls.
2015.01112 PMID: 26734023
40. Della Rovere F, Fattorini L, D’Angeli S, Veloccia A, Del Duca S, Cai G, et al. Arabidopsis SHR and SCR
transcription factors and AUX1 auxin influx carrier control the switch between adventitious rooting and
xylogenesis in planta and in in vitro cultured thin cell layers. Annals of Botany. 2015; 115:617–628.
https://doi.org/10.1093/aob/mcu258 PMID: 25617411
41. Yugandhar P, Basava RK, Desiraju S, Voleti S, Sharma RP, Neelamraju S. Identifying markers associ-
ated with yield traits in Nagina22 rice mutants grown in low phosphorus field or in alternate wet/dry con-
ditions. Australian Journal of Crop Science. 2017; 11(05):548–556.
PLOS ONE Novel major QTLs associated with low soil phosphorus tolerance
PLOS ONE | https://doi.org/10.1371/journal.pone.0254526 July 15, 2021 13 / 13