Phosphorus export from agricultural land: a simple approach
12
This article appeared in a journal published by Elsevier. The attached copy is furnished to the author for internal non-commercial research and education use, including for instruction at the authors institution and sharing with colleagues. Other uses, including reproduction and distribution, or selling or licensing copies, or posting to personal, institutional or third party websites are prohibited. In most cases authors are permitted to post their version of the article (e.g. in Word or Tex form) to their personal website or institutional repository. Authors requiring further information regarding Elsevier’s archiving and manuscript policies are encouraged to visit: http://www.elsevier.com/copyright
Transcript of Phosphorus export from agricultural land: a simple approach

This article appeared in a journal published by Elsevier. The attachedcopy is furnished to the author for internal non-commercial researchand education use, including for instruction at the authors institution
and sharing with colleagues.
Other uses, including reproduction and distribution, or selling orlicensing copies, or posting to personal, institutional or third party
websites are prohibited.
In most cases authors are permitted to post their version of thearticle (e.g. in Word or Tex form) to their personal website orinstitutional repository. Authors requiring further information
regarding Elsevier’s archiving and manuscript policies areencouraged to visit:
http://www.elsevier.com/copyright

Author's personal copy
Research Paper: SWdSoil and Water
Phosphorus export from agricultural land:a simple approach
A. Leonea,*, M.N. Ripaa, L. Bocciab, A. Lo Portoc
aTuscia University, DAF – Environment and Forestry Department, Agricultural Engineering Section, Viterbo, ItalybNaples University ‘Federico II’, Agricultural Engineering Department, Portici-Naples, ItalycItalian National Research Council, Water Resources Research Institute, IRSA-CNR, Bari, Italy
a r t i c l e i n f o
Article history:
Received 30 January 2006
Received in revised form
7 November 2007
Accepted 15 July 2008
Published online 11 September 2008
In the last few decades, increased inputs of nutrients (mostly nitrogen and phosphorus) to
agricultural land have led to runoff transporting an ever growing portion of these nutrients
from non-point (diffuse) pollution sources into rivers and lakes, thus threatening fresh-
water quality.Phosphorus (P), the focus of the present paper, is principally transported from agricultural
land bound to sediments and can accelerate freshwater eutrophication. Two fundamental
problems face land managers when dealing with the problem of non-point P pollution. The
first is posed by the quantitative evaluation of P loads at basin scale, which is essential in
assessing areas of higher export risk and transport pathways. The second is finding
a satisfactory compromise between two opposing needs: simplicity, to satisfy manage-
ment, and complexity, to interpret real processes and their related uncertainty. Uncer-
tainty is not merely the uncertainty that is intrinsic to model simulations, but also that
deriving from the inherent stochastic variability of real systems.In the present study, an attempt to maximise the advantages of both approaches was
made. The Lake Vico basin, Central Italy, was selected as a suitable site, since the P
concentration of the lake increased dramatically at the beginning of the 1990s, due to P
non-point pollution source loads.The simulation model (Groundwater Leaching Effects of Agricultural Management
Systems, GLEAMS) was used to evaluate field scale P losses in two different scenarios:
conventional and conservative agricultural practices. A regression model for each of these
two scenarios was then fitted, to find the best relation between slope, on the one hand, and
P losses. This regression allowed the GLEAMS results to be extended to basin scale, by
a digital terrain model and a geographic information system (GIS), making it possible to
evaluate P export into the lake, thus meeting management needs. The accuracy of this type
of approach was evaluated by comparing model predictions with monitored results of P
concentration in water.The suggested approach offers solutions to several problems regarding land management
sustainability, including: (i) a quantitative evaluation of different land management
scenarios; (ii) the possibility of zoning landscape according to risk level, comparing
Abbrevations: BMPs, best management practices; CAP, Common Agriculture Policy; CN, Curve Number; GIS, geographic information system;GLEAMS, Groundwater Leaching Effects of Agricultural Management Systems; L/R, Length Ratio; LU/LC, land use/land cover; NPS, non-pointpollution sources; P, Phosphorus; PDR, phosphorus delivery ratio; SCS, Soil Conservation Service; SDR, sediment delivery ratio.
* Corresponding author.E-mail address: [email protected] (A. Leone).
Avai lab le at www.sc iencedi rect .com
journa l homepage : www. e l sev i er . com/ locate / i ssn /15375110
1537-5110/$ – see front matter ª 2008 IAgrE. Published by Elsevier Ltd. All rights reserved.doi:10.1016/j.biosystemseng.2008.07.005
b i o s y s t e m s e n g i n e e r i n g 1 0 1 ( 2 0 0 8 ) 2 7 0 – 2 8 0

Author's personal copy
different scenarios and related environmental efficiency; (iii) an integrated evaluation of
land cover, in terms of its impact on freshwater ecological status and the long-term water
body condition, as a consequence of land use.
ª 2008 IAgrE. Published by Elsevier Ltd. All rights reserved.
1. Introduction
There is a worldwide, growing consensus for the need to
reconcile agricultural policies and the environment. Intensi-
fication of land use has created environmental problems
through the increased use of fertilisers, pesticides, water
resources, equipment, and additional feeds for livestock. In
Europe, there has been progress towards integrating the EU
agriculture and environmental policies since 1992, when
a reform of the Common Agriculture Policy (CAP) was agreed
on and the Fifth Action Programme was adopted.
Water pollution is probably the main threat to agricultural
environmental sustainability. It mainly derives from diffuse,
non-point pollution sources (NPS), where pollution results
from sources that are dispersed across a watershed
(sediments, animal wastes, plant nutrients, crop residues,
inorganic salts and minerals, pesticides) and arise from land
use/land cover (LU/LC), and not from a pipe (White and Howe,
2004).
In the last 50 years, there has been a major shift in the
agricultural sector from family subsistence farming, to large
commercial, mostly mono-cultural agro-businesses. This
change has led to excessive diffuse pollution and an unsus-
tainable adverse impact on the environment, above all on
water bodies, due to the loss of fertilisers from fields and
related export into surface and ground water (Novotny, 2005).
In this context, freshwater eutrophication is one of the most
pressing concerns (Arheimer et al., 2004).
Non-point sources originate from storm water runoff or
percolation, which carries pollutants into receiving water.
Hence, they depend on the complex interaction among many
factors: input quantities to the land; climate; drainage net
characteristics: soil kind; topography; presence in the land-
scape of buffer systems (riparian vegetation, hedges and
wetlands, that intercept sediments and runoff or denitrify
water or uptake nutrients etc.). Hence, change in water quality
due to NPS indicates a change in some aspects of the climatic,
terrestrial, riparian or in-channel ecosystem and in LU/LC.
The relevance of NPS to water quality and the role of
agriculture as a major source of NPS pollutants are confirmed
by both scientific literature and technical reports (Omernick
et al., 1981; Sharpley et al., 1994; Heathwaite and Sharpley,
1999; Heathwaite, 2003; Novotny, 2005).
Reliable estimations of diffuse pollutant exports at basin
scale are fundamental to an understanding of possible hazard
for the aquatic systems and, thus, are critical to the develop-
ment of strategies to limit negative effects on freshwater. The
principal challenge lies in the fact that diffuse pollution
effectively operates outside ‘traditional’ mechanisms of
structural control; until recently almost all water pollution
abatement efforts were aimed at water treatment plants in
order to control point sources flowing into receiving waters.
The focus for NPS is on land management that affects water
quality by influencing sediment yield, chemical loads, water-
shed hydrology and other processes, such as nutrient deten-
tion and transformation zones, dissolved or suspended
nutrients or sediment mobilisation zones, i.e. areas where
sediments move downstream (Basnyat et al., 1999).
Thus, although landscape ‘controls’ NPS production, there
is always potential for improving water quality with proper
landscape management (Haycock and Muscutt, 1995; Garnier
et al., 1998; US-EPA, 2000; White and Howe, 2004), whose main
tool consists in the promotion of best management practices
(BMPs) (Turpin et al., 2005). It is also necessary to manage the
many aspects of LU/LC, topography, climate, soils and the
related complex interactions that regulate NPS production and
consequent pollutant input–output. For instance, the study by
Pote et al. (1996, referred by Sharpley et al., 2002), who
measured very variable total P losses (from 0.05 to
0.35 kg [P]ha�1), from three sites with very low soil P content
(285–295 ppm), showed that erosion, rather than soil P content,
accounted for relevant differences in P losses between sites,
revealing just how chaotic NPS behaviour can be.
It is therefore necessary to make another shift in
perspective towards a more integrated approach, analysing
the joint contribution of multiple land use activities, their
environmental context and related consequences on
receiving waters. Little has been done in this sense, despite
numerous studies on the effects of individual LU/LC types.
Investigating the export into water bodies of phosphorus
(P), whose role in freshwater eutrophication is well known
(Sharpley et al., 1994; Correll, 1998), involves evaluating the
coincidence of both source and transport factors. In order to
produce satisfactory models that could be used to manage the
environmental impact of P non-point source water pollution,
would require very long detailed and expensive monitoring.
However, it is not at all certain that the processes can be
‘deterministically’ described by models, considering their
chaotic behaviour. In fact, it is not clear whether large, over
parameterised, deterministic models can be satisfactory
because it is almost impossible to validate them (Heathwaite,
2003).
Land managers should be aware of these limitations when
deciding which kind of model and what consequent method
to adopt (Lewis and McGechan, 2002). Scientific literature
offers very different approaches, aimed at estimating the
watershed nutrient losses of water. But in each case, planning
land use and modelling its consequences (both at field and
basin scale) are the key factors in control strategies.
The methods of evaluating phosphorus export into fresh-
water can be summarised as follows:
(1) Methods that consider simple export coefficients. These
coefficients depend only on land use (Dillon and Kirchner,
b i o s y s t e m s e n g i n e e r i n g 1 0 1 ( 2 0 0 8 ) 2 7 0 – 2 8 0 271

Author's personal copy
1975; Beaulac and Reckhow, 1982) or methods based on
some synthetic indices of hydrological or soil character-
istics (Frink 1991; Mattikalli and Richards, 1996).
In this category, the most complete analysis, is probably
the USDA-Natural Resources Conservation Service NRCS P
index (Lemunyon and Gilbert, 1993; Gburek et al., 2000),
which incorporates source characteristics (soil test P, fer-
tilisers and manure inputs) and transport characteristics
(runoff and erosion), at field scale.
This approach has the advantage of simple and imme-
diate application, but of necessity it cannot interpret
complex environment–anthropogenic interactions. Hence,
it satisfies the management requirement of a ‘simple and
easy to apply’ method. On the other hand, it is neither able
to interpret complexity, nor the effectiveness of the best
management practice (BMP) choice in the specific context.
(2) Running field scale, dynamic, physics based management
models, such as Groundwater Leaching Effects of Agricul-
tural Management Systems (GLEAMS) (Knisel, 1993) or
similar (see the review of Lewis and McGechan, 2002).
These have the advantage of focussing on the details of LU/
LC management and its related environmental context
(topography, soils, climate), based on physics, not based on
simple scores. Hence, they are optimal tools for interpret-
ing environment–anthropogenic interaction complexities
and evaluate BMP effectiveness. The limitation of such
models is the small area involved (a single landscape unit:
one slope, one soil, one microclimate etc.), lacking the real
loads for water bodies, which implies export into fresh-
water at basin scale.
(3) Running basin scale, dynamic models, such as Soil and
Water Assessment Tool (SWAT) (Arnold et al., 1996) or
Areal Non-point Source Watershed Environment Response
Simulation (ANSWERS) (Bouraoui and Dillaha, 1996). These
kinds of models have the advantage of involving a wide
area, often with highly detailed information, which is, at
the same time, their main limitation, since they require
a large quantity of input data for the whole basin, which
are rarely available. Thus, validation is much more difficult
or, more usually, impossible.
As a consequence of these considerations, all these
approaches present advantages and drawbacks. In most
cases, for management purposes, empirical and simple
methods might be more appropriate for evaluating pollutant
export into freshwater (Heathwaite, 2003). At the same time, it
is also true that they are too simple for interpreting
complexities such as NPS production and, above all, for
sufficiently focussing on land management. The need to reach
a compromise between simple methods and physical basin
properties is one of the trends in current research. It is
important to improve the interpretation of the practical
requirements of legislation, such as the EU Water Framework
Directive, by for example, the use of fuzzy systems which
have great potential to be used as a decision support tool for
policy makers (Scharer et al., 2006).
This work proposes a compromise solution between
physics based simulations and simple export indices, for
evaluating phosphorus export into a lake. The effort consists
in maximizing the advantages of physics models, while
minimising their application difficulties. The aim of the work
is not to propose a new model, but to find the best way of
integrating existing models, i.e. it consists in a new approach,
allowing land managers to optimise the advantages of both
physical models and simple export methods to assess LU/LC
impact on water resources.
2. Methods
The experimental site chosen was the Lake Vico basin, in
Central Italy (about 60 km north of Rome, Fig. 1). It is ideal for
investigating non-point pollution, because the land impact is
almost all due to intensive agriculture (hazelnut trees), while
civil and industrial settlements are negligible or absent (Leone
and Marini, 1993). Land cover is prevalently agriculture (about
48%) and forest (about 41%) (Leone et al., 2006).
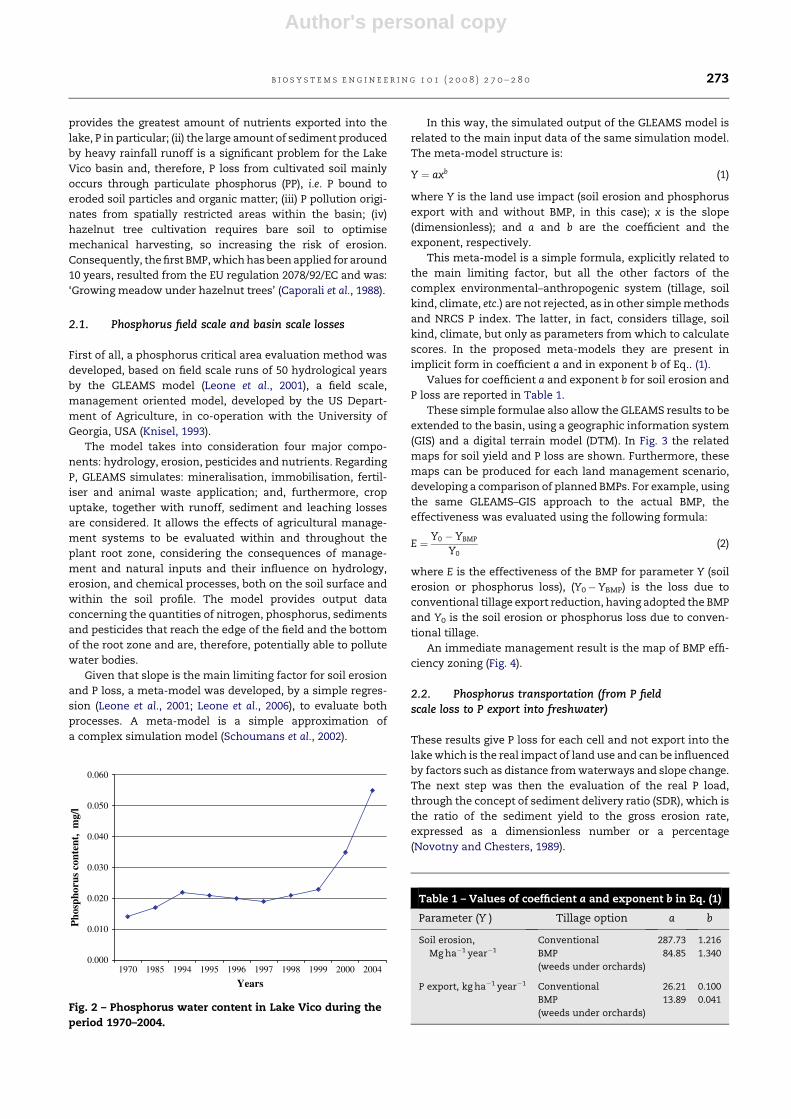
The phosphorus content of water has sharply increased
in recent years (Fig. 2) as a result of the changes in land use
which took place in the 1960s and 1970s, when extensive
agriculture switched to the present intensive hazel orchards
(Leone and Marini, 1993). Fig. 1 shows a detail of the first
preliminary assessment of P loads from different sources
in the Lake Vico basin (Leone and Marini, 1993), based on
mean export coefficients from literature (Beaulac and
Reckhow, 1982).
The work is based on the following assumptions, regarding
the Lake Vico basin: (i) intensive hazelnut tree cropping
0
200
400
600
800
1000
1200
Urbanised Tourism Livestock Untilled Agriculture Atmospheric
Land use
P r
eal l
oad,
(kg
/yea
r)
LAKE VICO
FIRENZE
ROMA
Fig. 1 – Localization of the study area and first rough assessment of P loads from different sources in the Lake Vico basin.
b i o s y s t e m s e n g i n e e r i n g 1 0 1 ( 2 0 0 8 ) 2 7 0 – 2 8 0272
Author's personal copy
provides the greatest amount of nutrients exported into the
lake, P in particular; (ii) the large amount of sediment produced
by heavy rainfall runoff is a significant problem for the Lake
Vico basin and, therefore, P loss from cultivated soil mainly
occurs through particulate phosphorus (PP), i.e. P bound to
eroded soil particles and organic matter; (iii) P pollution origi-
nates from spatially restricted areas within the basin; (iv)
hazelnut tree cultivation requires bare soil to optimise
mechanical harvesting, so increasing the risk of erosion.
Consequently, the first BMP, which has been applied for around
10 years, resulted from the EU regulation 2078/92/EC and was:
‘Growing meadow under hazelnut trees’ (Caporali et al., 1988).
2.1. Phosphorus field scale and basin scale losses
First of all, a phosphorus critical area evaluation method was
developed, based on field scale runs of 50 hydrological years
by the GLEAMS model (Leone et al., 2001), a field scale,
management oriented model, developed by the US Depart-
ment of Agriculture, in co-operation with the University of
Georgia, USA (Knisel, 1993).
The model takes into consideration four major compo-
nents: hydrology, erosion, pesticides and nutrients. Regarding
P, GLEAMS simulates: mineralisation, immobilisation, fertil-
iser and animal waste application; and, furthermore, crop
uptake, together with runoff, sediment and leaching losses
are considered. It allows the effects of agricultural manage-
ment systems to be evaluated within and throughout the
plant root zone, considering the consequences of manage-
ment and natural inputs and their influence on hydrology,
erosion, and chemical processes, both on the soil surface and
within the soil profile. The model provides output data
concerning the quantities of nitrogen, phosphorus, sediments
and pesticides that reach the edge of the field and the bottom
of the root zone and are, therefore, potentially able to pollute
water bodies.
Given that slope is the main limiting factor for soil erosion
and P loss, a meta-model was developed, by a simple regres-
sion (Leone et al., 2001; Leone et al., 2006), to evaluate both
processes. A meta-model is a simple approximation of
a complex simulation model (Schoumans et al., 2002).
In this way, the simulated output of the GLEAMS model is
related to the main input data of the same simulation model.
The meta-model structure is:
Y ¼ axb (1)
where Y is the land use impact (soil erosion and phosphorus
export with and without BMP, in this case); x is the slope
(dimensionless); and a and b are the coefficient and the
exponent, respectively.
This meta-model is a simple formula, explicitly related to
the main limiting factor, but all the other factors of the
complex environmental–anthropogenic system (tillage, soil
kind, climate, etc.) are not rejected, as in other simple methods
and NRCS P index. The latter, in fact, considers tillage, soil
kind, climate, but only as parameters from which to calculate
scores. In the proposed meta-models they are present in
implicit form in coefficient a and in exponent b of Eq.. (1).
Values for coefficient a and exponent b for soil erosion and
P loss are reported in Table 1.
These simple formulae also allow the GLEAMS results to be
extended to the basin, using a geographic information system
(GIS) and a digital terrain model (DTM). In Fig. 3 the related
maps for soil yield and P loss are shown. Furthermore, these
maps can be produced for each land management scenario,
developing a comparison of planned BMPs. For example, using
the same GLEAMS–GIS approach to the actual BMP, the
effectiveness was evaluated using the following formula:
E ¼ Y0 � YBMP
Y0(2)
where E is the effectiveness of the BMP for parameter Y (soil
erosion or phosphorus loss), (Y0�YBMP) is the loss due to
conventional tillage export reduction, having adopted the BMP
and Y0 is the soil erosion or phosphorus loss due to conven-
tional tillage.
An immediate management result is the map of BMP effi-
ciency zoning (Fig. 4).
2.2. Phosphorus transportation (from P fieldscale loss to P export into freshwater)
These results give P loss for each cell and not export into the
lake which is the real impact of land use and can be influenced
by factors such as distance from waterways and slope change.
The next step was then the evaluation of the real P load,
through the concept of sediment delivery ratio (SDR), which is
the ratio of the sediment yield to the gross erosion rate,
expressed as a dimensionless number or a percentage
(Novotny and Chesters, 1989).
0.000
0.010
0.020
0.030
0.040
0.050
0.060
1970 1985 1994 1995 1996 1997 1998 1999 2000 2004
Years
Pho
spho
rus
cont
ent,
mg/
l
Fig. 2 – Phosphorus water content in Lake Vico during the
period 1970–2004.
Table 1 – Values of coefficient a and exponent b in Eq. (1)
Parameter (Y ) Tillage option a b
Soil erosion,
Mg ha�1 year�1
Conventional 287.73 1.216
BMP
(weeds under orchards)
84.85 1.340
P export, kg ha�1 year�1 Conventional 26.21 0.100
BMP
(weeds under orchards)
13.89 0.041
b i o s y s t e m s e n g i n e e r i n g 1 0 1 ( 2 0 0 8 ) 2 7 0 – 2 8 0 273

Author's personal copy
Since the main P export from agricultural land is PP (bound
to soil particles), the ratio of the P exported into the lake to the
gross removal rate in each field (P loss in Fig. 3) could be
defined as the phosphorus delivery ratio (PDR). Numerically,
SDR and PDR coincide and, therefore, the P load on the lake
was considered as the gross production load of Fig. 3, multi-
plied for each basin SDR.
Therefore, the Lake Vico basin was divided into five areas,
defined by groups of smaller homogeneous sub-basins (Fig. 5).
Many factors affect SDR, but, in general, it is negatively
correlated with drainage basin area and positively correlated
with drainage density, channel slope, valley-side slope and
relief.
SDR evaluation is empirical and consequently there are
a large number of formulae available in the literature (see, for
example, the review of Ouyang and Bartholic, 1997). Naturally,
there is a very high degree of uncertainty in the estimation of
this parameter and only a thorough knowledge of the basin
and carefully selected choices by the expert (possibly based on
critical evaluation of experimental data) can give sufficient
assurance.
In this case, the following formulae for the SDR were
considered (for referencing, see the paper of Ouyang and
Bartholic, up-dated on the cited web site):
SDR ¼ 1:36� 10�11ðAÞ�0:0998ðZ=LÞ0:3629CN5:444 (3)
SDR ¼ 0:51� A�0:11�or 0:42� A�0:125
�(4)
logðSDRÞ ¼ 2:943� 0:824� logðL=RÞ (5)
SDR ¼ 0:627� S0:403LP (6)
Fig. 3 – GLEAMS simulated soil and phosphorus yield: conventional (a, c) and with BMPs (b, d).
b i o s y s t e m s e n g i n e e r i n g 1 0 1 ( 2 0 0 8 ) 2 7 0 – 2 8 0274

Author's personal copy
SDR ¼ 0:488� 0:00064�Aþ 0:0099� RO (7)
where SDR is the sediment delivery ratio; A is the drainage
area in km2; Z/L is the relief-length factor, in m km�1, ratio
between difference in elevation in m, of the watershed and
the mouth of the stream, versus length of watershed (along the
main stream, in km); CN is the long term, average US Soil
Conservation Service (SCS) Curve Number; L/R is the dimen-
sionless ratio of length of watershed (along the main stream)
versus difference in elevation of the divide and the mouth of
the stream; SLP is the gradient of the stream, in %; RO is the
runoff, in cm.
They represent all the requirements for SDR evaluation:
from the more immediate, related only to simple topographic
factors such as the area (Eq. (4)) or the slope (Eq. (6)) or a relief
factor (Eq. (5)), to the more complex, related to topography and
land use (Eq. (3)) or topography and hydrology land use (Eq. (7)).
The results for Lake Vico are reported in Table 2.
The choice of the best equation was derived from the
following considerations and evidence:
- the basin morphology is rather irregular, with very steep
slopes in the higher part of the basin and much more gentle
slopes down in the valley, around the lake. So, this part of
the landscape works as a sort of sedimentation zone, since
sediment from diffuse erosion has more probability of being
trapped before reaching streams and the lake, thus reducing
the SDR. Simple formulae considering only the area or the
morphology (slope, relief etc.) are not able to interpret these
characteristics;
- the Lake Vico basin soils are very coarse sands and, conse-
quently, runoff events are rare, occurring only in particular
hydrological conditions (Leone et al., 2000); furthermore, the
drainage net is not well developed, with few confluences
and scarce stream density, due to the geologically young
landscape.
Eqs. (4)–(6) are not able to interpret these two fundamental
characteristics, because they are based only on basin
morphology. In fact, they give SDR values which are too high
(in one case there is also an overflow figure: area 2, Eq. (6)),
which is not credible considering the basin’s situation, which
forces the SDR towards lower values. As a consequence, Eq. (3)
was preferred, because it contains the US SCS Curve Number
method (CN), which allows soil structure to be considered, to
highlight better the role of land use, the real focus of the
Fig. 4 – Effectiveness of BMPs in reducing phosphorus
export.
Fig. 5 – Export of phosphorus for conventional and BMPs
scenario.
b i o s y s t e m s e n g i n e e r i n g 1 0 1 ( 2 0 0 8 ) 2 7 0 – 2 8 0 275
Author's personal copy
problem. Furthermore, the CN factor was experimentally
verified on the basis of the results of a rainfall-runoff moni-
toring station in the Scardenato creek (Leone et al., 2000 and
other unpublished data). The Scardenato creek sub-basin is in
area 4.
2.3. Total P lake concentration
Having stated this result and considering the P loss maps in
Fig. 3, the P export into the lake can be evaluated comparing
both scenarios, without and with BMP (Fig. 5).
Quantitative evaluation of P export into the lake allows the
Vollenweider (1976) model to be applied:
½P� ¼ LðPÞtw
z�1þ
ffiffiffiffiffitw
p ��
mg l�1�
(8)
where [P] is the equilibrium total P water concentration,
expressed in mg l�1 (the consequence of long term land use);
L(P) is the real P lake load, i.e. the ratio between phosphorus
export and lake surface area, in kg [P] km�2 year�1; tw is
hydraulic residence time, in years; z is the mean lake depth, in
m. The calculus is illustrated in Table 3.
Furthermore, by means of this model, it is possible to
compare LU/LC scenarios in terms of their consequence on
lake trophic status, adopting the Organization for Economic
Cooperation and Development (OECD) probabilistic trophic
classification, as shown in Fig. 6.
3. Results and discussion
Fig. 5 reports the P export values produced by applying the
model. The simulated mean water content for conventional
management resulted 48.1 mg l�1 [P], while that for the adop-
ted BMP resulted 22.5 mg l�1, compared to the last available
monitoring figure of 55.0 mg l�1 (ARPA, 2004) and a natural
status of 14 mg l�1 (Leone and Marini, 1993). Applying Eq. (2) to
LU/LC with conventional agriculture, the simple bibliographic
export coefficients method gave a value for the equilibrium
total P concentration of 26.0 mg l�1 (Leone and Marini, 1993).
Fig. 3a and b shows the soil erosion risk maps obtained by
running the GLEAMS model. An alternative simulation
method, the ‘classical’ Universal Soil Loss Equation (USLE) of
Wischmeier and Smith (1978), was also used, giving quite
similar results (Leone et al., 2001). However, the USLE is more
difficult to apply at basin scale and gives a more relevant
impact to very subjective factors (all multiplicative), especially
to the soil cover factor C (USLE, Wischmeier and Smith, 1978).
Both approaches, in any case, were congruent with magnitude
order and, when compared with experimental data, demon-
strate their ability to interpret well the higher risk zones in the
northern and eastern part of the basin (Leone et al., 2001, 2006).
For management purposes (BMP zoning and comparison)
these results can be considered encouraging, although abso-
lute quantities cannot be validated, at the moment, as detailed
knowledge of the basin’s hydrology in conditions of extreme
rainfall is not available, nor is it an immediate research
priority.
The same considerations are valid for phosphorus loss
evaluation. The absolute values (see Fig. 3c and d) might
appear too high at a glance, but are in fact reasonable if the
very high natural soil phosphorus content is taken into
consideration. In fact, total phosphorus soil text (Ptot), gave
average values between 1217 and 2942 ppm (Leone et al., 2000).
Compared to these values, the GLEAMS simulations of P losses
range between 0.005% and 0.1%, not far from the experimental
values cited in literature, for example: Frink (1991), Mattikalli
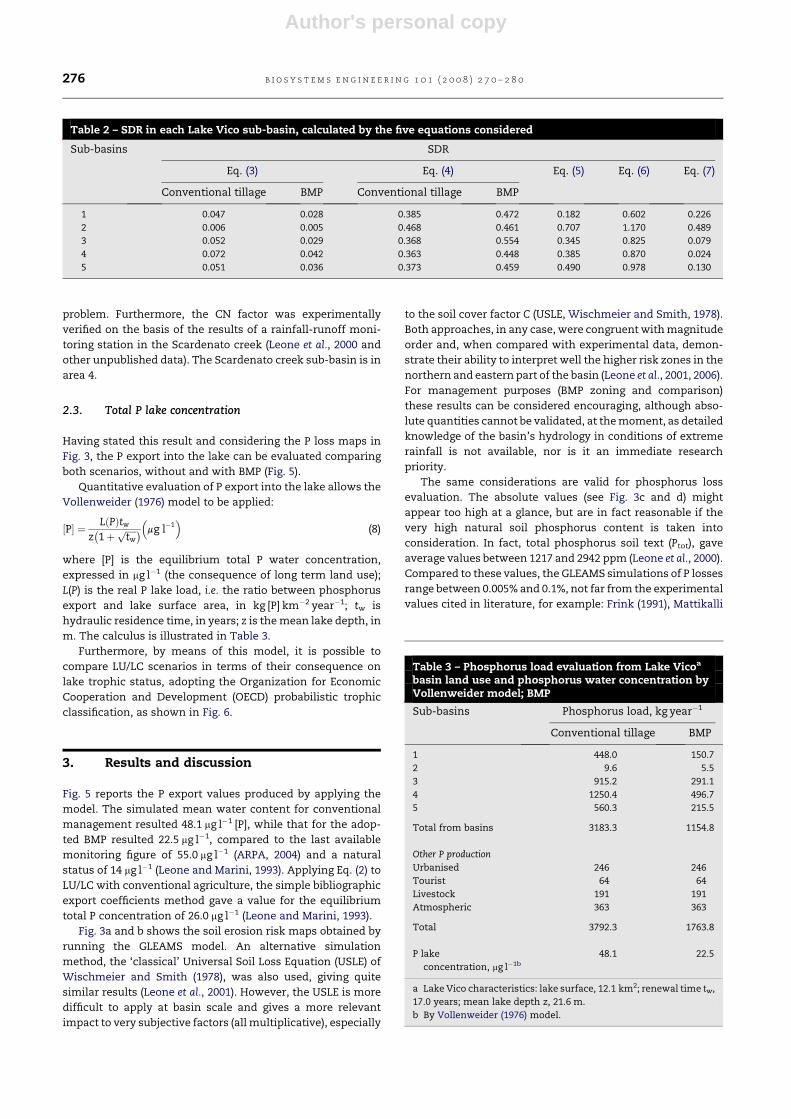
Table 2 – SDR in each Lake Vico sub-basin, calculated by the five equations considered
Sub-basins SDR
Eq. (3) Eq. (4) Eq. (5) Eq. (6) Eq. (7)
Conventional tillage BMP Conventional tillage BMP
1 0.047 0.028 0.385 0.472 0.182 0.602 0.226
2 0.006 0.005 0.468 0.461 0.707 1.170 0.489
3 0.052 0.029 0.368 0.554 0.345 0.825 0.079
4 0.072 0.042 0.363 0.448 0.385 0.870 0.024
5 0.051 0.036 0.373 0.459 0.490 0.978 0.130
Table 3 – Phosphorus load evaluation from Lake Vicoa
basin land use and phosphorus water concentration byVollenweider model; BMP
Sub-basins Phosphorus load, kg year�1
Conventional tillage BMP
1 448.0 150.7
2 9.6 5.5
3 915.2 291.1
4 1250.4 496.7
5 560.3 215.5
Total from basins 3183.3 1154.8
Other P production
Urbanised 246 246
Tourist 64 64
Livestock 191 191
Atmospheric 363 363
Total 3792.3 1763.8
P lake
concentration, mg l�1b
48.1 22.5
a Lake Vico characteristics: lake surface, 12.1 km2; renewal time tw,
17.0 years; mean lake depth z, 21.6 m.
b By Vollenweider (1976) model.
b i o s y s t e m s e n g i n e e r i n g 1 0 1 ( 2 0 0 8 ) 2 7 0 – 2 8 0276

Author's personal copy
and Richards (1996): Pote et al. (1996), Whiters et al. (2001),
Pandey et al. (2005) and Mushtak et al. (2005).
Further confirmation comes from the experimental appa-
ratus in the Lake Vico basin, where the runoff events regis-
tered in the last 5 years gave a Ptot loss from 5.2 to 18.0 kg ha�1,
due to rains of 2–30 years return time (Strauss et al., 2007).
The proposed approach is an attempt to satisfy both the
complexity required for the interpretation of the anthropo-
genic and environmental system and the simplicity required
for management. The first, because its core is the GLEAMS
model simulations, focuses on LU/LC; the latter, thanks to the
very simple structure of the meta-model, can also be applied
at basin scale. Both meet the requirements of land managers.
This compromise appears particularly useful in the
frequently occurring situation where data is lacking, and thus
it is impossible to calibrate and validate basin scale, physical
models.
The advantages of more rational land management are
evident and various, they include:
(1) landscape zoning in terms of sediment and phosphorus
losses. This may seem banal, but it is fundamental,
because it clearly highlights that the same LU/LC can have
dramatically different impacts. In consequence, the same
BMP can give very different contributions (from very low to
very high) to agriculture sustainability, depending heavily
on the environmental context;
(2) the possibility of evaluating planned BMPs, in terms of
their environmental protection efficiency, which is evident
from a simple visual comparison of Fig. 3 and from the
spatialisation of the results of Eq. (2);
(3) the highlighting of zones where even BMPs produce too
high P losses (the dark patches in Figs. 3d and 5b). In these
zones, the slope is so steep that land managers would
recommend natural rather than agricultural land use. A
slope limit also derives from this, that discriminates
sustainable and unsustainable agriculture, and it is a very
powerful land management datum.
These results show what clear powerful answers, con-
cerning the fundamentals of agricultural environmental
sustainability can be obtained by land managers.
In future, these needs will become more and more
pressing, considering, for example, the new European
Common Agricultural Policy which will be funded on the
principle of the eco-conditionality of financial support.
The proposed procedure has general validity, because it
remains the same, even though single situations and site
specificities (data availability, long series monitoring etc.)
could modify the instruments required to implement it: model
choice, the SDR approach, etc. For example, if a watershed is
well monitored and a basin scale physical model is sufficiently
calibrated and validated, the meta-model can be derived
directly from it. In other words, specific situations could lead
to a change in tools, but the following steps remain general:
(1) a preliminary assessment and consequent simulation of
the problems and characteristics of the basin to be studied,
using GLEAMS, or a similar model, to evaluate LU/LC
systems and the related environment, aimed at inter-
preting complexity;
(2) a transformation of the previous results into ‘simple and
easy to apply’ meta-models, for management necessities;
this phase requires the use of ad hoc P export coefficients or
P loss indices.
In this way, the ‘simple and easy to apply’ index does not
come from generic literature tables or procedures, but it is
specifically tailored to a well defined and checked situation,
based on previous runs of a complex, physics based model.
Hence, the advantages of both parametric or simple export
coefficients and physical models are optimised.
Since a direct validation of the proposed approach is
practically impossible, more indirect verification was carried
out, by means of experimental evidence. The latter shows
that, from different and independent points of view, the
results can be considered satisfactory. Phosphorus export
from agricultural areas (Fig. 3) is reasonable, in the magnitude
of literature ranges and experimental evidence.
The lake water P content was calculated from P export
values using the Vollenweider model (Table 3), and then
compared to that obtained from monitoring. The similarity
between the values provided further verification of the
adopted procedure. Table 3, in fact, correlates lake P
0
10
20
30
40
50
60
70
Ultraoligotrophic Oligotrophic Mesotrophic Eutrotrophic Ipereutrophic
Trophic status as P concentration
Pro
babi
lity,
()
Fig. 6 – Lake trophic status, adopting the OECD probabilistic trophic classification (OECD, 1982): natural 0.014 mg/l, BMP
adoption 0.022 mg/l, conventional tillage 0.048 mg/l.
b i o s y s t e m s e n g i n e e r i n g 1 0 1 ( 2 0 0 8 ) 2 7 0 – 2 8 0 277
Author's personal copy
concentration to LU/LC, by means of the Vollenweider model.
In particular, the first column, considers conventional tillage,
i.e. the lake basin management until a few years ago, which
can be considered as a synthesis of agricultural factors on the
trophic status of the lake. The second column represents
trophic evolution of the lake in recent years following imple-
mentation of the BMP.
The Vollenweider model application derives from Table 3;
it gives a lake P concentration of 48.1 mg l�1, very close to the
experimental figure of 55,0 mg l�1 (ARPA, 2004).
At the very least, these results are probably sufficient to
compare scenarios, where uncertainty is mitigated by the fact
that the environmental context is the same and changes are in
land use (with and without BMP). Alternative methods cannot
give the same effectiveness for land management objectives.
Indeed, it is by no means certain that traditional methods and
direct model validation would be able to give the same easily
applied results.
The Lake Vico monitoring example (and other examples e.g.
Heathwaite, 2003) supports this assumption: since 1999 a moni-
toring station has been installed in the lake basin, to record
rainfall, runoff, sediment yield and the water quality of runoff in
a representative sub-basin (2.66 km2 of the total Lake Vico basin
of 40.1 km2). However, due to the intense drought of recent
years, few relevant events have been recorded by this station
and, at present, it is not possible to foresee when an adequate
time series record will be available for satisfactory model vali-
dation. Furthermore, experimental data are site specific and,
therefore, not immediately applicable to other landscapes
where specific monitoring time series should be available.
This means that, rather than exact forecasts, at least in the
first phase, it is more useful to address efforts to comparing land
use scenarios and to the implementing territory informative
systems. This requires the application of models, but with a less
refined approach, oriented to comparison. The results can be
verified by simpler indirect methods, because the comparative
approach is less demanding and reduces uncertainty.
An advantage of the method is surely the possibility of
zoning the territory according to level of risk in a completely
distributed approach (cell by cell, Fig. 3), that, in many cases is
more effective than a semi-distributed or lumped approach. In
this case, it is due to the topography of the Lake Vico basin that
quickly changes from the very steep slopes of the higher part
of the basin to the flat zones around the lake. This means that
the sub-basin approach of semi-distributed models such as
SWAT proved inadequate, requiring not only a very refined
DTM (the 25 m raster of the available DTM, normally consid-
ered very refined, was still not sufficient in this case), but also
a division of the basin into an enormous, impractical number
of sub-basins (Leone et al., 2003).
Other advantages in decision-making are clear: it is possible
to compare scenarios and evaluate the efficiency of mitigation
scenarios (Figs. 4 and 5), also in terms of shifting lake trophic
status, that is a consequence of landscape order and, in partic-
ular, of agricultural land management (Fig. 6). Fig. 6 summarises
how lake hydro-biology changes in consequence of LU/LC
scenarios that are a very powerful tool for decision-making and
agricultural environmental sustainability assessment.
This is the real usefulness of the proposed method, which
maintains the frame of simple export index approaches, but
also interprets the complex environmental context (climate,
soil, topography etc.). Hence, it can be considered a contribu-
tion to more process-oriented land management and a stim-
ulus towards a more rational use of agriculture sustainability
subsidies.
Furthermore, the evaluation of P export into freshwater
allows an integrated approach, that considers the joint contri-
bution of the whole LU/LC and related consequences on final
water bodies. In fact, this study also shows how it is possible to
evaluate the consequences of LU/LC changes in the watershed
on receiving water bodies associating to each scenario an
environmental quality index (lake trophic status, in this case).
4. Conclusions
The aim of this work was to evaluate how landscape order
could affect water body quality, focussing scenarios for
sustainable agricultural systems. By the use of models BMP
environmental efficiency and risk areas were evaluated, in
terms of soil conservation and phosphorus loss reduction.
The literature is rich in models and approaches, each with
advantages and drawbacks. The present study proposes
a method that attempts to maximise the advantages of
complex, physics based, distributed models while offering
land managers simple export indices of freshwater P loads.
The suggested approach solves various aspects of land
management sustainability, by including: (i) a more rigorous
and objective (process oriented) evaluation of different land
management scenarios; (ii) the possibility of landscape zoning
according to level of risk, with and without BMPs and, at the
same time, quantifying related environmental efficiency;
(iii) an integrated evaluation of LU/LC, in terms of its impact
on freshwater ecological status; and (iv) a forecasting of
long-term water body condition, as a consequence of LU/LC.
These results when compared to experimental evidence
appear reasonable, at least for BMP evaluation and land
planning, but they are also encouraging from the point of view
of absolute forecasts.
Regarding the general validity of this study, it is the
proposed procedure, that remains generally valid, even
though data availability, long series monitoring etc. could
modify the instruments required to implement it (model type,
SDR approach, etc.), depending on specific situations. The
steps to be performed, which are widely applicable, encourage
land planners to base choices on a ‘simple and easy to apply’
index, that does not come from generic literature tables or
procedures, but is specifically tailored on previous runs of
a complex, physics based, validated model.
In this way, the advantages of both parametric or simple
export coefficients and physical models can be optimised,
providing land managers with more quantitatively supported
tools for their decision-making.
Acknowledgements
Support to carry out this work was provided by: the Euro-
pean Union project ‘AgriBMPWater’, V Environment
b i o s y s t e m s e n g i n e e r i n g 1 0 1 ( 2 0 0 8 ) 2 7 0 – 2 8 0278
Author's personal copy
Framework, contract No. EVK1-CT-1999-00025 and the
Italian Research Ministry, PRIN 2003, ‘Hydro-geological
modelling and land management in the Vico and Bracciano
(Lazio) lakes aimed at water resources protection’, contract
No. 2003049442_002.
r e f e r e n c e s
Arheimer B; Andersson L; Larsson M; Lindstrom G; Olsson J;Pers B C (2004). Modelling diffuse nutrient flow ineutrophication control scenarios. Water Science andTechnology, 49(3), 37–45.
Arnold J G; Williams J R; Srinivasan J; King K W (1996). The Soiland Water Assessment Tool (SWAT). User’s Manual. Temple,TX, USA.
ARPA. (2004). Water Resources Office. Official Communication.Lazio Regional Environment Protection Agency, Italy.
Basnyat P; Teeter L D; Flynn K M; Lockaby B G (1999).Relationships between landscape characteristics and non-point source pollution inputs to coastal estuaries.Environmental Management, 23(4), 539–549.
Bouraoui F; Dillaha T A (1996). ANSWERS-2000: runoff andsediment transport model. Journal of EnvironmentalEngineering, 122(6), 493–502, (ASCE).
Beaulac M N; Reckhow K H (1982). An examination of land use-nutrient export relationships. Water Resources Bulletin, 18(6),1013–1024.
Caporali, F; Campiglia E; Paolini R (1988). An approach to thereduction of environmental risks in specialized orchards:subterranean clover as cover crop in hazelnuts. In: AttiProceedings of the International Symposium on Agro-Ecological Engineering, August, Beijing, China, pp. 71–75.
Correll D L (1998). The role of phosphorus in the eutrophication ofreceiving waters: a review. Journal of Environmental Quality,27, 261–266.
Dillon P J; Kirchner W B (1975). The effects of geology and land useon the export of phosphorus from watersheds. WaterResources, 9(2), 135–148.
Frink C R (1991). Estimating nutrients exports to estuaries. Journalof Environmental Quality, 20, 717–724.
Garnier M; Lo Porto A; Marini A; Leone A (1998). Integrated use ofGLEAMS and GIS to prevent groundwater pollution caused byagricultural disposal of animal waste. EnvironmentalManagement, 22(5), 747–756.
Gburek W J; Sharpley A N; Heatwhite L; Folmar G J (2000).Phosphorus management at the watershed scale:a modification of the phosphorus index. Journal ofEnvironmental Quality, 29, 130–144.
Haycock N E; Muscutt A D (1995). Landscape managementstrategies for control of diffuse pollution. Landscape andUrban Planning, 31(1), 313–321.
Heathwaite A L; Sharpley A N (1999). Evaluating measures tocontrol the impact of agricultural phosphorus on waterquality. Water Science and Technology, 39, 149–155.
Heathwaite A L (2003). Making process-based knowledge useableat the operational level: a framework for modelling diffusepollution from agricultural land. Environmental Modellingand Software, 18(8–9), 753–760.
Knisel W G (ed). (1993). University of Georgia, Coastal PlainExperimental Station, Tifton, USA. 260 pp.
Leone A; Marini R (1993). Assessment and mitigation of theeffects of land use in a lake basin (Lake Vico in central Italy).Journal of Environmental Management, 39, 39–50.
Leone A; Preti F; Ripa M N; Milanese C; Di Maggio H; Benigni G(2000). Field scale and basin scale monitoring of diffuse
agricultural nutrients sources. In Proceedings of theInternational Congress of Agricultural Engineering. AsianInstitute of Technology, Bangkok, Thailand. December 4th–7th.
Leone A; Preti F; Ripa M N; Benigni G (2001). Evaluation ofagricultural nutrient diffuse sources and related landmanagement. Rivista di Ingegneria Agraria, XXXII, 20–25.
Leone A; Boccia L; Lo Porto A; Ripa M N (2003). Phosphorus lakeloads from basin land use: proposal for a new simpleevaluation method. In: Second International SWATConference, Bari, Italy, 1st–4th July.
Leone A; Ripa M N; Garnier M; Lo Porto A (2006). Agricultural landuse and best management practices to control nonpointpollution. Environmental Management, 38(2), 253–266.
Lemunyon J L; Gilbert R G (1993). The concept and need fora phosphorus assessment tool. Journal of ProductionAgriculture, 6, 483–496.
Lewis D R; McGechan M B (2002). A review of field scalephosphorus dynamics models. Biosystems Engineering, 82(4),359–380.
Mattikalli N M; Richards K S (1996). Estimation of surface waterquality changes in response to land use change: application ofthe export coefficient model using remote sensing andgeographical information system. Journal of EnvironmentalManagement, 48, 263–282.
Mushtak T J; Cai C F; Shi Z H; Wang T W (2005). Application ofgeo-information technology in the study of soil and nutrientsloss by water erosion for the different land cover. AmericanJournal of Applied Sciences, 2(6), 1065–1072.
Novotny V; Chesters G (Nov.–Dec. 1989). Delivery of sediment andpollutants from nonpoint sources: a water quality perspective.Journal of Soil and Water Conservation 568–576.
Novotny V (2005). Diffuse pollution from Agriculture in the World.In: Proceedings from the International Workshop: ‘Where dofertilizers go?’, Belgirate, Italy, June 28th–29th.
OECD. (1982). Eutrophication of Waters. Monitoring, Assessmentand Control. Organization for Economic Cooperation andDevelopment, Paris.
Omernick J M; Abernathy A R; Male L M (1981). Stream nutrientlevels and proximity of agricultural and forest land to streams:some relationships. Journal of Soil and Water Conservation,36, 227–231.
Ouyang D; Bartholic J (1997). Predicting sediment delivery ratio inSaginaw Bay watershed. In The 22nd National Association ofEnvironmental Professionals, Conference Proceedings, May19–23, Orlando, FL, USA, pp. 659–671. Water Research Institute,Michigan State University, Available from:<http://www.iwr.msu.edu/wouyangda/sdr/sag-sdr.htm> December 3, 2003.
Pandey V K; Panda S N; Sudhakar S (2005). Modelling of anagricultural watershed using remote sensing and geographicinformation system. Biosystems Engineering, 90(3), 331–347.
Pote D H; Daniel T C; Sharpley A N; Moore Jr. P A; Edwards D R;Nichols D J (1996). Relating extractable phosphorus tophosphorus losses in runoff. Soil Science Society of AmericaJournal, 60, 855–859.
Scharer M; Page T; Beven K (2006). A fuzzy decision tree to predictphosphorus export at the catchment scale. Journal ofHydrology, 331, 484–494.
Schoumans O F; Mol-Dijkstra J; Akkermans L M W;Roest C W J (2002). Assessment of non-point phosphoruspollution from agricultural land to surface waters by meansof a new methodology. Water Science and Technology,45(9), 177–182.
Sharpley A N; Chapra S C; Wedepohl R; Sims T J; Daniel T C;Reddy K R (1994). Managing agriculture phosphorus forprotection of surface waters: issues and options. Journal ofEnvironmental Quality, 23, 437–451.
Sharpley A N; Kleinman P J A; Mc Dowell R W; Gitau M; Briant R B(2002). Modelling phosphorus transport in agricultural
b i o s y s t e m s e n g i n e e r i n g 1 0 1 ( 2 0 0 8 ) 2 7 0 – 2 8 0 279

Author's personal copy
watersheds: processes and possibilities. Journal of Soil andWater Conservation, 57, 425–432.
Strauss P; Leone A; Ripa M N; Turpin N; Laplana R; Lescot J M(2007). Using critical source areas for targeting cost-effectivebest management practices to mitigate phosphorus andsediment transfer at the watershed scale. Soil Use andManagement, 23(Suppl.1), 144–153.
Turpin N; Bontems P; Rotillon G; Barlund I; Kaljonen M; Tattari S;Feichtinger F; Strauss P; Haverkamp R; Garnier M; Lo Porto A;Benigni G; Leone A; Ripa M N; Eklo O M; Romstad E;Bordenave P; Bioteau T; Birgand F; Laplana R; Piet L; Lescot J M(2005). AgriBMPWater: systems approach to environmentallyacceptable farming. Environmental Modelling and Software,20(2), 187–196.
US-EPA. (2000). A National Assessment of Landscape Change andImpacts to Aquatic Resources. EPA/600/R-00/001. USEnvironmental Protection Agency, Washington DC, USA.
Vollenweider R A (1976). Advances in defining critical loadinglevels of phosphorus in lake eutrophication. Annals of Italianof Idrobiology Institute, Italian Research Council, 33, 53–83.
White I; Howe J (2004). The mismanagement of surface water.Applied Geography, 24(4), 261–280.
Whiters P J A; Edwards A C; Foy R H (2001). Phosphorus cycling inUK agriculture and implications for phosphorus loss from soil.Soil Use and Management, 17(3), 139–149.
Wischmeier W D; Smith D D (1978). Predicting rainfall erosionlosses, a guide to conservation planning. USDA AgriculturalHandbook No. 278. Washington DC, USA, 58 pp.
b i o s y s t e m s e n g i n e e r i n g 1 0 1 ( 2 0 0 8 ) 2 7 0 – 2 8 0280