Multiple QTLs Linked to Agro-Morphological and Physiological Traits Related to Drought Tolerance in...
14
Quantitative genetic analysis of chlorophyll a fluorescence parameters in maize in the field environments Domagoj Šimić 1y , Hrvoje Lepeduš 2 * ,y , Vlatka Jurković 1 , Jasenka Antunović 3 and Vera Cesar 3 1 Agricultural Institute Osijek, HR‐31103, Osijek, Croatia, 2 Faculty of Humanities and Social Sciences, HR‐31000 Osijek, Croatia, 3 Department of Biology, Josip Juraj Strossmayer University of Osijek, HR‐31000 Osijek, Croatia. y These authors contributed equally to this work. *Correspondence: [email protected] Abstract Chlorophyll fluorescence transient from initial to maximum fluorescence (“P” step) throughout two intermedi- ate steps (“J” and “I”) (JIP‐test) is considered a reliable early quantitative indicator of stress in plants. The JIP‐test is particularly useful for crop plants when applied in variable field environments. The aim of the present study was to conduct a quantitative trait loci (QTL) analysis for nine JIP‐test parameters in maize during flowering in four field environ- ments differing in weather conditions. QTL analysis and identification of putative candidate genes might help to explain the genetic relationship between photosynthesis and different field scenarios in maize plants. The JIP‐test param- eters were analyzed in the intermated B73 Mo17 (IBM) maize population of 205 recombinant inbred lines. A set of 2,178 molecular markers across the whole maize genome was used for QTL analysis revealing 10 significant QTLs for seven JIP‐test parameters, of which five were co‐localized when combined over the four environments indicating polygenic inheritance and pleiotropy. Our results demonstrate that QTL analysis of chlorophyll fluorescence parameters was capable of detecting one pleiotropic locus on chromosome 7, coinciding with the gene gst23 that may be associated with efficient photosynthe- sis under different field scenarios. Keywords: Chlorophyll a fluorescence parameters; field conditions; intermated B73 Mo17 recombinant inbred lines; JIP‐test; maize (Zea mays L.); quantitative trait loci Citation: Šimić D, Lepeduš H, Jurković V, Antunović J, Cesar V (2014) Quantitative genetic analysis of chlorophyll a fluorescence parameters in maize in the field environments. J Integr Plant Biol 56: 695–708. doi: 10.1111/jipb.12179 Edited by: Cong‐Ming Lu, Institute of Botany, CAS, China Received Jan. 31, 2014; Accepted Feb. 11, 2014 Available online on Feb. 13, 2014 at www.wileyonlinelibrary.com/ journal/jipb © 2014 Institute of Botany, Chinese Academy of Sciences INTRODUCTION The process of photosynthesis in plants can be considered as a complex trait that is necessary to be described quantitatively by means of parameters. The structural composition and the photosynthetic components are genetically controlled and the genetic factors responsible can be revealed via a quantitative genetic approach (Flood et al. 2011). Thus, quantitative genetic studies for photosynthetic parameters were conducted in Arabidopsis, rice, maize, wheat, soybean, barley, cabbage, cotton, and sunflower (for review, see Flood et al. 2011). Analysis of chlorophyll fluorescence parameters is appreciated as a widely used method to evaluate the health or integrity of the internal apparatus during the photosynthetic process within a leaf (Krause and Weiss 1991; Clark et al. 2000). The parameters are strongly correlated with whole‐plant mortality in response to environmental stresses (Percival and Sheriffs 2002) and are reliable indicators of stress (Krause and Weiss 1991; Schreiber et al. 1994; Brestic and Zivcak 2013). This is of special interest for photosystem II (PSII), because it is more sensitive to all types of stresses than photosystem I (PSI) (Apostolova et al. 2006). A method of chlorophyll a fluorescence measuring that has been developed by Strasser and Govindjee (1992a, 1992b) offer additional information that cannot be obtained by other chlorophyll fluorescence techniques. The time course of the chlorophyll fluorescence yield measured by this approach is called the fast chlorophyll a fluorescence (OJIP) transient (1992a, 1992b). The procedure developed for the quantification of OJIP transients is known as JIP‐test (Strasser and Strasser 1995). One of the most often used parameters is maximum quantum yield of PSII (F v /F m ), which gives the information about the proportion of the light absorbed by chlorophyll in the PSII that is used in photochemical processes. Further advances in chlorophyll fluorescence techniques as well as development of new apparatuses for its measurement allowed the introduction of new JIP‐test parameters that describe PSII photochemistry in detail (Strasser et al. 2004). One of the most powerful and most comprehensive parameter is performance index (PI ABS ). This is a multiparametric expression that takes into account all of the main photochemical processes, such as absorption and trapping of excitation energy, electron transport further than primary plastoquinone (Q A ) and dissipation of excess excitation energy. Unlike F v /F m , which utilizes only extreme values of chlorophyll fluorescence, namely minimal (F 0 ) and maximal (F m ) fluorescence, very fast and accurate measurement of fluorescence transient between these two extremes is necessary for PI ABS calculation. Therefore, PI ABS appeared to be a very suitable and sensitive parameter to investigate plant overall photosynthetic JIPB Journal of Integrative Plant Biology www.jipb.net July 2014 | Volume 56 | Issue 7 | 695–708 Research Article
-
Upload
independent -
Category
Documents
-
view
1 -
download
0
Transcript of Multiple QTLs Linked to Agro-Morphological and Physiological Traits Related to Drought Tolerance in...

Quantitative genetic analysis of chlorophyll afluorescence parameters in maize in the fieldenvironmentsDomagoj Šimić1y, Hrvoje Lepeduš2*,y, Vlatka Jurković1, Jasenka Antunović3 and Vera Cesar3
1Agricultural Institute Osijek, HR‐31103, Osijek, Croatia, 2Faculty of Humanities and Social Sciences, HR‐31000 Osijek, Croatia, 3Department ofBiology, Josip Juraj Strossmayer University of Osijek, HR‐31000 Osijek, Croatia. yThese authors contributed equally to this work. *Correspondence:[email protected]
Abstract Chlorophyll fluorescence transient from initial tomaximum fluorescence (“P” step) throughout two intermedi-ate steps (“J” and “I”) (JIP‐test) is considered a reliable earlyquantitative indicator of stress in plants. The JIP‐test isparticularly useful for crop plants when applied in variablefield environments. The aim of the present study was toconduct a quantitative trait loci (QTL) analysis for nine JIP‐testparameters in maize during flowering in four field environ-ments differing in weather conditions. QTL analysis andidentification of putative candidate genes might help toexplain the genetic relationship between photosynthesis anddifferent field scenarios in maize plants. The JIP‐test param-eters were analyzed in the intermated B73�Mo17 (IBM)maizepopulation of 205 recombinant inbred lines. A set of 2,178molecular markers across the whole maize genome was usedfor QTL analysis revealing 10 significant QTLs for seven JIP‐testparameters, of which five were co‐localized when combined
over the four environments indicating polygenic inheritanceand pleiotropy. Our results demonstrate that QTL analysis ofchlorophyll fluorescence parameters was capable of detectingone pleiotropic locus on chromosome 7, coinciding with thegene gst23 that may be associated with efficient photosynthe-sis under different field scenarios.
Keywords: Chlorophyll a fluorescence parameters; field conditions;intermated B73�Mo17 recombinant inbred lines; JIP‐test; maize (Zeamays L.); quantitative trait lociCitation: Šimić D, Lepeduš H, Jurković V, Antunović J, Cesar V (2014)Quantitative genetic analysis of chlorophyll a fluorescence parametersin maize in the field environments. J Integr Plant Biol 56: 695–708. doi:10.1111/jipb.12179Edited by: Cong‐Ming Lu, Institute of Botany, CAS, ChinaReceived Jan. 31, 2014; Accepted Feb. 11, 2014Available online on Feb. 13, 2014 at www.wileyonlinelibrary.com/journal/jipb© 2014 Institute of Botany, Chinese Academy of Sciences
INTRODUCTION
The process of photosynthesis in plants can be considered as acomplex trait that is necessary to be described quantitativelyby means of parameters. The structural composition and thephotosynthetic components are genetically controlled and thegenetic factors responsible can be revealed via a quantitativegenetic approach (Flood et al. 2011). Thus, quantitative geneticstudies for photosynthetic parameters were conducted inArabidopsis, rice, maize, wheat, soybean, barley, cabbage,cotton, and sunflower (for review, see Flood et al. 2011).Analysis of chlorophyll fluorescence parameters is appreciatedas a widely used method to evaluate the health or integrity ofthe internal apparatus during the photosynthetic processwithin a leaf (Krause and Weiss 1991; Clark et al. 2000). Theparameters are strongly correlated with whole‐plant mortalityin response to environmental stresses (Percival and Sheriffs2002) and are reliable indicators of stress (Krause and Weiss1991; Schreiber et al. 1994; Brestic and Zivcak 2013). This is ofspecial interest for photosystem II (PSII), because it is moresensitive to all types of stresses than photosystem I (PSI)(Apostolova et al. 2006).
A method of chlorophyll a fluorescencemeasuring that hasbeen developed by Strasser and Govindjee (1992a, 1992b) offeradditional information that cannot be obtained by other
chlorophyll fluorescence techniques. The time course of thechlorophyll fluorescence yield measured by this approach iscalled the fast chlorophyll a fluorescence (OJIP) transient(1992a, 1992b). The procedure developed for the quantificationof OJIP transients is known as JIP‐test (Strasser and Strasser1995). One of the most often used parameters is maximumquantum yield of PSII (Fv/Fm), which gives the informationabout the proportion of the light absorbed by chlorophyll inthe PSII that is used in photochemical processes. Furtheradvances in chlorophyll fluorescence techniques as well asdevelopment of new apparatuses for itsmeasurement allowedthe introduction of new JIP‐test parameters that describe PSIIphotochemistry in detail (Strasser et al. 2004). One of themostpowerful and most comprehensive parameter is performanceindex (PIABS). This is a multiparametric expression that takesinto account all of the main photochemical processes, such asabsorption and trapping of excitation energy, electrontransport further than primary plastoquinone (QA) anddissipation of excess excitation energy. Unlike Fv/Fm, whichutilizes only extreme values of chlorophyll fluorescence,namely minimal (F0) and maximal (Fm) fluorescence, veryfast and accurate measurement of fluorescence transientbetween these two extremes is necessary for PIABS calculation.Therefore, PIABS appeared to be a very suitable and sensitiveparameter to investigate plant overall photosynthetic
JIPB Journal of IntegrativePlant Biology
www.jipb.net July 2014 | Volume 56 | Issue 7 | 695–708
Research
Article
performance under different abiotic and biotic stresses. TheJIP‐test is being used extensively in stress physiology in a rangeof plant species under controlled conditions and it is alsoadaptable to field conditions (Reddy and Strasser 2000). This isparticularly important for crop plants, because studies ofwater stress conducted under controlled conditions inade-quately reflect natural environmental conditions that areusually characterized by considerable fluctuations in tempera-ture and light intensity (Jompuk et al. 2005; Tardieu 2012).Moreover, co‐occurrence of several abiotic stresses is commonin the field environments but it was rarely addressed bymolecular biologists (Mittler 2006).
To elucidate responses to environmental cues in variouscrop plants, molecular marker technologies have beensuccessfully used to identify quantitative trait loci (QTL)associated with both agronomic and physiological traits in thequantitative genetic studies. It provides an opportunity todissect out the genetic and physiological components affect-ing source‐sink relationships (e.g., Prioul et al. 1997; Ribautet al. 1997; Courtois et al. 2000; Baum et al. 2003; Collinset al. 2008). Although there are many reports about QTLsassociated with variable abiotic stresses in maize (Zea mays L.)(for reviews, see Collins et al. 2008; Ribaut et al. 2009), nostudies have been published about QTLs for JIP‐testparameters and subsequent candidate genes. Maize, as amajor crop worldwide, is essential for industry and is cultivatedmostly in rain‐fed cropping systems where changes in climate,erosion, or diminishing water supply take place (Camposet al. 2004). The aim of the present study was to conduct aquantitative genetic analysis for nine JIP‐test parameters in theintermated B73�Mo17 (IBM) maize population during flower-ing in field environments differing in weather conditions. TheQTL analysis of JIP‐test parameters and the identification ofputative candidate genes might help to explain the geneticrelationship between photosynthesis and different fieldscenarios in maize plants.
RESULTSAccording to official data of Meteorological and HydrologicalService, Republic of Croatia, in Osijek, during July 2010, waterdeficit occurred if total rainfall in a 3‐week period beforeflowering and fluorescence measuring were taken intoconsideration (Figure S1). The 3‐week period is critical for maizeflowering in Eastern Croatia when precipitation, temperature,
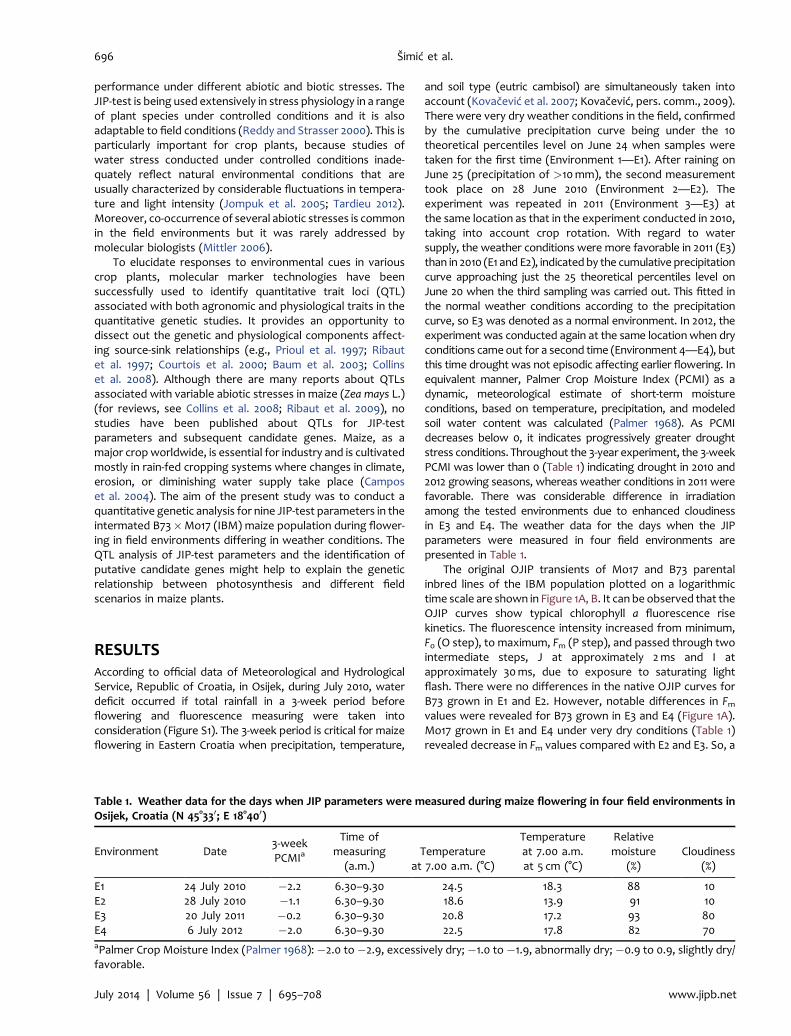
and soil type (eutric cambisol) are simultaneously taken intoaccount (Kovačević et al. 2007; Kovačević, pers. comm., 2009).There were very dry weather conditions in the field, confirmedby the cumulative precipitation curve being under the 10theoretical percentiles level on June 24 when samples weretaken for the first time (Environment 1—E1). After raining onJune 25 (precipitation of >10mm), the second measurementtook place on 28 June 2010 (Environment 2—E2). Theexperiment was repeated in 2011 (Environment 3—E3) atthe same location as that in the experiment conducted in 2010,taking into account crop rotation. With regard to watersupply, the weather conditions were more favorable in 2011 (E3)than in 2010 (E1 and E2), indicated by the cumulative precipitationcurve approaching just the 25 theoretical percentiles level onJune 20 when the third sampling was carried out. This fitted inthe normal weather conditions according to the precipitationcurve, so E3 was denoted as a normal environment. In 2012, theexperiment was conducted again at the same location when dryconditions cameout for a second time (Environment 4—E4), butthis time drought was not episodic affecting earlier flowering. Inequivalent manner, Palmer Crop Moisture Index (PCMI) as adynamic, meteorological estimate of short‐term moistureconditions, based on temperature, precipitation, and modeledsoil water content was calculated (Palmer 1968). As PCMIdecreases below 0, it indicates progressively greater droughtstress conditions. Throughout the 3‐year experiment, the 3‐weekPCMI was lower than 0 (Table 1) indicating drought in 2010 and2012 growing seasons, whereas weather conditions in 2011 werefavorable. There was considerable difference in irradiationamong the tested environments due to enhanced cloudinessin E3 and E4. The weather data for the days when the JIPparameters were measured in four field environments arepresented in Table 1.
The original OJIP transients of Mo17 and B73 parentalinbred lines of the IBM population plotted on a logarithmictime scale are shown in Figure 1A, B. It can be observed that theOJIP curves show typical chlorophyll a fluorescence risekinetics. The fluorescence intensity increased from minimum,F0 (O step), to maximum, Fm (P step), and passed through twointermediate steps, J at approximately 2ms and I atapproximately 30ms, due to exposure to saturating lightflash. There were no differences in the native OJIP curves forB73 grown in E1 and E2. However, notable differences in Fmvalues were revealed for B73 grown in E3 and E4 (Figure 1A).Mo17 grown in E1 and E4 under very dry conditions (Table 1)revealed decrease in Fm values compared with E2 and E3. So, a
Table 1. Weather data for the days when JIP parameters were measured during maize flowering in four field environments inOsijek, Croatia (N 45°330; E 18°400)
Environment Date3‐weekPCMIa
Time ofmeasuring(a.m.)
Temperatureat 7.00 a.m. (°C)
Temperatureat 7.00 a.m.at 5 cm (°C)
Relativemoisture
(%)Cloudiness
(%)
E1 24 July 2010 �2.2 6.30–9.30 24.5 18.3 88 10E2 28 July 2010 �1.1 6.30–9.30 18.6 13.9 91 10E3 20 July 2011 �0.2 6.30–9.30 20.8 17.2 93 80E4 6 July 2012 �2.0 6.30–9.30 22.5 17.8 82 70aPalmer Crop Moisture Index (Palmer 1968):�2.0 to�2.9, excessively dry;�1.0 to�1.9, abnormally dry;�0.9 to 0.9, slightly dry/favorable.
696 Šimić et al.
July 2014 | Volume 56 | Issue 7 | 695–708 www.jipb.net
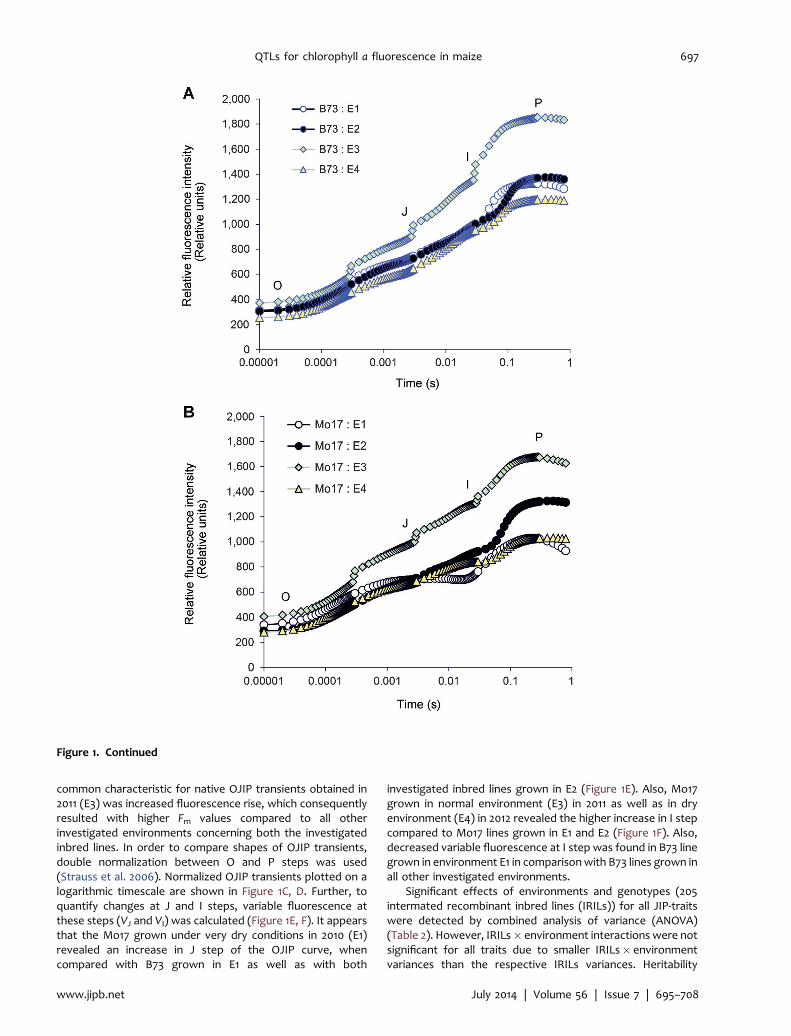
common characteristic for native OJIP transients obtained in2011 (E3) was increased fluorescence rise, which consequentlyresulted with higher Fm values compared to all otherinvestigated environments concerning both the investigatedinbred lines. In order to compare shapes of OJIP transients,double normalization between O and P steps was used(Strauss et al. 2006). Normalized OJIP transients plotted on alogarithmic timescale are shown in Figure 1C, D. Further, toquantify changes at J and I steps, variable fluorescence atthese steps (VJ and VI) was calculated (Figure 1E, F). It appearsthat the Mo17 grown under very dry conditions in 2010 (E1)revealed an increase in J step of the OJIP curve, whencompared with B73 grown in E1 as well as with both
investigated inbred lines grown in E2 (Figure 1E). Also, Mo17grown in normal environment (E3) in 2011 as well as in dryenvironment (E4) in 2012 revealed the higher increase in I stepcompared to Mo17 lines grown in E1 and E2 (Figure 1F). Also,decreased variable fluorescence at I step was found in B73 linegrown in environment E1 in comparisonwith B73 lines grown inall other investigated environments.
Significant effects of environments and genotypes (205intermated recombinant inbred lines (IRILs)) for all JIP‐traitswere detected by combined analysis of variance (ANOVA)(Table 2). However, IRILs� environment interactions were notsignificant for all traits due to smaller IRILs� environmentvariances than the respective IRILs variances. Heritability
Figure 1. Continued
QTLs for chlorophyll a fluorescence in maize 697
www.jipb.net July 2014 | Volume 56 | Issue 7 | 695–708

estimates were relatively high, about 70% for all JIP‐traits. Themean values between the two parents differed significantly inE1 (Table 3), which corresponded to the results in 2009(Lepeduš et al. 2012). Across the environments, B73 hadsignificantly higher values for maximum quantum yield of PSIIFv/Fm (expressed as TR0/ABS), yield of electron transport pertrapped exciton (ET0/TR0), electron transport per activereaction center (ET0/RC), flux ratio trapping per dissipation(TR0/DI0), electron transport beyond QA
� (ET0/(TR0� ET0))and PIABS. Mo17 had significantly higher values for threeparameters expressed per reaction center (RC): photonabsorbance rate per RC (ABS/RC), exciton trapping rate per
RC (TR0/RC) and exciton dissipation rate per RC (DI0/RC). Thesignificant differences between B73 and Mo17 were consistentacross all environments except in E2, where values in B73 andMo17 were not significantly different. The exceptions werevalues for electron transport rate per RC (ET0/RC), which weresignificantly higher in B73 in E2. Subsequently, with respectto the average across the four environments, B73 hadsignificantly higher values for TR0/ABS, ET0/TR0, ET0/RC, TR0/DI0, ET0/(TR0� ET0), PIABS, and lower values for ABS/RC, TR0/RC, and DI0/RC, when compared with Mo17.
Across the four environments, the significantly highestmeans over the 205 IRILs were obtained in E3 for TR0/ABS, TR0/
Figure 1. Continued
698 Šimić et al.
July 2014 | Volume 56 | Issue 7 | 695–708 www.jipb.net

DI0, and PIABS, while the highestmeanswere recorded for ABS/RC, TR0/RC, ET0/RC, DI0/RC in E1 (Table 4). There were nosignificantly highest means for ET0/TR0 and ET0/(TR0� ET0).
Significant and positive, both phenotypic and geneticcorrelations were observed among TR0/ABS, ET0/TR0 TR0/DI0,ET0/(TR0� ET0), and PIABS, whereas significant and negative
correlations were between these traits and ABS/RC, TR0/RC,and DI0/RC, respectively (Table 5). The strongest associationswere noted between TR0/ABS and DI0/RC (negative) andbetween TR0/ABS and TR0/DI0 (positive). Phenotypic correla-tions were mostly weak between ET0/RC and other traits. ET0/RC did not genetically correlate with any other parameter.
Figure 1. The OJIP chlorophyll a fluorescence transient curves (log time scale) in maize leaves of two inbred lines duringflowering in the four field environments (E1, E2, E3, E4) and variable fluorescence at J and I steps(A) Native curves in B73 inbred line. (B) Native curves in Mo17 inbred line. (C) Normalized curves in B73 inbred line. (D) Normalizedcurves in Mo17 inbred line. (E) Variable fluorescence at J step (VJ) in B73 and Mo17 inbred lines. (F) Variable fluorescence at I step(VI) in B73 and Mo17 inbred lines. Different letters (a, b, c, d) indicate statistical difference between two inbred lines in the fieldenvironments (E1, E2, E3, E4) (ANOVA, least significant difference, P< 0.05).
Table 2. Estimated variances from combined ANOVA and heritabilities of 205 intermated recombinant inbred lines (IRILs) of theintermated B73�Mo17 (IBM) maize population for nine JIP‐test parameters combined across four field environments
TraitsVariance due to Heritability (%)
Environment IRIL IRIL� environment Error Estimate Standard error
TR0/ABSa 0.029�� 0.002�� 0.001 0.001 72.6 � 6.2
ET0/TR0b 0.065�� 0.002�� 0.001 0.002 70.7 � 6.5
ABS/RCc 11.674�� 0.176� 0.142 0.166 65.8 � 7.1TR0/RC
d 6.032�� 0.053� 0.048 0.052 64.1 � 7.8ET0/RC
e 1.444�� 0.014� 0.013 0.015 61.4 � 7.1DI0/RC
f 1.361�� 0.053�� 0.034 0.043 69.2 � 7.4TR0/DI0
g 10.976�� 0.594�� 0.304 0.373 72.9 � 5.8ET0/(TR0� ET0)
h 2.401�� 0.088�� 0.047 0.056 72.4 � 6.1PIABS
i 28.376�� 0.683�� 0.413 0.477 70.7 �6.9� and �� F‐test of corresponding mean squares significant at the 0.05 or 0.01 probability levels, respectively. aMaximum quantumyield of PSII; byield of electron transport per trapped exciton; cphoton absorbance rate per reaction centre (RC); dexciton trappingrate per RC; eelectron transport rate per RC; fexciton dissipation rate per RC; g
flux ratio trapping per dissipation; helectrontransport beyond QA
�; iperformance index on absorption basis.
QTLs for chlorophyll a fluorescence in maize 699
www.jipb.net July 2014 | Volume 56 | Issue 7 | 695–708
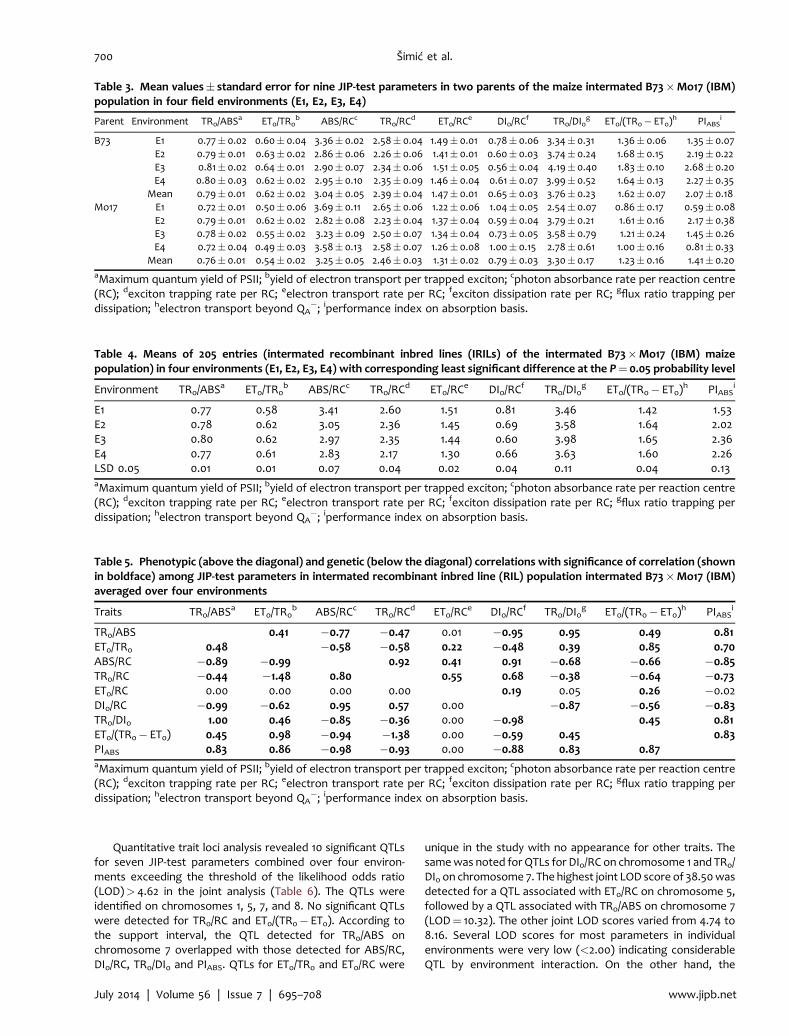
Quantitative trait loci analysis revealed 10 significant QTLsfor seven JIP‐test parameters combined over four environ-ments exceeding the threshold of the likelihood odds ratio(LOD)> 4.62 in the joint analysis (Table 6). The QTLs wereidentified on chromosomes 1, 5, 7, and 8. No significant QTLswere detected for TR0/RC and ET0/(TR0� ET0). According tothe support interval, the QTL detected for TR0/ABS onchromosome 7 overlapped with those detected for ABS/RC,DI0/RC, TR0/DI0 and PIABS. QTLs for ET0/TR0 and ET0/RC were
unique in the study with no appearance for other traits. Thesamewas noted for QTLs for DI0/RC on chromosome 1 and TR0/DI0 on chromosome 7. The highest joint LOD score of 38.50wasdetected for a QTL associated with ET0/RC on chromosome 5,followed by a QTL associated with TR0/ABS on chromosome 7(LOD¼ 10.32). The other joint LOD scores varied from 4.74 to8.16. Several LOD scores for most parameters in individualenvironments were very low (<2.00) indicating considerableQTL by environment interaction. On the other hand, the
Table 3. Mean values� standard error for nine JIP‐test parameters in two parents of the maize intermated B73�Mo17 (IBM)population in four field environments (E1, E2, E3, E4)
Parent Environment TR0/ABSa ET0/TR0
b ABS/RCc TR0/RCd ET0/RC
e DI0/RCf TR0/DI0
g ET0/(TR0� ET0)h PIABS
i
B73 E1 0.77�0.02 0.60� 0.04 3.36� 0.02 2.58� 0.04 1.49� 0.01 0.78� 0.06 3.34�0.31 1.36� 0.06 1.35� 0.07E2 0.79�0.01 0.63� 0.02 2.86� 0.06 2.26� 0.06 1.41� 0.01 0.60� 0.03 3.74�0.24 1.68� 0.15 2.19� 0.22E3 0.81�0.02 0.64� 0.01 2.90� 0.07 2.34� 0.06 1.51� 0.05 0.56� 0.04 4.19�0.40 1.83� 0.10 2.68� 0.20E4 0.80�0.03 0.62� 0.02 2.95� 0.10 2.35� 0.09 1.46� 0.04 0.61� 0.07 3.99�0.52 1.64� 0.13 2.27� 0.35
Mean 0.79�0.01 0.62� 0.02 3.04� 0.05 2.39� 0.04 1.47� 0.01 0.65� 0.03 3.76�0.23 1.62� 0.07 2.07� 0.18Mo17 E1 0.72�0.01 0.50� 0.06 3.69� 0.11 2.65� 0.06 1.22� 0.06 1.04� 0.05 2.54�0.07 0.86� 0.17 0.59� 0.08
E2 0.79�0.01 0.62� 0.02 2.82� 0.08 2.23� 0.04 1.37� 0.04 0.59� 0.04 3.79�0.21 1.61� 0.16 2.17� 0.38E3 0.78�0.02 0.55� 0.02 3.23� 0.09 2.50� 0.07 1.34� 0.04 0.73� 0.05 3.58�0.79 1.21� 0.24 1.45� 0.26E4 0.72�0.04 0.49� 0.03 3.58� 0.13 2.58� 0.07 1.26� 0.08 1.00� 0.15 2.78�0.61 1.00� 0.16 0.81� 0.33
Mean 0.76�0.01 0.54� 0.02 3.25� 0.05 2.46� 0.03 1.31� 0.02 0.79� 0.03 3.30�0.17 1.23� 0.16 1.41� 0.20aMaximum quantum yield of PSII; byield of electron transport per trapped exciton; cphoton absorbance rate per reaction centre(RC); dexciton trapping rate per RC; eelectron transport rate per RC; fexciton dissipation rate per RC; gflux ratio trapping perdissipation; helectron transport beyond QA
�; iperformance index on absorption basis.
Table 4. Means of 205 entries (intermated recombinant inbred lines (IRILs) of the intermated B73�Mo17 (IBM) maizepopulation) in four environments (E1, E2, E3, E4) with corresponding least significant difference at the P¼ 0.05 probability level
Environment TR0/ABSa ET0/TR0
b ABS/RCc TR0/RCd ET0/RC
e DI0/RCf TR0/DI0
g ET0/(TR0� ET0)h PIABS
i
E1 0.77 0.58 3.41 2.60 1.51 0.81 3.46 1.42 1.53E2 0.78 0.62 3.05 2.36 1.45 0.69 3.58 1.64 2.02E3 0.80 0.62 2.97 2.35 1.44 0.60 3.98 1.65 2.36E4 0.77 0.61 2.83 2.17 1.30 0.66 3.63 1.60 2.26LSD 0.05 0.01 0.01 0.07 0.04 0.02 0.04 0.11 0.04 0.13aMaximum quantum yield of PSII; byield of electron transport per trapped exciton; cphoton absorbance rate per reaction centre(RC); dexciton trapping rate per RC; eelectron transport rate per RC; fexciton dissipation rate per RC; gflux ratio trapping perdissipation; helectron transport beyond QA
�; iperformance index on absorption basis.
Table 5. Phenotypic (above the diagonal) and genetic (below the diagonal) correlations with significance of correlation (shownin boldface) among JIP‐test parameters in intermated recombinant inbred line (RIL) population intermated B73�Mo17 (IBM)averaged over four environments
Traits TR0/ABSa ET0/TR0
b ABS/RCc TR0/RCd ET0/RC
e DI0/RCf TR0/DI0
g ET0/(TR0� ET0)h PIABS
i
TR0/ABS 0.41 �0.77 �0.47 0.01 �0.95 0.95 0.49 0.81ET0/TR0 0.48 �0.58 �0.58 0.22 �0.48 0.39 0.85 0.70ABS/RC �0.89 �0.99 0.92 0.41 0.91 �0.68 �0.66 �0.85TR0/RC �0.44 �1.48 0.80 0.55 0.68 �0.38 �0.64 �0.73ET0/RC 0.00 0.00 0.00 0.00 0.19 0.05 0.26 �0.02DI0/RC �0.99 �0.62 0.95 0.57 0.00 �0.87 �0.56 �0.83TR0/DI0 1.00 0.46 �0.85 �0.36 0.00 �0.98 0.45 0.81ET0/(TR0� ET0) 0.45 0.98 �0.94 �1.38 0.00 �0.59 0.45 0.83PIABS 0.83 0.86 �0.98 �0.93 0.00 �0.88 0.83 0.87aMaximum quantum yield of PSII; byield of electron transport per trapped exciton; cphoton absorbance rate per reaction centre(RC); dexciton trapping rate per RC; eelectron transport rate per RC; fexciton dissipation rate per RC; gflux ratio trapping perdissipation; helectron transport beyond QA
�; iperformance index on absorption basis.
700 Šimić et al.
July 2014 | Volume 56 | Issue 7 | 695–708 www.jipb.net

highest individual LOD score was 30.88 for the QTL onchromosome 5 for ET0/RC, which had the greatest totalphenotypic variance (R2) values in E3 and E4 explaining 65.8%and 24.3% of the phenotypic variance, respectively. Generally,the total small values of R2 for all QTLs per trait indicate that allJIP parameters are controlled by several loci either detected orundetected indicating polygenic inheritance. QTLs with posi-tive and negative allelic effects were identified for all traits in allfour environments; a positive effect implied a higher value forthe trait conferred by the B73 allele, and vice versa. Thedirection of allelic effects was in general consistent with thecorresponding phenotypic differences between parents(Table 4).
One putative QTL was identified affecting one or more JIPparameters on the basis of the likelihood ratio test of the jointmultitrait composite interval mapping (MCIM) model over thenine JIP parameters (Figure 2). The highest peak exceeded thethreshold of LOD¼ 8.3. As expected, the joint MCIMmodel overthe nine JIP parameters revealed one significant pleiotropic QTLon chromosome7, as had been demonstrated in theQTL analysisfor individual traits where five parameters had QTLs at almostthe same position with support interval 288.9–296.2.
DISCUSSIONAprevious screening experiment (Lepeduš et al. 2012) revealedthat inbred lines B73 and Mo17 differed remarkably for Fv/Fmand PIABS parameters under the very dry scenario, therebyproviding contrasting parents for the mapping population tobe evaluated for abiotic stress. This is a crucial finding becausetheir biparental population IBM is unique among publiclyavailable maize mapping populations for two reasons: fourgenerations of intermating at the F2 stage have increased the
observed numbers of recombinations, expanding the geneticmap approximately fourfold, when compared with non‐intermated, conventional RIL populations (Lee et al. 2002)with a very high mapping resolution, approximately 0.4centimorgans (cM) (1 cM¼ 1 map unit¼ 1% recombination);and the IBM population consisting of a relatively large numberof IRILs (302) has been densely genotyped with >2,000molecularmarkers (Coe et al. 2002). This can act as an excellentresource for further physiological, genetic, genomic, orpostgenomic studies of photosynthesis.
OJIP chlorophyll a fluorescence transient curves obtainedin the very dry E1 for B73 and Mo17 confirmed differencesbetween the two inbred lines (Figure 1). The two parentsdiffered considerably for the chlorophyll fluorescence param-eters when grown under very dry (E1), but not under dryconditions (E2) (Table 3), indicating that chlorophyll fluores-cence can be an efficient and sensitive selection tool fordifferent drought scenarios. Further investigations done in 2011(E3) revealed that there is also considerable influence ofirradiation on photosynthetic performances in the two parentsgrown under well‐watered conditions. The highest increases ofchlorophyll fluorescence in J step, which was observed in Mo17plants grown in E4 under very dry conditions (Figure 1E),indicates increased reduction of primary quinone electronacceptor of PSII (QA) in comparison with Mo17 grown in E2 andE3 as well as with B73 grown in all investigated environments(Strasser et al. 2004). The accumulation of QA
� would lead tochanges in redox status of PQ pool and this, in turn, might be atrigger for changes in both nuclear and chloroplast genesexpression (Pfannschmidt 2003). Also, it is well known thatover‐reduction of the photosynthetic electron transport chainhas great potential to generate different toxic species inexcess, such as reactive oxygen species (ROS) (Asada 2006).Besides the toxic effects of ROS on biomolecules, their
Table 6. Main characteristics of quantitative trait loci (QTLs) s for seven JIP‐test parameters with a likelihood odds ratio (LOD)score >4.62 in joint analysis of 205 intermated recombinant inbred lines (IRILs) of intermated B73�Mo17 (IBM) maizepopulation in the four field environments
Parameter Chr.bina
Positionb Supportintervalc
Marker intervalcLOD scoree R2g
AdditiveeffecthE1 E2 E3 E4 Jointf E1 E2 E3 E4
TR0/ABSi 7.03 292.2 289.9–295.2 umc116a–umc1713 1.15 3.50 6.80 3.33 10.32 2.93 5.94 8.61 5.81 0.004
ET0/TR0j 1.08 799.4 793.5–805.3 AY110349–umc1383 4.36 1.21 1.54 2.63 5.99 6.77 2.24 2.36 3.84 0.013
ABS/RCk 7.03 292.2 289.8–295.4 umc116a–umc1713 0.28 1.96 1.83 2.24 5.87 0.44 3.41 3.28 3.64 �0.061ET0/RC
l 5.07 554.6 549.6–563.5 umc108–bnlg1118 1.58 0.87 30.88 9.91 38.50 2.65 1.73 65.8 24.3 �0.0498.03 212.0 211.0–216.2 npi260b–umc2354 7.11 0.87 0.33 1.64 8.16 12.87 0.21 0.15 1.96 0.016
DI0/RCm 1.04 401.2 399.4–401.3 bnlg2295–umc2112 3.95 2.21 1.83 0.28 4.74 7.21 4.52 3.64 0.42 0.051
7.03 290.2 288.9–295.1 umc116a–umc1713 0.63 2.98 1.72 2.65 5.34 0.77 6.94 3.48 5.45 �0.040TR0/DI0
n 7.03 290.2 288.9–295.0 umc116a–umc1713 0.52 2.23 2.70 1.75 4.77 0.86 4.52 4.61 3.57 0.0217.03 322.7 313.7–329.3 bnl5.46c–npi394 0.63 1.13 6.12 1.34 6.92 0.91 2.92 8.41 3.22 0.022
PIABSo 7.03 292.2 289.1–296.2 umc1926–adh2 0.91 2.34 4.03 1.54 7.03 1.42 3.95 5.14 2.35 0.238
aThe concept of dividing of 10 maize chromosomes into 10 segments (bins) each, of approximately 20 cM between two fixed CoreMarkers (Gardiner et al. 1993); bthe position of the peak of the QTL in linkage group; cthe map interval corresponding to a 1‐LODdecline either side of the LOD peak; dthe interval within which QTLs were mapped; eLog10 of the likelihood odds ratio—theprobability associated with the most likely location of the detected QTL; fLOD score in the joint analysis permutation test (1,000permutations) significant (>4.62) at the 0.05 probability level; gpercentage of the phenotypic variance explained by genotypeclass at LOD peak; hnegative value indicate that the allele of the first parent (B73) decreases the trait value; imaximum quantumyield of PSII; jyield of electron transport per trapped exciton; kphoton absorbance rate per reaction centre (RC); lelectron transportrate per RC; mexciton dissipation rate per RC; nflux ratio trapping per dissipation; operformance index on absorption basis.
QTLs for chlorophyll a fluorescence in maize 701
www.jipb.net July 2014 | Volume 56 | Issue 7 | 695–708

regulatory role in gene expression is emphasized (Neillet al. 2002). Since there was no significant differences in VIparameter between B73 and Mo17 lines for each particularenvironment (Figure 1F) it can be concluded that decreasedelectron transport beyond QA
� (ET0/RC) in Mo17 grown in E1,E3, and E4 in comparison with corresponding B73 (Table 3),that was caused by increase in VJ parameter, reflected onoverall photosynthetic performance (PIABS) (Table 3).
In our study, values of the JIP parameters were influencedby both environmental and genotypic effects, but nosignificant genotype� environment interactions weredetected indicating no considerable change in the IRILs ranksacross the environments for all JIP parameters. It wasconfirmed by relatively high estimates of heritability (Table 2).The mean differences for each trait across the four environ-ments clearly indicate that weather conditions strongly affectchlorophyll fluorescence parameters, particularly ABS/RC,TR0/RC, DI0/RC, and PIABS. Precipitation of 10mm and differentirradiation yielded considerable changes in JIP‐test parametervalues, thus supporting the classical reports of Krause andWeiss(1991) and Schreiber et al. (1994) showing that the chlorophyll
fluorescence parameters are very sensitive to variable environ-ments. Generally, under less favorable water supply, the meanvalues for ABS/RC, TR0/RC, ET0/RC, and DI0/RC increased, whilethose for TR0/ABS and PIABS decreased. Cruz de Carvalho et al.(2011) also reported about the differences in chlorophyllfluorescence among six Portuguese maize cultivars duringdrought stress and recovery.
Our study undoubtedly shows that the JIP‐test parameterswere under different genetic controls in different environ-ments. Relatively high LOD scores for QTL� environmentinteraction in the joint analysis demonstrated considerablelocus by environment interaction for all JIP parameters, whencompared with the respective joint LOD scores. Previousstudies (Fracheboud et al. 2002, 2004; Jompuk et al. 2005; Guoet al. 2008; Yin et al. 2010) have stressed that changes inenvironments can induce constitutive structural alterations ofthe photosynthetic apparatus, eventually leading to changes inphotosynthetic activity. Guo et al. (2008) found no commonQTLs across the two conditions contrasting in water supply inbarley, whereas Yang et al. (2007) detected no common QTLsfor chlorophyll fluorescence and associated traits under two
Figure 2. Likelihood‐ratio test statistic profile transferred to the likelihood odds ratio (LOD) profile from multitrait compositeinterval mapping (MCIM) of nine JIP‐test parametersThe solid line indicates the LOD significance threshold of 8.3 for joint mapping generated by permutation analysis (a¼ 0.05,experimentwide). All 10 chromosomes (linkage groups) are along the x‐axis Ch‐1–Ch‐10, with vertical double lines separating them.The arrow indicates the peak of the significant quantitative trait locus (QTL).
702 Šimić et al.
July 2014 | Volume 56 | Issue 7 | 695–708 www.jipb.net
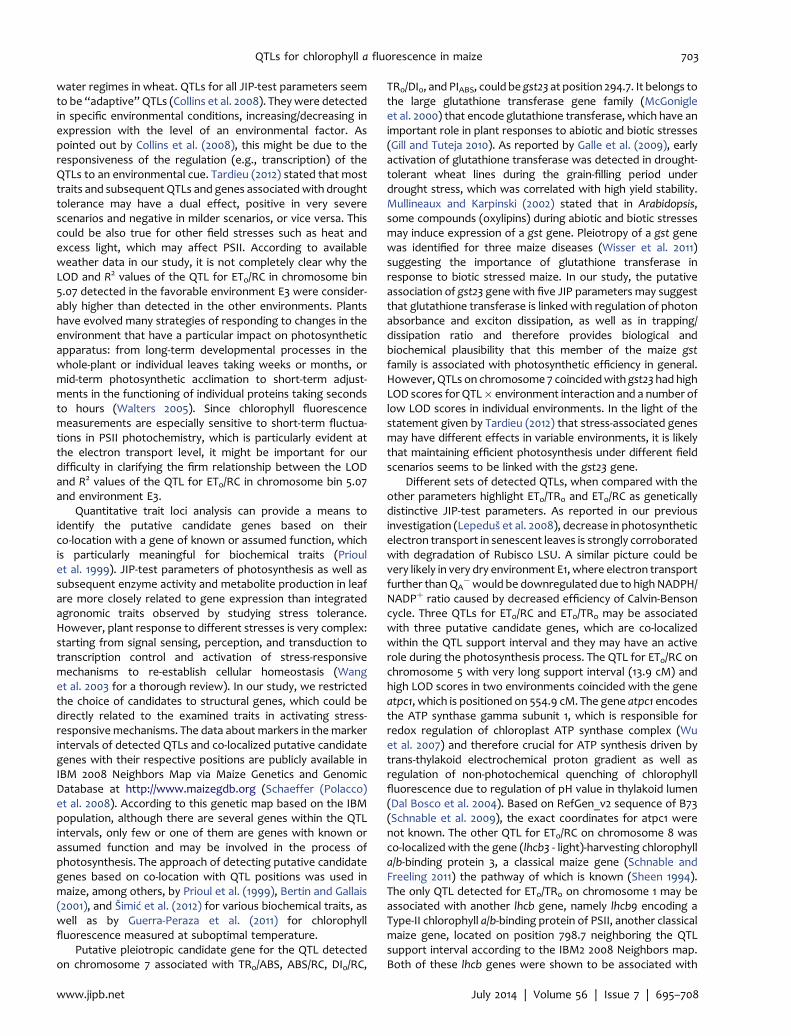
water regimes in wheat. QTLs for all JIP‐test parameters seemto be “adaptive”QTLs (Collins et al. 2008). Theywere detectedin specific environmental conditions, increasing/decreasing inexpression with the level of an environmental factor. Aspointed out by Collins et al. (2008), this might be due to theresponsiveness of the regulation (e.g., transcription) of theQTLs to an environmental cue. Tardieu (2012) stated that mosttraits and subsequent QTLs and genes associated with droughttolerance may have a dual effect, positive in very severescenarios and negative in milder scenarios, or vice versa. Thiscould be also true for other field stresses such as heat andexcess light, which may affect PSII. According to availableweather data in our study, it is not completely clear why theLOD and R2 values of the QTL for ET0/RC in chromosome bin5.07 detected in the favorable environment E3 were consider-ably higher than detected in the other environments. Plantshave evolved many strategies of responding to changes in theenvironment that have a particular impact on photosyntheticapparatus: from long‐term developmental processes in thewhole‐plant or individual leaves taking weeks or months, ormid‐term photosynthetic acclimation to short‐term adjust-ments in the functioning of individual proteins taking secondsto hours (Walters 2005). Since chlorophyll fluorescencemeasurements are especially sensitive to short‐term fluctua-tions in PSII photochemistry, which is particularly evident atthe electron transport level, it might be important for ourdifficulty in clarifying the firm relationship between the LODand R2 values of the QTL for ET0/RC in chromosome bin 5.07and environment E3.
Quantitative trait loci analysis can provide a means toidentify the putative candidate genes based on theirco‐location with a gene of known or assumed function, whichis particularly meaningful for biochemical traits (Prioulet al. 1999). JIP‐test parameters of photosynthesis as well assubsequent enzyme activity and metabolite production in leafare more closely related to gene expression than integratedagronomic traits observed by studying stress tolerance.However, plant response to different stresses is very complex:starting from signal sensing, perception, and transduction totranscription control and activation of stress‐responsivemechanisms to re‐establish cellular homeostasis (Wanget al. 2003 for a thorough review). In our study, we restrictedthe choice of candidates to structural genes, which could bedirectly related to the examined traits in activating stress‐responsive mechanisms. The data about markers in the markerintervals of detected QTLs and co‐localized putative candidategenes with their respective positions are publicly available inIBM 2008 Neighbors Map via Maize Genetics and GenomicDatabase at http://www.maizegdb.org (Schaeffer (Polacco)et al. 2008). According to this genetic map based on the IBMpopulation, although there are several genes within the QTLintervals, only few or one of them are genes with known orassumed function and may be involved in the process ofphotosynthesis. The approach of detecting putative candidategenes based on co‐location with QTL positions was used inmaize, among others, by Prioul et al. (1999), Bertin and Gallais(2001), and Šimić et al. (2012) for various biochemical traits, aswell as by Guerra‐Peraza et al. (2011) for chlorophyllfluorescence measured at suboptimal temperature.
Putative pleiotropic candidate gene for the QTL detectedon chromosome 7 associated with TR0/ABS, ABS/RC, DI0/RC,
TR0/DI0, and PIABS, could be gst23 at position 294.7. It belongs tothe large glutathione transferase gene family (McGonigleet al. 2000) that encode glutathione transferase, which have animportant role in plant responses to abiotic and biotic stresses(Gill and Tuteja 2010). As reported by Galle et al. (2009), earlyactivation of glutathione transferase was detected in drought‐tolerant wheat lines during the grain‐filling period underdrought stress, which was correlated with high yield stability.Mullineaux and Karpinski (2002) stated that in Arabidopsis,some compounds (oxylipins) during abiotic and biotic stressesmay induce expression of a gst gene. Pleiotropy of a gst genewas identified for three maize diseases (Wisser et al. 2011)suggesting the importance of glutathione transferase inresponse to biotic stressed maize. In our study, the putativeassociation of gst23 gene with five JIP parameters may suggestthat glutathione transferase is linked with regulation of photonabsorbance and exciton dissipation, as well as in trapping/dissipation ratio and therefore provides biological andbiochemical plausibility that this member of the maize gstfamily is associated with photosynthetic efficiency in general.However, QTLs on chromosome 7 coincidedwith gst23 had highLOD scores for QTL� environment interaction and a number oflow LOD scores in individual environments. In the light of thestatement given by Tardieu (2012) that stress‐associated genesmay have different effects in variable environments, it is likelythat maintaining efficient photosynthesis under different fieldscenarios seems to be linked with the gst23 gene.
Different sets of detected QTLs, when compared with theother parameters highlight ET0/TR0 and ET0/RC as geneticallydistinctive JIP‐test parameters. As reported in our previousinvestigation (Lepeduš et al. 2008), decrease in photosyntheticelectron transport in senescent leaves is strongly corroboratedwith degradation of Rubisco LSU. A similar picture could bevery likely in very dry environment E1, where electron transportfurther than QA
�would be downregulated due to high NADPH/NADPþ ratio caused by decreased efficiency of Calvin‐Bensoncycle. Three QTLs for ET0/RC and ET0/TR0 may be associatedwith three putative candidate genes, which are co‐localizedwithin the QTL support interval and they may have an activerole during the photosynthesis process. The QTL for ET0/RC onchromosome 5 with very long support interval (13.9 cM) andhigh LOD scores in two environments coincided with the geneatpc1, which is positioned on 554.9 cM. The gene atpc1 encodesthe ATP synthase gamma subunit 1, which is responsible forredox regulation of chloroplast ATP synthase complex (Wuet al. 2007) and therefore crucial for ATP synthesis driven bytrans‐thylakoid electrochemical proton gradient as well asregulation of non‐photochemical quenching of chlorophyllfluorescence due to regulation of pH value in thylakoid lumen(Dal Bosco et al. 2004). Based on RefGen_v2 sequence of B73(Schnable et al. 2009), the exact coordinates for atpc1 werenot known. The other QTL for ET0/RC on chromosome 8 wasco‐localized with the gene (lhcb3 ‐ light)‐harvesting chlorophylla/b‐binding protein 3, a classical maize gene (Schnable andFreeling 2011) the pathway of which is known (Sheen 1994).The only QTL detected for ET0/TR0 on chromosome 1 may beassociated with another lhcb gene, namely lhcb9 encoding aType‐II chlorophyll a/b‐binding protein of PSII, another classicalmaize gene, located on position 798.7 neighboring the QTLsupport interval according to the IBM2 2008 Neighbors map.Both of these lhcb genes were shown to be associated with
QTLs for chlorophyll a fluorescence in maize 703
www.jipb.net July 2014 | Volume 56 | Issue 7 | 695–708

changes in macrostructure and energy distribution in PSII(Damkjær et al. 2009; Alboresi et al. 2011). This indicates thatJIP parameters that describe electron transport and trappingmight be a good indicator for selecting maize genotypes withadvanced mechanisms for optimization of photochemical lightutilization and photo protection in defined environmentalconditions. Our results, though, should be validated viaassociation studies linking nuclear polymorphism of candidategenes with phenotypic chlorophyll a fluorescence data, as wellas via expression studies in transgenic plants.
Significant and tight genetic correlations as well as co‐localized QTLs on chromosome 7 for TR0/ABS, ABS/RC, DI0/RCTR0/DI0, and PIABS indicate pleiotropy for the parameters.Moreover,MCIM revealed several pleiotropic QTLswhen all JIPparameters were involved. The joint‐mapping approachoffered the advantage of directly testing whether differentJIP parameters were affected by a particular QTL and providedgreater power to detect pleiotropy. It is not clear, though,which particular JIP parameters were affected by the threedescribed QTLs. Eventually, fine‐scale mapping with additionalmarkers and larger mapping populations are required todistinguish truly pleiotropic loci from tightly linked loci notcontrolled by the same underlying genes.
The additive‐dominant model revealed mostly highlysignificant additive effects with no significant dominant effect(data not shown), suggesting that JIP parameters are mostlycontrolled by numerous small‐effect QTLs not identified in QTLanalysis, but predicted by a simple additive model. Further-more, they had nearly normal frequency distributionssuggesting that the traits seem to be controlled by a greaternumber of genes. The multifunctional JIP parameters, exceptET0/RC are linear functions of the respective measuredcomponents likely “normalized” by way of dividing oneskewed trait distribution by another.
Our results demonstrate that QTL analysis was capable ofdetecting 10 significant loci on the chromosomes 1, 5, 7, and 8,coinciding with the genes possibly associated with chlorophylla fluorescence parameters in different field environments.However, many of the QTLs were not stable across environ-ments indicating the “adaptive” nature of QTLs. Despite anumber of QTLs being detected, the sum of QTL effects for allJIP parameters according to percentage of explained pheno-typic variance is small. The remaining unexplained differencesuggests that there are many QTLs that were not detected inour study. Thus, photosynthetic processes of photon absor-bance, exciton trapping, exciton dissipation, and electrontransport, together with calculated traits of photosyntheticefficiency involve a much larger number of genes controllingphenotypic divergence. Because each QTL may containmultiple linked genes, and methods of estimating genenumber are inherently biased toward under‐detection ofQTLs, the QTLs detected in this study are minimum estimatesof gene number. The detection of these QTLs suggests thatimprovement in abiotic stress by marker‐assisted selection inmaize for JIP parameters is feasible. However, further studieson other breeding materials and linkage/association mappingare necessary to validate the presented QTLs, as well as detectthe additional loci associated with chlorophyll fluorescenceparameters in different field scenarios. Moreover, theemerging and converging approaches of genomic selectionand high‐throughput phenotyping promise to considerably
advance crop breeding for complex traits including adaptationto stress (Cabrera‐Bosquet et al. 2012).
MATERIALS AND METHODSPlant materials and experimental conditionsInbred lines B73 and Mo17 were chosen for QTL analysis in2010 according to the results of 2009 presented by Lepedušet al. (2012), where among seven inbred lines, the lines B73 andMo17 had the most contrasted values across all chlorophylla fluorescence parameters under very dry field conditions.Liu et al. (2003) presented in detail the genetic and genomicrelations between Mo17 and B73. Coincidentally, theselines are the best investigated genetic and genomic resourcesin maize. There exists a densely marked, high‐resolutiongenetic map of their biparental population IBM (IntermatedB73 and Mo17) consisting of 304 IRILs (Coe et al. 2002;Lee et al. 2002). Seeds of 304 IRILs of the IBM populationhad been received from the Maize Genetic COOP StockCenter, Urbana, IL, USA. Owing to seed shortage and poorgermination or growth during seed multiplication, only 245IBM lines were included in the experiment 2010. The parentsB73, Mo17, and 245 IRILs of the IBM population were plantedin randomized single row plots in two replications with 20plants per row.
Trait measurementIn all four environments, five randomly chosen maize plantsper plot were measured for JIP parameters. Across tworeplications, it made a total of 10 measurements per IRIL orparent in each environment. In each experimental unit, the firsttwo plants were considered border plants and were not usedfor measurement. We chose only ear‐leaf for measurementbecause it had been demonstrated that it could representchlorophyll‐related traits in a maize canopy (Ciganda et al.2009). Samples for chlorophyll fluorescence measurementwere taken in July (Table 1) during maize flowering when themaize plant was particularly sensitive to stress, that is,tasseling during VT phenological stage (environments E1, E3,and E4), and during phenological stages R0 and R1 (anthesisand silking) in E2 before fertilization. A common characteristicof maize response to stresses near flowering is a reduction inreproductive fertility (Collins et al. 2008) affecting grainformation and eventually grain yield. In this study, grain yieldwas not of interest since possible stress conditions afterflowering and during grain formation were not observed andIRILs were evaluated per se exhibiting inbreeding depression.Generally, chosen plant of all IRILs were at the samephenological stage upon measuring. There was 1‐d fluores-cence measurement per environment in the morning(6.30 a.m. to 9.30 a.m.) in order to minimize short‐termfluctuations in irradiance, rainfall and temperature. Thechlorophyll a fluorescence transient was measured by PlantEfficiency Analysers (PEA, Hansatech, UK) on attached leavesat ambient temperature. Details about the in vivo chlorophyllmeasurement were presented in the study by Lepedušet al. (2011b). Briefly, after dark adaptation (30min), thechlorophyll fluorescence transient was induced by applying apulse of saturating red light (peak at 650 nm, 3,000mmol/m2
per s). The application of the saturating light pulseinduces chlorophyll a fluorescence increases from minimal
704 Šimić et al.
July 2014 | Volume 56 | Issue 7 | 695–708 www.jipb.net

fluorescence (F0, O step) when all reaction centers (RC) areopen, to maximal fluorescence (Fm, P step) when all RC areclosed. Induction curves showed the polyphasic fluorescenceincrease, consisting of two intermediate steps (J step at 2msand I step at 30ms) (Figure 1). During the first 2ms, changeswere recorded every 10ms, and thereafter, every 1ms. Thedata obtained were used to draw the OJIP curves and tocalculate several biophysical parameters that describe thephotochemistry of PSII according to Strasser et al. (2004).Since native OJIP transient curves were recorded as absolutefluorescence, double normalization at the F0 and Fm points wasdone with intention to enable direct comparison of curvesshape (Strauss et al. 2006). Each curve represents the mean of10 independent transient measurements. Normalization wasdone using MS Excel 2007 software.
The parameter maximum quantum yield of PSII wascalculated as (Fm� F0)/Fm. The most important parameter ofthe JIP‐test that gives the information about overall photo-synthetic performance is the performance index (PIABS). PIABScomprises three main processes in PSII: light absorption (ABS),trapping of excitation energy (TR0), and conversion ofexcitation energy to photosynthetic electron transport (ET0).Furthermore, the JIP‐test facilitates the calculation of dissipa-tion (DI0) of excess light energy absorbed by PSII. PIABS wascalculated as PIABS¼ (RC/ABS)þ (TR0/DI0)þ (ET0/(TR0� ET0)).Other calculated parameters were yield of electron transportper trapped exciton (ET0/TR0), absorption per active RC (ABS/RC), trapping of exciton per active RC (TR0/RC), electrontransport beyond QA
� per RC (ET0/RC), non‐photochemicaldissipation per RC (DI0/RC), as well as components of PIABS:flux ratio trapping per dissipation (TR0/DI0), and electrontransport beyond QA
� (ET0/(TR0� ET0)). Maximum quantumyield of PSII, Fv/Fm is equivalent to TR0/ABS. Variablefluorescence at J step (VJ) and I step (VI) were calculated asVJ¼ (FJ� F0)/(Fm� F0) and VI¼ (FI� F0)/(Fm� F0), where FJindicates fluorescence intensity at 2ms and FI indicatesfluorescence intensity at 30ms. Calculations of these JIPparameters had been presented in the study by Lepeduš et al.(2011a). Due to within‐plot soil heterogeneity, 39 RILs, whichhad large sampling error exceeding 25% of the mean for a JIPparameter, were discarded, making a total of 205 IRILs for thesubsequent QTL analysis. Generally, sampling errors weresmall. The power and sample analysis for one‐sample t‐testrevealed that the power was 0.90 or higher (at the 0.05probability level) for actual means, standard errors, andsample size of 10 plants were in all JIP parameters. The powerof 0.90 is higher than usual “five‐eighty convention” applyingthreshold of 0.80 power value at the 0.05 probability level (DiStefano 2003).
Statistical analysisGenotypic variance of the 205 IRILs and two parents includingtheir standard errors, as well as block, replication and errorvariances for the eight JIP‐test traits were calculated byANOVA. Generally, there were no significant effects ofreplication and block. This suggests that no considerablechanges occurred in weather conditions and plant waterstatus during the measurement time span (Table 1). Inthe combined ANOVA, effects of environment, genotype,genotype� environment interaction, and error were estimat-ed on adjusted entry mean values from the individual
trial analyses. Broad‐sense heritability on a genotype (entry)mean basis (Hallauer et al. 1988) was estimated as h2 ¼s2G � 100� �
= s2GE=eþ s2e=reþ s2G� �
, where s2G is the estimate ofthe genotypic variance, s2GE is the estimate of the genotype� environment interaction variance, s2e is the estimate of errorvariance, e is the number of environments, and r is the numberof replications per environment. Genetic correlations amongJIP parameters were calculated as covG(i,j)/sisj, where covG(i,j)is the genetic covariance between parameters i and j and si andsj are the square roots of the genotypic variances of the twoparameters, respectively. Genetic correlation between param-eters can be taken as evidence that some common genesunderlie the phenotypic variation in multiple traits (Wisseret al. 2011). ANOVA were performed, and correlationcoefficients were calculated using PLABSTAT program, Version3A (Utz 2011).
QTL mappingThe map of the IBM population covered 7,090 cM across thewhole maize genome consisting of 2 178 markers. The units ofdistance in the IBM population are not, strictly speaking, cMrather “IBM centiMorgans” (IcM) since at small intervaldistances, 1 cM¼ approximately 4 IcM, but the relationshipbetween cM and IcM is not linear (Lee et al. 2002; Falque 2005).Rather than convert IBMmap positions to “true cM”, we reportQTL positions according to the widely used IBM2 map so thatthey can be easily matched with publicly available molecularmarkers. Details about the used markers are available in onlinedatabaseMaizeGDB (Andorf et al. 2010). The composite intervalmappingmethod (CIM) (Zeng1994), extendedtoperforma jointanalysis ofmultiple environments (MCIM) (JiangandZeng1995),was used tomap the QTLs and to test whether it accounts for aQTL by environment (QTL� E) interaction. The genome wasscanned at 2‐cM intervals and thewindow sizewas set at 10 cM.
For all traits examined in this study, thresholds of Log10 ofthe likelihood odds ratio (LOD) scores for declaring asignificant QTL were LOD< 2.20 by permutation test analyses(1,000 permutations and significance level¼ 5%; Churchill andDoerge 1994) detected at least in one environment. However,to find more putative QTLs and obtain a better understandingof the relationships among the traits, the LOD threshold of 4.62from the joint QTL analysis was eventually used for declaring aQTL. The maximum LOD score along the interval was taken asthe position of theQTL. The region in the LOD score, within oneLOD unit of maximum, was taken as the support interval. Thecontribution of each identified QTL to the total phenotypicvariance (R2) was estimated by variance component analysis.MCIM likelihood ratio test was used from joint analysis over allJIP parameters previously averaged across the environments,to determine if QTL detected by MCIM had pleiotropic effects.All QTL analyses, including the JZmapQTL procedure fordetecting QTL� E interaction and pleiotropy, were performedusing Windows QTL Cartographer software version 2.5 (Wanget al. 2011).
ACKNOWLEDGEMENTSThis work was supported by research grants 073‐0731674‐1673,073‐0731674‐0841 and 073‐0730463‐0203 from Ministry ofScience, Education and Sports, Republic of Croatia.
QTLs for chlorophyll a fluorescence in maize 705
www.jipb.net July 2014 | Volume 56 | Issue 7 | 695–708

REFERENCESAlboresi A, Gerotto C, Cazzaniga S, Bassi R, Morosinotto T (2011) A red‐
shifted antenna protein associated with photosystem II inPhyscomitrella patens. J Biol Chem 286: 28978–28987
Andorf CM, Lawrence CJ, Harper LC, Schaeffer ML, Campbell DA, SenTZ (2010) The Locus Lookup tool at MaizeGDB: Identification ofgenomic regions in maize by integrating sequence informationwith physical and genetic maps. Bioinformatics 26: 434–436
Apostolova EL, Dobrikova AG, Ivanova PI, Petkanchin IB, Taneva SG(2006) Relationship between the organization of the super-complex and the functions of the photosynthetic apparatus.J Photochem Photobiol B Biol 83: 114–122
Asada K (2006) Production and scavenging of reactive oxygen speciesin chloroplasts and their functions. Plant Physiol 141: 391–396
BaumM, Grando S, Backes G, Jahoor A, Sabbagh A, Ceccarelli S (2003)QTLs for agronomic traits in the Mediterranean environmentidentified in recombinant inbred lines of the cross “Arta” 9 H.spontaneum 41‐ 1. Theor Appl Genet 107: 1215–1225
Bertin P, Gallais A (2001) Genetic variation of nitrogen use efficiency in aset of recombinant maize inbred lines II. QTL detection andcoincidences. Maydica 46: 53–68
Brestic M, Zivcak M (2013) PSII fluorescence techniques for measure-ment of drought and high temperature stress signal in plants:Protocols and applications. In: Rout GR, Das AB, eds. MolecularStress Physiology of Plants. Springer, Dordrecht. pp. 87–131
Cabrera‐Bosquet L, Crossa J, von Zitzewitz J, Serret MD, Araus JL(2012) High‐throughput phenotyping and genomic selection: Thefrontiers of crop breeding converge. J Integr Plant Biol 54: 312–320
Campos H, Cooper M, Habben JE, Edmeades GO, Schussler JR (2004)Improving drought tolerance in maize: A view from industry. FieldCrop Res 90: 19–34
Churchill GA, Doerge RW (1994) Empirical threshold values forquantitative trait mapping. Genetics 138: 963–971
Ciganda V, Gitelson A, Schepers J (2009) Non‐destructive determina-tion of maize leaf and canopy chlorophyll content. J Plant Physiol166: 157–167
ClarkAJ, LandoltW,Bucher JB,StrasserRJ (2000)Beech (Fagus sylvatica)response to ozone exposure assessed with a chlorophyll fluores-cence performance index. Environ Pollut 109: 501–507
Coe E, Cone K, McMullen M, Chen S, Davis G, Gardiner J, Liscum E,Polacco M, Paterson A, Sanchez‐Villeda H, Soderlund C, Wing R(2002) Access to the maize genome: An integrated physical andgenetic map. Plant Physiol 128: 9–12
Collins NC, Tardieu F, Tuberosa R (2008) Quantitative trait loci and cropperformance under abiotic stress: Where do we stand? PlantPhysiol 147: 469–486
Courtois B, McLaren G, Sinha PK, Prasad K, Yadav R, Shen L (2000)Mapping QTL associated with drought avoidance in upland rice.Mol Breed 6: 55–66
Cruz de Carvalho, R, Cunha A, Marques da Silva J (2011) Photosynthesisby six Portuguese maize cultivars during drought stress andrecovery. Acta Physiol Plant 33: 359–374
Dal Bosco CD, Lezhneva L, Biehl A, Leister D, Strotmann H, Wanner G,Meurer J (2004) Inactivation of the chloroplast ATP synthasegamma subunit results in high non‐photochemical fluorescencequenching and altered nuclear gene expression in Arabidopsisthaliana. J Biol Chem 279: 1060–1069
Damkjær JT, Kereïche S, Johnson MP, Kovacs L, Kiss AZ, Boekema EJ,Ruban AV, Horton P, Jansson S (2009) The photosystem II light‐harvesting protein Lhcb3 affects the macrostructure of photosys-
tem II and the rate of state transitions in Arabidopsis. Plant Cell 21:3245–3256
Di Stefano J (2003) How much power is enough? Against thedevelopment of an arbitrary convention for statistical powercalculation. Funct Ecol 7: 707–709
Falque M (2005) IRILmap: Linkage map distance correction forintermated recombinant inbred lines/advanced recombinantinbred strains. Bioinformatics 21: 3441–3442
Flood PJ, Harbinson J, Aarts MGM (2011) Natural genetic variation inplant photosynthesis. Trends Plant Sci 16: 327–335
Fracheboud Y, Ribaut JM, Vargas M, Messmer R, Stamp P (2002)Identification of quantitative trait loci for cold‐tolerance ofphotosynthesis in maize (Zea mays L.). J Exp Bot 53: 1967–1977
Fracheboud Y, Jompuk C, Ribaut JM, Stamp P, Leipner J (2004) Geneticanalysis of cold‐tolerance of photosynthesis in maize. Plant MolBiol 56: 241–253
Galle A, Csiszar J, Secenji M, Guoth A, Cseuz L, Tari I, Gyorgyey J, Erdei L(2009) Glutathione transferase activity and expression patternsduring grain filling in flag leaves of wheat genotypes differing indrought tolerance: Response to water deficit. J Plant Physiol 166:1878–1891
Gardiner JM, Coe EH, Melia‐Hancock S, Hoisington DA, Chao S (1993)Development of a core RFLP map in maize using an immortalizedF2 population. Genetics 134: 917–930
Gill SS, Tuteja N (2010) Reactive oxygen species and antioxidantmachinery in abiotic stress tolerance in crop plants. Plant PhysiolBiochem 48: 909–930
Guerra‐Peraza O, Leipner J, Reimer R, Nguyen HT, Stamp P,Fracheboud Y (2011) Temperature at night affects the geneticcontrol of acclimation to cold in maize seedlings.Maydica 56: 367–377
Guo P, Baum M, Varshney RK, Graner A, Grando S, Ceccarelli S (2008)QTLs for chlorophyll and chlorophyll fluorescence parameters inbarley under post‐flowering drought. Euphytica 163: 203–214
Hallauer AR, Carena MJ, Filho JB (1988) Quantitative Genetics in MaizeBreeding. Second edition. Iowa State University Press, Ames, IA
Jiang C, Zeng ZB (1995) Multiple trait analysis of genetic mapping forquantitative trait loci. Genetics 140: 1111–1127
Jompuk C, Fracheboud Y, Stamp P, Leipner J (2005) Mapping ofquantitative trait loci associated with chilling tolerance in maize(Zea mays L.) seedlings grown under field conditions. J Exp Bot 56:1153–1163
Kovačević V, Šimić D, Šoštarić J, Josipović M (2007) Precipitation andtemperature regime impacts on maize yields in Eastern Croatia.Maydica 52: 301–305
Krause GH, Weiss E (1991) Chlorophyll fluorescence and photosynthe-sis: The basics. Annu Rev Plant Physiol Plant Mol Biol 42: 313–349
Lee M, Sharopova N, Beavis WD, Grant D, Katt M, Blair D, Hallauer A(2002) Expanding the genetic map of maize with the intermatedB73 � Mo17 (IBM) population. Plant Mol Biol 48: 453–461
LepedušH, Štolfa I, Radić S, Ćurković PericaM, Pevalek‐Kozlina B, CesarV (2008) Photosynthetic electron transport and superoxidedismutase activity during natural senescence of maple leaves.Croat Chem Acta 81: 97–103
Lepeduš H, Begović L, Mlinarić S, Šimić D, Štolfa I, Paradjiković N,Užarević Z, Jurković V, Cesar V (2011a) Physiology and biochemistryof leaf bleaching in prematurely aging maple (Acer saccharinum L.)trees. II. Functional and molecular adjustment of PSII. Acta BotCroat 70: 133–146
Lepeduš H, Gaća V, Viljevac M, Kovač S, Fulgosi H, Šimić D, JurkovićV, Cesar V (2011b) Changes in photosynthetic performance and
706 Šimić et al.
July 2014 | Volume 56 | Issue 7 | 695–708 www.jipb.net

antioxidative strategies during the maturation of Norwaymaple (Acer platanoides L.) leaves. Plant Physiol Biochem 49:368–376
Lepeduš H, Brkić I, Cesar V, Jurković V, Antunović J, Jambrović A, BrkićJ, Šimić D (2012) Chlorophyll fluorescence analysis of photosyn-thetic performance in seven maize inbred lines under water‐limited conditions. Period Biol 114: 73–76
Liu K, Goodman MM, Muse S, Smith JSC, Buckler ES, Doebley J (2003)Genetic structure and diversity among maize inbred lines asinferred from DNA microsatellites. Genetics 165: 2117–2128
McGonigle B, Keeler S, Lan SC, Koeppe M, O’Keefe D (2000) Agenomics approach to the comprehensive analysis of theglutathione S‐transferase gene family in soybean and maize. PlantPhysiol 124: 1105–1120
Mittler R (2006) Abiotic stress, the field environment and stresscombination. Trends Plant Sci 11: 15–19
Mullineaux P, Karpinski S (2002) Signal transduction in response toexcess light: Getting out of the chloroplast. Curr Opin Plant Biol 5:43–48
Neill SJ, Desikan R, Hancock JT (2002) Hydrogen peroxide and nitricoxide as signaling molecules in plants. Curr Opin Plant Biol 5: 388–395
Palmer WC (1968) Keeping track of crop moisture conditions,nationwide: ThenewCropMoisture Index.Weatherwise21: 156–161
Percival GC, Sheriffs CN (2002) Identification of drought tolerancewoody perennials using chlorophyll fluorescence. J Arboricul 28:215–223
Pfannschmidt T (2003) Chloroplast redox signals: How photosynthesiscontrols its own genes. Trends Plant Sci 8: 33–41
Prioul JL, Quarrie S, Causse M, de Vienne D (1997) Dissecting complexphysiological functions through the use of molecular quantitativegenetics. J Exp Bot 48: 1151–1163
Prioul JL, Pelleschi S, Sene M, Thevenot C, Causse M, de Vienne D,Leonardi A (1999) From QTL for enzyme activity to candidategenes in maize. J Exp Bot 50: 1281–1288
Reddy AR, Strasser RJ (2000) Probing the vitality of plants by the JIP‐test, a novel non‐invasive phenotypic screening technique forperformance under water‐limited conditions. In: Ribaut JM, Pol D,eds. Molecular Approaches for the Genetic Improvement of Cerealsfor Stable Production in Water‐Limited Environments. CIMMYT,Mexico City. pp. 90–91
Ribaut JM, Jiang C, Gonzalez‐de‐Leon D, Edmeades GO, Hoisington DA(1997) Identification of quantitative trait loci under droughtconditions in tropical maize. 2. Yield components and marker‐assisted selection. Theor Appl Genet 94: 887–896
Ribaut JM, Betran J, Monneveux P, Setter T (2009) Drought tolerancein maize. In: Bennetzen JL, Hake SC, eds. Handbook of Maize: ItsBiology. Springer, New York. pp. 311–344
Schaeffer (Polacco) ML, Sanchez‐Villeda H, Coe E (2008) IBM 2008Neighbors Map. Available online: http://www.maizegdb.org (Ac-cessed December 30, 2011)
Schnable JC, Freeling M (2011) Genes identified by visible mutantphenotypes show increased bias toward one of two subgenomesof maize. PLoS ONE 6: e17855. doi: 10.1371/journal.pone.0017855
Schnable PS, Ware D, Fulton RS, Stein JC, Wei F, Pasternak S, Liang C,Zhang J, Fulton L, Graves TA, Minx P, Reily AD, Courtney L,Kruchowski SS, Tomlinson C, Strong C, Delehaunty K, Fronick C,Courtney B, Rock SM, Belter E, Du F, Kim K, Abbott RM, Cotton M,Levy A, Marchetto P, Ochoa K, Jackson SM, Gillam B, Chen W, YanL, Higginbotham J, Cardenas M,Waligorski J, Applebaum E, PhelpsL, Falcone J, Kanchi K, Thane T, ScimoneA, ThaneN, Henke J,Wang
T, Ruppert J, Shah N, Rotter K, Hodges J, Ingenthron E, Cordes M,Kohlberg S, Sgro J, Delgado B, Mead K, Chinwalla A, Leonard S,Crouse K, Collura K, KudrnaD, Currie J, He R, Angelova A, RajasekarS,Mueller T, Lomeli R, Scara G, KoA, Delaney K,WissotskiM, LopezG, Campos D, Braidotti M, Ashley E, Golser W, Kim H, Lee S, Lin J,Dujmic Z, KimW, Talag J, Zuccolo A, Fan C, Sebastian A, Kramer M,Spiegel L, Nascimento L, Zutavern T, Miller B, Ambroise C,Muller S,SpoonerW, Narechania A, Ren L, Wei S, Kumari S, Faga B, LevyMJ,McMahan L, Van Buren P, VaughnMW, Ying K, Yeh C, Emrich SJ, JiaY, Kalyanaraman A, Hsia A, Barbazuk WB, Baucom RS, Brutnell TP,Carpita NC, Chaparro C, Chia J, Deragon J, Estill JC, Fu Y, JeddelohJA, Han Y, Lee H, Li P, Lisch DR, Liu S, Liu Z, Nagel DH, McCannMC,SanMiguel P, Myers AM, Nettleton D, Nguyen J, Penning BW,Ponnala L, Schneider KL, Schwartz DC, Sharma A, Soderlund C,Springer NM, Sun Q, Wang H, Waterman M, Westerman R,Wolfgruber TK, Yang L, Yu Y, Zhang L, Zhou S, ZhuQ, Bennetzen JL,Dawe RK, Jiang J, Jiang N, Presting GG, Wessler SR, Aluru S,Martienssen RA, Clifton SW, McCombie WR, Wing RA, Wilson RK(2009) The B73 maize genome: Complexity, diversity, anddynamics. Science 326: 1112–1115
Schreiber U, BilgerW, Neubauer C (1994) Chlorophyll fluorescence as anon‐intrusive indicator for rapid assessment of in vivo photosyn-thesis. In: Schulze ED, Caldwell MM, eds. Ecophysiology ofPhotosynthesis. Ecological Studies. Vol. 100 Springer, Berlin.pp. 49–70
Sheen J (1994) Feedback control of gene expression. Photosynth Res39: 427–438
Šimić D, Drinić SM, Zdunić Z, Jambrović A, Ledenčan T, Brkić J, Brkić A,Brkić I (2012) Quantitative trait loci for biofortification traits inmaize grain. J Hered 103: 47–54
Strasser RJ Govindjee, (1992a) The Fo and the O‐J‐I‐P fluorescence risein higher plants and algae. In: Argyroudi‐Akoyunoglou JH, ed.Regulation of Chloroplast Biogenesis. Plenum Press, New York.pp. 423–426
Strasser RJ Govindjee, (1992b) On the O‐J‐I‐P fluorescence transient inleaves and D1 mutants of Chlamydomonas reinhardtii. In: Murata N,ed. Research in Photosynthesis. Proceedings of the IXth InternationalCongress on Photosynthesis. Nagoya‐Japan, Kluwer AcademicPublishers, Dordrecht. pp. 29–32
Strasser BJ, Strasser RJ (1995) Measuring fast fluorescence transientsto address environmental questions: The JIP‐test. In: Mathis P, ed.Photosynthesis: From Light to Biosphere. Proceedings of XthInternational Photosynthesis Congress, Montpellier, France.Kluwer Academic Publishers, Dordrecht. pp. 977–980
Strasser RJ, Tsimilli‐MichaelM, Srisatva A (2004) Analysis of chlorophylla fluorescence transient. In: Papageorgiou GC, Govindjee, eds.Chlorophyll a Fluorescence—A Signature of Photosynthesis. Ad-vances in Photosynthesis and Respiration. Vol 19. Kluwer AcademicPublishers, Dordrecht. pp. 321–362
Strauss AJ, Krüger GHJ, Strasser RJ, Van Heerden PDR (2006) Rankingof dark chilling tolerance in soybean genotypes probed by thechlorophyll a fluorescence transient O‐J‐I‐P. Environ Exp Bot 56:147–157
Tardieu F (2012) Any trait of trait‐related allele can confer droughttolerance: Just design the right drought scenario. J Exp Bot 63: 25–31
Utz HF (2011) PLABSTAT Version 3A. A Computer Program for StatisticalAnalysis of Plant Breeding Experiments, University of Hohenheim,Stuttgart (Accessed November 10, 2012 )
Walters RG (2005) Towards an understanding of photosyntheticacclimation. J Exp Bot 56: 435–447
Wang W, Vinocur B, Altman A (2003) Plant responses to drought,salinity and extreme temperatures: Towards genetic engineeringfor stress tolerance. Planta 218: 1–14
www.jipb.net July 2014 | Volume 56 | Issue 7 | 695–708
QTLs for chlorophyll a fluorescence in maize 707
Wang SC, Basten CJ, Zeng ZB (2011) Windows QTL Cartographer 2.5.Department of Statistics, North Carolina State University, Raleigh,NC. Available online: http://statgen.ncsu.edu/qtlcart/WQTLCart.htm (Accessed April 15, 2013)
Wisser RJ, Kolkman JM, Patzoldt ME, Holland JB, Yu J, Krakowsky M,Nelson RJ, Balint‐Kurti PJ (2011) Multivariate analysis of maizedisease resistances suggests a pleiotropic genetic basis andimplicates a GST gene. Proc Natl Acad Sci USA 108: 7339–7344
Wu G, Ortiz‐Flores G, Ortiz‐Lopez A, Ort DR (2007) A point mutation inatpC1 raises the redox potential of the Arabidopsis chloroplast ATPsynthase gamma‐subunit regulatory disulfide above the range ofthioredoxin modulation. J Biol Chem 282: 36782–36789
Yang DL, Jing RL, Chang XP, Li W (2007) Quantitative trait loci mappingfor chlorophyll fluorescence and associated traits in wheat(Triticum aestivum). J Integr Plant Biol 49: 646–654
Yin Z, Meng F, Song H, He X, Xu X, Yu D (2010) Mapping quantitativetrait loci associated with chlorophyll a fluorescence parameters insoybean (Glycine max (L.) Merr.). Planta 231: 875–885
Zeng ZB (1994) Precision mapping of quantitative trait loci. Genetics136: 1457–1466
SUPPORTING INFORMATIONAdditional supporting information can be found in the onlineversion of this article:Figure S1. Cumulative precipitation (mm) in July 2010–07 2010(A), July 2011–07 2011 (B), June 2012–06 2012 (C) and July 2012–07 2012 (D) with theoretical percentiles (2, 10, 25, 50, 75,90 and 98) curves for the period 1961–2000 at the locationOsijek, Croatia (Source: Meteorological and HydrologicalService, Republic of Croatia; www.klima.hr) showing totalprecipitation three weeks before JIP‐test measurements.Arrows indicate dates when samples for JIP‐test were takendenoted as environments E1 and E2 (2010), E3 (2011) and E4(2012)
July 2014 | Volume 56 | Issue 7 | 695–708 www.jipb.net
708 Šimić et al.