Socio-Economic and Religious Factors Contributing to Drop ...
Upload
khangminh22Category
view
0download
0
Identification of traits and QTLs contributing to salt tolerance
in barley (Hordeum vulgare L.)
Nguyen Viet Long

ii
Thesis committee
Thesis supervisors
Prof. dr. Richard G.F. Visser Professor of Plant Breeding Wageningen University Dr. C. Gerard van der Linden Research group leader, Wageningen UR Plant Breeding Dr.ir. Oene Dolstra Senior scientist, Wageningen UR Plant Breeding Other members
Prof. dr. ir. H.J. Bouwmeester, Wageningen University Prof. dr. Bas Zwaan, Wageningen University Dr. Cecilia Stanghellini, PRI, Wageningen University & Research Centre Dr. Benjamin Kilian, Leibniz Institute of Plant Genetics & Crop Plant Research, Germany This research was conducted under the auspices of the Graduate School of Experimental Plant Science.

iii
Identification of traits and QTLs contributing to salt tolerance
in barley (Hordeum vulgare L.)
Nguyen Viet Long
Thesis
Submitted in fulfilment of the requirements for the degree of doctor at Wageningen University
by the authority of the Rector Magnificus Prof. dr. M.J. Kropff, in the presence of the
Thesis Committee appointed by the Academic Board to be defended in public
on Friday 2 November 2012 at 11a.m. in the Aula.

iv
Nguyen Viet Long (2012) Identification of traits and QTLs contributing to salt tolerance in barley (Hordeum vulgare L.) Pages 138 Thesis, Wageningen University, Wageningen, the Netherlands With references, with summaries in Dutch and English ISBN 978-94-6173-409-9

v
Table of contents
Chapter 1 General introduction 1-12
Chapter 2 Salt stress-induced changes in vegetative growth and plant mineral composition in a diverse set of barley genotypes
13-32
Chapter 3 Identification of QTLs for ion homeostasis and salt tolerance in barley (Hordeum vulgare L.)
33-52
Chapter 4 Characterization of QTL regions on barley chromosomes 2H and 3H conferring differences in salt tolerance observed between cvs Steptoe and Morex
53-68
Chapter 5 Association mapping of salt tolerance in barley (Hordeum vulgare L.)
69-90
Chapter 6 General discussion 91-106
References 107-117
Summary in English, Dutch and Vietnamese 122-129


CHAPTER 1
General Introduction

Chapter 1
�����������������������������������������������������������������������������������������������������������������������������������������������������������������������������������������������������������������������������������������������������
2
Salinity stress: an important trait in a changing world
The world population continues to increase rapidly and is expected to reach 9 billion by 2050 (FAO 2008). Agriculture will have to increase its crop productivity by 70-110% in 2050 to feed that world (Tester and Langridge 2010; Tilman et al. 2011). This task is challenging, as not only we must increase crop yields by a margin not seen before but also we have to do this in a changing climate (Roy et al. 2011). Climate change associates with increased exposure to abiotic stress factors such as water scarcity, elevated temperature, flooding and salinity, all of which have major impacts on crop yields. Salinity is considered to be the most severe among abiotic stresses (Tuteja 2007). Soils are classified as saline when elevated levels of soluble salt are present (EC of 4 ds/m or 40 mM NaCl) (Munns and Tester 2008). There is an increased demand for new salt tolerant crop varieties as salinization already affects 20% of the global area of highly productive irrigated land and 2% of the world’s rainfed areas which account for over 800 million ha worldwide. This area is expected to expand significantly with a rate of 10% annually in the coming decades due to changing climate conditions and poor cultivation practices (Bennett and Khush 2003). Genetic enhancement of crops is one of the most important strategies to increase productivity of crops under less then optimal agricultural conditions.
Plant responses to salinity stress
Salinity above a threshold level of 40 mM NaCl in soil water causes two types of stress in plants, often referred to as osmotic and ionic stress (Fig. 1), which both significantly reduce crop yield (Munns and Tester 2008). Osmotic stress effects occur immediately after exposure to saline conditions in the root environment. Osmotic stress induces stomatal closure and influences cell growth and metabolism, affecting shoot growth rate, shoot dry matter, and total leaf area.
Ionic effects of salinity stress are manifested at later stages following exposure to high salt levels, often after 2-4 weeks (Flowers et al. 1991; Munns and James 2003; Munns and Tester 2008; Rajendran et al. 2009). The ionic stress (Na+ and/or Cl- specific effects) is superimposed on the osmotic effects and showed greater genetic variation than osmotic effects (Munns et al. 2002). Metabolic toxicity of Na+ is largely a result of its ability to compete with K+ for binding sites essential for cellular function. High Na+/K+ ratios can disrupt various enzymatic processes in the cytoplasm (Tester and Davenport 2003). Ionic stress is associated with a reduction in chlorophyll content and inhibits photosynthesis, inducing leaf senescence and premature leaf death. Ionic stress thereby reduces photosynthesis capacity, biomass and yield (Isla et al. 1998; Tester & Davenport 2003). As NaCl is a major constituent of saline soil, plants accumulate Na+ and Cl- ions up to levels that are toxic. Shoot Na+ toxicity is associated with reduction of stomatal conductance while high shoot Cl- levels directly affect chlorophyll and inhibit Photosystem II (Tavakkoli et al. 2011). Higher Na+ and Cl- contents in plant cells are seen as the key factors responsible for ionic stress (Munns and Tester 2008; Rajendran et al. 2009; Cuin et al. 2009).

General introduction
�����������������������������������������������������������������������������������������������������������������������������������������������������������������������������������������������������������������������������������������������������
3
There are numerous studies and reviews that discuss the relation of Na+, K+ and K+/Na+
homeostasis with salt stress tolerance in crop plants (Maathuis et al. 1992; Apse et al. 1999;
Blumwald et al. 2000; Maser et al. 2002; Tester and Davenport 2003; Apse and Blumwald
2007; Horie et al. 2009). The role of Cl- homeostasis in salt tolerance is much less understood
(Teakle and Tyerman 2010). The high levels of Cl- that accumulate in the leaves of plants
grown under saline conditions will have detrimental effects on the plants (White and Broadley
2001). Therefore, it is remarkable that little scientific effort has been directed to the effects of
Cl- content in relation to crop salt tolerance, and to our knowledge there are no reports on the
genetic control of this trait. Only recently several studies demonstrated that handling of Cl-
may be very important for salt tolerance in some crops including barley (Teakle and Tyerman,
2010; Tavakkoli et al. 2010a, b).
Mechanisms of salt tolerance in plants
There is extensive variation in mechanisms that plants utilize to adapt to salinity stress (Maas
1986; Greenway and Munns 1980). Unfortunately most of the agricultural crops are sensitive
or hypersensitive to salt stress (and are so called glycophytes). While halophytic species are
highly salt tolerant and can continue to grow and reproduce at salinity levels even higher than
that of seawater, none of the modern crops are able to tolerate more than 25% of the salt stress
levels of seawater without yield and growth losses. The high salt tolerance of halophytes is
attributed to special anatomical and morphological adaptations, or mechanisms of avoidance
(Greenway and Munns 1980). However, halophytes are rare among the 250,000 species of
flowering plants (Flowers and Flowers 2005). The unique characteristics of halophytes are
believed to be difficult to transfer to crop plants (Flowers 2004). Previous studies have
classified plants into two categories: salt includers and salt excluders. Salt includers take up
Na+ and translocate it to the shoot, where it is sequestered and used as vacuolar osmoticum-so
called tissue tolerance. Salt excluders on the other hand adapt to saline stress by avoiding Na+
uptake (Mian et al. 2011a).
Halophytic species deploy mechanisms like efficient Na+ sequestration into the vacuole,
which does not only keep cytosolic Na+ low, but also enables these plants to use Na+ as an
osmoticum to maintain cell turgor and growth. Therefore higher Na+ uptake can even
stimulate the growth of halophytes (Blumwald 2000). Improvement of salt tolerance in
glycophytic crops like rice and durum wheat has been achieved by the development of
cultivars with low Na+ in shoot or high K+/Na+ ratio (Gregorio and Senadhira 1993; Tester
and Davenport 2003; Ren et al. 2005; Munns and Tester, 2008; Thomson et al. 2010; Munns
et al. 2012).

Chapter 1
�����������������������������������������������������������������������������������������������������������������������������������������������������������������������������������������������������������������������������������������������������
4
Figure 1. An overview of plant adaptive responses to salinity stress. High salt concentration in soil water causes osmotic stress in root area. Ionic stress is associated with the accumulation of high Na+ and Cl- concentrations in root and more importantly in leaf tissues. Glycophytes and halophytes adapt to saline stress by avoiding accumulation of toxic ion into roots, restricting ion uptake to the shoot (but not always) and synthesis of compatible solutes in the cytoplasm. Intracellular ion compartmentation and ion sequestration into vacuole or use of salt secretion to cope with salinity stress are the mechanisms more often found in halophytes than glycophytes.
Mechanisms of salt tolerance at molecular level
Plants utilize three common mechanisms of salt tolerance in plants (Munns and Tester 2008; Rajendran et al. 2009):
• osmotic adjustment; • adequate control of Na+ uptake by the roots and Na+ exclusion from sensitive tissue;
• tissue tolerance (Na+ inclusion; Na+ compartmentation).
These mechanisms are controlled by integrated physiological, biochemical and signalling pathways (Zhu 2001). Osmotic adjustment involves the synthesis and accumulation of compatible solutes within the cytoplasm. Compatible solutes are small water-soluble
Compartmentation of Na+/Cl- into older leaves or leaf sheaths
Synthesis of solutes
Ionic stress
SALINITY
Osmotic stress Ionic stress
Ion restriction uptake from roots
Secretion
Soil level
Na+/Cl- sequestering into
vacuole

General introduction
�����������������������������������������������������������������������������������������������������������������������������������������������������������������������������������������������������������������������������������������������������
5
molecules that comprise nitrogen-containing compounds such as amino acids, amines and betaines, but also organic acids, sugars and polyols (Chen et al. 2007a). The function of the compatible solutes is not limited to maintaining osmotic balance. Compatible solutes are typically hydrophilic and may be able to replace water at the surface of proteins or membranes, thus acting as low molecular weight chaperones (Carillo et al. 2011). These solutes also function to protect cellular structures through scavenging Reactive Oxygen Species (ROS) (Hasegawa et al. 2000a).
High concentrations of Na+ and Cl- are toxic to all plant cells. The capacity of plants to maintain a high cytosolic K+/Na+ ratio is likely to be one of the key determinants of plant salt tolerance. Several genes and transporters that plants use to maintain a high K+/Na+ ratio have been identified and characterized (Munns and Tester, 2008; Jamil et al. 2011) (Fig. 2). These include:
(1) Na+/H+ antiporters in plasma membranes that remove Na+ from the cytosol as part of the regulatory SOS pathway (Zhu 2001). Three salt overly sensitive (SOS) proteins (SOS 1, 2 and 3) play a regulatory role in the expression and activity of ion transporters to maintain a low cytoplasmic concentration of Na+ under salt stress. Zhu (2003) proposed that a protein kinase complex consisting of the calcium-binding protein SOS3 and the serine/threonine protein kinase SOS2 is activated by a salt-stress elicited calcium signal. The protein kinase complex then phosphorylates and activates various ion transporters, such as the plasma membrane Na+/H+ antiporter SOS1.
(2) Vacuolar Na+/H+ antiporters (NHXs) (Apse et al. 1999; Blumwald et al. 2000) and energy suppliers of these NHXs (like H+ pumps: HVA/68 and HVP1) (Ligaba and Katsuhara 2010). NHX proteins sequester Na+ in the vacuoles and provide an efficient mechanism to avoid the deleterious effects of Na+ in the cytosol and maintain osmotic balance (Glenn et al. 1999; Apse et al. 1999). Similarly, Cl- is likely transported into the vacuole by anion transporters such as CLC proteins (Teakle and Tyerman 2010; Zifarelli and Pusch 2010).
(3) High-and-low affinity K+ transporters (HKT) (Shabala and Cuin 2008; Shabala et al. 2010). The HKT family consists of two classes which function either as specific Na+ transporters or Na+ and K+ co-transporter (Hauser and Horie 2010). HKT2;1 was shown to enhance Na+ uptake and higher Na+ concentration in xylem sap (salt including behaviour) which correlated with increased salt tolerance (Mian et al. 2011). Many others suggested that Na+ exclusion from the shoot is associated with salt tolerance and that genes from the HKT1 subfamily such as HKT1;4 and HKT1;5 are involved (James et al. 2011; Munns et al. 2012). Shabala et al. (2010) pointed out that both salt exclusion and inclusion are important for barley salt tolerance. Indeed, barley is a good example of a crop that combines halophytic and glycophytic properties, and thus might be a good model crop to study the both glycophytic and halophytic mechanisms that can be utilized to cope with salinity stress (Munns et al. 2002; Munns and Tester 2008; Mian et al. 2011).

Chapter 1
�����������������������������������������������������������������������������������������������������������������������������������������������������������������������������������������������������������������������������������������������������
6
Barley: a model crop for salt tolerance studies?
Barley (Hordeum vulgare L.) is the fourth most important cereal crop worldwide after maize, rice and wheat in terms of total production and consumption (Schulte et al. 2009). About two third of the global barley crop is used for animal feed. The remaining one third is used for malting, brewing and distilling. Besides, barley is an energy source in human diet in many parts of the world.
Figure 2. General functions and localization of Na+ and Cl- transporters. Na+ uptake at the soil-root boundary occurs via non-selective cation channels like CNGCs. In halophytes, K+ channels such as AKT1 may also be involved in Na+ uptake. HKT1:1 helps to control the accumulation of Na+ in shoots and retrieval of Na+ from xylem. HKT2:1 mediates high affinity uptake of Na+ but may also participate in Na+ xylem loading. HKT1;5 reduces the xylem Na+ concentration and shoot Na+ load. Na+ efflux into the vacuole and apoplast occurs via antiport systems: NHX1 at the tonoplast and SOS1 at the plasma membrane. SOS1 may also mediate xylem loading of Na+ along with other antiporters such as CHXs. Chloride channels (CLCs) may be involved in compartmentation of Cl- into the vacuole and chloride cation co-transporters (CCCs) may mediate xylem loading of Cl- in the plant. The mechanism and identity of Cl- uptake systems are not known (Mian et al. 2011b).

General introduction
�����������������������������������������������������������������������������������������������������������������������������������������������������������������������������������������������������������������������������������������������������
7
Barley has been an important model species in the fields of genetics and mutagenesis, in particular for cereal species. This was because of its diploid self-pollinating crop species with a low chromosome number (2n = 14) and a relatively short life cycle, which can be cultivated in a wide range of climatic conditions and is easy to use in cross-breeding (Saisho and Takeda 2011). It has however a large genome (> 5Gbp) (Bennett and Smith 1976) which in the era of genomics is a negative point. Over the last century there has been a steady increase in barley production (Schulte et al. 2009) and scientists believe that with the increasing global temperatures and the challenges posed by climate change, barley cultivation will expand even more because of its excellent adaptation to harsh climatic conditions (Maas and Hoffman 1977; Greenway and Munns 1980; Munns and Tester 2008; Nevo and Chen 2010).
Cultivated barley originates from wild barley (Hordeum spontaneum) and was domesticated within the Fertile Crescent (Kilian et al. 2006). In comparison to other wild cereals, wild barley is widely distributed (Harlan and Zohary 1966; Nevo 2007). Both genetic diversity and the adaptation to a broad spectrum of micro-ecological conditions including water availability, temperature, soil type and altitude have strongly influenced the development of salt tolerance in barley. This has resulted in a rich genepool with a large variation in adaptation to abiotic stresses including drought and salinity (Nevo and Chen 2010). Therefore, scientists have advocated barley as a source of favourable alleles to be used in cereal salt tolerance improvement by means of conventional and molecular approaches (Colmer et al. 2006; Munns et al. 2006). Salt tolerant studies demonstrate that barley exhibits glycophytic features (a better capacity of excluding Na+ from uptake by the roots of salt tolerant cultivars in comparison with salt sensitive cultivars (Chen et al. 2007) while others report halophytic features (especially barley’s capacity to sequester Na+ in the vacuole and therefore maintaining high K+/Na+ levels in the cytosol while reducing damage due to sodium toxicity (Greenway and Munss 1980; Shabala et al. 2010; Mian et al. 2011a).
Recently, barley genomic resources have been developed (Saisho and Tekada 2011) including a large collection of DNA markers and several high density genetic maps (Close et al. 2009; Schulte et al. 2009). Advanced mapping populations including near-isogenic lines (NIL) (Marcel et al. 2007) and chromosome segment substitution lines (SSSLs) (Fukuoka et al. 2010) were developed to facilitate genetic dissection of quantitative trait loci (QTLs). The deployment of a novel association mapping technique (Kraakman et al. 2006) combined with the use of high density maps (Pasam et al. 2012; Close et al. 2009; Waugh et al. 2009) enables us to efficiently exploit natural genetic variation of the barley genepool. More recent innovations in sequencing technology and barley genomic sequencing that is expected to complete in 2012 will greatly facilitate gene discovery in barley for cereal breeding (Schulte et al. 2009).
Improvement of salt tolerance in cereals
Over the past decades, various breeding approaches have been undertaken to improve salt tolerance in crops (Gregorio et al. 2002; Munns et al. 2006). However there has been very
Chapter 1
�����������������������������������������������������������������������������������������������������������������������������������������������������������������������������������������������������������������������������������������������������
8
little success in this field. New salt tolerant varieties of crop including rice and wheat were reported in only few countries around the world like in the Philippines, India and Pakistan (Bennett and Khush 2003). Screening of a large collection (~5000 accessions) of bread wheat in Australia and 400 Iranian wheat varieties in California for salt tolerance has identified several accessions and lines that produced seeds under high salt concentration (50% seawater) or gave high yields on saline soil. So far no new cultivar has been developed from the identified tolerant accessions (Munns et al. 2006).
Classical selection is a laborious task and is associated with problems in developing appropriate and reproducible testing environments. Many genes control the traits that may involve in salt tolerance. These genes are expressed differently during the lifetime of the plants and in different tissues, and are influenced by many environmental factors (Roy et al. 2011). This complexity makes salt tolerance difficult to breed for. Improvement of crops for salt tolerance therefore demands tools that enable the dissection of salt tolerance in traits that can be resolved in genetic components, which may then be combined in a salt tolerant variety. Plant breeders look for more reliable approaches with the help of molecular markers (Collard and Mackill 2008) or transgenic approaches (Flowers 2004; Arzani 2008).
Most of the genes that may contribute to salt tolerance still remain to be discovered even in model crops like Arabidopsis and rice (Colmer et al. 2005). In addition, salt tolerance is a multigenic trait, therefore large improvement based on modification of a single gene is not likely to occur (Colmer and Munns 2005). Identification of new traits contributing to salt tolerance can be done through direct classical selection in stressful environments or based on mapping studies of quantitative trait loci (QTL) (Holland 2007). Currently, association mapping offers an attractive and powerful approach to identify additional genes contributing to the naturally occurring variation for salt tolerance in varieties, landraces and wild relatives of crops (Flint-Garcia 2003). Once the molecular basis of the traits contributing to salt tolerance has been established, marker-assisted selection (Collard and Mackill 2008; Munns et al. 2012) can be used to efficiently exploit the new traits and genes, or genetic modification technologies to generate transgenic plants with novel genes or altered expression levels of existing genes to improve the degree of salt tolerance.
Suitable selection tools to screen large mapping populations and produce accurate information on traits are essential for the identification of traits and genes for salt tolerance breeding. This will give insight on the presence/magnitude of the heritable variation for the tolerance traits, their inheritance and the magnitude of genotype x environment interactions.
Plant phenotyping
To unravel the genetic basis of complex traits like salt tolerance, it is necessary to associate genotypic marker information with the corresponding phenotypic data. Precise phenotyping is a key to finding and introducing new genes for salt tolerance into crop plants (Munns et al. 2006). Recently, progress in DNA marker and sequencing technologies has enabled high throughput genotyping of many individual plants at relatively low cost. The development of

General introduction
�����������������������������������������������������������������������������������������������������������������������������������������������������������������������������������������������������������������������������������������������������
9
fast and reliable methods to evaluate large numbers of genotypes is important to fully take advantage of the fast development of biotechnological techniques and to facilitate genetic dissection of complex traits.
Classical selection for performance and yield under saline field conditions has various limitations related to variation induced by variable environmental factors such as soil heterogeneity and weather conditions (Isla et al. 1998; Chen et al. 2005; Munns et al. 2006). The useful physiological traits contributing to salt tolerance and the genes underlying these traits can be identified more efficiently under well-defined controlled environmental conditions (Cuin et al. 2008). Successful screening methods that were utilized recently to evaluate the responses of cereals to salinity were carried out on hydroponics (Munns and James 2003; Chen et al. 2005) or on sand and soil-based substrates (Munns et al. 2002; Tavakkoli et al. 2010b). The shoot Na+ (Cl-) content and K+/Na+ ratio have been suggested as reliable traits for salt tolerance selection in crops (Munns et al. 2002; Tester and Davenport 2003; Munns and Tester 2008). Genetic analysis using traits affecting ion homeostasis has identified QTLs that are defined by Na+ and K+ transporters that contribute to salt tolerance in rice (Bonilla et al. 2002; Ren et al. 2005) and in wheat (Munns et al. 2012). Similar studies in barley surprisingly have not yet revealed genes for salt tolerance, even though – or maybe because- it is the most salt tolerant cereal crop. Shabala et al. (2010) and Mian et al. (2011) showed that both ion exclusion and inclusion contribute to barley salt tolerance. More accurate and appropriate screening procedures may be needed that allow multiple-stage measurements of salt stress during the life cycle of barley. Moreover, the methods should enable investigation of the combination and interaction effects between different traits and include Cl- toxicity as Cl- is a “forgotten enemy” for salt tolerance research (Munns and Tester 2008; Teakle and Tyerman 2010).
QTL mapping
QTL mapping has been a key tool to the study the genetic architecture of complex traits in plants (Kearsey 1998). Most agronomically important traits such as yield, grain quality and resistance/tolerance to biotic and/or abiotic stresses are complex traits. Genetic architecture refers to numerous genome locations with genes that affect the traits, the magnitude of the effects, and the relative contribution: additive, dominant and epistatic effects (Holland 2007). The detection of QTLs of agronomical importance and the underlying genes has greatly increased our understanding of the complexity of traits (Salvi and Tuberosa 2005). Understanding and further identifying QTLs that underlie the traits will significantly contribute to breeding through marker-assisted selection (Collard and Mackill 2008) and pyramiding of multiple favourable alleles (Yang et al. 2012).
Biparental (traditional) QTL mapping based on a single segregating population derived from two homozygous parental genotypes has been the common approach for genetic dissection of salt tolerance in rice (Koyama et al. 2001; Lin et al. 2004; Lee et al. 2006), wheat (Dubcovsky et al. 1996; Genc et al. 2010a) and barley (Mano and Takeda 1997; Ellis et al. 2002b; Xue et

Chapter 1
�����������������������������������������������������������������������������������������������������������������������������������������������������������������������������������������������������������������������������������������������������
10
al. 2009; Witzel et al. 2009b). Several loci were found to encode members of the HKT-family of ion transporters which significantly improve salt tolerance like the Saltol locus (Bonilla et al. 2002) and SKC1 locus (Ren et al. 2005) in rice; Kna1 locus in bread wheat (Dubcovsky et al. 1996), and Nax1 and Nax2 in durum wheat (Byrt et al. 2007; Munns et al. 2012). At the same time, biparental QTL mapping has limitations related to the poor sampling of allelic variation present in the genepool for each of the loci affecting the traits, lack of segregation for many traits, and poor resolution (Flint-Garcia 2003). Biparental QTL mapping detects genomic regions associated with traits with an accuracy ranging on average from 10-30 centiMorgans (cM) (Salvi and Tuberosa 2005; Bernardo 2008) such chromosomal regions could harbour a few hundred up to several thousand genes (Ingvarsson et al. 2010). This explains why only few causal genes underlying major-effect QTLs have been identified or cloned yet (Mackay and Powell 2007). Therefore additional fine-mapping or other methods to improve the mapping accuracy are needed to efficiently exploit the genetic variation for salt tolerance in barley germplasm.
Association mapping
In recent years, association mapping has been advocated as the method of choice for identifying loci involved in the inheritance of complex traits in human genetics. This method involves identifying markers associated with the phenotypes of interest found in a set of unrelated individuals (Pritchard et al. 2000). Association mapping or linkage disequilibrium approach has recently been introduced in plant genetic research as well (Flint-Garcia 2003; Kraakman et al. 2006; Cockram et al. 2010; Zhao et al. 2007b; Atwell et al. 2010; Kloth et al. 2012) and they have been demonstrated to be promising to exploit the full potential of novel molecular marker and sequencing technologies (Zhu et al. 2008).
Association mapping relies on the presence of trait-associated linkage disequilibria in collections of widely diverse germplasm (Mackay and Powell 2007). It makes efficient use of all the recombination events that have occurred during the long evolutionary history of a crop species, producing much smaller linkage blocks than those found in biparental QTL mapping studies (Nordborg and Tavare 2002). In addition, association mapping addresses all major allelic variants of QTLs affecting the traits of study when performed with an adequate association mapping panel representing most of the crop’s genepool.
In association mapping linkage disequilibrium (LD) plays a central role. LD is a population statistic for non-random association between alleles of different polymorphic loci. The decay in LD among neighbouring markers determines the marker density and experimental design needed to perform association mapping successfully. Linkage, selection, mutation and admixture all affect the level of LD. LD also depends on the mating system and therefore varies from species to species as well as between populations within species (Flint-Garcia 2003; Rostoks et al. 2006).

General introduction
�����������������������������������������������������������������������������������������������������������������������������������������������������������������������������������������������������������������������������������������������������
11
An association mapping panel covering a wide geographical area, locations of adaptation with a good representation of its evolutionary history usually is not fully random due to familial relatedness and may show different types of structure (Pritchard et al. 2000). This may result in spurious marker-trait associations (Zhao et al. 2007). Therefore it is important to have proper statistical methods and strategies to circumvent such complications (Patterson et al. 2006). The most popular way is to classify the members of an association mapping panel and incorporate the clustering information in the statistical models in which markers are tested within the identified subpopulations (Pritchard et al. 2000; Falush et al. 2003; Balding 2006). Other promising approaches to control population structure are the use of mixed models to account for difference in genetic relatedness between panel members (kinship matrix) (Yu et al. 2006; Malosetti et al. 2007). While estimating population structure is computational demanding, Patterson et al. (2006) introduced an intermediate approach using genetic principle component analysis (PCA) to deal with the problem of spurious associations. The method by Patterson is fast, simple and works well with large data sets.
In barley, several association mapping studies have been published that showed differences in occurrence of LD between markers. Studies with a limited number of AFLP or SSR markers showed LD between markers up to 10 cM apart (Kraakman et al. 2004; Malysheva-Otto et al. 2006). Zhang et al. (2009) and Comadran et al. (2009) showed the presence of LD among markers around 3.5cM in a study of a panel with 170 Canadian and 192 Mediterranean barley lines using around a thousand DaRT markers. A study of a diverse worldwide barley (around 200 genotypes) collection with 45 ETS-SSR markers reported a substantial influence of population structure on LD due to geographical origin of panel members and number of ear rows showed slow LD decay (Haseneyer et al. 2010). Pasam et al (2012) reported LD decay at 7-10cM using the same population and denser marker map.
Association mapping has been successfully used to localize QTLs for traits of agronomical importance in barley (Kraakman at al. 2004; Waugh et al. 2009; Pasam et al. 2012). Complementary to biparental QTL mapping, association mapping studies for salt tolerance in barley would greatly help to unravel the complexity of the genetic architecture of this trait and help to optimally exploit the genetic variation for crop salt tolerance improvement.
This thesis
The research presented in this thesis aims to identify traits and genes that underlie salinity tolerance in barley.
The objectives are:
1. To understand key traits determining salt tolerance; 2. To provide new tools and strategies to better exploit the available genetic variation for
salt tolerance present in the germplasm of barley; 3. To evaluate genetic variation in available segregating mapping populations as well as
in a worldwide barley collection with regard to salt tolerance;

Chapter 1
�����������������������������������������������������������������������������������������������������������������������������������������������������������������������������������������������������������������������������������������������������
12
4. To determine genetic architecture of salt tolerance and related traits using both traditional QTL mapping and novel association mapping;
5. To characterize QTLs and possibly candidate genes that contribute to the genetic variation in salt tolerance in barley and generation of tightly linked molecular markers that can be used in plant breeding.
In Chapter 2 the response of a set of parental breeding lines to different levels of salt stress was evaluated on a hydroponics system, and both short term and longer term effects were monitored. Measured traits included contents of ions (Na+, K+, Mg2+, Ca2+ and Cl-) in roots and shoots. Genotypic differences in ion composition and performance over time were used to get a better insight in key factors influencing osmotic and ionic stress, the two stages of salinity tolerance. This study allowed the selection of barley parental lines that utilize different mechanisms for salt tolerance for further breeding studies.
In Chapter 3, genetic analysis of the variation observed in various salt tolerance traits of the Steptoe x Morex doubled haploid (DH) mapping population is described. Steptoe and Morex were selected based on the differences in salt tolerance between these two lines, which was found to relate to Na+ and Cl- contents in the shoot (Chapter 2). Major QTLs controlling Na+, Cl-, K+ and Ca2+ homeostasis in shoots and roots of barley were identified that correlated to root and shoot growth under salt stress.
The study described in Chapter 4 aimed to further characterize and resolve the major QTLs identified in Chapter 3 through fine-mapping of chromosome 2H and chromosome 3H regions harbouring two major clusters of QTLs.
Chapter 5 describes the evaluation of the variation in salt tolerance in a worldwide association mapping panel representing much of the genetic variation in cultivated barley. An association mapping approach is utilized to identify promising alleles of genes contributing to salt tolerance to facilitate future breeding for salinity tolerance. Different methods were used to eliminate confounding effects due to population structure on LD mapping analyses. Several important QTLs are presented and discussed.
The General Discussion in Chapter 6 discusses the findings presented in this thesis in relation to the current status and the prospects of breeding for salt tolerance in barley and cereals. The impact of our results on major issues related to trait discovery strategies for salt tolerance and salt tolerance mechanisms in barley and other related crops are addressed. These include phenotyping strategies, the importance of ion homeostasis for salt tolerance and the advantages and disadvantages of traditional QTL mapping and association mapping in breeding for salt stress tolerance.

CHAPTER 2
Salt stress-induced changes in vegetative growth and plant mineral composition in a diverse set of barley genotypes
Nguyen Viet Long1,2, Simon A. Ribot2, Oene Dolstra2, Rients E. Niks2, Richard G. F. Visser2, C. Gerard van der Linden2
1 Graduate School Experimental Plant Sciences, Wageningen University, PO Box 386, 6700 AJ Wageningen, The Netherlands.
2 Wageningen UR Plant Breeding, Wageningen University and Research Centre, PO Box 386, 6700 AJ Wageningen, The Netherlands
To be submitted

Chapter 2 �����������������������������������������������������������������������������������������������������������������������������������������������������������������������������������������������������������������������������������������������������
14
Abstract
The variation in the temporal response to different levels of salinity stress was studied in twenty-four barley genotypes. The set of genotypes comprises parents of a number of currently available mapping populations. Seedlings grown on hydroponics were exposed at 2-leaf stage to three different salt treatments (100, 200 and 300 mM NaCl) for a period of three weeks and compared to a control (0 mM NaCl). Shoot and root growth were measured three times with an interval of one week. The resulting dried root and shoot samples were used to collect data on ion contents. Salinity was shown to induce a strong adverse effect on growth that increased with salt concentration and duration of the exposure to the stress. Shoot and root growth under saline and control conditions were mainly controlled by genetic factors (h2: 0.49-0.78). Highest heritability values were observed for shoot growth under saline conditions at final harvest (h2: 0.70-0.78). Genotypes largely differed in growth under different levels of salinity stress and showed remarkable stress-related differences in Na+, K+, Cl- and Ca2+ content in roots and shoots. The results indicate that high shoot Cl- content might even affect barley growth more than high shoot Na+ content. Salt exclusion is likely to be a stress tolerance mechanism operating in most of the tolerant genotypes (of which genotypes L94 and 116-5 were the most tolerant), while tissue tolerance was observed for the cultivar Steptoe. The three most sensitive genotypes (Morex, Vada and Rex) had the highest Na+ and Cl- contents in their shoots. The mechanisms excluding Na+ from shoots and enhancing accumulation of this ion in roots were independent of those for Cl- and both depended on stress level and duration of exposure to stress. This study showed interesting contrasts in salt tolerance in relation to Cl- and Na+ contents between parents of mapping populations, enabling a best choice of mapping populations for genetic analysis of salt tolerance. A salinity level of 200 mM NaCl for three weeks on hydroponics was found to be most effective for screening for salinity tolerance traits related to ion homeostasis in barley.
Keywords: salt tolerance, screening method, ion homeostasis, barley
Introduction
Salt stress interferes with numerous growth and development processes in plants. The response of plants to salt stress is controlled by many genes and interacting biochemical and physiological processes. This complexity hampers the progress in genetic improvement of salt tolerance in crops. Salinity above a threshold level of 40mM NaCl in soil water causes two types of stress in plants, often referred to as osmotic and ionic stress, which both significantly reduce crop yields (Munns and Tester 2008). Osmotic stress occurs immediately upon high NaCl application to the root growing media. Osmotic stress induces stomatal closure and influences plant growth and metabolism. Ionic effects of salinity stress are manifested after prolonged exposure to high salt levels, often after 2-4 weeks (Flowers et al. 1991; Munns et al. 2003; Rajendran et al. 2009). Ionic stress is associated with reduction in chlorophyll content and it inhibits photosynthesis, induces leaf senescence and premature leaf death. Ionic stress thereby reduces photosynthetic capacity, biomass and grain yield (Isla et al. 1998; Tester and Davenport 2003). Control of Na+ and Cl- contents in plant cells and tissues is most important for managing both the osmotic and the ionic stress (Munns and Tester 2008; Rajendran et al. 2009; Cuin et al. 2009). Studies on cereal cultivation under saline conditions

Salt stress-induced changes in vegetative growth and mineral composition
�����������������������������������������������������������������������������������������������������������������������������������������������������������������������������������������������������������������������������������������������������
15
indicate that the reduction of photosynthesis, growth and yield is directly linked to high Na+ and Cl- concentrations in plant cells (Garthwaite et al. 2005; El-Hendawy et al. 2009; Tavakkoli et al. 2011).
Munns et al. (1995) showed no clear genotypic differences in growth reduction due to osmotic stress in wheat and barley. In addition, Chen et al. (2007b) pointed out that the accumulation of known osmotic solutes such as glycine, betaine and proline in response to a high NaCl concentration in the soil water are not driving factors for salt tolerance. The genetic differerences in wheat and barley in response to ionic toxicity are large (Munns et al. 2002; Munns and James 2003). Barley plants cope with salt stress using salt tolerance mechanisms found in glycophytes (highly salt sensitive) as well as halophytes (species that can maintain growth above 350 mM NaCl). Glycophytic species (like Arabidopsis thaliana, durum wheat or rice) often respond to salinity by excluding Na+ and Cl- from the root and shoot cells. Ion exclusion mechanisms involve several ion transporters, such as HKT1 which limits Na+ loading to shoot cells (Huang et al. 2006; Chen et al. 2007; Byrt et al. 2007; Munns et al. 2012). Other studies have shown the potential of barley plants to sequester Na+ in the vacuoles to maintain a high K+/Na+ ratio in the cytosol and at the same time avoiding ion toxicity effects in leaf mesophyll cells (Shabala et al. 2010; Mian et al. 2011a). Barley thus has the ability to maintain growth through accumulation of high amounts of Na+ in the shoot, often called tissue tolerance or ion inclusion (Greenway and Munns 1980; Shabala et al. 2010). Na+ including behavior and compartmentation are associated with activities of vacuolar Na+/H+ exchangers NHX (Blumwald 2000) and cell membrane-associated HKT2 transporters (Mian et al. 2011). Munns and James (2003) showed that high biomass production in wheat under saline conditions is associated with Na+ and Cl- exclusion, Na+ and Cl- transport and the K+/Na+ ratio. In the past decades research on salt stress tolerance was mainly focused on the role of Na+ and K+ transport and accumulation in relation to ion homeostasis under salt stress, while the role of Cl- ions has received little attention (Teakle and Tyerman 2010; Munns and Tester 2008). As Cl- is the predominant anion in saline soil, plants accumulate high levels of Cl- in the leaves when grown under saline conditions (Garthwaite et al. 2005). Tavakkoli et al. (2010a; 2011) showed that in barley Cl- ions are as toxic as Na+ ions, and in beans, lotus, citrus and some woody plant species Cl- is even more toxic (Teakle and Tyerman 2010). Cl- and Na+ seem to have different and additive effects on salt tolerance of barley and bean plants (Tavakkoli et al. 2010 and 2011). Many other studies (Munns and James 2003; Shabala et al. 2010; Ligaba and Katsuhara 2010) concluded that growth reduction and Na+ toxicity are associated. However, Genc et al. (2007) and Dang et al. (2008) pointed out that not only Na+ but also Cl- exclusion is an important mechanism for salt tolerance in wheat and barley. This clearly demonstrates the importance of investigating the combinatory and interaction effects of Cl- and Na+ toxicity.
New traits and genes contributing to salt tolerance can be discovered by screening genetically diverse material for salt tolerance properties. Screening for salinity tolerance under field conditions is the traditional way for breeders to identify traits and develop salt tolerant varieties (Isla et al. 1997). This strategy, however, has various limitations related to
Chapter 2 �����������������������������������������������������������������������������������������������������������������������������������������������������������������������������������������������������������������������������������������������������
16
uncontrollable factors such as soil heterogeneity and weather conditions (Chen et al. 2005). The complexity of salt tolerance and interaction with environmental factors complicates selection under field conditions. Cuin et al. (2010) therefore concluded that the identification of useful physiological traits contributing to salt tolerance and the genes underlying these traits under well-defined controlled environmental screening conditions is preferable. Successful screening of responses of cereals to salinity was carried out on hydroponics (Munns and James 2003, Chen et al. 2005; Rajendran et al. 2009) or on sand and soil-based substrates (Munns et al. 2002). There are strong evidences that screening of germplasm on hydroponics is relevant for cultivation under saline field conditions (Tahir et al. 2011). El-Hendawy et al. (2009) concluded from greenhouse and field studies on salt tolerance with several wheat genotypes that monitoring ion contents in leaves (Na+, Cl- and Ca2+) was consistently informative in both environments. Genes for salt tolerance found in rice and wheat were identified mainly with the help of screening methods under controlled conditions, in particular hydroponics (Gregorio et al. 2002; Byrt et al. 2007; Munns et al. 2012). Similar studies in barley surprisingly have not yet revealed genes for salt tolerance, even though it is the most salt tolerant cereal crop. The large variability in the timing and severity of salt stress and inadequate understanding of its complexity adds to the challenge of genetic improvement of salt tolerance in crops. More accurate and appropriate screening procedures at multiple stages during salt stress for a large number of genotypes can help to dissect the plant’s responses to salinity in components and to identify genes influencing salt tolerance during different stages of the life cycle of the plant.
The current study investigates the temporal response to different salt stress levels of a diverse set of barley genotypes during vegetative growth with a focus on the role of ion accumulation in shoots and roots in salt tolerance. A diverse set of barley genotypes, which comprises mainly parental lines of mapping populations developed in Europe and America, was monitored for several weeks under different levels of salt stress. We found broad genetic variation for salt stress tolerance and identified traits contributing to salt tolerance, which were dependent on both the severity and the duration of the salt stress. Our results enable the selection of barley parental lines that utilize different mechanisms for salt tolerance for further breeding and breeding studies.
Materials and methods
Plant materials
Twenty-four barley genotypes, including parents of several different mapping populations were used in this study (Table 1). The set consists of both two row and six row barley lines from Europe and America. The parental lines differed in important agronomical traits, including disease resistance (Marcel et al. 2007; 2008). Little is known so far about the responses of these genotypes to abiotic stress and salinity stress, in particular with the exception of Steptoe and Morex (Mano and Takeda 1997; Witzel et al. 2009a; Nguyen et al. 2012).

Salt stress-induced changes in vegetative growth and mineral composition
�����������������������������������������������������������������������������������������������������������������������������������������������������������������������������������������������������������������������������������������������������
17
Table 1. Twenty four barley cultivars used in the current study; some are parents of the available recombinant inbred line (RIL) and doubled haploid (DH) mapping populations.
No. Cultivar Population Type No. Cultivar Population Type
1 Gunhild Gei x Gunhild RIL 13 Morex Steptoe x Morex DH
2 Cebada capa Cebada capa x Susptrit
RIL
14 Poker_14 *
3 Henni Henni x Meltan DH 15 Prisma * 4 Nure Nure x Tremois DH 16 Prestige_56 * 5 L94 L94 X C123 RIL 17 Class_13 * 6 116-5 L94 x 116-5 RIL 18 Tolar_SV * 7 Vada L94 x Vada RIL 19 Dom * 8 Steptoe Steptoe x Morex DH 20 Line_08 * 9 Gei Gei x Gunhild RIL 21 Rec *
10 Susptrit Cebada capa x Susptrit
RIL
22 Poet *
11 Meltan Henni x Meltan DH 23 Apex * 12 Tremois Nure x Tremois DH 24 Barke_33 * *: mapping population derived from these cultivars is not available
Hydroponics system and plant growth conditions
The twenty-four barley parental lines were tested on hydroponics with three salt treatments and a control. The experiment had a randomized block design with four plants per genotype per treatment. Each plant represented one experimental unit. The experiment consisted of eight randomized blocks, which were allocated to four hydroponics units each with either two control or two salt-treatment blocks. The nutrient solution was similar to full-strength modified Hoagland’s solution and maintained at pH5.8. The hydroponics system was located in a sun-lit greenhouse. The average day/night temperatures were set at +18/+14oC, and the photoperiod regime was 16 hours light and 8 hours dark. Greenhouse environmental humidity was 70%. Additional lighting (100 Wm-2) was used if the incoming shortwave radiation was below 200 Wm-2.
Screening procedure
Seeds from the 24 barley lines were germinated in trays with silver sand for one week until the first seedling leaf emerged. Individual seedlings were then transferred to the hydroponics system. After 7 days on the system, salinity treatments of 100 mM NaCl (mild stress), 200 mM NaCl (moderate stress) and 300 mM NaCl (severe stress) were stepwise applied to the containers containing the seedlings. NaCl was gradually added to those containers with a 50 mM day-1 (except for the control treatment which is 0 mM NaCl) increment to bring the solution to final concentrations of 100, 200 or 300 mM NaCl. The final concentration was then maintained until harvest. The range in salt concentration was based on various studies on

Chapter 2 �����������������������������������������������������������������������������������������������������������������������������������������������������������������������������������������������������������������������������������������������������
18
salt tolerance with Hordeum species (Garthwaite et al. 2005; Munns and Tester 2008). To assess the effects of different salt stress levels on salt tolerance, plants were harvested one, two and three weeks after final salt concentrations were reached.
Assessment of growth and salt tolerance
At harvest times, all plants from the control and salt stressed treatments were separated into shoots and roots. Plant shoot fresh weight was measured immediately at harvest. Both plant fractions were dried separately in a forced-air oven at 700C until the samples reached stable weight prior to the determination of the dry weight. Salt Tolerance (ST) was assessed as the percentage of relative shoot biomass production under saline and non-saline conditions according to the definition of Munns and James (2003).
Ion chromatography
For determination of the ion contents in the shoots and roots of each barley line, four replicated samples per line were pooled and ground to fine powder using a hammer mill with 1 mm sieve. Dry shoot and root powders were ashed at 575oC for 5 hours. Ash samples were dissolved by shaking for 30 minutes in 1 ml 3M formic acid at 95oC and then diluted with 9 ml MiliQ water. The samples were shaken again at 75oC for another 30 minutes. A final 1000x dilution was subsequently prepared by mixing 0.1 ml sample solution with 9.9ml MiliQ prior to the assessment of the Na+, K+, Cl- and Ca2+ content of each root and shoot sample using Ion Chromatography (IC) system 850 Professional, Metrohm Switzerland.
Statistical analysis of phenotypic data
The data was inspected and the relevance of genotype and genotype-by-environment interactions was assessed for shoot and root dry weight by variance analyses of the complete datasets using Genstat 13. The overall analyses were done with and without control treatment to differentiate the effects from different treatments. In these analyses the block was treated as fixed, and the other sources of variance, being harvest, treatment, genotype and genotype-by-harvest or genotype-by-treatment as random. Following the overall analyses, the data from the three salt and control treatments were analysed separately to get estimates of the genotypic and phenotypic variances, SD, LSD as well as the heritability (h2) based on genotypic means for shoot and root dry weights under either different stresses or control conditions. The relationship between the mean shoot and root ion contents of the lines and their contributions to the variance of Salt Tolerance was investigated using correlation analysis.

Salt stress-induced changes in vegetative growth and mineral composition
�����������������������������������������������������������������������������������������������������������������������������������������������������������������������������������������������������������������������������������������������������
19
Results
Growth responses to salinity stress
Mild salinity stress (100 mM NaCl) already caused reduction in biomass of barley genotypes one week after salt application. This early effect of mild stress on growth of barley genotypes over control condition was more obvious at the root than at the shoot level (25% and 10% reduction in biomass relative to control, respectively) (Fig. 1). At the mild stress level, however, no clear extra reduction in root growth was observed at subsequent harvests; reduction in root growth in harvests 2 and 3 was 22% and 20%, respectively. Additional effects of prolonged salt stress exposure on root growth were only found for barley genotypes grown at higher salt (200 and 300 mM NaCl) concentrations (Table 2).
Adverse effects on shoot growth were only manifest after prolonged exposure to mild salt stress (Fig. 1; 100 mM NaCl), with shoot reduction compared to control plants at harvests 1, 2 and 3 of approximately 10, 30 and 40%, respectively. Similar but more severe effects were observed in roots and shoots of plants grown at moderate and severe stresses. After three weeks of salt stress the reduction in shoot weight compared to control plants was 30, 60 and 75% and the reduction in root weight 20, 50 and 70% under mild, moderate and severe stresses, respectively (Fig. 1). Furthermore, significant genotypic differences for shoot and root biomass as well as significant genotype x treatment (salt levels or harvest) interactions were observed. Heritability estimates based on the genotypic means for shoot and root growth under control and different salt levels were moderate to high (0.49-0.78). The highest heritability estimates were generally found for measurements made at final harvest (Table 2) and ranged from 0.58 to 0.78.
Figure 1. Mean shoot dry weight (a) and root dry weight (b) of barley genotypes after one, two and three weeks (H1, H2 and H3) growth in 100 mM NaCl (S1/cross), 200 mM NaCl (S2/triangle), 300 mM NaCl (S3/square) and control (circle) conditions.
12
2
10
8
6
4
2
3 1 Harvest
Sho
ot D
W (
g)
1.4
2
1.2
1.0
0.8
0.6
0.4
1
0.2
3 Harvest
Roo
t DW
(g)
a b

Chapter 2 �����������������������������������������������������������������������������������������������������������������������������������������������������������������������������������������������������������������������������������������������������
20
Table 2. Summary statistics Max, Min, Mean, SD, LSD0.05, h2 and Fp refer to the maximum and
minimum genotype performance, the mean over all lines, standard deviation, the least significant difference (P<0.05), heritability and F probability value for shoot and root DW of 24 genotypes evaluated after one, two and three weeks under 100 (S1), 200 (S2), 300 (S3) and 0 (control) mM NaCl.
Harvest 1 Shoot Root
Control S1 S2 S3 Control S1 S2 S3 Mean(g) 0.18 0.16 0.13 0.12 0.04 0.03 0.03 0.02 Min (g) Max (g)
0.05 0.29
0.04 0.26
0.02 0.23
0.03 0.21
0.01 0.08
0.01 0.06
0.005 0.055
0.003 0.04
SD 0.05 0.04 0.04 0.03 0.01 0.01 0.01 0.01 LSD(0.05) 0.05 0.05 0.05 0.04 0.02 0.01 0.01 0.01 h2 0.77 0.49 0.56 0.63 0.58 0.57 0.62 0.51 Fp <.001 0.02 0.01 <.001 0.00 0.00 0.00 0.01
Harvest 2 Shoot Root
Control S1 S2 S3 Control S1 S2 S3 Mean(g) 0.48 0.35 0.25 0.19 0.09 0.07 0.04 0.03 Min (g) Max (g)
0.19 0.82
0.10 0.62
0.08 0.47
0.03 0.35
0.02 0.16
0.02 0.15
0.01 0.09
0.003 0.07
SD 0.13 0.11 0.07 0.06 0.03 0.03 0.02 0.01 LSD(0.05) 0.16 0.13 0.09 0.07 0.03 0.03 0.02 0.02 h2 0.54 0.59 0.60 0.63 0.69 0.75 0.69 0.65 Fp 0.01 0.00 0.00 <.001 <.001 <.001 <.001 <.001
Harvest 3 Shoot Root
Control S1 S2 S3 Control S1 S2 S3 Mean(g) 1.31 0.80 0.48 0.32 0.15 0.12 0.08 0.04 Min (g) Max (g)
0.1 2.4
0.18 1.5
0.10 0.84
0.07 0.60
0.01 0.34
0.03 0.25
0.01 0.19
0.004 0.13
SD 0.44 0.25 0.18 0.12 0.06 0.05 0.04 0.02 LSD(0.05) 0.52 0.26 0.21 0.14 0.07 0.05 0.04 0.02 h2 0.58 0.76 0.78 0.70 0.76 0.78 0.70 0.64 Fp 0.00 <.001 0.02 <.001 <.001 <.001 <.001 <.001
Salt Tolerance
Large genotypic variation for Salt Tolerance (ST) was found between the set of twenty four barley genotypes at each time points. Relatively to shoot growth, no clear effect of mild stress on ST was found one week after salt application. Several genotypes even showed better shoot growth (ST > 100%) under these conditions. However, a clear linear reduction in ST was observed as barley genotypes were exposed for a longer time to mild stress (Fig. 2). A similar relationship between ST and time of stress exposure was found for the moderate and severe stresses. Severe reduction in ST of barley genotypes was found after 3 three weeks exposure to severe stress (ST ranging from 10-40%). Several genotypes showed only around 10% shoot biomass produced relative to control condition at final harvest (5-weeks old). ST of barley genotypes found under moderate stress was more strongly correlated with ST found under severe and mild stresses (Fig. 3), implying that different mechanisms may underlie ST at mild salt stress compared to more severe stress.

Salt stress-induced changes in vegetative growth and mineral composition
�����������������������������������������������������������������������������������������������������������������������������������������������������������������������������������������������������������������������������������������������������
21
Figure 2. Mean ST of 24 genotypes under 100 (blue); 200 (purple) and 300 (red) mM NaCl, over H1; H2 and H3 are one, two and three weeks after saline treatments. Box edges show upper and lower quantile and the median as shown in the middle of the box. Individuals falling outside of the rank of whisker are shown as crosses.
120
H3
80
H2
40
H1 H3 H2 H1 H3 H2
100
H1
20
60
Sal
t Tol
eran
ce (
%)
Harvest
Figure 3. Correlation between mean ST of 24 genotypes at harvests H1 (crosses); H2 (red circles); H3 (blue triangles) under 100; 200 and 300 mM NaCl, r: correlation coefficient; *** P<0.001.
300 mM
100 mM
200 mM
100
806040130
120
110
100
90807060
80
50
60
40
20
7030
90
50
10
100
90
50
80
70
60
30
50
90
40
70
30
r=0.77**
r=0.71***
r=0.90***
Salt Tolerance (%)
Sal
t Tol
eran
ce (
%)
0
20
40
60
80
L94
Su
sPtr
it
11
6-5
Ce
ba
da
_C
…
He
nn
i
Ste
pto
e
Po
ke
r_1
4
Me
lta
n
Lin
e_
08
Pri
sma
To
lar_
SV
Ba
rke
_3
3
Ge
i
Gu
nh
ild
Pre
stig
e_
56
Nu
re
Do
m
Ap
ex
Tre
mo
is
Po
et
Cla
ss_
13
Va
da
Re
c
Mo
rex
Figure 4. Mean Salt Tolerance (n=4) of twenty four barley genotypes grown under 200 mM NaCl over control conditions for three weeks.
Sal
t Tol
eran
ce (
%)
Larger genetic variation for Salt Tolerance - ranging from 25% (Morex cultivar) to 65% (L94 cultivar) - was found after 3 weeks (5 week-old plants) of moderate salt stress (Fig. 4). The relative performance (mean ST over three salt treatments) of different genotypes was influenced by the time of harvest. The tolerant genotypes at final harvest, such as L94, 116-5 and Steptoe grew relatively poor in the first period of study and their salt tolerance compared to the other genotypes increased gradually in the following periods and vice versa for the sensitive genotypes Morex, Class 13, Rex and Apec (Fig. S1). This may be a reflection of the different components of salt tolerance (osmotic and ionic), differentially contributing to the variation of salt tolerance of genotypes at the different harvest time points. Other genotypes were relatively salt tolerant (Susptrit and Henni) or sensitive (Vada) at all three harvest points.

Chapter 2 �����������������������������������������������������������������������������������������������������������������������������������������������������������������������������������������������������������������������������������������������������
22
Root and shoot Na+ and Cl- contents
Na+ and Cl- accumulation in shoot and root tissues differed between the harvest times. Na+ and Cl- contents in plant tissues were substantially higher at higher salt stress levels. Shoot and root Na+ contents correlated well with shoot and root Cl- contents, respectively (P<0.001), regardless of the salt level and the time of exposure to stress. For all stress levels average shoot Na+ and Cl- contents increased during the first two weeks, and stabilized or even slightly decreased in the third growing period (Fig. 5). In contrast, root Na+ and Cl- contents increased continuously until the last harvest at mild and moderate salt stress. It is remarkable that there was larger genotypic variation from mild to severe salt stress for shoot Cl- content (30-100 mg/g DW) than for shoot Na+ content (40-65 mg/g DW). Na+ concentrations in response to different salt stress levels were lower in roots than in shoots (35-65 mg/g DW) but Cl- concentrations in the root were clearly lower than those in shoots (20-50mg/g DW).
Figure 5. Mean shoot, root Na+ (a,b) and Cl- (c,d) contents of barley genotypes measured after one, two and three weeks (harvests 1, 2 and 3) on media with 100 mM NaCl (cross), 200 mM NaCl (triangle), 300 mM NaCl (square) and on control (circle) conditions.
b
60
2
50
40
30
20
10
3 1 Harvest
Roo
t Na+
(m
g/g
DW
)a
60
2
50
40
30
20
10
3 1 Harvest
Sho
ot N
a+ (
mg/
g D
W)
c 100
2
80
60
40
20
1 3 Harvest
Sho
ot C
l- (m
g/g
DW
)
d 50
2
40
30
20
10
0 3 1
Harvest
Roo
t Cl-
(mg/
g D
W)

Salt stress-induced changes in vegetative growth and mineral composition
�����������������������������������������������������������������������������������������������������������������������������������������������������������������������������������������������������������������������������������������������������
23
Root and shoot K+ content and Na+/K+
Shoot and root K+ contents reduced significantly (2-4 fold) over time under salt stress. Shoot K+ content decreased over 2.5 fold already after 1 week of mild stress (from 74 to 29 mg/g DW), and higher stress levels affected K+ content similarly. Prolonged exposure to stress also did not further decrease shoot K+ relative to control levels. Root K+ concentration was more affected by higher stress levels. K+ contents in barley roots decreased from 40, 30 and 20 mg/g DW in the first week to 30, 20 and 10 mg/g DW after three weeks of mild, moderate and severe salt stress, respectively (Fig. 6).
The root and shoot Na+/K+ ratios increased in response to mild, moderate and severe stresses, and increased with exposure time as well. Shoot Na+/K+ under severe stress was similar to the ratio under moderate stress at final harvest. In roots the Na+/K+ ratio was considerably (2-fold) higher at severe stress compared to moderate stress (Fig. 6). This may reflect the ability of barley to exclude Na+ from the shoot to retain low Na+/K+ in shoot under severe stress.
Figure 6. Mean shoot, root K+ contents (a,b) and Na+/K+ ratio (c,d) of 24 barley genotypes measured after one, two and three weeks (harvests 1, 2 and 3) on media with 100 mM NaCl (cross), 200 mM NaCl (triangle), 300 mM NaCl (square) and control (circle) conditions.
b
80
2
70
60
50
40
30
20
3
10
1 Harvest
Roo
t K+
(mg/
g D
W)
70
2
60
50
40
30
20
3 1 Harvest
Sho
ot K
+ (m
g/g
DW
)
a
c 2.5
2
2.0
1.5
1.0
0.5
0.0
3 1 Harvest
Sho
ot N
a/K
d 6
2
5
4
3
2
1
1
0
3 Harvest
Roo
t Na/
K

Chapter 2 �����������������������������������������������������������������������������������������������������������������������������������������������������������������������������������������������������������������������������������������������������
24
Root and shoot Ca2+ content
The Ca2+ concentration in shoots of barley plants decreased remarkably over time under salt stress (2-3 fold) compared to the control treatment. In shoot, Ca2+ contents were similarly reduced at all stress levels already at an early stage, with an additional slight decrease after prolonged exposure. However, substantial effects of stress levels and stress exposure time were detected for root Ca2+ concentrations, with similar and slightly higher than control Ca2+ contents for all stress levels at the first harvest, and the largest reduction at the third harvest for plants grown under severe stress (Fig. 7). In roots the Ca2+ concentration gradually declined for all treatments including control, indicating that this may be a developmentally regulated decrease.
Correlation between shoot ion contents, root ion contents and biomass production
To investigate how different ion contents relate to barley biomass production under different salt stresses levels and exposure times, correlation analyses were done for shoot (Fig. 8) and root (Fig. 9) at three stress levels. Significant correlations (|r|>0.4; p<0.05; p<0.05) were more often observed at the later harvests. Na+ content in roots and K+ content in shoots correlated well with shoot production at 100 mM NaCl (Fig. 8a). At higher stress levels, root Cl- and root K+ contents positively correlated with shoot growth but only at the first harvest (Figs. 8 b and c). Shoot/root ion ratios for Na+ and Cl-, which reflect the amount of Na+ and Cl- loading from root to shoot and relate to ion exclusion, negatively correlated with shoot production in all saline treatments. This shows that ion exclusion or the ability to limit the transport of Na+ and Cl- to the shoot is a major mechanism conferring salt tolerance in barley.
Figure 7. Mean shoot (a) and root (b) Ca2+ contents of 24 barley genotypes measured after one, two and three weeks (harvests 1, 2 and 3) on the media of 100 mM NaCl (cross), 200 mM NaCl (triangle), 300 mM NaCl (square) and control (circle) conditions.
9
2
8
7
6
5
4
1
3
3 Harvest
Sho
ot C
a2+
(mg/
g D
W)
9
2
8
7
6
5
1 3 Harvest
Roo
t Ca2
+ (m
g/g
DW
)
b a

Salt stress-induced changes in vegetative growth and mineral composition
�����������������������������������������������������������������������������������������������������������������������������������������������������������������������������������������������������������������������������������������������������
25
Root Na+ and K+ concentrations positively correlated with root growth (Fig. 9). A consistent negative correlation with root growth over time was found with the shoot/root ratios of Na+ and Cl- contents which suggests that ion exclusion mechanisms that keep Na+ and Cl- from accumulating in the shoots positively affects photosynthetic activity and growth of not only shoots but also of the roots.
-0.8
-0.4
0
0.4
0.8N
a_
S
Na
_R
Na
/K_
S
Na
/K_
R
Na
_S
/R
Cl_
S
Cl_
R
Cl_
S/R
K_
S
K_
R
Ca
_S
Ca
_R
H1 H2 H3a
(r)
-0.8
-0.4
0
0.4
0.8
Na
_S
Na
_R
Na
/K_
S
Na
/K_
R
Na
_S
/R
Cl_
S
Cl_
R
Cl_
S/R
K_
S
K_
R
Ca
_S
Ca
_R
H1 H2 H3b
-0.8
-0.4
0
0.4
0.8
Na
_S
Na
_R
Na
/K_
S
Na
/K_
R
Na
_S
/R
Cl_
S
Cl_
R
Cl_
S/R
K_
S
K_
R
Ca
_S
Ca
_R
H1 H2 H3Figure 8. Relationship of shoot (S), root (R) ion contents and shoot DW (g) of 24 barley genotypes under 100 (a); 200 (b) and 300 (c) mM NaCl for one (H1); two (H2) and three (H3) weeks, respectivley. Verticle axis is correlation coefficient r; r is significant at P<0.05 when higher than 0.4 or lower than -0.4. (/) indicates the ratio betweeen ion contents.
c
(r)
-0.8
-0.4
0
0.4
0.8
Na
_S
Na
_R
Na
/K_
S
Na
/K_
R
Na
_S
/R
Cl_
S
Cl_
R
Cl_
S/R
K_
S
K_
R
Ca
_S
Ca
_R
H1 H2
H3
-0.8
-0.4
0
0.4
0.8
Na
_S
Na
_R
Na
/K_
S
Na
/K_
R
Na
_S
/R
Cl_
S
Cl_
R
Cl_
S/R
K_
S
K_
R
Ca
_S
Ca
_R
H1 H2 H3
-0.8
-0.4
0
0.4
0.8
Na
_S
Na
_R
Na
/K_
S
Na
/K_
R
Na
_S
/R
Cl_
S
Cl_
R
Cl_
S/R
K_
S
K_
R
Ca
_S
Ca
_R
H1 H2 Figure 9. Relationship of shoot (S), root (R) ion contents and root DW (g) of 24 genotypes under 100 (a), 200 (b) and 300 (c) mM NaCl for one (H1); two (H2) and three (H3) weeks, respectivley. Verticle axis is correlation coefficient r; r is significant at P<0.05 when higher than 0.4 or lower than -0.4). (/) indicates the ratio betweeen ion contents.
a
(r)
b
c
(r)

Chapter 2 �����������������������������������������������������������������������������������������������������������������������������������������������������������������������������������������������������������������������������������������������������
26
Mechanisms of salt tolerance in contrasting genotypes
We further investigated the mechanisms of salt tolerance in the genotypes that demonstrated the largest contrast in ST (e.g. sensitive group with ST<30% or salt tolerance group with ST>40%) (Fig. 4). The sensitive group includes Morex and Rex with the highest Cl-, Na+ concentration, but also other genotypes with lower concentrations (Fig. 10). The highest Cl- and Na+ concentrations were found in the two most sensitive genotypes. The most tolerant genotypes were L94, 116-5 and Susptrit, which were always in the group of genotypes that had the lowest Na+ and Cl- accumulation in shoots, the lowest Na+/K+ ratio and the lowest Na+ and Cl- shoot/root ratios. This demonstrates that minimizing Na+ and Cl- uploading to the shoot is important for salt tolerance. L94 was significantly more tolerant than the other tolerant genotypes, indicating that L94 utilizes probably an additional mechanism to counteract the adverse effects of salt stress. Interestingly, L94 and Steptoe were among the more sensitive lines at the first harvest with 200mM NaCl, but was hardly affected by prolonged exposure to stress. It suggests that L94 and Steptoe does not rely on early effects that might be caused by osmotic stress but more in adaptation to prolonged stress (Fig. S1).
Figure 10. The relationship between ion accumulation and Salt Tolerance of the constrasting genotypes grown under 200 mM NaCl for three weeks. (Asterix: sensitive and diamond: tolerant genotypes).
L94Susptrit
Steptoe
Rex
Morex
0
3
5
8
10
20 30 40 50 60 70
Sho
ot N
a/K
Salt Tolerance (%)
L94
116-5
Susptrit
Steptoe
Vada
RexMorex
20
40
60
80
20 40 60 80
Sho
ot N
a+
L94
116-5
Susptrit
SteptoeVada
Rex
Morex
0.6
1.0
1.4
1.8
20 40 60 80
Sho
ot/r
oot N
a+
L94Susptrit116-5
SteptoeVadaRex
Morex
40
70
100
130
20 40 60 80
Sho
ot C
l-
L94
116-5
SteptoeVada
2
3.5
5
6.5
20 30 40 50 60 70
Roo
t Ca2
+
Salt Tolerance (%)
L94
Susptrit
116-5
Steptoe
Vada
Rex
Morex
0.8
1.2
1.6
2.0
20 30 40 50 60 70
Sho
ot/r
oot C
l-

Salt stress-induced changes in vegetative growth and mineral composition
�����������������������������������������������������������������������������������������������������������������������������������������������������������������������������������������������������������������������������������������������������
27
Discussion
The current study evaluated twenty four barley lines at different levels of salt stress and salt stress exposure times and compared biomass growth, Salt Tolerance and shoot, root ion contents. We aimed at gaining more insight into the salt tolerance mechanisms, which are related to ion homeostasis, of barley genotypes grown under different levels of salinity over time. An additional objective of the current study was to provide information for selections of parents for establishing or perhaps selection of one or more mapping populations to be utilized for genetic analysis of salt tolerance in barley.
Screening methods
Both short- and long-term saline stress effects have been studied. Short-term salt stress leads to in small changes in leaf growth and the barley plants respond by osmotic adjustment. Fricke et al. (2006) and Rajendran et al. (2009) showed that barley osmotic adjustment found in short-term experiments could add to salt tolerance at the whole plant level but also agreed with others (Munns and James 2003; Munns and Tester 2008) that studies of both short and longer-term effects of salt stress are needed to identify traits that contribute to increased tolerance to both osmotic and ionic stress. This study incorporated both short and long term effects of stress, and our results showed that even though genetic variation in ion contents is already detected after one week of salt stress (Figs. 3-7) the variation for ST is often only clearly manifested one and two weeks later (Fig. 1). We found that medium salt stress (200 mM NaCl) for three weeks (5-week old plants of which three weeks under stress) provided the most effective screening conditions to distinguish the barley genotypic differences in ST in relation to ion homeostasis (Figs. 2 and 9).
It is well documented that plant growth and development can be affected differently by different salinity stresses at different time points in the life cycle. In rice and wheat, the seedling stage is the most sensitive to saline stress (Flowers 2004; Munns and Tester 2008). Steptoe and Morex have been studied for their salt tolerance differences. In our study, Steptoe performed better than Morex after three weeks of stress (Fig. 4), which is in agreement with the finding of Mano and Takeda (1997). Witzel et al. (2009a) on the other hand reported that Morex was more salt tolerant than Steptoe in the young seedling stage (13 days after saline treatments, which agreed with a time point between our first and second harvests). Similarly, we found that the cultivars L94, Class 13 and 116-5 were amongst the most salt tolerant genotypes when tested over a period of three weeks, but they were relatively sensitive to saline stress at first and second weeks (Figs. 4 and S1). The striking difference in salt tolerance of barley genotypes such as Steptoe, Morex, Apex, Class 13 and L94 depending on time of exposure to the stress (Fig. S1) demonstrates that osmotic adjustment and ionic stress tolerance contribute to early and late stress tolerance, respectively.

Chapter 2 �����������������������������������������������������������������������������������������������������������������������������������������������������������������������������������������������������������������������������������������������������
28
Different developmental stages, stress levels, plant species and cultivars within a crop species greatly interact with the responses to salt stress. The interaction with environment conditions makes salt tolerance so complicated to breed for (Flower et al. 2004). It is suggested that genotypes should be tested under field conditions and the confounding effects of environmental factors that could be important to estimate overall performance should be taken into account (El-Hendawy et al. 2009). Others have shown that testing germplasm for salt tolerance in a greenhouse or other controlled environments with reproducible treatments and avoiding the partial heterogeneity of soil properties, seasonal rainfall and temperatures can be a good strategy (James and Munns 2003; Cuin et al. 2010; Witzel et al. 2009). Tavakkoli et al. (2010b and 2012) found fundamental differences between their hydroponics and soil based and field conditions in Na+ and Cl- accumulation in barley shoots. Tavakkoli et al. (2010 and 2012) also failed to show salt exclusion in tests on their hydroponics system (no correlation between Na+ and Cl- with salt tolerance) as in their tests under soil based and field conditions. Our experiences with testing for salinity tolerance on hydroponics were strikingly different from those of Tavakkoli et al. (2010 and 2012). We found a clear relationship between Cl- and Na+ content in shoots as found by Tavakkoli et al. (2012) in their soil based and field studies as well as clear genotypic differences in salt exclusion (Fig. 8). This indicates that the result from salt test in our hydroponics system might relate better to the performance of the genotypes under field conditions. The discrepancy with the experiences of Tavakkoli et al. (2010 and 2012) might be related to the supplemental of Ca2+ to the hydroponics system, as we will discuss in the next paragraph. Positive correlations between variation in salt tolerance found under controlled and field conditions have been observed; maintenance of low Cl- and Na+ in leaves offered the best indicator trait for salt tolerance in screening under both controlled and field conditions (El-Hendawy et al. 2009). Until now, screening and selection under controlled environmental conditions to identify useful physiological traits contributing to salt tolerance and candidate genes gene(s) were shown to be most effective (Cuin et al. 2010; Munns et al. 2012).
Ion exclusion or inclusion mechanisms in barley
We showed that shoot Na+ and Cl- contents increased rapidly in the second week of salt stress (Fig.1), which coincided with shoot growth reduction. It was surprising to see that after two weeks of salt stress, shoot Na+ and Cl- did not further increase while it continued to increase in roots. The strong negative correlation between shoot Na+ and Cl- with shoot growth indicates that ion exclusion mechanisms may be involved in conferring salt tolerance in the set of barley genotypes and underlines that shoot ion exclusion is a dominant determinant for salt tolerance in cereals (Garthwaite et al. 2005; Horie et al. 2009; Shabala et al. 201). The most salt tolerant genotypes (L94, Susptrit and 116-5) in our study are among the best Na+ and Cl- excluders, while the most sensitive genotypes Morex and Rex had high concentrations of shoot Na+ and Cl- and a high shoot/root ratio of Na+ and Cl-. Barley is more salt tolerant than both bread and durum wheat and different mechanisms conferring salt tolerance were found in barley (Gorham et al. 1990; Munns and Tester 2008; Shabala et al. 2010; Mian et al.

Salt stress-induced changes in vegetative growth and mineral composition
�����������������������������������������������������������������������������������������������������������������������������������������������������������������������������������������������������������������������������������������������������
29
2011a). The mechanism by which wheat and barley plants avoid accumulation of Na+ in the shoot mainly involves members of the HKT1 gene family (Horie et al. 2009). An ancient HKT gene (HKT1:5) controlling Na+ exclusion conferred a yield increase of 25% in durum wheat (Munns et al. 2012). In our study, shoot/root ratio of Na+ and Cl- decreased substantially over time (data not shown). Root Na+ and Cl- increased remarkably with increased salt concentration and duration of exposure (Fig. 5). This may suggest that ion unloading to phloem or recirculation from shoots to roots play a role in addition to xylem unloading of Na+ (Munns and Testers 2008; Mian et al. 2011). High shoot Na+ and Cl- contents were only found in the salt sensitive lines Morex, Vada and Rex. Some of the tolerant lines such as Steptoe had relatively high levels of shoot Na+ and Cl- that were as high as several sensitive lines. These tolerant barley genotypes may exhibit ion including behaviour or tissue tolerance mechanisms by allowing transport of Na+ to the shoots and sequester Na+ (Cl-) in vacuoles or less sensitive plant tissues such as older leaves (Munns and Tester 2008).
The role of Cl- and Ca2+ in barley salt tolerance
Our results demonstrate that controlling intracellular Cl- is as important as handling Na+ for salt tolerance in barley. Shoot Cl- contents were strongly negatively correlated with shoot and root growth under saline stress (Figs. 8 and 9), and high levels of Cl- in the shoot were only seen in the most sensitive genotypes (Rex and Morex) (Fig. 10). This indicates that limiting Cl- loading from root to shoot is an important salt tolerance mechanism in barley. Reduced photosynthesis capacity and salt tolerance in bean and barley plants were associated with toxic leaf Cl- levels that may induce chlorophyll degradation and reduce the actual quantum yield of PSII electron transport (Tavakkoli et al. 2010). Our results indicate that Cl- and Na+ homeostasis are controlled by independent mechanisms (possibly involving ion transport, exclusion from shoots and compartmentalisation), which are differentially responding to salt stress levels and duration of the stress. Under mild stress (100 mM NaCl), barley plants did show to maintain for Cl- in comparison to Na+ relatively low concentrations in the shoot and root. In contrast, with higher salt stress (200-300 mM NaCl) shoot Cl- accumulation increased at a higher rate than shoot Na+. Root Na+ and Cl- concentration varied depending of both the level and duration of the stress (Fig. 5). Under saline conditions, Cl- seemed initially to be accumulated in the root cells at a slower rate than Na+ but Cl- levels increased after prolonged stress to levels similar to or even higher than Na+. In salt-stressed bread wheat, shoot Cl- concentration was found to be 5 times higher than shoot Na+ concentration, and in wild barley 1.2 times higher (Husain et al. 2003; Garthwaite et al. 2005). Our shoot Cl-/Na+ ratios at 200mM NaCl were similar to those in wild barley, but lower at mild stress (0.6 at 100 mM). These differences may be explained by differences in experimental setup, which include salt levels, duration of the exposure to stress and possibly also the testing system, as Tavakkoli et al. (2010) showed differences in accumulation of Na+ and Cl- between their hydroponics and soil-based experiments.

Chapter 2 �����������������������������������������������������������������������������������������������������������������������������������������������������������������������������������������������������������������������������������������������������
30
In contrast to Na+ and K+, there is little known about mechanisms or genes that control Cl- uptake and transport. The possible key aspects of Cl- transport that contribute to salt tolerance in some species include reduced net xylem loading, intracellular compartmentalization and efflux of Cl- from roots (Teakle and Tyerman 2010). Chloride channels (CLCs) may be involved in compartmentation of Cl- into the vacuole and chloride cation co-transporters (CCCs) may mediate xylem loading of Cl-. The mechanism and identity of Cl- uptake systems into the root are largely unknown (Mian et al. 2011b). In our experiment, accumulation of Ca2+ in root was correlated with increased growth reduction (Figs. 9 and 10). Ca2+ is known to act as a signal linking the stress sensing signal to the downstream stress response by interacting Ca2+ kinase complexes (CLB-CIPK gene; Luan 2009). Ca2+ handling is an important factor in salt tolerance studies, but mainly because high NaCl levels may interfere with Ca2+ uptake and nutrition, which may cause Ca2+-deficiency in salt-stressed plants; it is therefore suggested to add supplemental Ca2+ to the growing media when studying the effects of Na + and Cl- on plants (Munns and Tester 2008; Genc et al. 2010b). In our hydroponics system, we did not add additional Ca2+ to compensate for the effects of high Na+ on Ca2+ uptake and utilisation. The concentrations of Ca2+ measured in the leaf tissues are above 2.5 mg.g-1 at all time points and all stress levels; well above the proposed minimum threshold (around 1 mg.g-1) for Ca2+-deficiency in leaf tissue as stated by Genc et al. (2010). Therefore, it is not likely that even at the high salt stress levels (300mM) growth is influenced by Ca2+-deficiency. Genetic analysis of salt tolerance
Genotypes that differed in salt tolerance or in traits associated with different mechanisms controlling Na+/K+ and Cl- uptake are of great interest (Munns et al. 2002). The Steptoe x Morex mapping population is widely used in quantitative genetic studies because of the availability of high quality genetic maps and its variability for important agronomical traits like malting quality, and for tolerance to both biotic and abiotic stress (Kaneko et al. 2001; Han et al. 2003; Choi and Close 2000). The Steptoe x Morex mapping population was used previously to map salt tolerance traits such as germination rate and senescence (Mano and Takeda 1997). Our results showed that Steptoe and Morex contain allelic variation for genes affecting ST and ion handling mechanisms. Other mapping populations (L94 x Vada; 116-5 x Vada and Vada x Susptrit) (Jafary et al. 2008; Marcel et al. 2007; Aghnoum et al. 2010) have not yet been used to map QTLs for salt tolerance, but our results indicate that they offer great potential for detecting genomic regions contributing to salt tolerance. L94 was shown to be the best salt excluder and most salt tolerant line in this study. L94 has been collected from North Africa (Marcel et al. 2007), what implies that it originates from an area where drought and salinization often occur (Badr et al. 2000; Nevo 2007). Therefore it is likely that L94 contains favourable alleles conferring drought and salt tolerance. On the other hand European and American cultivars, such as Morex and Vada, for instance may hardly have alleles that confer resistance to salt stress since they were selected to perform well under relatively favourable conditions. The three available mapping populations derived from L94 (Table 1)

Salt stress-induced changes in vegetative growth and mineral composition
�����������������������������������������������������������������������������������������������������������������������������������������������������������������������������������������������������������������������������������������������������
31
seem to be attractive to map salt exclusion genes, in particular. The Steptoe x Morex mapping population is attractive because it offers the possibility to map both ion exclusion and compartmentation genes. It has the advantage that under normal conditions the growth properties of Steptoe and Morex are similar. The phenotypic differences in response to salt stress therefore will be related to physiological rather than morphological differences. The mapping populations derived from the genotypes that showed tolerance upon prolonged salt stress such as L94 and Steptoe or the genotypes sensitive under those conditions such as Vada and Morex open the possibility to study additional tolerance mechanisms what may lead to the discovery of novel genes contributing to salt tolerance.
Conclusions
Our study showed that difference in duration of exposure and severity of stress can reveal different and possibly independent traits and mechanisms that contribute to salt stress tolerance. In our system, screening for salt tolerance on hydroponics with three weeks of 200 mM NaCl salt stress is most effective for identifying salt tolerant genotypes and traits related to ion homeostasis. It showed a large heritable variation for salt tolerance among the twenty four lines tested in this study.
Salt (Na+ and Cl-) shoot exclusion is a dominant mechanism determining genotypic differences in salt tolerance between the barley genotypes used in this study; five out of seven tolerant genotypes did use this mechanism to counteract the adverse effects of salinity. Other tolerant barley genotypes with high levels of Na+ and Cl- in shoots may exhibit mechanisms causing salt tissue tolerance, what differentiates them from of the sensitive genotypes. This study also showed that the way genotypes cope with Cl- accumulation is as important as the response to the Na+ accumulation. In addition, Na+ and Cl- handling mechanisms may be independent.
The parents of several mapping populations such as L94 x Vada, 116-5 x Vada, Vada x Susptrit and Steptoe x Morex have shown contrasting salt tolerance properties. These populations are recommended for further genetic studies on salt tolerance.


CHAPTER 3
Identification of QTLs for ion homeostasis and salt tolerance in barley (Hordeum vulgare L.)
Nguyen Viet Long12, Simon A. Ribot2, Oene Dolstra2, Rients E. Niks2, Richard G. F. Visser2, C. Gerard van der Linden2
1 Graduate School Experimental Plant Sciences, Wageningen University, PO Box 386, 6700 AJ Wageningen, The Netherlands.
2 Wageningen UR Plant Breeding, Wageningen University and Research Centre, PO Box 386, 6700 AJ Wageningen, The Netherlands
This chapter has been published in Molecular Breeding (2012)

Chapter 3 �����������������������������������������������������������������������������������������������������������������������������������������������������������������������������������������������������������������������������������������������������
34
Abstract
Ion homeostasis is considered as one of the most important mechanisms underlying salt stress tolerance. We used the Steptoe x Morex barley doubled haploid (DH) population to screen for genetic variation in response to salinity stress at an early development stage in a hydroponics system, focusing on ion homeostasis. Salinity induced a strong adverse effect on growth of the parents and their derived population with Steptoe as the more tolerant parent. Steptoe maintained higher concentrations for K+, Na+ and Cl- in the root and a similar shoot/root ion ratio (<1) under stress conditions compared to control conditions. In contrast, Morex had higher concentrations for these ions in the shoot under stress and a doubled shoot/root ion ratio relative to control conditions, indicating that salt exclusion might contribute to the higher tolerance of Steptoe. Correlation and path analysis demonstrated that shoot Cl- contents most strongly affected salt tolerance and suggest that both Na+ and Cl- contents are important for salinity stress tolerance in barley. We identified 11 chromosomal regions involved in the control of the variation observed for Salt Tolerance and various salt stress response traits, including Na+, Cl- and K+ contents in shoots. Two specific regions on chromosomes 2H and 3H were found controlling ion contents and salt tolerance, pointing to genes involved in ion homeostasis that contribute to salt tolerance.
Keywords: Salt tolerance, QTL, ion homeostasis, path analysis, barley
Introduction
Salinity is one of the major global problems in agriculture and it affects 20% of all agricultural land (FAO 2008). Salinity has caused major crop losses worldwide. The problem is increasing yearly as more and more arable land becomes salty as a result of inappropriate irrigation practices and changing climatic conditions. Salinity is a common feature of arid and semiarid soils and many plant species have evolved mechanisms to cope with the unfavourable growing conditions caused by salinity such as the low soil water potential, one of the important stresses associated with salinity. Salinity interferes with numerous growth and development processes in plants (Koyama et al. 2001). In salinized soil, crop plants often try to avoid salt accumulation through mechanisms that effectively exclude Na+ and Cl- from roots and shoots while water is taken up from the soil (Munns and Tester 2008). Plants that suffer relatively little growth or biomass yield reduction under salinity conditions are considered salinity tolerant. Enhancing a crop’s salinity tolerance to make it suffer less under high salt conditions therefore is a challenge to plant breeders. It requires advanced screening methods, appropriate germplasm, and a combination of conventional and molecular breeding approaches (Flowers 2004).
Barley is one of the most salt tolerant crops (Maas and Hoffman 1977) and it is widely used for genetic studies. As such, barley is an excellent model crop for studies on the mechanisms and inheritance of salinity tolerance and for developing tools to improve salt tolerance in cereals (Chen et al. 2005 and 2007; Walia et al. 2007; Witzel et al. 2009a,b). The relatively high salt tolerance found in barley compared to that of other Gramineae species may partly originate from its rapid growth and fast phenological development, leading to early ripening

Identification of QTLs for ion homeostasis and salt tolerance
�����������������������������������������������������������������������������������������������������������������������������������������������������������������������������������������������������������������������������������������������������
35
(Munns et al. 2006). Salinity mostly affects the growth and development of barley during the vegetative growing stage and significantly decreases its growth.
Several traits in wheat, rice, maize and barley have been correlated to salinity tolerance at different growing stages. These include seedling root and shoot attributes, degree of leaf damage, rates of Na+ or Cl- accumulation in leaves (Munns and Rawson 1999) and in xylem sap (Ligaba and Katsuhara 2010 and Shabala et al. 2010), carbon isotope discrimination (δ13C) (Isla et al. 1998), canopy temperature (Sirault et al. 2009), ion concentration in root and shoot tissue (Flowers and Hajibagheri 2001), and chlorophyll fluorescence (Shabala et al. 1998). However, major strategies that may contribute to Gramineae salinity tolerance are Na+ exclusion, tolerance to Na+ in tissues, and osmotic adjustment (Munns and Tester 2008 and Rajendran et al. 2009). To date, several QTLs associated with salt tolerance-related traits in barley have been detected at different growing stages. Mano and Takeda (1997) reported that salt tolerance in the Steptoe x Morex doubled haploid (DH) population at germination and seedling stages is controlled by different loci. QTLs were also identified in other barley mapping populations for other traits suggested to be associated with salt tolerance of barley, including δ13C as a measure for water-use efficiency and other physiological traits (Ellis et al. 1997 and 2002). Recently, in a study on salt-treated soil QTLs for yield and yield components have also been identified in CM72 x Gairdner mapping population at a late growing stage (Xue et al. 2009).
Although the mechanisms conferring salt tolerance in barley and their genetic control are not fully understood, regulation of intracellular cation (Na+, K+, and Ca2+) and anion (Cl-) contents and control of ion transport are considered important. The decrease in growth under saline conditions is mainly attributed to ionic effects caused by toxic level of Na+ and Cl- concentrated in the leaves (Mano and Takeda 1997; Shabala et al. 2010; Storey and Jones 1978). Plant tissue Na+, K+ content and Na+/K+ ratio regulation in relation to a plant’s salt response have been studied in Thellungiella halophile - a salt tolerant relative of Arabidopsis thaliana (Volkov and Amtmann 2006), in wheat (Dubcovsky et al. 1996 and Gorham et al. 1997) and in barley (Chen et al. 2007). Genetic studies of these traits resulted in discovery of several QTLs for Na+ and K+ contents, and Na+/K+ ratio using solution culture studies in rice (Koyama et al. 2001 and Lee et al. 2006), in bread wheat (Shavrukov et al. 2010) and durum wheat seedlings (Lindsay et al. 2004). Xue et al. (2009) identified QTLs controlling Na+ contents and Na+/K+ ratio in mature barley plants grown on salt-treated soil. Cl- is the dominant anion in saline soil and most plants accumulate both Na+ and Cl- in their shoot tissues (Tavakkoli et al. 2011). The high levels of Cl- accumulation in the leaves and in other plant tissues have detrimental effects on the plants (Greenway and Munns 1980; White and Broadley 2001). High Cl- content in leave of barley plant was shown to reduce chlorophyll content and photosynthesis capacity (Tavakkoli et al. 2011). Therefore, it is remarkable that little scientific effort has been directed to the effects of Cl- content in relation to crop salt tolerance (Teakle and Tyerman 2010), and to our knowledge there are no reports on the genetic control of this trait. Similarly, information on the impacts and genetic control of other

Chapter 3 �����������������������������������������������������������������������������������������������������������������������������������������������������������������������������������������������������������������������������������������������������
36
major ions such as Ca2+, Mg2+, SO42- and PO4
3- under saline conditions and their association with salt stress tolerance is scarce.
In this study we focus on changes in ion contents and the genetics underlying these changes in response to salinity in barley. For this, we evaluated the genetic variation for salt tolerance in a barley doubled haploids (DH) population at the vegetative growing stage using a hydroponics system, and measured contents of major ions in root and shoot tissues of young barley plants. We examined how the concentrations of several ions including Cl- are associated with salt tolerance and we present several QTLs for salt tolerance that gives new insights in the mechanisms controlling ion homeostasis in barley in saline conditions.
Materials and methods
Mapping population
A population of over 150 double haploid (DH) lines was developed within the North America Barley Mapping Genome project (http://www.css.orst.edu/barley/nabgmp/nabgmp.htm) by the Hordeum bulbosum technique as described by Chen and Hayes (1989) using an F1 obtained from a cross between Steptoe and Morex cultivars. Steptoe is a high yielding, broadly adapted six-row coast-type feed barley selected from the cross of "WA3564/"Unitan". Morex, midwestern six-row Manchurian-type barley, is the North American six-row malting quality standard. It was developed at the University of Minnesota from the cross of Cree x Bonanza (Kleinhofs et al. 1993).
Hydroponics system and plant growth conditions
The lines were tested in an experiment on hydroponics with a saline treatment (200 mM NaCl) and a control (0 mM NaCl). The experiment had a randomized block design with four plants per line per treatment. Each plant represented one experimental unit. The experiment consisted of eight randomized blocks, which were allocated to four hydroponics units each with either two control or two salt-treatment blocks. The hydroponic nutrient solution was similar to full-strength modified Hoagland’s solution and maintained at pH 5.8. The hydroponics system was located in a sun-lit greenhouse. The average day/night temperatures were set at +18/+14oC, and the photoperiod regime was 16 hours light and 8 hours dark. Greenhouse environmental humidity was 70%. Addition light 100 Wm-2 was used when incoming shortwave radiation was below 200 Wm-2. Lamps were switched off at an incoming shortwave radiation higher 300 Wm-2.
Screening procedure
Seeds from 139 lines of the Steptoe x Morex DH population and the parents were germinated in trays with silver sand for one week until the first seedling leaf emerged. Individual seedlings were then transferred to the hydroponics system. After 7 days on the system, a

Identification of QTLs for ion homeostasis and salt tolerance
�����������������������������������������������������������������������������������������������������������������������������������������������������������������������������������������������������������������������������������������������������
37
salinity level of 200 mM NaCl was stepwise applied to half of the containers containing seedlings of the 139 DH lines and parents. NaCl was gradually added to those containers with a 50 mM day-1 increment to bring the solution to 200 mM NaCl. The final concentration was then maintained for three weeks until the plants were harvested for biomass and ion content measurements.
Assessment of growth and salt tolerance
To measure growth parameters at harvest, all seedlings from the control and salt-stressed treatments were separated into shoots and roots. Plant shoot fresh weight was measured immediately at harvest. Both plant fractions were dried separately in a forced-air oven at 700C until the samples reached stable weight prior to the determination of the dry weight. Salt Tolerance (ST) was assessed as the percentage of relative shoot biomass production under saline and non-saline conditions according to the definition of Munns et al. (2002).
Ion chromatography
For determination of the ion contents in the shoots and roots of each barley line, the four replicated samples obtained per line were pooled and ground to fine powder using a hammer mill with 1 mm sieve. Dry shoot and root powders were ashed at 575oC for 5 hours. Ash samples were dissolved by shaking for 30 minutes in 1 ml 3M formic acid at 95oC and then diluted with 9 ml MiliQ water. The samples were shaken again at 75oC for another 30 minutes. A final 1000x dilution was subsequently prepared by mixing 0.1 ml sample solution with 9.9ml MiliQ prior to the assessment of the Na+, K+, Cl-, Mg2+, Ca2+, SO4
2-, and PO4
3- content of each root and shoot sample using Ion Chromatography (IC) system 850 Professional, Metrohm Switzerland.
Statistical analysis of phenotypic data
Variances on root and shoot growth data were analysed using Genstat 13.0. Estimates of the genotypic and phenotypic variances were used to calculate heritability (h2). The relationships between the mean ion contents of DH lines and their direct and indirect contributions to the variance of Salt Tolerance between DHs were investigated using correlation and path analyses (Dewey 1959). Path analysis is a straightforward extension of a multiple regression analysis and is used to get insight in the relationships between a set of interrelated dependent variates and a response variate. The output of path analysis is a set of path coefficients (p), i.e. standardized partial regression coefficients, which are measures of the direct contribution of each of the dependent variates to the variance of the response variate.
QTL analyses and molecular mapping
Residual distribution analysis of the mapping population was performed to ensure that data quality was sufficient for QTL analysis. For QTL analysis, we made use of the basic map of

Chapter 3 �����������������������������������������������������������������������������������������������������������������������������������������������������������������������������������������������������������������������������������������������������
38
Steptoe x Morex (Mather 1995), a high quality skeleton map with 223 markers. The average distance between two consecutive markers was approximately 2-5cM. The software program MapQTL 6.0 (Van Ooijen 2009) was used to perform QTL analysis. An analysis started with Interval Mapping (IM) to position putative QTLs. An initial set of markers located in the vicinity of the QTLs was selected and tested with the automatic cofactor selection option of MapQTL. The final set of cofactors, except for the ones on the linkage group that a QTL is associated with, for each trait was applied in Multiple-QTL model Mapping (restricted MQM) to locate QTLs. Permutation tests were used to determine the LOD thresholds for each trait in MQM (1,000 permutation tests at 0.05 confidence level). A LOD value of 2.8 was the minimum for claiming a QTL. Graphics were made using MapChart software (Voorrips 2002).
Results
Phenotyping of salt tolerance
Growth traits and concentrations of seven ions were measured in shoots and roots of 139 DH lines and the parents under control and salt stress conditions. The traits showed a continuous and more or less normal frequency distribution which points to quantitative inheritance. The salinity level of 200 mM NaCl (which equates to approximately 20 dS/m which is considered a moderate to high salt stress level for the salt tolerant crop barley) (Chapter 2) significantly affected shoot dry weight and root dry weight of the DH population (P<0.001) (Table 1). Average shoot dry weight of barley plants grown under salt and control conditions was 0.44 g and 1.13 g, respectively. Average root dry weight of plants was 0.05g under stressed and 0.11g under control conditions. Significant genetic variation for biomass production under both control and salt conditions within the population was observed (Table 1). Overall, Morex (more sensitive parent) growth traits were clearly less than the population mean under salt conditions, while Steptoe, the more tolerant parent, was higher than the population mean except for Shoot Fresh Weight under salt conditions.
Substantial variation was observed within the population for Salt Tolerance – defined as the ratio between dry weight shoot under stress conditions and dry weight shoot under non-stress conditions, expressed as percentage (P<0.001). Salt Tolerance values of the DH population ranged from 14.7 to 61.35%. Steptoe was more salt tolerant than Morex but both parents had a slightly lower value for Salt Tolerance than the population mean (30.83%). The variation observed for growth-related traits was moderately to highly heritable (h2 > 0.7), indicating that environmental or experimental variation was fairly mildly obscuring the genetic variation.

Identification of QTLs for ion homeostasis and salt tolerance
�����������������������������������������������������������������������������������������������������������������������������������������������������������������������������������������������������������������������������������������������������
39
Table 1. Means, ranges, standard deviations (SD) and heritability (h2) for growth parameters and Na+/K+ ratio of parent and DH lines under different treatments.
Trait Treatment
Parents DH lines Steptoe Morex Mean Max Min SD h2 Fpr
Shoot FW(g) C 10.14 9.64 9.77 18.11 1.26 3.10 0.91 *** S 1.90 1.62 2.08 4.08 0.81 0.70 0.92 *** Shoot DW(g) C 1.69 1.80 1.33 2.61 0.7 0.38 0.90 *** S 0.43 0.38 0.41 0.74 0.18 0.13 0.92 *** Root DW (g) C 0.11 0.09 0.11 0.21 0.01 0.04 0.88 *** S 0.05 0.04 0.05 0.11 0.04 0.02 0.91 *** Total DW (g) C 1.92 1.80 1.5 2.77 0.75 0.19 0.88 *** S 0.48 0.42 0.47 0.82 0.19 0.08 0.93 *** Salt Tolerance(%) S/C 25.44 21.11 30.83 61.35 14.7 9.88 0.70 *** Shoot Na+/K+ C 0.05 0.07 0.06 0.11 0.03 0.02 S 6.07 6.58 5.45 8.77 2.1 0.97 Root Na+/K+ C 0.13 0.13 0.14 0.44 0.07 0.05 S 3.94 3.34 4.4 6.89 2.25 0.95 Fresh weight (FW) and dry weight (DW) of shoot and root; and Salt Tolerance (ST) of Steptoe and Morex and DH lines were measured on four replicated samples grown under two treatments e.g. control (C) and salt stress (S). *** significant at P<0.001.
Under control conditions, the parents and the DH population mean showed the same trend in distribution over roots and shoots of the ions measured, i.e higher concentrations in the roots than in the shoot except for Cl- (Figs 1a and b). However, under salt stress conditions the distribution of most of the measured ions over shoots and roots was different for Steptoe and Morex. Morex had higher concentrations of Na+, K+, and Cl- ions than Steptoe in shoots, but lower ones in its roots. Steptoe had a lower Na+/K+ ratio than Morex in shoot, and a higher ratio in root. This may point to a shoot exclusion mechanism of Na+ and Cl- contributing to the higher salt tolerance of Steptoe. Both parents and the DH population accumulated more Cl- in shoots as compared to Na+ (Fig. 1b). The DH population displayed transgressive segregation for growth traits and most of the ion contents (Table 1). The differential distribution of ions, Cl- and Na+ in particular over different plant parts in the parents and DH lines suggest an involvement of Cl- and Na+ homeostasis in salt tolerance differences.
Correlation and path analyses
To understand more about the causal relationships between ion uptake, ion allocation and growth of DH population genotypes under normal and saline conditions, correlation and path analyses were performed. Significant correlations were found between a number of measured ion contents and ST (Table 2 and Fig. 2). Low shoot Cl- under stress conditions was correlated with increased ST (r=-0.32, P<0.001), as well as low shoot Na+ and K+ (r=-0.24, P<0.01; r=-0.24, P<0.05, respectively). Low shoot Cl- content under control conditions was correlated with control shoot dry weight (r=-0.43, P<0.001), which also may be the cause of the decrease in ST with low shoot Cl- (r=0.34, P<0.001). Possibly a Cl- content-regulating mechanism that already manifests itself under control conditions is linked to higher ST.

Chapter 3 �����������������������������������������������������������������������������������������������������������������������������������������������������������������������������������������������������������������������������������������������������
40
Figure 1. Ion contents in shoot (a) and in root (b) of Steptoe, Morex and the mean of the derived DH population. Ion contents were measured from pooled samples of four replications grown in two environments e.g. control (C) and salt stress (S). Shoot and root cation (Na+, K+, Mg2+ and Ca2+), anion (Cl-; PO4
3- and SO42-) and total ion content (sum of all studied cation and anion) ratio of Steptoe (St),
Morex (Mx) and DH population mean (c).
0
20
40
60
80
C S C S C S C S C S C S C S
Na_Sh K_Sh Mg_Sh Ca_Sh Cl_Sh PO4_Sh SO4_Sh
mg/
g D
WSteptoe
Morex
DH mean
a
0
20
40
60
C S C S C S C S C S C S C S
Na_R K_R Mg_R Ca_R Cl_R PO4_R SO4_R
mg/
g D
W
Steptoe
Morex
DH mean
b
0
0.5
1
1.5
2
St Mx DH St Mx DH
Control Salt stress
Shoot/root cation ratio
Shoot/root anion ratio
Shoot/root ion ratio
Ion
ratio
c

Identification of QTLs for ion homeostasis and salt tolerance
�����������������������������������������������������������������������������������������������������������������������������������������������������������������������������������������������������������������������������������������������������
41
Table 2. Correlation coefficients (r) of Salt Tolerance and ion contents in shoot and root of DH population grown for 3 weeks on hydroponics under saline (S) and control (C) conditions. Trait
Treatment Salt Tolerance
Shoot Na+ S -0.28** C 0.14
Root Na+ S -0.15 C 0.16
Shoot K+ S -0.24* C -0.15
Root K+ S -0.03 C -0.04
Shoot Cl- S -0.32*** C 0.34***
Root Cl- S -0.12 C 0.16
Shoot Mg2+ S 0.06 C 0.00
Root Mg2+ S -0.06 C 0.25**
Shoot Ca2+ S 0.10 C 0.02
Root Ca2+ S -0.04 C 0.27**
*; **; *** significant at P< 0.05; 0.01; 0.001 respectively.
The observed correlations suggest that the variation for ST in the DH population is partly determined by the genotypic differences of mainly the Cl-, Na+ and K+ contents in shoots and roots. Variation in these ion contents may affect ST in part directly and in part indirectly; a change in the concentration of one ion may be causal to the change in another ion, which then causes growth reduction. We used path analysis to estimate the magnitude and significance of causal relations between ion content differences and ST in the DH population. Path analysis is an extension of a multiple regression analysis and is used to get insight in the relationships between a set of interrelated dependent variates and a response variate. This may give us the specific ion content differences that are causal to Salt Tolerance, which may be putative breeding targets for the improvement of salt stress tolerance in barley. The output is schematically represented in Fig. 2, which also displays path coefficients (p) and highly significant (P<0.001) correlation coefficients (r).
According to the path analysis, all ion content traits in shoot and in root under control conditions showed similar but small effects on ST, indicating that there is hardly a predisposition in ion homeostasis before stress is perceived. Nevertheless, control shoot Cl- and K+ content values seemed to correlate with ST. Control shoot Cl- had a positive effect on ST while shoot K+ showed a negative effect with path coefficient values of 0.3 and -0.21, respectively, which again may indicate that genotypic differences in these ion contents in control conditions are indicative for differences in Salt Tolerance. Similar but smaller effects were found for control root Cl- and K+ contents (p= 0.16 and -0.12, respectively).

Chapter 3 �����������������������������������������������������������������������������������������������������������������������������������������������������������������������������������������������������������������������������������������������������
42
Figure 2. Diagram showing correlation and path coefficients of 7 ions in shoot (left) and root (right) with salt tolerance (ST). Double-arrowed lines indicate mutual association as measured by correlation coefficients (r) and the single-arrowed lines represent direct influences as measured by path coefficients (p).
Path analysis also showed that under saline conditions, shoot Cl- and Na+ content variation influenced Salt Tolerance differently even though these two ion content traits were highly positively correlated and had a similar correlation with Salt Tolerance (Fig. 2). The direct effect of shoot Na+ content on Salt Tolerance was positive, (p=0.32) while Na+ concentrations in root displayed a negative effect (p=-0.98). Cl- concentrations in shoot on the other hand had a strong negative impact on Salt Tolerance (p=-0.67) while root Cl- content correlated positively to Salt Tolerance (p=0.82). Under stress conditions, root K+ had no direct effect on Salt Tolerance while K+ in shoot shows an effect on Salt Tolerance (p= 0.24). These results point to regulation of Cl- transport and distribution as the driving force for Salt Tolerance in Steptoe and Morex.
QTL mapping
QTL analysis was performed to discover the chromosomal regions contributing to the variation observed in the population under study for growth, salt tolerance, ion contents and Na+/K+ content ratio in shoots and roots. Eleven QTLs were found, scattered over the barley genome with LOD scores ranging from 2.8 to 20 which individually explained between 5.36 and 49.6% of the genotypic variance of the corresponding traits (Tables 3, 4 and Fig. 3). Significant QTLs for ion contents, salt tolerance and growth under both conditions were found to co-localize on specific regions of chromosomes 2H and 3H.
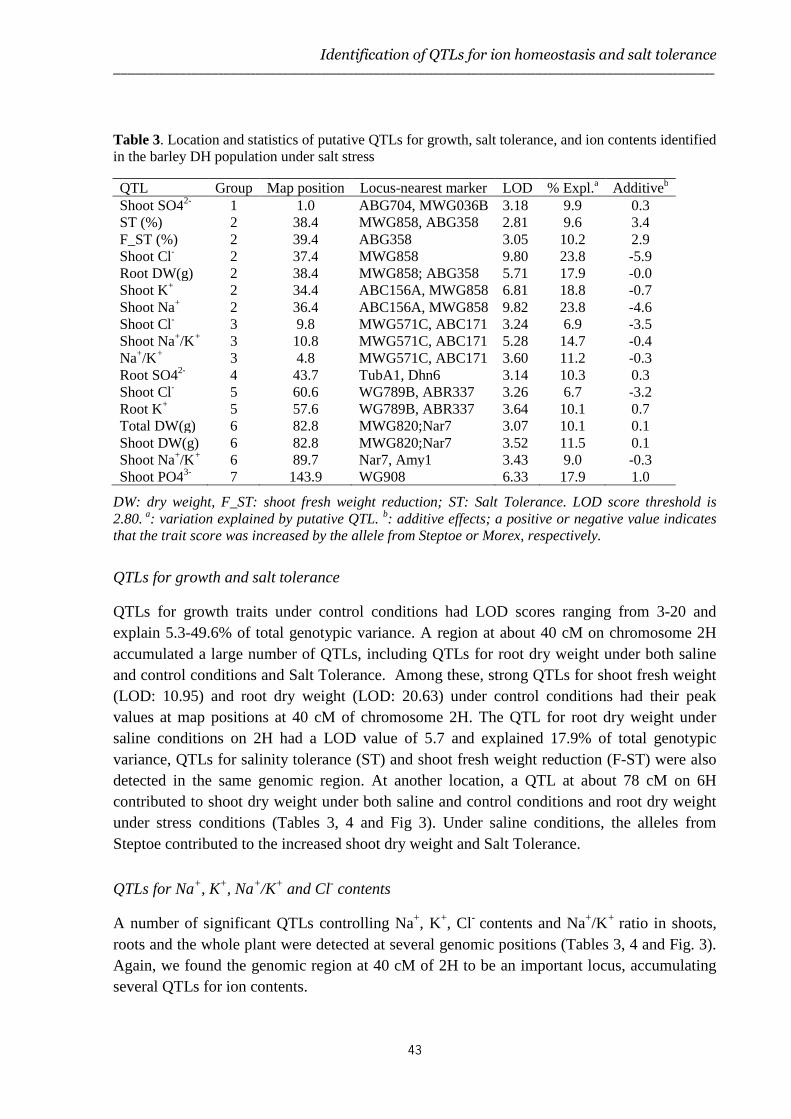
Identification of QTLs for ion homeostasis and salt tolerance
�����������������������������������������������������������������������������������������������������������������������������������������������������������������������������������������������������������������������������������������������������
43
Table 3. Location and statistics of putative QTLs for growth, salt tolerance, and ion contents identified in the barley DH population under salt stress
QTL Group Map position Locus-nearest marker LOD % Expl.a Additiveb
Shoot SO42- 1 1.0 ABG704, MWG036B 3.18 9.9 0.3 ST (%) 2 38.4 MWG858, ABG358 2.81 9.6 3.4 F_ST (%) 2 39.4 ABG358 3.05 10.2 2.9 Shoot Cl- 2 37.4 MWG858 9.80 23.8 -5.9 Root DW(g) 2 38.4 MWG858; ABG358 5.71 17.9 -0.0 Shoot K+ 2 34.4 ABC156A, MWG858 6.81 18.8 -0.7 Shoot Na+ 2 36.4 ABC156A, MWG858 9.82 23.8 -4.6 Shoot Cl- 3 9.8 MWG571C, ABC171 3.24 6.9 -3.5 Shoot Na+/K+ 3 10.8 MWG571C, ABC171 5.28 14.7 -0.4 Na+/K+ 3 4.8 MWG571C, ABC171 3.60 11.2 -0.3 Root SO42- 4 43.7 TubA1, Dhn6 3.14 10.3 0.3 Shoot Cl- 5 60.6 WG789B, ABR337 3.26 6.7 -3.2 Root K+ 5 57.6 WG789B, ABR337 3.64 10.1 0.7 Total DW(g) 6 82.8 MWG820;Nar7 3.07 10.1 0.1 Shoot DW(g) 6 82.8 MWG820;Nar7 3.52 11.5 0.1 Shoot Na+/K+ 6 89.7 Nar7, Amy1 3.43 9.0 -0.3 Shoot PO43- 7 143.9 WG908 6.33 17.9 1.0
DW: dry weight, F_ST: shoot fresh weight reduction; ST: Salt Tolerance. LOD score threshold is 2.80. a: variation explained by putative QTL. b: additive effects; a positive or negative value indicates that the trait score was increased by the allele from Steptoe or Morex, respectively.
QTLs for growth and salt tolerance
QTLs for growth traits under control conditions had LOD scores ranging from 3-20 and explain 5.3-49.6% of total genotypic variance. A region at about 40 cM on chromosome 2H accumulated a large number of QTLs, including QTLs for root dry weight under both saline and control conditions and Salt Tolerance. Among these, strong QTLs for shoot fresh weight (LOD: 10.95) and root dry weight (LOD: 20.63) under control conditions had their peak values at map positions at 40 cM of chromosome 2H. The QTL for root dry weight under saline conditions on 2H had a LOD value of 5.7 and explained 17.9% of total genotypic variance, QTLs for salinity tolerance (ST) and shoot fresh weight reduction (F-ST) were also detected in the same genomic region. At another location, a QTL at about 78 cM on 6H contributed to shoot dry weight under both saline and control conditions and root dry weight under stress conditions (Tables 3, 4 and Fig 3). Under saline conditions, the alleles from Steptoe contributed to the increased shoot dry weight and Salt Tolerance.
QTLs for Na+, K+, Na+/K+ and Cl- contents
A number of significant QTLs controlling Na+, K+, Cl- contents and Na+/K+ ratio in shoots, roots and the whole plant were detected at several genomic positions (Tables 3, 4 and Fig. 3). Again, we found the genomic region at 40 cM of 2H to be an important locus, accumulating several QTLs for ion contents.

Chapter 3 �����������������������������������������������������������������������������������������������������������������������������������������������������������������������������������������������������������������������������������������������������
44
Table 4. Location and statistics of putative QTLs for growth, salt tolerance, and ion contents identified in the barley DH population under control conditions. QTL Group Map position Locus/nearest marker LOD % Expl.a Additiveb Root SO42- 1 141.8 MWG635B 3.09 8.2 0.8 Shoot DW(g) 1 142.9 PSR106B 4.07 11.3 -0.1 DW (g) 1 142.9 PSR106B 3.77 10.2 -0.1 Shoot FW(g) 1 142.9 PSR106B 3.74 8.3 -0.9 Root Ca2+ 2 39.4 MWG858; ABG358 4.18 14.0 1.2 Shoot Ca2+ 2 31.4 ABC156A 7.23 13.7 -0.6 Root Cl- 2 37.4 MWG858 3.75 11.9 0.5 Shoot Cl- 2 37.4 MWG858 3.56 9.1 0.3 Root DW (g) 2 38.4 MWG858; ABG358 20.63 49.6 -0.0 DW (g) 2 40.3 ABG358 4.03 11.1 -0.1 Shoot FW(g) 2 40.3 ABG358 10.95 28.0 -1.6 Shoot K+ 2 35.4 ABC156A, MWG858 13.50 37.8 -4.1 Shoot Mg2+ 2 31.4 ABC156A 8.39 22.2 -0.2 Shoot Na+/K+ 2 38.4 MWG858, ABG358 3.79 12.0 0.0 Na+/K+ 2 40.3 ABG358 5.45 17.6 0.0 Root SO42- 2 33.4 ABC156A, MWG858 4.84 13.2 1.0 Shoot Ca2+ 3 5.8 MWG571C, ABC171 15.60 34.5 -1.1 Root DW (g) 3 0.0 ABA307B 4.25 7.4 -0.0 Root K+ 3 128.6 mPub 3.56 11.4 -2.3 Shoot Mg2+ 3 5.8 MWG571C, ABC171 6.89 17.5 -0.2 Shoot SO42- 5 0.0 MWG835A 4.09 12.9 -0.3 Root DW (g) 6 72.6 ksuD17;ABC175 3.36 5.3 0.0 Shoot DW(g) 6 78.8 MWG820;Nar7 3.13 8.5 0.1 Total DW(g) 6 78.8 MWG820;Nar7 3.16 8.4 0.1 Shoot Cl- 7 76.4 ABC302 8.45 23.6 -0.5
DW: dry weight, F_ST: shoot fresh weight reduction; ST: Salt Tolerance. LOD score threshold is 2.80. a: variation explained by putative QTL; b: additive effects; a positive or negative value indicates that the trait score was increased by the allele from Steptoe or Morex, respectively.
A QTL controlling shoot Na+ content mapped on chromosome 2H under stressed conditions with a high LOD value (9.82) and explaining 23% of total genotypic variance for this trait. The Steptoe-derived allele is associated with low Na+ content.
Two QTLs influencing shoot K+ content under both control and stress conditions were detected in the same region of 2H. These QTLs had strong effects on K+ content in shoots with LOD values of 13.5 and 6.8, respectively. Total genotypic variance for K+ content explained by these two QTLs was 37.8% and 18.8%, respectively. Steptoe donated the alleles for low K+ content. Two QTLs controlling Na+/K+ ratio in shoot and in the whole plant under control conditions were localized on Chr. 2H with LOD score 3.8 and 5.5 respectively. These two QTLs explained 12% and 17.6% of total genotypic variance for this trait, respectively.

Identification of QTLs for ion homeostasis and salt tolerance
�����������������������������������������������������������������������������������������������������������������������������������������������������������������������������������������������������������������������������������������������������
45
Under salinity stress conditions, two QTLs influencing Na+/K+ were found on chromosome 2H and the Steptoe alleles are associated with low values for Na+/K+. The chromosomal region at 40 cM of 2H also was found to control Cl- content under both control and saline conditions. The strongest QTL controlling Cl- concentration under saline conditions (LOD: 9.8 on 2H) accounted for 23.8% of the total genotypic variance.
In addition, QTLs for ion contents were found on chromosomes 3H, 5H and 7H. Under control conditions shoot Na+/K+ and Cl- contents were influenced by a QTL on Chr. 3H. QTLs for root K+ and shoot Cl- contents under saline conditions were identified on Chr. 5H. Under stressed conditions, a QTL affecting shoot Na+/K+ was found on Chr. 6H (LOD score 5.3). A strong QTL affecting Cl- concentration under control conditions was mapped on 7H (LOD: 8.45) and explained 23% of the total genotypic variance. Alleles associated with low Cl- concentrations in shoot contribute to growth under saline conditions came from Steptoe.
QTLs for other ion contents
QTLs influencing Mg2+, Ca2+ and SO42- contents were only detected for plants grown under
control conditions (Table 4 and Fig. 3b). Four QTLs controlling Mg2+, Ca2+ contents in shoot co-localized on the QTL hotspots on chromosomes 2H and 3H. In roots we detected only one QTL for root Ca2+ which was located on Chr. 2H (Table 4). Under stress conditions, only a single QTL on Chr. 4H was found for SO4
2- concentration in shoot under stress conditions, and a QTL for PO4
3- content was detected on 7H with a LOD score of 6.3. The allele for this QTL associated with low PO4
3- concentrations in shoot under salt stress came from Steptoe.

Identification of QTLs for ion homeostasis and salt tolerance
�����������������������������������������������������������������������������������������������������������������������������������������������������������������������������������������������������������������������������������������������������
46
.
Figure 3. Location of QTLs on the Steptoe x Morex skeleton map. The number on the left side is the genetic distance in centiMorgans (cM), marker names are given on the right side. QTLs are shown at the right side in vertical bars with trait names: Salt Tolerance (ST), shoot fresh weight reduction (F-ST), concentration and ratio of ions in roots (R) and shoots (Sh) and total dry weight (DW) of barley lines grown for 3 weeks either on nutrient solution with 200 mM NaCl (a) or under control conditions (b). LOD score threshold is 2.8.
a
b

Identification of QTLs for ion homeostasis and salt tolerance
�����������������������������������������������������������������������������������������������������������������������������������������������������������������������������������������������������������������������������������������������������
47
Discussion
Unravelling the mechanisms underlying salt tolerance in higher plants is a challenging task for plant scientists worldwide. We evaluated the segregating DH population derived from two well-known barley cultivars, Steptoe and Morex, on a hydroponics system under control and saline conditions to better understand the genetics of the mechanisms contributing to salt tolerance, in particular the concentrations of major ions in roots and shoots. The DH population is widely used in quantitative genetic studies as it segregates for important agronomical traits like malting quality, and for performance under both biotic and abiotic stress conditions (Mano et al. 1996; Kaneko et al. 2001; Han et al. 2003; Choi and Close 2000; Siahsar and Narouei 2010). Steptoe, Morex and the derived DH population have been deployed previously for salt tolerance studies (Mano and Takeda, 1997). A subset of the population (72 lines out of 150 DH lines) was used to map physiological traits under salinity stresses (Siahsar and Narouei, 2010). Morex was used to study gene expression under salt stress (Walia et al, 2006) and Steptoe and Morex were used as contrasting genotypes to study the salt stress-induced changes in the root proteome (Witzel et al, 2009). In our study Steptoe contributed alleles and major traits that were associated with salt tolerance such as biomass production under stress conditions, and decreased Cl- content and Na+/K+ ratio (Tables 3 and 4). The better performance of Steptoe compared to Morex under salt stress is in agreement with the findings of Mano and Takeda (1997). Witzel et al (2009) on the other hand reported that Morex was more salt tolerant than Steptoe at very early seedling stage. However, these studies assessed salt tolerance using criteria that differ from the ones used in this study. Mano and Takeda (1997) used leaf injury symptoms as criterion for salt tolerance. Witzel and colleagues used the delay in appearance of leaves 2 and 3 of young barley seedlings. We assessed salt tolerance according to the definition of Munns et al (2002) and used the biomass production under saline relative to production under non-saline conditions after three weeks cultivation on hydroponics as criterion. This relatively long time interval allows salt stress symptoms to build up over different stress phases (osmotic and cytotoxic phase Munns and Tester (2008) and to find associations with traits that influence salt tolerance. The genotypic differences in biomass production under different growing conditions between the two parents and their derived DH population were associated with the variation in contents of some ions in shoots and roots (Table 1 and Fig. 1). The differences in cation, anion and total ion contents in roots, shoots and the differences in root/shoot ion ratios imply that the parents differ in genetic constitution for mechanisms controlling ion homeostasis that contribute to salt tolerance.
QTL-rich region on chromosome 2H
Plant tissue Na+ and/or K+ contents and their ratio have been implicated for a long time in salt tolerance. We identified in the Steptoe x Morex DH population on chromosome 2H a chromosomal region controlling Salt Tolerance, shoot Na+ content under salt stress and shoot K+ content under both stress and control conditions. QTLs controlling Na+/K+ ratio were also found on chromosome 2H and 3H but they had smaller effects. QTLs controlling Na+, K+ and

Chapter 3 �����������������������������������������������������������������������������������������������������������������������������������������������������������������������������������������������������������������������������������������������������
48
Na+/K+ that contributed to salt tolerance were reported in rice (Koyama et al. 2001; Lin et al. 2004) and wheat (Dubcovsky et al. 1996; Genc et al. 2010a). The strong QTLs for Na+ content under salt stress conditions which may suggest the presence of one or more genes for regulation of Na+ uptake, transport and/or exclusion in the QTL region on chromosome 2H. In bread wheat QTLs for Na+ were identified on different chromosomes compared to QTLs for K+ (Genc et al. 2010). In our study QTLs for shoot K+ content were co-localized on chromosome 2H with a QTL for salt-stressed shoot Na+ content. This suggests the interdependency between these two ions. On the other hand, it may also indicate that in wheat and barley different mechanisms operate in salt stress-induced Na+ and K+ regulation, which may underlie the differences in salt tolerance mechanisms between wheat and barley. For instance, barley in general displays a higher Na+ compartmentalization and exclusion capacity (Munns and Tester, 2008). The co-localisation of QTLs for K+ content under both control and stress conditions on Chr. 2H with QTLs for contents of Na+, Cl- ions as well as Salt Tolerance (Fig. 3) suggests that at least some genes underlying these traits are constitutively expressed and are not salinity stress-induced.
The co-localization on chromosome 2H of QTLs for Na+ and K+ under stress conditions may be due to one or more genes regulating the Na+ and/or K+ transport such as vacuolar NHX antiporter genes which sequester Na+ in vacuoles to maintain a low Na+/K+ ratio in the cytosol, or genes operating in the SOS pathway such as plasma membrane Na+/H+ antiporters. The activity of these antiport transportation systems was found to be driven by vacuolar proton pumps (H+-ATPase and H+-pyrophosphatase) (Silva and Geros 2009). Genes belonging to the HKT1 family, which function as specific Na+ transporters or in Na+ and K+ co-transport (review of Hauser and Horie, 2010) may also be candidates for these QTLs. HKT is an important gene controlling cellular Na+ and K+ homeostasis.
The traits for which QTLs clustered on chromosome 2H in our study resemble the physiological functions of SNC7 (QTL for shoot Na+ concentration) and SKC1 (QTL for shoot K+ concentration) (Lin et al. 2004) which control rice seedling shoot Na+/K+ ratio under salt stress. The SKC1 gene was later found to encode a member of HKT-type transporters (Ren et al. 2005). However, it is unlikely that the SKC1 gene underlies the QTL effect, as the rice SKC1 gene is located on rice chrosomome 1 which does not share syntenic regions with the barley 2H chromosome (Close et al, 2009). In durum wheat, Linsay et al. (2004) mapped the Na+ exclusion locus Nax1 for low Na+ leaf blade on the long arm of chromosome 2A as one of the two major loci for this trait. Nax genes were found to restrict Na+ transportation from roots to the shoots and enhance the Na+/K+ ratio in the leaf blade (James et al. 2006). Nax2 was proposed by Byrt et al (2007) to have the same function as the Kna1 gene in wheat (Dubcovsky et al. 1996). Many HKT gene family members were found strongly associated with Nax1, Nax2 and Kna1 including HKT7 in durum wheat (Huang et al. 2006). Genes similar to HKT 1;4 genes were mapped to the wheat–barley chromosome groups 2 (Huang et al. 2008), indicating that some HKT genes may be located in our 2H QTL region. Both Nax

Identification of QTLs for ion homeostasis and salt tolerance
�����������������������������������������������������������������������������������������������������������������������������������������������������������������������������������������������������������������������������������������������������
49
loci were also strongly associated with cation transporter HKT1; 5 in wheat (Byrt et al. 2007), and were shown to reduce Na+ transport to leaves in bread wheat (James et al. 2011).
In barley, genetic analysis for salt tolerance was mainly performed at seedling or vegetative growing stages (Mano and Takeda 1997; Ellis et la. 2002; Shavrukov et al. 2010; Rivandi et al. 2010; Zhou et al. 2012) similarly with the current study. Very limited study has been conducted under maturing stage (Xue et al. 2009). Xue et al. (2009) identified QTLs for Na+ uptake and K+/Na+ ratio at plant maturity in a screening study with a barley DH population derived from CM72 x Gairdner in salt treated soil. These QTLs mapped on chromosome 2H but there was not sufficient information to conclude that the QTLs are in the same region as in this study. The co-localization of our 2H QTL with other QTLs for salt tolerance (leaf injury scoring) (Zhou et al. 2012) and shoot dry weight (Ellis et la. 2002) under saline conditions clearly suggest a gene(s) controlling ion homeostasis associate with salt tolerance of barley at vegetative growing stage. QTLs/genes for Na+ or K+ transportation identified at seedling stages in wheat such as Nax1 and Nax2 (Lindsay et al. 2004) or SKC1 in rice (Lin et al. 2004) have been shown to associate with salt tolerance at maturing stage as well (James et al. 2011; Ren et al. 2005). Recently Munns and colleagues have sucessfully used the Nax2 locus from Triticum monococcum to produce salt tolerant durum wheat which is significantly increased in salt tolerance and yield on saline soil, and they have shown that the responsible gene is HKT1;5 (Munns et al, 2012). The co-localization of strong QTLs for K+ and Na+ with Salt Tolerance in this study suggests that the chromosomal region on Chr. 2H of Steptoe may be a promising target for salt tolerance breeding programs using marker-aided selection. Effect of Cl- on Salt Tolerance
Previous studies focused only on Na+ and/or K+, and Na+/K+ ratios. Our results show that other ion concentrations are relevant for salt tolerance as well. We have assessed shoot and root cation (Na+, K+, Mg2+ and Ca2+) and anion (Cl-, PO4
3- and SO42-) contents that are the
main constituent ions of total soluble salts present in soils (Tavakkoli et al. 2011). Correlation analysis (Table 2) showed that increased Salt Tolerance was not only associated with decreased shoot Na+ content; an even stronger correlation was detected with Cl- content under stress conditions. Path analysis was used to partition correlation analysis and revealed direct and indirect negative effects of shoot Cl- and Na+ contents under stress conditions on Salt Tolerance. Path analysis is widely used to investigate the relationships between yield and other contributing components in cereals (Hui et al. 2008). Several recent studies have used path analysis for instance to evaluate the interrelationship of yield variation and yield components under different water regimes in durum wheat (Garcia de Moral 2005 ) and to assist phenotypic selection in wild barley under different water regimes (Volis et al. 2004) and nitrogen deficiency (Verhoeven et al. 2004). In our study, path analysis of Salt Tolerance using ion contents in shoots of plants grown under salt stress showed a striking difference in effect between Cl- and Na+ contents (Fig. 2), indicating Cl- to have a stronger effect on Salt Tolerance and possibly be more toxic even though the correlations of both traits with Salt

Chapter 3 �����������������������������������������������������������������������������������������������������������������������������������������������������������������������������������������������������������������������������������������������������
50
Tolerance were fairly similar. As Cl- is the most dominant anion in saline soil, plants accumulate high levels of Cl- in the leaves when grown under saline conditions. A lot of studies, amongst others in rice and wheat, support the importance of Na+ as this ion is highly correlated with salt tolerance. However, other studies demonstrated that handling of Cl- might be very important for salt tolerance in some other crops including Hordeum (Teakle and Tyerman, 2010; Tavakkoli et al. 2010). The relatively small direct effect of Na+ on Salt Tolerance may be explained by the excellent ability of barley to sequester Na+ in vacuoles and therefore decrease Na+ toxicity (James et al, 2006b). Oddly enough, the shoot Cl- content observed under control conditions showed a very strong positive correlation with Salt Tolerance and a negative correlation with shoot Cl- content under stress condition. This implies that already at control conditions a genetic factor determining Cl- content is operating that positively affects salinity tolerance, although the allelic differences are much smaller than under salinity stress (compare Tables 3 and 4, additive effects). Our results in fact indicate that Cl- content under control conditions may be informative in relation to salt tolerance. The finding of the strong QTL for Cl- content under control conditions suggests that a major gene expressed only under non-saline conditions may be located on chromosome 7H. In soybean, Abel (1969) suggested a single gene controlling Cl- loading in the plant shoots. Whether the effect of this QTL is functionally related to the strong effect of shoot Cl- under saline conditions is not clear, although several strong QTLs controlling shoot and root Cl- were detected on different chromosomes and shoot Cl- content QTLs for salt stress and control conditions co-localized on chromosome 2H (Fig. 3). The clustering or co-localization of Cl- and Na+ QTLs on chromosome 2H in our study supports the finding of Tavakkoli et al. (2011) that under saline conditions, high Na+ and Cl- might create cumulative adverse effects on salt-stressed barley plants. The relatively high concentration of Cl- compared to that of Na+ in the shoot under both stress and non-stress conditions and the relatively low concentration of Cl- in the root under control conditions (Figs. 1a and b) might indicate that independent mechanisms are controlling the transport of these two ions.
There is not much known about mechanisms or genes that control Cl- transport. The genes underlying the QTLs for Cl- content may include transporters having either direct or indirect effects on Cl- exclusion or control of a Chloride channel (CLC) gene family was found to control Cl-/H+ antiporters and Cl- transport. Another gene controls Cl- loading/uploading at the xylem/symplast boundary (CCC) and functions as a co-transporter of Na+:K+:2Cl-(review of Teakle and Tyerman 2010). Several recent papers have indicated that Cl- uptake and transport mechanisms may be implicated in salinity tolerance (White and Broadley 2001; Tavakkoli et al. 2010), but its genetic control still is unknown. Our study identified QTLs for shoot Cl- under stress conditions on chromosome 2H that contribute significantly to salt tolerance. Our results therefore suggest that as in bean, lotus, citrus, grapevine, avocado and other woody crops (review of Teakle and Tyerman, 2010) Cl- plays an important role in barley salt tolerance and both Na+ and Cl- uptake and transportation mechanisms operating in different plant parts of barley can contribute to salinity tolerance.

Identification of QTLs for ion homeostasis and salt tolerance
�����������������������������������������������������������������������������������������������������������������������������������������������������������������������������������������������������������������������������������������������������
51
QTLs for Mg2+and Ca2+ contents
Some important QTLs are found in both conditions, such as QTLs for root dry weight, shoot and root K+, Cl-, total Na+/K+ ratio and root SO4
2- contents. Other QTLs were only detected either in control conditions, such as QTLs for shoot Mg2+ and Ca2+, or in saline conditions, like the QTL for shoot Na+. QTLs for traits detected in both or only one environment provide information of the constitutive or non-constitutive expression of the gene-related traits (Genc et al. 2010a). Ca2+ and Mg2+ content were always highly correlated with each other in both stress and non-stress conditions (Fig. 3). However, path analysis did not reveal strong effects of these two ion contents on Salt Tolerance. The impact of Mg2+ has until now not been studied in relation to salt tolerance in higher plants, but Ca2+ is known to activate salt stress signalling that controls ion homeostasis and tolerance (Liu and Zhu 1998). In addition, supplemental Ca2+ enhances K+/Na+ selective intracellular accumulation helping plants to cope with higher Na+ concentrations under stress conditions. Munns and Tester (2008) and Genc et al. (2010b) pointed out that supplemental Ca2+ in the hydroponics media is necessary to discriminate between the effect of Na+ and Ca2+ deficiency induced by high concentrations of Na+. As shown in Chapter 2, we did not use extra Ca2+ to give the plants experimental growing conditions that mimic growing conditions met in soil as much as possible. Ca2+ contents of the root were not affected in salt stress conditions, but shoot Ca2+ content was significantly decreased. However, this decrease in shoot Ca2+ content did not appear to have a negative effect on shoot growth and salt tolerance. This indicates that in our experiments, the decrease in shoot Ca2+ content is not strong enough to induce Ca2+ deficiency with negative effects on growth, and that the effects detected on Salinity Tolerance and Na+, K+, or Cl- were not influenced by a genetic factor for Na+-induced Ca2+ deficiency. Conclusions
QTL mapping has proven itself as a standard procedure for dissecting the genetic control of various quantitative traits (Salvi and Tuberosa 2005). The most prominent QTLs found in our study agreed with our correlation and path analysis results in which we found shoot Cl- and Na+ under salt stress to be strong determinants for salt tolerance. Co-localization of several strong QTLs detected at both salt concentrations for ion contents and growth at specific regions of chromosomes 2H and 3H and path analysis results indicate clear and causal relationships between ion homeostasis and salt tolerance. The interdependency between ion content traits suggests that genes underlying the QTLs may control multiple ion transport mechanisms and affect ion homeostasis, like for instance ion channel and proton pump activities which may be the drivers for specific sym- and antiporter activities. The genomic regions that harbour strong QTLs for salt tolerance and ion contents on chromosome 2H and 3H in our study can be used for targeting candidate genes controlling ion homeostasis and salt tolerance. Exploration of Salt Tolerance and association mapping in a large set of barley lines representing more genetic variation for traits contributing to salt tolerance might confirm the importance of the traits and QTLs in this study for barley salt tolerance.


CHAPTER 4
Characterization of QTL regions on barley chromosomes 2H and 3H conferring differences in salt tolerance observed between cvs Steptoe and Morex
Nguyen Viet Long1,2, Vincent L.A. Kock2, Nguyen Hoang Han2, Oene Dolstra2, Richard G. F. Visser2, C. Gerard van der Linden2
1 Graduate School Experimental Plant Sciences, Wageningen University, PO Box 386, 6700 AJ Wageningen, The Netherlands.
2 Wageningen UR Plant Breeding, Wageningen University and Research Centre, PO Box 386, 6700 AJ Wageningen, The Netherlands
To be submitted

Chapter 4 �����������������������������������������������������������������������������������������������������������������������������������������������������������������������������������������������������������������������������������������������������
54
Abstract
The differences between the barley cultivars Steptoe and Morex in salt tolerance and related traits were found to be controlled by several QTLs. Here we focused on the fine-mapping of the QTL regions on chromosomes 2H and 3H, spanning about 13cM and 30cM, respectively. The regions harbour clusters of QTLs for traits like biomass under saline conditions and ion homeostasis traits including Na+, Cl-, K+ and Ca2+ contents. The objectives of this study are to verify the effects of the QTLs and to narrow down the QTL intervals to facilitate marker-assisted breeding and map-based cloning. To this end, two separate salt tolerance evaluations were performed on hydroponics, using lines recombinant in either the QTL regions on 2H or 3H. Additional molecular markers located in the QTL regions under study were used to support the fine-mapping of QTLs. In this way the QTLs on 2H for shoot K+ content and plant height were verified and mapped to a region spanning 2.2 cM. Steptoe contributed the QTL allele associated with the increased plant height. Morex contributed the QTL allele associated with a higher K+ content in shoots. For the 3H region, QTLs were verified, but also new QTLs were found. The QTLs for Ca2+ content in young and old leaf tissues and the QTL for K+ content in stem tissue from salt-stressed plants were mapped to an interval spanning 0.89 cM. We suggest the members of Na+ and K+ co-transporter HKT genes, NHX and CAX genes as candidates underlying these QTLs.
Keywords: fine-mapping; QTL; salt tolerance; ion homeostasis; barley
Introduction
Barley globally is the fourth arable crop based on area under cultivation (Schulte et al. 2009). It is the most salt-tolerant field crop (Maas and Hoffman 1977). Despite this favourable characteristic its growth is still considerably affected by salt stress (Azadgoleh and Yasari 2007). One of the ways to overcome the limitation of crop productivity on salinized soils is to breed new salt-tolerant cereal varieties (Munns et al. 2012).
It’s well known that salinity tolerance is a genetically and physiologically complex trait, controlled by polygenes, each having a relatively small quantitative contribution to the phenotypic variation (Flowers et al. 2004; Roy et al. 2011). Since a few decades such genes are indirectly mapped with the aid of molecular markers through QTL mapping (Kaersay 1998; Collard et al. 2008). The detection of QTLs underlying traits of agronomical importance has greatly increased our understanding of genetic complexity of abiotic stress tolerance (Salvi and Tuberosa 2005; Collin et al. 2008). However, the implementation of the knowledge on QTLs in plant breeding, for instance through pyramiding of favourable QTL alleles, map-based cloning, introgression of QTLs into commercial cultivars or marker-assisted selection is still a challenging task (Holland 2007; Bernardo 2008; Collins et al. 2008). The inaccuracy of mapped QTLs is the major reason that only a small proportion of polygenes controlling the variation for traits of interest has been identified and used (Mackay et al. 2009). QTLs are typically localized on chromosomes within map intervals spanning 10-30 cM; intervals that may harbour several hundreds of genes which limits the chances of finding the actual genes of interest (Salvi and Tuberosa et al. 2005; Ingvarsson and Street 2011).

Characterization of QTL regions on 2H and 3H �����������������������������������������������������������������������������������������������������������������������������������������������������������������������������������������������������������������������������������������������������
55
In barley, several QTL mapping studies have been performed to identify genes contributing to genetic variation in salt tolerance. This resulted in the detection of QTLs for salinity tolerance at germination (Mano and Takeda. 1997), the seedling stage and the vegetative growing stage under hydroponics (Mano and Takeda 1997; Ellis et al. 2002a; Shavrukov et al. 2010 and Nguyen et al. 2012) and at the maturity stage in soil in pots (Xue et al. 2009). Only few QTLs in barley have been fine-mapped and narrowed down to a few candidate genes. Shavrukov et al. (2010) and Rivandi et al. (2011) detected and fine-mapped two important loci: HvNax3 on chromosome 7H and HvNax4 on chromosome 1H. These two loci are associated with Na+ exclusion in barley. Candidate genes such as a vacuolar H+-pyrophosphates gene (NHX Na+/H+ anti-porter) are associated with the Salt overly sensitive (SOS) pathways (Liu and Zhu 1998) have been suggested for HvNax3 (Shavrukov et al. 2010). Another gene that is homologous with SOS3 (HvCLB4) was suggested as a candidate for HvNax4 (Rivandi et al. 2010). No QTL for growth or salt tolerance was detected at the HvNax3 and HvNax4 locations (Shavrukov et al. 2010; Rivandi et al. 2010).
The basis for the current study is described in Chapter 3 (Nguyen et al, 2012) in which the genetic variation in response to salt stress in a doubled haploid (DH) mapping population derived from the cultivars Steptoe and Morex (Kleinhofs et al. 1993) was studied. The study was carried out on hydroponics and resulted in the detection of highly significant differences among DH lines for various salinity-related traits. The variation was in part controlled by QTLs for traits such as biomass growth, ion contents of Na+, K+, Ca2+, and Cl-, and the Na+/K+ ratio in shoot and root tissues (Nguyen et al. 2012). A striking clustering of QTLs on 2H and 3H was observed, suggesting that in these chromosomal regions genes are located that play important roles in a number of traits. A total of 18 strong QTLs (LOD score up to 20) were mapped on chromosome 2H in a region spanning 13.2 cM. This region (the so-called 2H QTL region) contains QTLs for salt tolerance, root dry weight, shoot fresh weight, and QTLs for ion content in shoots of important cations and anions related to salt tolerance (K+, Mg2+, Ca2+, Na+ and Cl- contents). The region of chromosome 3H also showed clustering of QTLs. This region spanning about 30 cM is referred to as the 3H QTL region and contains QTLs for shoot Ca2+, Mg2+, Cl- contents and shoot Na+/K+ ratio (Nguyen et al. 2012).
The 2H and 3H QTL regions harbour genes that strongly contribute to the difference in salt tolerance between cultivars Steptoe and Morex. We separately evaluated recombinants in the 2H QTL region and in the 3H QTL region, and the parental genotypes Steptoe and Morex were also included. The evaluations were carried out on hydroponics with the aim to verify the presence of QTLs in both regions and a further characterization of the QTLs, paving the way for cloning of genes affecting salt tolerance as well as for marker-assisted breeding.

Chapter 4 �����������������������������������������������������������������������������������������������������������������������������������������������������������������������������������������������������������������������������������������������������
56
Materials and methods
Molecular maps of the 2H and 3H QTL regions
Markers located on the integrated barley map of (Aghnoum et al. 2010) close to or within the 2H or 3H QTL regions under study were used to increase the marker density in these regions. The 2H QTL region is delimited by the markers ABC156A and ABG 459 and the 3H QTL region by the markers ABA307B and ABG471 (Chapter 3). Extra markers were added to the skeleton map based on the Steptoe x Morex DH population (Mather 1995) as used by Nguyen et al. (2012). JoinMap® 3.0 (Van Ooijen and Voorrips 2001) was subsequently used to generate linkage maps for both QTL regions.
DH lines used for fine-mapping
The lines used in the two fine-mapping studies are summarized in Table 1. In each experiment the performance of 22 DH lines selected out of the Steptoe x Morex DH population plus the parents of the mapping population were studied. The selection of lines was made with help of the software program GGT 2.0 (van Berloo 1999) using the molecular map of either the 2H or 3H QTL region. The target was the identification of lines having a recombination in the 2H QTL region or 3H QTL region (S/M haplotype) and the establishment of the site of recombination within recombinant haplotypes.
Testing on hydroponics
The sets of genotypes mentioned in Table 1 were evaluated for salinity tolerance in separate greenhouse experiments on hydroponics similar to the screening of the Steptoe x Morex population (Chapter 3). Seeds of the lines received a heat treatment at 37oC for 24 hours prior to the experiments to improve germination. The seeds were then germinated in silver sand for seven days. Seedlings were then transferred to the hydroponics system. The basic elements of the system were containers holding 20 L nutrient solution; each having 24 positions for plants. One unit of the system contained 16 containers linked in parallel with large reservoirs and a pump for the circulation of the nutrient solution. After transfer to the system the plants were allowed to adjust for seven days prior to the application of the salt stress treatments as described in Chapters 2 and 3.The layout of Experiments 1 (2H QTL region) and 2 (3H QTL region) was similar with a randomized block design and single plants as experimental units. Each container represented a block. The treatment levels were 0 and 200 mM of NaCl. The number of replicates per genotype/treatment combination was 12 in the studies concerning the 2H QTL region (Experiment 1) and 4 in those concerning the 3H QTL region (Experiment 2), respectively.

Characterization of QTL regions on 2H and 3H �����������������������������������������������������������������������������������������������������������������������������������������������������������������������������������������������������������������������������������������������������
57
Table 1. Composition of the sets of lines used in the fine-mapping studies
Haplotype
Number of lines
2H QTL region 3H QTL region
Recombinant lines S/M 15 22
Non-recombinant lines S 3 0 M 4 0
Steptoe S 1 1 Morex M 1 1 S/M: recombinant haplotype for the QTL region; S: Steptoe haplotype for the QTL region; M: Morex haplotype for the QTL region
Assessment of plants
A variety of plant data were collected during the experiments with respect to physiological, morphological, and plant growth characteristics as well as the content of various ions in root and shoot dry matter. Before harvest, data were collected with respect to plant height, root length and tiller number for all plants grown under control and saline conditions. Upon harvest the plants were separated in roots and shoots. The latter fraction was subsequently separated in Experiments 1 and 2 in two or three sub-fractions, respectively. The shoot fractions of the first experiment consisted of lower (old) and upper (young) parts of all shoot tillers of plants. The upper part contained all plant biomass above the three oldest leaves of the tillers. In Experiment 2 the shoots were split upon harvest in stems, old and young leaves. The young leaves of a plant comprised the upper three leaves from the main tiller and the two youngest leaves from younger tillers. The remaining leaves formed the fraction with old leaves. The various plant fractions were dried in a ventilated oven at 70°C for at least 72 hours prior to weighing to get dry weight data. After collecting the dry matter figures, the dry samples of the various plant fractions were used for ion analyses as described in Chapters 2. Prior to ion analysis the number of samples to be analysed was reduced by pooling per combination of genotype, plant fraction, and stress treatment. Pools comprised samples from 4 plants in Experiment 1 (4 pools per genotype) and samples from 2 plants in Experiment 2 (2 pools per genotype).
Statistical analyses
Analyses of variance were done per salt treatment level for all traits for which data were collected in the Experiments 1 and 2 with the software package Genstat (13th edition). After fine-mapping and deduction of the origin of QTL alleles in the 2H or 3H QTL regions of the lines with a recombinant haplotype, the classification, i.e. S (Steptoe) or M (Morex) was used to test differences between both classes of genotypes with help of analyses of variance between genotypic means for each trait treatment combination and two-sided t-tests with 22 degrees of freedom.

Chapter 4 �����������������������������������������������������������������������������������������������������������������������������������������������������������������������������������������������������������������������������������������������������
58
Graphical fine mapping
The performance of each of the genotypes with a recombinant haplotype (S/M) of the 2H QTL region in Experiment 1 is used for fine-mapping of salinity tolerance traits. To this end the recombinant lines are classified in two groups, i.e. SM and MS haplotypes. The grouping is based on the origin of the border markers of the 2H QTL region. The first group comprises genotypes that are homozygous for the ABC156A allele from Steptoe and the ABG 459 allele from Morex. The opposite holds true for the second group. The fine-mapping is done by plotting the performance of the DH lines against the genetic positions in the QTL region. Fine-mapping was performed in a similar way for the QTL region on 3H, using the Steptoe and Morex alleles of the markers delimiting the 3H QTL region for haplotype classification.
Results
Molecular maps of 2H and 3H QTL regions
For the fine-mapping, more markers were mapped in the two regions of interest (2H QTL region and 3H QTL region). Fig. 1 depicts the markers and marker order in both regions on the skeleton map used in the original mapping study and the corresponding high density maps that will be used for the fine-mapping of the QTLs in two regions of interest. The new maps have a similar size in cM with on average about one marker per cM. The new markers have filled the gaps present on the skeleton maps rather well, but there still are some gaps in the novel maps. The novel maps were used to determine the site of recombination for each line recombinant in the 2H or 3H QTL region.
Figure 1. Original and new molecular maps of the 2H and 3H QTL regions

Characterization of QTL regions on 2H and 3H �����������������������������������������������������������������������������������������������������������������������������������������������������������������������������������������������������������������������������������������������������
59
Performance of lines used for fine mapping of the 2H QTL region
The results of the study of the set of lines used in Experiment 1 are summarized in Table 2. The lines showed considerable and mostly significant variation for all the traits under stress and/or control conditions. Not surprisingly salt stress resulted in reduction of growth. However, this only held true for shoot growth and not for root growth. The plants grown under stress had less tillers and somewhat more leaves; the latter indicates that stress may have promoted plant development. The salt stress treatment resulted in striking differences in contents of ions in the dry matter of the various plant fractions studied (Table 2). Roots had a lower Cl- content than the upper and lower parts of the plant shoots. In stressed plants the lower shoot parts had on average the highest Cl- contents. Salinity influenced both quantity as well as the distribution of Na+ over young and old shoots. The lower shoot parts also had the highest Na+ content. This may indicate that these plants store Na+ and Cl- in older leaves to ensure growth of the younger leaves under salt stress conditions. Salt stress also resulted in a large reduction of the contents of K+ in the upper and lower shoot parts as well as the roots. Salt stressed plant parts also had a considerable reduction in Ca2+ content in comparison to corresponding control parts, except for the roots (Table 2).
Table 2. Phenotypic performance of 24 lines chosen for fine mapping of the 2H region for various plant traits or plant fractions as collected in Experiment 1 under salt vs control conditions. Statistics Max, Min, Mean and LSD0.05 refer to the maximum and minimum, the mean over all lines, and the least significant difference between lines (at P=0.05).
Trait Plant fraction*
Salt Control
Max Min Mean LSD0.05 Max Min Mean LSD0.05
Number of tillers 5.08 1.67 2.89 0.60 9.33 3.58 5.26 1.12 Plant height (cm) 43.95 11.99 29.39 4.96 62.42 20.73 41.95 12.15 Number of leaves 7.83 5.42 6.79 0.47 6.72 4.72 5.75 0.55 Dry weight (g/plant) Sh 1.83 0.72 0.10 0.29 3.69 1.53 0.23 0.64 R 0.50 0.16 0.29 0.10 0.51 0.15 0.30 0.11 Cl- content (mg/g DW) US 51.41 32.33 40.89 6.23 11.94 6.60 8.49 1.28 LS 96.36 67.71 81.11 7.19 17.61 9.94 13.31 2.09 R 38.64 27.64 32.88 5.89 2.11 0.68 1.28 0.67 Na+ content (mg/g DW) US 55.77 39.69 46.80 6.20 10.49 5.94 7.65 3.41 LS 86.71 64.76 76.15 6.56 9.92 5.71 7.38 2.69 R 44.36 37.47 40.75 5.29 6.87 3.94 5.29 2.99 K+ content (mg/g DW) US 21.94 11.69 14.69 3.05 71.99 39.08 56.85 11.52 LS 20.73 9.43 13.40 2.49 87.48 63.97 75.44 11.29 R 11.95 6.76 9.55 1.98 55.97 27.83 38.69 14.56 Ca2+ content (mg/g DW) US 2.33 0.75 1.61 0.71 12.29 5.83 9.26 1.14 LS 7.59 3.67 5.48 1.32 20.20 8.26 14.72 3.02 R 5.37 3.48 4.37 1.93 7.16 4.67 5.50 2.35
*: Sh = shoot; R = root; US= upper shoot; LS=lower shoot

Chapter 4 �����������������������������������������������������������������������������������������������������������������������������������������������������������������������������������������������������������������������������������������������������
60
Fine mapping of 2H QTL
The performance data of lines that were recombinant in the 2H QTL region (Table 1) were used to map the trait variation graphically by plotting the performance of the SM and MS lines on the detailed map of the 2H region in Fig. 1. To this end, the line-specific sites of recombination were used. This was done for all trait-stress combinations; the four graphs showing the clearest patterns are presented in Fig. 2. The graphs clearly indicated the presence of a locus (or cluster of loci) affecting the K+ content in shoots and plant height. The most likely position of this locus is between the markers GBR0479 and GBS358 with map positions 38.4 and 40.0 cM. This information was subsequently used to re-classify the recombinant S/M lines in a group putatively having the M allele of this locus and one with the S allele. The higher shoot K+ content was donated by the Morex allele, larger plant height was donated by the Steptoe allele.
Figure 2. Performance of lines recombinant in 2H QTL region under control and saline conditions plotted against the genetic distance (cM). The traits shown are content of K+ in the whole shoots (a under control and b under saline, respectively) and plant height (c under control and d under saline, respectively). The SM lines are marked with asterisks (*) and the MS lines with closed bullets (•). Data were taken from Experiment 1.
10
20
30
40
50
25 30 35 40 45
Pla
nt h
eigh
t (cm
)
Genetic distance (cM)
8
12
16
20
25 30 35 40 45
Sho
ot K
+co
nten
t (m
g/g)
Genetic distance (cM)
50
60
70
80
25 30 35 40 45
Sho
ot K
+co
nten
t (m
g/g)
Genetic distance (cM)
10
30
50
70
25 30 35 40 45
Pla
nt h
eigh
t(cm
)
Genetic distance (cM)
a b
c d

Characterization of QTL regions on 2H and 3H �����������������������������������������������������������������������������������������������������������������������������������������������������������������������������������������������������������������������������������������������������
61
Table 3. Mean performance of M and S lines for several plant traits under salt stress or control conditions in Experiment 1.
*: Sh = shoot; R = root; US= upper shoot; LS=lower shoot; P(t22≥t) probability of t value at 22 degree of freedom; significant at P<0.05.
Significance of QTL(s) localized on 2H
The genotypic means from Experiment 1 (Table 2) were used to calculate per trait estimates of the effects of the M and S alleles and their relevance to the traits under study. The results of the comparative analyses of the two allelic groups under stress and control conditions are shown in Table 3. Under stress the S allele was found to be associated with a lower number of tillers, taller plants, less dry weight in the lower shoot and more dry weight in the upper shoot fractions, lower K+ contents in all plant fractions, and higher Ca2+ contents in the lower shoot fraction. The two allelic groups also differed significantly for several traits measured in the same study under control conditions (Table 3). It is remarkable that on average the S group of lines had significantly lower K+ contents in the shoot fractions.
Trait Plant fraction*
Salt Control
M S P(t22≥t) M S P(t22≥t)
Number of tillers 3.28 2.24 0.000 5.62 4.67 0.103 Plant height (cm) 22.85 40.29 0.000 34.09 55.05 0.000 Number of leaves 6.67 7.00 0.148 5.71 5.83 0.555 Dry weight (g/plant)
US 0.47 0.62 0.004 0.99 1.28 0.020 LS 0.66 0.47 0.004 1.64 1.43 0.175
R 0.31 0.26 0.148 0.31 0.28 0.328
Cl- content (mg/g DW)
US 40.68 41.24 0.767 8.11 9.11 0.135 LS 78.50 85.47 0.060 12.97 13.88 0.314 R 32.75 33.11 0.715 1.04 1.68 0.000
Na+ content (mg/g DW)
US 47.39 45.81 0.323 8.36 6.45 0.000 LS 75.11 77.89 0.271 7.77 6.74 0.051 R 40.74 40.77 0.968 5.61 4.76 0.004
K+ content (mg/g DW)
US 15.92 12.62 0.001 62.22 47.90 0.000 LS 14.31 11.89 0.038 78.90 69.69 0.000
R 9.95 8.88 0.047 38.93 38.29 0.797
Ca2+ content (mg/g DW) US 1.55 1.72 0.301 9.23 9.31 0.921
LS 4.99 6.30 0.000 14.98 14.31 0.657 R 4.33 4.43 0.715 5.52 5.46 0.851
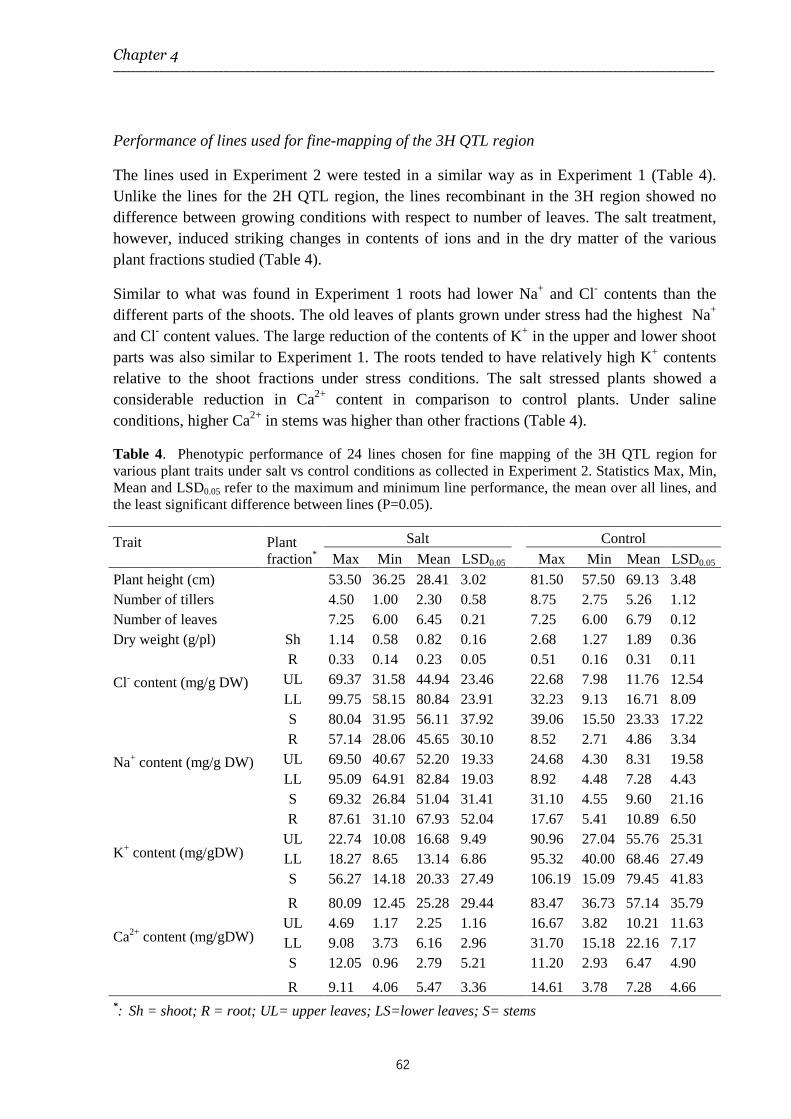
Chapter 4 �����������������������������������������������������������������������������������������������������������������������������������������������������������������������������������������������������������������������������������������������������
62
Performance of lines used for fine-mapping of the 3H QTL region
The lines used in Experiment 2 were tested in a similar way as in Experiment 1 (Table 4). Unlike the lines for the 2H QTL region, the lines recombinant in the 3H region showed no difference between growing conditions with respect to number of leaves. The salt treatment, however, induced striking changes in contents of ions and in the dry matter of the various plant fractions studied (Table 4).
Similar to what was found in Experiment 1 roots had lower Na+ and Cl- contents than the different parts of the shoots. The old leaves of plants grown under stress had the highest Na+ and Cl- content values. The large reduction of the contents of K+ in the upper and lower shoot parts was also similar to Experiment 1. The roots tended to have relatively high K+ contents relative to the shoot fractions under stress conditions. The salt stressed plants showed a considerable reduction in Ca2+ content in comparison to control plants. Under saline conditions, higher Ca2+ in stems was higher than other fractions (Table 4).
Table 4. Phenotypic performance of 24 lines chosen for fine mapping of the 3H QTL region for various plant traits under salt vs control conditions as collected in Experiment 2. Statistics Max, Min, Mean and LSD0.05 refer to the maximum and minimum line performance, the mean over all lines, and the least significant difference between lines (P=0.05).
Trait
Plant fraction*
Salt Control
Max Min Mean LSD0.05 Max Min Mean LSD0.05
Plant height (cm) 53.50 36.25 28.41 3.02 81.50 57.50 69.13 3.48 Number of tillers 4.50 1.00 2.30 0.58 8.75 2.75 5.26 1.12 Number of leaves 7.25 6.00 6.45 0.21 7.25 6.00 6.79 0.12 Dry weight (g/pl)
Sh 1.14 0.58 0.82 0.16 2.68 1.27 1.89 0.36 R 0.33 0.14 0.23 0.05 0.51 0.16 0.31 0.11
Cl- content (mg/g DW)
UL 69.37 31.58 44.94 23.46 22.68 7.98 11.76 12.54 LL 99.75 58.15 80.84 23.91 32.23 9.13 16.71 8.09 S 80.04 31.95 56.11 37.92 39.06 15.50 23.33 17.22 R 57.14 28.06 45.65 30.10 8.52 2.71 4.86 3.34
Na+ content (mg/g DW)
UL 69.50 40.67 52.20 19.33 24.68 4.30 8.31 19.58 LL 95.09 64.91 82.84 19.03 8.92 4.48 7.28 4.43 S 69.32 26.84 51.04 31.41 31.10 4.55 9.60 21.16 R 87.61 31.10 67.93 52.04 17.67 5.41 10.89 6.50
K+ content (mg/gDW)
UL 22.74 10.08 16.68 9.49 90.96 27.04 55.76 25.31 LL 18.27 8.65 13.14 6.86 95.32 40.00 68.46 27.49 S 56.27 14.18 20.33 27.49 106.19 15.09 79.45 41.83
R 80.09 12.45 25.28 29.44 83.47 36.73 57.14 35.79 Ca2+ content (mg/gDW)
UL 4.69 1.17 2.25 1.16 16.67 3.82 10.21 11.63 LL 9.08 3.73 6.16 2.96 31.70 15.18 22.16 7.17 S 12.05 0.96 2.79 5.21 11.20 2.93 6.47 4.90
R 9.11 4.06 5.47 3.36 14.61 3.78 7.28 4.66 *: Sh = shoot; R = root; UL= upper leaves; LS=lower leaves; S= stems

Characterization of QTL regions on 2H and 3H �����������������������������������������������������������������������������������������������������������������������������������������������������������������������������������������������������������������������������������������������������
63
Fine-mapping of the 3H QTL region
The performance of the SM and MS lines in Experiment 2 (Table 4) was plotted on the detailed map of the 3H QTL region to map the trait variation graphically. Fig. 3 shows the plots for Ca2+ content in lower and upper leaves under saline conditions (Fig. 3). The crossing point at 8.4 cM of the performance for the MS and SM lines indicate that the QTL affecting Ca2+ content in shoots is located between the markers Contig9797 and Contig11940 with map positions 8.0 and 8.9 cM. This information was used to re-classify the recombinant SM/MS lines in a group putatively having the M allele of this locus and one with S allele.
Significance of QTL(s) localized on 3H
The genotypic trait means collected for Experiment 2 (Table 4) were used to calculate per trait estimates of the effects of the M and S alleles and their relevance to the traits under study. The magnitude and the significance of the allelic effects contributing to the variation observed for the traits measured under stress and control conditions are shown in Table 5. The S allele was clearly associated with a higher number of tillers, less leaves and lower Ca2+ contents in old leaves and to the lesser extend lower K+ in stems of plants grown under stress conditions. The S allele of QTLs on 2H and 3H therefore showed opposite effects on Ca2+ contents of the older leaves (Tables 3 and 5). Under both control and stress conditions, allelic variation for the fine-mapped 3H QTL region had no influence on shoot and root biomass (Table 5).
Figure 3. Performance of lines recombinant in 3H QTL region under saline conditions plotted against genetic distance (cM) on horizontal axis. The traits shown are contents of Ca2+ in upper and lower leaves (a, b, respectively). The SM lines are marked with asterisks (*) and the MS lines with closed bullets (•). Data was taken from Experiment 2.
1
2
3
4
0 5 10 15 20 25 30
Ca2
+ c
onte
nt (
µg/
mg)
Genetic distance (cM)
Upper leaves
2
4
6
8
10
0 5 10 15 20 25 30
Ca2
+co
nten
t (µ
g/m
g)
Genetic distance (cM)
Lower leavesa b

Chapter 4 �����������������������������������������������������������������������������������������������������������������������������������������������������������������������������������������������������������������������������������������������������
64
Table 5. Mean performance of M and S lines for several plant or plant fraction traits under salt stress or control conditions in Experiment 2.
Trait Plant fraction*
Salt Control
M S P(t22≥t) M S P(t22≥t)
Plant height (cm) 47.13 43.48 0.078 71.10 67.71 0.173 Number of tillers 1.78 2.68 0.028 4.50 5.80 0.058 Number of leaves 6.68 6.29 0.044 6.78 6.80 0.874 Dry weight (g/plant) Sh 0.83 0.81 0.813 1.93 1.86 0.722 R 0.23 0.24 0.679 0.33 0.30 0.467 Cl- content (mg/gDW) UL 43.12 46.23 0.448 12.86 10.98 0.281 LL 82.63 79.55 0.515 19.65 14.60 0.025 S 58.78 54.20 0.389 24.50 22.50 0.429 R 46.86 44.78 0.522 5.15 4.65 0.451 Na+ content (mg/gDW) LL 84.78 81.46 0.333 7.15 7.38 0.597 UL 51.09 52.99 0.551 9.07 7.76 0.619 S 52.43 50.06 0.617 11.44 8.29 0.311 R 67.42 68.30 0.886 11.61 10.37 0.347 K+ content (mg/gDW) UL 16.74 16.64 0.933 52.11 58.38 0.230 LL 12.40 13.67 0.215 57.78 76.09 0.001 S 24.44 17.40 0.075 76.66 81.45 0.571 R 30.16 21.80 0.196 56.53 57.58 0.814 Ca2+ content (mg/gDW) UL 2.33 2.19 0.676 9.85 10.47 0.647 LL 7.35 5.30 0.000 25.94 19.45 0.000 S 3.38 2.37 0.297 5.77 6.97 0.185 R 5.88 5.18 0.167 7.77 6.93 0.327 *: Sh = shoot; R = root; UL= upper leaves; LS=lower leaves; S= stems. P(t22≥t) probability of t value at 22 degree of freedom; significant at P<0.05.
Discussion
Genetic dissection of a character of interest is an essential step towards map-based cloning of its underlying genes. This study has verified the presence of QTLs for traits that may contribute to salt tolerance on chromosomes 2H and 3H of the Steptoe x Morex barley population (Chapter 3). The results indicate that the genes responsible for the QTL effects are localized on the 2H map between the markers MWG858 and GBS0610 and on the 3H map between Contig9797 and Contig11940, respectively. Our results indicate that the 2H gene(s) plays an important role in uptake and/or translocation of K+ and the 3H gene(s) in uptake and transport of Ca2+. The two alleles of both genes were also shown to affect several other plant characteristics. The gene(s) underlying the 2H QTL contributed to shoot growth and its components (plant height, number of leaves and tillers) which are correlated with shoot K+, Cl- and Ca2+ contents under saline conditions. This verified the effects of the 2H QTL (Chapter 3). Shoot growth components such as plant height, number of tillers, number of leaves, shoot Ca2+ and to the lesser extent K+ contents were also affected by the 3H alleles

Characterization of QTL regions on 2H and 3H �����������������������������������������������������������������������������������������������������������������������������������������������������������������������������������������������������������������������������������������������������
65
(Table 5), indicating that the gene(s) at the 3H QTL location might contribute to growth characteristics of barley under saline conditions. However, Shoot dry weight was not significantly affected.
The 2H gene(s)
The fine-mapped 2H QTL located at or at least closely to several important QTLs found previously in cereals. It co-localized with the QTLs found under saline conditions in hydroponics-grown barley, including a QTL for shoot weight found by Ellis et al. (2002), leaf injury scoring (Zhou et al. 2012a) and a QTL for shoot Na+ and seedling biomass on chromosome 2AL of wheat (Genc et al. 2010). Zhou et al. (2012) and Genc et al. (2010) found that their loci were in the (syntenic) region of the Nax1 locus in durum wheat (Lindsay et al. 2004). The functional gene underlying the Nax1 locus was found to be HKT1;4 (Huang et al. 2006 and 2008). HKT1;4 belongs to the HKT subfamily 1 which are highly selective Na+ transporters (Hauser and Horie 2010). James et al. (2011) showed that the Nax1 gene (HKT1;4 in wheat) reduced Na+ content in the leaf blade by 40%. Even though in the QTL mapping presented in Chapter 3 a QTL for shoot Na+ content was identified that was not verified, which would support the suggestion of a role for HKT1;4, the phenotype of the Nax1 therefore does not match the phenotype of the fine-mapped 2H QTL in this Chapter.
It’s striking that the allele from the salt tolerant parent (Steptoe) associated with lower K+ in both lower and upper shoots (Table 3) and vice versa for the sensitive parent allele (Morex). Indeed, a negative correlation between shoot K+ contents and salt tolerance was found in Chapter 3. A positive correlation between K+ content (or high K+/Na+) and growth traits under saline conditions is reported more frequently in cereals (Yeo and Flowers 1986; Gorham et al. 1997; Munns and James 2003; Ren et al. 2005; Chen et al. 2007 and Shabala et al. 2010). However, other studies reported no such correlation between high shoot K+ contents and salt tolerance (Gorham et al. 1990; Isla et al. 1997; Genc et al. 2007). Higher K+/Na+ content in shoot was not a clear determinant to differentiate salt tolerance and sensitivity in Steptoe and Morex (Chapter 2). Shoot K+ content correlated positively with shoot growth only under mild (100 mM NaCl) stress at early harvest in the study described in Chapter 2. The positive relationship between K+ content and shoot growth was less obvious with increased stress severity and time of exposure to saline stress. The negative correlation between K+ content and salt tolerance in the current study and Chapter 3 (with 200 mM NaCl and three weeks of salt stress) agreed with Xue et al. (2009) who examined the relationship of K+ with salt tolerance at maturity stage. Possibly the higher K+ content in shoot which is associated with higher Na+ as well may be the result of a cation co-transporter for both K+ and Na+ such as HKT2;1 or HKT2;4 (Hauser and Horie 2010; Horie et al. 2011a).
Munns and James (2003) mentioned that K+ content might compensate only for small effects or secondary effects of Na+, and therefore QTLs for K+ under saline conditions will be difficult to find. Indeed, there has not been any report on QTLs for K+ in barley (Rivandi et al. 2010; Shavrukov et al. 2010; Xue et al. 2009; Ellis et al. 2002). We found that mapping K+

Chapter 4 �����������������������������������������������������������������������������������������������������������������������������������������������������������������������������������������������������������������������������������������������������
66
content separately is informative as was shown in wheat (Genc et al. 2007 and 2010) and in rice (Koyama et al. 2001; Bonilla et al. 2002; Lin et al. 2004). The short arm of chromosome 2H is syntenic to chromosomes 4 and 7 of rice (Close et al. 2009). On rice chromosome 7 a QTL for shoot Na+ content (SNC7) was found that explained 48% variation for this trait (Lin et al. 2004). SNC7 co-localized with a QTL for salt tolerance (seedling survival, root growth, and root K+ contents) and may be functionally similar to the 2H QTL found in Chapter 3 and the fine-mapped one in this Chapter. Lin et al. (2004) also detected another QTL for root K+ content on rice chromosome 4, which is in part syntenic with chromosome 2H in barley. It suggests that these QTLs and our QTL are controlled by similar genes.
Parent Steptoe was more salt tolerant than parent Morex (Chapters 2 and 3). The Steptoe allele for the QTL 2H region contributed to better shoot growth under stress conditions (Chapter 3) which is in part in agreement with the current study where the Steptoe allele was associated with better growth of young shoots (Table 3). Steptoe has been shown in Chapter 2 to possibly have ion tissue tolerance to render its salt tolerance. Under saline stress, Na+ strongly competes with Ca2+ uptake to the shoots (Liu and Zhu 1998). Storing Cl- and Na+ into the lower shoot and at the same time maintaining a significant amount of Ca2+ in these tissues may be a the fundamental mechanism contributing to salt tolerance of Steptoe (Table 3). Ca2+ is known to activate salt stress signalling, which controls ion homeostasis and tolerance (Liu and Zhu 1998). In addition, Ca2+ enhances K+/Na+ selective intracellular accumulation helping plants to cope with higher Na+ concentrations under stress conditions (Munns and Tester 2008; Genc et al. 2010). This might explain the clear association of higher Ca2+ content and salt tolerance in the cultivar Steptoe. The HKT subfamily 2 was found to contain co-transporters for both Na+ and K+, or Na+ selective transporters, depending on the ionic conditions (Hauser and Horie et al. 2010; Huang et al. 2008). Recently, Lan et al. (2010) found OsHKT2;4 also functions as a Ca2+-permeable cation channel that associated with a wide range of monovalent and divalent cations. OsHKT2;4 is localized to the plasma membrane, thereby providing a mechanism for cation uptake and extrusion. (Horie et al. 2011a) showed that rice OsHKT2;4 and to a lesser degree TaHKT2;1 mediate Ca+ and Mg2+ transport. HKT2;1 was suggested to improve tissue tolerance in barley (Mian et al. 2011). Therefore, a member of the HKT2 gene family may be a candidate gene underlying the effect of the 2H QTL region in barley.
The 3H gene(s)
The presence of QTLs on 3H was verified and the QTLs for Ca2+ in leaves were fine-mapped. QTLs controlling Ca2+ in young and older leaves were narrowed down to an interval of about 1cM (Fig. 3). No clear allelic variation effect of this QTL on shoot biomass was detected which agreed with QTL mapping in Chapter 3, that did not identify a growth QTL in salt stressed plants. However, the QTL alleles did contribute differently to growth related traits (tiller and numbers of leaves) (Table 5). This may also interact with root growth, as a QTL for dry weight was localized in the 3H QTL region (Chapter 3). The analysis of the allelic effects

Characterization of QTL regions on 2H and 3H �����������������������������������������������������������������������������������������������������������������������������������������������������������������������������������������������������������������������������������������������������
67
however did not reveal an effect of this region on root growth (Table 5). This might be partly due to the low number of lines used in this study and thus less statistical support for weaker QTL effects (Melchinger et al. 1998; Tuberosa et al. 2003).
The new 3H QTL for Ca2+ content might reveal a transporter gene (s) that regulates Ca2+ content under both saline and non-saline conditions. The fine-mapped QTL on 3H was delimited to a region of about 1 cM. Chromosome 3H of barley is syntenic to rice chromosome 1 (Close et al. 2009). This rice chromosome contains the most important QTLs for salt tolerance found in cereals such as Saltol controlling the K+/Na+ ratio (Bonilla et la. 2002) and SCK1 (Lin et al. 2004) which explains 40% of the variation in shoot K+ content under saline conditions. The SCK1 gene has been cloned using map-based cloning and was found to be a specific transporter for Na+ (OsHKT1;5) in rice. In wheat, Munns et al. (2012) showed that TmHKT1;5, encodes a Na+ -selective transporter to withdraw Na+ from the xylem and reduce transport of Na+ to leaves. TmHKT1;5 significantly reduces leaf Na+ and increases in durum wheat grain yield by 25% compared to control plants. Our fine-mapped 3H region is not encoding a phenotype that resembles the phenotype of the rice QTLs, and the putative syntenic position of the 3H QTL region does not appear to be near any of these QTLs. Therefore, the 3H QTL region may represent a novel QTL region involved in regulation of Ca2+ content which may influence salinity tolerance. The increase of cytosolic Ca2+ content under saline condition may contribute to stimulation of the SOS (salt overly sensitive) pathways (Liu and Zhu 1998; Zhu et al. 2003). In the pathways, a calcium sensor, SOS3, senses cytosolic calcium changes elicited by salt stress. SOS3 activates and interacts with the protein kinase SOS2. This SOS3/SOS2 complex activates the Na+/H+ antiporter encoded by SOS1 gene located in the plasma membrane (Mahajan et al. 2008). SOS1 locates on the plasma membrane and is responsible for extrusion of Na+ out of the cell. Moreover, SOS2 may interact with CBL10 (calcineurin B-like 10), which has been shown to have similar functions as SOS3 (Guo et al. 2007). The complex of CBL10/SOS2 regulates both extrusion of Na+ ion from the cytosol and sequestration of Na+ into the vacuole by activating NHX1 transporters, which pump Na+ into the vacuole (Mahajan et al. 2008). In our recombinant plants, Ca2+ concentration in the old leaves is significantly higher than Ca2+ in the young leaves and the stems. This higher Ca2+ content in the old leaves may cause activation of the vacuolar Na+ transporters (NHX transporters) (Blumwald et al. 2000), facilitating storage of Na+ in the old leaves (Tables 4 and 5). CAX genes were mainly found in leaves and stems and have a function as ion sequestration into the vacuole. In Arabidopsis AtCAX1 and AtCAX3 are important for Ca2+ homeostasis and might be specific for Ca2+ (Shigaki et al. 2003; Conn et al. 2011). AtCAX3 was found induced by Na+ is important for plant salt tolerance (Zhao et al. 2008). Han et al. (2011) showed CAX1 of a halophyte species (S. salsa) expression levels and the protein amounts were significantly up-regulated by NaCl treatments. Han et al. (2011) suggested that CAX1 might be a Ca2+ transporter operating at the tonoplast which plays a key role in maintaining cytosolic Ca2+ homeostasis under saline condition. Edmond et al. (2009) showed a barley HvCAX2 gene was transcriptionally upregulated by high Ca2+ concentration

Chapter 4 �����������������������������������������������������������������������������������������������������������������������������������������������������������������������������������������������������������������������������������������������������
68
under Na+ stress. The high concentration of Ca2+ in old leaves of our barley plants could be related to a high level of expression of HvCAX(s) in this tissue.
QTL fine-mapping
Genetic dissection of a character of interest and fine mapping of quantitative trait locus depend on three elements: marker density, crossover density and the accuracy of phenotyping (Yang et al. 2012). In this study the use of a high density map enabled improved mapping of the two QTL regions under study what gave rise to a better localisation of the QTLs found on 2H (2.2cM) and 3H (about 1cM), respectively. The identification of markers tightly linked to QTLs (often <5cM) is useful for further use in Marker-Assisted Selection (MAS) (Collard et al. 2008). Besides making use of a higher density map, we focused on the phenotyping accuracy of the recombinants in the QTL region. Using selected lines which show recombination events within the QTL interval, enabled extensive trait phenotyping such as more technical replications to reduce environmental variation. Barley is a species exhibiting poorer Na+ exclusion and K+/Na+ selectivity than wheat but possesses a superior level of salinity tolerance (Munns et al. 2002). Ion content traits measured in various plant fractions allowed us to relate several possible transportation mechanisms such as ion exclusion and compartmentation to better understand salt tolerance in barley (Gorham et al. 1990; Munns and James 2003; Colmer et al. 2005). In addition, extensive phenotyping helped to identify new traits controlled by QTLs, for instance K+ and Ca2+ contents in different plant parts. But in turn, the limitation in the number of lines used in the current study also showed the disadvantages caused by a small population size, which most likely is the reason why several QTLs detected in Chapter 3 were not found in this study. The number of 100 individuals in the population is close to the critical limit to detect major QTLs (large effects) (Melchinger et al. 1998; Tuberosa et al. 2003).
In conclusion this fine-mapping study verified the importance of the 2H and 3H QTLs in the Steptoe x Morex DH population for salt tolerant breeding. The fine-mapped 2H QTL suggests location of genes for Na+ and K+ co-transport that are associated with salt tolerance. The fine-mapped QTL region on 3H on the other hand presents a new QTL for Ca2+ transport which might be associated with ion homeostasis under salt stress and indirectly with salt tolerance. The 2H and 3H QTL were delimited to intervals of about 1-2cM which are promising to be implicated in salt tolerant breeding through map-based cloning or marker assisted selection.

CHAPTER 5
Association mapping of salt tolerance in barley (Hordeum vulgare L.)
Nguyen Viet Long1,2, Oene Dolstra1, Marcos Malosetti3, Benjamin Kilian 4, Andreas Graner4, Richard G. F. Visser1, C. Gerard van der Linden1
1Graduate School Experimental Plant Sciences, Wageningen University, PO Box 386, 6700 AJ Wageningen, The Netherlands.
2Wageningen UR Plant breeding, Wageningen University & Research Centre, PO Box 386, 6700 AJ Wageningen, The Netherlands
3Biometris, Department of Plant Sciences, Wageningen University & Research Centre, P.O. Box 100, 6700 AC Wageningen, The Netherlands
4Leibniz Institute of Plant Genetics and Crop Plant Research (IPK), Corrensstr.3, 06466 Gatersleben, Germany
The chapter has been submitted for publication with some small modification
Chapter 5 �����������������������������������������������������������������������������������������������������������������������������������������������������������������������������������������������������������������������������������������������������
70
Abstract
A spring barley collection of 192 genotypes from a wide geographical range was used to identify quantitative trait loci (QTLs) for salt tolerance traits by means of an association mapping approach using a thousand SNP marker set. Linkage disequilibrium (LD) decay was found with marker distances spanning from 2-8 cM depending on the methods used to account for population structure and genetic relatedness between genotypes. The association panel showed large variation for traits that were highly heritable under salt stress, including biomass production, chlorophyll content, plant height, tiller number, leaf senescence and shoot Na+, shoot Cl- and shoot, root Na+/K+ contents. The significant correlations between these traits and Salt Tolerance (defined as the biomass produced under salt stress relative to the biomass produced under control conditions) indicate that these traits contribute to (components of) Salt Tolerance. Association mapping was performed using several methods to account for population structure and minimize false positive associations. This resulted in the identification of a number of genomic regions that strongly influenced Salt Tolerance and ion homeostasis, with a major QTL controlling Salt Tolerance on chromosome 6H, and a strong QTL for ion contents on chromosome 4H.
Keywords: barley, salt tolerance, association mapping, LD, Eigenanalysis
Introduction
Salt stress is a major constraint to agricultural food production because it decreases crop yield and restricts the use of agricultural land. It is estimated that of the 280 million hectares of agricultural land approximately 20% is salinated (FAO 2008). The problem is increasing annually due to climatic change and poor irrigation management. Most cultivated crops are salt sensitive and therefore salinity is an ever-present threat to agriculture (Flowers and Flowers 2005).
Salt tolerance in crop plants is a genetic and physiological complex trait and is controlled by several quantitative trait loci (Flowers 2004). The plant’s response to salinity stress is composed of two phases (Munns and Tester 2008). The first phase concerns the osmotic stress that is perceived immediately upon plant exposure to highly saline conditions. Osmotic stress makes uptake of water by plants difficult and adversely affects shoot and root growth. To facilitate water uptake under such conditions plants have to accumulate extra solutes to maintain the water balance of the cells. The second phase is manifested when high concentrations of toxic ions are built up over a longer period of time. As NaCl is a major constituent of saline soil, plants accumulate Na+ and Cl- ions up to levels that are toxic, reducing amongst others their photosynthetic capacity. Shoot Na+ toxicity is associated with a reduction of stomatal conductance while high shoot Cl- levels affect chlorophyll and inhibit photosystem II (Tavakkoli et al. 2011). Therefore, both shoot Na+ and Cl- contents were considered important factors for salt-induced damage (Hasegawa et al. 2000; Munns and Testers 2008; Teakle and Tyerman 2010) even more because the toxicity effects of these ions appear to be cumulative (Tavakkoli et al. 2011). Although the mechanisms conferring salt tolerance and their genetic control in crops are not fully understood, regulation of intracellular

Association mapping of salt tolerance �����������������������������������������������������������������������������������������������������������������������������������������������������������������������������������������������������������������������������������������������������
71
content of cations (Na+, K+, Mg2+ and Ca2+) and anions (Cl-) and ion transport mechanisms are considered important. Ion homeostasis under salt stress conditions is controlled by several ion channels, pathways of transportation, compartmentalization mechanisms and ion sensing and signalling (Munns and Testers 2008; Zhu 2003).
Barley (Hordeum vulgare) is the fourth most important crop worldwide and it has a long history as a model for genetic studies (Schulte et al. 2009). It is the most salt tolerant cereal (Maas and Hoffman 1977; Munns and Tester 2008). Cultivated barley originates from wild barley (Hordeum spontaneum) and was domesticated within the Fertile Crescent, probably multiple times (Kilian et al. 2006). In comparison to other wild cereals, wild barley has a wide natural distribution area to which it is well adapted (Harlan and Zohary 1966; Nevo 2007). Both genetic diversity and the adaptation to a broad spectrum of micro-ecological conditions including water availability, temperature, soil type and altitude have strongly influenced the development of salt tolerance in barley. This resulted in a rich genepool with a large variation in adaptation to abiotic stresses including drought and salinity (Nevo and Chen 2010; Nevo et al. 2004). Therefore, scientists have advocated barley as a source of favourable alleles to be used in crop salt tolerance improvement by means of conventional and molecular approaches (Colmer et al. 2005; Munns 2005). However, the genetics of the various salt tolerance mechanisms found in the genepools of barley and wheat are still relatively unknown, which may explain the limited success in exploiting the resources in breeding for salt tolerance. Ellis et al. (2000) and Kilian et al. (2006) pointed out that modern barley cultivars only contain 15 - 40% of all alleles present in the barley genepool. Therefore it is quite likely that only a part of the barley genetic potential for salt tolerance has been addressed in salt tolerance genetic improvement performed so far.
Traditional QTL mapping or bi-parental QTL mapping based on a single segregating population derived from two homozygous parental genotypes has been the commonly used approach for genetic dissection of salt tolerance in barley and to identify candidate genes (Mano and Takeda 1997; Xue et al. 2009; Ellis et al. 2002; Witzel et al. 2009). This approach provides valuable information on genomic regions that control quantitative traits but it also has limitations due to poor sampling of the allelic variation present in the barley genepool for each of the loci affecting salt tolerance, lack of segregation, and poor resolution of this type of the mapping of QTLs. Bi-parental QTL mapping detects genomic regions with QTLs for a trait with an accuracy ranging on average from a few to several tens of centiMorgans (cM) and such chromosomal regions could harbor a few hundred up to several thousand genes (Ingvarsson et al. 2010). Accurate breeding methods are therefore needed to efficiently exploit the genetic variation for salt tolerance in barley germplasm.
Novel association mapping or linkage disequilibrium approaches have recently been introduced in plant genetic studies (Van Eeuwijk et al. 2004; Mackay and Powell 2007; Cockram et al. 2010; Zhao et al. 2007; Atwell et al. 2010). Association mapping studies in a much broader germplasm are now possible due to fast and affordable genotyping and sequencing technologies (Zhu et al. 2008). Association mapping relies on linkage

Chapter 5 �����������������������������������������������������������������������������������������������������������������������������������������������������������������������������������������������������������������������������������������������������
72
disequilibrium between markers and QTLs present in collections of diverse germplasm (Pritchard et al. 2000). It exploits the recombination events that have occurred during the long evolutionary history (Nordborg and Tavare 2002) of a crop species, producing shorter linkage blocks than found in bi-parent QTL mapping studies. QTLs for a salt tolerance trait detected in this way could be more precisely localized than those found through bi-parental QTL mapping. In addition, association mapping will address major allelic variants of QTLs for salt tolerance when performed with an adequate association mapping panel.
This study aims at the genetic dissection of mechanisms underlying salt tolerance in a worldwide panel of spring barley varieties using association mapping. The collection was chosen to represent a wide range of genetic diversity possible in spring barley (Stracke et al. 2009; Haseneyer et al. 2010) and has already been successfully applied in whole genome association analysis for several agronomical traits (Pasam et al. 2012). The objectives are (1) to evaluate genetic variation for salt tolerance and traits contributing to salt tolerance in a diverse spring barley collection; (2) to estimate genetic properties of the association mapping panel using a different method to account for the confounding of population structure; (3) to establish marker-trait associations for each salt tolerance trait, and (4) to identify major genes/loci affecting salt tolerance in spring barley that can be used for genetic improvement of salt tolerance. Our association mapping revealed a major locus significantly contributing to salt tolerance, and other major loci determining ion contents and ion homeostasis.
Materials and methods
Barley germplasm collection
The association panel used in this study consisted of 192 spring barley accessions originating from 51 different countries and four geographical regions: Europe (EU, n = 92), East Asia (EA, n = 33), West Asia and North Africa (WANA, n = 40), and America (AM, n = 27). The set of genotypes comprised breeding materials, traditional and improved cultivars and landraces, including 105 two-rowed and 87 six-rowed varieties. The genotypes were selected among the Barley Core Collection (BCC) (Knüpffer and van Hintum 2003) and the barley collection maintained at the IPK Genebank Gatersleben, Germany (Haseneyer et al. 2010). This world-wide collection was initially investigated by Stracke et al. (2009) using an association mapping approach to map flowering time genes. Haseneyer et al. (2010) studied this collection for several agronomical traits using microsatellite markers. The same population was used in a whole genome scan using SNP markers in order to identify QTLs associated with agronomical traits (Pasam et al. 2012).
Salt tolerance evaluation
The set of 192 genotypes from the association panel was evaluated at the vegetative stage of plant growth for salt tolerance traits during two consecutive years (2010 and 2011) using a hydroponics system. To this end seeds from the association panel genotypes were germinated

Association mapping of salt tolerance �����������������������������������������������������������������������������������������������������������������������������������������������������������������������������������������������������������������������������������������������������
73
in trays with silver sand for one week until the first seedling leaf had fully emerged. Individual seedlings were then transferred to the hydroponics system. The hydroponic growing media was full-strength modified Hoagland’s solution which was maintained at pH 5.8. After seven days on the system NaCl was gradually added to half of the containers with a 50 mM day-1 increment to bring the solution to a final salinity level of 200 mM NaCl. This final concentration was maintained for three weeks until the plants were harvested for biomass and ion content measurements.
The hydroponics system used for testing consists of four units of 16 containers with 24 plant positions as described in Chapter 4. The experiments in both years had a randomized block design, each with four blocks per treatment. Each plant represented one experimental unit. So in all each experiment consisted of eight randomized blocks allocated to two hydroponics units with the control treatment (0 mM NaCl) and to two units with the salt treatment (200 mM NaCl).
To measure growth parameters, all plants from the control and salt stress treatments were weighed at harvest and then separated into shoots and roots. Both plant fractions were dried separately in a forced-air oven at 700C until the samples reached stable weight prior to the determination of the dry weight. Salt Tolerance (ST) was assessed as the percentage of relative shoot biomass production under saline and non-saline conditions according to the definition of Munns and James (2003).
The shoot and root samples of the plants grown on the same hydroponic unit were pooled per genotype prior to the determination of contents of the cations Na+, K+, Ca2+ and Mg2+, and one anion (Cl-). Dry shoot and root samples were ground to powders and ashed at 575oC for 5 hours. Ash samples were dissolved by shaking for 30 minutes in 1 ml 3M formic acid at 95oC and then diluted with 9 ml MiliQ water. The samples were shaken again at 75oC for another 30 minutes. A final 1000x dilution was subsequently prepared by mixing 0.1 ml sample solution with 9.9 ml MiliQ prior to the assessment of the Na+, K+, Mg2+, Ca2+ and Cl- contents of each root and shoot sample using Ion Chromatography (IC) system 850 Professional (Metrohm Switzerland).
Data on plant height, root length (cm) and number of tillers were collected for all plants grown under control and saline conditions. Chlorophyll content was measured using a SPAD-502 meter (Minolta, Osaka, Japan) one day before the final harvest (three weeks after final salt concentration was reached). SPAD measurements give an accurate estimation of the total chlorophyll content (James et al. 2002). The SPAD readings were taken near the stem (5 cm from the stem), in the middle and near the tip (5 cm from the end) of the last fully expanded leaf. The leave was about 15-25 cm long at the time the SPAD reading was taken. The measurements were averaged of three per leaf. The SPAD measurements were collected on 4 plants per genotype per treatment. Leaf senescence on each of the three oldest leaves of the main tiller of each plant was scored one day before harvesting using a senescence scale from

Chapter 5 �����������������������������������������������������������������������������������������������������������������������������������������������������������������������������������������������������������������������������������������������������
74
1 to 9. The average over the three leaves per plant was used for analysis. The upper shoot leaves did not senescence during the experiment.
Genotyping
The association panel used in this study was genotyped with a customized 1536 SNP Illumina GoldenGate Oligonucleotide Pool Assay (OPA)(Close et al. 2009). In total 988 mapped SNPs were polymorphic. The SNPs with rare alleles and poor quality (more than 10% missing data) were excluded. The final set of 954 good quality SNPs that distribute over the whole barley genome were used to perform LD investigation and association mapping. The average spacing between markers is 1.18cM. Marker profiling has been described in details in Pasam et al. (2012).
Statistical analysis of phenotypic data
The data of the experiments combined over the two years were firstly inspected trait by trait to get insight in the relevance of the genotypic variation within the panel and genotype-by-environment interactions by means of an overall analysis of variance using Genstat version 14.2, while taking into consideration the experimental design with its block structure within both years. After the preliminary statistical analyses, separate analyses of variance were made using either the salt or control datasets. The 2-year data from the salt treatment were analysed to get for each trait estimates of the genotypic variance (σ2
g), genotype-by-year interactions (σ2
gy), and environmental variances (σ2e). These estimates were subsequently used to calculate
for each trait the heritability (hm2) based on genotypic means over two-year data by the
formula: hm2 = σ2
g / (σ2g + σ2
gy/y+ σ2e/ry) with y is number of years and r is number of
biological replications per year. The dataset of control treatment was analysed in the same way to get a similar set of population statistics. The relationship between the mean shoot and root ion contents of the lines and their contributions to the variance for Salt Tolerance was investigated using correlations. For the salt and control dataset separate ANOVAs were done to test the relevance of geographical origin and ear row number type.
Principle component analysis (Eigenanalysis)
Population structure of an association panel is typically assessed using the approach described by Pritchard et al. (2000) implemented in the STRUCTURE software. Haseneyer et al. (2010) and Pasam et al. (2012) used this to assess the structure information of the association panel and revealed subgroups existing within the collections that largely correspond to the row types of the ear and the geographical origins. In this study we used the Eigenanalysis method proposed by Price at al. (2006) and Patterson et al. (2006) to investigate the population structure. Eigenanalysis was run with help of the QEIGENALYSIS procedure in Genstat 14 (Payne, 2011) using the 954 SNP marker set. From a singular value decomposition of the genotype by marker matrix, a set of significant eigenvectors was obtained, which in turn were

Association mapping of salt tolerance �����������������������������������������������������������������������������������������������������������������������������������������������������������������������������������������������������������������������������������������������������
75
used as covariables in the marker-trait association models to account for population structure in the association panel.
LD decay investigation
The extent of LD within the current barley population was studied previously using 45 SSR markers (Haseneyer et al. 2010) and in a candidate gene approach for flowering time using 25 SSR markers (Stracke et al. 2009). These studies reported weak intra-and interchromosomal LD (Haseneyer et al. 2010) and the extent of LD was variable but on average moderate within three loci controlling flowering time traits (Stracke et al. 2009). On the other hand, Pasam et al. (2012) used the same population and SNP marker set and found LD decaying within 5-10cM.
In our study, 954 biallelic SNPs were used to study marker-marker associations (LD decay). Geographical origin and ear row type information separately were first used as predetermined subgroups in LD analysis models to reduce the impact of the differences in allele frequencies among subgroups on LD estimation (D'hoop et al. 2010; Pamsa et al. 2012). As described before, eigenvectors were used as covariables in the model to assess the LD decay to account for the effects of population structure (Patterson et al. 2006; Price et al. 2006). The Null model (i.e. without covariables), which assumes no population structure and individual relatedness in the association panel, was used as a reference. The LD decay per chromosome was visualized by plotting the –log10(P) value against the genetic distance between markers in centiMorgan (cM). All analyses and LD graphics were made with procedure QLDDECAY Genstat 14.2 edition (Payne et al. 2011).
Association mapping analysis
In the current study, the phenotypic data of the genotypes from the association mapping panel under saline and control conditions and the marker scores for a set of 954 SNPs were used to perform marker-trait association analysis. To account for effects of the structure of the mapping panel and relatedness among panel members, the three different association analysis models that are available in the procedure QSASSOCIATION in Genstat 14.2 (Payne et al. 2011) were used: (1) Eigenanalysis (Price at al. 2006; Patterson et al. 2006); (2) kinship matrix (Yu et al. 2006; Malosetti et al. 2007; Pasam et al. 2012); and (3) predetermined grouping (Zhao et al. 2007; Pasam et al. 2012). The kinship matrix based on similarities in the SNP scoring patterns between the genotypes in the panel was calculated using a simple matching method present in Genstat. The predetermined grouping approach gives results similar to those from the software package STRUCTURE, which uses molecular marker information within a Bayesian framework to assign group membership probabilities to the genotypes (Falush et al. 2003; Cockram et al. 2010).
We used a marker-trait association model that includes the treatment as an extra factor to
study marker and marker by treatment interaction effects. Mean phenotyping data per

Chapter 5 �����������������������������������������������������������������������������������������������������������������������������������������������������������������������������������������������������������������������������������������������������
76
treatment was used in the single trait-single environment association analyses performed. In
this study, we present mainly the results obtained by using the Eigenanalysis mixed-model
association mapping approach, where eigenvectors are used as covariates in the marker – trait
association model (Price at al. 2006; Patterson et al. 2006).
The QTL effects were fitted as fixed effects and tested using the Wald test statistic (Searle et
al. 1992; Verbeke and Molenberghs 2000). The Wald statistic is asymptotically distributed as
, where r is the number of parameters being estimated. The P-values from the tests are
transformed, using a –log10(P) transformation. The ratio of number of effective tests (total
genome size divided to LD decay which was found in the current study at 4cM) over the
significant level (α = 0.05) was used to calculate the threshold=-log10(0.05/#tests). The
threshold level on a –log10(P) scale at 3 was used to claim a significant QTL.
Results
Phenotypic variation and heritability
In the barley association panel grown on hydroponics, a significant reduction of shoot and
root growth due to salt stress was observed. There was significant variation (P <0.001) for dry
weight shoot and root, and other studied traits (Table 1). Estimates for the heritability (h2) of
growth traits ranked from 0.42 (root length under stress condition) to 0.86 (leaf chlorophyll
content under stress conditions). Heritability estimates for growth traits such as shoot, root
biomass, leaf chlorophyll content and leaf senescence under salt stress were generally higher
than for the same traits under control conditions. Significant variation in genotype by
treatment and genotype by year interaction were observed for most of the studied traits,
except root length and number of leaves on the main culm of barley plants grown under stress
conditions (Table 1). Like for growth-related traits, significant genotypic variation and clear
treatment effects on shoot and root ion contents were observed (Table 2). Heritabilities of
shoot Na+ and K+ content, and shoot and root Na+/K+ under salt stress were high (0.8). The
genotypic differences in shoot and root Cl- contents were highly heritable under both stress
and normal growth conditions. Small heritable variation was observed for Ca2+ and Mg2+
regardless of tissue type and growing conditions.
2rχ 2
rχ

Association mapping of salt tolerance �����������������������������������������������������������������������������������������������������������������������������������������������������������������������������������������������������������������������������������������������������
77
Table 1. Statistics of the association mapping panel describing the genotypic variation for various growth traits determined after three weeks testing with 200 mM NaCl (S) or 0 mM NaCl (C).
Trait Treatment Mean Range
LSD Variance component
hm2
Max Min σ2e σ2
g σ2gy
Shoot FW (g/plant) C 23.4 43.9 7.7 0.3 0.09 0.06 0.04 0.66
S 4.8 10.1 1.4 0.3 0.10 0.14 0.05 0.80 Shoot DW (g/plant) C 2.3 4.7 0.8 0.3 0.10 0.06 0.04 0.65
S 0.8 1.7 0.3 0.3 0.09 0.13 0.04 0.80 Root DW (g/plant) C 0.4 0.8 0.2 0.4 0.17 0.05 0.02 0.61
S 0.3 0.5 0.1 0.4 0.14 0.05 0.03 0.63 Chlorophyll content (SPAD reading)
C 46.4 54.9 28.2 3.9 15.91 13.45 3.64 0.8
S 47.3 58.4 23.2 5.2 27.65 40.38 5.97 0.86 Plant height (cm) C 71.7 90.8 52.2 6.0 37.71 36.90 5.28 0.83
S 45.0 57.6 30.9 6.3 41.78 27.81 2.06 0.82 Root length (cm) C 55.6 73.0 38.9 8.9 81.83 21.84 4.90 0.63
S 29.8 35.5 22.1 4.7 22.51 2.32 0.84 0.42 Number of tillers C 6.0 10.0 2.6 1.6 2.60 1.47 0.54 0.71
S 2.9 6.0 1.3 1.0 0.97 0.41 0.13 0.69 Leaf senescence C 1.5 3.5 1.0 0.7 0.47 0.12 0.06 0.58
S 5.4 8.9 1.8 1.3 1.88 1.14 0.61 0.68 FW: fresh weight; DW: dry weight; LSD: least significant difference at p<0.05;hm
2: heritability of means; σ2
e: environmental variance; σ2g: genotypic variance; σ
2gy: genotype-by-year interactions; Leaf
senescence (1-9 rating).
Salt tolerance and correlation to other traits
A large variation in Salt Tolerance (ST) - defined as the ratio of dry weight shoot under stress conditions and dry weight shoot under non-stress conditions, expressed as percentage – was observed within the association panel. The six-rowed East Asia (EA6) and two-rowed West Asia- North Africa (WANA2) genotype groups showed largest variation for shoot dry weight under both control and saline conditions. The six-rowed American (AM6) and European (EU6) groups produced less shoot biomass under saline conditions (Fig. 1a). ST ranged from 12.8 to 52.2% with a population average of 33%. Variation in salt tolerance appeared to be at least partly linked to the geographical origin of the germplasm and ear type. The WANA2 and EA6 genotypes had an average ST (34-35%) that was slightly higher than the population mean while the groups of AM6 and EU6 genotypes generally showed lower ST (Fig. 1b). Taking into account the variation contributed by ear row type within a geographical origin, two-rowed AM and two-rowed EU genotypes showed larger genotypic variation as well as higher means for ST than six-rowed genotypes. Six-rowed EA and two-rowed WANA genotypes displayed the largest variation for shoot dry weight under saline conditions. The best genotype for salt tolerance over the two-year trials was collected from North Africa (ST: 52%) and a genotype from America was consistently salt sensitive (ST: 12%).

Chapter 5 �����������������������������������������������������������������������������������������������������������������������������������������������������������������������������������������������������������������������������������������������������
78
Figure 1. Box plots showing differences in (a) shoot DW (g) under saline and control conditions and (b) Salt Tolerance (ST) among barleys from four different geographical origins and two ear types (2, tow-rowed and 6, six-rowed) subpopulations; Box edges show upper and lower quantile and the median as shown in the middle of the box. Individuals falling outside the rank of whisker are shown as crosses.
Shoot dry weight under control and saline conditions was highly positively correlated (r=0.83; P<0.001) (Table not shown). Most ion contents under both conditions are negatively correlated with shoot dry weight, except root K+. Under control conditions, shoot Mg2+, shoot Ca2+, root K+ and root Na+/K+ were negatively correlated to relative shoot dry weight. Under salinity stress, shoot K+, Mg2+, Ca2+ and Cl- and root K+, Na+/K+, Ca2+, and Cl- were inversely related to shoot dry weight.
ST within the association panel was found to be strongly associated with the amount of biomass produced (both shoot and root dry weight) under stressed condition but no clear relationship was found with control biomass, indicating that the performance of the plants under control conditions was not indicative for ST. Under stress conditions, high concentrations of both shoot and root Cl- were adversely correlated with ST (r=-0.33; P<0.001) and (r=-0.18; P<0.05), respectively (Table 3). Under saline conditions, Na+ contents in shoots compared to roots showed a clearly different relation with Salt Tolerance. Shoot Na+ (r=-0.23; P<0.01) was negatively correlated with ST, in contrast root Na+ content (r=0.19; P<0.01) positive correlated with ST. These results suggest that shoot Na+ exclusion mechanism is crucial for salt tolerance. Only shoot Mg2+ was negatively correlated with ST (r=-0.29; P<0.001) and this was found under control conditions.
50
40
WA
NA
6
30
WA
NA
2
20
EU
6
EU
2
EA
6
EA
2
AM
6
45
AM
2
25
15
35
Sal
t Tol
eran
ce (%
)
b a
200mM NaCl
Control

Association mapping of salt tolerance �����������������������������������������������������������������������������������������������������������������������������������������������������������������������������������������������������������������������������������������������������
79
Table 2. Summary of statistics of the association mapping panel for various ion content traits collected after three weeks testing under 200 mM NaCl (S) and 0 mM NaCl (C) treatments.
Trait Treatment Mean Range
LSD Variance component
hm2
Max Min σ2e σ2
g σ2gy
Shoot Na+(mg/g) S 38.2 69.6 18.4 7.1 25.74 102.29 37.32 0.80
Shoot K+(mg/g) C 65.2 81.0 48.3 8.0 32.99 28.40 12.86 0.66
S 25.2 51.6 8.1 5.5 15.82 57.28 19.37 0.81
Shoot Mg2+(mg/g) C 2.7 4.4 1.8 0.5 0.11 0.10 0.04 0.65
S 1.7 3.4 0.9 0.6 0.19 0.11 0.06 0.58
Shoot Ca2+ (mg/g) C 8.4 13.0 5.6 1.9 1.79 0.80 0.63 0.51
S 3.3 7.1 1.3 1.3 0.93 0.40 1.05 0.34
Shoot Cl- (mg/g) C 11.6 19.3 7.0 1.5 1.11 3.80 1.61 0.78
S 45.5 77.9 24.3 8.9 40.75 84.30 18.20 0.81
Shoot Na+/K+ S 1.9 5.0 0.6 0.6 0.21 1.13 0.19 0.88
Root Na+ (mg/g) S 56.5 65.8 46.5 7.1 25.96 9.45 3.41 0.54
Root K+ (mg/g) C 44.8 62.9 31.1 7.5 29.19 21.18 9.56 0.64
S 11.5 19.5 4.1 3.3 5.69 5.59 1.50 0.72
Root Mg2+ (mg/g) C 3.0 5.5 1.9 1.0 0.52 0.14 0.00 0.52
S 1.9 3.3 1.2 0.9 0.39 0.03 0.08 0.17
Root Ca2+ (mg/g) C 7.2 12.0 4.6 2.9 4.46 0.12 0.00 0.10
S 4.4 6.8 1.7 2.4 2.89 0.04 0.44 0.04
Root Cl- (mg/g) C 0.7 2.3 0.0 0.5 0.12 0.09 0.01 0.71
S 54.8 71.6 45.1 7.1 25.86 19.48 4.55 0.69
Root Na+/K+ C 0.2 0.4 0.1 0.1 0.00 0.00 0.00 0.08
S 5.4 14.8 2.9 1.4 1.08 1.99 0.66 0.77 LSD: least significant difference at p<0.05;hm
2: heritability of means; σ2e: environmental variance;
σ2g: genotypic variance; σ
2gy: genotype-by-year interactions
Under saline conditions, leaf chlorophyll content (r= 0.46; P<0.001), tiller number (r= 0.36; P<0.001), plant height (r= 0.47; p<0.001) and shoot DW (r= 0.63; P<0.001) were positively correlated with ST (Table not shown). Leaf senescence showed clear negative correlation with ST (r= -0.40; P<0.001). Shoot Cl- was inversely correlated with leaf chlorophyll content (r=-0.21; P<0.01). In contrast, shoot Cl- was positively correlated with leaf senescence (r= 0.32; P<0.001). This clearly indicates the interdependency between shoot Cl- content, leaf chlorophyll content, leaf senescence and ST. The effect of shoot Cl- to plant growth components is the most obvious with respect to reduction of plant height (r=-0.6; P<0.001), may even be more harmful than shoot Na+ which showed smaller correlation with plant height (r=-0.4; P<0.001). A higher shoot Na+ showed no correlation with chlorophyll content of the leaves and the formation of tillers. We observed no clear association of growth-related traits with shoot K+ under stress conditions. On the other hand there were negative correlations between shoot and root Na+/K+ and plant height (r= -0.22; p<0.01) and (r= -0.40; p<0.001), respectively.

Chapter 5 �����������������������������������������������������������������������������������������������������������������������������������������������������������������������������������������������������������������������������������������������������
80
Table 3. Coefficients of correlation (r) between various compositional traits of the shoot and root plant fraction and Salt Tolerance (ST) and shoot dry weight of the association mapping panel after three weeks testing on hydroponics with 200 mM NaCl (S) or 0 mM NaCl (C).
Trait Treatment ST Shoot DW
S C Shoot Na+ S -0.23** ns ns
C ns ns ns Root Na+ S 0.19** ns ns
C ns ns ns Shoot K+ S ns -0.27*** -0.27***
C ns ns ns Root K+ S ns 0.26*** 0.24***
C ns 0.32*** 0.35*** Root Na+/K+ S -0.17* -0.30*** -0.30***
C ns -0.28*** -0.23** Shoot Mg2+ S -0.44*** -0.58*** -0.46***
C -0.29*** -0.40*** -0.34*** Shoot Ca2+ S ns -0.20** -0.19**
C ns -0.15* -0.18* Root Ca2+ S ns -0.19** -0.17*
C ns ns ns Shoot Cl- S -0.33*** -0.42*** -0.30***
C ns ns ns Root Cl- S -0.18* -0.21** ns
C ns ns ns ns: not significant; *: significant at P< 0.05; **: P< 0.01; ***: P< 0.001
Genetic properties of the association panel
The Eigenanalysis resulted in the 19 axes (PCs) which describe the relationships between individuals in the association panel (Fig. 2). The PCs 1-6 explain most of the variation and indicate the presence of major groups in the population (Fig. 2). The rest of the axes indicate the existence of the more cryptic relationships. The differences in variation explained by 19 axes might reflect the differences in relatedness and the population structure within the association panel. The estimates for linkage disequilibrium (–log10(P)) between all possible pairs of SNP markers within each of the seven barley linkage groups were plotted against their genetic distance in cM on the integrated genetic map (Close et al. 2009; Pasam et al. 2012) to determine LD decay. Fig. 3 displays the LD decay plots for chromosome 5H with and without correction for population structure.

Association mapping of salt tolerance �����������������������������������������������������������������������������������������������������������������������������������������������������������������������������������������������������������������������������������������������������
81
Figure 2. Eigenanalysis based on 954 SNP markers of 192 barley genotypes. Plot shows 19 significant axes (PCs) with Eigenvalue (left) and percentage of variance (triangle) and cumulative variance (cross) expressed by PCs (right).
Figure 3. LD -log10(P) decay plot of marker pairs as a function of genetic distance on chromosome 5H. The curve illustrates LD decay trend line based on the nonlinear regression of –log10(P) on genetic distance. The title of each plot shows the model used to account for population structure while investigating LD decay. The inset in the Eigenanalysis model provide an enhanced view of LD decay for markers located <10cM apart. Similar LD decay was found on other chromosomes see Fig. S1.
1 3 5 7 9 11 13 15 17 19
0
10
4
20
8
30
12
40
16
50
60
2 10 186 14
Per
cent
age
of v
aria
nce
Principal component (PC)
6 1412108 1542 16 18139
0
5
5
1
10
15
19
20
25
73 1711
Principal Component (PC)
Eig
enva
lue
NULL
05
10
5
15
15
20
25
25303540
0 20 30 10
-log
10(P
)
SUBPOPULATIONS
05
10
5
15
15
20
25
25303540
10 30 0 20
ROW TYPES
05
10
0
15
10
20
20
25
30
303540
15 25 5 Map distance (cM)
EIGENANALYSIS
0
0
10
5
20
10
30
15
20
25
30
15 5 25
-log
10(P
)
Map distance (cM)
0
5
2
10
6
15
10
20
25
30
0 8 4

Chapter 5 �����������������������������������������������������������������������������������������������������������������������������������������������������������������������������������������������������������������������������������������������������
82
Including structure information in the analysis models helps to reduce noise and LD decay more rapidly (Fig. 3). Without correcting for population structure, the average LD decay was typically at 10cM (Null model – Fig. 3). The predetermined models that included geographical origin and ear row type information had similar effects with the mean marker distance from 7-8cM. The LD estimates obtained with the Eigenanalysis showed a clear decay in each linkage group between markers spaced up to about 4 cM on the integrated map. A similar extent of LD was found across the whole barley genome with LD rapidly decaying with map distance between markers. These results indicate that correction for relatedness is essential and that Eigenanalysis may give less but more likely significant marker-trait associations, reducing the number of false positive associations. The LD decay at 4 cM (found in Eigenanalysis model) was used to calculate the threshold for marker-trait associations in the next section as described in Materials and methods.
Association mapping
Three models of accounting for population structure were used in the association mapping analysis and all three reduced noise and effects of population structure over the Null model. The number of significant QTLs identified (-log10(P) threshold >3) differed from model to model. As expected from LD decay analyses, the association mapping approach using the Eigenanalysis model found less QTLs than the models that incorporated either the kinship matrix or predetermined group (subpopulation or ear row type) information (Fig. 4). The Eigenanalysis association mapping procedure identified markers associated with most of the studied traits which were scattered over the whole barley genome. An overview of significant trait-marker associations identified under Eigenanalysis model with genome positions, -log10(P) scores and allele effects of the gene-specific markers for QTLs detected under saline conditions are given in Table S1, respectively.
Three strong QTLs for ST were detected. These associations were consistently detected independently of the model that is used to account for population structure. The strongest QTL for ST on chromosome 6H was consistently found independently from population structure (Fig. 4). This QTL colocalizes with QTLs for other growth-related traits such as shoot dry weight, chlorophyll content, tiller number, plant height and leaf senescence under stress conditions – located at around 60 cM on chromosome 6H, with -log10(P) scores ranging from six to fourteen (Fig. 5-right). Another important region was found at 119 cM on chromosome 4H with highly significant QTL -log10(P) scores (4-28) for the ion homeostasis-related traits: shoot Na+, K+, Na+/K+ ratio and Cl-, and root Na+/K+ (Fig. 5-left). The QTL for ion contents were mainly detected in salt-stressed plants. QTLs affecting shoot growth and related traits were found under both stress and non-stress conditions. However, we observed significantly higher -log10(P) scores and effects for QTL(s) determining growth traits under stress conditions than under control conditions.

Association mapping of salt tolerance �����������������������������������������������������������������������������������������������������������������������������������������������������������������������������������������������������������������������������������������������������
83
Figure 4. Association profiles showing outputs of Salt Tolerance (ST) association mapping analysis using different models to prevent the confounding of population structure. The title of each plot shows the model used to account for population structure or relatedness in association mapping analysis. Horizontal axis presents seven chromosomes (1-7H) of barley genome. Vertical axis is the -log10 (P) values of QTLs according to the Wald test. The horizontal red line indicates the -log10(P) threshold (3).
Discussion
Unravelling the mechanisms underlying salt tolerance in higher plants is a challenging task
for plant scientists due to the complexity of the adaptive mechanisms of the plants in response
to salt stress. In this study we present the genetic dissection of the naturally occurring genetic
variation of salt tolerance in a worldwide collection of spring barley genotypes, linking traits
that contribute to salt tolerance to specific regions in the barley genome. A number of
genomic regions with genes putatively affecting salt tolerance and related physiological and
ion homeostasis traits were identified. In particular, QTLs for Salt Tolerance, biomass
production, chlorophyll content, leave senescence, tiller number and plant height accumulated
on a prominent genomic region located on chromosome 6H. QTLs for contents of Na+, K+
and Cl- were found on chromosome 4H (Fig. 5). Association mapping has proven to be a
powerful approach to dissect the complexity of qualitative traits in plants (Flint-Garcia 2003;
Nordborg and Tavare 2002; Mackay and Powell 2007). The current study has shown that this
also holds true for salt stress tolerance in barley.
ST: EIGENANALYSIS
8
4
7 0
6 5 4 3
6
2 1
2
10
-log
10(P
)
ST: SUBPOPULATIONS
12
8
7
4
6 0
5 4 3
14
2
6
1
10
2
ST: KINSHIP
12
8
7
4
6 0
5 4 3 2
10
1
2
14
6
-log
10(P
)
Chromosomes
ST: ROW TYPES
12
8
7
4
6 0
5 4 3
14
2
6
1
2
10
Chromosomes

Chapter 5 �����������������������������������������������������������������������������������������������������������������������������������������������������������������������������������������������������������������������������������������������������
84
Figure 5. Association profiles showing significant markers associated with Salt Tolerance and related growth traits (left) and ion contents in shoot and root under saline conditions (right) using Eigenanalysis association mapping method. Horizontal axis presents seven chromosomes (1-7H) of barley genome. Vertical axis is the -log10 (P) values of QTLs according to Wald test. The horizontal red line indicates -log10 (P) threshold (3). Associations of markers and other traits as well as the allele effects and other statistical parameters for QTLs can be found in Table S1.
Salt Tolerance
8
4
7 0
6 5 4 3
6
2 1
2
10
-log
10(P
)Shoot Na+
16
12
8
4
7 0
6 5 4
14
3
6
2 1
2
10
-log
10(P
)
Shoot K+
20
10
7 0
6 5 4 3
15
2 1
5-log
10(P
)
Shoot Na/K
20
10
7 0
6 5 4 3
15
2 1
5
25-l
og10
(P)
Root Na/K
4
2
7 0
6 5 4 3
3
2 1
1
5
-log
10(P
)
Shoot Mg2+8
4
7 0
6 5 4 3
6
2 1
2-log
10(P
)
Shoot Cl-
4
7
2
6 0
5 4 3 2 1
1
3
-log
10(P
)
Chromosomes
Shoot dry weight
8
4
7 0
6 5 4 3
6
2 1
2
10
-log
10(P
)
Chlorophyll content
12
8
4
7 0
6 5 4
14
3
6
2 1
2
10
-log
10(P
)
Plant height6
4
2
7 0
6 5 4 3
3
2 1
1
5
-log
10(P
)
Tiller number
6
4
2
7 0
6 5 4 3
3
2 1
1
5
-log
10(P
)
Leaf senescence6
4
7
2
6 0
5 4 3 2
5
1
1
3
-log
10(P
)
Chromosomes

Association mapping of salt tolerance �����������������������������������������������������������������������������������������������������������������������������������������������������������������������������������������������������������������������������������������������������
85
Genetic variation for salt tolerance in barley
Association mapping is becoming a common tool for identifying alleles and loci responsible for traits of agronomical importance. Kraakman et al. (2004) demonstrated the clear potential of association mapping to dissect highly complex traits such as yield and yield stability in barley. Its success, however, depends on the species under study, the trait, the association panel and the way how the peculiarities of the available panel are tackled. A first critical step before initiating an association mapping study for target traits is to consider the species and its available germplasm (Zhu et al. 2008). In the current study, we have chosen a worldwide barley collection to map loci controlling salt tolerance and related growth and ion homeostasis traits with the ultimate aim to discover useful alleles of candidate genes for crop salt tolerance improvement. The collection consisted of 192 genotypes originating from a wide range of ecological habitats. The population size should be sufficient to detect all relevant genetic factors determining variation present in the barley genepool for the trait of interest (Zhu et al. 2008; Haseneyer et al. 2010). The narrowing of genetic diversity due to plant breeding activities implies that elite barley germplasm is not necessarily a promising source material for genetic improvement of tolerance to abiotic stress in crops (Roy et al. 2011). The large variation in salt tolerance found in the current study might attribute by the association panel that consists of barley genotypes including landraces and old cultivars that were released before 1990 (Pasam et al. 2012). Barley materials have been domesticated in environments where salt and drought stresses often occur were shown to contribute to the genetic diversity for a salt tolerance study (Nevo et al. 2010, Munns et al. 2006). Barley cultivars from Europe and America were mainly selected to perform well under relatively favourable conditions and may hardly have alleles that confer resistance to salt stress. Barley, on the other hand, has a long history of cultivation and adaptation in North Africa, West Asia and East Asia; in particular in areas where drought and salinization often occur (Badr et al. 2000; Nevo et al. 2007). So it is likely that in areas upon selection under arid and semi-arid conditions the frequencies of favourable alleles for drought and salt tolerance have increased.
Population structure and LD
An association mapping panel assembled on basis of different geographical origins, location of adaptation and a long evolution history usually is not fully random (Prichard et al. 2000). Genotypes originating from the same area may be more closely related than the ones from different areas. This may result in spurious marker-trait associations (Zhao et al. 2007). Malysheva-Otto et al. (2006) reported that a global population of cultivated barley consisting of 953 accessions was highly structured due to geographical origins and row types. We compared LD decay information obtained with the Eigenanalysis with other methods. The LD values observed within the population between markers decayed within 4cM (Eigenanalysis) and 7-8cM (subpopulations). Our LD decay result using subpopulation methods is similar to the finding of Pasam et al. (2012) where LD decay was found from 5-10cM in the same population and the same marker data set. The LD decay (2-4 cM) found using the Eigenanalysis model in our study on the other hand agreed with other studies in barley.

Chapter 5 �����������������������������������������������������������������������������������������������������������������������������������������������������������������������������������������������������������������������������������������������������
86
Comadran et al (2011) reported LD decay within a distance of 5cM between markers for a panel with 109 elite cultivated barley varieties and a large set of markers (2132 SNPs). However, the estimates for LD decay from our study differed strikingly from those of Haseneyer et al (2010) who showed weak intra and interchromosomal LD, using the same association panel as in our study but with only a few markers (45 SSRs). The difference with our study is likely due to the low number of markers that were relatively widely spaced. One further reason might be the marker type. Malysheva-Otto et al. (2006) showed for a large worldwide barley collection and only 48 SSR markers that LD can extend over a marker distance of up to 50 cM, which strongly depends on population structure. With a set of 549 DArT markers and a restricted diversity in a Tibetan barley collection, the decay of LD on chromosome 5H was 8.9cM (Wu et al. 2011). Using 134 AFLP markers, Kraakman et al. (2006) showed LD decay beyond 10 cM in a 146 spring barley collection with restriction in European genotypes. The relatively faster LD decay (4 cM) observed in the current study is probably due to i) a fairly large and genetically diverse population, ii) dense markers coverage and that iii) the confounding effect of population structure has been accounted for using Eigenanalysis. This more rapid LD decay in barley than expected in a selfing species is also consistent with the study in various barley populations (Rodriguez et al. 2012; Zhang et al. 2009; Comandran et al. 2009). Even limited in the number of markers (134 SSRs), Rodriguez et al. (2012) found that LD steeply decayed within 3cM. The higher allele frequency per locus, the high heritability of the salt tolerance traits together with the LD decay of up to 4 cM in our association panel facilitates association studies with a medium marker density (approximately 1000 evenly distributed markers) (Rostock et al. 2006 and Comadran et al. 2009). Given our LD decay result from Eigenanalysis and an average marker spacing of 1.18 cM in the population, it is expected that the resolution of QTL detected could be about 2-4cM.
Association mapping and salt tolerance mechanisms
Association mapping is believed to be more powerful over but also complementary to bi-parent QTL mapping (Ingvarsson et al. 2010; Brachi 2011). In barley salt tolerance studies, biparental QTL mapping has resulted in the detection of several genomic regions with candidate genes controlling salt tolerance-related traits (Mano and Tekada 1997; Xue et al. 2009; Nguyen et al. 2012). However, the QTLs found with biparental mapping strategies often have not lead to the identification of candidate genes for crop improvement, mainly because of low resolution mapping due to genetic linkage blocks as a consequence of the small number of recombination events between the two parental genomes (Bernardo 2008). Our previous bi-parental QTL mapping using the Steptoe x Morex DH population with a similar hydroponics experimental setup resulted in several QTL regions - some of which are the same locations with QTLs found in the current study such as the 6H QTL- controlling growth, ST, and ion homeostasis, but the QTL regions were 15-30cM in size on average.
In this study, we have identified strong QTLs affecting ST and related traits using an association mapping approach while correcting for population structure and relatedness (Fig. 4). We found a number of trait-marker associations in different regions of the barley genome

Association mapping of salt tolerance �����������������������������������������������������������������������������������������������������������������������������������������������������������������������������������������������������������������������������������������������������
87
controlling salt tolerance and related traits (Table S1). This confirms that salt tolerance is a complex trait and is controlled by several factors/gene(s). Some of these genes/factors may not be specific for stressed conditions as they were identified under both control and stress conditions which might relate to the developmental traits or growth vigor. However, the relatively high heritability values for growth and related traits as well as the higher QTL -log10(P) scores and effects in the studies under stress conditions over those under the control conditions indicate that traits phenotyped under saline conditions are strong indicators for salt tolerance selection. The genomic region on chromosome 6H identified in the current study strongly influenced ST as well as chlorophyll content, plant height, tiller number and leaf senescence under salinity stress. This suggested that these related traits might be controlled by only a single or few gene(s). Our QTL mapping using Steptoe x Morex DH population (Chapter 3) also found a QTL on chromosome 6H in the same region controlling biomass produced under saline conditions. This QTL had a large confidence interval (30cM). Xue et al. (2009), using a DH population derived from CM72 x Gairdner, mapped QTLs for Na+/K+
ratio and plant height on chromosome 6H around our QTL region. In the current study the QTL affecting Salt Tolerance and growth-related traits was found in a small interval (2cM) of chromosome 6H. Taking the advantages of the expected higher recombination events in the association mapping panel, additional molecular markers in the genetic map or in the QTL region would facilitate the fine mapping of this QTL.
The QTL for Na+, K+ and Na+/K+ ratio identified on chromosome 4H with high -log10(P) scores was only detected under saline conditions. Forster et al. (2000) showed that chromosome 4H in barley harbours several loci involving abiotic stress tolerance including salt and drought. Previous studies showed that a decrease in growth under saline conditions could be mainly attributed to ionic effects caused by toxic levels of Na+ in the leaves (Mano and Takeda 1997; Shabala et al. 2010; Storey and Jones 1978). In barley, QTLs for Na+, K+ and Na+/K+ were identified using bi-parental mapping but on different locations on the chromosomes 6H, 2H and 1H (Xue et al. 2009) and in Steptoe x Morex mapping population on the chromosomes 2H and 3H (Chapter 3). Several genes which are differentially expressed under saline conditions may underlie the QTL region on chromosome 4H controlling ion contents only under stress conditions. Among potential ion-transporting genes that may contribute to salt tolerance in plants, genes belonging to the HKT1 (high affinity potassium transport) family which function as specific Na+ transporters or have a function in Na+ and K+ co-transport (review of Hauser and Horie 2010) are candidates for this QTL. We showed in our worldwide barley collection that higher Na+ in both shoot and root are negatively associated with ST. This suggests that salt exclusion at both shoot and root levels are important. Many studies suggested that Na+ exclusion from the shoot is associated with salt tolerance which involves HKT1;4 and HKT1;5 (James et al. 2011). Six HKT genes were mapped to wheat–barley chromosome groups. Among them, HKT1:5 was mapped on chromosome 4H of barley (Huang et al. 2008). HKT1:5 is a strong candidate for Nax2, a gene conferring salt exclusion in Durum wheat (Byrt et al. 2007). There is no available deteails on the location of HKT1:5 on the barley genome in the study of Huang et al. (2008) and

Chapter 5 �����������������������������������������������������������������������������������������������������������������������������������������������������������������������������������������������������������������������������������������������������
88
therefore our QTL provides valuable information on the possible location of HKT1:5 on chromosome 4H. Recently, Munns and colleagues have sucessfully used the HKT1:5 gene from ancestral wheat to produce salt tolearant durum wheat which show increased salt tolerance and an yield increase of 25% on saline soil (Munns et al. 2012).
Previous studies only focused on Na+ and K+ homeostasis in their salt tolerance studies. Niu et al. (1995), Zhu (2001) and Munns and Testers (2008) suggested to consider the interrelationship between other ions such as Ca2+ and Mg2+ in relation ot ion homeostasis under saline conditions. Tavakkoli et al. (2010 and 2011) provided evidences to consider the important role of Cl- content in shoot - as higher contents of this ion in shoot is highly toxic to many plants (White and Broadley 2001) including barley (Teakle and Tyreman 2010). Measuring the five most important ions that are major constituents of saline soil (Tavakkoli et al. 2010), we were able to assess the role of ion homeostasis in plants under salt stress condition in a wider context. In addition to Na+ and K+, a QTL for Cl- was found in the same region which supports the recently made suggestion by others to consider the role of Cl- in relation to ion homeostasis and salt tolerance in barley (Tavakkoli et al. 2010; Chapters 2 and 3). Our results suggested that accumulation of Cl- in both roots and shoots might be toxic for barley plants. In addition, shoot Cl- content consistently showed a stronger negative correlation with salt tolerance than shoot Na+ in our Steptoe x Morex bi-parental mapping study (Chapter 3). In contrast to Na+, there is little known about mechanisms or genes that control Cl- transport/uptake and no QTL has been detected for Cl- in cereals. In our study, the QTL on chromosome 4H was found controlling homeostasis of Na+/K+ and Cl- as well, which may suggest that the gene that controls Cl- loading/uploading at the xylem/symplast boundary (CCC) could be a target for further investigation. Recently, the Arabidopsis thaliana AtCCC gene encoding a cation-chloride co-transporter was cloned and shown to control both shoot and root Cl- homeostasis under saline conditions (Colmenero-Flores et al. 2007). In rice, the OsCCC1 gene was shown to play a significant role in ion homeostasis and rice development under saline conditions (Kong et al. 2011). The genes underlying the QTLs for Cl- content may also include transporters having either direct or indirect effects on Cl- exclusion or control of a Chloride channel. The CLC gene family was found to control Cl-/H+ antiporters and Cl- (Lv et al. 2009). The CLC subclass I family was found to be located on the tonoplast membrane in Arabidopsis and was suggested to be involved in sequestering Cl- in the vacuole under salinity stress (Li et al. 2006; Teakle and Tyerman 2010).
Conclusions
Our study showed extensive genetic variation for salt tolerance that can be exploited for barley improvement. Results obtained by Eigenanalysis that is incorporated in the association mapping approach defined the linkage disequilibrium of the barley collection decaying within 4 cM. The current study showed that the medium density genetic map with a thousand makers is sufficient for an association study on barley. Association mapping identified QTLs for salt tolerance, growth related traits and ion homeostasis-related traits. We presented more than 100 significant maker-traits associations over the whole barley genome, among them, 66

Association mapping of salt tolerance �����������������������������������������������������������������������������������������������������������������������������������������������������������������������������������������������������������������������������������������������������
89
QTLs were detected under control and 58 QTLs were found under saline conditions. We showed a strong QTL on 6H independently from population structure controlling salt tolerance that co-localized with QTL for other traits such as biomass growth, chlorophyll content and leaf senescence. Another strong QTL was identified on 4H controlling contents of various ion including Na+, K+ Na+/K+ and Cl-. The genomic regions that harbour QTLs for salt tolerance and ion contents on chromosome 4H and 6H in our study can be used for targeting candidate gene(s) for salt tolerance and uptake/transportation of both Na+ and Cl-, which are important factors for salt tolerance improvement of barley.


CHAPTER 6
General Discussion

Chapter 6 �����������������������������������������������������������������������������������������������������������������������������������������������������������������������������������������������������������������������������������������������������
92
General discussion
Given the amount of food that needs to be increased in the near future, improving salt tolerance of crops is an important challenge for plant breeders. Many trials in conventional breeding programs have been performed to develop elite varieties with a high level of salt tolerance, but till now this endeavour has limited success (Flowers 2004; Munns et al. 2006). Understanding the genetic mechanisms underlying salt tolerance is of key importance to reach the desired breeding goals with respect to this trait. The genetic dissection of the quantitative traits controlling the adaptive response of crops to abiotic stress is a prerequisite to allow cost-effective applications of genomics-based approaches in breeding high yielding crops for saline conditions. Barley is the fourth most important cereal crop in terms of quantity and area of production in the world. Unlike other important cereals such as wheat and rice that are moderately- highly salt sensitive, barley is relatively salt tolerant even though saline stress reduces significantly its growth and yield. What makes barley more salt tolerant than wheat and rice is still unclear. It is widely known that barley not only exhibits the common salt exclusion mechanism to cope with saline stress like wheat and rice, but also utilizes other mechanisms such as salt (Na+ and Cl-) compartmentation, ion vacuolar sequestration and osmotic adjustment.
There have been successes in the identification and use of QTLs/genes contributing to salt tolerance in other cereals like wheat and rice. The QTLs/genes such as Saltol, SCK1 in rice, HKT1;4 and HKT1;5 in wheat and rice mainly reduce salt toxicity in leaves. The introduction of HKT1;5 into a durum wheat variety significantly improves wheat yields on saline fields (Munns et al. 2012). Similar studies in barley surprisingly have not yet revealed genes that contribute to salt tolerance, even though it is the most salt tolerant cereal crop and it has for a long time been used as an experimental model species for genetics and breeding in Poaceae (grass family). As barley uses various mechanisms to cope with salinity stress, unravelling the genetic complexity of salt tolerance in barley would greatly facilitate genetic improvement for salt tolerance in cereals.
We have shown in this thesis that identifying accurate trait information is a vital step to be able to genetically dissect salt tolerance. Our biparental QTL mapping study revealed important QTLs associated with salt tolerance. To pave the way toward map based cloning or marker assisted breeding a fine-mapping study was carried out to verify the QTLs and delimit the QTL regions on the barley chromosomes. Finally the powerful association mapping approach was used to efficiently exploit genetic diversity and accurately localize QTLs for salt tolerance. In the current chapter we will expand the discussion on our major findings and their prospects for salt stress tolerance improvement through breeding.
Ion homeostasis and salt tolerance improvement
Ion homeostasis is a key process for plants to tolerate high salt concentrations in the root environment (Niu et al. 1995; Zhu 2003). Especially intracellular Na+ and K+ homeostasis until now were found to be crucial for cell metabolism and are considered key components of

General discussion �����������������������������������������������������������������������������������������������������������������������������������������������������������������������������������������������������������������������������������������������������
93
salinity tolerance in plants (Niu et al. 1995; Tester and Davenport 2003; Hasegawa (Hasegawa et al. 2000b; Chen et al. 2007).
Na+ homeostasis
Reduced Na+ loading into the xylem is one of the main mechanisms of salinity tolerance and it is considered one of the most crucial features of restricting Na+ accumulation in plant tissues (Tester and Davenport 2003; Shabala et al. 2010). The important genes found in rice such as Saltol (Bonilla et al. 2002) and SCK1 (Lin et al. 2004); Kna1 in bread wheat
(Dubcovsky et al. 1996) and Nax1 and Nax2 in durum wheat (Munns et al. 2003); Lindsay et al. 2004; James et al. 2011) are implicated in Na+ exclusion or the co-transportation of Na+ and K+. The importance of Na+ exclusion was confirmed in our studies, as we found a strong correlation of Na+ exclusion with biomass growth and salt tolerance under salt stress (Chapters 2, 3 and 5). However, we also found possible additional traits in the examined barley lines, including tissue tolerance such as ion compartmentation in to the older leaves or sequestration into vacuole (Chapters 2 and 4). Although less common, several other studies have shown that ion (Na+ and Cl-) compartmentation into the vacuole is a mechanism that contributes more to salt tolerance in barley than in wheat (Greenway and Munns 1980; Munns and James 2003; Munns and Tester 2008; Shabala et al. 2010; Mian et al. 2011). The QTL analysis in Chapter 3 detected a salt stress-induced QTL on 2H (explaining 23% shoot Na+) in coincidence with QTL for biomass growth. The QTLs on 2H were verified and fine-mapped to a region of 2cM. Exploiting the synteny between rice and barley and when available possibly later in 2012 using the barley genome sequence, the 2H QTLs can be further explored and possibly cloned.
We examined the rice-barley synteny in the fine-mapped 2H QTL region using the marker data set of the Steptoe x Morex DH population (Chapter 4) and the software HarvEST: Barley (http://harvest.ucr.edu). The similarity between the map of Close et al. (2009) and the integrated barley map used for the QTL fine-mapping in Chapter 4 is shown in Fig. 1. The two locus-nearest markers of the QTL for K+ content in shoots in the Close et al. (2009) consensus map were POPA1_0943 (18.3) and POPA2_1015 (27.3). Nine markers were present between the locus-nearest markers in the map of Close et al. (2009), however, we could not fully exploit this information as some recombinants with a crossing-over between the locus nearest markers had no data for those nine markers. The 2H QTL interval was syntenic to parts of rice chromosomes 4 and 7. A potassium transporter 2 (OsKUP) and two calmodulin-like proteins (CaM, regulating cation transporters and channels) located in the vicinity to the syntenic region on chromosome 7 (Fig. 1). Lin et al. (2004) identified the QTL SNC7 for shoot Na+ content on rice chromosome 7 that explained 48% variation for this trait. SNC7 co-localized with salt tolerance (seedling survival, root growth, and potassium content in roots) which is comparable to the effects of the 2H QTL region. Therefore a SNC7-like gene may underlie this barley QTL.

Chapter 6 �����������������������������������������������������������������������������������������������������������������������������������������������������������������������������������������������������������������������������������������������������
94
Figure. 1 Barley-rice synteny of the interval for the QTL for shoot K+ concentration on barley chromosome 2HS and rice chromosomes 4 and 7. The synteny region in rice was obtained using the software HarvEST: Barley (http://harvest.ucr.edu). Left, new map from this study; middle the consensus map of Close et al. (2009); right, the physical map of rice chromosomes 4 and 7 constructed from the sequence annotations on http://www.phytozome.net/cgi-bin/gbrowse/rice/. The lines connect each barley marker to the position of the best BLAST hit on the rice genome (Close et al. 2009).
The fine-mapped 2H QTL region was also located in the same -or close to the- region with barley QTLs for shoot dry weight (Ellis et al. 2002) and leaf injury (Zhou et al. 2012) under saline conditions. The QTL for leaf injury found in Zhou et al. (2012) was in the syntenic region as the previously reported Nax1 locus in wheat which explained 40% of shoot Na+ exclusion (Lindsay et al. 2004). This strongly suggests that gene(s) for shoot Na+ exclusion which associate with salt tolerance are present in our QTL region. Nax1 (HvHKT1;4) removes Na+ from the xylem in the root, older leaves and leaf sheath and therefore reduces leaf blade/ leaf sheath ratio (James at al. 2011). In Chapter 4 we showed that the difference in ion contents in shoots of Steptoe and Morex found earlier in Chapters 2 and 3 might partly be due to the difference mainly found in older leaves. These phenotypes resembled that of Nax1, which may indicate that the 2H QTL for Na+ and K+ contents is encoded by Nax1-like gene.
The 2H fine-mapped region between MWG858 and GBR0479 also points to a syntenic interval (LOC_Os04g33340/LOC_Os04g51120) of rice chromosome 4 which contains OsHKT1;4 (Os04g51830). OsHKT1;4 is mainly expressed in shoots, while the barley HvHKT1;4 is likely to act in roots and leaf sheaths (Huang et al. 2008). The gene TmHKT1;4 was successfully transferred from durum to bread wheat with the help of marker-assisted selection and showed in wheat to help in retaining Na+ in leaf sheaths and therefore

General discussion �����������������������������������������������������������������������������������������������������������������������������������������������������������������������������������������������������������������������������������������������������
95
decreased the leaf blade Na+ concentration by 50% (James et al. 2011). In addition, James et al. (2011) showed that HKT1;4 conferred an extra advantage under a combination of waterlogged and saline field conditions. The HvHKT1;4 may therefore be a strong candidate for the fine-mapped 2H QTL. The markers we provided can be used in marker assisted breeding for salt tolerance.
A QTL controlling Na+ homeostasis under saline conditions identified in a diverse barley germplasm collection was presented in Chapter 5. This novel “super-strong” QTL revealed a single locus on chromosome 4 that co-localized with QTLs for K+ and Cl- homeostasis in shoots. No QTL for ion content on chromosome 4H of barley has been detected before, but several QTLs for salt tolerance or yield related traits were found on the same or close to our 4H QTL such as QTLs for spike numbers per plant and tiller numbers under saline conditions (Xue et al. 2009) and a major QTL for yield under normal field conditions (Ellis et al. 2002). The QTL on the long arm of 4H is clearly a candidate for ion transporter(s), a proton pump(s) or ion channel(s) that control ion exclusion in roots and shoots and the gene might mediate constitutively shoot K+ over Na+ discrimination under saline conditions. Dubcovsky et al. (1996) mapped the Kna1 gene on chromosome 4D of wheat which partly explains the better Na+ exclusion or K+/Na+ discrimination of bread wheat over durum wheat. In durum wheat Nax2 was proposed by Byrt et al. (2007) to have the same function as the Kna1 gene in bread wheat. HKT1;5 is a strong candidate for Nax2, a gene conferring salt exclusion in durum wheat (Byrt et al. 2007; James et al. 2011). The barley HKT1;5 gene was mapped on the long arm of chromosome 4H as well (Huang et al. 2008). Our results suggest that the QTL on the long arm of 4H in barley might relate to both Knal and Nax2 which may explain why barley in more salt tolerant than both bread and durum wheat (Munns and Tester 2008). HKT1;5 therefore is a strong candidate gene for our 4H QTL. Recently Munns and colleagues have sucessfully used the HKT1;5 gene from ancestral wheat to produce salt tolerant durum wheat which showed increased salt tolerance with yield increases of 25% on saline soil (Munns et al. 2012). Another association mapping QTL for Na+, K+ and Na+/K+ ratio locates near the center of chromosome 7H might be related to the HvNax3 locus by Shavrukov et al. (2010). This locus in our association mapping study however has a small effect compared to the QTL on 4H (-Log10(P) 3 compared to 20) (Chapter 5).
According to the rice-barley syntenic map, chromosome 4H is syntenic with rice chromosome 3 (Close et al. 2009). We tried to link the position of the 4H interval with help of the flanking SNP markers to the rice genome, but were not able to localize it accurately. With more markers it is likely that we will be able to annotate more markers to this QTL, what may enable us to identify the rice syntenic region and find possible candidate genes. Otherwise information on such genes will become available when the barley genome sequence comes available, what is expected soon.

Chapter 6 �����������������������������������������������������������������������������������������������������������������������������������������������������������������������������������������������������������������������������������������������������
96
Cl- homeostasis
Already many years ago it was suggested to consider the interrelationship between Na+, K+ and other ions in salt tolerance studies in plants (Niu et al. 1995). However, little attention has been paid to other ions in favour to Na+ and K+. Nevertheless, shoot Cl- exclusion as well as Cl- compartmentation may be important for salt tolerance in crops and tree plants (White and Broadley 2001; Munns and Tester 2008; Mian et al. 2009; Teakle and Tyerman 2010). Recently, Tavakkoli et al. (2010a and 2011) found that Na+ and Cl- had different effects in plants exposed to salt stress. The presence of both ions in saline solution had an additive effect in barley and bean. However, little effort has been undertaken to understand the mechanisms and genetic factors controlling Cl- homeostasis in relation to salt tolerance in cereals.
We considered both Na+ and Cl- as important factors for salt tolerance. In Chapter 2 we showed that the mean shoot Cl- concentration was dramatically different under mild, moderate and severe stress treatments (35, 65 and 110 mg/g dry weight, respectively). The concentrations are far above the critical toxicity levels, which are 4-7 and 15-50 mg/g dry weight for Cl- sensitive and tolerant species (Xu et al. 2000). In addition, path analysis revealed a direct negative effect of shoot Cl- content on salt tolerance in the Steptoe x Morex barley mapping population (Chapter 3). This agrees with (Tavakkoli et al. 2010b and 2012) who studied several barley genotypes contrasting for salt tolerance and showed that Cl- had greater negative correlations with salt tolerance and grain yield under saline soil experiments and field conditions than Na+. We showed a consistent stronger negative correlation of biomass growth and salt tolerance with Cl- content than with Na+ content (Chapters 2, 3 and 5). This suggests that Cl- may even be more damaging than Na+ to the barley plant; an assumption which agrees with findings in Trifolium, Medicago, Glycine, Lotus, Pinus banksiana, Citrus and Vitis (Reviews of Teakle and Tyerman 2010). Understanding the genetics that control Cl- uptake, transport and storage is therefore important for salt tolerance improvement in cereals. Both shoot Na+ and Cl- content are highly heritable (h2=0.8) in our salt stress experiments (Chapter 5). The important QTLs detected for Na+ and K+ were usually in the same region as Cl- QTLs (Chapters 3 and 5) indicating that the regulation of homeostasis for these ions under saline conditions may be functionally linked.
Until now, hardly any QTL for Cl--related salt tolerant traits has been reported. In rice, Koyama et al. (2001) detected markers associated with shoot Cl- content on chromosome 6 coincident with other traits like shoot Na+ and K+ contents. However, the magnitude of this QTL and the relationship with growth were not shown. We found three QTLs for Cl- which in total explained 40% of the variation for shoot Cl- under saline conditions (Chapter 3). The strong QTLs for Cl- contents always co-localized with QTLs for Na+, K+ or Na+/K+ on 2H, 3H (Chapter 3) and 4H (Chapter 5). This suggests that Cl- accumulation might correlate to cation homeostasis which in turn contributes to salt tolerance. Shoot Cl- content was strongly correlated with reduction in shoot growth (Chapters 2, 3 and 5) suggesting that QTL may be important for Cl- exclusion from the (young) shoot. The QTL might reveal a chloride-cation co-transporter (CCC) gene. This gene family members mediate movement of Cl- which is

General discussion �����������������������������������������������������������������������������������������������������������������������������������������������������������������������������������������������������������������������������������������������������
97
tightly coupled with Na+ (NCC) or K+ (KCC) transport, and both cations (NKCC) have a significant role in major plant developmental processes and ion homeostasis (Colmenero-Flores et al. 2007). This gene can play a significant role in K+ and Cl- homeostasis as was shown in rice by Kong et al. (2010) who recently cloned the OsCCC1 and studied its effect on plant development under high salt concentration conditions
Ellis et al. (2002) showed the co-localization of QTLs for grain nitrogen contents and grain yield under field condtions. The QTL of Ellis et al. (2002) was close to our 4H QTL for amongst others shoot Cl- content. This might suggest the possible involvement of NO3
-/Cl- transporter genes of the CLC subclass I family (Mian et al. 2009; Zifarelli and Pusch 2010). Several chloride channel (CLC) genes were recently isolated from Arabidopsis and associated with Cl- homeostasis (Lv et al. 2009). We have analyzed gene expression of HvCLC-c1 and found it strongly correlated with salt tolerance of selected barley genotypes growing on both saline sand and hydroponics (unpublished results), which is another indication that Cl- transport may play an important role in salt tolerance. It is expected that further investigations of the role of the QTLs presented in this thesis will generate new insights in the underestimated role of Cl- in salt tolerance and the underlying mechanisms and genes.
K+ homeostasis
Intracellular K+ homeostasis is crucial for cell metabolism and is considered to be a key component of salinity tolerance in plants (Niu et al. 1995; Hasegawa et al. 2000; Tester and Davenport 2005; Chen et al. 2007). Munns and James (2003) argued that changes in K+ content may be only small or secondary to changes in Na+ therefore QTLs for K+ under saline conditions were hardly found. Indeed, there have been limited reports on QTLs controlling K+ content, and many more on Na+ and/or Na+/K+ ratio (Xue et al. 2009; Shavrukov et al. 2010 Rivandi et al. 2010). In several reports, shoot K+ content was associated with salt tolerance. Maintaining a sufficient level of K+ to be able to still compete with accumulating Na+ apparently is an important trait, expressed as Na+/K+ ratio.
In contrast, we observed a negative correlation between K+-content in shoots and salt tolerance (Chapter 3), which was contributed by the Steptoe allele (that is also associated with salt tolerance) to lower shoot K+-contents in the fine-mapping study (Chapter 4). K+ contents were negatively correlated with shoot dry weight observed in the association mapping panel (Chapter 5). As explained in Chapter 4, a negative correlation between shoot K+ contents and salt tolerance is more obvious with increased stress severity and time of exposure to saline stress. We detected salt stress-induced QTLs on 2H (explaining 18% variation for shoot K+) that co-localized with a QTL for biomass growth (Chapter 3). The confirmation of location and the effect of the QTL for shoot K+ (Chapter 4) showed that it might be as informative as QTLs found in rice (Koyama et al. 2001; Bonilla et al. 2002; Lin et al. 2004). In our study, we found QTLs for K+ under both control (37% variation explained) and under stress conditions (18% variation explained) for this trait, which may reveal a physiological function similar to that of the SKC1 locus for shoot K+ content (Lin et al. 2004). The SKC1 locus on chromosome 1 of rice explained 40% variation for shoot K+. SKC1 is preferentially expressed in the

Chapter 6 �����������������������������������������������������������������������������������������������������������������������������������������������������������������������������������������������������������������������������������������������������
98
parenchyma cells surrounding the xylem vessels. SKC1 protein functions as a Na+-selective transporter. Physiological analysis suggested that SKC1 is involved in regulating K+/Na+ homeostasis under salt stress, providing a potential tool for improving salt tolerance in crops.
Ca2+and Mg2+ homeostasis
The genetic controlling Ca2+ and Mg2+ in relation to salt tolerance has never been reported, even though it was suggested more then 30 years to consider the interaction of different cations (Na+, K+, Mg+2 and Ca2+) in plant salt tolerance studies (Bansal and Shah 1978; Liu and Zhu 1998; Zhu 2001). Ca2+ has at least two roles in salt tolerance. It has a pivotal signaling funtion in the salt response leading to adaptation and a direct inhibitory effect on the Na+ influx (Yokoi et al. 2002 ). We showed that root Ca2+ strongly negatively correlated with salt tolerance under saline conditions (Chapter 2). We presented a QTL for Ca2+ on chromosome 3H which explained 34% variation for this trait. This QTL for Ca2+ content in whole shoot was detected only under control conditions and was not clearly correlated with salt tolerance (Chapter 3), but fine-mapping of this QTL showed the importance of the QTL for Ca2+ contents in different shoot fractions under saline condtions as well. The QTLs are also related to the tiller numbers and leaf development under saline conditions (Chapter 4). Shabala et al. (2005) pointed out that in barley Ca2+ in the cytosol is involved in the ameliorative mechanisms to enhance plant salt tolerance by maintaining K+/Na+ homeostasis in the cytosol and normal photosynthetic properties.
Chromosome 3H in barley is syntenic to chromosome 1 in rice (Close et al. 2009). The rice chromosome harbours the most important QTLs/genes for salt tolerance found in the past such as Saltol controlling Na+/K+ ratio (Thomson et al. 2010) and SCK1 (Lin et al. 2004). The SCK1 gene has been cloned using map-based cloning and it was found to encode a Na+- selective transporter (HKT1;5) (Ren et al. 2005). In addition, TmHKT1;5 increased yield of durum wheat under saline field conditions significantly (James and Munns 2011; Munns et al. 2012). We often found QTLs for Ca2+ co-localized with Na+/K+ ratio on 3H and 4H (Chapters 3 and 5) suggesting the dependency between these traits. Other divalent cations such as Mg2+, Ba2+ and Zn2+ might have similar funtions in barley (Shabala et al. 2005) and other crops (Bansal and Shah 1978). Ca2+ and Mg2+ contents were always highly positively correlated in our studies (all Chapters). QTLs for Mg2+ co-localized with Ca2+ (Chapter 3) and with salt tolerance as well (Chapters 5). This suggests a common transporter of these two ions to be present in the regions of 3H and 4H (might also for 6H) that may positively affect Na+ and K+ homeostasis and salt tolerance
The gene(s) responsible for the 3H QTL which controls Ca2+ may function in a similar way as the locus controlling Zn2+ accumulation in barley (Lonergan et al. 2009). The Zn+ locus was later found to be strongly associated with Na+ accumulation and named HvNax4 (Rivandi et al. 2011). This gene was suggested to be identical HvCLB4; a gene homologous to SOS3. The 3H QTL region is not at the same locus as HvNax4 but it shares phenotypic characteristics with HvNax4 as it strongly controlled Ca2+, the most important divalent cation involved in salt stress signalling and salt tolerance. We suggested in Chapter 4 that barley HvCAX2 gene (Edmond et al. 2009) which is transcriptionally up regulated at high Ca2+

General discussion �����������������������������������������������������������������������������������������������������������������������������������������������������������������������������������������������������������������������������������������������������
99
concentrations under Na+ stress might be responsible for the high concentration of Ca2+ in old leaves of our barley plants. The increased Ca2+ content in old leaves may then activate the SOS pathway (Liu and Zhu 1998); Yokoi et al. 2002), which regulates extrusion of Na+ ion from the cytosol by activating vacuolar HvNHX transporters that pump Na+ into the vacuole (Mahajan et al. 2008). This may explain why Steptoe was more salt tolerant while at the same time it had a relatively high Na+ content in the leaves (Chapters 2 and 4). This hypothesis may be further explored and corroborated by expression studies of CAX, SOS and NHX genes using recombinants in the 3H QTL region, together with further examination of the 3H QTL region.
Osmotic regulation and salt stress tolerance
Osmotic stress is the first stress that plants encounter in saline soil and has an immediate influence on the growth of plants under salinity stress (Munns and Tester 2008). High concentrations of salts in root growing media cause osmotic pressure, reduced water uptake or loss of water in roots (Horie et al. 2011). The molecular response of barley to the osmotic phase has been targeted in several transcriptome studies (Ueda et al. 2006; Walia et al. 2007; Walia et al. 2006) and resulted in the discovery of early response genes controlling osmoprotection under salinity stress.
The 2cM interval of the 6H QTL is in the syntenic region between LOC_Os02g41990 and LOC_Os02g45820 in rice. Searching on the rice genome database (http://rice.plantbiology.msu.edu/index.shtml) we found among several hundred genes locating within these two loci two aquaporin genes, two dehydrin genes, and one CBF gene. Walia et al. (2006) showed that the expression of barley dehydrin, aquaporin and CBF genes was associated with osmotic stress induced by high salt concentration in hydroponics. In plants the CBF gene family was critical in a pathway signalling of osmotic stress caused by drought and salinity. The CBF3 gene was associated with drought and cold stress in barley (Choi et al. 2000). Three CBF genes partly explained the variation in salt tolerance in Tibetan barley (Wu et al. 2011). On the other hand, Dehydrins were found to play an important protective role during cellular dehydration, improving enzyme functioning under the conditions of low water availability. Dehydrin gene expression was strongly induced by drought and cold stresses in rice and barley (Park et al. 2006). Du et al. (2011) showed that two dehydrin genes might contribute to improved drought and salt tolerance of Tibetan and wild barley.
Recent studies on osmotic stress tolerance in barley revealed that under saline conditions, aquaporins - channel proteins that mediate transport of water and small neutral molecules across cellular membrane- relate to salt tolerance. In barley roots, three types of plasma membrane aquaporin genes (PIP) were expressed under osmotic stresses (Katsuhara et al. 2002). HvPIP2;1 is most abundant in the plasma membrane and associated with root water management and osmotic responses. Katsuhara et al. (2003) showed that overexpression of HvPIP2;1 makes rice plants more sensitive to mild salt stress. The activities of aquaporin genes which relate to root hydraulic conductivity played an important role in short term salt

Chapter 6 �����������������������������������������������������������������������������������������������������������������������������������������������������������������������������������������������������������������������������������������������������
100
tolerance mechanisms (Katsuhara et al. 2011). The barley gene HvPIP2;1 was down regulated at moderate to high salt levels in salt tolerant barley genotypes (Koshio et al. 2002; Horie et al. 2011b). On the other hand, Zawoznik et al. (2011) reported for the first time that the Azospirillum strain which induced up regulation of HvPIP2;1 expression helped to mitigate NaCl stress in barley grown on hydroponics at 200 mM NaCl. This barley aquaporin gene therefore justifies more investigations to better understand its functions and significance of the regulation plant stress brought about by major environmental stresses such as salinity and drought Horie et al. (2011). This all suggests that genes on our 6H QTL region control osmotic and ionic stress tolerance.
The salt tolerant QTL on chromosome 6H co-localized with strong QTLs for chlorophyll content, plant height, tiller numbers and leaf senescence under salinity stress and with smaller effects under control conditions. This suggests that these related traits might be controlled by a single gene with pleiotropic effects. Several QTLs for shoot, root growth and salt tolerance (Chapter 3) or related traits such as K+/Na+ ratio and plant height under saline conditions (Xuet et al. 2009) were mapped at the 6H QTL region. In the same region Ellis et al. (2002) also detected in a field trial with barley a QTLfor grain yield. These may point to candidate genes controlling growth or growth vigor with stronger expression under saline than control conditions. The genes on 6H for growth might have epistatic effects on other ion content traits which would explain the small QTL for ion contents detected in this location (Chapter 5). However, it is also possible that there are genes that have adaptive effects on salt tolerance (Chen et al. 2007) in the QTL region of 6H. In addition, Huang et al (2008) mapped a barley HvHKT1;3 at the region of our 6H QTL and copies of this gene were found in syntenic regions of chromosomes 6B and 6D in wheat and on chromosome 2 in rice. No detailed information is available with respect to cellular location and funtion of this gene, but HKT1;3 may affect ion vacuolar compartmentation (Huang et al. 2008). We measured ion contents in the whole shoot which may have limited our ability to detect ion-related QTLs responsible for HKT1;3. Ion compartmentation or vacuolar sequestration might partly explain why barley is more salt tolerant than other cereals (Munns and Tester 2008; Shabala et al. 2010; Mian et al. 2011). We can therefore not exclude that the 6H QTL influence ion tissue tolerance, and HKT1;3 may be an interesting candidate gene. It is thought that further analysis of the 6H QTL with help of high density marker map and the barley genome sequence will further elucidate the mechanisms and genes involved in tolerance for osmotic and ionic stress.
Salt tolerance screening strategies
Genetic analysis in many crops and species (tomato, rice, citrus, Arabidopsis and barley) suggests that QTLs detected for salt tolerance differ with developmental stage (Flowers and Flowers 2005). We focused our studies on the vegetative stage, as it is the most sensitive stage to salinity in cereals (Munns and Tester 2008). Most of the previous studies evaluated genetic variation for salt tolerance at one single level of stress and one specific stage of development (time). In Chapter 2 we evaluated 24 lines at different combinations of levels of stress and development to identify suitable traits for screening and contrasting parents for genetic analysis. Different traits contributing to salt tolerance such as osmotic and ionic

General discussion �����������������������������������������������������������������������������������������������������������������������������������������������������������������������������������������������������������������������������������������������������
101
effects may influence the responses of several important parental lines such as L94, Morex and Steptoe. The importance of these stress components depends on the duration of exposure to salinity (Chapter 2). The performance of Steptoe and Morex in our tests after short time of salt stress is in agreement with the findings of Witzel et al. (2009). However, two genotypes showed opposite performance after prolonged exposure to salt stress and this result was similar to those of Mano and Takeda (1997). The genotypes showing salt tolerance after a short exposure such as Morex, Rex and Class 13 probably are more tolerant to osmotic stress (Munns et al. 2002). They are not necessarily contributors to tolerance to ionic stresses operating later in time. Ionic tolerance on the other hand might contribute to the better growth of Steptoe, L94 and 116-5 cultivars after prolonged exposure to stress (Munns and Tester 2008). Munns et al. (2002) found no difference of the leaf elongation rate between 20 cultivars of wheat, barley and triticale in the first 10 days after salinization. In rice the initial growth reduction upon salinization is possibly due to osmotic stress caused by a limitation of water supply to the root (Yeo et al. 1991). The time-dependent salt tolerance of L94, Steptoe, Morex and other parental lines described in Chapter 2 demonstrates that traits suggested to improve salt tolerance should be properly defined in terms of the stage of crop development and stress levels.
It is important to consider the specific attributes of the target environment to which abiotic stress-tolerant varieties need to be adapted and the impact of these attributes on yield (Trethowan and Reynolds 2007). In this thesis we have used a hydroponics system that allows us to easily monitor the extent of ion transport in different parts of the barley plant, including roots, while avoiding the interaction of salt tolerance traits with environmental factors as may occur under field conditions and complicate selection. Our findings therefore still need to be translated to the target field environment. In our different diverse sets of barley genotypes examined, shoot growth under saline conditions was highly controlled by genetic factors (h2: 0.5-0.9 Chapters 2-5). Similarly shoot Na+ and Cl- are highly heritable (h2: 0.8) (Chapter 5). Salt tolerance was also found highly heritable (h2=0.69, Chapter 3). Under saline stress, a highly significant negative correlation between shoot Na+ and Cl- with shoot growth (Chapter 2) and salt tolerance (Chapters 3 and 5) was observed. A linear relationship between shoot Na+ and Cl- (r=0.85-0.96) under saline conditions was always found in the current studies. The outcome is highly similar to what Tavakkoli et al. (2010 and 2012) found in testing barley genotypes in pot and field experiments using saline soil. However, in the same studies, Tavakkoli et al. (2012) found low heritability for salt tolerance (h2= 0.3), shoot Na+ and Cl- (h2= 0.3) as well as no significant correlation between shoot Na+ and Cl- and salt tolerance under their hydroponics condition. In addition, Tavakkoli et al. (2012) showed the correlation between Na+ and Cl- in hydroponics compared to field and pots was lower (r=0.76 in hydroponics; 0.94 in pots and 0.84 in the field experiments). This observation indicates that our hydroponics system might be more relevant to growing conditions in the field than that of Tavakkoli et al. (2012). In these studies of Tavakkoli et al. (2010a,b and 2012) the high concentrations of NaCl in the soil systems increased the concentration of leaf Cl- more than the concentration of Na+ which is opposite to their hydroponic systems. We found similar changes in Na+ and Cl- between our hydroponics and the soil systems of Tavakkoli et al. (2010a, b and 2012) when we increased NaCl in the growing solution from 0 mM NaCl to

Chapter 6 �����������������������������������������������������������������������������������������������������������������������������������������������������������������������������������������������������������������������������������������������������
102
moderate and severe stresses (Chapter 1). More evidence of the relevance of our results using the hydroponics system comes from evaluation of 8 contrasting genotypes selected from association panel in pots with sand (unpublished data). We observed a good correlation of ion accumulations in these 8 genotypes under our hydroponics and sand-based experiments. Salt tolerance was also mostly similar as 6 out of 8 genotypes showed consistency in response to salinity in these systems. In addition, other studies showed that salinity tolerance evaluated in hydroponics correlated well with those of soil-based screening, for instance in the evaluation a diverse set of wheat genotypes (El-Hendawy et al. 2009; Genc et al. 2007) or a large mapping study in wheat (Gorham et al. 1997). The most important QTLs/genes that have been shown to significantly contribute to salt tolerance in wheat (Lindsay et al. 2004; Munns and James 2003; Munns et al. 2012) and rice (Bonilla et al. 2002; Lin et al. 2004; Ren et al. 2005) under field conditions have been identified with the help of hydroponics systems. This suggests that the traits and genes identified under our hydroponics system can be used to improved salt tolerance in the field. Biparental QTL mapping and association mapping for salt tolerance
Traditional (biparental) QTL mapping has been commonly employed to detect quantitative trait loci (QTLs) because of its high power to detect QTLs (Yu and Buckler 2006). The biparental QTL mapping approach has been successfully used for the genetic analysis of salt tolerance in cereals (Mano and Takeda 1997; Elis et al. 2002; Bonilla et al. 2002; Munns and James 2003; Lin et al. 2004; Lindsay et al. 2004; Genc et al. 2010; Shavrukov et al. 2010; Rivandi et al. 2010 and Chapter 3 of this thesis). To widen genetic variation in the breeding programs researchers used wild, primitive and cultivated materials which have been developed in and adapted to diverse and marginal environments (Garthwaite et al. 2005; Colmer et al. 2006; Nevo and Chen 2010). Traditional QTL mapping studies where one of the parents was a wheat landrace (Line 149) (Munns and James 2003) or a wild barley (Shavrukov et al. 2010) identified several loci (Nax1, Nax2 in wheat and HvNax3 in barley) contributing significantly to salt exclusion that might be useful for crop improvement (Munns et al. 2012). However, the difficulties caused by interspecific crossing between wild relatives and improved cultivars like linkage drag have hampered the progress of salt tolerance breeding (Colmer et al. 2006). In addition, biparental QTL mapping is limited by the number of alleles evaluated and it suffers from mapping inaccuracy due to the low frequency of recombination events between the parental genomes during the generation of a mapping population. Recently, association mapping methods have been introduced to crops (Flint-Garcia 2003). This approach showed to be powerful in detecting QTLs for complex traits in barley in terms of mapping resolution and number of alleles evaluated (Kraakman et al. 2004; Pasam et al. 2012). We evaluated a barley collection that included landraces and old and modern cultivars developed from a wide range of ecological habitats all around the world including saline areas like the Fertile Crescent and Tibet (Nevo et al. 2004; Qiu et al. 2011). We showed that a large genetic variation for salt tolerance and related traits was present in this collection (Chapter 5) and resulted in much more QTLs (in total more than 100 trait-marker associations) associated with salt tolerance than the biparental QTL mapping (Mano and Takeda 1997; Ellis et al. 2002; Shavrukov et al. 2010; Chapter 3). In addition, the dense

General discussion �����������������������������������������������������������������������������������������������������������������������������������������������������������������������������������������������������������������������������������������������������
103
molecular map in combination with the higher recombination events enabled the detection of QTLs affecting salt tolerance and growth-related traits as accurate as 2cM (6H QTL). Other QTLs found with biparental QTL mapping for abiotic stress including drought and salinity often span up to 30cM (Chapter 3; review of Collin at al. 2008). QTLs detected with association mapping thus can verify QTLs found previously using different methods, and help narrow them down to a small genomic region. In the vicinity of the QTL 2H region in our biparental mapping population (Chapter 3) the association mapping study identified QTLs for salt tolerance and leaf senescence. More evidence for the contribution of this QTL region to salt tolerance in barley and its potentials for breeding comes from the co-localization with a QTL identified by Zhou et al. (2012), which is also in the syntenic region of Nax1 in wheat (Lindsay et al. 2006). In association mapping several important QTLs were identified including a new strong QTL for ion homeostasis on 4H in barley described earlier. This might reveal that in our worldwide association panel there are barley lines that contribute novel genes and/or alleles that strongly contribute to salt exclusion. In addition, association mapping can identify new lines for future study and as parents in breeding programs.
The success of association mapping however depends very much on the understanding of the LD in the population and the methods to account for the confounding of population structure and rare marker alleles. This section discusses our strategies to deal with these problems. Lam et al. (2007) showed that rare genotypes and alleles are more likely to result in spurious associations. As a common practice to avoid spurious detections (Comadran et al 2011), rare SNPs (less than 10% allele frequency) were removed from our dataset (Chapter 5). This might results in loss of information and limits the ability to capture variation associated with rare alleles (Brachi et al. 2011). Ardlie et al. (2002) showed that loci with markers having a lower allele frequency than 5-10% have less power to detect weak genetic effects. However, there is strong evidence that rare alleles play an important role in complex disease etiology and may have larger genetic effects than common variants in human (Manolio et al. 2009). Rare alleles might partly explain the “missing heritability” of the plant adaptive traits in the field (Brachi et al. 2011). We found in our association panel that the extreme and most consistent salt tolerant genotypes come from North Africa (also the more salt tolerant group). The worst and most consistent sensitive genotypes come from America (the more sensitive group). This genetic variation for salt tolerance therefore appears to overlap with patterns of population structure. Statistically accounting for structural confounding can reduce the association signals around the major stress tolerance genes (Brachi et al. 2011). However, the extreme genotypes in the association panel might still be donors of the useful alleles. It is expected that a better understanding of LD decay (Rafalski 2002), the development of dense marker sets and high power association mapping experiments would help researchers to fully explain the heritable variation underlying stress tolerance traits (Price et al. 2010; Brachi et al. 2011).
LD is the non-random association of alleles at two or more loci. In contrast to out-crossing species like maize, barley is a self-fertilizing inbreeding species with a narrow genetic basis and theoretically extensive LD (slow decay) (Flint-Garcia 2003). This is predicted to result in a combination of low resolution and a high frequency of spurious associations (Rostoks et al. 2006). In barley, LD has been reported to vary from 50-60 cM (Malysheva-Otto et al. 2006;

Chapter 6 �����������������������������������������������������������������������������������������������������������������������������������������������������������������������������������������������������������������������������������������������������
104
Rostoks et al. 2006) down to 10cM (Kraakman et al. 2004; Zhou et al. 2012b; Pasam et al. 2012) depending on number of markers used, type of population and how the confounding of population structure is corrected. With sufficient markers and better tools available to deal with structural confounding, LD decay in barley was determined between 1.5 and 10cM in a highly structured (Comadran et al. 2009; Zhang et al. 2009) or in more diverse landrace barley populations (Rodriguez et al. 2012; Comadran et al. 2011). Using the same set of SNP markers and the association panel as in Chapter 5, Pasam et al. (2012) reported LD decay from 5 to 10cM. Even 1 cM encompasses an enormous physical distance and may contain many genes, which poses a challenge to geneticists sifting for candidate genes (Hayes 2006). We therefore used a novel Eigenanalysis (Principle component analysis- PCA) method which efficiently accounts for population structure (Patterson et al. 2006; Price et al. 2010) to better understand LD in the world-wide barley population with an ultimate aim to incorporate the LD information and accurately map QTLs for salt tolerance and the related traits. In our study, Eigenanalysis or PCA performed a greater correction to markers with large differences in allele frequency (Price at al. 2010) and revealed fast LD decay (2-4cM). This short LD decay also can be found in other barley studies (Rostoks et al. 2006; Comadran et al. 2009 and 2012). Slower LD decays were found with other models in our study (5-8 cM) which are similar with Pasam et al. (2012). Zhou et al. (2012) found LD decay ranging from 4-16cM in ten barley breeding populations across the United States. The higher the genetic diversity found within the population, the shorter the LD decay. LD decay ranging from 2-4cM in our population using the Eigenanalysis model points to large genetic diversity. The success of our approach in Chapter 5 is evidenced by numerous marker-trait associations found using association mapping. We showed earlier that QTLs detected by association mapping are mapped as accurately as fine-mapped salt tolerance QTLs identified by biparental QTL mapping (Chapter 3 and Shavrukov et al. 2010). This greatly reduces time and efforts to verify and fine map other published QTLs that co-localize with our QTLs. A strong population structure-independent QTL controlling salt tolerance that co-localized with QTLs for other related traits such as biomass, tiller numbers, chlorophyll content and leaf senescence was detected on 6H. Another strong QTL on 4H controls the contents of various ions including Na+, K+ Na+/K+ and Cl-.
Concluding remarks
Barley is a good model crop to study different mechanisms conferring salt tolerance in cereals. Using traditional QTL mapping in complement to a new association mapping methods allowed us efficiently to explore genetic diversity of salt tolerance in barley. The developments with respect of association mapping technology highly increased the detection power and mapping resolution. Traits and QTLs identified in this thesis suggested both osmotic and ionic stress tolerant genes to be of importance for salt tolerant breeding. Table 1 summarizes the major QTLs identified in this thesis with their putative functions to give plant breeders tools for marker-assisted introgression of salt tolerance genes in barley breeding programs. Some QTLs were found to be syntenic with the important QTLs/genes for salt tolerance found in wheat and rice such as Na+ and K+ transporter gene families. Other QTLs are newly found suggesting the presence of novel genes important for homeostasis or

General discussion �����������������������������������������������������������������������������������������������������������������������������������������������������������������������������������������������������������������������������������������������������
105
transportation of Cl- and Ca2+ and osmotic tolerance. As for other complex traits, association mapping shows to be a powerful and promising approach to dissect the complexity of salt tolerance in barley. Recently the barley research community made available a molecular map with a seven times higher density of SNP markers that enables further investigation with the association panel used in this thesis. This in combination with large variation present in the assocation mapping panel and a low LD decay will greatly facilitate fine-map QTL for gene cloning. We believe that by comparing diffent genes and genetic combinations suggested in this thesis researchers will be able to better understand the physiological and genetic basis of salt tolerance and to assist development of salt tolerant crops.
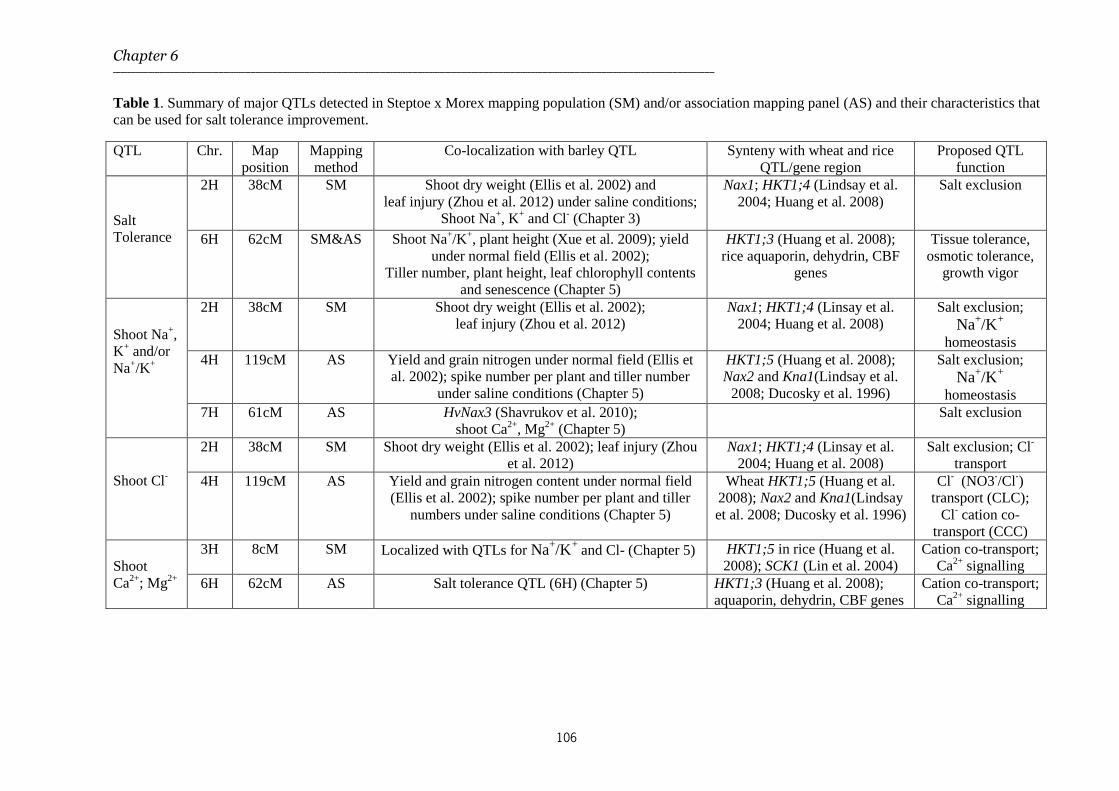
Chapter 6 �����������������������������������������������������������������������������������������������������������������������������������������������������������������������������������������������������������������������������������������������������
106
Table 1. Summary of major QTLs detected in Steptoe x Morex mapping population (SM) and/or association mapping panel (AS) and their characteristics that can be used for salt tolerance improvement.
QTL Chr. Map position
Mapping method
Co-localization with barley QTL Synteny with wheat and rice QTL/gene region
Proposed QTL function
Salt Tolerance
2H 38cM SM
Shoot dry weight (Ellis et al. 2002) and leaf injury (Zhou et al. 2012) under saline conditions;
Shoot Na+, K+ and Cl- (Chapter 3)
Nax1; HKT1;4 (Lindsay et al. 2004; Huang et al. 2008)
Salt exclusion
6H 62cM SM&AS Shoot Na+/K+, plant height (Xue et al. 2009); yield under normal field (Ellis et al. 2002);
Tiller number, plant height, leaf chlorophyll contents and senescence (Chapter 5)
HKT1;3 (Huang et al. 2008); rice aquaporin, dehydrin, CBF
genes
Tissue tolerance, osmotic tolerance,
growth vigor
Shoot Na+, K+ and/or Na+/K+
2H 38cM SM Shoot dry weight (Ellis et al. 2002); leaf injury (Zhou et al. 2012)
Nax1; HKT1;4 (Linsay et al. 2004; Huang et al. 2008)
Salt exclusion; Na+/K+
homeostasis 4H 119cM AS Yield and grain nitrogen under normal field (Ellis et
al. 2002); spike number per plant and tiller number under saline conditions (Chapter 5)
HKT1;5 (Huang et al. 2008); Nax2 and Kna1(Lindsay et al. 2008; Ducosky et al. 1996)
Salt exclusion; Na+/K+
homeostasis 7H 61cM AS HvNax3 (Shavrukov et al. 2010);
shoot Ca2+, Mg2+ (Chapter 5) Salt exclusion
Shoot Cl-
2H 38cM SM Shoot dry weight (Ellis et al. 2002); leaf injury (Zhou et al. 2012)
Nax1; HKT1;4 (Linsay et al. 2004; Huang et al. 2008)
Salt exclusion; Cl- transport
4H 119cM AS Yield and grain nitrogen content under normal field (Ellis et al. 2002); spike number per plant and tiller
numbers under saline conditions (Chapter 5)
Wheat HKT1;5 (Huang et al. 2008); Nax2 and Kna1(Lindsay et al. 2008; Ducosky et al. 1996)
Cl- (NO3-/Cl-) transport (CLC);
Cl- cation co-transport (CCC)
Shoot Ca2+; Mg2+
3H 8cM SM Localized with QTLs for Na+/K+ and Cl- (Chapter 5) HKT1;5 in rice (Huang et al. 2008); SCK1 (Lin et al. 2004)
Cation co-transport; Ca2+ signalling
6H 62cM AS Salt tolerance QTL (6H) (Chapter 5) HKT1;3 (Huang et al. 2008); aquaporin, dehydrin, CBF genes
Cation co-transport; Ca2+ signalling

Reference �����������������������������������������������������������������������������������������������������������������������������������������������������������������������������������������������������������������������������������������������������
107
Reference
Abel GH (1969) Inheritance of Capacity for Chloride Inclusion and Chloride Exclusion by Soybeans. Crop Science 9 (6):697
Aghnoum R, Marcel TC, Johrde A, Pecchioni N, Schweizer P, Niks RE (2010) Basal host resistance of barley to powdery mildew: connecting quantitative trait Loci and candidate genes. Mol Plant Microbe Interact 23:91-102
Apse MP, Aharon GS, Snedden WA, Blumwald E (1999) Salt tolerance conferred by overexpression of a vacuolar Na+/H+ antiport in Arabidopsis. Science 285:1256-1258
Apse MP, Blumwald E (2007) Na+ transport in plants. Febs Letters 581:2247-2254 Ardlie KG, Lunetta KL, Seielstad M (2002) Testing for population subdivision and association in four
case-control studies. Am J Hum Genet 71:304-311 Arzani A (2008) Improving salinity tolerance in crop plants: a biotechnological view. In Vitro Cellular
& Developmental Biology-Plant 44:373-383 Atwell S, Huang YS, Vilhjalmsson BJ, Willems G, Horton M, Li Y, Meng D, Platt A, Tarone AM, Hu
TT, Jiang R, Muliyati NW, Zhang X, Amer MA, Baxter I, Brachi B, Chory J, Dean C, Debieu M, de Meaux J, Ecker JR, Faure N, Kniskern JM, Jones JD, Michael T, Nemri A, Roux F, Salt DE, Tang C, Todesco M, Traw MB, Weigel D, Marjoram P, Borevitz JO, Bergelson J, Nordborg M (2010) Genome-wide association study of 107 phenotypes in Arabidopsis thaliana inbred lines. Nature 465:627-631
Azadgoleh E, Yasari E (2007) Wheat and barely response to salinity stress. Ecology, Environment and Conservation 13:453-458
Badr A, Muller K, Schafer-Pregl R, El Rabey H, Effgen S, Ibrahim HH, Pozzi C, Rohde W, Salamini F (2000) On the origin and domestication history of barley (Hordeum vulgare). Mol Biol Evol 17:499-510
Balding DJ (2006) A tutorial on statistical methods for population association studies. Nature Reviews Genetics 7:781-791
Bansal V, Shah D (1978) The effect of divalent cations on the optimal salinity and salt tolerance of petroleum sulfonate and ethoxylated sulfonate mixtures in relation to improved oil recovery. Journal of the American Oil Chemists' Society 55:367-370
Bennett J, Khush GS (2003) Enhancing Salt Tolerance in Crops Through Molecular Breeding: A New Strategy. Journal of Crop Production 7:11-65
Bernardo R (2008) Molecular Markers and Selection for Complex Traits in Plants: Learning from the Last 20 Years. Crop Sci 48:1649-1664
Blumwald E (2000) Sodium transport and salt tolerance in plants. Current opinion in cell biology 12:431-434
Blumwald E, Aharon GS, Apse MP (2000) Sodium transport in plant cells. Biochim Biophys Acta 1465:140-151
Bonilla P, Dvorak J, Mackill D, Deal K, Gregorio G (2002) RFLP and SSLP mapping of salinity tolerance genes in chromosome 1 of rice (Oryza sativa L.) using recombinant inbred lines. Philippine Agricultural Scientist 85:68-76
Brachi B, Morris G, Borevitz J (2011) Genome-wide association studies in plants: the missing heritability is in the field. Genome Biology 12:232
Byrt CS, Platten JD, Spielmeyer W, James RA, Lagudah ES, Dennis ES, Tester M, Munns R (2007) HKT1;5-like cation transporters linked to Na+ exclusion loci in wheat, Nax2 and Kna1. Plant Physiology 143:1918-1928
Carillo P, Parisi D, Woodrow P, Pontecorvo G, Massaro G, Annunziata MG, Fuggi A, Sulpice R (2011) Salt-induced accumulation of glycine betaine is inhibited by high light in durum wheat. Functional Plant Biology 38:139-150
Chen FQ, Hayes PM (1989) A Comparison of Hordeum-Bulbosum-Mediated Haploid Production Efficiency in Barley Using Invitro Floret and Tiller Culture. Theoretical and Applied Genetics 77:701-704
Chen Z, Cuin TA, Zhou M, Twomey A, Naidu BP, Shabala S (2007a) Compatible solute accumulation and stress-mitigating effects in barley genotypes contrasting in their salt tolerance. Journal of Experimental Botany 58:4245-4255

Reference �����������������������������������������������������������������������������������������������������������������������������������������������������������������������������������������������������������������������������������������������������
108
Chen Z, Cuin TA, Zhou M, Twomey A, Naidu BP, Shabala S (2007b) Compatible solute accumulation and stress-mitigating effects in barley genotypes contrasting in their salt tolerance. J Exp Bot 58:4245-4255
Chen Z, Newman I, Zhou M, Mendham N, Zhang G, Shabala S (2005) Screening plants for salt tolerance by measuring K+ flux: a case study for barley. Plant Cell and Environment 28:1230-1246
Chen Z, Pottosin, II, Cuin TA, Fuglsang AT, Tester M, Jha D, Zepeda-Jazo I, Zhou M, Palmgren MG, Newman IA, Shabala S (2007c) Root plasma membrane transporters controlling K+/Na+ homeostasis in salt-stressed barley. Plant Physiol 145:1714-1725
Choi DW, Close TJ (2000) A newly identified barley gene, Dhn12 encoding a YSK2 DHN, is located on chromosome 6H and has embryo-specific expression. Theoretical and Applied Genetics 100:1274-1278
Choi DW, Koag MC, Close TJ (2000) Map locations of barley Dhn genes determined by gene-specific PCR. Theoretical and Applied Genetics 101:350-354
Close TJ, Bhat PR, Lonardi S, Wu YH, Rostoks N, Ramsay L, Druka A, Stein N, Svensson JT, Wanamaker S, Bozdag S, Roose ML, Moscou MJ, Chao SAM, Varshney RK, Szucs P, Sato K, Hayes PM, Matthews DE, Kleinhofs A, Muehlbauer GJ, DeYoung J, Marshall DF, Madishetty K, Fenton RD, Condamine P, Graner A, Waugh R (2009) Development and implementation of high-throughput SNP genotyping in barley. BMC Genomics 10
Cockram J, White J, Zuluaga DL, Smith D, Comadran J, Macaulay M, Luo ZW, Kearsey MJ, Werner P, Harrap D, Tapsell C, Liu H, Hedley PE, Stein N, Schulte D, Steuernagel B, Marshall DF, Thomas WTB, Ramsay L, Mackay I, Balding DJ, Waugh R, O'Sullivan DM, Consortium A (2010) Genome-wide association mapping to candidate polymorphism resolution in the unsequenced barley genome. Proceedings of the National Academy of Sciences of the United States of America 107:21611-21616
Collard BCY, Mackill DJ (2008) Marker-assisted selection: an approach for precision plant breeding in the twenty-first century. Philos T R Soc B 363:557-572
Collins NC, Tardieu F, Tuberosa R (2008) Quantitative trait loci and crop performance under abiotic stress: Where do we stand? Plant Physiology 147:469-486
Colmenero-Flores JM, Martinez G, Gamba G, Vazquez N, Iglesias DJ, Brumos J, Talon M (2007) Identification and functional characterization of cation-chloride cotransporters in plants. Plant J 50:278-292
Colmer TD, Flowers TJ, Munns R (2006) Use of wild relatives to improve salt tolerance in wheat. J Exp Bot 57:1059-1078
Colmer TD, Munns R, Flowers TJ (2005) Improving salt tolerance of wheat and barley: future prospects. Australian Journal of Experimental Agriculture 45:1425-1443
Comadran J, Ramsay L, MacKenzie K, Hayes P, Close TJ, Muehlbauer G, Stein N, Waugh R (2011) Patterns of polymorphism and linkage disequilibrium in cultivated barley. Theoretical and Applied Genetics 122:523-531
Comadran J, Thomas WT, van Eeuwijk FA, Ceccarelli S, Grando S, Stanca AM, Pecchioni N, Akar T, Al-Yassin A, Benbelkacem A, Ouabbou H, Bort J, Romagosa I, Hackett CA, Russell JR (2009) Patterns of genetic diversity and linkage disequilibrium in a highly structured Hordeum vulgare association-mapping population for the Mediterranean basin. Theor Appl Genet 119:175-187
Conn SJ, Gilliham M, Athman A, Schreiber AW, Baumann U, Moller I, Cheng NH, Stancombe MA, Hirschi KD, Webb AAR, Burton R, Kaiser BN, Tyerman SD, Leigh RA (2011) Cell-Specific Vacuolar Calcium Storage Mediated by CAX1 Regulates Apoplastic Calcium Concentration, Gas Exchange, and Plant Productivity in Arabidopsis. Plant Cell 23:240-257
Cuin TA, Betts SA, Chalmandrier R, Shabala S (2008) A root's ability to retain K+ correlates with salt tolerance in wheat. J Exp Bot 59:2697-2706
Cuin TA, Parsons D, Shabala S (2010) Wheat cultivars can be screened for NaCl salinity tolerance by measuring leaf chlorophyll content and shoot sap potassium. Functional Plant Biology 37:656-664
Cuin TA, Tian Y, Betts SA, Chalmandrier R, Shabala S (2009) Ionic relations and osmotic adjustment in durum and bread wheat under saline conditions. Functional Plant Biology 36:1110-1119
Reference �����������������������������������������������������������������������������������������������������������������������������������������������������������������������������������������������������������������������������������������������������
109
D'hoop BB, Paulo MJ, Kowitwanich K, Sengers M, Visser RGF, van Eck HJ, van Eeuwijk FA (2010) Population structure and linkage disequilibrium unravelled in tetraploid potato. Theoretical and Applied Genetics 121:1151-1170
Dang YP, Dalal RC, Mayer DG, McDonald M, Routley R, Schwenke GD, Buck SR, Daniells IG, Singh DK, Manning W, Ferguson N (2008) High subsoil chloride concentrations reduce soil water extraction and crop yield on Vertosols in north-eastern Australia. Australian Journal of Agricultural Research 59:321-330
Dewey DR, Lu KH (1959) A correlation and path coefficient analysis of components of crested wheatgrass seed production Agron J 51:515-518
Du JB, Yuan S, Chen YE, Sun X, Zhang ZW, Xu F, Yuan M, Shang J, Lin HH (2011) Comparative expression analysis of dehydrins between two barley varieties, wild barley and Tibetan hulless barley associated with different stress resistance. Acta Physiologiae Plantarum 33:567-574
Dubcovsky J, Maria GS, Epstein E, Luo MC, Dvorak J (1996) Mapping of the K+/Na+ discrimination locus Kna1 in wheat. Theoretical and Applied Genetics 92:448-454
Edmond C, Shigaki T, Ewert S, Nelson MD, Connorton JM, Chalova V, Noordally Z, Pittman JK (2009) Comparative analysis of CAX2-like cation transporters indicates functional and regulatory diversity. Biochemical Journal 418:145-154
El-Hendawy SE, Ruan Y, Hu Y, Schmidhalter U (2009) A Comparison of Screening Criteria for Salt Tolerance in Wheat under Field and Controlled Environmental Conditions. Journal of Agronomy and Crop Science 195:356-367
Ellis RP, Forster BP, Gordon DC, Handley LL, Keith RP, Lawrence P, Meyer R, Powell W, Robinson D, Scrimgeour CM, Young G, Thomas WT (2002a) Phenotype/genotype associations for yield and salt tolerance in a barley mapping population segregating for two dwarfing genes. J Exp Bot 53:1163-1176
Ellis RP, Forster BP, Gordon DC, Handley LL, Keith RP, Lawrence P, Meyer R, Powell W, Robinson D, Scrimgeour CM, Young G, Thomas WTB (2002b) Phenotype/genotype associations for yield and salt tolerance in a barley mapping population segregating for two dwarfing genes. Journal of Experimental Botany 53:1163-1176
Ellis RP, Forster BP, Robinson D, Handley LL, Gordon DC, Russell JR, Powell W (2000) Wild barley: a source of genes for crop improvement in the 21st century? J Exp Bot 51:9-17
Ellis RP, Forster BP, Waugh R, Bonar N, Handley LL, Robinson D, Gordon DC, Powell W (1997) Mapping physiological traits in barley. New Phytologist 137:149-157
Falush D, Stephens M, Pritchard JK (2003) Inference of population structure using multilocus genotype data: Linked loci and correlated allele frequencies. Genetics 164:1567-1587
FAO (2008) FAO Land and Plant Nutrition Management Service. http://wwwfaoorg/ag/agl/agll/spush Farooq S, Farooq-E-Azam (2001) Co-existence of salt and drought tolerance in Triticeae. Hereditas
135:205-210 Flint-Garcia SA, Thornsberry JM, Buckler ESt (2003) Structure of linkage disequilibrium in plants.
Annu Rev Plant Biol 54:357-374 Flint-Garcia SA, Thuillet AC, Yu JM, Pressoir G, Romero SM, Mitchell SE, Doebley J, Kresovich S,
Goodman MM, Buckler ES (2005) Maize association population: a high-resolution platform for quantitative trait locus dissection. Plant Journal 44:1054-1064
Flowers TJ (2004) Improving crop salt tolerance. J Exp Bot 55:307-319 Flowers TJ, Flowers SA (2005) Why does salinity pose such a difficult problem for plant breeders?
Agricultural Water Management 78:15-24 Flowers TJ, Hajibagheri MA (2001) Salinity tolerance in Hordeum vulgare: ion concentrations in root
cells of cultivars differing in salt tolerance. Plant and Soil 231:1-9 Flowers TJ, Hajibagheri MA, Yeo AR (1991) Ion Accumulation in the Cell-Walls of Rice Plants
Growing under Saline Conditions - Evidence for the Oertli Hypothesis. Plant Cell and Environment 14:319-325
Forster BP, Ellis RP, Thomas WTB, Newton AC, Tuberosa R, This D, El-Enein RA, Bahri MH, Ben Salem M (2000) The development and application of molecular markers for abiotic stress tolerance in barley. Journal of Experimental Botany 51:19-27
Fricke W, Akhiyarova G, Wei WX, Alexandersson E, Miller A, Kjellbom PO, Richardson A, Wojciechowski T, Schreiber L, Veselov D, Kudoyarova G, Volkov V (2006) The short-term

Reference �����������������������������������������������������������������������������������������������������������������������������������������������������������������������������������������������������������������������������������������������������
110
growth response to salt of the developing barley leaf. Journal of Experimental Botany 57:1079-1095
Fukuoka S, Ebana K, Yamamoto T, Yano M (2010) Integration of Genomics into Rice Breeding. Rice 3:131-137
Garcia de Moral LFR, Y.; Elhani, S.; Martos, V.; Royo, C. (2005 ) Yield formation in Mediterranean durum wheat under two contrasting water regimes based on path-coefficient analysis Euphytica 146:203-212
Garthwaite AJ, von Bothmer R, Colmer TD (2005) Salt tolerance in wild Hordeum species is associated with restricted entry of Na+ and Cl- into the shoots. J Exp Bot 56:2365-2378
Genc Y, Mcdonald GK, Tester M (2007) Reassessment of tissue Na+ concentration as a criterion for salinity tolerance in bread wheat. Plant Cell and Environment 30:1486-1498
Genc Y, Oldach K, Verbyla AP, Lott G, Hassan M, Tester M, Wallwork H, McDonald GK (2010a) Sodium exclusion QTL associated with improved seedling growth in bread wheat under salinity stress. Theoretical and Applied Genetics 121:877-894
Genc Y, Tester M, McDonald GK (2010b) Calcium requirement of wheat in saline and non-saline conditions. Plant and Soil 327:331-345
Glenn EP, Brown JJ, Blumwald E (1999) Salt tolerance and crop potential of halophytes. Critical Reviews in Plant Sciences 18:227-255
Gorham J, Bridges J, Dubcovsky J, Dvorak J, Hollington PA, Luo MC, Khan JA (1997) Genetic analysis and physiology of a trait for enhanced K+/Na+ discrimination in wheat. New Phytologist 137:109-116
Gorham J, Bristol A, Young EM, Jones RGW, Kashour G (1990) Salt Tolerance in the Triticeae - K/Na Discrimination in Barley. Journal of Experimental Botany 41:1095-1101
Greenway H, Munns R (1980) Mechanisms of Salt Tolerance in Non-Halophytes. Annu Rev Plant Phys 31:149-190
Gregorio GB, Senadhira D (1993) Genetic-Analysis of Salinity Tolerance in Rice (Oryza-Sativa L). Theoretical and Applied Genetics 86:333-338
Gregorio GB, Senadhira D, Mendoza RD, Manigbas NL, Roxas JP, Guerta CQ (2002) Progress in breeding for salinity tolerance and associated abiotic stresses in rice. Field Crops Research 76:91-101
Guo Y, Quan RD, Lin HX, Mendoza I, Zhang YG, Cao WH, Yang YQ, Shang M, Chen SY, Pardo JM (2007) SCABP8/CBL10, a putative calcium sensor, interacts with the protein kinase SOS2 to protect Arabidopsis shoots from salt stress. Plant Cell 19:1415-1431
Han F, Ullrich SE, Romagosa I, Clancy JA, Froseth JA, Wesenberg DM (2003) Quantitative genetic analysis of acid detergent fibre content in barley grain. Journal of Cereal Science 38:167-172
Han N, Shao Q, Bao HY, Wang BS (2011) Cloning and Characterization of a Ca2+/H+ Antiporter from Halophyte Suaeda salsa L. Plant Mol Biol Rep 29:449-457
Harlan JR, Zohary D (1966) Distribution of Wild Wheats and Barley. Science 153:1074-& Hasegawa PM, Bressan RA, Zhu J-K, Bohnert HJ (2000a) PLANT CELLULAR AND MOLECULAR
RESPONSES TO HIGH SALINITY. Annual Review of Plant Physiology and Plant Molecular Biology 51:463-499
Hasegawa PM, Bressan RA, Zhu JK, Bohnert HJ (2000b) Plant cellular and molecular responses to high salinity. Annu Rev Plant Phys 51:463-499
Haseneyer G, Stracke S, Paul C, Einfeldt C, Broda A, Piepho HP, Graner A, Geiger HH (2010) Population structure and phenotypic variation of a spring barley world collection set up for association studies. Plant Breeding 129:271-279
Hauser F, Horie T (2010) A conserved primary salt tolerance mechanism mediated by HKT transporters: a mechanism for sodium exclusion and maintenance of high K(+)/Na(+) ratio in leaves during salinity stress. Plant Cell Environ 33:552-565
Hayes P, Szucs P (2006) Disequilibrium and association in barley: thinking outside the glass. Proc Natl Acad Sci U S A 103:18385-18386
Hepler PK (2005) Calcium: A central regulator of plant growth and development. Plant Cell 17:2142-2155
Holland JB (2007) Genetic architecture of complex traits in plants. Curr Opin Plant Biol 10:156-161

Reference �����������������������������������������������������������������������������������������������������������������������������������������������������������������������������������������������������������������������������������������������������
111
Horie T, Brodsky DE, Costa A, Kaneko T, Lo Schiavo F, Katsuhara M, Schroeder JI (2011a) K+ Transport by the OsHKT2;4 Transporter from Rice with Atypical Na+ Transport Properties and Competition in Permeation of K+ over Mg2+ and Ca2+ Ions. Plant Physiology 156:1493-1507
Horie T, Hauser F, Schroeder JI (2009) HKT transporter-mediated salinity resistance mechanisms in Arabidopsis and monocot crop plants. Trends Plant Sci 14:660-668
Horie T, Kaneko T, Sugimoto G, Sasano S, Panda SK, Shibasaka M, Katsuhara M (2011b) Mechanisms of Water Transport Mediated by PIP Aquaporins and Their Regulation Via Phosphorylation Events Under Salinity Stress in Barley Roots. Plant and Cell Physiology 52:663-675
Huang S, Spielmeyer W, Lagudah ES, Munns R (2008) Comparative mapping of HKT genes in wheat, barley, and rice, key determinants of Na+ transport, and salt tolerance. J Exp Bot 59:927-937
Huang SB, Spielmeyer W, Lagudah ES, James RA, Platten JD, Dennis ES, Munns R (2006) A sodium transporter (HKT7) is a candidate for Nax1, a gene for salt tolerance in durum wheat. Plant Physiology 142:1718-1727
Hui Z, Zhang ZB, Shao HB, Ping X, Foulkes MJ (2008) Genetic correlation and path analysis of transpiration efficiency for wheat flag leaves. Environmental and Experimental Botany 64:128-134
Husain S, Munns R, Condon AG (2003) Effect of sodium exclusion trait on chlorophyll retention and growth of durum wheat in saline soil. Australian Journal of Agricultural Research 54:589-597
Ingvarsson PK, Hall D, Tegstrom C (2010) Using association mapping to dissect the genetic basis of complex traits in plants. Brief Funct Genomics 9:157-165
Ingvarsson PK, Street NR (2011) Association genetics of complex traits in plants. New Phytologist 189:909-922
Isla R, Aragues R, Royo A (1998) Validity of various physiological traits as screening criteria for salt tolerance in barley. Field Crops Research 58:97-107
Isla R, Royo A, Aragues R (1997) Field screening of barley cultivars to soil salinity using a sprinkler and a drip irrigation. Plant and Soil 197:105-117
Jafary H, Albertazzi G, Marcel TC, Niks RE (2008) High diversity of genes for nonhost resistance of barley to heterologous rust fungi. Genetics 178:2327-2339
James RA, Blake C, Byrt CS, Munns R (2011) Major genes for Na(+) exclusion, Nax1 and Nax2 (wheat HKT1;4 and HKT1;5), decrease Na(+) accumulation in bread wheat leaves under saline and waterlogged conditions. Journal of Experimental Botany 62:2939-2947
James RA, Davenport RJ, Munns R (2006a) Physiological characterization of two genes for Na+ exclusion in durum wheat, Nax1 and Nax2. Plant Physiol 142:1537-1547
James RA, Munns R, von Caemmerer S, Trejo C, Miller C, Condon TA (2006b) Photosynthetic capacity is related to the cellular and subcellular partitioning of Na+, K+ and Cl- in salt-affected barley and durum wheat. Plant Cell Environ 29:2185-2197
James RA, Rivelli AR, Munns R, von Caemmerer S (2002) Factors affecting CO2 assimilation, leaf injury and growth in salt-stressed durum wheat. Functional Plant Biology 29:1393-1403
Jamil A, Riaz S, Ashraf M, Foolad MR (2011) Gene Expression Profiling of Plants under Salt Stress. Critical Reviews in Plant Sciences 30:435-458
Kaneko T, Zhang WS, Takahashi H, Ito K, Takeda K (2001) QTL mapping for enzyme activity and thermostability of beta-amylase in barley (Hordeum vulgare L.). Breeding Science 51:99-105
Katsuhara M, Akiyama Y, Koshio K, Shibasaka M, Kasamo K (2002) Functional analysis of water channels in barley roots. Plant and Cell Physiology 43:885-893
Katsuhara M, Koshio K, Shibasaka M, Hayashi Y, Hayakawa T, Kasamo K (2003) Over-expression of a barley aquaporin increased the shoot/root ratio and raised salt sensitivity in transgenic rice plants. Plant Cell Physiol 44:1378-1383
Katsuhara M, Rhee JY, Sugimoto G, Chung GC (2011) Early response in water relations influenced by NaCl reflects tolerance or sensitivity of barley plants to salinity stress via aquaporins. Soil Science and Plant Nutrition 57:50-60
Kearsey MJ (1998) The principles of QTL analysis (a minimal mathematics approach). Journal of Experimental Botany 49:1619-1623

Reference �����������������������������������������������������������������������������������������������������������������������������������������������������������������������������������������������������������������������������������������������������
112
Kilian B, Ozkan H, Kohl J, von Haeseler A, Barale F, Deusch O, Brandolini A, Yucel C, Martin W, Salamini F (2006) Haplotype structure at seven barley genes: relevance to gene pool bottlenecks, phylogeny of ear type and site of barley domestication. Molecular Genetics and Genomics 276:230-241
Kleinhofs A, Kilian A, Maroof MAS, Biyashev RM, Hayes P, Chen FQ, Lapitan N, Fenwick A, Blake TK, Kanazin V, Ananiev E, Dahleen L, Kudrna D, Bollinger J, Knapp SJ, Liu B, Sorrells M, Heun M, Franckowiak JD, Hoffman D, Skadsen R, Steffenson BJ (1993) A Molecular, Isozyme and Morphological Map of the Barley (Hordeum-Vulgare) Genome. Theoretical and Applied Genetics 86:705-712
Kloth KJ, Thoen MPM, Bouwmeester HJ, Jongsma MA, Dicke M (2012) Association mapping of plant resistance to insects. Trends in Plant Science 17:311-319
Knupffer H, van Hintum T (2003) Chapter 13 Summarised diversity-the Barley Core Collection. In: von Bothmer R, van Hintum T, Knupffer H, Kazuhiro S(eds). . Developments in Plant Genetics and Breeding Elsevier 259-267
Kong XQ, Gao XH, Sun W, An J, Zhao YX, Zhang H (2011) Cloning and functional characterization of a cation-chloride cotransporter gene OsCCC1. Plant Mol Biol 75:567-578
Koshio K, Katsuhara M, Shibasaka M, Kasamo K (2002) The functional regulation of a water channel HvPIP2;1 under salt stress, drought stress and its diurnal expression. Plant and Cell Physiology 43:S49-S49
Koyama ML, Levesley A, Koebner RM, Flowers TJ, Yeo AR (2001) Quantitative trait loci for component physiological traits determining salt tolerance in rice. Plant Physiol 125:406-422
Kraakman ATW, Martinez F, Mussiraliev B, van Eeuwijk FA, Niks RE (2006) Linkage disequilibrium mapping of morphological, resistance, and other agronomically relevant traits in modern spring barley cultivars. Molecular Breeding 17:41-58
Kraakman ATW, Niks RE, Van den Berg PMMM, Stam P, Van Eeuwijk FA (2004) Linkage disequilibrium mapping of yield and yield stability in modern spring barley cultivars. Genetics 168:435-446
Kresovich S, Casa AM, Pressoir G, Brown PJ, Mitchell SE, Rooney WL, Tuinstra MR, Franks CD (2008) Community resources and strategies for association mapping in sorghum. Crop Science 48:30-40
Lam AC, Schouten M, Aulchenko YS, Haley CS, de Koning DJ (2007) Rapid and robust association mapping of expression quantitative trait loci. BMC proceedings 1 Suppl 1:S144
Lan WZ, Wang W, Wang SM, Li LG, Buchanan BB, Lin HX, Gao JP, Luan S (2010) A rice high-affinity potassium transporter (HKT) conceals a calcium-permeable cation channel. Proc Natl Acad Sci U S A 107:7089-7094
Lee SY, Ahn JH, Cha YS, Yun DW, Lee MC, Ko JC, Lee KS, Eun MY (2006) Mapping of quantitative trait loci for salt tolerance at the seedling stage in rice. Mol Cells 21:192-196
Li WYF, Wong FL, Tsai SN, Phang TH, Shao GH, Lam HM (2006) Tonoplast-located GmCLC1 and GmNHX1 from soybean enhance NaCl tolerance in transgenic bright yellow (BY)-2 cells. Plant Cell and Environment 29:1122-1137
Ligaba A, Katsuhara M (2010) Insights into the salt tolerance mechanism in barley (Hordeum vulgare) from comparisons of cultivars that differ in salt sensitivity. Journal of Plant Research 123:105-118
Lin HX, Zhu MZ, Yano M, Gao JP, Liang ZW, Su WA, Hu XH, Ren ZH, Chao DY (2004) QTLs for Na+ and K+ uptake of the shoots and roots controlling rice salt tolerance. Theor Appl Genet 108:253-260
Lindsay MP, Lagudah ES, Hare RA, Munns R (2004) A locus for sodium exclusion (Nax1), a trait for salt tolerance, mapped in durum wheat. Functional Plant Biology 31:1105-1114
Liu JP, Zhu JK (1998) A calcium sensor homolog required for plant salt tolerance. Science 280:1943-1945
Lonergan PF, Pallotta MA, Lorimer M, Paull JG, Barker SJ, Graham RD (2009) Multiple genetic loci for zinc uptake and distribution in barley (Hordeum vulgare). New Phytol 184:168-179
Luan S (2009) The CBL-CIPK network in plant calcium signaling. Trends in Plant Science 14:37-42 Lv QD, Tang RJ, Liu H, Gao XS, Li YZ, Zheng HQ, Zhang HX (2009) Cloning and molecular
analyses of the Arabidopsis thaliana chloride channel gene family. Plant Science 176:650-661

Reference �����������������������������������������������������������������������������������������������������������������������������������������������������������������������������������������������������������������������������������������������������
113
Maas EV (1986) Salt tolerance of plants. ApplAgr Res 1:12-26 Maas EV, Hoffman GJ (1977) Crop salt tolerance-current assessment. J Irrig Drain 103(IR2):115-134 Maathuis FJM, Flowers TJ, Yeo AR (1992) Sodium-Chloride Compartmentation in Leaf Vacuoles of
the Halophyte Suaeda-Maritima (L) Dum and Its Relation to Tonoplast Permeability. Journal of Experimental Botany 43:1219-1223
Maccaferri M, Sanguineti MC, Demontis A, El-Ahmed A, del Moral LG, Maalouf F, Nachit M, Nserallah N, Ouabbou H, Rhouma S, Royo C, Villegas D, Tuberosa R (2011) Association mapping in durum wheat grown across a broad range of water regimes. Journal of Experimental Botany 62:409-438
Mackay I, Powell W (2007) Methods for linkage disequilibrium mapping in crops. Trends in Plant Science 12:57-63
Mahajan S, Pandey GK, Tuteja N (2008) Calcium- and salt-stress signaling in plants: Shedding light on SOS pathway. Archives of Biochemistry and Biophysics 471:146-158
Malosetti M, van der Linden CG, Vosman B, van Eeuwijk FA (2007) A mixed-model approach to association mapping using pedigree information with an illustration of resistance to Phytophthora infestans in potato. Genetics 175:879-889
Malysheva-Otto LV, Ganal MW, Roder MS (2006) Analysis of molecular diversity, population structure and linkage disequilibrium in a worldwide survey of cultivated barley germplasm (Hordeum vulgare L.). Bmc Genetics 7:-
Mano Y, Nakazumi H, Takeda K (1996) Varietal variation in and effects of some major genes on salt tolerance at the germination stage in barley. Breeding Science 46:227-233
Mano Y, Takeda K (1997) Mapping quantitative trait loci for salt tolerance at germination and the seedling stage in barley (Hordeum vulgare L). Euphytica 94:263-272
Manolio TA, Collins FS, Cox NJ, Goldstein DB, Hindorff LA, Hunter DJ, McCarthy MI, Ramos EM, Cardon LR, Chakravarti A, Cho JH, Guttmacher AE, Kong A, Kruglyak L, Mardis E, Rotimi CN, Slatkin M, Valle D, Whittemore AS, Boehnke M, Clark AG, Eichler EE, Gibson G, Haines JL, Mackay TF, McCarroll SA, Visscher PM (2009) Finding the missing heritability of complex diseases. Nature 461:747-753
Marcel TC, Aghnoum R, Durand J, Varshney RK, Niks RE (2007) Dissection of the barley 2L1.0 region carrying the 'Laevigatum' quantitative resistance gene to leaf rust using near-isogenic lines (NIL) and subNIL. Mol Plant Microbe Interact 20:1604-1615
Marscher H (1995) Mineral nutrient of higher plants, 2nd edn. London: Academic Press Maser P, Gierth M, Schroeder JI (2002) Molecular mechanisms of potassium and sodium uptake in
plants. Plant and Soil 247:43-54 Mather DE (1995 ) Base maps of NABGMP crosses. ttp://gnome.agrenv.mcgill.ca/info/basemaps.htm Melchinger AE, Utz HF, Schon CC (1998) Quantitative trait locus (QTL) mapping using different
testers and independent population samples in maize reveals low power of QTL detection and large bias in estimates of QTL effects. Genetics 149:383-403
Mian A, Oomen RJFJ, Isayenkov S, Sentenac H, Maathuis FJM, Very AA (2011a) Over-expression of an Na(+)- and K(+)-permeable HKT transporter in barley improves salt tolerance. Plant Journal 68:468-479
Mian A, Senadheera P, Maathuis FJ (2011b) Improving crop salt tolerance: Anion and Cation Transporters as genetic engineering targets Global Science Books, Plant Stress 5:64-72
Montes JM, Melchinger AE, Reif JC (2007) Novel throughput phenotyping platforms in plant genetic studies. Trends in Plant Science 12:433-436
Munns R (2005) Genes and salt tolerance: bringing them together. New Phytol 167:645-663 Munns R, Husain S, Rivelli AR, James RA, Condon AG, Lindsay MP, Lagudah ES, Schachtman DP,
Hare RA (2002) Avenues for increasing salt tolerance of crops, and the role of physiologically based selection traits. Plant and Soil 247:93-105
Munns R, James RA (2003) Screening methods for salinity tolerance: a case study with tetraploid wheat. Plant and Soil 253:201-218
Munns R, James RA, Lauchli A (2006) Approaches to increasing the salt tolerance of wheat and other cereals. J Exp Bot 57:1025-1043

Reference �����������������������������������������������������������������������������������������������������������������������������������������������������������������������������������������������������������������������������������������������������
114
Munns R, James RA, Xu B, Athman A, Conn SJ, Jordans C, Byrt CS, Hare RA, Tyerman SD, Tester M, Plett D, Gilliham M (2012) Wheat grain yield on saline soils is improved by an ancestral Na(+) transporter gene. Nat Biotechnol
Munns R, Rawson HM (1999) Effect of salinity on salt accumulation and reproductive development in the apical meristem of wheat and barley. Australian Journal of Plant Physiology 26:459-464
Munns R, Rebetzke GJ, Husain S, James RA, Hare RA (2003) Genetic control of sodium exclusion in durum wheat. Australian Journal of Agricultural Research 54:627-635
Munns R, Schachtman DP, Condon AG (1995) The Significance of a 2-Phase Growth-Response to Salinity in Wheat and Barley. Australian Journal of Plant Physiology 22:561-569
Munns R, Tester M (2008) Mechanisms of salinity tolerance. Annu Rev Plant Biol 59:651-681 Nevo E (2007) Evolution of wild wheat and barley and crop improvement: Studies at the Institute of
Evolution. Israel Journal of Plant Sciences 55:251-262 Nevo E, Chen G (2010) Drought and salt tolerances in wild relatives for wheat and barley
improvement. Plant Cell Environ 33:670-685 Nevo E, Chen GX, Suprunova T, Krugman T, Fahima T (2004) Ecogeographic and genetic
determinants of kernel weight and colour of wild barley (Hordeum spontaneum) populations in Israel. Seed Sci Res 14:137-146
Nguyen VL, R. SA, Oene D, Rients EN, Van der Linden CG, Richard GFV (2012). Identification of QTLs for ion homeostasis and salt tolerance in barley (Hordeum vulgare L.). Mol Breeding. Doi:10.1007/s11032-012-9777-9
Niu XM, Bressan RA, Hasegawa PM, Pardo JM (1995) Ion Homeostasis in Nacl Stress Environments. Plant Physiology 109:735-742
Nordborg M, Tavare S (2002) Linkage disequilibrium: what history has to tell us. Trends in Genetics 18:83-90
Park S-Y, Noh K, Yoo J, Yu J, Lee B, Kim J, Seo H, Paek N (2006) Rapid upregulation of Dehyrin3; andDehydrin4 in response to dehydration is a characteristic of drought-tolerant genotypes in barley. Journal of Plant Biology 49:455-462
Pasam RK, Sharma R, Malosetti M, van Eeuwijk FA, Haseneyer G, Kilian B, Graner A (2012) Genome-wide association studies for agronomical traits in a world wide spring barley collection. Bmc Plant Biology 12
Patterson N, Price AL, Reich D (2006) Population structure and eigenanalysis. Plos Genetics 2:2074-2093
Payne RW, Harding SA, Murray DA, Soutar DM, Baird DB, Glaser AI, Welham SJ, Gilmour AR, Thompson R, Webster R ( 2011 ) GenStat Release 14 Reference Manual, Part 3 Procedure Library PL20. VSN International, Hemel Hempstead, UK
Petronia C, Maria Grazia Annunziata, Giovanni Pontecorvo, Woodrow AFaP (2011) Salinity Stress and Salt Tolerance. Abiotic Stress in Plants - Mechanisms and Adaptations, Arun Shanker and B. Venkateswarlu (Ed.) edn
Price AL, Patterson NJ, Plenge RM, Weinblatt ME, Shadick NA, Reich D (2006) Principal components analysis corrects for stratification in genome-wide association studies. Nature Genetics 38:904-909
Price AL, Zaitlen NA, Reich D, Patterson N (2010) New approaches to population stratification in genome-wide association studies. Nature Reviews Genetics 11:459-463
Pritchard JK, Stephens M, Rosenberg NA, Donnelly P (2000) Association mapping in structured populations. Am J Hum Genet 67:170-181
Qiu L, Wu DZ, Ali S, Cai SG, Dai F, Jin XL, Wu FB, Zhang GP (2011) Evaluation of salinity tolerance and analysis of allelic function of HvHKT1 and HvHKT2 in Tibetan wild barley. Theoretical and Applied Genetics 122:695-703
Rafalski A (2002) Applications of single nucleotide polymorphisms in crop genetics. Current Opinion in Plant Biology 5:94-100
Rajendran K, Tester M, Roy SJ (2009) Quantifying the three main components of salinity tolerance in cereals. Plant Cell and Environment 32:237-249
Ren ZH, Gao JP, Li LG, Cai XL, Huang W, Chao DY, Zhu MZ, Wang ZY, Luan S, Lin HX (2005) A rice quantitative trait locus for salt tolerance encodes a sodium transporter. Nat Genet 37:1141-1146

Reference �����������������������������������������������������������������������������������������������������������������������������������������������������������������������������������������������������������������������������������������������������
115
Rivandi J, Miyazaki J, Hrmova M, Pallotta M, Tester M, Collins NC (2011) A SOS3 homologue maps to HvNax4, a barley locus controlling an environmentally sensitive Na(+) exclusion trait. Journal of Experimental Botany 62:1201-1216
Rodriguez M, Rau D, O'Sullivan D, Brown AH, Papa R, Attene G (2012) Genetic structure and linkage disequilibrium in landrace populations of barley in Sardinia. Theor Appl Genet 125:171-184
Rostoks N, Mudie S, Cardle L, Russell J, Ramsay L, Booth A, Svensson JT, Wanamaker SI, Walia H, Rodriguez EM, Hedley PE, Liu H, Morris J, Close TJ, Marshall DF, Waugh R (2005) Genome-wide SNP discovery and linkage analysis in barley based on genes responsive to abiotic stress. Molecular Genetics and Genomics 274:515-527
Rostoks N, Ramsay L, MacKenzie K, Cardle L, Bhat PR, Roose ML, Svensson JT, Stein N, Varshney RK, Marshall DF, Grainer A, Close TJ, Waugh R (2006) Recent history of artificial outcrossing facilitates whole-genome association mapping in elite inbred crop varieties. Proceedings of the National Academy of Sciences of the United States of America 103:18656-18661
Roy SJ, Tucker EJ, Tester M (2011) Genetic analysis of abiotic stress tolerance in crops. Current Opinion in Plant Biology 14:232-239
Saisho D, Takeda K (2011) Barley: emergence as a new research material of crop science. Plant Cell Physiol 52:724-727
Salvi S, Tuberosa R (2005) To clone or not to clone plant QTLs: present and future challenges. Trends in Plant Science 10:297-304
Schulte D, Close TJ, Graner A, Langridge P, Matsumoto T, Muehlbauer G, Sato K, Schulman AH, Waugh R, Wise RP, Stein N (2009) The International Barley Sequencing Consortium-At the Threshold of Efficient Access to the Barley Genome. Plant Physiology 149:142-147
Searle SR, Casella G, C.E. M (1992) Variance components. Wiley, New York Shabala S, Cuin TA (2008 ) Potassium transport and plant salt tolerance. Physiologia Plantarum
133:651-669 Shabala S, Cuin TA, Pang J, Percey W, Chen Z, Conn S, Eing C, Wegner LH (2010) Xylem ionic
relations and salinity tolerance in barley. Plant J 61:839-853 Shabala SN, Shabala SI, Martynenko AI, Babourina O, Newman IA (1998) Salinity effect on
bioelectric activity, growth, Na+ accumulation and chlorophyll fluorescence of maize leaves: a comparative survey and prospects for screening. Australian Journal of Plant Physiology 25:609-616
Shavrukov Y, Gupta NK, Miyazaki J, Baho MN, Chalmers KJ, Tester M, Langridge P, Collins NC (2010) HvNax3--a locus controlling shoot sodium exclusion derived from wild barley (Hordeum vulgare ssp. spontaneum). Funct Integr Genomics 10:277-291
Shigaki T, Pittman JK, Hirschi KD (2003) Manganese specificity determinants in the Arabidopsis metal/H+ antiporter CAX2. Journal of Biological Chemistry 278:6610-6617
Siahsar BA, Narouei M (2010) Mapping QTLs of physiological traits associated with salt tolerance in 'Steptoe'x'Morex' doubled haploid lines of barley at seedling stage. Journal of Food Agriculture & Environment 8:751-759
Silva P, Geros H (2009) Regulation by salt of vacuolar H+-ATPase and H+-pyrophosphatase activities and Na+/H+ exchange. Plant signaling & behavior 4:718-726
Sirault XRR, James RA, Furbank RT (2009) A new screening method for osmotic component of salinity tolerance in cereals using infrared thermography. Functional Plant Biology 36:970-977
Storey R, Jones RGW (1978) Salt stress and comparative physiology in gramineae. I-Ion relations of two salt and water stressed barley cultivars, California Mariout and Arimar. Aust J Plant Physiol 5
Stracke S, Haseneyer G, Veyrieras JB, Geiger HH, Sauer S, Graner A, Piepho HP (2009) Association mapping reveals gene action and interactions in the determination of flowering time in barley. Theoretical and Applied Genetics 118:259-273
Tahir MA, Aziz T, Rahmatullah (2011) Silicon-Induced Growth and Yield Enhancement in Two Wheat Genotypes Differing in Salinity Tolerance. Commun Soil Sci Plan 42:395-407

Reference �����������������������������������������������������������������������������������������������������������������������������������������������������������������������������������������������������������������������������������������������������
116
Tavakkoli E, Fatehi F, Coventry S, Rengasamy P, McDonald GK (2011) Additive effects of Na+ and Cl- ions on barley growth under salinity stress. Journal of Experimental Botany 62:2189-2203
Tavakkoli E, Fatehi F, Rengasamy P, McDonald GK (2012) A comparison of hydroponic and soil-based screening methods to identify salt tolerance in the field in barley. J Exp Bot
Tavakkoli E, Rengasamy P, McDonald GK (2010a) High concentrations of Na+ and Cl- ions in soil solution have simultaneous detrimental effects on growth of faba bean under salinity stress. Journal of Experimental Botany 61:4449-4459
Tavakkoli E, Rengasamy P, McDonald GK (2010b) The response of barley to salinity stress differs between hydroponic and soil systems. Functional Plant Biology 37:621-633
Teakle NL, Tyerman SD (2010) Mechanisms of Cl- transport contributing to salt tolerance. Plant Cell and Environment 33:566-589
Tester M, Davenport R (2003) Na+ tolerance and Na+ transport in higher plants. Annals of Botany 91:503-527
Tester M, Langridge P (2010) Breeding Technologies to Increase Crop Production in a Changing World. Science 327:818-822
Thomson MJ, de Ocampo M, Egdane J, Rahman MA, Sajise AG, Adorada DL, Tumimbang-Raiz E, Blumwald E, Seraj ZI, Singh RK, Gregorio GB, Ismail AM (2010) Characterizing the Saltol Quantitative Trait Locus for Salinity Tolerance in Rice. Rice 3:148-160
Tilman D, Balzer C, Hill J, Befort BL (2011) Global food demand and the sustainable intensification of agriculture. Proceedings of the National Academy of Sciences of the United States of America 108:20260-20264
Trethowan RM, Reynolds M (2007) Drought resistance: Genetic approaches for improving productivity under stress. Dev Plant Breed 12:289-299
Tuberosa R, Salvi S, Sanguineti MC, Maccaferri M, Giuliani S, Landi P (2003) Searching for quantitative trait loci controlling root traits in maize: a critical appraisal. Plant and Soil 255:35-54
Tuteja N (2007) Mechanisms of high salinity tolerance in plants. Methods Enzymol 428:419-438 Ueda A, Kathiresan A, Bennett J, Takabe T (2006) Comparative transcriptome analyses of barley and
rice under salt stress. Theor Appl Genet 112:1286-1294 van Berloo R (1999) GGT: Software for the display of graphical genotypes. Journal of Heredity
90:328-329 Van Eeuwijk FA, Kraakman ATW, Niks RE, Van den Berg PMMM, Stam P (2004) Linkage
disequilibrium mapping of yield and yield stability in modern spring barley cultivars. Genetics 168:435-446
Van Ooijen JW (2009) MapQTL6, Software for the mapping of quantitative trait loci in experimental populations of diploid species. . Kyazma BV, Wageningen, Netherlands
Verbeke G, Molenberghs G ( 2000 ) Linear mixed models for longitudinal data. Springer-Verlag Inc, Berlin; New York
Verhoeven KJ, Biere A, Nevo E, van Damme JM (2004) Differential selection of growth rate-related traits in wild barley, Hordeum spontaneum, in contrasting greenhouse nutrient environments. J Evol Biol 17:184-196
Volis S, Verhoeven KJF, Mendlinger S, Ward D (2004) Phenotypic selection and regulation of reproduction in different environments in wild barley. Journal of Evolutionary Biology 17:1121-1131
Volkov V, Amtmann A (2006) Thellungiella halophila, a salt-tolerant relative of Arabidopsis thaliana, has specific root ion-channel features supporting K+/Na+ homeostasis under salinity stress. The Plant Journal 48 342-353
Voorrips RE (2002) MapChart: Software for the graphical presentation of linkage maps and QTLs. The Journal of Heredity 93:77-78
Walia H, Wilson C, Condamine P, Ismail AM, Xu J, Cui XP, Close TJ (2007) Array-based genotyping and expression analysis of barley cv. Maythorpe and Golden Promise. BMC Genomics 8:-
Walia H, Wilson C, Wahid A, Condamine P, Cui X, Close TJ (2006) Expression analysis of barley (Hordeum vulgare L.) during salinity stress. Funct Integr Genomics 6:143-156
Waugh R, Jannink JL, Muehlbauer GJ, Ramsay L (2009) The emergence of whole genome association scans in barley. Current Opinion in Plant Biology 12:218-222

Reference �����������������������������������������������������������������������������������������������������������������������������������������������������������������������������������������������������������������������������������������������������
117
White PJ (2000) Calcium channels in higher plants. Bba-Biomembranes 1465:171-189 White PJ, Broadley MR (2001) Chloride in soils and its uptake and movement within the plant: A
review. Annals of Botany 88:967-988 Witzel K, Weidner A, Surabhi GK, Borner A, Mock HP (2009a) Salt stress-induced alterations in the
root proteome of barley genotypes with contrasting response towards salinity. Journal of Experimental Botany 60:3545-3557
Witzel K, Weidner A, Surabhi GK, Varshney RK, Kunze G, Buck-Sorlin GH, Borner A, Mock HP (2009b) Comparative analysis of the grain proteome fraction in barley genotypes with contrasting salinity tolerance during germination. Plant Cell Environ
Wu DZ, Qiu L, Xu LL, Ye LZ, Chen MX, Sun DF, Chen ZH, Zhang HT, Jin XL, Dai F, Zhang GP (2011) Genetic Variation of HvCBF Genes and Their Association with Salinity Tolerance in Tibetan Annual Wild Barley. Plos One 6
Xu GH, Magen H, Tarchitzky J, Kafkafi U (2000) Advances in chloride nutrition of plants. Adv Agron 68:97-150
Xue DW, Huang YZ, Zhang XQ, Wei K, Westcott S, Li CD, Chen MC, Zhang GP, Lance R (2009) Identification of QTLs associated with salinity tolerance at late growth stage in barley. Euphytica 169:187-196
Yang Q, Zhang D, Xu M (2012) A sequential quantitative trait locus fine-mapping strategy using recombinant-derived progeny. J Integr Plant Biol 54:228-237
Yeo AR, Flowers TJ (1986) Salinity Resistance in Rice (Oryza-Sativa-L) and a Pyramiding Approach to Breeding Varieties for Saline Soils. Australian Journal of Plant Physiology 13:161-173
Yeo AR, Lee KS, Izard P, Boursier PJ, Flowers TJ (1991) Short-Term and Long-Term Effects of Salinity on Leaf Growth in Rice (Oryza-Sativa L). Journal of Experimental Botany 42:881-889
Yokoi S, Bressan RA, Hasegawa PM (2002 ) Salt stress tolerance of plants JIRCAS Working Report 25–33
Yu JM, Buckler ES (2006) Genetic association mapping and genome organization of maize. Curr Opin Biotech 17:155-160
Yu JM, Pressoir G, Briggs WH, Bi IV, Yamasaki M, Doebley JF, McMullen MD, Gaut BS, Nielsen DM, Holland JB, Kresovich S, Buckler ES (2006) A unified mixed-model method for association mapping that accounts for multiple levels of relatedness. Nature Genetics 38:203-208
Zawoznik MS, Ameneiros M, Benavides MP, Vazquez S, Groppa MD (2011) Response to saline stress and aquaporin expression in Azospirillum-inoculated barley seedlings. Applied Microbiology and Biotechnology 90:1389-1397
Zhang LY, Marchand S, Tinker NA, Belzile F (2009) Population structure and linkage disequilibrium in barley assessed by DArT markers. Theor Appl Genet 119:43-52
Zhao J, Paulo MJ, Jamar D, Lou P, van Eeuwijk F, Bonnema G, Vreugdenhil D, Koornneef M (2007a) Association mapping of leaf traits, flowering time, and phytate content in Brassica rapa. Genome 50:963-973
Zhao K, Aranzana MJ, Kim S, Lister C, Shindo C, Tang C, Toomajian C, Zheng H, Dean C, Marjoram P, Nordborg M (2007b) An Arabidopsis example of association mapping in structured samples. PLoS Genet 3:e4
Zhou GF, Johnson P, Ryan PR, Delhaize E, Zhou MX (2012a) Quantitative trait loci for salinity tolerance in barley (Hordeum vulgare L.). Molecular Breeding 29:427-436
Zhou H, Muehlbauer G, Steffenson B (2012b) Population structure and linkage disequilibrium in elite barley breeding germplasm from the United States. J Zhejiang Univ Sci B 13:438-451
Zhu C, Gore M, Buckler ES, Yu J (2008) Status and Prospects of Association Mapping in Plants. 103835/plantgenome2008020089 1:5-20
Zhu JK (2001) Plant salt tolerance. Trends in Plant Science 6:66-71 Zhu JK (2003) Regulation of ion homeostasis under salt stress. Current Opinion in Plant Biology
6:441-445 Zifarelli G, Pusch M (2010) CLC transport proteins in plants. FEBS Lett 584:2122-2127

Supplemental materials �����������������������������������������������������������������������������������������������������������������������������������������������������������������������������������������������������������������������������������������������������
118
Sal
t tol
eran
ce (
%)
0
20
40
60
80
Gun
hild
Cla
ss_1
3P
rest
ige_
56G
eiL9
411
6-5
Pok
er_1
4T
olar
_SV
Mor
exS
usP
trit
Mel
tan
Poe
tV
ada
Hen
niT
rem
ois
Geb
ada_
Cap
aN
ure
Pris
ma
Ape
xLi
ne_0
8B
arke
_33
Dom
Ste
ptoe
Rec
0
20
40
60
80
100S
usP
trit
Mel
tan
Ape
xM
orex
Pre
stig
e_56
Gei
Geb
ada_
Cap
aC
lass
_13
Rec
Poe
tH
enni
Vad
aD
omP
oker
_14
Gun
hild
Ste
ptoe
Line
_08
Bar
ke_3
3L9
4N
ure
Tol
ar_S
V11
6-5
Pris
ma
Tre
moi
s
0
20
40
60
L94
Pok
er_1
4P
rism
aH
enni
Line
_08
Geb
ada…
Ste
ptoe
Pre
stig
e…11
6-5
Cla
ss_1
3T
olar
_SV
Sus
Ptr
itM
elta
nG
eiT
rem
ois
Vad
aP
oet
Gun
hild
Dom
Nur
eB
arke
_33
Rec
Ape
xM
orex
H3
Sal
t tol
eran
ce (
%)
Sal
t tol
eran
ce (
%)
H2
H1
Supplemental materials
Chapter 2
Fig. S1 Mean Salt Tolerance of 24 genotypes over three salt stresses (100, 200 and 300 mM NaCl, respectively) assessed at first week (H1), second week (H2) and third week (H3) after saline treatments.

Supplemental materials �����������������������������������������������������������������������������������������������������������������������������������������������������������������������������������������������������������������������������������������������������
119
Supplemental materials
Chapter 5
Table S1. Significant marker-traits associations identified under saline condition using Eigenanalysis association mapping with -log10(P) score, allele frequency (Fq), allele effects and standard error (S.E). Trait Marker Chr. cM -log10(P) Allele Fq Allele effects S.E
Shoot FW (g) SNP518 4 79.6 3.67 0.46 -0.506 0.137
SNP779 6 60.2 10.84 0.26 -3.095 0.134
Shoot DW (g) SNP779 6 60.2 11.32 0.26 -0.485 0.021
Root DW (g)
SNP395 3 111.4 3.56 0.39 -0.02 0.005
SNP518 4 79.6 3.02 0.46 -0.019 0.006
SNP696 5 161.6 3.20 0.09 0.031 0.009
Leaf chlorophyll content (SPAD reading)
SNP14 1 31.1 3.44 0.25 -1.985 0.557
SNP548 5 6.4 3.03 0.26 -1.824 0.551
SNP742 6 45.4 3.39 0.30 2.98 0.843
SNP779 6 60.2 14.19 0.26 -17.995 0.484
SNP840 7 4.9 3.33 0.10 -5.896 0.911
Plant height (cm)
SNP164 2 59.2 3.27 0.23 -2.284 0.660
SNP779 6 60.2 6.09 0.26 -4.261 0.471
SNP840 7 4.9 4.81 0.10 -3.49 0.807
SNP871 7 61.3 3.32 0.24 1.999 0.572
Root length (cm) SNP643 5 110.3 3.08 0.12 -1.013 0.303
SNP860 7 46.2 3.23 0.23 0.737 0.215
Tiller number
SNP518 4 79.6 3.50 0.46 -0.226 0.063
SNP777 6 60.2 6.54 0.35 -1.266 0.056
SNP864 7 54.4 3.08 0.47 0.205 0.061
Leaf number
SNP436 3 170.1 3.80 0.09 0.257 0.068
SNP543 4 123.3 3.61 0.25 -0.189 0.051
SNP639 5 108.2 4.52 0.38 -0.174 0.042
Leaf senescence (Rating 1-9)
SNP97 1 114.8 3.25 0.25 -0.456 0.132
SNP160 2 59.2 3.54 0.20 -0.853 0.129
SNP236 2 113.5 3.24 0.46 1.023 0.120
SNP779 6 60.2 5.80 0.26 0.999 0.111
Salt Tolerance SNP405 3 126.3 4.15 0.27 2.207 0.556
SNP779 6 60.2 10.09 0.26 -11.505 0.528
Shoot Na+
SNP535 4 103.1 3.37 0.22 -7.005 1.103
SNP541 4 119.1 16.53 0.39 6.838 0.809
SNP906 7 83.4 3.24 0.19 4.022 1.169
Shoot K+
SNP541 4 119.1 21.67 0.39 -5.665 0.582
SNP776 6 60.2 3.13 0.40 5.123 0.830
SNP873 7 63.7 3.68 0.38 6.624 0.713
Shoot Mg2+ SNP779 6 60.2 7.77 0.26 1.259 0.035

Supplemental materials �����������������������������������������������������������������������������������������������������������������������������������������������������������������������������������������������������������������������������������������������������
120
Table S1. continued…
Shoot Ca2+
SNP89 1 99.2 3.37 0.29 0.328 0.093
SNP779 6 60.2 4.28 0.26 0.735 0.095
SNP949 7 149 3.14 0.11 0.458 0.136
Shoot Cl-
SNP23 1 47.5 3.13 0.44 3.613 1.071
SNP541 4 119.1 4.14 0.39 3.198 0.806
SNP840 7 4.9 3.52 0.10 5.215 1.444
Shoot Na+/K+ SNP541 4 119.1 28.42 0.39 1.23 0.074
SNP874 7 64.8 3.52 0.06 0.728 0.202
Root Na+ SNP852 7 34.8 3.21 0.42 -1.206 0.352
Root K+
SNP61 1 66 4.68 0.35 -0.914 0.215
SNP541 4 119.1 4.54 0.39 1.011 0.242
SNP647 5 129.4 3.13 0.22 0.923 0.274
SNP779 6 60.2 4.32 0.26 -1.008 0.248
SNP855 7 38.3 3.52 0.39 -0.88 0.243
Root Mg2+ SNP164 2 59.2 4.20 0.23 0.141 0.035
Root Ca2+
SNP215 2 86.6 3.13 0.31 -0.835 0.070
SNP422 3 148.9 3.10 0.34 -0.229 0.068
SNP871 7 61.3 4.35 0.24 -0.554 0.074
Root Cl- SNP200 2 74.4 3.71 0.25 9.403 0.537
SNP921 7 104.8 3.02 0.36 -1.404 0.425
Root Na+/K+
SNP61 1 66 4.89 0.35 0.513 0.118
SNP489 4 55.6 4.97 0.48 0.472 0.107
SNP770 6 55.9 3.13 0.29 -0.419 0.124
SNP855 7 38.3 3.46 0.39 0.462 0.129 FW: fresh weight, DW dry weight

Supplemental materials �����������������������������������������������������������������������������������������������������������������������������������������������������������������������������������������������������������������������������������������������������
121
Supplemental materials
Chapter 5
Figure S1. LD -log10(P) decay plot of markers as a function of genetic distance on other six chromosomes for 192 barley genotypes. The curve illustrates LD decay trend line based on the nonlinear regression of –log10(P) on genetic distance. Each plot represents LD within a chromosome. LD decay was investigated using Eigenanalysis model in Genstat 14th edition.

Summary �����������������������������������������������������������������������������������������������������������������������������������������������������������������������������������������������������������������������������������������������������
122
Summary
Salinity is the most severe abiotic stress perceived by plants and is affecting 800 million hectares of land worldwide, including 20% of the world’s highly productive irrigated land. Significant crop yield losses are observed due to salinity. Salinization is increasing because of poor irrigation management and climate change. Improving salt tolerance in crops is for these reasons an important target for plant breeding in the near future. However, salinity tolerance is not easy to breed for as it interacts in plants with many physiological processes that are controlled by many genes and that are influenced by environmental factors. Besides an important crop barley also is an excellent experimental model species for genetic studies. Barley is the most salt tolerant among cereals and believed to utilize both halophytic (highly salt tolerant) and glycophytic (more sensitive) strategies in nature to cope with salinity stress. This thesis applies several genetic and experimental breeding approaches to elucidate the genetic and physiological mechanisms underlying natural variation for salt tolerance in barley and to find ways to explore this variation. The ultimate aim is to find new genes that can be exploited to improve salt tolerance in cereal crops.
Twenty four barley lines that are parents of several barley mapping populations were screened in a hydroponics system in the greenhouse to identify heritable variation for salt tolerance traits and suitable populations for genetic analysis of salt tolerance. The changes of shoot and root growth in relation to the contents of the important cations Na+, K+, Ca2+, Mg2+, and anion Cl- in shoots and roots under mild, moderate and severe stresses were monitored after one, two and three weeks of saline stress. The study showed that shoot growth under saline stress is mainly controlled by genetic factors and strongly associates with shoot Na+ and Cl- exclusion from the shoot. The results indicate that both osmotic and ionic tolerance influence barley growth with the importance depending on the stress level applied and duration of exposure to salinity. The lines Steptoe and Morex had contrasting salt tolerance properties, which were genetically analyzed in this study.
In total 139 doubled haploid lines derived from the cross Steptoe x Morex were used to map QTLs for ion contents and salt tolerance at vegetative growing stage under moderate stress for three weeks. Increased salt tolerance of Steptoe over Morex was observed and attributed mostly to a better shoot Na+ and Cl- exclusion. We identified 11 chromosomal regions involved in the control of the variation observed for salt tolerance and various salt stress response traits. A total of 18 strong QTLs (LOD scores up to 20) for salt tolerance, shoot and root growth, and shoot Na+, K+ and Cl- contents were mapped on a 13cM interval on chromosome 2H. Another region of 30 cM on chromosome 3H contains QTLs for shoot Ca2+, Cl- contents and shoot Na+/K+ ratio. The striking clustering of QTLs on 2H and 3H suggests that genes are located in these chromosomal regions that have pleiotrophic effects and influence a number of salt tolerance traits.
A fine-mapping study was subsequently performed to verify the effects of the QTLs and to delimit the QTL intervals to facilitate marker-assisted breeding and map-based cloning. The fine-mapping strategy included the use of (1) additional molecular markers at the QTL intervals, (2) selected recombinants at the 2H and 3H regions, and (3) extensive phenotyping
Summary �����������������������������������������������������������������������������������������������������������������������������������������������������������������������������������������������������������������������������������������������������
123
e.g. monitoring ion contents of various plant fractions. The QTL on 2H for shoot K+ content associated with salt tolerance was verified and mapped to a region spanning 2.2 cM. The 3H QTL region was narrowed down to about 1cM and shown to be important for Ca2+ contents affecting ion homeostasis under saline conditions. Members of the Na+ and K+ co-transporter HKT gene family, NHX and CAX genes were suggested as putative candidate genes underlying these QTLs.
Most quantitative approaches used to dissect the genetic complexity in salt tolerance have been conducted in a limited number of biparental mapping populations, similar to the one used in Chapter 3 of this thesis. These however represent only a small part of the existing genetic variation available in nature. A worldwide collection of 192 spring barley varieties was used in an association mapping (linkage disequilibrium mapping) study to maximize the number of alleles studied that represents a better sampling of the diversity in the barley gene pool. This approach efficiently exploits the fast development of molecular technology and is able to use all the recombination events accumulated during the evolution and domestication of a crop to enable a higher mapping resolution. A high density molecular map with one thousand SNPs (an average distance between markers of ~1cM) and the phenotypic data collected from two consecutive salt stress evaluation experiments were used to investigate the extent of linkage disequilibrium and to map QTLs for salt tolerance. Eigenanalysis, one of the statistical models used in this study to account for the confounding effects due to population structure, revealed a fast LD decay (within 2-4cM), which is attributed in part to the large genetic diversity of the genotype collection and the quality of the genetic map. The association mapping incorporating the Eigenanalysis model resulted in detection of numerous markers scattered over the barley genome that were significantly associated with various salt tolerance traits. An important (about 2cM interval) region on 6H was found to strongly contribute to the variation in salt tolerance and various related traits (shoot growth, chlorophyll contents, leaf senescence, tiller numbers and plant height) which were also highly heritable under saline conditions. Shoot Na+, Cl- exclusion and other ion homeostasis traits were found to be mainly under the genetic control of a region on chromosome 4H. The advantages and pitfalls of association mapping over the traditional QTL mapping of salt tolerance are discussed in this thesis.
Saline affected growth and ionic homeostasis QTLs identified in this thesis point to several osmotic and ionic stressed tolerance genes that can be further exploited. Several QTLs were found in the regions containing the QTLs for salt tolerance identified previously in barley or in syntenic genome regions of wheat and/or rice containing the most important salt tolerance genes for Na+ and K+ transporters and osmotic tolerance. Some QTLs are likely controlled by novel genes important for transport of Cl- or Ca2+, interacting with ion homeostasis under saline stress. The results of this thesis stress the importance to consider Cl- in parallel with Na+ and K+ in salt tolerance studies. The increased insight in traits and mechanisms related to salt tolerance in barley and the underlying genetics as presented in this thesis is of direct use to breeders and scientists and will significantly contribute to improvement of salt tolerance in cereal crops.

Samenvatting �����������������������������������������������������������������������������������������������������������������������������������������������������������������������������������������������������������������������������������������������������
124
Samenvatting
Van alle abiotische stressfactoren die de plant moet weerstaan berokkent verzilting van de bodem de meeste schade. Over de heel wereld is al meer dan 800 miljoen hectare land te zout geworden, inclusief 20% van de beste geïrrigeerde landbouwgrond. Stress door verzilting van de grond veroorzaakt grote opbrengstverliezen bij landbouwgewassen. Verzilting neemt bovendien steeds verder toe door de veranderingen in het klimaat en verkeerde irrigatietechnieken. Het verbeteren van de zouttolerantie van gewassen draagt bij tot terugdringen van het opbrengstverlies als gevolg van verzilting, en is daarom een belangrijk doel voor de plantenveredeling voor nu en in de nabije toekomst. Zouttolerantie is echter niet eenvoudig te realiseren in gewassen, omdat deze eigenschap bepaald wordt door meerdere fysiologische processen die worden aangestuurd door een groot aantal genen, en die bovendien worden beïnvloed door andere factoren in de leefomgeving van de plant.
Gerst is een belangrijk gewas, met name ook voor de meer marginale landbouwgronden in de wereld, en is bovendien een uitstekend model voor genetische studies. Gerst is beter in staat te groeien op verzilte grond dan de andere graansoorten, waarbij gerst strategieën van halofyten (zeer zouttolerant) en glycofyten (zoutgevoelig) combineert om de nadelige effecten van verzilte grond te weerstaan.
In dit proefschrift worden verschillende genetische en experimentele methoden gebruikt om de genetica en de fysiologische mechanismen op te helderen die ten grondslag liggen aan de natuurlijke variatie voor zouttolerantie in gerst. De ontwikkelde en gebruikte methoden om de zouttolerantie van gerst te onderzoeken en de resultaten van onze studie zullen leiden tot nieuwe genen die kunnen worden gebruikt voor verdere verbetering van de zouttolerantie van granen.
Allereerst hebben we een collectie van gerstlijnen die dienst doen als ouderlijnen voor een aantal karteringspopulaties op een hydropoon groeisysteem (watercultuur) in de kas getest bij verschillende zoutconcentraties. Hiermee zijn de overerfbare variatie voor eigenschappen die bijdragen aan zouttolerantie geïdentificeerd. Daarmee zijn karteringspopulaties geselecteerd die het meest geschikt zijn om een genetische analyse van zouttolerantie in gerst uit te voeren. De effecten van milde, matige en ernstige zout stress (100, 200 en 300mM NaCl) op groei van het bovengrondse deel en de wortels zijn gemeten na 1, 2 en 3 weken van zout stress, en werden gerelateerd aan de concentraties van belangrijke ionen (Na+, Cl-, K+, Ca2+, Mg2+) in de plant. De resultaten laten zien dat groei van de gerstplant in het hydropone systeem onder zout stress sterk bepaald wordt genetische factoren, waarbij met name de mate waarin de Na+ en Cl- concentratie in het blad laag kan worden gehouden (exlusie strategie) een belangrijke rol speelt. Zouttolerantie van deze lijnen wordt bepaald door aanpassing aan zowel osmotische stress als de toxiciteit van de zout ionen. Niet alleen het zoutniveau maar ook de lengte van de periode waarin de planten worden blootgesteld aan de zout stress zijn van belang voor de zouttolerantie. Sommige lijnen zijn meer effectief bij lage concentraties of korte blootstelling aan stress, terwijl anderen juist relatief beter presteren bij langdurige blootstelling aan zout of aan hoge zoutconcentraties. Deze variatie wordt veroorzaakt door verschillende

Samenvatting �����������������������������������������������������������������������������������������������������������������������������������������������������������������������������������������������������������������������������������������������������
125
eigenschappen van die planten met betrekking tot ionen homeostase en osmotische aanpassing.
De karteringspopulatie Steptoe x Morex is geselecteerd voor genetische analyse van zouttolerantie. In totaal zijn 139 verdubbelde haploide lijnen gebruikt om “Quantitative Trait Loci” (QTLs) te karteren voor ionengehaltes in de plant, voor zouttolerantie en voor groei eigenschappen. De jonge planten zijn gekweekt in het hydropone systeem met een zoutconcentratie van 200 mM NaCl (matige zoutstress) gedurende 3 weken. De ouder Steptoe bleek beter bestand tegen zoutstress, en dit werd met name veroorzaakt doordat Steptoe beter dan Morex de Na+ en Cl- concentraties in het blad laag kan houden. Er zijn 11 gebieden in het genoom geïdentificeerd die van belang zijn voor regulatie van zouttolerantie en verschillende eigenschappen betrokken bij de respons van de plant op zout stress. In totaal zijn 18 sterke QTLs gevonden (LOD scores oplopend tot 20) voor zouttolerantie, blad en wortelgroei, en Na+, Cl- en K+ gehaltes in een gebied van 18cM op chromosoom 2H. In een gebied van 30cM op chromosoom 3H zijn verschillende QTLs gelokaliseerd die bijdragen aan Ca2+, Cl- gehaltes en de Na/K verhouding in het blad. Deze opmerkelijke clustering van QTLs op chromosomen 2H en 3H suggereert dat er genen in het QTL gebied aanwezig zijn die meerdere zouttolerantie eigenschappen direct beïnvloeden.
Vervolgens is verder ingezoomd op de twee belangrijkste QTL gebieden op chromosoom 2H en 3H. Met een strategie voor precieze kartering is de grootte van de QTL gebieden teruggebracht tot enkele cM zodat kaart-gebaseerde klonering van de genen eenvoudiger wordt. Hiermee kunnen nauw gekoppelde moleculaire merkers worden ontwikkeld voor merker-gestuurde verdeling voor zouttolerantie. Er is gebruik gemaakt van 1) extra moleculaire merkers in de QTL gebieden 2) extra nakomelingen die recombineren in het QTL gebied, en 3) uitgebreide fenotyping inclusief bepalen van iongehaltes in meerdere plantenfracties. De QTL op chromosoom 2H voor K+-gehaltes in het blad is bevestigd, en gekarteerd op een gebied van 2,2 cM. Het QTL gebied op chromosoom 3 is teruggebracht tot ongeveer 1 cM, en speelt met name een rol bij het reguleren van de Ca2+ gehaltes in planten die zout stress ondervinden, waardoor de ionenhomeostase wordt aangepast. Leden van de Na+ en K+ cotransporter HKT gen familie (NHX en CAX genen) zijn mogelijk kandidaat genen die verantwoordelijk kunnen zijn voor de effecten van deze QTLs.
De meeste kwantitatieve benaderingen die worden gebruikt om de genetische complexiteit van zouttolerantie te ontrafelen worden uitgevoerd met een beperkt aantal karteringspopulaties met elk 2 ouderlijnen, zoals beschreven in Hoofdstuk 3 van dit proefschrift. Deze lijnen representeren echter maar een klein deel van de variatie in eigenschappen die aanwezig is in een gewas. Daarom hebben we in het laatste deel van dit proefschrift een collectie van 192 zomergerstlijnen gebruikt in een associatie-karteringsbenadering (Linkage Disequilibrium (LD) mapping). Hiermee wordt een groot aantal allelen bestudeerd waardoor een veel betere doorsnee van de beschikbare variatie voor zouttolerantie in gerst wordt onderzocht. Deze benadering maakt gebruik van de recente ontwikkeling van moleculaire technieken is in staat alle recombinaties te gebruiken die zijn opgetreden gedurende de evolutie en domesticatie van een gewas, waardoor veel nauwkeuriger kan worden gekarteerd. De 192 lijnen zijn in twee proeven in twee jaar

Samenvatting �����������������������������������������������������������������������������������������������������������������������������������������������������������������������������������������������������������������������������������������������������
126
geëvalueerd op het hydropone systeem voor zouttolerantie. De verzamelde fenotypische data zijn gecombineerd met data van ongeveer 1000 gekarteerde SNP merkers (onderlinge afstand tussen de merkers ongeveer 1cM) in aan “Linkage Disequilibrium” (LD) karteringsbenadering om QTLs te vinden en te karteren voor eigenschappen die bijdragen aan zouttolerantie. Een statistisch model dat rekening houdt met en corrigeert voor de structuur van de populatie (Eigen-analyse) liet een snelle LD afname zien (niet meer dan 2-4cM), mede veroorzaakt door de grote diversiteit in de collectie gerstlijnen en de goede kwaliteit van de genetische kaart. De LD kartering met behulp van de Eigen-analyse resulteerde in een groot aantal merkers verspreid over het gerstgenoom die sterk geassocieerd waren met eigenschappen voor zouttolerantie. Een belangrijk gebied op chromosoom 6H van ongeveer 2cM groot bleek een grote bijdrage te leveren aan de variatie voor zouttolerantie en verschillende andere goed overerfbare eigenschappen (bovengrondse groei, chlorofyl gehalte, veroudering van het blad, aantal scheuten en plantlengte) van planten onder zout stress. Tevens is een belangrijke QTL geïdentificeerd op chromosoom 4H die een belangrijke bijdrage levert aan een de uitsluiting van Na+ en Cl- van het blad (Na+ en Cl- exclusie) en andere ion homeostase eigenschappen. De voordelen en valkuilen van LD kartering in vergelijking met traditionele QTL kartering voor zouttolerantie zijn verder uiteengezet.
De QTLs voor groei en ion homeostase die in dit proefschrift zijn gepresenteerd wijzen in de richting van genen betrokken bij osmotische en ion stress tolerantie die verder kunnen worden geëxploiteerd in de veredeling. Verschillende QTLs zijn gevonden in gebieden die in eerdere studies aan zouttolerantie in gerst zijn geïdentificeerd, of in overeenkomende gebieden in de genomen van tarwe en/of rijst waarvan bekend is dat ze zeer belangrijke genen voor Na+ en K+ transport en osmotische aanpassing bevatten. Sommige van de in dit proefschrift gepresenteerde QTLs worden waarschijnlijk gereguleerd door nieuwe genen betrokken bij Cl- of Ca2+ transport direct van invloed zijn op ion homeostase tijdens zout stress. De resultaten van dit proefschrift benadrukken het belang van Cl- naast Na+ en K+ voor zouttolerantie en daarmee de noodzaak om ook Cl- te bestuderen in onderzoek naar zouttolerantie in gerst en andere gewassen. Het verbeterde inzicht in de eigenschappen en mechanismen die bijdragen tot zouttolerantie in gerst en de genen en genetica die daaraan ten grondslag liggen kan direct worden gebruikt door veredelaars en wetenschappers, en kan een belangrijke bijdrage leveren aan de verbetering van de zouttolerantie van granen.

Tóm tắt �����������������������������������������������������������������������������������������������������������������������������������������������������������������������������������������������������������������������������������������������������
127
Tóm tắt
Mặn là điều kiện môi trường khắc nghiệt gây ảnh hưởng nặng nề nhất cho cây trồng. Đất nhiễm mặn hiện chiếm tới 800 triệu hecta trên toàn thế giới trong đó bao gồm 20% diện tích đất có tưới là vùng đất có hiệu quả sản xuất nông nghiệp cao nhất. Đất mặn gây giảm năng suất cây trồng nghiêm trọng. Quá trình mặn hoá đang tăng lên nhanh chóng bởi trình độ kỹ thuật canh tác và quản lý tưới tiêu yếu kém cũng như do biến đổi khí hậu. Chính vì vậy, cải thiện tính chịu mặn cho cây trồng là một mục tiêu quan trọng cho tạo giống trong tương lai gần. Tuy nhiên, tạo giống chịu mặn rất khó khăn bởi trong cây trồng khả năng chịu mặn tương tác với nhiều phản ứng sinh lý, được quy định bởi nhiều gen và tương tác với nhiều yếu tố môi trường.
Cây lúa mạch (Barley- Hordeum Vulgare L.) bên cạnh là một trong bốn cây lương thực quan trọng nhất sau lúa nước, lúa mì và ngô còn là cây mô hình lý tưởng cho các nghiên cứu di truyền học. Lúa mạch chống chịu tốt nhất với điều kiện đất mặn trong số cây lấy hạt. Đặc tính này được cho là do lúa mạch sử dụng cơ chế chịu mặn của cả hai nhóm có khả năng chịu mặn trái ngược trong tự nhiên là halophyte (siêu chịu mặn) và glycophyte (rất mẫn cảm) để đối phó với những ảnh hưởng do mặn gây ra. Đề tài nghiên cứu này áp dụng một số phương pháp di truyền và thí nghiệm tạo giống để làm sáng tỏ đặc điểm di truyền và cơ chế sinh lý quy định những biến dị di truyền trong tự nhiên của tính chống chịu mặn đồng thời tìm cách khám phá những biến dị này. Mục tiêu cuối cùng của nghiên cứu này là tìm ra các gen mới có thể sử dụng để cải thiện tính chịu mặn trên các loại cây ngũ cốc.
Hai mươi bốn dòng lúa mạch là bố mẹ của một số quần thể di truyền được nghiên cứu trên một hệ thống thuỷ canh trong nhà kính tại Wageningen UR để xác định biến dị di truyền cho các tính trạng liên quan đến tính chịu mặn và tìm quần thể phù hợp để tiến hành phân tích di truyền. Sự biến đổi về sinh trưởng, phát triển của của thân lá và rễ liên quan đến hàm lượng các ion quan trọng bao gồm: cation Na+, K+, Ca2+, Mg2+, và anion Cl- trong thân lá và rễ được quản lý trong điều kiện stress mặn nhẹ, trung bình và nghiêm trọng trong thời gian một, hai và ba tuần. Nghiên cứu này chỉ ra rằng sự phát triển thân lá thể hiện qua hàm lượng chất khô của cây lúa mạch trong điều kiện stress mặn được quy định bởi các yếu tố di truyền và có quan hệ chặt với khả năng hạn chế sự vận chuyển và hấp thụ vào thân lá hoặc sự đẩy Na+ và Cl- ra khỏi thân lá (ion exclusion). Kết quả nghiên cứu cho thấy cả hai thành phần chống chịu là chống chịu với stress thẩm thấu và stress ion có ảnh hưởng đến sự sinh trưởng và phát triển của lúa mạch với tầm quan trọng phụ thuộc vào mức độ stress mặn và thời gian gây stress mặn. Hai dòng lúa mạch Steptoe và Morex thể hiện sự tương phản về các đặc tính liên quan đến tính chịu mặn được sử dụng để phân tích di truyền trong luận án này.
Tổng số 139 dòng đơn bội kép (DH) tạo ra từ tổ hợp lai giữa Steptoe x Morex được sử dụng để xác định QTL quy định hàm lượng ion và tính chịu mặn tại giai đoạn sinh trưởng dinh dưỡng của cây lúa mạch trồng trong điều kiện mặn trung bình trong ba tuần. Khả năng chịu mặn của Steptoe và Morex có sự liên hệ chặt chẽ với khả năng hạn chế hút hoặc đẩy Na+ và Cl- ra khỏi thân lá. Nghiên cứu xác định được 11 vùng nhiễm sắc thể quy định biến dị di truyền về tính chịu mặn và các tính trạng liên quan. Đáng chú ý, có 18 QTL (chỉ số LOD dao động từ 3-20) quy định tính chịu mặn, sinh trưởng và phát triển của thân lá và hàm lượng Na+,

Tóm tắt �����������������������������������������������������������������������������������������������������������������������������������������������������������������������������������������������������������������������������������������������������
128
K+ và Cl- trong thân lá cùng được xác định trong khoảng 13cM trên nhiễm sắc thể (NST) 2H của cây lúa mạch. Một vùng NST khoảng 30cM trên 3H được xác định mang QTL quy định hàm lượng Ca2+, Cl- và Na+/K+ trong thân lá. Sự cùng tồn tại của nhóm các QTL trên 2H và 3H chỉ ra rằng các gen nằm trên những vùng NST này có nhiều tác động qua lại đồng thời ảnh hưởng đến những tính trạng khác nhau liên quan đến tính chịu mặn.
Nghiên cứu lập bản đồ có độ phân giải cao (fine-mapping) sau đó được tiến hành để làm rõ những ảnh hưởng của QTL và để làm giảm độ lớn của QTL trên NST nhằm hỗ trợ phát triển chỉ thị phân tử trong tạo giống (MAS) và để phân lập gen/QTL. Chiến lược trong fine-mapping đã sử dụng bao gồm (1) bổ sung chỉ thị phân tử vào vùng QTL, (2) sử dụng các dòng tái tổ hợp tại vùng NST 2H và 3H và (3) extensive phenotyping – phân tích kiểu hình sâu ví dụ như quản lý hàm lượng ion tại nhiều bộ phận khác nhau của cây lúa mạch. QTL trên NST 2H quy định hàm lượng K+ trong thân lá có liên quan đến tính chịu mặn được kiểm chứng và thu hẹp trên khoảng 2.2cM. Vùng QTL trên 3H được thu hẹp xuống 1cM có liên quan đến hàm lượng Ca2+ và ảnh hưởng đến sự cân bằng ion (ion homeostasis) trong thân lá trong điều kiện mặn. Thành viên của gia đình gen HKT (đồng) vận chuyển Na+ và K+, NHX và CAX gen được xem là ứng cử viên của những QTL này.
Hầu hết các phương pháp số lượng sử dụng để phân tích tính di truyền phức tạp của tính trạng chịu mặn được tiến hành trên số lượng giới hạn các quần thể được tạo ra từ hai bố mẹ ban đầu (biparental mapping population) tương tự như nghiên cứu trong Chương 3 của luận án này. Những quần thể này chỉ đại diện một phần rất nhỏ của đa dạng di truyền tồn tại trong tự nhiên của cây lúa mạch. Tập hợp một quần thể gồm 192 dòng và giống lúa mạch quốc tế được sử dụng để lập bản đồ tổ hợp (Association mapping) hay còn gọi là lập bản đồ liên kết không cân bằng (linkage disequilibrium (LD) mapping) để làm tăng số lượng alen nghiên cứu và đại diện tốt hơn cho đa dạng di truyền của nguồn gen lúa mạnh. Phương pháp này lợi dụng một cách hiệu quả sự phát triển nhanh chóng của công nghệ phân tử và cho phép sử dụng tất cả các sự kiện tái tổ hợp trong quá trình tiến hoá và thuần hoá cây trồng tạo ra độ chính xác cao trong việc xác định QTL. Một bản đồ phân tử với khoảng 1000 chỉ thị SNP (khoảng cách giữa hai chỉ thị là ~1cM) và số liệu kiểu hình thu thập từ hai thí nghiệm đánh giá tính chịu mặn được sử dụng để điều tra các liên kết không cân bằng (LD) và để xác định QTL cho tính chịu mặn.
Eigenanalysis, một trong những mô hình thống kê sử dụng trong nghiên cứu này để khắc phục những hiệu ứng không mong muốn gây ra do sự khác nhau trong cấu trúc quần thể Association mapping, xác định sự giảm liên kết không cân bằng (LD decay) nhanh trong khoảng 2-4cM, sự giảm liên kết không cân bằng nhanh trên cây lúa mạch được tìm ra trong nghiên cứu này được cho là do sự đa dạng di truyền lớn tồn tại trong quần thể, phương pháp thống kê phù hợp và chất lượng của bản đồ phân tử. Phương pháp association mapping kết hợp với mô hình Eigenanalysis tìm ra số lượng lớn các SNP nằm rải rác trên toàn hệ gen liên kết chặt với độ tin cậy cao với các tính trạng chịu mặn. Một vùng quan trọng (khoảng 2cM) trên NST 6H được xác định ảnh hưởng tới biến dị di truyền của tính chịu mặn và một số các tính trạng liên quan (hàm lượng chất khô, hàm lượng diệp lục, sự vàng hoá, số nhánh và chiều cao cây). Đây cũng là những tính trạng có khả năng di truyền cao trong điều kiện stress mặn. Khả năng tránh hay hạn chế hấp thụ Na+ và Cl- vào thân lá và quản lý cân bằng các ion khác

Tóm tắt �����������������������������������������������������������������������������������������������������������������������������������������������������������������������������������������������������������������������������������������������������
129
được quy định bởi các yếu tố di truyền trên vùng NST 4H. Ưu điểm và những hạn chế của Association mapping so với phương pháp mapping truyền thống trên tính trạng chịu mặn được thảo luận trong luận án này.
QTL quy định sinh trưởng, phát triển và cân bằng ion trong điều kiện mặn xác định được trong công trình nghiên cứu này chỉ ra một số gen quy định các thành phần chống chịu như chống chịu stress thẩm thấu và stress ion có thể được sử dụng trong tạo giống. Một số QTL được tìm thấy trong vùng NST của lúa mạch quy định tính chịu mặn đã được xác định trước đây trên cây lúa mạch hay trong vùng di truyền tương đồng của lúa và/hoặc lúa mỳ có mang những gen chịu mặn quan trọng nhất giúp vận chuyển Na+ và/hoặc K+ hay là gen quy định tính chống chịu stress thẩm thấu. Một số QTL chỉ ra những gen mới quan trọng trong việc vận chuyển Cl- hay Ca2+ liên quan đến cân bằng ion trong điều kiện mặn. Kết quả trong công trình nghiên cứu này nhấn mạnh tầm quan trọng của việc xem xét hàm lượng Cl- song song với Na+ và K+ trong nghiên cứu cây trồng chịu mặn.
Những kiến thức mới về tính trạng và cơ chế sinh lý liên quan đến tính chịu mặn của cây lúa mạch và cơ chế di truyền quy định được trình bày trong luận án này có thể được các nhà khoa học và nhà tạo giống sử dụng trực tiếp để cải thiện tính chịu mặn cho các loại cây lấy hạt.

Acknowledgement �����������������������������������������������������������������������������������������������������������������������������������������������������������������������������������������������������������������������������������������������������
130
Acknowledgements
Being at the end of the road to obtain the PhD degree and looking back to the whole journey, there is a lot of feeling inside of me. There are many things I want to mention; so many people I would like to acknowledge. However, it might not be simple to express it enough.
First of all, I would like to express my heartfelt gratitude to my promoter Prof. Richard Visser for giving me the chance to study and to do research toward my PhD at the Laboratory of Plant Breeding, Wageningen UR. You were so kind to give very supportive e-mails and advice from the beginning that made my dream of doing a PhD at Plant Breeding come true. I much appreciate your time spent to read and comment on my manuscript, especially during your busy time and even your holiday period to help finish my writing on time. Besides the PhD project, I thank you a lot for your continual support in building the relationship between my colleagues from Hanoi and your Laboratory; for your support to find my post-graduate research funding and for your care.
I would like to thank Dr. Gerard van der Linden, my co-promoter and my daily supervisor, for scientific support and contribution to this thesis. You created an interesting scientific and friendly working environment in your Abiotic stress group. It was a big challenge when we decided to submit my thesis after 3.5 years. Some thought that it maybe impossible, but we did it. Without your help it would not be possible. I greatly appreciate your striking effort to finish reading the thesis before your holiday. You were a good supervisor, but you also felt like a nice older brother to me. Your clever and effective direction made my PhD project go smoothly, and your concern and care made my PhD and my family life at Wageningen easier. I would like to take this opportunity also to thank your family members for their hospitality whenever we visited them.
I would like to thank Dr. Oene Dolstra, my second co-promoter and daily supervisor. It is hard for me to find enough words to express my gratitude to you because of so much help and your contribution to this thesis. Just after submitting my thesis, you told me that we had 3.5 years working efficiently together. I also think that it was a lot of luck for me achieving that. The luck that only I can understand well is that I have you in my PhD project. The combination of your great traditional breeding knowledge and the magical statistical skills gave luck to my research project. We had all the experiments and studies go smoothly and and effectively. Oene, I will never forget so much help you gave to me at work and to my family.
In my PhD study, I had great chances to work with excellent barley experts. I would like to thank Dr. Rients Niks for his contribution in many aspects to my PhD project. Dear Rients, barley is a new crop in the group of Gerard, so that your help not only built the main road in my thesis but also made its branches nicer. I liked very much the discussion with you about the research, and thank you very much for your comments on my manuscripts. I would like to thank Dr. Thierry Marcel for advice on the molecular map of barley. I would like to thank Dr. Benjamin Killian and his colleagues from IPK, Germany for the contribution on one of the major chapters in my thesis. I would like to expand my gratitude to Prof. Andreas
Acknowledgement �����������������������������������������������������������������������������������������������������������������������������������������������������������������������������������������������������������������������������������������������������
131
Graner for his kindness to allow me to use the materials from his institute in my study. At the end of my PhD study, I am so happy to see that the discussions between Gerard and these barley experts furthered my PhD project.
I would like to thank my external supervisor, Prof. Fenny Dane from Auburn University, USA. I enjoyed very much our discussions and thank you so much for your comments on my thesis.
I would like to thank Dr. Marcos Malosetti for his contribution to one chapter of my thesis. Thanks to Dr. Bjorn D’hoop for his advice when I studied association mapping, a new area for me.
I enjoyed very much supervising and working with (Master’s) students in my PhD project: Vincent, Han, Rick and Tigist. I appreciate very much your contributions to this thesis. I learnt a lot from your different cultures and backgrounds…
I received a lot help from people from different laboratories and from Unifarm. I really enjoyed working with people in Biochem Lab, where I first received help from Simon. The collaboration later with Heleen, Luc and Annemarie was so nice too. I would like to thank people in Molecular Lab especially, Linda and Dianka, for their advice and assistance. I will never forget the great and friendly help of people at Unifarm and the greenhouse: Geurt, Anton, Wim , Martin and Herman….
I enjoyed very much working in my office where I shared the working place with Dianka and Carole. I would like to express my gratitude to Dianka for her help with molecular knowledge and skills. I learnt a lot of the molecular map development skills of Carole. And above all, I was grateful for the daily advice of these two officemates to support my family in the Netherlands.
I would like to thank many other colleagues and friends in the Abiotic stress group (Anitha , Brigitte , Marcel, Christos, Rafeal, Daniella…) for their help at the greenhouse and in the Labs. I liked very much the valuable discussions in our group with you. I would like to extend my thanks to other colleagues and friends in the the department of Plant breeding for being nice with me: Paul Arens, Chris Maliepaard , Sjaak van Heusden, Luisa Trinidate , Jaap van Tuyl, Yuling Bai , Alvaro , Peter Dinh, Freddy, Awang, Nasim and Arwa….
I would like to express my sincere thanks to Anie, Letty , Mariame Gada, Janneke and Nicole for their help with administrative and other issues.
This thesis is co-funded by the Vietnamese Ministry of Education and Training and the Ministry of EL&I, the Netherlands.
Having my family at Wageningen made the PhD life so beautiful and unforgettable. We had chance to meet a lot of nice and kind friends from many places in the world, and we were

Acknowledgement �����������������������������������������������������������������������������������������������������������������������������������������������������������������������������������������������������������������������������������������������������
132
happy to be with a nice Vietnamese community too. We will not forget the help of many people to make our life there easier. We would like to thank Leo and his wife; Raymond and his wife for being so kind. We received great help and we had unforgettable moments with (gia đình các anh chị) Vu Minh , Ke Quyen, Long Huyen, Hung Ha, Hoa Thierry , Phuong Sang, Phuong Minh and Lan Linh . We love so much the “old pa” of our children there in the Netherlands: ong Binh. Words are never sufficient to express my gratitute for these people. I would also like to thank my nice friends: Binh, Tu, Nhan, Tung, Khoi, Phu, Phuong, Han, Hoang, Huong…. for your sharing and support. To Edwin, it was a nice time for my family to meet you in the Netherlands and for me once more in Germany.
For my parents, my parents-in-law, my bother Dung Linh and bother-in-law Hai Mai and my other relatives in Vietnam, I thank you all for your love, care and endless support.
My PhD life was extra special, as at the middle of the journey we were so happy to have my wife obtain her Master’s degree at Wageningen just before the birth of my son, Lam. These made the journey to the PhD of mine, although busy, full of flowers and happiness. I thank you and love you all, Lan, Linh and Lam.

About the author �����������������������������������������������������������������������������������������������������������������������������������������������������������������������������������������������������������������������������������������������������
133
About the author
Nguyen Viet Long was born in 1979 in Cuong Son, Bac Giang, Vietnam. After obtaining the bachelor degree in Agronomy from Hanoi University of Agriculture (HUA) in 2002 he attended a 3-month training in maize breeding in Kasetsart University, Thailand. He has been given the lectureship position at the Department of Crop science, faculty of Agronomy, HUA early 2002. Funded by Danida, Denmark, he pursued his MSc in plant breeding at the Department of Agronomy, University of the Philippines Los Banos (UPLB) from 2003-2006. Returning to the teaching position at HUA after graduation from UPLB, he attended a training course funded by SIDA on genetic recourses and intellectual property right in 2007 in Svalof, Sweden. He was a visiting scholar to University of the California, Davis, USA during the spring quarter in 2008. Early 2009, he was accepted to do his PhD thesis in the Laboratory of Plant Breeding, Wageningen UR funded by Vietnamese ministry of Education and the Department of Plant Breeding, WUR. The PhD project attempted to identify the traits and genes contributing to salt tolerance in Barley.

List of publication �����������������������������������������������������������������������������������������������������������������������������������������������������������������������������������������������������������������������������������������������������
134
List of Publication:
Identification of QTLs for ion homeostasis and salt tolerance in barley (Hordeum vulgare L.). Nguyen Viet Long, Simon A. Ribot, Oene Dolstra, Rients E. Niks, Richard G. F. Visser, C. Gerard van der Linden. Molecular Breeding. 2012, DOI: 10.1007/s11032-012-9777-9.
Association mapping of salt tolerance in barley (Hordeum vulgare L.). Nguyen Viet Long, Oene Dolstra, Marcos Malosetti, Benjamin Kilian, Andreas Graner, Richard G. F. Visser, C. Gerard van der Linden (Submitted).
Salt stress-induced changes in vegetative growth and plant mineral composition in a diverse set of barley genotypes. Nguyen Viet Long, Simon A. Ribot, Oene Dolstra, Rients E. Niks, Richard G. F. Visser, C. Gerard van der Linden (In preparation).
Characterization of QTL regions on barley chromosomes 2H and 3H conferring differences in salt tolerance observed between cvs Steptoe and Morex. Nguyen Viet Long, Vincent L.A. Kock, Nguyen Hoang Han, Oene Dolstra, Richard G. F. Visser, C. Gerard van der Linden. (In preparation)
Conference abstract:
Genetic variation for and QTL analysis of salinity tolerance in barley (Hordeum vulgare L.). Nguyen Viet Long, Ribot Simon A, Dolstra Oene, Visser Richard GF, van der Linden C Gerard. 2nd International Symposium on Genomics of Plant Genetic Resources (24–27 April 2010, Bologna, Italy). Page: 216.
Association mapping of salt tolerance in barley (Hordeum vulgare L.). Nguyen Viet Long, Oene Dolstra, Marcos Malosetti, Benjamin Kilian, Andreas Graner, Richard G. F. Visser, C. Gerard van der Linden. Conference 'Molecular Basis of Plant Stress'. Varna, Bulgaria, 21-23.9.2011. Pages: 69-70.

135
Education Statement of the Graduate School
Experimental Plant Sciences
Issued to: Nguyen Viet Long Date: 2 November 2012 Group: Plant Breeding, Wageningen University & Research Centre
1) Start-up phase date
► First presentation of your project
Breeding for salt tolerance in Barley using genetic and genomic approaches Jun 09, 2009
► Writing or rewriting a project proposal
Identification of traits and QTLs that improve salt tolerance in barley Apr 02, 2009
► Writing a review or book chapter
► MSc courses
► Laboratory use of isotopes
Subtotal Start-up Phase 7,5 credits*
2) Scientific Exposure date
► EPS PhD student days
2009 PhD student day in Leiden Mar 26, 2009
2010 PhD student day in Utrecht Jun 01, 2010
2011 PhD student day in Wageningen May 20, 2011
► EPS theme symposia
EPS Theme 2 symposium 'Ecology and Experimental Plant Sciences 2, WUR Sep 22, 2009
EPS Theme Meeting Theme 3: Metabolism and Adaptation Feb 10, 2010
EPS Theme Meeting Theme 4: Genome biology Dec 09, 2011
EPS Theme Meeting Theme 3: Metabolism and Adaptation Apr 26, 2011
► NWO Lunteren days and other National Platforms
NWO-ALW, 'Experimental Plant Sciences', Lunteren (2 days) Apr 06-07, 2009
NWO-ALW, 'Experimental Plant Sciences', Lunteren (2 days) Apr 19-20, 2010
NWO-ALW, 'Experimental Plant Sciences', Lunteren (2 days) Apr 04-05, 2011
NWO-ALW, 'Experimental Plant Sciences', Lunteren (2 days) Apr 02-03, 2012
► Seminars (series), workshops and symposia
Seminar by Dr. Wallace A. Cowlling, International Centre for Plant Breeding, The University of Western Australia Jun 26, 2009
Seminar Dr. Hiro Nonogaki, Oregon State University, USA Title: “Seeds, microRNA and Darwin?” Sep 17, 2009
Seminar Prof. Fenny Dane, Auburn University, Unravelling drought and cold tolerance mechanisms in watermelon and Citrus Sep 22, 2009
Seminar Dr. Justin Borevitz, University of Chicago, "Genetics of adaptation: from model organism to model ecosystem Jan 12, 2010
Seminar Prof. Kazuto Iwanma, Hokkaido University, "Varietal difference in potato root system and its implications in drought tolerance Feb 22, 2010
Seminar by Dr. Adam Price, Aberdeen UK: Study genetics of root growth Sep 17, 2010
Seminar by Dr. Kirsten Bomblies Harvard University: Genetic incompatibility and the plant immune system Nov 18, 2010
Seminar by Dr. Jose Jimenz-Gomez Max Planck Institute: 'Next generation quantitative genetics' Nov 29, 2010

136
Seminar by Dr. Ales Pecinka Max Planck Institute: 'Genome and epigenome stability under abiotic stress' Nov 29, 2010
Seminar Dr. Ian Henderson University of Cambridge: Genetics and epigenetics’ Dec 13, 2010
Seminar by Dr. Scott Chapman (CSIRO): Traits and technologides to design breeding systems for climate change Jan 28, 2011
Seminar by Prof. Fred van Euwijk: GxE interaction Mar 15, 2011
Seminar by Dr. Aaron Lorenz, University of Nebraska: Association mapping and gene interaction, WUR Oct 12, 2011
Seminar by Prof. Sissel Torre (Norwegian University of Life Sciences): Air humidity and stomatal responses of Arabidopsis Nov 02, 2011
Seminar by Dr. Roland Pieruschka (Forschungszentrum Jülich GmbH, Germany): Plant phenotyping from greenhouse Nov 03, 2011
Seminar by Dr. Veronica Grieneisen, John Innes Centre, Norwich, UK: Computational and Systems Biology Nov 17, 2011
Seminar by Dr. Wilfred Vermerris, University of Florida. Genetic Dissection of Complex Bioenergy Traits in Maize, Sorghum Nov 21, 2011
Seminar by Prof. Jill Farrant (Capetown University): A systems biology approach with applications for making drought tolerant crops’ Jun 26, 2012
Seminar by Dr. Inez Hortenze Slamet-Loedin (IRRI): Genetic modification for iron biofortification and drought tolerance in rice’ Jun 29, 2012
Seminar series of Plant Science, Wageningen (monthly on 2nd Tuesday) 2010-2012
Graduate School EPS: Career day Nov 18, 2011
Mini symposium: How to write world class paper by WUR library 2011
Mini symposium: Plant Breeding in Genomic Era Nov 25, 2011
Public lectures Crop & Weed Ecology: Title:"Crop Ecology to address the global agricultural challenges of the 21st century - illustrations from the World of Rice " Dec 02, 2011
Plant Breeding Annual research day 2009 Mar 04, 2009
Plant Breeding Annual research day 2010 Mar 10, 2010
Plant Breeding Annual research day 2011 Mar 08, 2011
Plant Breeding Annual research day 2012 Feb 28, 2012
► Seminar plus
► International symposia and congresses
International symposia Bologna Italy: Genomics of plant genetic recourses at Bologna Italy Apr 23-27, 2010
International conference, Varna Bulgaria: Molecular Basis of Plant Stress Sep 21-23, 2011
► Presentations
Ion Chromatography as a Tool to study Salt Tolerance in Barley, Plant breeding annual day (poster) Mar 10, 2010
Genetic variation for and QTL analysis of salinity tolerance in barley, Bologna Italy (poster) Apr 23-27, 2010
QTL mapping and path analysis determine salt tolerance, Luteren meeting (poster) Apr 04-05, 2011
Association mapping of salt tolerance in barley, Varna Bulgaria (poster) Sept 21-23, 2011
Association mapping of salt tolerance in barley, Luteren meeting (oral) Apr 02-03, 2012
► IAB interview Feb 2011
► Excursions
Visit IPK, Germany (2 days) Nov 2009
Visiting to PPO Lelystad May 10, 2012
Visit Breeding Station, Versuchsstation für Pflanzenzüchtung, Hohenheim University (02 days), Teilstation Eckartsweier May 14, 2012
Visit Keygene breeding company May 07, 2012
Subtotal Scientific Exposure 20,1 credits*

137
3) In-Depth Studies date
► EPS courses or other PhD courses
International course on QTL detection and use (Biometris, WUR) Jun 06-10, 2011
Molecular Markers course (Plant Breeding, WUR) Mar 26, 2009
► Journal club
Literature discussion group in Plant Breeding WUR 2009-2012
► Individual research training
Subtotal In-Depth Studies 4,8 credits*
4) Personal development date
► Skill training courses
Scientific writing, Wageningen UR Apr 2010
WGS course Basic Statistics, Wageningen UR Dec 2009
► Organisation of PhD students day, course or conference
► Membership of Board, Committee or PhD council
Subtotal Personal Development 3,3 credits*
TOTAL NUMBER OF CREDIT POINTS* 35.7 Herewith the Graduate School declares that the PhD candidate has complied with the educational requirements set by the Educational Committee of EPS which comprises of a minimum total of 30 ECTS credits
* A credit represents a normative study load of 28 hours of study.

Front cover:
Barley plants in the saline experiment on the hydroponics
Back cover:
Barley field at Wageningen UR, 2012
Cover idea and design: By the author
Printing: WÖHRMANN PRINT SERVICE, Zutphen, the Netherlands
Copyright © 2022 FDOKUMEN