Improving the quality of African robustas: QTLs for yield- and quality-related traits in Coffea...
18
ORIGINAL PAPER Improving the quality of African robustas: QTLs for yield- and quality-related traits in Coffea canephora Thierry Leroy & Fabien De Bellis & Hyacinthe Legnate & Edmund Kananura & Gustavo Gonzales & Luiz Felipe Pereira & Alan Carvalho Andrade & Pierre Charmetant & Christophe Montagnon & Philippe Cubry & Pierre Marraccini & David Pot & Alexandre de Kochko Received: 29 October 2010 / Revised: 27 January 2011 / Accepted: 7 February 2011 # Springer-Verlag 2011 Abstract Coffea canephora breeding requires combining sustainable productivity with improved technological and cup quality characteristics. Beverage quality is a complex and subjective trait, and breeding for this trait is time consuming and depends on knowledge of the genetics of its components. A highly variable C. canephora progeny resulting from an intraspecific cross was assessed for 63 traits over 5 years. To identify quantitative trait loci (QTLs) controlling agronomic, technological, and quality-related traits, a genetic map comprising 236 molecular markers was constructed, and composite interval mapping was per- formed. Beverage quality was evaluated in relation to biochemical and cup tasting traits. QTLs were identified for almost half of the traits evaluated, with effects ranging from 6% to 80% of phenotypic variation. Most of them present a consistent detection over years. The strongest QTLs explained a high percentage of the variation for yield in 2006 (34% to 57%), bean size (25% to 35%), content of chlorogenic acids (22% to 35%), sucrose and trigonelline content (29% to 81%), and acidity and bitterness of coffee beverages (30% to 55%). Regions of the C. canephora genome influencing beverage quality were identified. Five QTL zones were co-localized with candidate genes related to the biosynthesis of the analyzed traits: two genes coding for caffeine biosynthesis, one gene implicated in the biosynthesis of chlorogenic acids, and two genes implicated in sugar metabolism. This is one of the first studies on the identification of QTLs combining agronomic and quality Communicated by D. Grattapaglia Electronic supplementary material The online version of this article (doi:10.1007/s11295-011-0374-6) contains supplementary material, which is available to authorized users. T. Leroy (*) : F. De Bellis : P. Charmetant : P. Cubry : P. Marraccini : D. Pot UMR AGAP, CIRAD, 34398 Montpellier, France e-mail: [email protected] C. Montagnon UMR RPB, CIRAD, 34398 Montpellier, France H. Legnate Centre National de Recherche Agronomique (CNRA), BP 808, Divo, Ivory Coast E. Kananura National Agricultural Research Organisation (NARO), P.O. Box 185, Kituza, Mukono, Uganda G. Gonzales Department of Analytical chemistry, University of Seville, 41012 Seville, Spain L. F. Pereira Instituto Agronomico do Paraná (IAPAR), LBI-AMG, CP 481, 86001–970 Londrina, Paraná, Brazil A. C. Andrade Laboratory of Molecular Genetics (LGM-NTBio), Embrapa Genetic Resources and Biotechnology, CP 02372, 70770–900 Brazilian Federal District, Brazil A. de Kochko UMR DIADE, IRD, 34394 Montpellier, France Tree Genetics & Genomes DOI 10.1007/s11295-011-0374-6
-
Upload
independent -
Category
Documents
-
view
0 -
download
0
Transcript of Improving the quality of African robustas: QTLs for yield- and quality-related traits in Coffea...

ORIGINAL PAPER
Improving the quality of African robustas: QTLsfor yield- and quality-related traits in Coffea canephora
Thierry Leroy & Fabien De Bellis & Hyacinthe Legnate & Edmund Kananura &
Gustavo Gonzales & Luiz Felipe Pereira & Alan Carvalho Andrade &
Pierre Charmetant & Christophe Montagnon & Philippe Cubry & Pierre Marraccini &David Pot & Alexandre de Kochko
Received: 29 October 2010 /Revised: 27 January 2011 /Accepted: 7 February 2011# Springer-Verlag 2011
Abstract Coffea canephora breeding requires combiningsustainable productivity with improved technological andcup quality characteristics. Beverage quality is a complexand subjective trait, and breeding for this trait is timeconsuming and depends on knowledge of the genetics of itscomponents. A highly variable C. canephora progenyresulting from an intraspecific cross was assessed for 63traits over 5 years. To identify quantitative trait loci (QTLs)controlling agronomic, technological, and quality-relatedtraits, a genetic map comprising 236 molecular markers wasconstructed, and composite interval mapping was per-formed. Beverage quality was evaluated in relation tobiochemical and cup tasting traits. QTLs were identified foralmost half of the traits evaluated, with effects ranging from
6% to 80% of phenotypic variation. Most of them present aconsistent detection over years. The strongest QTLsexplained a high percentage of the variation for yield in2006 (34% to 57%), bean size (25% to 35%), content ofchlorogenic acids (22% to 35%), sucrose and trigonellinecontent (29% to 81%), and acidity and bitterness of coffeebeverages (30% to 55%). Regions of the C. canephoragenome influencing beverage quality were identified. FiveQTL zones were co-localized with candidate genes relatedto the biosynthesis of the analyzed traits: two genes codingfor caffeine biosynthesis, one gene implicated in thebiosynthesis of chlorogenic acids, and two genes implicatedin sugar metabolism. This is one of the first studies on theidentification of QTLs combining agronomic and quality
Communicated by D. Grattapaglia
Electronic supplementary material The online version of this article(doi:10.1007/s11295-011-0374-6) contains supplementary material,which is available to authorized users.
T. Leroy (*) : F. De Bellis : P. Charmetant : P. Cubry :P. Marraccini :D. PotUMR AGAP, CIRAD,34398 Montpellier, Francee-mail: [email protected]
C. MontagnonUMR RPB, CIRAD,34398 Montpellier, France
H. LegnateCentre National de Recherche Agronomique (CNRA),BP 808,Divo, Ivory Coast
E. KananuraNational Agricultural Research Organisation (NARO),P.O. Box 185, Kituza, Mukono, Uganda
G. GonzalesDepartment of Analytical chemistry, University of Seville,41012 Seville, Spain
L. F. PereiraInstituto Agronomico do Paraná (IAPAR), LBI-AMG,CP 481,86001–970 Londrina, Paraná, Brazil
A. C. AndradeLaboratory of Molecular Genetics (LGM-NTBio),Embrapa Genetic Resources and Biotechnology,CP 02372,70770–900 Brazilian Federal District, Brazil
A. de KochkoUMR DIADE, IRD,34394 Montpellier, France
Tree Genetics & GenomesDOI 10.1007/s11295-011-0374-6

traits in coffee. The high variability of quality traits withinC. canephora and the presence of consistent QTLs offerbreeders a promising tool to improve coffee cup quality.
Keywords Coffee . QTL . Beverage quality . Yield .
Cup tasting . Biochemical traits
AbbreviationsQTL Quantitative trait lociMAS Marker-assisted selectionY_200X Yield for the year 200XCY_200X/Y Cumulated yield from year 200X to 200YBS Bean sizePB Rate of pea berriesCA Caffeine contentTR Trigonelline contentSU Sucrose content3C 3-Caffeoylquinic acid content (3-CQA)4C 4-Caffeoylquinic acid content (4-CQA)5C 5-Caffeoylquinic acid content (5-CQA)5F 5-Feruloylquinic acid content (5-FQA)34dC 3,4-Dicaffeoylquinic acid (3,4di-CQA)35dC 3,5-Dicaffeoylquinic acid (3,5di-CQA)45dC 4,5-Dicaffeoylquinic acid (4,5di-CQA)FR FragranceAR AromaBO BodyFL FlavorAC AcidityBI BitternessAF AftertasteGL Global noteLG Linkage group
Introduction
Two coffee species have worldwide economic importance,namely Coffea arabica L. and Coffea canephora Pierreknown commercially as Arabica and Robusta, respectively(Wintgens 2004). Large variations within and betweencultivated species are observed (Anthony et al. 1993, 2001;Gomez et al. 2009; Cubry et al. submitted for publication).Arabica represents approximately 65% of worldwide coffeeproduction and presents higher quality than Robusta due to itslower bitterness and caffeine content and its more appreciatedflavor (for a review, see Leroy et al. 2006). To date, qualityhas not often been considered before the last steps of thebreeding process for C. canephora (Charrier and Berthaud1988). Two main genetic and geographic C. canephoragroups were identified: the Guinean group from westernAfrica and the Congolese group from central Africa (Berthaud
1986). Further studies also divided the Congolese group intofour subgroups (Montagnon et al. 1992; Dussert et al. 1999).A recurrent selection program has been built on C. canephorabreeding in Côte d’Ivoire since 1984. This recurrent selectionbreeding is based on the improvement of complementaryGuinean and Congolese populations (Leroy et al. 1993).
The main traits commonly taken into account forC. canephora coffee quality improvement are as follows:bean size and extractable soluble solids with respect totechnological qualities; aroma precursors, such as sugars,caffeine, trigonelline, lipids, and chlorogenic acids, asbiochemical traits; and organoleptic traits assessed by cuptasting. Ky et al. (2001a) described the diversity observedin a number of quality traits, including caffeine, trigonel-line, chlorogenic acids, and sucrose in Robusta and Arabicacoffees. For most compounds, they indicated that thegeographical origin of the plants within the genetic groupswas the main factor contributing to variability. Regardingcup quality, Moschetto et al. (1996) reported differencesbetween genetic groups related to preference, aroma,acidity, body, and bitterness. Additionally, the same studyconcluded that Guinean genotypes were on average inferiorto Congolese genotypes for preference and aroma. Theyalso indicated good linear correlation coefficients betweenpreference and certain factors, such as acidity and aroma.
Montagnon et al. (1998) observed that the variations inyield and quality traits were independent within C. canephora,meaning that quality could be improved without loweringyield. In the same report, the authors showed that narrowsense heritability was high for caffeine content (h2=0.80) andbean weight (0.73), intermediate for chlorogenic acids (0.36),and low for sucrose content (0.11). For cumulative yield overfour harvests, narrow sense heritability values were estimatedas intermediate with values ranging from 0.3 to 0.4 (Leroy etal. 1994; Montagnon et al. 2003).
Other results for interspecific hybrids suggested a highvalue (0.71) for the heritability of trigonelline content(Ky et al. 2001b), with a maternal mode of inheritance.For sucrose content, while Montagnon et al. (1998)indicated that this trait could be difficult to improvebecause h2 was low, Ky et al. (2000a) found additivetransmission among their interspecific hybrids, presentingthe possibility of choosing parents for its improvement.Relationships between different chlorogenic acid mono-mers or dimers were also studied by Ky et al. (1999) usingan interspecific cross between Coffea liberica and Coffeapseudozanguebariae, indicating a linear relationship be-tween caffeoylquinic and dicaffeoylquinic contents. In thesame interspecific population, Barre et al. (1998) indicatedthat caffeine was under polygenic control, with stronggenetic effects.
Unraveling the genetic basis of complex traits, such asyield potential and stability and coffee quality, can be
Tree Genetics & Genomes
undertaken through the construction of a genetic linkagemap followed by quantitative trait loci (QTL) identification.
The first C. canephora map was constructed withdoubled haploids using restriction fragment length poly-morphism (RFLP) markers (Paillard et al. 1996). Anothermap has been developed using doubled haploids for theanalysis of segregation distortion (Lashermes et al. 2001).Recently, a map has been developed (Lefebvre-Pautignyet al. 2010) from a segregating population of 93individuals resulting from a cross between heterozygousgenotypes, using mainly RFLP, simple sequence repeat(SSR), and expressed sequence tag (EST)–SSR markers.Maps were also developed for interspecific crosses(Akaffou et al. 2003; Coulibaly et al. 2003; Ky et al.2000b; N’Diaye et al. 2007) to identify QTLs involved incontrasting traits between wild species using mainlyAFLP markers.
To date, few QTL studies have been performed oncoffee, and no QTL report is available related to qualitytraits for coffee. QTLs have been identified for theincompatibility S locus (Lashermes et al. 1996), pollenviability restoration (Coulibaly et al. 2003), fructificationtime (Akaffou et al. 2003), morphological traits (N’Diaye etal. 2007), and for somatic embryogenesis capacity (Priyonoet al. 2010). However, the genetic diversity from theGuinean pool has not been explored in these QTL studies,and the main C. canephora breeding program is based onreciprocal recurrent selection between the Congolese andGuinean pool (Leroy et al. 1993).
The aims of the present study were: (1) to construct anintraspecific genetic linkage map for C. canephora using apseudo-backcross progeny between Guinean and Congo-lese genotypes, (2) to identify QTLs for yield and quality-related traits, and (3) to draw conclusions related to yieldand quality breeding of C. canephora.
Materials and methods
Plant material
Genetic mapping was performed on an intraspecific popula-tion of 273 pseudo-backcross individuals of C. canephora.This progeny resulted from a cross between an intergroupprogeny genotype (Guinean 410×Congolese A03) used as thefemale and a Guinean genotype used as the male (02183). Atrial was set up in 2000 on Divo station at the CentreNational de Recherche Agronomique (CNRA) in Republicof Côte d’Ivoire (RCI) (5°46′04.07″N, 5°13′22.09″W,altitude 200 masl). The experimental design was a fullyrandomized single tree plot. Trees were planted at a highdensity (2.5×1.5 m, approximately 3,000 plants per hectare).The grandparents 410 and A03 and the parent 02183 were
planted in the same plot as the progeny. Data were collectedbetween 2002 and 2006.
During the trial (2000–2006), the pattern of rainfall wasquite normal, with two rainy seasons (May to June andSeptember to November). Eighteen trees from our progenydied during the first dry season; the trees were not irrigatedand they were fertilized twice a year with 20 g of 23-10-5(NPK)+4 Mg. Treatment against weeds was performed sixtimes a year. Coffee leaf rust appeared on the trees, but notreatment was performed for this because this disease hadno significant effect on yield.
Cherries from the entire trial were sun-dried. Samples fortechnological, chemical, and organoleptic analyses werewet processed. After pulping, beans were fermented andthen dried without direct sun exposure.
Evaluation of phenotypic traits
We analyzed each trait separately within each year to takeinto account environmental annual effects. A total of 21phenotypic traits were recorded for variable number ofyears, totalling 57 yearly phenotypic traits. Cumulativeyields were analyzed for the 2002 to 2003, 2002 to 2004,2002 to 2005, 2002 to 2006, 2003 to 2006, and 2004 to2006 harvests. A total of 63 traits were thus evaluated forthis trial. These traits can be split into four classes: yield,technological, biochemical, and organoleptic.
Yield traits
Yield was calculated by summing the weights of freshberries (in grams) harvested during the productive period(from the second fortnight of September until the end ofDecember). Fresh red fruits were harvested by hand eachmonth and weighed immediately for each tree. Observa-tions were recorded from the second until the sixth yearafter planting (i.e., 2002 to 2006) for 248 trees. It wasobserved that 25 of the 273 trees never produced any fruit,including the 18 trees that died during the first dry season.
Technological traits
Samples of 250 g with 12% moisture were used to estimatebean size (BS) as the weight of 100 kernels (in grams) andthe percentage of round beans, or pea berries (PB, inpercentage). Both traits were recorded during 4 years(2003–2006) in samples of 155, 227, 216, and 191 trees,respectively, depending on the availability of fruits.
Biochemical traits
Biochemical traits were analyzed for the 2003 (103samples) and 2005 (204 samples) harvests. Caffeine,
Tree Genetics & Genomes
trigonelline, and chlorogenic acid content were analyzed byreversed-phase high-performance liquid chromatography(HPLC) with spectrophotometric detection. A 5-μm particlesize C18 150×4.6 mm column was used. Mobile phaseconsisted of a mixture of methanol and an aqueous solutionof 5 mM triethylamine and acetic acid (pH 3.0, 30:70 v/v).Elution was performed in isocratic mode at 1 ml min−1.Detection was conducted with a diode array detector.Caffeine and trigonelline were quantified using the peakarea (measuring the absorbance at 273 nm for caffeine and265 nm for trigonelline) by external calibration usingstandards. Prior to HPLC determination, the powderedassay portion was extracted using an aqueous suspension ofMgO at 105°C for 20 min. Quantification of chlorogenicacids was achieved by peak area measurement. Sevenchlorogenic acids were measured: three caffeoylquinicacids, 3-CQA (3C), 4-CQA (4C), and 5-CQA (5C); theferuloylquinic acid 5-FQA (5F) and three dicaffeoylquinicacids, 3,4di-CQA (34dC), 3,5di-CQA (35dC), and 4,5di-CQA (45dC). These are the main chlorogenic acids presentin C. canephora (Ky et al. 2001a).
For chlorogenic acid determinations, the methodologyused was reversed-phase HPLC using mobile phases A(2 mM H3PO4 in methanol 5% (v/v) pH 2.7) and B (2 mMH3PO4 in methanol 5% (v/v) pH 3.9). A gradient programwas used for 45 min with different volumes of phases Aand B. Chromatograms were recorded at 325 nm. The flowrate was 0.8 ml min−1. Sucrose (SU) was quantified byenzymatic spectrophotometric determination on green cof-fee, as described by Alcazar et al. (2004).
Organoleptic traits
The liquoring method used was adapted from CIRADprotocol (Ribeyre, personal communication) and performedat NARO facilities (Uganda). Samples were received fromthe experimental field (CNRA, RCI) and stored untiltesting. A maximum of four samples per day were roastedto medium roast using a PROBERT roasting machine. Eachsample was tested in triplicate using 10 g of roasted beansground to medium size and 200 ml of controlled nearlyboiled water (95°C, pH ~7.0 and dry residues <100 mg) foreach replicate. After mixing and prior to analysis, time wasallowed for coffee powder to settle and for the temperatureto cool down to 50°C. The same panel of five well-trainedtasters conducted the whole experiment. A sample scoreusing a six-class scale (from 0=not detected to 5=fullydetected) was performed on eight coffee quality descriptors:fragrance, aroma, body, flavor, acidity, bitterness, andaftertaste. A global note was attributed by each taster basedon a global preference of the beverage. Organolepticanalyses were carried out on the three last harvests (from2004 to 2006), with an unequal number of samples (trees)
analyzed each year: 62 trees in 2004, 112 trees in 2005, and180 trees in 2006.
Data analysis
The mean, standard deviation and variance were calculatedfor all traits. Histograms were built, and normality waschecked using a Shapiro and Wilk test; an appropriatetransformation was performed to reach a normal distribu-tion whenever needed.
Genotypic analyses and map construction
DNA extraction
Genomic DNA was extracted from ground leaves followingan extraction procedure using MATAB buffer adapted fromRisterucci et al. (2000). Purification of the extracts was thenperformed using an anion exchange resin column (Nucleo-Bond AX 20 from Macherey-Nagel, Düren, Germany).
Molecular markers
A set of 147 genomic microsatellites (SSRs) was mapped.They were identified in enriched libraries (Poncet et al.2004, 2007; Combes et al. 2000; Baruah et al. 2003;Moncada and Mac Couch 2004). We also mapped 69 SSRsderived from EST sequences, genes or BAC end sequences(Leroy et al. 2005; Lin et al. 2005; Geromel et al. 2006).
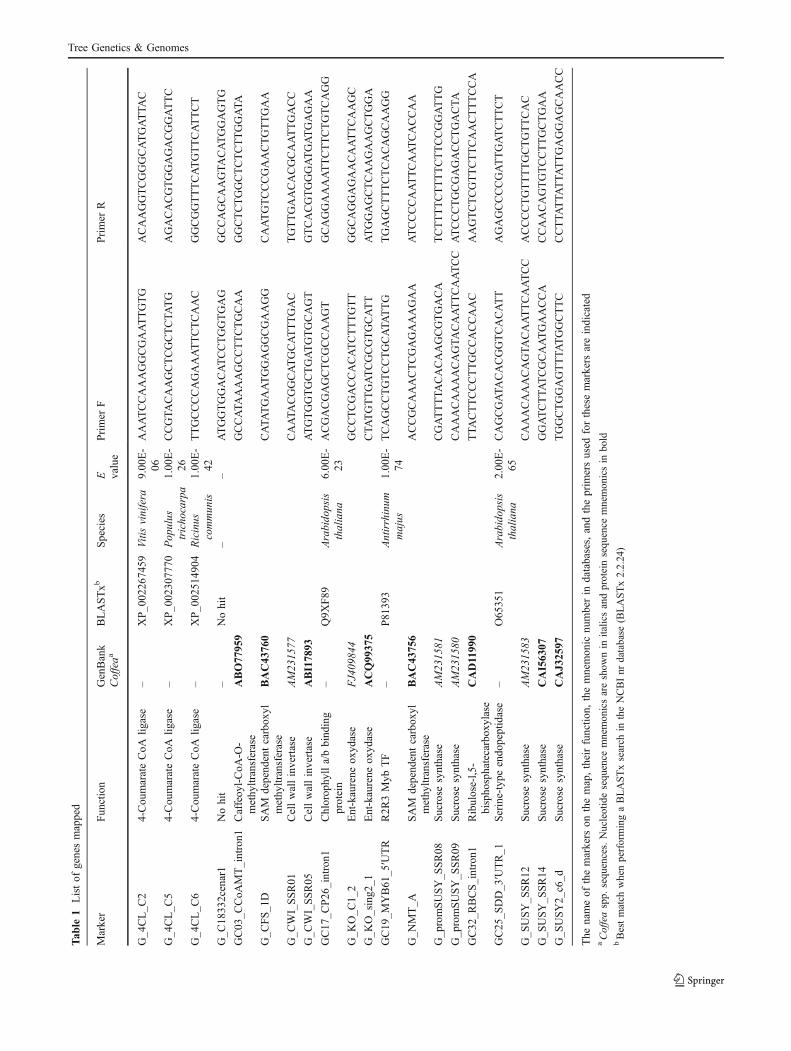
Twenty fragments of genes were mapped for sugar, lipid,caffeine, and chlorogenic acid metabolism (Bouchet et al.2005; Geromel et al. 2006). Fragments of genes related todrought tolerance in coffee were also mapped (Freire et al.2010). The genes mapped are presented in Table 1.
Genotyping
For the genes to be mapped, primers were defined atdifferent locations within genes in promoters, exons, or 3’or 5’ UTR regions. Then, PCR amplification was per-formed for parents, indicating whether a size polymorphism(insertion/deletion) was present. If a size polymorphismwas present, the genes were mapped using the samegenotyping method as was used for SSRs.
For each PCR reaction, 5 ng of DNA in 5 μl of waterwas used as a template and mixed in a final reaction volumeof 10 μl with 1× buffer (10 mM Tris–HCl, 50 mM KCl,2 mM MgCl2, 0.001% glycerol), 200 μM dNTPs, 0.10 μMof reverse primer, 0.08 μM of forward primer tailed withM13 sequence, 0.10 μM of fluorescently labeled M13primer, and 0.1 U of Taq polymerase. PCR amplificationswere performed in an Eppendorf Mastercycler ep 384(Eppendorf, Westbury, NY, USA). The amplification
Tree Genetics & Genomes
Tab
le1
Listof
genesmapped
Marker
Fun
ction
GenBank
Coffeaa
BLASTxb
Species
E value
Primer
FPrimer
R
G_4
CL_C
24-Cou
marateCoA
ligase
–XP_0
0226
7459
Vitis
vinifera
9.00
E-
06AAATCCAAAGGCGAATTGTG
ACAAGGTCGGGCATGATTA
C
G_4
CL_C
54-Cou
marateCoA
ligase
–XP_0
0230
7770
Pop
ulus
tricho
carpa
1.00
E-
26CCGTA
CAAGCTCGCTCTATG
AGACACGTGGAGACGGATTC
G_4
CL_C
64-Cou
marateCoA
ligase
–XP_0
0251
4904
Ricinus
commun
is1.00
E-
42TTGCCCCAGAAATTCTCAAC
GGCGGTTTCATGTTCATTCT
G_C
1833
2cenar1
Nohit
–Nohit
––
ATGGTGGACATCCTGGTGAG
GCCAGCAAGTACATGGAGTG
GC03
_CCoA
MT_intron1
Caffeoy
l-CoA
-O-
methy
ltransferase
ABO77
959
GCCATA
AAAGCCTTCTGCAA
GGCTCTGGCTCTCTTGGATA
G_C
FS_1
DSAM
depend
entcarbox
ylmethy
ltransferase
BAC43
760
CATA
TGAATGGAGGCGAAGG
CAATGTCCCGAACTGTTGAA
G_C
WI_SSR01
Cellwallinvertase
AM23
1577
CAATA
CGGCATGCATTTGAC
TGTTGAACACGCAATTGACC
G_C
WI_SSR05
Cellwallinvertase
ABI178
93ATGTGGTGCTGATGTGCAGT
GTCACGTGGGATGATGAGAA
GC17
_CP26
_intron1
Chlorop
hylla/bbind
ing
protein
–Q9X
F89
Arabido
psis
thaliana
6.00
E-
23ACGACGAGCTCGCCAAGT
GCAGGAAAATTCTTCTGTCAGG
G_K
O_C
1_2
Ent-kaurene
oxyd
ase
FJ409
844
GCCTCGACCACATCTTTGTT
GGCAGGAGAACAATTCAAGC
G_K
O_sing2
_1Ent-kaurene
oxyd
ase
ACQ99
375
CTA
TGTTGATCGCGTGCATT
ATGGAGCTCAAGAAGCTGGA
GC19
_MYB61
_5′UTR
R2R
3Myb
TF
–P81
393
Antirrhinum
majus
1.00
E-
74TCAGCCTGTCCTGCATA
TTG
TGAGCTTTCTCACAGCAAGG
G_N
MT_A
SAM
depend
entcarbox
ylmethy
ltransferase
BAC43
756
ACCGCAAACTCGAGAAAGAA
ATCCCCAATTCAATCACCAA
G_p
romSUSY_S
SR08
Sucrose
synthase
AM23
1581
CGATTTTA
CACAAGCGTGACA
TCTTTTCTTTTCTTCCGGATTG
G_p
romSUSY_S
SR09
Sucrose
synthase
AM23
1580
CAAACAAAACAGTACAATTCAATCC
ATCCCTGCGAGACCTGACTA
GC32
_RBCS_intron1
Ribulose-l,5
-bispho
sphatecarbox
ylase
CAD1199
0TTA
CTTCCCTTGCCACCAAC
AAGTCTCGTTCTTCAACTTTCCA
GC25
_SDD_3
′UTR_1
Serine-type
endo
peptidase
–O65
351
Arabido
psis
thaliana
2.00
E-
65CAGCGATA
CACGGTCACATT
AGAGCCCCGATTGATCTTCT
G_S
USY_S
SR12
Sucrose
synthase
AM23
1583
CAAACAAACAGTA
CAATTCAATCC
ACCCCTGTTTTGCTGTTCAC
G_S
USY_S
SR14
Sucrose
synthase
CAI563
07GGATCTTA
TCGCAATGAACCA
CCAACAGTGTCCTTGCTGAA
G_S
USY2_
c6_d
Sucrose
synthase
CAJ3
2597
TGGCTGGAGTTTATGGCTTC
CCTTA
TTA
TTA
TTGAGGAGCAACC
The
nameof
themarkers
onthemap,theirfunctio
n,themnemon
icnu
mberin
databases,andtheprim
ersused
forthesemarkers
areindicated
aCoffeaspp.
sequ
ences.Nucleotidesequence
mnemon
icsareshow
nin
italicsandproteinsequ
ence
mnemonicsin
bold
bBestmatch
whenperformingaBLASTxsearch
intheNCBInr
database
(BLASTx2.2.24)
Tree Genetics & Genomes
program consisted of an initial denaturation cycle of 5 minat 94°C, followed by ten cycles of “touch-down” PCRconsisting of 45 s at 94°C, 1 min at 60°C to 55°C,decreasing by 0.5°C each cycle, and 1 min at 72°C. Thenext 20 cycles consisted of 94°C for 45 s, 55°C for 1 min,and 72°C for 1 min, prior to a final elongation step at 72°Cfor 5 min.
Fluorescently labeled PCR products were analyzed byelectrophoresis on a 6.5% polyacrylamide gel using a LI-COR 4300 automated sequencer (LI-COR Biosciences,Lincoln, NE, USA). Gel images were retrieved, and gelswere scored manually. Individuals were scored according tothe parental segregation types.
Statistical analysis
Statistical analysis was performed to determine variation inthe data and to calculate correlation coefficients. Meansover years and coefficients of variation were computed foreach trait. These coefficients of variation were calculatedconsidering data throughout harvest years.
Pearson phenotypic correlation coefficients betweentraits were evaluated, and the significance was tested by aP value test. These correlations were calculated forindividual annual data for all traits, as well as for meanphenotypic data over years.
Map construction
Due to the high heterozygosity of both parents, a pseudo-testcross strategy was used (Grattapaglia and Sederoff1994). After building independent datasets with segregatingmarkers for each parent, parental maps were constructedusing JoinMap 4 software (Van Ooijen 2006) withKosambi’s mapping function and default parameters. Aconsensus map was then built for a log-of-odds (LOD)score higher than 4.4 and visualized using Spidermapsoftware (Rami, unpublished).
QTL analysis
A MapQTL 5 software (Van Ooijen 2004) was used for thedetection of QTLs on the consensus genetic map for the 63traits observed, with between 62 and 246 individuals scoredfor each trait. The data for all 63 traits were used for QTLdetection.
Interval mapping was used to detect QTLs. An LODthreshold was experimentally determined for a given traitusing the permutation test of MapQTL 5 with 500 iterations.Specific thresholds were determined for the 1% confidencelevel for each trait in each linkage group (LG). At the genome-wide level, thresholds were determined for 10%, 5%, and 1%confidence levels. In a second step, composite interval
mapping referred as MQM in MapQTL (Multiple QTLmodels, Jansen and Stam 1994) was used after an automaticcofactor selection allowing the removal of some loci flankingthe most important QTLs and then localizing QTLs withsmaller effects more precisely. The confidence interval wasdetermined by the LOD-1 method for each QTL.
Allelic effects of the QTLs were estimated as Af = [(μac +μad) − (μbc + μbd)]/4 for female additivity, Am = [(μac +μbc) − (μad + μbd)]/4 for male additivity, and D = [(μac +μbd) − (μad + μbc)]/4 for dominance, where μac, μad, μbc, andμbd are the estimated phenotypic means associated with eachof the four possible genotypic classes, ac, bc, ad, and bd,derived from a <ab × cd> cross (Segura et al. 2009). Thegenetic LGs carrying QTLs were presented using MapChartsoftware (Voorrips 2002).
Results
Quantitative trait analysis
A total of 63 quantitative traits were analyzed separately.The mean, SD, min, and max values were calculated for theprogeny. Mean values were calculated for three parentalgenotypes: 410 and A03 as grandparents, and 02183 as themale parent of the progeny.
Yield traits
Individual yields for each of the 248 trees of the progenywere recorded for five consecutive years (2002 to 2006)along with the calculation of cumulative yields. These fiveharvests constitute the first cycle of production for youngtrees. After this fifth harvest, trees were cut for a newproduction cycle. The 2004 to 2006 harvests were the mostproductive. For further analyses, all yield data were logtransformed (log (yield in grams+1)) to fit data normality.
Summary data for parents and progeny are presented inTable S1. The trees were planted in 2000; yields increasedyearly until 2004 and remained stable from 2004 to 2006,with a slight decrease occurring in 2005 due to alternationin production. Yield presented a high variability, with acoefficient of variation reaching 62.2% (Table 2). This highvariability is always observed for yield in coffee, as strongenvironmental and ontogenic effects are observed for youngplants.
Correlations were estimated for yearly and cumulativeyields after log transformation (see supplementary Table S2).All of the yearly and cumulative data were moderately tohighly correlated (0.21 to 0.55), except for yield in 2002 and2006. The cumulative 5-year yield was highly correlatedwith yearly yields from 2004 to 2006, with correlationcoefficients higher than 0.6.
Tree Genetics & Genomes
Technological traits
BS and the rate of PB were measured for harvests from2003 to 2006. The results for the progeny and for parentalgenotypes are presented in Table S1. Bean size remainedlow for the progeny and the rate of pea berries was high,always being higher than 30%. The values observed for theprogeny were within the values observed for the parentsand grandparents (Table S1). Technological traits exhibitedmedium coefficients of variation (19% for BS and 34% forPB, Table 2). The phenotypic correlations were highlysignificant for each trait considering successive years, withvalues above 0.5 in most cases (Table S2). Significantpositive correlations were also observed between PB andBS, except in 2005.
Biochemical traits
Biochemical traits were estimated for the 2003 and 2005harvests. A high variability was observed every year withinthe progeny, and values were quite stable from 1 year toanother. For all compounds, the values observed for theprogeny were included between the values measured for theparents 410 and A03 (Table S1). Some data were modified
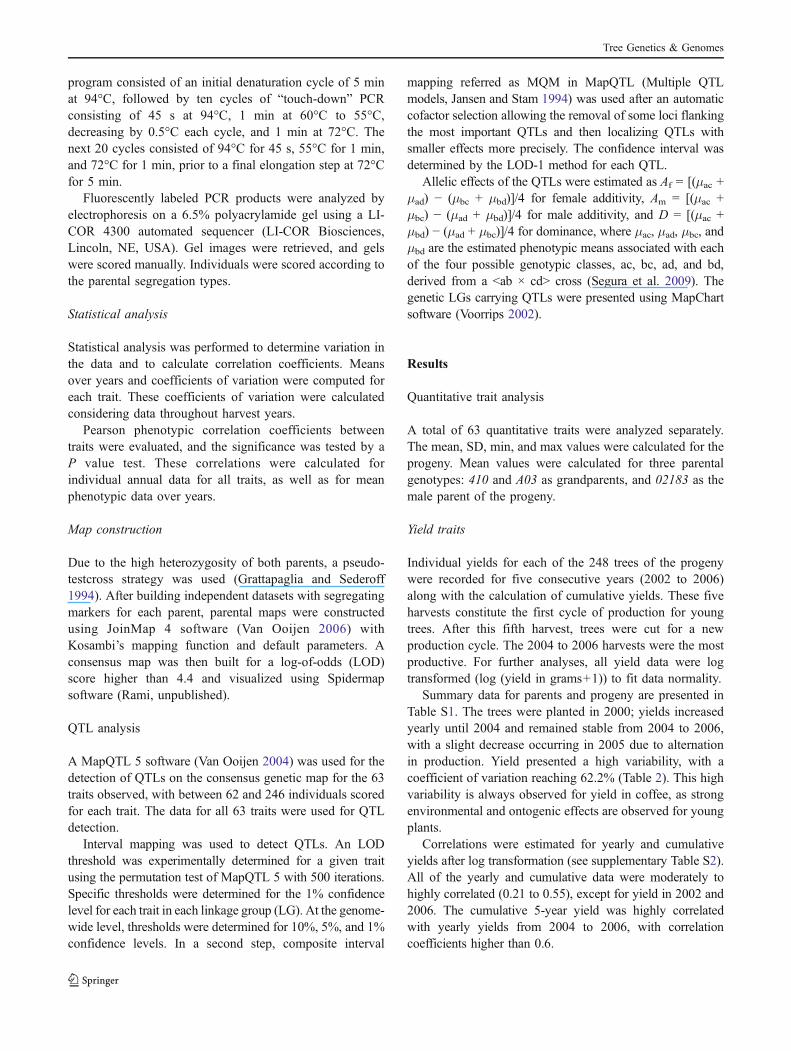
to fit normality; for example, data on chlorogenic acidswere transformed using the ArcSIN ((x/100)0.5) formula.The concentration of biochemical compounds in the greenbeans presented a coefficient of variation ranging from11.16% (5-CQA) to 58.19% (3,5di-CQA); see Table 2.Phenotypic variability was moderate for caffeine, sucrose,and trigonelline content (19% to 22%). Variability for thedifferent chlorogenic acids was highly variable, with apositive correlation with the compound’s mean value. Thelowest variability was observed for 5-CQA (11.16%, for amean of 55.06), and the highest was observed for 3,5di-CQA (58.19%, for a mean of 3.27).
Correlations for biochemical traits are presented insupplementary Table S2. For sucrose, caffeine and 3-CQA, 4-CQA and 5-FQA chlorogenic acid content, a highpositive correlation was observed between values in 2003and 2005. A highly significant positive correlation wasobserved between 3-CQA and 4-CQA content (0.99 in2003 and 0.96 in 2005), whereas highly significant negativecorrelations were observed between these two chlorogenicacids and the other chlorogenic acids, including 5-CQA and5-FQA.
For the dicaffeoylquinic acids, highly significant positivecorrelations were observed between the three compoundsanalyzed in both years of the analysis. Correlations betweenthe contents of all caffeoylquinic acids (except 5-FQA) andthe contents of dicaffeoylquinic acids were negative in2003 (−0.12 to −0.66) and were significantly negative withthe three di-CQAs in 2005 (−0.34 to −0.43).
Additionally, no significant correlation was observedbetween sucrose, caffeine or trigonelline content, and thecontent of other compounds, except for caffeine content in2003 and dicaffeoylquinic acid contents in 2005.
Organoleptic traits
Each coffee sample produced from each plant wasindividually tested for its organoleptic characteristics forthree successive years from 2004 to 2006. Small differenceswere observed for all traits between genotypes and years.The Guinean parents of the progeny (410 and 02183)presented much higher bitterness than the Congolesegrandparent A03, but the differences were quite small foracidity. Within the progeny, the bitterness was quite highbut decreased over the years. Meanwhile, acidity remainedlow for all years, with values also decreasing from year toyear. The global preference notation given by the judgesdecreased in 2006, along with decreasing aroma and body(Table S1). The variability of organoleptic traits (Table 2)was generally low to medium (13% to 23%), except foracidity and bitterness, which showed high levels ofvariability (99% and 40%, respectively) with very lowmean values. The high level of variability found for acidity
Table 2 Mean and coefficient of variation for all traits, calculatedfrom data throughout the 5 years of the experiment
Type of trait Trait Mean Coefficient of variation in percent
Yield Y 1.82 62.23
Technological PB 36.28 34.12
BS 9.91 19.33
Biochemical SU 5.27 22.63
CA 2.56 19.56
TR 0.84 22.94
3C 9.62 20.36
5C 55.06 11.16
4C 13.62 17.38
5F 11.48 26.55
34dC 3.26 36.78
35dC 3.27 58.19
45dC 4.39 53.47
Organoleptic FR 2.03 13.29
AR 1.97 14.63
BO 1.98 16.48
FL 1.85 20.16
AC 0.13 99.24
BI 1.33 39.79
AF 1.72 22.09
GL 1.86 23.60
CA caffeine, FR fragrance, AR aroma, BO body, FL flavor, AC acidity,BI bitterness, AF aftertaste, GL global note
Tree Genetics & Genomes
was due to its very low content for the beans tested, andthus, this trait was very difficult for the tasters to estimate.
Significant correlations between organoleptic traits wereobserved each year, but not between years, indicating theindependence of successive years (Table S2). As expected,acidity was highly positively correlated with the globalpreference note, with values ranging from 0.49 to 0.60, but itwas negatively correlated with bitterness (−0.33 to −0.37).
Phenotypic correlations among all mean trait values overthe years were evaluated (Table 3), including cumulativeyield over five years. Significant but low positive correla-tions were observed between cumulative yield (CY_2002/6), bean size (0.21), and sucrose content (0.15). Cumulativeyield was also significantly correlated with favorableorganoleptic traits, such as acidity, flavor, and the globalnote (0.19 to 0.29). Technological traits (bean size and rateof pea berries) presented highly significant correlationswith 3-CQA (0.15 to 0.17) and with 5-FQA (negativecorrelations from −0.17 to −0.22). Finally, the correlationsbetween flavor, acidity, and the global note, with respect toorganoleptic traits, and sucrose and 5-CQA content, amongbiochemical traits, were highly and positively significant. Anegative correlation was observed between flavor andacidity with trigonelline and 5-FQA content. Bitternesswas highly negatively correlated with sucrose (−0.25) andwas highly positively correlated with caffeine content(0.20).
LG analysis
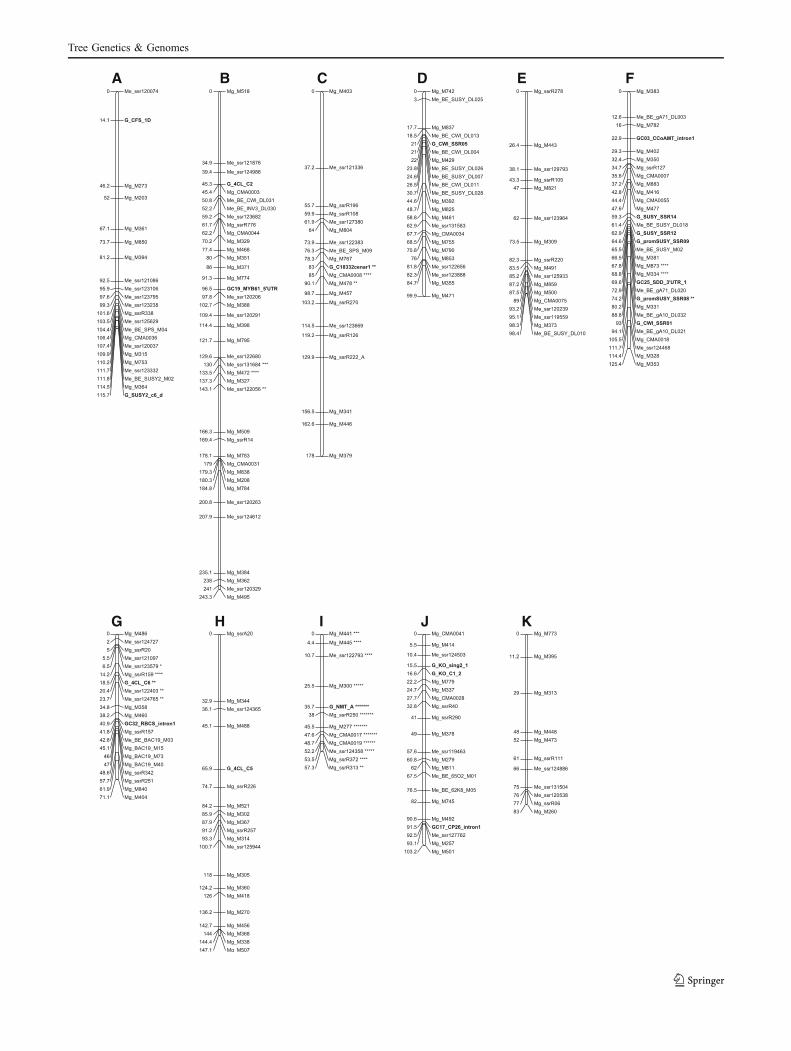
A total of 248 markers were initially used for genotypingthe population of 248 individuals. Markers or genotypeswith more than 10% of missing data were eliminated.Finally, 238 markers were mapped using 184 individualtrees. Eleven LGs were constructed, corresponding to the11 gametic chromosomes of C. canephora. The total lengthof our consensus map was 1,290 cM, with an averagedistance of 5.5 cM between markers and a maximumdistance of 37 cM between markers. The length of the LGswas variable, ranging from 57.8 cM for LG I to 243.3 cMfor LG B. Segregation distortion was observed for allmarkers in LG I, with χ2 test values found to be highlysignificant (p<0.05 to 0.0001). The consensus map ispresented in Fig. 1. We built both parental maps, but as themap for the male Guinean parent 02183 was sparse, weonly used the female map to confirm the position ofmarkers on the consensus map.
Sixteen genes were mapped to nine LGs. These geneswere identified in EST libraries in the framework of ourcollaboration with Brazilian teams from IAPAR andEMBRAPA/CENARGEN (Geromel et al. 2006; Freire etal. 2010). Two genes involved in caffeine metabolism weremapped to LGs A and I. One gene (two markers) related to
lipid metabolism has been mapped to LG J. Four genesinvolved in the biosynthesis of chlorogenic acids weremapped to LGs B, F, G, and H. For CGA biosynthesis, wemapped one CCoAOMT gene that was previously mappedby Campa et al. (2003) and three 4CL genes. This lastenzyme acts at different levels in the CGA metabolic chainpathway (Lepelley et al. 2007; Joët et al. 2009). Fiveputative candidate genes implicated in drought tolerancewere mapped on to the B, C, F, G, and J LGs. Finally, fourgenes for sucrose metabolism were mapped to LGs A, D,and F (five markers from two sucrose synthase genes, SUS1and SUS2, and two CWI genes encoding cell wallinvertases). With respect to previous work on the charac-terization of a C. canephora BAC library using sucrosesynthase genes (Leroy et al. 2005), the copy number ofthese genes were confirmed, with one copy found for SUS2and three copies found for SUS1.
QTL detection
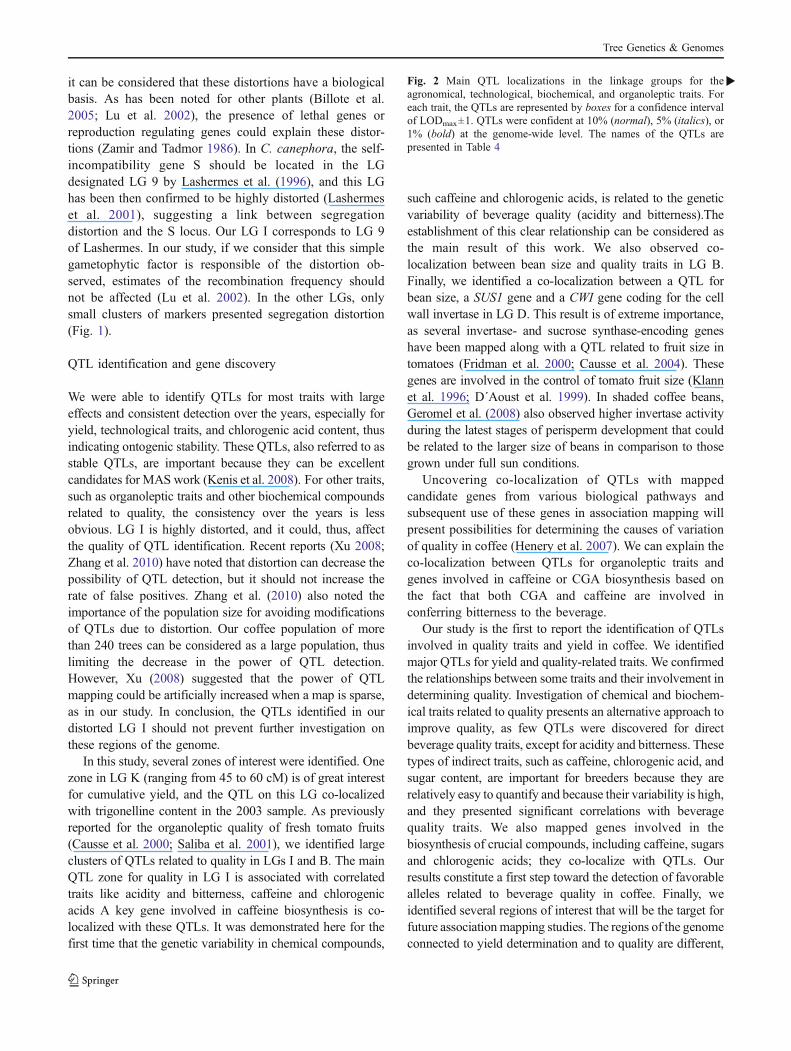
QTL detection was performed from a synthetic map with209 markers. Markers that were very close to each otherwere eliminated for QTL detection. Phenotypic data wereavailable for all of the trees, and these trees were integratedin the QTL study independently of their elimination in mapconstruction. The QTL detection was, thus, performedusing all of the 248 trees of the progeny. Figure 2 presentsthe main QTLs identified per LG for all data and Table 4presents all of the QTLs and their characteristics.
Seven QTLs were identified for yield (Table 4). Onemain QTL zone was located in LG K for the 2006 yield andthe cumulative yield for 3 to 5 years of harvest. Two QTLsthat explained 34% to 42% of the phenotypic variations forthe 2006 yield were identified in LG I, and one QTL wasidentified in the D LG for the 2003 yield. Dominanceeffects were predominant for cumulative yield.
For the rate of pea berries, six QTLs were identified inLGs F, J, and K. A female additive effect was found to bethe most important effect for this trait. Eleven QTLs forbean size were found in LGs A, B, D, F, and J, with littleconsistency throughout the years, and quite surprisingly,dominance effects were the most important for thisheritable trait. One QTL in LG A explained 35% of thevariation in this trait in 2005, while two QTL zones in LGB explained up to 25% of the trait variation.
Co-localization between agronomic and technologicaltraits was limited to LG F, where a QTL for bean size andthe rate of pea berries co-localized. With respect tobiochemical traits, 27 QTL zones were implicated in thisstudy (Table 4). Female additive effects were quite importantfor chlorogenic acids and caffeine. For sucrose and trigonel-line content, male additive and dominant effects were alsofound. QTLs were identified for all traits analyzed. For these
Tree Genetics & Genomes

Tab
le3
Pheno
typiccorrelations
amon
gmeanvalues
ofthetraitsov
ertheyears(Pearson
’scorrelationtest)
BS
CY_200
2/6
FR
AR
BO
FL
AC
BI
AF
GL
SU
CA
TR
3C5C
4C5F
34dC
35dC
45dC
PB
0.19
**ns
0.22**
nsns
nsns
nsns
nsns
nsns
0.17
**ns
0.16*
−0.17**
nsns
ns
BS
0.21**
nsns
0.14
*ns
0.15*
nsns
nsns
0.16*
0.17*
0.15
*ns
ns−0
.22**
ns0.14
*ns
CY_2
002/6
nsns
0.19
**0.19**
0.18**
0.18*
0.29
**0.20**
0.15
*ns
nsns
nsns
nsns
nsns
FR
0.29**
0.18
**ns
nsns
0.18
*ns
nsns
ns0.16
*ns
nsns
nsns
ns
AR
0.16
*0.19**
nsns
0.15
*ns
nsns
nsns
nsns
nsns
nsns
BO
0.42**
0.29**
ns0.45
**0.44**
nsns
nsns
nsns
nsns
ns0.17*
FL
0.59**
−0.26**
0.53
**0.74**
0.23
**ns
−0.18*
ns0.26**
ns−0
.15*
nsns
ns
AC
−0.19**
0.50
**0.66**
0.30
**ns
−0.24**
ns0.18*
ns−0
.18**
nsns
ns
BI
ns−0
.23**
−0.25*
*0.20**
nsns
nsns
nsns
nsns
AF
0.59**
0.14
*ns
nsns
0.18*
ns−0
.16*
nsns
ns
GL
0.25
**ns
nsns
0.29**
nsns
nsns
ns
SU
nsns
−0.15*
0.25**
−0.15*
−0.16*
nsns
ns
CA
0.21**
−0.15*
ns−0
.13*
ns0.15*
0.22
**0.20**
TR
nsns
ns0.26**
nsns
ns
3°C
−0.27**
0.96**
−0.39**
−0.36**
−0.43*
*−0
.43**
5°C
−0.22**
−0.19**
−0.44**
−0.35*
*−0
.44**
4°C
−0.41**
−0.41**
−0.47*
*−0
.47**
5°F
−0.17*
nsns
34dC
0.82
**0.88**
35dC
0.78**
nsno
tsign
ificant,FRfragrance,
ARarom
a,BO
body,FLflavor,ACacidity,BIbitterness,AFaftertaste,GLglob
alno
te
*P<0.05
;**
P<0.01
;on
lysign
ificantcorrelations
areshow
n
Tree Genetics & Genomes
three traits, no consistency was observed throughout theyears, but some QTLs in LGs I and K for trigonelline contentexplained a large part of the variation of the trait: 81.2% and41.8% in 2003 and 2005, respectively.
Eight QTLs were identified for 3-CQA and 4-CQAcontents in LGs A, B, and I, with a good consistencythroughout years. Both QTLs for 4-CQA content in 2003and 2005 in LG B represented 28.8% and 40.6% of thevariation in this trait, respectively (26.7% and 16% for 3-CQA). For 5-FQA, six QTLs were identified in LGs A, B,D, F, and I, with a common QTL found in LG I in 2003 and2005. The QTLs for this trait in LG F explained up to 35%of its variation in 2003.
In LG A, a unique QTL zone was related to both 4-CQAand 5-FQA content, which are negatively correlated in2005. In LG B, a large QTL zone included QTLs for 3-CQA, 4-CQA, 5-CQA, and 5-FQA content. In LG D, asmall zone included QTLs for 5-FQA and 3,5di-CQA.Another zone in the same LG includes QTLs for trigonel-line, 5-FQA, and 4-CQA. In LG I, the QTL zone includedQTLs for caffeine (2005), CGA monomers and sucrose in2005. In LG J, a small zone included QTLs for 3,4 and3,5di-CQA. In LG K, one QTL zone was identified forcaffeine and trigonelline in 2005, and another was found for5-CQA in 2003.
Six QTLs were identified for organoleptic traits (Table 4).One QTL was identified for the global note in LG H (notpresented in Fig. 2). For bitterness (2004), one QTL wasidentified in LG D. In LG I, we observed a QTL zone foracidity in 2006 and bitterness in 2005 and 2006. This resultis consistent with the negative phenotypic correlationsobserved between these traits. For bitterness, femaleadditive effects were predominant, while for acidity, onlya male additive effect was identified.
All of the QTLs found for organoleptic propertiesexplained more than 15% of the trait variability and up to54.8% for acidity in LG I. The major co-localizations ofQTL for traits from different sources of data were as follows:
– In LG B, bean size in 2004 and 2005 with caffeoyl-quinic acids in 2005
– In LG I, co-localization between bitterness, acidity (in2006), sucrose content (2005), content of 3-CQA, 4-CQA and 5-FQA (2003 and 2005), caffeine content(2005), and yield (2006) was found.
– In LG J, bean size (2006) with dicaffeoylquinic acids(2005)
Some QTL zones co-localized with genes implicated indifferent metabolic pathways related to coffee quality. InLG A, a QTL for caffeine content co-localized with acaffeine synthase gene implicated in the last steps ofcaffeine biosynthesis (Misako and Kouichi 2004). In LGB, a composite QTL zone, including all caffeoylquinic
acids and bean size was localized near a 4CL geneimplicated in the biosynthesis of chlorogenic acids andnear genes encoding two invertase genes (mapped fromBAC ends sequences). In LG D, QTLs for bean size (2006)were located in the same zone as a gene encoding a cellwall invertase CWI and a copy from a SUS1 gene mappedfrom BAC end sequences (Leroy et al. 2005). In LG F,QTLs for bean size and the rate of pea berries were locatednear a SUS1 sucrose synthase gene. In LG I, a gene impliedin caffeine metabolism, one N-methyltransferase, wasfound close to QTLs for caffeine (2005), monomer CGAsand sucrose (2005), and acidity and bitterness (2006).
Discussion
Our population of C. canephora possesses a large amountof phenotypic variability for yield and for traits related toquality. This outcome was expected for yield. For sucroseand caffeine content, it presents a higher variability thanthat observed in C. canephora accessions by Ky et al.(2001a). As it is known that sucrose content has additivetransmission, selection for this trait will be possible. Forbiochemical traits, a good correlation was observedbetween the years, which is consistent with the resultsobtained by Ky et al. (2000a).
CGA biosynthesis in coffee seeds has been analyzed byJoët et al. (2010). These authors defined “control boxes” forCGA biosynthesis and showed relationships betweenmono- and di-CQA chlorogenic acids and the influence ofabiotic factors such as low temperatures. Linear relation-ships between di-CQA have also been established (Bertrandet al. 2003b). Our results confirm linear relationshipsbetween CQA and di-CQA, all di-CQA being derived from5-CQA (Ky et al. 1999).
The genetic map
As expected for C. canephora, a genetic map of 11 linkagegroups was produced using 238 markers, with an averageof 5.5 cM between markers. As previously reported forintra- and interspecific maps in coffee (Paillard et al. 1996;Lashermes et al. 2001; Ky et al. 2000b), segregationdistortion was observed for LG I. The distorted markershave not been discarded during map construction as theyhave for other species (Venkateswarlu et al. 2006) because
Fig. 1 Genetic linkage map of C. canephora based on SSR markersand genes, constructed with 238 markers and 184 plants with aminimum LOD score of 4.4. Distortion of markers in linkage groupsis indicated by stars corresponding to the significance of the χ2 test(double asterisk, p=0.05 to septuple asterisk, p=0.0001). Candidategenes are indicated in bold
�
Tree Genetics & Genomes
A B C D E F
G H I J K
Tree Genetics & Genomes
it can be considered that these distortions have a biologicalbasis. As has been noted for other plants (Billote et al.2005; Lu et al. 2002), the presence of lethal genes orreproduction regulating genes could explain these distor-tions (Zamir and Tadmor 1986). In C. canephora, the self-incompatibility gene S should be located in the LGdesignated LG 9 by Lashermes et al. (1996), and this LGhas been then confirmed to be highly distorted (Lashermeset al. 2001), suggesting a link between segregationdistortion and the S locus. Our LG I corresponds to LG 9of Lashermes. In our study, if we consider that this simplegametophytic factor is responsible of the distortion ob-served, estimates of the recombination frequency shouldnot be affected (Lu et al. 2002). In the other LGs, onlysmall clusters of markers presented segregation distortion(Fig. 1).
QTL identification and gene discovery
We were able to identify QTLs for most traits with largeeffects and consistent detection over the years, especially foryield, technological traits, and chlorogenic acid content, thusindicating ontogenic stability. These QTLs, also referred to asstable QTLs, are important because they can be excellentcandidates for MAS work (Kenis et al. 2008). For other traits,such as organoleptic traits and other biochemical compoundsrelated to quality, the consistency over the years is lessobvious. LG I is highly distorted, and it could, thus, affectthe quality of QTL identification. Recent reports (Xu 2008;Zhang et al. 2010) have noted that distortion can decrease thepossibility of QTL detection, but it should not increase therate of false positives. Zhang et al. (2010) also noted theimportance of the population size for avoiding modificationsof QTLs due to distortion. Our coffee population of morethan 240 trees can be considered as a large population, thuslimiting the decrease in the power of QTL detection.However, Xu (2008) suggested that the power of QTLmapping could be artificially increased when a map is sparse,as in our study. In conclusion, the QTLs identified in ourdistorted LG I should not prevent further investigation onthese regions of the genome.
In this study, several zones of interest were identified. Onezone in LG K (ranging from 45 to 60 cM) is of great interestfor cumulative yield, and the QTL on this LG co-localizedwith trigonelline content in the 2003 sample. As previouslyreported for the organoleptic quality of fresh tomato fruits(Causse et al. 2000; Saliba et al. 2001), we identified largeclusters of QTLs related to quality in LGs I and B. The mainQTL zone for quality in LG I is associated with correlatedtraits like acidity and bitterness, caffeine and chlorogenicacids A key gene involved in caffeine biosynthesis is co-localized with these QTLs. It was demonstrated here for thefirst time that the genetic variability in chemical compounds,
such caffeine and chlorogenic acids, is related to the geneticvariability of beverage quality (acidity and bitterness).Theestablishment of this clear relationship can be considered asthe main result of this work. We also observed co-localization between bean size and quality traits in LG B.Finally, we identified a co-localization between a QTL forbean size, a SUS1 gene and a CWI gene coding for the cellwall invertase in LG D. This result is of extreme importance,as several invertase- and sucrose synthase-encoding geneshave been mapped along with a QTL related to fruit size intomatoes (Fridman et al. 2000; Causse et al. 2004). Thesegenes are involved in the control of tomato fruit size (Klannet al. 1996; D´Aoust et al. 1999). In shaded coffee beans,Geromel et al. (2008) also observed higher invertase activityduring the latest stages of perisperm development that couldbe related to the larger size of beans in comparison to thosegrown under full sun conditions.
Uncovering co-localization of QTLs with mappedcandidate genes from various biological pathways andsubsequent use of these genes in association mapping willpresent possibilities for determining the causes of variationof quality in coffee (Henery et al. 2007). We can explain theco-localization between QTLs for organoleptic traits andgenes involved in caffeine or CGA biosynthesis based onthe fact that both CGA and caffeine are involved inconferring bitterness to the beverage.
Our study is the first to report the identification of QTLsinvolved in quality traits and yield in coffee. We identifiedmajor QTLs for yield and quality-related traits. We confirmedthe relationships between some traits and their involvement indetermining quality. Investigation of chemical and biochem-ical traits related to quality presents an alternative approach toimprove quality, as few QTLs were discovered for directbeverage quality traits, except for acidity and bitterness. Thesetypes of indirect traits, such as caffeine, chlorogenic acid, andsugar content, are important for breeders because they arerelatively easy to quantify and because their variability is high,and they presented significant correlations with beveragequality traits. We also mapped genes involved in thebiosynthesis of crucial compounds, including caffeine, sugarsand chlorogenic acids; they co-localize with QTLs. Ourresults constitute a first step toward the detection of favorablealleles related to beverage quality in coffee. Finally, weidentified several regions of interest that will be the target forfuture associationmapping studies. The regions of the genomeconnected to yield determination and to quality are different,
Fig. 2 Main QTL localizations in the linkage groups for theagronomical, technological, biochemical, and organoleptic traits. Foreach trait, the QTLs are represented by boxes for a confidence intervalof LODmax±1. QTLs were confident at 10% (normal), 5% (italics), or1% (bold) at the genome-wide level. The names of the QTLs arepresented in Table 4
�
Tree Genetics & Genomes

Me_ssr1200740
G_CFS_1D14
Mg_M27346
Mg_M36167Mg_M85074
Me_ssr12108692Me_ssr125629103Me_BE_SPS_M04104Me_ssr120037107G_SUSY2_c6_d116
SU
_2003_A
CA
_2003_A55FF__22000055__AA
22
4C_2005_A
BBSS__22000055__AA
A
Mg_M5180
Me_ssr12187635G_4CL_C245Me_BE_CWI_DL03151Me_BE_INV3_DL03052Mg_CMA004462
Mg_M46877
Mg_M77491G_MYB61_5'UTR96
Me_ssr120291109Mg_M398114Mg_M795122Me_ssr131684130
Me_ssr122056143
Mg_M509166Mg_M783178Mg_CMA0031179Mg_M784185
Me_ssr120263201Me_ssr124612208
Mg_M384235Mg_M495243
55FF__22000055__BB
44CC__22000033__BB
33CC__22000033__BB
33CC__22000055__BB
44CC__22000055__BB
55CC__22000055__BB
BS
_2005_B
BBSS__22000044__BB
11B
S_2004_B
2
BBSS__22000066__BB AA
CC__22000066__BB
B
Mg_M7420Me_BE_SUSY_DL0253Me_BE_CWI_DL01318G_CWI_SSR0521Mg_M42922Me_BE_SUSY_DL02831Mg_M39245
Mg_M46159Me_ssr13158363Mg_M79071
Mg_M35585
Mg_M471100
BBII__22000044__DD
BS
_2006_D1
BS
_2006_D2
BS
_2006_D3
35dC_2003_D
5F_2005_D
Y_2003_D
D
Mg_M3830
Me_BE_gA71_DL00313
G_CCoAMT_intron123
Mg_ssrR12735Mg_M41643
G_SUSY_SSR1459G_promSUSY_SSR0965G_SDD_3'UTR_170Mg_M33180
G_CWI_SSR0193
Mg_M328114
Mg_M353125
55FF__22000033__FFPP
BB__22000044__FF
BS
_2006_F
PPBB
__22000066__FFB
S_2004_F
F
Mg_M4410Mg_M4454Me_ssr12279311
Mg_M30026
G_NMT_A36Mg_M27746Me_ssr12435852Mg_ssrR31357
BI_2005_I
BBII__22000066__II
AACC
__22000066__II
3C_2003_I
4C_2003_I
33CC__22000055__II
CA
_2005_I
55FF__22000055__II
55FF__22000033__II
SU
_2005_I
TR
_2005_I
YY__22000066__II11
YY__22000066__II22
I
Mg_CMA00410
G_KO_sing2_116Mg_M33725
Mg_ssrR29041Mg_M37849Me_ssr11946358
Me_BE_62K8_M0576
GC17_CP26_intron191
Mg_M501103
35dC_2005_J
34dC_2005_J
PPBB
__22000055__JJ11PP
BB__22000055__JJ22
BS
_2006_J
J
Mg_M7730
Mg_M39511
Mg_M31329
Mg_M44848
Mg_ssrR11161
Me_ssr13150475Mg_M26083
5C_2003_K
CA
_2005_K
CY
_2002/6_K
CY
_2003/6_K
CY
_2004/6_K
YY__22000066__KK
TR
_2003_K
PPBB
__22000055__KK
PB
_2006_K
K
Tree Genetics & Genomes
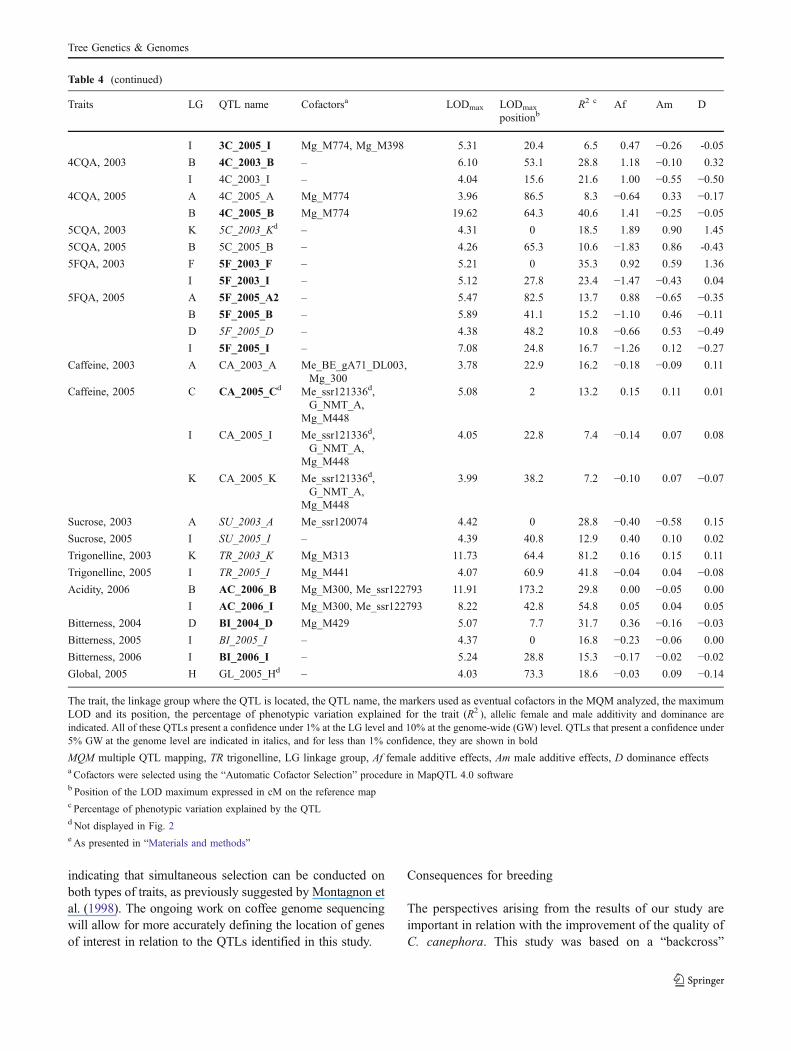
Table 4 List of QTLs identified by MQM for agronomic, technological, biochemical, and organoleptic traits
Traits LG QTL name Cofactorsa LODmax LODmax
positionbR2 c Af Am D
Cumulative yield,2002–2006
K CY_2002/6_K – 3.96 49.2 17.4 0.06 0.06 −0.09
Cumulative yield,2003–2006
K CY_2003/6_K – 4.07 50.2 16.7 0.06 0.06 −0.09
Cumulative yield,2004–2006
K CY_2004/6_K – 3.98 50.2 16.2 0.07 0.07 −0.09
Yield, 2003 D Y_2003_D – 4.07 66.1 8.1 0.26 −0.02 −0.18Yield, 2006 I Y_2006_I1 G_NMT_A, Me_ssr122793, 6.33 43.8 34.0 −0.34 −0.41 −0.29
Mg_M445, Mg_M313
I Y_2006_I2 G_NMT_A, Me_ssr122793, 9.46 57.9 42.4 0.03 0.57 −0.03Mg_M445, Mg_M313
K Y_2006_K G_NMT_A, Me_ssr122793, 9.93 62.4 56.8 0.24 0.25 −0.25Mg_M445, Mg_M313
Bean size, 2004 B BS_2004_B1 Me_ssr120037, Mg_M328 4.64 71.9 10.5 0.38 −0.30 −0.20B BS_2004_B2 Me_ssr120037, Mg_M328 4.48 130.8 8.1 0.42 0.07 0.18
F BS_2004_F Me_ssr120037, Mg_M328 4.26 113.2 7.9 0.24 0.42 0.01
Bean size, 2005 A BS_2005_A Me_ssr125629,Me_BE_SPS_M04,
16.44 103.7 35.3 −0.63 0.00 0.01
Mg_M328, Mg_M521d
B BS_2005_B Me_ssr125629,Me_BE_SPS_M04,
4.24 64.3 6.4 −0.05 −0.25 −0.49
Mg_M328, Mg_M521d
Bean size, 2006 B BS_2006_B Mg_M783, Mg_CMA0031, 10.30 145.8 25.3 0.50 −0.01 −0.15Mg_BAC19_M40d,Me_ssr119463
D BS_2006_D1 Mg_M783, Mg_CMA0031, 4.27 0 6.1 −0.12 0.00 0.45Mg_BAC19_M40d,Me_ssr119463
D BS_2006_D2 Mg_M783, Mg_CMA0031, 4.92 15.3 10.9 −0.09 0.00 0.60Mg_BAC19_M40d,Me_ssr119463
D BS_2006_D3 Mg_M783,Mg_CMA0031, 5.12 33.3 14.1 0.04 0.15 0.66Mg_BAC19_M40d,Me_ssr119463
F BS_2006_F Mg_M783,Mg_CMA0031, 4.49 52.8 11.0 −0.33 0.36 −0.37Mg_BAC19_M40d,Me_ssr119463
J BS_2006_J Mg_M783, Mg_CMA0031, 5.00 57 7.2 −0.46 −0.19 −0.01Mg_BAC19_M40d,Me_ssr119463
Pea berry, 2004 F PB_2004_F – 6.46 49.8 19.4 −6.05 0.91 −0.18Pea berry, 2005 J PB_2005_J1 – 3.89 39.6 11.5 3.45 0.12 1.50
J PB_2005_J2 – 3.94 92.8 8.1 3.03 1.23 0.59
K PB_2005_Kd – 4.49 83.3 16.6 −3.71 1.48 −3.12Pea berry, 2006 F PB_2006_F Mg_ssrR127,
G_SSR09_promSUSY5.21 61.5 10.5 −4.33 0.27 1.15
K PB_2006_Kd Mg_ssrR127,G_SSR09_promSUSY
4.76 85.5 13.5 −3.83 2.00 −2.60
34dCQA, 2005 J 34dC_2005_J – 4.15 53 13.1 0.02 −0.08 −0.4035dCQA, 2003 D 35dC_2003_D – 2.52 45.2 10.7 -0.70 −0.20 0.52
35dCQA, 2005 J 35dC_2005_J – 4.10 52 13.0 0.00 −0.13 −0.433CQA, 2003 B 3C_2003_B – 6.58 57.3 26.7 1.02 −0.04 0.06
I 3C_2003_I – 4.02 15.6 21.1 0.83 −0.46 -0.49
3CQA, 2005 B 3C_2005_B Mg_M774, Mg_M398 9.18 63.3 16.0 0.97 −0.33 -0.06
Tree Genetics & Genomes
indicating that simultaneous selection can be conducted onboth types of traits, as previously suggested by Montagnon etal. (1998). The ongoing work on coffee genome sequencingwill allow for more accurately defining the location of genesof interest in relation to the QTLs identified in this study.
Consequences for breeding
The perspectives arising from the results of our study areimportant in relation with the improvement of the quality ofC. canephora. This study was based on a “backcross”
Table 4 (continued)
Traits LG QTL name Cofactorsa LODmax LODmax
positionbR2 c Af Am D
I 3C_2005_I Mg_M774, Mg_M398 5.31 20.4 6.5 0.47 −0.26 -0.05
4CQA, 2003 B 4C_2003_B – 6.10 53.1 28.8 1.18 −0.10 0.32
I 4C_2003_I – 4.04 15.6 21.6 1.00 −0.55 −0.504CQA, 2005 A 4C_2005_A Mg_M774 3.96 86.5 8.3 −0.64 0.33 −0.17
B 4C_2005_B Mg_M774 19.62 64.3 40.6 1.41 −0.25 −0.055CQA, 2003 K 5C_2003_Kd – 4.31 0 18.5 1.89 0.90 1.45
5CQA, 2005 B 5C_2005_B – 4.26 65.3 10.6 −1.83 0.86 -0.43
5FQA, 2003 F 5F_2003_F – 5.21 0 35.3 0.92 0.59 1.36
I 5F_2003_I – 5.12 27.8 23.4 −1.47 −0.43 0.04
5FQA, 2005 A 5F_2005_A2 – 5.47 82.5 13.7 0.88 −0.65 −0.35B 5F_2005_B – 5.89 41.1 15.2 −1.10 0.46 −0.11D 5F_2005_D – 4.38 48.2 10.8 −0.66 0.53 −0.49I 5F_2005_I – 7.08 24.8 16.7 −1.26 0.12 −0.27
Caffeine, 2003 A CA_2003_A Me_BE_gA71_DL003,Mg_300
3.78 22.9 16.2 −0.18 −0.09 0.11
Caffeine, 2005 C CA_2005_Cd Me_ssr121336d,G_NMT_A,
5.08 2 13.2 0.15 0.11 0.01
Mg_M448
I CA_2005_I Me_ssr121336d,G_NMT_A,
4.05 22.8 7.4 −0.14 0.07 0.08
Mg_M448
K CA_2005_K Me_ssr121336d,G_NMT_A,
3.99 38.2 7.2 −0.10 0.07 −0.07
Mg_M448
Sucrose, 2003 A SU_2003_A Me_ssr120074 4.42 0 28.8 −0.40 −0.58 0.15
Sucrose, 2005 I SU_2005_I – 4.39 40.8 12.9 0.40 0.10 0.02
Trigonelline, 2003 K TR_2003_K Mg_M313 11.73 64.4 81.2 0.16 0.15 0.11
Trigonelline, 2005 I TR_2005_I Mg_M441 4.07 60.9 41.8 −0.04 0.04 −0.08Acidity, 2006 B AC_2006_B Mg_M300, Me_ssr122793 11.91 173.2 29.8 0.00 −0.05 0.00
I AC_2006_I Mg_M300, Me_ssr122793 8.22 42.8 54.8 0.05 0.04 0.05
Bitterness, 2004 D BI_2004_D Mg_M429 5.07 7.7 31.7 0.36 −0.16 −0.03Bitterness, 2005 I BI_2005_I – 4.37 0 16.8 −0.23 −0.06 0.00
Bitterness, 2006 I BI_2006_I – 5.24 28.8 15.3 −0.17 −0.02 −0.02Global, 2005 H GL_2005_Hd – 4.03 73.3 18.6 −0.03 0.09 −0.14
The trait, the linkage group where the QTL is located, the QTL name, the markers used as eventual cofactors in the MQM analyzed, the maximumLOD and its position, the percentage of phenotypic variation explained for the trait (R2 ), allelic female and male additivity and dominance areindicated. All of these QTLs present a confidence under 1% at the LG level and 10% at the genome-wide (GW) level. QTLs that present a confidence under5% GW at the genome level are indicated in italics, and for less than 1% confidence, they are shown in bold
MQM multiple QTL mapping, TR trigonelline, LG linkage group, Af female additive effects, Am male additive effects, D dominance effectsa Cofactors were selected using the “Automatic Cofactor Selection” procedure in MapQTL 4.0 softwareb Position of the LOD maximum expressed in cM on the reference mapc Percentage of phenotypic variation explained by the QTLd Not displayed in Fig. 2e As presented in “Materials and methods”
Tree Genetics & Genomes

progeny between the Congolese and the Guinean groups onwhich the selection program in Côte d’Ivoire is established.These QTL studies are specific to the pedigree, site, andontogenic stage of the individuals investigated. Thus, wewill have to validate the stability of the QTLs obtained herein other locations and in different progenies, particularly inthe offspring of crosses generated between the diversitygroups used in the selection scheme. For the offspring ofcrosses generated within the diversity groups, we will haveto perform complementary QTL studies. Associationmapping studies within genetic groups or on large coffeecollections will also allow precisely determining the zonesof the genome and the genes implicated in the establish-ment of quality. The results presented here and futurestudies to be implemented in other populations willcontribute developing marker-assisted selection for qualityimprovement, considering the favorable alleles of themarkers involved in the QTLs for quality. A marker-assisted selection could be applied directly to our progenyfor the selection of varieties presenting good yield andquality.
Finally, our work is of interest for assisting breedersattempting to control the introgression of resistance genesfrom C. canephora to C. arabica without lowering quality(Bertrand et al. 2003a).
Acknowledgments This work was supported by EU grant ICA4-CT-2001-10068. The University of Trieste (Italy) kindly provided 16SSR markers.
References
Akaffou DS, Ky CL, Barre P, Hamon S, Louarn J, Noirot M (2003)Identification and mapping of a major gene (Ft1) involved infructification time in the interspecific cross Coffea pseudozan-guebariae x C. liberica var. Dewevrei: impact on caffeine contentand seed weight. Theor Appl Genet 106:1486–1490
Alcazar A, Jurad JM, Martin MJ, Pablos F, Gonzales AG (2004)Enzymatic-spectrophotometric determination of sucrose in coffeebeans. Talanta 67:760–766
Anthony F, Clifford MN, Noirot M (1993) Biochemical diversity inthe genus Coffea L.: chlorogenic acids, caffeine and mozambio-side contents. Genet Res Crop Evol 40:61–70
Anthony F, Bertrand B, Quiros O, Wilches A, Lashermes P, BerthaudJ, Charrier A (2001) Genetic diversity of wild coffee (Coffeaarabica L.) using molecular markers. Euphytica 118:53–65
Barre P, Akaffou S, Louarn J, Charrier A, Hamon S, Noirot M (1998)Inheritance of caffeine and heteroside contents in an interspecificcross between a cultivated coffee species Coffea liberica vardewevrei and a wild species caffeine-free C. pseudozanguebar-iae. Theor Appl Genet 96:306–311
Baruah A, Naik V, Hendre PS, Rajkumar R, Rajendrakumar P,Aggarwal K (2003) Isolation and characterization of ninemicrosatellite markers from Coffea arabica L. showing widecross-species amplifications. Mol Ecol Notes 3:647–650
Berthaud J (1986) Les ressources génétiques pour l'amélioration descaféiers africains diploïdes. Evaluation de la richesse génétiquedes populations sylvestres et de ses mécanismes organisateurs.Conséquences pour l'application. ORSTOM, Paris
Bertrand B, Guyot B, Anthony F, Lashermes P (2003a) Impact of theCoffea canephora gene introgression on beverage quality of C.Arabica. Theor Appl Genet 107:387–394
Bertrand C, Noirot M, Doulbeau S, de Kochko A, Hamon S, Campa C(2003b) Chlorogenic acid content swap during fruit maturation inCoffea pseudozanguebariae. Quantitative comparison withleaves. Plant Sci 165:1355–1361
Billote N, Marseillac N, Risterucci AM et al (2005) Microsatellite-based high density linkage map in oil palm (Elaeis guineensisJacq.). Theor Appl Genet 110:754–765
Bouchet S, Marraccini P, Jourdan I, Leroy T, Vieira LGE, Ferreira LP,Musoli P, Pot D (2005) Nucleotide diversity and molecularevolution of five genes involved in the sucrose biosynthesis pathwayof Coffea canephora. In: Proceedings of the 4th Plant GenomicsEuropean Meeting, Amsterdam, 20–23 Sept 2005
Campa C, Noirot M, Bourgeois M, Pervent M, Ky CL, Chrestin H,Hamon S, de Kochko A (2003) Genetic mapping of a caffeoyl-coenzyme A 3-0-methltransferase gene in coffee trees. Impact onchlorogenic acid content. Theor Appl Genet 107:751–756
Causse M, Saliba V, Lesschaeve I, Buret M (2000) Genetic analysis oforganoleptic quality in fresh-market tomato. 2. Mapping QTLsfor sensory attributes. Theor Appl Genet 102:257–272
Causse M, Duffe P, Gomez MC, Buret M, Damidaux R, Zamir D, GurA, Chevalier C, Lemaire-Chamley M, Rothan C (2004) A geneticmap of candidate genes and QTLs involved in tomato fruit sizeand composition. J Exp Bot 55:1671–1685
Charrier A, Berthaud J (1988) Principles and methods in coffee plantbreeding Coffea canephora Pierre. In: Clarke RJ, Macrae R (eds)Coffee, vol 4, Agronomy. Elsevier Applied Science, London, pp167–197
Combes MC, Andrzejewski S, Anthony F, Bertrand B, Rovelli P,Grasiozi G, Lashermes P (2000) Characterization of micro-satellite loci in Coffea arabica and related coffee species. MolEcol Notes 9:1171–1193
Coulibaly I, Revol B, Noirot M, Poncet V, Lorieux M, Carasco-LacombeC, Minier J, Hamon P (2003) AFLP and SSR polymorphism in aCoffea interspecific backcross progeny ((C. heterocalyx x C.canephora) x C. canephora). Theor Appl Genet 107:1148–1155
D’Aoust MA, Yelle S, Nguyen-Quoc B (1999) Antisense inhibition oftomato fruit sucrose synthase decreases fruit setting and the sucroseunloading capacity of young fruit. Plant Cell 11:2407–2418
Dussert D, Lashermes P, Anthony F, Montagnon C, Trouslot P, CombesMC, Berthaud J, Noirot M, Hamon S (1999) Le caféier, Coffeacanephora. In: Hamon P, Seguin M, Perrier X, Glaszmann JC(eds) Diversité génétique des plantes tropicales cultivées. CIRAD,Montpellier, pp 175–194
Freire LP, Vieira NG, Vinecky F, Alvas GSC, Leroy T, Pot D, ElbeltS, Marques T, Rodrigues GC, Marraccini P, Andrade AC (2010).Expression analysis and nucleic polymorphism of candidategenes for drought tolerance in coffee (in press)
Fridman E, Pleban T, Zamir D (2000) A recombination hotspot delimits awild-species quantitative trait locus for tomato sugar content to 484 bpwithin an invertase gene. Proc Natl Acad Sci USA 97:4718–4723
Geromel C, Ferreira LP, Guerreiro SMC, Cavalari AA, Pot D, Pereira LFP,Leroy T, Vieira LGE, Mazzafera P, Marraccini P (2006) Biochemicaland genomic analysis of sucrose metabolism during coffee (Coffeaarabica) fruit development. J Exp Bot 57:3243–3258
Geromel C, Ferreira LP, Davrieux F, Guyot B, Ribeyre F, dos SantosScholz MB, Pereira LFP, Vaast P, Pot D, Leroy T, AndrocioliFilho A, Vieira LGE, Mazzafera P, Marraccini P (2008) Effectsof shade on the development and sugar metabolism of coffee(Coffea arabica L.) fruits. Plant Physiol Biochem 46:569–579
Tree Genetics & Genomes
Gomez C, Dussert S, Hamon P, Hamon S, de Kochko A, Poncet V(2009) Current genetic differentiation of Coffea canephora Pierreex A. Froehn in the Guineo-Congolian African zone: cumulativeimpact of ancient climatic changes and recent human activities.BMC Evol Biol 9:167
Grattapaglia D, Sederoff R (1994) Genetic maps of Eucalyptusgrandis and Eucalyptus urophylla using a pseudo-test crossmapping strategy and RAPD markers. Genetics 137:1121–1137
Henery ML, Moran GF, Wallis IR, Foley WJ (2007) Identification ofquantitative trait loci influencing foliar concentrations of terpenesand formylated phloroglucinol compounds in Eucalyptus nitens.New Phytol 176:82–95
Jansen RC, Stam P (1994) High resolution of quantitative traits intomultiple loci via interval mapping. Genetics 136:1447–1455
Joët T, Laffargue A, Salmona J, Doulbeau S, Descroix F, Bertrand B,de Kochko A, Dussert S (2009) Metabolic pathways in tropicaldicotyledonous albuminous seeds: Coffea arabica as a casestudy. New Phytol 182:146–162
Joët T, Salmona J, Laffargue A, Descroix F, Dussert S (2010) Use ofthe growing environment as a source of variation to identify thequantitative trait transcripts and modules of co-expressed genesthat determine chlorogenic acid accumulation. Plant Cell Environ33:1220–1233
Kenis K, Keulemans J, Davey MW (2008) Identification and stabilityof QTLs for fruit quality traits in apple. Tree Genet Gen 4:647–661
Klann EM, Hall B, Bennett AB (1996) Antisense acid invertase(TIV1) gene alters soluble sugar composition and size intransgenic tomato fruit. Plant Physiol 112:1321–1330
Ky CL, Louarn J, Guyot B, Charrier A, Hamon S, Noirot M(1999) Relations between and inheritance of chlorogenic acidcontents in an interspecific cross between Coffea pseudozan-guebariae and Coffea liberica var ‘dewevrei’. Theor ApplGenet 98:628–637
Ky CL, Doulbeau S, Guyot B, Akaffou S, Charrier A, Hamon S,Louarn J, Noirot M (2000a) Inheritance of coffee bean sucrosecontent in the interspecific cross Coffea pseudozanguebariae xCoffea liberica ‘dewevrei’. Plant Breed 119:165–168
Ky CL, Barre P, Lorieux M, Trouslot P, Akaffou S, Louarn J, CharrierA, Hamon S, Noirot M (2000b) Interspecific genetic linkagemap, segregation distortion and genetic conversion in coffee(Coffea sp.). Theor Appl Genet 101:669–676
Ky CL, Louarn J, Dussert S, Guyot B, Hamon S, Noirot M (2001a)Caffeine, trigonelline, chlorogenic acids and sucrose diversity inwild Coffea arabica L. and C. canephora P. accessions. FoodChem 75:223–230
Ky CL, Guyot B, Louarn J, Hamon S, Noirot M (2001b) Trigonellineinheritance in the interspecific Coffea pseudozanguebariae x C.liberica var. dewevrei cross. Theor Appl Genet 102:630–634
Lashermes P, Couturon E, Moreau N, Paillard M, Louarn J (1996)Inheritance and genetic mapping of self -incompatibility inCoffea canephora Pierre. Theor Appl Genet 93:458–462
Lashermes P, Combes MC, Prakash NS, Trouslot P, Lorieux M,Charrier A (2001) Genetic linkage map of Coffea canephora:effect of segregation distortion and analysis of recombination ratein male and female meioses. Genome 44:589–596
Lefebvre-Pautigny F, Wu F, Philippot M, Rigoreau M, Priyono ZM,Frasse P, Bouzayen M, Broun P, Pétiard V, Tanksley SD,Crouzillat D (2010) High resolution syntheny maps allowingdirect comparisons between the coffee and tomato genome. TreeGenet Gen 6:565–577
Lepelley M, Cheminade G, Tremillon N, Simkin A, Caillet V,McCarthy J (2007) Chlorogenic acid syntheses in coffee: Ananalysis of CGA content and real-time RT-PCR expression ofHCT, HQT, C3H1, and CCoAOMT1 genes during graindevelopment in C. canephora. Plant Sci 172:978–996
Leroy T, Montagnon C, Charrier A, Eskes AB (1993) Reciprocalrecurrent selection applied to Coffea canephora Pierre I.Characterization and evaluation of breeding populations andvalue of intergroup hybrids. Euphytica 67:113–125
Leroy T, Montagnon C, Cilas C, Charrier A, Eskes AB (1994)Reciprocal recurrent selection applied to Coffea canephora PierreII. Evaluation of genetic parameters. Euphytica 74:121–128
Leroy T, Marraccini P, Dufour M, Montagnon C, Lashermes P, SabauX, Ferreira LP, Jourdan I, Pot D, Andrade AC, Glaszmann JC,Vieira LGE, Piffanelli P (2005) Construction and characterizationof a Coffea canephora BAC library to study the organization ofsucrose biosynthesis genes. Theor Appl Genet 111:1032–1041
Leroy T, Ribeyre F, Bertrand B, Charmetant P, Dufour M, MontagnonC, Marraccini P, Pot D (2006) Genetics of coffee quality. Braz JPlant Physiol 18:229–242
Lin C, Mueller LA, Mc Carthy J, Crouzillat D, Pétiard V, Tanksley S(2005) Coffee and tomato share common gene repertoires asrevealed by deep sequencing of seed and cherry transcripts.Theor Appl Genet 112:114–130
Lu H, Romero-Severson J, Bernardo R (2002) Chromosomal regionsassociated with segregation distortion in maize. Theor ApplGenet 105:622–628
Misako K, Kouichi M (2004) Caffeine synthase and relatedmethyltransferases in plants. Front Biosci 9:1833–1842
Moncada P, McCouch S (2004) Simple sequences repeat diversity indiploid and tetraploid Coffea species. Genome 47:501–509
Montagnon C, Leroy T, Yapo A (1992) Diversité génotypique etphénotypique de quelques groupes de caféiers (Coffea canephoraPierre) en collection. Conséquences sur leur utilisation ensélection. Café Cacao Thé 36:187–198
Montagnon C, Guyot B, Cilas C, Leroy T (1998) Genetic parametersof several biochemical compounds from green coffee, Coffeacanephora. Plant Breed 117:576–578
Montagnon C, Leroy T, Cilas C, Charrier A (2003) Heritability ofCoffea canephora yield estimated from several mating designs.Euphytica 133:209–218
Moschetto D, Montagnon C, Guyot B, Perriot JJ, Leroy T, Eskes AB(1996) Studies on the effect of genotype on cup quality of Coffeacanephora. Trop Sci 36:18–31
N’Diaye A, Noirot M, Hamon S, Poncet V (2007) Genetic basis ofspecies differentiation between Coffea liberica Hiern and C.canephora Pierre: analysis of an interspecific cross. GenetResour Crop Evol 54:1011–1021
Paillard M, Lashermes P, Pétiard V (1996) Construction of amolecular linkage map in coffee. TheorAppl Genet 93:41–47
Poncet V, Hamon P, Minier J, Carasco C, Hamon S, Noirot M (2004)SSR cross-amplification and variation within coffee trees (Coffeaspp.). Genome 47:1071–1081
Poncet V, Dufour M, Hamon P, Hamon S, de Kochko A, Leroy T(2007) Development of genomic microsatellite markers in Coffeacanephora and their transferability to other coffee species.Genome 50:1156–1161
Priyono FB, Rigoreau M, Ducos JP, Sumirat U, Mawardi S, LambotC, Broun P, Pétiard V, Wahyudi T, Crouzillat D (2010) Somaticembryogenesis and vegetative cutting capacity are under distinctcontrol in Coffea canephora Pierre. Plant Cell Rep 29:343–357
Risterucci AM, Grivet L, N’Goran JAK et al (2000) A high-densitylinkage map of Theobroma cacao L. Theor Appl Genet 101:948–955
Saliba V, Causse M, Langlois D, Philouze J, Buret M (2001) Geneticanalysis of organoleptic quality in fresh-market tomato. 1.Mapping QTLs for physical and chemical traits. Theor ApplGenet 102:273–283
Segura V, Durel CE, Costes E (2009) Dissecting apple architectureinto genetic, ontogenetic and environmental effects: QTLmapping. Tree Genet Gen 5:165–179
Tree Genetics & Genomes
Van Ooijen JW (2004) MapQTL 5, software for the mapping ofquantitative trait loci in experimental populations. Kyazma BV,Wageningen
Van Ooijen JW (2006) JoinMap 4 software for the calculation ofgenetic linkage maps. Kyazma BV, Wageningen
Venkateswarlu M, Urs SR, Nath BS, Shashidar HE, Maheswaran M,Veeraiah TM, Sabitha MG (2006) A first genetic linkage map ofmulberry (Morus spp.) using RAPD, ISSR and SRR markers andpseudo testcross mapping strategy. Tree Genet Gen 3:15–24
Voorrips RE (2002) Mapchart: software for the graphical presentationof linkage maps and QTLs. J Hered 93:77–78
Wintgens JN (2004) Coffee: growing, processing, sustainable productionA guidebook for growers, processors, traders, and researchers.Wiley-VCG Verlag GmbH & Co., Weinheim
Xu S (2008) QTL mapping can benefit from segregation distortion.Genetics 180:2201–2208
Zamir D, Tadmor Y (1986) Unequal segregation of nuclear genes inplants. Bot Gaz 147:355–358
Zhang L,Wang S, Li H, DengQ, ZhengA, Li S, Li P, Li Z,Wang J (2010)Effects of missing markers and segregation distortion on QTLmapping in F2 populations. Theor Appl Genet. doi:10.1007/s00122-010-1372-z
Tree Genetics & Genomes

![Sustained Photosynthetic Performance of Coffea spp. under Long-Term Enhanced [CO2]](https://static.fdokumen.com/doc/165x107/633a6600bff0159b5b0083e1/sustained-photosynthetic-performance-of-coffea-spp-under-long-term-enhanced-co2.jpg)