Muslimhiphop.com: Constructing Muslim Hip Hop Identities on ...

GENETIC MAPPING OF HOP (Humulus lupulus L.) APPLIED TO THE
DETECTION OF QTLs FOR ALPHA-ACID CONTENT
Andreja Čerenak1, Zlatko Satovic
3 and Branka Javornik
1,2,4
1Slovenian Institute for Hop Research and Brewing, Cesta Žalskega tabora 2, 3310 Žalec,
Slovenia 2University of Ljubljana, Biotechnical Faculty, Jamnikarjeva 101, 1000 Ljubljana,
Slovenia 3University of Zagreb, Faculty of Agriculture, Svetosimunska 25, 10000 Zagreb, Croatia
4Corresponding author (tel.: +386 1 423 11 61; fax: +386 1 423 10 88;
e-mail: [email protected])

Abstract
The map locations and effects of quantitative trait loci (QTLs) were estimated for alpha-
acid content in hop (Humulus lupulus L.) using amplified fragment length polymorphism
(AFLP) and microsatellite markers (SSRs) genetic linkage maps constructed from a
double pseudo-testcross. The mapping population consisted of 111 progeny from the
cross between the German variety ‘Magnum’ showing high levels of alpha-acids and a
wild Slovene male hop ‘2/1’. The progeny segregated quantitatively for alpha-acid
content determined in the years 2002, 2003 and 2004. The maternal map consisted of 96
markers mapped on 14 linkage groups defining 661.90 cM of total map distance. The
paternal map included 70 markers assigned to 12 linkage groups covering 445.90 cM of
hop genome. QTL analysis indicated 4 putative QTLs (alpha1, alpha2, alpha3 and
alpha4) on linkage groups LG03, LG01, LG09, and LG03 of the female map,
respectively. QTLs explained 11.9 to 24.8% of the phenotypic variance. The most
promising QTL to be used in marker-assisted selection is alpha2 with the peak co-located
exactly with the AFLP marker. Three chalcone synthase-like genes (chs2, chs3, and chs4)
involved in hop bitter acid synthesis mapped together on the LG04 on female map. The
saturation of the maps will be carried out, particularly the putative QTL regions, using
SSR markers and stability of the QTLs will be tested in next years.

Introduction
Hop (Humulus lupulus L.) is an important ingredient in beer-brewing process. Female
hop plants are cultivated for their secondary metabolites, resins and essential oils, which
give flavour, bitterness and aroma to beer and are also of pharmaceutical interest. For hop
industry the content of alpha-acids in hop cones is of prime importance according to
which hop cultivars are divided into two main classes, aroma and high-alpha varieties.
Aroma hop varieties with alpha content up to 8% are typical of European hop production
and high alpha varieties, mainly grown in USA gave up to 18% of alpha-acids. In
Slovenia traditional European aroma hops is produced by the domestic hop varieties.
Overall orientation in hop production is towards high alpha varieties following the
demands of brewing industry.
The typical bitterness of beer comes from the isomerisation of hop bitter acids, highly
prenylated phloroglucinols (humulone and lupulone). The valerophenone synthase (VPS)
was the first chalcone synthases (CHS) homologues cloned which forms intermediates in
the biosynthesis of the hop bitter acids (Paniego et al. 1999; Okada and Ito 2001). Four
other chs homologues were later isolated from hop: chs_H1 with characterized enzymatic
activity (Matoušek et al. 2002) and chs2, chs3 and chs4 (Novak et al. 2003). Recent
enzymatic activity study of all cloned homologues confirmed that VPS and CHS_H1
enzymes were involved in biosynthesis of bitter acids, CHS_H1 alone in biosynthesis of
prenyflavonoids while CHS3 showed no enzymatic activity and CHS2 and CHS4
produced only some intermediate compounds (Okada et al. 2004). However, more genes
and regulatory factors are involved in the production of bitter acids as well as other hop
secondary metabolites and efforts are being made to elucidate their biosynthesis. This
knowledge could greatly contribute to more efficient breeding of hops on high alpha acid
content. The direct selection for an alpha-acid content, a quantitatively inherited trait,
cannot be carried out until the female plants flower and develop cones after a minimum
of three years of growth. If prior knowledge of linkage relationships between marker loci
or gene and an important resin characteristics were available, undesirable individuals
could be eliminated from progeny populations with marker-assisted selection as early as
when the seedlings develop the first few leaves. Such efficiency of breeding by using
molecular markers linked to agronomically important traits has been shown in many
important crops. Moreover, in perennial species, QTL mapping is a useful tool for
studying gene expression at different developmental stages (Wu et al. 2000; Lercetau et
al. 2000; Yin et al. 2003; Atienza et al. 2004), which is highly desirable for carrying out
early stage selection. However, identifying genetic basis of alpha-acid content in hop is a
demanding task particulary in the view of hop genetic complexity. Cultivated European
hop is diploid (2n = 2x = 20), with nine autosomal bivalents and two sex chromosomes
(Karlov et al. 2003). It is dioecious plant producing highly heterozygous offsprings, while
male plants enter a breeding process as nearly unknown pollinators. Backcrossing is an
unrealistic option as for other outcrossing perennial species (Maliepaard 1998), so genetic
analysis in hop is typically performed on the full-sib progeny of a single cross, which is
also the base population for selection. Both parents of a cross are expected to display a
high level of heterozygosity, thereby allowing markers to be found that are heterozygous

in one or both parents. This type of analysis has been called double pseudo-testcross or
two-way pseudo-testcross (Grattapaglia and Sederoff 1994). Such strategy was already
used in construction of first published hop male and female linkage map (Seefelder et al.
2000a) and as reported later by Seefelder et al. (2005) in construction of hop maps on
progeny segregating for resistance to powdery mildew where they identified two tightly
linked AFLP markers to resistance locus R2. Similarly, Koie et al. (2005) reported on the
use of pseudo-testcross strategy in development of hop genetic maps for detection of
QTLs of chemical components of hop resin.
We have also chosen this mapping approach for the development of hop genetic maps
using AFLP and microsatellite markers on the family segregating quantitatively for
alpha-acid content. Maternal and paternal linkage groups were constructed and data of
repeated evaluations of alpha-acid content over three vegetation periods were used for
mapping of QTLs. Quantitative analysis indicated four putative QTLs on three linkage
groups of the female map of which one overlapped with the AFLP marker.
Materials and methods
Plant material
The F1 full-sib family used in this study is part of the breeding program carried out by the
Slovenian Institute of Hop Research and Brewing, Žalec, Slovenia. Our mapping
population was obtained by crossing the German variety ‘Magnum’ with the Slovene
breeding line ‘2/1’. The analysis included 111 full-sib genotypes, 97 female and 14 male
plants and the two parents. The progenies display clear morphological variations in many
traits, such as growth rate, vigour and alpha-acid content. The mapping population was
selected on the basis of observations made in the breeding programme.
DNA isolation
Total genomic DNA was extracted from young leaves using a modified CTAB method
according to Kump and Javornik (1996). The ground leaf suspensions were treated with
CTAB buffer [2% (w/v) CTAB, 1.4 M NaCl, 20 mM EDTA, 100 mM Tris-HCl (pH 8.0),
0.2% (v/v) -mercaptoethanol; Sigma-Aldrich Chemie GmbH], and extracted by
repetitions with a phenol : chlorophorm : isoamylalcohol mixture (25:24:1). The DNA
was precipitated by the addition of sodium acetate (3M, pH 5.2) and ice cooled
isopropanol. The pellet was washed with cold ethanol (70%), dried and re-suspended in
TE buffer (10 mM Tris-HCl, 1 mM EDTA, pH 8.0). The DNA concentration was
estimated by mini TKO 100 DNA fluorimeter (Hoefer Scientific) and samples were
stored at 4°C.
AFLP analysis
The AFLP protocol was carried out according to Vos et al. (1995). Restriction digests
were performed by using 2.5 U EcoRI and 2.5 U MseI enzymes in 1x NE EcoRI buffer

(50 mM NaCl, 100 mM Tris-HCl, 10 mM MgCl2, 0.025% Triton X-100 pH 7.5) or 2.5 U
PstI and 2.5 U MseI enzymes in 1x NE buffer 2 [50 mM NaCl, 10 mM Tris-HCl, 10 mM
MgCl2, 1 mM dithiothreitol (pH 7.9), 1x BSA (100 g/mL)] in a final volume of 40 L at
37°C incubated overnight. Ligation was performed at the same temperature adding
EcoRI/PstI (5 pmol) and MseI (50 pmol) adapters in 1x T4 DNA ligase buffer (50 mM
Tris-HCl, 10 mM MgCl2, 10 mM ditiotreitol, 1 mM ATP, 25 g/L BSA pH 7.8) adding
1 U Weiss T4 – DNA ligase.
Restricted and ligated DNA (50 ng DNA) was pre-amplified in standard 1x PCR buffer
(10 mM Tris-HCl, 1.5 mM MgCl2, 50 mM KCl, pH 8.3) with 50 ng EcoRI, PstI and MseI
primers with one additional nucleotide, 1.25 U Taq DNA polymerase (Promega), 0.8 mM
mixture of four dNTPs (Roche Molecular Biochemicals) in a final volume of 50 L. The
pre-amplification mixture was amplified in a MWG Primus 96 using 20 cycles of 94°C
for 30 s, 56°C for 60 s, and 72°C for 60 s.
The following touchdown protocol was used for selective amplification of 2 L
preamplified DNA in 1x PCR buffer (10 mM Tris-HCl, 1.5 mM MgCl2, 50 mM KCl, pH
8.3), 15 ng EcoRI/PstI and MseI primers with two or three selective nucleotides, 0.3 U
Taq DNA polymerase (Promega), 0.8 mM mixture of four dNTPs (Roche Molecular
Biochemicals) in a final volume of 10 L: 13 cycles of 94°C for 30 s, 65°C for 30 s with
a decrease of –0.7°C per cycle, and 72°C for 1 min; followed by 23 cycles at the
annealing temperature of 56°C.
For amplification of parental DNA, 108 primer pairs were screened in total. The
progenies of the family were selectively amplified with 18 EcoRI/MseI and 18 PstI/MseI
primer pair combinations selected after screening parental DNA samples. EcoRI or PstI
primers in selective amplification were labelled with Cy5 to allow detection of separated
fragments by ALFexpress II automated sequencer (Amersham Biosciences). Results were
analysed by the software package ALFwinTM
Fragment Analyser 1.03 (Amersham
Biosciences) and visually.
The AFLP markers were named after the selective primer set used and the number of
detected bases.
SSR analysis
Twenty-two SSR markers, expressing polymorphism in parents, were screened on the F1
crossing family. Amplification of SSR markers was carried out according to Štajner et al.
(2005 ali 2004??) for 15 markers (HlGA24, HlAGA4, HlAGA7, HlAGA6, HlGA23,
HlGA35, HlGA31, HlGT24, HlGT20, HlGT17, HlGT16, HlGT14, HlAGA8, HlGA36,
HlACA3), according to Brady et al. (1996) for two SSR markers (Hl3a88, Hl7a82) and
according to Araki et al. (1998) for STS marker HlBrapd. 4 SSR markers were found in
chalcone synthase genes (chs2, chs3, chs4) and in endochitinase precursor gene hch1.
Markers CHS2 (AB061020, SSR repeat motif (TC)11CATATATAC(AT)6, position 232-
274 bp), CHS3 (AB061022, SSR repeat motif (AT)6, position 230-241 bp) and CHS4
(AJ430353, SSR repeat motif (AT)5(AC)4(AT)4N236(TA)7, position 1372-1648 bp) and

HCH1B (AF147497, SSR motif (TAGTTA)5, position 1935-1964 bp) were amplified in
PCR reactions in a volume of 20 L containing 1x PCR buffer (10 mM Tris-HCl, 50 mM
KCl, pH 8.3), 1.5 mM MgCl2, 0.2 mM each of dNTPs, 10 μM of each primer (forward
Cy5 labelled), 0.5 U of Taq polymerase (Biotools) and 40 ng of hop DNA. Amplification
was performed in a PE9700 Thermal Cycler (Applied Biosystems) using the following
thermal cycling protocol: 95°C for 5 min, followed by the 26 cycles of 45 sec at 94°C, 30
sec at 52 – 64°C and 1 min 30 sec at 72°C. The reactions were completed by incubating
at 72°C for 8 min and held at 4°C. Microsatellites were separated and detected on an
ALFexpress II automated sequencer (Amersham Biosciences).
Alpha-acid content
The content of alpha-acids was measured in 2002, 2003 and 2004 with the lead
conductance value (LCV) method (Analytica EBC 1998). With this standardised method
the dried hop cones (5 g) of each female hop plant were grinded up and extracted with 50
mL toluene. After shaking (30 min) and filtration the LCV of hop was determined with
conductometric titration with lead acetate in the methanolic solution (20 g/L, acidified
with acetic acid). Determination of the equivalent point gave the LCV, which is
proportional to the percentage content of alpha-acids.
The distribution of alpha-acid content in all 3 years was tested with the Kolmogorov-
Smirnov test. Phenotypic data from each year were used in the QTL analysis.
Data analysis
Dominant AFLP loci were separated into three segregation patterns: 1:1 for loci showing
segregation for the female parent (‘Magnum’ x ‘2/1’; type ab×aa); 1:1 for loci showing
segregation for the male parent (type aa×ab), and loci heterozygous in both of them (type
a0×a0). The SSR markers revealed three patterns of segregation: 1:1 for markers
segregating only in the male or in the female (types ab×aa and aa×ab), 1:2:1 for markers
segregating in male and female (type ab×ab) and more informative 1:1:1:1 segregation in
markers segregating in both parents with three alleles (type ab×ac).
Markers segregation was tested by chi-square test although all markers were used for the
mapping including those demonstrating significant departure from the expected
Mendelian ratios.
Monoparental AFLP markers and all SSR markers were used to construct separate
genetic linkage maps for the female (‘Magnum’) and male (‘2/1’) parents, using the two-
way pseudo-testcross strategy (Grattapaglia and Sederoff 1994). The hypothetical M
marker linked absolutely to the male plants was added to mapping data.
Map construction was carried out using the JoinMap 3.0 programme (Van Ooijen and
Voorrips 2001). The phase was determined internally by software based on the
recombination frequency. The map was constructed using a LOD of 5.0 for the grouping
of markers. In each linkage group, the order of markers was inferred using pairwise data
of only those loci that had a recombination frequency lower than 0.35 and a LOD value
higher than 2.0. The optimal marker order was determined by using the ripple value of

1.0 and the jump threshold of 5.0. The Kosambi mapping function was used to convert
recombination data to map distances.
MapQTL version 4.0 (Van Ooijen and Maliepaard 1996) was used to identify and locate
QTLs associated with alpha-acid content, by performing the non-parametric test of
Kruskal-Wallis as well as both interval mapping (Lander and Botstein 1989) and
multiple-QTL mapping (MQM; Jansen and Stam 1994). Each linkage group was scanned
at 1-cM intervals. In the regions of the putative QTLs, the markers with the highest LOD
values were chosen as co-factors. A backward elimination procedure was used to select
cofactors significantly associated with each trait at p < 0.02 to be used in MQM. A LOD
score of 3.0 was used to declare the presence of a QTL linked to alpha-acid content. The
results are reported in terms of the individual parental effects (i.e., difference in effect of
the alleles inherited from each parent) and the interaction effect (i.e., deviation from
additivity, where a value of zero indicates complete additivity) (Table 1). For each LOD
peak, the 2-LOD support intervals were determined (Conneally et al. 1985).
Maps were drawn using the MapChart version 2.1 software (Voorrips 2002).
Result and discussion
The molecular mapping of the cultivar ‘Magnum’, a representative of high alpha-acid
varieties, and ‘2/1’, a traditional Slovene male hop, is described. Constructed maps were
used to initiate a dissection of genetic factors responsible for alpha-acid content by QTL
mapping.
Mapping population and genotyping
Our population consisted of 97 female and 14 male plants derived from the cross
‘Magnum’ x ‘2/1’. Sex segregation ratio was highly distorted (6.9:1) in our mapping
population as has been frequently observed in hop 2:1 (Neve 1991), 3:1 (Nesvadba et al.
1999), 4:1 (Patzak et al. 2002) and even 7.5:1 (Seefelder et al. 2000a). However, the
genetic basis of sex determination in hops remains still largely unknown. The population
was selected from our breeding programme on the basis of the variability of alpha-acid
content ranging in values from 2% to 17%. Such range covers almost all known values of
alpha-acid content since alpha content more than 18% is very rarely reported in breeding
lines. This variability was obtained only in female plants since lupulin, which contains
most of hop resins and essential oils, originates in the cones. Thus, only female plants
were included in the evaluation of alpha acids and together with sex segregation
distortion presumably affected the statistical potential of the test.
The parents were analysed with 108 AFLP primer combinations using EcoRI, PstI and
MseI restriction enzymes. Thirty-six primer combinations were selected out of 108
combinations and amplified on the entire mapping population. AFLP analysis with 18
PstI/MseI primer combinations gave a total of 807 amplified fragments in comparison to
1145 bands obtained with 18 EcoRI/MseI primer combinations but much higher (50.0%)
polymorphism was obtained in first set than in the second one (30.8%). The percentage of
revealed polymorphism with our AFLP analysis on the entire population was 40.5%,
which is comparable with other reports (Seefelder et al. 2000b; Jakše et al. 2001; Čerenak
and Javornik 2002).
From 36 primer combinations, 1955 AFLP markers were scored, ranging from 28 to 625
bp, of which 762 (~40%) were polymorphic. Of these markers, 137 were inherited from
the female parent cv. ‘Magnum’ (1:1), 104 from male parent ‘2/1’ (1:1), and 521 were
heterozygous in both parents (3:1). Segregation ratios were tested using the 2 test and a
total of 479 AFLP markers (62.86%) did not fit the expected Mendelian ratios (p<0.01)
(Table 2).
Two restriction enzyme combinations, MseI/PstI and MseI/EcoRI, differing in sensitivity
to cytosine methylation, were used in an attempt to achieve a wider distribution of
markers across the genome (Young et al. 1999, Hanley et al. 2002). On average, 20%
higher polymorphism was obtained using MseI/PstI comparing to MseI/EcoRI primer
combinations. In the developed maps, pronounced clustering of any marker type was not
evident similar to the results in grapevine (Fisher et al. 2004). In other mapping
approaches, evidence for the clustering of AFLP markers has been reported (Doligez et
al. 2002) and AFLP marker distribution in general has been discussed as being potentially
biased by methylation patterns influencing the frequency and distribution of restriction
enzyme target sequences in a given genome.
Segregation analysis of all three types of AFLP markers revealed a high percentage of
distorted markers. Segregation distortion has often been observed in perennial species,
such as forest and fruit trees (Grattapaglia and Sederoff 1994; Marques et al. 1999;
Cervera et al. 2001). Departures from expected Mendelian ratios often indicate a linkage
between molecular markers and distorting factors and by excluding such markers from
the map part of the linkage group would be missing (Hackett and Broadfoot 2003).
Therefore it is suggested that all markers should be used in the mapping process. For
example, the use of distorted markers in the construction of chestnut map did not affect
the result of marker grouping (Casasoli et al. 2001). However in pine, eucalyptus and
oak, general trend was observed for distorted markers to cluster in particular linkage
groups (Verhaegen and Plomion 1996; Barreneche et al. 1998). We included all markers
in mapping regardless of the segregation ratio since majority of them were sex linked and
no linkage groups containing clusters of distorted markers were found.
The AFLP technique considerably decreases the cost and time required to construct
genetic linkage maps, relative to other PCR-based marker systems (Vos et al. 1995). A
growing number of genetic maps based on different kinds of molecular markers now
include AFLP, indicating their efficiency for mapping purposes. However, microsatellites
or SSR are co-dominant and highly informative markers in the linkage analysis of
outbreeding populations but they are considerable more costly than AFLP markers.
We used 17 hop genomic SSRs (ali se piše množina?), one STS marker and four SSRs
found in hop cloned genes. From the set of 22 microsatellite markers tested, five

segregated in highly informative 1:1:1:1 ratio, one in 1:2:1 ratio and 16 segregate in 1:1
ratio (Table 2). 18 SSR markers were heterozygous in female parent and 15 of them were
mapped while 10 SSR markers were inherited from male parent of which 8 were mapped.
Altogether, out of 22 SSR markers 19 markers were placed on either map of which 3
markers were linked on both maps (HlAGA6, HlAGA7, HlGT14).
Within sequences of the cloned chs-like genes we found microsatellite like structures
which we used to develop SSR markers. These genes are of importance since they are
key players (?) in the biosynthesis of hop bitter acids. Only SSRs developed from
enzymatically not yet well defined genes (chs2, chs3 and chs4) were polymorphic in our
mapping population and they cluster together on the same linkage group. The
microsatellite HCH1B obtained from sequences of endochitinase precursor gene mapped
on LG14 which is assumed to be a part of one major linkage group.
Map construction
A total of 96 markers (81 AFLPs, 15 SSRs) were placed on the ‘Magnum’ map forming 9
linkage groups, 2 triplets and 3 doublets which are assumed to be part of the other groups,
defining 661.90 cM of total map distance. The average distance between adjacent
markers was 11.51 cM; the largest interval was 26.47 cM in LG 12 (doublet), but there
were also significantly higher intervals in three other minor groups. In the remaining 9
‘major’ linkage groups, the average interval ranged between 4.43 and 11.92 cM. The
‘Magnum’ map has 37.1% more markers than the ‘2/1’ male map. A total of 70 markers
(61 AFLPs, 1 hypothetical marker, 8 SSRs) were placed on the ‘2/1’ map, defining
445.90 cM of total map distance, with an average interval of 12.26 cM between adjacent
markers. The largest interval 24.41 cM was obtained in LG 10 (doublet). Seven ‘major’
linkage groups containing from 4 to 23 markers were evidently in ‘2/1’ and ranged from
26.07 to 81.90 cM. The other 5 linkage groups are only doublets, and ranged from 1.87 to
24.41 cM.
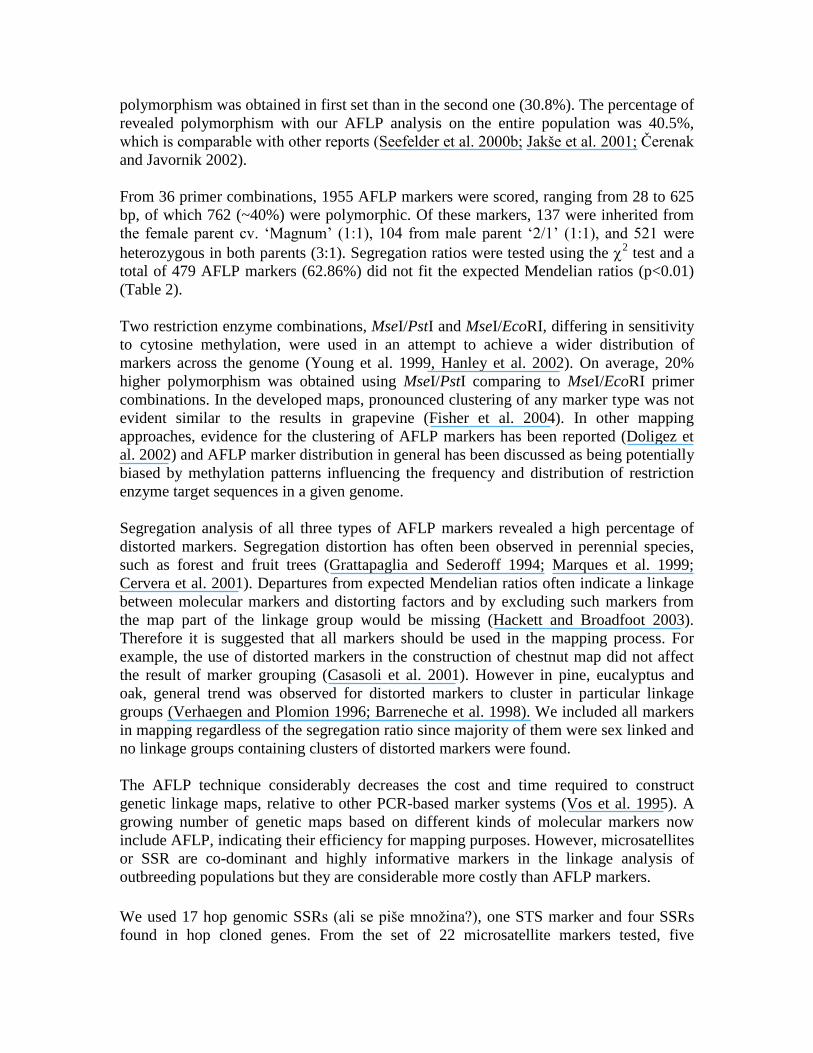
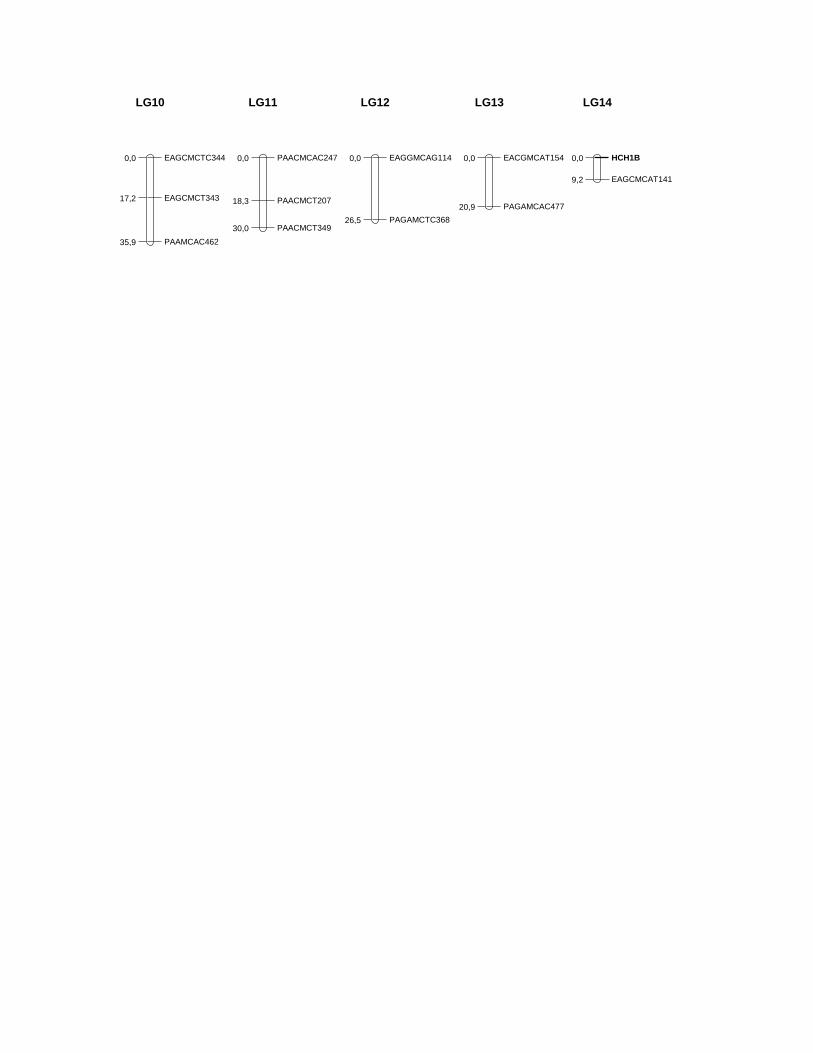
Marker distribution in the resulting maps seemed fairly even with only slight clustering
of SSRs on LG04 on female map. Large gaps of around 20 cM distance between two
markers remain on 6 ‘Magnum’ linkage groups and 4 linkage groups identified from
‘2/1’ if doublets and triplets are excluded. These gaps seem to occur predominantly in
terminal regions (Fig. 3, 4).
For both the paternal and maternal maps, the number of resolved linkage groups
exceeded the haploid number of hop (n=10) suggesting that additional markers will be
required to bridge gaps between linkage groups and to improve resolution. Small linkage
groups (doublets and triplets) are assumed to be the part of other major groups. The
presence of large gaps may also be explained by hot spots of recombination (Cervera et
al. 2001). It is to be expected that the number of linkage groups will be reduced as more
molecular markers are mapped, especially SSRs with a co-dominant nature.
The ‘Magnum’ and ‘2/1’ maps were deliberately constructed with high statistical
stringency (linkage threshold of LOD 5.0), which is two orders of magnitude more
stringent than the significance threshold of LOD 3.0 first suggested by Lander and
Botstein (1989) in order to construct a very robust and reliable skeleton for QTL analysis.

The size of female linkage map was larger than male map. The smaller total map length
of the paternal map in comparison to the maternal map suggests that some regions are
still under-represented by markers available in the paternal data set. However, our maps
coverage is larger than in the hop maps published by Seefelder et al. (2000a), using 217
AFLPs, 3 RAPDs, 1 STS and 3 SSR markers segregating in an 68 F1 population
obtaining coverage of 346.7 cM in the maternal and 227.4 cM in the paternal map or on
their other maps Seefelder et al. (2005) using large mapping family and higher number of
AFLP markers. Koie et al. (2005) also covered only 272 cM and 102 cM on female and
male maps respectively, but using smaller number of AFLP markers.
QTL analysis
QTL analyses were carried out using data of alpha-acid contents obtained in the years
2002, 2003 and 2004. In 3 years, during which the plants were grown in experimental
field, the 76, 80 or 79 female plants of the segregating population showed variation of
alpha-acid content. In addition to variation of this trait, the individuals varied also in
other agronomic traits, such as growth habit, the beginning of ripening and cone
characteristics. The frequencies of observed alpha-acid contents showed normal
distribution as seen in Fig. 1. Good correlations with average correlation coefficients of
0.66 for 2002/2003, 0.53 for 2002/2004 and 0.58 for 2003/2004, were obtained at p<0.01.
The distribution of alpha-acid content in all 3 years was tested with the Kolmogorov-
Smirnov test and none of the 3 distributions deviated significantly from the expected
normal distribution (p>0.05) (Table 3).
QTL analysis showed no significant QTLs for alpha-acid content in 2002 but in 2003 one
putative QTL, alpha1, was identified on linkage group LG03 of the female map. Using
multiple-QTL mapping (MQM) its peak LOD value was estimated as 3.13. This QTL
accounted for 24.8% of the observed phenotypic variation (Table 4). In 2004 three QTLs
(alpha2, alpha3, and alpha4) associated with alpha-acid content were localized on
linkage groups LG01, LG09, and LG03 of the female map, respectively. Its LOD values
were 4.60, 3.60, and 3.10 explaining 18.6, 20.6, and 11.9% of the phenotypic variance.
The location of alpha1 was not significant using data of alpha-acids content obtained in
2004. The most interesting for eventual marker-assisted selection is QTL alfa2, having
the 2-LOD confidence interval of only 4 cM. The peak of putative QTL is found exactly
on the location of AFLP marker EACGMCTT440. The paternal effect of alfa2 was null
suggesting that the male parent ‘2/1’ was homozygous. The alfa3 QTL exhibit a strong
interaction effect, which suggests some degree of non-additive (i.e., dominant or
epistatic) expression for alleles at this QTL.
The genetic effects related to the alpha-acid content were thus identified in three different
chromosomal regions on LG01, LG03 and LG09 of ‘Magnum’ although all of these
QTLs were not repeatedly obtained by analyzing field data from different years. But Koie
et al. (2005) provided preliminary information that their three QTLs for alpha acids on
three linkage groups were detected repeatedly in the same region by independent analysis
of phenotypic data from three different years. Therefore, we will continue with our work
by including additional data of alpha-acid content and saturating the map with more
markers, particularly the putative QTL regions.

Our QTLs were localized on the different linkage groups than three chalcone synthase -
like genes (chs2, chs3, and chs4) which mapped together on the same linkage group. We
were not able to map vps and chs_h1 which encode enzymes directly involved in
biosynthesis of bitter acids but it has been suggested that vps gene is part of the gene
cluster together with chs3, and chs4 (Novak et al. 2003) and therefore we can assume that
at least vps gene could be linked to mapped genes but not to our QTLs. Considering the
lack of co_localization of chs_like genes and detected QTLs we can speculate that some
of our alpha acid QTL may represent a regulatory factors since it has been indicated that
regulation rather than number of chs-genes determine varying level of bitter acids in hops
(Matoušek et al. 2002).
Conclusion
We constructed hop genetic maps by using mapping family displaying variations in
alpha-acid content in order to detect QTLs for this trait. We examined linkages between
molecular markers and quantitative traits related to alpha-acid content. This trait explains
a continuous phenotypic distribution and marker loci were used to estimate the number
and effect of QTLs associated with this character. The identification of such QTLs will
aid hop breeding by increasing our understanding of the inheritance of the character and
provide the basis for marker-assisted selection. Although these maps are not complete
and constitute the skeleton on which more co-dominant microsatellite markers can be
mapped progressively to construct a saturated map, we were able to detect some QTLs.
The most interesting for marker-assisted selection is QTL alfa2, explaining 18.6% of
phenotypic variability of alpha-acid content, which is co-located with a marker. Mapping
of chs-like genes which encode enzymes involved in biosynthesis of bitter acids to
different linkage group than detected QTLs support the complexity of the production of
hop secondary metabolites. Addition of more functional genes and regulatory factors
involved in the secondary metabolite biosynthesis to our framework maps will allow us
to search for QTLs co-localize with the genes and to establish their putative role in the
determination of alpha acid content.
Acknowledgment: This work was supported by research grants PO-0513-0481 and S4-
486-019/18828/2001 from the Slovene Ministry of Education, Science and Sport. We
thank B. Juvančič for skilful technical assistance in the laboratory.

References
Analytica EBC / European brewery convention 1998. Nuernberg, EBC Analysis
Committe – Nuernberg, Carl, Hans, Getränke – Fadverl. Grundwerk: Section 7
Araki, S., Tsuchiya, Y., Takashio, M., Tamaki, T., and Shinotsuka, K. 1998.
Identification of hop cultivars by DNA marker analysis. J. Am. Soc. Brew.
Chem. 56: 93-98.
Atienza, S.G., Satovic, Z., Petersen, K.K., Dolstra, O., Martín, A. 2003. Identification of
QTLs influencing combustion quality in Miscanthus sinensis Anderss. II.
Chlorine and potassium content. Theor. Appl. Genet. 107: 857-863.
Barreneche, T., Bodenes, C., Lexer, C., Trontin, J.F., Fluch, S., Streiff, R., Plomion, C.,
Roussel, G., Steinkellner, H., Burg, K., Favre, J.M., Glossl, J., and Kremer, A.
1998. A genetic linkage map of Quercus robur L. (Pedunculate oak) based on
RAPD, SCAR, microsatellite, isozyme and 5S rDNA markers. Theor. Appl.
Genet. 97: 1090-1103.
Brady, J.L., Scott, N.S., and Thomas, M.R. 1996. DNA typing of hops (Humulus lupulus)
through application of RAPD and microsatellite marker sequences converted to
sequence tagged sites (STS). Euphytica 91: 277-284. Casasoli, M., Mattioni, C., Cherubini, M., and Villani, F. 2001. A genetic linkage map of
European chestnut (Castanea sativa Mill.) based on RAPD, ISSR and isozyme
markers. Theor. Appl. Genet. 102: 1190-1199.
Cervera, M.T., Storme, V., Ivens, B., Guemao, J., Liu, B.H., Hostyn, V., Van Slycken,
M., Van Montague, M., and Boerjan, W. 2001. Dense genetic linkage maps of
three Populus species (Populus deltoides, P. nigra and P. trichocarpa) based on
AFLP and microsatellite markers. Genetics 158: 787-809.
Conneally, P.M., Edwards, J.H., Kidd, K.K., Lalouel, J.M., and Morton, N.E. 1985.
Report of the committee on methods of linkage analysis and reporting.
Cytogenet. Cell. Genet. 40: 356-359.
Čerenak, A., and Javornik, B. 2002. Analysis of DNA markers for damson hop aphid
resistance in hop. Res. Rep. Biot. Fac. Univ. LJ. 79: 361-369.
Doligez, A., Bouquet, A., Danglot, Y., Lahogue, F., Riaz, S., Meredith, C.P., Edwards,
K.J., and This, P. 2002. Genetic mapping of grapevine (Vitis vinifera L.) applied
to the detection of QTLs for seedlessness and berry weight. Theor. Appl. Genet.
105: 780-795.
Fisher, B.M., Salakhutdinov, I., Akkurt, M., Eibach, R., Edwards, K.J., Topfer, R., and
Zyprian, E.M. 2004. Quantitative trait locus analysis of fungal disease
resistance factors on a molecular map of grapevine. Theor. Appl. Genet. 108:
501-515.
Grattapaglia, D., and Sederoff, R. 1994. Genetic linkage maps of Eucalyptus grandis and
Eucalyptus urophylla using a pseudo-testcross: Mapping strategy and RAPD
Markers. Genetics 137: 1121-1137.
Hackett, C.A., and Broadfoot, L.B. 2003. Effects of genotyping errors, missing values
and segregation distortion in molecular marker data on the construction of
linkage maps. Hered. 90: 33-38.
Hanley, S., Barker, J.H.A., Van Ooijen, J.W., Aldam, C., Harris, S.L., Ahman, I.,
Larsson, S., and Karp, A. 2002. A genetic linkage map of willow (Salix
viminalis) based on AFLP and microsatellite markers. Theor. Appl. Genet. 105:
1087-1096.
Jakše, J., Kindlhofer, K., and Javornik, B. 2001. Assesment of genetic variation and
differentiation of hop genotypes by microsatellite and AFLP markers. Genome
44: 773-782.
Jansen, R.C., and Stam, P. 1994. High resolution of quantitative traits into multiple loci
via interval mapping. Genetics 136: 1447-1455.
Karlov, G.I., Danilova, T.V., Horlemann, C., and Weber, G. 2003. Molecular
cytogenetics in hop (Humulus lupulus L.) and identification of sex
chromosomes by DAPI-banding. Euphytica 132: 185-190.
Knott, S.A., Neale, D.B., Sewell, M.H., and Haley, C.S. 1997. Multiple marker mapping
of quantitative trait loci in an outbred pedigree of loblolly pine. Theor. Appl.
Genet. 94: 810-820.
Koie, K., Inaba, A., Okada, Y., Kaneko, T., and Ito, K. 2005. Construction of the genetic
linkage map and QTL analysis on hop (Humulus lupulus L.). In Proceedings of
the 1st International Humulus Symposium held 1-7 Aug. 2004, Corvallis,
Oregon. Edited by K. E. Hummer and J.A. Henning. Acta.Hort. 668, ISHS
2005, pp. 59-67.
Kump, B., and Javornik, B. 1996. Evaluation of genetic variability among common
buckwheat (Fagopyrum esculentum Moench.) populations by RAPD markers.
Plant Sci. 114: 149-158.
Lander, E.S., and Botstein, D. 1989. Mapping Mendelian factors underlying quantitative
traits using RFLP linkage maps. Genetics 121: 185–199.
Lercetau, E., Plomion, C., and Andersson, B. 2000. AFLP mapping and detection of
quantitative trait loci (QTLs) for economically important traits in Pinus
sylvestris: a preliminary study. Mol. Breed. 6: 451-458.
Maliepaard, C., Alston, F.H., Van Arkel, G., Brown, L.M., Chevreau, E., Dunemann, F.,
Evans, K.M., Gardiner, S., Guilford, P., van Heusden, A.W., Janse, J., Laurens,
F., Lynn, J.R., Manganaris, A.G., Den Nijs, A.P.M., Periam, N., Rikkerink, E.,
Roche, P., Ryder, C., Sansavini, S., Schmidt, H., Tartarini, S., Verhaegh, J.J.,
Vrielink-Van Ginkel, M., and King, G.J. 1998. Aligning male and female
linkage maps of apple (Malus pumila Mill.) using multi-allelic markers. Theor.
Appl. Genet. 97: 60–73.
Marques, C.M., Vasquez-Kool, J., Carocha, V.J., Ferreira, J.G., O'Malley, D.M., Liu, B.-
H., and Sederoff, R. 1999. Genetic dissection of vegetative propagation traits in
Eucalyptus tereticornis and E. globulus. Theor. Appl. Genet. 99: 936-946.
Matoušek, J., Novák, P., Břiza, J., Patzak, J., and Niedermeierová, H. 2002. Cloning and
characterisation of chs-specific DNA and cDNA sequences from hop (Humulus
lupulus L.). Plant Sci. 162: 1007-1018.
Nesvadba, V., Vejl, P., and Skupinova, S. 1999. Transfer of hop agricultural tratis on F1
generation posterity. Rostl. Vyr. 45: 245-249.
Neve, R.A. 1991. Hops. London, Chapman and Hall p. 266.
Novak, P., Matoušek, J., and Briza, J. 2003. Valerophenone synthase-like chalcone
synthase homologues in Humulus lupulus. Biologia Plant. 46:375-381.

Okada, Y., and Ito, K. 2001. Cloning and analysis of valerophenon synthase gene
expressed specifically in lupulin gland of hop (Humulus lupulus L.). Biosci.
Biotechnol. Biochem. 65: 150-155.
Okada, Y., Sano, Y., Kaneko, T., Abe, I., Noguchi, H., and Ito, K. 2004. Enzymatic
reactions by five chalcone synthase homologues from hop (Humulus lupulus
L.). Biosci. Biotechnol. Biochem. 68:1142-1145.
Paniego, N.B., Zuurbier, K.W.M., Fung, S.Y., van der Heijden, R., Scheffer, J.J.C., and
Verpoorte, R. 1999. Phlorisovalerophenone synthase, a novel polyketide synthase
from hop (Humulus lupulus L.) cones. Eur. J. Biochem. 262: 612-616.
Patzak, J., Vejl, P., Skupinova, S., and Nesvadba, V. 2002. Identification of sex in F1
progenies of hop (Humulus lupulus L.) by molecular marker. Rostl Výroba 48:
318-321.
Seefelder, S., Ehrmaier, H., Schweizer, G., and Seigner, E. 2000a. Male and female
genetic linkage map of hops, Humulus lupulus. Plant Breed. 119: 249-255.
Seefelder, S., Ermaier, H., Schweizer, G., and Seigner, E. 2000b. Genetic diversity and
phylogenetic relationships among accessions of hop, Humulus lupulus, as
determined by amplified fragment length polymorphism fingerprinting
compared with pedigree data. Plant Breed. 119: 257-263.
Seefelder, S., Lutz, A., and Seigner, E. 2005. Mapping of a powdery mildew resistance
gene in hop (Humulus lupulus L.). In Proceedings of the Scientific Commission,
I.H.G.C., held 20-25 Feb. 2005, George, South Africa. Edited by E. Seigner. By
Bayerische Landesanstalt für Bodenkultur und Pflanzenbau, Hüll, Germany. pp.
31-35.
Štajner, N., Jakše, J., Kozjak, P., and Javornik, B. 2004. The isolation and
characterisation of microsatellites in hop (Humulus lupulus L.). Plant sci. 168:
213-221.
van Ooijen, J.W., and Voorrips, V.E. 2001. JoinMap 3.0, Software for the calculation of
genetic linkage maps. Plant Research International, Wageningen, the
Netherlands.
van Ooijen, J.W., and Maliepaard, C. 1996. MapQTL, version 3.0: software for the
calculation of QTL positions on genetic maps. CPRO-DLO, Wageningen, The
Netherlands.
Verhaegen, D., and Plomion, C. 1996. Genetic mapping of Eucalyptus urophylla and
Eucalyptus grandis using RAPD markers. Genome 39: 1051-1061.
Voorrips, R.E. 2002. MapChart: Software for the graphical presentation of linkage maps
and QTLs. J Hered 93: 77-78.
Vos, P., Hogers, R., Bleeker, M., Reijans, M., Lee, T., Hornes, M., Frijters, A., Pot, F.,
Peleman, J., Kuiper, M., and Zabeau, M. 1995. AFLP: a new technique for
DNA fingerprinting. Nucleic Acids Res. 21: 4407-4414.
Wu, R.L., Han, Y.F., Hu, J.J., Fang, J.J., Li, L., Li, M.L., and Zeng, Z.B. 2000. An
integrated genetic map of Populus deltoides based on amplified fragment length
polymorphisms. Theor. Appl. Genet. 100: 1249-1256.
Yin, T.-M., Wang, X.-R., Andersson, B., and Lercetau-Kohler, E. 2003. Nearly complete
genetic maps of Pinus sylvestris L. (Scots pine) constructed by AFLP marker
analysis in a full-sib family. Theor. Appl. Genet. 106: 1075-1083.

Young, W.P., Schupp, J.M., and Keim, P. 1999. DNA methylation and AFLP marker
distribution in the soybean genome. Theor. Appl. Genet. 99: 785-790.

Table 1: Model used to test the effects of QTL alleles (Knott et al. 1997).
Parental cross Q1Q2 x Q3Q4 → Q1Q3, Q1Q4, Q2Q3, Q2Q4
Maternal effect (M) = (Q1Q3 + Q1Q4) - (Q2Q3 + Q2Q4)
Paternal effect (P) = (Q1Q3 + Q2Q3) - (Q1Q4 + Q2Q4)
Interaction effect (I) = (Q1Q3 + Q2Q4) - (Q1Q4 + Q2Q3)

Table 2: Number and segregation types of markers.
Marker type Segregation type No. polymorphic
markers
No. of loci at
p < 0.01
AFLP
<a0×a0> 521 341
<ab×aa> 137 72
<aa×ab> 104 66
SSR
<ab×ab> 1 1
<ab×aa> 8 1
<aa×ab> 4 0
<ab×ac> 5 4
CHS + HCH * <ab×aa> 4 0
Total 784 485
* - Designation in Material and methods

Table 3: Number of progenies of crossing family (N) included in analysis of alpha-acid
content, mean of alpha-acid content, variance (Var.), minimum (Min.) and
maximum (Max.) value, coefficient of skewness and kurtosis and P value
from Kolmogorov-Smirnov test for normality.
Trait - alpha
acid N Mean Var. Min. Max.
Coeficient
of skewness
Coeficient of
kurtosis P
2002 76 10.42 7.51 4.50 16.40 -0.25 -0.61 0.74
2003 80 7.09 5.67 3.00 15.10 0.64 0.45 0.51
2004 79 8.7 7.90 2.00 17.0 0.62 0.60 0.48

Table 4: Location, significance and genetic effects of individual QTLs detected related
to alpha-acid content using multiple-QTL mapping approach.
QTL Year LGa cM
b Marker LOD
c %
d M
e P
f I
g
alfa1 2003 LG03 4.7 EACCMCAA103F* 3.13 24.8 -4.60 -1.53 0.16
alfa2 2004 LG01 35.5 EACGMCTT440F 4.60 18.6 5.23 0.00 0.00
alfa3 2004 LG09 20.5 EAGGMCAC135F* 3.60 20.6 0.17 3.58 -3.58
alfa4 2004 LG03 24.7 EAGCMCAG100F 3.10 11.9 -3.62 -2.02 -0.22
a LG – linkage group;
b QTL position as estimated by the location of the local LOD maximum in cM from
the 'top' of the linkage group; c LOD value at QTL position;
d percentage of phenotypic variance explained
by QTL; marker – marker nearest to the QTL position and genetic effects (e maternal,
f paternal and
g
interaction effect) (Knott et al. 1997)

Figure 1: Distribution of alpha-acid content in the mapping population in relation to the
sample size in 2002, 2003 and 2004.

0
2
4
6
8
10
12
14
16
18
20
22
24
[1;2] [2;3] [3;4] [4;5] [5;6] [6;7] [7;8] [8;9] [9;10] [10;11] [11;12] [12;13] [13;14] [14;15] [15;16] [16;17]
% of the alpha acid content in the year 2002
sa
mp
le s
ize

0
2
4
6
8
10
12
14
16
18
20
22
24
[1;2] [2;3] [3;4] [4;5] [5;6] [6;7] [7;8] [8;9] [9;10] [10;11] [11;12] [12;13] [13;14] [14;15] [15;16] [16;17]
% of alpha acid content in the year 2003
sam
ple
siz
e

0
2
4
6
8
10
12
14
16
18
20
22
24
[1;2] [2;3] [3;4] [4;5] [5;6] [6;7] [7;8] [8;9] [9;10] [10;11] [11;12] [12;13] [13;14] [14;15] [15;16] [16;17]
% of the alpha acid content in the year 2004
sa
mp
le s
ize

Figure 3: Schematic presentation of female genetic linkage groups for the mapping
population of ‘Magnum’ × ‘2/1’ containing AFLP and microsatellite (marked
bold) markers. Numbers on the left side of the linkage groups indicate genetic
distances in centi-Morgan (cM). Bars indicate QTL location.

PACAMCTA1420,0
PAACMCTT2786,9EACCMCAA33513,3EACCMCAA5518,0EACCMCAA15521,2EAGGMCAC26323,5EAGGMCTC43525,9PACAMCAT16528,6EACGMCTT44035,5PAGAMCTC19735,9PAGAMCTC38042,6EACGMCTA16847,8PAGAMCTC22051,5PAGAMCAG11853,2
PAAMCAC16064,1
PAGAMCTC22475,6
PAGAMCTC7184,3
PAGAMCTC17599,8
PAGAMCTC126117,3
alp
ha
2LG01
EAGGMCAG1290,0PAGAMCAC2652,5PAAMCAC2615,0
PAGAMCT13919,8PAGAMCT25528,0PAGAMCTT25433,0EAGGMCTC27233,7HlGA3534,1PAGAMCAA38834,7EAGCMCTG17036,8
EACGMCTA8147,2
EAGCMCTA19760,5
LG02
PACAMCAC4120,0
EAGCMCTA2848,1
EAGCMCAC42621,1EAGGMCAC39222,5HlGT1423,9EAGCMCAG10024,7EACGMCTA17725,6EACCMCTT26226,5EAGGMCTC17728,2EAGCMCTT8233,1EAGCMCTC8639,8
EACCMCAA10362,5
alp
ha
1
alp
ha
4
LG03
PAGAMCAT2350,0
CHS326,1
CHS4B30,7
CHS242,2
PACAMCAT30363,1Hl3a8866,6HlGT1767,9HlGA2468,0PAGAMCT16272,0EACCMCTT34176,6
LG04
EAGCMCAC3800,0EACCMCAT937,1PAGAMCAA22210,0EAGCMCAG14612,1HlAGA613,3EAGCMCTC6814,1PAGAMCAA26817,4EACCMCAT21322,0
EACCMCAA26334,7
LG05
PAAMCAC1360,0
PAACMCT10915,8
PAAMCAC45932,0HlGA3134,1
EACGMCTA26954,6
PAGAMCTT15962,9
PAGAMCTT4471,5
LG06
EACCMCTT810,0
EAGCMCT5058,1
PAACMCTC7717,8
HlBrapd30,7
HlAGA738,2
LG07
PAGAMCTC1480,0PAGAMCTC503,5
EAGCMCAT19011,4
PACAMCTA16519,4
PAACMCAC20145,7
LG08
PAGAMCTT1060,0
EAGGMCAC13520,5HlGT1624,7HlAGA425,4
PAGAMCAG18032,4
alp
ha
3
LG09
EAGCMCTC3440,0
EAGCMCT34317,2
PAAMCAC46235,9
LG10
PAACMCAC2470,0
PAACMCT20718,3
PAACMCT34930,0
LG11
EAGGMCAG1140,0
PAGAMCTC36826,5
LG12
EACGMCAT1540,0
PAGAMCAC47720,9
LG13
HCH1B0,0
EAGCMCAT1419,2
LG14

Figure 4: Schematic presentation of male genetic linkage groups for the mapping
population of ‘Magnum’ × ‘2/1’ containing AFLP and microsatellite (marked
bold) markers. Numbers on the left side of the linkage groups indicate genetic
distances in centi-Morgan (cM).

PAACMCT2290,0PAGAMCTC3225,0PAACMCAC767,7PAAMCAC2098,7PAACMCT34410,2EACGMCAT15712,2PAGAMCT22813,7PACAMCTA13915,1PACAMCTA15315,9PAACMCT20416,1PAAMCAC10918,2MHlAGA7
19,6
PAGAMCAA41825,0PAGAMCAT13826,7PAGAMCAG21033,5PACAMCAC10035,5PACAMCAT10040,4PACAMCAT7343,6PACAMCAT11148,0PACAMCAT9850,9
PACAMCAT12258,6
PAGAMCAT18073,8
LG01
PACAMCAT880,0
PAACMCTT11120,1
PAGAMCAT13537,2
PACAMCTA21442,9
PACAMCTA8346,7PACAMCAC38450,9PAACMCTC8651,3PACAMCTA8054,1PAAMCAC5058,3
PACAMCAC28862,1
PACAMCTA9466,8
PAGAMCAC9981,9
LG02
PAAMCAC3270,0
EACCMCAA23619,6Hl7a82EACCMCTT265HlAGA8
22,4
HlGA3122,9HlACA323,3
PAACMCAC36747,4
LG03
EAGGMCTG740,0
EAGGMCTG11614,2EAGGMCTG25416,0EAGGMCTG21616,9
EAGCMCAC10926,1
LG04
PAGAMCAT3150,0
PAACMCT17823,0
PACAMCTA11445,3
PAACMCT32851,0
LG05

PAACMCT490,0
EACCMCTT19027,5HlGT1429,5
PAGAMCTG8235,1
LG06
EACGMCAT1900,0
PACAMCAT13817,8
PAGAMCAT15634,6
PAGAMCAT7354,3
LG07
HlAGA60,0
EAGCMCTA30018,6
LG08
EAGGMCTG2580,0
EAGGMCTG458,5
LG09
EACGMCTA660,0
PAACMCAA21524,4
LG10
HlGA230,0EACCMCAT2791,9
LG11
PAGAMCAC1770,0
PAGAMCAC18022,8
LG12
Copyright © 2022 FDOKUMEN