The native male morphophysiology - Agro Productividad
175
Año 14 • Volumen 14 • Número 8 • agosto, 2021 2030 agenda and its considerations in the framework of artisanal fishing cooperatives in Mexico 13 Conceptual proposal of the landscape as an environmental indicator for the spatial and temporal study of the territory 25 Bacterial diversity with plant growth-promoting potential isolated from Agave americana L., rhizosphere 31 Web-based system for the traceability of cultivated Nile Tilapia based on ISO 12877: 2011 39 Mexican demand for rice imports (Oryza sativa L.) during NAFTA: evidence from a NARDL model with structural change and outliers 47 Probability of Heavy Metals Mobility from Dumped Sediments in a Quarry 57 y más artículos de interés... ISSN: 2594-0252 The native turkey turkey (Meleagris gallopavo): male morphophysiology pág. 3 Colegio de Postgraduados
-
Upload
khangminh22 -
Category
Documents
-
view
0 -
download
0
Transcript of The native male morphophysiology - Agro Productividad
Año 14 • Volumen 14 • Número 8 • agosto, 2021
2030 agenda and its considerations in the framework of artisanal fishing cooperatives in Mexico 13
Conceptual proposal of the landscape as an environmental indicator for the spatial and temporal study of the territory 25
Bacterial diversity with plant growth-promoting potential isolated from Agave americana L., rhizosphere 31
Web-based system for the traceability of cultivated Nile Tilapia based on ISO 12877: 2011 39
Mexican demand for rice imports (Oryza sativa L.) during NAFTA: evidence from a NARDL model with structural change and outliers 47
Probability of Heavy Metals Mobility from Dumped Sediments in a Quarry 57y más artículos de interés...
ISSN: 2594-0252
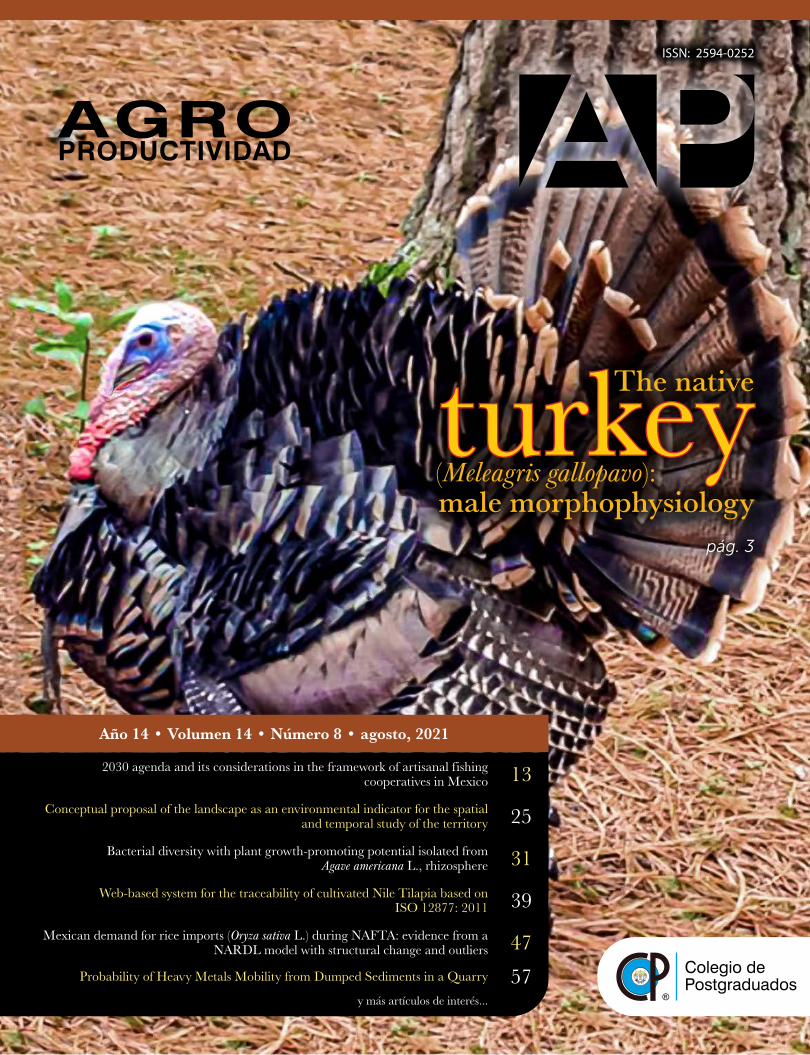
The native turkeyturkey (Meleagris gallopavo): male morphophysiology
pág. 3
Colegio dePostgraduados
Contenido
AGROPRODUCTIVIDAD
®
Año 14 Volumen 14 Número 8 agosto, 2021
3 The native turkey (Meleagris gallopavo): male morphophysiology
13 2030 agenda and its considerations in the framework of artisanal fishing cooperatives in Mexico
25 Conceptual proposal of the landscape as an environmental indicator for the spatial and temporal study of the territory
31 Bacterial diversity with plant growth-promoting potential isolated from Agave americana L., rhizosphere
39 Web-based system for the traceability of cultivated Nile Tilapia based on ISO 12877: 2011
47 Mexican demand for rice imports (Oryza sativa L.) during NAFTA: evidence from a NARDL model with structural change and outliers
57 Probability of Heavy Metals Mobility from Dumped Sediments in a Quarry
71 Morpho-physiological characteristics of corn (Zea mays L.) affected by drought during its vegetative stage
79 Spatial variability of physical, chemical, and biological properties of agricultural soils in Hidalgo State, Mexico
91 Reproductive characterization of the female Mexican turkey (Meleagris gallopavo L.)
103 Evaluation of seminal characteristics of Pelibuey and East Friesian rams at two different times of the year
111 Reproductive Management of the Male Goat: A Review
119 Reproductive management strategies to reduce postpartum anestrus in dual-purpose cattle
127 Suckling and Excess Fat in the Postpartum Reproductive Activity of Hair Sheep
135 Functional Social Organization to Obtain the Region of Origin Cotija Cheese Collective Brand
143 Effect of Coconut Water on Physical Characteristics and Yield of Vanilla planifolia Fruit
151 Involvement of the Interferon Tau Gene in Maternal Recognition of Gestation in Sheep
159 Resistance inducers and organic fertilizer in Citrus sinensis [L.] Osbeck infected with Candidatus Liberibacter asiaticus bacteria
167 Reproductive activity of dairy cattle in the postpartum anestrus period
1AGROPRODUCTIVIDAD
Directrices para Autores/asNaturaleza de los trabajos: Las contribuciones que se reciban para su eventual publicación deben ser resultados originales derivados de un trabajo académico de alto nivel sobre los tópicos presentados en la sección de temática y alcance de la revista.
Extensión y formato: Los artículos deberán estar escritos en proce-sador de textos, con una extensión de 15 cuartillas, tamaño carta con márgenes de 2.5 centímetros, Arial de 12 puntos, interlineado doble, sin espacio entre párrafos. Las páginas deberán estar foliadas desde la primera hasta la última en el margen inferior derecho. La extensión total incluye abordaje textual, bibliografía, gráficas, figuras, imágenes y todo material adicional. Debe evitarse el uso de sangría al inicio de los párrafos. Las secciones principales del artículo deberán escribirse en mayúsculas, negritas y alineadas a la izquierda. Los subtítulos de las secciones se escribirán con mayúsculas sólo la primera letra, negri-tas y alineadas a la izquierda.
Exclusividad: Los trabajos enviados a Agro Productividad deberán ser inéditos y sus autores se comprometen a no someterlos simultánea-mente a la consideración de otras publicaciones; por lo que es necesa-rio adjuntar este documento: Carta de originalidad.
Comité CientíficoDr. Giuseppe CollaUniversity of Tuscia, Italia
0000-0002-3399-3622
Dra. Magaly Sánchez de Chial Universidad de Panamá, Panamá
0000-0002-6393-9299
Dra. Maritza EscalonaUniversidad de Ciego de Ávila, Cuba
0000-0002-8755-6356
Dr. Kazuo WatanabeUniversidad de Tsukuba, Japón
0000-0003-4350-0139
Dra. Ryoko Machida HiranoOrganización Nacional de Investigación en Agricultura y Alimentación (NARO-Japón)
0000-0002-7978-0235
Dr. Ignacio de los Ríos CarmenadoUniversidad Politécnica de Madrid, España
0000-0003-2015-8983
Dra. María de Lourdes Arévalo GalarzaColegio de Postgraduados, México
0000-0003-1474-2200
Dra. Libia Iris Trejo TéllezColegio de Postgraduados, México
0000-0001-8496-2095
Comité EditorialDr. Rafael Rodríguez Montessoro† - Director FundadorDr. Jorge Cadena Iñiguez - Editor en JefeDr. Fernando Carlos Gómez Merino - Editor de secciónDr. Ángel Bravo Vinaja - Curador de metadatosM.A. Ana Luisa Mejia Sandoval - AsistenteM.C. Moisés Quintana Arévalo - Cosechador de metadatosM.C. Valeria Abigail Martínez Sias - DiagramadorLic. Hannah Infante Lagarda - FilologoBiól. Valeria J. Gama Ríos - TraductorTéc. Mario Alejandro Rojas Sánchez - Diseñador
Frecuencia de publicación: Cuando un autor ha publicado en la revista como autor principal o de correspondencia, deberá esperar tres números de ésta para publicar nuevamente como autor principal o de correspondencia.
Idiomas de publicación: Se recibirán textos en inglés con títulos, resúmenes y palabras clave en inglés.
ID Autores: El nombre de los autores se escribirán comenzando con el apellido o apellidos unidos por guion, sólo las iniciales del nombre, separados por comas, con un índice progresivo en su caso. Es indis-pensable que todos y cada uno de los autores proporcionen su núme-ro de identificador normalizado ORCID, para mayor información ingresar a (https://orcid.org).
Institución de adscripción: Es indispensable señalar la institución de adscripción y país de todos y cada uno de los autores, indicando ex-clusivamente la institución de primer nivel, sin recurrir al uso de siglas o acrónimos. Se sugiere recurrir al uso de la herramienta wyta (http://wayta.scielo.org/) de Scielo para evitar el uso incorrecto de nombres de instituciones.
AGROPRODUCTIVIDAD
®
Es responsabilidad del autor el uso de las ilustraciones, el material gráfico y el contenido creado para esta publicación.
Las opiniones expresadas en este documento son de exclusiva responsabilidad de los autores, y no reflejan necesariamente los puntos de vista del Colegio de Postgraduados, de la Edito-rial del Colegio de Postgraduados, ni de la Fundación Cole-gio de Postgraduados en Ciencias Agrícolas.
CCAABB AABBSSTTRRAACCTTSS
CCAABBII
Master Journal List
Año 14, Volumen 14, Número 8, agosto 2021, Agro productividad es una publicación mensual editada por el Colegio de Postgraduados. Carretera México-Texcoco Km. 36.5, Montecillo, Texcoco, Estado de México. CP 56230. Tel. 5959284427. www.colpos.mx. Editor responsable: Dr. Jorge Cadena Iñiguez. Reservas de Derechos al Uso Exclusivo No. 04-2017-031313492200-203. ISSN: 2594-0252, ambos otorgados por el Instituto Nacional del Derecho de Autor. Responsable de la última actualización de este número, M.C. Valeria Abigail Martínez Sias. Fecha de última modificación, 31 de agosto de 2021.
Las opiniones expresadas por los autores no necesariamente ref lejan la postura del editor de la publicación.
Contacto principalJorge Cadena IñiguezGuerrero 9, esquina avenida Hidalgo, C.P. 56220, San Luis Huexotla, Texcoco, Estado de Mé[email protected]
Contacto de [email protected]
Bases de datos de contenido científico Directorios
Colegio dePostgraduados
2 AGROPRODUCTIVIDAD
Anonimato en la identidad de los autores: Los artículos no debe-rán incluir en ni en cuerpo del artículo, ni en las notas a pie de página ninguna información que revele su identidad, esto con el fin de ase-gurar una evaluación anónima por parte de los pares académicos que realizarán el dictamen. Si es preciso, dicha información podrá agre-garse una vez que se acredite el proceso de revisión por pares.
Estructura de los artículos: Los artículos incluirán los siguientes elementos: Título, title, autores y adscripción, abstract, keywords, resumen, palabras clave, introducción, objetivos, materiales y mé-todos, resultados y discusión, conclusiones y literatura citada en for-mato APA.
Título: Debe ser breve y reflejar claramente el contenido, debe-rá estar escrito en español e inglés. Cuando se incluyan nombres científicos deben escribirse en itálicas. No deberá contener abre-viaturas ni exceder de 20 palabras, se usará solo letras mayúsculas, en negritas, centrado y no llevará punto final.Resumen y Abstract: Deberá integrarse un resumen en inglés y español (siguiendo ese orden), de máximo 250 palabras, donde se destaque obligatoriamente y en este orden: a) objetivo; b) diseño / metodología / aproximación; c) resultados; d) limitaciones / impli-caciones; e) hallazgos/ conclusiones. El resumen no deberá incluir citas, referencias bibliográficas, gráficas ni figuras.Palabras clave y Keywords: Se deberá incluir una lista de 3 a 5 palabras clave en español e inglés que permitan identificar el ámbito temático que aborda el artículo.Introducción: Se asentará con claridad el estado actual del co-nocimiento sobre el tema investigado, su justificación e importan-cia, así como los objetivos del trabajo. No deberá ser mayor a dos cuartillas.Materiales y Métodos: Se especificará cómo se llevó a cabo la investigación, incluyendo el tipo de investigación, diseño experi-mental (cuando se traten de investigaciones experimentales), equi-pos, substancias y materiales empleados, métodos, técnicas, proce-dimientos, así como el análisis estadístico de los datos obtenidos.Resultados y Discusión: Puede presentarse en una sola sección. En caso de presentarse de forma separada, la discusión debe enfo-carse a comentar los resultados (sin repetirlos), en términos de sus características mismas, su congruencia con la hipótesis planteada y sus semejanzas o diferencias con resultados de investigaciones similares previamente realizadas.Conclusiones: Son la generalización de los resultados obtenidos; deben ser puntuales, claras y concisas, y no deben llevar discusión, haciendo hincapié en los aspectos nuevos e importantes de los re-sultados obtenidos y que establezcan los parámetros finales de lo observado en el estudio.Agradecimientos: Son opcionales y tendrán un máximo de tres renglones para expresar agradecimientos a personas e institucio-nes que hayan contribuido a la realización del trabajo.Cuadros: Deben ser claros, simples y concisos. Se ubicarán in-mediatamente después del primer párrafo en el que se mencionen o al inicio de la siguiente cuartilla. Los cuadros deben numerarse progresivamente, indicando después de la referencia numérica el título del mismo (Cuadro 1. Título), y se colocarán en la parte superior. Al pie del cuadro se incluirán las aclaraciones a las que se hace mención mediante un índice en el texto incluido en el cuadro. Se recomienda que los cuadros y ecuaciones se preparen con el editor de tablas y ecuaciones del procesador de textos.Uso de siglas y acrónimos: Para el uso de acrónimos y siglas en el texto, la primera vez que se mencionen, se recomienda escri-bir el nombre completo al que corresponde y enseguida colocar la sigla entre paréntesis. Ejemplo: Petróleos Mexicanos (Pemex), después sólo Pemex.Elementos gráficos: Corresponden a dibujos, gráficas, diagra-mas y fotografías. Deben ser claros, simples y concisos. Se ubi-carán inmediatamente después del primer párrafo en el que se mencionen o al inicio de la siguiente cuartilla. Las figuras deben
numerarse progresivamente, indicando después de la referencia numérica el título del mismo (Figura 1. Título), y se colocarán en la parte inferior. Las fotografías deben ser de preferencia a colores y con una resolución de 300 dpi en formato JPG, TIF o RAW. El autor deberá enviar 2 fotografías adicionales para ilustrar la pági-na inicial de su contribución. Las gráficas o diagramas serán en formato de vectores (CDR, EPS, AI, WMF o XLS).Unidades. Las unidades de pesos y medidas usadas serán las aceptadas en el Sistema Internacional.Citas bibliográficas: deberán insertarse en el texto abriendo un paréntesis con el apellido del autor, el año de la publicación y la página, todo separado por comas. Ejemplo (Zheng et al., 2017). El autor puede introducir dos distintos tipos de citas:
Citas directas de menos de 40 palabras: Cuando se transcri-ben textualmente menos de 40 palabras, la cita se coloca entre comillas y al final se añade entre paréntesis el autor, el año y la página. Ejemplo:
Alineado al Plan Nacional de Desarrollo 2013-2018, (DOF, 2013), el Programa Sectorial de Desarrollo Agropecuario, Pesquero y Alimentario 2013-2018 establece “Construir un nuevo rostro del campo sustentado en un sector agroalimenta-rio productivo, competitivo, rentable, sustentable y justo que garantice la seguridad alimentaria del país” (DOF, 2013).
Citas indirectas o paráfrasis: Cuando se interpretan o se co-mentan ideas que son tomadas de otro texto, o bien cuando se expresa el mismo contenido pero con diferente estructura sintácti-ca. En este caso se debe indicar el apellido del autor y el año de la referencia de donde se toman las ideas. Ejemplo:
Los bajos rendimientos del cacao en México, de acuerdo con Avendaño et al. (2011) y Hernández-Gómez et al. (2015); se debe principalmente a la edad avanzada de las plantaciones.
Las referencias bibliográficas: al final del artículo deberán in-dicarse todas y cada una de las fuentes citadas en el cuerpo del texto (incluyendo notas, fuentes de los cuadros, gráficas, mapas, tablas, figuras etcétera). El autor(es) debe revisar cuidadosamente que no haya omisiones ni inconsistencias entre las obras citadas y la bibliografía. Se incluirá en la lista de referencias sólo las obras citadas en el cuerpo y notas del artículo. La bibliografía deberá presentarse estandarizada recurriendo a la norma APA, ordenarse alfabéticamente según los apellidos del autor. De haber dos obras o más del mismo autor, éstas se listan de manera cronológica iniciando con la más antigua. Obras de un mismo autor y año de publicación se les agregará a, b, c… Por ejemplo:
Ogata N. (2003a).Ogata N. (2003b).
Artículo de revista:Wang, P., Zhang, Y., Zhao, L., Mo, B., & Luo, T. (2017). Effect of Gamma Rays on Sophora davidii and Detection of DNA Polymorphism through ISSR Marker [Research article]. https://doi.org/10.1155/2017/8576404
Libro:Turner J. (1972). Freedom to build, dweller control of the housing process. New York: Macmillan.
Uso de gestores bibliográficos: Se dará prioridad a los artí-culos enviados con la bibliografía gestionada electrónicamente, y presentada con la norma APA. Los autores podrán recurrir al uso de cualquier gestor disponible en el mercado (Reference Manager, Crossref o Mendeley entre otros), o de código abierto tal como Refworks o Zotero.

Colegio dePostgraduados
3
The native turkey (Meleagris gallopavo): malemorphophysiologyLópez-Pérez, Elvia1; Gallegos-Sánchez, Jaime2; Pró Martínez Arturo2;
Cuca-García, Juan M.2, Calderón-Sánchez, Francisco3; Herrera-Barragán, José Antonio4*
1 Universidad Autónoma Chapingo. Departamento de Zootecnia. Carretera México-Texcoco km 38.5, Chapingo, Texcoco, Estado de México. C.P. 56230.
2 Colegio de Postgraduados Campus Montecillo. Carretera México-Texcoco km 36.5, Montecillo, Texcoco, Estado de México. C.P. 56230.
3 Colegio de Postgraduados Campus Puebla. Carretera Federal México-Puebla km 125.5, Santiago Momoxpan, Puebla, México. C. P. 72760.
4 Universidad Autónoma Metropolitana Xochimilco. Calzada del Hueso 1100, Villa Quietud, Coyoacán, Ciudad de México. C. P. 04960.
* Corresponding author: [email protected]; [email protected]
ABSTRACTObjective: To describe the morphophysiology and reproductive characteristics of the male turkey.Methodology: An analysis based on the practical experiences from over 10 years with the native Mexican turkey was developed and complemented with literature reports. Results: In Mexico the production management is customs based on traditions and beliefs. In their reproductive morphophysiology, the epididymis absence stands out, as well as a rapid testicular growth during the breeding season, which is controlled by the photoperiod.Limitations of the study: Native turkey farming is practiced in backyard, in marginalized and low-resource areas that have no strategies (nutritional and reproductive) to improve their production.Conclusions: The anatomical, morphological, physiological and reproductive characteristics of the native Mexican turkey were documented. The knowledge on these characteristics will allow to develop feeding and reproductive strategies to improve the productive and reproductive performance of the native turkey and preserve their genetic resources.
Key words: native species, bird, conservation, spermatozoa, Mexican species.
INTRODUCTION Since ancient times, native “guajolotes” (Meleagris gallopavo Linn) were part of the Mexican diet. This bird, one of the most important during the conquest of America, was introduced from Mexico to Spain and from there to other countries, including England, where it is believed that its productive capacity was improved. Later, it returned to America, specifically to North America, where it hybridized with wild species and gave rise to enhanced turkeys (Crawford, 1992). The productive practices for native turkeys are based on customs, traditions and beliefs dating back to the conquest; its breeding is still
Citation: López-Pérez, E., Gallegos-Sánchez, J., Pró- Martínez, A., Cuca-García, J. M., Calderón-Sánchez, F., & Herrera-Barragán, J. A. (2021). The native turkey (Meleagris gallopavo): male morphophysiology. Agro Productividad. https://doi.org/10.32854/agrop.v14i8.2105
Editor in Chief: Dr. Jorge Cadena Iñiguez
Received: February, 2021.Accepted: August, 2021.
Agro Productividad, 14(8). August. 2021. pp: 3-12.
This work is licensed under a Creative Commons Attribution-Non-Commercial 4.0 International license.
4 Agro productividad 2021. https://doi.org/10.32854/agrop.v14i8.2105
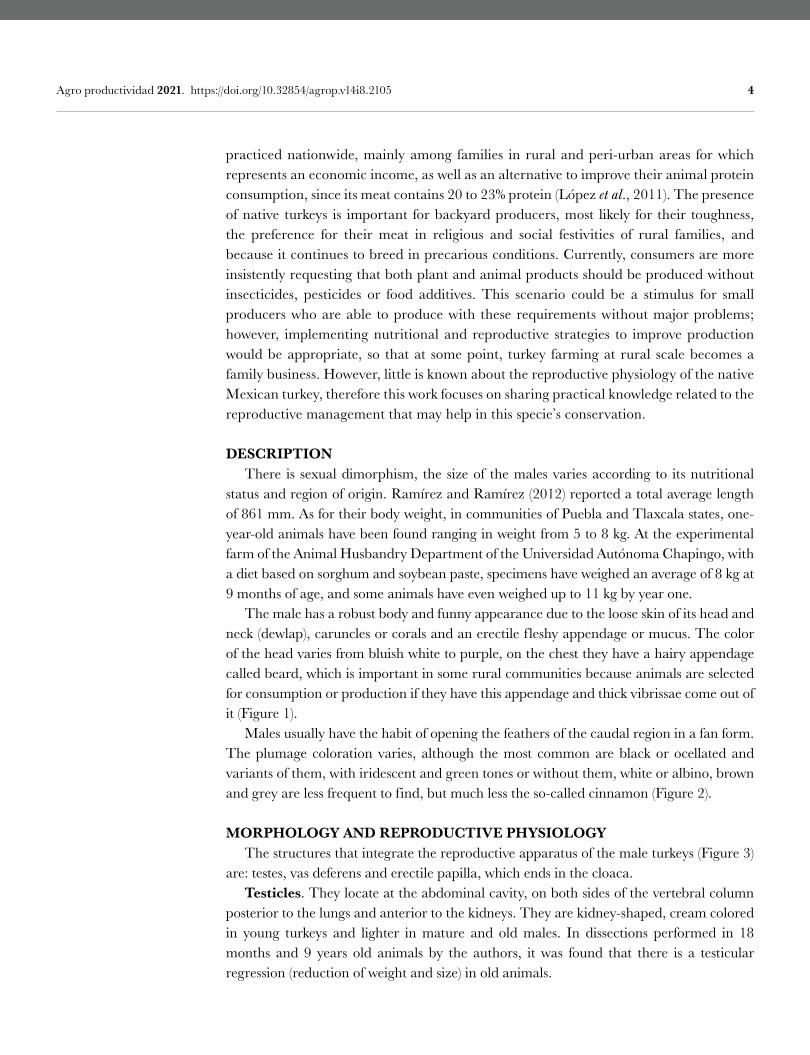
practiced nationwide, mainly among families in rural and peri-urban areas for which represents an economic income, as well as an alternative to improve their animal protein consumption, since its meat contains 20 to 23% protein (López et al., 2011). The presence of native turkeys is important for backyard producers, most likely for their toughness, the preference for their meat in religious and social festivities of rural families, and because it continues to breed in precarious conditions. Currently, consumers are more insistently requesting that both plant and animal products should be produced without insecticides, pesticides or food additives. This scenario could be a stimulus for small producers who are able to produce with these requirements without major problems; however, implementing nutritional and reproductive strategies to improve production would be appropriate, so that at some point, turkey farming at rural scale becomes a family business. However, little is known about the reproductive physiology of the native Mexican turkey, therefore this work focuses on sharing practical knowledge related to the reproductive management that may help in this specie’s conservation.
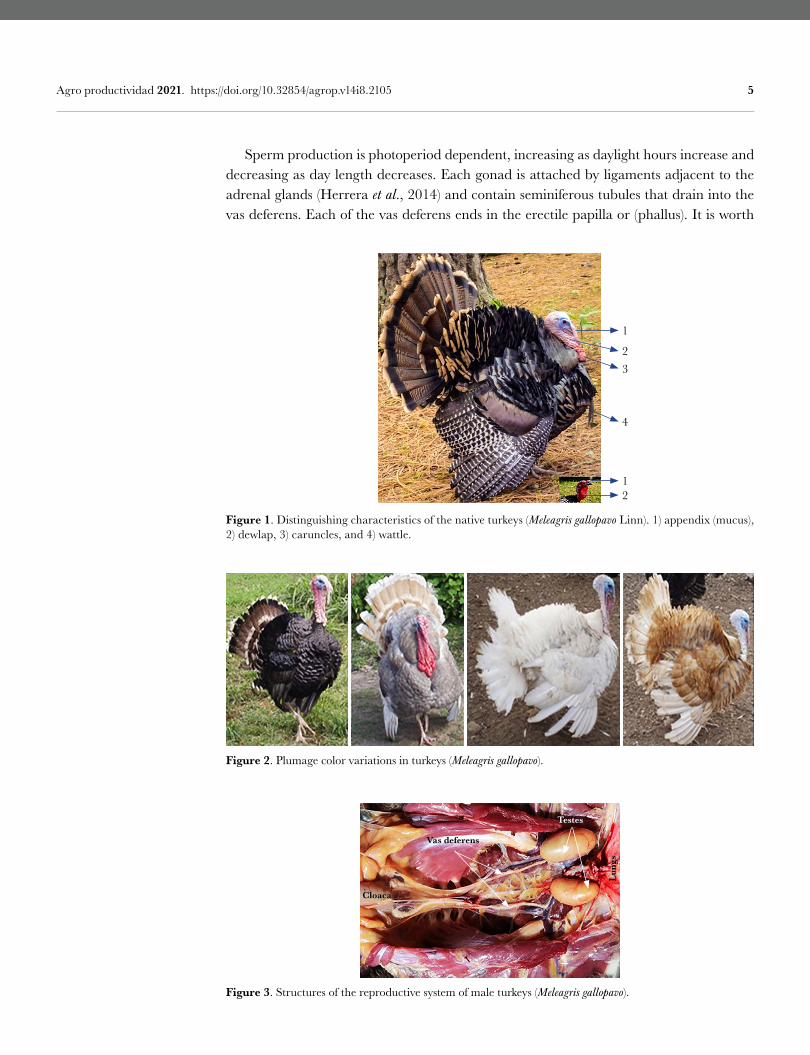
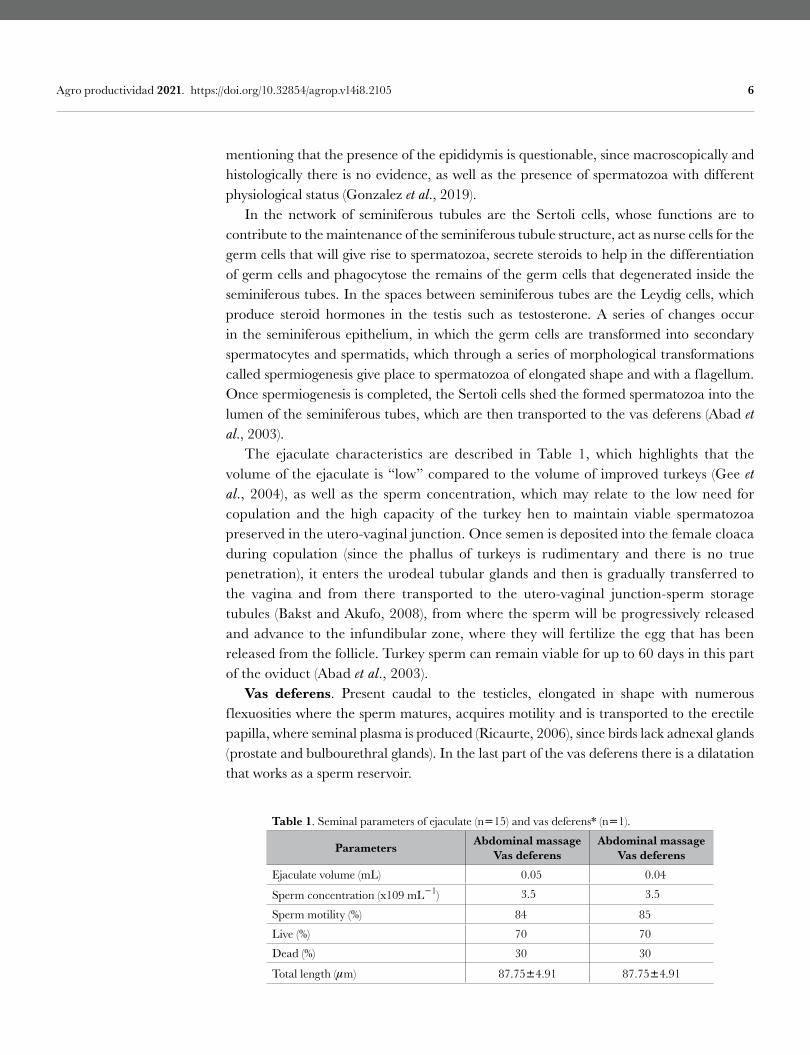
DESCRIPTION There is sexual dimorphism, the size of the males varies according to its nutritional status and region of origin. Ramírez and Ramírez (2012) reported a total average length of 861 mm. As for their body weight, in communities of Puebla and Tlaxcala states, one-year-old animals have been found ranging in weight from 5 to 8 kg. At the experimental farm of the Animal Husbandry Department of the Universidad Autónoma Chapingo, with a diet based on sorghum and soybean paste, specimens have weighed an average of 8 kg at 9 months of age, and some animals have even weighed up to 11 kg by year one. The male has a robust body and funny appearance due to the loose skin of its head and neck (dewlap), caruncles or corals and an erectile fleshy appendage or mucus. The color of the head varies from bluish white to purple, on the chest they have a hairy appendage called beard, which is important in some rural communities because animals are selected for consumption or production if they have this appendage and thick vibrissae come out of it (Figure 1). Males usually have the habit of opening the feathers of the caudal region in a fan form. The plumage coloration varies, although the most common are black or ocellated and variants of them, with iridescent and green tones or without them, white or albino, brown and grey are less frequent to find, but much less the so-called cinnamon (Figure 2).
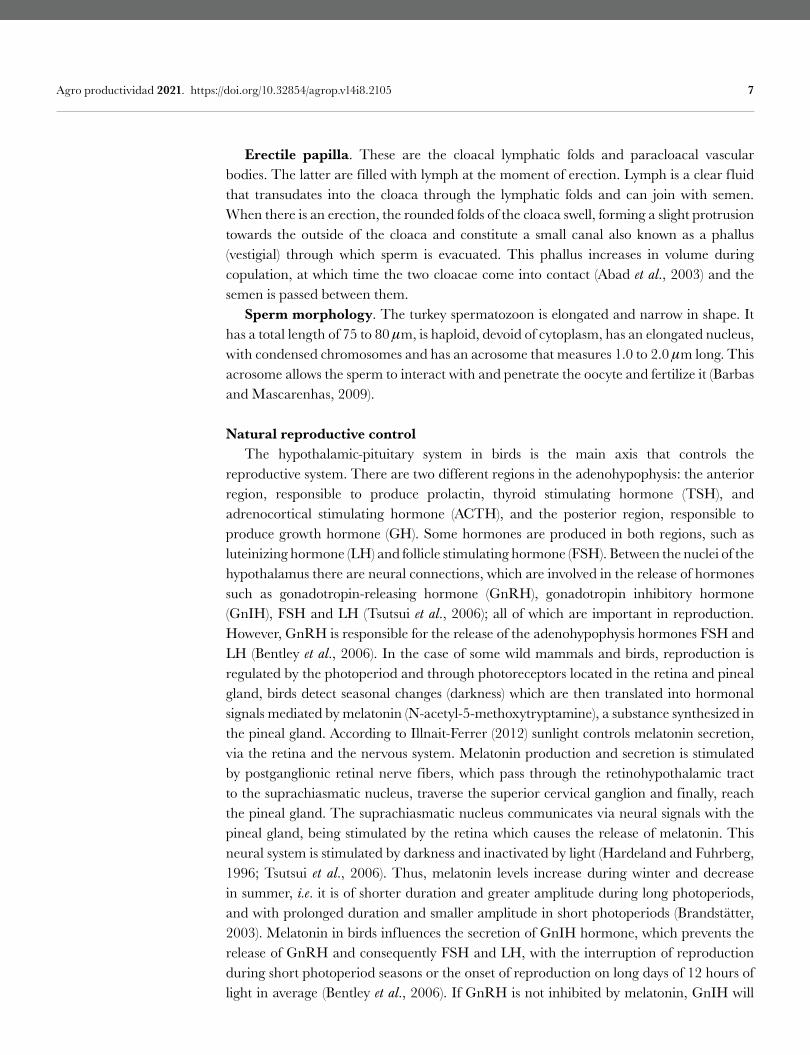
MORPHOLOGY AND REPRODUCTIVE PHYSIOLOGY The structures that integrate the reproductive apparatus of the male turkeys (Figure 3) are: testes, vas deferens and erectile papilla, which ends in the cloaca. Testicles. They locate at the abdominal cavity, on both sides of the vertebral column posterior to the lungs and anterior to the kidneys. They are kidney-shaped, cream colored in young turkeys and lighter in mature and old males. In dissections performed in 18 months and 9 years old animals by the authors, it was found that there is a testicular regression (reduction of weight and size) in old animals.
5 Agro productividad 2021. https://doi.org/10.32854/agrop.v14i8.2105
Sperm production is photoperiod dependent, increasing as daylight hours increase and decreasing as day length decreases. Each gonad is attached by ligaments adjacent to the adrenal glands (Herrera et al., 2014) and contain seminiferous tubules that drain into the vas deferens. Each of the vas deferens ends in the erectile papilla or (phallus). It is worth
Figure 2. Plumage color variations in turkeys (Meleagris gallopavo).
Figure 1. Distinguishing characteristics of the native turkeys (Meleagris gallopavo Linn). 1) appendix (mucus), 2) dewlap, 3) caruncles, and 4) wattle.
1
23
4
12
Figure 3. Structures of the reproductive system of male turkeys (Meleagris gallopavo).
Vas deferens
Testes
Cloaca
Lung
s
6 Agro productividad 2021. https://doi.org/10.32854/agrop.v14i8.2105
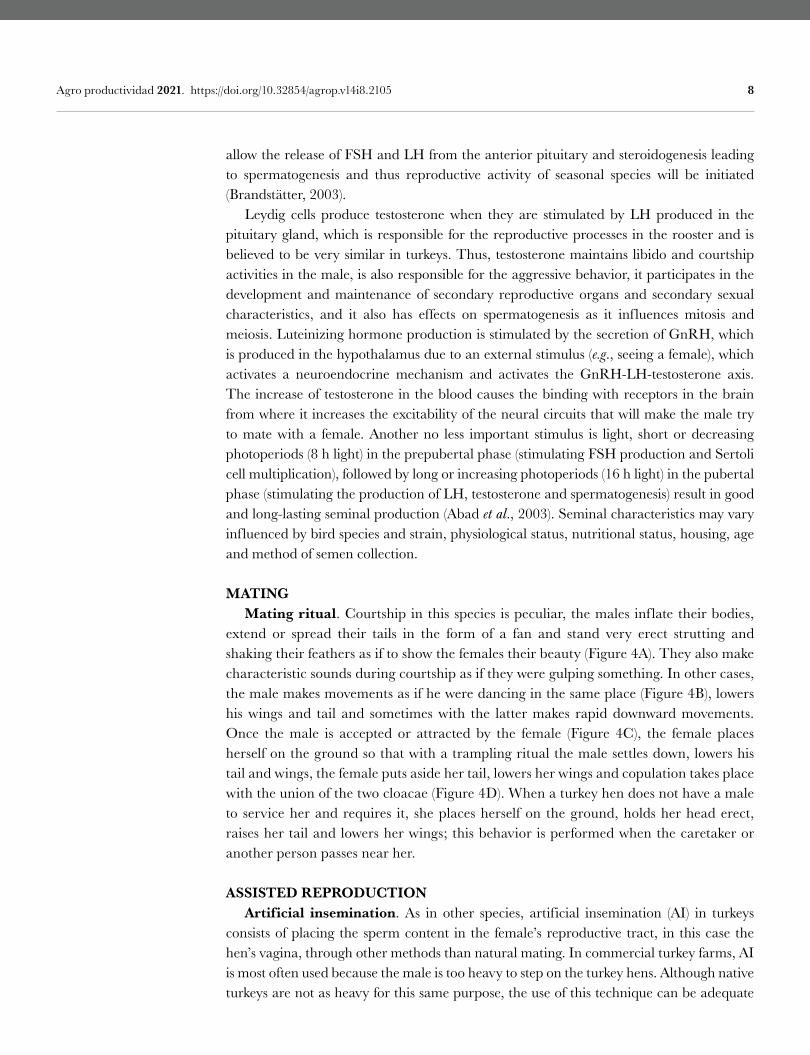
mentioning that the presence of the epididymis is questionable, since macroscopically and histologically there is no evidence, as well as the presence of spermatozoa with different physiological status (Gonzalez et al., 2019). In the network of seminiferous tubules are the Sertoli cells, whose functions are to contribute to the maintenance of the seminiferous tubule structure, act as nurse cells for the germ cells that will give rise to spermatozoa, secrete steroids to help in the differentiation of germ cells and phagocytose the remains of the germ cells that degenerated inside the seminiferous tubes. In the spaces between seminiferous tubes are the Leydig cells, which produce steroid hormones in the testis such as testosterone. A series of changes occur in the seminiferous epithelium, in which the germ cells are transformed into secondary spermatocytes and spermatids, which through a series of morphological transformations called spermiogenesis give place to spermatozoa of elongated shape and with a flagellum. Once spermiogenesis is completed, the Sertoli cells shed the formed spermatozoa into the lumen of the seminiferous tubes, which are then transported to the vas deferens (Abad et al., 2003). The ejaculate characteristics are described in Table 1, which highlights that the volume of the ejaculate is “low” compared to the volume of improved turkeys (Gee et al., 2004), as well as the sperm concentration, which may relate to the low need for copulation and the high capacity of the turkey hen to maintain viable spermatozoa preserved in the utero-vaginal junction. Once semen is deposited into the female cloaca during copulation (since the phallus of turkeys is rudimentary and there is no true penetration), it enters the urodeal tubular glands and then is gradually transferred to the vagina and from there transported to the utero-vaginal junction-sperm storage tubules (Bakst and Akufo, 2008), from where the sperm will be progressively released and advance to the infundibular zone, where they will fertilize the egg that has been released from the follicle. Turkey sperm can remain viable for up to 60 days in this part of the oviduct (Abad et al., 2003). Vas deferens. Present caudal to the testicles, elongated in shape with numerous flexuosities where the sperm matures, acquires motility and is transported to the erectile papilla, where seminal plasma is produced (Ricaurte, 2006), since birds lack adnexal glands (prostate and bulbourethral glands). In the last part of the vas deferens there is a dilatation that works as a sperm reservoir.
Table 1. Seminal parameters of ejaculate (n15) and vas deferens* (n1).
Parameters Abdominal massage Vas deferens
Abdominal massage Vas deferens
Ejaculate volume (mL) 0.05 0.04
Sperm concentration (x109 mL1) 3.5 3.5
Sperm motility (%) 84 85
Live (%) 70 70
Dead (%) 30 30
Total length (m) 87.754.91 87.754.91
7 Agro productividad 2021. https://doi.org/10.32854/agrop.v14i8.2105
Erectile papilla. These are the cloacal lymphatic folds and paracloacal vascular bodies. The latter are filled with lymph at the moment of erection. Lymph is a clear fluid that transudates into the cloaca through the lymphatic folds and can join with semen. When there is an erection, the rounded folds of the cloaca swell, forming a slight protrusion towards the outside of the cloaca and constitute a small canal also known as a phallus (vestigial) through which sperm is evacuated. This phallus increases in volume during copulation, at which time the two cloacae come into contact (Abad et al., 2003) and the semen is passed between them. Sperm morphology. The turkey spermatozoon is elongated and narrow in shape. It has a total length of 75 to 80 m, is haploid, devoid of cytoplasm, has an elongated nucleus, with condensed chromosomes and has an acrosome that measures 1.0 to 2.0 m long. This acrosome allows the sperm to interact with and penetrate the oocyte and fertilize it (Barbas and Mascarenhas, 2009).
Natural reproductive control The hypothalamic-pituitary system in birds is the main axis that controls the reproductive system. There are two different regions in the adenohypophysis: the anterior region, responsible to produce prolactin, thyroid stimulating hormone (TSH), and adrenocortical stimulating hormone (ACTH), and the posterior region, responsible to produce growth hormone (GH). Some hormones are produced in both regions, such as luteinizing hormone (LH) and follicle stimulating hormone (FSH). Between the nuclei of the hypothalamus there are neural connections, which are involved in the release of hormones such as gonadotropin-releasing hormone (GnRH), gonadotropin inhibitory hormone (GnIH), FSH and LH (Tsutsui et al., 2006); all of which are important in reproduction. However, GnRH is responsible for the release of the adenohypophysis hormones FSH and LH (Bentley et al., 2006). In the case of some wild mammals and birds, reproduction is regulated by the photoperiod and through photoreceptors located in the retina and pineal gland, birds detect seasonal changes (darkness) which are then translated into hormonal signals mediated by melatonin (N-acetyl-5-methoxytryptamine), a substance synthesized in the pineal gland. According to Illnait-Ferrer (2012) sunlight controls melatonin secretion, via the retina and the nervous system. Melatonin production and secretion is stimulated by postganglionic retinal nerve fibers, which pass through the retinohypothalamic tract to the suprachiasmatic nucleus, traverse the superior cervical ganglion and finally, reach the pineal gland. The suprachiasmatic nucleus communicates via neural signals with the pineal gland, being stimulated by the retina which causes the release of melatonin. This neural system is stimulated by darkness and inactivated by light (Hardeland and Fuhrberg, 1996; Tsutsui et al., 2006). Thus, melatonin levels increase during winter and decrease in summer, i.e. it is of shorter duration and greater amplitude during long photoperiods, and with prolonged duration and smaller amplitude in short photoperiods (Brandstätter, 2003). Melatonin in birds influences the secretion of GnIH hormone, which prevents the release of GnRH and consequently FSH and LH, with the interruption of reproduction during short photoperiod seasons or the onset of reproduction on long days of 12 hours of light in average (Bentley et al., 2006). If GnRH is not inhibited by melatonin, GnIH will
8 Agro productividad 2021. https://doi.org/10.32854/agrop.v14i8.2105
allow the release of FSH and LH from the anterior pituitary and steroidogenesis leading to spermatogenesis and thus reproductive activity of seasonal species will be initiated (Brandstätter, 2003). Leydig cells produce testosterone when they are stimulated by LH produced in the pituitary gland, which is responsible for the reproductive processes in the rooster and is believed to be very similar in turkeys. Thus, testosterone maintains libido and courtship activities in the male, is also responsible for the aggressive behavior, it participates in the development and maintenance of secondary reproductive organs and secondary sexual characteristics, and it also has effects on spermatogenesis as it influences mitosis and meiosis. Luteinizing hormone production is stimulated by the secretion of GnRH, which is produced in the hypothalamus due to an external stimulus (e.g., seeing a female), which activates a neuroendocrine mechanism and activates the GnRH-LH-testosterone axis. The increase of testosterone in the blood causes the binding with receptors in the brain from where it increases the excitability of the neural circuits that will make the male try to mate with a female. Another no less important stimulus is light, short or decreasing photoperiods (8 h light) in the prepubertal phase (stimulating FSH production and Sertoli cell multiplication), followed by long or increasing photoperiods (16 h light) in the pubertal phase (stimulating the production of LH, testosterone and spermatogenesis) result in good and long-lasting seminal production (Abad et al., 2003). Seminal characteristics may vary influenced by bird species and strain, physiological status, nutritional status, housing, age and method of semen collection.
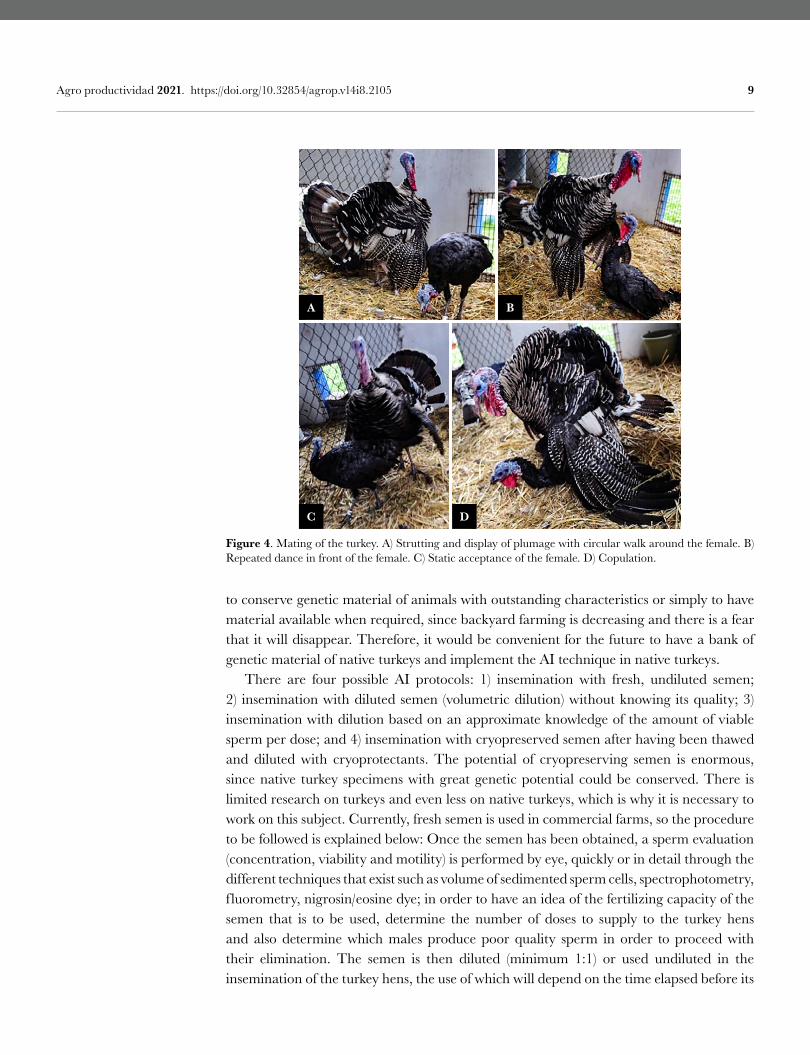
MATING Mating ritual. Courtship in this species is peculiar, the males inf late their bodies, extend or spread their tails in the form of a fan and stand very erect strutting and shaking their feathers as if to show the females their beauty (Figure 4A). They also make characteristic sounds during courtship as if they were gulping something. In other cases, the male makes movements as if he were dancing in the same place (Figure 4B), lowers his wings and tail and sometimes with the latter makes rapid downward movements. Once the male is accepted or attracted by the female (Figure 4C), the female places herself on the ground so that with a trampling ritual the male settles down, lowers his tail and wings, the female puts aside her tail, lowers her wings and copulation takes place with the union of the two cloacae (Figure 4D). When a turkey hen does not have a male to service her and requires it, she places herself on the ground, holds her head erect, raises her tail and lowers her wings; this behavior is performed when the caretaker or another person passes near her.
ASSISTED REPRODUCTION Artificial insemination. As in other species, artificial insemination (AI) in turkeys consists of placing the sperm content in the female’s reproductive tract, in this case the hen’s vagina, through other methods than natural mating. In commercial turkey farms, AI is most often used because the male is too heavy to step on the turkey hens. Although native turkeys are not as heavy for this same purpose, the use of this technique can be adequate
9 Agro productividad 2021. https://doi.org/10.32854/agrop.v14i8.2105
Figure 4. Mating of the turkey. A) Strutting and display of plumage with circular walk around the female. B) Repeated dance in front of the female. C) Static acceptance of the female. D) Copulation.
A B
C D
to conserve genetic material of animals with outstanding characteristics or simply to have material available when required, since backyard farming is decreasing and there is a fear that it will disappear. Therefore, it would be convenient for the future to have a bank of genetic material of native turkeys and implement the AI technique in native turkeys. There are four possible AI protocols: 1) insemination with fresh, undiluted semen; 2) insemination with diluted semen (volumetric dilution) without knowing its quality; 3) insemination with dilution based on an approximate knowledge of the amount of viable sperm per dose; and 4) insemination with cryopreserved semen after having been thawed and diluted with cryoprotectants. The potential of cryopreserving semen is enormous, since native turkey specimens with great genetic potential could be conserved. There is limited research on turkeys and even less on native turkeys, which is why it is necessary to work on this subject. Currently, fresh semen is used in commercial farms, so the procedure to be followed is explained below: Once the semen has been obtained, a sperm evaluation (concentration, viability and motility) is performed by eye, quickly or in detail through the different techniques that exist such as volume of sedimented sperm cells, spectrophotometry, f luorometry, nigrosin/eosine dye; in order to have an idea of the fertilizing capacity of the semen that is to be used, determine the number of doses to supply to the turkey hens and also determine which males produce poor quality sperm in order to proceed with their elimination. The semen is then diluted (minimum 1:1) or used undiluted in the insemination of the turkey hens, the use of which will depend on the time elapsed before its
10 Agro productividad 2021. https://doi.org/10.32854/agrop.v14i8.2105
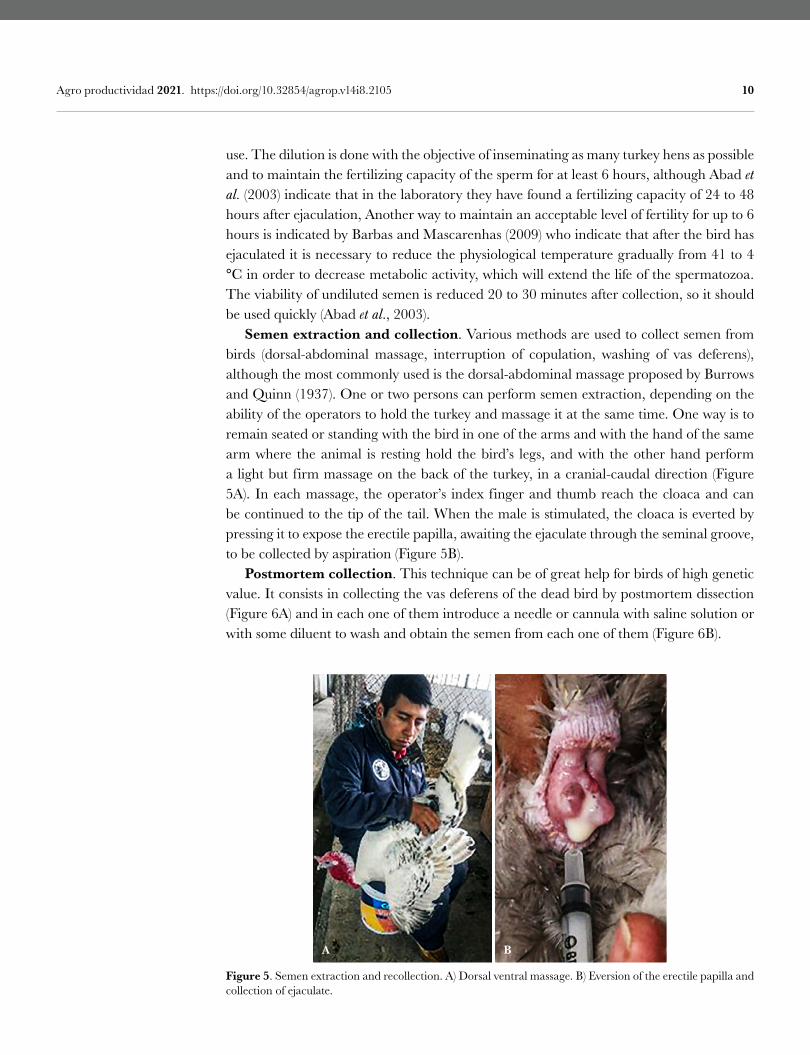
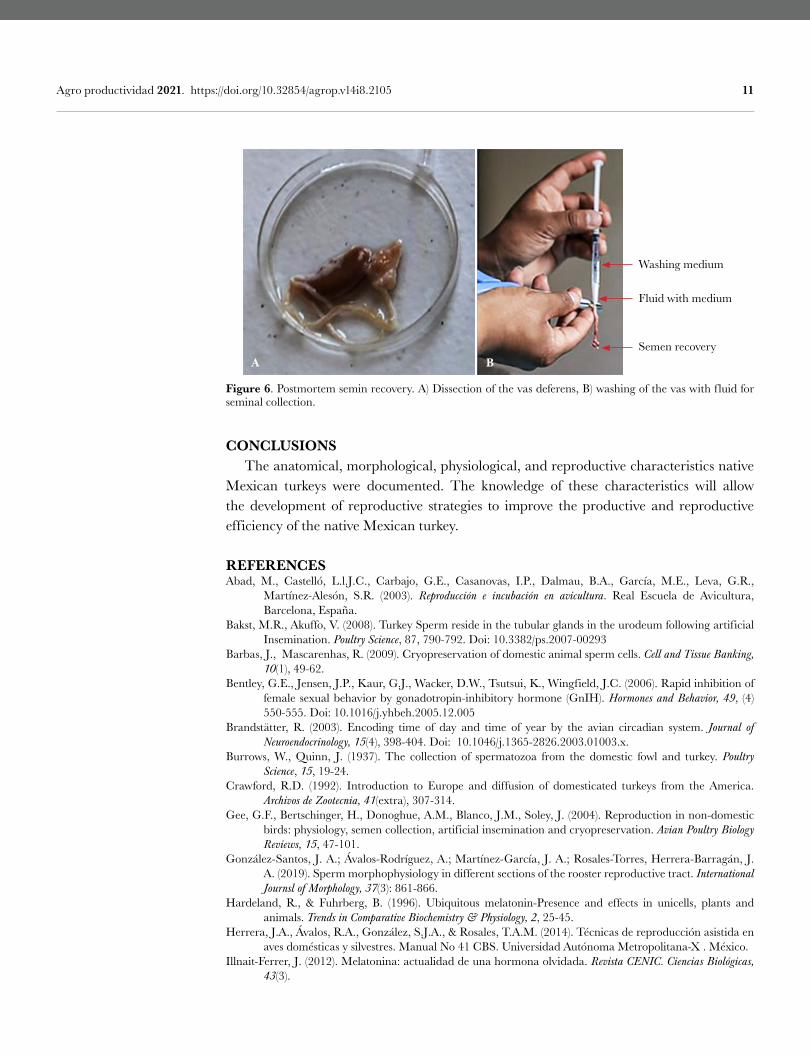
use. The dilution is done with the objective of inseminating as many turkey hens as possible and to maintain the fertilizing capacity of the sperm for at least 6 hours, although Abad et al. (2003) indicate that in the laboratory they have found a fertilizing capacity of 24 to 48 hours after ejaculation, Another way to maintain an acceptable level of fertility for up to 6 hours is indicated by Barbas and Mascarenhas (2009) who indicate that after the bird has ejaculated it is necessary to reduce the physiological temperature gradually from 41 to 4 °C in order to decrease metabolic activity, which will extend the life of the spermatozoa. The viability of undiluted semen is reduced 20 to 30 minutes after collection, so it should be used quickly (Abad et al., 2003). Semen extraction and collection. Various methods are used to collect semen from birds (dorsal-abdominal massage, interruption of copulation, washing of vas deferens), although the most commonly used is the dorsal-abdominal massage proposed by Burrows and Quinn (1937). One or two persons can perform semen extraction, depending on the ability of the operators to hold the turkey and massage it at the same time. One way is to remain seated or standing with the bird in one of the arms and with the hand of the same arm where the animal is resting hold the bird’s legs, and with the other hand perform a light but firm massage on the back of the turkey, in a cranial-caudal direction (Figure 5A). In each massage, the operator’s index finger and thumb reach the cloaca and can be continued to the tip of the tail. When the male is stimulated, the cloaca is everted by pressing it to expose the erectile papilla, awaiting the ejaculate through the seminal groove, to be collected by aspiration (Figure 5B). Postmortem collection. This technique can be of great help for birds of high genetic value. It consists in collecting the vas deferens of the dead bird by postmortem dissection (Figure 6A) and in each one of them introduce a needle or cannula with saline solution or with some diluent to wash and obtain the semen from each one of them (Figure 6B).
Figure 5. Semen extraction and recollection. A) Dorsal ventral massage. B) Eversion of the erectile papilla and collection of ejaculate.
A B
11 Agro productividad 2021. https://doi.org/10.32854/agrop.v14i8.2105
CONCLUSIONS The anatomical, morphological, physiological, and reproductive characteristics native Mexican turkeys were documented. The knowledge of these characteristics will allow the development of reproductive strategies to improve the productive and reproductive efficiency of the native Mexican turkey.
REFERENCESAbad, M., Castelló, L.l.J.C., Carbajo, G.E., Casanovas, I.P., Dalmau, B.A., García, M.E., Leva, G.R.,
Martínez-Alesón, S.R. (2003). Reproducción e incubación en avicultura. Real Escuela de Avicultura, Barcelona, España.
Bakst, M.R., Akuffo, V. (2008). Turkey Sperm reside in the tubular glands in the urodeum following artificial Insemination. Poultry Science, 87, 790-792. Doi: 10.3382/ps.2007-00293
Barbas, J., Mascarenhas, R. (2009). Cryopreservation of domestic animal sperm cells. Cell and Tissue Banking, 10(1), 49-62.
Bentley, G.E., Jensen, J.P., Kaur, G.J., Wacker, D.W., Tsutsui, K., Wingfield, J.C. (2006). Rapid inhibition of female sexual behavior by gonadotropin-inhibitory hormone (GnIH). Hormones and Behavior, 49, (4) 550-555. Doi: 10.1016/j.yhbeh.2005.12.005
Brandstätter, R. (2003). Encoding time of day and time of year by the avian circadian system. Journal of Neuroendocrinology, 15(4), 398-404. Doi: 10.1046/j.1365-2826.2003.01003.x.
Burrows, W., Quinn, J. (1937). The collection of spermatozoa from the domestic fowl and turkey. Poultry Science, 15, 19-24.
Crawford, R.D. (1992). Introduction to Europe and diffusion of domesticated turkeys from the America. Archivos de Zootecnia, 41(extra), 307-314.
Gee, G.F., Bertschinger, H., Donoghue, A.M., Blanco, J.M., Soley, J. (2004). Reproduction in non-domestic birds: physiology, semen collection, artificial insemination and cryopreservation. Avian Poultry Biology Reviews, 15, 47-101.
González-Santos, J. A.; Ávalos-Rodríguez, A.; Martínez-García, J. A.; Rosales-Torres, Herrera-Barragán, J. A. (2019). Sperm morphophysiology in different sections of the rooster reproductive tract. International Journsl of Morphology, 37(3): 861-866.
Hardeland, R., & Fuhrberg, B. (1996). Ubiquitous melatonin-Presence and effects in unicells, plants and animals. Trends in Comparative Biochemistry & Physiology, 2, 25-45.
Herrera, J.A., Ávalos, R.A., González, S.J.A., & Rosales, T.A.M. (2014). Técnicas de reproducción asistida en aves domésticas y silvestres. Manual No 41 CBS. Universidad Autónoma Metropolitana-X . México.
Illnait-Ferrer, J. (2012). Melatonina: actualidad de una hormona olvidada. Revista CENIC. Ciencias Biológicas, 43(3).
Figure 6. Postmortem semin recovery. A) Dissection of the vas deferens, B) washing of the vas with fluid for seminal collection.
Washing medium
Fluid with medium
Semen recovery A B
12 Agro productividad 2021. https://doi.org/10.32854/agrop.v14i8.2105
López, P.E., Uriostegui, R.E., López, P.F., Pro, M.A., Hernández, M.O., Guerrero S.J.I. (2011). Calidad nutricional de pechuga, muslo y pierna de guajolotas y guajolotes nativos mexicanos (Meleagris gallopavo L.). Actas Iberoamericanas de Conservación Animal, 1, 338-341.
Ramírez, C.O.Y., Ramírez, S.E. (2012). Relaciones filogenéticas y morfológicas de poblaciones nativas de guajolotes (Meleagris gallopavo Linn) utilizando marcadores moleculares AFLP`S. [Tesis Profesional. Departamento de Zootecnia. Universidad Autónoma Chapingo]. 51 p.
Ricaurte, G.S.L. (2006). Importancia de un buen manejo de la reproducción en avicultura. Revista Electrónica de Veterinaria 7(4), 1-16.
Tsutsui, K., Ubuka, T., Yin, H., Osugi, T., Ukena, K., Bentley, G.E., Ciccone, N., Inoue, K., Chowdhury, V.S., Sharp, P.J. (2006). Mode of action and functional significance of avian gonadotropin inhibitory hormone (GnIH): a review. Journal of Experimental Zoology Part A: Comparative Experimental Biology, 305(9), 801-806.
Colegio dePostgraduados
13 Image by Quang Nguyen vinh at Pixabay
2030 agenda and its considerations in the framework of artisanal fishing cooperatives in MexicoMagadán-Revelo L. D.1*; Escalona-Maurice M. J.1; Aguilar-Ibarra A.2; Hernández-Juárez M.1
1 Colegio de Postgraduados Campus Montecillo, Posgrado en Socioeconomía, Estadística e Informática–Desarrollo Rural, Carretera México-Texcoco Km. 36.5, Montecillo, Texcoco 56230, Estado de México, México.
2 Instituto de Investigaciones Económicas, Universidad Nacional Autónoma de México, Ciudad de la Investigación en Humanidades, Ciudad Universitaria., 04510 Ciudad de México.
* Corresponding author: [email protected]
ABSTRACTObjective: To analyze the objectives proposed by the UN, linking them in a theoretical and practical way with the real condition of artisanal fishing cooperatives in Mexico, contrasting the theoretical scope of the 2030 Agenda vs. the real praxis of the communities of artisanal fishermen. Design/Methodology/Approach: Through the application of a Participatory Rapid Appraisal Workshop (PRAW) points of the Agenda 2030 were discussed with three artisanal fishing communities in Mexico. The participants learned in a theoretical way the objectives presented by the UN; selected those that in their opinion are important and punctual parts of their fishing activity; and then analyzed these objectives comparing them with their practical daily reality. Results: Conclusions and clarifications were obtained from the social subjects in which it was recognized as a general argument that for the Mexican artisanal fishing cooperatives framework the objectives of the 2030 Agenda are possible as long as the action strategy promotes a cooperative culture with community values and social bonds; respect for their environment and way of life; as well as the sustainability of the ocean as their means of work. Limitations/Implications of the study: the main implication noticed was the enormous importance that exists towards delivering theoretical considerations from international organizations and decision makers, to the social base who operates these proposals. These spaces create discussions that allow the theoretical analysis of practical needs which is mandatory in the social sciences.Findings/Conclusions: The neoliberal globalized economic system is the main disagreement for the 2030 Agenda. The 2030 Agenda encourages developed countries to support under-developed countries with knowledge, technology and investments to achieve sustainability. However, the Agenda does not recognize local knowledge, use forms and customs in those developing countries, as effective operational alternatives.
Keywords: 2030 Agenda, cooperative fisheries, artisanal fishermen, Theory-Practice.
Citation: Magadán-Revelo, L. D., Escalona-Maurice, M. J., Aguilar-Ibarra, A., & Hernández-Juárez M. (2021). The 2030 agenda and its considerations in the framework of artisanal fishing cooperatives in MexicoAgro Productividad. https://doi.org/10.32854/agrop.v14i8.1763
Editor in Chief: Dr. Jorge Cadena Iñiguez
Received: January, 2021.Accepted: July, 2021.
Agro Productividad, 14(8). August. 2021. pp: 13-23.
This work is licensed under a Creative Commons Attribution-Non-Commercial 4.0 International license.
14 Agro productividad 2021. https://doi.org/10.32854/agrop.v14i8.1763
INTRODUCTIONThe 2030 agenda, framework of appearance and objectives The degradation of the planet, the enormous development gaps among countries, the constant increase in violence, the increase in temperatures derived from climate change; and the huge disparity between rich and poor people have motivated the United Nations (UN) discourse, as an organization of global magnitude, to emphasize their efforts into building and encouraging those life situations involved in the sustainable development of our planet, and therefore of the social groups operating in it. During 2015, at the United Nations summit, substantial cohort points were worked on for the future development of the world. The main course was the incorporation of the sustainable development concept as a criterion that would unite the actions, proposals and work of citizens, governments and international organizations in a work agenda that generates the necessary transformations to improve the living conditions of all of us, the people inhabiting the planet. As well as to solve and counteract those environmental conditions as pollution and climate change that afflict everyone today. From September 25th to 27th, 2015 at the UN headquarters in New York, USA, the Resolution of the United Nations General Assembly was approved and signed. The document was named “Transforming Our World: the 2030 Agenda for Sustainable Development” (Girón, 2016). Within those pages, 17 objectives and 169 goals were stated (ONU, 2015); which, if accomplished, would face domestic and global challenges of each country (Álvarez, 2016). Thus, changing those conditions of political restrictions, and economic, social and environmental scarcities of the world. These 17 objectives are organized within a systemic approach, that is, each one of them intervenes and forms an integral part for the implementation of those subsequent. The operation of these objectives and nations’ commitment to implement them may be the change that the world needs in order to participate in a dignified life. Through the redistribution of wealth, termination of hunger, sustainable resource management, and ethic revaluation of citizenship (ONU, 2015). For 15 years after the 2030 Agenda was signed, the core axis guiding the actions of nations should revolve around sustainable growth of under-developed countries within three spheres: economic, social and environmental. Expectations are that the world would take a shift to sustainability for the generations to come. The objectives stated by the 2030 Agenda are translated into actions, possible and plausible operational goals, which are included in the resolution document signed by the participant nations. These goals are defined as the series of steps to follow to achieve an adequate future prospect. Theoretically, the UN (ONU, 2015) mentions that nations should work under the following strategic terms:
People: through the operation of actions to terminate hunger in the world, ending poverty, and securing the integrated development of human beings in every aspect.The planet: avoiding soil and natural resources degradation; and promoting their sustainable and rational use.
15 Agro productividad 2021. https://doi.org/10.32854/agrop.v14i8.1763
Prosperity: promoting a well-being and fulfilling life, striving for economic, social and technological progress, harmonic with nature.Peace: avoiding and eliminating all trace of social and gender violence, in order to favor more just societies.Alliances: under the agreement of global solidarity, nations and international organizations will focus their efforts on the needs of the most vulnerable people, proposing sustainable lifestyles.
The objectives and goals of the Agenda entered into force on January 1, 2016 and these should be achieved in the next 15 years. The deadline for this global development plan is 2030. The circumscribed objectives in this Agenda ought to be of an “integrated and indivisible nature, of global scope and universal application” (UN 2015, p: 15) and those are categorized as follows: 1) to put an end to poverty in all its forms and throughout the world; 2) to terminate hunger, achieving food security, improving nutrition, and promoting sustainable agriculture; 3) to secure healthy lives, promoting well-being at all ages; 4) to ensure inclusive and equitable quality education, facilitating lifelong learning opportunities for everyone; 5) to achieve gender equality empowering all women and girls; 6) to secure availability and sustainable management of water and sanitation for everyone; 7) to guarantee access to affordable, reliable, sustainable and modern energy for all people; 8) to promote sustained, inclusive and sustainable economic growth, through ethic, fulfilling and productive employment for everyone; 9) to build resilient infrastructure, promoting inclusive and sustainable industrialization and fostering innovation; 10) to reduce inequality among and within countries; 11) to make cities and human settlements inclusive, safe, resilient and sustainable; 12) to ensure sustainable production and consumption habits; 13) to take urgent measures to face climate change and its effects; 14) to conserve and sustainably use the oceans, seas and marine resources for sustainable development; 15) to protect, restore and promote sustainable use of inland ecosystems, sustainable forests management, fight against desertification, stopping and reversing land degradation, and halting biodiversity loss; 16) to promote peaceful and inclusive societies for sustainable development, facilitating access to justice for people and building effective and inclusive entities at all levels committed to accountability; and 17) to strengthen the means for goals implementation, revitalizing the Global Partnership for Sustainable Development. All countries, regardless of their development model, need to focus on specific objectives and indicators to achieve their own growth. The international community should support their aspirations. The 2030 Agenda is a useful baseline to guide cooperation and policy coordination (Álvarez, 2016; Girón, 2016).
MATERIALS AND METHODS This research focuses on the analysis generated by three communities of artisanal fishermen in Mexico (Puerto San Carlos, BCS; Santa Cruz de Miramar, Nayarit; and Chapala, Jalisco) regarding the goals of the 2030 Agenda. In each community, Participatory
16 Agro productividad 2021. https://doi.org/10.32854/agrop.v14i8.1763
Rapid Appraisal Workshops (PRAW) were organized for a week with the population dedicated to artisanal fishing. The criteria for participation in the workshops were: 1) to be an active party in artisanal fisheries, 2) to belong to any coastal fishery cooperative; and 3) to have interest and time for their participation. In each locality, groups of 20 social partners met, who analyzed the same document prepared by the UN “Transforming Our World: the 2030 Agenda for Sustainable Development”. Subsequently, those goals that, in the opinion of the participants, denoted greater importance in terms of their immediate reality were selected. After the analysis that was made of each of those selected goals, the participants were encouraged to expose the major problems and disagreements that they perceived between the document and their daily experiences. Afterwards, participants were asked to venture arguments, conclusions, and general opinions either as alternatives to support the achievement of the goals, or as being opposed to them. Finally, the conclusions obtained were generalized and presented to the participants of the workshops to request the validation of an integrating opinion. The findings from the three communities were integrated by constructing a general document where as far as possible the existing relationship between the theory presented in the UN document and the practical reality of individuals living in social base of artisanal fishing was outlined.
The 2030 Agenda key goals for the development of Mexico’s coastal zones and their participation within the fishing cooperatives framework Mexico played an active role in the integration of 2030 Agenda, showing concern in terms of improving the quality of life of national inhabitants. For this, Mexico assumed tacitly by signing the resolution, the commitment to achieve the goals stipulated therein through the active cooperation of the Mexican Government, and national lawful organizations, such as production associations; cooperatives; co-state entities; micro and macro incorporations; international organizations such as the International Monetary Fund (IMF) and the World Bank (WB); as well as the United Nations Development Program (UNDP) (Programa de cooperación AMEXCID-PNUD, 2017). The coastal areas of Mexico and the world are a specific point within the goals set by the 2030 Agenda; particularly represented by the provisions of the aforementioned 14th Goal. The systemic nature of that document invites us to analyze the different objectives that can promote better management of marine and coastal resources; as well as how to increase the quality of life of social partners playing their daily roles near to the coasts.
1) Bringing poverty to end in all its forms in the world: This objective aims to transform citizens by encouraging the means of production and ways of life necessary to move from poverty to an economic stratum that allows them the acquisition of the materials necessary for their subsistence. It establishes the access to economic resources and basic services as a human right. Along with the ownership and control of their lands and other assets; their inheritance and natural resources; the use of appropriate technology and adequate financing to carry out the activity to which they are destined (ONU, 2015). All this with the full participation of the political-regulatory
17 Agro productividad 2021. https://doi.org/10.32854/agrop.v14i8.1763
framework that should provide local, regional, national and international proposals that promote the integrated development of all social partners, focusing as a priority on the sector of the population considered vulnerable. This goal is opposite to the visible struggle for the commons in the coastal regions, which being a focus of tourism growth cause the artisanal fisherman (the most vulnerable class of fishermen) to be uprooted from the necessary natural resources to carry out their activity. Such a condition is a violation of the guarantees provided in the Mexican Constitution Act, which stipulates that sites which concentrate valuable natural or cultural resources are property of the Nation. Thus, the right of collective use by legally constituted civil organizations is a guarantee that the Mexican State should provide (Martínez and Corgos, 2014). This is how a huge problem is observed in which artisanal fishermen are stripped of their traditional work areas, confining them to delimited areas of coastal territory to carry out their activity on lands. Also limiting their extraction access to certain nautical areas and target fishing resources, under what is conferred by the somehow infamous fishing permits. In addition to this, the majority of artisanal fishermen have a low technical level in their fishing infrastructure. A fact that does not allow them to improve the yield and revenue of their activity. The coastal areas of Mexico have a high potential for material reproduction and extraction of resources with high nutritional value (González et al., 2000). If these benefits were launched on the market under an equitable distribution of wealth, valuing the fishing effort, and under proper measures of State regulation, such as warranty prices, the poverty in these areas could be emancipated from society and, in turn, it would contribute to the termination of poverty in other rural and urban areas of Mexico. The role of the Mexican State in order to achieve the objectives of this first goal must be decisive; through improving the regulations established for the use of natural resources, seeking their sustainability through an active and fair work with society. In spite of this, the derivation of natural resources from the domain of the coastal states and the handing over of the usufruct to foreign companies, there was evidence in previous years, that the path of change laid on the incorporation of social partners, not as the direct beneficiaries but as the active labor force (Delgado, 2013). The foregoing is verified in the participation of labor employed in cooperative organizations of coastal fishing, where the interaction role of employer-employee began to diminish the intrinsic bond that a commons cooperative should manifest. That is why the termination of poverty in the fishing communities should extrapolate the relations of labor supremacy that currently occur in the cooperatives, and promote the active, responsible and respectful participation of all partners in the coastal fishery.
2) Terminating hunger, achieving food security, improving nutrition and promoting sustainable agriculture: It is framed as a crucial issue closely linked to poverty eradication, since within its precepts the urgent need to secure the means of production is stated. Thus, guaranteeing the necessary means of life, and promoting access to good nutrition with healthy products.
18 Agro productividad 2021. https://doi.org/10.32854/agrop.v14i8.1763
This objective can be achieved with the support of fish production, since the products obtained by this activity contain a high protein value and are a source of minerals and amino acids (Olivares et al., 2005) necessary for the healthy growth of human beings. However, a marketing plan for seafood must necessarily be established that links the production process with final consumption, and thereby secure the equitable distribution of the wealth generated by fishing (Rubio, 2000). That would give to the producers an opportunity of obtaining a profit for the product offered, also contributing to decrease the purchase prices for the final consumer. Active participation on the maritime extraction to achieve the referred goals in this objective was considered in the Mexico’s National Development Plan 2013-2018, which mentions the need to consolidate a sustainable fishing development, as well as fishermen’s participation of fishing resources within their family diet, as an excellent source of high quality nutrients (Gobierno de la República, 2013). Unfortunately, this document does not state how and under what circumstances the current fisheries management shall move towards sustainable fishing.
6) Securing the availability and sustainable management of water and sanitation for everyone At this point it is necessary to discuss of the increasing pollution to which our continental and maritime bodies of water are subjected. The use of water resources is of vital importance to sustain life and for the development of every kind of economic activity. Water for human consumption has become a scarce commodity over some time and future prospects are not encouraging. That is why citizens, private companies and governments must act and face the water problems. To stop contaminating lakes and aquifers, as well as the dumping of biological and chemical waste into rivers and estuarine water bodies, directly connected with seas and oceans. To guarantee the access to drinking water is not only established as a social benefit; maintaining available sources of fresh water shows respect to the value of biodiversity. In that way this also contributes to the preservation of natural resources, improving the quality of life on the planet. In many coastal areas of Mexico and their continental sea extent, fish production has diminished due to the problem of pollutants that are dumped daily into the sea. Fish products may become contaminated with toxic elements such as heavy metals (Funes et al., 2007). In addition to the problems of mortality of big marine species or their migration to other parts of the ocean, which make the capture of target species inaccessible for the artisanal fisherman (Perry et al., 2010). Thus, protecting the planet ecosystems through international cooperation and promoting good practices for conservation become prioritized goals for global welfare (ONU, 2015).
7) Guaranteeing access to affordable, reliable, sustainable and modern energy for all people In addition to the objective of sanitation, it is essential to find environmentally friendly forms of energy that promote the proper development of economic activities, without
19 Agro productividad 2021. https://doi.org/10.32854/agrop.v14i8.1763
jeopardizing the socio-environmental balance of the planet (Naredo, 1999). That is why the seventh goal of the agenda is crucial for all economic sectors of production. Sustainable practices have been motivated in the fishing activity; as well as the use of efficient technology that mitigates and counteracts the effects of contamination by hydrocarbons and oils in the Mexican seas. The supply of ecological outboard motors has been a measure adopted by the Mexican government, which provides the coastal cooperative member with an option for technological innovation that encourages fuel savings, contributing to avoid atmospheric and ocean pollution (Beltrán and Magadán, 2010). However, equipping the bay fleet with environmentally friendly technology is a daunting task due to the large population dedicated to this activity. But this is the main way that the Mexican government has adopted with the aim to mitigate pollution by fossil fuels discharged into marine ecosystems.
8) Promoting sustained, inclusive and sustainable economic growth, full and productive employment, and decent work for everyone This goal pays attention to the growing needs that under-developed countries have to seek sources of employment for their citizens. The governmental revaluation of the work itself as a means of production and social welfare. Salary obtained from work should provide the full maintenance of families, fulfilling their basic needs and giving economic security to people and society. It is necessary then, to promote public, micro and macroeconomic policies for national and foreign investment, which promote the generation of activities in the three main production sectors. Technological development and the implementation of regulations to legislate and promote good practices and relations at work are a framework that nations should promote. In the shoreline fishing activity in Mexico, the impact that this objective would have within the fishing production cooperatives would be expressed in the incorporation of social security for their active members. Cooperative organizations are present in the legal framework of Mexican Constitution Act. Social association and unions can promote for their members and for other workers who provide their workforce, improvements in labor relations that allow medical security and funds for retirement at old ages. The creation of public policies considering perceptions of the coastal fishermen population might be focused and emphasized on specific applications and target objectives at each fishing region within the Mexican State (Buhaya and Ramirez, 2013). This derives from the multifaceted way in which coastal fishing activity is carried out in Mexico. The granting of fishing permits as well as the incorporation of good community practices for social development are some of the activities that should be integrated into the operation management plan of cooperative organizations. On the other hand, to habilitate a political-social link would guarantee a full development of the activity, fostering the appropriate geographical spaces and means. Linking the cooperative fishing work to the tourist activities that are promoted in the coastal regions could expand the benefits of a sector as vulnerable as the coastal fisherman, incorporate their work capacity to the implementation of tourism activities as well as to the supply of
20 Agro productividad 2021. https://doi.org/10.32854/agrop.v14i8.1763
food services and maritime transport can promote the economic development of both production sectors. Likewise, financial institutions must procure the supply of working capital necessary to initialize the fishing activity and this must be repeated until the artisanal fisherman can capitalize their investment and apply it in an emancipated way. The cooperative has access to these credit benefits in a more viable way, however, it must provide the cooperative partner with the necessary education to be able to adequately manage the cash flow and thus change the vision of permanent indebtedness in investments for the sustainable development of activity.
12) Ensuring sustainable consumption and production patterns Both internal and external economic exchange, within the increasing neoliberalism framework, have shown restraints and delimitation of areas of commercial influence linked to primary producers. The necessary economic measures should be implemented to promote an efficient transit between producer and consumer. It is necessary to create public policies that minimize the actions of intermediaries (middlemen); seeking towards a fair price for fishing (Moyano, 2011) would greatly improve both the profit received by coastal fishermen and the acquisition price for the final consumer. The commercial transit of fish species would lead to a greater domestic demand of fish, which would help improving nutritional values for citizens, and the livelihood of coastal fishermen. This exchange of merchandise should be monitored according to its extent, through guarantee prices that factually add to the income of the shoreline or inland fishery producer. The active participation of coastal and inland fishing cooperatives in Mexico must be consolidated into the search for points of sale close to final consumers, avoiding intermediaries. On the other hand, the incorporation of added value to seafood is another course of action into which cooperatives can guide their activities. By that means, cooperatives would promote the incorporation of their own labor force within their community; thus, allowing the revaluation of the economic product offered.
13) Taking urgent measures to face climate change and its effects This objective could be achieved with the implementation of regulatory measures that reduce the use of fossil fuels and encourage the generation and use of alternative energies that are more environmentally friendly. All the above must be materialized through a strategic planning from the State that allows the incorporation of new technologies, linking environmental education with business and civil action. Counteracting climate would favor coastal areas thoroughly. Coastline regions are prone to disappearing due to global warming and the melting of the poles. The marine currents have shown an imbalance induced by the increase in ocean temperatures, causing hurricanes and phenomena such as El Niño and La Niña phases of the ENSO to become more violent; and affecting the environment and way of life of the people who inhabit the coasts. The increase of toxic waste discharged into the oceans has resulted in acidification
21 Agro productividad 2021. https://doi.org/10.32854/agrop.v14i8.1763
of marine ecosystems, killing or causing migration of some marine organisms (Álvarez et al., 2017). Some of those belong to the inventory of target species for coastal or inland fishermen.
14) Conserving and sustainably using the oceans, seas and marine resources for sustainable development This objective of the 2030 Agenda safeguards coastal areas and fishing cooperatives in Mexico. It is noteworthy that in the 2030 Agenda this aim has been framed as a particular target on improving the management of oceans, recognizing the paramount importance that these ecosystems have towards the sustainable development of the environment. A crucial point is to significantly reduce the pollution of the seas, since the biological development of the species that those ecosystems sustain depends on that reduction. Along coastal areas, or in deltas of rivers and streams, the bond shared between sea and land becomes a point of concentration of pollutants as all waste products from the inland will end up in water bodies and these in turn to marine areas. Proper waste management, as well as changing the conditions of use, reuse and recycling can strongly favor the reduction of pollutants discharged into the seas (Álvarez et al., 2017). Another extremely important aspect is to regulate fishing exploitation with efficient measures and regulations. Fishing cooperatives in Mexico emerged as a means of State control to ensure legitimacy and management of the resources extracted from the Mexican coasts. These regulations should be complemented by incorporating plans for fishing moratorium and catch quotas because, in a historical moment, the fishing cooperatives witnessed that the fishing effort was exponentially increased on certain targeted species. This caused a severe deficit in the populations of those organisms; it was the origin of the subsequent set of productive and economic problems that currently are present in the activity. That is why efficient regulation through the co-management of resources can offer Mexican artisanal fisheries a forceful way to avoid overexploitation. In the same way, it would serve as a point of cohesion by which fishermen can participate in the care of their resources, thus reducing illegal fishing and wrong practices in the development of their activity, also implementing the use of incidental fishing gear. The scientific community should be a participant in these efforts by promoting constant studies and monitoring in marine areas; conducting specific research that can contribute to restore the health of the oceans and their sustainable development. Scientific support should be framed within the directions and guidelines of the Transfer of Marine Technology of UNESCO’s Intergovernmental Oceanographic Commission (ONU, 2015). On the other hand, in Mexico the work of scientific research has been disconnected from fishing resources due to budget cuts and the decentralization of institutions dedicated to the study of fishing in Mexico (Villamar et al., 2007), a situation that must be reversed in order to achieve one of the goals present in this objective. The good management of marine resources is an integral part of the commercial cycle that they have within the Mexican market. Then making real the need to seek out effective
22 Agro productividad 2021. https://doi.org/10.32854/agrop.v14i8.1763
marketing channels that promote a fair exchange between the fishing activity, and the consumption of the derived products. The intervention of the federation and of the states, and even of international entities as financial development agencies should support fishing activity. This may be accomplished by directing it towards the acquisition and use of technologies that promote a healthy development. As well as establishing the specific infrastructure necessary in each extractive zone; thereby encouraging the sustainable development of coastal and inland fishing activity in Mexico. Within the international legal framework, all activities, regulations and adjustments made by nations must be subject to and submitted to the general document issued by the United Nations Convention on the Law of the Sea (ONU, 2015) which serves as a legal framework for development of this activity. Access to the sea by fishing communities is a customary right directed by traditional uses and customs. That is why to a large extent the activity carried out by shoreline fishermen must be respected and revalued. This access must be regulated and delimited, but never restrictive or detrimental to the livelihood of coastal fishermen. In addition to this, it is necessary to legitimize access to a way of life that meets the basic needs of people. To implement cooperative organizations, that promote community development and social bond within communities, strengthens sustainable development on the three guiding axes in the 2030 Agenda.
CONCLUSION The cited objectives of the 2030 Agenda discussed here are those that, in the opinion and experience of the fishermen, and through the eyes of the researcher, circumscribe the actions of cooperative fishing organizations in Mexico. The integrating character that the Agenda promotes is a huge step in the understanding of the world as a systemic subject-object. As a guideline, the 2030 Agenda offers a path towards improving the world in which we live. However, for these actions to be carried out globally, a series of intrinsic alliances must be presented between developed countries and those under develop, an action that will serve as the engine to achieve the Goals outlined by the Agenda. The globalized neoliberal economic system is the first checkpoint that is presented, since by mentioning the support, subsidies and investments made by the developed countries, it seems to promulgate the overthrow of the national autonomy of the developing countries. Efforts should be focused to provide the appropriate technological knowledge to avoid the use of polluting energies (what would increase the quality of life in the entire planet). But at the same time, the common uses and customs, as well as the local knowledge in each nation, must be recognized to encourage their people participation as an alternative route for effective development. For the Mexican fishing cooperatives, the course of the objectives is plausible as long as the action strategy promotes a cooperative culture full of community values and social bonds. Along with respect for their environment and way of life, as well as for their work environment and object, the oceans. Cooperative education must be a key element for the sustainable development of coastal areas.
23 Agro productividad 2021. https://doi.org/10.32854/agrop.v14i8.1763
On the other hand, the creation of an efficient and reliable fishing regulation that starts from the very structure of the State is a crucial point for the proper development of the commercial activities derived from fishing, as well as it is legality and access to fishing resources. To this end, the involvement of cooperative members, freelance and permit fishermen, is mandatory; including these key subjects in those proposals and development models, which have the possibility to be applied in their working areas.
REFERENCESÁlvarez, A. M. (2016). Retos de América Latina: Agenda para el Desarrollo Sostenible y Negociaciones del
siglo XXI. Problemas del Desarrollo. Revista Latinoamericana de Economía, 47(186), 9–30.Álvarez, M., Arias, A., Lorenzo, M., Serrallé, F. (2017). Educación para la Sustentabilidad: Cambio Global y
Acidificación Oceánica. Formación Universitaria, 10(2), 89–102.Beltrán Espinosa, E., Magadán Revelo, L. D. (2010). Cooperativismo pesquero en la comunidad La Reforma
Sinaloa, caso de la pesca artesanal. Universidad Autónoma Chapingo.Buhaya, D., Ramírez, H. (2013). Análisis de impacto de políticas públicas para el desarrollo local en
comunidades costeras y rurales: El caso de la pesca en San Blas, Nayarit. RIDE Revista Iberoamericana para la Investigación y el Desarrollo Educativo, 3(6), 24–43.
Delgado Ramírez, C. E. (2013). La pesca ribereña en el contexto económico capitalista. Apuntes sobre una propuesta de análisis. En G. C. Váldez Gardea, M. S. Galindo Bect, (coords.), Pesquerías globalizadas (pp. 203–221). Hermosillo: El Colegio de Sonora y Universidad Autónoma de Baja California.
Funes Rodríguez, R., Gómez Gutiérrez, J., Palomares García, R. (2007). Estudios ecológicos en Bahía Magdalena (1era ed.). México: Centro de Investigaciones Biológicas del Noroeste, S.C. e Instituto Politécnico Nacional Centro Interdisciplinario de Ciencias Marinas.
Girón, A. (2016). Objetivos del Desarrollo Sostenible y la Agenda 2030: Frente a las políticas públicas y los cambios de gobierno en América Latina. Problemas del Desarrollo. Revista Latinoamericana de Economía, 47(186), 3-8.
González Becerril, A., Espino Barr, E., Cruz Romero, M., Ruiz Luna, A. (2000). Determinación de la unidad de esfuerzo de pesca en una pesquería artesanal ribereña en Manzanillo, Colima, México. Ciencias Marinas, 26(1), 113–124.
Martínez González, P., Corgos López-Prado, A. (2014). La pesca artesanal en Jalisco. Conflictos en torno a la conservación biocultural y la reproducción del capital. El caso de Careyitos. Sociedad y Ambiente, 1(4), 23–38. Doi: 10.31840/sya.v0i4.1522
Moyano, P. (2011). La adaptación del Sistema Nacional de Incentivos Regionales a la Ley para el Desarrollo Sostenible del Medio Rural. Estudios de Economía Aplicada, 29(1), 95–128. Doi: 10.25115/eea.v29i1.3934
Olivares, S., Zacarías, I., Lera, L., Bárbara, L., Durán, R., y Vio del R, F. (2005). Estado nutricional y consumo de alimentos seleccionados en escolares de la región metropolitana: línea base para un proyecto de promoción del consumo de pescado. Revista Chilena de Nutrición, 32(2), 12–22.
ONU. (2015). Transformar nuestro mundo: la Agenda 2030 para el Desarrollo Sostenible. New York.Programa de cooperación amexcid-pnud. (2017). Buenas prácticas de cooperación internacional para el desarrollo
entre el sistema de las Naciones Unidas y el Gobierno Mexicano.Villamar Calderón, A., Aburto Perdomo, D., Fernández Méndez, J. I., Vázquez, Á., y Rojas Carrillo, P. (2007).
Políticas para el fomento de la producción pesquera y acuícola. En J. L. Calva (Ed.), Agenda para el desarrollo. Desarrollo agropecuario, forestal y pesquero (Vol. 9). México: UNAM, Miguel Ángel Porrúa y Cámara de Diputados.

Colegio dePostgraduados
25
Conceptual proposal of the landscape as an environmental indicator for the spatial and temporal study of the territoryJiménez-Moreno, María Josefa1; Escalona-Maurice, Miguel J.2*; Rodríguez-Laguna, Rodrigo3;
Razo-Zarate, Ramón3; Acevedo-Sandoval, Otilio. A.3
1 Instituto de Ciencias Básicas e Ingenierías, Universidad Autónoma del Estado de Hidalgo, México. 2 Desarrollo Rural, Campus Montecillo, Colegio de Posgraduados, Carretera. Estado de México. 3 Instituto de Ciencias Agropecuarias, Universidad Autónoma del Estado de Hidalgo, Tulancingo de Bravo,
Hidalgo, México.* Corresponding author: [email protected]
ABSTRACTObjective: To propose the landscape as an environmental indicator that spatially and temporally, describes, analyzes, and evaluates territory, by changing some natural, social, economic, and cultural components. Approach: Different methodological concepts of the landscape and environmental indicators were reviewed, as well as their characteristics to describe and evaluate the environment.Results: It was found that the landscape is a comprehensive analysis method for the study of the environment, by selecting the parameters that describe and represent each landscape, through shapes, size, colors, textures, shadows, patterns, situations, associated features, and structures arranged under a spatial and temporal order which, when perceived by humans, present a given form of organization or disorganization in the environment.Implications: The environmental indicator allows to analyze and evaluate the changes in space and time, with updated qualitative and quantitative research. These changes play an important role in building the perception of environmental problems through the landscape.Conclusion: Landscape is an integral component that describes the biotic and abiotic elements of a given space. While, as an environmental indicator, it analyzes and evaluates changes in the composition and configuration of the environment, both spatially and temporally.
Keywords: ecosystem, natural resources, territory.
INTRODUCTION Landscape is the image that humans perceive of their environment; as well, it is a natural resource able to be used (Rodríguez et al., 2013), which describes the integration of the spatial and temporal characteristics of the elements of nature (Allan et al., 2015; Jiménez et al., 2019). While an environmental indicator is the key instrument for planning natural resources that assesses the environmental, social, economic (He et al., 2011; Walz, 2015) and even cultural aspects, that determine the current condition of a particular ecosystem.
Citation: Jiménez-Moreno, María J., Escalona-Maurice, M. J., Rodríguez-Laguna, R., Razo-Zarate, R., & Acevedo-Sandoval, O. A. (2021). Conceptual proposal of the landscape as an environmental indicator for the spatial and temporal study of the territory. Agro Productividad https://doi.org/10.32854/agrop.v14i8.1782
Editor in Chief: Dr. Jorge Cadena Iñiguez
Received: February, 2021.Accepted: July, 2021.
Agro Productividad, 14(8). August. 2021. pp: 25-30.
This work is licensed under a Creative Commons Attribution-Non-Commercial 4.0 International license.
Image by Jörg Peter at Pixabay 25
26 Agro productividad 2021. https://doi.org/10.32854/agrop.v14i8.1782
The importance of the information obtained from the landscape is since any change in the composition and configuration of the environment may be used as an environmental indicator (Alphan, 2017), through qualitative (Delphi method, interviews, etc.) and quantitative (biodiversity models, regression, indices, etc.) techniques (Matovnikov and Matovnikova, 2016; Jiménez et al., 2019). Changes in landscapes are solid environmental indicators about mainly anthropogenic disturbances that should be monitored for decision-making. Thus, explaining the conditions and interactions of physical changes and social aspects of each element forming a place in a given time (Ginzarly et al., 2019). Therefore, a space-temporal environmental indicator studies, understands and evaluates the condition of the territory ( Jiménez et al., 2019). Based on the above, the objective was to propose the concept of landscape as an environmental indicator for the spatial and temporal study of territory. By the diversity of characteristics, it presents to describe, analyze, and evaluate the composition and configuration of an ecosystem. This is an analytical and comprehensively methodological process.
Conceptual analysis of landscape and environmental indicator Landscape. It is a set of natural and cultural phenomena that describe the extension of a territory and provide information (Cruz-Medoza, 2018). They are complex systems, subject to rapid and extensive changes due to human activities affecting the environment (Alphan, 2017; Ginzarly et al., 2019). Recent studies (He et al., 2011; Zhang et al., 2019) conceptualized landscape as the environmental factor linked to the subjective experience of analysis of a place that is characterized by positive and negative elements. Other authors (Walz, 2015; Cruz-Mendoza, 2018) consider the landscape as the integral and visual external expression of an ecosystem. This perception is produced on the environmental system, in a subjective and variable way through all senses of direct and indirect appreciation, which operate in the observer, for example: sight, hearing, smell, touch, among others. And, based on perceptual experience of the individual classification and valuation of each landscape is determined by relating a person with their space, which sets out the role of the landscape as an environmental indicator (Schindler et al., 2014; Ginzarly et al., 2019). Landscape is a real, complex, and dynamic fact that exists in the earth’s surface, the nature and characteristics are independent of the meaning attributed to it by human beings, through shapes, sizes, colors, textures, shadows, patterns, situations, associated features, and structures arranged under a spatial and temporal order. Which, perceived by a human present a given form of organization or disorganization in the environment (Matovnikov and Matovnikova, 2016; Cruz-Mendoza, 2018). Consequently, human activity and the scenery of social life in each landscape is interpreted by the interactions between the biotic and abiotic elements of the natural environment (Alphan, 2017). Reason why landscapes are the consequence of natural and social evolution through time (Walz, 2015).
27 Agro productividad 2021. https://doi.org/10.32854/agrop.v14i8.1782
Environmental indicator. It is a parameter that provides information, data, comparisons, and it evaluates situations of a place at a given time (Shul’kin et al., 2017), evidencing the impact of human beings on the biophysical and socioeconomic environment. For this reason, they are fundamental at the international, national, regional, and local levels, to describe and evaluate the consequences of human development (Rodríguez et al., 2013). Environmental indicators provide useful information for planning and environmental assessment (Alphan, 2017; Gao et al., 2017; Luo et al., 2017), constitute a basic tool of information and monitoring of the processes occurring in the environment, in social and economic aspects. It explains the status and trends of natural resources in order to manage and formulate policies for programs aiming at the conservation and sustainable use of natural resources (Asumadu and Asantewaa, 2017), providing information in a simple and easy way to understand (Walz, 2015). In summary, they are useful for communicating scientific and technical information for the environmental management and to the general public (Schindler et al., 2014). The use of environmental indicators has been of great relevance to science (Burkhard et al., 2015), because they allow to build the perception of the environmental problems, providing qualitative or quantitative information, as well as, evaluating decision alternatives and solutions (Schindler et al., 2014). These are fundamental instruments to generate and to analyze relevant information from environmental, social, economic, and even cultural aspects (Delgado et al., 2011; Rodríguez et al., 2013).
The landscape on environmental study The landscape is a spatial unit of environmental analysis, which describes the structure forming a visual or surface image (He et al., 2011). It studies dynamic and functional aspects covering all the environmental components, and the influence of human beings (Ginzarly et al., 2019). Landscape is a complex and deep concept which involves environmental, social, economic, and cultural aspects that determine the characteristics of a place. These must be taken to get to know the functioning of the territory (Rodríguez et al., 2013). From a more general perspective, the landscape integrates configurations perceptible through sight and images. It reflects the state or condition of the nature it occupies, and the form of participation of each environmental component, determined by space and time of each process, which are key to the functioning of the environment (Gao et al., 2017; Jiménez et al., 2019). Within this context, the configuration of the landscape is complex and sensitive, subordinate to any change that affects its structure and environmental components (Walz, 2015). The potential of the landscape depends on both the relationships between its components, as those relations with neighboring landscapes. Thus, it is conditioned not only by local characteristics, but also includes regional influence. This potential changes over time due to the levels of development of the society, and their needs (Delgado et al., 2011; Allan et al., 2015).
28 Agro productividad 2021. https://doi.org/10.32854/agrop.v14i8.1782
Importance of the environmental indicator on the composition and configuration of the territory Currently, human beings have made great modifications to their environment, that is, changes in the composition and configuration of nature, which is evident through an environmental indicator (Walz, 2015). This shows the situation of the environment in different analysis systems and determines the current diagnosis of the ecosystem (Bredemeier et al., 2015; Dyer et al., 2017). Environmental indicators explain conditions and interactions with each element forming the place (space) at a given time (temporary) (Ginzarly et al., 2019; Jiménez et al., 2019). They expose those environmental problems caused by socioeconomic activities involving human beings for their development and growth (Asumadu and Asantewaa, 2017). They analyze and evaluate environmental conditions likely to improve through environmental management and the scope on the ecosystem (He et al., 2011; Gao et al., 2017). Those which can be described by different definitions, specifications, guidelines, statistics and classifying categories; they should be practical and realistic, as statistical, social, demographic and economic systems that allow us to observe changing trends, predictive situations, and they provide signs of possible future scenarios (Rodríguez et al., 2013; Walz, 2015).
Analysis and approach of the landscape as environmental indicator The landscape as an environmental indicator describes, analyzes and evaluates environmental problems affecting ecosystems due to human intervention (Alpha, 2017). Conceptually, landscape is dynamic, because it analyzes the environment in a consistent relationship within a theoretical and practical context, to show a comprehensive environmental assessment from different perspectives (environmental, social, economic, and cultural) of each landscape (Rodriguez et al., 2013; Asumadu and Asantewaa, 2017). A landscape represents the external condition of the environment in which some biotic and abiotic components are evaluated, on the use and extraction of natural resources. It also shows, the degree of social development and the quality of environmental management (Ginzarly et al., 2019). It considers limitations on the stability conditions of an ecosystem, based on a spatially and temporally related study of the landscape ( Jiménez et al., 2019); those conditions are due to environmental and social characteristics (Delgado et al., 2011; Walz, 2015). Any change in the configuration of landscape can be used as an environmental indicator ( Jimenez et al., 2019), which describes (qualitatively) and generates quantitative information to analyze and assess the condition of that landscape. The landscape as an environmental indicator aims to be an effective tool in the (spatial) study of the territory, in a conceptual and methodological way, because it involves (temporarily) those environmental, social, economic and cultural disturbances occurring at a specific moment (Alphan, 2017; Jiménez et al., 2019). An environmental indicator is one of the most important components of the landscape, because of its spatial, temporal and comprehensive aspects, integrated from different (environmental, social, economic and cultural) perspectives of evaluation. Such analysis must be planned and assessed, aiming to offer major contributions to knowledge, intending to explain
29 Agro productividad 2021. https://doi.org/10.32854/agrop.v14i8.1782
different components of the environment for the benefit of nature and human beings (Cruz-Mendoza, 2018). The aforementioned defines the landscape as an environmental indicator that describes, analyzes and evaluates ecosystems, and thus it can be used with applications on management and environmental analysis (Burkhard et al., 2015; Luo et al., 2017). It shows the ecological fragility and the degree of conservation, identifying the most sensitive elements of the environment, as well as the risks of breaking the environmental balance and moreover, the ecological behavior (Rodríguez et al., 2013). Landscape as an environmental indicator is not a static and passive depiction, but images full of dynamic meanings, composed of biotic and abiotic components showing developments and imbalances, most of them caused by human activities on ecosystems (Cruz-Mendoza, 2018). Landscape explains the situation of the environmental components, and shows through scenarios perceived by people, complex images in which it is possible to detect the nature of the environmental components participating in the ecosystem (Ginzarly et al., 2019). Likewise, its comprehensive character allows those elements forming the landscape to appear not in a disaggregated manner but integrated into complex systems that bring us closer to the real understanding of nature (He et al., 2011). For example, a landscape seen as an environmental indicator describes the climate, f lora, fauna, soil types, as well as the consequences of human activities on the ecosystem and the magnitude of environmental impacts. It shows and evaluates the need for protection in the face of certain natural events caused by humans, which are dangerous for the very survival of the landscape, and which threaten the integrity of the ecosystem (Alphan, 2017; Jiménez et al., 2019). The landscape is a fundamental component of the ecosystem and its character as a globalizing environmental indicator from an integral perspective, establishes direct contact between human beings and their environment in which he is immersed and of which he is a part (Ginzarly et al., 2019). In other words, it shows the consequences of human perception and assessments, becoming a useful instrument as an environmental indicator for environmental management (Rodríguez et al., 2013). In addition to this, an adequate understanding of the characteristics of the landscape shows the causes of environmental problems, and the consequences of the human impact on ecosystems (Alphan, 2017).
CONCLUSIONS The landscape as an environmental indicator is an effective tool to describe, analyze and evaluate changes in the configuration of the territory. It provides analytical and methodological direction, spatially and temporally comprehensive to incorporate different perspectives of study (environmental, social, economic, and cultural), and it is essential for management and planning.
REFERENCESAllan, E., P. Manning, F. Alt, J. Binkenstein, S. Blaser, N. Blüthgen, S. Böhm, F. Grassein, N. Hötzel, V.
H. Klaus, T. Kleinebecker, E. K. Morris, Y. Oelmann, D. Prati, S. C. Renner, M. C. Riling, M. Schaefer, M. Schloter, B. Schmitt, I. Schöning, M. Schrumpf, E. Solly, E. Sorkau, J. Steckel, I. Steffen-Dewenter, B. Stempfhuber, M. Tschapka, C. N. Weiner, W. W. Weisser, M. Werner, C. Westphal,
30 Agro productividad 2021. https://doi.org/10.32854/agrop.v14i8.1782
W. Wilcke.,Fischer, M. (2015). Land use intensification alters ecosystem multifunctionality via loss biodiversity and changes to functional composition. Ecol. Lett. 18 (8): 838-843. Doi: 10.1111/ele.12469
Alphan, H. (2017). Analysis of landscape changes as an indicator for environmental monitoring. Environ. Monit. and Assess. 189 (1): 24. Doi: 10.1007/s10661-016-5748-7
Asumadu, S. S., Asantewaa, O, P. (2017). The impact of energy, agriculture, macroeconomic and human-induced indicators on environmental pollution: evidence from Ghana. Environ. Sci. and Pollut. Res. 24(7): 6622-6633. Doi: 10.1007/s11356-016-8321-6
Bredemeier, B., C. von Haaren, S. Rüter, M. Reich., Meise, T.(2015). Evaluating the nature conservation value of field habitats: A model approach for targeting agri-environmental measures and projecting their effects. Ecol. Modell. 295:113-122. Doi: 10.1016/j.ecolmodel.2014.08.010
Burkhard, B., B. Fath, S. E. Jørgensen., B., Li, L. (2015). Use of ecological indicators in models. Ecol. Model. 295: 1-4.Doi: 10.1016/j.ecolmodel.2014.10.016
Cruz-Mendoza, A. E. (2018). El trabajo de campo y la identificación de paisajes con potencial para el turismo en el volcán Nevado de Toluca, Estado de México. Invest. Geo. 95: 1-13. Doi:10.14350/rig.59639
Delgado P., J. J., J. D. Ruíz S., E. Navarro J., R. Cortes M., R. Remond N., E. Salinas C., J. M. Fernández L., P., Acevedo R. (2011). La degradación ambiental de los paisajes en las cuencas tributarias de la Ensenada de Sibarimar (Guanabo e Itabo, Cuba). Cuadernos Geográficos. 48: 161-188. https://www.redalyc.org/pdf/171/17121091006.pdf
Gao, J., P. Christensen., Kornov L. (2017). Indicators´ role: How do they influence Strategic Environmental Assessment and Sustainable Planning The Chinese experience. Sci Total Environ. 592: 60-67. Doi: 10.1016/j.scitotenv.2017.02.211
Ginzarly, M., A. Pereira R., Teller, J. (2019). Mapping historic urban landscape values through social media. J. Cult. Herit. 36: 1-11. Doi: 10.1016/j.culher.2018.10.002
He, X., Y. Gao., J. Niu., Zhao, Y. 2011. Landscape Pattern Changes under the Impacts of Urbanization in the Yellow River Wetland taking Zhengzhou as an example. Procedia Environ. Sci. 10: 2165-2169. Doi: 10.1016/j.proenv.2011.09.339
Jiménez M., M. J., R. Rodríguez L., M. J. Escalona M., R. Razo Z., Acevedo, O. A S. (2019). Análisis de indicadores ambientales espacio-temporales de agua, suelo y vegetación. Rev. Mex. Cienc. Agrí. 10(7): 1641-1652. Doi: 10.29312/remexca.v10i7.1806
Luo, J., W. Huai, Gao, M. 2017. Indicators for environmental dispersion in a two-layer wetland flow with effect of wind. Ecol. Indic. 78: 421-436. Doi: 10.1016/j.ecolind.2017.03.027
Matovnikov, S., A., Matovnikova, N. G. (2016). Innovative Urban Planning Methods for the Urban Landscape Design in the Volgograd Agglomeration. Procedia Eng. 150: 1966-1971. Doi: 10.1016/j.proeng.2016.07.199
Rodríguez G., M. L., J. López B., Vela, G. C. (2013). Indicadores ambientales biofísicos a escala detallada para la planeación territorial en Milpa Alta, Centro de México. Invest. Geog. 80: 21-35.
Schindler, S., H. von Wehrden, K. Poirazidis, W. M. Hochachka, T. Wrbka, Kati, V. (2014). Performance of methods to select landscape metrics for modelling species richness. Ecol. Model. 295: 107-112. Doi: 10.1016/j.ecolmodel.2014.05.012
Shul’kin, V. M., A. I. Kachur., Kozhenkova, S.I. (2017). Environmental Objectives and Indicators of the State of Marine and Coastal Zones in the Northwest Pacific Region. Geogr. Nat. Resour. 38: 52-59. Doi: 10.1134/S1875372817010073
Walz, U. 2015. Indicators to monitor the structural diversity of landscapes. Ecol. Model. 295: 88-106. Doi: 10.1016/j.ecolmodel.2014.07.011
Zhang, D., Q. Huang, C. He, D. Yin, Liu, Z. 2019. Planning urban landscape to maintain key ecosystem services in a rapidly urbanizing area: A scenario analysis in the Beijing-Tianjin-Hebei urban agglomeration, China. Ecol. Indic. 96: 559-571. Doi: 10.1016/j.ecolind.2018.09.030
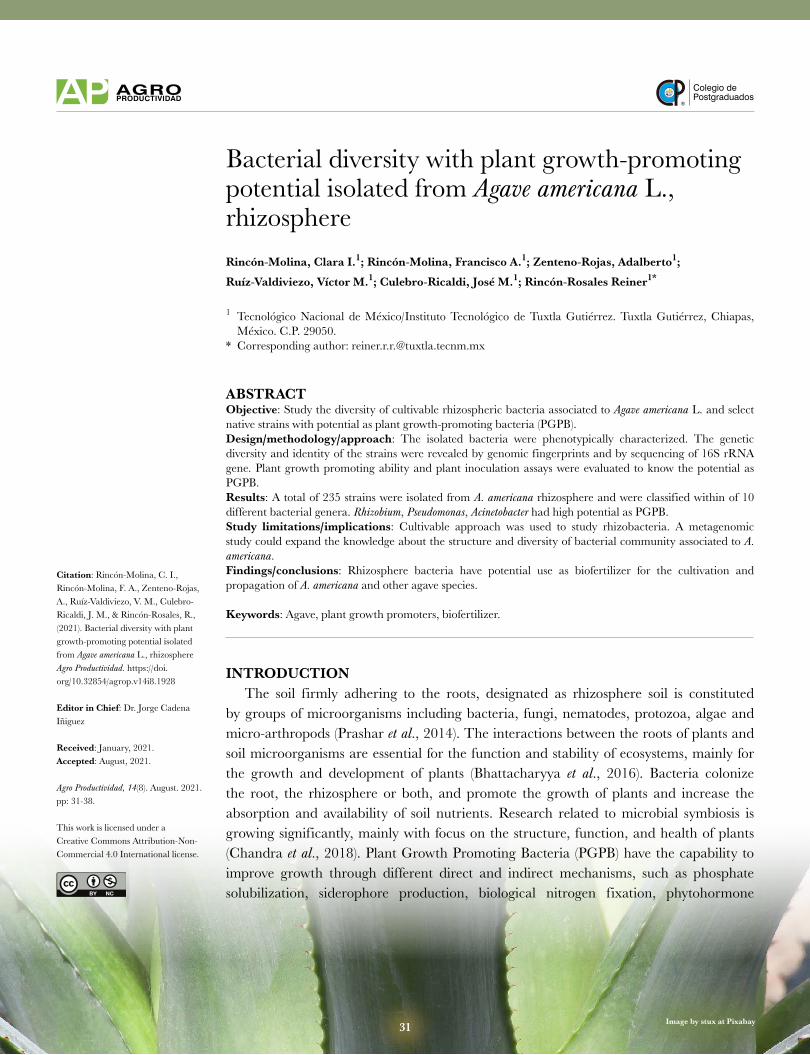
Colegio dePostgraduados
31 Image by stux at Pixabay
Bacterial diversity with plant growth-promoting potential isolated from Agave americana L., rhizosphereRincón-Molina, Clara I.1; Rincón-Molina, Francisco A.1; Zenteno-Rojas, Adalberto1;
Ruíz-Valdiviezo, Víctor M.1; Culebro-Ricaldi, José M.1; Rincón-Rosales Reiner1*
1 Tecnológico Nacional de México/Instituto Tecnológico de Tuxtla Gutiérrez. Tuxtla Gutiérrez, Chiapas, México. C.P. 29050.
* Corresponding author: [email protected]
ABSTRACTObjective: Study the diversity of cultivable rhizospheric bacteria associated to Agave americana L. and select native strains with potential as plant growth-promoting bacteria (PGPB).Design/methodology/approach: The isolated bacteria were phenotypically characterized. The genetic diversity and identity of the strains were revealed by genomic fingerprints and by sequencing of 16S rRNA gene. Plant growth promoting ability and plant inoculation assays were evaluated to know the potential as PGPB.Results: A total of 235 strains were isolated from A. americana rhizosphere and were classified within of 10 different bacterial genera. Rhizobium, Pseudomonas, Acinetobacter had high potential as PGPB.Study limitations/implications: Cultivable approach was used to study rhizobacteria. A metagenomic study could expand the knowledge about the structure and diversity of bacterial community associated to A. americana.Findings/conclusions: Rhizosphere bacteria have potential use as biofertilizer for the cultivation and propagation of A. americana and other agave species.
Keywords: Agave, plant growth promoters, biofertilizer.
INTRODUCTION The soil firmly adhering to the roots, designated as rhizosphere soil is constituted by groups of microorganisms including bacteria, fungi, nematodes, protozoa, algae and micro-arthropods (Prashar et al., 2014). The interactions between the roots of plants and soil microorganisms are essential for the function and stability of ecosystems, mainly for the growth and development of plants (Bhattacharyya et al., 2016). Bacteria colonize the root, the rhizosphere or both, and promote the growth of plants and increase the absorption and availability of soil nutrients. Research related to microbial symbiosis is growing significantly, mainly with focus on the structure, function, and health of plants (Chandra et al., 2018). Plant Growth Promoting Bacteria (PGPB) have the capability to improve growth through different direct and indirect mechanisms, such as phosphate solubilization, siderophore production, biological nitrogen fixation, phytohormone
Citation: Rincón-Molina, C. I., Rincón-Molina, F. A., Zenteno-Rojas, A., Ruíz-Valdiviezo, V. M., Culebro-Ricaldi, J. M., & Rincón-Rosales, R., (2021). Bacterial diversity with plant growth-promoting potential isolated from Agave americana L., rhizosphereAgro Productividad. https://doi.org/10.32854/agrop.v14i8.1928
Editor in Chief: Dr. Jorge Cadena Iñiguez
Received: January, 2021.Accepted: August, 2021.
Agro Productividad, 14(8). August. 2021. pp: 31-38.
This work is licensed under a Creative Commons Attribution-Non-Commercial 4.0 International license.
31
32 Agro productividad 2021. https://doi.org/10.32854/agrop.v14i8.1928
production, antifungal activity, induction of systemic resistance, promotion of beneficial plant-microbe symbioses, among other functions. Different bacterial species grouped within the genera Azospirillum, Bacillus, Enterobacter and Pseudomonas have been used as PGPB. On the other hand, Mexico is the site of origin, evolution, and diversification of Agave genus (Figueredo et al., 2015). Approximately 163 species are found in Mexico, out of which 123 are endemic. Agave americana L. is a species from the Chiapas (Mexico) highlands. It has an economic, social, and cultural importance, as it is a source of natural fiber, medicine, and fructans. Notably it is used to produce traditional alcoholic beverages. Local farmers have established plantations of A. americana to obtain sufficient raw materials for agroindustrial use. However, the water and soil nutrient scarcity, and some diseases caused by fungi, primarily Fusarium species (Ramírez-Ramírez et al., 2017), limit plant growth, consequently, plants reach maturity only after 5 to 7 years instead of instead of a few years. An alternative for obtaining mature plants for industrial use is the application of plant growth-promoting bacteria, but it is necessary to assess the possible effects of PGPB on A. americana to increase the survival and growth of plantlets. Thus, the objective of this study was to determine the phenotypic and genotypic characteristics of native bacterial strains isolated from A. americana rhizosphere, and to evaluate their potential as PGPB.
MATERIALS AND METHODSExperimental site and rhizosphere soil sampling The samples were obtained from suckers (young plants) of A. americana that grow in experimental plots “Tulaito”, located at 16° 16ʼ N and 92° 10ʼ W, with an altitude of 1832 masl, in the municipality of Comitán de Domínguez, Chiapas (Mexico). The plants with rhizosphere were obtained from five sampling points into the plot. The soil attached to the roots was obtained carefully as indicated by Schafer et al. (2014).
Phenotypic characterization of strains The cell morphologies of the strains were examined by light microscopy. The Gram reaction it was done using a kit (Merck®), according to the manufacturer’s procedure, and colony morphology was determined. Bacteriological characterizations of the isolates were performed in distinct nutrient solid medium. The salinity tolerance, ability to grow at different pH levels and the capacity to produce exopolysaccharides (EPS) was determined with the methodology described by Paulo et al. (2012).
Genotypic characterization of strains The isolates were grown in 2.0 ml of nutrient medium overnight. Genomic DNA was extracted using a DNA Isolation Kit (Roche®) and then ERIC genomic fingerprints were analyzed (Versalovic et al., 1994). The richness (d) and diversity (H) index (Shannon-Weaver index) were calculated based on ERIC genetic profiles of the strains. PCR was performed with the universal 16S rRNA primers for bacteria 27-F and 1492-R. The amplification products were digested with a restriction endonuclease Alu I (Thermo Scientific®). The amplified ribosomal rDNA restriction analysis (ARDRA) profiles obtained were used to calculate the diversity of the bacterial species (Rincón-Rosales
33 Agro productividad 2021. https://doi.org/10.32854/agrop.v14i8.1928
et al., 2013). PCR products were purified and sequenced. The taxonomically related sequences obtained from the National Center for Biotechnology Information (NCBI) were aligned by the CLUSTAL X (2.0) software with default settings. Phylogenetic analysis was performed with MEGA v5.2 (Tamura et al., 2011) and phylogenetic tree was constructed by Neighbour-Joining. The 16S rRNA gene sequences of strains were deposited in the GenBank database (Table 1).
Measurement of PGPB efficiency Indole acetic acid (IAA) production. The isolates were streaked on LB agar amended with 5 mmol L1 L-tryptophan. When the bacterial strain grew, it was covered with Whatman filter paper and incubated at 28 °C for 72 h. The paper was removed and treated with Salkowski’s reagent. The production of IAA-like substances was identified by the formation of a red halo on the paper surrounding the colony. Inorganic phosphate solubilization. Isolates were individually grown in YM broth medium and then inoculated in NBRIP medium containing insoluble tricalcium phosphate, pH was adjusted to 7.0. Phosphate solubilizing bacteria were recognized by clear halos after 5 days of incubation at 30 °C and then the phosphate solubilization index (PSI) was calculated. Acetylene reduction assay (ARA). Acetylene reduction assay was performed with a single colony of bacteria grown in N-free minimal semisolid medium. Cultures were incubated for 72 h at 28 °C, and then with acetylene at final concentrations of 1% and 10%. The ARA was measured with a Varian 3300 gas chromatograph with a flame ionization detector. ACC deaminase. The isolates was inoculated in culture medium containing: 0.25 g K2HPO4; 0.05 g MgSO4.7H2O; 0.025 g FeSO4.7H2O; 0.25 g CaCO3; 0.05 g NaCl; 0.0012 g NaMoO4.2H2O; 2.5 g glucose; 3.75 g agar; 240 ml distilled water, and 0.03% of ACC as the sole source of nitrogen. The strains were incubated at 30 °C for 4 days. Colonies were subcultured in fresh medium containing ACC and incubated under the same conditions to confirm growth. Development of bacterial colonies indicates production of ACC deaminase. Production of siderophore. Bacterial isolates were grown in CAS-agar medium [chromeazurol-S (CAS), iron (III) and hexadecyl trimethyl ammonium bromide (HDTMA)] at 28-30 °C for 5 days until there was a color change from blue to a fluorescent orange surrounding the bacterial colonies indicating the production of siderophore (Amaresan et al., 2013).
Plant inoculation assay Representative strain of each of the bacterial genus identified in this study were selected for the inoculation test. A. americana plantlets obtained by micropropagation were used as test plants. After 60 days after transplantation, the plants were transferred to pots containing peat moistened with free N Fahraeus medium as a nutrient source. The plants were inoculated with 2 mL of a suspension of each strain at a concentration of 106 UFC mL1. Uninoculated plants and others treated with 30 mg of KNO3-N per plant served
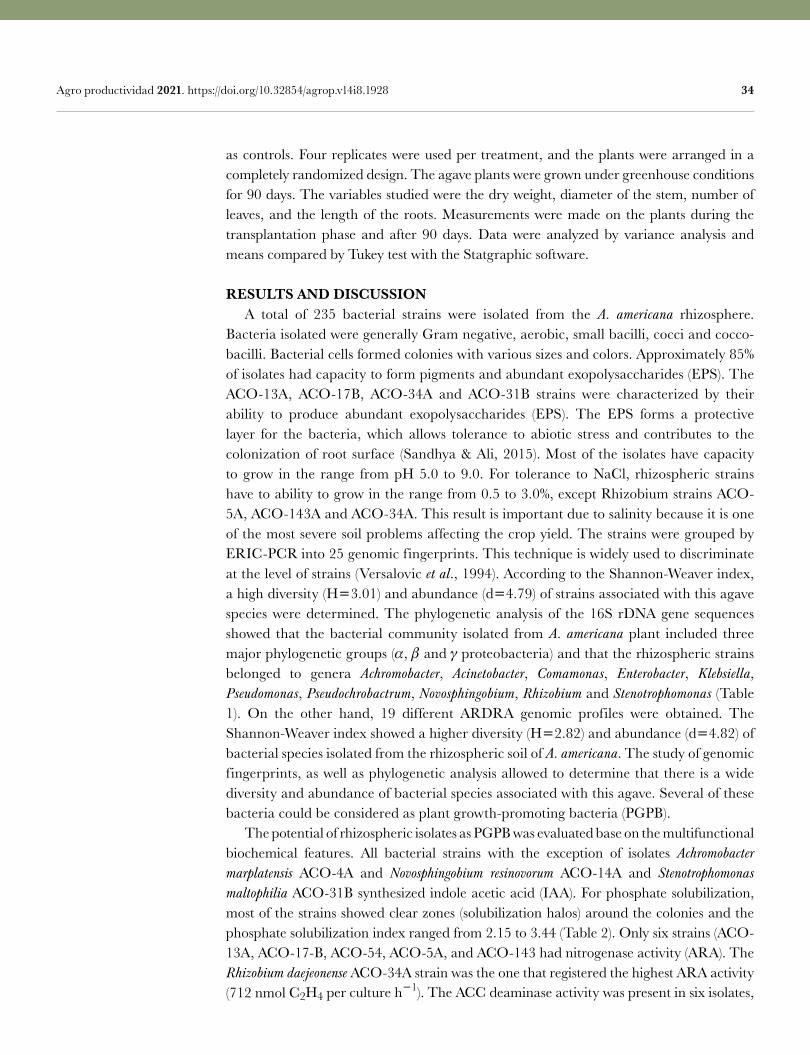
34 Agro productividad 2021. https://doi.org/10.32854/agrop.v14i8.1928
as controls. Four replicates were used per treatment, and the plants were arranged in a completely randomized design. The agave plants were grown under greenhouse conditions for 90 days. The variables studied were the dry weight, diameter of the stem, number of leaves, and the length of the roots. Measurements were made on the plants during the transplantation phase and after 90 days. Data were analyzed by variance analysis and means compared by Tukey test with the Statgraphic software.
RESULTS AND DISCUSSION A total of 235 bacterial strains were isolated from the A. americana rhizosphere. Bacteria isolated were generally Gram negative, aerobic, small bacilli, cocci and cocco-bacilli. Bacterial cells formed colonies with various sizes and colors. Approximately 85% of isolates had capacity to form pigments and abundant exopolysaccharides (EPS). The ACO-13A, ACO-17B, ACO-34A and ACO-31B strains were characterized by their ability to produce abundant exopolysaccharides (EPS). The EPS forms a protective layer for the bacteria, which allows tolerance to abiotic stress and contributes to the colonization of root surface (Sandhya & Ali, 2015). Most of the isolates have capacity to grow in the range from pH 5.0 to 9.0. For tolerance to NaCl, rhizospheric strains have to ability to grow in the range from 0.5 to 3.0%, except Rhizobium strains ACO-5A, ACO-143A and ACO-34A. This result is important due to salinity because it is one of the most severe soil problems affecting the crop yield. The strains were grouped by ERIC-PCR into 25 genomic fingerprints. This technique is widely used to discriminate at the level of strains (Versalovic et al., 1994). According to the Shannon-Weaver index, a high diversity (H3.01) and abundance (d4.79) of strains associated with this agave species were determined. The phylogenetic analysis of the 16S rDNA gene sequences showed that the bacterial community isolated from A. americana plant included three major phylogenetic groups (, and γproteobacteria) and that the rhizospheric strains belonged to genera Achromobacter, Acinetobacter, Comamonas, Enterobacter, Klebsiella, Pseudomonas, Pseudochrobactrum, Novosphingobium, Rhizobium and Stenotrophomonas (Table 1). On the other hand, 19 different ARDRA genomic profiles were obtained. The Shannon-Weaver index showed a higher diversity (H2.82) and abundance (d4.82) of bacterial species isolated from the rhizospheric soil of A. americana. The study of genomic fingerprints, as well as phylogenetic analysis allowed to determine that there is a wide diversity and abundance of bacterial species associated with this agave. Several of these bacteria could be considered as plant growth-promoting bacteria (PGPB). The potential of rhizospheric isolates as PGPB was evaluated base on the multifunctional biochemical features. All bacterial strains with the exception of isolates Achromobacter marplatensis ACO-4A and Novosphingobium resinovorum ACO-14A and Stenotrophomonas maltophilia ACO-31B synthesized indole acetic acid (IAA). For phosphate solubilization, most of the strains showed clear zones (solubilization halos) around the colonies and the phosphate solubilization index ranged from 2.15 to 3.44 (Table 2). Only six strains (ACO-13A, ACO-17-B, ACO-54, ACO-5A, and ACO-143 had nitrogenase activity (ARA). The Rhizobium daejeonense ACO-34A strain was the one that registered the highest ARA activity (712 nmol C2H4 per culture h1). The ACC deaminase activity was present in six isolates,
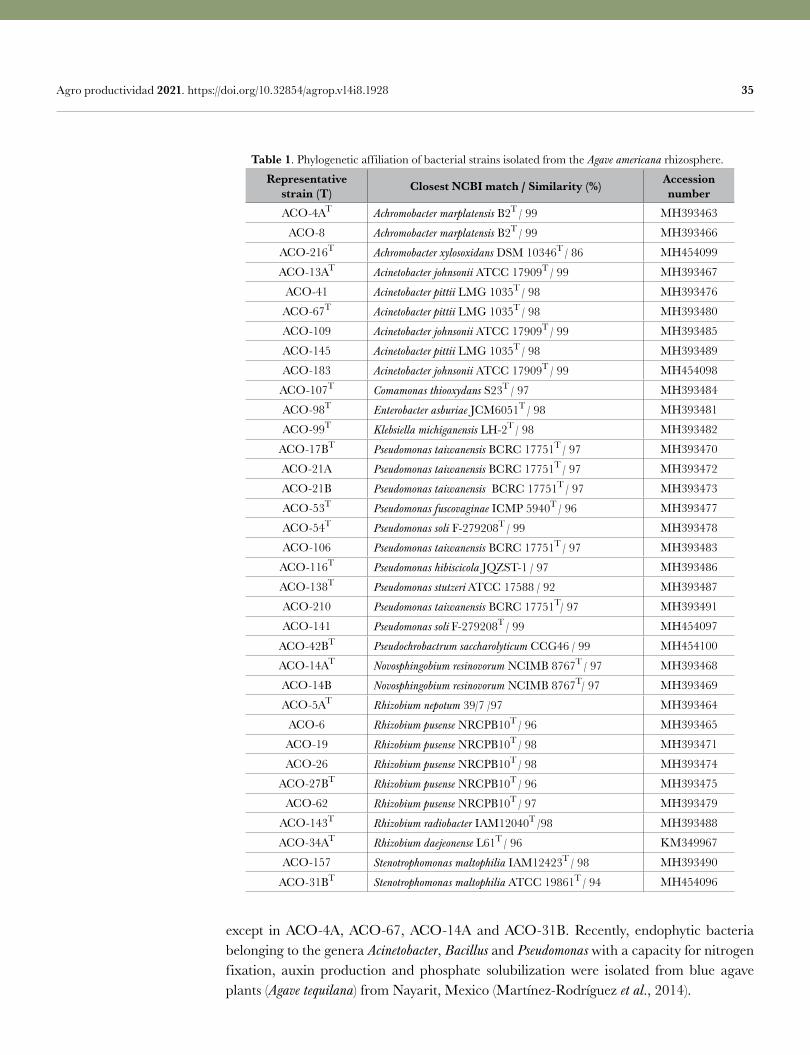
35 Agro productividad 2021. https://doi.org/10.32854/agrop.v14i8.1928
except in ACO-4A, ACO-67, ACO-14A and ACO-31B. Recently, endophytic bacteria belonging to the genera Acinetobacter, Bacillus and Pseudomonas with a capacity for nitrogen fixation, auxin production and phosphate solubilization were isolated from blue agave plants (Agave tequilana) from Nayarit, Mexico (Martínez-Rodríguez et al., 2014).
Table 1. Phylogenetic affiliation of bacterial strains isolated from the Agave americana rhizosphere.
Representative strain (T) Closest NCBI match / Similarity (%) Accession
numberACO-4AT Achromobacter marplatensis B2T / 99 MH393463
ACO-8 Achromobacter marplatensis B2T / 99 MH393466
ACO-216T Achromobacter xylosoxidans DSM 10346T / 86 MH454099
ACO-13AT Acinetobacter johnsonii ATCC 17909T / 99 MH393467
ACO-41 Acinetobacter pittii LMG 1035T / 98 MH393476
ACO-67T Acinetobacter pittii LMG 1035T / 98 MH393480
ACO-109 Acinetobacter johnsonii ATCC 17909T / 99 MH393485
ACO-145 Acinetobacter pittii LMG 1035T / 98 MH393489
ACO-183 Acinetobacter johnsonii ATCC 17909T / 99 MH454098
ACO-107T Comamonas thiooxydans S23T / 97 MH393484
ACO-98T Enterobacter asburiae JCM6051T / 98 MH393481
ACO-99T Klebsiella michiganensis LH-2T / 98 MH393482
ACO-17BT Pseudomonas taiwanensis BCRC 17751T / 97 MH393470
ACO-21A Pseudomonas taiwanensis BCRC 17751T / 97 MH393472
ACO-21B Pseudomonas taiwanensis BCRC 17751T / 97 MH393473
ACO-53T Pseudomonas fuscovaginae ICMP 5940T / 96 MH393477
ACO-54T Pseudomonas soli F-279208T / 99 MH393478
ACO-106 Pseudomonas taiwanensis BCRC 17751T / 97 MH393483
ACO-116T Pseudomonas hibiscicola JQZST-1 / 97 MH393486
ACO-138T Pseudomonas stutzeri ATCC 17588 / 92 MH393487
ACO-210 Pseudomonas taiwanensis BCRC 17751T/ 97 MH393491
ACO-141 Pseudomonas soli F-279208T / 99 MH454097
ACO-42BT Pseudochrobactrum saccharolyticum CCG46 / 99 MH454100
ACO-14AT Novosphingobium resinovorum NCIMB 8767T / 97 MH393468
ACO-14B Novosphingobium resinovorum NCIMB 8767T/ 97 MH393469
ACO-5AT Rhizobium nepotum 39/7 /97 MH393464
ACO-6 Rhizobium pusense NRCPB10T / 96 MH393465
ACO-19 Rhizobium pusense NRCPB10T / 98 MH393471
ACO-26 Rhizobium pusense NRCPB10T / 98 MH393474
ACO-27BT Rhizobium pusense NRCPB10T / 96 MH393475
ACO-62 Rhizobium pusense NRCPB10T / 97 MH393479
ACO-143T Rhizobium radiobacter IAM12040T /98 MH393488
ACO-34AT Rhizobium daejeonense L61T / 96 KM349967
ACO-157 Stenotrophomonas maltophilia IAM12423T / 98 MH393490
ACO-31BT Stenotrophomonas maltophilia ATCC 19861T / 94 MH454096
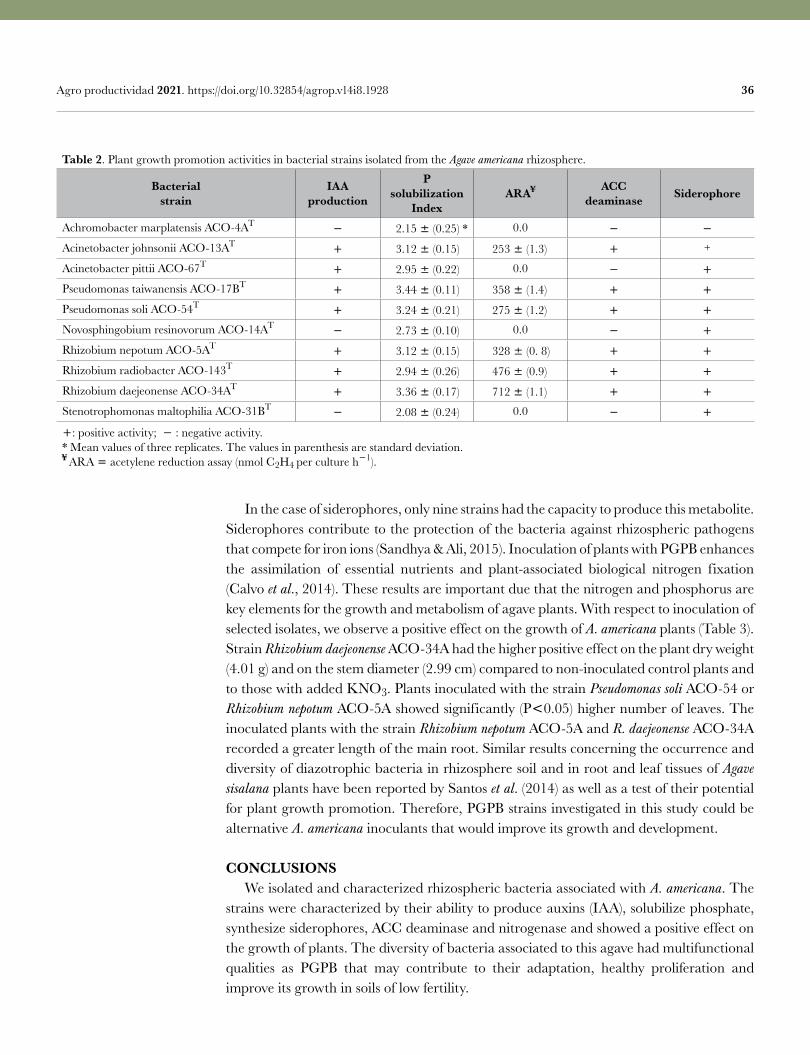
36 Agro productividad 2021. https://doi.org/10.32854/agrop.v14i8.1928
In the case of siderophores, only nine strains had the capacity to produce this metabolite. Siderophores contribute to the protection of the bacteria against rhizospheric pathogens that compete for iron ions (Sandhya & Ali, 2015). Inoculation of plants with PGPB enhances the assimilation of essential nutrients and plant-associated biological nitrogen fixation (Calvo et al., 2014). These results are important due that the nitrogen and phosphorus are key elements for the growth and metabolism of agave plants. With respect to inoculation of selected isolates, we observe a positive effect on the growth of A. americana plants (Table 3). Strain Rhizobium daejeonense ACO-34A had the higher positive effect on the plant dry weight (4.01 g) and on the stem diameter (2.99 cm) compared to non-inoculated control plants and to those with added KNO3. Plants inoculated with the strain Pseudomonas soli ACO-54 or Rhizobium nepotum ACO-5A showed significantly (P0.05) higher number of leaves. The inoculated plants with the strain Rhizobium nepotum ACO-5A and R. daejeonense ACO-34A recorded a greater length of the main root. Similar results concerning the occurrence and diversity of diazotrophic bacteria in rhizosphere soil and in root and leaf tissues of Agave sisalana plants have been reported by Santos et al. (2014) as well as a test of their potential for plant growth promotion. Therefore, PGPB strains investigated in this study could be alternative A. americana inoculants that would improve its growth and development.
CONCLUSIONS We isolated and characterized rhizospheric bacteria associated with A. americana. The strains were characterized by their ability to produce auxins (IAA), solubilize phosphate, synthesize siderophores, ACC deaminase and nitrogenase and showed a positive effect on the growth of plants. The diversity of bacteria associated to this agave had multifunctional qualities as PGPB that may contribute to their adaptation, healthy proliferation and improve its growth in soils of low fertility.
Table 2. Plant growth promotion activities in bacterial strains isolated from the Agave americana rhizosphere.
Bacterialstrain
IAAproduction
P solubilization
IndexARA¥ ACC
deaminase Siderophore
Achromobacter marplatensis ACO-4AT 2.15 (0.25) * 0.0
Acinetobacter johnsonii ACO-13AT 3.12 (0.15) 253 (1.3) +
Acinetobacter pittii ACO-67T 2.95 (0.22) 0.0
Pseudomonas taiwanensis ACO-17BT 3.44 (0.11) 358 (1.4)
Pseudomonas soli ACO-54T 3.24 (0.21) 275 (1.2)
Novosphingobium resinovorum ACO-14AT 2.73 (0.10) 0.0
Rhizobium nepotum ACO-5AT 3.12 (0.15) 328 (0. 8)
Rhizobium radiobacter ACO-143T 2.94 (0.26) 476 (0.9)
Rhizobium daejeonense ACO-34AT 3.36 (0.17) 712 (1.1)
Stenotrophomonas maltophilia ACO-31BT 2.08 (0.24) 0.0
: positive activity; : negative activity.* Mean values of three replicates. The values in parenthesis are standard deviation.¥ ARA acetylene reduction assay (nmol C2H4 per culture h1).
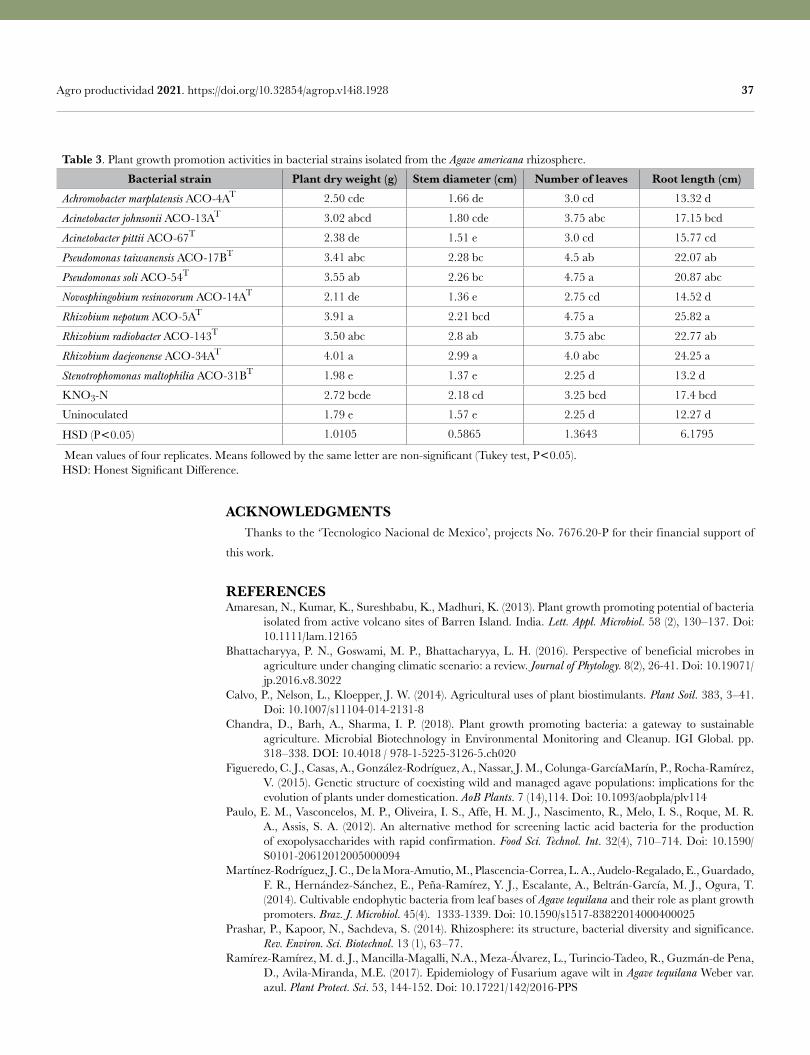
37 Agro productividad 2021. https://doi.org/10.32854/agrop.v14i8.1928
ACKNOWLEDGMENTS Thanks to the ‘Tecnologico Nacional de Mexico’, projects No. 7676.20-P for their financial support of
this work.
REFERENCES Amaresan, N., Kumar, K., Sureshbabu, K., Madhuri, K. (2013). Plant growth promoting potential of bacteria
isolated from active volcano sites of Barren Island. India. Lett. Appl. Microbiol. 58 (2), 130–137. Doi: 10.1111/lam.12165
Bhattacharyya, P. N., Goswami, M. P., Bhattacharyya, L. H. (2016). Perspective of beneficial microbes in agriculture under changing climatic scenario: a review. Journal of Phytology. 8(2), 26-41. Doi: 10.19071/jp.2016.v8.3022
Calvo, P., Nelson, L., Kloepper, J. W. (2014). Agricultural uses of plant biostimulants. Plant Soil. 383, 3–41. Doi: 10.1007/s11104-014-2131-8
Chandra, D., Barh, A., Sharma, I. P. (2018). Plant growth promoting bacteria: a gateway to sustainable agriculture. Microbial Biotechnology in Environmental Monitoring and Cleanup. IGI Global. pp. 318–338. DOI: 10.4018 / 978-1-5225-3126-5.ch020
Figueredo, C. J., Casas, A., González-Rodríguez, A., Nassar, J. M., Colunga-GarcíaMarín, P., Rocha-Ramírez, V. (2015). Genetic structure of coexisting wild and managed agave populations: implications for the evolution of plants under domestication. AoB Plants. 7 (14),114. Doi: 10.1093/aobpla/plv114
Paulo, E. M., Vasconcelos, M. P., Oliveira, I. S., Affe, H. M. J., Nascimento, R., Melo, I. S., Roque, M. R. A., Assis, S. A. (2012). An alternative method for screening lactic acid bacteria for the production of exopolysaccharides with rapid confirmation. Food Sci. Technol. Int. 32(4), 710–714. Doi: 10.1590/S0101-20612012005000094
Martínez-Rodríguez, J. C., De la Mora-Amutio, M., Plascencia-Correa, L. A., Audelo-Regalado, E., Guardado, F. R., Hernández-Sánchez, E., Peña-Ramírez, Y. J., Escalante, A., Beltrán-García, M. J., Ogura, T. (2014). Cultivable endophytic bacteria from leaf bases of Agave tequilana and their role as plant growth promoters. Braz. J. Microbiol. 45(4). 1333-1339. Doi: 10.1590/s1517-83822014000400025
Prashar, P., Kapoor, N., Sachdeva, S. (2014). Rhizosphere: its structure, bacterial diversity and significance. Rev. Environ. Sci. Biotechnol. 13 (1), 63–77.
Ramírez-Ramírez, M. d. J., Mancilla-Magalli, N.A., Meza-Álvarez, L., Turincio-Tadeo, R., Guzmán-de Pena, D., Avila-Miranda, M.E. (2017). Epidemiology of Fusarium agave wilt in Agave tequilana Weber var. azul. Plant Protect. Sci. 53, 144-152. Doi: 10.17221/142/2016-PPS
Table 3. Plant growth promotion activities in bacterial strains isolated from the Agave americana rhizosphere.
Bacterial strain Plant dry weight (g) Stem diameter (cm) Number of leaves Root length (cm)Achromobacter marplatensis ACO-4AT 2.50 cde γ 1.66 de 3.0 cd 13.32 d
Acinetobacter johnsonii ACO-13AT 3.02 abcd 1.80 cde 3.75 abc 17.15 bcd
Acinetobacter pittii ACO-67T 2.38 de 1.51 e 3.0 cd 15.77 cd
Pseudomonas taiwanensis ACO-17BT 3.41 abc 2.28 bc 4.5 ab 22.07 ab
Pseudomonas soli ACO-54T 3.55 ab 2.26 bc 4.75 a 20.87 abc
Novosphingobium resinovorum ACO-14AT 2.11 de 1.36 e 2.75 cd 14.52 d
Rhizobium nepotum ACO-5AT 3.91 a 2.21 bcd 4.75 a 25.82 a
Rhizobium radiobacter ACO-143T 3.50 abc 2.8 ab 3.75 abc 22.77 ab
Rhizobium daejeonense ACO-34AT 4.01 a 2.99 a 4.0 abc 24.25 a
Stenotrophomonas maltophilia ACO-31BT 1.98 e 1.37 e 2.25 d 13.2 d
KNO3-N 2.72 bcde 2.18 cd 3.25 bcd 17.4 bcd
Uninoculated 1.79 e 1.57 e 2.25 d 12.27 d
HSD (P0.05) 1.0105 0.5865 1.3643 6.1795γMean values of four replicates. Means followed by the same letter are non-significant (Tukey test, P0.05).HSD: Honest Significant Difference.
38 Agro productividad 2021. https://doi.org/10.32854/agrop.v14i8.1928
Rincón-Rosales, R., Villalobos-Escobedo, J. M., Rogel, M. A., Martínez, J., Ormeño-Orrillo, E., Martínez-Romero, E. (2013). Rhizobium calliandrae sp. nov., Rhizobium mayense sp. nov. and Rhizobium jaguaris sp. nov., rhizobial species nodulating the medicinal legume Calliandra grandiflora. Int. J. Syst. Evol. Microbiol. 63(9), 3423–3429. Doi: 10.1099/ijs.0.048249-0
Sandhya, V., & Ali, S.Z. (2015). The production of exopolysaccharide by Pseudomonas putida GAP-P45 under various abiotic stress conditions and its role in soil aggregation. Microbiology. 84, 512–519. Doi: 10.1134/S0026261715040153
Santos, A.F.D., Martins, C.Y. S, Santos, P. O. (2014) Diazotrophic bacteria associated with sisal (Agave sisalana Perrine exEngelm): potential for plant growth promotion. Plant Soil. 385, 37–48. Doi: 10.1007/s11104-014-2202-x
Schafer, J., Hallett, S., Johnson, W. (2014). Rhizosphere Microbial Community Dynamics in Glyphosate-Treated Susceptible and Resistant Biotypes of Giant Ragweed (Ambrosia trifida). Weed Science, 62(2), 370-381. Doi:10.1614/WS-D-13-00164.1
Versalovic, J., Schneider, M., Brujin, J. F., Lupski, J. R. (1994). Genomic fingerprinting of bacteria using repetitive sequence-based polymerase chain reaction. Methods Mol. Cell Biol. 5 (1), 25–40.
Tamura, K., Peterson, D., Peterson, N., Stecher, G., Nei M., Kumar, S. (2011). MEGA 5: molecular evolutionary genetics analysis using maximum likelihood, evolutionary distance, and maximum parsimony methods. Mol. Biol. Evol. 28 (10), 2731–2739.
Colegio dePostgraduados
39 Image by Bishnu Sarangi at Pixabay
Web-based system for the traceability of cultivated Nile Tilapia based on ISO 12877: 2011Lerdo-Morales Hember Aldair1* , Chávez-Valdez Ramona Evelia1 ,
Figueroa-Millán Patricia Elizabeth1 , Benavides-Delgado J. Reyes 1 ,
Bricio-Barrios Elena Elsa1
1 Tecnológico Nacional de México/IT Colima. Av. Tecnológico No. 1. Colonia Liberación. Villa de Álvarez, Colima, México. CP. 28976.
* Correspondence author: [email protected]
ABSTRACTObjective: To describe the systematization of the Nile tilapia cultivation process using a computer system for production and marketing traceability based on ISO 12877:2011 standard and web technologies.Design/methodology/approach: A documentary and field investigation were conducted to learn about the Nile tilapia production process currently applied; traceability was evaluated based on Double T and María del Carmen study cases, aquaculture farms located in the municipalities of Manzanillo and Armería located in the state of Colima, México; the process was contrasted with the ISO standard and the system was developed and implemented.Results: A Traceability System that records backward, internal, and forward procedural activities in the cultivation and marketing of tilapia. The system improves food safety control by registering lot care based on the ISO standard, resulting in well-defined traceable processes in the production and commercialization of the Nilotic tilapia.Limitations on study/implications: The results shown are related to the development and implementation of the system; however future work is yet to be carried out to assess its effect on the production and commercialization of farmed tilapia, as well as the efficiency of traceability. Findings/conclusions: The system was developed taking into consideration the necessary indicators for an ISO certification. Hence, aside from simplifying the registration and consultation of information, the producing company has the benefit of earning a certification for the aquaculture production process, creating additional value to its products.
Keywords: Food safety, Web system, Tilapia, Traceability.
INTRODUCTION Nile tilapia (Oreochromis niloticus) was the fifth most produced species worldwide in 2017, representing more than four million tons, due to its high consumer acceptance and its nutritional value (FAO, 2017). In the same year, Tilapia imports in México were the highest compared to other species, with only more than one million tons (CONAPESCA, 2017), making evident a strong competition for national producers. However, issues such as the poor application of technology in production processes and the unfavorable climatic
Citation: Lerdo-Morales, H., A., Chávez-Valdez, R. E., Figueroa-Millán, P., E., Benavides-Delgado, J. & R., & Bricio-Barrios E. E. (2021). Web-based system for the traceability of cultivated Nile Tilapia based on ISO 12877: 2011Agro Productividad. https://doi.org/10.32854/agrop.v14i8.1937
Editor in Chief: Dr. Jorge Cadena Iñiguez
Received: January, 2021.Accepted: July, 2021.
Agro Productividad, 14(8). August. 2021. pp: 39-46.
This work is licensed under a Creative Commons Attribution-Non-Commercial 4.0 International license.
40 Agro productividad 2021. https://doi.org/10.32854/agrop.v14i8.1937
conditions that prevail in many states of the Mexican Republic have harmed national production (Pea et al., 2016). Despite this, in the past decade, national aquaculture production grew slightly over 2% (CONAPESCA 2010; CONAPESCA 2018). On the other hand, even with government programs such as those of SENASICA aimed at food safety, it is essential to trace food products through the traceability chain and raising awareness among producers about safe food production (Chávez et al., 2019), giving them a competitive advantage and being one of several mandatory conditions for those who wish to export their products to new markets (Huerta and Sandoval, 2018); In addition, it promotes the growth of national aquaculture output, the advantages of producers and the decrease of imports, as well as the enhancement of food quality and safety in Mexico (Herrera et al., 2013). Despite this, the latter are compromised by the communication complexity between those involved in the supply chain, and how weak each link in the supply chain may be (Yu, 2020). Consequently, it is necessary to integrate information systems that allows more effective data organization, storage, and analysis, thereby improving confidence and transparency in food products (Nikolaus, 2020). For this purpose, food traceability systems were created and thus, scientific publications related to traceability have increased by 41 percent annually over the last two decades, demonstrating how producers in various countries around the world have incorporated technology into the supervision of cultivation processes (Callejas and Alvarez, 2020). ValorMar R&D, a fisheries and aquaculture value chain traceability platform from Portugal, integrates business processes to identify the required data to be collected and processed centrally (Rosado, 2019). The food traceability system in Jiangsu, China, incorporates a count of expired and recycled food, to predict food safety issues (Cao, 2017). In Panama, a digital platform model based on blockchain is proposed to optimize agricultural supply chain processes by establishing smart contracts enabling the creation of an online market between costumers and producers, removing the need for intermediaries (Caballero and Rivera, 2019). In Sonora, Mexico, SITAGAN, a software developed for cattle producers, is used to maintain a punctual record of production history such as breed, day of birth, birth weight, among others (Valdez et al., 2011). On the other hand, new technological solutions have been created, such as traceability systems based on video monitoring (Mao, 2015), as well as the use of RFID technologies for effective data input, protecting their veracity (Zhao, 2014). However, most of these solutions lack standards, generating diverse outcomes, limiting efficient and transparent information flow in supply chains, hence the importance of a system based on international standards (Šenk et al., 2013).
MATERIALS AND METHODS In this applied research, a web system was designed based on the international standard ISO 12877:2011 for the traceability of Nile tilapia farms in the state of Colima, México, and implemented with open-source technologies, using the Double T farm and the Maria del Carmen farm as case studies; the first is in Armeria and the second in Manzanillo, both municipalities of Colima.
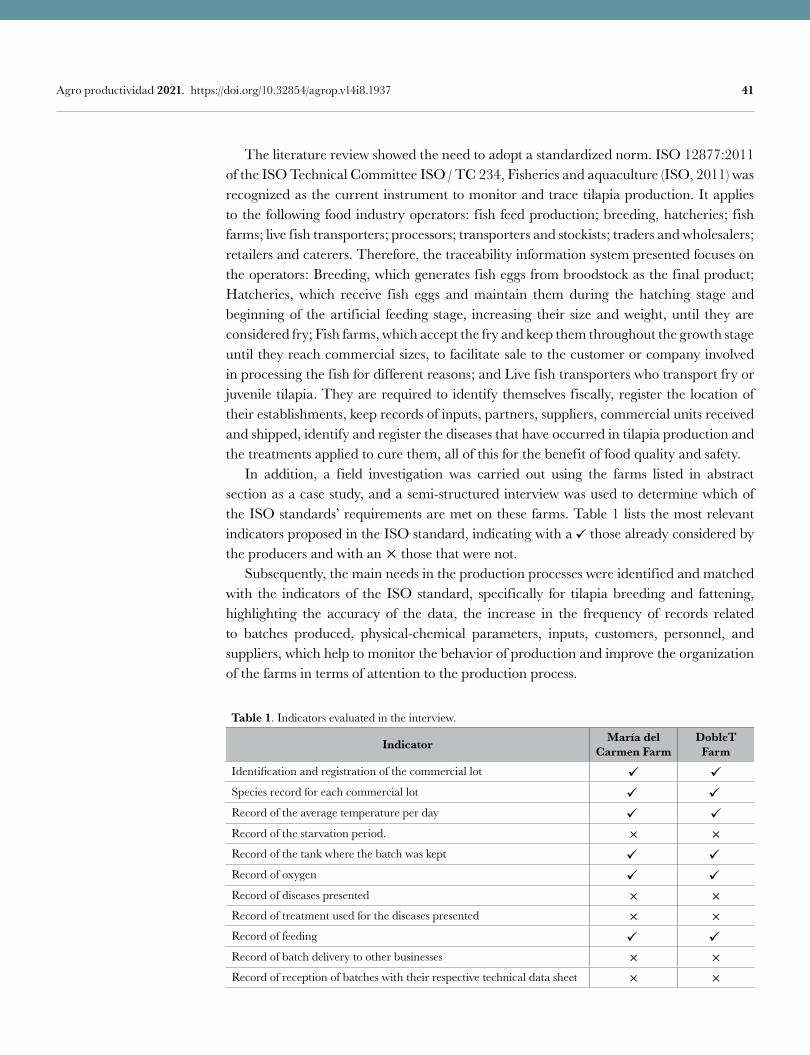
41 Agro productividad 2021. https://doi.org/10.32854/agrop.v14i8.1937
The literature review showed the need to adopt a standardized norm. ISO 12877:2011 of the ISO Technical Committee ISO / TC 234, Fisheries and aquaculture (ISO, 2011) was recognized as the current instrument to monitor and trace tilapia production. It applies to the following food industry operators: fish feed production; breeding, hatcheries; fish farms; live fish transporters; processors; transporters and stockists; traders and wholesalers; retailers and caterers. Therefore, the traceability information system presented focuses on the operators: Breeding, which generates fish eggs from broodstock as the final product; Hatcheries, which receive fish eggs and maintain them during the hatching stage and beginning of the artificial feeding stage, increasing their size and weight, until they are considered fry; Fish farms, which accept the fry and keep them throughout the growth stage until they reach commercial sizes, to facilitate sale to the customer or company involved in processing the fish for different reasons; and Live fish transporters who transport fry or juvenile tilapia. They are required to identify themselves fiscally, register the location of their establishments, keep records of inputs, partners, suppliers, commercial units received and shipped, identify and register the diseases that have occurred in tilapia production and the treatments applied to cure them, all of this for the benefit of food quality and safety. In addition, a field investigation was carried out using the farms listed in abstract section as a case study, and a semi-structured interview was used to determine which of the ISO standards’ requirements are met on these farms. Table 1 lists the most relevant indicators proposed in the ISO standard, indicating with a those already considered by the producers and with an those that were not. Subsequently, the main needs in the production processes were identified and matched with the indicators of the ISO standard, specifically for tilapia breeding and fattening, highlighting the accuracy of the data, the increase in the frequency of records related to batches produced, physical-chemical parameters, inputs, customers, personnel, and suppliers, which help to monitor the behavior of production and improve the organization of the farms in terms of attention to the production process.
Table 1. Indicators evaluated in the interview.
Indicator María del Carmen Farm
DobleT Farm
Identification and registration of the commercial lot
Species record for each commercial lot γ γ
Record of the average temperature per day γ
Record of the starvation period.
Record of the tank where the batch was kept γ γ
Record of oxygen γ γ
Record of diseases presented
Record of treatment used for the diseases presented
Record of feeding γ γ
Record of batch delivery to other businesses
Record of reception of batches with their respective technical data sheet
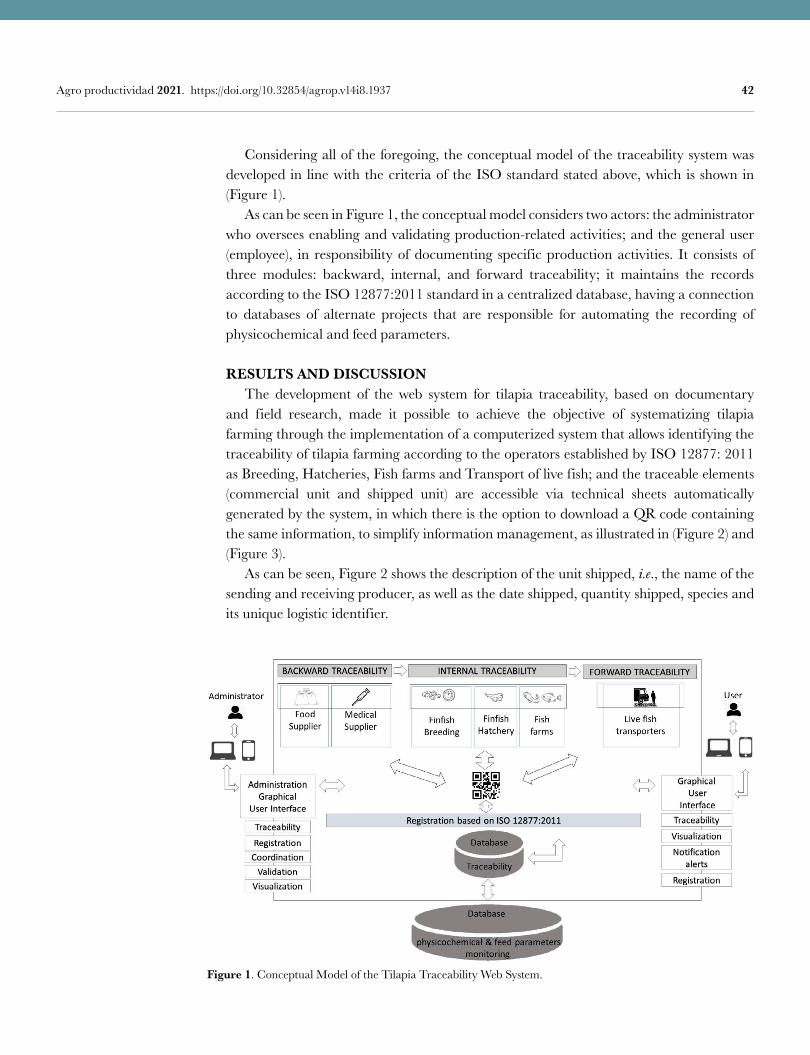
42 Agro productividad 2021. https://doi.org/10.32854/agrop.v14i8.1937
Considering all of the foregoing, the conceptual model of the traceability system was developed in line with the criteria of the ISO standard stated above, which is shown in (Figure 1). As can be seen in Figure 1, the conceptual model considers two actors: the administrator who oversees enabling and validating production-related activities; and the general user (employee), in responsibility of documenting specific production activities. It consists of three modules: backward, internal, and forward traceability; it maintains the records according to the ISO 12877:2011 standard in a centralized database, having a connection to databases of alternate projects that are responsible for automating the recording of physicochemical and feed parameters.
RESULTS AND DISCUSSION The development of the web system for tilapia traceability, based on documentary and field research, made it possible to achieve the objective of systematizing tilapia farming through the implementation of a computerized system that allows identifying the traceability of tilapia farming according to the operators established by ISO 12877: 2011 as Breeding, Hatcheries, Fish farms and Transport of live fish; and the traceable elements (commercial unit and shipped unit) are accessible via technical sheets automatically generated by the system, in which there is the option to download a QR code containing the same information, to simplify information management, as illustrated in (Figure 2) and (Figure 3). As can be seen, Figure 2 shows the description of the unit shipped, i.e., the name of the sending and receiving producer, as well as the date shipped, quantity shipped, species and its unique logistic identifier.
Figure 1. Conceptual Model of the Tilapia Traceability Web System.

43 Agro productividad 2021. https://doi.org/10.32854/agrop.v14i8.1937
Figure 2. Technical data sheet of the unit sent.
Figure 3. Commercial unit data sheet.
In Figure 3, the data described in the technical data sheet correspond to the commercial unit, including planting date, average temperature, diseases recorded, name of the food used during production, as well as the unique identifier of that commercial unit, which is constituted in accordance with the standard. The ISO 12877:2011 standard provides a generic basis for traceability, giving f lexibility for companies to add lot-specific information,
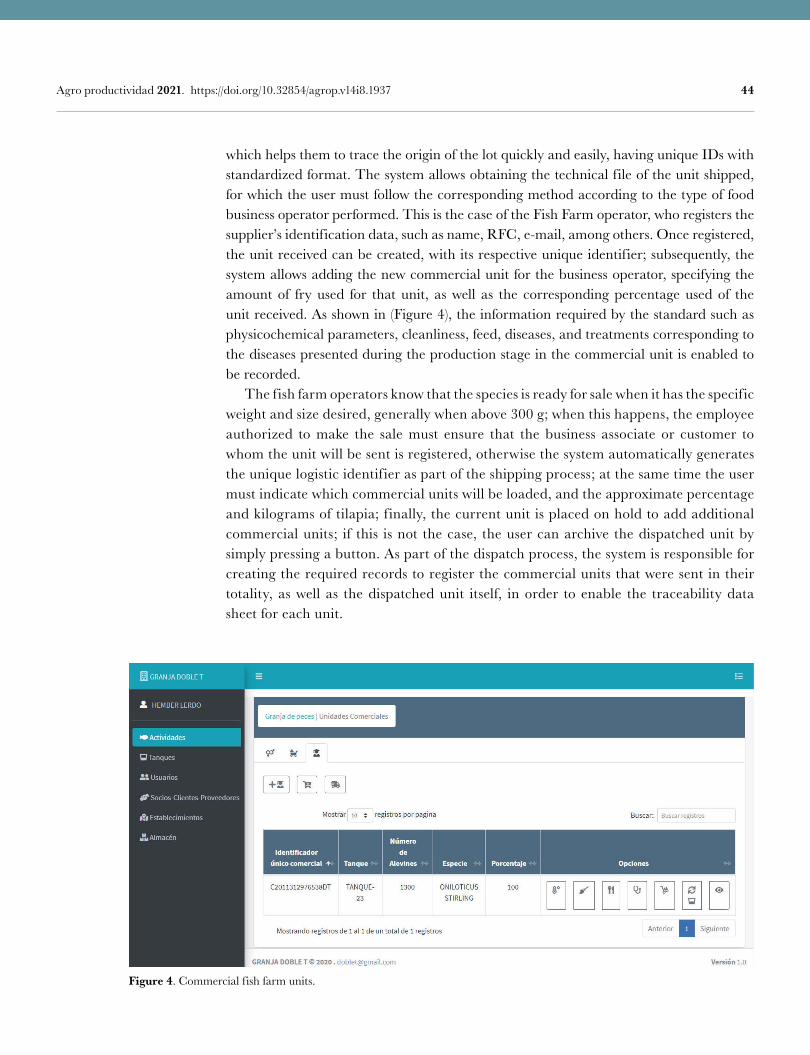
44 Agro productividad 2021. https://doi.org/10.32854/agrop.v14i8.1937
which helps them to trace the origin of the lot quickly and easily, having unique IDs with standardized format. The system allows obtaining the technical file of the unit shipped, for which the user must follow the corresponding method according to the type of food business operator performed. This is the case of the Fish Farm operator, who registers the supplier’s identification data, such as name, RFC, e-mail, among others. Once registered, the unit received can be created, with its respective unique identifier; subsequently, the system allows adding the new commercial unit for the business operator, specifying the amount of fry used for that unit, as well as the corresponding percentage used of the unit received. As shown in (Figure 4), the information required by the standard such as physicochemical parameters, cleanliness, feed, diseases, and treatments corresponding to the diseases presented during the production stage in the commercial unit is enabled to be recorded. The fish farm operators know that the species is ready for sale when it has the specific weight and size desired, generally when above 300 g; when this happens, the employee authorized to make the sale must ensure that the business associate or customer to whom the unit will be sent is registered, otherwise the system automatically generates the unique logistic identifier as part of the shipping process; at the same time the user must indicate which commercial units will be loaded, and the approximate percentage and kilograms of tilapia; finally, the current unit is placed on hold to add additional commercial units; if this is not the case, the user can archive the dispatched unit by simply pressing a button. As part of the dispatch process, the system is responsible for creating the required records to register the commercial units that were sent in their totality, as well as the dispatched unit itself, in order to enable the traceability data sheet for each unit.
Figure 4. Commercial fish farm units.
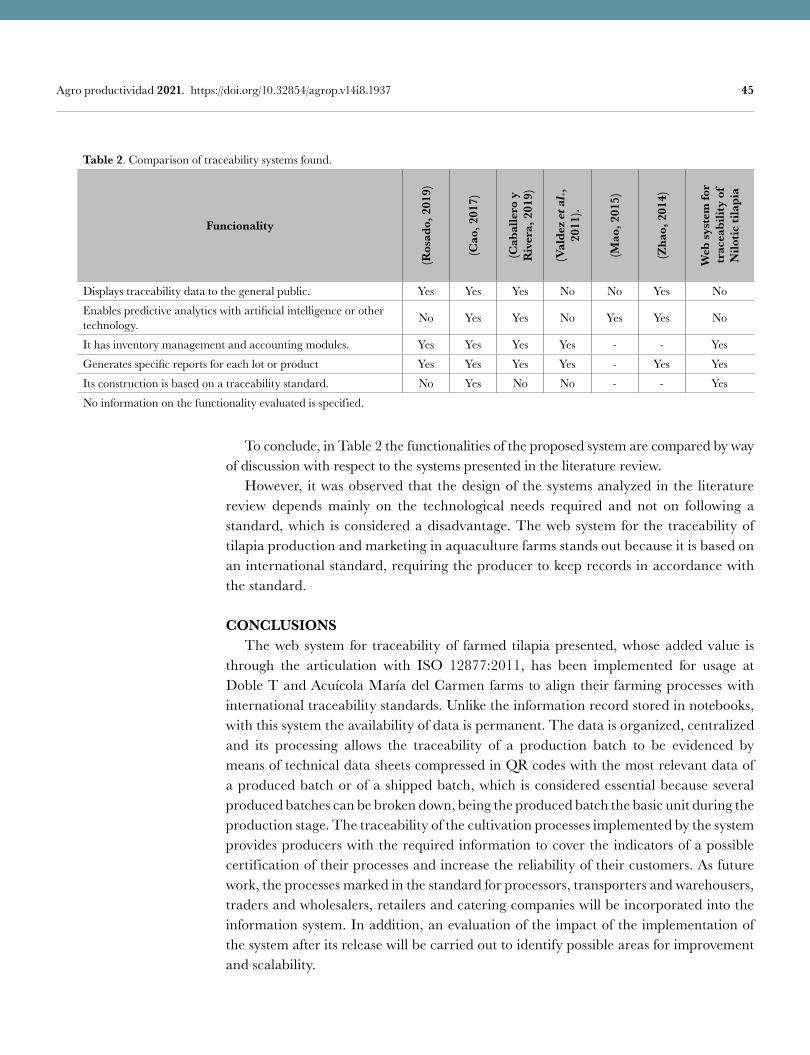
45 Agro productividad 2021. https://doi.org/10.32854/agrop.v14i8.1937
Table 2. Comparison of traceability systems found.
Funcionality
(Ros
ado,
201
9)
(Cao
, 201
7)
(Cab
alle
ro y
R
iver
a, 2
019)
(Val
dez
et a
l.,
2011
).
(Mao
, 201
5)
(Zha
o, 2
014)
Web
sys
tem
for
trac
eabi
lity
of
Nilo
tic ti
lapi
a
Displays traceability data to the general public. Yes Yes Yes No No Yes No
Enables predictive analytics with artificial intelligence or other technology. No Yes Yes No Yes Yes No
It has inventory management and accounting modules. Yes Yes Yes Yes - - Yes
Generates specific reports for each lot or product Yes Yes Yes Yes - Yes Yes
Its construction is based on a traceability standard. No Yes No No - - Yes
No information on the functionality evaluated is specified.
To conclude, in Table 2 the functionalities of the proposed system are compared by way of discussion with respect to the systems presented in the literature review. However, it was observed that the design of the systems analyzed in the literature review depends mainly on the technological needs required and not on following a standard, which is considered a disadvantage. The web system for the traceability of tilapia production and marketing in aquaculture farms stands out because it is based on an international standard, requiring the producer to keep records in accordance with the standard.
CONCLUSIONS The web system for traceability of farmed tilapia presented, whose added value is through the articulation with ISO 12877:2011, has been implemented for usage at Doble T and Acuícola María del Carmen farms to align their farming processes with international traceability standards. Unlike the information record stored in notebooks, with this system the availability of data is permanent. The data is organized, centralized and its processing allows the traceability of a production batch to be evidenced by means of technical data sheets compressed in QR codes with the most relevant data of a produced batch or of a shipped batch, which is considered essential because several produced batches can be broken down, being the produced batch the basic unit during the production stage. The traceability of the cultivation processes implemented by the system provides producers with the required information to cover the indicators of a possible certification of their processes and increase the reliability of their customers. As future work, the processes marked in the standard for processors, transporters and warehousers, traders and wholesalers, retailers and catering companies will be incorporated into the information system. In addition, an evaluation of the impact of the implementation of the system after its release will be carried out to identify possible areas for improvement and scalability.
46 Agro productividad 2021. https://doi.org/10.32854/agrop.v14i8.1937
ACKNOWLEDGMENTS To the farms ‘DobleT y Acuícola María del Carmen’ for the availability for the development of the web
system, applicable to their tilapia farming processes; to CONACyT and the TECNM campus Instituto
Tecnológico de Colima. Also, to the academic organization ITCOL-CA-7 ‘Emerging Technologies’ for their
advice and support in this paper.
REFERENCESCaballero, R. y Rivera, B., (2019). Blockchain: An Alternative to Enable Traceability in the Agricultural Supply
Chain in Panama, 7th International Engineering, Sciences and Technology Conference (IESTEC), Panama, Panama, 2019, pp. 46-51, Doi: 10.1109/IESTEC46403.2019.00017.
Callejas, L.F., Álvarez, K.C. (2020). Trazabilidad en la cadena de suministro alimentaria: Un estudio bibliométrico. Revista CIES.11. (2). 277-297.
Cao, Y., Liu, X., Guan, C., Mao, B. (2017). Implementation and Current Status of Food Traceability System in Jiangsu China, Procedia Computer Science, 122, 617-621. Doi: 10.1016/j.procs.2017.11.414.
Chávez-Almazán, L. A., Díaz-Ortiz, J. A., Garibo-Ruiz, D., Alarcón-Romero, M. A., Mata-Diaz, M. A., Pérez-Cruz, B., Godoy-Galeana, E. (2019). Impact of health monitoring of clenbuterol in Guerrero, Mexico: Results from 2011 to 2015. Revista Mexicana de Ciencias Pecuarias, 10, (1). Doi: 10.22319/rmcp.v10i1.4350
CONAPESCA. Comisión Nacional de Acuacultura y Pesca. (2017). Anuario Estadístico de Acuacultura y Pesca 2017.Sinaloa, México.
CONAPESCA. Comisión Nacional de Acuacultura y Pesca. (2010). Anuario Estadístico de Acuacultura y Pesca 2010.Sinaloa, México.
CONAPESCA. Comisión Nacional de Acuacultura y Pesca. (2018). Anuario Estadístico de Acuacultura y Pesca 2018.Sinaloa, México.
FAO. Organización de las Naciones Unidas para la Alimentación y la Agricultura. (2017). Estadísticas de pesca y acuicultura 2017, 30. Roma, Italia.
Herrera, L., Pérez, F., Martínez, M., Hernandéz, O. (2013). Modelo dinámico para la evaluación económica de la trazabilidad en el mercado mexicano de carne de bovino. Tropical and Subtropical Agroecosystems, 16, (3). 465-473.
Huerta, M., Sandoval, S., (2018). Sistemas de calidad como estrategia de ventaja competitiva en la agroindustria alimentaria. Agricultura, Sociedad y Desarrollo.15, (1). 19-28. Doi: 10.22231/asyd.v15i1.746
ISO. Organización Internacional de Normalización. 2011. ISO 12877:2011 Traceability of finfish products Specification on the information to be recorded in farmed finfish distribution chains. Switzerland.
Mao, B., He, J., Cao, J., Stephen W. Bigger, Todor Vasiljevic, A. (2015). Framework for Food Traceability Information Extraction Based on a Video Surveillance System, Procedia Computer Science, 55. 1285-1292, Doi: /10.1016/j.procs.2015.07.139
Nikolaus, W. P., (2020). How emerging data technologies can increase trust and transparency in fisheries, ICES Journal of Marine Science,77, (4).1286–1294 Doi: 10.1093/icesjms/fsz036
Peña, G.A., Sanchez, J., Aguirre, H., García T. (2016). “Thermal Feasibility of Tilapia Production under Greenhouse Conditions in a Semi-Desert Region of Mexico”. IEEE Xplore. DOI: 10.1109/CONIIN.2016.7498116
Rosado da Cruz, A. M. et al., “On the Design of a Platform for Traceability in the Fishery and Aquaculture Value Chain,” 2019 14th Iberian Conference on Information Systems and Technologies (CISTI), Coimbra, Portugal, 2019, pp. 1-6, Doi: 10.23919/CISTI.2019.8760891.
Valdez, G., Torrescano, G., Sánchez, A., Paz, R. , Vázquez, M., Pardo, D. (2011). Acortando la brecha digital para la trazabilidad sanitaria: el problema de la transferencia tecnológica en la ganadería sonorense, caso SITAGAN. Estud. soc. 19, (37), 141-174..
Yu, B., Zhan, P., Lei, M., Zhou, F., Wang, P., “Food Quality Monitoring System Based on Smart Contracts and Evaluation Models,” in IEEE Access, vol. 8, pp. 12479-12490, 2020, doi: 10.1109/ACCESS.2020.2966020.
Zhao G., Yu H., Wang G., Sui Y., Zhang L. (2015) Applied Research of IOT and RFID Technology in Agricultural Product Traceability System. In: Li D., Chen Y. (eds) Computer and Computing Technologies in Agriculture VIII. CCTA 2014. IFIP Advances in Information and Communication Technology, vol 452. Springer, Cham. Doi: 10.1007/978-3-319-19620-6_57 .
Šenk I., Ostojić G., Tarjan L., Stankovski S., Lazarević M. (2013) Food Product Traceability by Using Automated Identification Technologies. Springer, Berlin.
Colegio dePostgraduados
47 Image by congerdesign at Pixabay
Mexican demand for rice imports (Oryza sativa L.) during NAFTA: evidence from a NARDL model with structural change and outliersValencia-Romero, Ramón1*; Martínez-García, Miguel A.1; Sánchez-Bárcenas, Horacio1;
Ríos-Bolívar, Humberto1
1 Escuela Superior de Economía, Instituto Politécnico Nacional, Unidad Profesional Lázaro Cárdenas. Alcaldía Miguel Hidalgo, CDMX, México, C.P.11350.
* Corresponding author: [email protected]
ABSTRACT Objective: This study aimed to determine which model best captures the behaviour of rice imports during the North America Free Trade Agreement (NAFTA) regime (1994-2018). Methodology: Mexican demand for rice imports is estimated with Autoregressive Distributed Lag Model (ARDL) and Nonlinear Autoregressive Distributed Lag Model (NARDL), both with and without structural change and outliers. Results: It starts with the ARDL and NARDL models, obtaining non-cointegration, as well as diagnosis and specification problems. Subsequently an ARDL model is proposed with structural change and outliers, which represents an improvement but still has specification problems. Finally, the best model is obtained incorporating non-linearity.Limitations/Implications: It is a study for a specific grain, so the results obtained are only valid for rice imports. Nevertheless, it must be considered that it is a basic grain. Moreover, a new methodology is used to estimate the import demand function. Findings: There is evidence of an asymmetric response of rice imports to fluctuations in economic activity and the exchange rate in the short run, and only in the long run for the latter. An increase in rice imports with NAFTA is also confirmed, as well as two extraordinary variations of rice imports during the study period.
Keywords: Rice imports; ARDL; NARDL; structural change; outliers.
INTRODUCTION Despite divergences, neoclassical economic theory as well as post-Keynesianism have converged on the view that import demand is a function of income (economic activity) and the relative price of imports, in national currency. The first theory operates through the imperfect substitution of goods, using utility maximization (Goldstein & Khan, 1985; Leamer & Stern, 1970), and the second one analyses economic growth through demand (Thirlwall, 2002). Empirical studies for Mexico have maintained this theoretical structure of demand, using Gross Domestic Product (GDP) -recently the Global Indicator of
Citation: Valencia-Romero, R., Martínez-García, M. A., Sánchez-Bárcenas, H., & Ríos-Bolívar, H. (2021). Mexican demand for rice imports (Oryza sativa L.) during NAFTA: evidence from a NARDL model with structural change and outliers. Agro Productividad. https://doi.org/10.32854/agrop.v14i8.1947
Editor in Chief: Dr. Jorge Cadena Iñiguez
Received: February, 2021.Accepted: August, 2021.
Agro Productividad, 14(8). August. 2021. pp: 47-55.
This work is licensed under a Creative Commons Attribution-Non-Commercial 4.0 International license.
48 Agro productividad 2021. https://doi.org/10.32854/agrop.v14i8.1947
Economic Activity (GIEA)[1]- and the real exchange rate index as proxy variables of income and the relative price of imports, obtaining income and price elasticities of import demand when the calculation is done with logarithms. The import demand function has been calculated for various periods and with various econometric methodologies for the Mexican economy (Cardero & Galindo, 1999; Cermeño & Rivera Ponce, 2016; Loria Díaz, 2001; Moreno-Brid, 2002; Pacheco-López, 2005; Romero, 2010; Valencia, 2008). A brief description of the research prior to 2000 can be found in Moreno-Brid (2002). All these previous studies suggest that import demand has been extensively studied in the case of Mexico. These studies have been concentrated at the aggregate level of imports, considering trade liberalization in 1994, when the North America Free Trade Agreement (NAFTA) came into force[2]. However, there are still points to analyse. First, none of the research mentioned has focused on imports of a basic grain, such as rice. Second, Mexico eliminated import tariffs on rice only in 2003, instead of 1994. Third, national production of rice could be affected by financial crisis or/and weather problems, and as a result imports would change. Fourth, rice imports may respond asymmetrically to fluctuations in the exchange rate and GIEA[3]. Therefore, the central hypothesis is that import demand of rice reacts asymmetrically to variations in the exchange rate and economic activity. Also, NAFTA (in 2003 and 2008, instead of 1994), as well as extraordinary events (financial crises and climate problems), affected the behaviour of these imports. In this sense, this document extends the literature of import demand, adding not only asymmetry but also structural change (NAFTA) and outliers, without changing the fundamental point that a basic grain is analysed. Globally, rice provides 20 percent of food energy supply; thus it is key to food security (FAO, 2004). It is also one of the three food grains (along with wheat and maize) that predominates in cultivated area and production (FAO, 2019). In Mexico, rice is the second grain -behind only maize- that represents the highest expense for Mexican households on food, beverages, and tobacco (INEGI, 2013). In addition, rice ranks fourth in production of food grains, behind maize, beans, and wheat (Ireta-Paredes et al., 2015). In this sense, rice is strategic, not only nutritionally but also economically. Despite its relevance, the rice supply in Mexico has become exogenous, that is, it is increasingly composed of imports (Figure 1). In this context, it is undoubtedly interesting to study rice imports.
METHODS: ARDL AND NARDL MODELS Empirically, import demand has been represented with the following equation:
1 The GIEA uses the same methodology as GDP, but monthly instead of quarterly (INEGI, 2019b).2 NAFTA was a trade bloc to eliminate or reduce barriers to trade and investment between Canada, Mexico, and the United States. NAFTA has been replaced by the new United States–Mexico–Canada Agreement (USMC), which was signed on November 30, 2018 (United States-Mexico-Canada Agreement, 2019).3 Recently, empirical evidence of asymmetry has been found in different goods; for example, asymmetry response of fuel demand for road transport in Korea (Chi, 2018), of tourism demand in ten European countries (Irandoust, 2019), of energy demand in OECD and non-OECD countries (Liddle & Sadorsky, 2020), even of the money demand in the United Kingdom (Bahmani-Oskooee & Nayeri, 2020).
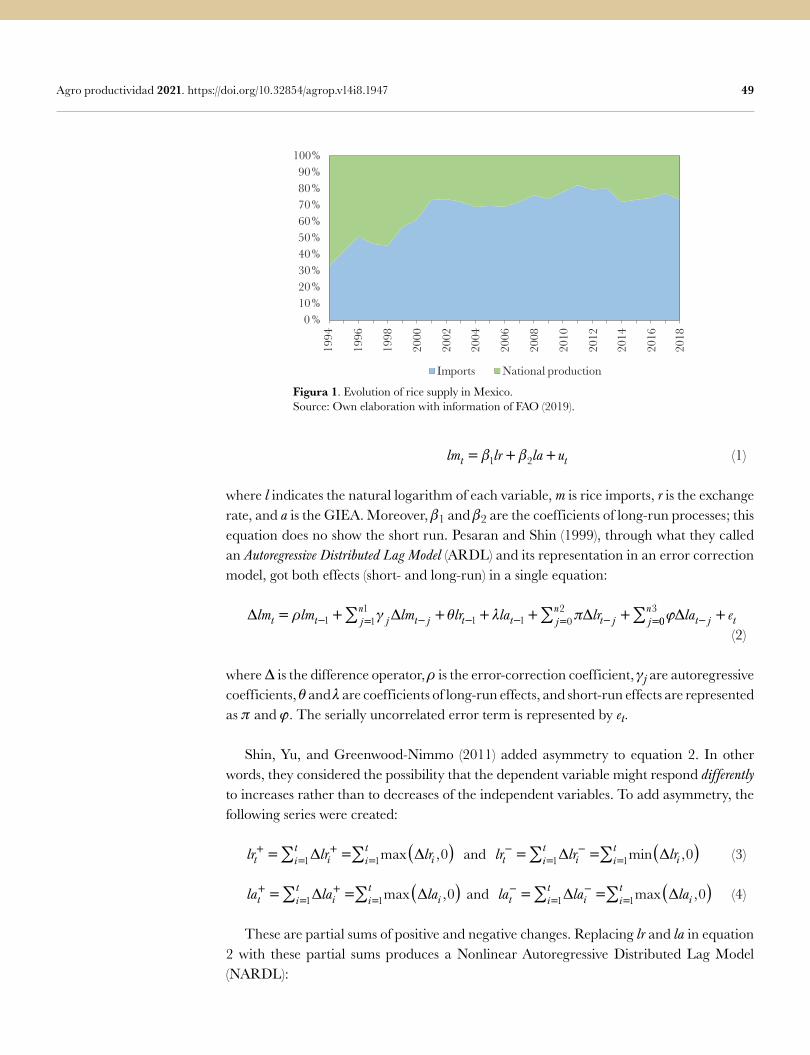
49 Agro productividad 2021. https://doi.org/10.32854/agrop.v14i8.1947
lm lr la ut t= + +β β1 2 (1)
where l indicates the natural logarithm of each variable, m is rice imports, r is the exchange rate, and a is the GIEA. Moreover, 1 and 2 are the coefficients of long-run processes; this equation does no show the short run. Pesaran and Shin (1999), through what they called an Autoregressive Distributed Lag Model (ARDL) and its representation in an error correction model, got both effects (short- and long-run) in a single equation:
∆ ∆ ∆lm lm lm lr la lrt t jjn
t j t t jn
t j j= + + + + +− = − − − = − =∑ ∑ρ γ θ λ π ϕ1 11
1 1 02
003n
t j tla e∑ − +∆ (2)
where is the difference operator, is the error-correction coefficient, j are autoregressive coefficients, and are coefficients of long-run effects, and short-run effects are represented as and . The serially uncorrelated error term is represented by et.
Shin, Yu, and Greenwood-Nimmo (2011) added asymmetry to equation 2. In other words, they considered the possibility that the dependent variable might respond differently to increases rather than to decreases of the independent variables. To add asymmetry, the following series were created:
lr lr lrt iit
iit+ +
= == = ( )∑ ∑∆ ∆1 1 0max , and lr lr lrt iit
iit− −
= == = ( )∑ ∑∆ ∆1 1 0min , (3)
la la lat iit
iit+ +
= == = ( )∑ ∑∆ ∆1 1 0max , and la la lat iit
iit− −
= == = ( )∑ ∑∆ ∆1 1 0max , (4)
These are partial sums of positive and negative changes. Replacing lr and la in equation 2 with these partial sums produces a Nonlinear Autoregressive Distributed Lag Model (NARDL):
Figura 1. Evolution of rice supply in Mexico.Source: Own elaboration with information of FAO (2019).
0 %10 %20 %30 %40 %50 %60 %70 %80 %90 %
100%
1994
1996
1998
2000
2002
2004
2006
2008
2010
2012
2014
2016
2018
Imports National production
50 Agro productividad 2021. https://doi.org/10.32854/agrop.v14i8.1947
∆ ∆lm lm lm lr lr la lat t j j t j t t t tj= + + + + +− −
+−+ −
−− +
−+ −
−−
=ρ γ θ θ λ λ1 1 1 1111
02
n
j t j j t jjn
j t j j t jlr lr la la
∑
∑+ +( )+ +(+−+ −
−−
=+
−+ −
−−π π ϕ ϕ∆ ∆ ∆ ∆ ))+=∑ εtj
n0
3 (5)
It is worth mentioning that equation 2 is an ARDL model without structural changes or outliers. But if we wanted to include them, we would have the following equation[4]:
∆ ∆ ∆
∆
lm lm lm lr la lr
l
t t j j t j t tjn
t jjn= + + + +
+
− − − −= −=∑ ∑ρ γ θ λ π
ϕ
1 111
02
aa s ot j t r rtrk
jn
r rtrk
t− == =+ + + +∑∑ ∑ε δ ϑ ε103
1
(6)
In the same way, the NARDL model would take the following form:
∆ ∆lm lm lm lr lr la lat t j j t j t t t tj= + + + + +− −+
−+ −
−− +
−+ −
−−
=ρ γ θ θ λ λ1 1 1 1111
1 102
1 1
n
j t j tjn
j t j tlr lr la la
∑
∑+ +( )+ +( )+−+ −
−−
=+
−+ −
−−π π ϕ ϕ∆ ∆ ∆jj
n
r rtrk
r rtrk
ts o
=
= =
∑
∑ ∑+ + +
03
1 1δ ϑ ε
(7)
In equations 6 and 7, δr rtrk s=∑ 1 and ϑr rtr
k o=∑ 1 represent the structural changes and outliers, respectively. In this case srt is a dummy variable, defined as srt1 for Ts, otherwise srt0, Ts, indicates the beginning of structural change; ort is also a dummy variable, but defined in a different way, ort1 only for To, the exact time when an outlier happened, and the rest of the time ort=0. Moreover, r and r are the coefficients of the respective structural change and outlier. Finally, cointegration tests, as well as diagnostic and specification tests, are applied to validate the ARDL and NARDL models and evaluate their usefulness.
DATA For this study we used national-level data for Mexico during the NAFTA period (1994–2018). The GIEA (INEGI, 2019b) and the real exchange rate index (BANXICO, 2019) are used to quantify their effects on rice imports (INEGI, 2019a). All variables are seasonally adjusted (base 2013100). Regarding the structural change in rice imports, NAFTA will be tested. NAFTA began in 1994, but Mexico eliminated import tariffs on rice only in 2003 (Zahniser & Link, 2002); thus, the structural change of imports will be tested from 2003 instead of 1994. As for outliers in imports, there are two options to test, 2008 and 2016. First, the global financial crisis in 2008 had important economic effects, such as instability in the real exchange rate,
4 Raheem (2018)which is contrary to theoretical argument. The study’s estimation is based on both symmetric (linear analysed the dollarization of several countries through ARDL and NARDL models with multiple structural changes, but this research did not consider outliers.
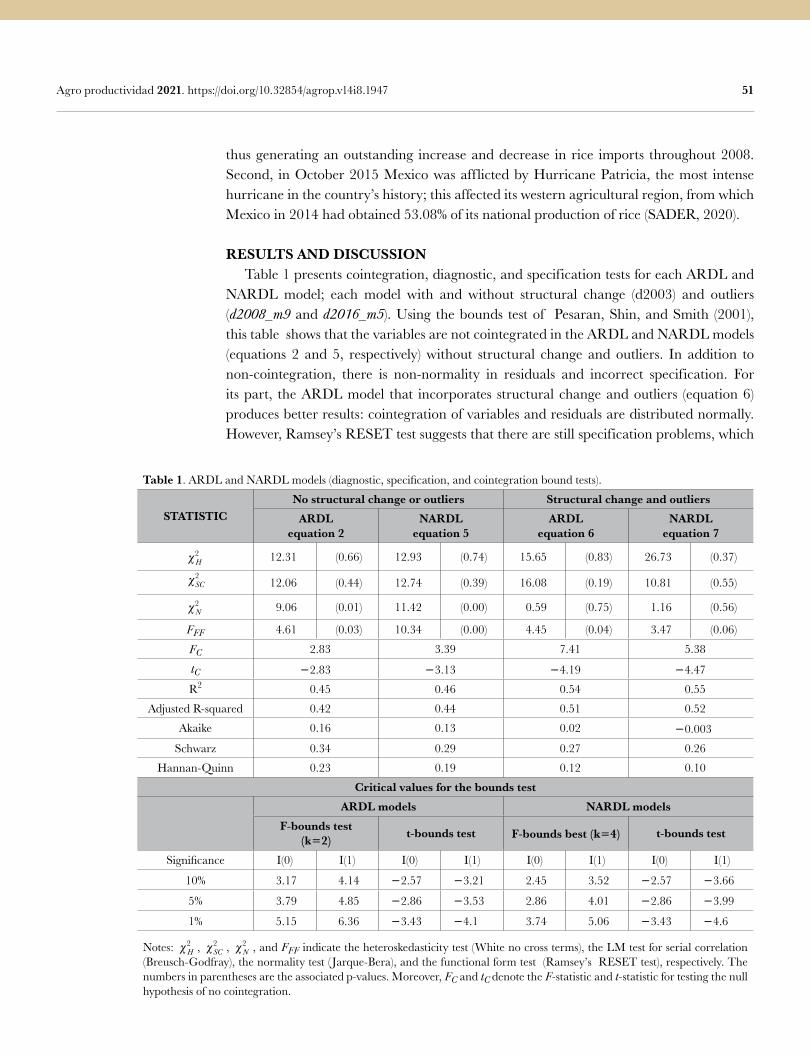
51 Agro productividad 2021. https://doi.org/10.32854/agrop.v14i8.1947
thus generating an outstanding increase and decrease in rice imports throughout 2008. Second, in October 2015 Mexico was afflicted by Hurricane Patricia, the most intense hurricane in the country’s history; this affected its western agricultural region, from which Mexico in 2014 had obtained 53.08% of its national production of rice (SADER, 2020).
RESULTS AND DISCUSSION Table 1 presents cointegration, diagnostic, and specification tests for each ARDL and NARDL model; each model with and without structural change (d2003) and outliers (d2008_m9 and d2016_m5). Using the bounds test of Pesaran, Shin, and Smith (2001), this table shows that the variables are not cointegrated in the ARDL and NARDL models (equations 2 and 5, respectively) without structural change and outliers. In addition to non-cointegration, there is non-normality in residuals and incorrect specification. For its part, the ARDL model that incorporates structural change and outliers (equation 6) produces better results: cointegration of variables and residuals are distributed normally. However, Ramsey’s RESET test suggests that there are still specification problems, which
Table 1. ARDL and NARDL models (diagnostic, specification, and cointegration bound tests).
STATISTICNo structural change or outliers Structural change and outliers
ARDLequation 2
NARDLequation 5
ARDLequation 6
NARDLequation 7
H2 12.31 (0.66) 12.93 (0.74) 15.65 (0.83) 26.73 (0.37)
γ SC2
12.06 (0.44) 12.74 (0.39) 16.08 (0.19) 10.81 (0.55)
N2 9.06 (0.01) 11.42 (0.00) 0.59 (0.75) 1.16 (0.56)
FFF 4.61 (0.03) 10.34 (0.00) 4.45 (0.04) 3.47 (0.06)
FC 2.83 3.39 7.41 5.38
tC 2.83 3.13 4.19 4.47
R2 0.45 0.46 0.54 0.55
Adjusted R-squared 0.42 0.44 0.51 0.52
Akaike 0.16 0.13 0.02 0.003
Schwarz 0.34 0.29 0.27 0.26
Hannan-Quinn 0.23 0.19 0.12 0.10
Critical values for the bounds testARDL models NARDL models
F-bounds test (k2) t-bounds test F-bounds best (k4) t-bounds test
Significance I(0) I(1) I(0) I(1) I(0) I(1) I(0) I(1)
10% 3.17 4.14 2.57 3.21 2.45 3.52 2.57 3.66
5% 3.79 4.85 2.86 3.53 2.86 4.01 2.86 3.99
1% 5.15 6.36 3.43 4.1 3.74 5.06 3.43 4.6
Notes: H2 , SC
2 , N2 , and FFF indicate the heteroskedasticity test (White no cross terms), the LM test for serial correlation
(Breusch-Godfray), the normality test ( Jarque-Bera), and the functional form test (Ramseyʼs RESET test), respectively. The numbers in parentheses are the associated p-values. Moreover, FC and tC denote the F-statistic and t-statistic for testing the null hypothesis of no cointegration.
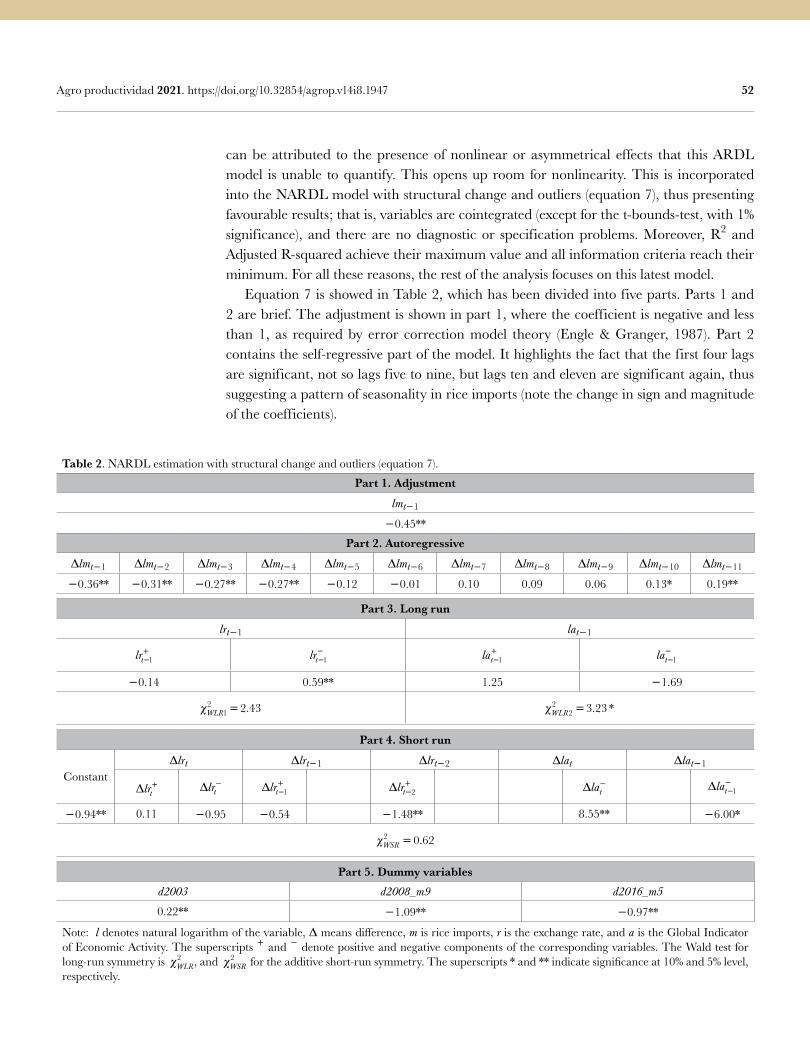
52 Agro productividad 2021. https://doi.org/10.32854/agrop.v14i8.1947
can be attributed to the presence of nonlinear or asymmetrical effects that this ARDL model is unable to quantify. This opens up room for nonlinearity. This is incorporated into the NARDL model with structural change and outliers (equation 7), thus presenting favourable results; that is, variables are cointegrated (except for the t-bounds-test, with 1% significance), and there are no diagnostic or specification problems. Moreover, R2 and Adjusted R-squared achieve their maximum value and all information criteria reach their minimum. For all these reasons, the rest of the analysis focuses on this latest model. Equation 7 is showed in Table 2, which has been divided into five parts. Parts 1 and 2 are brief. The adjustment is shown in part 1, where the coefficient is negative and less than 1, as required by error correction model theory (Engle & Granger, 1987). Part 2 contains the self-regressive part of the model. It highlights the fact that the first four lags are significant, not so lags five to nine, but lags ten and eleven are significant again, thus suggesting a pattern of seasonality in rice imports (note the change in sign and magnitude of the coefficients).
Table 2. NARDL estimation with structural change and outliers (equation 7).
Part 1. Adjustment
lmt1
0.45**
Part 2. Autoregressive
lmt1 lmt2 lmt3 lmt4 lmt5 lmt6 lmt7 lmt8 lmt9 lmt10 lmt11
0.36** 0.31** 0.27** 0.27** 0.12 0.01 0.10 0.09 0.06 0.13* 0.19**
Part 5. Dummy variablesd2003 d2008_m9 d2016_m5
0.22** 1.09** 0.97**
Note: l denotes natural logarithm of the variable, means difference, m is rice imports, r is the exchange rate, and a is the Global Indicator of Economic Activity. The superscripts and denote positive and negative components of the corresponding variables. The Wald test for long-run symmetry is χWLR1
2 2 43= ., and χWSR2 0 62= . for the additive short-run symmetry. The superscripts * and ** indicate significance at 10% and 5% level,
respectively.
Part 3. Long run
lrt1 lat1
lrt−+
1 lrt
1 lat−+
1 lat
1
0.14 0.59** 1.25 1.69
χWLR12 2 43= . χWLR2
2 3 23= . *
Part 4. Short run
Constantlrt lrt1 lrt2 lat lat1
∆lrt+ ∆lrt
− ∆lrt−+
1 ∆lrt−+
2 ∆lat− ∆lat−
−1
0.94** 0.11 0.95 0.54 1.48** 8.55** 6.00*
χWSR2 0 62= .
53 Agro productividad 2021. https://doi.org/10.32854/agrop.v14i8.1947
Parts 3 and 4 focus on the long- and short-run effects, respectively. With respect to the long run, only the coefficient of lrt
1 is significant, with the expected positive sign; that is,
an exchange rate appreciation increases rice imports. It would be appropriate to evaluate the absence or presence of symmetry with the null hypothesis lr lrt t−
−−+=1 1 , the Wald test
χWLR12( ) suggesting symmetry. However, as mentioned above, only lrt
1 is significant,
not lrt−+
1 . In this way, the presence of long-run asymmetry is indirectly confirmed: only appreciations and not depreciations have effects on imports. As for the GIEA, because no coefficient is significant, its long-run effect on imports is ruled out. Notice that WLR2
2 suggests asymmetry, with significance at 10%. But lat
1 and lat−
+1 are not significant.
With respect to the short term, in addition to the constant, only the coefficients of ∆lrt−
+2 , ∆lat
− , and ∆lat−−
1 are significant. The negative sign of the coefficient of ∆lrt−+
2 indicates that a depreciation reduces rice imports. For its part, the positive sign of the coefficient of ∆lat
− indicates that a decrease in economic activity increases imports, suggesting that rice is a grain which shows immediate increases in consumption and storage in difficult times: storage since lag ∆lat−
−( )1 shows a negative sign, thus indicating a reduction in imports. All these variables are significant, but there are not counterparts ∆ ∆ ∆lr la lat t t−
− +−+( )2 1, , and , which indirectly expresses the existence of short-
term asymmetry (adjustment and cumulative short-run asymmetry). However, there is no short-run asymmetry effect; the Wald test χWSR1
2( ) suggests symmetry, but ∆lrt− and
∆lrt+ are not statistically significant[5].
Part 5 assesses the presence of structural change (d2003) and outliers (d2008_m9 and d2016_m5). The dummy variable is statistically significant, supporting a conclusion that the elimination of tariffs in 2003 increased rice imports. Variables d2008_m9 and d2016_m5 represent the 2008 crisis as well as Hurricane Patricia in late 2015. Both are statistically significant, thus indicating that these extraordinary events had an impact on imports, not permanently but only in the indicated month. Finally, the results obtained have two important characteristics. First, they are consistent with the hypothesis raised. And second, they are different from previous studies of Mexican demand for imports. (Cardero & Galindo, 1999; Cermeño & Rivera Ponce, 2016; Loria Díaz, 2001; Moreno-Brid, 2002; Pacheco-López, 2005; Romero, 2010; Valencia, 2008). Not only do the results analyse a particular crop, but they also indicate for the first time an asymmetric response of Mexican demand for rice imports.
CONCLUSIONS This study, through a NARDL model, provides evidence of asymmetry, structural change, and the presence of outliers in Mexican rice imports during NAFTA (1994-2018). With regard to asymmetry, only exchange rate appreciations affected rice imports in the long run; in the short run, these were affected by depreciation, as well as a decline in the
5 Adjustment asymmetry is defined as ∆lat− and ∆lat
+ taking different lag orders, and cumulative asymmetry when ϕ ϕj j
− +≠∑∑ . And a short-run asymmetry effect is present if at the same lag order j, estimates of ϕ j−
are different than those of ϕ j+ (Bahmani-Oskooee, Xi, and Bahmani, 2019).
54 Agro productividad 2021. https://doi.org/10.32854/agrop.v14i8.1947
Global Indicator of Economic Activity. Regarding structural change, the elimination of import tariffs in Mexico in 2003 led to an increase in rice imports. With respect to outliers, there were two outstanding changes in rice imports. First, Patricia Hurricane affected the main rice-producing areas in Mexico (its occident part of Mexico), thus generating an extraordinary increase in rice imports in May 2016. And second, the financial crisis in 2008 created an exceptional exchange rate instability and, therefore, instability in the purchase of rice imports in September 2008. Without a doubt the results found here are important for producers (domestic as well as foreign) and the Mexican government. As for producers, increased imports during NAFTA suggest a growing market -a market in a period of liberalization in which the most competitive producer would undoubtedly succeed. Hence the importance of these results for the Mexican government because the production of an essential grain must undoubtedly be dealt with strategically, for example, by strengthening infrastructure, minimizing intermediaries, and increasing R&D, all to create a more competitive market.
REFERENCESBahmani-Oskooee, M., & Nayeri, M. M. (2020). Policy uncertainty and the demand for money in the United
Kingdom : Are the effects asymmetric ? Economic Analysis and Policy, 66, 76–84. doi: 10.1016/j.eap.2020.02.005
Bahmani-Oskooee, M., Xi, D., & Bahmani, S. (2019). More evidence on the asymmetric effects of exchange rate changes on the demand for money: evidence from Asian. Applied Economics Letters, 26(6), 485–495. Doi: 10.1080/13504851.2018.1486979
BANXICO. (2019). Sistema de Información Económica. Disponible en: http://www.banxico.org.mx/SieInternet/consultarDirectorioInternetAction.do?sector=6&accion=consultarCuadro&idCuadro=CR60&locale=es
Cardero, M. E., Galindo, L. M. (1999). La demanda de importaciones en México: un enfoque de elasticidades. Comercio Exterior, 49(5), 481–487.
Cermeño, R. S., Rivera Ponce, H. (2016). La demanda de importaciones y exportaciones de México en la era del TLCAN. Trimestre Económico, 83(1), 127–147. doi: 10.20430/ete.v83i329.198
Chi, J. (2018). Imperfect reversibility of fuel demand for road transport: Asymmetric and hysteretic effects of income and price changes in Korea. Transport Policy, 71, 116–125. Doi: 10.1016/j.tranpol.2018.08.006
Engle, R. F., Granger, C. W. J. (1987). Co-Integration and Error Correction: Representation, Estimation, and Testing. Econometrica, 55(2), 251-276. Doi: 10.2307/1913236
FAO. (2004). El Arroz y la Nutrición Humana. En Año Internacional del Arroz. Disponible en: http://www.fao.org/rice2004/es/f-sheet/hoja3.pdf
FAO. (2019). FAOSTAT. Organización de las Naciones Unidadas para la Alimentación y la Agricultura. Disponible en: http://www.fao.org/faostat/es/#data
Goldstein, M., Khan, M. S. (1985). Income and price effects in foreign trade. Handbook of International Economics, 2, 1041–1105. Doi: 10.1016/S1573-4404(85)02011-1
INEGI. (2013). Encuesta Nacional de Gastos de los Hogares. INEGI. Disponible en: http://www3.inegi.org.mx/rnm/index.php/catalog/132
INEGI. (2019a). Banco de Información Económica. Disponible en: https://www.inegi.org.mx/sistemas/bie/INEGI. (2019b). Indicador Global de la Actividad Económica. Disponible en: https://www.inegi.org.mx/programas/
igae/2013/Irandoust, M. (2019). On the relation between exchange rates and tourism demand: A nonlinear and
asymmetric analysis. The Journal of Economic Asymmetries, 20(4), 1–10. Doi: 10.1016/j.jeca.2019.e00123Ireta-Paredes, A. D. R., Altamirano-Cárdenas, J. R., Ayala-Garay, A. V., Covarrubias-Gutiérrez, I. (2015).
Análisis macroeconómico y microeconómico de la competitividad del arroz en México. Agricultura Sociedad y Desarrollo, 12(4), 499. doi: 10.22231/asyd.v12i4.242.
Leamer, E. E., & Stern, R. M. (1970). Quantitative International Economics. Routledge.Liddle, B., & Sadorsky, P. (2020). How much do asymmetric changes in income and energy prices affect energy
demand ? The Journal of Economic Asymmetries, 21. Doi: 10.1016/j.jeca.2019.e00141
55 Agro productividad 2021. https://doi.org/10.32854/agrop.v14i8.1947
Loria Díaz, E. (2001). La restricción externa y dinámica al crecimiento de México, a través de las propensiones del comercio, 1970-1999. Estudios Económicos, 16(2), 227–251.
Moreno-Brid, J. C. (2002). Liberalización Comercial y la Demanda de Importaciones en México. Investigación económica, 62,(240), 13–50.
Pacheco-López, P. (2005). The effect of trade liberalization on exports, imports, the balance of trade, and growth: The case of Mexico. Journal of Post Keynesian Economics, 27(4), 595–617.
Pesaran, M. H., Shin, Y. (1999). An Autoregressive Distributed-Lag Modelling Approach to Cointegration Analysis. En S. Strøm (Ed.), Econometrics and Economic Theory in the 20th Century: The Ragnar Frisch Centennial Symposium (pp. 371–413). Cambridge University Press. doi: 10.1017/CCOL521633230.011
Pesaran, M. H., Shin, Y., Smith, R. J. (2001). Bounds testing approaches to the analysis of level relationships. Journal of Applied Econometrics, 16(3), 289–326. doi: 10.1002/jae.616
Raheem, I. D. (2018). Dollarization: asymmetry and breaks. International Review of Applied Economics, 32(5), 697–710. doi: 10.1080/02692171.2017.1375465
Romero, J. (2010). Evolución de la demanda de importaciones de México: 1940-2009. En Documentos de trabajo (Número III). El Colegio de Mexico, Centro de Estudios Económicos.
SADER. (2020). Sistema de Información Agroalimentaria de Consulta. Mexico. Gobierno de México. Disponible en: https://www.gob.mx/siap/documentos/siacon-ng-161430
Shin, Y., Yu, B., Greenwood-Nimmo, M. (2011). Modelling Asymmetric Cointegration and Dynamic Multipliers in a Nonlinear ARDL Framework. SSRN, 1–61. doi: 10.2139/ssrn.1807745
Thirlwall, A. P. (2002). The Nature of Economic Growth. An Alternative Framework for Understanding the Performance of Nations. Edward Elgar Publishing. doi: 10.4337/9781843767466
Valencia, R. (2008). El modelo de crecimiento con restricción de balanza de pagos con incorporación de las remesas. El caso de México. Comercio Exterior, 58(1), 17–26.
Zahniser, S., Link, J. (2002). Effects of North American Free Trade Agreement on agriculture and the rural economy. Economic Research Service, USDA.

Colegio dePostgraduados
57
Probability of Heavy Metals Mobility from Dumped Sediments in a QuarryGarcía-Rangel, Karina T.1; Gavi-Reyes Francisco1; Carrillo-González Rogelio2*;
Martínez-Menes, Mario1
1 Programa de Hidrociencias. Colegio de Postgraduados. Texcoco, México, México, C. P. 56230. 2 Programa de Edafología. Colegio de Postgraduados. Texcoco, México, México, C. P. 56230* Corresponding author: [email protected]
ABSTRACTDregs from the former Texcoco Lake were used to build the new international Mexico City airport and pumped in a quarry. The dredged sediments could have heavy metals (HMs) capable of polluting water bodies. The study’s objective was to evaluate the content of Cu, Zn, Cd, Ni, and Pb of the sediments deposited in the quarry, their transfer to the runoff water and the adsorption of Cu, Zn, Ni, and Pb in the subsoil. Other variables measured were water infiltration rate, HM in sediments, water runoff, and the HM adsorption in the subsoil. The infiltration rate in sediments is low (10-7 cm/h). HMs in sediments are within the maximum permissible limits by Mexican regulations, for sewage sludge. The HMs in the runoff from the sediments are in the range of the Mexican regulations for the discharge into rivers and for irrigation purposes of agricultural soils. They are also within safe limits for irrigation use considered by FAO and EPA. The materials adsorption capacity of Pb (1250 mg kg1), Zn (588 mg kg1), and Cu (1250 mg kg1) is higher than the concentration of metals in the runoff water, so the movement of HMs down into the subsoil is unlikely.
INTRODUCTION Mining of materials for construction in open-pit mines is relatively inexpensive, but it causes conspicuous changes in ecosystems. Among its negative effects there is deforestation, habitat destruction, landscape change, rock fracturing from the use of explosives, dust generation, alteration of the site’s hydrology, formation of large craters with risk of collapse (Green et al., 2005, Korkmaz et al., 2011). Performing large civil works involves the removal of the superficial layer of the soil or unstable sediments for the foundation of the structures. For the construction of the new international airport in Mexico City (NAICM, the acronym in Spanish language) in the former Texcoco Lake, it was necessary to drag and transport large volumes of sediment to authorized confinements (GACM, 2014). The confinements are located 10 km away in the middle part of the Sierra Nevada that fed the lake. Due to the origin and management
Image by Uwe T. at Pixabay
Citation: García-Rangel, Karina T.; Gavi-Reyes Francisco; Carrillo-González, Rogelio; Martínez-Menes, Mario. (2021). Probability of Heavy Metals Mobility from Dumped Sediments in a Quarry. Agro Productividad. https://doi.org/10.32854/agrop.v14i8.1952
Editor in Chief: Dr. Jorge Cadena Iñiguez
Received: February, 2021.Accepted: August, 2021.
Agro Productividad, 14(8). August. 2021. pp: 57-69.
This work is licensed under a Creative Commons Attribution-Non-Commercial 4.0 International license.
57
58 Agro productividad 2021. https://doi.org/10.32854/agrop.v14i8.1952
of the excavation material, the place of its confinement and the concentrated volume, the following question arises: Could the sediments represent a source of heavy metals (HMs) that would contaminate the bodies of water that are used for human consumption and other activities such as agriculture? The confinement site corresponds to an exhausted quarry, adjacent to a tributary of the Texcoco River, of up to 65 m of depth, abandoned without rehabilitation. The appropriate use of these sinkholes as confinement sites could solve two environmental problems of strong impact in the zone, the rehabilitation of the quarry and the confinement of sediments, but could unleash a greater impact in the long term: underground water contamination. The sediment from the former lake constitutes the superior clay formation (Anónimo, 2014). It has a very alkaline pH (Balderas et al., 2006), deficient drainage, high content of salts and high rate of exchangeable sodium (Segura et al., 2000). This sediment contains Ni, Cu, Mo, Pb (Morales-García et al., 2020), Cr, Zn and V (Morton-Bermea et al., 2009), whose origin is a combination of the open air conditions of the rock from the high parts of the basin, industrial activities and f low transport, among the most notable sources. The Fe, Pb, Cr, As, Cu, Zn, Cd, V, and Hg content was reported in sediments from other lakes (Vowotor et al., 2014; Pejman et al., 2015). The metals can be freed as a result of different processes, among them their physical alteration, which can increase their solubility and impact negatively the environment (Wu et al., 2014). Vowotor et al. (2014) suggest the following potential for ecological risk: Cd Hg As Pb Cu Cr Zn. The HMs of the sediment have low or null potential for lixiviation because they are united to stable mineral fractions in the soil (Balderas et al., 2006). In an alkaline medium the mobility of metals is minimized, and this sediment has poor drainage, characteristic derived from its high content of smectites (Ortiz and Gutiérrez, 2015) and amorphous silica (Balderas et al., 2006), as well as the lack of structure due to its high sodium content (Rowell, 1994). In the confinement site, the impermeability of the bottom would favor rainfall runoff and cracking could give rise to a preferential f low of HMs towards water table layers, although it is unknown whether the site has cracks formed during the material’s extraction. And, depending on its ability to sorb metals, it could continue its migration towards underground waters, since the potential of transference of HM contents in the sediments towards the water medium depends on their concentration and solubility (Kabata-Pendias, 2011). Soluble HMs in the infiltration water can be adsorbed in the bottom of the confinement (Van der Perk, 2013) and with it, reduce the risk of contamination of underground waters. The adsorption in the soil-water interphase (Sparks, 2003) indicates the capacity of substrates to retain solutes (Appelo and Postma 2005), with which their mobility can be predicted. The best known models to simulate the isotherms are those by Freundlich and Langmuir (Roy et al., 1992). The objective of this study was to evaluate the content of Cu, Zn, Cd, Ni and Pb of the sediments of the former Texcoco Lake and in the runoff water, and the sorption of Cu, Zn, Ni and Pb in the bottom of the confinement.
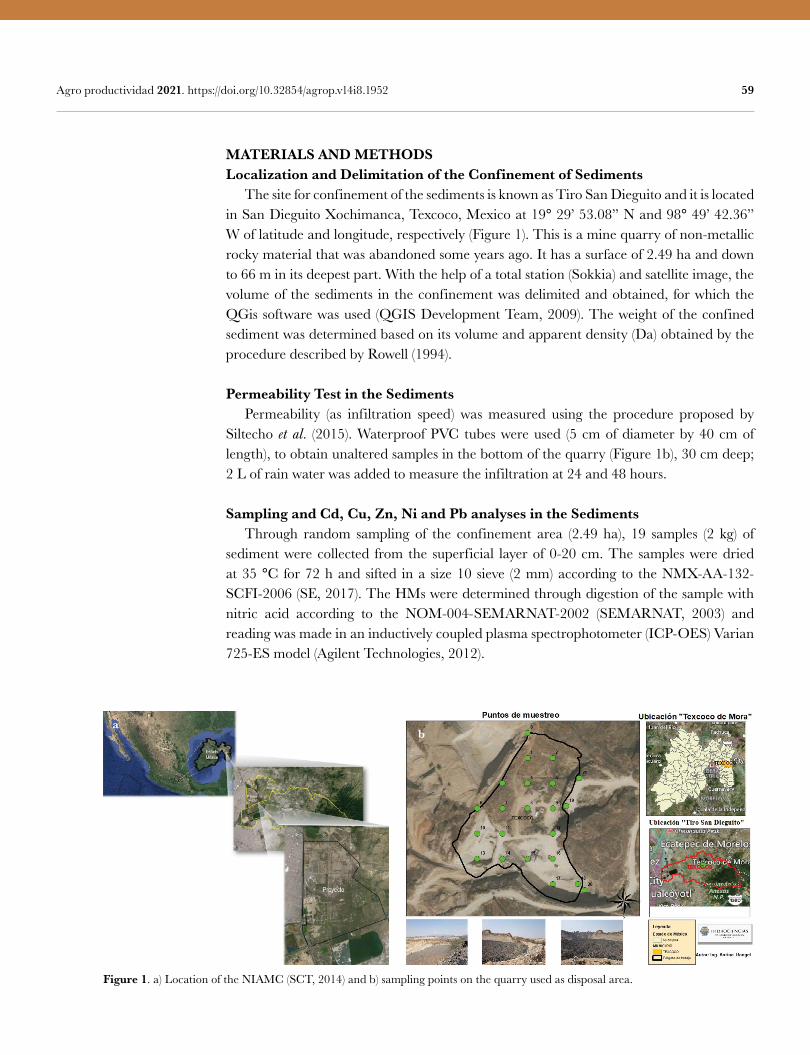
59 Agro productividad 2021. https://doi.org/10.32854/agrop.v14i8.1952
MATERIALS AND METHODSLocalization and Delimitation of the Confinement of Sediments The site for confinement of the sediments is known as Tiro San Dieguito and it is located in San Dieguito Xochimanca, Texcoco, Mexico at 19° 29’ 53.08” N and 98° 49’ 42.36” W of latitude and longitude, respectively (Figure 1). This is a mine quarry of non-metallic rocky material that was abandoned some years ago. It has a surface of 2.49 ha and down to 66 m in its deepest part. With the help of a total station (Sokkia) and satellite image, the volume of the sediments in the confinement was delimited and obtained, for which the QGis software was used (QGIS Development Team, 2009). The weight of the confined sediment was determined based on its volume and apparent density (Da) obtained by the procedure described by Rowell (1994).
Permeability Test in the Sediments Permeability (as infiltration speed) was measured using the procedure proposed by Siltecho et al. (2015). Waterproof PVC tubes were used (5 cm of diameter by 40 cm of length), to obtain unaltered samples in the bottom of the quarry (Figure 1b), 30 cm deep; 2 L of rain water was added to measure the infiltration at 24 and 48 hours.
Sampling and Cd, Cu, Zn, Ni and Pb analyses in the Sediments Through random sampling of the confinement area (2.49 ha), 19 samples (2 kg) of sediment were collected from the superficial layer of 0-20 cm. The samples were dried at 35 °C for 72 h and sifted in a size 10 sieve (2 mm) according to the NMX-AA-132-SCFI-2006 (SE, 2017). The HMs were determined through digestion of the sample with nitric acid according to the NOM-004-SEMARNAT-2002 (SEMARNAT, 2003) and reading was made in an inductively coupled plasma spectrophotometer (ICP-OES) Varian 725-ES model (Agilent Technologies, 2012).
Figure 1. a) Location of the NIAMC (SCT, 2014) and b) sampling points on the quarry used as disposal area.
ab
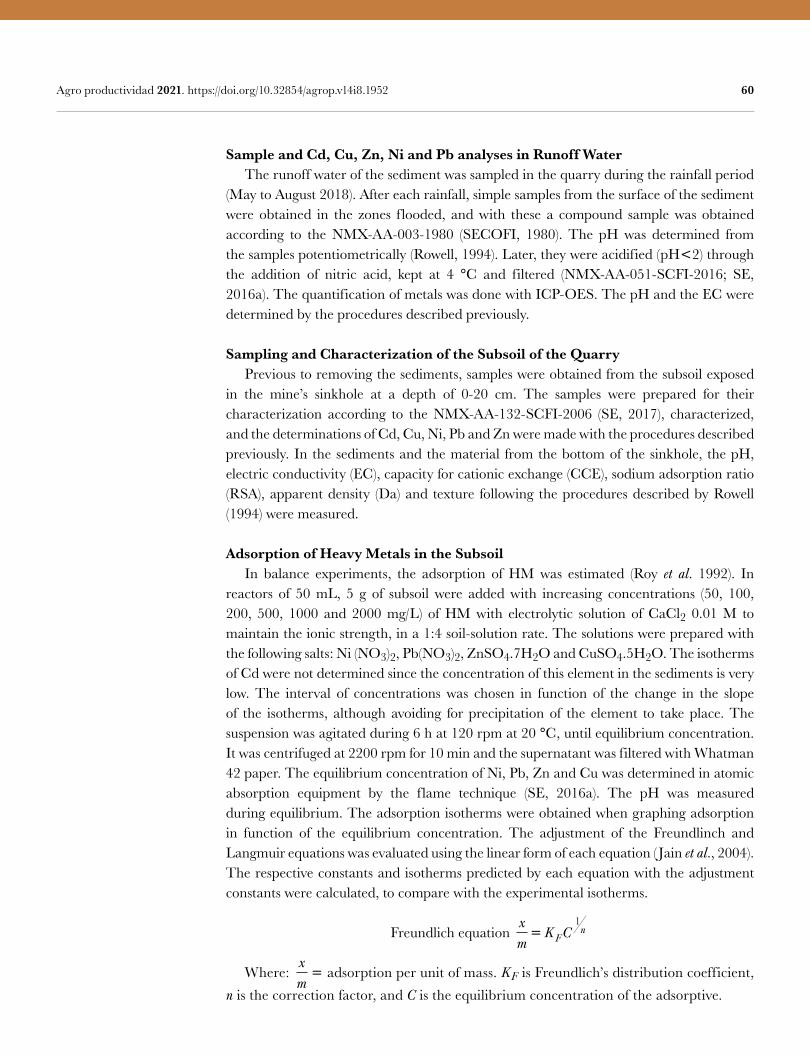
60 Agro productividad 2021. https://doi.org/10.32854/agrop.v14i8.1952
Sample and Cd, Cu, Zn, Ni and Pb analyses in Runoff Water The runoff water of the sediment was sampled in the quarry during the rainfall period (May to August 2018). After each rainfall, simple samples from the surface of the sediment were obtained in the zones flooded, and with these a compound sample was obtained according to the NMX-AA-003-1980 (SECOFI, 1980). The pH was determined from the samples potentiometrically (Rowell, 1994). Later, they were acidified (pH2) through the addition of nitric acid, kept at 4 °C and filtered (NMX-AA-051-SCFI-2016; SE, 2016a). The quantification of metals was done with ICP-OES. The pH and the EC were determined by the procedures described previously.
Sampling and Characterization of the Subsoil of the Quarry Previous to removing the sediments, samples were obtained from the subsoil exposed in the mine’s sinkhole at a depth of 0-20 cm. The samples were prepared for their characterization according to the NMX-AA-132-SCFI-2006 (SE, 2017), characterized, and the determinations of Cd, Cu, Ni, Pb and Zn were made with the procedures described previously. In the sediments and the material from the bottom of the sinkhole, the pH, electric conductivity (EC), capacity for cationic exchange (CCE), sodium adsorption ratio (RSA), apparent density (Da) and texture following the procedures described by Rowell (1994) were measured.
Adsorption of Heavy Metals in the Subsoil In balance experiments, the adsorption of HM was estimated (Roy et al. 1992). In reactors of 50 mL, 5 g of subsoil were added with increasing concentrations (50, 100, 200, 500, 1000 and 2000 mg/L) of HM with electrolytic solution of CaCl2 0.01 M to maintain the ionic strength, in a 1:4 soil-solution rate. The solutions were prepared with the following salts: Ni (NO3)2, Pb(NO3)2, ZnSO4.7H2O and CuSO4.5H2O. The isotherms of Cd were not determined since the concentration of this element in the sediments is very low. The interval of concentrations was chosen in function of the change in the slope of the isotherms, although avoiding for precipitation of the element to take place. The suspension was agitated during 6 h at 120 rpm at 20 °C, until equilibrium concentration. It was centrifuged at 2200 rpm for 10 min and the supernatant was filtered with Whatman 42 paper. The equilibrium concentration of Ni, Pb, Zn and Cu was determined in atomic absorption equipment by the flame technique (SE, 2016a). The pH was measured during equilibrium. The adsorption isotherms were obtained when graphing adsorption in function of the equilibrium concentration. The adjustment of the Freundlinch and Langmuir equations was evaluated using the linear form of each equation ( Jain et al., 2004). The respective constants and isotherms predicted by each equation with the adjustment constants were calculated, to compare with the experimental isotherms.
Freundlich equation xm
K CFn
1
Where: xm adsorption per unit of mass. KF is Freundlich’s distribution coefficient,
n is the correction factor, and C is the equilibrium concentration of the adsorptive.
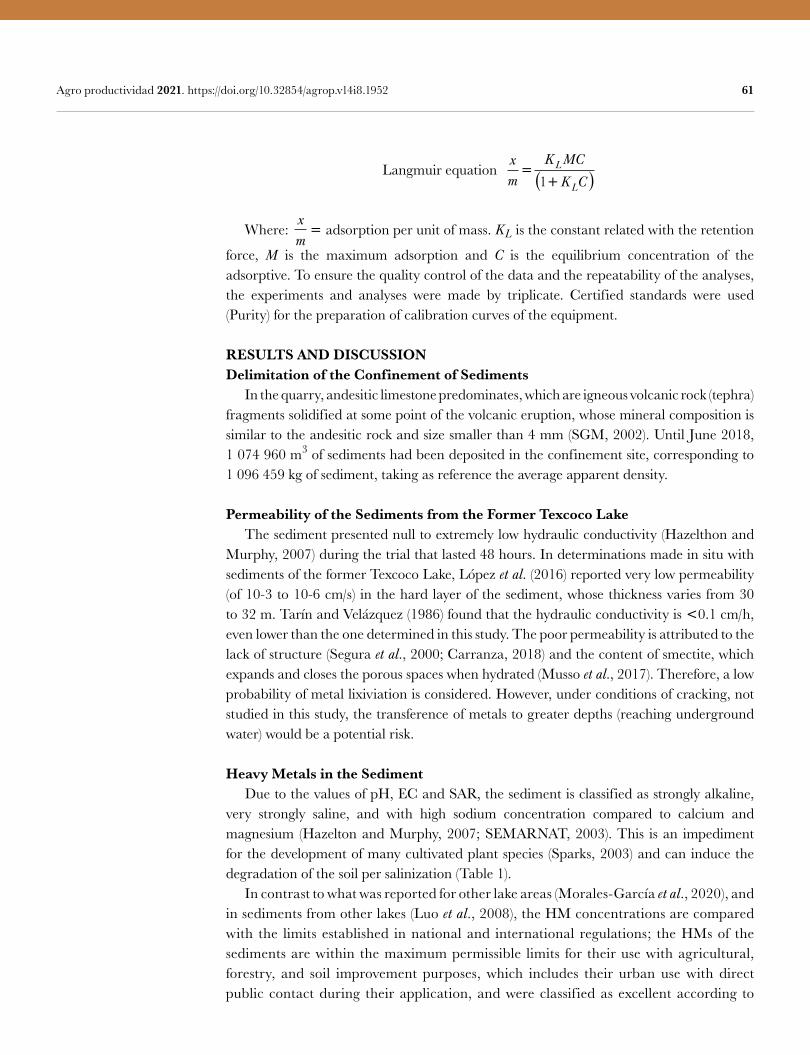
61 Agro productividad 2021. https://doi.org/10.32854/agrop.v14i8.1952
Langmuir equation xm
K MC
K CL
L
=+( )1
Where: xm adsorption per unit of mass. KL is the constant related with the retention
force, M is the maximum adsorption and C is the equilibrium concentration of the adsorptive. To ensure the quality control of the data and the repeatability of the analyses, the experiments and analyses were made by triplicate. Certified standards were used (Purity) for the preparation of calibration curves of the equipment.
RESULTS AND DISCUSSIONDelimitation of the Confinement of Sediments In the quarry, andesitic limestone predominates, which are igneous volcanic rock (tephra) fragments solidified at some point of the volcanic eruption, whose mineral composition is similar to the andesitic rock and size smaller than 4 mm (SGM, 2002). Until June 2018, 1 074 960 m3 of sediments had been deposited in the confinement site, corresponding to 1 096 459 kg of sediment, taking as reference the average apparent density.
Permeability of the Sediments from the Former Texcoco Lake The sediment presented null to extremely low hydraulic conductivity (Hazelthon and Murphy, 2007) during the trial that lasted 48 hours. In determinations made in situ with sediments of the former Texcoco Lake, López et al. (2016) reported very low permeability (of 10-3 to 10-6 cm/s) in the hard layer of the sediment, whose thickness varies from 30 to 32 m. Tarín and Velázquez (1986) found that the hydraulic conductivity is 0.1 cm/h, even lower than the one determined in this study. The poor permeability is attributed to the lack of structure (Segura et al., 2000; Carranza, 2018) and the content of smectite, which expands and closes the porous spaces when hydrated (Musso et al., 2017). Therefore, a low probability of metal lixiviation is considered. However, under conditions of cracking, not studied in this study, the transference of metals to greater depths (reaching underground water) would be a potential risk.
Heavy Metals in the Sediment Due to the values of pH, EC and SAR, the sediment is classified as strongly alkaline, very strongly saline, and with high sodium concentration compared to calcium and magnesium (Hazelton and Murphy, 2007; SEMARNAT, 2003). This is an impediment for the development of many cultivated plant species (Sparks, 2003) and can induce the degradation of the soil per salinization (Table 1). In contrast to what was reported for other lake areas (Morales-García et al., 2020), and in sediments from other lakes (Luo et al., 2008), the HM concentrations are compared with the limits established in national and international regulations; the HMs of the sediments are within the maximum permissible limits for their use with agricultural, forestry, and soil improvement purposes, which includes their urban use with direct public contact during their application, and were classified as excellent according to
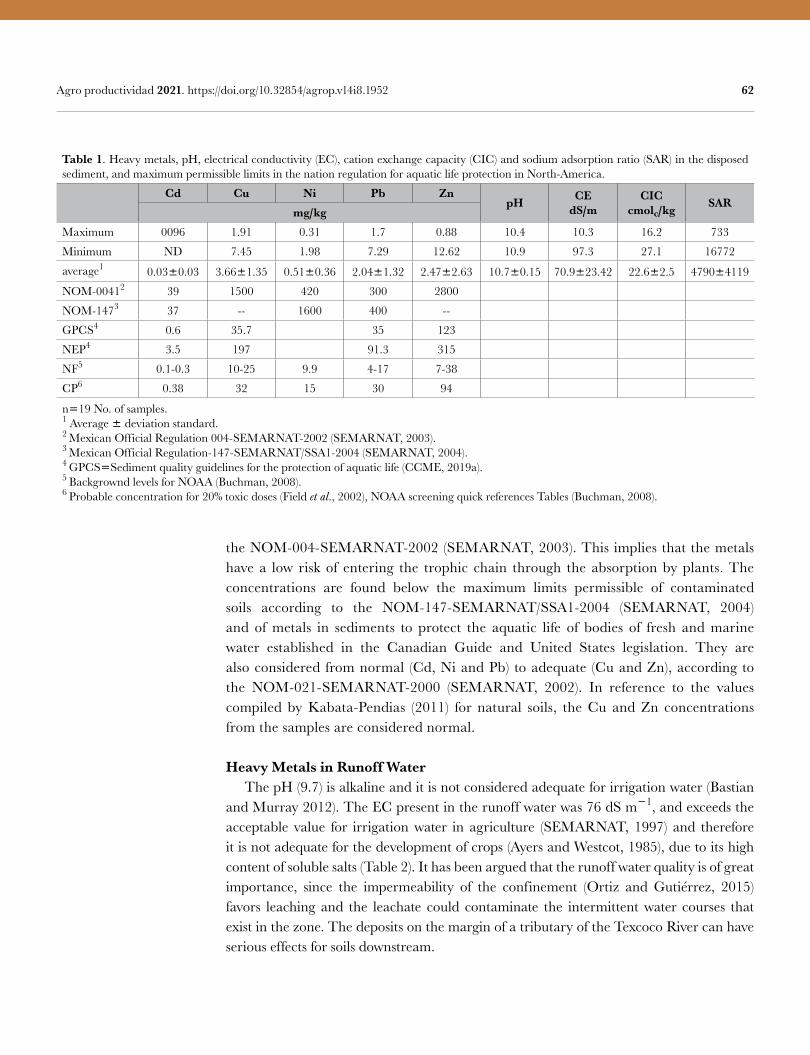
62 Agro productividad 2021. https://doi.org/10.32854/agrop.v14i8.1952
Table 1. Heavy metals, pH, electrical conductivity (EC), cation exchange capacity (CIC) and sodium adsorption ratio (SAR) in the disposed sediment, and maximum permissible limits in the nation regulation for aquatic life protection in North-America.
Cd Cu Ni Pb ZnpH CE
dS/mCIC
cmolc/kg SARmg/kg
Maximum 0096 1.91 0.31 1.7 0.88 10.4 10.3 16.2 733
Minimum ND 7.45 1.98 7.29 12.62 10.9 97.3 27.1 16772
average1 0.030.03 3.661.35 0.510.36 2.041.32 2.472.63 10.70.15 70.923.42 22.62.5 47904119
NOM-00412 39 1500 420 300 2800
NOM-1473 37 -- 1600 400 --
GPCS4 0.6 35.7 35 123
NEP4 3.5 197 91.3 315
NF5 0.1-0.3 10-25 9.9 4-17 7-38
CP6 0.38 32 15 30 94
n19 No. of samples. 1 Average deviation standard.2 Mexican Official Regulation 004-SEMARNAT-2002 (SEMARNAT, 2003).3 Mexican Official Regulation-147-SEMARNAT/SSA1-2004 (SEMARNAT, 2004).4 GPCSSediment quality guidelines for the protection of aquatic life (CCME, 2019a).5 Backgrownd levels for NOAA (Buchman, 2008).6 Probable concentration for 20% toxic doses (Field et al., 2002), NOAA screening quick references Tables (Buchman, 2008).
the NOM-004-SEMARNAT-2002 (SEMARNAT, 2003). This implies that the metals have a low risk of entering the trophic chain through the absorption by plants. The concentrations are found below the maximum limits permissible of contaminated soils according to the NOM-147-SEMARNAT/SSA1-2004 (SEMARNAT, 2004) and of metals in sediments to protect the aquatic life of bodies of fresh and marine water established in the Canadian Guide and United States legislation. They are also considered from normal (Cd, Ni and Pb) to adequate (Cu and Zn), according to the NOM-021-SEMARNAT-2000 (SEMARNAT, 2002). In reference to the values compiled by Kabata-Pendias (2011) for natural soils, the Cu and Zn concentrations from the samples are considered normal.
Heavy Metals in Runoff Water The pH (9.7) is alkaline and it is not considered adequate for irrigation water (Bastian and Murray 2012). The EC present in the runoff water was 76 dS m1, and exceeds the acceptable value for irrigation water in agriculture (SEMARNAT, 1997) and therefore it is not adequate for the development of crops (Ayers and Westcot, 1985), due to its high content of soluble salts (Table 2). It has been argued that the runoff water quality is of great importance, since the impermeability of the confinement (Ortiz and Gutiérrez, 2015) favors leaching and the leachate could contaminate the intermittent water courses that exist in the zone. The deposits on the margin of a tributary of the Texcoco River can have serious effects for soils downstream.
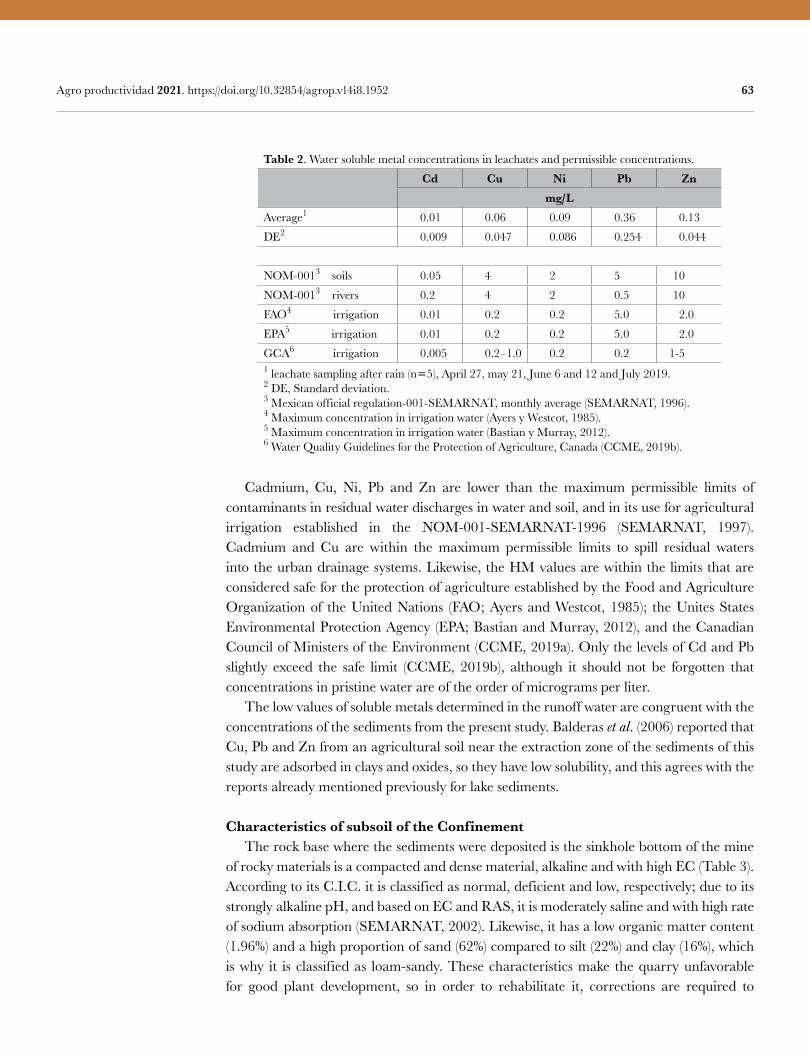
63 Agro productividad 2021. https://doi.org/10.32854/agrop.v14i8.1952
Cadmium, Cu, Ni, Pb and Zn are lower than the maximum permissible limits of contaminants in residual water discharges in water and soil, and in its use for agricultural irrigation established in the NOM-001-SEMARNAT-1996 (SEMARNAT, 1997). Cadmium and Cu are within the maximum permissible limits to spill residual waters into the urban drainage systems. Likewise, the HM values are within the limits that are considered safe for the protection of agriculture established by the Food and Agriculture Organization of the United Nations (FAO; Ayers and Westcot, 1985); the Unites States Environmental Protection Agency (EPA; Bastian and Murray, 2012), and the Canadian Council of Ministers of the Environment (CCME, 2019a). Only the levels of Cd and Pb slightly exceed the safe limit (CCME, 2019b), although it should not be forgotten that concentrations in pristine water are of the order of micrograms per liter. The low values of soluble metals determined in the runoff water are congruent with the concentrations of the sediments from the present study. Balderas et al. (2006) reported that Cu, Pb and Zn from an agricultural soil near the extraction zone of the sediments of this study are adsorbed in clays and oxides, so they have low solubility, and this agrees with the reports already mentioned previously for lake sediments.
Characteristics of subsoil of the Confinement The rock base where the sediments were deposited is the sinkhole bottom of the mine of rocky materials is a compacted and dense material, alkaline and with high EC (Table 3). According to its C.I.C. it is classified as normal, deficient and low, respectively; due to its strongly alkaline pH, and based on EC and RAS, it is moderately saline and with high rate of sodium absorption (SEMARNAT, 2002). Likewise, it has a low organic matter content (1.96%) and a high proportion of sand (62%) compared to silt (22%) and clay (16%), which is why it is classified as loam-sandy. These characteristics make the quarry unfavorable for good plant development, so in order to rehabilitate it, corrections are required to
Table 2. Water soluble metal concentrations in leachates and permissible concentrations.
Cd Cu Ni Pb Znmg/L
Average1 0.01 0.06 0.09 0.36 0.13
DE2 0.009 0.047 0.086 0.254 0.044
NOM-0013 soils 0.05 4 2 5 10
NOM-0013 rivers 0.2 4 2 0.5 10
FAO4 irrigation 0.01 0.2 0.2 5.0 2.0
EPA5 irrigation 0.01 0.2 0.2 5.0 2.0
GCA6 irrigation 0.005 0.2–1.0 0.2 0.2 1-51 leachate sampling after rain (n5), April 27, may 21, June 6 and 12 and July 2019.2 DE, Standard deviation.3 Mexican official regulation-001-SEMARNAT, monthly average (SEMARNAT, 1996).4 Maximum concentration in irrigation water (Ayers y Westcot, 1985).5 Maximum concentration in irrigation water (Bastian y Murray, 2012).6 Water Quality Guidelines for the Protection of Agriculture, Canada (CCME, 2019b).
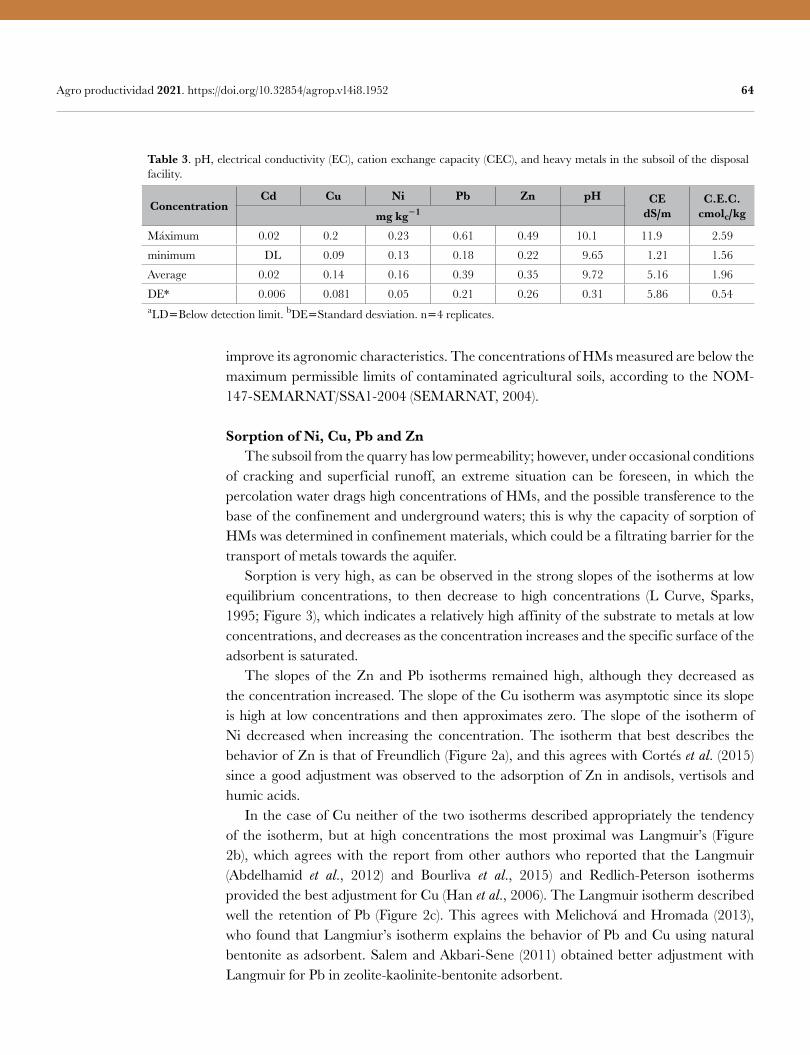
64 Agro productividad 2021. https://doi.org/10.32854/agrop.v14i8.1952
improve its agronomic characteristics. The concentrations of HMs measured are below the maximum permissible limits of contaminated agricultural soils, according to the NOM-147-SEMARNAT/SSA1-2004 (SEMARNAT, 2004).
Sorption of Ni, Cu, Pb and Zn The subsoil from the quarry has low permeability; however, under occasional conditions of cracking and superficial runoff, an extreme situation can be foreseen, in which the percolation water drags high concentrations of HMs, and the possible transference to the base of the confinement and underground waters; this is why the capacity of sorption of HMs was determined in confinement materials, which could be a filtrating barrier for the transport of metals towards the aquifer. Sorption is very high, as can be observed in the strong slopes of the isotherms at low equilibrium concentrations, to then decrease to high concentrations (L Curve, Sparks, 1995; Figure 3), which indicates a relatively high affinity of the substrate to metals at low concentrations, and decreases as the concentration increases and the specific surface of the adsorbent is saturated. The slopes of the Zn and Pb isotherms remained high, although they decreased as the concentration increased. The slope of the Cu isotherm was asymptotic since its slope is high at low concentrations and then approximates zero. The slope of the isotherm of Ni decreased when increasing the concentration. The isotherm that best describes the behavior of Zn is that of Freundlich (Figure 2a), and this agrees with Cortés et al. (2015) since a good adjustment was observed to the adsorption of Zn in andisols, vertisols and humic acids. In the case of Cu neither of the two isotherms described appropriately the tendency of the isotherm, but at high concentrations the most proximal was Langmuir’s (Figure 2b), which agrees with the report from other authors who reported that the Langmuir (Abdelhamid et al., 2012) and Bourliva et al., 2015) and Redlich-Peterson isotherms provided the best adjustment for Cu (Han et al., 2006). The Langmuir isotherm described well the retention of Pb (Figure 2c). This agrees with Melichová and Hromada (2013), who found that Langmiur’s isotherm explains the behavior of Pb and Cu using natural bentonite as adsorbent. Salem and Akbari-Sene (2011) obtained better adjustment with Langmuir for Pb in zeolite-kaolinite-bentonite adsorbent.
Table 3. pH, electrical conductivity (EC), cation exchange capacity (CEC), and heavy metals in the subsoil of the disposal facility.
ConcentrationCd Cu Ni Pb Zn pH CE
dS/mC.E.C.
cmolc/kgmg kg1
Máximum 0.02 0.2 0.23 0.61 0.49 10.1 11.9 2.59
minimum DL 0.09 0.13 0.18 0.22 9.65 1.21 1.56
Average 0.02 0.14 0.16 0.39 0.35 9.72 5.16 1.96
DE* 0.006 0.081 0.05 0.21 0.26 0.31 5.86 0.54aLDBelow detection limit. bDEStandard desviation. n4 replicates.
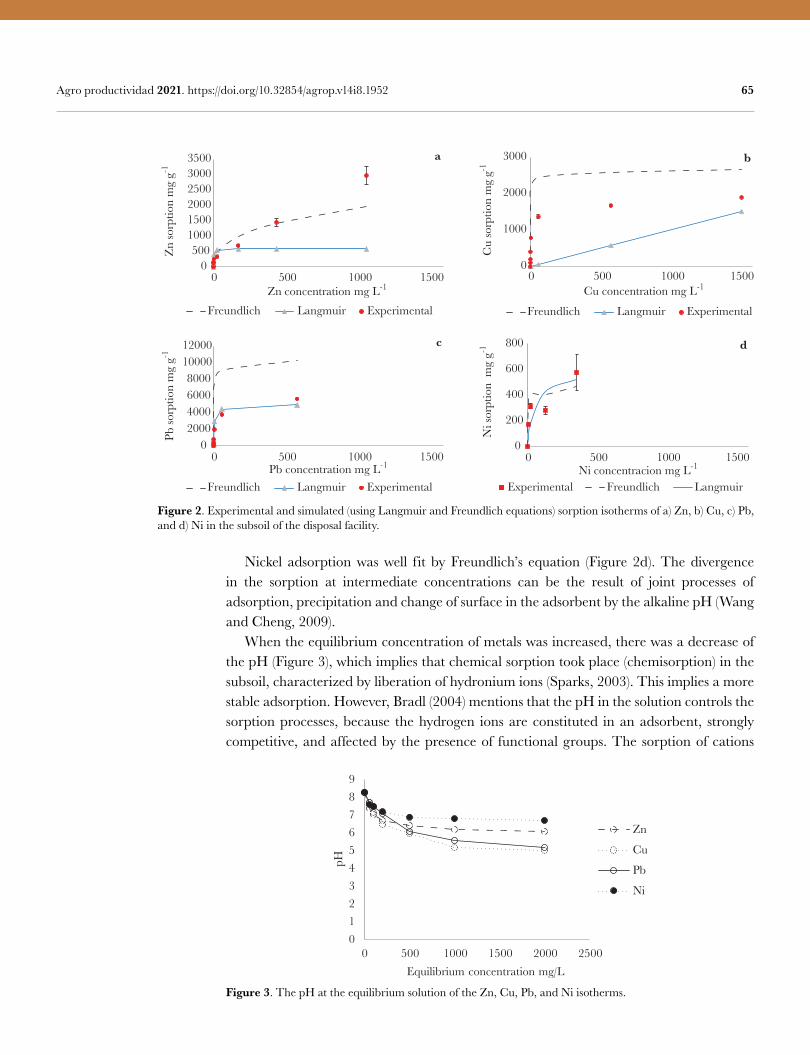
65 Agro productividad 2021. https://doi.org/10.32854/agrop.v14i8.1952
Nickel adsorption was well fit by Freundlich’s equation (Figure 2d). The divergence in the sorption at intermediate concentrations can be the result of joint processes of adsorption, precipitation and change of surface in the adsorbent by the alkaline pH (Wang and Cheng, 2009). When the equilibrium concentration of metals was increased, there was a decrease of the pH (Figure 3), which implies that chemical sorption took place (chemisorption) in the subsoil, characterized by liberation of hydronium ions (Sparks, 2003). This implies a more stable adsorption. However, Bradl (2004) mentions that the pH in the solution controls the sorption processes, because the hydrogen ions are constituted in an adsorbent, strongly competitive, and affected by the presence of functional groups. The sorption of cations
a
0500
100015002000250030003500
0 500 1000 1500
Zn so
rptio
n m
g g-1
Zn concentration mg L-1
Freundlich Langmuir Experimental
b
0
1000
2000
3000
0 500 1000 1500
Cu
sorp
tion
mg
g-1
Cu concentration mg L-1
d
0
200
400
600
800
0 500 1000 1500
Ni s
orpt
ion
mg
g-1Ni concentracion mg L-1
Experimental Freundlich Langmuir
c
02000400060008000
1000012000
0 500 1000 1500
Pb so
rptio
n m
g g-1
Pb concentration mg L-1
Freundlich Langmuir Experimental
Freundlich Langmuir Experimental
Figure 2. Experimental and simulated (using Langmuir and Freundlich equations) sorption isotherms of a) Zn, b) Cu, c) Pb, and d) Ni in the subsoil of the disposal facility.
0123456789
0 500 1000 1500 2000 2500
pH
Equilibrium concentration mg/L
Zn
Cu
Pb
Ni
Figure 3. The pH at the equilibrium solution of the Zn, Cu, Pb, and Ni isotherms.
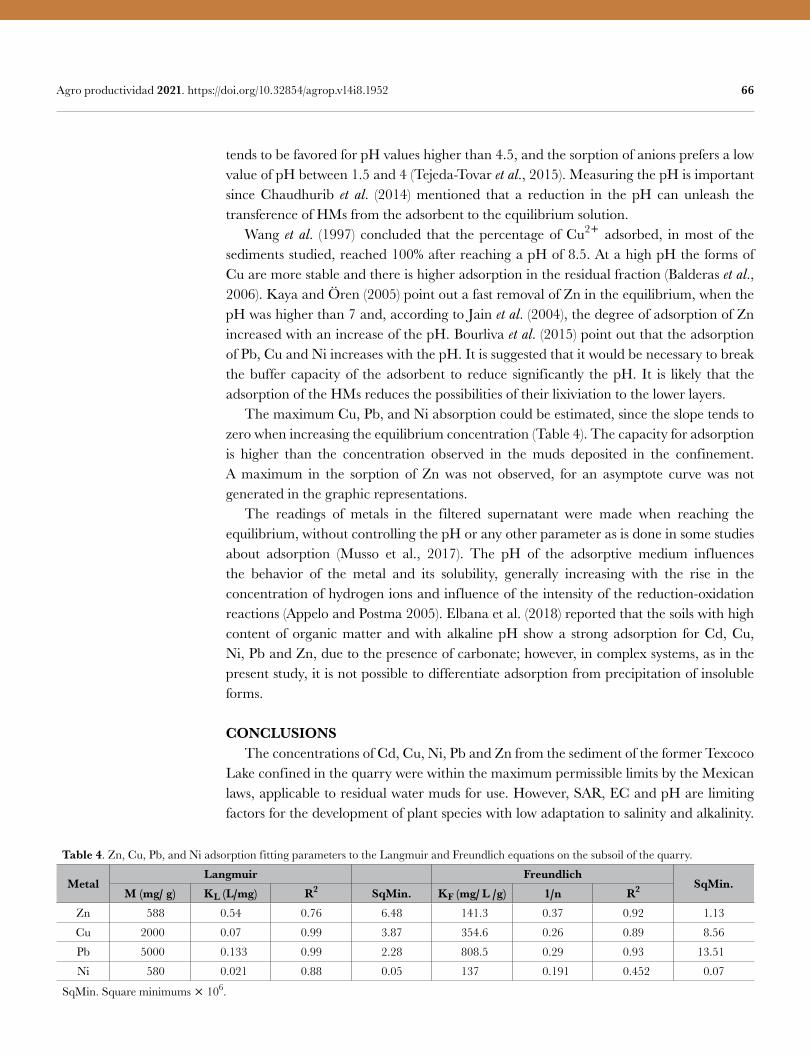
66 Agro productividad 2021. https://doi.org/10.32854/agrop.v14i8.1952
tends to be favored for pH values higher than 4.5, and the sorption of anions prefers a low value of pH between 1.5 and 4 (Tejeda-Tovar et al., 2015). Measuring the pH is important since Chaudhurib et al. (2014) mentioned that a reduction in the pH can unleash the transference of HMs from the adsorbent to the equilibrium solution. Wang et al. (1997) concluded that the percentage of Cu2 adsorbed, in most of the sediments studied, reached 100% after reaching a pH of 8.5. At a high pH the forms of Cu are more stable and there is higher adsorption in the residual fraction (Balderas et al., 2006). Kaya and Ören (2005) point out a fast removal of Zn in the equilibrium, when the pH was higher than 7 and, according to Jain et al. (2004), the degree of adsorption of Zn increased with an increase of the pH. Bourliva et al. (2015) point out that the adsorption of Pb, Cu and Ni increases with the pH. It is suggested that it would be necessary to break the buffer capacity of the adsorbent to reduce significantly the pH. It is likely that the adsorption of the HMs reduces the possibilities of their lixiviation to the lower layers. The maximum Cu, Pb, and Ni absorption could be estimated, since the slope tends to zero when increasing the equilibrium concentration (Table 4). The capacity for adsorption is higher than the concentration observed in the muds deposited in the confinement. A maximum in the sorption of Zn was not observed, for an asymptote curve was not generated in the graphic representations. The readings of metals in the filtered supernatant were made when reaching the equilibrium, without controlling the pH or any other parameter as is done in some studies about adsorption (Musso et al., 2017). The pH of the adsorptive medium influences the behavior of the metal and its solubility, generally increasing with the rise in the concentration of hydrogen ions and influence of the intensity of the reduction-oxidation reactions (Appelo and Postma 2005). Elbana et al. (2018) reported that the soils with high content of organic matter and with alkaline pH show a strong adsorption for Cd, Cu, Ni, Pb and Zn, due to the presence of carbonate; however, in complex systems, as in the present study, it is not possible to differentiate adsorption from precipitation of insoluble forms.
CONCLUSIONS The concentrations of Cd, Cu, Ni, Pb and Zn from the sediment of the former Texcoco Lake confined in the quarry were within the maximum permissible limits by the Mexican laws, applicable to residual water muds for use. However, SAR, EC and pH are limiting factors for the development of plant species with low adaptation to salinity and alkalinity.
Table 4. Zn, Cu, Pb, and Ni adsorption fitting parameters to the Langmuir and Freundlich equations on the subsoil of the quarry.
MetalLangmuir Freundlich
SqMin.M (mg/ g) KL (L/mg) R2 SqMin. KF (mg/ L /g) 1/n R2
Zn 588 0.54 0.76 6.48 141.3 0.37 0.92 1.13
Cu 2000 0.07 0.99 3.87 354.6 0.26 0.89 8.56
Pb 5000 0.133 0.99 2.28 808.5 0.29 0.93 13.51
Ni 580 0.021 0.88 0.05 137 0.191 0.452 0.07
SqMin. Square minimums 106.
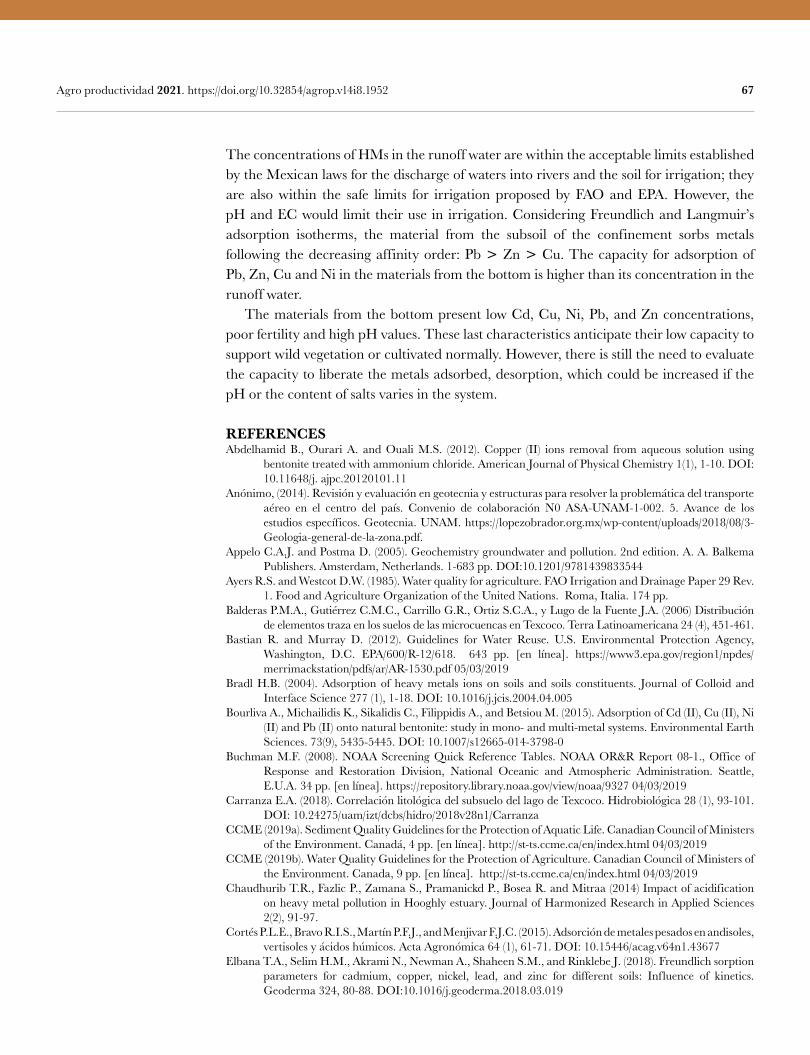
67 Agro productividad 2021. https://doi.org/10.32854/agrop.v14i8.1952
The concentrations of HMs in the runoff water are within the acceptable limits established by the Mexican laws for the discharge of waters into rivers and the soil for irrigation; they are also within the safe limits for irrigation proposed by FAO and EPA. However, the pH and EC would limit their use in irrigation. Considering Freundlich and Langmuir’s adsorption isotherms, the material from the subsoil of the confinement sorbs metals following the decreasing affinity order: Pb Zn Cu. The capacity for adsorption of Pb, Zn, Cu and Ni in the materials from the bottom is higher than its concentration in the runoff water. The materials from the bottom present low Cd, Cu, Ni, Pb, and Zn concentrations, poor fertility and high pH values. These last characteristics anticipate their low capacity to support wild vegetation or cultivated normally. However, there is still the need to evaluate the capacity to liberate the metals adsorbed, desorption, which could be increased if the pH or the content of salts varies in the system.
REFERENCESAbdelhamid B., Ourari A. and Ouali M.S. (2012). Copper (II) ions removal from aqueous solution using
bentonite treated with ammonium chloride. American Journal of Physical Chemistry 1(1), 1-10. DOI: 10.11648/j. ajpc.20120101.11
Anónimo, (2014). Revisión y evaluación en geotecnia y estructuras para resolver la problemática del transporte aéreo en el centro del país. Convenio de colaboración N0 ASA-UNAM-1-002. 5. Avance de los estudios específicos. Geotecnia. UNAM. https://lopezobrador.org.mx/wp-content/uploads/2018/08/3-Geologia-general-de-la-zona.pdf.
Appelo C.A.J. and Postma D. (2005). Geochemistry groundwater and pollution. 2nd edition. A. A. Balkema Publishers. Amsterdam, Netherlands. 1-683 pp. DOI:10.1201/9781439833544
Ayers R.S. and Westcot D.W. (1985). Water quality for agriculture. FAO Irrigation and Drainage Paper 29 Rev. 1. Food and Agriculture Organization of the United Nations. Roma, Italia. 174 pp.
Balderas P.M.A., Gutiérrez C.M.C., Carrillo G.R., Ortiz S.C.A., y Lugo de la Fuente J.A. (2006) Distribución de elementos traza en los suelos de las microcuencas en Texcoco. Terra Latinoamericana 24 (4), 451-461.
Bastian R. and Murray D. (2012). Guidelines for Water Reuse. U.S. Environmental Protection Agency, Washington, D.C. EPA/600/R-12/618. 643 pp. [en línea]. https://www3.epa.gov/region1/npdes/merrimackstation/pdfs/ar/AR-1530.pdf 05/03/2019
Bradl H.B. (2004). Adsorption of heavy metals ions on soils and soils constituents. Journal of Colloid and Interface Science 277 (1), 1-18. DOI: 10.1016/j.jcis.2004.04.005
Bourliva A., Michailidis K., Sikalidis C., Filippidis A., and Betsiou M. (2015). Adsorption of Cd (II), Cu (II), Ni (II) and Pb (II) onto natural bentonite: study in mono- and multi-metal systems. Environmental Earth Sciences. 73(9), 5435-5445. DOI: 10.1007/s12665-014-3798-0
Buchman M.F. (2008). NOAA Screening Quick Reference Tables. NOAA OR&R Report 08-1., Office of Response and Restoration Division, National Oceanic and Atmospheric Administration. Seattle, E.U.A. 34 pp. [en línea]. https://repository.library.noaa.gov/view/noaa/9327 04/03/2019
Carranza E.A. (2018). Correlación litológica del subsuelo del lago de Texcoco. Hidrobiológica 28 (1), 93-101. DOI: 10.24275/uam/izt/dcbs/hidro/2018v28n1/Carranza
CCME (2019a). Sediment Quality Guidelines for the Protection of Aquatic Life. Canadian Council of Ministers of the Environment. Canadá, 4 pp. [en línea]. http://st-ts.ccme.ca/en/index.html 04/03/2019
CCME (2019b). Water Quality Guidelines for the Protection of Agriculture. Canadian Council of Ministers of the Environment. Canada, 9 pp. [en línea]. http://st-ts.ccme.ca/en/index.html 04/03/2019
Chaudhurib T.R., Fazlic P., Zamana S., Pramanickd P., Bosea R. and Mitraa (2014) Impact of acidification on heavy metal pollution in Hooghly estuary. Journal of Harmonized Research in Applied Sciences 2(2), 91-97.
Cortés P.L.E., Bravo R.I.S., Martín P.F.J., and Menjivar F.J.C. (2015). Adsorción de metales pesados en andisoles, vertisoles y ácidos húmicos. Acta Agronómica 64 (1), 61-71. DOI: 10.15446/acag.v64n1.43677
Elbana T.A., Selim H.M., Akrami N., Newman A., Shaheen S.M., and Rinklebe J. (2018). Freundlich sorption parameters for cadmium, copper, nickel, lead, and zinc for different soils: Influence of kinetics. Geoderma 324, 80-88. DOI:10.1016/j.geoderma.2018.03.019
68 Agro productividad 2021. https://doi.org/10.32854/agrop.v14i8.1952
Field L.J., MacDonald D.M., Norton S.B., Ingersoll C.G., Severn C.G., Smorong D., and Lindskoog R. (2002). Predicting amphipod toxicity from sediment chemistry using logistic regression models. Environmental Toxicology and Chemistry 21(9), 1993–2005. DOI: 10.1002/etc.5620210929
GACM (2014). Manifestación de Impacto Ambiental Modalidad Regional del Nuevo Aeropuerto Internacional de la Ciudad de México. Resumen Ejecutivo Grupo Aeroportuario de la Ciudad de México, S.A. de C.V. México. 22 pp. [en línea]. https://apps1.semarnat.gob.mx:445/dgiraDocs/documentos/mex/resumenes/2014/15EM2014V0044.pdf 5/03/2019
Green J. A., Pavlish J. A. Merritt R. G., and Leete J. L. (2005). Hydraulic impact of quarries and gravel pits. Minnesota Environment and Natural Resources Trust Fund. pp. 35.
Han R., Lu Z., Zou W., Daotong W., Shi J. and Jiujun Y. (2006). Removal of copper (II) and lead (II) from aqueous solution by manganese oxide coated sand: II. Equilibrium study and competitive adsorption. Journal of Hazardous Materials 137(1), 480-488. DOI: 10.1016/j.jhazmat.2006.02.018
Hazelton P. y B. Murphy. (2007). Interpreting soil test results. What do all the numbers mean? CSIIRO. Publishing. Australia.
Jain C.K., Singhal D.C. and Sharma M.K. (2004). Adsorption of zinc on bed sediment of River Hindon: adsorption models and kinetics. Journal of Hazardous Materials 114(1-3), 231-239. DOI: 10.1016/j.jhazmat.2004.09.001
Kabata-Pendias A. (2011). Trace elements in soils and plants. 4th ed. Taylor and Francis Group. New York, U.S.A. 505 pp.
Kaya A. and Ören A. H. (2005). Adsorption of zinc from aqueous solutions to bentonite. Journal of Hazardous Materials 125 (1-3), 183-189. DOI: 10.1016/j.jhazmat.2005.05.027
Korkmaz H., Cetin B., Ege I., Karatas A., Bom A., and Ozsahin E. (2001). Environmental effects of Stone pits in Hatay (Turkey). Procedia Social and Behavioral Sciences 19, 504-510
López A.N.P., Espinosa S.A.L. and Zuluaga B.D. (2016). Sobre la permeabilidad del subsuelo en la zona del ex Lago de Texcoco. Memoria de la XXVIII Reunión Nacional de Ingeniería Geotécnica. Mérida Yucatán. 23-26 de noviembre de 2016.
Luo M., Li J., Cao W. and Wang M. (2008). Study of heavy metals speciation in branch sediments of Poyang Lake. Journal Environmental Sciences 20 (2), 161-166. DOI: 10.1016/S1001-0742(08)60025-X
Melichová Z. and Hromada L. (2013). Adsorption of Pb2+ and Cu2+ ions from aqueous solutions on natural bentonite. Pol. J. Environ. Stud. 22 (2), 457-464.
Morales-García S.S. Meza-Olvera E., Shruti V.C., Sedeño-Díaz J.E., (2020). Assessment of metal contamination and their ecological risks in wetland sediments of the former Texcoco saline lake, México. Journal Soil Sediments 20, 2912-2930.
Morton-Bermea O., Hernández-Álvarez E., González-Hernández G., Romero F., Lozano R. and Beramendi-Orosco L.E. (2009). Assessment of heavy metal pollution in urban topsoils from the metropolitan area of Mexico City, Journal of Geochemical Exploration 101 (3), 218-224. DOI: 10.1016/j.gexplo.2008.07.002
Musso T.B., Pettinari G., Parolo M.E. and Mesquín L. (2017). Arcillas esmectíticas de la región Norpatagónica Argentina como barreras hidráulicas de rellenos sanitarios y agentes de retención de metales pesados. Revista Internacional de Contaminación Ambiental 33 (1), 141-152. DOI: 10.20937/RICA.2017.33.01.13
Ortiz S.C.A. and Gutiérrez C.M. del C. (2015). El Nuevo Aeropuerto Internacional de la Ciudad de México: Las limitaciones de los terrenos del ex lago de Texcoco. Artículos y Ensayos de Sociología Rural 10 (19). 11-23.
Pejman A., Bidhendi G. N., Ardestani M., Saeedi M. and Baghvand A. (2015). A new index for assessing heavy metals contamination in sediments: a case study. Ecological Indicators 58, 365-373. DOI: 10.1016/j.ecolind.2015.06.012
QGIS Development Team (2009). QGIS Geographic Information System. Open Source Geospatial Foundation. [en línea]. https://qgis.org/es/site/ 06/03/2019
Roy W., Krapac I., Chou S. and Griffin R. (1992). Batch-type procedures for estimating soil adsorption of chemicals. U.S. Environmental Protection Agency, Washington, D.C., EPA/530/SW-87/006F. 116 pp. [en línea]. https://nepis.epa.gov/Exe/ZyPDF.cgi/100018S4.PDF?Dockey=100018S4.PDF 5/03/2019
Rowell, D.L., 1994. Soil Science: Methods and Applications. Longman Scientific & Technical/John Wiley & Sons.
Salem A. and Akbari-Sene R. (2011). Removal of lead from solution by combination of natural zeolite–kaolin–bentonite as a new low-cost adsorbent. Chemical Engineering Journal. 174 (2-3), 619-628. DOI: 10.1016/j.cej.2011.09.075
69 Agro productividad 2021. https://doi.org/10.32854/agrop.v14i8.1952
SE (2016a). Norma Mexicana NMX-AA-051-SCFI-2016. Análisis de agua. Medición de metales por absorción atómica en aguas naturales, potables, residuales y residuales tratadas. Método de prueba. Secretaría de Economía. Diario Oficial de la Federación. 3 de noviembre de 2016.
SE (2017). Norma Mexicana NMX-AA-132-SCFI-2006. Muestreo de suelos para la identificación y la cuantificación de metales y metaloides, y manejo de la muestra. Secretaría de Economía. Diario Oficial de la Federación. 06 de marzo de 2017.
SECOFI (1980). Norma Mexicana NMX-AA-003-1998. Aguas residuales. Muestreo. Secretaría de Comercio y Fomento Industrial. Diario Oficial de la Federación. 6 de noviembre de 1992.
Segura C.M.A., Gutiérrez C.M. del C., Ortiz S.C.A., and Gómez D.D.J. (2000). Suelos arcillosos de la zona oriente del Estado de México. Terra Latinoamericana 18 (1). 35-44.
SEMARNAT (1997). Norma Oficial Mexicana NOM-001-SEMARNAT-1996. Límites máximos permisibles de contaminantes en las descargas de aguas residuales en aguas y bienes nacionales. Secretaría de Medio Ambiente y Recursos Naturales. Diario Oficial de la Federación. 23 de abril de 2003.
SEMARNAT (2002). Norma Oficial Mexicana NOM-021-SEMARNAT-2000. Especificaciones de fertilidad, salinidad y clasificación de suelos. Estudios, muestreo y análisis. Secretaría de Medio Ambiente y Recursos Naturales. Diario Oficial de la Federación. 31 de diciembre de 2002.
SEMARNAT (2003). Norma Oficial Mexicana NOM-004-SEMARNAT-2002. Lodos y biosólidos. Especificaciones y límites máximos permisibles de contaminantes para su aprovechamiento y disposición final. Secretaría de Medio Ambiente y Recursos Naturales. Diario Oficial de la Federación. 15 de agosto de 2003.
SEMARNAT (2004). Norma Oficial Mexicana NOM-147-SEMARNAT/SSA1-2004. Criterios para determinar las concentraciones de remediación de suelos contaminados por arsénico, bario, berilio, cadmio, cromo hexavalente, mercurio, níquel, plata, plomo, selenio, talio y/o vanadio. Secretaría de Medio Ambiente y Recursos Naturales. Diario Oficial de la Federación. 2 de marzo de 2007.
SGM (2002). Carta geológico-minera 1:250,000. E14-2. Ciudad de México. Servicio Geológico Minero. [en línea]. http://mapserver.sgm.gob.mx/Cartas_Online/geologia/89_E14-2_GM.pdf 06/03/2019
Siltecho S., Hammecker C., Sriboonlue V., Clermont-Dauphin C., Trelo-Ges V., Antonino A.C.D. and Angulo-Jaramillo R. (2015). Use of field and laboratory methods for estimating unsaturated hydraulic properties under different land uses, Hydrol. Earth Syst. Sci. 19, 1193-1207. DOI: 10.5194/hess-19-1193-2015
Sobczynski T. and Siepak J. (2001). Speciation of heavy metals in botton sediments of lakes in the area of Wielkopolske National Park. Polish Journal of Environmental Studies 10(6), 463-474.
Sparks D.L. (2003). Environmental soil chemistry. 2a ed. Elsevier. San Diego, California, U.S.A. 352 pp.Tarín V. M. and Velázquez L.A. (1986). Lavado de suelos en el ex-Lago de Texcoco. Ingeniería Hidráulica en
México. Mayo-Agosto: 30-49 pp.Tejeda-Tovar C., Villabona-Ortiz A., and Garcés-Jaraba L. (2015). Adsorción de metales pesados en aguas
residuales usando materiales de origen biológico. Tecno Lógicas 18 (34), 109-123. Van der Perk M. (2013). Soil and water contamination. 2nd ed. CRC Press. Balkema. Netherlands. 428 pp. Vowotor M.K., Hood C.O., Sackey S.S., Owusu A., Tatchie E., Nyarko S., Osel D.M., Mireku K.K., Letsa
C.B. and Atleomo S.M. (2014). An assessment of heavy metal pollution in sediments of a tropical lagoon: A case study of the Benya Lagoon, Komenda Edina Eguafo Abrem Municipality (KEEA) Ghana. Journal of Health and Pollution 4(6), 26-39. DOI: 10.5696/2156-9614-4-6.26
Wang J.L. and Chen C. (2009). Biosorbents for heavy metals removal and their future. Biotechnology Advances 27 (2), 195-226. DOI: 10.1016/j.biotechadv.2008.11.002
Wang F.Y., Chen J.S. and Forsling W. (1997). Modeling sorption of trace metals on natural sediments by surface complexation model. Env. Sci. Technol. 31 (2), 448-453. DOI: 10.1021/es960270a
Wu B., Wang G., Wu J., Fu Q. and Liu C. (2014). Sources of heavy metals in surface sediments and an ecological risk assessment from two adjacent Plateau reservoirs. PloS one 9 (7). DOI: 10.1371/journal.pone.0102101

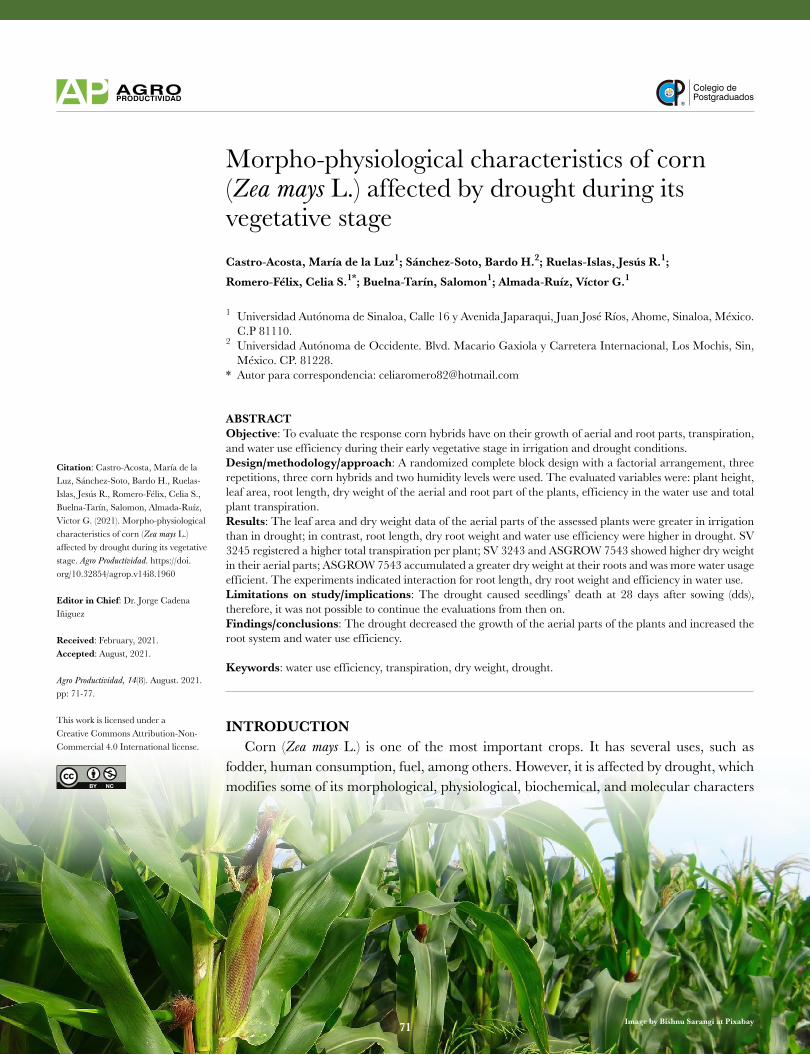
Colegio dePostgraduados
71
Morpho-physiological characteristics of corn (Zea mays L.) affected by drought during its vegetative stageCastro-Acosta, María de la Luz1; Sánchez-Soto, Bardo H.2; Ruelas-Islas, Jesús R.1;
Romero-Félix, Celia S.1*; Buelna-Tarín, Salomon1; Almada-Ruíz, Víctor G.1
1 Universidad Autónoma de Sinaloa, Calle 16 y Avenida Japaraqui, Juan José Ríos, Ahome, Sinaloa, México. C.P 81110.
2 Universidad Autónoma de Occidente. Blvd. Macario Gaxiola y Carretera Internacional, Los Mochis, Sin, México. CP. 81228.
* Autor para correspondencia: [email protected]
ABSTRACT Objective: To evaluate the response corn hybrids have on their growth of aerial and root parts, transpiration, and water use efficiency during their early vegetative stage in irrigation and drought conditions.Design/methodology/approach: A randomized complete block design with a factorial arrangement, three repetitions, three corn hybrids and two humidity levels were used. The evaluated variables were: plant height, leaf area, root length, dry weight of the aerial and root part of the plants, efficiency in the water use and total plant transpiration.Results: The leaf area and dry weight data of the aerial parts of the assessed plants were greater in irrigation than in drought; in contrast, root length, dry root weight and water use efficiency were higher in drought. SV 3245 registered a higher total transpiration per plant; SV 3243 and ASGROW 7543 showed higher dry weight in their aerial parts; ASGROW 7543 accumulated a greater dry weight at their roots and was more water usage efficient. The experiments indicated interaction for root length, dry root weight and efficiency in water use.Limitations on study/implications: The drought caused seedlings’ death at 28 days after sowing (dds), therefore, it was not possible to continue the evaluations from then on.Findings/conclusions: The drought decreased the growth of the aerial parts of the plants and increased the root system and water use efficiency.
Keywords: water use efficiency, transpiration, dry weight, drought.
INTRODUCTION Corn (Zea mays L.) is one of the most important crops. It has several uses, such as fodder, human consumption, fuel, among others. However, it is affected by drought, which modifies some of its morphological, physiological, biochemical, and molecular characters
Citation: Castro-Acosta, María de la Luz, Sánchez-Soto, Bardo H., Ruelas-Islas, Jesús R., Romero-Félix, Celia S., Buelna-Tarín, Salomon, Almada-Ruíz, Victor G. (2021). Morpho-physiological characteristics of corn (Zea mays L.) affected by drought during its vegetative stage. Agro Productividad. https://doi.org/10.32854/agrop.v14i8.1960
Editor in Chief: Dr. Jorge Cadena Iñiguez
Received: February, 2021.Accepted: August, 2021.
Agro Productividad, 14(8). August. 2021. pp: 71-77.
This work is licensed under a Creative Commons Attribution-Non-Commercial 4.0 International license.
Image by Bishnu Sarangi at Pixabay 71
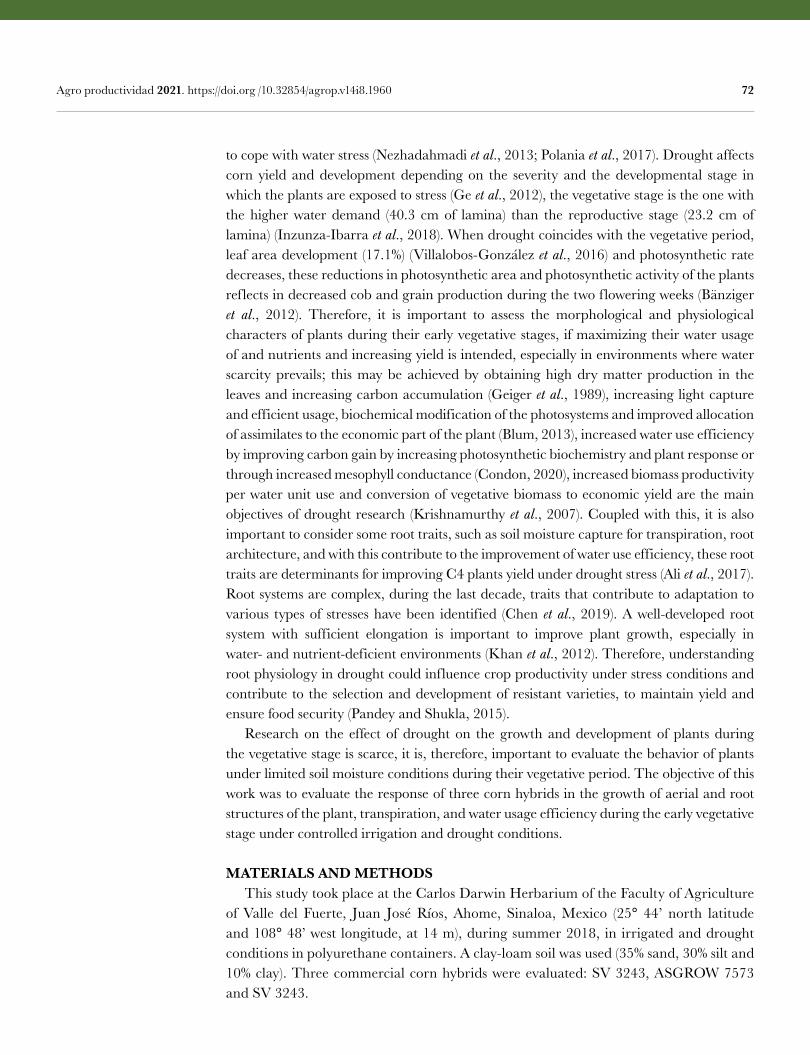
72 Agro productividad 2021. https://doi.org /10.32854/agrop.v14i8.1960
to cope with water stress (Nezhadahmadi et al., 2013; Polania et al., 2017). Drought affects corn yield and development depending on the severity and the developmental stage in which the plants are exposed to stress (Ge et al., 2012), the vegetative stage is the one with the higher water demand (40.3 cm of lamina) than the reproductive stage (23.2 cm of lamina) (Inzunza-Ibarra et al., 2018). When drought coincides with the vegetative period, leaf area development (17.1%) (Villalobos-González et al., 2016) and photosynthetic rate decreases, these reductions in photosynthetic area and photosynthetic activity of the plants reflects in decreased cob and grain production during the two flowering weeks (Bänziger et al., 2012). Therefore, it is important to assess the morphological and physiological characters of plants during their early vegetative stages, if maximizing their water usage of and nutrients and increasing yield is intended, especially in environments where water scarcity prevails; this may be achieved by obtaining high dry matter production in the leaves and increasing carbon accumulation (Geiger et al., 1989), increasing light capture and efficient usage, biochemical modification of the photosystems and improved allocation of assimilates to the economic part of the plant (Blum, 2013), increased water use efficiency by improving carbon gain by increasing photosynthetic biochemistry and plant response or through increased mesophyll conductance (Condon, 2020), increased biomass productivity per water unit use and conversion of vegetative biomass to economic yield are the main objectives of drought research (Krishnamurthy et al., 2007). Coupled with this, it is also important to consider some root traits, such as soil moisture capture for transpiration, root architecture, and with this contribute to the improvement of water use efficiency, these root traits are determinants for improving C4 plants yield under drought stress (Ali et al., 2017). Root systems are complex, during the last decade, traits that contribute to adaptation to various types of stresses have been identified (Chen et al., 2019). A well-developed root system with sufficient elongation is important to improve plant growth, especially in water- and nutrient-deficient environments (Khan et al., 2012). Therefore, understanding root physiology in drought could influence crop productivity under stress conditions and contribute to the selection and development of resistant varieties, to maintain yield and ensure food security (Pandey and Shukla, 2015). Research on the effect of drought on the growth and development of plants during the vegetative stage is scarce, it is, therefore, important to evaluate the behavior of plants under limited soil moisture conditions during their vegetative period. The objective of this work was to evaluate the response of three corn hybrids in the growth of aerial and root structures of the plant, transpiration, and water usage efficiency during the early vegetative stage under controlled irrigation and drought conditions.
MATERIALS AND METHODS This study took place at the Carlos Darwin Herbarium of the Faculty of Agriculture of Valle del Fuerte, Juan José Ríos, Ahome, Sinaloa, Mexico (25° 44ʼ north latitude and 108° 48’ west longitude, at 14 m), during summer 2018, in irrigated and drought conditions in polyurethane containers. A clay-loam soil was used (35% sand, 30% silt and 10% clay). Three commercial corn hybrids were evaluated: SV 3243, ASGROW 7573 and SV 3243.
73 Agro productividad 2021. https://doi.org /10.32854/agrop.v14i8.1960
Experimental design and treatments The sowing occurred on June 19, 2018. The experiment had two soil moisture treatments: irrigation (I) with water applied from sowing to 28 days after sowing (dds) and drought (D), where water was suspended from 19 dds on (when the plants had four leaves). The genotypes were assigned to a randomized complete block design with three repetitions in I and three in D treatments; The experimental unit consisted of an individual plant, grown in a three kg soil container. Each of the containers was filled with a soil (60%) and sand (40%) mixture. The soil was watered and once the water stopped draining, its weight was recorded and set as the initial weight at field capacity (IWFC) in each experimental unit. In the drought treatments, the containers were weighed every third day, to calculate the lost amount of water from direct evaporation in the soil and add the required water to maintain each containerʼs soil moisture level close to the IWFC from planting to 28 das. The procedure in the D treatments was the same as in I; however, 19 days after the beginning of the irrigation it was suspended, and the container’s weight was recorded 28 days after the end of the experiment.
Evaluated Variables Plant height (PH, cm): measured from the base of the plant to the apex of the longest leaf. Leaf area per plant (FA, cm2): the area (cm2) of the leaves was measured by multiplying the length (cm) width (cm) 0.75 (Villalobos-González et al., 2019) at 28 das. Root length (LR, cm): determined by measuring the total length from the nodal region to the apex of the longest root. Shoot dry weight (SDW, g): assessed by adding the accumulated dry matter in the vegetative aerial organs (stem and leaves) after samples were dried in an oven (Riossa®). Root dry weight (RDW, g): determined by obtaining the dry weight in an oven (Riossa®) at 70 °C for 48 hours. Total transpiration per plant (TT, kg): calculated as the difference between the IWFC and the weight of the container assessed every third day and subsequently adding each obtained value. Water use efficiency for total plant biomass production (WUETBP, g of TBP/kg of evapotranspired H2O): calculated by dividing the total plant biomass (SDWRDW)/TT.
Statistical analysis An analysis of variance (ANOVA) was performed in the SAS statistical program in combined R and S form, as a series of experiments (YijkHiGjHGijB(i)jEijk), to determine the differences between the soil moisture treatments (H), genotypes (G) and the GH interaction, and an individual ANOVA (YijGiBjEij) for irrigation and continued in those response variables in which there was a significant effect of the GH interaction. The comparison of means was carried out with the Tukey test (P0.05).
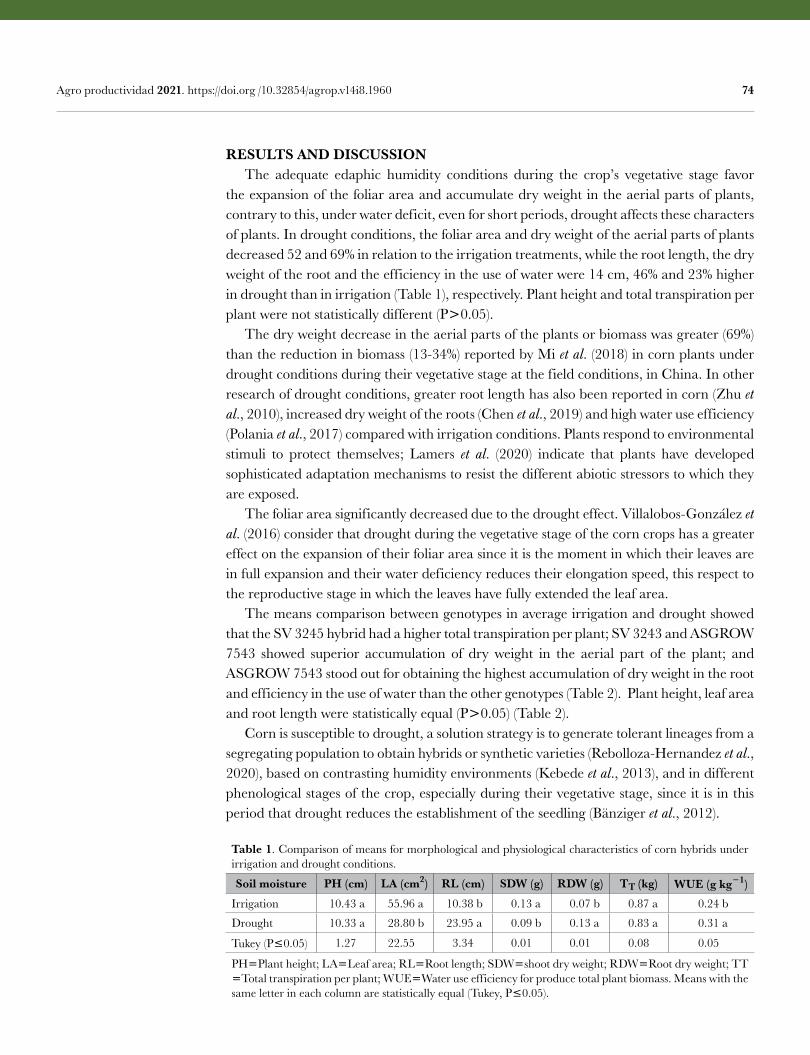
74 Agro productividad 2021. https://doi.org /10.32854/agrop.v14i8.1960
RESULTS AND DISCUSSION The adequate edaphic humidity conditions during the cropʼs vegetative stage favor the expansion of the foliar area and accumulate dry weight in the aerial parts of plants, contrary to this, under water deficit, even for short periods, drought affects these characters of plants. In drought conditions, the foliar area and dry weight of the aerial parts of plants decreased 52 and 69% in relation to the irrigation treatments, while the root length, the dry weight of the root and the efficiency in the use of water were 14 cm, 46% and 23% higher in drought than in irrigation (Table 1), respectively. Plant height and total transpiration per plant were not statistically different (P0.05). The dry weight decrease in the aerial parts of the plants or biomass was greater (69%) than the reduction in biomass (13-34%) reported by Mi et al. (2018) in corn plants under drought conditions during their vegetative stage at the field conditions, in China. In other research of drought conditions, greater root length has also been reported in corn (Zhu et al., 2010), increased dry weight of the roots (Chen et al., 2019) and high water use efficiency (Polania et al., 2017) compared with irrigation conditions. Plants respond to environmental stimuli to protect themselves; Lamers et al. (2020) indicate that plants have developed sophisticated adaptation mechanisms to resist the different abiotic stressors to which they are exposed. The foliar area significantly decreased due to the drought effect. Villalobos-González et al. (2016) consider that drought during the vegetative stage of the corn crops has a greater effect on the expansion of their foliar area since it is the moment in which their leaves are in full expansion and their water deficiency reduces their elongation speed, this respect to the reproductive stage in which the leaves have fully extended the leaf area. The means comparison between genotypes in average irrigation and drought showed that the SV 3245 hybrid had a higher total transpiration per plant; SV 3243 and ASGROW 7543 showed superior accumulation of dry weight in the aerial part of the plant; and ASGROW 7543 stood out for obtaining the highest accumulation of dry weight in the root and efficiency in the use of water than the other genotypes (Table 2). Plant height, leaf area and root length were statistically equal (P0.05) (Table 2). Corn is susceptible to drought, a solution strategy is to generate tolerant lineages from a segregating population to obtain hybrids or synthetic varieties (Rebolloza-Hernandez et al., 2020), based on contrasting humidity environments (Kebede et al., 2013), and in different phenological stages of the crop, especially during their vegetative stage, since it is in this period that drought reduces the establishment of the seedling (Bänziger et al., 2012).
Table 1. Comparison of means for morphological and physiological characteristics of corn hybrids under irrigation and drought conditions.
Soil moisture PH (cm) LA (cm2) RL (cm) SDW (g) RDW (g) TT (kg) WUE (g kg1)Irrigation 10.43 a 55.96 a 10.38 b 0.13 a 0.07 b 0.87 a 0.24 b
Drought 10.33 a 28.80 b 23.95 a 0.09 b 0.13 a 0.83 a 0.31 a
Tukey (P0.05) 1.27 22.55 3.34 0.01 0.01 0.08 0.05
PHPlant height; LALeaf area; RLRoot length; SDWshoot dry weight; RDWRoot dry weight; TT Total transpiration per plant; WUEWater use efficiency for produce total plant biomass. Means with the same letter in each column are statistically equal (Tukey, P0.05).
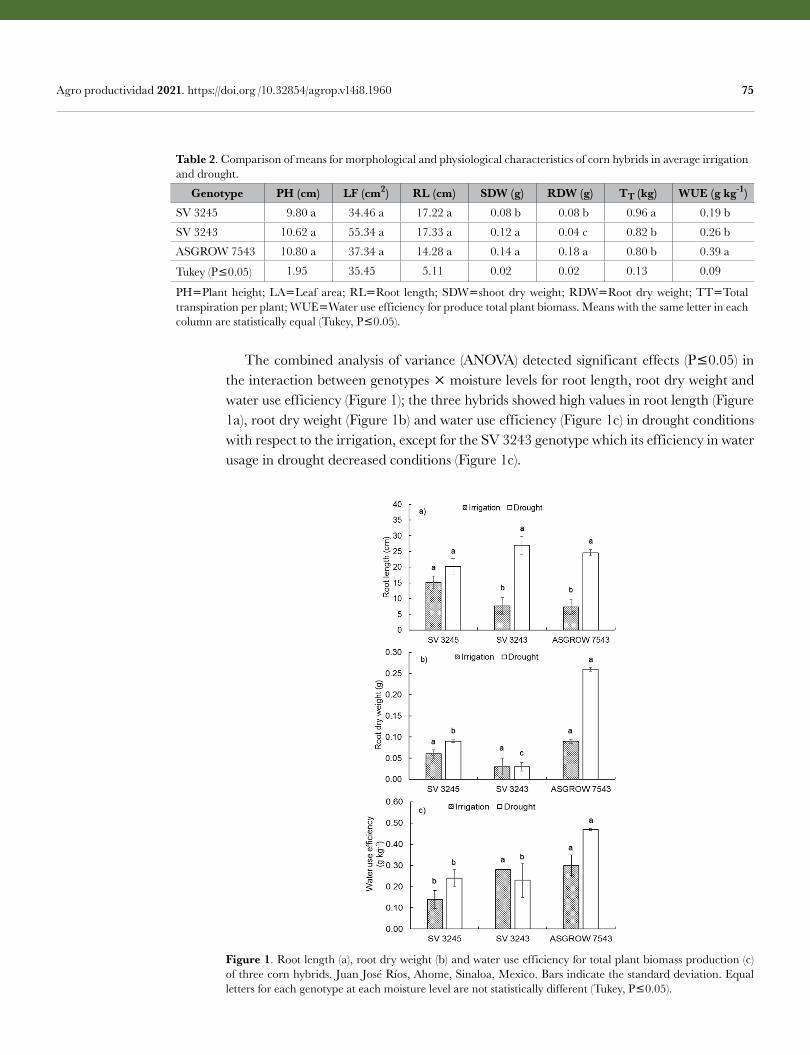
75 Agro productividad 2021. https://doi.org /10.32854/agrop.v14i8.1960
The combined analysis of variance (ANOVA) detected significant effects (P0.05) in the interaction between genotypes moisture levels for root length, root dry weight and water use efficiency (Figure 1); the three hybrids showed high values in root length (Figure 1a), root dry weight (Figure 1b) and water use efficiency (Figure 1c) in drought conditions with respect to the irrigation, except for the SV 3243 genotype which its efficiency in water usage in drought decreased conditions (Figure 1c).
Table 2. Comparison of means for morphological and physiological characteristics of corn hybrids in average irrigation and drought.
Genotype PH (cm) LF (cm2) RL (cm) SDW (g) RDW (g) TT (kg) WUE (g kg-1)SV 3245 9.80 a 34.46 a 17.22 a 0.08 b 0.08 b 0.96 a 0.19 b
SV 3243 10.62 a 55.34 a 17.33 a 0.12 a 0.04 c 0.82 b 0.26 b
ASGROW 7543 10.80 a 37.34 a 14.28 a 0.14 a 0.18 a 0.80 b 0.39 a
Tukey (P0.05) 1.95 35.45 5.11 0.02 0.02 0.13 0.09
PHPlant height; LALeaf area; RLRoot length; SDWshoot dry weight; RDWRoot dry weight; TTTotal transpiration per plant; WUEWater use efficiency for produce total plant biomass. Means with the same letter in each column are statistically equal (Tukey, P0.05).
Figure 1. Root length (a), root dry weight (b) and water use efficiency for total plant biomass production (c) of three corn hybrids. Juan José Ríos, Ahome, Sinaloa, Mexico. Bars indicate the standard deviation. Equal letters for each genotype at each moisture level are not statistically different (Tukey, P0.05).
76 Agro productividad 2021. https://doi.org /10.32854/agrop.v14i8.1960
The individual ANOVA for the irrigation conditions showed that the SV 3245 genotype had greater root length (Figure 1a); and ASGROW 7543 and SV 3243 had higher water use efficiency (Figure 1c). There were no statistically significant differences for root dry weight (Figure 1b); in drought, ASGROW 7543 exhibited high values of root dry weight (Figure 1b) and water use efficiency (Figure 1c) compared to the other genotypes. The root length was not different between genotypes (P0.05) (Figure 1a). Although this research was taking place during the seedling period, other researchers have reported similar results in the dry matter accumulation in the roots during the reproductive stage; Villalobos-González et al. (2018) when evaluating hybrid and creole corn varieties in contrasting humidity environments, found that the accumulation of dry matter in the roots was greater in drought than in irrigation conditions. For their part, Tracy et al. (2020) mention that the root system determines water and nutrients for photosynthesis and harvested products, which sustains agricultural productivity.
CONCLUSIONS The morpho-physiological characteristics of the three hybrids were affected by soil water deficit; the dry weight of the aerial structures of the plants and their foliar area decreased in drought conditions compared to irrigation. In contrast, root length, root dry weight, and water use efficiency were higher in drought than in irrigation. The hybrid ASGROW 7543, in average irrigation and drought, was outstanding for exhibiting better behavior in accumulation of the dry weight of the aerial and root part of the plant, greater efficiency in the use of water and low total transpiration per plant. In addition, drought showed high efficiency in the use of water and root dry weight.
REFERENCESAli, F., Ahsan, M., Ali, Q., and Kanwal, N. (2014). Phenotypic stability of Zea mays grain yield and its attributing
traits under drought stress. Frontiers Plant Science 8(1397): 189-197. https://doi.org/10.3389/fpls.2017.01397
Bänziger, M., Edmeades, G.O., Beck, D., y Bellon, M. (2012). Mejoramiento para aumentar la tolerancia a sequía y a deficiencia de nitrógeno en el maíz: In: CIMMYT. (Ed.). De la teoría a la práctica. México, D. F., CIMMYT. 61 p.
Blum, A. (2013). Heterosis, stress, and the environment: a possible road map towards the general improvement of crop yield. Journal of Experimental Botany 64(16): 4829-4837. https://doi.org/10.1093/jxb/ert289
Condon, A.G. (2020). Drying times: plant traits to improve crop water use efficiency and yield. Journal Experimental Botany 71: 2239-2252. doi.org/10.1093/jxb/eraa002
Chen, X., Mo, X., Hu, S., and Liu, S. (2019). Relationship between fluorescence yield and photochemical yield under water stress and intermediate light conditions. Journal of Experimental Botany 70(1): 301-313. doi:10.1093/jxb/ery341
Chen, Y., Palta, J.A., Wu, P., and Siddique, K.H.M. (2019). Crop root systems and rhizosphere interactions. Plant Soil 439: 1-5. https://doi.org/10.1007/s11104-019-04154-2
Ge, T.D., Sui, F.., Bai, L.P., Tong, C.L., Sun, N.B. (2012). Effects of water stress on growth, biomass partitioning, and water-use efficiency in summer maize (Zea mays L.) throughout the growth cycle. Acta Physiologiae Plantarum 34: 1043-1053. https://doi.org/10.1007/s11738-011-0901-y
Geiger, R.D., Shieh, W.J., and Saluke, R.M. (1989). Carbon partitioning among leaves, fruits, and seeds during development of Phaseolus vulgaris L. Plant Physiology 91(1): 291-297. Doi: 10.1104/pp.91.1.291
Inzunza-Ibarra, M.A., Villa-Castorena, M.M., Catalán-Valencia, E.A., López-López, R., Sifuentes-Ibarra, E. (2018). Rendimiento de grano de maíz en déficit hídrico en el suelo en dos etapas de crecimiento. Revista Fitotecnia Mexicana 41(3): 283-290.
77 Agro productividad 2021. https://doi.org /10.32854/agrop.v14i8.1960
Khan, M.B., Yousaf, F., Hussain, M., Haq, W.M., Lee, D.J., and Farooq, M. (2012). Influence of planting methods on root development, crop productivity and water use efficiency in maize hybrids. Chilean Journal of Agricultural Research 72: 556-563. http://dx.doi.org/10.4067/S0718-58392012000400015
Kebede, A.Z., Melchinger, A.E., Cairns, J.E., Araus, J.L., Makumbi, D., Atlin, G.N. (2013). Relationship of line per se and testcross performance for grain yield of tropical maize in drought and well-watered trials. Crop Science 53: 1228-1236.
Krishnamurthy, L., Vadez, V., Devi, M.J., Serraj, R., Nigam, S.N., Sheshshayee, M.S., Chandra, S., and Aruna, R. (2007). Variation in transpiration efficiency and its related traits in a groundnut (Arachis hypogaea L.) mapping population. Field Crops Research 103(3): 189-197. https://doi.org/10.1016/j.fcr.2007.06.009
Lamers, J., van der Meer, T., Testerink, C. (2020). How Plants Sense and Respond to Stressful Environments. Plant Physiology 182: 1624-1635.
Mi, N., Cai, F., Zhang, Y., Ji, R., Zhang, S., and Wang, Y. 2018. Differential responses of maize yield to drought at vegetative and reproductive stages. Plant Soil Environment 64(6): 260-267. https://doi.org/10.17221/141/2018-PSE
Nezhadahmadi, A., Prodhan, Z.H., and Faruq, G. (2013). Drought tolerance in wheat. The Scientific World Journal 2013(1): 1-12. Doi: 10.1155/2013/610721
Pandey, V., and Shukla, A. (2015). Acclimation and tolerance strategies of rice under drought stress. Rice Science 22(4): 147-161. https://doi.org/10.1016/j.rsci.2015.04.001
Polania, J., Poschenrieder, C., Rao, I., and Beebe, S. (2017). Root traits and their potential links to plant ideotypes to improve drought resistance in common bean. Theoretical and Experimental Plant Physiology 29: 143-154. doi: 10.1007/s40626-017-0090-1
Rebolloza-Hernández, H., Cervantes-Adame, Y.F., Broa-Rojas, E., Bahena-Delgado, G., y Olvera-Velona, A. (2020). Fenotipeo y selección de líneas S1 segregantes de maíz tolerantes a estrés hídrico. Biotecnia 22(3): 20-28.
SAS. (2009). The SAS System Program release 9.1 for Windows. SAS Institute, Inc., Cary, North Carolina, U.S.A. Software of statistical analysis.
Tracy, S.R., Nagel, K.A., Postma, J.A., Fassbender, H., Wasson, A., and Watt, M. (2020). Crop Improvement from Phenotyping Roots: Highlights Reveal Expanding Opportunities Saoirse. Trends in Plant Science 25: 105-118. https://doi.org/10.1016/j.tplants.2019.10.015
Villalobos-González, A., López-Castañeda, C., Miranda-Colín, S., Aguilar-Rincón, V.H., y López-Hernández, M.B. (2016). Relaciones hídricas en maíces de Valles Altos de la Mesa Central de México en condiciones de sequía y fertilización nitrogenada. Revista Mexicana de Ciencias Agrícolas 7(7): 1651-1665.
Villalobos-González, A., López-Castañeda, C., Miranda-Colín, S., Aguilar-Rincón, V.H., y López-Hernández, M.B. (2018). Efecto del estrés hídrico y nitrógeno en las raíces de variedades hibridas y criollas de maíz (Zea mays L.). Agroproductividad 11(1): 3-8.
Villalobos-González, A., López-Hernández, M.B., Valdivia-González, N.A., Arcocha-Gómez, E., y Medina-Méndez, J. (2019). Variabilidad morfológica de maíz nativo (Zea mays L.) en la Península de Yucatán, México. Agroproductividad 12(11): 15-20.
Zhu, J., Brown, K.M., and Lynch, J.P. (2010). Root cortical aerenchyma improves the drought tolerance of maize (Zea mays L.). Plant, Cell and Environment 33: 740-749. doi: 10.1111/j.1365-3040.2009.02099.x

Colegio dePostgraduados
79
Spatial variability of physical, chemical, and biological properties of agricultural soils in Hidalgo State, Mexico Prieto-Méndez, Judith1; Prieto-García, Francisco2*; Acevedo-Sandoval, Otilio Arturo1;
Aquino-Torres, Eliazar2
1 Instituto de Ciencias Agropecuarias, Universidad Autónoma del Estado de Hidalgo. Carretera Pachuca-Tulancingo, km 4.5. C. P. 42076. Pachuca, México.
2 Instituto de Ciencias Básicas e Ingeniería. Universidad Autónoma del Estado de Hidalgo. Carretera Pachuca-Tulancingo, km 4.5. C. P. 42076. Pachuca, México.
* Corresponding author: [email protected]
ABSTRACT Objective: To establish the influence on soil fertility by spatial variations of physical, chemical, and biological properties of two agricultural soils in the state of Hidalgo (Mexico).Methodology: Soils A, (clay-sandy, shallow horizon imperfect drainage), the municipality of Apan and soil B (with a light phase and thick, with stones), the municipality of Emiliano Zapata, were sampled in a network of 1010 m at 10, 20 and 40 cm Deep. Four plots that have been under a malting barley monoculture system for more than 40 years were sampled. Physical, chemical and biological parameters were determined, following the official Mexican standard for soils.Results: The C/N ratio of both soils had a low spatial variation due to its relationship with stable fractions of soil organic matter (humus) and relatively low content. The spatial variability increased significantly with depth in both soils, while the apparent density showed little spatial variation. In addition, random behavior was observed at short distances (for available phosphorus, enzymatic activity and nitrates). The spatial variability of interaction between exchangeable bases, K/(CaMg) was greater than that of each element individually. The results showed that the concentrations of nutrients and the biological processes that affect their availability in the soil did not have a uniform spatial distribution, so that the applications in the fertilizer of the cultivated soil must adapt to these variations (site-specific fertilization).Conclusions: There is a significant spatial of the soils dedicated for more than 40 years to the monoculture of malting barley. Nutrients and biological processes see their availability in soils affected. It is understood that applications of fertilizers to the soil are required to overcome and adapt to these variations (site-specific fertilization).
Keywords: soil fertility, spatial distribution, soil properties, geostatistics, spatial variability
INTRODUCTION The increase in global food demand has considerably increased agricultural production in the last decades, requiring the use of crop varieties with high yields and the application of large amounts of fertilizer. Consequently, soil and water pollution
Citation: Prieto-Méndez, J., Prieto-García, F., Acevedo-Sandoval, O. A., & Aquino-Torres, E., (2021). Spatial variability of physical, chemical, and biological properties of agricultural soils in Hidalgo State, Mexico. Agro Productividad. https://doi.org/10.32854/agrop.v14i8.2040
Editor in Chief: Dr. Jorge Cadena Iñiguez
Received: February, 2021.Accepted: July, 2021.
Agro Productividad, 14(8). August. 2021. pp: 79-89.
This work is licensed under a Creative Commons Attribution-Non-Commercial 4.0 International license.
Image by Free-Photos at Pixabay 79
80 Agro productividad 2021. https://doi.org/10.32854/agrop.v14i8.2040
has increased in proportion to the intensity of agriculture developed. Currently, global fertilizer use exceeds 195 million tons per year (FAO, 2008), which causes nitrate residue (50 mg L1) and phosphate (0.1 mg L1) in aquifers above the permissible limits, and results in annual emissions to the atmosphere of 1400 kTon carbon dioxide, methane 749 kTon and 81 kTon of nitrous oxide (Brethour et al., 2006). This has led to the development of agronomic practices that achieve high yields with less environmental impact, such as site-specific fertilization. Site specific fertilization involves evaluating the spatial relationships of the properties of the soil and its effect on the crop yield. It has been observed that the spatial distribution of the physical, chemical, and biological soil, affecting the yield of a crop (Machado et al., 2002), however, the spatial dependence of the biological parameters of the soil has been underexplored. The purpose of this research was to study the nature of the spatial relationships of the physical, chemical, and biological properties of two agricultural soils used for growing malting barley (Hordeum distichum L.) for over 40 years as a monoculture and its influence on fertility thereof. These spatial relationships in these soils have not been reported in the literature.
MATERIALS AND METHODS The study was conducted in two municipalities floors southern state of Hidalgo (Mexico). The average annual temperature, altitude and geolocation are indicated in Table 1. In these territories reaches an average rainfall of 1223 mm year1. Two soils were selected Cambisol, with contents of low activity clays, soil A (two plots of the municipality Apan) with clay loam and sandy shallow horizon (26 cm) with imperfect drainage, while the ground B (two plots of the municipality of Emiliano Zapata) with a light phase and thick, sandy-loam and stony (Prieto et al., 2011). Identified two plots of 3500 m2, with each soil type respectively. The four plots have spent more than 40 years under a system of monoculture planted to malting barley. In early spring and in each experimental plot 40 soil samples taken in a network of 1010 m, some samples were collected at 20 cm depth, and other samples every 10 cm to 40 cm deep. A portion of the samples were cooled to 4 °C until biological analyzes: mineralization potential nitrogen soil incubation in 14 days microbial respiration by CO2 evolution; urease activity by incubation of the soil with urea at 37 °C and activity Acid and alkaline phosphatases soil by incubation at 37 °C and colorimetry (Pinochet et al., 1997; Echevarria et al., 2000; Velascos et al., 2004). The other part of the samples was air dried and sieved (2 mm) to determine the fractions of sand, silt and clay by hydrometer, Uhland cylinder bulk density, pH 1:2 suspension, total Kjeldahl nitrogen, nitrate nitrogen and ammonia by acid digestion and alloy Devarda MgO and Kjeldahl distillation; Walkley organic carbon-Black, phosphorus,
Table 1. Location of sampling sites for municipalities.
City Latitude Longitude Altitude (m) Temperature °CApan 19° 41ʼ 16.6ʼʼ 98° 23’ 33” 2547 14.1
E. Zapata 19° 54ʼ 16.0ʼʼ 98° 53’ 4” 2355 15.4
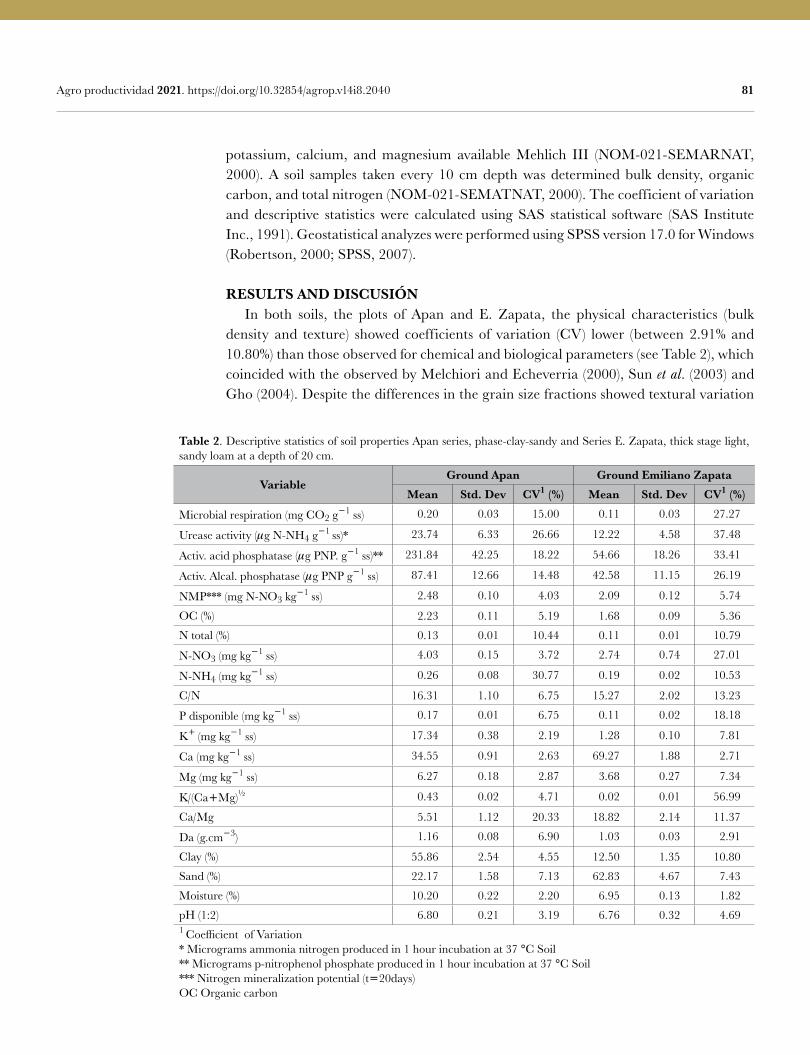
81 Agro productividad 2021. https://doi.org/10.32854/agrop.v14i8.2040
potassium, calcium, and magnesium available Mehlich III (NOM-021-SEMARNAT, 2000). A soil samples taken every 10 cm depth was determined bulk density, organic carbon, and total nitrogen (NOM-021-SEMATNAT, 2000). The coefficient of variation and descriptive statistics were calculated using SAS statistical software (SAS Institute Inc., 1991). Geostatistical analyzes were performed using SPSS version 17.0 for Windows (Robertson, 2000; SPSS, 2007).
RESULTS AND DISCUSIÓN In both soils, the plots of Apan and E. Zapata, the physical characteristics (bulk density and texture) showed coefficients of variation (CV) lower (between 2.91% and 10.80%) than those observed for chemical and biological parameters (see Table 2), which coincided with the observed by Melchiori and Echeverria (2000), Sun et al. (2003) and Gho (2004). Despite the differences in the grain size fractions showed textural variation
Table 2. Descriptive statistics of soil properties Apan series, phase-clay-sandy and Series E. Zapata, thick stage light, sandy loam at a depth of 20 cm.
VariableGround Apan Ground Emiliano Zapata
Mean Std. Dev CV1 (%) Mean Std. Dev CV1 (%)
Microbial respiration (mg CO2 g1 ss) 0.20 0.03 15.00 0.11 0.03 27.27
Urease activity (g N-NH4 g1 ss)* 23.74 6.33 26.66 12.22 4.58 37.48
Activ. acid phosphatase (g PNP. g1 ss)** 231.84 42.25 18.22 54.66 18.26 33.41
Activ. Alcal. phosphatase (g PNP g1 ss) 87.41 12.66 14.48 42.58 11.15 26.19
NMP*** (mg N-NO3 kg1 ss) 2.48 0.10 4.03 2.09 0.12 5.74
OC (%) 2.23 0.11 5.19 1.68 0.09 5.36
N total (%) 0.13 0.01 10.44 0.11 0.01 10.79
N-NO3 (mg kg1 ss) 4.03 0.15 3.72 2.74 0.74 27.01
N-NH4 (mg kg1 ss) 0.26 0.08 30.77 0.19 0.02 10.53
C/N 16.31 1.10 6.75 15.27 2.02 13.23
P disponible (mg kg1 ss) 0.17 0.01 6.75 0.11 0.02 18.18
K (mg kg1 ss) 17.34 0.38 2.19 1.28 0.10 7.81
Ca (mg kg1 ss) 34.55 0.91 2.63 69.27 1.88 2.71
Mg (mg kg1 ss) 6.27 0.18 2.87 3.68 0.27 7.34
K/(CaMg)½ 0.43 0.02 4.71 0.02 0.01 56.99
Ca/Mg 5.51 1.12 20.33 18.82 2.14 11.37
Da (g.cm3) 1.16 0.08 6.90 1.03 0.03 2.91
Clay (%) 55.86 2.54 4.55 12.50 1.35 10.80
Sand (%) 22.17 1.58 7.13 62.83 4.67 7.43
Moisture (%) 10.20 0.22 2.20 6.95 0.13 1.82
pH (1:2) 6.80 0.21 3.19 6.76 0.32 4.691 Coefficient of Variation * Micrograms ammonia nitrogen produced in 1 hour incubation at 37 °C Soil ** Micrograms p-nitrophenol phosphate produced in 1 hour incubation at 37 °C Soil *** Nitrogen mineralization potential (t20days)OC Organic carbon
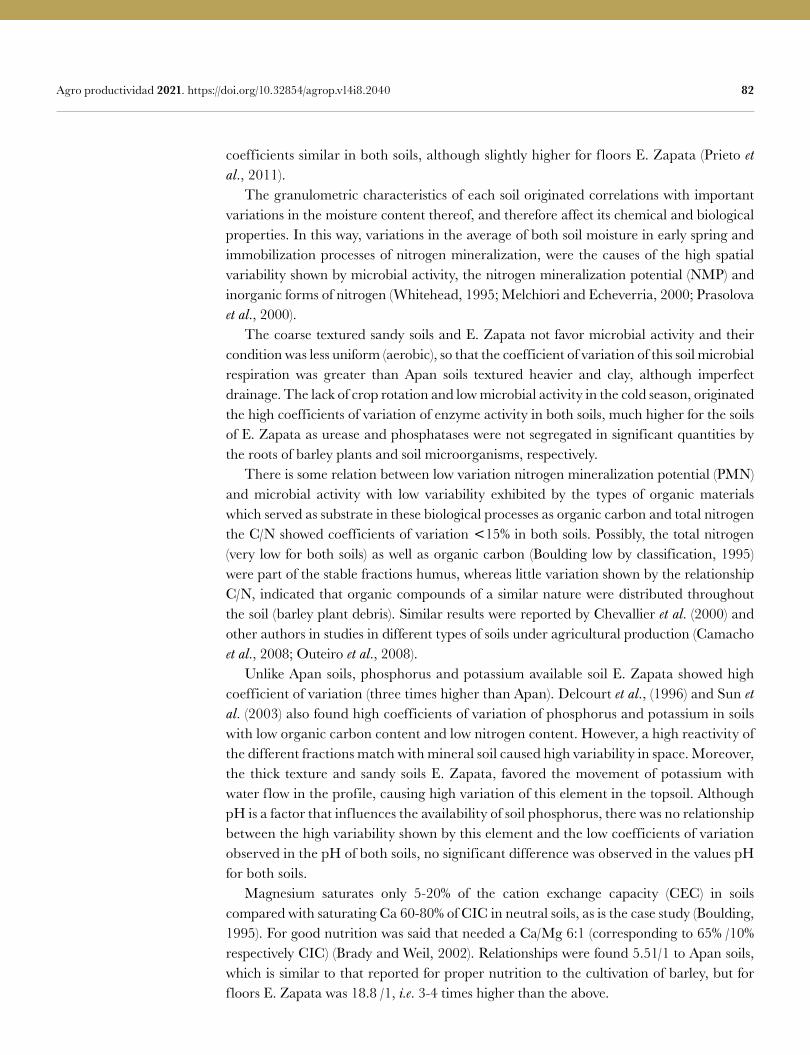
82 Agro productividad 2021. https://doi.org/10.32854/agrop.v14i8.2040
coefficients similar in both soils, although slightly higher for f loors E. Zapata (Prieto et al., 2011). The granulometric characteristics of each soil originated correlations with important variations in the moisture content thereof, and therefore affect its chemical and biological properties. In this way, variations in the average of both soil moisture in early spring and immobilization processes of nitrogen mineralization, were the causes of the high spatial variability shown by microbial activity, the nitrogen mineralization potential (NMP) and inorganic forms of nitrogen (Whitehead, 1995; Melchiori and Echeverria, 2000; Prasolova et al., 2000). The coarse textured sandy soils and E. Zapata not favor microbial activity and their condition was less uniform (aerobic), so that the coefficient of variation of this soil microbial respiration was greater than Apan soils textured heavier and clay, although imperfect drainage. The lack of crop rotation and low microbial activity in the cold season, originated the high coefficients of variation of enzyme activity in both soils, much higher for the soils of E. Zapata as urease and phosphatases were not segregated in significant quantities by the roots of barley plants and soil microorganisms, respectively. There is some relation between low variation nitrogen mineralization potential (PMN) and microbial activity with low variability exhibited by the types of organic materials which served as substrate in these biological processes as organic carbon and total nitrogen the C/N showed coefficients of variation 15% in both soils. Possibly, the total nitrogen (very low for both soils) as well as organic carbon (Boulding low by classification, 1995) were part of the stable fractions humus, whereas little variation shown by the relationship C/N, indicated that organic compounds of a similar nature were distributed throughout the soil (barley plant debris). Similar results were reported by Chevallier et al. (2000) and other authors in studies in different types of soils under agricultural production (Camacho et al., 2008; Outeiro et al., 2008). Unlike Apan soils, phosphorus and potassium available soil E. Zapata showed high coefficient of variation (three times higher than Apan). Delcourt et al., (1996) and Sun et al. (2003) also found high coefficients of variation of phosphorus and potassium in soils with low organic carbon content and low nitrogen content. However, a high reactivity of the different fractions match with mineral soil caused high variability in space. Moreover, the thick texture and sandy soils E. Zapata, favored the movement of potassium with water f low in the profile, causing high variation of this element in the topsoil. Although pH is a factor that inf luences the availability of soil phosphorus, there was no relationship between the high variability shown by this element and the low coefficients of variation observed in the pH of both soils, no significant difference was observed in the values pH for both soils. Magnesium saturates only 5-20% of the cation exchange capacity (CEC) in soils compared with saturating Ca 60-80% of CIC in neutral soils, as is the case study (Boulding, 1995). For good nutrition was said that needed a Ca/Mg 6:1 (corresponding to 65% /10% respectively CIC) (Brady and Weil, 2002). Relationships were found 5.51/1 to Apan soils, which is similar to that reported for proper nutrition to the cultivation of barley, but for floors E. Zapata was 18.8 /1, i.e. 3-4 times higher than the above.
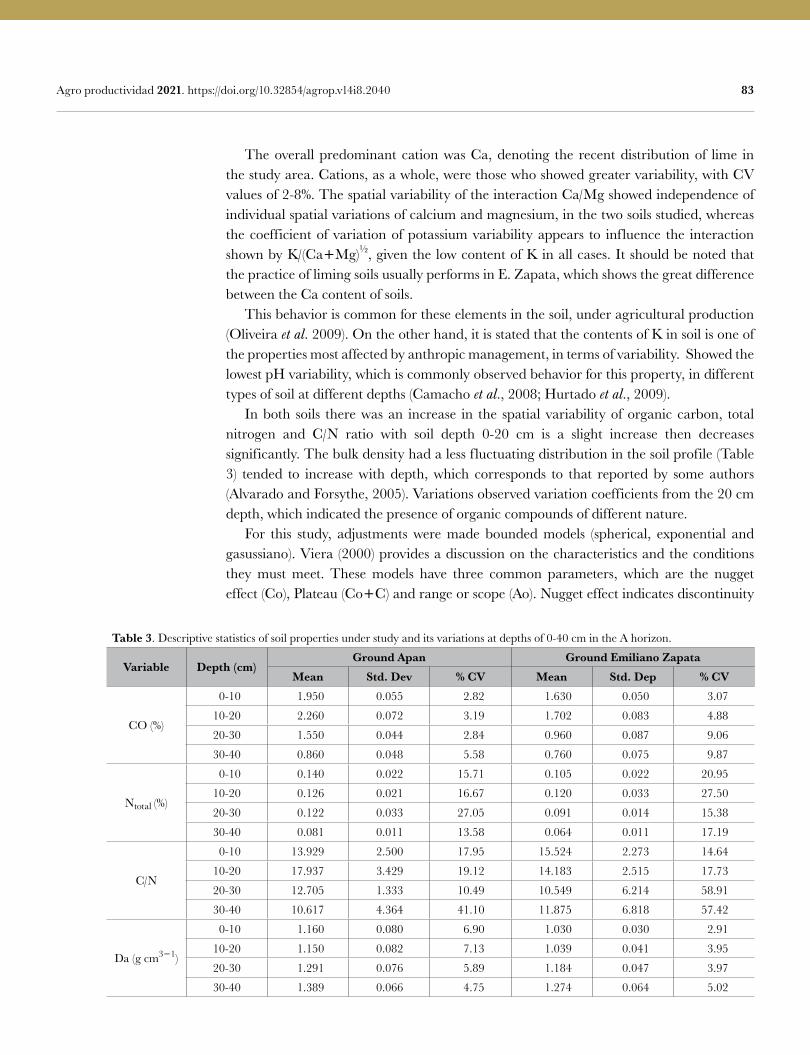
83 Agro productividad 2021. https://doi.org/10.32854/agrop.v14i8.2040
The overall predominant cation was Ca, denoting the recent distribution of lime in the study area. Cations, as a whole, were those who showed greater variability, with CV values of 2-8%. The spatial variability of the interaction Ca/Mg showed independence of individual spatial variations of calcium and magnesium, in the two soils studied, whereas the coefficient of variation of potassium variability appears to influence the interaction shown by K/(CaMg)½, given the low content of K in all cases. It should be noted that the practice of liming soils usually performs in E. Zapata, which shows the great difference between the Ca content of soils. This behavior is common for these elements in the soil, under agricultural production (Oliveira et al. 2009). On the other hand, it is stated that the contents of K in soil is one of the properties most affected by anthropic management, in terms of variability. Showed the lowest pH variability, which is commonly observed behavior for this property, in different types of soil at different depths (Camacho et al., 2008; Hurtado et al., 2009). In both soils there was an increase in the spatial variability of organic carbon, total nitrogen and C/N ratio with soil depth 0-20 cm is a slight increase then decreases significantly. The bulk density had a less fluctuating distribution in the soil profile (Table 3) tended to increase with depth, which corresponds to that reported by some authors (Alvarado and Forsythe, 2005). Variations observed variation coefficients from the 20 cm depth, which indicated the presence of organic compounds of different nature. For this study, adjustments were made bounded models (spherical, exponential and gasussiano). Viera (2000) provides a discussion on the characteristics and the conditions they must meet. These models have three common parameters, which are the nugget effect (Co), Plateau (CoC) and range or scope (Ao). Nugget effect indicates discontinuity
Table 3. Descriptive statistics of soil properties under study and its variations at depths of 0-40 cm in the A horizon.
Variable Depth (cm)Ground Apan Ground Emiliano Zapata
Mean Std. Dev % CV Mean Std. Dep % CV
CO (%)
0-10 1.950 0.055 2.82 1.630 0.050 3.07
10-20 2.260 0.072 3.19 1.702 0.083 4.88
20-30 1.550 0.044 2.84 0.960 0.087 9.06
30-40 0.860 0.048 5.58 0.760 0.075 9.87
Ntotal (%)
0-10 0.140 0.022 15.71 0.105 0.022 20.95
10-20 0.126 0.021 16.67 0.120 0.033 27.50
20-30 0.122 0.033 27.05 0.091 0.014 15.38
30-40 0.081 0.011 13.58 0.064 0.011 17.19
C/N
0-10 13.929 2.500 17.95 15.524 2.273 14.64
10-20 17.937 3.429 19.12 14.183 2.515 17.73
20-30 12.705 1.333 10.49 10.549 6.214 58.91
30-40 10.617 4.364 41.10 11.875 6.818 57.42
Da (g cm31)
0-10 1.160 0.080 6.90 1.030 0.030 2.91
10-20 1.150 0.082 7.13 1.039 0.041 3.95
20-30 1.291 0.076 5.89 1.184 0.047 3.97
30-40 1.389 0.066 4.75 1.274 0.064 5.02
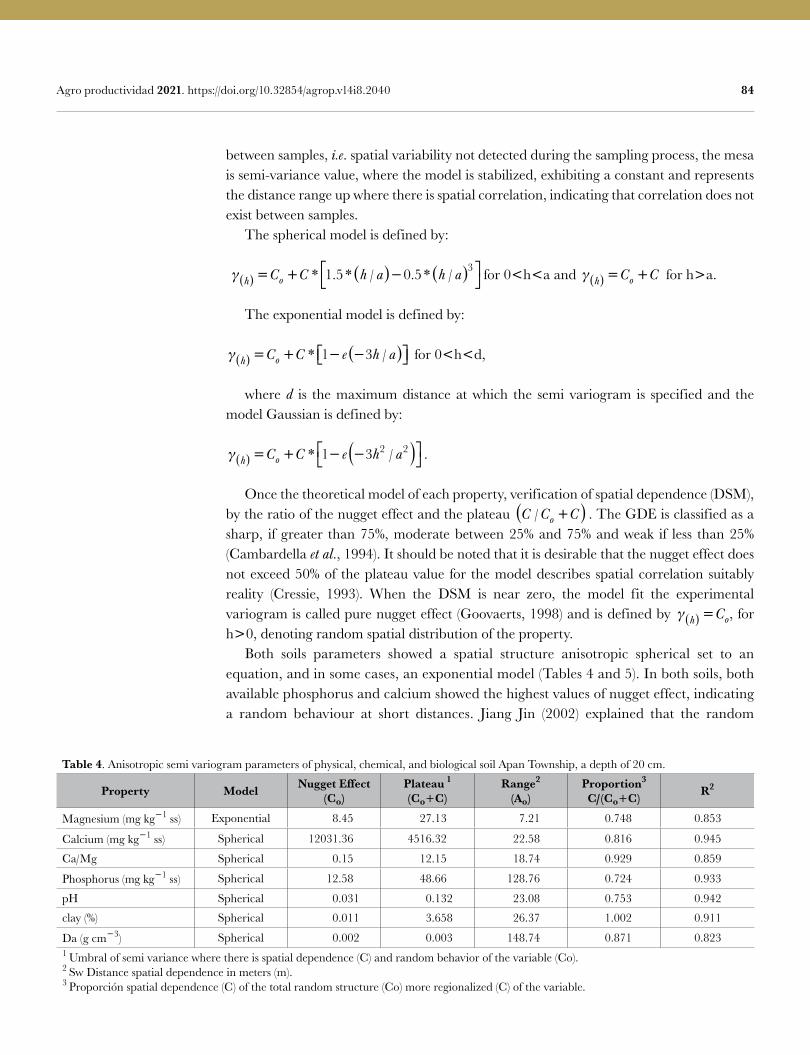
84 Agro productividad 2021. https://doi.org/10.32854/agrop.v14i8.2040
between samples, i.e. spatial variability not detected during the sampling process, the mesa is semi-variance value, where the model is stabilized, exhibiting a constant and represents the distance range up where there is spatial correlation, indicating that correlation does not exist between samples. The spherical model is defined by:
γ γ h oC C h a h a( ) = + ( )− ( )
* . * / . * /1 5 0 5 3 for 0ha and γ h oC C( ) = + for ha.
The exponential model is defined by:
γ h oC C e h a( ) = + − −( ) * /1 3 for 0hd,
where d is the maximum distance at which the semi variogram is specified and the model Gaussian is defined by:γγ h oC C e h a( ) = + − −( )
* /1 3 2 2 .
Once the theoretical model of each property, verification of spatial dependence (DSM), by the ratio of the nugget effect and the plateau C C Co/ +( ) . The GDE is classified as a sharp, if greater than 75%, moderate between 25% and 75% and weak if less than 25% (Cambardella et al., 1994). It should be noted that it is desirable that the nugget effect does not exceed 50% of the plateau value for the model describes spatial correlation suitably reality (Cressie, 1993). When the DSM is near zero, the model fit the experimental variogram is called pure nugget effect (Goovaerts, 1998) and is defined by γ h oC( ) = , for h0, denoting random spatial distribution of the property. Both soils parameters showed a spatial structure anisotropic spherical set to an equation, and in some cases, an exponential model (Tables 4 and 5). In both soils, both available phosphorus and calcium showed the highest values of nugget effect, indicating a random behaviour at short distances. Jiang Jin (2002) explained that the random
Table 4. Anisotropic semi variogram parameters of physical, chemical, and biological soil Apan Township, a depth of 20 cm.
Property Model Nugget Effect (Co)
Plateau 1
(CoC)Range2
(Ao)Proportion3
C/(CoC) R2
Magnesium (mg kg1 ss) Exponential 8.45 27.13 7.21 0.748 0.853
Calcium (mg kg1 ss) Spherical 12031.36 4516.32 22.58 0.816 0.945
Ca/Mg Spherical 0.15 12.15 18.74 0.929 0.859
Phosphorus (mg kg1 ss) Spherical 12.58 48.66 128.76 0.724 0.933
pH Spherical 0.031 0.132 23.08 0.753 0.942
clay (%) Spherical 0.011 3.658 26.37 1.002 0.911
Da (g cm3) Spherical 0.002 0.003 148.74 0.871 0.8231 Umbral of semi variance where there is spatial dependence (C) and random behavior of the variable (Co). 2 Sw Distance spatial dependence in meters (m). 3 Proporción spatial dependence (C) of the total random structure (Co) more regionalized (C) of the variable.
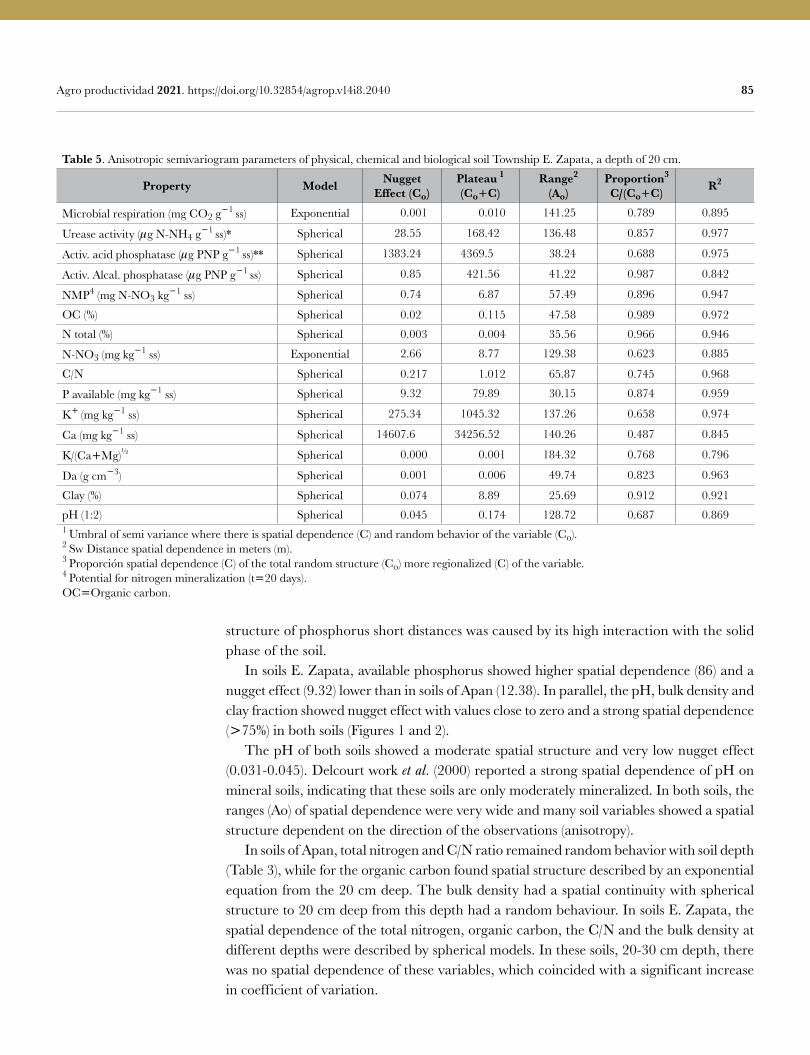
85 Agro productividad 2021. https://doi.org/10.32854/agrop.v14i8.2040
structure of phosphorus short distances was caused by its high interaction with the solid phase of the soil. In soils E. Zapata, available phosphorus showed higher spatial dependence (86) and a nugget effect (9.32) lower than in soils of Apan (12.38). In parallel, the pH, bulk density and clay fraction showed nugget effect with values close to zero and a strong spatial dependence (75%) in both soils (Figures 1 and 2). The pH of both soils showed a moderate spatial structure and very low nugget effect (0.031-0.045). Delcourt work et al. (2000) reported a strong spatial dependence of pH on mineral soils, indicating that these soils are only moderately mineralized. In both soils, the ranges (Ao) of spatial dependence were very wide and many soil variables showed a spatial structure dependent on the direction of the observations (anisotropy). In soils of Apan, total nitrogen and C/N ratio remained random behavior with soil depth (Table 3), while for the organic carbon found spatial structure described by an exponential equation from the 20 cm deep. The bulk density had a spatial continuity with spherical structure to 20 cm deep from this depth had a random behaviour. In soils E. Zapata, the spatial dependence of the total nitrogen, organic carbon, the C/N and the bulk density at different depths were described by spherical models. In these soils, 20-30 cm depth, there was no spatial dependence of these variables, which coincided with a significant increase in coefficient of variation.
Table 5. Anisotropic semivariogram parameters of physical, chemical and biological soil Township E. Zapata, a depth of 20 cm.
Property Model Nugget Effect (Co)
Plateau 1
(CoC)Range2
(Ao)Proportion3
C/(CoC) R2
Microbial respiration (mg CO2 g1 ss) Exponential 0.001 0.010 141.25 0.789 0.895
Urease activity (g N-NH4 g1 ss)* Spherical 28.55 168.42 136.48 0.857 0.977
Activ. acid phosphatase (g PNP g1 ss)** Spherical 1383.24 4369.5 38.24 0.688 0.975
Activ. Alcal. phosphatase (g PNP g1 ss) Spherical 0.85 421.56 41.22 0.987 0.842
NMP4 (mg N-NO3 kg1 ss) Spherical 0.74 6.87 57.49 0.896 0.947
OC (%) Spherical 0.02 0.115 47.58 0.989 0.972
N total (%) Spherical 0.003 0.004 35.56 0.966 0.946
N-NO3 (mg kg1 ss) Exponential 2.66 8.77 129.38 0.623 0.885
C/N Spherical 0.217 1.012 65.87 0.745 0.968
P available (mg kg1 ss) Spherical 9.32 79.89 30.15 0.874 0.959
K (mg kg1 ss) Spherical 275.34 1045.32 137.26 0.658 0.974
Ca (mg kg1 ss) Spherical 14607.6 34256.52 140.26 0.487 0.845
K/(CaMg)½ Spherical 0.000 0.001 184.32 0.768 0.796
Da (g cm3) Spherical 0.001 0.006 49.74 0.823 0.963
Clay (%) Spherical 0.074 8.89 25.69 0.912 0.921
pH (1:2) Spherical 0.045 0.174 128.72 0.687 0.8691 Umbral of semi variance where there is spatial dependence (C) and random behavior of the variable (Co). 2 Sw Distance spatial dependence in meters (m). 3 Proporción spatial dependence (C) of the total random structure (Co) more regionalized (C) of the variable. 4 Potential for nitrogen mineralization (t20 days).OCOrganic carbon.
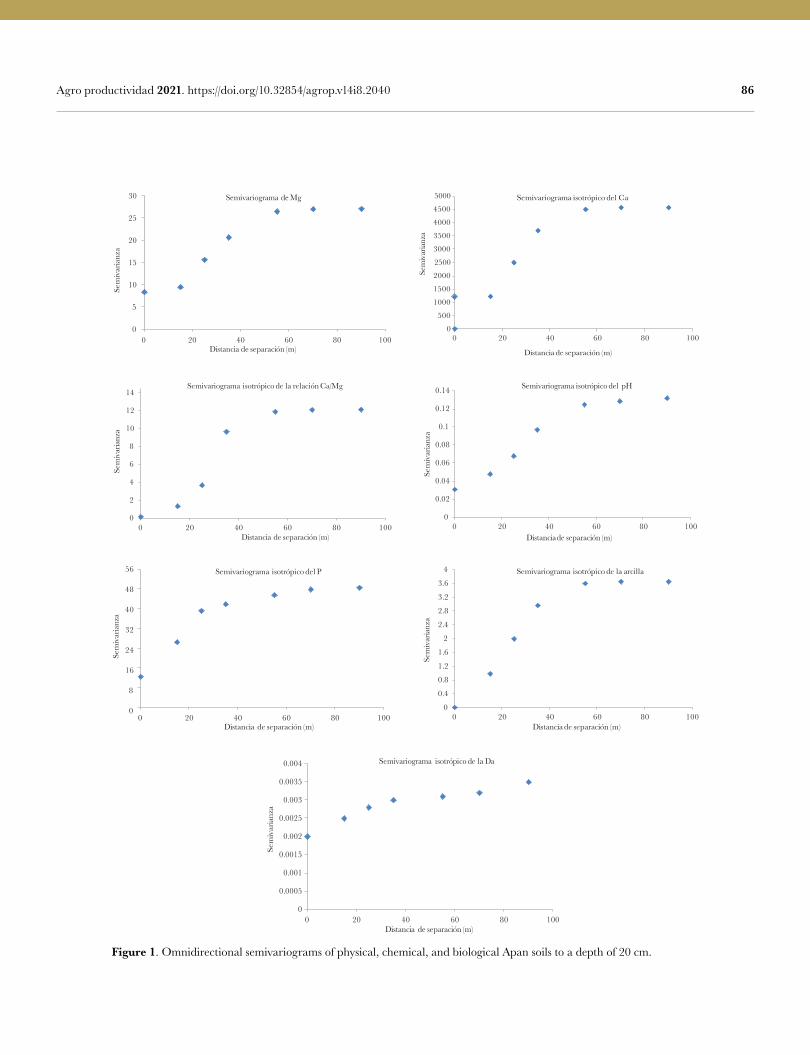
86 Agro productividad 2021. https://doi.org/10.32854/agrop.v14i8.2040
Figure 1. Omnidirectional semivariograms of physical, chemical, and biological Apan soils to a depth of 20 cm.
0
5
10
15
20
25
30
0 20 40 60 80 100Distancia de separación (m)
Sem
ivar
ianz
a
Semivariograma de Mg
0
2
4
6
8
10
12
14
0 20 40 60 80 100Distancia de separación (m)
Sem
ivar
ianz
a
Semivariograma isotrópico de la relación Ca/Mg
0
0.02
0.04
0.06
0.08
0.1
0.12
0.14
0 20 40 60 80 100
Sem
ivar
ianz
a
Semivariograma isotrópico del pH
Distanciade separación (m)
0
8
16
24
32
40
48
56
0 20 40 60 80 100Distancia de separación (m)
Sem
ivar
ianz
a
Semivariograma isotrópico del P
0
0.4
0.8
1.2
1.6
2
2.4
2.8
3.2
3.6
4
0 20 40 60 80 100
Sem
ivar
ianz
a
Semivariograma isotrópico de la arcilla
Distancia de separación (m)
0
0.0005
0.001
0.0015
0.002
0.0025
0.003
0.0035
0.004
0 20 40 60 80 100
Sem
ivar
ianz
a
Semivariograma isotrópico de la Da
Distancia de separación (m)
0
500
1000
1500
2000
2500
3000
3500
4000
4500
5000
0 20 40 60 80 100
Sem
ivar
ianz
a
Semivariograma isotrópico del Ca
Distancia de separación (m)
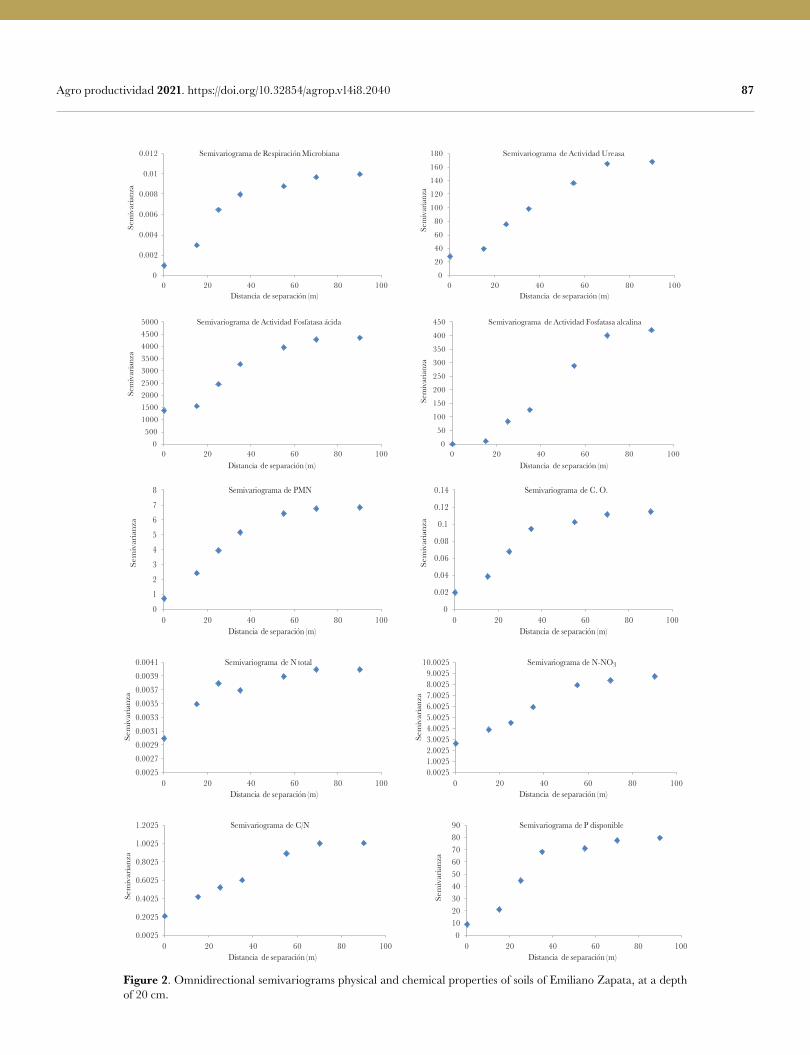
87 Agro productividad 2021. https://doi.org/10.32854/agrop.v14i8.2040
Figure 2. Omnidirectional semivariograms physical and chemical properties of soils of Emiliano Zapata, at a depth of 20 cm.
0
0.002
0.004
0.006
0.008
0.01
0.012
0 20 40 60 80 100Distancia de separación (m)
Sem
ivar
ianz
a
Semivariograma de Respiración Microbiana
0
20
40
60
80
100
120
140
160
180
0 20 40 60 80 100Distancia de separación (m)
Sem
ivar
ianz
a
Semivariograma de Actividad Ureasa
0500
100015002000250030003500400045005000
0 20 40 60 80 100Distancia de separación (m)
Sem
ivar
ianz
a
Semivariograma de Actividad Fosfatasa ácida
0
50
100
150
200
250
300
350
400
450
0 20 40 60 80 100Distancia de separación (m)
Sem
ivar
ianz
a
Semivariograma de Actividad Fosfatasa alcalina
0
1
2
3
4
5
6
7
8
0 20 40 60 80 100Distancia de separación (m)
Sem
ivar
ianz
a
Semivariograma de PMN
0
0.02
0.04
0.06
0.08
0.1
0.12
0.14
0 20 40 60 80 100Distancia de separación (m)
Sem
ivar
ianz
a
Semivariograma de C. O.
0.00250.00270.00290.00310.00330.00350.00370.00390.0041
0 20 40 60 80 100Distancia de separación (m)
Sem
ivar
ianz
a
Semivariograma de N total
0.00251.00252.00253.00254.00255.00256.00257.00258.00259.0025
10.0025
0 20 40 60 80 100Distancia de separación (m)
Sem
ivar
ianz
a
Semivariograma de N-NO3
0.0025
0.2025
0.4025
0.6025
0.8025
1.0025
1.2025
0 20 40 60 80 100Distancia de separación (m)
Sem
ivar
ianz
a
Semivariograma de C/N
0102030405060708090
0 20 40 60 80 100Distancia de separación (m)
Sem
ivar
ianz
a
Semivariograma de P disponible
88 Agro productividad 2021. https://doi.org/10.32854/agrop.v14i8.2040
CONCLUSIONS The fineness of the soil, moisture content-mineralization processes immobilization and changes in the nature of the organic compounds affect the spatial distribution of the physical, chemical, and biological properties of the soils studied. The physical properties exhibited coefficients of variation lower than the chemical and biological properties for both types of soil, indicating that the biochemical parameters showed a very complex dynamic, while the physical characteristics of the soil generally exhibited a more uniform distribution. Organic carbon, total nitrogen and C/N ratio of both soils had low spatial variation due to his relationship with stable fractions of soil organic matter (humus) and relatively low content. Variability in the space of organic carbon, total nitrogen and C/N ratio increased significantly with depth in the two soils studied, whereas the apparent density showed little spatial variation. Random behavior at short distances (nugget effect) observed for phosphorus available, enzyme activity and nitrates in the two floors, it may be caused by moisture variations thereof mineralization processes, nitrogen immobilization, the little reactivity with the phosphorus content of the soil solid phase, among other causes. The spatial variability of the interaction between exchangeable bases, K/(CaMg) was higher than that of each element individually; showing independence in the spatial behavior associated perhaps low potassium. The results showed that concentrations of nutrients and biological processes affecting their availability in soil did not have a uniform spatial distribution, whereby applications in the cultivated soil fertilizer must accommodate these variations (site specific fertilization).
REFERENCESAlvarado, A., Forsythe, W. (2005). Variation of bulk density in soil orders of Costa Rica. Costa Rican Agriculture,
29 (1): 85-94.Boulding, JR. (1995). Description and sampling of contaminated soils. A field guide, 2nd ed. Boca Raton, FL7
Lewis Publishers. Brady, N., Weil, R. (2002). Soil acidity: Calcium and Magnesium as plant nutrients. 404-410.Brethour, C., T. Moore and D. Bucknell. (2006). Évaluation des incidences environnementales et Economiques
des Règlements environnementaux pour le secteur agricole. Une étude de cas sur l’Elevage de porcins. Agriculture et Agroalimentaire Canada. George Morris Centre. 179 p. Disponible en: http://www4.agr.gc.ca/resources/prod/doc/pol/pub/hog-porc/pdf/hog-porc_f.pdf
Camacho-Tamayo, J. H., Luengas, C. A., Leiva. F. R. (2008). Effect of agricultural intervention on the spatial variability of some chemical properties of soils in the Eastern Planes of Colombia. Chilean J. Agr. Res, 68 (1) :42-55. Doi: 10.4067/S0718-58392008000100005
Cambardella, C. A., Moorman, T. B.; Novak, J. M., Parkin, T. B.; Karlen, D. L., Turco, R. F.; Konopka, A. E. (1994). Field-scale variability of soil properties in Central Iowa Soils. Soil Sci. Soc. Am. J., 58 (5) :1501-1511. Doi: 10.2136/sssaj1994.03615995005800050033x
Chevallier, T., M. Voltz, E. Blanchart, J.L. Chotte, V. Eschenbrenner, M. Mahieu., A. Albrecht. (2000). Spatial and temporal changes of soil C after establishment of a pasture on a long term cultivation Martinique.Geoderma vertisol 94 (1). 43-58. Doi: 10.1016/S0016-7061(99)00064-6
Cressie, N. (1993). Statistics for spatial data, John Wiley & Sons, New York. 928p.Delcourt, H., P. L. Darius., J. F. Baerdemaeker. (1996). The spatial variability of some aspects of topsoil
fertility in two Belgian fields. Computers and Electronics in Agriculturle. 14:179-196. Doi: 10.1016/0168-1699(95)00047-X
Echeverría, H. E., St. Martin, N. F., Bergonzi, R. (2000). Rapid methods of estimating potentially mineralizable nitrogen in soils. Soil Science, 18 (1) p. 9-16.
FAO, (2008). Current world fertilizer trends and outlook to 2011/12. Food and Agriculture Organization of United Nations, Rome. 57 p. Disponible en: ftp://ftp.fao.org/agl/agll/docs/cwfto11.pdf
89 Agro productividad 2021. https://doi.org/10.32854/agrop.v14i8.2040
Gho B., C. (2004). Spatial variability of soil chemical properties and their relationship to yields of maize (Zea mays L.). Monograph. Pontifical Catholic University of Chile, Faculty of Agriculture and Forestry, Department of Plant Sciences. Disponible en: http://www.uc.cl/agronomia/e_publicaciones/Articulos/articulos.htm
Goovaerts, P. (1998). Geostatistical tools for characterizing the spatial variability of microbiological and physico-chemical soil properties. Biol Fert. Soils. 27 (4) :315-334.
Hurtado, S. M. C., Silva, C. A., Resende, A. V. De; Von Pinho, R. G.; Inacio, E. S. B., Higas-hikawa, F. S. (2009). Spatial variability of soil acidity attributes and the spatialization of liming requirement for corn. Ciência e Agrotecn. 33 (5) :1351-1359. Doi: 10.1590/S1413-70542009000500022
Jin J., Jiang, C. (2002). Spatial variability of soil nutrients and site-specific nutrient management in the PR China. Computers and Electronics in Agriculture 36 (2):165 -172. Doi: 10.1016/S0168-1699(02)00099-6
Machado, S., E. D. Bynum Jr., T. Archer, R. Lascano, J. Bordovsky, K. Bronson, D. Nesmith, E. Segarra, D. Rosenow, G. Peterson, W. Xu., Wilson, L. (2002). Spatial and temporal variability of sorghum and corn yield: interactions of biotic and abiotic factors. Proceedings of the 5th International Conference on Precision Agriculture, Bloomington, Minnesota, USA, 16-19 July. American Society of Agronomy, Madison, USA.
Melchiori, R. J., Echeverria, H. (2000). Spatial variability in soil properties: I. Association with variations in the yield of wheat. Disponible en: http://www.agriculturadeprecision.org/articulos/mansit.htm
Moulin, A., D. Derksen, D. McLaren., Grant, C. (2002). Spatial variability of soil fertility and identification of management zones on hummocky terrain. Brandon Research Centre, Agriculture and Agri-Food Canada, Brandon. 3rd. Annual Manitoba Agronomists Conference, 2002. December 10-11.
Official Mexican Standard (2000). NOM-021-SEMARNAT-2000. Establishing the specifications of fertility, salinity and soil classification. Studies, sampling and analysis. Mexico.
Oliveira, P. C. G., Farias, P. R. S., Lima, H. V.; Fernande, A. R.; Oliveira, F. A., Pita, J. D. (2009). Spatial Variabilidade chemical properties do alone and gives Productivity of Amazonian nania citros East. Rev. Bras. Engenharia Agr. Amb. 13 (6) :708-715.
Outeiro, L.; Asperó, F., Ubeda, X. (2008). Geostatistical methods to study spatial variability of soil cations after a prescribed fire and rainfall. Catena. 74 (3) :310-320. Doi: 10.1016/j.catena.2008.03.019
Paz-Gonzalez, A., S. R. Vieira., Taboada, M.T C. (2000). The effect of cultivation on the spatial variability of selected properties of an umbric horizon. Geoderma 97:273-292. Doi: 10.1016/S0016-7061(00)00066-5
Pinochet, D., Mendoza, J., Galvis, J. (1997). Nitrogen mineralization potential of a Hapludand with different agricultural managements. Hundred. Investig. Agr. 27 (2) :97-106.
Prasolova, N. V., Z.H. XUB, P. G. Safagnaa and M.J. Dieters. (2000). Spatial-temporal variability of soil moisture, nitrogen availability indices and other chemical properties in hoop pine (Araucaria cunninghamii) plantations of subtropical Australia. Forest Ecology and Management.136:1-10. Doi: 10.1016/S0378-1127(99)00254-6
Prieto-Mendez, J., Rubio-Arias, H., Prieto-Garcia, F., Roman-Gutierrez, A. D., Mendez-March, M. A., Acevedo-Sandoval, O. A. (2011). Soil Quality in Terms of Physical-Chemical-Metal Properties for Barley (Hordeum vulgare) Production in the State of Hidalgo, Mexico. American-Eurasian J. Agric. & Environ. Sci, 10 (2): 230-237.
Robertson, G. (2000). Geostatistics for the environmental science. GS + for Windows v. 5.1 Gamma Design Software.
SAS Institute Inc. (1991). SAS / STAT. User’s guide. Version 6.03. Fourth edition, vol. 1. Cary, NC, SAS Institute Inc.
SPSS 17.0. (2007). User Manual SPSS Statistics Base 17.0. SPSS Inc. 233 South Wacker Drive, 11th Floor, Chicago, IL 60606-6412, USA
Sun, B., S. Zhou., Zhao, Q. (2003). Evaluation of spatial and temporal changes of soil quality based on geostatistical analysis in the hill region of subtropical China. Geoderma 115:85-99. Doi: 10.1016/S0016-7061(03)00078-8
Velasco-Velasco, J., Figueroa-Sandoval, B., Ferrera-Cerrato, R. 2004. Trinidad-Santos, A., Gallegos-Sanchez, J. CO2 and microbial population dynamics of manure and straw compost aerated. TERRA,22, (3).307-316.
Whitehead, D.C. (1995). Grassland nitrogen. CAB International, Wallingford, UK. 397 p.

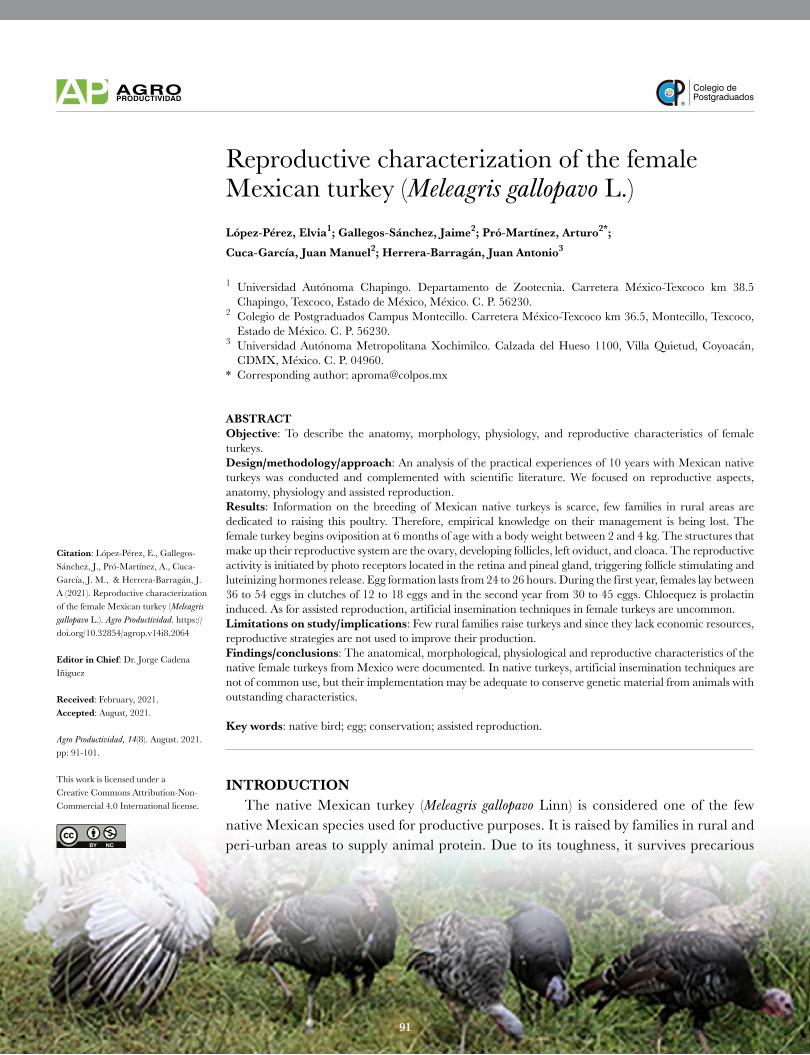
Colegio dePostgraduados
91
Reproductive characterization of the female Mexican turkey (Meleagris gallopavo L.)López-Pérez, Elvia1; Gallegos-Sánchez, Jaime2; Pró-Martínez, Arturo2*;
Cuca-García, Juan Manuel2; Herrera-Barragán, Juan Antonio3
1 Universidad Autónoma Chapingo. Departamento de Zootecnia. Carretera México-Texcoco km 38.5 Chapingo, Texcoco, Estado de México, México. C. P. 56230.
2 Colegio de Postgraduados Campus Montecillo. Carretera México-Texcoco km 36.5, Montecillo, Texcoco, Estado de México. C. P. 56230.
3 Universidad Autónoma Metropolitana Xochimilco. Calzada del Hueso 1100, Villa Quietud, Coyoacán, CDMX, México. C. P. 04960.
* Corresponding author: [email protected]
ABSTRACTObjective: To describe the anatomy, morphology, physiology, and reproductive characteristics of female turkeys.Design/methodology/approach: An analysis of the practical experiences of 10 years with Mexican native turkeys was conducted and complemented with scientific literature. We focused on reproductive aspects, anatomy, physiology and assisted reproduction.Results: Information on the breeding of Mexican native turkeys is scarce, few families in rural areas are dedicated to raising this poultry. Therefore, empirical knowledge on their management is being lost. The female turkey begins oviposition at 6 months of age with a body weight between 2 and 4 kg. The structures that make up their reproductive system are the ovary, developing follicles, left oviduct, and cloaca. The reproductive activity is initiated by photo receptors located in the retina and pineal gland, triggering follicle stimulating and luteinizing hormones release. Egg formation lasts from 24 to 26 hours. During the first year, females lay between 36 to 54 eggs in clutches of 12 to 18 eggs and in the second year from 30 to 45 eggs. Chloequez is prolactin induced. As for assisted reproduction, artificial insemination techniques in female turkeys are uncommon.Limitations on study/implications: Few rural families raise turkeys and since they lack economic resources, reproductive strategies are not used to improve their production.Findings/conclusions: The anatomical, morphological, physiological and reproductive characteristics of the native female turkeys from Mexico were documented. In native turkeys, artificial insemination techniques are not of common use, but their implementation may be adequate to conserve genetic material from animals with outstanding characteristics.
Key words: native bird; egg; conservation; assisted reproduction.
INTRODUCTION The native Mexican turkey (Meleagris gallopavo Linn) is considered one of the few native Mexican species used for productive purposes. It is raised by families in rural and peri-urban areas to supply animal protein. Due to its toughness, it survives precarious
Citation: López-Pérez, E., Gallegos-Sánchez, J., Pró-Martínez, A., Cuca-García, J. M., & Herrera-Barragán, J. A (2021). Reproductive characterization of the female Mexican turkey (Meleagris gallopavo L.). Agro Productividad. https://doi.org/10.32854/agrop.v14i8.2064
Editor in Chief: Dr. Jorge Cadena Iñiguez
Received: February, 2021.Accepted: August, 2021.
Agro Productividad, 14(8). August. 2021. pp: 91-101.
This work is licensed under a Creative Commons Attribution-Non-Commercial 4.0 International license.
91
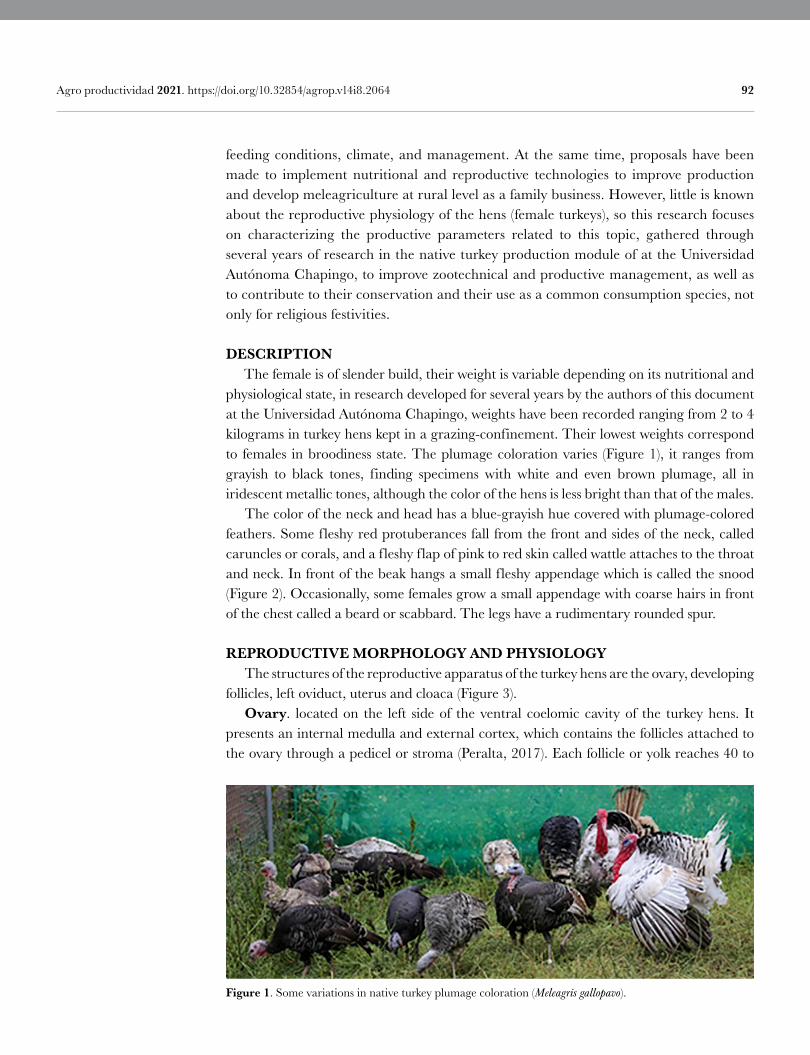
92 Agro productividad 2021. https://doi.org/10.32854/agrop.v14i8.2064
feeding conditions, climate, and management. At the same time, proposals have been made to implement nutritional and reproductive technologies to improve production and develop meleagriculture at rural level as a family business. However, little is known about the reproductive physiology of the hens (female turkeys), so this research focuses on characterizing the productive parameters related to this topic, gathered through several years of research in the native turkey production module of at the Universidad Autónoma Chapingo, to improve zootechnical and productive management, as well as to contribute to their conservation and their use as a common consumption species, not only for religious festivities.
DESCRIPTION The female is of slender build, their weight is variable depending on its nutritional and physiological state, in research developed for several years by the authors of this document at the Universidad Autónoma Chapingo, weights have been recorded ranging from 2 to 4 kilograms in turkey hens kept in a grazing-confinement. Their lowest weights correspond to females in broodiness state. The plumage coloration varies (Figure 1), it ranges from grayish to black tones, finding specimens with white and even brown plumage, all in iridescent metallic tones, although the color of the hens is less bright than that of the males. The color of the neck and head has a blue-grayish hue covered with plumage-colored feathers. Some fleshy red protuberances fall from the front and sides of the neck, called caruncles or corals, and a fleshy flap of pink to red skin called wattle attaches to the throat and neck. In front of the beak hangs a small f leshy appendage which is called the snood (Figure 2). Occasionally, some females grow a small appendage with coarse hairs in front of the chest called a beard or scabbard. The legs have a rudimentary rounded spur.
REPRODUCTIVE MORPHOLOGY AND PHYSIOLOGY The structures of the reproductive apparatus of the turkey hens are the ovary, developing follicles, left oviduct, uterus and cloaca (Figure 3). Ovary. located on the left side of the ventral coelomic cavity of the turkey hens. It presents an internal medulla and external cortex, which contains the follicles attached to the ovary through a pedicel or stroma (Peralta, 2017). Each follicle or yolk reaches 40 to
Figure 1. Some variations in native turkey plumage coloration (Meleagris gallopavo).
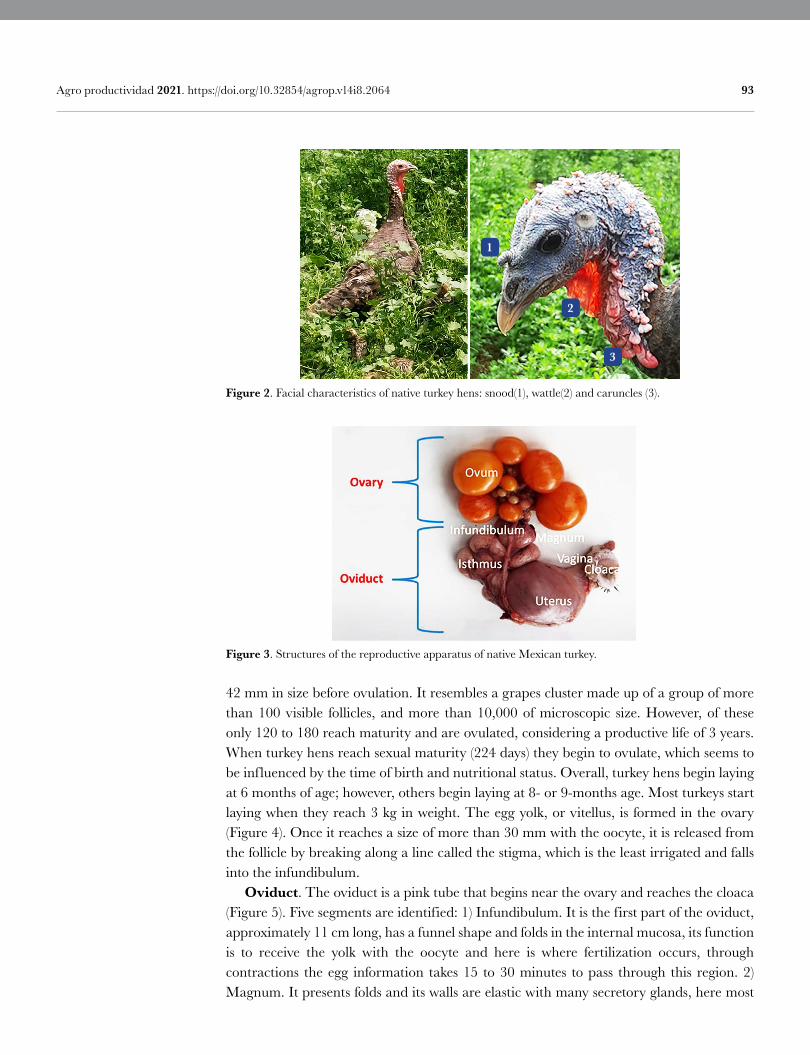
93 Agro productividad 2021. https://doi.org/10.32854/agrop.v14i8.2064
Figure 2. Facial characteristics of native turkey hens: snood(1), wattle(2) and caruncles (3).
1
2
3
Figure 3. Structures of the reproductive apparatus of native Mexican turkey.
42 mm in size before ovulation. It resembles a grapes cluster made up of a group of more than 100 visible follicles, and more than 10,000 of microscopic size. However, of these only 120 to 180 reach maturity and are ovulated, considering a productive life of 3 years. When turkey hens reach sexual maturity (224 days) they begin to ovulate, which seems to be influenced by the time of birth and nutritional status. Overall, turkey hens begin laying at 6 months of age; however, others begin laying at 8- or 9-months age. Most turkeys start laying when they reach 3 kg in weight. The egg yolk, or vitellus, is formed in the ovary (Figure 4). Once it reaches a size of more than 30 mm with the oocyte, it is released from the follicle by breaking along a line called the stigma, which is the least irrigated and falls into the infundibulum. Oviduct. The oviduct is a pink tube that begins near the ovary and reaches the cloaca (Figure 5). Five segments are identified: 1) Infundibulum. It is the first part of the oviduct, approximately 11 cm long, has a funnel shape and folds in the internal mucosa, its function is to receive the yolk with the oocyte and here is where fertilization occurs, through contractions the egg information takes 15 to 30 minutes to pass through this region. 2) Magnum. It presents folds and its walls are elastic with many secretory glands, here most
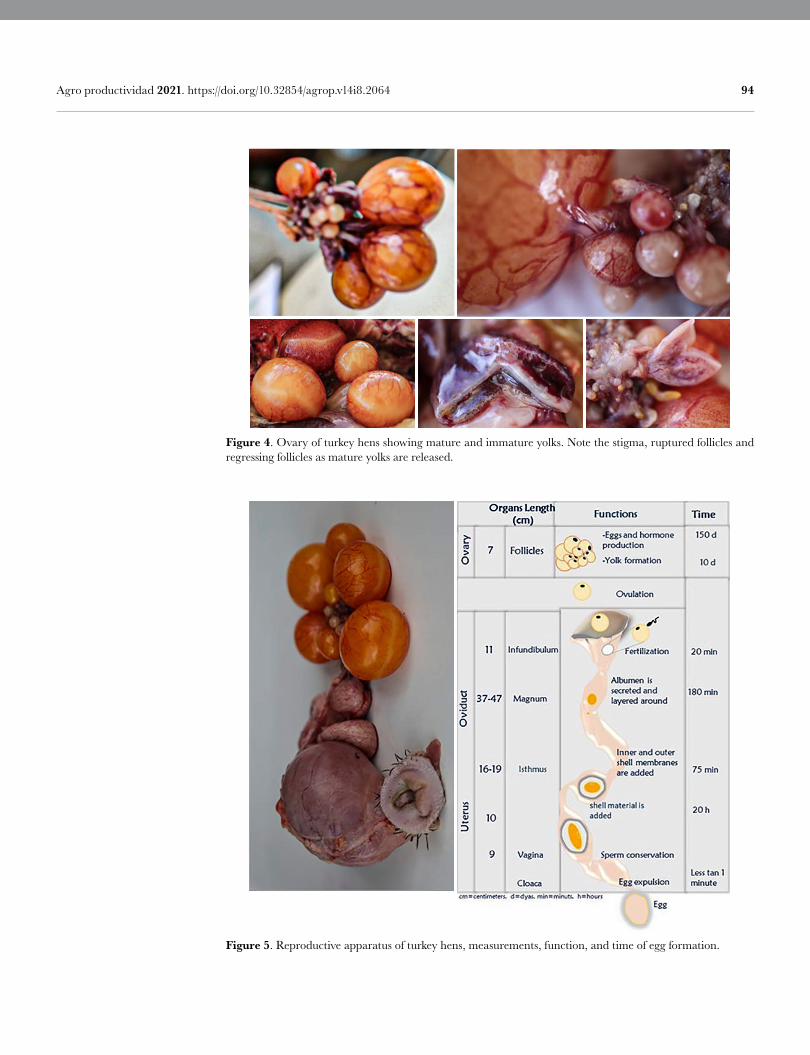
94 Agro productividad 2021. https://doi.org/10.32854/agrop.v14i8.2064
Figure 4. Ovary of turkey hens showing mature and immature yolks. Note the stigma, ruptured follicles and regressing follicles as mature yolks are released.
Figure 5. Reproductive apparatus of turkey hens, measurements, function, and time of egg formation.
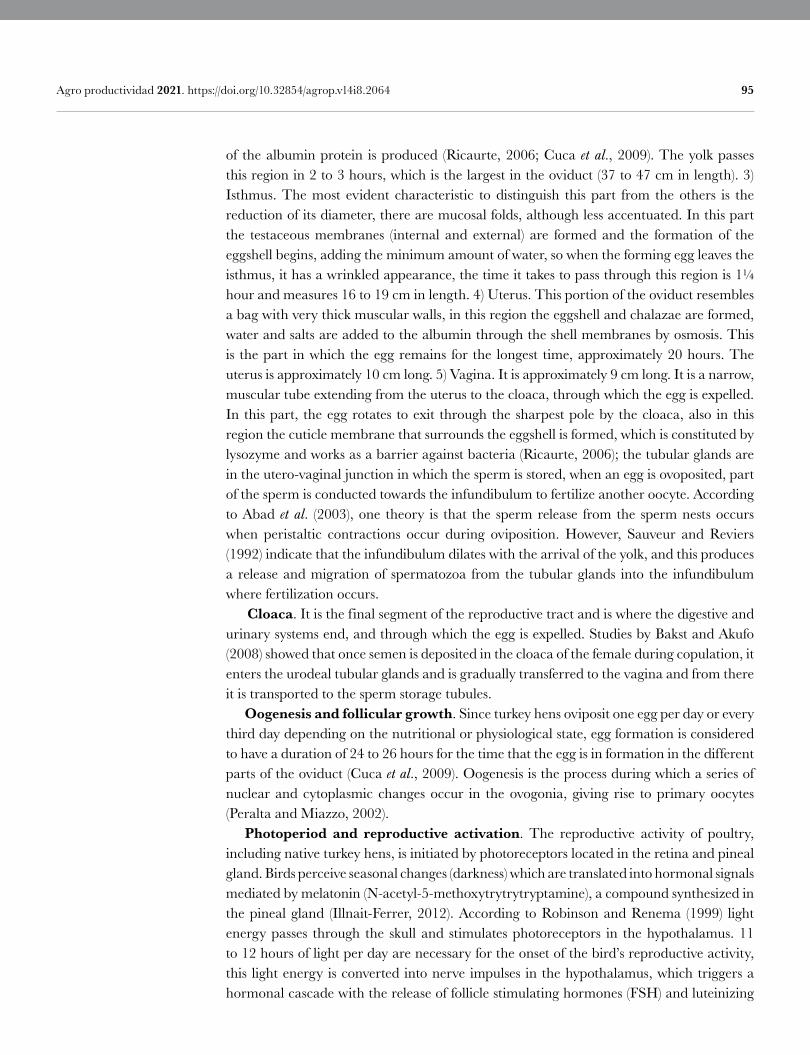
95 Agro productividad 2021. https://doi.org/10.32854/agrop.v14i8.2064
of the albumin protein is produced (Ricaurte, 2006; Cuca et al., 2009). The yolk passes this region in 2 to 3 hours, which is the largest in the oviduct (37 to 47 cm in length). 3) Isthmus. The most evident characteristic to distinguish this part from the others is the reduction of its diameter, there are mucosal folds, although less accentuated. In this part the testaceous membranes (internal and external) are formed and the formation of the eggshell begins, adding the minimum amount of water, so when the forming egg leaves the isthmus, it has a wrinkled appearance, the time it takes to pass through this region is 1¼ hour and measures 16 to 19 cm in length. 4) Uterus. This portion of the oviduct resembles a bag with very thick muscular walls, in this region the eggshell and chalazae are formed, water and salts are added to the albumin through the shell membranes by osmosis. This is the part in which the egg remains for the longest time, approximately 20 hours. The uterus is approximately 10 cm long. 5) Vagina. It is approximately 9 cm long. It is a narrow, muscular tube extending from the uterus to the cloaca, through which the egg is expelled. In this part, the egg rotates to exit through the sharpest pole by the cloaca, also in this region the cuticle membrane that surrounds the eggshell is formed, which is constituted by lysozyme and works as a barrier against bacteria (Ricaurte, 2006); the tubular glands are in the utero-vaginal junction in which the sperm is stored, when an egg is ovoposited, part of the sperm is conducted towards the infundibulum to fertilize another oocyte. According to Abad et al. (2003), one theory is that the sperm release from the sperm nests occurs when peristaltic contractions occur during oviposition. However, Sauveur and Reviers (1992) indicate that the infundibulum dilates with the arrival of the yolk, and this produces a release and migration of spermatozoa from the tubular glands into the infundibulum where fertilization occurs. Cloaca. It is the final segment of the reproductive tract and is where the digestive and urinary systems end, and through which the egg is expelled. Studies by Bakst and Akufo (2008) showed that once semen is deposited in the cloaca of the female during copulation, it enters the urodeal tubular glands and is gradually transferred to the vagina and from there it is transported to the sperm storage tubules. Oogenesis and follicular growth. Since turkey hens oviposit one egg per day or every third day depending on the nutritional or physiological state, egg formation is considered to have a duration of 24 to 26 hours for the time that the egg is in formation in the different parts of the oviduct (Cuca et al., 2009). Oogenesis is the process during which a series of nuclear and cytoplasmic changes occur in the ovogonia, giving rise to primary oocytes (Peralta and Miazzo, 2002). Photoperiod and reproductive activation. The reproductive activity of poultry, including native turkey hens, is initiated by photoreceptors located in the retina and pineal gland. Birds perceive seasonal changes (darkness) which are translated into hormonal signals mediated by melatonin (N-acetyl-5-methoxytrytrytryptamine), a compound synthesized in the pineal gland (Illnait-Ferrer, 2012). According to Robinson and Renema (1999) light energy passes through the skull and stimulates photoreceptors in the hypothalamus. 11 to 12 hours of light per day are necessary for the onset of the bird’s reproductive activity, this light energy is converted into nerve impulses in the hypothalamus, which triggers a hormonal cascade with the release of follicle stimulating hormones (FSH) and luteinizing
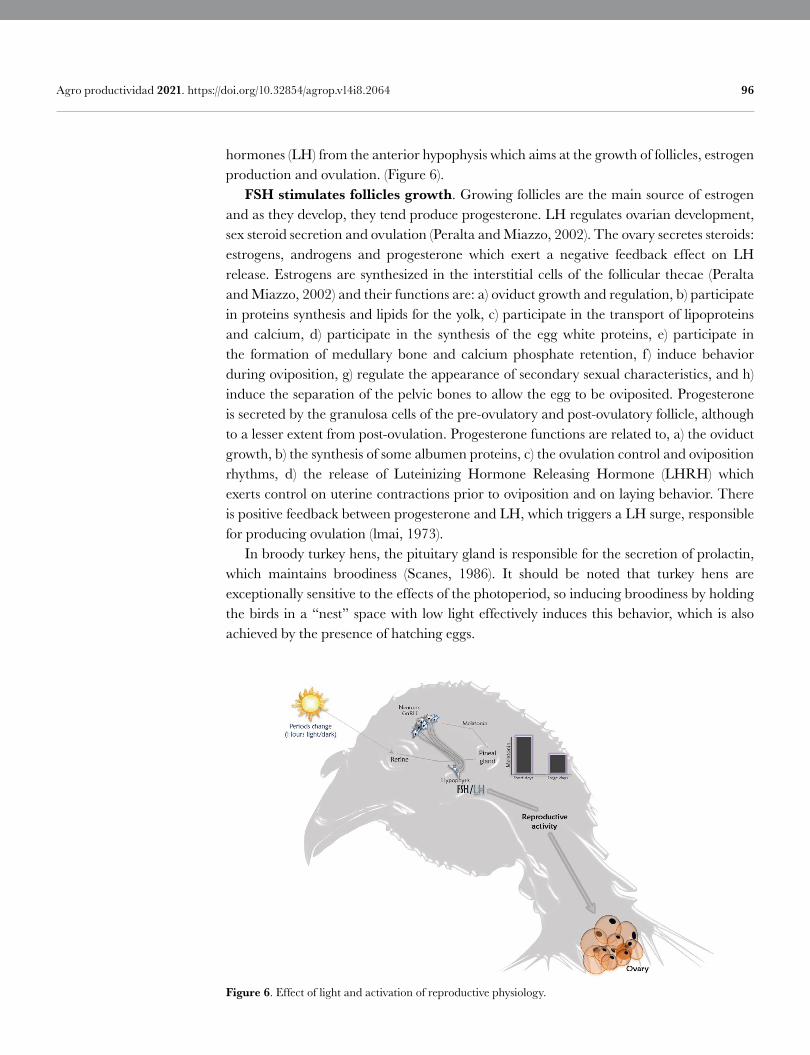
96 Agro productividad 2021. https://doi.org/10.32854/agrop.v14i8.2064
hormones (LH) from the anterior hypophysis which aims at the growth of follicles, estrogen production and ovulation. (Figure 6). FSH stimulates follicles growth. Growing follicles are the main source of estrogen and as they develop, they tend produce progesterone. LH regulates ovarian development, sex steroid secretion and ovulation (Peralta and Miazzo, 2002). The ovary secretes steroids: estrogens, androgens and progesterone which exert a negative feedback effect on LH release. Estrogens are synthesized in the interstitial cells of the follicular thecae (Peralta and Miazzo, 2002) and their functions are: a) oviduct growth and regulation, b) participate in proteins synthesis and lipids for the yolk, c) participate in the transport of lipoproteins and calcium, d) participate in the synthesis of the egg white proteins, e) participate in the formation of medullary bone and calcium phosphate retention, f ) induce behavior during oviposition, g) regulate the appearance of secondary sexual characteristics, and h) induce the separation of the pelvic bones to allow the egg to be oviposited. Progesterone is secreted by the granulosa cells of the pre-ovulatory and post-ovulatory follicle, although to a lesser extent from post-ovulation. Progesterone functions are related to, a) the oviduct growth, b) the synthesis of some albumen proteins, c) the ovulation control and oviposition rhythms, d) the release of Luteinizing Hormone Releasing Hormone (LHRH) which exerts control on uterine contractions prior to oviposition and on laying behavior. There is positive feedback between progesterone and LH, which triggers a LH surge, responsible for producing ovulation (lmai, 1973). In broody turkey hens, the pituitary gland is responsible for the secretion of prolactin, which maintains broodiness (Scanes, 1986). It should be noted that turkey hens are exceptionally sensitive to the effects of the photoperiod, so inducing broodiness by holding the birds in a “nest” space with low light effectively induces this behavior, which is also achieved by the presence of hatching eggs.
Figure 6. Effect of light and activation of reproductive physiology.
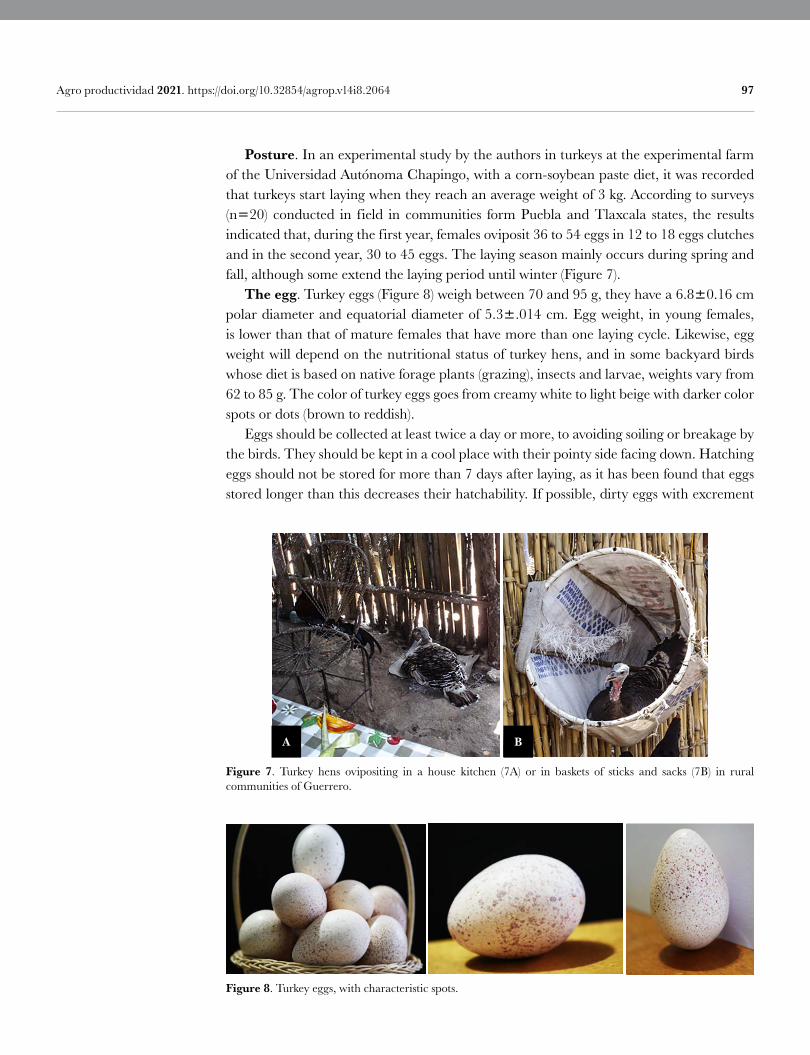
97 Agro productividad 2021. https://doi.org/10.32854/agrop.v14i8.2064
Posture. In an experimental study by the authors in turkeys at the experimental farm of the Universidad Autónoma Chapingo, with a corn-soybean paste diet, it was recorded that turkeys start laying when they reach an average weight of 3 kg. According to surveys (n20) conducted in field in communities form Puebla and Tlaxcala states, the results indicated that, during the first year, females oviposit 36 to 54 eggs in 12 to 18 eggs clutches and in the second year, 30 to 45 eggs. The laying season mainly occurs during spring and fall, although some extend the laying period until winter (Figure 7). The egg. Turkey eggs (Figure 8) weigh between 70 and 95 g, they have a 6.80.16 cm polar diameter and equatorial diameter of 5.3.014 cm. Egg weight, in young females, is lower than that of mature females that have more than one laying cycle. Likewise, egg weight will depend on the nutritional status of turkey hens, and in some backyard birds whose diet is based on native forage plants (grazing), insects and larvae, weights vary from 62 to 85 g. The color of turkey eggs goes from creamy white to light beige with darker color spots or dots (brown to reddish). Eggs should be collected at least twice a day or more, to avoiding soiling or breakage by the birds. They should be kept in a cool place with their pointy side facing down. Hatching eggs should not be stored for more than 7 days after laying, as it has been found that eggs stored longer than this decreases their hatchability. If possible, dirty eggs with excrement
A B
Figure 7. Turkey hens ovipositing in a house kitchen (7A) or in baskets of sticks and sacks (7B) in rural communities of Guerrero.
Figure 8. Turkey eggs, with characteristic spots.
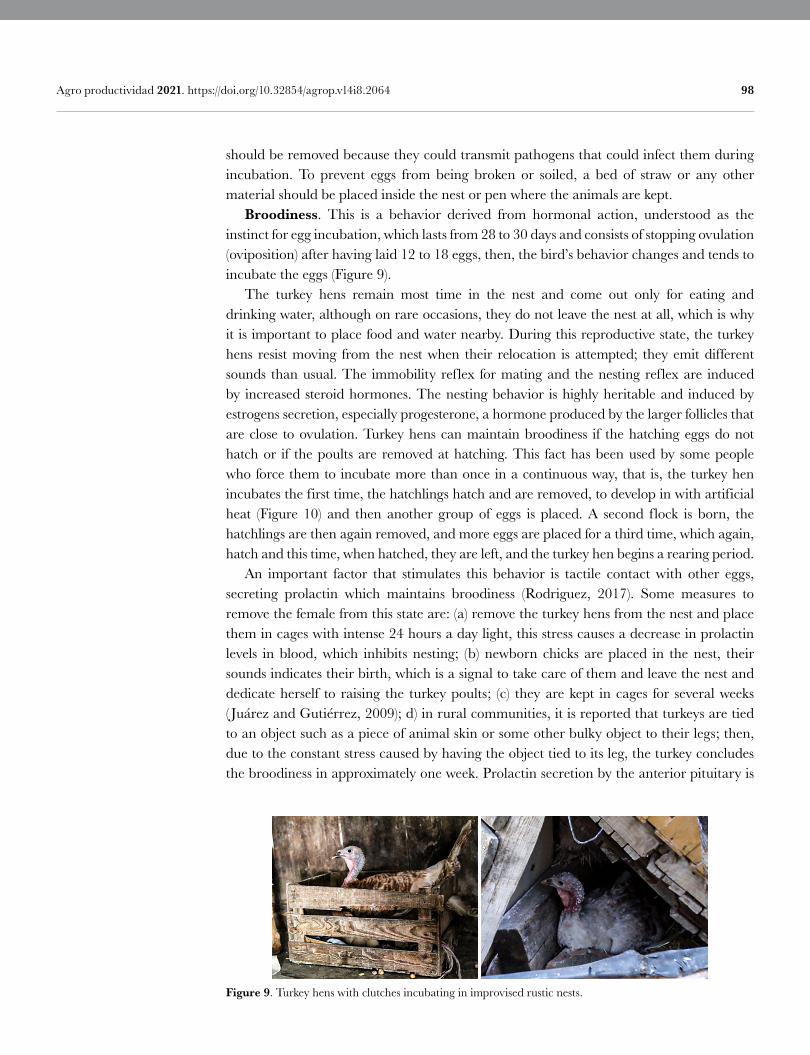
98 Agro productividad 2021. https://doi.org/10.32854/agrop.v14i8.2064
should be removed because they could transmit pathogens that could infect them during incubation. To prevent eggs from being broken or soiled, a bed of straw or any other material should be placed inside the nest or pen where the animals are kept. Broodiness. This is a behavior derived from hormonal action, understood as the instinct for egg incubation, which lasts from 28 to 30 days and consists of stopping ovulation (oviposition) after having laid 12 to 18 eggs, then, the bird’s behavior changes and tends to incubate the eggs (Figure 9). The turkey hens remain most time in the nest and come out only for eating and drinking water, although on rare occasions, they do not leave the nest at all, which is why it is important to place food and water nearby. During this reproductive state, the turkey hens resist moving from the nest when their relocation is attempted; they emit different sounds than usual. The immobility reflex for mating and the nesting reflex are induced by increased steroid hormones. The nesting behavior is highly heritable and induced by estrogens secretion, especially progesterone, a hormone produced by the larger follicles that are close to ovulation. Turkey hens can maintain broodiness if the hatching eggs do not hatch or if the poults are removed at hatching. This fact has been used by some people who force them to incubate more than once in a continuous way, that is, the turkey hen incubates the first time, the hatchlings hatch and are removed, to develop in with artificial heat (Figure 10) and then another group of eggs is placed. A second flock is born, the hatchlings are then again removed, and more eggs are placed for a third time, which again, hatch and this time, when hatched, they are left, and the turkey hen begins a rearing period. An important factor that stimulates this behavior is tactile contact with other eggs, secreting prolactin which maintains broodiness (Rodriguez, 2017). Some measures to remove the female from this state are: (a) remove the turkey hens from the nest and place them in cages with intense 24 hours a day light, this stress causes a decrease in prolactin levels in blood, which inhibits nesting; (b) newborn chicks are placed in the nest, their sounds indicates their birth, which is a signal to take care of them and leave the nest and dedicate herself to raising the turkey poults; (c) they are kept in cages for several weeks ( Juárez and Gutiérrez, 2009); d) in rural communities, it is reported that turkeys are tied to an object such as a piece of animal skin or some other bulky object to their legs; then, due to the constant stress caused by having the object tied to its leg, the turkey concludes the broodiness in approximately one week. Prolactin secretion by the anterior pituitary is
Figure 9. Turkey hens with clutches incubating in improvised rustic nests.
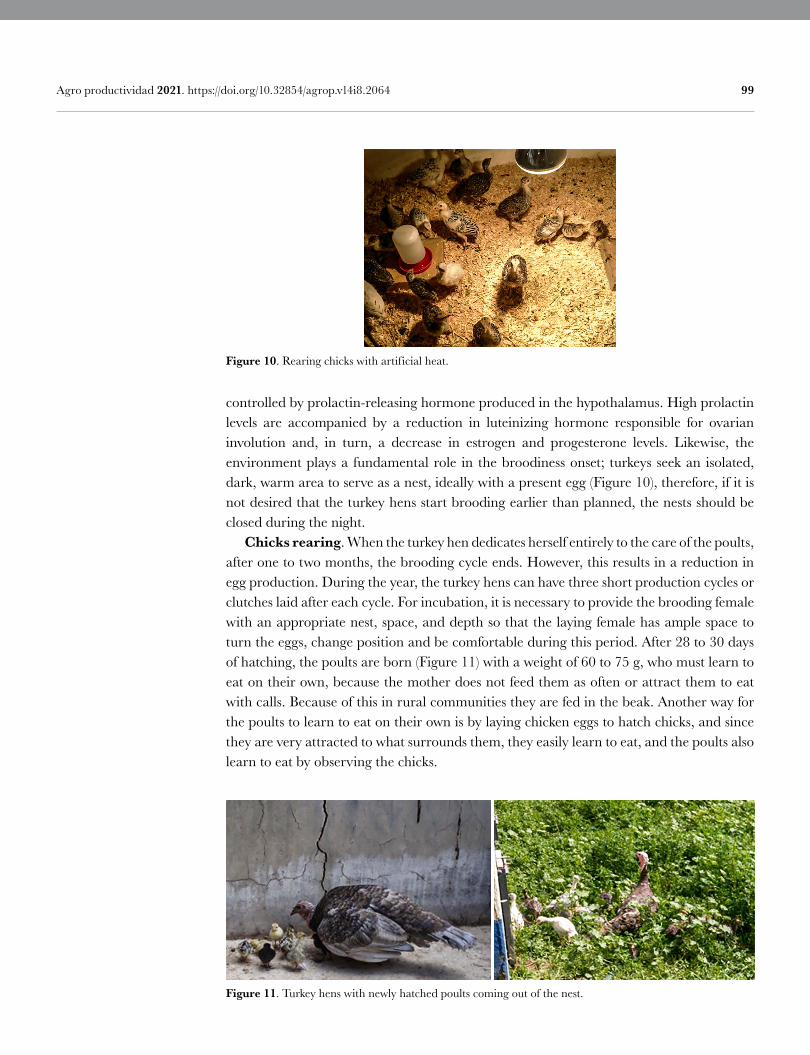
99 Agro productividad 2021. https://doi.org/10.32854/agrop.v14i8.2064
Figure 10. Rearing chicks with artificial heat.
controlled by prolactin-releasing hormone produced in the hypothalamus. High prolactin levels are accompanied by a reduction in luteinizing hormone responsible for ovarian involution and, in turn, a decrease in estrogen and progesterone levels. Likewise, the environment plays a fundamental role in the broodiness onset; turkeys seek an isolated, dark, warm area to serve as a nest, ideally with a present egg (Figure 10), therefore, if it is not desired that the turkey hens start brooding earlier than planned, the nests should be closed during the night. Chicks rearing. When the turkey hen dedicates herself entirely to the care of the poults, after one to two months, the brooding cycle ends. However, this results in a reduction in egg production. During the year, the turkey hens can have three short production cycles or clutches laid after each cycle. For incubation, it is necessary to provide the brooding female with an appropriate nest, space, and depth so that the laying female has ample space to turn the eggs, change position and be comfortable during this period. After 28 to 30 days of hatching, the poults are born (Figure 11) with a weight of 60 to 75 g, who must learn to eat on their own, because the mother does not feed them as often or attract them to eat with calls. Because of this in rural communities they are fed in the beak. Another way for the poults to learn to eat on their own is by laying chicken eggs to hatch chicks, and since they are very attracted to what surrounds them, they easily learn to eat, and the poults also learn to eat by observing the chicks.
Figure 11. Turkey hens with newly hatched poults coming out of the nest.
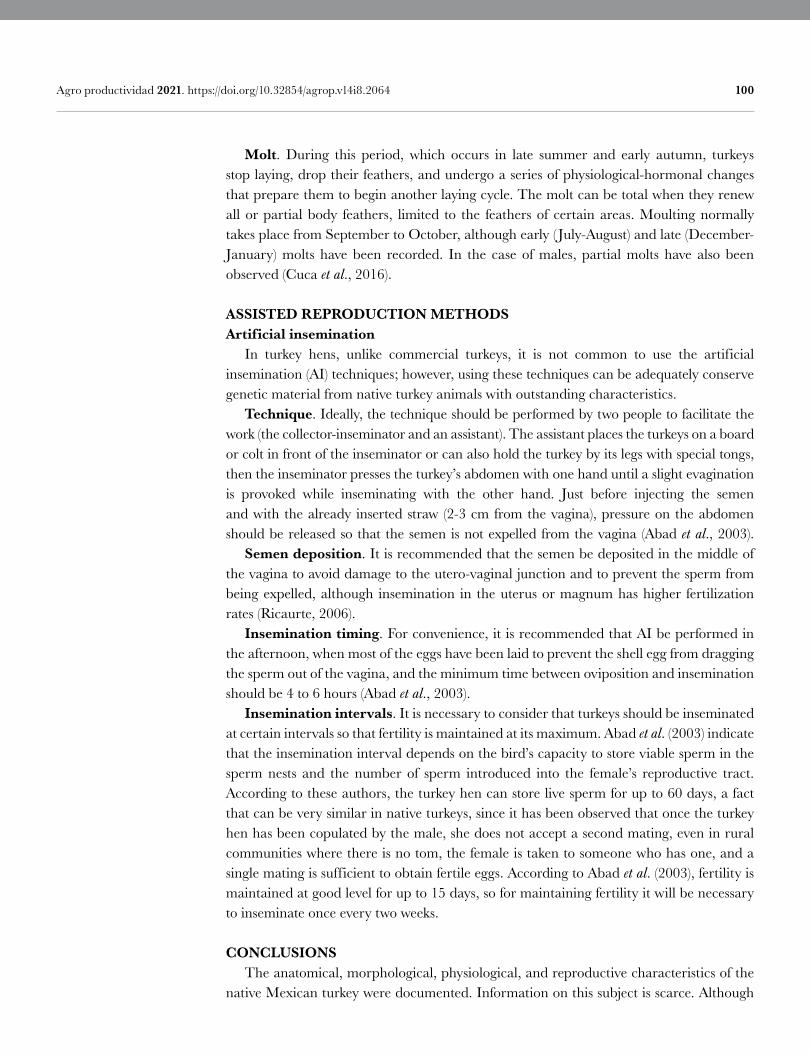
100 Agro productividad 2021. https://doi.org/10.32854/agrop.v14i8.2064
Molt. During this period, which occurs in late summer and early autumn, turkeys stop laying, drop their feathers, and undergo a series of physiological-hormonal changes that prepare them to begin another laying cycle. The molt can be total when they renew all or partial body feathers, limited to the feathers of certain areas. Moulting normally takes place from September to October, although early ( July-August) and late (December-January) molts have been recorded. In the case of males, partial molts have also been observed (Cuca et al., 2016).
ASSISTED REPRODUCTION METHODSArtificial insemination In turkey hens, unlike commercial turkeys, it is not common to use the artificial insemination (AI) techniques; however, using these techniques can be adequately conserve genetic material from native turkey animals with outstanding characteristics. Technique. Ideally, the technique should be performed by two people to facilitate the work (the collector-inseminator and an assistant). The assistant places the turkeys on a board or colt in front of the inseminator or can also hold the turkey by its legs with special tongs, then the inseminator presses the turkey’s abdomen with one hand until a slight evagination is provoked while inseminating with the other hand. Just before injecting the semen and with the already inserted straw (2-3 cm from the vagina), pressure on the abdomen should be released so that the semen is not expelled from the vagina (Abad et al., 2003). Semen deposition. It is recommended that the semen be deposited in the middle of the vagina to avoid damage to the utero-vaginal junction and to prevent the sperm from being expelled, although insemination in the uterus or magnum has higher fertilization rates (Ricaurte, 2006). Insemination timing. For convenience, it is recommended that AI be performed in the afternoon, when most of the eggs have been laid to prevent the shell egg from dragging the sperm out of the vagina, and the minimum time between oviposition and insemination should be 4 to 6 hours (Abad et al., 2003). Insemination intervals. It is necessary to consider that turkeys should be inseminated at certain intervals so that fertility is maintained at its maximum. Abad et al. (2003) indicate that the insemination interval depends on the bird’s capacity to store viable sperm in the sperm nests and the number of sperm introduced into the female’s reproductive tract. According to these authors, the turkey hen can store live sperm for up to 60 days, a fact that can be very similar in native turkeys, since it has been observed that once the turkey hen has been copulated by the male, she does not accept a second mating, even in rural communities where there is no tom, the female is taken to someone who has one, and a single mating is sufficient to obtain fertile eggs. According to Abad et al. (2003), fertility is maintained at good level for up to 15 days, so for maintaining fertility it will be necessary to inseminate once every two weeks.
CONCLUSIONS The anatomical, morphological, physiological, and reproductive characteristics of the native Mexican turkey were documented. Information on this subject is scarce. Although
101 Agro productividad 2021. https://doi.org/10.32854/agrop.v14i8.2064
it is not common to use artificial insemination in native turkeys, this technique can be adequate to conserve genetic material of animals with outstanding characteristics.
REFERENCESAbad, M., Castelló, L.l.J.C., Carbajo, G.E., Casanovas, I.P., Dalmau, B.A., García, M.E., Leva, G.R.,
Martínez-Alesón, S.R. (2003). Reproducción e incubación en avicultura. Real Escuela de Avicultura, Barcelona, España.
Bakst, M.R., Akuffo, V. (2008). Turkey Sperm reside in the tubular glands in the urodeum following artificial Insemination. Poultry Science, 87,(4). 790-792. Doi: 10.3382/ps.2007-00293
Cuca, G.M., Ávila, G.E, Pró, M.A. (2009). Alimentación de las aves. Studio Lithografico. Departamento de Zootecnia. Dirección de Patronato Universitario. Universidad Autónoma Chapingo.
Cuca, G.M., Valdés, N.V.M., Gómez, V.G., & López, P.E. (2016). Producción y manejo de aves domésticas. 1ª reimp. AIP. Coatlinchán, Texcoco. Estado de México.
Illnait-Ferrer, J. (2012). Melatonina: actualidad de una hormona olvidada. Revista CENIC. Ciencias Biológicas, 43(3): 1-12.
Imai, K. (1973). Effects of avian and mammalian pituitary preparations on induction of ovulation in the domestic fowl, Gallus domesticus. Journal of Reproduction and Fertility, 33(1), 91-98. Doi: 10.1530/jrf.0.0330091
Juárez, A. Gutiérrez, E. (2009). Control de cloequez y comportamiento productivo de guajolotas criollas. Avances en Investigación Agropecuaria, 13(1): 59-70.
Peralta, M.F. (2017). Bases de la Reproducción Aviar. Universidad Nacional de Río Cuarto FAV. Prod. Animal Producción Avícola. Argentina.
Peralta, M.F., Miazo, R. (2002). Bases de la Reproducción animal: Reproducción aviar. Universidad Nacional del Río Cuarto FAV. Disponible en: www.produccion-animal.com.ar
Ricaurte, G.S.L. (2006). Importancia de un buen manejo de la reproducción en avicultura. Revista Electrónica de Veterinaria REDVET, 7(4): 1-16.
Rodriguez, E. (2017) Cloequez. Veterinaria Digital – Avicultura, Porcicultura, Rumiantes y Acuicultura. Disponible en: https://www.veterinariadigital.com/articulos/la-cloquez/
Robinson, F.E., Renema, R. (1999). Principles of photoperiod management in female broiler breeders. University of Alberta, Department of Agricultural, Food and Nutritional Sciences. Technical news, Cobb-Vantres.
Sauveur, B., Reviers, M. (1992). Reproducción de las aves. 2ª ed. Ed. Mundiprensa. Madrid, España.Scanes, C. (1986). Pituitary gland. En P. Sturkie (Ed.), Avian Physiology (pp. 383-402). Springer Verlag.

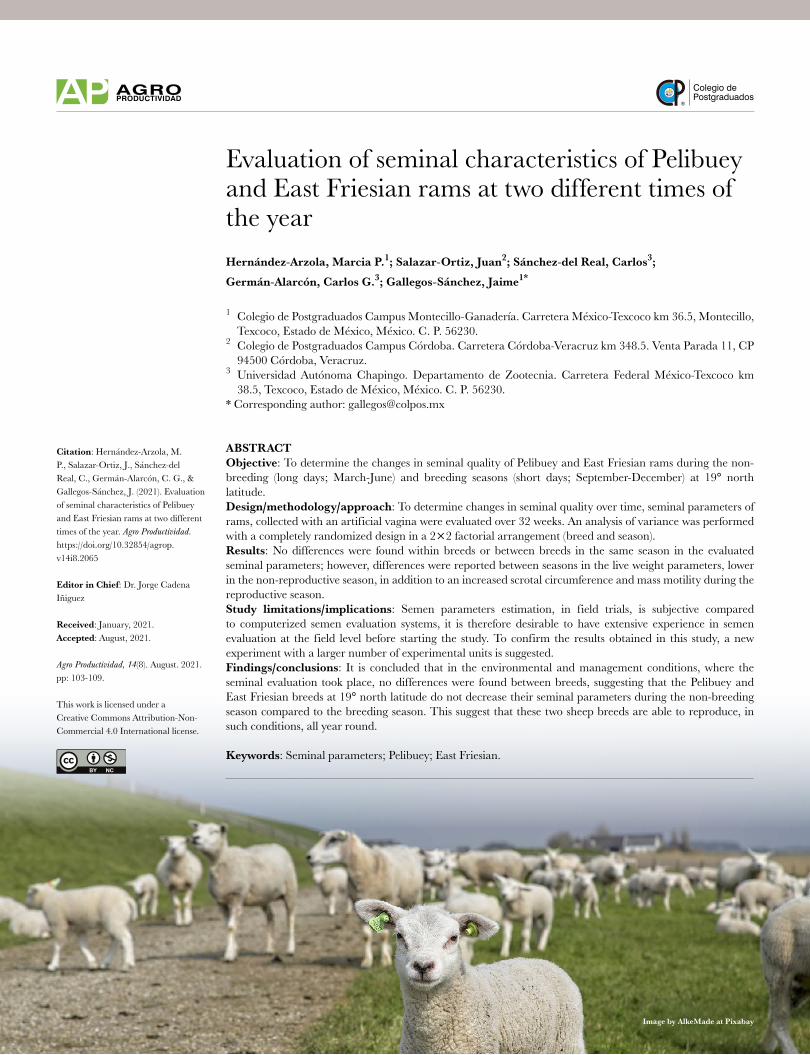
Colegio dePostgraduados
103
Evaluation of seminal characteristics of Pelibuey and East Friesian rams at two different times of the yearHernández-Arzola, Marcia P.1; Salazar-Ortiz, Juan2; Sánchez-del Real, Carlos3;
Germán-Alarcón, Carlos G.3; Gallegos-Sánchez, Jaime1*
1 Colegio de Postgraduados Campus Montecillo-Ganadería. Carretera México-Texcoco km 36.5, Montecillo, Texcoco, Estado de México, México. C. P. 56230.
2 Colegio de Postgraduados Campus Córdoba. Carretera Córdoba-Veracruz km 348.5. Venta Parada 11, CP 94500 Córdoba, Veracruz.
3 Universidad Autónoma Chapingo. Departamento de Zootecnia. Carretera Federal México-Texcoco km 38.5, Texcoco, Estado de México, México. C. P. 56230.
* Corresponding author: [email protected]
ABSTRACTObjective: To determine the changes in seminal quality of Pelibuey and East Friesian rams during the non-breeding (long days; March-June) and breeding seasons (short days; September-December) at 19° north latitude.Design/methodology/approach: To determine changes in seminal quality over time, seminal parameters of rams, collected with an artificial vagina were evaluated over 32 weeks. An analysis of variance was performed with a completely randomized design in a 22 factorial arrangement (breed and season).Results: No differences were found within breeds or between breeds in the same season in the evaluated seminal parameters; however, differences were reported between seasons in the live weight parameters, lower in the non-reproductive season, in addition to an increased scrotal circumference and mass motility during the reproductive season.Study limitations/implications: Semen parameters estimation, in field trials, is subjective compared to computerized semen evaluation systems, it is therefore desirable to have extensive experience in semen evaluation at the field level before starting the study. To confirm the results obtained in this study, a new experiment with a larger number of experimental units is suggested.Findings/conclusions: It is concluded that in the environmental and management conditions, where the seminal evaluation took place, no differences were found between breeds, suggesting that the Pelibuey and East Friesian breeds at 19° north latitude do not decrease their seminal parameters during the non-breeding season compared to the breeding season. This suggest that these two sheep breeds are able to reproduce, in such conditions, all year round.
Keywords: Seminal parameters; Pelibuey; East Friesian.
Image by AlkeMade at Pixabay
Citation: Hernández-Arzola, M. P., Salazar-Ortiz, J., Sánchez-del Real, C., Germán-Alarcón, C. G., & Gallegos-Sánchez, J. (2021). Evaluation of seminal characteristics of Pelibuey and East Friesian rams at two different times of the year. Agro Productividad.https://doi.org/10.32854/agrop.v14i8.2065
Editor in Chief: Dr. Jorge Cadena Iñiguez
Received: January, 2021.Accepted: August, 2021.
Agro Productividad, 14(8). August. 2021. pp: 103-109.
This work is licensed under a Creative Commons Attribution-Non-Commercial 4.0 International license.
104 Agro productividad 2021. https://doi.org/10.32854/agrop.v14i8.2065
INTRODUCTION Sheep represent one of the most important livestock species in the world due to the various products derived from them (meat, milk, wool) and its by-products (hair, leather, manure, hooves) (Sánchez-Rodríguez, 2010). To improve productive variables within the herd, reproductive biotechnology has been incorporated in many scientific studies, aiming to understand female and male physiology (Alonso-Aguerrebere, 2018). Studies aimed at solving certain physiological aspects in ram reproduction are focused on making the spermatogenesis process more efficient and thereby improving seminal quality, a very important variable for improving reproductive efficiency in sheep; however, these cellular events related to other environmental factors, such as the photoperiod (Blache et al., 2000; Martin et al., 2010). A ram is defined as a seasonal breeder and its reproductive activity is regulated by hormones that dynamically integrate the neuroendocrine axis: hypothalamus-adenohypophysis-testes; in particular, melatonin and testosterone. Melatonin is synthesized at the pineal glands, the duration of its secretion increases during the reproductive season (short days; autumn-winter) and decreases in the non-reproductive season (long days; spring and summer; northern latitude), regulating the frequency of pulsatile secretion of gonadotropin-releasing hormone (GnRH; Orihuela-Trujillo, 2014). Different sheep breeds show variations in their testosterone secretions throughout the year, and therefore, there are fluctuations in seminal production; however, something important is that, although rams are less susceptible than females to photoperiod and it has been shown that libido decreases during the non-reproductive season, the spermatogenesis process is continuous, although the efficiency with which this cellular event occurs varies due to the effect of photoperiod (Martin et al., 2010; Orihuela-Trujillo 2014). Other great relevant factors in the different reproductive processes of the rams are the breed and the latitude of origin, since hair breeds, which inhabit latitudes close to the equator, show little seasonality (Arroyo-Ledezma et al., 2007), and breeds from latitudes far from the equator, such as meat and wool-producing breeds, show a marked reproductive seasonality (Malpaux et al., 1997). Thus, the photoperiod, through seasonality and the fluctuations experienced by the spermatogenic process throughout the year, exerts important effects on the physiology of the testis, which will closely relate to the various variables that characterize the ram semen and have a direct impact on seminal quality (Arellano-Lezama, 2015). The objective of the present study was to determine the changes over time in the seminal quality in two ram breeds (Pelibuey vs. East Friesian).
MATERIALS AND METHODSExperimental animals The study took place from April to July (non-reproductive season; 16 weeks), and from September to December (reproductive season; 16 weeks) of 2020 since the duration of the sperm cycle in rams is approximately 52 to 55 days. The study was carried out at the Sheep and Goat Reproduction Laboratory (LaROCa), at the Colegio de Postgraduados, Campus Montecillos, located at 19° 29’ north latitude and 98° 53’ west latitude and 2240 masl (Garcia, 2004).
105 Agro productividad 2021. https://doi.org/10.32854/agrop.v14i8.2065
An eight rams group was used, four of the Pelibuey breed (R1) and four of the East Friesian breed (R2), with an average age of 2.50.5 years and an average initial weight for R1 of 64.57.4 kg and R2 of 70.32.17 kg, these were kept in observation pens, under an intensive management system in a natural photoperiod. Before starting the study, all rams were dewormed with Ivermectin at a dose of 0.2 mg kg1 of body weight, vaccinated with BOBACT® 8 (MSD Animal Health) at a 2.5 mL dose per animal, with two applications before the start of the study and with a period of 15 days between the two applications. Also, before the start of the study, behavioral training of the rams was performed, which consisted of taking the sexually inexperienced rams to the mounting area every day for 15 days prior to the start of the study, to familiarize them and teach them to perform the mounting behavior on a restrained ewe. All experimental animals used in this study were handled following the Mexican Official Standard NOM-062-ZOO-1999 (SAGARPA, 1999) and the manual of practices, and procedures for experimental animals of the Colegio de Postgraduados. During the development of the study, all rams were fed with a base diet at a rate of 3 kg per animal day1, the diet consisted of 60% of oat hay and 24% of sun-cured alfalfa hay, 15% of a commercial concentrate (Borrega plus: Alimentos Unión Tepexpan®; 12% CP, 40% FDA, 51% NDF, 2.3% EE and 9% ash) and 1% of minerals.
Seminal variables and evaluation procedure The rams were weighed on a scale (Braunker® YP200S) with a 250 kg capacity 100 g, and the scrotal circumference was measured (weekly) with a tape measure (Mellisho, 2010). The assessed semen variables were classified as qualitative: mass motility, individual progressive motility, appearance and color, as well as quantitative: percentage of live spermatozoa, abnormal spermatozoa (normality), sperm concentration, volume and time to ejaculate. Immediately after obtaining the samples, using the artificial vagina method, these were analyzed in the laboratory. Semen was evaluated by examining volume and appearance (watery or creamy), as well as color in 15 mL graduated tubes. To determine the mass motility, a drop of semen was taken with a Pasteur pipette and observed under a brightfield microscope (Carl ZEISS®, Primo Star, Microimaging GmbH 37081, Göttingen, Germany. Series-Nr: 3125001511), at a 10X objective, with eyepieces and objectives centered using Köeller illumination, assigning values from 0 (no motility) to 5 (maximum motility, swirling with vigorous mass movement). In the same way, individual progressive motility was evaluated, observing the sperm trajectory ranging from 0 to 100%. The percentage of live spermatozoa was quantified using a smear stained with the eosin-nigrosin staining technique, the preparations were dried at room temperature and 100 spermatozoa were counted in a single ocular field, considering dead those that were totally or partially stained (Mellisho, 2010). On the smear, the most frequent abnormalities in structure and morphology of 100 cells were observed, the number of spermatozoa with loose heads, coiled tails, loose or double tails, which were the most frequent abnormalities, were determined. Sperm concentration was determined by the
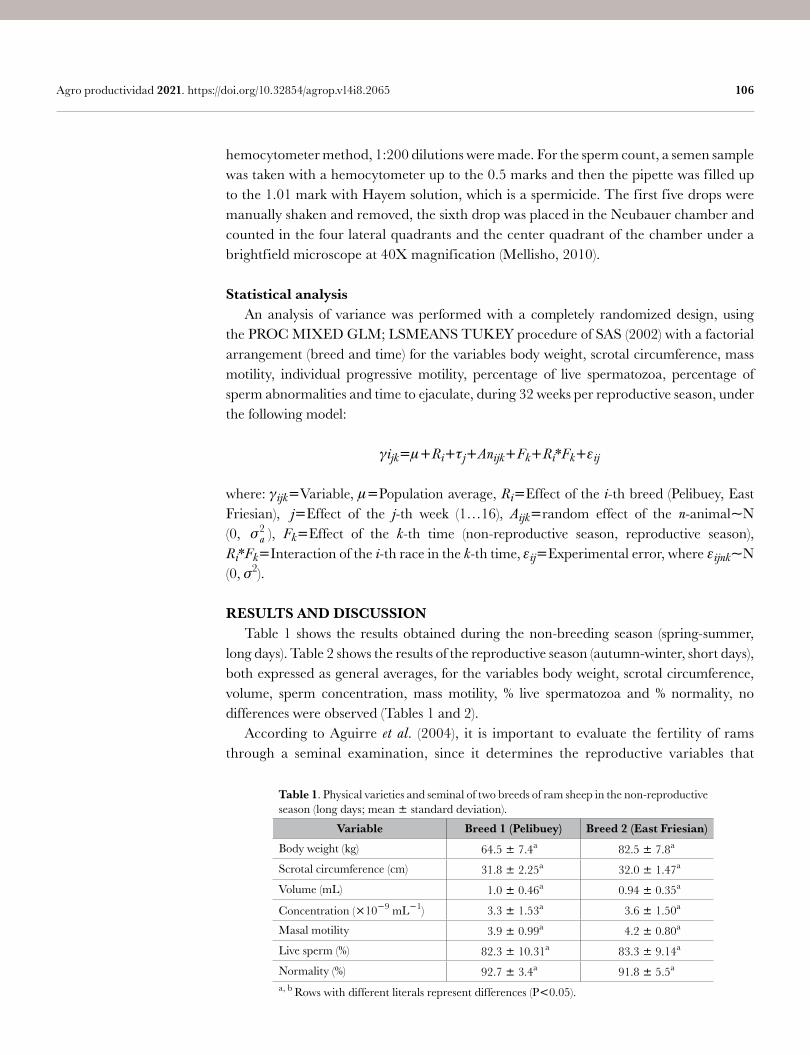
106 Agro productividad 2021. https://doi.org/10.32854/agrop.v14i8.2065
hemocytometer method, 1:200 dilutions were made. For the sperm count, a semen sample was taken with a hemocytometer up to the 0.5 marks and then the pipette was filled up to the 1.01 mark with Hayem solution, which is a spermicide. The first five drops were manually shaken and removed, the sixth drop was placed in the Neubauer chamber and counted in the four lateral quadrants and the center quadrant of the chamber under a brightfield microscope at 40X magnification (Mellisho, 2010).
Statistical analysis An analysis of variance was performed with a completely randomized design, using the PROC MIXED GLM; LSMEANS TUKEY procedure of SAS (2002) with a factorial arrangement (breed and time) for the variables body weight, scrotal circumference, mass motility, individual progressive motility, percentage of live spermatozoa, percentage of sperm abnormalities and time to ejaculate, during 32 weeks per reproductive season, under the following model:
ijkRijAnijkFkRi*Fkij
where: ijkVariable, Population average, RiEffect of the i-th breed (Pelibuey, East Friesian), γjEffect of the j-th week (1…16), Aijkrandom effect of the n-animalN (0, a
2 ), FkEffect of the k-th time (non-reproductive season, reproductive season), Ri*FkInteraction of the i-th race in the k-th time, ijExperimental error, whereγijnkN (0, 2).
RESULTS AND DISCUSSION Table 1 shows the results obtained during the non-breeding season (spring-summer, long days). Table 2 shows the results of the reproductive season (autumn-winter, short days), both expressed as general averages, for the variables body weight, scrotal circumference, volume, sperm concentration, mass motility, % live spermatozoa and % normality, no differences were observed (Tables 1 and 2). According to Aguirre et al. (2004), it is important to evaluate the fertility of rams through a seminal examination, since it determines the reproductive variables that
Table 1. Physical varieties and seminal of two breeds of ram sheep in the non-reproductive season (long days; mean standard deviation).
Variable Breed 1 (Pelibuey) Breed 2 (East Friesian)
Body weight (kg) 64.5 7.4a 82.5 7.8a
Scrotal circumference (cm) 31.8 2.25a 32.0 1.47a
Volume (mL) 1.0 0.46a 0.94 0.35a
Concentration (109 mL1) 3.3 1.53a 3.6 1.50a
Masal motility 3.9 0.99a 4.2 0.80a
Live sperm (%) 82.3 10.31a 83.3 9.14a
Normality (%) 92.7 3.4a 91.8 5.5a
a, b Rows with different literals represent differences (P0.05).
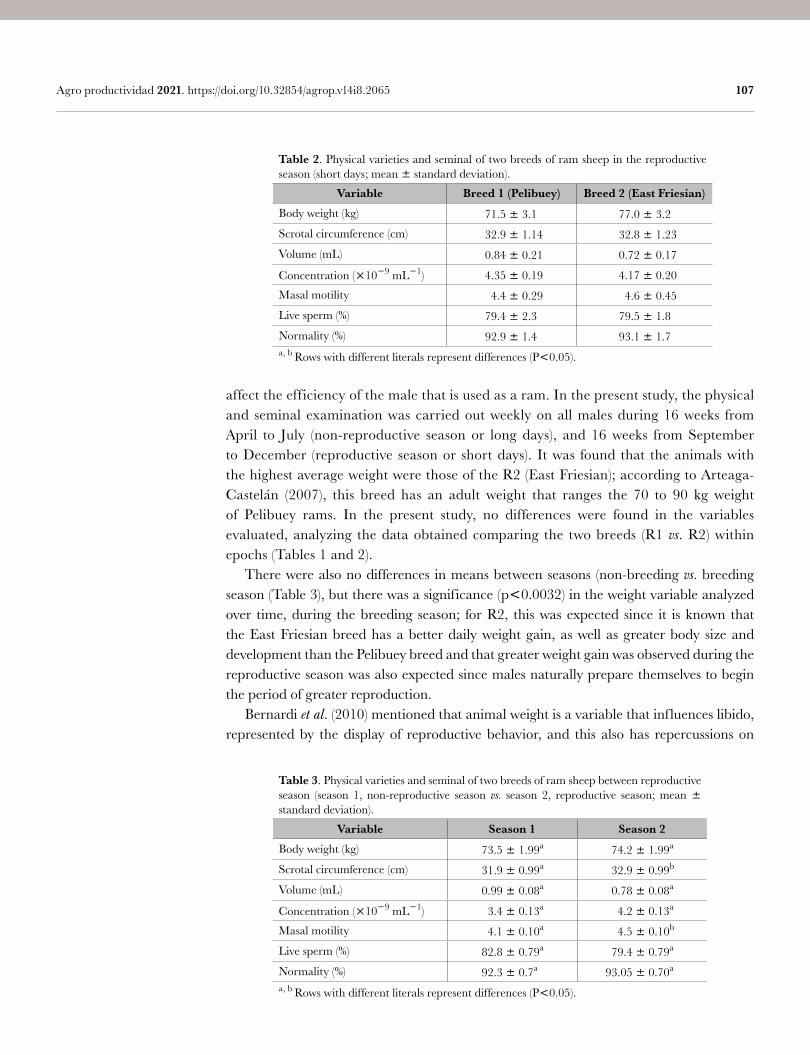
107 Agro productividad 2021. https://doi.org/10.32854/agrop.v14i8.2065
affect the efficiency of the male that is used as a ram. In the present study, the physical and seminal examination was carried out weekly on all males during 16 weeks from April to July (non-reproductive season or long days), and 16 weeks from September to December (reproductive season or short days). It was found that the animals with the highest average weight were those of the R2 (East Friesian); according to Arteaga-Castelán (2007), this breed has an adult weight that ranges the 70 to 90 kg weight of Pelibuey rams. In the present study, no differences were found in the variables evaluated, analyzing the data obtained comparing the two breeds (R1 vs. R2) within epochs (Tables 1 and 2). There were also no differences in means between seasons (non-breeding vs. breeding season (Table 3), but there was a significance (p0.0032) in the weight variable analyzed over time, during the breeding season; for R2, this was expected since it is known that the East Friesian breed has a better daily weight gain, as well as greater body size and development than the Pelibuey breed and that greater weight gain was observed during the reproductive season was also expected since males naturally prepare themselves to begin the period of greater reproduction. Bernardi et al. (2010) mentioned that animal weight is a variable that influences libido, represented by the display of reproductive behavior, and this also has repercussions on
Table 2. Physical varieties and seminal of two breeds of ram sheep in the reproductive season (short days; mean standard deviation).
Variable Breed 1 (Pelibuey) Breed 2 (East Friesian)
Body weight (kg) 71.5 3.1 77.0 3.2
Scrotal circumference (cm) 32.9 1.14 32.8 1.23
Volume (mL) 0.84 0.21 0.72 0.17
Concentration (109 mL1) 4.35 0.19 4.17 0.20
Masal motility 4.4 0.29 4.6 0.45
Live sperm (%) 79.4 2.3 79.5 1.8
Normality (%) 92.9 1.4 93.1 1.7a, b Rows with different literals represent differences (P0.05).
Table 3. Physical varieties and seminal of two breeds of ram sheep between reproductive season (season 1, non-reproductive season vs. season 2, reproductive season; mean standard deviation).
Variable Season 1 Season 2
Body weight (kg) 73.5 1.99a 74.2 1.99a
Scrotal circumference (cm) 31.9 0.99a 32.9 0.99b
Volume (mL) 0.99 0.08a 0.78 0.08a
Concentration (109 mL1) 3.4 0.13a 4.2 0.13a
Masal motility 4.1 0.10a 4.5 0.10b
Live sperm (%) 82.8 0.79a 79.4 0.79a
Normality (%) 92.3 0.7a 93.05 0.70a
a, b Rows with different literals represent differences (P0.05).
108 Agro productividad 2021. https://doi.org/10.32854/agrop.v14i8.2065
the various physical and seminal variables that comprise a field examination. The oscillations in body weight influence the scrotal circumference diameter, as well as the sperm concentration (SC), presenting, in some studies (Avellaneda et al., 2006; Palacios-Moreno, 2012) significant correlations between these variables. In the present study, statistical differences were found in some variables when analyzing the data between seasons (non-breeding vs. breeding season). For example, in scrotal circumference, there is a significance (p0.0001) in the reproductive period. In this regard, Espitia-Pacheco et al. (2018) mentioned that in males the increase in scrotal circumference is determined as a function of the relationship between age and body weight, since testicular development is closely correlated with body growth and the age of the animal. In the present study, two breeds were used, one of medium size (Pelibuey) and one of large size (East Friesian), which is possibly the reason why the differences were observed. Benítez (2011) also confirmed the importance of scrotal circumference as a variable that must be correlated with body weight, sperm concentration and ejaculate volume. In this regard, sperm concentration in the present study for R1 (Pelibuey) during the non-breeding season was 3.31.53109 mL1 and during the reproductive season was 4.350.20109 mL1, an increase during the reproductive season, coinciding with the reported (4.0510.729 mL1) by Maza-Gamboa et al. (2015) for Pelibuey rams. While, for the East Friesian breed, in the present study, a mean of 3.61.50109 mL1 and in the reproductive season of 4.170.20109 mL1 being higher than that reported by Delgado-Cásares (2013) who obtained an average of 2.0109 mL1, in wool breeds. It is important to mention that most rams of the different sheep breeds produce semen throughout the year; however, there is a decrease in semen production and sexual activity during the spring months (non-reproductive season, northern latitude). It is also mentioned that the efficiency with which spermatogenesis is carried out is evaluated with various physical and andrological variables such as body weight and scrotal circumference, which are related to the variables that characterize semen. In the present study, it was found that the variable mass motility (p0.0001) is higher in the reproductive season compared to the non-reproductive season. According to Hafez and Hafez (2004), a very good sperm concentration ranges from 3.5109 to 6.0109 mL1 during the reproductive season. In this study the sperm concentrations, both in the non-reproductive and reproductive seasons, are within the aforementioned ranges; that is, the males used in this study had very good sperm concentrations throughout the year, possibly due to the management provided in the laboratory, good supervision in feeding and sanitation.
CONCLUSION It is concluded that under the environmental and management conditions, where the seminal evaluation was carried out in this study, no differences were found between breeds, suggesting that the Pelibuey and East Friesian breeds, located at 19° north latitude, do not present a decrease in seminal parameters during the non-breeding season compared to the breeding season, which suggests that these two breeds of ram sheep are capable of reproducing, under these conditions, all year round.
109 Agro productividad 2021. https://doi.org/10.32854/agrop.v14i8.2065
REFERENCESAguirre, V., Orihuela, A., Vázquez, R. (2004). Comportamiento de algunas variables usadas como un
procedimiento para estimar la capacidad sexual (fertilidad) del carnero. Investigación Agropecuaria, 1(1), 81-85.
Alonso-Aguerrebere, J.I. (1981). Manejo de la reproducción en el ovino. Ciencia Veterinaria, 3(13), 434-463. Arellano Lezama, T. (2015). La nutrición y su efecto en las células testiculares del carnero. Tesis doctoral,
Colegio de Postgraduados. México.Arroyo-Ledezma, J., Gallegos-Sánchez, J., Villa-Godoy, A., Berruecos, J.M., Perera, J., Valencia J. (2007).
Reproductive activity of Pelibuey and Suffolk ewes at 19º north latitude. Animal Reproduction. Science, 102, 24-30.
Arteaga-Castelán, J.D. (2007). Razas ovinas en México, Asociación Mexicana de Criadores de Ovinos. Disponible en: https://uno.org.mx/razas_ovinas/catalogo_razas.pdf
Avellaneda, Y., Rodríguez, F., Grajales, H., Martínez, R. & Vásquez, R. (2006). Determinación de la pubertad en corderos en el trópico alto colombiano por características corporales, calidad del eyaculado y valoración de testosterona. Livestock Research for Rural Development, 18(10). Disponible en: http://www.lrrd.cipav.org.co/lrrd18/10/avel18138.htm
Benítez, D.M. (2011). Circunferencia escrotal y parámetros de calidad seminal en caprinos de las razas Bóer, Anglo nubian y Criollos de la Provincia de Formosa. Tesis, Universidad Nacional de Nordeste. Facultad de Ciencias Veterinarias. Argentina.
Bernardi, S., Brogliani, G., Oyarzabal, M.I. (2010). Estructura testicular y calidad seminal en ratones seleccionados por peso. International Journal of Morphology, 28(3), 673-680. Doi: 10.4067/S0717-95022010000300004
Blache, D., Chagas, L.M., Blackberry, M.A., Vercoe, P.E., Martin, G.B. (2000). Metabolic factors affecting the reproductive axis in male sheep. Journal of Reproduction and Fertility, 120(1), 1-11. Doi: :10.1530/reprod/120.1.1
Delgado-Cásares, B.E. 2013. Evaluación espermática de semen de ovino tratado por la técnica de gradiente de densidad. Disponible en: http://repositorio.urp.edu.pe/handle/urp/589.
Espitia-Pacheco, A., Montes-Vergara, D., Lara-Fuenmayor, D. (2018). Evaluation of testicular development and morphometrics measurements in Colombian hair sheep. Agronomía Mesoamericana, 29(1),165-175.
García, E. (2004). Modificaciones al Sistema de clasificación climática de Köppen. Instituto de Geografía, Universidad Nacional Autónoma de México.
Hafez, E.S.E., Hafez, B. (2004). Reproducción e inseminación artificial en animales. México: McGraw-Hill Inteamericana.
Malpaux, B., Viguié, C., Skinner, D.C., Thiéry, J.C., Chimineau, P. (1997). Control of the circannual rhythm of reproduction by melatonin in the ewe. Brain Research Bulletin, 44,(4). 431-438. Doi: 10.1016/s0361-9230(97)00223-2
Martin, G.B., Blache, D., Miller, D.W., Vercoe, P.E. (2010). Interactions between nutrition and reproduction in the management of the mature male ruminant. Animal, 4(7): 214-226. Doi: 10.1017/S1751731109991674
Maza-Gamboa, J., Navarrete-Sierra, L.F., Aguilar- Loría, A., Zamora- Bustillos, R., Magaña-Sevilla, H. (2015). Calidad seminal en ovinos Pelibuey con inclusión de Hibiscus rosasinensis en la dieta. Nova Scientia, 7(15), 33-48. Doi: 10.21640/ns.v7i15.252
Mellisho, E. (2010). Manual de laboratorio de reproducción animal. Disponible en: http://tarwi.lamolina.edu.pe/~emellisho/reproduccionarchivos/practica%204-eval-semen.pdf
Orihuela-Trujillo, A. (2014). La conducta sexual del carnero: Revisión. Revista Mexicana de Ciencias Pecuarias, 5(1), 49-89. Doi: 10.22319/rmcp.v5i1.3217
Palacios-Moreno, N., González-Mendoza, D.F. (2012). Correlación entre diámetro testicular y calidad espermática en ovinos criollos del Municipio de Soracá, Boyacá. Conexión Agropecuaria JDL, 2(2): 45-55.
SAGARPA. (1999). NORMA Oficial Mexicana NOM-062-ZOO-1999, Especificaciones técnicas para la producción, cuidado y uso de los animales de laboratorio. Disponible en: https://www.fmvz.unam.mx/fmvz/principal/archivos/062ZOO.PDF
Sánchez-Rodríguez, M. (2010) Curso: Producción y bienestar animal, pequeños rumiantes. Córdoba. Universidad de Córdoba. Asociación Iberoamericana de Zootecnia.
SAS. 2011. JMP. Statistic Visual. Version 9.2. institute inc, campus Drive. Cary. NC. 27517.

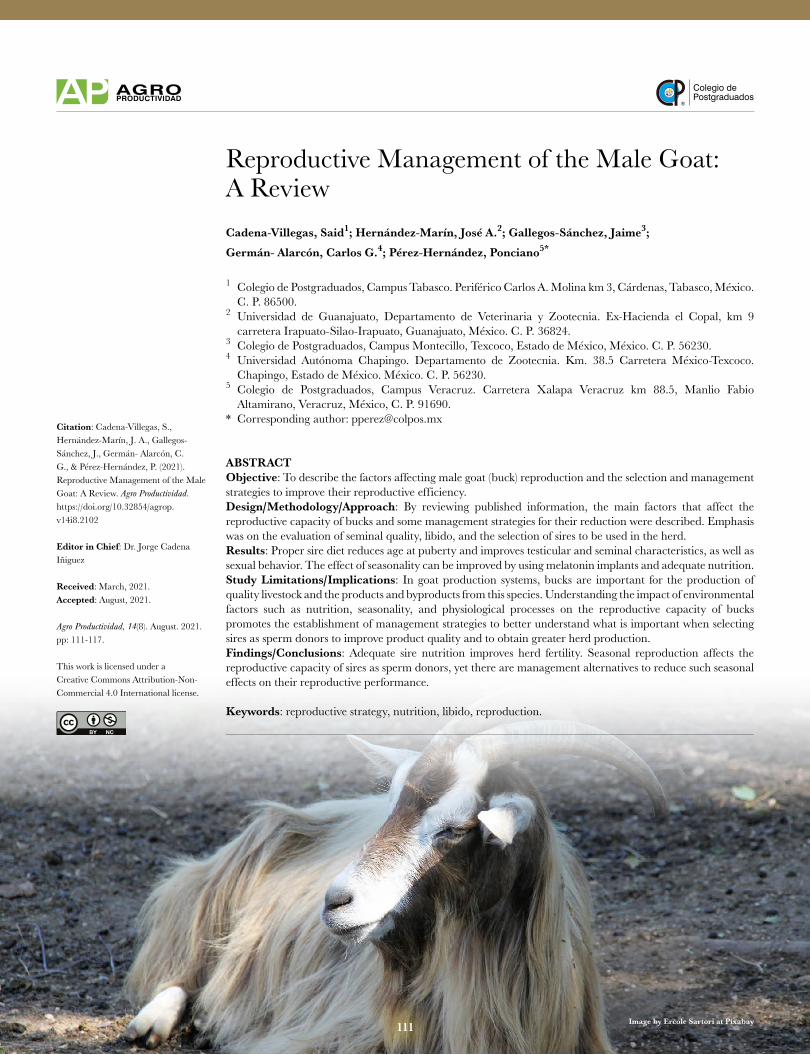
Colegio dePostgraduados
111 Image by Ercole Sartori at Pixabay
Reproductive Management of the Male Goat: A ReviewCadena-Villegas, Said1; Hernández-Marín, José A.2; Gallegos-Sánchez, Jaime3;
Germán- Alarcón, Carlos G.4; Pérez-Hernández, Ponciano5*
1 Colegio de Postgraduados, Campus Tabasco. Periférico Carlos A. Molina km 3, Cárdenas, Tabasco, México. C. P. 86500.
2 Universidad de Guanajuato, Departamento de Veterinaria y Zootecnia. Ex-Hacienda el Copal, km 9 carretera Irapuato-Silao-Irapuato, Guanajuato, México. C. P. 36824.
3 Colegio de Postgraduados, Campus Montecillo, Texcoco, Estado de México, México. C. P. 56230.4 Universidad Autónoma Chapingo. Departamento de Zootecnia. Km. 38.5 Carretera México-Texcoco.
Chapingo, Estado de México. México. C. P. 56230. 5 Colegio de Postgraduados, Campus Veracruz. Carretera Xalapa Veracruz km 88.5, Manlio Fabio
Altamirano, Veracruz, México, C. P. 91690.* Corresponding author: [email protected]
ABSTRACTObjective: To describe the factors affecting male goat (buck) reproduction and the selection and management strategies to improve their reproductive efficiency.Design/Methodology/Approach: By reviewing published information, the main factors that affect the reproductive capacity of bucks and some management strategies for their reduction were described. Emphasis was on the evaluation of seminal quality, libido, and the selection of sires to be used in the herd.Results: Proper sire diet reduces age at puberty and improves testicular and seminal characteristics, as well as sexual behavior. The effect of seasonality can be improved by using melatonin implants and adequate nutrition.Study Limitations/Implications: In goat production systems, bucks are important for the production of quality livestock and the products and byproducts from this species. Understanding the impact of environmental factors such as nutrition, seasonality, and physiological processes on the reproductive capacity of bucks promotes the establishment of management strategies to better understand what is important when selecting sires as sperm donors to improve product quality and to obtain greater herd production.Findings/Conclusions: Adequate sire nutrition improves herd fertility. Seasonal reproduction affects the reproductive capacity of sires as sperm donors, yet there are management alternatives to reduce such seasonal effects on their reproductive performance.
Keywords: reproductive strategy, nutrition, libido, reproduction.
Citation: Cadena-Villegas, S., Hernández-Marín, J. A., Gallegos-Sánchez, J., Germán- Alarcón, C. G., & Pérez-Hernández, P. (2021). Reproductive Management of the Male Goat: A Review. Agro Productividad. https://doi.org/10.32854/agrop.v14i8.2102
Editor in Chief: Dr. Jorge Cadena Iñiguez
Received: March, 2021.Accepted: August, 2021.
Agro Productividad, 14(8). August. 2021. pp: 111-117.
This work is licensed under a Creative Commons Attribution-Non-Commercial 4.0 International license.
111
112 Agro productividad 2021. https://doi.org/10.32854/agrop.v14i8.2102
INTRODUCTION Goat production represents a viable income alternative in places where there is a shortage of feed for other animal species and provides producers in these areas with a production alternative, especially in the form of kids (Escareño et al., 2011). In turn, there is a strong influence of environmental factors on production, where the reproductive season, fluctuations in feeding and environmental conditions determine the reproductive capacity of herds (Dubeuf, 2011). In these production systems, the buck plays an important role in obtaining good productive and reproductive efficiency (Ridler et al., 2012). Reproductive management of the male is the set of systems, practices and manipulations aimed at improving the efficiency of goat male reproductive performance (Luo et al., 2019), since there are several factors throughout the year that affect semen production; among these, some are related to nutrition, with changes in day length (photoperiod), or to the ratio of number of females per male, among others. Variations in nutritional conditions increase or decrease testicular size, which is highly related to daily sperm production (Smith et al., 2018). This is further accentuated by the extensive management of the animals, so that bucks subsist throughout the year exclusively on native vegetation, which affects semen quality due to the fluctuation of nutrients and photochemicals in forage (Delgadillo et al., 2021). In goats, reproductive activity is seasonal, as it is influenced by the photoperiod (daylight hours), which determines annual variations in libido, seminal quality and testicular size in goats. Testicular size is related to sperm production, and can be estimated by scrotal circumference (SC; Maroto-Morales et al., 2016). Stimulation with light or melatonin implants induce an increase in plasma testosterone concentrations during seasonal anestrus (long days), which induces reproductive activity in male goats (Zarazaga et al., 2010).The proportion of females that the male will mount during the mating season and the number of females per male are related to the age and nutritional status of the sire, the time of year, terrain and feed availability (Ridler et al., 2012). Therefore, the objective of this literature review is to describe buck selection and management strategies to improve the reproductive and productive efficiency of the goat herd.
AGE AT PUBERTY Puberty is the condition in which animals begin the reproductive period. The maturity of the reproductive apparatus and the onset of sexual activity are dependent on body development, therefore, good nutrition is essential. Other important factors affecting age at puberty are breed and time of birth (Sarma et al., 2019). Under normal conditions, males reach puberty at between 4 and 6 months of age and with 60% of their adult weight. Once males have reached puberty, they can be used for breeding, although in seasonal breeds it is common to wait until the following breeding season, when they are between 17 and 19 months of age (Ridler et al., 2012).
SIRE SELECTION, SEMINAL QUALITY AND LIBIDO It is important to understand the factors that affect the reproductive activity of sires, since the reproductive efficiency of the herd depends to a great extent on them. Higher
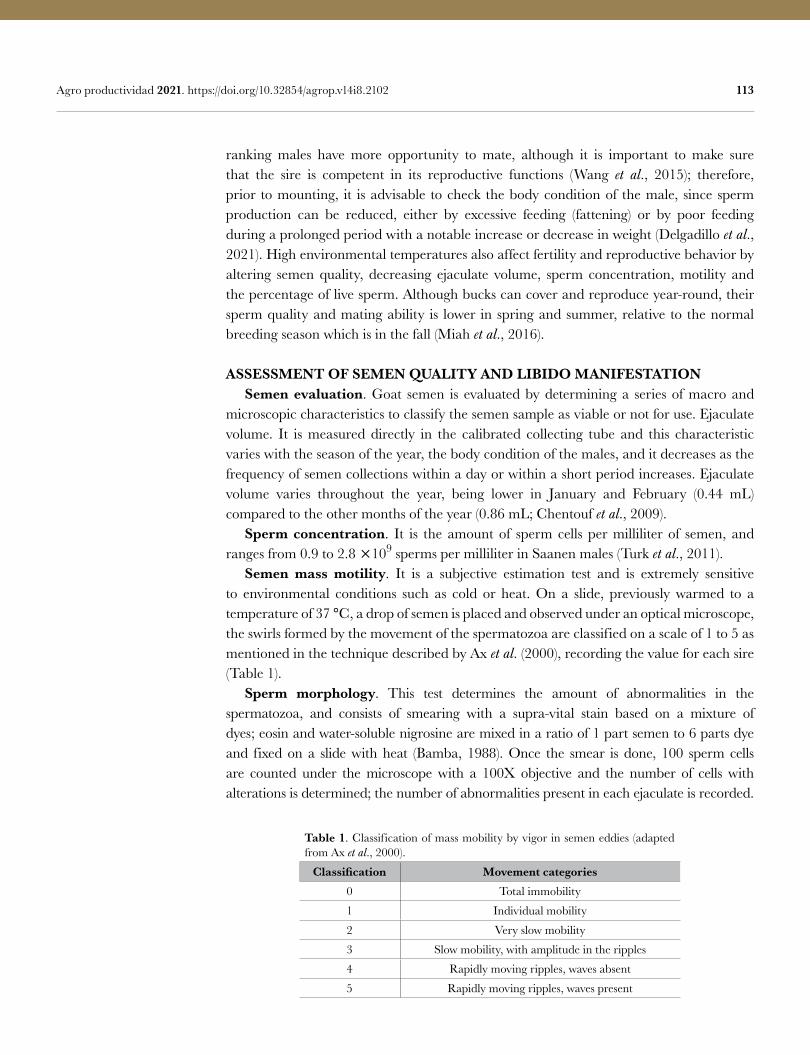
113 Agro productividad 2021. https://doi.org/10.32854/agrop.v14i8.2102
ranking males have more opportunity to mate, although it is important to make sure that the sire is competent in its reproductive functions (Wang et al., 2015); therefore, prior to mounting, it is advisable to check the body condition of the male, since sperm production can be reduced, either by excessive feeding (fattening) or by poor feeding during a prolonged period with a notable increase or decrease in weight (Delgadillo et al., 2021). High environmental temperatures also affect fertility and reproductive behavior by altering semen quality, decreasing ejaculate volume, sperm concentration, motility and the percentage of live sperm. Although bucks can cover and reproduce year-round, their sperm quality and mating ability is lower in spring and summer, relative to the normal breeding season which is in the fall (Miah et al., 2016).
ASSESSMENT OF SEMEN QUALITY AND LIBIDO MANIFESTATION Semen evaluation. Goat semen is evaluated by determining a series of macro and microscopic characteristics to classify the semen sample as viable or not for use. Ejaculate volume. It is measured directly in the calibrated collecting tube and this characteristic varies with the season of the year, the body condition of the males, and it decreases as the frequency of semen collections within a day or within a short period increases. Ejaculate volume varies throughout the year, being lower in January and February (0.44 mL) compared to the other months of the year (0.86 mL; Chentouf et al., 2009). Sperm concentration. It is the amount of sperm cells per milliliter of semen, and ranges from 0.9 to 2.8 109 sperms per milliliter in Saanen males (Turk et al., 2011). Semen mass motility. It is a subjective estimation test and is extremely sensitive to environmental conditions such as cold or heat. On a slide, previously warmed to a temperature of 37 °C, a drop of semen is placed and observed under an optical microscope, the swirls formed by the movement of the spermatozoa are classified on a scale of 1 to 5 as mentioned in the technique described by Ax et al. (2000), recording the value for each sire (Table 1). Sperm morphology. This test determines the amount of abnormalities in the spermatozoa, and consists of smearing with a supra-vital stain based on a mixture of dyes; eosin and water-soluble nigrosine are mixed in a ratio of 1 part semen to 6 parts dye and fixed on a slide with heat (Bamba, 1988). Once the smear is done, 100 sperm cells are counted under the microscope with a 100X objective and the number of cells with alterations is determined; the number of abnormalities present in each ejaculate is recorded.
Table 1. Classification of mass mobility by vigor in semen eddies (adapted from Ax et al., 2000).
Classification Movement categories0 Total immobility
1 Individual mobility
2 Very slow mobility
3 Slow mobility, with amplitude in the ripples
4 Rapidly moving ripples, waves absent
5 Rapidly moving ripples, waves present
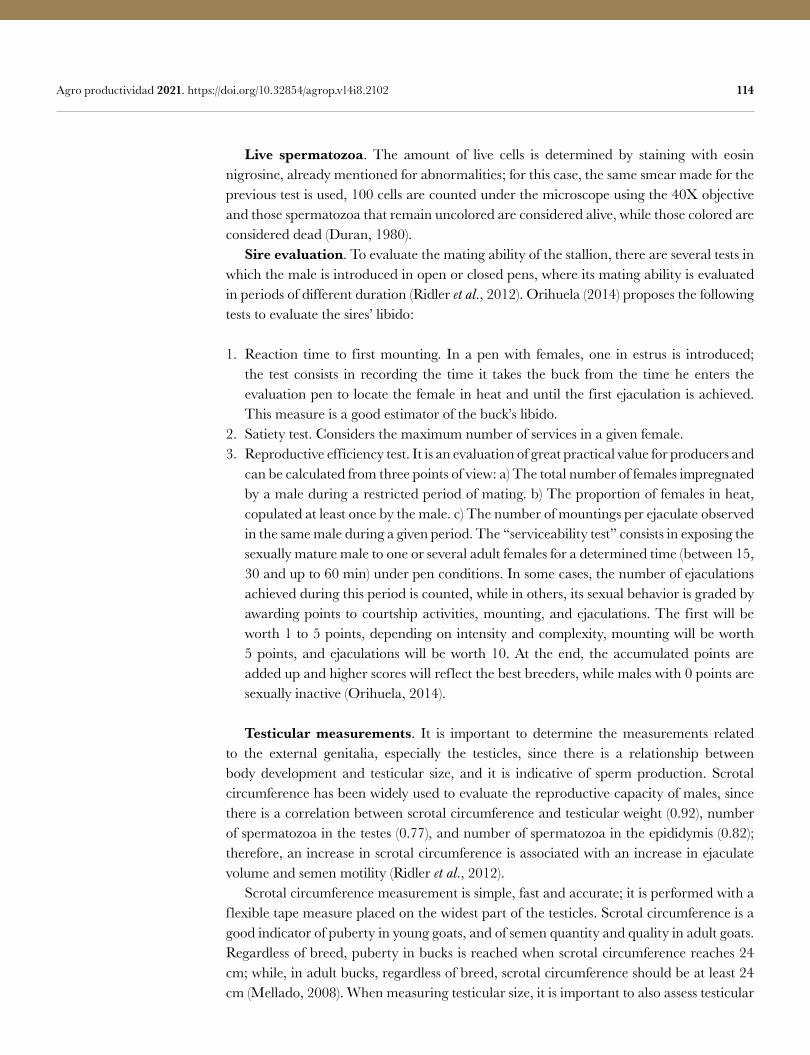
114 Agro productividad 2021. https://doi.org/10.32854/agrop.v14i8.2102
Live spermatozoa. The amount of live cells is determined by staining with eosin nigrosine, already mentioned for abnormalities; for this case, the same smear made for the previous test is used, 100 cells are counted under the microscope using the 40X objective and those spermatozoa that remain uncolored are considered alive, while those colored are considered dead (Duran, 1980). Sire evaluation. To evaluate the mating ability of the stallion, there are several tests in which the male is introduced in open or closed pens, where its mating ability is evaluated in periods of different duration (Ridler et al., 2012). Orihuela (2014) proposes the following tests to evaluate the sires’ libido:
1. Reaction time to first mounting. In a pen with females, one in estrus is introduced; the test consists in recording the time it takes the buck from the time he enters the evaluation pen to locate the female in heat and until the first ejaculation is achieved. This measure is a good estimator of the buck’s libido.
2. Satiety test. Considers the maximum number of services in a given female. 3. Reproductive efficiency test. It is an evaluation of great practical value for producers and
can be calculated from three points of view: a) The total number of females impregnated by a male during a restricted period of mating. b) The proportion of females in heat, copulated at least once by the male. c) The number of mountings per ejaculate observed in the same male during a given period. The “serviceability test” consists in exposing the sexually mature male to one or several adult females for a determined time (between 15, 30 and up to 60 min) under pen conditions. In some cases, the number of ejaculations achieved during this period is counted, while in others, its sexual behavior is graded by awarding points to courtship activities, mounting, and ejaculations. The first will be worth 1 to 5 points, depending on intensity and complexity, mounting will be worth 5 points, and ejaculations will be worth 10. At the end, the accumulated points are added up and higher scores will reflect the best breeders, while males with 0 points are sexually inactive (Orihuela, 2014).
Testicular measurements. It is important to determine the measurements related to the external genitalia, especially the testicles, since there is a relationship between body development and testicular size, and it is indicative of sperm production. Scrotal circumference has been widely used to evaluate the reproductive capacity of males, since there is a correlation between scrotal circumference and testicular weight (0.92), number of spermatozoa in the testes (0.77), and number of spermatozoa in the epididymis (0.82); therefore, an increase in scrotal circumference is associated with an increase in ejaculate volume and semen motility (Ridler et al., 2012). Scrotal circumference measurement is simple, fast and accurate; it is performed with a flexible tape measure placed on the widest part of the testicles. Scrotal circumference is a good indicator of puberty in young goats, and of semen quantity and quality in adult goats. Regardless of breed, puberty in bucks is reached when scrotal circumference reaches 24 cm; while, in adult bucks, regardless of breed, scrotal circumference should be at least 24 cm (Mellado, 2008). When measuring testicular size, it is important to also assess testicular
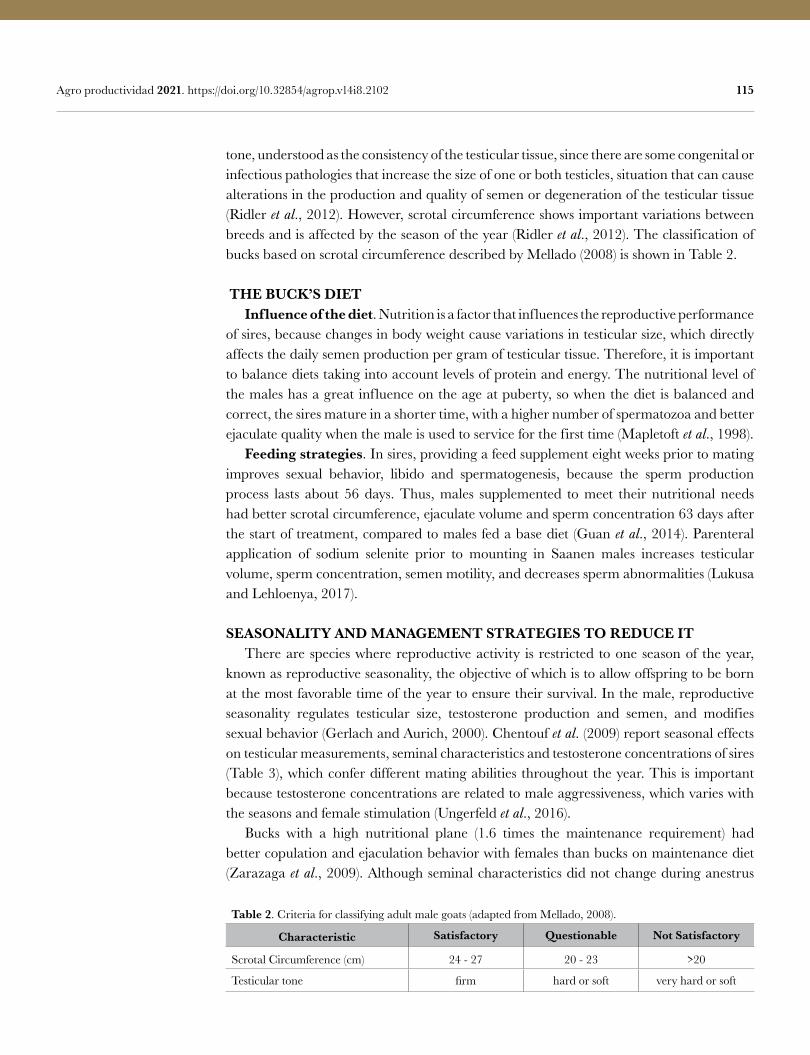
115 Agro productividad 2021. https://doi.org/10.32854/agrop.v14i8.2102
tone, understood as the consistency of the testicular tissue, since there are some congenital or infectious pathologies that increase the size of one or both testicles, situation that can cause alterations in the production and quality of semen or degeneration of the testicular tissue (Ridler et al., 2012). However, scrotal circumference shows important variations between breeds and is affected by the season of the year (Ridler et al., 2012). The classification of bucks based on scrotal circumference described by Mellado (2008) is shown in Table 2.
THE BUCK’S DIET Influence of the diet. Nutrition is a factor that influences the reproductive performance of sires, because changes in body weight cause variations in testicular size, which directly affects the daily semen production per gram of testicular tissue. Therefore, it is important to balance diets taking into account levels of protein and energy. The nutritional level of the males has a great influence on the age at puberty, so when the diet is balanced and correct, the sires mature in a shorter time, with a higher number of spermatozoa and better ejaculate quality when the male is used to service for the first time (Mapletoft et al., 1998). Feeding strategies. In sires, providing a feed supplement eight weeks prior to mating improves sexual behavior, libido and spermatogenesis, because the sperm production process lasts about 56 days. Thus, males supplemented to meet their nutritional needs had better scrotal circumference, ejaculate volume and sperm concentration 63 days after the start of treatment, compared to males fed a base diet (Guan et al., 2014). Parenteral application of sodium selenite prior to mounting in Saanen males increases testicular volume, sperm concentration, semen motility, and decreases sperm abnormalities (Lukusa and Lehloenya, 2017).
SEASONALITY AND MANAGEMENT STRATEGIES TO REDUCE IT There are species where reproductive activity is restricted to one season of the year, known as reproductive seasonality, the objective of which is to allow offspring to be born at the most favorable time of the year to ensure their survival. In the male, reproductive seasonality regulates testicular size, testosterone production and semen, and modifies sexual behavior (Gerlach and Aurich, 2000). Chentouf et al. (2009) report seasonal effects on testicular measurements, seminal characteristics and testosterone concentrations of sires (Table 3), which confer different mating abilities throughout the year. This is important because testosterone concentrations are related to male aggressiveness, which varies with the seasons and female stimulation (Ungerfeld et al., 2016). Bucks with a high nutritional plane (1.6 times the maintenance requirement) had better copulation and ejaculation behavior with females than bucks on maintenance diet (Zarazaga et al., 2009). Although seminal characteristics did not change during anestrus
Table 2. Criteria for classifying adult male goats (adapted from Mellado, 2008).
Characteristic Satisfactory Questionable Not Satisfactory
Scrotal Circumference (cm) 24 - 27 20 - 23 >20
Testicular tone firm hard or soft very hard or soft
116 Agro productividad 2021. https://doi.org/10.32854/agrop.v14i8.2102
due to the effect of nutrition, the improvement in mounting behavior is important to stimulate the reactivation of females in their reproductive activity. Another way to activate the buck is through implants containing 18 mg of melatonin, since this increases testosterone levels and improves seminal characteristics (Zarzaga et al., 2010).
CONCLUSIONS It is important to evaluate bucks prior to mating to verify their reproductive capacity through assessment of libido and seminal characteristics that allow gestation of the assigned females. Providing the male with a feed supplement 63 days before mating improves scrotal circumference, ejaculate volume and sperm concentration, which allows for greater fertility in the herd. The time of the year affects the reproductive activity of the sire; however, there are management alternatives to reduce it.
REFERENCESAx, R.L., Dally, M.R., Didion, B.A., Lenz, R.W., Love, C.C., Varner, D.D., Hafez, B., Bellin, M.E. (2000).
Semen evaluation. In E.S.E. Hafez, and B. Hafez (Eds.), Reproduction in farm animals (pp. 363-375). Lippincott Williams & Wilkins.
Bamba, K. (1988). Evaluation of acrososmal integrity of boar spermatozoa by bright field microscopy using an eosin-nigrosine stain. Theriogenology, 29(6), 1245-1251. Doi:10.1016/0093-691X(88)90004-0
Chentouf, M., Arrebola, F.M., Bister, J.L., Abbadi, N. (2009). Evaluación mensual de los parámetros testiculares y espermáticos de los machos cabríos del norte de Marruecos. En Memorias del XXXIV Congreso Nacional de Ovinotecnia y Caprinotecnia (pp. 368-371). Sociedad Española de Ovinotecnia y Caprinotecnia.
Delgadillo, J.A., Sifuentes, P.I., Flores, M.J., Espinoza-Flores, L.A., Andrade-Esparza, J.D., Hernández, H., Keller, M., & Chemineau, P. (2021). Nutritional supplementation improves the sexual response of bucks exposed to long days in semi-extensive management and their ability to stimulate reproduction in goats. Animal, 15, (2), 1-9. Doi: 10.1016/j.animal.2020.100114
Dubeuf, J.P. (2011). The social and environmental challenges faced by goat and small livestock local activities: Present contribution of research-development and stakes for the future. Small Ruminant Research, 98(1-3), 3-8. Doi: 10.1016/j.smallrumres.2011.03.008
Duran, C.A. (1980). Anatomía, fisiología de la reproducción e inseminación artificial en ovinos. Editorial Hemisferio Sur.Escareño, S.L.M., Wurzinger, M., Pastor, L.F., Salinas, H., Sölkner, J., Iñiguez, L. (2011). La cabra y los
sistemas de producción caprina de los pequeños productores de la Comarca Lagunera, en el norte de México. Rev. Chapingo Ser. Cienc. For. Ambiente, 17, 235-246. Doi: 10.5154/r.rchscfa.2010.10.087
Gerlach, T., Aurich, J.E. (2000). Regulation of seasonal reproductive activity in the stallion, ram and hamster. Review. An. Rep. Sci., 58, 197-213.Doi: 10.1016/S0378-4320(99)00093-7
Guan, Y.I., Malecki, A., Hawken, P.A.R., Linden, M.D., & Martin, G.B. (2014). Under-nutrition reduces spermatogenic efficiency and sperm velocity and increases sperm DNA damage in sexually mature male sheep. Anim. Reprod. Sci., 149, 163-172. Doi:10.1016/j.anireprosci.2014.07.014
Table 3. Seasonal variation of sperm parameters and gonadal measurements in local male goats from northern Morocco (adapted from Chentouf et al., 2009).
Autumn Winter Spring Summer PScrotal circumference (cm) 24.0c 24.3c 26.3b 27.7a 0.001
Testicular diameter (cm) 5.0b 4.6c 5.3b 5.6a 0.001
Testicular length (cm) 8.8a 7.7b 8.1b 9.0a 0.001
Volume (mL) 0.85a 0.44b 0.82a 0.92 a 0.001
Concentration (109 mL1) 2.79b 1.89c 3.61a 3.43ab 0.001
Plasma testosterone (ng mL1) 9.2a 2.0b 3.8b 14.22a 0.001
117 Agro productividad 2021. https://doi.org/10.32854/agrop.v14i8.2102
Lukusa, K., & Lehloenya, K.C. (2017). Selenium supplementation improves testicular characteristics and semen quality of Saanen buck. Small Rum. Res.,151, 52–58.Doi: 10.1016/j.smallrumres.2017.04.016
Luo, J., Wang, W., Sun, S. (2019). Research advances in reproduction for dairy goats. Asian-Australas J. Anim. Sci., 32(8), 1284-1295. Doi: 10.5713/ajas.19.0486
Mapletoft, R.J., Kastelic, J.P., & Coulter, G.C. (1998). Manejo y selección de toros de carne. Oeste Ganadero, 1(3), 10-13.
Maroto-Morales, A., García-Álvarez, O., Ramón, M., Martínez-Pastor, F., Fernández-Santos, M.R., Soler, A.J., Garde, J.J. (2016). Current status and potential of morphometric sperm analysis. Asian J. Androl., 18, 863-870.
Mellado, M. (2008). Técnicas para el manejo reproductivo de las cabras en agostadero. Trop. Subtrop. Agroecosyst., 9, (1), 47-63.
Miah, G., Das, A., Bilkis, T., Momin, M.M., Uddin, M.A., Mohammad, M.A.A., Mahmud, S., & Miazi, O.F. (2016). Comparative study on productive and reproductive traits of black Bengal and jamnapari goats under semi-intensive condition. Sci. Res. J., 4(2), 1-6.
Orihuela, T.A. (2014). La conducta sexual del carnero. Revisión. Rev. Mex. Cienc. Pecu., 5(1), 49-89. Doi: 10.22319/rmcp.v5i1.3217
Ridler, A.L., Smith, S.L., & West, D.M. (2012). Ram and buck management. Anim. Reprod. Sci., 130, 180-183.Doi: 10.1016/j.anireprosci.2012.01.012
Sarma, L., Nahardeka, N., Goswami, R.N., Aziz, A., Zaman, G., Das, A., & Akhtar, F. (2019). Non-genetic factors affecting pre-weaning growth and morphometric traits in Assam Hill goat. Vet. World, 12,(8), 1327-1331.Doi: 10.14202/vetworld.2019.1327-1331
Smith, M.F., Geisert, R.D., Parrish, J.J. (2018). Reproduction in domestic ruminants during the past 50 year: discovery to application. J. Anim. Sci., 96,(7), 2952-2970. Doi: 10.1093/jas/sky139
Turk, G., Gur, S., Kandemir, F.M., & M. Sönmez, M. (2011). Relationship between seminal plasma arginase activity and semen quality in Saanen bucks. Small Rum. Res., 97, 83-87. Doi: 10.1016/j.smallrumres.2011.01.015
Ungerfeld, R., Freitas de Melo, A., Giriboni, J., Lacuesta, L., Toledano-Díaz, A., & Santiago-Moreno, J. (2016). Influence of seasonality and stimulus of estrus does in buck’s aggressiveness. Behavioural Processes, 133, 1-5. doi:10.1016/j.beproc.2016.10.008.
Wang, W., Luo, J., Sun S., Xi, S.L., Gao, Q., Haile, A.B., Shi, H., Zhang, W., & Shi, H. (2015). The effect of season on spermatozoa motility, plasma membrane and acrosome integrity in fresh and frozen-thawed semen from Xinong Saanen bucks. Reprod. Domest. Anim., 50,(1), 23-28. Doi: 10.1111/rda.12444
Zarazaga, L.A., Guzmán, J.L., Domínguez, C., Pérez, M.C., & Prieto, R. (2009). Effects of season and feeding level on reproductive activity and semen quality in payoya buck goat. Theriogenology, 71, (8), 1316-1325. Doi: 10.1016/j.theriogenology.2009.01.007
Zarazaga, L.M., Gatica, M.C., Celi, I., Guzmán, J.L., & Malpaux, B. (2010). Effect of artificial long days and / or melatonin treatment on the sexual activity of Mediterranean bucks. Small Rum. Res., 93, 110-118. Doi: 10.1016/j.smallrumres.2010.05.008

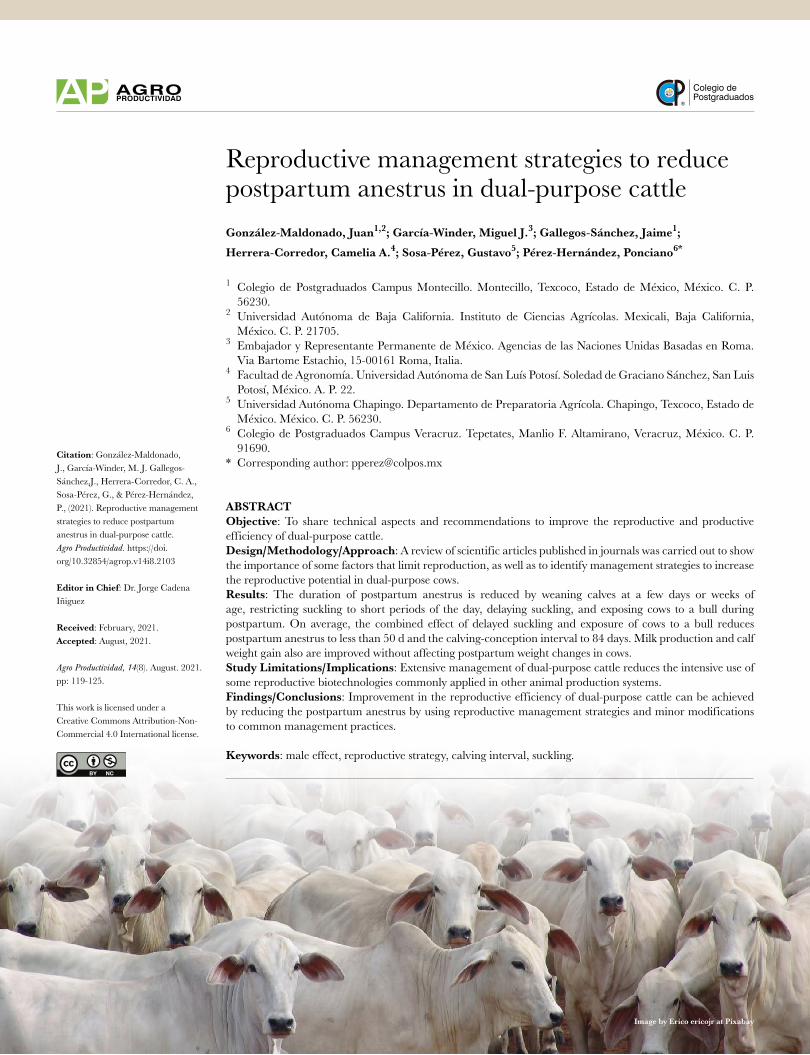
Colegio dePostgraduados
119
Reproductive management strategies to reduce postpartum anestrus in dual-purpose cattleGonzález-Maldonado, Juan1,2; García-Winder, Miguel J.3; Gallegos-Sánchez, Jaime1;
Herrera-Corredor, Camelia A.4; Sosa-Pérez, Gustavo5; Pérez-Hernández, Ponciano6*
1 Colegio de Postgraduados Campus Montecillo. Montecillo, Texcoco, Estado de México, México. C. P. 56230.
2 Universidad Autónoma de Baja California. Instituto de Ciencias Agrícolas. Mexicali, Baja California, México. C. P. 21705.
3 Embajador y Representante Permanente de México. Agencias de las Naciones Unidas Basadas en Roma. Via Bartome Estachio, 15-00161 Roma, Italia.
4 Facultad de Agronomía. Universidad Autónoma de San Luís Potosí. Soledad de Graciano Sánchez, San Luis Potosí, México. A. P. 22.
5 Universidad Autónoma Chapingo. Departamento de Preparatoria Agrícola. Chapingo, Texcoco, Estado de México. México. C. P. 56230.
6 Colegio de Postgraduados Campus Veracruz. Tepetates, Manlio F. Altamirano, Veracruz, México. C. P. 91690.
* Corresponding author: [email protected]
ABSTRACTObjective: To share technical aspects and recommendations to improve the reproductive and productive efficiency of dual-purpose cattle.Design/Methodology/Approach: A review of scientific articles published in journals was carried out to show the importance of some factors that limit reproduction, as well as to identify management strategies to increase the reproductive potential in dual-purpose cows.Results: The duration of postpartum anestrus is reduced by weaning calves at a few days or weeks of age, restricting suckling to short periods of the day, delaying suckling, and exposing cows to a bull during postpartum. On average, the combined effect of delayed suckling and exposure of cows to a bull reduces postpartum anestrus to less than 50 d and the calving-conception interval to 84 days. Milk production and calf weight gain also are improved without affecting postpartum weight changes in cows.Study Limitations/Implications: Extensive management of dual-purpose cattle reduces the intensive use of some reproductive biotechnologies commonly applied in other animal production systems.Findings/Conclusions: Improvement in the reproductive efficiency of dual-purpose cattle can be achieved by reducing the postpartum anestrus by using reproductive management strategies and minor modifications to common management practices.
Keywords: male effect, reproductive strategy, calving interval, suckling.
Image by Erico ericojr at Pixabay
Citation: González-Maldonado, J., García-Winder, M. J. Gallegos-Sánchez,J., Herrera-Corredor, C. A., Sosa-Pérez, G., & Pérez-Hernández, P., (2021). Reproductive management strategies to reduce postpartum anestrus in dual-purpose cattle.Agro Productividad. https://doi.org/10.32854/agrop.v14i8.2103
Editor in Chief: Dr. Jorge Cadena Iñiguez
Received: February, 2021.Accepted: August, 2021.
Agro Productividad, 14(8). August. 2021. pp: 119-125.
This work is licensed under a Creative Commons Attribution-Non-Commercial 4.0 International license.
120 Agro productividad 2021. https://doi.org/10.32854/agrop.v14i8.2103
INTRODUCTION Producers in the dual-purpose cattle production system use mainly Bos indicus animals, B. taurusB. indicus crosses, and a minority of B. taurus (González-Padilla et al., 2019); they base cattle feeding on monoculture pastures with grasses, where their availability and quality vary throughout the year (Ku-Vera et al., 2014). Normally, cow milking is done manually with calf support (Pérez-Hernández et al., 2001); reproduction is carried out by “natural mounting” and minimal use of reproductive technologies (Lassala et al., 2020). The objective of these production systems is to produce meat and milk, however, their reproductive efficiency and levels of production are low (Rojo-Rubio et al., 2009), with an age at puberty greater than 30 months, age at first calving of 426 months (Vite-Cristobal et al., 2007), calving intervals of up to 650 days (Abeygunawardena and Dematawewa, 2004; Arce-Recinos et al., 2017), and a calving rate between 40 and 50% (Lassala et al., 2020). Pre-weaning weight gain of the calves fluctuates between 200 and 700 g d1 depending on the type of suckling used, reaching weights of 9317 kg at 4 months and ranging between 120 and 156 kg at weaning, commonly performed at 8 months of age (Rojo-Rubio et al., 2009).This low weight gain of calves in these production systems is in part due to the way they are managed during lactation, since it is normal that cows in this production system are milked completely, leaving only “residual” milk for the calves’ consumption, or else milking three out of four mammary glands, leaving the fourth (1/4) for the calves’ consumption. In addition, it is customary to leave the calves confined in a pen in the afternoon and at night, without adequate access to forage, water or a feed supplement (Pérez-Hernández et al., 2001). Therefore, it is important to make known the different options that exist to improve the reproductive efficiency of dual-purpose cattle, mainly in relation to age at puberty, duration of postpartum anestrus, calving-conception interval and calving interval, and fof the development of calves. The objective of this review is to present technical aspects, management strategies and recommendations reported in the ligerature to improve the reproductive and productive efficiency of dual-purpose cattle.
POSTPARTUM ANESTRUS AND SUCKLING Postpartum anestrus. It is characterized by the absence of ovulation in the female, because after calving there is a partial reestablishment of ovarian function, with follicle development, but none reach the ovulatory phase, at least during the first weeks (Pérez-Hernández et al., 2006; Baéz and Grajales, 2009). This is caused in part by a temporary shortage of luteinizing hormone (LH), which is responsible for inducing ovulation. In addition, it is common for the first ovulation not to be preceded by external signs of estrus and for the corpus luteum formed to have a short half-life, small size and reduced steroidogenic activity (Montiel and Ahuja, 2005; Baéz and Grajales, 2009). In addition to suckling, nutritional imbalances, dystocia at calving and health problems tend to increase the duration of postpartum anestrus (Short et al., 1990). However, it has been shown that suckling and nutrition are the main factors that prolong anestrus in dual-purpose cows (Montiel and Ahuja, 2005; Baéz and Grajales, 2009), so regulating
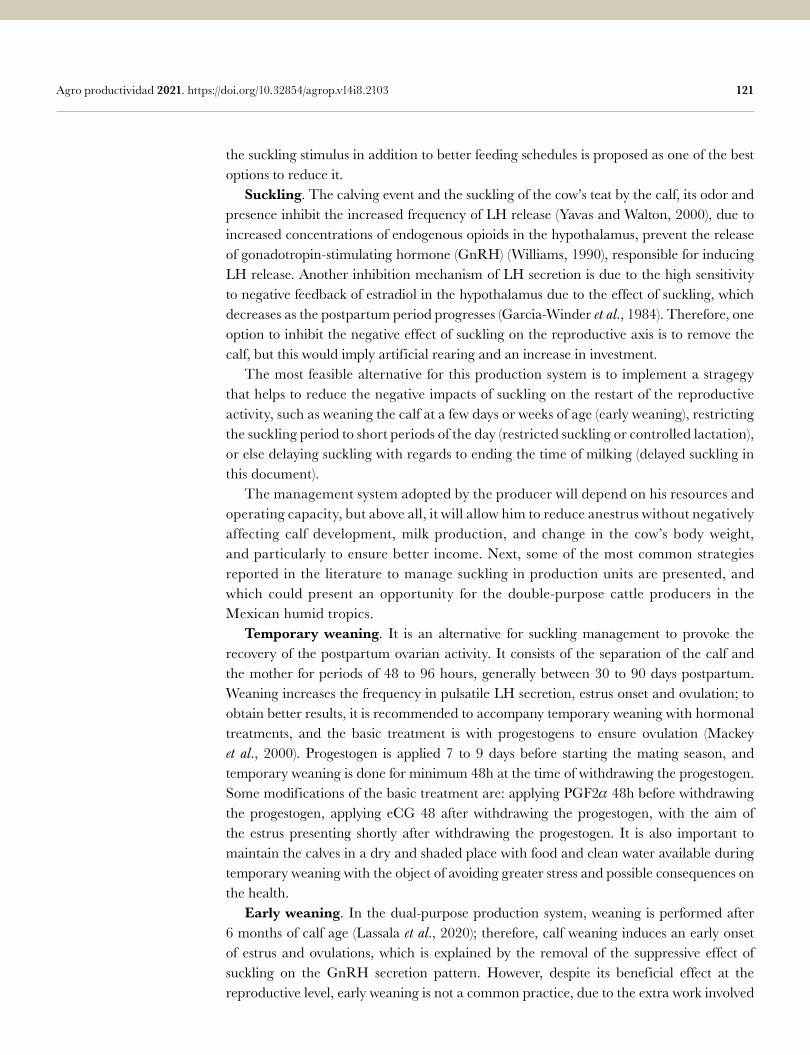
121 Agro productividad 2021. https://doi.org/10.32854/agrop.v14i8.2103
the suckling stimulus in addition to better feeding schedules is proposed as one of the best options to reduce it. Suckling. The calving event and the suckling of the cow’s teat by the calf, its odor and presence inhibit the increased frequency of LH release (Yavas and Walton, 2000), due to increased concentrations of endogenous opioids in the hypothalamus, prevent the release of gonadotropin-stimulating hormone (GnRH) (Williams, 1990), responsible for inducing LH release. Another inhibition mechanism of LH secretion is due to the high sensitivity to negative feedback of estradiol in the hypothalamus due to the effect of suckling, which decreases as the postpartum period progresses (Garcia-Winder et al., 1984). Therefore, one option to inhibit the negative effect of suckling on the reproductive axis is to remove the calf, but this would imply artificial rearing and an increase in investment. The most feasible alternative for this production system is to implement a stragegy that helps to reduce the negative impacts of suckling on the restart of the reproductive activity, such as weaning the calf at a few days or weeks of age (early weaning), restricting the suckling period to short periods of the day (restricted suckling or controlled lactation), or else delaying suckling with regards to ending the time of milking (delayed suckling in this document). The management system adopted by the producer will depend on his resources and operating capacity, but above all, it will allow him to reduce anestrus without negatively affecting calf development, milk production, and change in the cow’s body weight, and particularly to ensure better income. Next, some of the most common strategies reported in the literature to manage suckling in production units are presented, and which could present an opportunity for the double-purpose cattle producers in the Mexican humid tropics. Temporary weaning. It is an alternative for suckling management to provoke the recovery of the postpartum ovarian activity. It consists of the separation of the calf and the mother for periods of 48 to 96 hours, generally between 30 to 90 days postpartum. Weaning increases the frequency in pulsatile LH secretion, estrus onset and ovulation; to obtain better results, it is recommended to accompany temporary weaning with hormonal treatments, and the basic treatment is with progestogens to ensure ovulation (Mackey et al., 2000). Progestogen is applied 7 to 9 days before starting the mating season, and temporary weaning is done for minimum 48h at the time of withdrawing the progestogen. Some modifications of the basic treatment are: applying PGF2 48h before withdrawing the progestogen, applying eCG 48 after withdrawing the progestogen, with the aim of the estrus presenting shortly after withdrawing the progestogen. It is also important to maintain the calves in a dry and shaded place with food and clean water available during temporary weaning with the object of avoiding greater stress and possible consequences on the health. Early weaning. In the dual-purpose production system, weaning is performed after 6 months of calf age (Lassala et al., 2020); therefore, calf weaning induces an early onset of estrus and ovulations, which is explained by the removal of the suppressive effect of suckling on the GnRH secretion pattern. However, despite its beneficial effect at the reproductive level, early weaning is not a common practice, due to the extra work involved
122 Agro productividad 2021. https://doi.org/10.32854/agrop.v14i8.2103
(Lassala et al., 2020) and the decrease in lactation length, especially in cows with more zebu characteristics (Pérez-Hernández et al., 2001). Restricted suckling. This consists of limiting contact between calf and mother for periods of 20 to 120 minutes per day during seven days before mating season, which increases the incidence of estrus and ovulations, and can be started at 45 days postpartum (Mondragón et al., 2016) and up to 13 points in the percentage of gestation (Rodríguez and Segura, 1995), without affecting calf weight gains as long as they are provided with concentrated feed, good quality forage and clean water during the restriction period (Pérez-Hernández et al., 2001). In order to obtain an adequate response, it is important to have a good nutritional status of the mother (Montiel and Ahuja, 2005). The basic treatment to stimulate the restoration of reproductive activity consists in applying a progestogen at 7 to 9 days before beginning the mating season, and transrectal palping can be combined at the time of starting the restricted suckling, with the aim of identifying the females that are cycling (presence of corpus luteum) and those that are not cycling and grouping them (females cycling vs. females not cycling); PGF2 is applied with the object of lysing the corpus luteum present and suckling during the day must be allowed. Delayed suckling. It consists of milking cows thoroughly in the morning, using the calf as a support for milk let-down and allowing suckling the calf 8 hours after milking. After milking, cows are subjected to the tratidional management of the production unit far from the calves, which remain in a pen isolated from the cows, preferably with access to small pastures and water. At 8 hours after milking, cows and calves are brought together for 30 to 60 minutes so that calves consume all the milk synthesized in the 8 h between milking and suckling (Pérez-Hernández et al., 2002a). This management simulates two milking events, with the difference that the morning milk is for the producer and the afternoon milk is for the calf. It is recommended to start this management one week after calving, so that the calf consumes abundant amounts of colostrum, strengthening the calf ’s bond with its mother and decreasing the incidence of diseases (Pérez-Hernández et al., 2001). The implementation of this management reduces the interval between calving and first ovulation approximately 20 days and achieves for 100% of the cows to present ovulation before 100 days postpartum (Pérez-Hernández et al., 2002a;b; Izaguirre-Flores et al., 2007). Additionally, this management system increases the amount of milk milked (7.0 vs. 5.2 kg d1) and total milk production, obtained by adding the milked milk and the milk consumed by the calf, compared to cows with restricted suckling (11.3 vs. 9.2 kg d1); this allows calf weight gains of 751.159.9 g d1 when fed milk and pasture, and 82734.8 g d1 when calves are fed, in addition to maternal milk and pasture, free access concentrate feed as a supplement, as suggested in controlled lactation or restricted suckling.
EXPOSURE OF COWS TO THE BULL Exposure of dual-purpose cows to the bull from 7 days after calving allows cows managed with delayed suckling to present their first ovulation before 50 days postpartum (Pérez-Hernández et al., 2002b; Izaguirre-Flores et al., 2007) and for the calving-conception interval to be 8410.19 days, which meets the ideal objective of producing
123 Agro productividad 2021. https://doi.org/10.32854/agrop.v14i8.2103
one calf per cow per year without affecting calf development, milk production and body weight changes of postpartum cows (Izaguirre-Flores et al., 2007).
RECOMMENDATIONS FOR REPRODUCTIVE MANAGEMENT OF DUAL PURPOSE COWS It is recommended that the cows and the bull to be in optimal conditions at the time of mating to increase the probability of obtaining a pregnancy and achieving a calving interval of 13 to 14 months. To achieve this, it is important that in cows after calving: 1) To see that fetal membranes are expelled, preferably within the first 6 hours after calving, otherwise attention and treatments should be given for the membranes to be expelled; at a 12-hour interval, it is recommended to apply soft uterine massage and light traction of the externalized part of the placenta, being careful not to pull forcibly. 2) To make sure that the cow is in good health and not presenting high temperature after calfing, since this could be the sign of an infection, and in case of elevated body temperature, to apply antinflammatory, antipyretic and also administer antibiotic. When giving antibiotic, it should be taken into account that the milk that is produced during the period of use of these compounds cannot be used for human consumption and should be kept separate from the rest of the milk to be sold. 3) To monitor uterine involution to reduce infection, at least once a week within the first three weeks after calving, and thereafter at two-week intervals until complete regression of the uterus. Palpations can be performed by ranch personnel, since this is an activity that, through training, can be performed by any trained person. 4) To get cows to resume ovarian activity before 60 days postpartum, for which it is suggested to use some of the methods described above, primarily through suckling management. 5) Starting on day 40 postpartum, it is recommended to conduct palpations to determine if ovulation has taken place, which will manifest by the existence of a corpus luteum. 6) If a bull is used to stimulate reproduction in cows during postpartum, to ensure that the bull to be used is an animal in good health and reproductive state, and that it has good libido and mounting ability, it is important that the bull be selected due to its productive characteristic, given its genetic importance; it is recommended to check the fertility of the bull 30 to 60 days before mating. If the bull were not apt for reproduction or presented physical problems, it would have to be replaced by another male. 8) If a bull were used for reproduction by natural mounting, it is important to maintain a proportion of 1 bull for a maximum of 25 cows. In production units where more than one sire is available and two or more bulls are added to the group of cows at the same time, it is recommended that they be familiar with each other to avoid fights. 9) It is recommended to monitor cows daily to know if they have been “serviced” by the bull, and if possible it is suggested to use markers on the sire’s chest or patches placed on the cow’s rump that change color from pressure and which allow to determine if a cow has been in contack with the male. 10) In cows that it has been determined that they have been serviced, palpation for pregnancy diagnosis should be programmed 30 to 45 days after mounting, to determine if they are pregnant or not. If they are pregnant, then they should be managed according to gestation. 11) All those cows that do not show signs of having been mounted by the bull or which have not been detected in heat should be palpated to determine their reproductive status. If they
124 Agro productividad 2021. https://doi.org/10.32854/agrop.v14i8.2103
have restarted their sexual activity it is recommended to observe them carefully and carry out a heat synchronization program to increase the possibility of identifying their estrus and programming their insemination or mount. If they have not restarted their cycle it is recommended to use a treatment to induce estrus. It is important to pay attention to the percentage of gestation generated by each bull, for if it is very low, the status of the bull would have to be checked and if it does not fulfill expectations to substitute it. 12) The cows diagnosed as gestating in the first palpation should be subject to a second palpation during the next 30 days, to make sure that they are in fact pregnant. If a cow is not detected as gestating in the second palpation it should be returned to the group of “empty” cows for their management and to offer them a new opportunity to get pregnant. For production units that use or would like to use artificial insemination, it is highly advisable to establish estrus or heat synchronization programs, for which there are several options. One of these options is using two injections of prostaglandins F2, with an interval of 12 to 14 days between each application, followed by observing estrus and insemination. It is important to remember that prostaglandins are only effectiveif there is a corpus luteum present, so it is recommended if possible to conduct palpation on the cows to be sure that they are cycling. A second option to synchronize estrus is the use of “intravaginal devices” that release progesterone or synthetic progestogens, which are placed in the cow for 7 to 9 days. The esturs would present on average at 48 to 72 hours after withdrawing the progestogens. The devices provoke an artificial luteal phase and allow the development of a dominant ovulatory follicle. An advantage of these treatments is that in cows with anestrus they can induce ovulation and the restart of estrus cycles, and their efficacy is not affected by the presence or not of a corpus luteum. There are a great variety of protocols for estrus synchronization, but the selection and application of each one of them depends on the physiological conditions of the cow and the management of the ranch, so the decision of which protocol to use is the responsibility of the specialized reproductive technician.
CONCLUSION The production units of dual-purpose cattle have a great opportunity to improve the reproductive efficiency of their livestock through the implementation of integral management practices that include feeding, suckling and exposure of cows to the bull to reduce postpartum anestrus; as well as the use of estrus synchronization to ease the use of artificial insemination.
REFERENCESAbeygunawardena, H. Dematawewa, C.M. (2004). Pre-pubertal and postpartum anestrus in tropical Zebu
cattle. Animal Reproduction Science, 82-83, 373-387. Doi: 10.1016/j.anireprosci.2004.05.006Arce-Recinos, A., Aranda-Ibáñez, E.M., Osorio-Arce, M.E., González-Garduño, R., Díaz-Rivera, P., Hinojosa-
Cuellar, J.A. (2017). Productive and reproductive parameters in dual-purpose Zebu Holstein cattle in Tabasco, Mexico. Revista Mexicana en Ciencias Pecuarias, 8, 83-91. Doi: 10.22319/rmcp.v8i1.4347
Báez, S.G., Grajales, L.H. (2009). Anestro posparto en ganado bovino en el trópico. Revisión de Literatura. Rev. MVZ Córdoba, 14(3), 1867-1875.
125 Agro productividad 2021. https://doi.org/10.32854/agrop.v14i8.2103
García-Winder, M., Imakawa, Day, D.L., Zalesky, D.D., Nielsen, M.K., Kinder, J.E. (1984). Effect of suckling and ovariectomy on the control of luteinizing hormone secretion during the postpartum period in beef cows. Biology of Reproduction, 31, 771-778.
González-Padilla, E., Lassala, A., Padernera, M., Gutiérrez, C.G. (2019.) Cow-calf management practices in México: Farm organization and infrastructure. Veterinaria México OA, 6(3), 1-17.
Izaguirre-Flores, F., Martínez-Tinajero, J.J., Sánchez-Orozco, L., Ramón–Castro, M.A., Pérez-Hernández, P., Martínez-Priego, G. (2007). Influencia del amamantamiento y presencia del toro en el comportamiento productivo y reproductivo de vacas pardo suizo en el trópico. Revista Científica, FCV-LUZ, 17(6), 614-620.
Ku-Vera, J.C., Briceño, E.G., Ruiz, A., Mayo, R., Ayala, A.J., Aguilar, C.F., Solorio, F.J., Ramírez, L. (2014). Manipulación del metabolismo energético de los rumiantes en los trópicos: opciones para mejorar la producción y la calidad de la carne y leche. Revista Cubana de Ciencia Agrícola, 48, 43-53.
Lassala, A., Hernández-Cerón, J., Pedernera, M., González-Padilla, E., Gutiérrez, C.G. (2020). Cow-calf management practices in México: Reproduction and breeding. Veterinaria México OA, 7(1). Doi: 10.22201/fmvz.24486760e.2020.1.839
Mackey, D.R., Sreenan, J.M., Roche. J.F., Diskin. M.G. (2000). The effect of progesterone alone or in combination with estradiol on follicular dynamics, gonadotropin profiles, and estrus in beef cows following calf isolation and restricted suckling. Journal of Animal Science, 78, 1917-1929. Doi: 10.2527/2000.7871917x
Mondragón, V., Galina, C.S., Rubio, I., Corro, M., Salmerón, F. (2016). Effect of restricted suckling on the onset of follicular dynamics and body condition score in Brahman cattle raised under tropical conditions. Animal Reproduction Science, 167, 89-95. Doi: 10.1016/j.anireprosci.2016.02.011
Montiel, F., & Ahuja, C. (2005). Body condition and suckling as factors influencing the duration of postpartum anestrus in cattle: a review. Animal Reproduction Science, 85, 1-26.
Pérez-Hernández, P., Sánchez del Real, C., Gallegos-Sánchez, J. (2001). Anestro postparto y alternativas de manejo del amamantamiento en vacas de doble propósito en el trópico. Investigación Agraria. Producción y Sanidad Animales, 16, 235-248.
Pérez-Hernández, P., García-Winder, M., Gallegos-Sánchez, J. (2002a). Postpartum anoestrus is reduced by increasing the within-day milking to suckling interval in dual purpose cows. Animal Reproduction Science, 73, 159-168. Doi: 10.1016/S0378-4320(02)00147-1
Pérez-Hernádez, P., García-Winder, M., Gallegos-Sánchez, J. (2002b). Bull exposure an increased within-day milking to suckling interval reduced postpartum in dual purpose cows. Animal Reproduction Science, 74, 111-119.
Pérez-Hernández, P., Becerril-Pérez, M., Lamothe-Zavaletta, C., Torres-Hernández, G., López Ortiz, S., Gallegos-Sánchez, J. (2006). Efecto del amamantamiento retrasado en la actividad posparto de las vacas y en los becerros de doble propósito. Interciencia, 31(10), 748-752.
Rodriguez, R.O.L., Segura, C.V.M. (1995). Effect of once daily suckling on postpartum reproduction in zebu-cross cows in the tropics. Animal Reproduction Science, 40, 1-5. Doi: 10.1016/0378-4320(95)01417-X
Rojo-Rubio, R., Vázquez-Armijo, J.F., Pérez-Hernández, P., Mendoza-Martínez, G.D., Salem, A.Z.M., Albarrán-Portillo, B., González-Reyna, A., Hernández-Martínez, J., Rebollar-Rebollar, S., Cardoso-Jiménez, D., Dorantes-Coronado, E.J., Gutierrez-Cedillo, J.G. (2009). Dual purpose cattle production in Mexico. Tropical Animal Health and Production, 41, 715-721.
Short, R.E., Bellows, R.A., Staigmiller, R.B., Berardinelli, J.G., Custer, E.E. (1990). Physiological mechanisms controlling anestrus and infertility in postpartum beef cattle. Journal of Animal Science, 68, 799-816. Doi: 10.2527/1990.683799x
Vite-Cristóbal, C., López-Ordaz, R., García-Muñiz, J.G., Ramírez-Valverde, R., Ruíz-Flores, A., López-Ordaz, R. (2007). Producción de leche y comportamiento reproductivo de vacas de doble propósito que consumen forrajes tropicales y concentrados. Veterinaria México, 38(1), 63-79.
Williams, G.L. (1990). Suckling as a regulator of postpartum rebreeding in cattle: a review. Journal of Animal Science, 68, 831-852. Doi: 10.2527/1990.683831x
Yavas, Y., Walton, J.S. (2000). Postpartum acyclicity in suckled beef cows: a review. Theriogenology, 54, 25-55. Doi: 10.1016/s0093-691x(00)00323-x

Colegio dePostgraduados
127
Suckling and by Pass Fat in the Postpartum Reproductive Activity of Hair SheepOsorio-Marín, Yolanda1; Torres-Hernández, Glafiro1; Becerril-Pérez, Carlos Miguel2,
Gallegos-Sánchez, Jaime1*
1 Colegio de Postgraduados Campus Montecillo. Carretera Federal México-Texcoco km 36.5, Montecillo, Texcoco, Estado de México, México. C.P. 56230.
2 Colegio de Postgraduados Campus Veracruz. Carretera Federal Xalapa-Veracruz km 88.5, vía Paso de Ovejas entre Paso San Juan y Puente Jula, Tepetates, Manlio F. Altamirano, Veracruz, México. C.P. 91690.
* Corresponding Author: [email protected]
ABSTRACTObjective: To evaluate the effect of by pass fat and suckling control on postpartum reproductive activity of hair ewes.Design/Methodology/Approach: Eighty-one (81) hair ewes with average weight of 588 kg were used, which on postpartum day 7 were assigned to one of four treatments under a completely randomized design with 22 factorial arrangement. Factor A is the type of suckling [continuous suckling (CS) and suckling control (SC)] and factor B, by pass fat (with or without). In CS, ewes remained with their offspring 24 hours a day (n16). In continuous suckling plus fat (CSF), ewes remained with the offspring all day plus the addition of 8% in dietary fat (n24). In SC, it was 30 min of suckling only twice per day (n14). In suckling control plus fat (SCF), controlled suckling lasted 30 min, twice a day plus 8% fat (n25).Results: The response to the treatments was similar (p0.05) in onset of estrus, return rate, gestation, prolificacy and fertilization; for the lambing rate variable, there were differences (p0.05), the SCF treatment was higher (68%) compared to CS (50%) and CSF (50%), but equal (p0.05) to SC (57.1%).Implications: In this experiment, it was observed that the SCF treatment presented a better response, implying that controlling suckling and providing by pass fat helps to restore ovarian activity sooner after lambing.Conclusions: Suckling control plus inclusion of dietary by pass fat in ovulation induction protocols during early postpartum (around day 25 postpartum) can be included in routine reproductive management of flocks, improving the reproductive efficiency of hair sheep.
Keywords: anestrus, excess fat, lactation, supplementation, lambing rate.
INTRODUCTION Sheep farming is an activity of great economic importance in Mexico, and this can be sustained with the growing demand for meat of this species. In addition, imports evidence the need to produce increasingly more (SIAP, 2019).
Citation: Osorio-Marín, Y., Torres-Hernández, G., Becerril-Pérez, C. M., Gallegos-Sánchez, J. (2021) Suckling and by Pass Fat in the Postpartum Reproductive Activity of Hair Sheep. Agro Productividad. https://doi.org/10.32854/agrop.v14i8.2107
Editor in Chief: Dr. Jorge Cadena Iñiguez
Received: January, 2021.Accepted: August, 2021.
Agro Productividad, 14(8). August. 2021. pp: 127-134.
This work is licensed under a Creative Commons Attribution-Non-Commercial 4.0 International license.
Image by S. Hermann & F. Richter at Pixabay 127
128 Agro productividad 2021. https://doi.org/10.32854/agrop.v14i8.2107
This can be achieved if emphasis is placed, among others, on improving the reproductive parameters of the flocks; that is, if the number of lambs born per ewe at each lambing is increased through various reproductive techniques and adequate knowledge in physiology and endocrinology, since they are essential to improve the reproductive efficiency of the flock (Meikle et al., 2001; Cortez-Romero and Gallegos-Sánchez, 2014). Adequate nutrient supply at appropriate times during gestation ensures successful productive and reproductive efficiency of mothers and offspring during postpartum (Radunz et al., 2011; Abdalla et al., 2012; Mahboub et al., 2013; Vicente-Pérez et al., 2015). Therefore, high energy diets have been used to cover the ewes’ energy requirements. Among the ingredients that have been used, the use of excess fat to cover such energy requirements stands out (Machmüller et al., 2000; Bhatt et al., 2013; Bianchi et al., 2018). It has been observed that by pass fat escapes fermentation and bio-hydrogenation that takes place in the rumen, in addition to improving fiber digestibility (Palmquist and Jenkins, 1980; Behan et al., 2019). Also, it has been shown that suckling control during lactation can decrease or inhibit the negative effects that the negative energy balance and continued suckling often have on follicular development and ovulation after lambing (Fray et al., 1995; Scaramuzzi et al., 1996; Abu Ishmais et al., 2004; Morales-Terán et al., 2004; Pérez-Hernández et al., 2009; Castillo-Maldonado et al., 2013). Therefore, the objective of the present study was to evaluate the effect of suckling control and by pass fat on the restoration of postpartum ovarian activity in hair ewes.
MATERIALS AND METHODS Location of the study area. The study was conducted at the Sheep and Goat Reproduction Laboratory (LaROCa) of Colegio de Postgraduados, located in Montecillo, Texcoco de Mora, Estado de México (19° 29’ LN and 98° 53’ LW) at an altitude of 2250 m. The region has a temperate climate [C(W)], mean annual rainfall of 664 mm and average annual temperature of 15° C (García, 2004). Animals, management and treatments. A total of 81 multiparous hair ewes were used, with lambing at the end of November, and average weight of 588 kg at lambing. Seven days after lambing, ewes were assigned to one of four treatments using a completely randomized design with factorial arrangement, where factor A is type of suckling [continuous suckling (CS) and suckling control (SC)] and factor B is fat use (fat and non-fat). In continuous suckling (CS; n16), mother and lamb remained together for 24 h per day. In continuous suckling fat (CSF; n26), the mother remained in contact with the lamb 24 h per day, and 8% fat was added to the diet. In suckling control (SC; n14), suckling was controlled for 1 h per day, that is, 30 min of suckling twice a day, and the rest of the time the lambs were separated from their mothers. In suckling control fat (SCF; n25), suckling was controlled for 30 min, 2 times per day, and 8% by pass fat was added to the diet; the remaining time, mothers and lambs were separated. The lambs were weaned at 60 days of age. Feeding. The ewes were fed a balanced diet covering the nutritional needs of ewes in the physiological stage of lactation (2.3 Mcal kg1 dry matter of metabolizable energy and
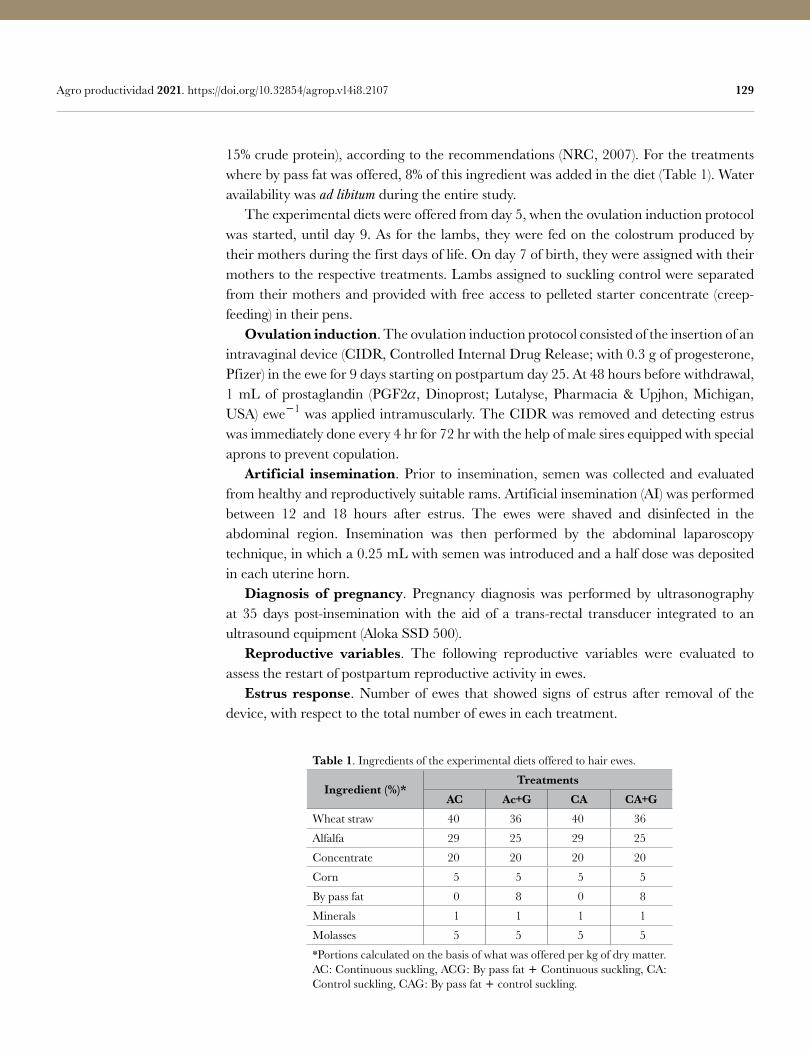
129 Agro productividad 2021. https://doi.org/10.32854/agrop.v14i8.2107
15% crude protein), according to the recommendations (NRC, 2007). For the treatments where by pass fat was offered, 8% of this ingredient was added in the diet (Table 1). Water availability was ad libitum during the entire study. The experimental diets were offered from day 5, when the ovulation induction protocol was started, until day 9. As for the lambs, they were fed on the colostrum produced by their mothers during the first days of life. On day 7 of birth, they were assigned with their mothers to the respective treatments. Lambs assigned to suckling control were separated from their mothers and provided with free access to pelleted starter concentrate (creep-feeding) in their pens. Ovulation induction. The ovulation induction protocol consisted of the insertion of an intravaginal device (CIDR, Controlled Internal Drug Release; with 0.3 g of progesterone, Pfizer) in the ewe for 9 days starting on postpartum day 25. At 48 hours before withdrawal, 1 mL of prostaglandin (PGF2, Dinoprost; Lutalyse, Pharmacia & Upjhon, Michigan, USA) ewe1 was applied intramuscularly. The CIDR was removed and detecting estrus was immediately done every 4 hr for 72 hr with the help of male sires equipped with special aprons to prevent copulation. Artificial insemination. Prior to insemination, semen was collected and evaluated from healthy and reproductively suitable rams. Artificial insemination (AI) was performed between 12 and 18 hours after estrus. The ewes were shaved and disinfected in the abdominal region. Insemination was then performed by the abdominal laparoscopy technique, in which a 0.25 mL with semen was introduced and a half dose was deposited in each uterine horn. Diagnosis of pregnancy. Pregnancy diagnosis was performed by ultrasonography at 35 days post-insemination with the aid of a trans-rectal transducer integrated to an ultrasound equipment (Aloka SSD 500). Reproductive variables. The following reproductive variables were evaluated to assess the restart of postpartum reproductive activity in ewes. Estrus response. Number of ewes that showed signs of estrus after removal of the device, with respect to the total number of ewes in each treatment.
Table 1. Ingredients of the experimental diets offered to hair ewes.
Ingredient (%)*Treatments
AC Ac+G CA CA+GWheat straw 40 36 40 36
Alfalfa 29 25 29 25
Concentrate 20 20 20 20
Corn 5 5 5 5
By pass fat 0 8 0 8
Minerals 1 1 1 1
Molasses 5 5 5 5
*Portions calculated on the basis of what was offered per kg of dry matter. AC: Continuous suckling, ACG: By pass fat Continuous suckling, CA: Control suckling, CAG: By pass fat control suckling.
130 Agro productividad 2021. https://doi.org/10.32854/agrop.v14i8.2107
% EstrusNumber of ewes that showed estrus
100Total number of ewes in each treatment
Onset at estrus. Interval between removal of CIDR and onset of estrus. The distribution was determined by the number of ewes that went into estrus up to 72 hours after removal of the CIDR. Return to estrus. Number of ewes that showed estrus 17 or 34 days post-insemination.
% Return to estrusNumber of ewes that showed estrus 17 or 34 days post-insemination
100Total number of ewes in each treatment
Pregnancy rate. Number of ewes diagnosed as pregnant with respect to the total number of ewes per treatment.
% Pregnancy rateNumber of ewes diagnosed as pregnant
100Total number of ewes in each treatment
Lambing rate. Number of ewes lambed in relation to the total number of ewes per treatment.
% Lambing rateNumber of ewes lambed
100Total number of ewes in each treatment
Fertility. Total number of lambs born in relation to the total number of ewes per treatment.
FertilityNumber of lambs born
Total number of ewes in each treatment
Prolificacy. Number of lambs born in relation to the number of ewes lambed per treatment.
ProlificacyNumber of lambs born
Number of ewes lambed
Statistical analysis. The statistical package Statistical Analysis Systems (SAS, 2012) was used for data analysis, considering significant differences at p0.05. The variables response to estrus, return to estrus, gestation rate and lambing rate were analyzed by logistic regression with PROC LOGISTIC. The variables prolificacy and fertility were analyzed by means of a POISSON distribution using PROC GENMOD. For the variable onset at estrus, the Shapiro and Wilk test (Shapiro and Wilk, 1965) was performed to
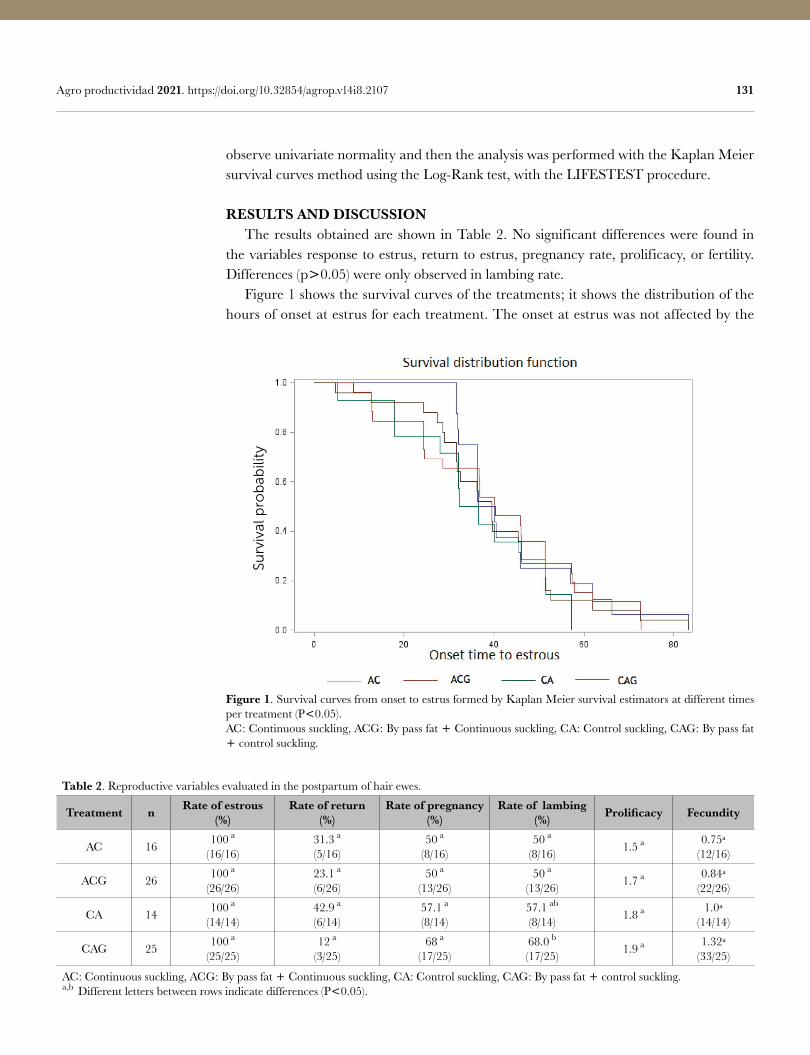
131 Agro productividad 2021. https://doi.org/10.32854/agrop.v14i8.2107
observe univariate normality and then the analysis was performed with the Kaplan Meier survival curves method using the Log-Rank test, with the LIFESTEST procedure.
RESULTS AND DISCUSSION The results obtained are shown in Table 2. No significant differences were found in the variables response to estrus, return to estrus, pregnancy rate, prolificacy, or fertility. Differences (p0.05) were only observed in lambing rate. Figure 1 shows the survival curves of the treatments; it shows the distribution of the hours of onset at estrus for each treatment. The onset at estrus was not affected by the
Table 2. Reproductive variables evaluated in the postpartum of hair ewes.
Treatment n Rate of estrous (%)
Rate of return (%)
Rate of pregnancy (%)
Rate of lambing (%) Prolificacy Fecundity
AC 16 100 a
(16/16)31.3 a
(5/16)50 a
(8/16)50 a
(8/16) 1.5 a 0.75ª(12/16)
ACG 26 100 a
(26/26)23.1 a
(6/26)50 a
(13/26)50 a
(13/26) 1.7 a 0.84ª(22/26)
CA 14 100 a
(14/14)42.9 a
(6/14)57.1 a
(8/14)57.1 ab
(8/14) 1.8 a 1.0ª(14/14)
CAG 25 100 a
(25/25)12 a
(3/25)68 a
(17/25)68.0 b
(17/25) 1.9 a 1.32ª(33/25)
AC: Continuous suckling, ACG: By pass fat Continuous suckling, CA: Control suckling, CAG: By pass fat control suckling.a,b Different letters between rows indicate differences (P0.05).
Figure 1. Survival curves from onset to estrus formed by Kaplan Meier survival estimators at different times per treatment (P0.05).AC: Continuous suckling, ACG: By pass fat Continuous suckling, CA: Control suckling, CAG: By pass fat control suckling.
Surv
ival
pro
bab
ility
132 Agro productividad 2021. https://doi.org/10.32854/agrop.v14i8.2107
addition of by pass fat or suckling control, however, it is shown that ewes belonging to the SC group (suckling control) went into estrus on average at 36.094.19 hours, and the total ewes in that treatment before 60 hours after removal of the device. In the same way, it can be observed that ewes with continuous suckling were the last to come into estrus, after 80 hours. Regarding the variable rate of return to estrus, it was found that the CS treatment had 31.3%, CSF 23.1%, SC 42.9% and SCF 12%, with no significant differences (p0.05). Similarly, the pregnancy rate had no significant differences (p0.05). For the lambing rate variable, the results obtained show differences (p0.05) and it is observed that the SCF treatment was higher (68%), compared to CS (50%) and CSF (50%), but equal (p0.05) to SC (57.1%); while CS and CSF were equal (p0.05). It has been shown that hair ewes respond satisfactorily to the ovulation induction protocols before 60 days postpartum (Morales-Terán et al., 2011). This information is similar to that reported by Castillo-Maldonado et al. (2013) who showed that ewes restart their postpartum reproductive activity around day 35 after lambing. Likewise, in this study, ovulation induction in hair ewes was performed on average on postpartum day 25, with the aim of performing artificial insemination on approximately postpartum day 35. In addition, it was observed that ewes responded to the ovulation induction protocol, as all ewes showed signs of estrus after CIDR withdrawal. It has also been shown that decreasing the contact of the lamb with its mother positively increases the response to ovulation induction protocols; that is, females with suckling control reestablish ovarian activity sooner than females with continuous suckling after lambing (Morales-Terán et al., 2011; Castillo-Maldonado et al., 2013). The lambing rate results found in this experiment agree with authors who reported that continuous suckling causes a lower lambing rate, confirming that the effect of suckling is a factor that directly inf luences the inhibition of postpartum ovarian activity in ewes (Fraire-Cordero et al., 2018), as it is known to inhibit the secretion frequency of GnRH/LH pulses. A possible reason to explain the better response of the SCF treatment may be because of the interaction observed between suckling control and by pass fat, that is, a decrease in suckling frequency (reducing the number of times the lamb sucks the mammary gland) and an increase in available energy that helps to increase the frequency of secretion of gonadotropin (LH and FSH) pulses, although some authors, such as Bayourthe et al. (1993) mentioned that an increase of more than 5% of excess fat in the diet causes negative effects on fiber digestibility, and also a decrease in the population of ruminal microorganisms (Palmquist and Jenkins, 1980). However, in this study, where 8% of fat was used in the diet, no decrease in the reproductive variables studied was observed.
CONCLUSIONS Suckling control plus the inclusion of dietary by pass fat in ovulation induction protocols during early postpartum (around day 25 postpartum) can be included in routine reproductive management of f locks, thus improving the reproductive efficiency of hair ewes.
133 Agro productividad 2021. https://doi.org/10.32854/agrop.v14i8.2107
REFERENCESAbdalla, E.B., Abou-Ammou, F.F., El-Shafie, M.H., El-Bordeny, N.E., Hamida, R.M. (2012). Effect of feeding
levels on the reproductive performance of Barki sheep. Egyptian Journal of Sheep & Goat Sciences, 7(2), 11-15.
Abu Ishmais, M.A., Kridli, R.T., Omer, S.A. (2004). Body Weight Change, Milk Production and Reproductive Parameters in Suckled vs. Non-suckled Awassi Ewes. Asian-Australasian Journal of Animal Sciences, 17(9), 1236-1240. Doi: 10.5713/ajas.2004.1236
Bayourthe, C., Moncoulon, R., Vernay, M. (1993). Effect of protein-protected fat on ruminal and total nutrient digestibility of sheep diets. Journal of Animal Science, 71(4), 1026-1031. Doi: 10.2527/1993.7141026x
Behan, A.A., Loh, T.C., Fakurazi, S., Kaka, U., Kaka, A., Samsudin, A.A. (2019). Effects of Supplementation of Rumen Protected Fats on Rumen Ecology and Digestibility of Nutrients in Sheep. Animals, 9(7), 400. Doi: 10.3390/ani9070400
Bhatt, R.S., Sahoo, A., Shinde, A.K., Karim, S.A. (2013). Change in body condition and carcass characteristics of cull ewes fed diets supplemented with rumen bypass fat. Livestock Science, 157(1), 132-140. Doi: 10.1016/j.livsci.2013.06.025
Bianchi, A.E., Macedo, V.P., Silva, A.S.D., Silveira, A.L.F. da, Hill, J.A.G., Zortéa, T., Rossi, R.M., Batista, R. (2018). Effect of the addition of protected fat from palm oil to the diet of dairy sheep. Revista Brasileira de Zootecnia, 47. Doi: 10.1590/rbz4720160137
Castillo-Maldonado, P.P., Vaquera-Huerta, H., Tarango-Arambula, L.A., Pérez-Hernández, P., Herrera-Corredor, A.C., Gallegos-Sánchez, J. (2013). Restablecimiento de la actividad reproductiva posparto en ovejas de pelo. Archivos de Zootecnia, 62(239), 419-428. Diu: 10.4321/S0004-05922013000300010
Cortez-Romero, C., Gallegos-Sánchez, J. (2014). Biotecnologías reproductivas, moleculares y génicas en ovinos. Biblioteca Básica de Agricultura, Colegio de Postgraduados. pp 277
Fraire-Cordero, S., Salazar-Ortiz, J., Cortez-Romero, C., Pérez-Hernández, P., Herrera-Corredor, C.A., Gallegos-Sánchez, J. (2018). External stimuli help restore post-partum ovarian activity in Pelibuey sheep. South African Journal of Animal Science, 48(2), 337. Doi: 10.4314/sajas.v48i2.14
Fray, M.D., Lamming, G.E., Haresign, W. (1995). Induction of ovulation in the acyclic postpartum ewe following continuous, low-dose subcutaneous infusion of GnRH. Theriogenology, 43(6), 1019-1030. Doi: 10.1016/0093-691X(95)00066-H
García, E. (2004). Modificaciones al sistema de clasifiación Climática de Köppen (Quinta edición). Instituto de Geografía-UNAM.
Machmüller, A., Ossowski, D.A., Kreuzer, M. (2000). Comparative evaluation of the effects of coconut oil, oilseeds and crystalline fat on methane release, digestion and energy balance in lambs. Animal Feed Science and Technology, 85(1), 41-60. Doi: 10.1016/S0377-8401(00)00126-7
Mahboub, H.D.H., Ramadan, S.D.H., Helal, M.A.Y., & Aziz, E.A.K. (2013). Effect of Maternal Feeding in Late Pregnancy on Behaviour and Performance of Egyptian Goat and Sheep and Their Offspring. Global Veterinaria, 11(2), 168-176. Doi: 10.5829/idosi.gv.2013.11.2.74152
Meikle, A., Garófalo, E., Rodríguez-Piñón, M., Tasende, C., Sahlin, L. (2001). Regulation by gonadal steroids of estrogen and progesterone receptors along the reproductive tract in female lambs. Acta Veterinaria Scandinavica, 42(1), 161. Doi: 10.1186/1751-0147-42-161
Morales-Terán, G., Pro-Martínez, A., Figueroa-Sandoval, B., Sánchez-del-Real, C., Gallegos-Sánchez, J. (2004). Amamantamiento continuo o restringido y su relación con la duración del anestro postparto en ovejas Pelibuey. Agrociencia, 38, (2). 165-171.
Morales-Terán, G., Pro-Martínez, A., Salazar-Ortiz, J., Gallegos-Sánchez, J. (2011). Influence of controlled suckling and the male effect on the resumption of postpartum ovarian activity in Pelibuey sheep. Tropical and Subtropical Agroecosystems, 13, (3). 493-500.
NRC. (2007). Nutrient Requirements of Small Ruminants: Sheep, Goats, Cervids, and New World Camelids (p. 11654). National Academies Press. Doi: 10.17226/11654
Palmquist, D. L., Jenkins, T.C. (1980). Fat in Lactation Rations: Review. Journal of Dairy Science, 63(1), 1-14. Doi: 10.3168/jds.S0022-0302(80)82881-5
Pérez-Hernández, P., Hernández-Valdez, V.M., Figueroa-Sandoval, B., Torres-Hernández, G., Díaz-Rivera, P., Gallegos-Sánchez, J. (2009). Efecto del tipo de amamantamiento en la actividad ovárica postparto de ovejas pelibuey y tasas de crecimiento de corderos en los primeros 90 días de edad. Revista Científica de la Facultad de Ciencias Veterinarias, 19(4), 398-402.
Radunz, A.E., Fluharty, F.L., Zerby, H.N., Loerch, S.C. (2011). Winter-feeding systems for gestating sheep I. Effects on pre- and postpartum ewe performance and lamb progeny preweaning performance. Journal of Animal Science, 89(2), 467-477. Doi: 10.2527/jas.2010-3035.
134 Agro productividad 2021. https://doi.org/10.32854/agrop.v14i8.2107
SAS. (2012). SAS/STAT: Userʼs guide statistics released 9.1. (2nd edition). SAS Institute Inc.Scaramuzzi, R., Cognié, Y., Downing, J. (1996). The ovarian secretion of androstenedione and oestradiol
during late pregnancy and the early postpartum period in sheep with an autotransplanted ovary. Reproduction Nutrition Development, 36(5), 531-543. Doi: 10.1051/rnd:19960509
Shapiro, S.S., Wilk, M.B. (1965). An Analysis of Variance Test for Normality (Complete Samples). Biometrika, 52(3/4), 591-611. Doi: 10.1093/biomet/52.3-4.591
SIAP. (2019). Servicio de Información Agroalimentaria y Pesquera. En: Ovino. Población ganadera 2010-2019. Disponible en: https://infosiap.siap.gob.mx/opt fecha de consulta 20 de septiembre de 2020.
Vicente-Pérez, R., Avendaño-Reyes, L., Álvarez, F., Correa-Calderón, A., Meza-Herrera, C., Mellado, M., Quintero, J., Macías-Cruz, U. (2015). Comportamiento productivo, consumo de nutrientes y productividad al parto de ovejas de pelo suplementadas con energía en el preparto durante verano e invierno. Archivos de Medicina Veterinaria, 47(3), 301-309. Doi: 10.4067/S0301-732X2015000300006
Colegio dePostgraduados
135
Functional Social Organization to Obtain the Region of Origin Cotija Cheese Collective BrandOvando-Flores, Huitzilihuitl1; Thomé-Ortiz, Humberto1*; Barragán-López, Esteban2;
Torres-Villa, Rogelia3
1 Universidad Autónoma del Estado de México. Instituto de Ciencias Agropecuarias y Rurales. México. 2 El Colegio de Michoacán, A.C. Centro de Estudios Rurales. México. 3 Unidad Académica de Estudios Regionales de la Coordinación de Humanidades de la UNAM, Jiquilpan,
Michoacán, México.* Corresponding author: [email protected]
ABSTRACTObjective: To identify the functional elements which impact the processes of patrimonial activation to obtain the Region of Origin Cotija Cheese Collective Brand, through collective social action as the basis of territorial development in the Sierra of the states of Jalisco and Michoacán. Design/Methodology/Approach: A qualitative study was conducted, based on the tradition of rural sociology, where the categories of analysis of the Localized Agrifood Systems approach were used. For this purpose, semi-structured interviews with different social actors were applied where there was an inquiry about the technical, organizational, economic and political aspects that have an impact in obtaining seals of quality, destined to the protection and differentiation of emblematic foods.Results: After an attempt to obtain the Denomination of Origin, given the particularities of the Localized Agrifood System involved in the production of Cotija cheese, the decision was to obtain a Collective Brand whose prerequisites adjusted better to the characteristics of their productive systems. Obtaining the seal was an important achievement in terms of the horizon that this signal generated for producers and for the territory. However, this is only the beginning in a process of constant valuation that must be redefined throughout time.Study Limitations/Implications: It is an exploratory study that only addresses the internal dimension of the productive system of Cotija cheese; a deeper analysis ought to broaden the study of the social networks implied in the processes of valuation, including actors outside the territory.Findings/Conclusions: Mexico’s agrifood heritage is a strategic resource that must be protected for cultural, economic, food security and health reasons. This should be assumed as an obligation of the State in co-responsibility with academia, producers and consumers. Obtaining a collective brand is only one step within an unfinished valuation process that must be maintained through collective action and market stimulus.
Keywords: Collective brand, heritage valuation, artisan food, Cotija cheese.
INTRODUCTION Localized Agrifood Systems (LAFS) are productive conglomerates linked to a specific territory that implies a set of activities, where the dynamics that take place are closely
linked to the inhabitants, with their knowhow and lifestyle in a specific spatial scale (Muchnik, 2006).
The evolution and studies that have been developed based on the LAFS methodology have allowed understanding various dynamics around
agrifood products, which are related to the social
interactions generated within and outside the
Citation: Ovando-Flores, H., Thomé-Ortiz, H., Barragán-López, E. &, Torres-Villa, R. (2021). Functional Social Organization to Obtain the Region of Origin Cotija Cheese Collective Brand. Agro Productividad.https://doi.org/10.32854/agrop.v14i8.1958
Editor in Chief: Dr. Jorge Cadena Iñiguez
Received: March, 2021.Accepted: August, 2021.
Agro Productividad, 14(8). August. 2021. pp: 135-142.
This work is licensed under a Creative Commons Attribution-Non-Commercial 4.0 International license.
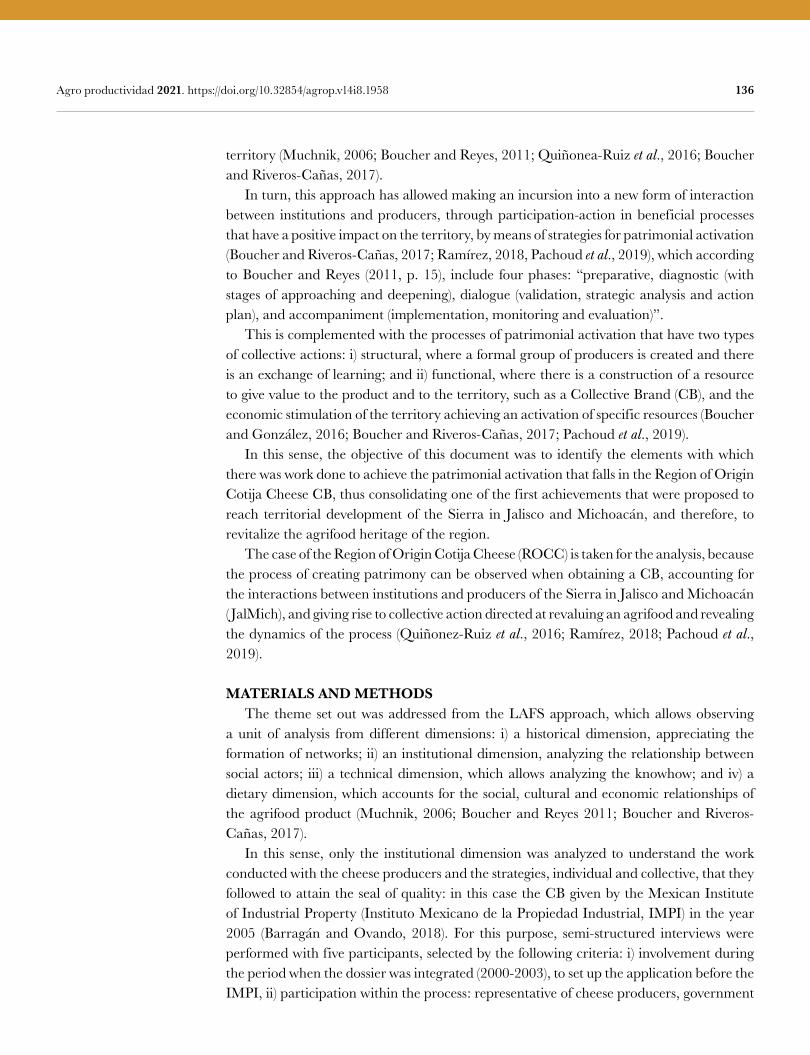
136 Agro productividad 2021. https://doi.org/10.32854/agrop.v14i8.1958
territory (Muchnik, 2006; Boucher and Reyes, 2011; Quiñonea-Ruiz et al., 2016; Boucher and Riveros-Cañas, 2017). In turn, this approach has allowed making an incursion into a new form of interaction between institutions and producers, through participation-action in beneficial processes that have a positive impact on the territory, by means of strategies for patrimonial activation (Boucher and Riveros-Cañas, 2017; Ramírez, 2018, Pachoud et al., 2019), which according to Boucher and Reyes (2011, p. 15), include four phases: “preparative, diagnostic (with stages of approaching and deepening), dialogue (validation, strategic analysis and action plan), and accompaniment (implementation, monitoring and evaluation)”. This is complemented with the processes of patrimonial activation that have two types of collective actions: i) structural, where a formal group of producers is created and there is an exchange of learning; and ii) functional, where there is a construction of a resource to give value to the product and to the territory, such as a Collective Brand (CB), and the economic stimulation of the territory achieving an activation of specific resources (Boucher and González, 2016; Boucher and Riveros-Cañas, 2017; Pachoud et al., 2019). In this sense, the objective of this document was to identify the elements with which there was work done to achieve the patrimonial activation that falls in the Region of Origin Cotija Cheese CB, thus consolidating one of the first achievements that were proposed to reach territorial development of the Sierra in Jalisco and Michoacán, and therefore, to revitalize the agrifood heritage of the region. The case of the Region of Origin Cotija Cheese (ROCC) is taken for the analysis, because the process of creating patrimony can be observed when obtaining a CB, accounting for the interactions between institutions and producers of the Sierra in Jalisco and Michoacán ( JalMich), and giving rise to collective action directed at revaluing an agrifood and revealing the dynamics of the process (Quiñonez-Ruiz et al., 2016; Ramírez, 2018; Pachoud et al., 2019).
MATERIALS AND METHODS The theme set out was addressed from the LAFS approach, which allows observing a unit of analysis from different dimensions: i) a historical dimension, appreciating the formation of networks; ii) an institutional dimension, analyzing the relationship between social actors; iii) a technical dimension, which allows analyzing the knowhow; and iv) a dietary dimension, which accounts for the social, cultural and economic relationships of the agrifood product (Muchnik, 2006; Boucher and Reyes 2011; Boucher and Riveros-Cañas, 2017). In this sense, only the institutional dimension was analyzed to understand the work conducted with the cheese producers and the strategies, individual and collective, that they followed to attain the seal of quality: in this case the CB given by the Mexican Institute of Industrial Property (Instituto Mexicano de la Propiedad Industrial, IMPI) in the year 2005 (Barragán and Ovando, 2018). For this purpose, semi-structured interviews were performed with five participants, selected by the following criteria: i) involvement during the period when the dossier was integrated (2000-2003), to set up the application before the IMPI, ii) participation within the process: representative of cheese producers, government
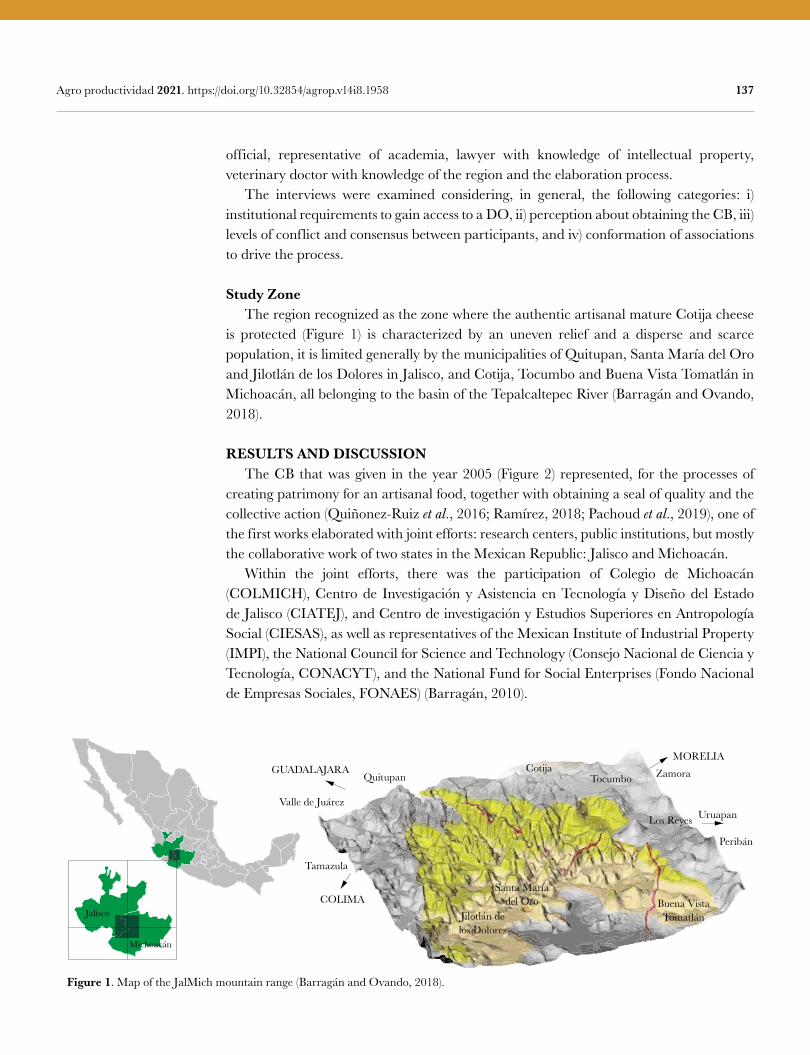
137 Agro productividad 2021. https://doi.org/10.32854/agrop.v14i8.1958
official, representative of academia, lawyer with knowledge of intellectual property, veterinary doctor with knowledge of the region and the elaboration process. The interviews were examined considering, in general, the following categories: i) institutional requirements to gain access to a DO, ii) perception about obtaining the CB, iii) levels of conflict and consensus between participants, and iv) conformation of associations to drive the process.
Study Zone The region recognized as the zone where the authentic artisanal mature Cotija cheese is protected (Figure 1) is characterized by an uneven relief and a disperse and scarce population, it is limited generally by the municipalities of Quitupan, Santa María del Oro and Jilotlán de los Dolores in Jalisco, and Cotija, Tocumbo and Buena Vista Tomatlán in Michoacán, all belonging to the basin of the Tepalcaltepec River (Barragán and Ovando, 2018).
RESULTS AND DISCUSSION The CB that was given in the year 2005 (Figure 2) represented, for the processes of creating patrimony for an artisanal food, together with obtaining a seal of quality and the collective action (Quiñonez-Ruiz et al., 2016; Ramírez, 2018; Pachoud et al., 2019), one of the first works elaborated with joint efforts: research centers, public institutions, but mostly the collaborative work of two states in the Mexican Republic: Jalisco and Michoacán. Within the joint efforts, there was the participation of Colegio de Michoacán (COLMICH), Centro de Investigación y Asistencia en Tecnología y Diseño del Estado de Jalisco (CIATEJ), and Centro de investigación y Estudios Superiores en Antropología Social (CIESAS), as well as representatives of the Mexican Institute of Industrial Property (IMPI), the National Council for Science and Technology (Consejo Nacional de Ciencia y Tecnología, CONACYT), and the National Fund for Social Enterprises (Fondo Nacional de Empresas Sociales, FONAES) (Barragán, 2010).
Figure 1. Map of the JalMich mountain range (Barragán and Ovando, 2018).
GUADALAJARA
Valle de Juárez
Quitupan
Tamazula
COLIMAJilotlán delos Dolores
Santa Maríadel Oro Buena Vista
Tomatlán
Peribán
Los Reyes Uruapan
Tocumbo ZamoraMORELIA
Cotija
Jalisco
Michoacán
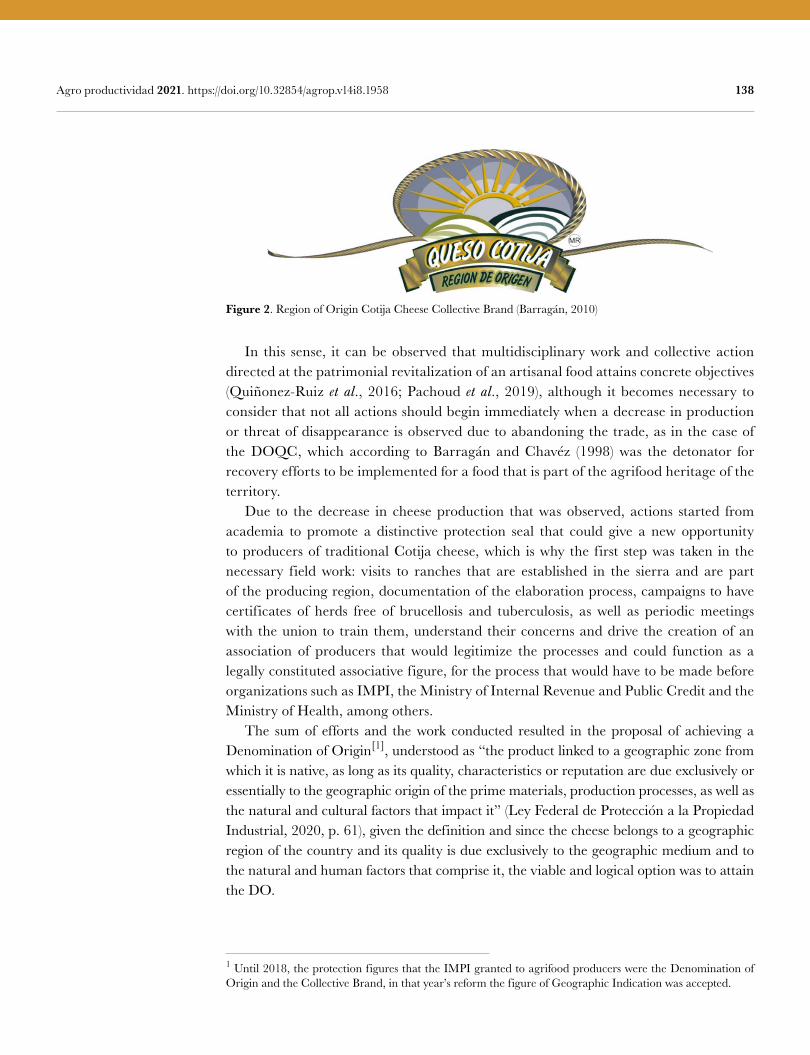
138 Agro productividad 2021. https://doi.org/10.32854/agrop.v14i8.1958
In this sense, it can be observed that multidisciplinary work and collective action directed at the patrimonial revitalization of an artisanal food attains concrete objectives (Quiñonez-Ruiz et al., 2016; Pachoud et al., 2019), although it becomes necessary to consider that not all actions should begin immediately when a decrease in production or threat of disappearance is observed due to abandoning the trade, as in the case of the DOQC, which according to Barragán and Chavéz (1998) was the detonator for recovery efforts to be implemented for a food that is part of the agrifood heritage of the territory. Due to the decrease in cheese production that was observed, actions started from academia to promote a distinctive protection seal that could give a new opportunity to producers of traditional Cotija cheese, which is why the first step was taken in the necessary field work: visits to ranches that are established in the sierra and are part of the producing region, documentation of the elaboration process, campaigns to have certificates of herds free of brucellosis and tuberculosis, as well as periodic meetings with the union to train them, understand their concerns and drive the creation of an association of producers that would legitimize the processes and could function as a legally constituted associative figure, for the process that would have to be made before organizations such as IMPI, the Ministry of Internal Revenue and Public Credit and the Ministry of Health, among others. The sum of efforts and the work conducted resulted in the proposal of achieving a Denomination of Origin[1], understood as “the product linked to a geographic zone from which it is native, as long as its quality, characteristics or reputation are due exclusively or essentially to the geographic origin of the prime materials, production processes, as well as the natural and cultural factors that impact it” (Ley Federal de Protección a la Propiedad Industrial, 2020, p. 61), given the definition and since the cheese belongs to a geographic region of the country and its quality is due exclusively to the geographic medium and to the natural and human factors that comprise it, the viable and logical option was to attain the DO.
Figure 2. Region of Origin Cotija Cheese Collective Brand (Barragán, 2010)
1 Until 2018, the protection figures that the IMPI granted to agrifood producers were the Denomination of Origin and the Collective Brand, in that year’s reform the figure of Geographic Indication was accepted.
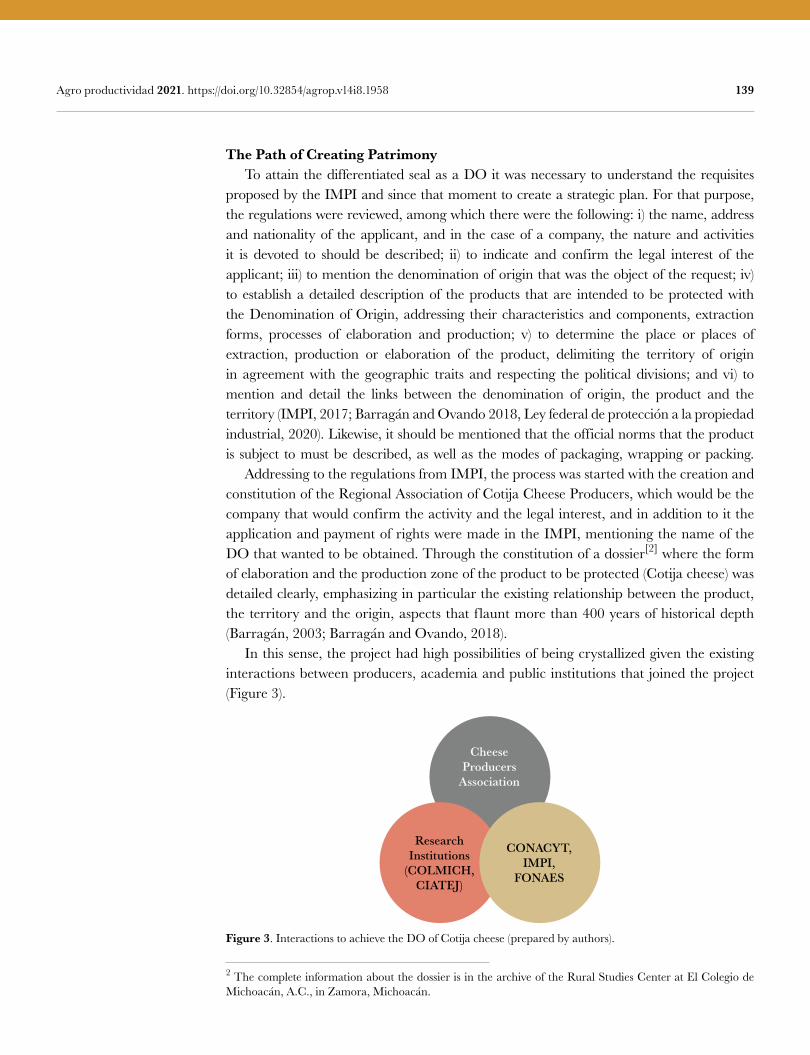
139 Agro productividad 2021. https://doi.org/10.32854/agrop.v14i8.1958
The Path of Creating Patrimony To attain the differentiated seal as a DO it was necessary to understand the requisites proposed by the IMPI and since that moment to create a strategic plan. For that purpose, the regulations were reviewed, among which there were the following: i) the name, address and nationality of the applicant, and in the case of a company, the nature and activities it is devoted to should be described; ii) to indicate and confirm the legal interest of the applicant; iii) to mention the denomination of origin that was the object of the request; iv) to establish a detailed description of the products that are intended to be protected with the Denomination of Origin, addressing their characteristics and components, extraction forms, processes of elaboration and production; v) to determine the place or places of extraction, production or elaboration of the product, delimiting the territory of origin in agreement with the geographic traits and respecting the political divisions; and vi) to mention and detail the links between the denomination of origin, the product and the territory (IMPI, 2017; Barragán and Ovando 2018, Ley federal de protección a la propiedad industrial, 2020). Likewise, it should be mentioned that the official norms that the product is subject to must be described, as well as the modes of packaging, wrapping or packing. Addressing to the regulations from IMPI, the process was started with the creation and constitution of the Regional Association of Cotija Cheese Producers, which would be the company that would confirm the activity and the legal interest, and in addition to it the application and payment of rights were made in the IMPI, mentioning the name of the DO that wanted to be obtained. Through the constitution of a dossier[2] where the form of elaboration and the production zone of the product to be protected (Cotija cheese) was detailed clearly, emphasizing in particular the existing relationship between the product, the territory and the origin, aspects that flaunt more than 400 years of historical depth (Barragán, 2003; Barragán and Ovando, 2018). In this sense, the project had high possibilities of being crystallized given the existing interactions between producers, academia and public institutions that joined the project (Figure 3).
Figure 3. Interactions to achieve the DO of Cotija cheese (prepared by authors).
2 The complete information about the dossier is in the archive of the Rural Studies Center at El Colegio de Michoacán, A.C., in Zamora, Michoacán.
CheeseProducers
Association
Research Institutions
(COLMICH,CIATEJ)
CONACYT,IMPI,
FONAES
140 Agro productividad 2021. https://doi.org/10.32854/agrop.v14i8.1958
The state governments of Jalisco and Michoacán adhered to the work carried out jointly, and this brought a greater benefit since there was more support, the impulse that had been developed with producers had now been escalated up to government spheres, which was perceived positively, since by having support from the government of both states, there was the political capital to begin the necessary negotiations (Barragán, 2010; Barragán and Ovando, 2018). However, the effort was not enough, or at least not in the terms set out since the DO was not attained, although the CB was, with which new proposals and strategies were started towards the protection and valuation of Cotija cheese. One of the weak points, so to speak, is that Cotija cheese at the time of presenting the request before the IMPI did not have an Official Mexican Norm that would back it based on the dispositions of the Federal Law of Industrial Property Protection (IMPI, 2017, Ley Federal de Protección a la Propiedad Industrial, 2020). Despite having not obtained the DO at that moment, the suggestions were reformulated and with the work already established, what was necessary was done to consolidate the Region of Origin Cotija CB[3], for which the Rules of Use were developed for the Region of Origin Cotija Cheese Collective Brand together with the producers, and the work started around the design of the labels for the product that would begin to be commercialized with the CB.
Leveraging the Brand With the distinctive seal attained, the goals were maximized, new channels of distribution and commercialization were imagined, but at the same time the bases were established to drive territorial development from the benefit. Through the creation of Mesón del Queso, actions of interaction with consumers would be promoted, through visits and tourism journeys, thinking of a Center of Productive Articulation (Centro de Articulación Productiva, CAP), where planning of the place with a zone for resting, recreational areas, and an outdoor space where the visitor could prepare food would be made through a feasibility study[4] where visits were made to know the optimal paths of access for visitors. The idea of having visitors and generating local tourism (through the creation of a tourism route) that could benefit the region was part of the action plan to consolidate the CB, since the service providers would be the inhabitants of the place themselves, where the Mesón would be located, while the cheese producers could continue to be devoted to their activity without neglecting their production unit. Unfortunately, the goals set out and the ideal of territorial development were decreased due to the lack of budgetary continuity and organizational efficacy of the state governments (the Inter-State Commission for the Development of the Jalmich Sierra, Comisión Interestatal para el Desarrollo de la Sierra de Jalmich, constituted in 2005, was dissolved at the end of the administration of the governors in office), the problems around distribution
3 The CAP’s feasibility study is located in the archive of the Rural Studies at El Colegio de Michoacán.4 The distinctive sign given by the IMPI in 2005 (it was presented in 2003 but was given in 2005) is Region of Origin Cotija, the word Cheese is not part of the brand, although it is included in the design.
141 Agro productividad 2021. https://doi.org/10.32854/agrop.v14i8.1958
channels, which were not those expected due to the requirements and abusive contracts of supermarkets or transnational companies, and decisively, the climate of violence that was accentuated and remains in the region, which have made obtaining the distinctive seal surmise new challenges to be overcome.
CONCLUSIONS Mexico is a country with a vast agrifood heritage that should be protected, given the strong pressure that emblematic foods from the territory face within the context of the industrialized global food system. Safeguarding that heritage is a responsibility of the State, together with organized society, whether the groups of producers, conscious consumers, or academia from its tasks of connection with society and service. Despite this, obtaining the seals of quality which allow the protection of the heritage, and of producers and consumers, is a winding path full of difficulties. It is necessary to develop public policies that reach small-scale producers, authentic guardians of the food heritage of Mexico. The case of Cotija cheese illustrates the need to redefine clear and attainable criteria in the processes of valuation of local resources, as well as to improve the conception of protection of the foods, based on territoriality, historicity, and knowhow associated to an agrifood system. This not only has an impact on the improvement of the living conditions of rural producers, but rather also on the drive towards a quality, healthy, and culturally appropriate diet that is so necessary in such tumultuous moments as are experienced nowadays. Future studies ought to include a deeper analysis about the networks of actors implicated in the processes of protection and valuation, from a socio-ecosystemic and biocultural perspective. Likewise, it is important to contrast the varied and irregular trajectories that different foods susceptible of valuation in Mexico have followed.
REFERENCESBarragán, Esteban, (2003), “Por una orientación plural del porvenir. Proceso de certificación y patrimonio
cultural en la Sierra de Jalmich”, en Oscar González (compilador), Estudios Michoacanos, El Colegio de Michoacán, Zamora, Michoacán, pp. 219-243.
Barragán, Esteban, (2010), “Con el patrimonio en sus manos”, en Esteban Barragán López, el queso cotija región de origen. siempre a su mesa, Icatmi, Morelia, Michoacán, pp. 11-45.
Barragán, E., Chávez, M. (1998). El queso Cotija se nos va de las manos, en: Oikión, V (coord) Manufacturas de Michoacán, México, El Colegio de Michoacán/Gobierno del Estado.
Barragán, E. Ovando, P. (2018) 18 años de esfuerzos a favor de un producto cultural con identidad territorial: Queso Cotija Región de Origen. En: Pérez, P., González, A. y Picado, W. (coords) Saberes de Origen. Experiencias de México y Centroamérica (pp. 347-364) UNAM.
Boucher, F., González, J. A. R. (2016). El Enfoque SIAL como catalizador de la acción colectiva: casos territoriales en América Latina The LAS Approach as catalyzer for collective action: territorial case-studies from Latin America. Estudios Sociales. Revista de alimentación contemporánea y desarrollo regional, 25(47), 11-37.
Boucher Reyes J. (2011). Guía metodológica para la activación de sistemas agroalimentarios localizados. IICA, CIRAD, RED-SIAL México-Europa. México.
Boucher, F., Riveros-Cañas, R. A. (2017). Dinamización económica incluyente de los territorios rurales: alternativas desde los Sistemas Agroalimentarios Localizados y los Circuitos Cortos de Comercialización. Estudios latinoamericanos, 40, julio-diciembre, 39-58
142 Agro productividad 2021. https://doi.org/10.32854/agrop.v14i8.1958
Instituto Mexicano de la Propiedad Industrial (16 de febrero 2017) Servicios que ofrece el IMPI Marcas / Denominaciones de Origen. México. Disponible en: https://www.gob.mx/impi/acciones-y-programas/servicios-que-ofrece-el-impi-marcas-denominaciones-de-origen
Ley Federal de Protección a la Propiedad Industrial (2020) Diario Oficial de la Federación, México, 1 de julioMuchnik, J. (2006). Sistemas agroalimentarios localizados: evolución del concepto y diversidad de situaciones.
En III Congreso Internacional de la Red SIAL: ALTER 06” Alimentación y Territorios. Pachoud, C., Labeyrie, V., Polge, E. (2019). Collective action in Localized Agrifood Systems: An analysis by the
social networks and the proximities. Study of a Serrano cheese producers’ association in the Campos de Cima da Serra/Brazil. Journal of Rural Studies, 72, 58–74. Doi: 10.1016/j.jrurstud.2019.10.003
Quiñones-Ruiz, X. F., Penker, M., Belletti, G., Marescotti, A., Scaramuzzi, S., Barzini, E., Samper-Gartner, L. F. (2016). Insights into the black box of collective efforts for the registration of Geographical Indications. Land Use Policy, 57, 103–116. Doi: 10.1016/j.landusepol.2016.05.021
Ramírez, J. H. (2018). Cuando la alimentación se convierte en gastronomía. Procesos de activación patrimonial de tradiciones alimentarias. REVISTA CUHSO, 28(1), 154-176.
Colegio dePostgraduados
143
Effect of Coconut Water on Physical Characteristics and Yield of Vanilla planifolia FruitPérez-Orozco, Zayra Guadalupe1; Delgado-Alvarado, Adriana1; Herrera-Cabrera, Braulio Edgar1;
Arévalo-Galarza, Ma. de Lourdes2; Jaramillo-Villanueva, José Luis1
1 Colegio de Postgraduados, Campus Puebla. Boulevard Forjadores de Puebla 205, Col. Santiago Momoxpan, San Pedro Cholula, Puebla, CP 72760. México.
2 Colegio de Postgraduados Campus Montecillo. Carretera México-Texcoco km 36.5, Montecillo, Texcoco, Estado de México. CP 56230. México.
* Corresponding author: [email protected], [email protected]
ABSTRACTObjective: To evaluate the effect of coconut water spray on the physical characteristics and yield of vanilla fruit and to identify the relationship between environmental variables and yield components in Gutiérrez Zamora, Veracruz, Mexico. Design/Methodology/Approach: The study was conducted in a 3- to 4-year-old vanilla plantation under shade mesh with bamboo stakes as support. The variables measured were fruit and plant dimensions, weight, yield components, and environmental variables (temperature, relative humidity, and photosynthetically active radiation, PAR). Beginning at flowering, the plants were sprayed every two weeks for three months with one of four treatments (T1: 100% water; T2: 50% coconut water; T3: 100% coconut water; and T4: Megafol solution) at two sites within the same vanilla plantation. Statistical analysis consisted of ANOVA, comparison of means, and canonical correlation analysis. Results: The highest averages of fruit dimensions and weight were obtained from Site 1. T2 and T3 fruits were heavier than T1 and T4 fruits. The canonical correlation analysis showed that PAR and relative humidity were related in different ways to yield component variables in function of the vanilla plantation site. Study Limitations/Implications: Using coconut water as an organic alternative for fertilization can decrease application of chemical substances and reduce production costs, among other advantages. Findings/Conclusion: Coconut water applied at the beginning of the vanilla flowering stage has a significant effect on fruit dimensions and on the accumulation of fruit dry matter and may be an organic option for supplying nutrients and increasing vanilla yield.
Keywords: Cocos nucifera L., organic fertilizer, yield, environment.
INTRODUCTION In 2019, Mexico produced 850.4 tons of vanilla, production that was distributed over four states: Veracruz (Totonacapan region) with approximately 80% (679.5 t) of the country’s total production, Oaxaca with 10.11% (86 t), Puebla with 7.74% (65.9 t), and San Luis Potosí with 2.23% (19 t) (SIAP, 2019).
Image by DTelloc at Pixabay
Citation: Pérez-Orozco, Z. G., Delgado-Alvarado, A., Herrera-Cabrera, B. E., Arévalo-Galarza, Ma. de L., & Jaramillo-Villanueva, J. L (2021). Effect of Coconut Water on Physical Characteristics and Yield of Vanilla planifolia Fruit. Agro Productividad. https://doi.org/10.32854/agrop.v14i8.2076
Editor in Chief: Dr. Jorge Cadena Iñiguez
Received: February, 2021.Accepted: August, 2021.
Agro Productividad, 14(8). August. 2021. pp: 143-150.
This work is licensed under a Creative Commons Attribution-Non-Commercial 4.0 International license.
144 Agro productividad 2021. https://doi.org/10.32854/agrop.v14i8.2076
Vanilla can be cultivated in various ways. It can be grown in acahual, or secondary vegetation, or intensively with live or inert supports. In the Totonacapan region, the two most used systems are in acahual and under shade mesh (Espinoza-Pérez et al., 2018). In acahual, the plant obtains most of its nutrients from the organic matter that accumulates on the soil when the support tree loses its leaves (Barrera-Rodríguez et al., 2009), while management and monitoring is easier under shade mesh, and agrochemical application and irrigation is controlled (Hernández-Hernández, 2014). Because vanilla cultivation depends essentially on organic nutrition and traditional management, vanilla plantations lack a management system that standardizes variables such as the amount and quality of organic matter that should be incorporated (González-Chávez et al., 2018). For this reason, in terms of establishment and maintenance of vanilla plantations, one of the main challenges is to maintain adequate plant nutrition (Carrillo-González & González-Chávez, 2018), which has positive effects on number of inf lorescences, f lower budding, number of fruits, and fruit size, among other variables (Diez et al., 2018). Naturally, these variables can also depend on management, water availability, solar radiation, and temperature (Rocha-Flores et al., 2018). Vanilla is a species that is highly sensitive to climate events (Borbolla-Pérez et al., 2016), and for this reason, production on the national level is low. It has been documented that coconut (Cocos nucifera L.) fruit promotes plant growth because of its content of phytohormones (Sandoval-Prando et al., 2014), such as cytokines, which are known to play an important role in plant growth and development (Ge et al., 2006). Several studies have found that coconut water contains diverse organic compounds and mineral nutrients that are important for plant development (Ramírez-Luna et al., 2005; Vieira de Souza et al., 2013; Sandoval-Prando et al., 2014). Worldwide, Mexico is eighth in the production of coconut palm, contributing 1.7% of the world production. This palm is found in mostly in tropical regions (SAGARPA, 2017), and the tropical state of Veracruz is one of the main producer states of C. nucifera L. as well as of Vanilla planifolia L. For this reason, we propose the application of coconut water in the cultivation of vanilla to make use of the plant genetic resources that exist in the region. The objective of this study was to evaluate the effect of applying coconut water at different concentrations on physical characteristics and yield of vanilla fruit, as well as to determine the relationship between yield components and environmental variables at two sites of the same vanilla plantation in Paso de Barriles, Gutiérrez Zamora, Veracruz.
MATERIALS AND METHODSStudy Sites The study was conducted during the 2019 crop cycle in a vanilla plantation established with inert supports (bamboo) in a system under 50% shade mesh. The vanilla plantation is found in the locality Paso de Barriles, Gutiérrez Zamora, Veracruz, at 97.123611 W and 20.443056 N, at an altitude of 20 m. Two experiments were established in the vanilla plantation: Site 1 was placed on the northern side of the plantation and Site 2 on the southern side to determine the possible effects of the treatments in different locations within the same plantation.
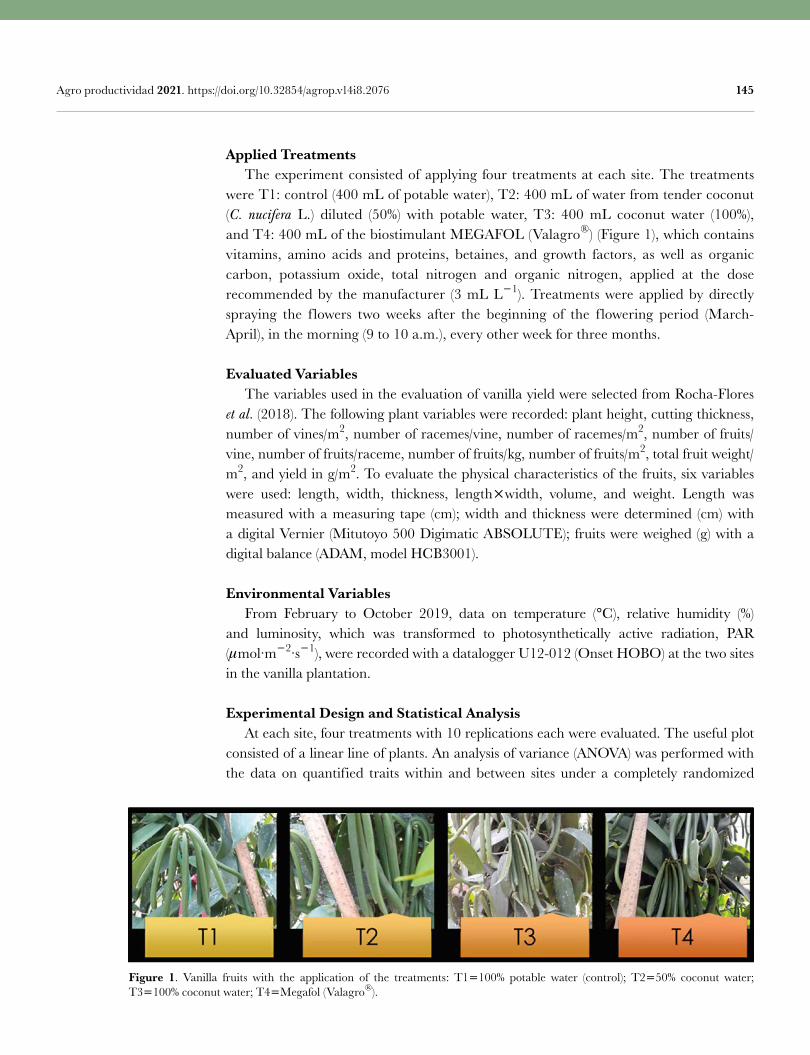
145 Agro productividad 2021. https://doi.org/10.32854/agrop.v14i8.2076
Applied Treatments The experiment consisted of applying four treatments at each site. The treatments were T1: control (400 mL of potable water), T2: 400 mL of water from tender coconut (C. nucifera L.) diluted (50%) with potable water, T3: 400 mL coconut water (100%), and T4: 400 mL of the biostimulant MEGAFOL (Valagro®) (Figure 1), which contains vitamins, amino acids and proteins, betaines, and growth factors, as well as organic carbon, potassium oxide, total nitrogen and organic nitrogen, applied at the dose recommended by the manufacturer (3 mL L1). Treatments were applied by directly spraying the f lowers two weeks after the beginning of the f lowering period (March-April), in the morning (9 to 10 a.m.), every other week for three months.
Evaluated Variables The variables used in the evaluation of vanilla yield were selected from Rocha-Flores et al. (2018). The following plant variables were recorded: plant height, cutting thickness, number of vines/m2, number of racemes/vine, number of racemes/m2, number of fruits/vine, number of fruits/raceme, number of fruits/kg, number of fruits/m2, total fruit weight/m2, and yield in g/m2. To evaluate the physical characteristics of the fruits, six variables were used: length, width, thickness, lengthwidth, volume, and weight. Length was measured with a measuring tape (cm); width and thickness were determined (cm) with a digital Vernier (Mitutoyo 500 Digimatic ABSOLUTE); fruits were weighed (g) with a digital balance (ADAM, model HCB3001).
Environmental Variables From February to October 2019, data on temperature (°C), relative humidity (%) and luminosity, which was transformed to photosynthetically active radiation, PAR (mol∙m2∙s1), were recorded with a datalogger U12-012 (Onset HOBO) at the two sites in the vanilla plantation.
Experimental Design and Statistical Analysis At each site, four treatments with 10 replications each were evaluated. The useful plot consisted of a linear line of plants. An analysis of variance (ANOVA) was performed with the data on quantified traits within and between sites under a completely randomized
Figure 1. Vanilla fruits with the application of the treatments: T1100% potable water (control); T250% coconut water; T3100% coconut water; T4Megafol (Valagro®).
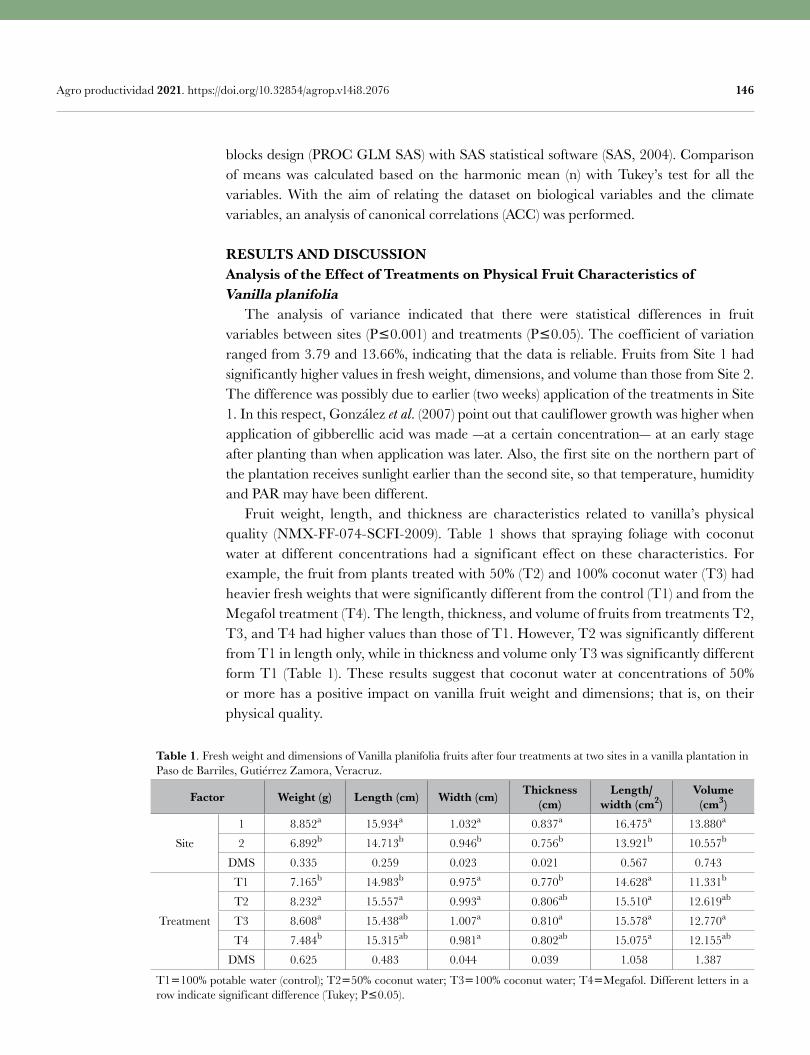
146 Agro productividad 2021. https://doi.org/10.32854/agrop.v14i8.2076
blocks design (PROC GLM SAS) with SAS statistical software (SAS, 2004). Comparison of means was calculated based on the harmonic mean (n) with Tukey’s test for all the variables. With the aim of relating the dataset on biological variables and the climate variables, an analysis of canonical correlations (ACC) was performed.
RESULTS AND DISCUSSIONAnalysis of the Effect of Treatments on Physical Fruit Characteristics of Vanilla planifolia The analysis of variance indicated that there were statistical differences in fruit variables between sites (P0.001) and treatments (P0.05). The coefficient of variation ranged from 3.79 and 13.66%, indicating that the data is reliable. Fruits from Site 1 had significantly higher values in fresh weight, dimensions, and volume than those from Site 2. The difference was possibly due to earlier (two weeks) application of the treatments in Site 1. In this respect, González et al. (2007) point out that cauliflower growth was higher when application of gibberellic acid was made -at a certain concentration- at an early stage after planting than when application was later. Also, the first site on the northern part of the plantation receives sunlight earlier than the second site, so that temperature, humidity and PAR may have been different. Fruit weight, length, and thickness are characteristics related to vanilla’s physical quality (NMX-FF-074-SCFI-2009). Table 1 shows that spraying foliage with coconut water at different concentrations had a significant effect on these characteristics. For example, the fruit from plants treated with 50% (T2) and 100% coconut water (T3) had heavier fresh weights that were significantly different from the control (T1) and from the Megafol treatment (T4). The length, thickness, and volume of fruits from treatments T2, T3, and T4 had higher values than those of T1. However, T2 was significantly different from T1 in length only, while in thickness and volume only T3 was significantly different form T1 (Table 1). These results suggest that coconut water at concentrations of 50% or more has a positive impact on vanilla fruit weight and dimensions; that is, on their physical quality.
Table 1. Fresh weight and dimensions of Vanilla planifolia fruits after four treatments at two sites in a vanilla plantation in Paso de Barriles, Gutiérrez Zamora, Veracruz.
Factor Weight (g) Length (cm) Width (cm) Thickness (cm)
Length/width (cm2)
Volume (cm3)
Site
1 8.852a 15.934a 1.032a 0.837a 16.475a 13.880a
2 6.892b 14.713b 0.946b 0.756b 13.921b 10.557b
DMS 0.335 0.259 0.023 0.021 0.567 0.743
Treatment
T1 7.165b 14.983b 0.975a 0.770b 14.628a 11.331b
T2 8.232a 15.557a 0.993a 0.806ab 15.510a 12.619ab
T3 8.608a 15.438ab 1.007a 0.810a 15.578a 12.770a
T4 7.484b 15.315ab 0.981a 0.802ab 15.075a 12.155ab
DMS 0.625 0.483 0.044 0.039 1.058 1.387
T1100% potable water (control); T250% coconut water; T3100% coconut water; T4Megafol. Different letters in a row indicate significant difference (Tukey; P0.05).
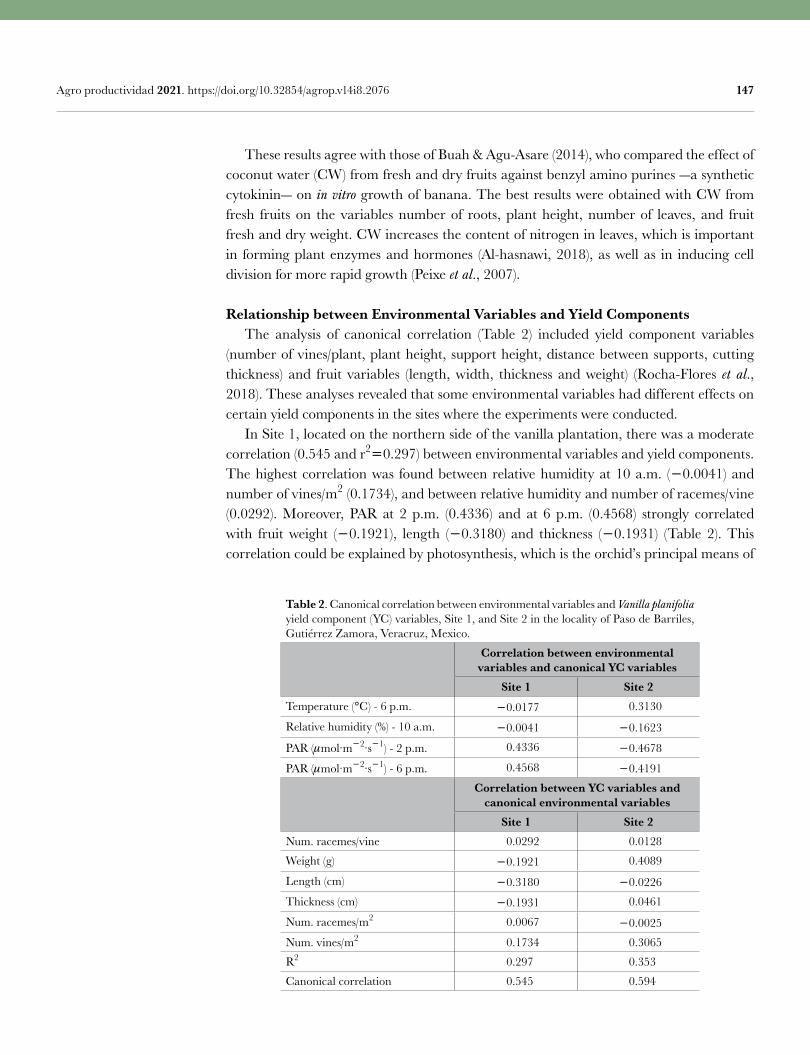
147 Agro productividad 2021. https://doi.org/10.32854/agrop.v14i8.2076
These results agree with those of Buah & Agu-Asare (2014), who compared the effect of coconut water (CW) from fresh and dry fruits against benzyl amino purines -a synthetic cytokinin- on in vitro growth of banana. The best results were obtained with CW from fresh fruits on the variables number of roots, plant height, number of leaves, and fruit fresh and dry weight. CW increases the content of nitrogen in leaves, which is important in forming plant enzymes and hormones (Al-hasnawi, 2018), as well as in inducing cell division for more rapid growth (Peixe et al., 2007).
Relationship between Environmental Variables and Yield Components The analysis of canonical correlation (Table 2) included yield component variables (number of vines/plant, plant height, support height, distance between supports, cutting thickness) and fruit variables (length, width, thickness and weight) (Rocha-Flores et al., 2018). These analyses revealed that some environmental variables had different effects on certain yield components in the sites where the experiments were conducted. In Site 1, located on the northern side of the vanilla plantation, there was a moderate correlation (0.545 and r20.297) between environmental variables and yield components. The highest correlation was found between relative humidity at 10 a.m. (0.0041) and number of vines/m2 (0.1734), and between relative humidity and number of racemes/vine (0.0292). Moreover, PAR at 2 p.m. (0.4336) and at 6 p.m. (0.4568) strongly correlated with fruit weight (0.1921), length (0.3180) and thickness (0.1931) (Table 2). This correlation could be explained by photosynthesis, which is the orchid’s principal means of
Table 2. Canonical correlation between environmental variables and Vanilla planifolia yield component (YC) variables, Site 1, and Site 2 in the locality of Paso de Barriles, Gutiérrez Zamora, Veracruz, Mexico.
Correlation between environmental variables and canonical YC variables
Site 1 Site 2Temperature (°C) - 6 p.m. 0.0177 0.3130
Relative humidity (%) - 10 a.m. 0.0041 0.1623
PAR (mol∙m2∙s1) - 2 p.m. 0.4336 0.4678
PAR (mol∙m2∙s1) - 6 p.m. 0.4568 0.4191
Correlation between YC variables and canonical environmental variables
Site 1 Site 2Num. racemes/vine 0.0292 0.0128
Weight (g) 0.1921 0.4089
Length (cm) 0.3180 0.0226
Thickness (cm) 0.1931 0.0461
Num. racemes/m2 0.0067 0.0025
Num. vines/m2 0.1734 0.3065
R2 0.297 0.353
Canonical correlation 0.545 0.594
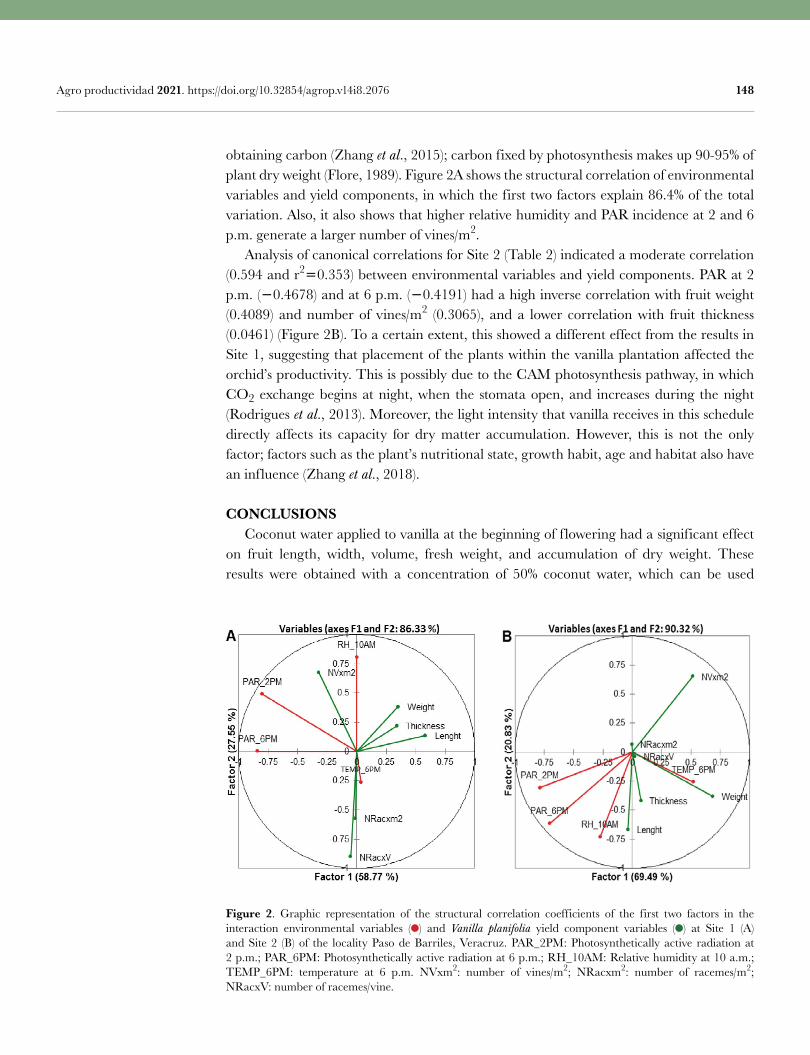
148 Agro productividad 2021. https://doi.org/10.32854/agrop.v14i8.2076
obtaining carbon (Zhang et al., 2015); carbon fixed by photosynthesis makes up 90-95% of plant dry weight (Flore, 1989). Figure 2A shows the structural correlation of environmental variables and yield components, in which the first two factors explain 86.4% of the total variation. Also, it also shows that higher relative humidity and PAR incidence at 2 and 6 p.m. generate a larger number of vines/m2. Analysis of canonical correlations for Site 2 (Table 2) indicated a moderate correlation (0.594 and r20.353) between environmental variables and yield components. PAR at 2 p.m. (0.4678) and at 6 p.m. (0.4191) had a high inverse correlation with fruit weight (0.4089) and number of vines/m2 (0.3065), and a lower correlation with fruit thickness (0.0461) (Figure 2B). To a certain extent, this showed a different effect from the results in Site 1, suggesting that placement of the plants within the vanilla plantation affected the orchid’s productivity. This is possibly due to the CAM photosynthesis pathway, in which CO2 exchange begins at night, when the stomata open, and increases during the night (Rodrigues et al., 2013). Moreover, the light intensity that vanilla receives in this schedule directly affects its capacity for dry matter accumulation. However, this is not the only factor; factors such as the plant’s nutritional state, growth habit, age and habitat also have an influence (Zhang et al., 2018).
CONCLUSIONS Coconut water applied to vanilla at the beginning of flowering had a significant effect on fruit length, width, volume, fresh weight, and accumulation of dry weight. These results were obtained with a concentration of 50% coconut water, which can be used
Figure 2. Graphic representation of the structural correlation coefficients of the first two factors in the interaction environmental variables ( ) and Vanilla planifolia yield component variables ( ) at Site 1 (A) and Site 2 (B) of the locality Paso de Barriles, Veracruz. PAR_2PM: Photosynthetically active radiation at 2 p.m.; PAR_6PM: Photosynthetically active radiation at 6 p.m.; RH_10AM: Relative humidity at 10 a.m.; TEMP_6PM: temperature at 6 p.m. NVxm2: number of vines/m2; NRacxm2: number of racemes/m2; NRacxV: number of racemes/vine.
149 Agro productividad 2021. https://doi.org/10.32854/agrop.v14i8.2076
as an organic option for nutrition to increase vanilla yield. In terms of environmental effects, photosynthetically active radiation has a direct effect on fruit weight, thickness and length. The effects of coconut water and the environment should be considered among the management and crop nutrition practices for vanilla.
REFERENCES Al-hasnawi, A. N. H. (2018). Effect of benzyladenine and chelated magnesium spraying on growth and
flowering of Chrysanthemum hortorum Hort. Agricultural Research Journal, 55: 386-388.Barrera-Rodríguez, A. I., Herrera-Cabrera, B. E., Jaramillo-Villanueva, J. L., Escobedo-Garrido, J.S.
Bustamante-González, A. (2009). Caracterización de los sistemas de producción de vainilla (Vanilla planifolia A.) bajo naranjo y en malla sombra en el Totonacapan. Tropical and Subtropical Agroecosystems, 10: 199-212.
Borbolla-Pérez, V. V., Iglesias-Andreu, L.G., Herrera-Cabrera, B.E. Vovides-Papalouka, A. (2016). Aborción prematura de frutos de Vanilla planifolia Jacks. Ex Andrews. Agroprodcutividad, 9: 11.
Buah, J. N. Agu-Asare, P. (2014). Coconut water from fresh and dry fruits as an alternative to BAP in the in vitro culture of Dwarf Cavendish Banana. Journal of biological sciences, 14: 521-526.
Carrillo-González, R. González-Chávez, M.C. (2018). Relación capacidad-intensidad de potasio en los suelos no fertilizados cultivados con vainilla (Vanilla planifolia Jacks. ex Andrews). Agroproductividad, 11: 37-44.
Diez, M. C., Osorio, M. W. Moreno, F. (2016). Effect of dose and type of fertilizer on flowering and fruiting of vanilla plants. Journal of Plant Nutrition, 39: 1297-1310.
Espinoza-Pérez, J., Herrera-Cabrera, B. E., Zizumbo-Villarreal, D., Delgado-Alvarado, A. Salazar-Rojas, V. M. (2018). Perfil de productor por intensidad de manejo sobre vainilla (Vanilla planifolia Jacks. ex Andrews) en la región Totonacapan, México. Agroproductividad, 11: 58-63.
Flore, J. A. Lakso, A.N. (1989). Environmental and physiological regulation of photosynthesis in fruit crops. Horticultural Reviews, 11: 112-157.
Ge, L., Hong-Yong, J. W., Ngin-Tan, S. Shi-Ong, E. (2006). Determination of cytokinins in coconut (Cocos nucifera L.) water using capillary zone electrophoresis–tandem mass spectrometry. Electrophoresis, 27: 2171 – 2181.
González, M. L., Caycedo, C., Velásquez, M. F., Flórez, V. Garzón, M. R. (2007). Efecto de la aplicación del ácido giberélico sobre el crecimiento de coliflor (Brassica oleraceae L.) var. Botrytis DC. Agronomía Colombiana, 25: 54-61.
González-Chávez, M. C., Carrillo-González, R., Villegas-Monter, A., Delgado-Alvarado, A., Perea-Vélez, S. Y. Herrera-Cabrera, B. E. (2018). Uso de vermicompost para la propagación de estacas de vainilla (Vanilla planifolia Jacks. ex Andrews). Agroproductividad, 3: 22-28.
Hernández-Hernández, J. (2014). Técnicas implementadas para el cultivo de vainilla en México. Araya Fernández et al. (Presidencia). I Seminario Internacional de Vainilla. Promoviendo la investigación, extensión y producción de vainilla en Mesoamérica. CONICIT, Costa Rica.
Lima-Morales, M., Herrera-Cabrera, B.E., Delgado-Alvarado, A., Salazar-Rojas, V.M. Campos-Contreras, J.E. (2018). Conocimiento tradicional del manejo de Vanilla planifolia Jacks Ex. Andrews (Orchidaceae) en la región huasteca de San Luis Potosí, México. Agroproductividad, 11: 51-57.
NMX-FF-074-SCFI-2009. Productos no industrializados para uso humano -vainilla- (Vanilla fragrans (Salisbury) Ames*) - especificaciones y métodos de prueba. Normas Mexicanas. Dirección General de Normas.
Peixe, A., Raposo, A., Lourenco, R., Cardoso, H. Macedo E. (2007). Coconut water and BAP successfully replaced zeatin in olive (Olea europaea L.) micropropagation. Scientia. Horticulturae, 113: 1-7.
Ramírez-Luna, E., Castillo-Aguilar, C. de la C., Aceves-Navarro, E. Carrillo-Ávila, E. (2005). Efecto de productos con reguladores de crecimiento sobre la floración y amarre de fruto en chile “habanero”. Revista Chapingo Serie Horticultura, 9: 93-98.
Rocha-Flores, R. G., Herrera-Cabrera, B. E., Velasco-Velasco, J., Salazar-Rojas, V. M., Delgado-Alvarado, A. Mendoza-Castillo, M. C. (2018). Determinación preliminar de componentes de rendimiento para el cultivo de vainilla (Vanilla planifolia Jacks. ex Andrews) en la región Totonacapan, México. Agroproductividad, 11: 9-14
Rodrigues, M.A., Matiz, A., Cruz, A.B., Matsumura, A.T., Takahashi, C. A., Hamachi, L., Félix, L. M., Pereira, P. N., Latansio-Aidar, S. R., Marinho-Aidar, M. P., Demarco, A., Freschi, L., Mercier, H. Barbante-Kerbauy, G. (2013). Spatial patterns of photosynthesis in thin- and thick-leaved epiphytic orchids: unravelling C3-CAM plasticity in an organ-compartmented way. Annals of Botany, 112: 17-29.
150 Agro productividad 2021. https://doi.org/10.32854/agrop.v14i8.2076
SAGARPA. (2017). Planeación Agrícola Nacional 2017-2030. (1era Edición). Disponible en: https://www.gob.mx/cms/uploads/attachment/file/257086/Potencial-Vainilla.pdf
Sandoval-Prando, M. A., Chiavazza, P., Faggio A. & Contessa C. (2014). Effect of coconut water and growth regulator supplements on in vitro propagation of Corylus avellana L. Scientia Horticulturae, 171: 91-94.
SAS, Statistical Analysis System (2004) SAS/STAT User’s Guide. Version 9.1, SAS Institute Inc, Cary, North Carolina, USA. 5136 p.
SIAP. (2019). Estadística de producción agrícola 2019. Recuperado de: http://infosiap.siap.gob.mx/gobmx/datosAbiertos_a.php
Vieira de Souza, R. A., Tavares Braga, F., Alemu Setotaw, T., Vieira Neto, J., Helena de AzevedoI, P., Helena de AzevedoI, V. & Magela de Almeida CançadoII, G. (2013). Effect of coconut water on growth of olive embryos cultured in vitro. Ciencia Rural, 43: 290-296.
Zhang, S.B., Chen, W.Y., Huang, J.L., Bi, Y. F. Yan, X.F. (2015). Orchid species richness along elevational and environmental gradients in Yunnan, China. PLOS One 10: 1- 23.
Zhang, S., Yang, Y., Jiawei, L., Qin, J., Zhang, W., Huang, W. Hu H. (2018). Physiological diversity of orchids. Plant Diversity, 40: 196-208.
Colegio dePostgraduados
151
Involvement of the Interferon Tau Gene in Maternal Recognition of Gestation in SheepConde-Hinojosa, M.P.1; Gallegos-Sánchez, J.1; Torres-Hernández, G.1; Salazar-Ortiz, J.2;
Clemente-Sánchez, F.3, Cortez-Romero, C.1,3,*
1 Colegio de Postgraduados, Recursos Genéticos y Productividad-Ganadería, Campus Montecillo, Carretera México-Texcoco km. 36.5, Montecillo, Texcoco, 56230, Estado de México, México.
2 Colegio de Postgraduados, Innovación Agroalimentaria Sustentable, Campus Córdoba, carretera federal Córdoba-Veracruz km 348, Congregación Manuel León, 94946, Amatlán de los Reyes, Veracruz, México.
3 Colegio de Postgraduados, Innovación en Manejo de Recursos Naturales, Campus San Luis Potosí, Iturbide No. 73, Salinas de Hidalgo, 78600, San Luis Potosí, México.
* Corresponding author: [email protected]
ABSTRACTObjective: To describe the involvement of the interferon tau gene in the maternal recognition of pregnancy in sheep.Design/Methodology/Approach: A search and analysis of the scientific documents retrieved from the Web of Science and Scopus databases related to the functions of the interferon tau gene in the maternal recognition of pregnancy in sheep were conducted.Results: The interferon tau gene (IFN) participates in maternal recognition of pregnancy to avoid possible rejection of the embryo, and supports the secretion of progesterone involved in preparing the endometrium for implantation; it also inhibits myometrial motility to maintain pregnancy. IFNγstimulates the transcription of so-called interferon-stimulated genes (ISGs), which are the effectors of cell-autonomous antiviral defense. One of the representative members of ISGs is the interferon 15-stimulated gene (ISG15) which regulates endometrial receptivity at implantation, as well as survival, growth and development of the conceptus. Study Limitations/Implications: Most embryonic losses occur between fertilization and maternal recognition of pregnancy. Understanding this issue is essential to understanding the possible causes of early pregnancy losses. Findings/Conclusions: Considerable progress has been made in the discovery of how the IFN and ISG15 genes act in maternal recognition of gestation in sheep. However, some of the regulatory mechanisms involved remain poorly understood.
Keywords: IFNγ, ISG15, pregnancy, sheep.
Citation: Conde-Hinojosa, M.P., Gallegos-Sánchez, J., Torres-Hernández, G., Salazar-Ortiz, J., Clemente-Sánchez, F., & Cortez-Romero, C. (2021). Involvement of the Interferon Tau Gene in Maternal Recognition of Gestation in Sheep. Agro Productividad. https://doi.org/10.32854/ agrop.v14i8.2039
Editor in Chief: Dr. Jorge Cadena Iñiguez
Received: February, 2021.Accepted: July, 2021.
Agro Productividad, 14(8). August. 2021. pp: 151-158.
This work is licensed under a Creative Commons Attribution-Non-Commercial 4.0 International license.
Image by Roman Grac at Pixabay 151
152 Agro productividad 2021. https://doi.org/10.32854/agrop.v14i8.2039
INTRODUCTION A large portion of embryo loss originates during the first few weeks post conception. Most embryonic losses occur between fertilization and maternal recognition of gestation (Lonergan et al., 2016). Therefore, it is necessary to address this issue with research into the enigmas of embryo implantation (Miller et al., 2012). Evolving molecular insights have been used to study the process of maternal recognition of gestation, along with the molecular aspects of endometrial-embryo interactions, embryo development and implantation (Zohni et al., 2016). In ruminants, the establishment of adequate communication between the conceptus and the endometrium is essential for embryo implantation and subsequent successful placentation (Nakamura et al., 2020). This process involves the protein known as interferon tau (IFN), initially called trophoblast protein or trophoblastin (Taverne & Noakes, 2019), which is produced by its homologous gene now known as interferon tau or also known as TP-1 gene (Ealy & Wooldridge, 2017). Some studies performed with ISG15 and IFN genes in vivo as well as in vitro have confirmed their importance in reproductive function in ruminants. The IFN gene is involved in the maternal recognition of gestation to prevent possible rejection of the embryo and also supports progesterone secretion (D’Occhio et al., 2020). IFN molecules bind to cell surface receptors and initiate signal transduction; this activates the transcription of so-called ISGs which are the effectors of cell autonomous antiviral defense. One of the representative and well-studied ISG members with specific antiviral activities is the ISG15 gene (Wang et al., 2017). Given the critical importance of the process of maternal recognition of gestation, the objective of this review was to describe the implications of the interferon tau gene on maternal recognition of gestation in the ewe.
Maternal Recognition of Gestation and Implantation Successful establishment of gestation involves ovulation of an oocyte, fertilization by a sperm and growth of the embryo in an environment conducive to normal development (Lonergan & Sanchez, 2020). In several domestic species, the corpus luteum (CL) is important in regulating the periodicity of the estrus cycle (Hennebold, 2018), because the establishment of gestation requires that progesterone concentrations remain elevated. This results in negative feedback in the hypothalamus and the anterior pituitary gland with inhibition of follicular development. In several species, the placenta subsequently replaces or supplements the luteal source of progesterone (Taverne & Noakes, 2019). The presence of a viable developing embryo prevents the CL from being destroyed (Pate, 2020) by the action of prostaglandin F2 and thus inhibits the return to estrus. This phenomenon was defined in 1969 as the “maternal recognition of gestation” (Short, 1969). The developing embryo eventually undergoes a process called conceptus elongation, which is a short-lived phenomenon resulting from remodeling and cellular migration of the developing embryo. Conceptus elongation begins on days 12-13 in ewes and is associated with implantation and recognition of gestation (Kasimanickam & Kasimanickam, 2020). Around day 12, the embryo’s trophoectoderm cells begin to secrete IFN, the gestation recognition factor that overrides the uterine luteolytic mechanism to ensure maintenance of a functional CL (Lonergan & Sanchez, 2020). Embryo implantation is a complex
153 Agro productividad 2021. https://doi.org/10.32854/agrop.v14i8.2039
succession of events involving the attachment, adhesion, and invasion of the blastocyst in the endometrium (Liu & Li, 2019). Understanding this issue is basic to understanding the possible causes of early gestational losses (Taverne & Noakes, 2019).
Role of Progesterone (P4) in Maternal Recognition of Gestation Progesterone (P4) is secreted by the CL and placenta (Schumacher et al., 2014), and it is necessary for the establishment, maintenance and success of gestation (Wilson & Mesiano, 2020). In the ewe it has two important functions: controlling the release of gonadotropin-releasing hormone (GnRH; Bartlewski et al., 2017) and maintaining gestation (Keller et al., 2019), because it is involved in preparing the endometrium for embryo implantation and it inhibits myometrial motility to maintain gestation (Mondal et al., 2017). P4 along with interferon tau are essential for maintening gestation (Reynolds et al., 2014) and P4 blocks the proliferative effect of estrogen and induces the expression of genes that admit for the endometrium to accept embryo attachment (Halasz & Szekeres-Bartho, 2013). High concentrations of P4 in maternal recognition of gestation have been associated with conceptus elongation and increased production of interferon tau, resulting in high gestation rates (Lonergan & Forde, 2014). And low P4 concentrations are associated with lower fertility, reduced conceptus growth and elongation, decreased IFN production and lower gestation rates (Lonergan & Sanchez, 2020).
Interferons Interferons (IFNs) are widely expressed cytokines with antiviral properties (Gonzalez-Navajas et al., 2012). Mammalian IFNs are classified into Type I, Type II and Type III (Bayer et al., 2016). Type I IFNs are a group of highly related proteins that include interferons alpha (IFN), beta (IFN), delta (IFN), epsilon (IFN), tau (IFN) and omega (IFN) (Dembic, 2015). Type II IFNs are represented by a single member, referred to as IFN gamma (IFN); and the type III class of IFNs contains three members that are known as IFN lambda (IFN1, also known as IL-29), IFN2 (also known as IL-28A) and IFN3 (also known as IL-28B) (González-Navajas et al., 2012). IFNs are elements of the immune system and serve as a response to pathogens, have a key role in reducing pathogen replication and regulating immune responses (Snell et al., 2017).
Interferon Tau (IFN) and its Involvement in Gestation Recognition Moor (1968) conducted research in ewes in which he demonstrated that the conceptus produces a protein. This protein is now known as interferon tau and is produced by its homologous gene IFN or also known as TP-1. The IFN gene interacts with uterine cells to direct the establishment and maintenance of gestation (Ealy & Wooldridge, 2017). After 1979, purification of IFN revealed its anti-luteolytic activity to prevent CL regression in sheep (Bazer & Thatcher, 2017). Originally, it was called ovine trophoblast protein (oTP-1) or trophoblastin. This substance has been shown to be a type I interferon, classified as ovine interferon tau (oIFN); (Taverne & Noakes, 2019). IFN is transiently produced by the ovine trophoectoderm, with expression being highest in the uterine epithelium between days 13 and 14 of the estrus cycle in ewes
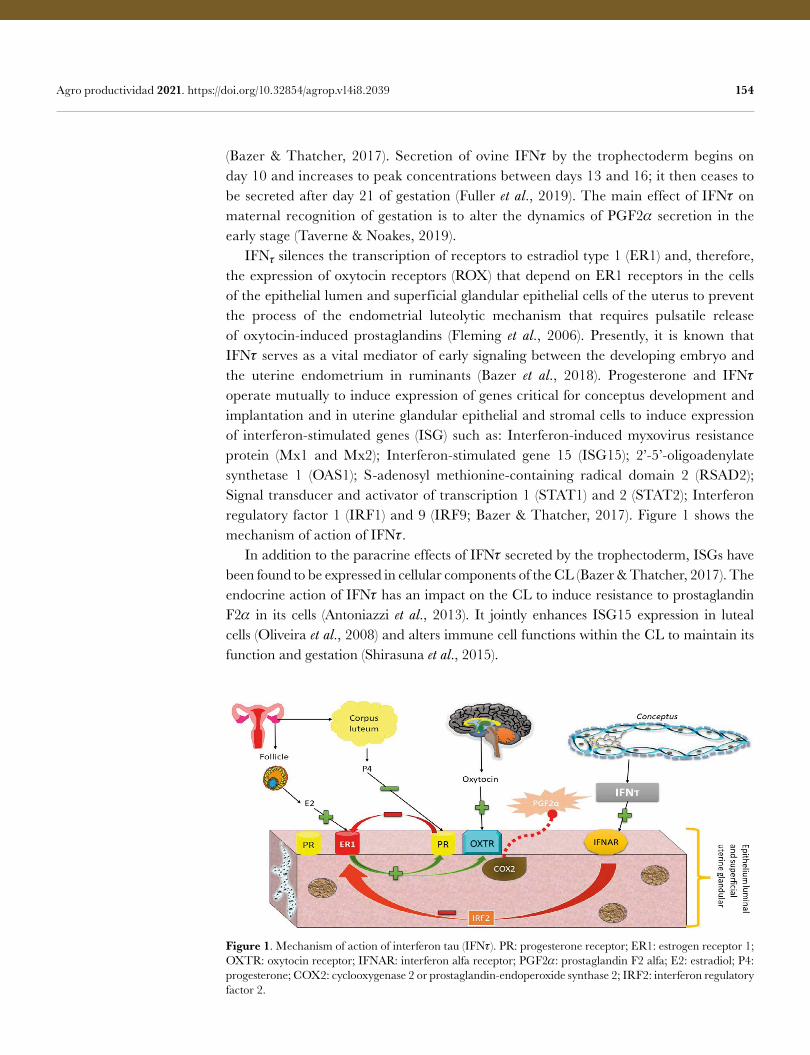
154 Agro productividad 2021. https://doi.org/10.32854/agrop.v14i8.2039
(Bazer & Thatcher, 2017). Secretion of ovine IFN by the trophectoderm begins on day 10 and increases to peak concentrations between days 13 and 16; it then ceases to be secreted after day 21 of gestation (Fuller et al., 2019). The main effect of IFN on maternal recognition of gestation is to alter the dynamics of PGF2 secretion in the early stage (Taverne & Noakes, 2019). IFNγsilences the transcription of receptors to estradiol type 1 (ER1) and, therefore, the expression of oxytocin receptors (ROX) that depend on ER1 receptors in the cells of the epithelial lumen and superficial glandular epithelial cells of the uterus to prevent the process of the endometrial luteolytic mechanism that requires pulsatile release of oxytocin-induced prostaglandins (Fleming et al., 2006). Presently, it is known that IFN serves as a vital mediator of early signaling between the developing embryo and the uterine endometrium in ruminants (Bazer et al., 2018). Progesterone and IFN operate mutually to induce expression of genes critical for conceptus development and implantation and in uterine glandular epithelial and stromal cells to induce expression of interferon-stimulated genes (ISG) such as: Interferon-induced myxovirus resistance protein (Mx1 and Mx2); Interferon-stimulated gene 15 (ISG15); 2’-5’-oligoadenylate synthetase 1 (OAS1); S-adenosyl methionine-containing radical domain 2 (RSAD2); Signal transducer and activator of transcription 1 (STAT1) and 2 (STAT2); Interferon regulatory factor 1 (IRF1) and 9 (IRF9; Bazer & Thatcher, 2017). Figure 1 shows the mechanism of action of IFN. In addition to the paracrine effects of IFN secreted by the trophectoderm, ISGs have been found to be expressed in cellular components of the CL (Bazer & Thatcher, 2017). The endocrine action of IFN has an impact on the CL to induce resistance to prostaglandin F2 in its cells (Antoniazzi et al., 2013). It jointly enhances ISG15 expression in luteal cells (Oliveira et al., 2008) and alters immune cell functions within the CL to maintain its function and gestation (Shirasuna et al., 2015).
Figure 1. Mechanism of action of interferon tau (IFN). PR: progesterone receptor; ER1: estrogen receptor 1; OXTR: oxytocin receptor; IFNAR: interferon alfa receptor; PGF2: prostaglandin F2 alfa; E2: estradiol; P4: progesterone; COX2: cyclooxygenase 2 or prostaglandin-endoperoxide synthase 2; IRF2: interferon regulatory factor 2.
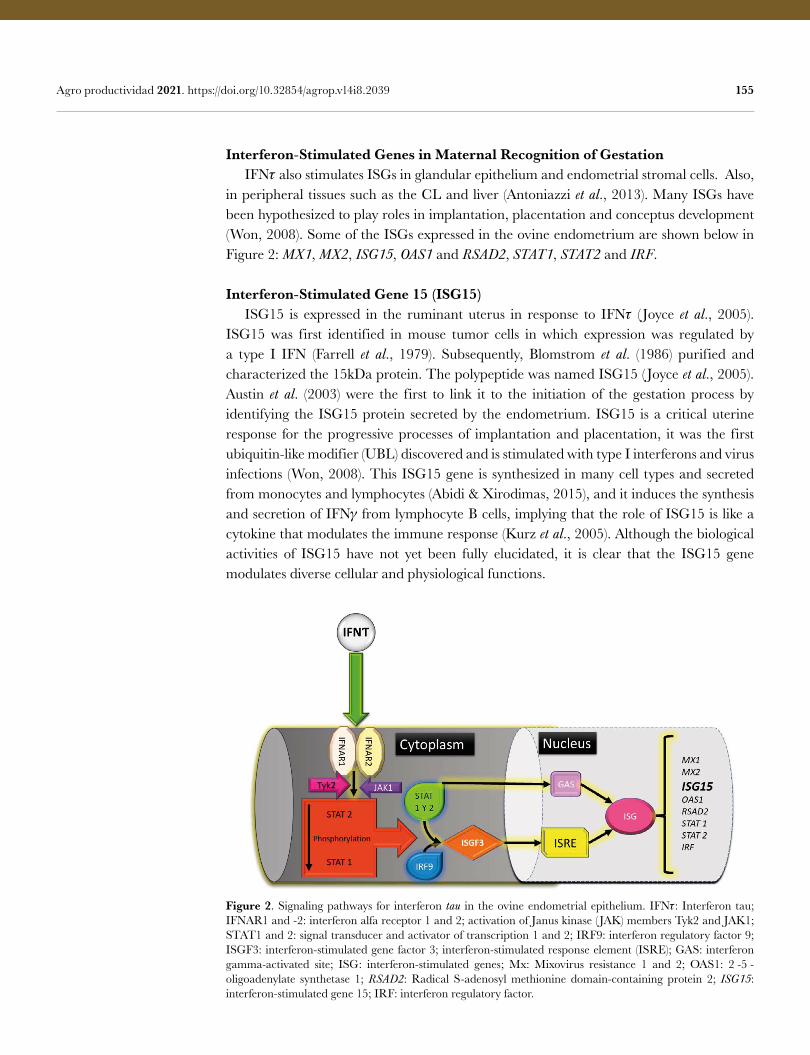
155 Agro productividad 2021. https://doi.org/10.32854/agrop.v14i8.2039
Figure 2. Signaling pathways for interferon tau in the ovine endometrial epithelium. IFN: Interferon tau; IFNAR1 and -2: interferon alfa receptor 1 and 2; activation of Janus kinase ( JAK) members Tyk2 and JAK1; STAT1 and 2: signal transducer and activator of transcription 1 and 2; IRF9: interferon regulatory factor 9; ISGF3: interferon-stimulated gene factor 3; interferon-stimulated response element (ISRE); GAS: interferon gamma-activated site; ISG: interferon-stimulated genes; Mx: Mixovirus resistance 1 and 2; OAS1: 2γ-5γ- oligoadenylate synthetase 1; RSAD2: Radical S-adenosyl methionine domain-containing protein 2; ISG15: interferon-stimulated gene 15; IRF: interferon regulatory factor.
Interferon-Stimulated Genes in Maternal Recognition of Gestation IFN also stimulates ISGs in glandular epithelium and endometrial stromal cells. Also, in peripheral tissues such as the CL and liver (Antoniazzi et al., 2013). Many ISGs have been hypothesized to play roles in implantation, placentation and conceptus development (Won, 2008). Some of the ISGs expressed in the ovine endometrium are shown below in Figure 2: MX1, MX2, ISG15, OAS1 and RSAD2, STAT1, STAT2 and IRF.
Interferon-Stimulated Gene 15 (ISG15) ISG15 is expressed in the ruminant uterus in response to IFN ( Joyce et al., 2005). ISG15 was first identified in mouse tumor cells in which expression was regulated by a type I IFN (Farrell et al., 1979). Subsequently, Blomstrom et al. (1986) purified and characterized the 15kDa protein. The polypeptide was named ISG15 (Joyce et al., 2005). Austin et al. (2003) were the first to link it to the initiation of the gestation process by identifying the ISG15 protein secreted by the endometrium. ISG15 is a critical uterine response for the progressive processes of implantation and placentation, it was the first ubiquitin-like modifier (UBL) discovered and is stimulated with type I interferons and virus infections (Won, 2008). This ISG15 gene is synthesized in many cell types and secreted from monocytes and lymphocytes (Abidi & Xirodimas, 2015), and it induces the synthesis and secretion of IFN from lymphocyte B cells, implying that the role of ISG15 is like a cytokine that modulates the immune response (Kurz et al., 2005). Although the biological activities of ISG15 have not yet been fully elucidated, it is clear that the ISG15 gene modulates diverse cellular and physiological functions.
156 Agro productividad 2021. https://doi.org/10.32854/agrop.v14i8.2039
Effect of the ISG15 Gene on Embryonic Development in Sheep The induction of ISG15 in response to IFN (Dzimianski et al., 2019) is mediated by an intracellular transduction signal system involving type I IFN receptors STAT1, STAT2 and IRF (Morales & Lenschow, 2013). It is presumed that ISG15 regulates endometrial receptivity in implantation, survival, growth and development of the conceptus (embryo and associated extraembryonic membranes; Johnson et al., 1999). There is a significant increase in ISG15 gene expression in the ovine uterus at 15 days of gestation (Guo et al., 2020). Expression of this gene has been found in parts of the stroma along the utero-placental interface in gestation. In addition, results from some studies demonstrate that ISG15-conjugated protein levels increase and then decrease during gestation (Alak et al., 2020), which indicates that it is a biologically active molecule that responds to IFN signaling from the conceptus and which temporarily targets proteins for regulation and modification associated with the gestation process ( Jain et al., 2012). Endometrial ISG15 is not simply a consequence of an antiviral state induced by high levels of IFN in the lumen of ruminants at gestational recognition, but is a uterine response to conceptus processes; development, implantation and placentation ( Joyce et al., 2005).
CONCLUSIONS The IFN gene acts via paracrine in the endometrium and endocrine in the CL to exert its anti-luteolytic effects; this triggers progesterone production to be maintained and maternal recognition of gestation to occur. High concentrations of P4 in maternal recognition of gestation have been associated with lengthening of the conceptus and an increase in IFN production and higher gestation rates. IFN induces positive regulation of several ISG genes including the ISG15 gene, which is involved in maternal immunoregulation and other functions in early gestation in the ewe, such as regulation of endometrial receptivity during implantation.
ACKNOWLEDGMENTS To the National Council for Science and Technology (Consejo Nacional de Ciencia y Tecnología, CONACyT)
for funding the doctoral studies of the first author and to Colegio de Postgraduados for funding the research.
REFERENCESAbidi, N., Xirodimas, D. P. (2015). Regulation of cancer-related pathways by protein NEDDylation and
strategies for the use of NEDD8 inhibitors in the clinic. Endocrine-Related Cancer, 22(1), T55-70. Doi: 10.1530/ERC-14-0315
Alak, I., Hitit, M., Kose, M., Kaya, M. S., Ucar, E. H., Atli, Z., Atli, M. O. (2020). Relative abundance and localization of interferon-stimulated gene 15 mRNA transcript in intra- and extra-uterine tissues during the early stages of pregnancy in sheep. Animal Reproduction Science, 216, 106347. Doi: 10.1016/j.anireprosci.2020.106347
Antoniazzi, A. Q., Webb, B. T., Romero, J. J., Ashley, R. L., Smirnova, N. P., Henkes, L. E., Bott, R. C., Oliveira, J. F., Niswender, G. D., Bazer, F. W., Hansen, T. R. (2013). Endocrine Delivery of Interferon Tau Protects the Corpus Luteum from Prostaglandin F2 Alpha-Induced Luteolysis in Ewes. Biology of Reproduction, 88(6), 144. Doi: 10.1095/biolreprod.112.105684
Austin, K. J., Bany, B. M., Belden, E. L., Rempel, L. A., Cross, J. C., Hansen, T. R. (2003). Interferon-stimulated gene-15 (Isg15) expression is up-regulated in the mouse uterus in response to the implanting conceptus. Endocrinology, 144(7), 3107-3113. Doi:10.1210/en.2002-0031
157 Agro productividad 2021. https://doi.org/10.32854/agrop.v14i8.2039
Bartlewski, P. M., Sohal, J., Paravinja, V., Baby, T., Oliveira, M. E. F., Murawski, M., Schwarz, T., Zieba, D. A., Keisler, D. H. (2017). Is progesterone the key regulatory factor behind ovulation rate in sheep? Domestic Animal Endocrinology, 58, 30–38. Doi: 10.1016/j.domaniend.2016.06.006
Bayer, A., Lennemann, N. J., Ouyang, Y., Bramley, J. C., Morosky, S., Marques, E. T. D. A., Cherry, S., Sadovsky, Y., Coyne, C. B. (2016). Type III Interferons Produced by Human Placental Trophoblasts Confer Protection against Zika Virus Infection. Cell Host & Microbe, 19(5), 705–712. Doi: 10.1016/j.chom.2016.03.008
Bazer, F. W., Burghardt, R. C., Johnson, G. A., Spencer, T. E., Wu, G. (2018). Mechanisms for the establishment and maintenance of pregnancy: Synergies from scientific collaborations†. Biology of Reproduction, 99(1), 225–241. Doi: 10.1093/biolre/ioy047
Bazer, F. W., Thatcher, W. W. (2017). Chronicling the discovery of interferon tau. Reproduction, 154(5), F11–F20. Doi: 10.1530/REP-17-0257
Blomstrom, D. C., Fahey, D., Kutny, R., Korant, B. D., Knight, E. (1986). Molecular characterization of the interferon-induced 15-kDa protein. Molecular cloning and nucleotide and amino acid sequence. Journal of Biological Chemistry, 261(19), 8811–8816. Doi: 10.1016/S0021-9258(19)84453-8
Dembic, Z. (2015). Cytokines of the Immune System. In: The Cytokines of the Immune System (pp. 123–142). Elsevier. Doi: 10.1016/B978-0-12-419998-9.00005-5
D’Occhio, M. J., Campanile, G., Baruselli, P. S. (2020). Transforming growth factor-γ superfamily and interferon-γ in ovarian function and embryo development in female cattle: Review of biology and application. Reproduction, Fertility and Development, 32(6), 539-552. Doi: 10.1071/RD19123
Dzimianski, J. V., Scholte, F. E. M., Bergeron, É., Pegan, S. D. (2019). ISG15: It’s Complicated. Journal of Molecular Biology, 431(21), 4203–4216. Doi: 10.1016/j.jmb.2019.03.013
Ealy, A. D., Wooldridge, L. K. (2017). The evolution of interferon-tau. Reproduction, 154(5), F1–F10. Doi: 10.1530/REP-17-0292
Farrell, P. J., Broeze, R. J., Lengyel, P. (1979). Accumulation of an mRNA and protein in interferon-treated Ehrlich ascites tumour cells. Nature, 279(5713), 523-525. Doi: 10.1038/279523a0
Fleming, J. G. W., Spencer, T. E., Safe, S. H., Bazer, F. W. (2006). Estrogen Regulates Transcription of the Ovine Oxytocin Receptor Gene through GC-Rich SP1 Promoter Elements. Endocrinology, 147(2), 899-911. Doi: 10.1210/en.2005-1120
Fuller, W. B., Jinyoung, K. J., Gwonhwa, S. G., Hakhyun, K. H., Guoyao, W. G., Johnson, G. A., Vallet, J. L. (2019). Roles of selected nutrients in development of the porcine conceptus during pregnancy. Bioscientifica Proceedings. Doi: 10.1530/biosciprocs.19.0016
González-Navajas, J. M., Lee, J., David, M., Raz, E. (2012). Immunomodulatory functions of type I interferons. Nature Reviews Immunology, 12(2), 125-135. Doi: 10.1038/nri3133
Guo, Y., Song, Z., Cheng, X., Wang, Y., Luo, X., An, R., Wang, J., Gao, M. (2020). Molecular and functional characterization of ovis aries IFN-epsilon. Molecular Immunology, 119, 1–7. Doi: 10.1016/j.molimm.2020.01.001
Halasz, M., Szekeres-Bartho, J. (2013). The role of progesterone in implantation and trophoblast invasion. Journal of Reproductive Immunology, 97(1), 43-50. Doi: 10.1016/j.jri.2012.10.011
Jain, A., Baviskar, P. S., Kandasamy, S., Kumar, R., Singh, R., Kumar, S., Agarwal, S. K., Joshi, P., Mitra, A. (2012). Interferon stimulated gene 15 (ISG15): Molecular characterization and expression profile in endometrium of buffalo (Bubalus bubalis). Animal Reproduction Science, 133(3–4), 159–168. Doi: 10.1016/j.anireprosci.2012.06.023
Johnson, G. A., Spencer, T. E., Hansen, T. R., Austin, K. J., Burghardt, R. C., Bazer, F. W. (1999). Expression of the Interferon Tau Inducible Ubiquitin Cross-Reactive Protein in the Ovine Uterus. Biology of Reproduction, 61(1), 312–318. Doi: 10.1095/biolreprod61.1.312
Joyce, M. M., White, F. J., Burghardt, R. C., Muñiz, J. J., Spencer, T. E., Bazer, F. W., Johnson, G. A. (2005). Interferon Stimulated Gene 15 Conjugates to Endometrial Cytosolic Proteins and Is Expressed at the Uterine-Placental Interface throughout Pregnancy in Sheep. Endocrinology, 146(2), 675–684. Doi: 10.1210/en.2004-1224
Kasimanickam, R. K., Kasimanickam, V. R. (2020). IFNT, ISGs, PPARs, RXRs and MUC1 in day 16 embryo and endometrium of repeat-breeder cows, with or without subclinical endometritis. Theriogenology, 158, 39–49. Doi: 10.1016/j.theriogenology.2020.09.001
Keller, M., Vandenberg, L. N., Charlier, T. D. (2019). The parental brain and behavior: A target for endocrine disruption. Frontiers in Neuroendocrinology, 54, 100765. Doi: 10.1016/j.yfrne.2019.100765
Kurz, T., Ozlü, N., Rudolf, F., O’Rourke, S. M., Luke, B., Hofmann, K., Hyman, A. A., Bowerman, B., Peter, M. (2005). The conserved protein DCN-1/Dcn1p is required for cullin neddylation in C. elegans and S. cerevisiae. Nature, 435(7046), 1257–1261. Doi: 10.1038/nature03662
158 Agro productividad 2021. https://doi.org/10.32854/agrop.v14i8.2039
Liu, F., Li, R. (2019). The Role of Neuroendocrine in Embryo Implantation. En B. Wu & H. L. Feng (Eds.), Embryology—Theory and Practice. IntechOpen. Doi: 10.5772/intechopen.87863
Lonergan, P., Forde, N. (2014). Maternal-embryo interaction leading up to the initiation of implantation of pregnancy in cattle. Animal: An International Journal of Animal Bioscience, 8 Suppl 1, 64–69. Doi: 10.1017/S1751731114000470
Lonergan, P., Sánchez, J. M. (2020). Symposium review: Progesterone effects on early embryo development in cattle. Journal of Dairy Science, 103(9), 8698–8707. Doi: 10.3168/jds.2020-18583
Lonergan, Pat, Forde, N., Spencer, T. (2016). Role of progesterone in embryo development in cattle. Reproduction, Fertility, and Development, 28(2), 66–74. Doi: 10.1071/RD15326
Miller, P. B., Parnell, B. A., Bushnell, G., Tallman, N., Forstein, D. A., Higdon, H. L., Kitawaki, J., Lessey, B. A. (2012). Endometrial receptivity defects during IVF cycles with and without letrozole. Human Reproduction, 27(3), 881–888. Doi: 10.1093/humrep/der452
Mondal, S., Mor, A., Reddy, I. J. (2017). Factors/Genes in Maternal Recognition of Pregnancy. In: Current Developments in Biotechnology and Bioengineering (pp. 597–630). Elsevier.Doi: 10.1016/B978-0-444-63660-7.00023-1
Moor, R. M. (1968). Effect of Embryo on Corpus Luteum Function. Journal of Animal Science, 27, 97-118. Doi: 10.2527/animalsci1968.27Supplement_197x
Morales, D. J., Lenschow, D. J. (2013). The Antiviral Activities of ISG15. Journal of Molecular Biology, 425(24), 4995–5008. Doi: 10.1016/j.jmb.2013.09.041
Nakamura, K., Kusama, K., Suda, Y., Fujiwara, H., Hori, M., Imakawa, K. (2020). Emerging Role of Extracellular Vesicles in Embryo–Maternal Communication throughout Implantation Processes. International Journal of Molecular Sciences, 21(15), 5523. Doi: 10.3390/ijms21155523
Oliveira, J. F., Henkes, L. E., Ashley, R. L., Purcell, S. H., Smirnova, N. P., Veeramachaneni, D. N. R., Anthony, R. V., & Hansen, T. R. (2008). Expression of Interferon (IFN)-Stimulated Genes in Extrauterine Tissues during Early Pregnancy in Sheep Is the Consequence of Endocrine IFN-γ Release from the Uterine Vein. Endocrinology, 149(3), 1252–1259. Doi: 10.1210/en.2007-0863
Pate, J. L. (2020). Roadmap to pregnancy during the period of maternal recognition in the cow: Changes within the corpus luteum associated with luteal rescue. Theriogenology, 150, 294-301. Doi: 10.1016/j.theriogenology.2020.01.074
Reynolds, L. P., Borowicz, P. P., Palmieri, C., Grazul-Bilska, A. T. (2014). Placental Vascular Defects in Compromised Pregnancies: Effects of Assisted Reproductive Technologies and Other Maternal Stressors. In: L. Zhang & C. A. Ducsay (Eds.), Advances in Fetal and Neonatal Physiology, 814, 193-204. Springer New York. Doi: 10.1007/978-1-4939-1031-1_17
Schumacher, M., Mattern, C., Ghoumari, A., Oudinet, J. P., Liere, P., Labombarda, F., Sitruk-Ware, R., De Nicola, A. F., Guennoun, R. (2014). Revisiting the roles of progesterone and allopregnanolone in the nervous system: Resurgence of the progesterone receptors. Progress in Neurobiology, 113, 6–39. Doi: 10.1016/j.pneurobio.2013.09.004
Shirasuna, K., Matsumoto, H., Matsuyama, S., Kimura, K., Bollwein, H., & Miyamoto, A. (2015). Possible role of interferon tau on the bovine corpus luteum and neutrophils during the early pregnancy. Reproduction, 150(3), 217-225. Doi: 10.1530/REP-15-0085
Short, R. V. (1969). Implantation and the Maternal Recognition of Pregnancy. In: G. E. W. Wolstenholme & M. O’Connor (Eds.), Novartis Foundation Symposia (pp. 2–31). John Wiley & Sons, Ltd. Doi: /10.1002/9780470719688.ch2
Snell, L. M., McGaha, T. L., Brooks, D. G. (2017). Type I Interferon in Chronic Virus Infection and Cancer. Trends in Immunology, 38(8), 542-557. Doi: 10.1016/j.it.2017.05.005
Taverne, M., & Noakes, D. E. (2019). Pregnancy and Its Diagnosis. In: Veterinary Reproduction and Obstetrics, 78-114. Elsevier. Doi: 10.1016/B978-0-7020-7233-8.00005-7
Wang, W., Xu, L., Su, J., Peppelenbosch, M. P., & Pan, Q. (2017). Transcriptional Regulation of Antiviral Interferon-Stimulated Genes. Trends in Microbiology, 25(7), 573–584. Doi: 10.1016/j.tim.2017.01.001
Wilson, R. A., & Mesiano, S. A. (2020). Progesterone signaling in myometrial cells: Role in human pregnancy and parturition. Current Opinion in Physiology, 13, 117-122. Doi: 10.1016/j.cophys.2019.09.007
Won A. H. (2008). Progesterone and interferon tau regulated genes in the endometrium of the ovine uterus and expression of interferon stimulated genes in the corpus luteum during early pregnancy in sheep. These of Master of Science. Texas A&M University College Station.
Zohni, K. M., Gat, I., & Librach, C. (2016). Recurrent implantation failure: A comprehensive review. Minerva Ginecologica, 68(6), 653–667.
Colegio dePostgraduados
159
Resistance inducers and organic fertilizer in Citrus sinensis [L.] Osbeck infected with Candidatus Liberibacter asiaticus bacteria Zapata-Contreras, Yazmin G.1; Osorio-Hernández, Eduardo1*; Silva-Espinosa, José H.1;
Saénz-Pérez, Criseida A.1; Segura-Martínez, Ma. T.1
1 División de Estudios de Postgrado e Investigación-Facultad de Ingeniería y Ciencias-Universidad Autónoma de Tamaulipas. Centro Universitario Adolfo López Mateos, Cd. Victoria, Tamaulipas, México. C.P. 87000 Tel. 834 3181721, ext. 2111.
* Corresponding author: [email protected]
ABSTRACT Objective: To evaluate the effect of three resistance inducers and an organic fertilizer on the titles of Candidatus Liberibacter asiaticus in Citrus sinensis (L.) Obseck cv. Valencia. Design/methodology/approach: The treatments consisted of Vacciplant Max and UPL-08, Fosetil aluminum. Likewise, BIO-FOM was applied on the periphery of the trees, with moisture for nutrients absorption. The evaluated variables were fruit weight, equatorial diameter, skin thickness, °BRIX, severity and chlorophyll, in each of the five treatments, which consisted of 20 repetitions. Results: The fruits of the trees treated with Vacciplant Max had lower skin thickness and a higher °BRIX. Also, the highest chlorophyll index was recorded with BIO-FOM fertilizer. However, none of the evaluated treatments significantly decreased the fruit harshness.Findings/conclusions: The best treatment against Huanglongbing was fosetyl aluminum which conferred greater fruit weight and diameter.
Keywords: Nutrients; Huanglongbing; Inductors; Citrus; Dhiaphorina Citri.
INTRODUCTION Citrus fruits are grown in tropical and subtropical regions of the world (Spreen, 2020) due to their high vitamin C content. At the same time, it provides multiple benefits to human health and is also used as a raw material in various agro-industrial processes
(Sharif, 2018). Overall, México’s citrus production is in fourth worldwide (Hernández et al., 2019) with a 590,000 ha cultivated
area and an 8 million tons production (Sáenz et al., 2019). The most important citrus species are sweet orange, lemon
in all its species, mandarin and grapefruit (Hernández et al., 2019). In this regard, it should be noted that, worldwide, the most devastating disease for citrus fruits is Huanglongbing (Garza-Saldaña et al., 2017). These disease symptoms are associated with the presence of
the Gram-negative -proteobacterium Candidatus Liberibacter asiaticus, spread by the insect vector
Citation: Zapata-Contreras, Yazmin G., Osorio-Hernández, Eduardo, Silva-Espinosa, José H., Saénz-Pérez, Criseida A., Segura-Martínez, Ma. T., (2021). Resistance inducers and organic fertilizer in Citrus sinensis [L.] Osbeck infected with Candidatus Liberibacter asiaticus bacteria. Agro Productividad. https://doi.org/10.32854/agrop.v14i8.1945
Editor in Chief: Dr. Jorge Cadena Iñiguez
Received: March, 2021.Accepted: July, 2021.
Agro Productividad, 14(8). August. 2021. pp: 159-165.
This work is licensed under a Creative Commons Attribution-Non-Commercial 4.0 International license.
Image by WikimediaImages at Pixabay
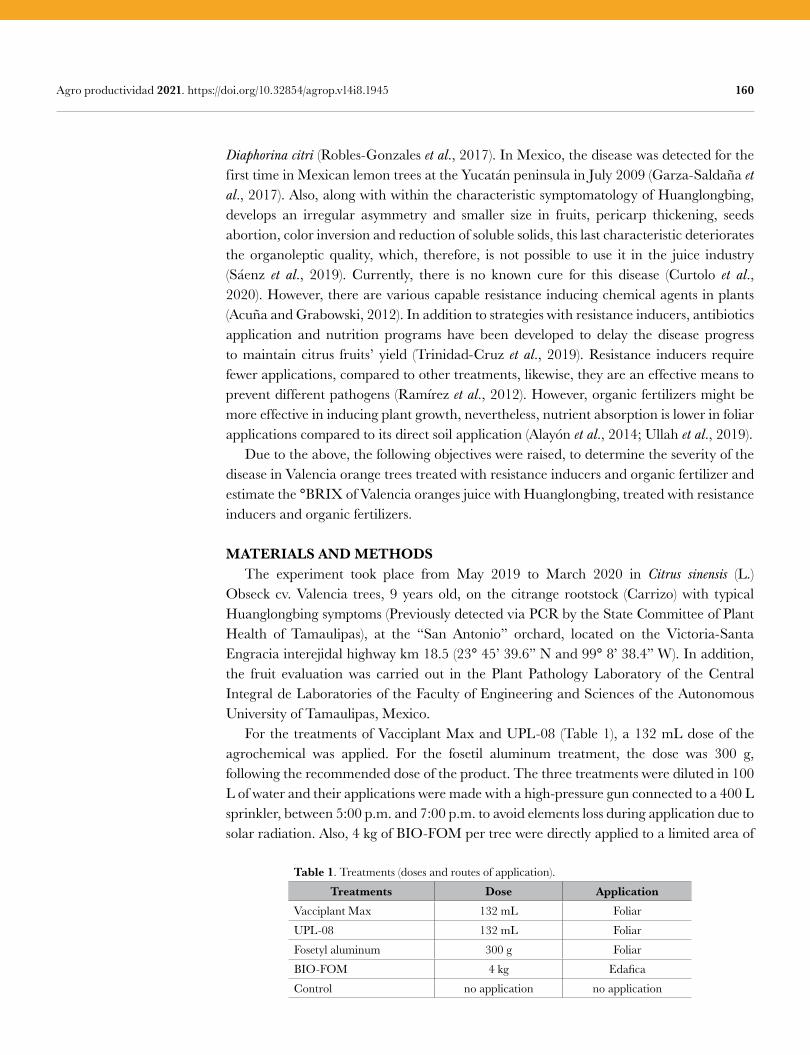
160 Agro productividad 2021. https://doi.org/10.32854/agrop.v14i8.1945
Diaphorina citri (Robles-Gonzales et al., 2017). In Mexico, the disease was detected for the first time in Mexican lemon trees at the Yucatán peninsula in July 2009 (Garza-Saldaña et al., 2017). Also, along with within the characteristic symptomatology of Huanglongbing, develops an irregular asymmetry and smaller size in fruits, pericarp thickening, seeds abortion, color inversion and reduction of soluble solids, this last characteristic deteriorates the organoleptic quality, which, therefore, is not possible to use it in the juice industry (Sáenz et al., 2019). Currently, there is no known cure for this disease (Curtolo et al., 2020). However, there are various capable resistance inducing chemical agents in plants (Acuña and Grabowski, 2012). In addition to strategies with resistance inducers, antibiotics application and nutrition programs have been developed to delay the disease progress to maintain citrus fruitsʼ yield (Trinidad-Cruz et al., 2019). Resistance inducers require fewer applications, compared to other treatments, likewise, they are an effective means to prevent different pathogens (Ramírez et al., 2012). However, organic fertilizers might be more effective in inducing plant growth, nevertheless, nutrient absorption is lower in foliar applications compared to its direct soil application (Alayón et al., 2014; Ullah et al., 2019). Due to the above, the following objectives were raised, to determine the severity of the disease in Valencia orange trees treated with resistance inducers and organic fertilizer and estimate the °BRIX of Valencia oranges juice with Huanglongbing, treated with resistance inducers and organic fertilizers.
MATERIALS AND METHODS The experiment took place from May 2019 to March 2020 in Citrus sinensis (L.) Obseck cv. Valencia trees, 9 years old, on the citrange rootstock (Carrizo) with typical Huanglongbing symptoms (Previously detected via PCR by the State Committee of Plant Health of Tamaulipas), at the “San Antonio” orchard, located on the Victoria-Santa Engracia interejidal highway km 18.5 (23° 45’ 39.6’’ N and 99° 8’ 38.4’’ W). In addition, the fruit evaluation was carried out in the Plant Pathology Laboratory of the Central Integral de Laboratories of the Faculty of Engineering and Sciences of the Autonomous University of Tamaulipas, Mexico. For the treatments of Vacciplant Max and UPL-08 (Table 1), a 132 mL dose of the agrochemical was applied. For the fosetil aluminum treatment, the dose was 300 g, following the recommended dose of the product. The three treatments were diluted in 100 L of water and their applications were made with a high-pressure gun connected to a 400 L sprinkler, between 5:00 p.m. and 7:00 p.m. to avoid elements loss during application due to solar radiation. Also, 4 kg of BIO-FOM per tree were directly applied to a limited area of
Table 1. Treatments (doses and routes of application).
Treatments Dose ApplicationVacciplant Max 132 mL Foliar
UPL-08 132 mL Foliar
Fosetyl aluminum 300 g Foliar
BIO-FOM 4 kg Edafica
Control no application no application
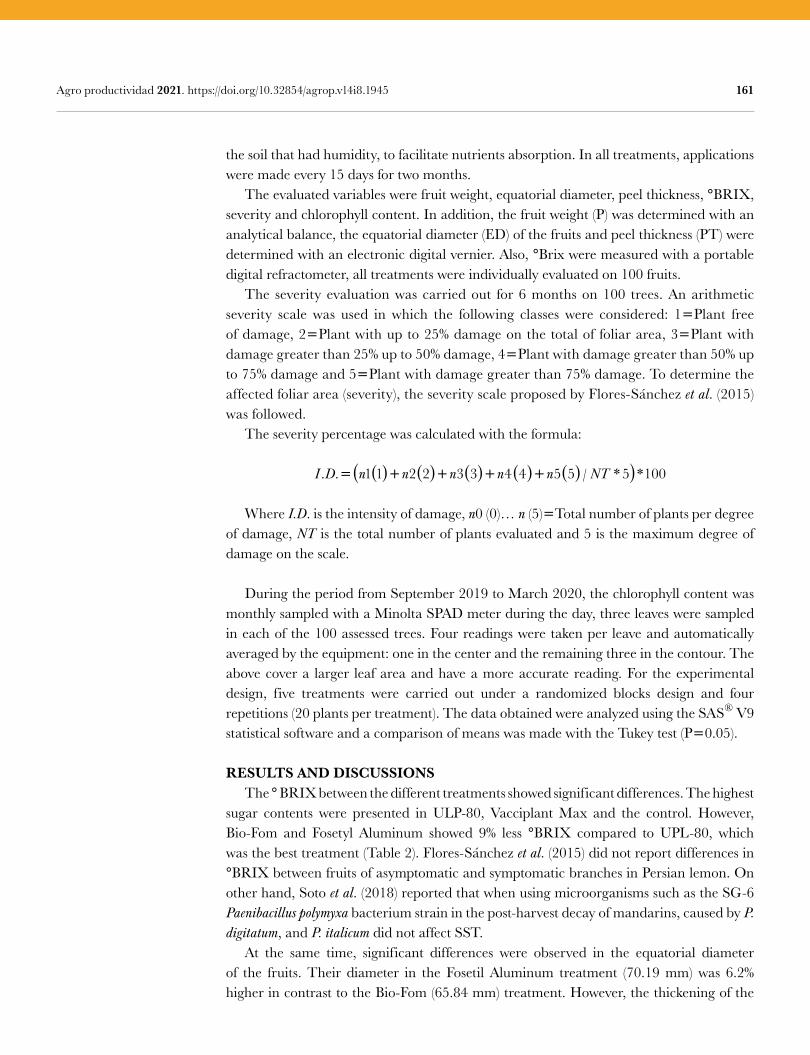
161 Agro productividad 2021. https://doi.org/10.32854/agrop.v14i8.1945
the soil that had humidity, to facilitate nutrients absorption. In all treatments, applications were made every 15 days for two months. The evaluated variables were fruit weight, equatorial diameter, peel thickness, °BRIX, severity and chlorophyll content. In addition, the fruit weight (P) was determined with an analytical balance, the equatorial diameter (ED) of the fruits and peel thickness (PT) were determined with an electronic digital vernier. Also, °Brix were measured with a portable digital refractometer, all treatments were individually evaluated on 100 fruits. The severity evaluation was carried out for 6 months on 100 trees. An arithmetic severity scale was used in which the following classes were considered: 1Plant free of damage, 2Plant with up to 25% damage on the total of foliar area, 3Plant with damage greater than 25% up to 50% damage, 4Plant with damage greater than 50% up to 75% damage and 5Plant with damage greater than 75% damage. To determine the affected foliar area (severity), the severity scale proposed by Flores-Sánchez et al. (2015) was followed. The severity percentage was calculated with the formula:
I D n n n n n NT. . / * *= ( )+ ( )+ ( )+ ( )+ ( )( )1 1 2 2 3 3 4 4 5 5 5 100
Where I.D. is the intensity of damage, n0 (0)… n (5)Total number of plants per degree of damage, NT is the total number of plants evaluated and 5 is the maximum degree of damage on the scale.
During the period from September 2019 to March 2020, the chlorophyll content was monthly sampled with a Minolta SPAD meter during the day, three leaves were sampled in each of the 100 assessed trees. Four readings were taken per leave and automatically averaged by the equipment: one in the center and the remaining three in the contour. The above cover a larger leaf area and have a more accurate reading. For the experimental design, five treatments were carried out under a randomized blocks design and four repetitions (20 plants per treatment). The data obtained were analyzed using the SAS® V9 statistical software and a comparison of means was made with the Tukey test (P0.05).
RESULTS AND DISCUSSIONS The ° BRIX between the different treatments showed significant differences. The highest sugar contents were presented in ULP-80, Vacciplant Max and the control. However, Bio-Fom and Fosetyl Aluminum showed 9% less °BRIX compared to UPL-80, which was the best treatment (Table 2). Flores-Sánchez et al. (2015) did not report differences in °BRIX between fruits of asymptomatic and symptomatic branches in Persian lemon. On other hand, Soto et al. (2018) reported that when using microorganisms such as the SG-6 Paenibacillus polymyxa bacterium strain in the post-harvest decay of mandarins, caused by P. digitatum, and P. italicum did not affect SST. At the same time, significant differences were observed in the equatorial diameter of the fruits. Their diameter in the Fosetil Aluminum treatment (70.19 mm) was 6.2% higher in contrast to the Bio-Fom (65.84 mm) treatment. However, the thickening of the
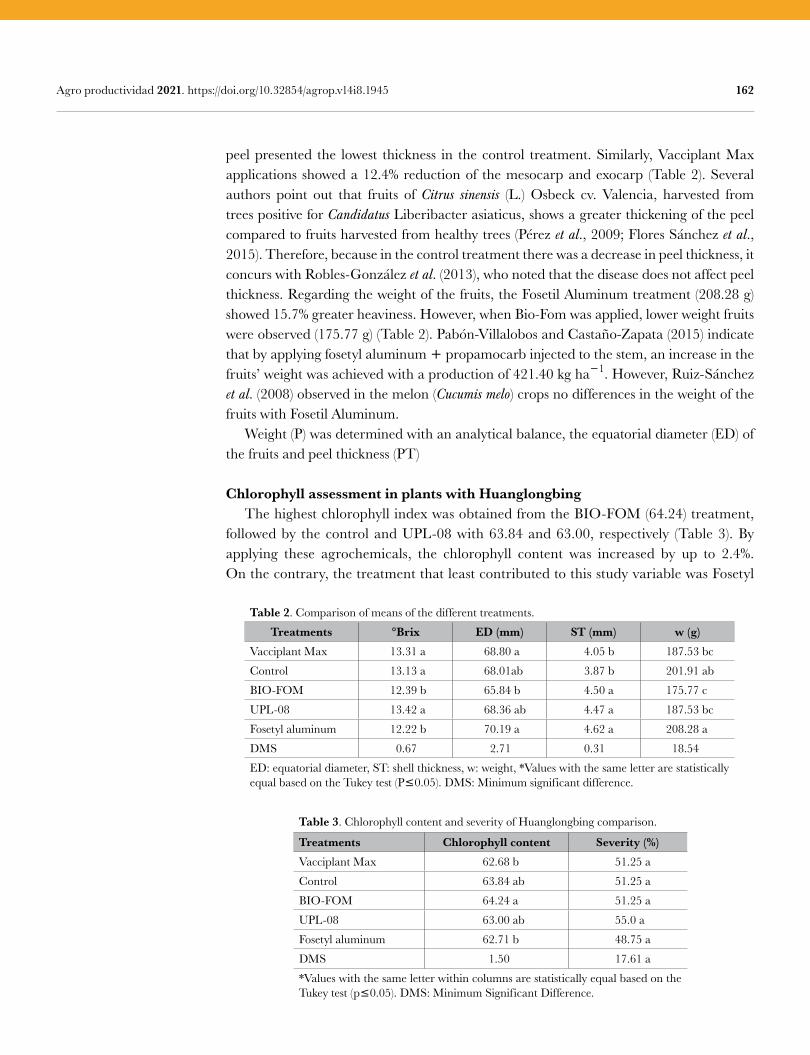
162 Agro productividad 2021. https://doi.org/10.32854/agrop.v14i8.1945
peel presented the lowest thickness in the control treatment. Similarly, Vacciplant Max applications showed a 12.4% reduction of the mesocarp and exocarp (Table 2). Several authors point out that fruits of Citrus sinensis (L.) Osbeck cv. Valencia, harvested from trees positive for Candidatus Liberibacter asiaticus, shows a greater thickening of the peel compared to fruits harvested from healthy trees (Pérez et al., 2009; Flores Sánchez et al., 2015). Therefore, because in the control treatment there was a decrease in peel thickness, it concurs with Robles-González et al. (2013), who noted that the disease does not affect peel thickness. Regarding the weight of the fruits, the Fosetil Aluminum treatment (208.28 g) showed 15.7% greater heaviness. However, when Bio-Fom was applied, lower weight fruits were observed (175.77 g) (Table 2). Pabón-Villalobos and Castaño-Zapata (2015) indicate that by applying fosetyl aluminum propamocarb injected to the stem, an increase in the fruitsʼ weight was achieved with a production of 421.40 kg ha1. However, Ruiz-Sánchez et al. (2008) observed in the melon (Cucumis melo) crops no differences in the weight of the fruits with Fosetil Aluminum. Weight (P) was determined with an analytical balance, the equatorial diameter (ED) of the fruits and peel thickness (PT)
Chlorophyll assessment in plants with Huanglongbing The highest chlorophyll index was obtained from the BIO-FOM (64.24) treatment, followed by the control and UPL-08 with 63.84 and 63.00, respectively (Table 3). By applying these agrochemicals, the chlorophyll content was increased by up to 2.4%. On the contrary, the treatment that least contributed to this study variable was Fosetyl
Table 2. Comparison of means of the different treatments.
Treatments °Brix ED (mm) ST (mm) w (g)Vacciplant Max 13.31 a 68.80 a 4.05 b 187.53 bc
Control 13.13 a 68.01ab 3.87 b 201.91 ab
BIO-FOM 12.39 b 65.84 b 4.50 a 175.77 c
UPL-08 13.42 a 68.36 ab 4.47 a 187.53 bc
Fosetyl aluminum 12.22 b 70.19 a 4.62 a 208.28 a
DMS 0.67 2.71 0.31 18.54
ED: equatorial diameter, ST: shell thickness, w: weight, *Values with the same letter are statistically equal based on the Tukey test (P0.05). DMS: Minimum significant difference.
Table 3. Chlorophyll content and severity of Huanglongbing comparison.
Treatments Chlorophyll content Severity (%)Vacciplant Max 62.68 b 51.25 a
Control 63.84 ab 51.25 a
BIO-FOM 64.24 a 51.25 a
UPL-08 63.00 ab 55.0 a
Fosetyl aluminum 62.71 b 48.75 a
DMS 1.50 17.61 a
*Values with the same letter within columns are statistically equal based on the Tukey test (p0.05). DMS: Minimum Significant Difference.
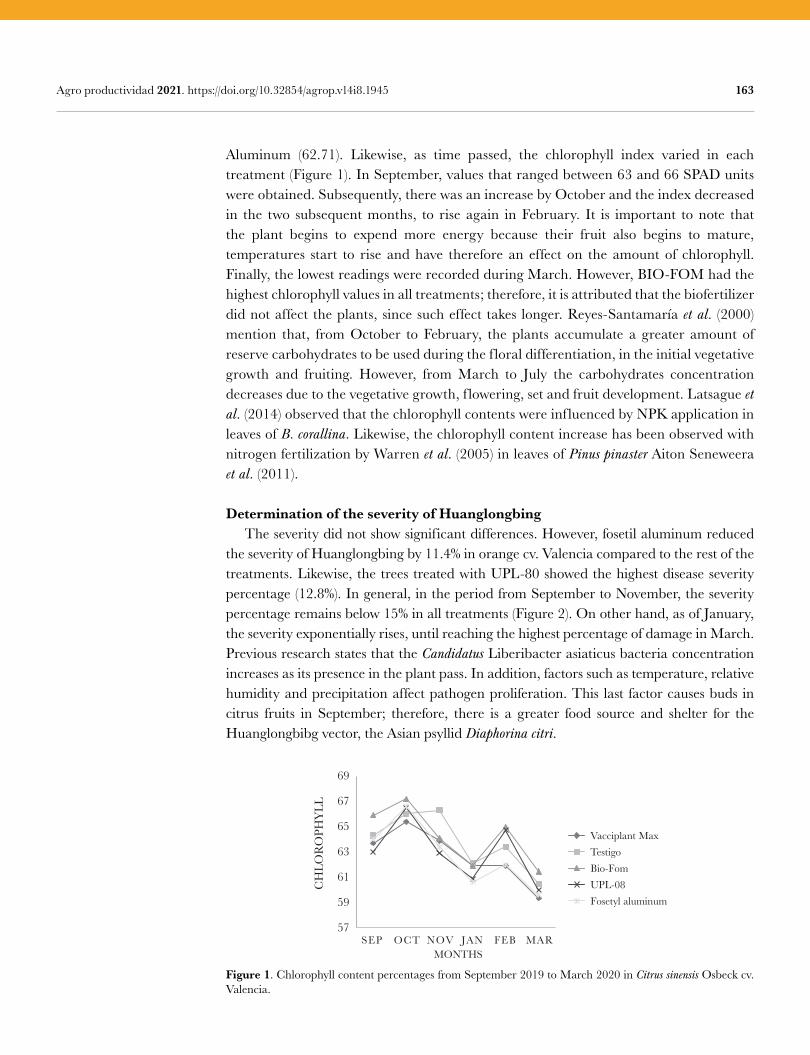
163 Agro productividad 2021. https://doi.org/10.32854/agrop.v14i8.1945
Aluminum (62.71). Likewise, as time passed, the chlorophyll index varied in each treatment (Figure 1). In September, values that ranged between 63 and 66 SPAD units were obtained. Subsequently, there was an increase by October and the index decreased in the two subsequent months, to rise again in February. It is important to note that the plant begins to expend more energy because their fruit also begins to mature, temperatures start to rise and have therefore an effect on the amount of chlorophyll. Finally, the lowest readings were recorded during March. However, BIO-FOM had the highest chlorophyll values in all treatments; therefore, it is attributed that the biofertilizer did not affect the plants, since such effect takes longer. Reyes-Santamaría et al. (2000) mention that, from October to February, the plants accumulate a greater amount of reserve carbohydrates to be used during the f loral differentiation, in the initial vegetative growth and fruiting. However, from March to July the carbohydrates concentration decreases due to the vegetative growth, f lowering, set and fruit development. Latsague et al. (2014) observed that the chlorophyll contents were inf luenced by NPK application in leaves of B. corallina. Likewise, the chlorophyll content increase has been observed with nitrogen fertilization by Warren et al. (2005) in leaves of Pinus pinaster Aiton Seneweera et al. (2011).
Determination of the severity of Huanglongbing The severity did not show significant differences. However, fosetil aluminum reduced the severity of Huanglongbing by 11.4% in orange cv. Valencia compared to the rest of the treatments. Likewise, the trees treated with UPL-80 showed the highest disease severity percentage (12.8%). In general, in the period from September to November, the severity percentage remains below 15% in all treatments (Figure 2). On other hand, as of January, the severity exponentially rises, until reaching the highest percentage of damage in March. Previous research states that the Candidatus Liberibacter asiaticus bacteria concentration increases as its presence in the plant pass. In addition, factors such as temperature, relative humidity and precipitation affect pathogen proliferation. This last factor causes buds in citrus fruits in September; therefore, there is a greater food source and shelter for the Huanglongbibg vector, the Asian psyllid Diaphorina citri.
57
59
61
63
65
67
69
SEP OCT NOV JAN FEB MAR
CH
LOR
OPH
YLL
MONTHS
Vacciplant MaxTestigoBio-FomUPL-08Fosetyl aluminum
Figure 1. Chlorophyll content percentages from September 2019 to March 2020 in Citrus sinensis Osbeck cv. Valencia.
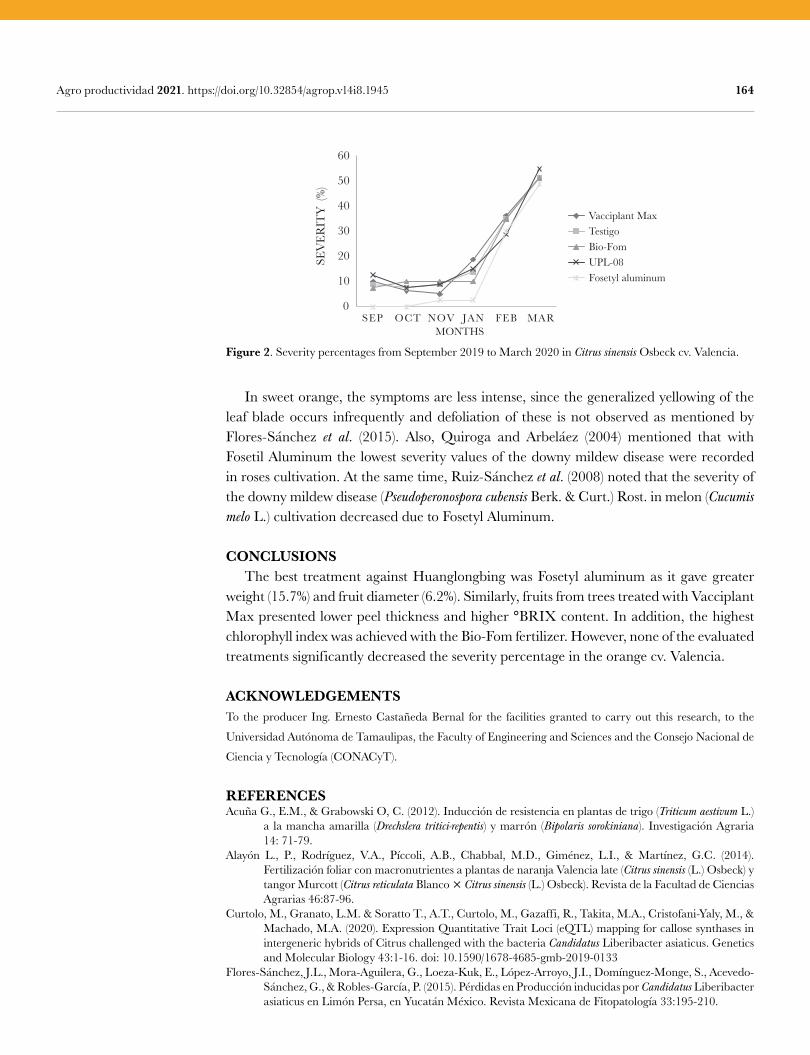
164 Agro productividad 2021. https://doi.org/10.32854/agrop.v14i8.1945
Figure 2. Severity percentages from September 2019 to March 2020 in Citrus sinensis Osbeck cv. Valencia.
0
10
20
30
40
50
60
SEP OCT NOV JAN FEB MARSE
VER
ITY
(%)
MONTHS
Vacciplant MaxTestigoBio-FomUPL-08Fosetyl aluminum
In sweet orange, the symptoms are less intense, since the generalized yellowing of the leaf blade occurs infrequently and defoliation of these is not observed as mentioned by Flores-Sánchez et al. (2015). Also, Quiroga and Arbeláez (2004) mentioned that with Fosetil Aluminum the lowest severity values of the downy mildew disease were recorded in roses cultivation. At the same time, Ruiz-Sánchez et al. (2008) noted that the severity of the downy mildew disease (Pseudoperonospora cubensis Berk. & Curt.) Rost. in melon (Cucumis melo L.) cultivation decreased due to Fosetyl Aluminum.
CONCLUSIONS The best treatment against Huanglongbing was Fosetyl aluminum as it gave greater weight (15.7%) and fruit diameter (6.2%). Similarly, fruits from trees treated with Vacciplant Max presented lower peel thickness and higher °BRIX content. In addition, the highest chlorophyll index was achieved with the Bio-Fom fertilizer. However, none of the evaluated treatments significantly decreased the severity percentage in the orange cv. Valencia.
ACKNOWLEDGEMENTSTo the producer Ing. Ernesto Castañeda Bernal for the facilities granted to carry out this research, to the
Universidad Autónoma de Tamaulipas, the Faculty of Engineering and Sciences and the Consejo Nacional de
Ciencia y Tecnología (CONACyT).
REFERENCESAcuña G., E.M., & Grabowski O, C. (2012). Inducción de resistencia en plantas de trigo (Triticum aestivum L.)
a la mancha amarilla (Drechslera tritici-repentis) y marrón (Bipolaris sorokiniana). Investigación Agraria 14: 71-79.
Alayón L., P., Rodríguez, V.A., Píccoli, A.B., Chabbal, M.D., Giménez, L.I., & Martínez, G.C. (2014). Fertilización foliar con macronutrientes a plantas de naranja Valencia late (Citrus sinensis (L.) Osbeck) y tangor Murcott (Citrus reticulata Blanco Citrus sinensis (L.) Osbeck). Revista de la Facultad de Ciencias Agrarias 46:87-96.
Curtolo, M., Granato, L.M. & Soratto T., A.T., Curtolo, M., Gazaffi, R., Takita, M.A., Cristofani-Yaly, M., & Machado, M.A. (2020). Expression Quantitative Trait Loci (eQTL) mapping for callose synthases in intergeneric hybrids of Citrus challenged with the bacteria Candidatus Liberibacter asiaticus. Genetics and Molecular Biology 43:1-16. doi: 10.1590/1678-4685-gmb-2019-0133
Flores-Sánchez, J.L., Mora-Aguilera, G., Loeza-Kuk, E., López-Arroyo, J.I., Domínguez-Monge, S., Acevedo-Sánchez, G., & Robles-García, P. (2015). Pérdidas en Producción inducidas por Candidatus Liberibacter asiaticus en Limón Persa, en Yucatán México. Revista Mexicana de Fitopatología 33:195-210.
165 Agro productividad 2021. https://doi.org/10.32854/agrop.v14i8.1945
Garza-Saldaña, J.J., Varela-Fuentes, S., & Gómez-Flores, W. (2017). Métodos para la detección presuntiva de Huanglongbing (HLB) en cítricos. CienciaUAT 11: 93-104.
Hernández H., R., Granados R., G.R., Mora A., G., Aguirre G., R., & León G., I. (2019). Reconversión de cultivos como resultado de la presencia de Huanglongbing en Colima, México. Acta Universitaria 29:1-13. doi: 10.15174/au.2019.1921
Latsague, M., Sáez D., P., & Mora, M. (2014). Efecto de la fertilización con nitrógeno, fósforo y potasio, sobre el contenido foliar de carbohidratos, proteínas y pigmentos fotosintéticos en plantas de Berberidopsis corallina Hook.f. Gayana Botanica 71:37-42.
Pabón-Villalobos, J., & Castaño-Zapata, J. (2015). Evaluación de productos químicos y uno biológico para el manejo de Phytophthora spp. en naranjo ‘salustiana’ injertado en portainjerto sunki. Revista U.D.C.A Actualidad y Divulgación Científica 18: 339- 349.
Quiroga B., N.J., & Arbeláez T., G. (2004). Evaluación de la eficacia de fungicidas aplicados al suelo y al follaje para el control de mildeo velloso, ocasionado por Peronospora sparsa en un cultivo comercial de rosa. Agronomía Colombiana 22: 110-118.
Ramírez G., M., & Rodríguez, A. (2012). Mecanismos de defensa y respuestas de las plantas en la interacción micorrícica. Revista Colombiana de Biotecnología 14: 271-284.
Reyes-Santamaría, M.I., Villegas-Monter, A., Colinas-León, M.T., & Calderón-Zavala, G. (2000). Peso específico, contenido de proteína y de clorofila. Agrociencia 34: 49-55.
Robles-González, M.M., Orozco-Santos, M., Manzanilla-Ramírez, M.A., Velázquez-Monreal, J.J., & Carrillo-Medrano, S.H. (2017). Efecto del HLB sobre el rendimiento de limón mexicano en Colima, México. Revista Mexicana de Ciencias Agrícolas 8: 1101-1111.
Robles-González, M.M., Velázquez-Monreal, J.J., Manzanilla-Ramirez, M.A., Orozco-Santos, M., Medina-Urrutia, V.M., López-Arroyo, J.I., & Flores-Virgen, R. (2013). Síntomas del Huanglongbing (HLB) en árboles de limón mexicano [Citrus aurantifolia (Christm) Swingle] y su dispersión en el estado de Colima, México. Revista Chapingo. Serie Horticultura 19: 15-31.
Ruiz-Sanchez, E., Tún-Suárez, J.M., Pinzón-López, L.L., Valerio-Hernández, G., & Zavala-León, M.J. (2008). Evaluación de fungicidas sistémicos para el control del mildiú velloso (Pseudoperonospora cubensis Berk. & Curt.) Rost. en el cultivo del melón (Cucumis melo L.). Revista Chapingo. Serie Horticultura 14:79-84.
Sáenz P., C. A., Osorio H., E., Estrada D., B., Poot P., W.A., Delgado M., R., y Rodríguez H., R. (2019). Principales enfermedades en cítricos. Revista Mexicana de Ciencias Agrícolas 10:1653-1665.
Seneweera, S., Makino, A., Hirotsu, N., Norton, R., & Suzuki, Y. (2011). New insight into photosynthetic acclimation to elevated CO2: The role of leaf nitrogen and ribulose-1,5- bisphosphate carboxylase/oxygenase content in rice leaves. Environmental and Experimental Botany 71: 128-136.
Sharif, M., Attique K., M., Iqbal Z., Faisal A., M., I. Ullah L., M.I., & Younus J., M. (2018). Detection and classification of citrus diseases in agriculture based on optimized weighted segmentation and feature selection. Computers and Electronics in Agriculture 150:220-234.
Soto C., F., Tramón P., C., Aqueveque M., P., & De Bruijn, J. (2018). Microorganismos antagonistas que inhiben el desarrollo de patógenos en post-cosecha de limones (Citrus limon L.). Chilean Journal of Agricultural & Animal Sciences 32: 173-184.
Spreen, T. H., Gao Z., Fernandes W., & Zansler, M. L. (2020). Global economics and marketing of citrus productsIn: Talón, M., Caruso M., & Gmitter, F. G. (Eds.). The Genus Citrus. Elsevier. España. pp:471-493.
Trinidad-Cruz, J.R., Rincón-Enríquez, G., Quiñones-Aguilar, E.E., Arce-Leal, A.P., & Leyva-López, N.E. (2019). Inductores de resistencia vegetal en el control de Candidatus Liberibacter asiaticus en árboles de limón (Citrus aurantifolia) mexicano. Revista Mexicana de Fitopatología 37:1-14.
Warren, Ch.R., Mcgrath, J.F., & Adams, M.A. (2005). Differential effects of N, P and K on photosynthesis and partitioning of N in Pinus pinaster needles. Annals of Forest Science 62: 1-8.

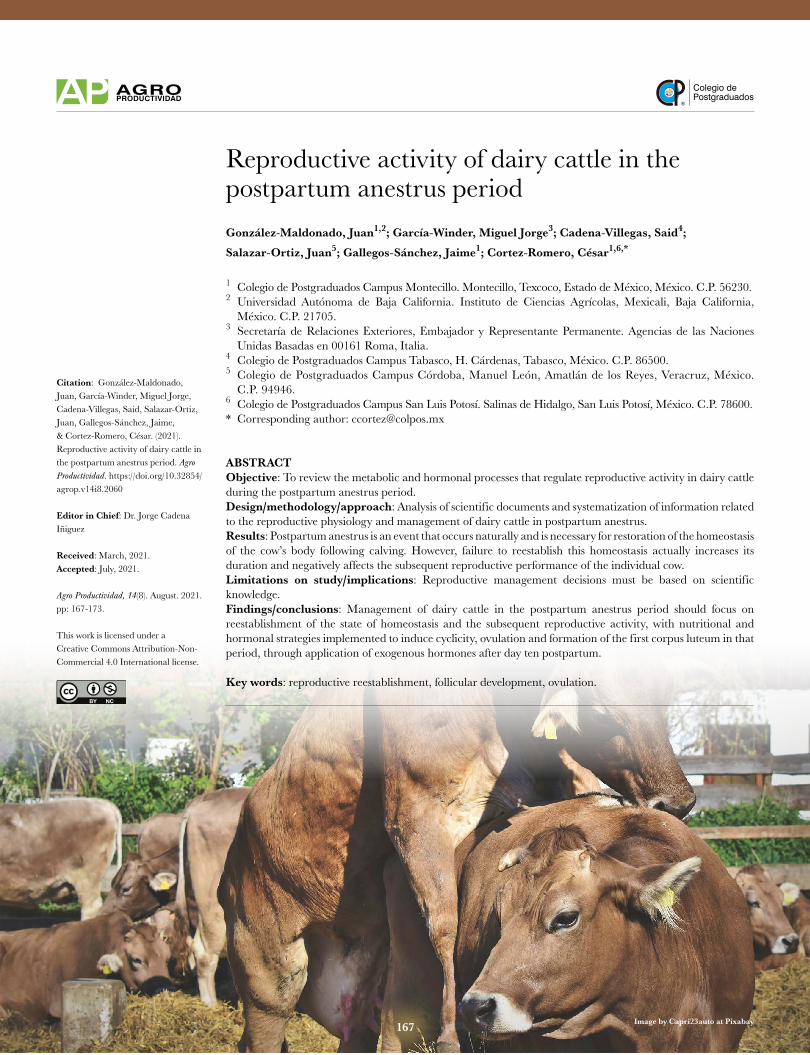
Colegio dePostgraduados
167
Reproductive activity of dairy cattle in the postpartum anestrus periodGonzález-Maldonado, Juan1,2; García-Winder, Miguel Jorge3; Cadena-Villegas, Said4;
Salazar-Ortiz, Juan5; Gallegos-Sánchez, Jaime1; Cortez-Romero, César1,6,*
1 Colegio de Postgraduados Campus Montecillo. Montecillo, Texcoco, Estado de México, México. C.P. 56230. 2 Universidad Autónoma de Baja California. Instituto de Ciencias Agrícolas, Mexicali, Baja California,
México. C.P. 21705. 3 Secretaría de Relaciones Exteriores, Embajador y Representante Permanente. Agencias de las Naciones
Unidas Basadas en 00161 Roma, Italia. 4 Colegio de Postgraduados Campus Tabasco, H. Cárdenas, Tabasco, México. C.P. 86500. 5 Colegio de Postgraduados Campus Córdoba, Manuel León, Amatlán de los Reyes, Veracruz, México.
C.P. 94946. 6 Colegio de Postgraduados Campus San Luis Potosí. Salinas de Hidalgo, San Luis Potosí, México. C.P. 78600. * Corresponding author: [email protected]
ABSTRACTObjective: To review the metabolic and hormonal processes that regulate reproductive activity in dairy cattle during the postpartum anestrus period. Design/methodology/approach: Analysis of scientific documents and systematization of information related to the reproductive physiology and management of dairy cattle in postpartum anestrus. Results: Postpartum anestrus is an event that occurs naturally and is necessary for restoration of the homeostasis of the cow’s body following calving. However, failure to reestablish this homeostasis actually increases its duration and negatively affects the subsequent reproductive performance of the individual cow.Limitations on study/implications: Reproductive management decisions must be based on scientific knowledge.Findings/conclusions: Management of dairy cattle in the postpartum anestrus period should focus on reestablishment of the state of homeostasis and the subsequent reproductive activity, with nutritional and hormonal strategies implemented to induce cyclicity, ovulation and formation of the first corpus luteum in that period, through application of exogenous hormones after day ten postpartum.
Key words: reproductive reestablishment, follicular development, ovulation.
Citation: González-Maldonado, Juan, García-Winder, Miguel Jorge, Cadena-Villegas, Said, Salazar-Ortiz, Juan, Gallegos-Sánchez, Jaime, & Cortez-Romero, César. (2021). Reproductive activity of dairy cattle in the postpartum anestrus period. Agro Productividad. https://doi.org/10.32854/agrop.v14i8.2060
Editor in Chief: Dr. Jorge Cadena Iñiguez
Received: March, 2021.Accepted: July, 2021.
Agro Productividad, 14(8). August. 2021. pp: 167-173.
This work is licensed under a Creative Commons Attribution-Non-Commercial 4.0 International license.
Image by Capri23auto at Pixabay 167
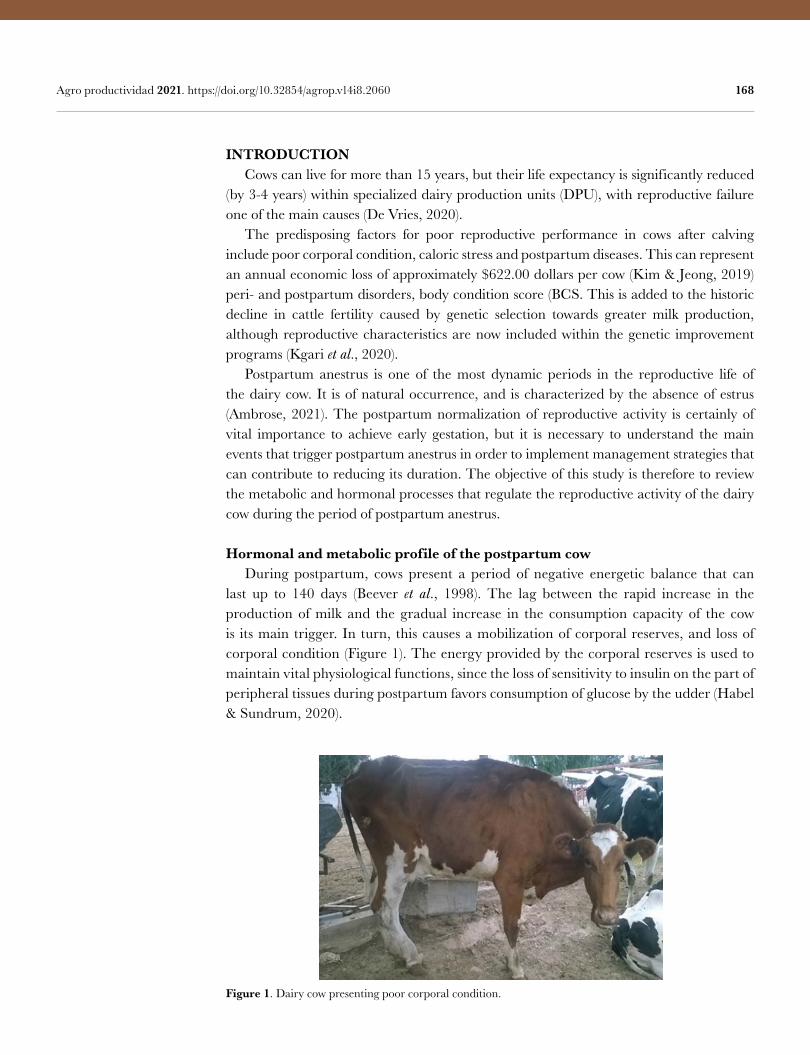
168 Agro productividad 2021. https://doi.org/10.32854/agrop.v14i8.2060
INTRODUCTION Cows can live for more than 15 years, but their life expectancy is significantly reduced (by 3-4 years) within specialized dairy production units (DPU), with reproductive failure one of the main causes (De Vries, 2020). The predisposing factors for poor reproductive performance in cows after calving include poor corporal condition, caloric stress and postpartum diseases. This can represent an annual economic loss of approximately $622.00 dollars per cow (Kim & Jeong, 2019)peri- and postpartum disorders, body condition score (BCS. This is added to the historic decline in cattle fertility caused by genetic selection towards greater milk production, although reproductive characteristics are now included within the genetic improvement programs (Kgari et al., 2020). Postpartum anestrus is one of the most dynamic periods in the reproductive life of the dairy cow. It is of natural occurrence, and is characterized by the absence of estrus (Ambrose, 2021). The postpartum normalization of reproductive activity is certainly of vital importance to achieve early gestation, but it is necessary to understand the main events that trigger postpartum anestrus in order to implement management strategies that can contribute to reducing its duration. The objective of this study is therefore to review the metabolic and hormonal processes that regulate the reproductive activity of the dairy cow during the period of postpartum anestrus.
Hormonal and metabolic profile of the postpartum cow During postpartum, cows present a period of negative energetic balance that can last up to 140 days (Beever et al., 1998). The lag between the rapid increase in the production of milk and the gradual increase in the consumption capacity of the cow is its main trigger. In turn, this causes a mobilization of corporal reserves, and loss of corporal condition (Figure 1). The energy provided by the corporal reserves is used to maintain vital physiological functions, since the loss of sensitivity to insulin on the part of peripheral tissues during postpartum favors consumption of glucose by the udder (Habel & Sundrum, 2020).
Figure 1. Dairy cow presenting poor corporal condition.
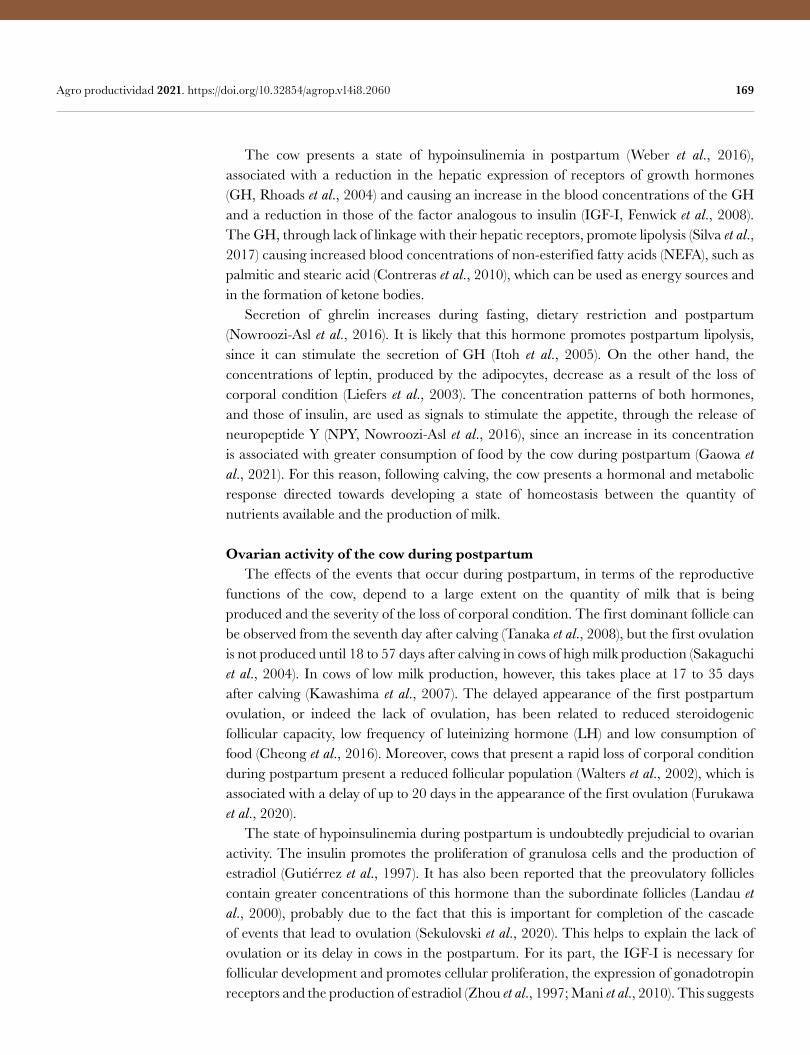
169 Agro productividad 2021. https://doi.org/10.32854/agrop.v14i8.2060
The cow presents a state of hypoinsulinemia in postpartum (Weber et al., 2016), associated with a reduction in the hepatic expression of receptors of growth hormones (GH, Rhoads et al., 2004) and causing an increase in the blood concentrations of the GH and a reduction in those of the factor analogous to insulin (IGF-I, Fenwick et al., 2008). The GH, through lack of linkage with their hepatic receptors, promote lipolysis (Silva et al., 2017) causing increased blood concentrations of non-esterified fatty acids (NEFA), such as palmitic and stearic acid (Contreras et al., 2010), which can be used as energy sources and in the formation of ketone bodies. Secretion of ghrelin increases during fasting, dietary restriction and postpartum (Nowroozi-Asl et al., 2016). It is likely that this hormone promotes postpartum lipolysis, since it can stimulate the secretion of GH (Itoh et al., 2005). On the other hand, the concentrations of leptin, produced by the adipocytes, decrease as a result of the loss of corporal condition (Liefers et al., 2003). The concentration patterns of both hormones, and those of insulin, are used as signals to stimulate the appetite, through the release of neuropeptide Y (NPY, Nowroozi-Asl et al., 2016), since an increase in its concentration is associated with greater consumption of food by the cow during postpartum (Gaowa et al., 2021). For this reason, following calving, the cow presents a hormonal and metabolic response directed towards developing a state of homeostasis between the quantity of nutrients available and the production of milk.
Ovarian activity of the cow during postpartum The effects of the events that occur during postpartum, in terms of the reproductive functions of the cow, depend to a large extent on the quantity of milk that is being produced and the severity of the loss of corporal condition. The first dominant follicle can be observed from the seventh day after calving (Tanaka et al., 2008), but the first ovulation is not produced until 18 to 57 days after calving in cows of high milk production (Sakaguchi et al., 2004). In cows of low milk production, however, this takes place at 17 to 35 days after calving (Kawashima et al., 2007). The delayed appearance of the first postpartum ovulation, or indeed the lack of ovulation, has been related to reduced steroidogenic follicular capacity, low frequency of luteinizing hormone (LH) and low consumption of food (Cheong et al., 2016). Moreover, cows that present a rapid loss of corporal condition during postpartum present a reduced follicular population (Walters et al., 2002), which is associated with a delay of up to 20 days in the appearance of the first ovulation (Furukawa et al., 2020). The state of hypoinsulinemia during postpartum is undoubtedly prejudicial to ovarian activity. The insulin promotes the proliferation of granulosa cells and the production of estradiol (Gutiérrez et al., 1997). It has also been reported that the preovulatory follicles contain greater concentrations of this hormone than the subordinate follicles (Landau et al., 2000), probably due to the fact that this is important for completion of the cascade of events that lead to ovulation (Sekulovski et al., 2020). This helps to explain the lack of ovulation or its delay in cows in the postpartum. For its part, the IGF-I is necessary for follicular development and promotes cellular proliferation, the expression of gonadotropin receptors and the production of estradiol (Zhou et al., 1997; Mani et al., 2010). This suggests
170 Agro productividad 2021. https://doi.org/10.32854/agrop.v14i8.2060
that the low concentrations of IGF-I observed during the postpartum are undesirable in terms of follicular activity. The maturation, culture and fertilization of oocytes, in the presence of concentrations of palmitic and stearic acid similar to those found in the follicles of cows of high milk production during postpartum, increases the apoptosis of the cells of the clusters and reduces the level of competition of the oocyte (Leroy et al., 2005). In contrast, in cows that are not in a negative energetic balance, intra-follicular injection of these acids temporarily reduces the follicular size, but not the steroidogenic activity (Ferst et al., 2020). This suggests that the effect of the NEFA is dependent on the energetic balance of the cow.
Uterine health of postpartum cows and its effect on reproductive function Uterine infections are common during postpartum. However, the probability that a cow becomes pregnant following its first insemination postpartum is four times lower in cows that suffered an infection than it is in healthy individuals (Gobikrushanth et al., 2016). This is possibly due to the presence of high intra-follicular concentrations of endotoxins (Cheong et al., 2017), since the intra-follicular injection of bacterial products (lipopolysaccharides) reduces the number of ovulations (Gindri et al., 2019). The addition of follicular liquid of cows with subclinical uterine infection in the middle of the culture acts to diminish the competition of the oocyte, because of a high concentration of lipopolysaccharides (Heidari et al., 2019). This could be due to the fact that these induce an inflammatory response and an oxidative stress (Zhao et al., 2019), as well as altering the nuclear and cytoplasmic maturation in the oocyte (Magata & Shimizu, 2017).
Nutritional and hormonal strategies to break postpartum anestrus Nutritional and hormonal strategies to shorten or to break postpartum anestrus are directed towards reestablishing the hormonal and metabolic balance of the cow. Restoration of the blood concentrations of insulin is perhaps one of the main objectives. Supplementation with propylene glycol in postpartum is effective in terms of increasing the blood concentration of insulin, while reducing those of NEFA and ketone bodies (Rizos et al., 2008). In addition, to improve fertility, it is recommended to establish a pattern of feeding that allows an increase in the blood concentrations of this hormone in the first days postpartum, with the subsequent provision of a diet that allows the reduction of these concentrations (Garnsworthy et al., 2009). There is a large quantity of scientific information that addresses the application of hormones to induce postpartum cyclicity (Rhodes et al., 2003). Hormonal strategies to induce this generally include the use of progestogens, estradiol and GnRH. The progestogens are used to sensitize the hypothalamus to the effect of the estradiol following calving, such that the female can exhibit the behavior of estrus (Figure 2; Nagai et al., 2013). On the other hand, the LH content in the pituitary remains low between days one and 15 compared to that of day 30 postpartum, while the quantity of GnRH receptors increases at 15 days after calving (Nett et al., 1988). This explains the absence of a peak in LH in response to the injection of GnRH within the first eight days postpartum (Peters et al., 1985), although it has been observed that the response tends to normalize after day ten
171 Agro productividad 2021. https://doi.org/10.32854/agrop.v14i8.2060
(Fernandes et al., 1978), for which reason it is recommended to begin the treatments after day ten postpartum.
CONCLUSIONS Management of dairy cattle in postpartum should be focused on reestablishing the state of homeostasis, and then reproductive activity, for which reason the nutrition, health, well being and reproduction should be coordinated into a single management strategy; mainly featuring nutritional and hormonal strategies designed to induce cyclicity with ovulation and formation of the first corpus luteum in the postpartum period, through the use of progesterone, estradiol and GnRH after day ten postpartum.
REFERENCESAmbrose D. J. (2021). Pospartum anestrus and its maganement in dairy cattle. In R. M. Hopper (Ed) Bovine
Reproduction (pp 408-430). Wiley Online Library. Doi: 10.1002/9781119602484.ch34Beever, D. ., Cammell, S. B., Sutton, J. D., Rowe, N., & Perrott, G. E. (1998). Energy metabolism in high yielding
cows. Proceedings of the British Society of Animal Science, 1998, 13–13. Doi:10.1017/s0308229600032268Cheong, S. H., Filho, O. G. S., Absalon-Medina, V. A., Schneider, A., Butler, W. R., & Gilbert, R. O. (2017).
Uterine and systemic inflammation influences ovarian follicular function in postpartum dairy cows. PLoS ONE, 12(5), 1–16. Doi: 10.1371/journal.pone.0177356
Cheong, S. H., Sá Filho, O. G., Absalón-Medina, V. A., Pelton, S. H., Ronald Butler, W., & Gilbert, R. O. (2016). Metabolic and endocrine differences between dairy cows that do or do not ovulate first postpartum dominant follicles. Biology of Reproduction, 94(1). Doi: 10.1095/biolreprod.114.127076
Contreras, G. A., O’Boyle, N. J., Herdt, T. H., & Sordillo, L. M. (2010). Lipomobilization in periparturient dairy cows influences the composition of plasma nonesterified fatty acids and leukocyte phospholipid fatty acids. Journal of Dairy Science, 93(6), 2508–2516. Doi: 10.3168/jds.2009-2876
De Vries, A. (2020). Symposium review: Why revisit dairy cattle productive lifespan? Journal of Dairy Science, 103(4), 3838–3845. Doi: 10.3168/jds.2019-17361
Fenwick, M. A., Fitzpatrick, R., Kenny, D. A., Diskin, M. G., Patton, J., Murphy, J. J., Wathes, D. C. (2008). Interrelationships between negative energy balance (NEB) and IGF regulation in liver of lactating dairy cows. Domestic Animal Endocrinology, 34(1), 31–44. Doi: 10.1016/j.domaniend.2006.10.002
Fernandes, L. C., Thatcher, W. W., Wilcox, C. J., Call, E. P. (1978). LH Release in response to GnRH during the postpartum period of dairy cows. Journal of Animal Science, 46(2), 443–448. Doi: 10.2527/jas1978.462443x
Ferst, J. G., Missio, D., Bertolin, K., Gasperin, B. G., Leivas, F. G., Bordignon, V., Gonçalves, P. B., Ferreira, R. (2020). Intrafollicular injection of nonesterified fatty acids impaired dominant follicle growth in cattle. Animal Reproduction Science, 219, 106536. Doi: 10.1016/j.anireprosci.2020.106536
Furukawa, E., Masaki, T., Sakaguchi, K., Bo, M., Yanagawa, Y., Ueda, K., Nagano, M. (2020). Relationship between the timing of the first postpartum ovulation and antral follicle counts in Holstein cows. Journal of Ovarian Research, 13(1), 1–9. Doi: 10.1186/s13048-020-0610-5
Figure 2. Secondary signs of estrus. A: the cow sniffs its companions. B: the cow rests its head on the back of another. C: primary sign of estrus; the cow accepts being mounted by another and is then considered to be in estrus.
172 Agro productividad 2021. https://doi.org/10.32854/agrop.v14i8.2060
Gaowa, N., Zhang, X., Li, H., Wang, Y., Zhang, J., Hao, Y., Cao, Z., Li, S. (2021). Bacterial Community in Multiparous Holstein Dairy Cow during the Postpartum Period. Animals, 11(3), 617. Doi: 10.3390/ani11030617
Garnsworthy, P. C., Fouladi-Nashta, A. A., Mann, G. E., Sinclair, K. D., Webb, R. (2009). Effect of dietary-induced changes in plasma insulin concentrations during the early post partum period on pregnancy rate in dairy cows. Reproduction, 137(4), 759–768. Doi: 10.1530/REP-08-0488
Gindri, P., de Ávila Castro, N., Mion, B., Garziera Gasperin, B., Catarelli Pegoraro, L. M., Alveiro Alvarado Rincón, J., Diniz Vieira, A., Pradieé, J., Machado Pfeifer, L. F., Nunes Corrêa, M., Schneider, A. (2019). Intrafollicular lipopolysaccharide injection delays ovulation in cows. Animal Reproduction Science, 211(September), 106226. Doi: 10.1016/j.anireprosci.2019.106226
Gobikrushanth, M., Salehi, R., Ambrose, D. J., Colazo, M. G. (2016). Categorization of endometritis and its association with ovarian follicular growth and ovulation, reproductive performance, dry matter intake, and milk yield in dairy cattle. Theriogenology, 86(7), 1842–1849. Doi: 10.1016/j.theriogenology.2016.06.003
Gutiérrez, C. G., Campbell, B. K., Webb, R. (1997). Development of a long-term bovine granulosa cell culture system: Induction and maintenance of estradiol production, response to follicle- stimulating hormone, and morphological characteristics. Biology of Reproduction, 56(3), 608–616. Doi: 10.1095/biolreprod56.3.608
Habel, J., Sundrum, A. (2020). Mismatch of glucose allocation between different life functions in the transition period of dairy cows. Animals, 10(6), 1–21. Doi: 10.3390/ani10061028
Heidari, M., Kafi, M., Mirzaei, A., Asaadi, A., Mokhtari, A. (2019). Effects of follicular fluid of preovulatory follicles of repeat breeder dairy cows with subclinical endometritis on oocyte developmental competence. Animal Reproduction Science, 205, 62–69. Doi:10.1016/j.anireprosci.2019.04.004
Itoh, F., Komatsu, T., Yonai, M., Sugino, T., Kojima, M., Kangawa, K., Hasegawa, Y., Terashima, Y., Hodate, K. (2005). GH secretory responses to ghrelin and GHRH in growing and lactating dairy cattle. Domestic Animal Endocrinology, 28(1), 34–45. Doi:10.1016/j.domaniend.2004.06.001
Kawashima, Chiho, Fukihara, S., Maeda, M., Kaneko, E., Montoya, C. A., Matsui, M., Shimizu, T., Matsunaga, N., Kida, K., Miyake, Y.-I., Schams, D., Miyamoto, A. (2007). Relationship between metabolic hormones and ovulation of dominant follicle during the first follicular wave post-partum in high-producing dairy cows. Reproduction, 133(1), 155–163. Doi: 10.1530/REP-06-0046
Kgari, R. D., Muller, C. J. C., Dzama, K., Makgahlela, M. L. (2020). Evaluation of female fertility in dairy cattle enterprises – A review. Arquivos Brasileiros de Psicologia, 50(6), 819–829. Doi: 10.4314/sajas.v50i6.8
Kim, I. H., Jeong, J. K. (2019). Risk factors limiting first service conception rate in dairy cows and their economic impact. Asian-Australasian Journal of Animal Sciences, 32(4), 519–526. Doi: 10.5713/ajas.18.0296
Landau, S., Braw-Tal, R., Kaim, M., Bor, A., Bruckental, I. (2000). Preovulatory follicular status and diet affect the insulin and glucose content of follicles in high-yielding dairy cows. Animal Reproduction Science, 64(3–4), 181–197. Doi: 10.1016/S0378-4320(00)00212-8
Leroy, J. L. M. R., Vanholder, T., Mateusen, B., Christophe, A., Opsomer, G., de Kruif, A., Genicot, G., Van Soom, A. (2005). Non-esterified fatty acids in follicular fluid of dairy cows and their effect on developmental capacity of bovine oocytes in vitro. Reproduction, 130(4), 485–495. Doi: 10.1530/rep.1.00735
Liefers, S. C., Veerkamp, R. F., Te Pas, M. F. W., Delavaud, C., Chilliard, Y., Van Der Lende, T. (2003). Leptin concentrations in relation to energy balance, milk yield, intake, live weight, and estrus in dairy cows. Journal of Dairy Science, 86,(3), 799–807. Doi: 10.3168/jds.S0022-0302(03)73662-5
Magata, Fumie, Shimizu, T. (2017). Effect of lipopolysaccharide on developmental competence of oocytes. In Reproductive Toxicology 71, 1-7. Doi: 10.1016/j.reprotox.2017.04.001
Mani, A. M., Fenwick, M. A., Cheng, Z., Sharma, M. K., Singh, D., Wathes, D. C. (2010). IGF1 induces up-regulation of steroidogenic and apoptotic regulatory genes via activation of phosphatidylinositol-dependent kinase/AKT in bovine granulosa cells. Reproduction, 139(1), 139–151. Doi:10.1530/REP-09-0050
Nagai, K., Endo, N., Tanaka, T., Kamomae, H. (2013). Exposure to estrogen mimicking the level of late pregnancy suppresses estrus subsequently induced by estrogen at the level of the follicular phase in Ovariectomized Shiba goats. Journal of Reproduction and Development, 59(2), 123–130. Doi: 10.1262/jrd.2012-140
Nett, T. M., Cermak, D., Braden, T., Manns, J., Niswender, G. (1988). Pituitary receptors for GnRH and estradiol, and pituitary content of gonadotropins in beef cows. II. Changes during the postpartum period. Domestic Animal Endocrinology, 5(1), 81–89. Doi: 10.1016/0739-7240(88)90029-X
173 Agro productividad 2021. https://doi.org/10.32854/agrop.v14i8.2060
Nowroozi-Asl, A., Aarabi, N., Rowshan-Ghasrodashti, A. (2016). Ghrelin and its correlation with leptin, energy related metabolites and thyroidal hormones in dairy cows in transitional period. Polish Journal of Veterinary Sciences, 19(1), 197–204. Doi: 10.1515/pjvs-2016-0024
Peters, A. R., Pimentel, M. G., Lamming, G. E. (1985). Hormone responses to exogenous GnRH pulses in post-partum dairy cows. Reproduction, 75(2), 557–565. Doi: 10.1530/jrf.0.0750557
Rhoads, R. P., Kim, J. W., Leury, B. J., Baumgard, L. H., Segoale, N., Frank, S. J., Bauman, D. E., Boisclair, Y. R. (2004). Insulin increases the abundance of the growth hormone receptor in liver and adipose tissue of periparturient dairy cows. Journal of Nutrition, 134(5), 1020–1027. Doi: 10.1093/jn/134.5.1020
Rhodes, F. M., McDougall, S., Burke, C. R., Verkerk, G. A., Macmillan, K. L. (2003). Invited review: Treatment of cows with an extended postpartum anestrous interval. Journal of Dairy Science, 86(6), 1876–1894. Doi: 10.3168/jds.S0022-0302(03)73775-8
Rizos, D., Kenny, D. A., Griffin, W., Quinn, K. M., Duffy, P., Mulligan, F. J., Roche, J. F., Boland, M. P., Lonergan, P. (2008). The effect of feeding propylene glycol to dairy cows during the early postpartum period on follicular dynamics and on metabolic parameters related to fertility. Theriogenology, 69(6), 688–699. Doi: 10.1016/j.theriogenology.2007.12.001
Sakaguchi, M., Sasamoto, Y., Suzuki, T., Takahashi, Y., Yamada, Y. (2004). Postpartum ovarian follicular dynamics and estrous activity in lactating dairy cows. Journal of Dairy Science, 87(7), 2114–2121. Doi: 10.3168/jds.S0022-0302(04)70030-2
Sekulovski, N., Whorton, A. E., Shi, M., Hayashi, K., MacLean, J. A. (2020). Periovulatory insulin signaling is essential for ovulation, granulosa cell differentiation, and female fertility. FASEB Journal, 34(2), 2376–2391. Doi: 10.1096/fj.201901791R
Silva, P. R. B., Soares, H. F., Braz, W. D., Bombardelli, G. D., Clapper, J. A., Keisler, D. H., Chebel, R. C. (2017). Effects of treatment of periparturient dairy cows with recombinant bovine somatotropin on health and productive and reproductive parameters. Journal of Dairy Science, 100(4), 3126–3142. Doi: 10.3168/jds.2016-11737
Tanaka, T., Arai, M., Ohtani, S., Uemura, S., Kuroiwa, T., Kim, S., Kamomae, H. (2008). Influence of parity on follicular dynamics and resumption of ovarian cycle in postpartum dairy cows. Animal Reproduction Science, 108(1–2), 134–143. Doi: 10.1016/j.anireprosci.2007.07.013
Walters, A. H., Bailey, T. L., Pearson, R. E., Gwazdauskas, F. C. (2002). Parity-related changes in bovine follicle and oocyte populations, oocyte quality, and hormones to 90 days postpartum. Journal of Dairy Science, 85(4), 824–832. Doi: 10.3168/jds.S0022-0302(02)74142-8
Weber, C., Schäff, C. T., Kautzsch, U., Börner, S., Erdmann, S., Görs, S., Röntgen, M., Sauerwein, H., Bruckmaier, R. M., Metges, C. C., Kuhla, B., Hammon, H. M. (2016). Insulin-dependent glucose metabolism in dairy cows with variable fat mobilization around calving. Journal of Dairy Science, 99(8), 6665–6679. Doi: 10.3168/jds.2016-11022
Zhao, S., Pang, Y., Zhao, X., Du, W., Hao, H., Zhu, H. (2019). Detrimental effects of lipopolysaccharides on maturation of bovine oocytes. Asian-Australasian Journal of Animal Sciences, 32(8), 1112–1121. Doi: 10.5713/ajas.18.0540
Zhou, J., Kumar, T. R., Matzuk, M. M., Bondy, C. (1997). Insulin-like growth factor I regulates gonadotropin responsiveness in the murine ovary. Molecular Endocrinology, 11(13), 1924–1933. Doi: 10.1210/mend.11.13.0032