Genetic linkage mapping for molecular dissection of chilling requirement and budbreak in apricot (...
12
Genetic linkage mapping for molecular dissection of chilling requirement and budbreak in apricot (Prunus armeniaca L.) Bode A. Olukolu, Taly Trainin, Shenghua Fan, Chittaranjan Kole, Douglas G. Bielenberg, Gregory L. Reighard, Albert G. Abbott, and Doron Holland Abstract: Commercial production of apricot is severely affected by sensitivity to climatic conditions, an adaptive feature essential for cycling between vegetative or floral growth and dormancy. Yield losses are due to late winter or early spring frosts and inhibited vegetative or floral growth caused by unfulfilled chilling requirement (CR). Two apricot cultivars, Per- fection and A.1740, were selected for high and low CR, respectively, to develop a mapping population of F1 individuals using a two-way pseudo-testcross mapping strategy. High-density male and female maps were constructed using, respec- tively, 655 and 592 markers (SSR and AFLP) spanning 550.6 and 454.9 cM with average marker intervals of 0.84 and 0.77 cM. CR was evaluated in two seasons on potted trees forced to break buds after cold treatments ranging from 100 to 900 h. A total of 12 putative CR quantitative trait loci (QTLs) were detected on six linkage groups using composite inter- val mapping and a simultaneous multiple regression fit. QTL main effects of additive and additive  additive interactions accounted for 58.5% ± 6.7% and 66.1% ± 5.8% of the total phenotypic variance in the Perfection and A.1740 maps, re- spectively. We report two apricot high-density maps and QTLs corresponding to map positions of differentially expressed transcripts and suggested candidate genes controlling CR. Key words: dormancy, budbreak, peach, QTL. Re ´sume ´: La production commerciale de l’abricot est grandement affecte ´e par sa sensibilite ´ aux conditions climatiques, une caracte ´ristique adaptative essentielle pour alterner entre les phases de croissance ve ´ge ´tative ou floraison et de dor- mance. Des baisses de rendement sont enregistre ´es lorsque surviennent des gele ´es a ` la fin de l’hiver ou au de ´but du prin- temps ou encore lorsque le froid ne ´cessaire pour lever la dormance (CR) n’est pas obtenu, ce qui entraı ˆne une inhibition de la croissance ve ´ge ´tative et de la floraison. Deux cultivars de l’abricotier, Perfection et A.1740, ont e ´te ´ choisis en raison de leur grande et faible exigence en froid, afin de de ´velopper une population de cartographie F 1 a ` l’aide d’une strate ´gie de pseudo-testcross re ´ciproque. Des cartes ma ˆle et femelle a ` haute densite ´ ont e ´te ´ produites avec respectivement 655 et 592 marqueurs (SSR et AFLP), s’e ´tendant sur 550,6 et 454,9 cM pour une distance moyenne de 0,84 et 0,77 cM. L’exigence en froid a e ´te ´e ´value ´e sur deux saisons sur des arbres cultive ´s en pots et dont le de ´bourrement des bourgeons a e ´te ´ force ´ apre `s des traitements au froid variant entre 100 et 900 h. Au total, 12 QTL putatifs pour l’exigence en froid ont e ´te ´ de ´tec- te ´s sur six groupes de liaison par analyse composite des intervalles et une re ´gression multiple simultane ´e. Les effets princi- paux des composantes additives et des interactions additive  additive expliquaient 58,5 ± 6,7 % et 66,1 ± 5,8 % de la variance phe ´notypique au sein des cartes respectives de Perfection et A.1740. Les auteurs rapportent deux cartes ge ´ne ´ti- ques a ` haute densite ´ pour l’abricotier ainsi que des QTL dont la position coı ¨ncide avec celle de transcrits exprime ´s de ma- nie `re diffe ´rentielle, ce qui en fait des ge `nes candidats pour le contro ˆle de l’exigence en froid pour lever la dormance. Mots-cle ´s : dormance, de ´bourrement des bourgeons, pe ˆche, QTL. [Traduit par la Re ´daction] Received 14 April 2009. Accepted 3 July 2009. Published on the NRC Research Press Web site at genome.nrc.ca on 16 September 2009. Corresponding Editor: P. Gulick. B.A. Olukolu, S. Fan, C. Kole, and A.G. Abbott. 1 Genetics and Biochemistry, Clemson University, 100 Jordan Hall, Clemson, SC 29634, USA. T. Trainin and D. Holland. 2 Fruit Sciences, Newe Ya’ar Research Center, Agricultural Research Organization, P.O. Box 1021, Ramat Yishay 30095, Israel. D.G. Bielenberg. Horticulture, Clemson University, 170 Poole Agriculture Center, Clemson, SC 29634, USA; Biological Sciences, Clemson University, 132 Long Hall, Clemson, SC 29634, USA. G.L. Reighard. Horticulture, Clemson University, 170 Poole Agriculture Center, Clemson, SC 29634, USA. 1 Corresponding author (e-mail: [email protected]). 2 Corresponding author (e-mail: [email protected]). 819 Genome 52: 819–828 (2009) doi:10.1139/G09-050 Published by NRC Research Press
Transcript of Genetic linkage mapping for molecular dissection of chilling requirement and budbreak in apricot (...
Genetic linkage mapping for molecular dissectionof chilling requirement and budbreak in apricot(Prunus armeniaca L.)
Bode A. Olukolu, Taly Trainin, Shenghua Fan, Chittaranjan Kole, DouglasG. Bielenberg, Gregory L. Reighard, Albert G. Abbott, and Doron Holland
Abstract: Commercial production of apricot is severely affected by sensitivity to climatic conditions, an adaptive featureessential for cycling between vegetative or floral growth and dormancy. Yield losses are due to late winter or early springfrosts and inhibited vegetative or floral growth caused by unfulfilled chilling requirement (CR). Two apricot cultivars, Per-fection and A.1740, were selected for high and low CR, respectively, to develop a mapping population of F1 individualsusing a two-way pseudo-testcross mapping strategy. High-density male and female maps were constructed using, respec-tively, 655 and 592 markers (SSR and AFLP) spanning 550.6 and 454.9 cM with average marker intervals of 0.84 and0.77 cM. CR was evaluated in two seasons on potted trees forced to break buds after cold treatments ranging from 100 to900 h. A total of 12 putative CR quantitative trait loci (QTLs) were detected on six linkage groups using composite inter-val mapping and a simultaneous multiple regression fit. QTL main effects of additive and additive � additive interactionsaccounted for 58.5% ± 6.7% and 66.1% ± 5.8% of the total phenotypic variance in the Perfection and A.1740 maps, re-spectively. We report two apricot high-density maps and QTLs corresponding to map positions of differentially expressedtranscripts and suggested candidate genes controlling CR.
Key words: dormancy, budbreak, peach, QTL.
Resume : La production commerciale de l’abricot est grandement affectee par sa sensibilite aux conditions climatiques,une caracteristique adaptative essentielle pour alterner entre les phases de croissance vegetative ou floraison et de dor-mance. Des baisses de rendement sont enregistrees lorsque surviennent des gelees a la fin de l’hiver ou au debut du prin-temps ou encore lorsque le froid necessaire pour lever la dormance (CR) n’est pas obtenu, ce qui entraıne une inhibitionde la croissance vegetative et de la floraison. Deux cultivars de l’abricotier, Perfection et A.1740, ont ete choisis en raisonde leur grande et faible exigence en froid, afin de developper une population de cartographie F1 a l’aide d’une strategie depseudo-testcross reciproque. Des cartes male et femelle a haute densite ont ete produites avec respectivement 655 et 592marqueurs (SSR et AFLP), s’etendant sur 550,6 et 454,9 cM pour une distance moyenne de 0,84 et 0,77 cM. L’exigenceen froid a ete evaluee sur deux saisons sur des arbres cultives en pots et dont le debourrement des bourgeons a ete forceapres des traitements au froid variant entre 100 et 900 h. Au total, 12 QTL putatifs pour l’exigence en froid ont ete detec-tes sur six groupes de liaison par analyse composite des intervalles et une regression multiple simultanee. Les effets princi-paux des composantes additives et des interactions additive � additive expliquaient 58,5 ± 6,7 % et 66,1 ± 5,8 % de lavariance phenotypique au sein des cartes respectives de Perfection et A.1740. Les auteurs rapportent deux cartes geneti-ques a haute densite pour l’abricotier ainsi que des QTL dont la position coıncide avec celle de transcrits exprimes de ma-niere differentielle, ce qui en fait des genes candidats pour le controle de l’exigence en froid pour lever la dormance.
Mots-cles : dormance, debourrement des bourgeons, peche, QTL.
[Traduit par la Redaction]
Received 14 April 2009. Accepted 3 July 2009. Published on the NRC Research Press Web site at genome.nrc.ca on 16 September 2009.
Corresponding Editor: P. Gulick.
B.A. Olukolu, S. Fan, C. Kole, and A.G. Abbott.1 Genetics and Biochemistry, Clemson University, 100 Jordan Hall, Clemson, SC29634, USA.T. Trainin and D. Holland.2 Fruit Sciences, Newe Ya’ar Research Center, Agricultural Research Organization, P.O. Box 1021, RamatYishay 30095, Israel.D.G. Bielenberg. Horticulture, Clemson University, 170 Poole Agriculture Center, Clemson, SC 29634, USA; Biological Sciences,Clemson University, 132 Long Hall, Clemson, SC 29634, USA.G.L. Reighard. Horticulture, Clemson University, 170 Poole Agriculture Center, Clemson, SC 29634, USA.
1Corresponding author (e-mail: [email protected]).2Corresponding author (e-mail: [email protected]).
819
Genome 52: 819–828 (2009) doi:10.1139/G09-050 Published by NRC Research Press

Introduction
Apricots, like other temperate stone fruit crops, are grownin climates with well-differentiated seasons where specieshave adapted mechanisms to survive low winter tempera-tures and frost damage (Ruiz et al. 2007). Survival and re-production of perennial fruit trees require adaptation to theenvironment by synchronizing development with the cyclicclimatic conditions (Dietrichson 1964; Hill et al. 1998).
A prominent adaptive feature, dormancy, involves a grad-ual and progressive process through autumn until a deep reststate is reached (Hatch and Walker 1969; Lang et al. 1987).Transition into dormancy is triggered by environmental cuessuch as photoperiod, cold, or drought (Arora et al. 2003;Rohde et al. 2007). Cultivars introduced into a climatewhere low winter temperatures are not sufficient for break-ing dormancy exhibit adverse effects with regard to vegeta-tive or floral growth and fruit-bearing capacity (Coville1920). On the contrary, cultivars with low chilling require-ment (CR) that are grown in cold-winter climates quicklycomplete CR and bloom too early, leading to yield lossesdue to late winter or early spring frosts (Scorza and Okie1990).
The poor understanding of the genetics controlling CR infruiting trees is most likely due to their long generation timeand the complex mode of inheritance of characters related toplant growth and habit. However, the state of the art in fruittree genetics and genomics affords a unique opportunity tocharacterize CR. Currently we know that there is a highlevel of conservation of synteny among the genomes of dif-ferent Prunus species (Dirlewanger et al. 2004), facilitatingtransferability of genomic and genetic resources. Capitaliz-ing on this fact, a Prunus reference genetic and physicalmap populated with numerous marker types, including thosebased on expressed sequence tags (ESTs), was constructed(Aranzana et al. 2003; Zhebentyayeva et al. 2008). With anumber of important genes and quantitative trait loci(QTLs) already mapped in Prunus species, marker-assistedselection is now becoming a reality in some breeding pro-grams (Dirlewanger et al. 2004). Numerous genetic linkagemaps marking important characters have been constructedfor several Prunus species including apricot, peach and re-lated wild species, almond, plum, and cherry (Genome Data-base for Rosaceae; Jung et al. 2008; available at http://www.bioinfo.wsu.edu/gdr/); however, maps identifying genes orQTLs controlling CR in Prunus have not been published.The Prunus reference map could in principle facilitate dis-covery of CR-related genes if appropriate mapping popula-tions exist in Prunus species.
In this communication, we report the underlying geneticbasis of CR in apricot through the development and analysisof a mapping population segregating for CR. Using thismapping population and a 2-way pseudo-testcross mappingstrategy, 2 high-density genetic linkage maps with locationsof putative QTLs for CR were developed. Twelve QTLs forCR were located on 2 maps generated from high and lowCR parents. Because of the utilization of core Prunus mapmarkers that are integrated on the peach physical map, thephysical map location of these QTL intervals is availableand potential candidate gene ESTs have been identified.
Materials and methods
Mapping populationA 2-way pseudo-testcross population consisting of 100 F1
individuals was developed from crosses between 2 cultivars(Perfection as male and A.1740 as female) with contrastingdifferences for CR and other traits. The parents and proge-nies were maintained at the Newe Ya’ar Research Center ofthe Agricultural Research Organization in Israel. Routinemethods of bagging and pollination were followed.
DNA extractionGenomic DNA was extracted from fresh young leaves us-
ing a hexadecyltrimethylammonium bromide – polyvinylpyrrolidone (CTAB–PVP) method as described in Porebskiet al. (1997). This procedure is a modification of the CTABprotocol of Eldredge et al. (1992) for plants containing highamounts of polysaccharides and polyphenolic compounds.DNA concentrations were quantified by a minifluorimeter(TKO100, Hoefer Scientific).
SSR markersMost of the simple sequence repeat (SSR) markers used
were from the Prunus anchor marker set originally devel-oped for peach (Aranzana et al. 2003). These markers wereselected based on uniform distribution across the linkagegroups of the Prunus reference map (Dirlewanger et al.2004) to establish a framework map for apricot for studiesof genome homology. These SSR markers were screenedfor polymorphism between the 2 parents and segregationamong 6 randomly selected individuals from the pseudo-testcross mapping population. The specific primer pairs, am-plification conditions, radioactive labeling, and polyacryla-mide gel electrophoresis were employed as described inCombes et al. (2000).
PCR reactions of 10 mL contained 10 mmol/L Tris-HCl(pH 8.3), 50 mmol/L KCl, 1.5 mmol/L MgCl2, 0.2 mmol/Lof each dNTP, 10 pmol of labeled forward primer and 10pmol of unlabelled reverse primer, 10 ng of genomic DNA,and 0.5 U of Taq polymerase (Life Technologies, Inc.). Am-plification was conducted with initial denaturing at 94 8Cfor 3 min followed by 35 cycles of denaturing at 94 8C for1 min, annealing at 49–56 8C for 1 min, and primer exten-sion at 72 8C for 1 min, and a final extension at 72 8C for5 min. Forward primers were end-radiolabeled with [g-33P]ATP (PerkinElmer) and T4 polynucleotide kinase(Promega). PCR products were separated on 6% denaturingpolyacrylamide gels which were vacuum-dried, exposed toX-Omat blue XB-1 films (Kodak), and developed after 1–7 days. A DNA standard ladder (Promega, fmol DNA cyclesequencing system) was loaded alongside the samples to de-termine the sizes of the amplified fragments.
AFLP protocol and markersAmplified fragment length polymorphism (AFLP) marker
analysis was performed as described in Vos et al. (1995). Analiquot of 200 ng of genomic DNA was digested with the re-striction enzymes EcoRI and MseI. Restriction fragmentsfrom the digest were ligated to EcoRI and MseI adapters anddiluted 10-fold for pre-amplification. The pre-amplificationreaction was set up using standard E and M primers corre-
820 Genome Vol. 52, 2009
Published by NRC Research Press

sponding to the EcoRI and MseI adapters, respectively, andcontaining one selective nucleotide (E+A and M+C) at the3’ end. The pre-amplification reaction mixture was diluted10-fold and used for selective amplification using variouscombinations of E primers with 1 additional selective nu-cleotide and M primers with 2 additional selective nucleo-tides. The 256 primer combinations initially screenedamong the parents and 6 progenies include all combina-tions from EAA to ETT and MCAA to MCTT. Followingscreening, primer combinations were chosen based on thepolymorphism information content (PIC) and used for gen-otyping the mapping population.
Pre-amplification PCR conditions included 20 cycles ofdenaturing at 94 8C for 30 s, annealing at 56 8C for 1 min,and primer extension at 72 8C for 1 min, followed by a finalextension at 72 8C for 5 min. Selective PCR conditions in-cluded 13 cycles of denaturing at 94 8C for 30 s, annealingat 65 8C (decreasing by 0.7 8C per cycle) for 1 min, and pri-mer extension at 72 8C for 1 min; 24 cycles of denaturing at94 8C for 30 s, annealing at 56 8C for 30 s, and primer ex-tension at 72 8C for 1 min; and a final extension at 72 8Cfor 5 min. End-radiolabeling of E primers and separationand detection of PCR products were conducted as describedunder SSR markers.
Genotyping and nomenclature of markersGenotyped marker data were obtained from visual scoring
of the banding patterns. Alleles detected with primers thatproduced multiple loci were labeled with an alphabetic suf-fix for SSR markers and a numeric suffix for AFLPmarkers. The segregating loci obtained from AFLP and SSRanalysis were categorized into 6 classes. These included locithat are heterozygous in both parents and segregate in a1:1:1:1 ratio, involving 4 alleles (ab � cd) and 3 non-nullalleles (ef � eg); loci that are heterozygous in both parentsand segregate in a 1:2:1 ratio, with both parents having thesame genotype of codominant alleles (hk � hk); loci that areheterozygous in both parents and segregate in a 3:1 ratio(some mapped as dominant bridge markers); and loci thatare in a testcross configuration between the parents and seg-regate in a 1:1 ratio (dominant markers), comprising locithat are heterozygous in the female parent and homozygousin the male parent (lm � ll) and those that are heterozygousin the male parent and homozygous in the female parent (nn� np). Only 39 AFLP markers were scored as codominantfor bands showing polymorphism and intensity differencesbetween heterozygous and homozygous allelic states (Casti-glioni et al. 1999).
Genotypic data for each parental map comprised markerssegregating specifically in a parent as well as the bridgemarkers, which served as anchors to align linkage groupsbetween the 2 parental maps. Raw genotypic data were re-corded without any previous knowledge of phase relation-ship and inheritance, as typical of 2-way pseudo-testcrossmapping populations.
Linkage analysis and map constructionLinkage map construction was performed according to the
procedures described in Lodhi et al. (1995) for 2-waypseudo-testcross populations (Grattapaglia and Sederoff1994; Maliepaard et al. 1997; Lambert et al. 2004) using
JoinMap version 3.0 (Van Ooijen and Voorrips 2001). Gen-otypic data were prepared based on the JoinMap CP (cross-pollinating) function for 2 separate parental maps. JoinMapdata analysis tools were used to screen for missing datapoints, segregation distortion, and similarity between lociand individuals. Segregation distortion was determined byc2 analysis. Linkage analysis was performed using a maxi-mum recombination fraction of 0.40 and minimum criticallogarithm of odds (LOD) scores of 6.0 and 7.3 for the Per-fection and A.1740 maps, respectively. Marker distanceswere calculated based on the Kosambi mapping function(Kosambi 1944).
Since the linkage phases in a 2-way pseudo-testcross arenot known beforehand, a first round of linkage analysis wasdone to determine loci out of linkage phase, followed by asecond round of analysis that included dummy variables (al-ternative linkage phase) of loci that were not in linkagephase. Map files of both parental maps were used to drawthe linkage map in MapChart 2.2 (Voorrips 2002).
Algorithms of the mapping software used do not take intoaccount the 2-way pseudo-testcross population structure forthe estimation of actual centimorgan marker intervals (Wuet al. 2002, 2007). For instance, the CP function in JoinMap(Van Ooijen and Voorrips 2001) and the F2 pseudo-testcrosspopulation mapping options in MAPMAKER (Lander et al.1987) do not yield exactly the same centimorgan distances.In fact, they do not compute an actual centimorgan distanceunit, and JoinMap has been shown to produce a shorter mapthan MAPMAKER (Van Ooijen et al. 1994; Qi et al. 1996).Therefore, they cannot be compared directly for the distanceestimates obtained from the Prunus maps based on F2 andbackcross populations. To resolve this conundrum, we uti-lized IRILmap version 1.1 (Falque 2005), which is capableof computing actual centimorgan distances from recombina-tion fraction per meiosis (rn). It takes into account the n gen-erations of inter-mating by reversing Winkler’s formula(Winkler et al. 2003) through iteration and finally reappliesa distance function. Since the n generations cannot be deter-mined for the highly heterozygous apricot parents, the gen-eration of inter-mating (n = 4) that produced expected maplengths estimated from existing Prunus maps was utilized.
Evaluation of chilling requirementChilling requirement evaluation was performed at the
Newe Ya’ar Research Center in Israel under controlled con-ditions on the Perfection � A.1740 mapping population.Seeds of matured fruits from the cross were washed withwater and treated with an antifungal solution of 0.25% Mer-pan 48 containing 480 g/kg Captan. Seeds were then placedin wet vermiculite at 4–5 8C until the beginning of germina-tion. Upon germination, the seedlings were placed in 1 Lplastic pots containing garden soil inside growth chambers.The growth chambers were set at 24 8C and diurnal cyclesof 8 h dark and 16 h light in artificial light. Young plantsof about 0.5 m length were planted in the field at NeweYa’ar.
Three-year-old flowering trees developed from the plantedseedlings were used as the source material for stem cuttingswith buds. Cuttings harvested from individual trees weretop-grafted on 1-year-old plum rootstock (Mariana 2624)with low CR. Leaves were stripped in late November fol-
Olukolu et al. 821
Published by NRC Research Press

lowing the onset of sufficient low temperatures in mid-November, marked by growth cessation and leaf senes-cence. Following defoliation, pots were placed in walk-incold chambers at 6 8C, and 2 replicates of each individualwere removed at 200 h intervals ranging from 200 to600 h in 2007 and 100 to 900 h in 2008, with the excep-tion of the 700 chilling hour treatment. Chilled potted treeswere transferred to a naturally lit greenhouse at day andnight temperatures of 25 8C and 13 8C, respectively, toforce budbreak under normal photoperiod and irradiance.
Due to limitation of space in the controlled cold cham-bers, it was not feasible to sample large numbers of apricottrees with multiple replicates in the same year. Subse-quently, intervals and the range in chilling hours in eachyear do not adequately represent the phenotypic classes seg-regating in the population. Pooling data from both years wasrequired to reveal an all-inclusive spectrum of recombinantgenotypes. The emphasis of the study was on vegetativebudbreak and the data were expressed as the time in forcingconditions (‘‘days in forcing’’). From analysis of the data inthe greenhouse and comparison with similar data from thefield, we concluded that the best variable expressing the dif-ferences in CR in the population is days to first vegetativebud opening followed by bud flush. This variable was usedas a basis to determine CR for each progeny in the follow-ing manner: the chilling regime in which bud opening oc-curred within 15 days in forcing was set as the minimumamount of chilling hours required for budbreak. Quantifica-tion of CR (chill accumulated in cold chamber) was ex-pressed in chilling hours (Weinberger 1950).
Quantative trait loci analysisQuantitative trait loci for CR were detected using compo-
site interval mapping (CIM, Zeng 1994) and by integratinggenetic information and accumulated chilling hour data us-ing the PC version of PlabQTL version 1.2 (Utz and Mel-chinger 1996). The PlabQTL algorithm was proposed toimprove precision of QTL mapping (Zeng 1994). The CIMemployed the cov SELECT option of PlabQTL, which usesa forward stepwise multiple regression to select cofactorsautomatically. The LOD curve of the PlabQTL multiple re-gression is similar to that of maximum likelihood-based pro-grams (i.e., MapQTL and MAPMAKER/QTL), thoughmultiple regression-based interval mapping is more robustagainst non-normality, is statistically well known, andunderestimates R2 (Haley and Knott 1992).
Different genetic models were compared based onAkaike’s information criterion and Bayesian information cri-terion values (Hjorth 1994) to determine the best regressionfit. The LOD curves were created by scanning at 1 cM inter-vals, while a permutation test (1000 resamplings) was per-formed to determine the critical LOD score appropriate toempirically identify a putative QTL with a genome-wide er-ror at a 0.05 confidence level (Churchill and Doerge 1994).Subsequently, the detected QTLs and their estimated mappositions were verified using a simultaneous multiple regres-
sion, which accounts for effects of other linked QTLs on achromosome (Zeng 1993). The phenotypic variance ex-plained by each QTL (R2) was calculated as the square ofthe correlation coefficient from the final multiple regressionmodel (Utz and Melchinger 1995, 1996). To examine the in-teraction between detected QTLs, the general linear modelof variance analysis was implemented.
Results
Molecular marker analysisOut of a total of 275 SSR primer pairs screened, 225 pro-
duced amplification products and 53 were selected based ontheir uniform distribution over the Prunus reference map(Dirlewanger et al. 2004) for genotyping 94 pseudo-testcrossprogenies. After genotyping with the 53 SSR markers, only43 showed linkage and were mapped (Table 1). Segregationpatterns of 256 AFLP primer combinations among 6 ran-domly selected progenies generated 2253 segregating loci(Table S1).2 The highest number of loci per primer combi-nation (30 loci) was observed using primers with AT-richselective nucleotides, while the lowest frequencies of lociper primer combination (2 loci) were observed using primerswith GC-rich selective nucleotides. For the parent Perfec-tion, 900 AFLP loci were analyzed, while for A.1740, 716AFLP loci were analyzed (Table 2). The proportion of seg-regation distortion observed in Perfection was estimated at10.07% at P < 0.01 and 24.60% at P < 0.05, while forA.1740 it was 4.97% at P < 0.01 and 13.98% at P < 0.05.
Linkage analysis and map constructionOf the 1059 markers (1016 AFLP and 43 SSR markers)
mapped on the linkage maps, 176 AFLP (165 dominant and11 codominant) and 12 SSR markers (18.1% of mappedmarkers) were bridge markers mapped in both parents(Table 2). These bridge markers allowed for transferabilityof markers and alignment of homologous linkage groups(Figs. 1 and 2). Totals of 632 and 567 dominant markerswere mapped on the Perfection and A.1740 parental maps,respectively (Table 2). Some SSR primers detected multipleloci that mapped within close genomic vicinity. The averagemarker intervals were 0.84 and 0.77 cM for the Perfectionand A.1740 maps, respectively, while the largest gap wasonly 7.5 cM. The map lengths were 550.6 cM and454.9 cM for the Perfection and A.1740 maps, respectively(Table 3).
To further validate marker order on our maps, the 2 pa-rental maps were compared with the published Prunus refer-ence map (Dirlewanger et al. 2004) to assess colinearity. All8 homologous linkage groups (LGs) of our maps correspondto the homeologous linkage groups of the Prunus referencemap based on alignments with anchor SSR markers (FiguresS1a, S1b, S1c, and S1d).3 All 32 anchor SSR markersmapped in our maps showed perfect conservation of syntenywith the Prunus reference map (Figures S1a, S1b, S1c, andS1d) except for 2 markers on LG1 and LG2 (CPPCT034 andBPPCT040, respectively). Comparison with other apricot
2 Supplementary data for this article are available on the journal Web site (http://genome.nrc.ca) or may be purchased from the Depositoryof Unpublished Data, Document Delivery, CISTI, National Research Council Canada, Building M-55, 1200 Montreal Road, Ottawa, ONK1A 0R6, Canada. DUD 5256. For more information on obtaining material refer to http://cisti-icist.nrc-cnrc.gc.ca/eng/ibp/cisti/collection/unpublished-data.html.
822 Genome Vol. 52, 2009
Published by NRC Research Press

maps showed that the incongruence at the CPPCT034 lociwas consistent between our map and the map by Dondini etal. (2007), thus showing a slight variation within a small ge-netic distance between the peach and apricot genomes.
Phenotypic evaluation and mapping of CR QTLsCR of the parents obtained from the phenotypic assay was
in agreement with previous studies establishing CR at 600and 300 chilling hours for Perfection and A.1740, respec-tively. CR segregated in the mapping population, with 900,600, 500, 400, 300, and 200 chilling hours required for 49,4, 14, 9, 2, and 12 individuals, respectively (Fig. 3). Proge-nies with the parental phenotypes were the least frequent,with 4 and 2 individuals for Perfection and A.1740, respec-
Table 1. SSR markers mapped on Perfection and A.1740 parental maps.
Position (cM)
LocusSegregationtype Classes Perfection A.1740 c2
CPSCT042a <ab�cd> [ac:ad:bc:bd] LG7:43.3 LG7:33.1 10.2**Taly <ab�cd> [ac:ad:bc:bd] — LG2:36.7 1.0BPPCT007a <ef�eg> [ee:ef:eg:fg] LG3:0.0 LG3:0.0 1.6BPPCT025a <ef�eg> [ee:ef:eg:fg] LG6:43.2 LG6:43.2 3.6CPDCT045a <ef�eg> [ee:ef:eg:fg] LG4:14.8 LG4:21.4 0.5CPPCT026a <ef�eg> [ee:ef:eg:fg] LG1:53.0 LG1:51.3 4.0PceGA025a <ef�eg> [ee:ef:eg:fg] LG5:33.8 LG5:28.8 11.8***PceGA034a <ef�eg> [ee:ef:eg:fg] LG2:57.1 LG2:42.1 1.5Pchmgs001a <ef�eg> [ee:ef:eg:fg] LG2:40.9 LG2:31.3 2.5BPPCT013aa <hk�hk> [hh:hk:kk] LG2:29.9 LG2:22.3 0.2CPPCT034aa <hk�hk> [hh+hk+h-:kk] LG1:38.7 LG1:45.9 2.7CPPCT034b <hk�hk> [hh+hk+h-:kk] — LG1:47.7 0.6EPDCU2862a <hk�hk> [hh:hk:kk] LG1:63.3 LG1:64.0 3.1UDP96-005aa <hk�hk> [hh+hk+h-:kk] LG1:38.9 LG1:37.4 1.1BPPCT004 <lm�ll> [ll:lm] LG2:23.9 — 1.7BPPCT028 <lm�ll> [ll:lm] LG1:76.1 — 0.7BPPCT030 <lm�ll> [ll:lm] LG2:42.2 — 0.0BPPCT040 <lm�ll> [ll:lm] LG4:4.7 — 0.0CPDCT025 <lm�ll> [ll:lm] LG3:54.3 — 1.1CPDCT034 <lm�ll> [ll:lm] LG8:22.0 — 0.0CPSCT044 <lm�ll> [ll:lm] LG2: 28.5 — 1.2EPDCU3083b <lm�ll> [ll:lm] LG3:44.7 — 0.0EPDCU3454 <lm�ll> [ll:lm] LG8:42.2 — 0.7Pchcms002 <lm�ll> [ll:lm] LG7:43.6 — 0.8Pchgms044a <lm�ll> [ll:lm] LG3:60.1 — 0.0Pchmgs005 <lm�ll> [ll:lm] LG4:16.4 — 2.3SSRM6a <lm�ll> [ll:lm] LG8:30.9 — 0.4UDA002 <lm�ll> [ll:lm] LG3:45.6 — 0.1UDA011a <lm�ll> [ll:lm] LG8:0.0 — 1.1UDA011b <lm�ll> [ll:lm] LG3:28.9 — 0.0UDP97-403 <lm�ll> [ll:lm] LG3:17.2 — 0.2UDP98-024 <lm�ll> [ll:lm] LG4:8.9 — 0.3UDP98-406 <lm�ll> [ll:lm] LG2:55.6 — 0.1UDP98-409a <lm�ll> [ll:lm] LG8:38.3 — 0.1UDP98-409b <lm�ll> [ll:lm] LG2:37.0 — 0.9UDP98-412 <lm�ll> [ll:lm] LG6:58.8 — 0.2BPPCT039 <nn�np> [nn:np] — LG3:17.6 0.0EPDCU3083a <nn�np> [nn:np] — LG3:21.2 0.0Pchgms044b <nn�np> [nn:np] — LG7:30.5 0.0SSRM2b <nn�np> [nn:np] — LG7:41.0 1.5UDP96-001 <nn�np> [nn:np] — LG6:20.9 1.7UDP96-005b <nn�np> [nn:np] — LG1:38.8 0.7UDP97-401 <nn�np> [nn:np] — LG5:21.1 0.4
Note: LG, linkage group. c2, chi-square values for expected Mendelian segregation ratios (** and ***denote significance at P < 0.01 and P < 0.001, respectively). Segregation types ab�cd, ef�eg, andhk�hk depict segregation in both parents, while lm�ll and nn�np depict segregation in Perfection andA.1740, respectively.
aBridge markers have corresponding map positions on both parental maps.
Olukolu et al. 823
Published by NRC Research Press

tively (Fig. 3). Transgressive segregants were observed forvery low and very high CR (200 and 900 chilling hours).
Following QTL analysis for co-segregation between phe-notypic and genotypic markers using the additive and addi-tive � additive interaction regression model, a total of 12unique QTLs were detected at initial LOD thresholds of9.44 and 8.46 (as determined by a permutation test) for thePerfection and A.1740 maps, respectively. LOD scores ofthe QTL peaks ranged from 10.52 to 64.61, while the QTLsupport intervals were established at 2-LOD support interval(Table 4). The positive additive effects indicate that the fe-male parent with high CR (Perfection) contributed the in-creasing allele, while the negative additive effects indicatethat the male parent with low CR (A.1740) contributed theincreasing allele. Most of the increasing QTL alleles camefrom the high CR parent (Perfection), while 4 of the increas-ing alleles are from the low CR parent (A.1740).
In addition to the one-dimensional genome-wide scan, themain-effect QTLs of digenic interactions were estimated asshown in Table 5. Six main-effect QTLs detected on thePerfection map explained a total of 58.5% ± 6.7% of thephenotypic variance, while 8 main-effect QTLs detected onthe A.1740 map accounted for 66.1% ± 5.8% of the pheno-typic variance (Table 5). Two of the QTLs detected werecommon to both maps on LGs 1 and 8. Distorted markerswere fairly evenly distributed across all linkage groups ex-cept for the region around the QTL on LG6 with a peak at29 cM. The overrepresentation of alleles from A.1740 for alldistorted markers in this genomic region (Fig. 2) corre-sponds with results from QTL analysis showing that the in-creasing allele is from the A.1740 parent (Table 4).
Discussion
Linkage analysis and map constructionComparative mapping within Prunus, as well as among
related genera (Malus, Pyrus, Rosa, Rubus, and Fragaria),has emerged as a potential strategy for genetically exploringeconomically important traits. These maps facilitate the de-tection of genomic intervals that underlie economic traits,some of which have already been shown to segregate in ourmapping population. The high map saturation with AFLPmarkers reduces detection of spurious QTLs and could po-tentially provide (with conversion to sequence tagged sites)
more tightly linked flanking markers for marker-assisted se-lection.
The two high-density parental maps we constructed inapricot correspond well to the Prunus reference map (Dirle-wanger et al. 2004), since all except 2 SSR markers weresyntenic to those in the reference map in all 8 homeologouschromosomes. The incongruence of the 2 SSR markers(CPPCT034 and BPPCT040) occurred within a small ge-netic distance, while the position and incongruence ofCPPCT034 were validated by another apricot map (Dondiniet al. 2007) which was mostly syntenic with our maps. Be-cause of the inclusion of the Prunus anchor SSR loci in ourmaps, all functional genomic resources (ESTs, BAC sequen-ces, whole genome sequences, and cDNAs) from the Prunusdatabase will provide more information for the genomic in-tervals in which detected QTLs exist. Our maps provide bet-ter genome coverage than the previously published apricotmaps. The greater genome coverage observed predominantlyin the Perfection parental map can be attributed to the avail-ability of more markers segregating in this parent. Aligningthe linkage groups with bridge markers in similar order pro-vided evidence for regions on either end of the linkagegroups that are underrepresented in the other parental map(9.2 to 25.8 cM). At P < 0.05, the percentages of markerdistortion in this study (24.60% and 13.98%) were compara-ble with other published works (10.2% to 17%) in apricot(Hurtado et al. 2002; Vilanova et al. 2003; Lambert et al.2004; Lalli et al. 2007).
Phenotypic evaluation and QTL mappingIn this study, 12 unique QTLs for chilling requirement
were mapped in the Perfection � A.1740 population. Owingto limited population size, only QTLs with large effectswere statistically significant; hence, the number of QTLs de-tected in this study should be considered a minimal estimate(Dirlewanger et al. 1999). Our sampling in 2 years spans100 to 900 chilling hours, but only the central portion ofthis range (200–600 h) overlaps between years. A more ro-bust sampling with replicates could allow for better defini-tion or elimination of minor QTLs.
As mentioned earlier, Perfection has high CR, whereasA.1740 has low CR. However, some progenies exhibitedlower CR than A.1740. This could be attributed to epistaticinteractions of different QTL alleles. Some individuals super-
Table 2. AFLP and SSR marker analysis.
Perfection A.1740
Dominant Codominant Dominant Codominant TotalSegregating AFLP loci 879a 21 695a 21 1252Segregating SSR loci 25 18 10 18 53AFLP loci after c2 test 794b 11 668b 11 1136SSR loci after c2 test 25 18 10 18 53AFLP loci mapped (422) 610c 11 (292) 560d 11 1016SSR loci mapped 22 12 7 14 43Total loci in linkage map 632 23 567 25 .
Note: Dominant AFLP markers also include bands heterozygous and segregating in both parents, with 165 ofthem serving as bridge markers: a343, b337, c188, and d268. Numbers in parentheses indicate AFLP markers uniqueto each parental map (i.e., not bridge markers). AFLP and SSR loci that did not map were due to lack of linkage,and unequal numbers of bridge markers were mapped between the 2 parental maps. Total AFLP markers: 422 +(188 – 165) + 292 + (268 – 165) + 165 + 11 = 1016.
824 Genome Vol. 52, 2009
Published by NRC Research Press

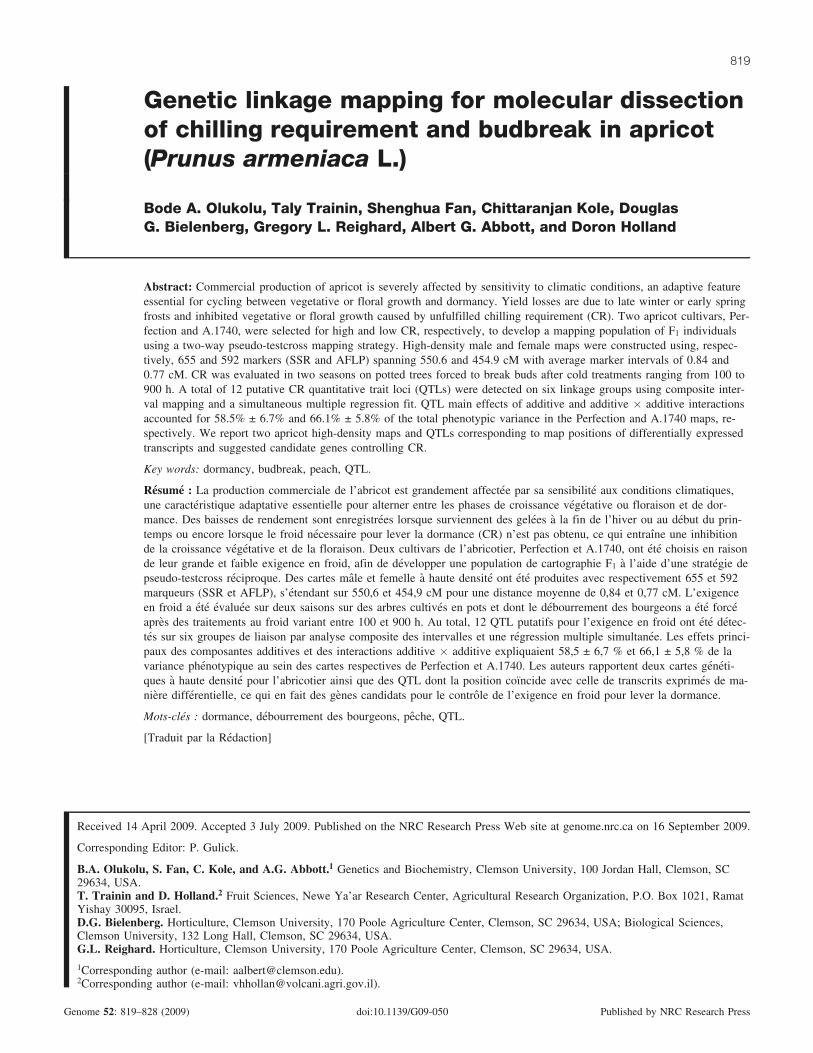
Fig
.1.
Gen
etic
link
age
map
s(l
inka
gegr
oups
1,2,
3,an
d4)
deri
ved
from
aP
erfe
ctio
n×
A.1
740
cros
sor
ient
edw
ith
the
Pru
nus
refe
renc
em
apus
ing
SS
Rm
arke
rs(g
ray
text
;pu
rple
inth
eW
ebve
rsio
n).
AF
LP
brid
gem
arke
rs(b
old
blac
kte
xt)
conf
irm
coli
near
ity
betw
een
pare
ntal
map
s.D
etec
ted
QT
Ls
are
indi
cate
dby
soli
dgr
ay(p
urpl
ein
the
Web
vers
ion)
fill
san
dba
rs,
wit
hco
mm
onQ
TL
sin
cros
shat
chfi
ll.
The
aste
risk
ssh
owth
eχ2
ple
vels
ofsi
gnif
ican
ce(*
,0.
05;
**,
0.01
;**
*,0.
001)
. Pub
lish
edby
NR
CR
esea
rch
Pre
ss

Fig
.2.
Gen
etic
link
age
map
s(l
inka
gegr
oups
5,6,
7,an
d8)
deri
ved
from
aP
erfe
ctio
n×
A.1
740
cros
sor
ient
edw
ith
the
Pru
nus
refe
renc
em
apus
ing
SS
Rm
arke
rs(g
ray
text
;pu
rple
inth
eW
ebve
rsio
n).
AF
LP
brid
gem
arke
rs(b
old
blac
kte
xt)
conf
irm
coli
near
ity
betw
een
pare
ntal
map
s.D
etec
ted
QT
Ls
are
indi
cate
dby
soli
dgr
ay(p
urpl
ein
the
Web
vers
ion)
fill
san
dba
rs,
wit
hco
mm
onQ
TL
sin
cros
shat
chfi
ll.
The
aste
risk
ssh
owth
eχ2
ple
vels
ofsi
gnif
ican
ce(*
,0.
05;
**,
0.01
;**
*,0.
001)
. Pub
lish
edby
NR
CR
esea
rch
Pre
ss

seded the high CR parent. This may be due to contribution ofsome QTL alleles from the low CR parent to these progenies.The transgressive segregants, both positive and negative,may serve as useful materials for future breeding of high andlow CR apricot as required for specific agro-climates.
QTLs detected in this study on LGs 1, 5, 6, 7, and 8 werelocalized to similar map positions in a CR study in peach(Fan et al. 2008). In addition, the SSR markers in apricotmapped within or close to the support intervals of the corre-sponding QTLs in peach. The similarity in QTL positionsbetween peach and apricot deserves special attention be-cause bud flush was studied in peach, while dormancy re-lease of vegetative bud was analyzed in apricot. Thissuggests that similar genes might be involved in these twodifferent physiological processes.
Following detection of QTLs controlling CR and bud-break, the next step is to associate these loci with knowngenes using functional genomics and transcriptome resour-ces. The QTL on LG1 was shown to map to a region corre-sponding to the known location of the evergrowing (EVG)
locus in peach, characterized as comprising MADS-boxtranscription factors (Wang et al. 2002; Bielenberg et al.2004; Bielenberg et al. 2008). The evg mutant is known tolack responsiveness to winter temperatures (i.e., evergrow-ing trees keep growing and are killed by low winter temper-atures). The presence of the wild-type cold-responsive EVGlocus within close proximity of our QTL provides us with apotential gene candidate in this region that has been exten-sively characterized in peach (Bielenberg et al. 2008).
Genomic sequence-based and EST-derived SSR markersthat mapped directly within QTLs on LGs 7 and 8 includedCPSCT042 and EPDCU3454, respectively. The CPSCT042genomic and EPDCU3454 EST sequences showed homol-ogy to the MITOGEN-ACTIVATED PROTEIN KINASE7(MPK7) and ABSCISIC ACID INSENSITIVE3 (ABI3) genes,respectively. ABI3 has been confirmed in several studies tobe primarily responsible for imposition and maintenance ofseed dormancy (Rohde et al. 2002). The processes associ-ated with late seed development, such as reserve accumula-tion, dormancy imposition, and acquisition of tolerance ofseed tissues to desiccation, seem to be controlled by ABI3(Bonetta and McCourt 1998). The gene promoter activity ofABI3 has also been detected in vegetative meristems (Ng etal. 2004). MPK7 is a downstream substrate of MKK3 (aMAPK kinase), and in a few recent studies it has beenshown to have a role in transducing signals involving reac-tive oxygen species (ROS) (Doczi et al. 2007; Pitzschke andHirt 2009) and in turn a corresponding H2O2-induced dor-mancy release in grapevine (Perez and Lira 2005) and rasp-berry (Mazzitelli et al. 2007). Several studies now show thatthe MAPK cascade is not only induced by ROS but can alsoregulate production of ROS (Pitzschke and Hirt 2009).
Utilizing the available Prunus genomic resources (Horn etal. 2005; Zhebentyayeva et al. 2008), we are currently ex-panding our search for candidate CR genes in these majorQTL intervals.
ConclusionsIn this study, we report on 2 high-density parental maps
in apricot constructed by using Prunus SSR anchor markersand saturated by using AFLP markers. A densely populatedmap is required for map-based cloning of economically im-portant genes (Zhang 2008) and dissection of complex traits
Table 3. Data on Perfection and A.1740 maps: number of mapped markers, linkage group and map lengths, marker density, and mar-ker intervals (gaps).
Perfection A.1740
LGNo. ofloci
Map length,cM
Mean distance,cM
Gaps > 2 cM(n)
No. ofloci
Map length,cM
Mean distance,cM
Gaps > 2 cM(n)
1 161 96.1 0.60 2.4, 3.7 149 88.2 0.59 2.4–6.9 (4)2 76 59.6 0.78 2.1–4.3 (3) 52 44.4 0.85 2.1–2.9 (4)3 97 87 0.90 2.1–5.9 (7) 87 58.8 0.68 2.84 68 44.6 0.66 2.2, 2.5 73 58.1 0.80 2.0–4.3 (6)5 47 58.2 1.24 2.0–7.5 (10) 85 44 0.52 2.8, 4.16 86 76.4 0.89 2.0–5.1 (8) 53 63.8 1.20 2.1–4.5 (9)7 64 74 1.16 2.1–6.2 (8) 50 43.5 0.87 2.1–3.7 (4)8 56 54.7 0.98 2.0–4.4 (6) 43 54.1 1.26 3.7–6.3 (3)Total 655 550.6 0.84 592 454.9 0.77 .
Note: LG, linkage group.
Fig. 3. Frequency distribution of chilling requirement (CR) pheno-types in the Perfection � A.1740 mapping population. A.1740 andPerfection had CRs of 300 and 600 chilling hours ({), respectively.Transgressive segregants are indicated by asterisks (*).
Olukolu et al. 825
Published by NRC Research Press

to understand their genetic basis (Frewen et al. 2000). Basedon our current map resolution and the degree of microsyn-teny between peach and apricot (Jung et al. 2006), a candi-date gene approach should be possible for discovery ofgenes involved in CR and budbreak, particularly as thewhole genome sequence of peach is currently been as-sembled (B. Sosinski, personal communication, 2008). How-ever, to assist in this candidate gene endeavor, it isnecessary to detect and locate QTLs more precisely by fine-mapping and other approaches such as association mapping.
AcknowledgementsThis research was supported by research grant No. US-
3746-05 R from the United States – Israel Binational Agri-cultural Research and Development Fund (BARD). The au-thors wish to thank Tatyana N. Zhebentyayeva, Laura L.
Georgi, Renate Horn, Inaki Hormaza, Wu Rongling, and Al-drich Preston for expert technical help.
ReferencesAranzana, M.J., Pineda, A., Cosson, P., Dirlewanger, E., Ascasibar,
J., Cipriani, G., et al. 2003. A set of simple-sequence repeat(SSR) markers covering the Prunus genome. Theor. Appl.Genet. 106(5): 819–825. doi:10.1007/s00122-002-1094-y.PMID:12647055.
Arora, R., Rowland, L.J., and Tanino, K. 2003. Induction and re-lease of bud dormancy in woody perennials: a science comes ofage. HortScience, 38: 911–921.
Bielenberg, D.G., Wang, Y., Fan, S., Reighard, G.L., Scorza, R.,and Abbott, A.G. 2004. A deletion affecting several gene candi-dates is present in the Evergrowing peach mutant. J. Hered.95(5): 436–444. doi:10.1093/jhered/esh057. PMID:15388771.
Bielenberg, D.G., Wang, Y., Li, Z., Zhebentyayeva, T., Fan, S.,
Table 4. QTLs detected for chilling requirement in parental maps using composite interval mapping.
Map LGPosition(cM) SIa LOD
Additiveeffect SSR markers within or close to SI
Perfection 1 82 80–84 61.29 117.19 BPPCT28-76.12 15 13–17 63.56 72.42 BPPCT04-23.96 29 27–31 64.61 602.62 BPPCT25-43.26 66 64–68 50.80 165.93 UDP98-412-58.87 8 6–10 46.15 –205.37 —8 44 42–46 56.44 –221.19 EPDCU3454-42.2
A.1740 1 69 67–71 14.57 400.50 EPDCU2862-641 86 81–89 12.04 265.75 —2 4 2–6 11.78 –301.04 —2 36 34–38 17.29 247.04 Taly-36.75 1 0–3 12.86 –595.14 BPPCT7-0.05 27 25–29 15.54 112.82 EPDCU3083-21.27 26 26–34 11.63 180.82 Pchgms044b-30.5, CPSCT042-33.18 35 33–38 10.52 75.63 —
Note: LG, linkage group. Position, location of the maximum LOD score of the QTL on the LG. Only QTLs aboveempirical LOD thresholds of 9.44 and 8.46 (for the Perfection and A.1740 maps, respectively) are listed (LOD thresh-old computed by 1000 permutations). The positive and negative additive effects indicate that the allele which increasesthe trait values is in Perfection and A.1740, respectively.
a2-LOD support interval in the fit.
Table 5. Digenic interactions of QTLs controlling chilling requirement.
A A � A
QTL 1 QTL 2 R2 (%) Std eff. R2 (%) Std eff.
Perfection (LOD = 17.19, R = 0.765, R2 = 58.5% ± 6.7%)LG1:82 LG7:8 — — 8.9 1.29.*LG2:15 LG8:44 — — 9.0 1.05.*LG6:29 LG6:66 — — 12.4 –1.33.**
A.1740 (LOD = 21.15, R = 0.813, R2 = 66.1% ± 5.8%)LG5:27 — 6.2 0.56* — —LG1:69 LG7:26 — — 16.7 0.95.**LG1:86 LG2:36 — — 15.5 –0.89.**LG2:4 LG2:36 — — 16.7 0.76.**LG2:36 LG5:27 — — 14.1 1.16.**LG5:1 LG8:35 — — 10.1 –1.06.**
Note: A and A � A values are the additive and additive � additive interaction ef-fects of QTLs; R, multiple correlation coefficient; R2, percentage of phenotypic var-iance explained by all the QTL interactions; Std eff., standardized QTL effects. * and** denote significance at P < 0.05 and P < 0.01, respectively.
826 Genome Vol. 52, 2009
Published by NRC Research Press

Reighard, G.L., et al. 2008. Sequencing and annotation of theevergrowing locus in peach [Prunus persica (L.) Batsch] revealsa cluster of six MADS-box transcription factors as candidategenes for regulation of terminal bud formation. Tree Genet.Genomes, 4(3): 495–507. doi:10.1007/s11295-007-0126-9.
Bonetta, D., and McCourt, P. 1998. Genetic analysis of ABA signaltransduction pathways. Trends Plant Sci. 3(6): 231–235. doi:10.1016/S1360-1385(98)01241-2.
Castiglioni, P., Ajmone-Marsan, P., van Wijk, R., and Motto, M.1999. AFLP markers in a molecular linkage map of maize: co-dominant scoring and linkage group distribution. Theor. Appl.Genet. 99(3–4): 425–431. doi:10.1007/s001220051253.
Churchill, G.A., and Doerge, R.W. 1994. Empirical threshold va-lues for quantitative trait mapping. Genetics, 138(3): 963–971.PMID:7851788.
Combes, M.C., Andrzejewski, S., Anthony, F., Bertrand, B., Ro-velli, P., Graziosi, G., and Lashermes, P. 2000. Characterizationof microsatellite loci in Coffea arabica and related coffee spe-cies. Mol. Ecol. 9(8): 1178–1180. doi:10.1046/j.1365-294x.2000.00954-5.x. PMID:10964241.
Coville, F.V. 1920. The influence of cold in stimulating the growthof plants. J. Agric. Res. 20: 151–192.
Dietrichson, J. 1964. The selection problem and growth rhythm.Silvae Genet. 13: 178–184.
Dirlewanger, E., Moing, A., Rothan, C., Svanella, L., Pronier, V.,Guye, A., et al. 1999. Mapping QTLs controlling fruit qualityin peach [Prunus persica (L.) Batsch.]. Theor. Appl. Genet.98(1): 18–31. doi:10.1007/s001220051035.
Dirlewanger, E., Graziano, E., Joobeur, T., Garriga-Caldere, F.,Cosson, P., Howad, W., and Arus, P. 2004. Comparative map-ping and marker-assisted selection in Rosaceae fruit crops.Proc. Natl. Acad. Sci. U.S.A. 101(26): 9891–9896. doi:10.1073/pnas.0307937101. PMID:15159547.
Doczi, R., Brader, G., Pettko-Szandtner, A., Rajh, I., Djamei, A.,Pitzschke, A., et al. 2007. The Arabidopsis mitogen-activatedprotein kinase kinase MKK3 is upstream of group C mitogen-activated protein kinases and participates in pathogen signaling.Plant Cell, 19(10): 3266–3279. doi:10.1105/tpc.106.050039.PMID:17933903.
Dondini, L., Lain, O., Geuna, F., Banfi, R., Gaiotti, F., Tartarini,S., et al. 2007. Development of a new SSR-based linkage mapin apricot and analysis of synteny with existing Prunus maps.Tree Genet. Genomes, 3(3): 239–249. doi:10.1007/s11295-006-0059-8.
Eldredge, L., Ballard, R., Baird, W.V., Abbott, A., Morgens, P.,Callahan, A., et al. 1992. Application of RFLP analysis to ge-netic-linkage mapping in peaches. HortScience, 27(2): 160–163.
Falque, M. 2005. IRILmap: linkage map distance correction for in-termated recombinant inbred lines/advanced recombinant inbredstrains. Bioinformatics, 21(16): 3441–3442. doi:10.1093/bioinformatics/bti543. PMID:15961443.
Fan, S., Bielenberg, D., Zhebentyayeva, T., Reighard, G., and Ab-bott, A. 2008. QTL analysis of chilling requirement. In 4th In-ternational Rosaceae Genomics Conference, Pucon, Chile, 16–19 March 2008. [Abstr.]
Frewen, B.E., Chen, T.H.H., Howe, G.T., Davis, J., Rohde, A.,Boerjan, W., and Bradshaw, H.D., Jr. 2000. Quantitative traitloci and candidate gene mapping of bud set and bud flush in po-pulus. Genetics, 154(2): 837–845. PMID:10655234.
Grattapaglia, D., and Sederoff, R. 1994. Genetic linkage maps ofEucalyptus grandis and Eucalyptus urophylla using a pseudo-testcross: mapping strategy and RAPD markers. Genetics,137(4): 1121–1137. PMID:7982566.
Haley, C.S., and Knott, S.A. 1992. A simple regression method for
mapping quantitative trait loci in line crosses using flankingmarkers. Heredity, 69(4): 315–324. PMID:16718932.
Hatch, A.H., and Walker, D.R. 1969. Rest intensity of dormantpeach and apricot leaf buds as influenced by temperature, coldhardiness and respiration. J. Am. Soc. Hortic. Sci. 94(3): 304–307.
Hill, J., Becker, H.C., and Tigerstedt, P.M.A. 1998. Quantitativeand ecological aspects of plant breeding. St. EdmundsburyPress, Suffolk, U.K.
Hjorth, J.S.U. 1994. Computer intensive statistical methods. Chap-man & Hall, New York.
Horn, R., Lecouls, A.C., Callahan, A., Dandekar, A., Garay, L.,McCord, P., et al. 2005. Candidate gene database and transcriptmap for peach, a model species for fruit trees. Theor. Appl.Genet. 110(8): 1419–1428. doi:10.1007/s00122-005-1968-x.PMID:15846479.
Hurtado, M.A., Westman, A., Beck, E., Abbott, G.A., Llacer, G.,and Badenes, M.L. 2002. Genetic diversity in apricot cultivarsbased on AFLP markers. Euphytica, 127(2): 297–301. doi:10.1023/A:1020206601328.
Jung, S., Main, D., Staton, M., Cho, I., Zhebentyayeva, T., Arus,P., and Abbott, A. 2006. Synteny conservation between the Pru-nus genome and both the present and ancestral Arabidopsis gen-omes. BMC Genomics, 7(1): 81. doi:10.1186/1471-2164-7-81.PMID:16615871.
Jung, S., Staton, M., Lee, T., Blenda, A., Svancara, R., Abbott, A.,and Main, D. 2008. GDR (Genome Database for Rosaceae): in-tegrated web-database for Rosaceae genomics and genetics data.Nucleic Acids Res. 36(Database issue): D1034–D1040. doi:10.1093/nar/gkm803.
Kosambi, D.D. 1944. The estimation of map distance from recom-bination values. Ann. Eugen. 12: 172–175.
Lalli, D.A., Abbott, A.G., Zhebentyayeva, T.N., Badenes, M.L.,Damsteegt, V., Polak, J., et al. 2007. A genetic linkage map foran apricot (Prunus armeniaca L.) BC1 population mapping plumpox virus resistance. Tree Genet. Genomes, 4(3): 481–493.doi:10.1007/s11295-007-0125-x.
Lambert, P., Hagen, L.S., Arus, P., and Audergon, J.M. 2004. Ge-netic linkage maps of two apricot cultivars (Prunus armeniacaL.) compared with the almond Texas � peach Earlygold refer-ence map for Prunus. Theor. Appl. Genet. 108(6): 1120–1130.doi:10.1007/s00122-003-1526-3. PMID:15067399.
Lander, E.S., Green, P., Abrahamson, J., Barlow, A., Daly, M.J.,Lincoln, S.E., and Newburg, L. 1987. MAPMAKER: an interac-tive computer package for constructing primary genetic linkagemaps of experimental and natural populations. Genomics, 1(2):174–181. doi:10.1016/0888-7543(87)90010-3. PMID:3692487.
Lang, G.A., Early, J.D., Martin, G.C., and Darnell, R.L. 1987. En-dodormancy, paradormancy, and ecodormancy — physiologicalterminology and classification for dormancy research.HortScience, 22(3): 371–377.
Lodhi, M.A., Daly, M.J., Ye, G.-N., Weeden, N.F., and Reisch, B.I.1995. A molecular marker based linkage map of Vitis. Genome,38(4): 786–794. doi:10.1139/g95-100. PMID:7672609.
Maliepaard, C., Jansen, J., and Van Ooijen, J.W. 1997. Linkageanalysis in a full-sib family of an outbreeding plant species:overview and consequences for application. Genet. Res. 70(3):237–250. doi:10.1017/S0016672397003005.
Mathiason, K., He, D., Grimplet, J., Venkateswari, J., Galbraith,D.W., Or, E., and Fennell, A. 2009. Transcript profiling in Vitisriparia during chilling requirement fulfillment reveals coordina-tion of gene expression patterns with optimized bud break.Funct. Integr. Genomics, 9(1): 81–96. doi:10.1007/s10142-008-0090-y. PMID:18633655.
Olukolu et al. 827
Published by NRC Research Press

Mazzitelli, L., Hancock, R.D., Haupt, S., Walker, P.G., Pont, S.D.,McNicol, J., et al. 2007. Co-ordinated gene expression duringphases of dormancy release in raspberry (Rubus idaeus L.)buds. J. Exp. Bot. 58(5): 1035–1045. doi:10.1093/jxb/erl266.PMID:17244630.
Ng, D.W., Chandrasekharan, M.B., and Hall, T.C. 2004. The 5’UTR negatively regulates quantitative and spatial expressionfrom the ABI3 promoter. Plant Mol. Biol. 54(1): 25–38. doi:10.1023/B:PLAN.0000028767.06820.34. PMID:15159632.
Perez, F.J., and Lira, W. 2005. Possible role of catalase in post-dor-mancy bud break in grapevines. J. Plant Physiol. 162(3): 301–308. doi:10.1016/j.jplph.2004.07.011. PMID:15832682.
Pitzschke, A., and Hirt, H. 2009. Disentangling the complexity ofmitogen-activated protein kinases and reactive oxygen speciessignaling. Plant Physiol. 149(2): 606–615. doi:10.1104/pp.108.131557. PMID:19201916.
Porebski, S., Bailey, L.G., and Baum, B.R. 1997. Modification of aCTAB DNA extraction protocol for plants containing high poly-saccharide and polyphenol components. Plant Mol. Biol. Rep.15(1): 8–15. doi:10.1007/BF02772108.
Qi, X.Q., Stam, P., and Lindhout, P. 1996. Comparison and inte-gration of four barley genetic maps. Genome, 39(2): 379–394.doi:10.1139/g96-049. PMID:18469901.
Rohde, A., Prinsen, E., De Rycke, R., Engler, G., Van Montagu,M., and Boerjan, W. 2002. PtABI3 impinges on the growth anddifferentiation of embryonic leaves during bud set in poplar.Plant Cell, 14(8): 1885–1901. doi:10.1105/tpc.003186. PMID:12172029.
Rohde, A., Ruttink, T., Hostyn, V., Sterck, L., Van Driessche, K.,and Boerjan, W. 2007. Gene expression during the induction,maintenance, and release of dormancy in apical buds of poplar.J. Exp. Bot. 58(15-16): 4047–4060. doi:10.1093/jxb/erm261.PMID:18039739.
Ruiz, D., Campoy, J.A., and Egea, J. 2007. Chilling and heat re-quirements of apricot cultivars for flowering. Environ. Exp.Bot. 61(3): 254–263. doi:10.1016/j.envexpbot.2007.06.008.
Scorza, R., and Okie, W.R. 1990. Peaches (Prunus persica L.Batsch). Acta Hortic. 290: 177–231.
Utz, H.F., and Melchinger, A.E. 1995. PLABQTL: a computer pro-gram to map QTL. Version 1.0. University of Hohenheim.
Utz, H.F., and Melchinger, A.E. 1996. PLABQTL: a program forcomposite interval mapping of QTL. JQTL 2(1).
Van Ooijen, J.W., and Voorrips, R.E. 2001. JoinMap1 3.0, Soft-ware for the calculation of genetic linkage maps. Plant ResearchInternational, Wageningen, the Netherlands.
Van Ooijen, J.W., Sandbrink, J.M., Vrielink, M., Verkerk, R., Za-
bel, P., and Lindhout, P. 1994. An RFLP linkage map of Lyco-persicon peruvianum. Theor. Appl. Genet. 89(7–8): 1007–1013.
Vilanova, S., Romero, C., Abbott, A.G., Llacer, G., and Badenes,M.L. 2003. An apricot (Prunus armeniaca L.) F2 progeny link-age map based on SSR and AFLP markers, mapping plum poxvirus resistance and self-incompatibility traits. Theor. Appl.Genet. 107(2): 239–247. doi:10.1007/s00122-003-1243-y.PMID:12845439.
Voorrips, R.E. 2002. MapChart: software for the graphical presen-tation of linkage maps and QTLs. J. Hered. 93(1): 77–78.doi:10.1093/jhered/93.1.77. PMID:12011185.
Vos, P., Hogers, R., Bleeker, M., Reijans, M., van de Lee, T.,Hornes, M., et al. 1995. AFLP: a new technique for DNA fin-gerprinting. Nucleic Acids Res. 23(21): 4407–4414. doi:10.1093/nar/23.21.4407. PMID:7501463.
Wang, Y., Georgi, L.L., Reighard, G.L., Scorza, R., and Abbott,A.G. 2002. Genetic mapping of the evergrowing gene in peach[Prunus persica (L.) Batsch]. J. Hered. 93(5): 352–358. doi:10.1093/jhered/93.5.352. PMID:12547924.
Weinberger, J.H. 1950. Chilling requirements of peach varieties.Proc. Am. Soc. Hortic. Sci. 56: 122–128.
Winkler, C.R., Jensen, N.M., Cooper, M., Podlich, D.W., andSmith, O.S. 2003. On the determination of recombination ratesin intermated recombinant inbred populations. Genetics, 164(2):741–745. PMID:12807793.
Wu, R.L., Ma, C.X., Painter, I., and Zeng, Z.B. 2002. Simultaneousmaximum likelihood estimation of linkage and linkage phases inoutcrossing species. Theor. Popul. Biol. 61(3): 349–363. doi:10.1006/tpbi.2002.1577. PMID:12027621.
Wu, R.L., Ma, C.X., and Casella, G. 2007. Statistical genetics ofquantitative traits: linkage, maps, and QTL. Springer-Verlag,New York.
Zeng, Z.B. 1993. Theoretical basis for separation of multiple linkedgene effects in mapping quantitative trait loci. Proc. Natl. Acad.Sci. U.S.A. 90(23): 10972–10976. doi:10.1073/pnas.90.23.10972. PMID:8248199.
Zeng, Z.B. 1994. Precision mapping of quantitative trait loci. Ge-netics, 136(4): 1457–1468. PMID:8013918.
Zhang, H.B. 2008. Map-based cloning of genes and quantitativetrait loci. In Principles and practices of plant genomics. Vol. 1.Genome mapping. Edited by C. Kole and A.G. Abbott. SciencePublishers, Enfield, N.H. pp. 229–267.
Zhebentyayeva, T.N., Swire-Clark, G., Georgi, L.L., Garay, L.,Jung, S., Forrest, S., et al. 2008. A framework physical map forpeach, a model Rosaceae species. Tree Genet. Genomes, 4(4):745–756. doi:10.1007/s11295-008-0147-z.
828 Genome Vol. 52, 2009
Published by NRC Research Press