Cervical carcinoma-associated fibroblasts are DNA diploid and do not show evidence for somatic...
12
Genome Haploidisation with Chromosome 7 Retention in Oncocytic Follicular Thyroid Carcinoma Willem E. Corver 1 *, Dina Ruano 1 , Karin Weijers 1 , Wietske C. E. den Hartog 1 , Merlijn P. van Nieuwenhuizen 1 , Noel de Miranda 1 , Ronald van Eijk 1 , Anneke Middeldorp 1 , Ekaterina S. Jordanova 1 , Jan Oosting 1 , Ellen Kapiteijn 2 , Guido Hovens 3 , Jan Smit 3 , Tom van Wezel 1 , Hans Morreau 1 * 1 Department of Pathology, Leiden University Medical Center, Leiden, The Netherlands, 2 Department of Clinical Oncology, Leiden University Medical Center, Leiden, The Netherlands, 3 Department of Endocrinology, Leiden University Medical Center, Leiden, The Netherlands Abstract Background: Recurrent non-medullary thyroid carcinoma (NMTC) is a rare disease. We initially characterized 27 recurrent NMTC: 13 papillary thyroid cancers (PTC), 10 oncocytic follicular carcinomas (FTC-OV), and 4 non-oncocytic follicular carcinomas (FTC). A validation cohort composed of benign and malignant (both recurrent and non-recurrent) thyroid tumours was subsequently analysed (n = 20). Methods: Data from genome-wide SNP arrays and flow cytometry were combined to determine the chromosomal dosage (allelic state) in these tumours, including mutation analysis of components of PIK3CA/AKT and MAPK pathways. Results: All FTC-OVs showed a very distinct pattern of genomic alterations. Ten out of 10 FTC-OV cases showed near- haploidisation with or without subsequent genome endoreduplication. Near-haploidisation was seen in 5/10 as extensive chromosome-wide monosomy (allelic state [A]) with near-haploid DNA indices and retention of especially chromosome 7 (seen as a heterozygous allelic state [AB]). In the remaining 5/10 chromosomal allelic states AA with near diploid DNA indices were seen with allelic state AABB of chromosome 7, suggesting endoreduplication after preceding haploidisation. The latter was supported by the presence of both near-haploid and endoreduplicated tumour fractions in some of the cases. Results were confirmed using FISH analysis. Relatively to FTC-OV limited numbers of genomic alterations were identified in other types of recurrent NMTC studied, except for chromosome 22q which showed alterations in 6 of 13 PTCs. Only two HRAS, but no mutations of EGFR or BRAF were found in FTC-OV. The validation cohort showed two additional tumours with the distinct pattern of genomic alterations (both with oncocytic features and recurrent). Conclusions: We demonstrate that recurrent FTC-OV is frequently characterised by genome-wide DNA haploidisation, heterozygous retention of chromosome 7, and endoreduplication of a near-haploid genome. Whether normal gene dosage on especially chromosome 7 (containing EGFR, BRAF, cMET) is crucial for FTC-OV tumour survival is an important topic for future research. Microarrays: Data are made available at GEO (GSE31828). Citation: Corver WE, Ruano D, Weijers K, den Hartog WCE, van Nieuwenhuizen MP, et al. (2012) Genome Haploidisation with Chromosome 7 Retention in Oncocytic Follicular Thyroid Carcinoma. PLoS ONE 7(6): e38287. doi:10.1371/journal.pone.0038287 Editor: Marian Ludgate, Cardiff University, United Kingdom Received November 2, 2011; Accepted May 3, 2012; Published June 1, 2012 Copyright: ß 2012 Corver et al. This is an open-access article distributed under the terms of the Creative Commons Attribution License, which permits unrestricted use, distribution, and reproduction in any medium, provided the original author and source are credited. Funding: The authors have no support or funding to report. Competing Interests: The authors have declared that no competing interests exist. * E-mail: [email protected] (WEC); [email protected] (HM) Introduction Thyroid cancer is a common disease of the endocrine system with a worldwide incidence rate of approximately 212,000 new cases and 35,000 related cancer deaths per year [1]. Differentiated thyroid cancer can be subdivided into medullary (MTC) and non- medullary (NMTC) thyroid carcinoma. Differentiated NMTC is the most common, and two subgroups, papillary thyroid cancer (PTC) and follicular thyroid cancer (FTC), account for approx- imately 95% of all thyroid cancers. Many variants of these subgroups have been identified, including a follicular variant of PTC (FVPTC) and the Hu ¨rthle cell or oncocytic variant of FTC (FTC-OV). The large majority of patients with differentiated thyroid carcinoma have a favourable prognosis and patient cure is achieved by thyroidectomy, followed by adjuvant radioactive iodine treatment. However, approximately 5% of patients show recurrent disease, mostly due to impaired radioactive iodine- response, frequently leading to death within 5 years of surgical intervention [2]. Treatment options for these recurrent cases remain limited. Oncocytic carcinomas are characterised by mitochondrial hyperplasia, which gives rise to distinctive morphologic features typified by a strong eosinophilic cytoplasm in conventional histology. The accumulation of mitochondria is associated with mutations of mitochondrial DNA (mtDNA) in one of the three PLoS ONE | www.plosone.org 1 June 2012 | Volume 7 | Issue 6 | e38287
-
Upload
independent -
Category
Documents
-
view
0 -
download
0
Transcript of Cervical carcinoma-associated fibroblasts are DNA diploid and do not show evidence for somatic...

Genome Haploidisation with Chromosome 7 Retention inOncocytic Follicular Thyroid CarcinomaWillem E. Corver1*, Dina Ruano1, Karin Weijers1, Wietske C. E. den Hartog1, Merlijn P. van
Nieuwenhuizen1, Noel de Miranda1, Ronald van Eijk1, Anneke Middeldorp1, Ekaterina S. Jordanova1,
Jan Oosting1, Ellen Kapiteijn2, Guido Hovens3, Jan Smit3, Tom van Wezel1, Hans Morreau1*
1 Department of Pathology, Leiden University Medical Center, Leiden, The Netherlands, 2 Department of Clinical Oncology, Leiden University Medical Center, Leiden, The
Netherlands, 3 Department of Endocrinology, Leiden University Medical Center, Leiden, The Netherlands
Abstract
Background: Recurrent non-medullary thyroid carcinoma (NMTC) is a rare disease. We initially characterized 27 recurrentNMTC: 13 papillary thyroid cancers (PTC), 10 oncocytic follicular carcinomas (FTC-OV), and 4 non-oncocytic follicularcarcinomas (FTC). A validation cohort composed of benign and malignant (both recurrent and non-recurrent) thyroidtumours was subsequently analysed (n = 20).
Methods: Data from genome-wide SNP arrays and flow cytometry were combined to determine the chromosomal dosage(allelic state) in these tumours, including mutation analysis of components of PIK3CA/AKT and MAPK pathways.
Results: All FTC-OVs showed a very distinct pattern of genomic alterations. Ten out of 10 FTC-OV cases showed near-haploidisation with or without subsequent genome endoreduplication. Near-haploidisation was seen in 5/10 as extensivechromosome-wide monosomy (allelic state [A]) with near-haploid DNA indices and retention of especially chromosome 7(seen as a heterozygous allelic state [AB]). In the remaining 5/10 chromosomal allelic states AA with near diploid DNAindices were seen with allelic state AABB of chromosome 7, suggesting endoreduplication after preceding haploidisation.The latter was supported by the presence of both near-haploid and endoreduplicated tumour fractions in some of thecases. Results were confirmed using FISH analysis. Relatively to FTC-OV limited numbers of genomic alterations wereidentified in other types of recurrent NMTC studied, except for chromosome 22q which showed alterations in 6 of 13 PTCs.Only two HRAS, but no mutations of EGFR or BRAF were found in FTC-OV. The validation cohort showed two additionaltumours with the distinct pattern of genomic alterations (both with oncocytic features and recurrent).
Conclusions: We demonstrate that recurrent FTC-OV is frequently characterised by genome-wide DNA haploidisation,heterozygous retention of chromosome 7, and endoreduplication of a near-haploid genome. Whether normal gene dosageon especially chromosome 7 (containing EGFR, BRAF, cMET) is crucial for FTC-OV tumour survival is an important topic forfuture research.
Microarrays: Data are made available at GEO (GSE31828).
Citation: Corver WE, Ruano D, Weijers K, den Hartog WCE, van Nieuwenhuizen MP, et al. (2012) Genome Haploidisation with Chromosome 7 Retention inOncocytic Follicular Thyroid Carcinoma. PLoS ONE 7(6): e38287. doi:10.1371/journal.pone.0038287
Editor: Marian Ludgate, Cardiff University, United Kingdom
Received November 2, 2011; Accepted May 3, 2012; Published June 1, 2012
Copyright: � 2012 Corver et al. This is an open-access article distributed under the terms of the Creative Commons Attribution License, which permitsunrestricted use, distribution, and reproduction in any medium, provided the original author and source are credited.
Funding: The authors have no support or funding to report.
Competing Interests: The authors have declared that no competing interests exist.
* E-mail: [email protected] (WEC); [email protected] (HM)
Introduction
Thyroid cancer is a common disease of the endocrine system
with a worldwide incidence rate of approximately 212,000 new
cases and 35,000 related cancer deaths per year [1]. Differentiated
thyroid cancer can be subdivided into medullary (MTC) and non-
medullary (NMTC) thyroid carcinoma. Differentiated NMTC is
the most common, and two subgroups, papillary thyroid cancer
(PTC) and follicular thyroid cancer (FTC), account for approx-
imately 95% of all thyroid cancers. Many variants of these
subgroups have been identified, including a follicular variant of
PTC (FVPTC) and the Hurthle cell or oncocytic variant of FTC
(FTC-OV).
The large majority of patients with differentiated thyroid
carcinoma have a favourable prognosis and patient cure is
achieved by thyroidectomy, followed by adjuvant radioactive
iodine treatment. However, approximately 5% of patients show
recurrent disease, mostly due to impaired radioactive iodine-
response, frequently leading to death within 5 years of surgical
intervention [2]. Treatment options for these recurrent cases
remain limited.
Oncocytic carcinomas are characterised by mitochondrial
hyperplasia, which gives rise to distinctive morphologic features
typified by a strong eosinophilic cytoplasm in conventional
histology. The accumulation of mitochondria is associated with
mutations of mitochondrial DNA (mtDNA) in one of the three
PLoS ONE | www.plosone.org 1 June 2012 | Volume 7 | Issue 6 | e38287
energy-transducing enzyme complexes of the respiratory chain. In
the FTC-OV, mtDNA mutations are mostly found in NADH-
ubiquinone oxidoreductase of complex I [3], resulting in loss of
enzyme activity. Due to the dysfunction of oxidative phosphory-
lation, cells become dependent on glycolysis for energy produc-
tion.
Progress has been made in further understanding the underlying
genetic alterations in thyroid cancer. In NMTC chromosomal
aberrations encompassing chromosomal losses or gains have been
described [4–6] although no specific pattern was recognized
(recently reviewed in [7] and [8]). One study suggested a relation
between numerical chromosomal aberrations, oncocytic follicular
thyroid carcinoma and recurrence [9]. BRAF and RAS mutations,
and RET-chromosomal rearrangements (RET/PTC and RET/
NTRK1) have been identified in approximately 35–70% of cases of
PTCs [10]. The BRAF V600E mutation was also found in 26% of
FVPTC cases [11]. Interestingly, BRAF and RAS mutations, and
RET/PTC rearrangements appear to be mutually exclusive [6,12],
and the less common RET/NTRK1 rearrangement, present in
5.5% of the PTCs, is absent from RET/PTC-associated PTC [13].
While BRAF-RAS mutations and RET-chromosomal rearrange-
ments are rarely seen in FTCs [14], PAX8/PPARc rearrangements
are seen at frequencies of 30–40% [15] and PIK3CA copy number
gains and mutations have also been recently found in FTCs [16].
While all of these somatic DNA alterations are known to be
involved in the PIK3CA/AKT and MAPK pathways, the
upstream receptors of these signalling pathways, EGFR and
VEGFR1, also display copy number gains in about 32% and
44% of FTCs, respectively [16]. These studies strongly implicate
the PIK3CA/AKT and MAPK signalling pathways in thyroid
carcinogenesis and suggest that tailored compounds targeting
these pathways might be therapeutically beneficial. Phase II trials
including a variety of multi-kinase inhibitors are ongoing or have
been completed (reviewed by Kapiteijn et al. [17]) and partial
responses and stable disease were observed in patients with
differentiated thyroid carcinoma [18].
Many of the abovementioned studies used primary NMTC
tissue, without further information on recurrence in the patient. In
order to better characterise recurrent NMTC, we analysed
primary tumour tissue from a cohort of twenty-seven NMTC
patients showing recurrence, comprising mainly PTCs or FTC-
OV tumours. These patients were previously enrolled in a clinical
trial with sorafenib, a multi-kinase inhibitor targeting the MAPK
pathway [17,19]. We carried out a DNA copy number analysis of
tumour tissue using genome-wide SNP arrays and integrated
information on DNA content into these data. By combining these
data with allele-specific intensity, we were able to derive an
estimation of the true chromosomal dosage in these tumours. We
validated our findings in a cohort of twenty frozen benign and
malignant (both recurrent and non-recurrent) thyroid tumours.
This analysis was complemented by mutation analysis of
molecular components of the PIK3CA/AKT and MAPK
pathways.
Materials and Methods
Patient material and flow cytometryTwenty-seven patients with recurrent non-medullary thyroid
carcinoma were included in the study. These patients were
enrolled under an earlier study protocol [19], approved by the
Institutional Review Board of the Leiden University Medical
Center. This study has been registered at ClinicalTrials.gov (#NCT00887107). Informed written consent was obtained from all
patients in the study.
Formalin fixed paraffin embedded (FFPE) primary thyroid
carcinoma samples of the primary study were obtained from a
number of pathology departments in the Netherlands. For
validation frozen primary thyroid tumour samples were selected
from twenty patients (Dept. of Pathology, LUMC). One of these
patients took also part in the primary study (primary study Table 1,
No. 9; validation study Table 2, No. 39).
Samples were handled according to the medical ethical
guidelines described in the Code Proper Secondary Use of
Human Tissue established by the Dutch Federation of Medical
Sciences (www.federa.org). Paraffin or frozen sections were taken
from all samples, haematoxylin and eosin stained, and reviewed by
a pathologist (HM).
Multiparameter DNA flow cytometry of FFPE sampleCell suspensions were prepared for multiparameter DNA flow
cytometry from three to four 2 mm diameter FFPE tissue punches
(Beecher Instruments, distributed by K7 Biosystems Inc. Chicago,
IL). Punches were dewaxed and submerged in citrate buffer for
heat-induced antigen retrieval (HIAR) at 80uC for 60 min,
followed by dissociation using collagenase/dispase at 37uC.
Harvested cells were washed, counted and stored on ice. Next,
cell suspensions were indirectly labelled for stromal cells
(allophycocyanin, APC), epithelial cells (fluorescein isothiocyanate,
FITC) and DNA (propidium iodide, PI) simultaneously and
analysed on an LSRII flow cytometer (BD Biosciences, Erembo-
degem, Belgium) [20].
DNA IsolationIn order to enrich for tumour DNA, 0.6 mm diameter tissue
punches (Beecher Instruments) were taken from selected tumour
areas. From the frozen samples three to six 10 mm sections were
taken using a cryostat. DNA from FFPE samples or frozen samples
was isolated by an overnight or 2 hour digestion with proteinase K
at 56uC, respectively. Next (morning), DNA was purified using the
NucleoSpin purification kit (Macherey-Nagel GmbH & Co. KG,
Duren, BRD) according to the manufacturer’s instructions. DNA
concentrations were determined using the Picogreen method (Life
Technologies Europe BV, Bleiswijk, The Netherlands).
SNP Array AnalysisIn the initial series 6k SNP arrays (GoldenGate assay, Illumina,
Eindhoven, The Netherlands) experiments were performed at the
Leiden Genome Technology Center (http://www.lgtc.nl), as
described with minor modifications: [21] 0.4–1.0 mg DNA was
used as input in a multi-use activation step and was subsequently
dissolved in 60 ml resuspension buffer. Genotype, genotype quality
call score (GCS), and the allele specific raw intensities were
extracted using Beadstudio 2.3 (Illumina,). The beadarraySNP
package was adapted to combine copy number profiles, allele-
specific intensities and the DNA index, allowing the determination
of the allelic state for all genomic regions [22].
Briefly, the normalised intensity signal (copy number) and the
so-called lesser allele intensity ration (LAIR) values are subjected
to a segmentation procedure, which allows the identification of
genomic regions that share the same allelic state [21]. The LAIR
value is a measure of the contribution of the two parental alleles to
a genomic region. This value is close to 1 when the contribution of
both alleles of a SNP to the total intensity in the tumour is similar
to that of the reference sample. The value is close to 0 when there
is no signal for one of the alleles in the tumour (as in LOH). Allelic
imbalances will show intermediate values. Regions with a lesser
allele intensity ratio close to 1 should have an even copy number
because both alleles are in balance. The calculated DNA index
Near-Haploid Oncocytic Follicular Thyroid Cancer
PLoS ONE | www.plosone.org 2 June 2012 | Volume 7 | Issue 6 | e38287
obtained by LAIR analysis (LAIR index) from the summing of the
number of alleles for each SNP should match the DNA index
measured by flow cytometry. This is used to calibrate the allelic
copy number in each genomic region, referred to as the ‘‘allelic
state’’. The following allelic states can be distinguished: [AB],
normal; [A], LOH or physical loss in the context of a diploid
genome but monosomy in the context of a haploid genome; [AA],
copy-neutral LOH; [AAA] or [AAAA] etc., amplified LOH;
[AABB] or [AAABBB] etc., amplified heterozygous state; [AAB],
[AAAB], [AAABB] or [AAAABB] etc., imbalanced gain. All array
data is MIAME compliant and the raw data has been deposited in
GEO (http://www.ncbi.nlm.nih.gov/geo/query/acc.
cgi?token = fnibdumqmooeezu&acc = GSE31828).
For the validation series CytoSNP-12 (Illumina, USA) high-
density SNP-arrays were used according to the manufacturer
instructions. After HE guided evaluation of snap frozen tumours
the tissue was sectioned. DNA was isolated as described above and
4 ml of DNA was processed according to the Infinium HD Ultra
Assay protocol and used for hybridization. Sample processing and
hybridisation was performed by ServiceXS (Leiden, The Nether-
lands).
Interphase FISH analysisThe chromosome 7 centromeric region probe (p7t1 alphoid
satellite probe) and the a-satellite centromeric chromosome 6-
probe (D6Z1, Oncor, Gaithersburg, MD) were labelled with biotin
by standard nick-translation. For EGFR, PAC clone RP5-1091E12
was selected from the Ensembl Genome Browser and was labelled
with digoxigenin-12-dUTP (Roche, Basel, Switzerland) by stan-
dard nick translation. The hybridisation solution contained 50%
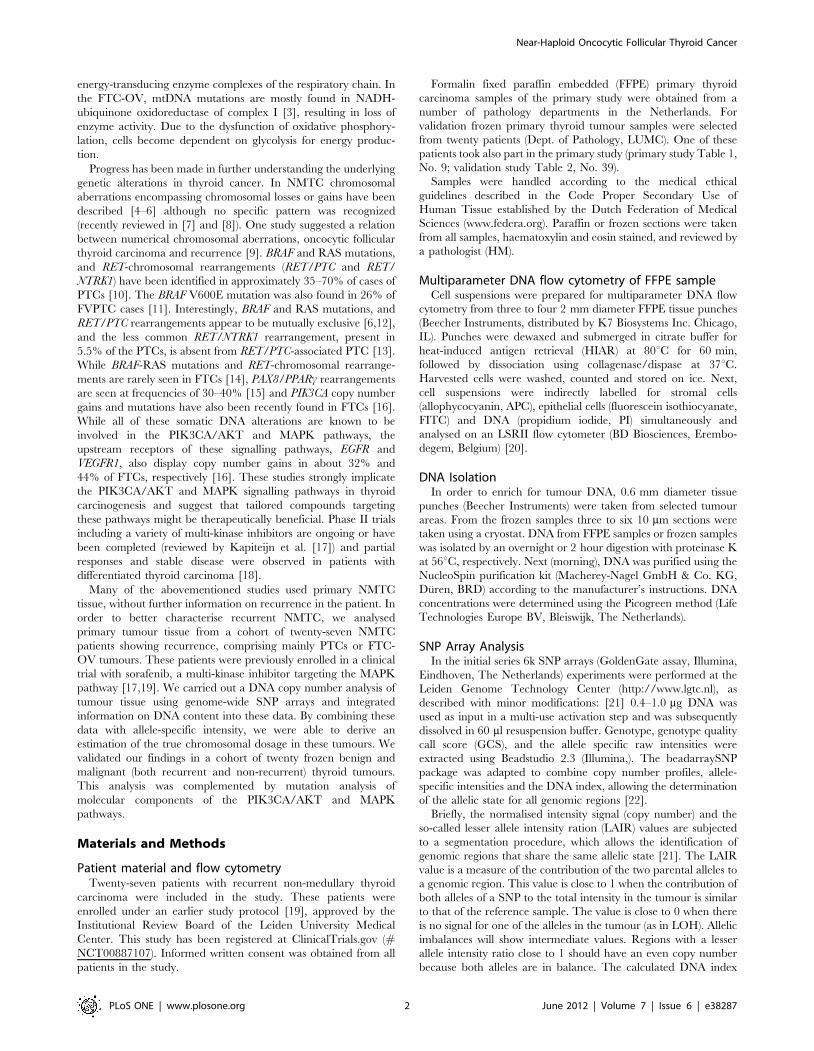
Table 1. Summary of results of the analysis of 27 recurrent NMTC tumours: DNA index, allelic state and chromosome copy numberdetermined by FISH for chromosomes 6 (centromeric probe) and 7 (centromeric and EGFR locus specific probes) and mutationanalysis of BRAF, EGFR, RAS (HRAS, KRAS and NRAS) genes and PIK3CA.
Patient No.Tumourtype Gender
Age atdiagnosis
DNAindex#
Chr. 6 allelicstate(centromericregion)
Chr. 6FISHcopynumber
Chr. 7allelic state(centromericregion)
Chr. 7 FISHcopy number BRAF EGFR RAS PIK3CA
1 FTC m 74 1.01 AB nd AB nd 2 2 NRAS 2
2 FTC f 59 0.98 AB nd AB nd 2 2 2 2
3 FTC m 82 0.90 AB nd AB nd 2 2 2 2
4 FTC/FVPC f 65 1.02 AB nd AB nd 2 2 2 2
5 FTC-OV m 77 0.73 AAAA 2 AB 2 2 2 2 2
6 FTC-OV m 68 0.71 A 1 AB 2 2 2 2 2
7 FTC-OV m 59 0.67 A 1 AB 2 2 2 2 2
8 FTC-OV m 54 1.27 AA 2 AABB 4 2 2 2 2
9 FTC-OV m 60 1.19 AA 2 AABB 4 2 2 2 2
10 FTC-OV m 69 1.01 A 1 AABB 4 2 2 2 2
11 FTC-OV f 66 1.28 AA 2 AAB 3–4* 2 2 22 +
12 FTC-OV f 61 0.62/1.26 A 1 AB 4 2 2 2 2
13 FTC-OV f 59 0.53/1.04 A nd AB nd 2 2 2 2
14 FTC-OV f 53 0.98/1.22 AA 2 AABB 4 2 2 2 2
15 FVPC m 68 1.05 AB nd AAB nd 2 2 2 2
16 PTC m 64 1.00 AB nd AB nd + 2 2 2
17 PTC f 65 1.02 AB 2 AB 2 + 2 2 2
18 PTC m 62 2.06 AABB nd AABB nd + 2 2 2
19 PTC m 72 1.02/2.05 AB 2 AB 2 + 2 2 2
20 PTC m 62 1.07 AB nd AB nd + 2 2 2
21 PTC f 60 0.92 AB 2 AB 2 2 2 2 2
22 PTC f 77 0.98/2.02 AB nd AB nd 2 2 NRAS 2
23 PTC m 60 1.01 AB nd AB nd + 2 2 2
24 PTC-OV f 72 0.94 AB nd AB nd + 2 2 2
25 PTC-OV m 56 0.97 AB nd AB nd + 2 2 2
26 PTC-OV f 63 1.04 AB nd AB nd + 2 2 2
27 PTC Tall Cell m 79 1.00 AB nd AB nd + 2 2 +
Underlined: discrepancy between FISH copy number and allelic state.# = bold indicates the dominant population as determined by flow cytometry, in cases where multiple populations are present.* = an intermingled pattern of three and four copies was found both for the centromeric and the EGFR locus specific probes.+ = presence of mutation.2 = mutation not found.nd = not determined.doi:10.1371/journal.pone.0038287.t001
Near-Haploid Oncocytic Follicular Thyroid Cancer
PLoS ONE | www.plosone.org 3 June 2012 | Volume 7 | Issue 6 | e38287

formamide, 10% dextran sulphate, 50 mM sodium phosphate
(pH = 7.0), 26SCC, 3 ng/ml of each probe, and a 50-fold excess
of human Cot-1 DNA (BRL-Life Technologies, Rockville, MD,
USA).
For interphase FISH 500 to 2000 nuclei were prepared from nine
FTC-OV and three PTCs, spotted on ethanol-cleaned and air-dried
glass slides. After spotting, the slides were dried overnight at room
temperature. If necessary, the slides were incubated in a 0.1 M
solution of Na2B4O7 to permit swelling of the nuclei. The slides were
then serially rinsed in PBS and sterile water, dehydrated and air-
dried before hybridisation. After applying the probe mix the slides
were heated at 80uC for 12 min and incubated overnight in a moist
chamber at 37uC. Next, the slides were further prepared for
immunodetection, and fluorescent spots of a minimum of 50 nuclei
were counted per probe combination. Images were captured using a
COHU 4910 series monochrome CCD camera (COHU, San
Diego, CA, USA) attached to a DM fluorescence microscope (Leica,
Wetzlar, Germany), equipped with a PL Fluotar 1006, NA 1.30 –
0.60 objective and I3 and N2.1 filters (Leica) and Leica QFISH
software (Leica Imaging Systems, Cambridge, UK).
Somatic mutation analysisFor somatic mutation analysis of EGFR (exons 18–21), the RAS
(HRAS, KRAS and NRAS) genes (codons 12, 13 and 61), PIK3CA
(codons 542, 545 and 1047) and BRAF (codon 600), Sanger
sequencing was performed using specific primers listed in Table
S1. To allow universal sequencing, M13 tails were added to all
primers, which were obtained from Eurofins (Ebersberg, Ger-
many).
Uniform PCR conditions were used (iCycler, Bio-Rad,
Veenendaal, The Netherlands) in 10 ml reactions with 10 ng
DNA, iQ Supermix (Bio-Rad) and 2 pmol primers, as described.
PCR conditions were: 10 minutes at 95uC, followed by 40 cycles
of 5 seconds at 95uC, 10 seconds at 60uC, and 10 seconds at
72uC, with a final elongation step of 10 minutes at 72uC. Purified
PCR products were Sanger sequenced at the Leiden Genome
Technology Center and analyzed using the Mutation Surveyor
software package (Softgenetics, PA, USA).
Results
Patient cohortWe analyzed twenty-seven recurrent non-medullary thyroid
carcinoma (NMTC) cases. Tumours were categorised according to
their histological subtype. The FTC-OV and PTC variants were
predominant in this series (for details, see Table 1). To validate our
findings we further analyzed a cohort of 20 patients, primarily
composed of ATC, FTC-OV and PTC (Table 2 and Table S2).
SNP-array analysis, multiparameter DNA flow cytometryand FISH
SNP array analysis of all ten FTV-OV showed genome-wide
LOH on most of the chromosomes. In all cases heterozygosity was
retained for chromosome 7. After integration of the DNA index
(DI, see Table 1) in the SNP-array analysis 5/10 FTC-OV showed
LOH due to chromosomal monosomy with the allelic state [A]
(see the materials and methods). In the remaining 5 FTC-OV DI
range (0.98–1.27) copy neutral LOH was found (allelic states
[AA]). The latter suggests endoreduplication of a previous near-
haploid genome.
A single tumour population was observed in 81% of the
samples, after gating in the flow cytometric analysis on the keratin-
positive (K+) epithelial cell fractions (Figure 1). Remarkably, two
out five FTC-OVs with a DNA near-haploid DI (range 0.53–0.73)
showed a second cell population with a DI twice that of the DNA
near-haploid population, indicative of endoreduplication of the
DNA near-haploid population (Table 1, Figure 1).
An example of complete allelic state of a FTC-OV (case No. 13)
in the SNP array analysis is shown in Figure 2A, whereas in
Figure 3 all samples are depicted. The FTC-OV case No. 13 is
only heterozygous [AB] for chromosomes 7, 12 and a segment of
18. All other autosomes show monosomy [A]. Flow cytometric
analysis showed in FTC-OV cases with allelic states AA a DI
between 1.01 and 1.28, indeed approximately twice the range of
DIs found in the DNA near-haploid tumour fractions. One of
these near-diploid tumours was also bimodal, with cell populations
displaying DIs of 0.98 and 1.22, possibly reflecting intra-tumour
heterogeneity. The near-haploidisation process, with or without
subsequent endoreduplication in FTC-OV, implied different
combinations of chromosomes, however LOH was seen in all
cases for chromosomes 3, 6, and 22. Remarkably, this histological
variant never displayed allelic states [A] or [AA] for chromosome
7 as all the FTC-OV samples showed retention of chromosome 7
in a heterozygous state (at least one copy of the B allele was
preserved).
All other NMTC variants, with the exception of one PTC with
a DI of 2.06 (Tumour No. 18, DNA near-tetraploid), showed a
near-diploid tumour population with a DI between 0.90 and 1.07.
Table 2. Summary of results of the analysis of the 20 tumoursin the validation cohort: diagnosis, near-homozygousphenotype and recurrence.
No. DiagnosisNear-homozygousphenotype Recurrence
28 FA No -
29 FA No -
30 FA, partially OV No No
31 ATC No *
32 ATC No *
33 ATC No *
34 ATC No *
35 ATC, partially OV No *
36 FTC No Yes
37 FTC, partially OV Yes Yes
38 FTC-OV& Yes *
39 FTC-OV** Yes Yes
40 FTC-OV, min. inv. No No
41 FTC-OV, min. inv. No$ No
42 Mixed FTC/PTC No Yes
43 PTC No No
44 PTC No No
45 PTC No No
46 PTC No No
47 PTC No Yes
The presence of homozygous chromosomes was determined by high-densitySNP-arrays.min. inv. = minimal invasive.* = incomplete resection and death of disease ,5 months.** = sorafenib study, FFPE sample No. 9.& = other tumour fraction dedifferentiated to ATC.$ = possible intratumour heterogeneity.doi:10.1371/journal.pone.0038287.t002
Near-Haploid Oncocytic Follicular Thyroid Cancer
PLoS ONE | www.plosone.org 4 June 2012 | Volume 7 | Issue 6 | e38287

Near-Haploid Oncocytic Follicular Thyroid Cancer
PLoS ONE | www.plosone.org 5 June 2012 | Volume 7 | Issue 6 | e38287

Figure 1. Examples of DNA content analysis of recurrent NMTC. Multiparameter DNA content analysis was performed on FFPENMTC, as described. A. Multiparameter DNA content analysis of a bimodal PTC with a DI of 1.02 and 2.05 (case No. 19), B. a PTC-OV with a DI of0.97 (case No. 25) and C. a bi-modal FTC-OV with a DI of 0.53 and 1.04, respectively (case No. 13). a. Haematoxylin – eosin staining 2006. b. keratinvs. vimentin density plot (note the vimentin co-expression of these tumours and the clear separation between the stromal and the epithelial cellfraction. The expression of keratin and vimentin are high, relative to the controls showing background fluorescence [d]). Twenty-five samples, 93%(25/27), showed high vimentin co-expression in more than 50% of the cancer cells (data not shown). c. DNA histogram generated after gating on theepithelial cell fraction. e. DNA histogram generated after gating on the normal DNA diploid stromal cell fraction. This fraction was used as a DNAcontent reference. f. DNA histogram of the epithelial cell fraction after modelling by ModFit (note that the presence of a second cell cyclingpopulation in the bimodal PTC and the FTC-OV DNA histograms is significant and demonstrates endoreduplication. In addition, the FTC-OV shows adominant DNA near-haploid population [c, f]).doi:10.1371/journal.pone.0038287.g001
Figure 2. Examples of genome-wide allelic state analysis of an FTC-OV and a PTC-OV. A. FTC-OV (case No. 13, see also Figure 1) with DIsof 0.53 and 1.04 shows allelic state [A] for most chromosomes, except for chromosomes 7 and 12 and a segment of chromosome 18 showingretention (allelic state [AB]). Chromosome X also shows an allelic state [A]. B. The PTC-OV sample with a DI of 0.94 (case No. 24) shows a relativelylimited number of genomic alterations. Chromosomes 1q and 7p showed an [AAA] allelic state after LAIR analysis. Another segment of 1q showed 1copy but was heterozygous, which can be explained by a balanced mixture of two populations, one with an allelic state [A] and one with an allelicstate [B], representing intra-tumour heterogeneity. In comparison with normal cells, one copy of chromosome 9, 13 and 22 was lost, as shown by theallelic state [A]. Both X chromosomes were detected in this female patient [AB].doi:10.1371/journal.pone.0038287.g002
Near-Haploid Oncocytic Follicular Thyroid Cancer
PLoS ONE | www.plosone.org 6 June 2012 | Volume 7 | Issue 6 | e38287
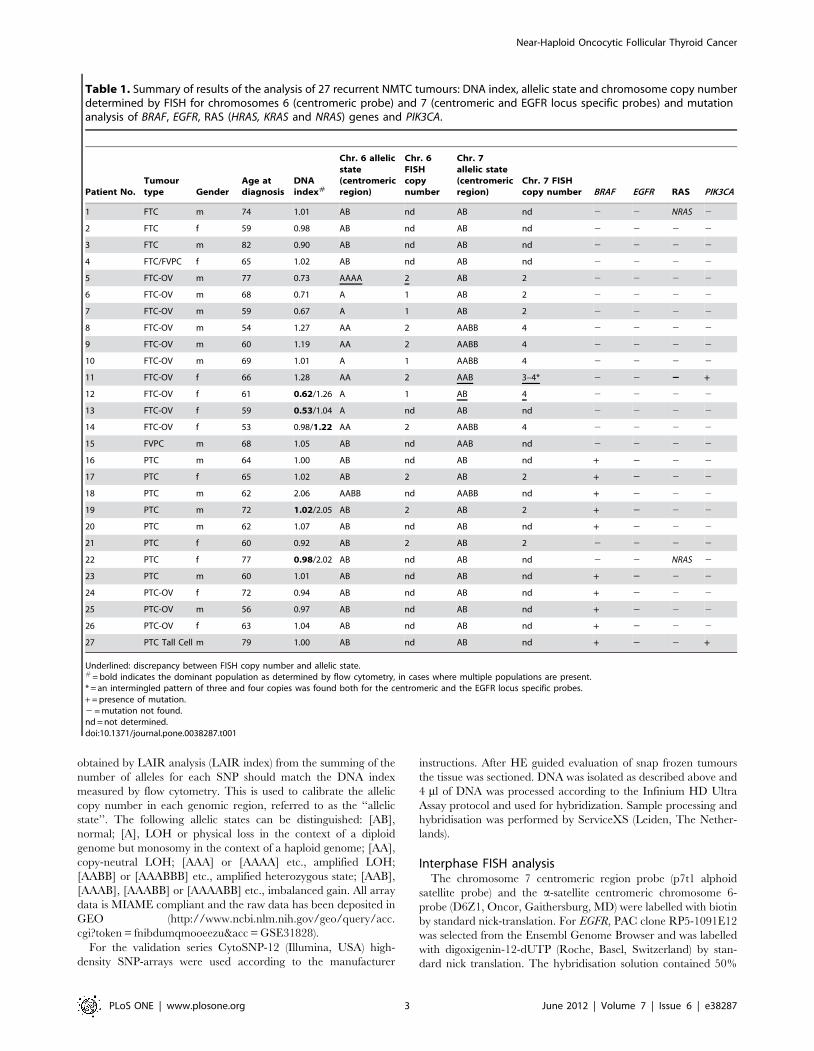
In two of these tumours (No. 19 and No. 22), in addition to the
DNA near-diploid cell population, a second cell fraction was
observed with a near-tetraploid DNA index.
An example of complete allelic state of a PTC tumour (PTC-
OV, case No. 24) is shown in Figure 2B. In the SNP-array analysis
relative limited chromosomal alterations were identified in this
case. In contrast to FTC-OV, the other histological variants
Figure 3. Summary of the genomic alterations found after LAIR analysis (see Materials and Methods) in 27 recurrent NMTCs. In thisheatmap, rows represent tumours and columns represent chromosomes. The first column shows the tumour number, type and DNA index (DI). Thetumours have been grouped according to their subtype, with ten FTC-OV tumours in the upper group and 17 NON FTC-OV in the lower group. Thecombined frequency of genomic alterations for each group is indicated in a separate row. Black indicates allelic states with .2 copies and at least oneB allele retained, e.g. [AABB] and [AAB]. Grey indicates allelic states of [A] and [AA]. The colours in the heatmap indicate: white, allelic state[AB] = normal heterozygous state. Dark red, allelic states [AABB], [AAABBB], etc. = amplified heterozygous states. Light red, allelic states [AAB],[AAABB], etc. = imbalanced gain. Dark blue, allelic state [A] = LOH or physical loss in the context of a diploid genome but monosomy in the context ofa haploid genome. Light blue, allelic states [AA], [AAA], etc. = copy neutral LOH and amplified LOH, respectively. Notice the retention of chromosome7 for five out of ten FTC-OV tumours (allelic states [AB]) with the remaining five showing endoreduplication with allelic states [AABB] (n = 4) or [AAB](n = 1). The Integrative Genomics Viewer (IGV) was used to produce this image.doi:10.1371/journal.pone.0038287.g003
Near-Haploid Oncocytic Follicular Thyroid Cancer
PLoS ONE | www.plosone.org 7 June 2012 | Volume 7 | Issue 6 | e38287

showed relatively limited numbers of chromosomal aberrations.
Allelic state [A], indicating physical loss, or [AA] (copy-neutral
LOH) was observed for chromosome 22 in six out of eleven PTC
or PTC-variant cases.
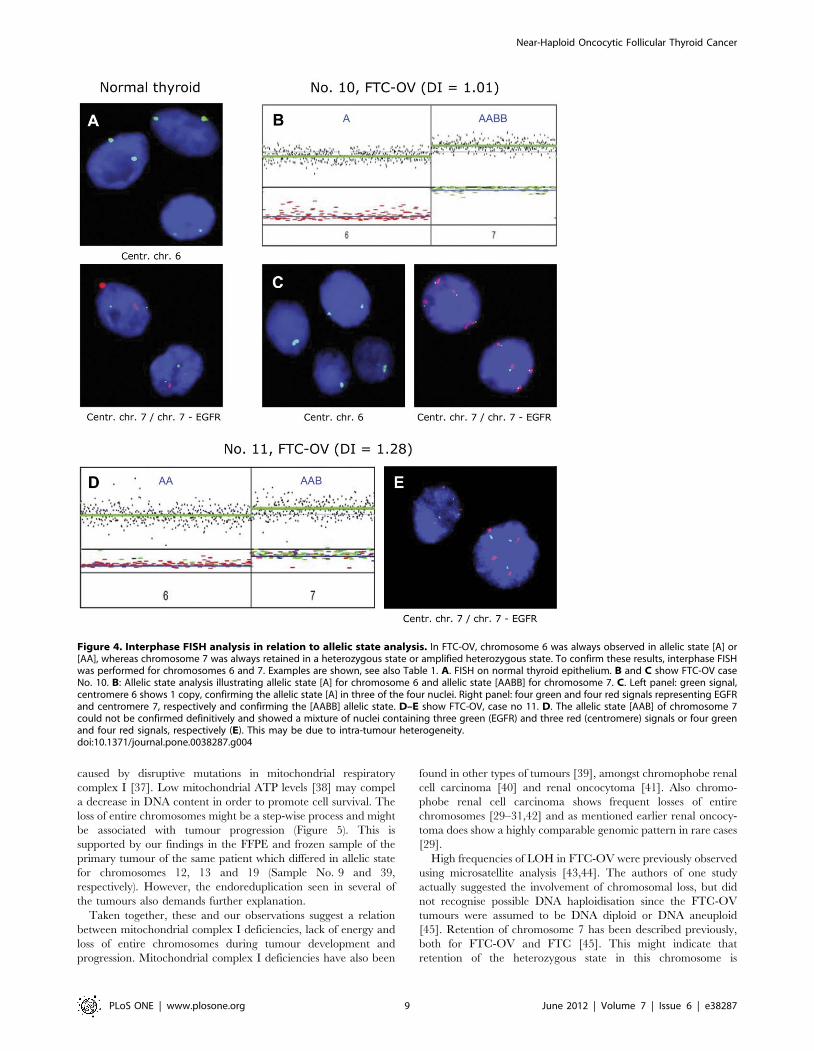
FISH analysis: To confirm the copy number of chromosomes 6
and 7, FISH analysis was performed on interphase nuclei isolated
from nine FTC-OV and three PTCs (Table 1, Figure 4).
Centromeric probes for both chromosome 6 and 7 and an
additional probe on 7p (EGFR locus) were used. The previously
determined copy numbers were confirmed in the vast majority of
cases, with 3 exceptions. Two of these exceptions involved
chromosome 7 of tumours no 11 and 12. In tumour no 11, the
LAIR results for chromosome 7 (Figure 4D) were interpreted as
three chromosomal copies in an imbalanced state (allelic state
[AAB]) while FISH (Figure 4E) clearly showed a mixture of three
and four copies, both for the centromeric and the EGFR specific
probes. In tumour no 12, the chromosome 7 discordance might be
attributable to intra-tumour heterogeneity as this sample corre-
sponds to a bimodal histogram where two cell populations are
present.
Validation of the near-homozygous phenotype found inrecurrent FTC-OV
In order to validate our findings we additionally studied the
frozen tissue of twenty thyroid tumours using high-density SNP-
arrays. The validation cohort consisted of three follicular
adenomas (FA, one partially oncocytic), five anaplastic thyroid
carcinomas (ATC, one partially oncocytic), one FTC/PTC, one
FTC, one FTC partially oncocytic, two FTC-OVs, two minimal
invasive FTC-OVs, and five PTCs. All patients with ATC died
within 5 months after treatment. Of the remaining cases five
showed recurrences (see Table 2 and for detailed information
Table S2).
Two FTC-OV (Table 2, No’s 38 and 39) and one FTC,
partially OV (No. 37) showed the characteristic near-homozygous
phenotype as described above. From one FTC-OV patient
(Table 2, No. 39) an FFPE sample was analyzed in the initial
series (Table 1, No. 9). The frozen sample was comparable with
the FFPE sample and showed chromosomes 1–11, 15–17 and 19–
22 in identical heterozygous or homozygous states, respectively.
Only chromosomes 12, 13 and 19 showed homozygous in the
FFPE sample while these were retained in the frozen sample
(compare Figure 3, No. 9 with Figure S2, No. 39).
The near-homozygous phenotype was not observed in any other
case in the validation series. However one ATC with partially
oncocytic features (Table 2 and Table S2, No. 35) showed allelic
imbalances for all chromosomes except chromosome 7 (Figure S2).
Mutation analysis of EGFR, BRAF, RAS genes and PIK3CAA summary of the detected mutations in the initial cohort is
presented in Table 1. Mutations in the RAS genes and PIK3CA
were rarely found. One FTC-OV case (No. 11) and the PTC Tall
Cell tumour (No. 27) showed a PIK3CA (c.86276A.G,
p.H1047R) mutation. Two tumours (FTC No. 1 and PTC
No. 22) showed NRAS (c.2987A.G, p.Q61R) mutations. No
mutations were detected in EGFR. Of the thirteen PTCs and PTC
variants analysed, ten (77%) showed the activating BRAF
mutation, c.1799T.A, p.V600E. The BRAF mutation was not
detected in the FTC-OV (n = 10) or FTC (n = 4) subgroups. In the
validation cohort 4 BRAF c.1799T.A, p.V600E mutations were
detected, all in PTC. No mutations were found in KRAS or
PIK3CA.
Discussion
We initially characterised recurrent NMTC by combining
genome-wide SNP-array analysis with DNA flow cytometry. We
clearly showed that recurrent oncocytic follicular thyroid carcino-
ma (FTC-OV) is characterised by genomic haploidisation,
frequent endoreduplication of a DNA near-haploid genome with
especially retention of a heterozygous chromosome 7 in all the
cases. The latter suggests a strong association of genomic
haploidisation with mitochondrial defects. In a subsequent
validation cohort this genomic phenotype found in FTC-OV
was also observed in two additional recurrent thyroid cancers with
oncocytic features. There were also 4 cases showing morpholog-
ically partially or overt oncocytic features (one benign FA and one
ATC and 2 non recurrent minimal invasive FTC-OV) that did not
show the characteristic genomic phenotype described above. The
one ATC (partially OV) however did show genome-wide
imbalances with the exception of chromosome 7. Tumour cell
percentage was high enough in this particular sample, so only
tumour heterogeneity could be an explanation.
Our flow cytometric findings differ from previous single
parameter flow cytometric DNA content measurements of FTC-
OV carcinomas [23,24]. In contrast, our multiparameter flow
cytometric method for FFPE samples allows the use of stromal
cells as a DNA diploid reference [20]. Previously, defining a
reliable DNA content reference was problematic [25]. In the
single-parameter approach, the left peak of a bimodal DNA
histogram was assumed to represent the normal stromal cell
fraction in all cases [26]. This approach can lead to the mistaken
designation of a DNA near-haploid FTC-OV as DNA diploid. To
date, all studies measuring DNA content of FTC-OV have defined
these tumours as DNA diploid or aneuploid [23]. In our opinion
the DNA histograms published in 1988 by McLeod et al. [24]
show DNA near-haploidy in FTC-OV, but these authors did not
elaborate on this observation (see Figure S1). Haploidisation has
only been widely documented in chondrosarcomas [27] and is
found sporadically in solid tumours. Even so, we found one report
of a renal oncocytoma with a near-haploid karyotype [28]. One
study on copy number alterations by SNP-arrays showed a near-
homozygous like phenotype in one of the fifteen renal oncocytoma
cases [29]. Others did not report these specific genomic alterations
[30,31]. Oncocytic thyroid tumours have been studied by CGH
technology. A limitation is that with CGH possible regions of
chromosomal homozygosity cannot be detected. Haploidisation is
missed with CGH due to the fact that normalisation of CGH
patterns is based on average genomic content. Interestingly, one
well documented array-CGH study of 13 thyroid FTC-OV and 15
FA-OV by Wada et al. showed highly comparable copy number
alterations [9]. Just like our investigation they found increased
signal intensities for chromosomes 5, 7, 12, 17, 19 and 20. Relative
losses were mostly restricted to chromosomes 2 and 9. Notewor-
thy, these authors (also) suggested an association between these
specific numerical chromosomal aberrations and recurrence. Five
Patients (n = 5) without chromosomal aberrations did not recur,
whereas 5 of 8 patients with chromosomal aberrations showed a
recurrence. In addition, XTC.UC1 cells [32], the only known
model for oncocytic thyroid cancer [33,34], shows a CGH profile
[7] highly comparable with those found by Wada et al. [9].
Our observations suggest a possible relation between the FTC-
OV phenotype and haploidisation/endoreduplication. However,
the underlying molecular mechanism remains to be elucidated.
Possible mechanisms are abnormal mitosis [35] or meiosis-like
events. Alternatively, the process of haploidisation may well be
driven by a lack of cellular energy [36] which in FTC-OV may be
Near-Haploid Oncocytic Follicular Thyroid Cancer
PLoS ONE | www.plosone.org 8 June 2012 | Volume 7 | Issue 6 | e38287
caused by disruptive mutations in mitochondrial respiratory
complex I [37]. Low mitochondrial ATP levels [38] may compel
a decrease in DNA content in order to promote cell survival. The
loss of entire chromosomes might be a step-wise process and might
be associated with tumour progression (Figure 5). This is
supported by our findings in the FFPE and frozen sample of the
primary tumour of the same patient which differed in allelic state
for chromosomes 12, 13 and 19 (Sample No. 9 and 39,
respectively). However, the endoreduplication seen in several of
the tumours also demands further explanation.
Taken together, these and our observations suggest a relation
between mitochondrial complex I deficiencies, lack of energy and
loss of entire chromosomes during tumour development and
progression. Mitochondrial complex I deficiencies have also been
found in other types of tumours [39], amongst chromophobe renal
cell carcinoma [40] and renal oncocytoma [41]. Also chromo-
phobe renal cell carcinoma shows frequent losses of entire
chromosomes [29–31,42] and as mentioned earlier renal oncocy-
toma does show a highly comparable genomic pattern in rare cases
[29].
High frequencies of LOH in FTC-OV were previously observed
using microsatellite analysis [43,44]. The authors of one study
actually suggested the involvement of chromosomal loss, but did
not recognise possible DNA haploidisation since the FTC-OV
tumours were assumed to be DNA diploid or DNA aneuploid
[45]. Retention of chromosome 7 has been described previously,
both for FTC-OV and FTC [45]. This might indicate that
retention of the heterozygous state in this chromosome is
Figure 4. Interphase FISH analysis in relation to allelic state analysis. In FTC-OV, chromosome 6 was always observed in allelic state [A] or[AA], whereas chromosome 7 was always retained in a heterozygous state or amplified heterozygous state. To confirm these results, interphase FISHwas performed for chromosomes 6 and 7. Examples are shown, see also Table 1. A. FISH on normal thyroid epithelium. B and C show FTC-OV caseNo. 10. B: Allelic state analysis illustrating allelic state [A] for chromosome 6 and allelic state [AABB] for chromosome 7. C. Left panel: green signal,centromere 6 shows 1 copy, confirming the allelic state [A] in three of the four nuclei. Right panel: four green and four red signals representing EGFRand centromere 7, respectively and confirming the [AABB] allelic state. D–E show FTC-OV, case no 11. D. The allelic state [AAB] of chromosome 7could not be confirmed definitively and showed a mixture of nuclei containing three green (EGFR) and three red (centromere) signals or four greenand four red signals, respectively (E). This may be due to intra-tumour heterogeneity.doi:10.1371/journal.pone.0038287.g004
Near-Haploid Oncocytic Follicular Thyroid Cancer
PLoS ONE | www.plosone.org 9 June 2012 | Volume 7 | Issue 6 | e38287
important for tumour survival in recurrent FTC-OV. Interesting-
ly, an association between accumulation of mitochondria in
oncocytic lesions and trisomy of chromosome 7 has also been
described [46]. Several important oncogenes are located on
chromosome 7, including cMET, BRAF and EGFR. Three thyroid
cancer cases with activating EGFR mutations have been
described, two of which showed a favourable response when
treated with EGFR tyrosine-kinase inhibitors [47,48]. No activat-
ing mutations in EGFR were identified in our cohort and only two
samples showed a mutation in an EGFR downstream signalling
molecule (NRAS and PIK3CA).
Only a limited number of gross chromosomal aberrations were
identified in FTC and PTCs. PTCs showed frequent LOH on
chromosome 22q, in concordance with a previous study [49]. An
array CGH study in PTCs showed higher percentages of
chromosomal aberrations [6]. However, in contrast to our study
with BRAF c.1799T.A, p.V600E in 77% of the PTCs, very low
frequencies of this mutation were found in that particular study.
These findings further support the concept of different routes of
tumour development in PTC.
Also in concordance with previous studies, DNA ploidy
measurements on PTCs showed mainly diploidy or near-diploid
DNA content. The three PTC-OVs (carrying BRAF c.1799T.A)
did not show the typical haploidisation/endoreduplication seen in
FTC-OV but were comparable to non-oncocytic PTC. Thus,
haploidisation might be frequent in oncocytic tumours, but it is
unlikely that all subtypes of oncocytic tumours show haploidisa-
tion. It is known that the BRAF p.V600E mutant protein in PTC
translocates to the outer membrane of mitochondria and seems to
be involved in high glucose uptake rate and reduced mitochondrial
oxidative phosphorylation and ATP synthesis [50]. To compen-
sate for reduced ATP synthesis, the mitochondrial mass expands,
resulting in the typical oncocytic phenotype. The mitochondrial
proliferation found in PTC-OV might therefore be secondary to
the BRAF c.1799T.A mutation. Still, although speculative, the
effects on the cellular energy supply of mutations in nuclear
encoded mitochondrial genes might be different from mutations in
mitochondrial encoded genes.
In summary, we showed for the first time that FTC-OV is
frequently characterised by initial genomic haploidisation, showing
monosomies of entire chromosomes but with retention of
chromosome 7 in a heterozygous state. Endoreduplication of the
previous near-haploid genome was observed in half of the FTC-
OV cases. Retention of chromosome 7 might be essential for
tumour cell survival in recurrent FTC-OV and may open new
avenues to targeted therapies. A cohort of 20 cases confirmed our
findings. The near-homozygous phenotype is associated with
FTC-OV and might reflect a more aggressive disease. Whether
the oncocytic cell phenotype and mitochondrial dysfunction in
FTC-OV are directly related to these chromosomal aberrations
remains to be established.
Supporting Information
Table S1 Primers used for hot-spot mutation analysisof EGFR, NRAS, HRAS, KRAS, BRAF and PIK3CA inNMTC.(DOC)
Table S2 Detailed overview of the validation cohort.(XLS)
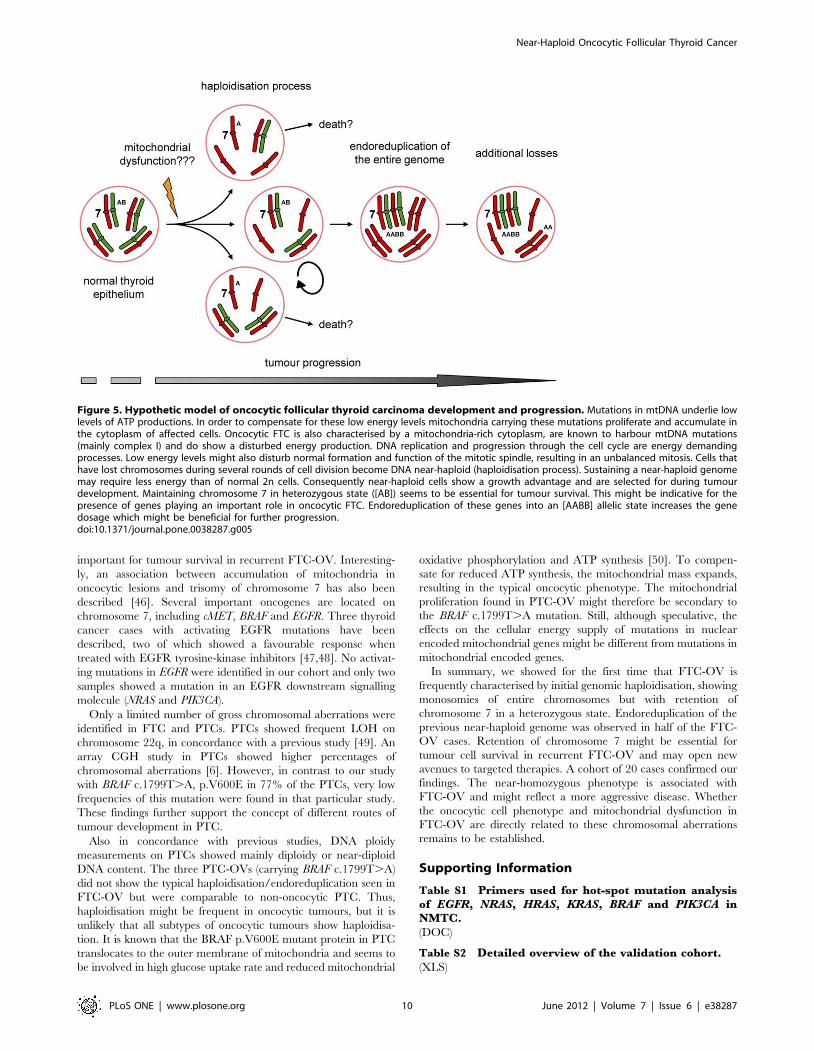
Figure 5. Hypothetic model of oncocytic follicular thyroid carcinoma development and progression. Mutations in mtDNA underlie lowlevels of ATP productions. In order to compensate for these low energy levels mitochondria carrying these mutations proliferate and accumulate inthe cytoplasm of affected cells. Oncocytic FTC is also characterised by a mitochondria-rich cytoplasm, are known to harbour mtDNA mutations(mainly complex I) and do show a disturbed energy production. DNA replication and progression through the cell cycle are energy demandingprocesses. Low energy levels might also disturb normal formation and function of the mitotic spindle, resulting in an unbalanced mitosis. Cells thathave lost chromosomes during several rounds of cell division become DNA near-haploid (haploidisation process). Sustaining a near-haploid genomemay require less energy than of normal 2n cells. Consequently near-haploid cells show a growth advantage and are selected for during tumourdevelopment. Maintaining chromosome 7 in heterozygous state ([AB]) seems to be essential for tumour survival. This might be indicative for thepresence of genes playing an important role in oncocytic FTC. Endoreduplication of these genes into an [AABB] allelic state increases the genedosage which might be beneficial for further progression.doi:10.1371/journal.pone.0038287.g005
Near-Haploid Oncocytic Follicular Thyroid Cancer
PLoS ONE | www.plosone.org 10 June 2012 | Volume 7 | Issue 6 | e38287
Figure S1 Examples of DNA content analysis of FFPEoncocytic follicular thyroid carcinomas by McLeod et al.[24].(DOC)
Figure S2 Summary of high-density genomic patternsfound in the validation cohort (n = 20).(DOC)
Author Contributions
Conceived and designed the experiments: WEC TvW HM. Performed the
experiments: WEC KW WCEdH MvN NM RvE AM ESJ TvW. Analyzed
the data: WEC DR HM. Contributed reagents/materials/analysis tools:
EK GH JS DR JO. Wrote the paper: WEC DR HM. Designed the
software used in analysis: JO.
References
1. Ferlay J, Shin HR, Bray F, Forman D, Mathers C, et al. (2010) Estimates of
worldwide burden of cancer in 2008: GLOBOCAN 2008. Int J Cancer 127:2893–2917.
2. Ricarte-Filho JC, Ryder M, Chitale DA, Rivera M, Heguy A, et al. (2009)
Mutational profile of advanced primary and metastatic radioactive iodine-refractory thyroid cancers reveals distinct pathogenetic roles for BRAF,
PIK3CA, and AKT1. Cancer Res 69: 4885–4893.
3. Gasparre G, Porcelli AM, Bonora E, Pennisi LF, Toller M, et al. (2007)Disruptive mitochondrial DNA mutations in complex I subunits are markers of
oncocytic phenotype in thyroid tumors. Proc Natl Acad Sci USA 104:9001–9006.
4. Tallini G, Hsueh A, Liu S, Garcia-Rostan G, Speicher MR, et al. (1999)
Frequent chromosomal DNA unbalance in thyroid oncocytic (Hurthle cell)neoplasms detected by comparative genomic hybridization. Lab Invest 79:
547–555.
5. Frisk T, Kytola S, Wallin G, Zedenius J, Larsson C (1999) Low frequency ofnumerical chromosomal aberrations in follicular thyroid tumors detected by
comparative genomic hybridization. Genes Chromosomes Cancer 25: 349–353.
6. Unger K, Malisch E, Thomas G, Braselmann H, Walch A, et al. (2008) ArrayCGH demonstrates characteristic aberration signatures in human papillary
thyroid carcinomas governed by RET/PTC. Oncogene 27: 4592–4602.
7. Ribeiro FR, Meireles AM, Rocha AS, Teixeira MR (2008) Conventional andmolecular cytogenetics of human non-medullary thyroid carcinoma: character-
ization of eight cell line models and review of the literature on clinical samples.BMC Cancer 16: 371.
8. Gasparre G, Bonora E, Tallini G, Romeo G (2010) Molecular features of
thyroid oncocytic tumors. Mol Cell Endocrinol 321: 67–76.
9. Wada N, Duh QY, Miura D, Brunaud L, Wong MG, et al. (2002)Chromosomal aberrations by comparative genomic hybridization in hurthle
cell thyroid carcinomas are associated with tumor recurrence. J Clin EndocrinolMetab 87: 4595–4601.
10. Xu X, Quiros RM, Gattuso P, Ain KB, Prinz RA (2003) High prevalence of
BRAF gene mutation in papillary thyroid carcinomas and thyroid tumor celllines. Cancer Res 63: 4561–4567.
11. Rivera M, Ricarte-Filho J, Knauf J, Shaha A, Tuttle M, et al. (2010) Molecular
genotyping of papillary thyroid carcinoma follicular variant according to itshistological subtypes (encapsulated vs infiltrative) reveals distinct BRAF and
RAS mutation patterns. Mod Pathol 23: 1191–200.
12. Soares P, Trovisco V, Rocha AS, Lima J, Castro P, et al. (2003) BRAFmutations and RET/PTC rearrangements are alternative events in the
etiopathogenesis of PTC. Oncogene 22: 4578–4580.
13. Frattini M, Ferrario C, Bressan P, Balestra D, De CL, et al. (2004) Alternativemutations of BRAF, RET and NTRK1 are associated with similar but distinct
gene expression patterns in papillary thyroid cancer. Oncogene 23: 7436–7440.
14. Nikiforova MN, Lynch RA, Biddinger PW, Alexander EK, Dorn GW, et al.(2003) RAS point mutations and PAX8-PPAR gamma rearrangement in thyroid
tumors: evidence for distinct molecular pathways in thyroid follicular carcinoma.J Clin Endocrinol Metab 88: 2318–2326.
15. Nikiforov YE (2011) Molecular diagnostics of thyroid tumors. Arch Pathol Lab
Med 135: 569–577.
16. Liu Z, Hou P, Ji M, Guan H, Studeman K, et al. (2008) Highly prevalent geneticalterations in receptor tyrosine kinases and phosphatidylinositol 3-kinase/akt
and mitogen-activated protein kinase pathways in anaplastic and follicularthyroid cancers. J Clin Endocrinol Metab 93: 3106–3116.
17. Kapiteijn E, Schneider TC, Morreau H, Gelderblom H, Nortier JW, et al.
(2011) New treatment modalities in advanced thyroid cancer. Ann Oncol 23:10–18.
18. Gupta-Abramson V, Troxel AB, Nellore A, Puttaswamy K, Redlinger M, et al.
(2008) Phase II trial of sorafenib in advanced thyroid cancer. J Clin Oncol 26:4714–4719.
19. Hoftijzer H, Heemstra KA, Morreau H, Stokkel MP, Corssmit EP, et al. (2009)
Beneficial effects of sorafenib on tumor progression, but not on radioiodineuptake, in patients with differentiated thyroid carcinoma. Eur J Endocrinol 161:
923–931.
20. Corver WE, Ter Haar NT, Dreef EJ, Miranda NF, Prins FA, et al. (2005) High-resolution multi-parameter DNA flow cytometry enables detection of tumour
and stromal cell subpopulations in paraffin-embedded tissues. J Pathol 206:233–241.
21. Oosting J, Lips EH, van Eijk R, Eilers PH, Szuhai K, et al. (2007) High-
resolution copy number analysis of paraffin-embedded archival tissue using SNPBeadArrays. Genome Res 17: 368–376.
22. Corver WE, Middeldorp A, Ter Haar NT, Jordanova ES, van PM, et al. (2008)
Genome-wide allelic state analysis on flow-sorted tumor fractions provides an
accurate measure of chromosomal aberrations. Cancer Res 68: 10333–10340.
23. El-Naggar AK, Batsakis JG, Luna MA, Hickey RC (1988) Hurthle cell tumors of
the thyroid. A flow cytometric DNA analysis. Arch Otolaryngol Head Neck Surg
114: 520–521.
24. McLeod MK, Thompson NW, Hudson JL, Gaglio JA, Lloyd RV, et al. (1988)
Flow cytometric measurements of nuclear DNA and ploidy analysis in Hurthle
cell neoplasms of the thyroid. Arch Surg 123: 849–854.
25. Schultz DS, Zarbo RJ (1992) Comparison of eight modifications of Hedley’s
method for flow cytometric DNA ploidy analysis of paraffin-embedded tissue.
Am J Clin Pathol 98: 291–295.
26. Hedley DW, Friedlander ML, Taylor IW, Rugg CA, Musgrove EA (1983)
Method for analysis of cellular DNA content of paraffin-embedded pathological
material using flow cytometry. J Histochem Cytochem 31: 1333–1335.
27. Bovee JV, van RM, Bardoel AF, Rosenberg C, Cornelisse CJ, et al. (2000) Near-
haploidy and subsequent polyploidization characterize the progression of
peripheral chondrosarcoma. Am J Pathol 157: 1587–1595.
28. Gregori-Romero MA, Morell-Quadreny L, Llombart-Bosch A (1996) A singular
case of near-haploid stemline karyotype in a renal oncocytoma. Cancer Genet
Cytogenet 92: 28–30.
29. Kim HJ, Shen SS, Ayala AG, Ro JY, Truong LD, et al. (2009) Virtual-
karyotyping with SNP microarrays in morphologically challenging renal cell
neoplasms: a practical and useful diagnostic modality. Am J Surg Pathol 33:
1276–1286.
30. Yusenko MV, Kuiper RP, Boethe T, Ljungberg B, van Kessel AG, et al. (2009)
High-resolution DNA copy number and gene expression analyses distinguish
chromophobe renal cell carcinomas and renal oncocytomas. BMC Cancer 9:
152.
31. Tan MH, Wong CF, Tan HL, Yang XJ, Ditlev J, et al. (2010) Genomic
expression and single-nucleotide polymorphism profiling discriminates chromo-
phobe renal cell carcinoma and oncocytoma. BMC Cancer 10: 196.
32. Zielke A, Tezelman S, Jossart GH, Wong M, Siperstein AE, et al. (1998)
Establishment of a highly differentiated thyroid cancer cell line of Hurthle cell
origin. Thyroid 8: 475–483.
33. Savagner F, Chevrollier A, Loiseau D, Morgan C, Reynier P, et al. (2001)
Mitochondrial activity in XTC.UC1 cells derived from thyroid oncocytoma.
Thyroid 11: 327–333.
34. Stankov K, Biondi A, D’Aurelio M, Gasparre G, Falasca A, et al. (2006)
Mitochondrial activities of a cell line derived from thyroid Hurthle cell tumors.
Thyroid 16: 325–331.
35. Rizzoni M, Palitti F, Perticone P (1974) Euploid segregation through multipolar
mitosis in mammalian cell cultures. Identification of triploid, haploid, and
segregating diploid cells in a diploid-euploid primary culture of rhesus kidney
cells. Chromosoma 45: 151–162.
36. Savagner F, Franc B, Guyetant S, Rodien P, Reynier P, et al. (2001) Defective
mitochondrial ATP synthesis in oxyphilic thyroid tumors. J Clin Endocrinol
Metab 86: 4920–4925.
37. Gasparre G, Porcelli AM, Bonora E, Pennisi LF, Toller M, et al. (2007)
Disruptive mitochondrial DNA mutations in complex I subunits are markers of
oncocytic phenotype in thyroid tumors. Proc Natl Acad Sci USA 104:
9001–9006.
38. Bonora E, Porcelli AM, Gasparre G, Biondi A, Ghelli A, et al. (2006) Defective
oxidative phosphorylation in thyroid oncocytic carcinoma is associated with
pathogenic mitochondrial DNA mutations affecting complexes I and III. Cancer
Res 66: 6087–6096.
39. Zimmermann FA, Mayr JA, Feichtinger R, Neureiter D, Lechner R, et al.
(2011) Respiratory chain complex I is a mitochondrial tumor suppressor of
oncocytic tumors. Front Biosci (Elite Ed) 3: 315–325.
40. Nagy A, Wilhelm M, Sukosd F, Ljungberg B, Kovacs G (2002) Somatic
mitochondrial DNA mutations in human chromophobe renal cell carcinomas.
Genes Chromosomes Cancer 35: 256–260.
41. Mayr JA, Meierhofer D, Zimmermann F, Feichtinger R, Kogler C, et al. (2008)
Loss of complex I due to mitochondrial DNA mutations in renal oncocytoma.
Clin Cancer Res 14: 2270–2275.
42. Speicher MR, Schoell B, du MS, Schrock E, Ried T, et al. (1994) Specific loss of
chromosomes 1, 2, 6, 10, 13, 17, and 21 in chromophobe renal cell carcinomas
revealed by comparative genomic hybridization. Am J Pathol 145: 356–364.
43. Zedenius J, Wallin G, Svensson A, Grimelius L, Hoog A, et al. (1995)
Allelotyping of follicular thyroid tumors. Hum Genet 96: 27–32.
Near-Haploid Oncocytic Follicular Thyroid Cancer
PLoS ONE | www.plosone.org 11 June 2012 | Volume 7 | Issue 6 | e38287
44. Stankov K, Pastore A, Toschi L, McKay J, Lesueur F, et al. (2004) Allelic loss on
chromosomes 2q21 and 19p 13.2 in oxyphilic thyroid tumors. Int J Cancer 111:
463–467.
45. Tung WS, Shevlin DW, Kaleem Z, Tribune DJ, Wells SA Jr., et al. (1997)
Allelotype of follicular thyroid carcinomas reveals genetic instability consistent
with frequent nondisjunctional chromosomal loss. Genes Chromosomes Cancer
19: 43–51.
46. Dettori T, Frau DV, Lai ML, Mariotti S, Uccheddu A, et al. (2003) Aneuploidy
in oncocytic lesions of the thyroid gland: diffuse accumulation of mitochondria
within the cell is associated with trisomy 7 and progressive numerical
chromosomal alterations. Genes Chromosomes Cancer 38: 22–31.
47. Masago K, Asato R, Fujita S, Hirano S, Tamura Y, et al. (2009) Epidermal
growth factor receptor gene mutations in papillary thyroid carcinoma.Int J Cancer 124: 2744–2749.
48. Hogan T, Jing JY, Williams HJ, Altaha R, Xiaobing L, et al. (2009) Oncocytic,
focally anaplastic, thyroid cancer responding to erlotinib. J Oncol Pharm Pract15: 111–117.
49. Nikiforova MN, Nikiforov YE (2008) Molecular genetics of thyroid cancer:implications for diagnosis, treatment and prognosis. Expert Rev Mol Diagn 8:
83–95.
50. Lee MH, Lee SE, Kim DW, Ryu MJ, Kim SJ, et al. (2011) Mitochondriallocalization and regulation of BRAFV600E in thyroid cancer: a clinically used
RAF inhibitor is unable to block the mitochondrial activities of BRAFV600E.J Clin Endocrinol Metab 96: E19–E30.
Near-Haploid Oncocytic Follicular Thyroid Cancer
PLoS ONE | www.plosone.org 12 June 2012 | Volume 7 | Issue 6 | e38287