Call degradation in diploid and tetraploid green toads
16
Biological Journal of the Linnean Society , 2003, 78 , 11–26. With 10 figures © 2003 The Linnean Society of London, Biological Journal of the Linnean Society, 2003, 78 , 11–26 11 Blackwell Science, LtdOxford, UKBIJBiological Journal of the Linnean Society0024-4066The Linnean Society of London, 2002 78 Original Article CALL DEGRADATION IN TOADSS. CASTELLANO ET AL. *Corresponding author. E-mail: [email protected] Call degradation in diploid and tetraploid green toads SERGIO CASTELLANO 1 *, CRISTINA GIACOMA 1 and MICHAEL J. RYAN 2 1 Dipartimento di Biologia Animale e dell’Uomo, Via Accademia Albertina, 17, 10123 – Torino, Italy 2 Section of Integrative Biology, University of Texas at Austin, Austin, Texas 78746, USA Received 28 January 2002; accepted for publication 1 August 2002 According to the ‘environmental selection’ hypothesis, the physical characteristics of environments influence the evo- lution of long-range acoustic signals by favouring those properties that decrease sound attenuation and distortion with distance. Different environments could favour different acoustic properties and therefore contribute to the intra- and interspecific variation of calls. In the present paper, we investigate whether this hypothesis could explain the differences between the advertisement calls of three taxa of central-Asian green toads: lowland diploids, high- land tetraploids and lowland tetraploids. The pattern of propagation of 12 natural calls (four for each taxon) was analysed in nine localities of Kyrgyzstan and Kazakstan. We broadcast the calls and recorded them along a trasect at distances of 2, 4, 8, 16, and 32 m from the speaker, to estimate sound attenuation and propagation. Attenuation was quantified from the oscillogram (by directly calculating the SPL of calls) and from the power spectrum (by mea- suring the relative amplitude of the fundamental frequency) , whereas degradation was estimated by cross- correlating spectrograms of the same call at different distances. Results show that: (1) the pattern of sound propa- gation significantly differs among localities in relation to the different vegetation and environmental noise; (2) in most localities, call attenuation and degradation differ significantly among the three taxa ; (3) such differences are not consistent to those expected under the hypothesis of environmental selection: independent of altitude, lowland tetraploid calls fare worse than both diploid and highland tetraploid calls, whereas diploid and highland tetraploid calls show different patterns of propagation in a few localities only. © 2003 The Linnean Society of London, Bio- logical Journal of the Linnean Society , 2003, 78 , 11–26. ADDITIONAL KEYWORDS: advertisement call – Bufo viridis – cross-correlation – sound attenuation – sound degradation – sound transmission. INTRODUCTION In many animals, acoustic signals are employed for long-range communication. The effectiveness of these signals depends on the distance at which they can be perceived and recognized by recipients (Brown, 1989). In order to be perceived, signals must have sufficient energy to elicit a response from the receiver, whereas to be recognized they must maintain unaltered tem- poral and spectral structures encoding information. Selective pressures acting on long-range signals to decrease both attenuation (energy content) and distor- tion (information content) with distance would depend not only upon the signal acoustic properties (that is, the biology of signal production), but also upon the physical characteristics of the habitats where signals are broadcast (Bradbury & Veherencamp, 1998; Kime, Turner, Ryan, 2000; Wiley & Richards, 1978; Ryan & Kime, in press). Since the pioneering works of Chappuis (1971) and Morton (1975), many researchers have investigated the role of the environment in influencing the evolu- tion of signal structure. These researchers have adopted either a comparative or an experimental approach. In the first case, investigators compare calls of taxa within a phylogenetic framework to find out whether similarities are due to common descent or to convergent evolution and whether between-taxon dif- ferences are due to lack of phylogenetic affinity or to divergent selection (Cosens & Falls, 1984; Ryan & Brenowitz, 1985; Wiley, 1991). With the experimental approach, investigators directly test the transmission efficiency of calls broadcast in different habitats and
Transcript of Call degradation in diploid and tetraploid green toads
Biological Journal of the Linnean Society
, 2003,
78
, 11–26. With 10 figures
© 2003 The Linnean Society of London,
Biological Journal of the Linnean Society,
2003,
78
, 11–26
11
Blackwell Science, LtdOxford, UKBIJBiological Journal of the Linnean Society0024-4066The Linnean Society of London, 200278
Original Article
CALL DEGRADATION IN TOADSS. CASTELLANO ET AL.
*Corresponding author. E-mail: [email protected]
Call degradation in diploid and tetraploid green toads
SERGIO CASTELLANO
1
*, CRISTINA GIACOMA
1
and MICHAEL J. RYAN
2
1
Dipartimento di Biologia Animale e dell’Uomo, Via Accademia Albertina, 17, 10123 – Torino, Italy
2
Section of Integrative Biology, University of Texas at Austin, Austin, Texas 78746, USA
Received 28 January 2002; accepted for publication 1 August 2002
According to the ‘environmental selection’ hypothesis, the physical characteristics of environments influence the evo-lution of long-range acoustic signals by favouring those properties that decrease sound attenuation and distortionwith distance. Different environments could favour different acoustic properties and therefore contribute to theintra- and interspecific variation of calls. In the present paper, we investigate whether this hypothesis could explainthe differences between the advertisement calls of three taxa of central-Asian green toads: lowland diploids, high-land tetraploids and lowland tetraploids. The pattern of propagation of 12 natural calls (four for each taxon) wasanalysed in nine localities of Kyrgyzstan and Kazakstan. We broadcast the calls and recorded them along a trasectat distances of 2, 4, 8, 16, and 32 m from the speaker, to estimate sound attenuation and propagation. Attenuationwas quantified from the oscillogram (by directly calculating the SPL of calls) and from the power spectrum (by mea-suring the relative amplitude of the fundamental frequency) , whereas degradation was estimated by cross-correlating spectrograms of the same call at different distances. Results show that: (1) the pattern of sound propa-gation significantly differs among localities in relation to the different vegetation and environmental noise; (2) inmost localities, call attenuation and degradation differ significantly among the three
taxa
; (3) such differences arenot consistent to those expected under the hypothesis of environmental selection: independent of altitude, lowlandtetraploid calls fare worse than both diploid and highland tetraploid calls, whereas diploid and highland tetraploidcalls show different patterns of propagation in a few localities only. © 2003 The Linnean Society of London,
Bio-logical Journal of the Linnean Society
, 2003,
78
, 11–26.
ADDITIONAL KEYWORDS:
advertisement call –
Bufo viridis
– cross-correlation – sound attenuation – sound
degradation – sound transmission.
INTRODUCTION
In many animals, acoustic signals are employed forlong-range communication. The effectiveness of thesesignals depends on the distance at which they can beperceived and recognized by recipients (Brown, 1989).In order to be perceived, signals must have sufficientenergy to elicit a response from the receiver, whereasto be recognized they must maintain unaltered tem-poral and spectral structures encoding information.Selective pressures acting on long-range signals todecrease both attenuation (energy content) and distor-tion (information content) with distance would dependnot only upon the signal acoustic properties (that is,the biology of signal production), but also upon the
physical characteristics of the habitats where signalsare broadcast (Bradbury & Veherencamp, 1998; Kime,Turner, Ryan, 2000; Wiley & Richards, 1978; Ryan &Kime, in press).
Since the pioneering works of Chappuis (1971) andMorton (1975), many researchers have investigatedthe role of the environment in influencing the evolu-tion of signal structure. These researchers haveadopted either a comparative or an experimentalapproach. In the first case, investigators compare callsof taxa within a phylogenetic framework to find outwhether similarities are due to common descent or toconvergent evolution and whether between-taxon dif-ferences are due to lack of phylogenetic affinity or todivergent selection (Cosens & Falls, 1984; Ryan &Brenowitz, 1985; Wiley, 1991). With the experimentalapproach, investigators directly test the transmissionefficiency of calls broadcast in different habitats and
12
S. CASTELLANO
ET AL
.
© 2003 The Linnean Society of London,
Biological Journal of the Linnean Society,
2003,
78
, 11–26
analyse their pattern of degradation with distance(Brenowitz, Wilczynski & Zakon, 1984; Ryan &Sullivan, 1989; Ryan, Cocroft & Wilczynski, 1990;Penna & Solis, 1998; Kime
et al
., 2000).The comparative and experimental approaches com-
plement each other. These methodologies have oftenprovided congruent evidence of a direct role of envi-ronmental selection in shaping acoustic structure ofcalls of birds and primates (Brown, 1989; Gish &Morton, 1981; Brown & Gomez, 1992). However, a lessclear picture has emerged from studies with anurans.Ryan & Sullivan (1989) found significant differencesin the spatial pattern of degradation of call temporalstructure in two species of toads. Furthermore, Ryan
et al
. (1990), by means of transmission experiments,provided evidence to attribute call differences betweentwo subspecies of cricket frogs,
Acris crepitans
, to envi-ronmental selection for increased transmission effi-ciency. On the other hand, some recent studies ontropical and temperate frogs have failed to find differ-ences in call structure consistent with the differentacoustic environments where species typically call(Kime
et al
., 2000; Penna & Solis, 1998). These studieshave suggested that differences among the calls ofanuran species inhabiting different habitats arerelated to phylogenetic and morphological constraintsrather than to different selective pressures forenhancing transmission efficiency.
In the present paper, we show results of transmis-sion experiments on green toad calls. Experimentswere carried out to test the hypothesis that differencesbetween advertisement calls of diploid and tetraploidgreen toads (
Bufo viridis
complex) have originatedfrom different environmental pressures (Castellano
et al
.,1998; Castellano,Giacoma & Dujsebayeva,2002).
T
HE
ASIAN
GREEN
TOADS
The Green toad (
Bufo viridis
complex) is a widespreadspecies extending as far west as Morocco and easternFrance and as far east as north-western China andMongolia. In central Asia diploid (2
n
=
22) and tetra-ploid (2
n
=
44) green toad populations coexist(Castellano, Giacoma & Dujsebayeva, 2000; Kadyrova,Mazik & Toktosunov, 1976; Dujsebayeva
et al
., 1997;Stöck & Grosse, 1997). In some regions (i.e.Kyrgyzstan), diploids and tetraploids show an altitu-dinal segregation, such that tetraploids inhabit themountains and diploids the lowlands. In other regions(i.e. eastern Kazakstan), however, tetraploids are alsofound in the lowlands (Borkin
et al
., 1996; Castellano
et al
., 2000; Borkin
et al
., 2001).To date there is no clear consensus as to the mech-
anism (auto- or allo-polyploidization) that led to theorigin of tetraploid toads (Borkin
et al
., 1986; Roth &Ràb, 1986; Mezhzherin & Pisanets, 1995), but cytolog-
ical data provide evidence for their relative ancientorigin (Odierna
et al
., 1995). The two taxa differ intheir morphological and behavioural characters: dip-loids are larger than tetraploids and produce callshaving lower frequencies and higher pulse-rates(Castellano
et al
., 1998; Stöck, 1998). Differences incall frequency are not totally explained by differencesin body size: although call frequency decreases withsize, diploid toads call at frequencies lower than thoseof tetraploids of similar body size. Furthermore, intwo-choice discrimination tests, diploid females signif-icantly prefer a typical diploid call over a tetraploidalternative, showing that between-taxon call differ-ences might function as a pre-mating isolation mech-anism (Giacoma & Castellano, 2001).
In previous papers (Castellano
et al
., 1998;Castellano
et al
., 2002) we addressed the question ofthe evolutionary mechanisms responsible for the dif-ferences between diploid and tetraploid advertisementcalls. In contrast with release calls (short-range sig-nals mediating male–male interactions), advertise-ment calls do not vary congruently with the phylogenyof the group; in fact, the advertisement calls of Asiandiploid and tetraploid populations differ from eachother more than predicted by their genetic distances(Castellano
et al
., 2002). Furthermore, triploid callsdid not differ significantly from tetraploid calls (Cas-tellano
et al
., 1998), indicating that call differences arenot the direct effect of polyploidization. Althoughthese findings suggest that natural selection isresponsible for call differences, it is not clear whetherselection acts by favouring reproductive isolation insympatry (reproductive character displacement) or byenhancing signal propagation in allopatry (environ-mental hypothesis). In the present paper we test theenvironmental hypothesis experimentally.
MATERIAL AND METHODS
S
TUDY
SITES
Transmission experiments were carried out in Mayand June 1997 in nine localities of south-easternKazakstan (KZ) and north-eastern Kyrgyzstan (KY).Four localities were in the plains, at altitudes of up to800 m above see level (a.s.l.): (1) Kapchagai (KZ, lati-tude 43
∞
57
¢
98
¢¢
N, 77
∞
21
¢
74
¢¢
E, altitude 554 m a.s.l.);(2) Damba (KZ, latitude 44
∞
13
¢
54
¢¢
N, 74
∞
47
¢
57
¢¢
E,altitude 559 m a.s.l.); (3) Kopa (KZ, latitude43
∞
28
¢
97
¢¢
N, 75
∞
46
¢
87
¢¢
E, altitude 648 m a.s.l.); (4)Tulek (KY, latitude 43
∞
06
¢
56
¢¢
N, 74
∞
05
¢
51
¢¢
E, altitude758 m a.s.l.). The other five localities were in themountains at altitudes above 1000 m: (5) CharinCañon (KZ, latitude 43
∞
15
¢
61
¢¢
N, 78
∞
59
¢
55
¢¢
E, alti-tude 1225 m a.s.l.); (6) Kok-jar (KY, latitude42
∞
41
¢
54
¢¢
N, 74
∞
39
¢
40
¢¢
E, altitude 1283 m a.s.l.); (7)Chon-Kurchak (KY, latitude 42
∞
38
¢
84
¢¢
N, 74
∞
37
¢
63
¢¢
E,
CALL DEGRADATION IN TOADS
13
© 2003 The Linnean Society of London,
Biological Journal of the Linnean Society,
2003,
78
, 11–26
altitude 1920 m a.s.l.); (8) Big Lake (KZ, latitude43
∞
04
¢
52
¢¢
N, 76
∞
59
¢
05
¢¢
E, altitude 2300 m a.s.l.); (9)Koi-Tash (KY, latitude 42
∞
41
¢
04
¢¢
N, 74
∞
40
¢
22
¢¢
E, alti-tude 1350 m a.s.l.). All sites were in open grasslands.For each locality we estimated the mean height ofplants and the percentage of ground covered by vege-tation. Five 1 m
-
2
quadrats were sampled at regulardistances along the experimental transect (see below).For each quadrat, we visually estimated the percentcover according to the classes defined by the Braun-Blanquet cover scale (class 0, cover 0–0.9%; class 1,cover 1–5%; class 2, cover 6–25%; class 3, cover 26–50%; class 4, cover 51–75%; class 5, cover 76–100%).To estimate the mean vegetation height, we groupedvegetation in five height classes (1, 1–10 cm; 2, 11–25 cm; 3, 26–50 cm; 4, 50–75 cm; 5,
>
75 cm) andranked these categories according to their abundancein the quadrat. We calculated the mean vegetationheight by weight-averaging the medians of the vege-tation height categories (mean vegetation height
=S
(r
i
¥
x
i
)/
S
r
i
; where x
i
is the median of class (i) of veg-etation height, and r
i
is its rank of abundance).
E
XPERIMENTAL
PROCEDURE
We carried out the transmission experiments duringnight time, between 2100 and 0200 h, when thesetoads call. Experimental calls (see below), containedon a digital tape, were played back with a DATrecorder (Sony TCD-D8) and passed through a soundamplifier (Proton D230) and a loud speaker (JBLcontrol-1), placed at ground level.
Before each transmission session we adjusted thevolume of the tape recorder so that a 1.4 kHz puretone had a fast-root mean square (RMS) of 90 SPL dBat 0.5 m in front of the loud speaker. We measured thesound pressure levels to the nearest dB by means of asound pressure level meter REALISTIC (mod. 33–2050). After calibration, and during each recordingsession, we kept constant the output level of thebroadcasting tape recorder.
We recorded the broadcast stimuli with a secondSony TCD-D8 DAT recorder and a Sennheiser K6microphone. Each broadcast sound was subsequentlyrecorded along a transect, at 2 m, 4 m, 8 m, 16 m, and32 m from the source, with the microphone at a heightof 10 cm above the ground. At each distance, weadjusted the microphone input level so that the broad-cast sounds from stimulus tape could be recorded atthe highest possible input without being overloaded.Once we set the microphone input level, we broadcastwith a Marantz CP430 tape recorder a calibration tonenear the microphone and read its sound pressure levelinto the tape recorder. This sound was employed as acalibration signal to calculate the absolute SPLs of therecorded sounds. Within each locality we repeated a
complete series of recordings three times, along thesame transect, and during the same night. Before eachrecording session, we measured the relative humidityand the air temperature.
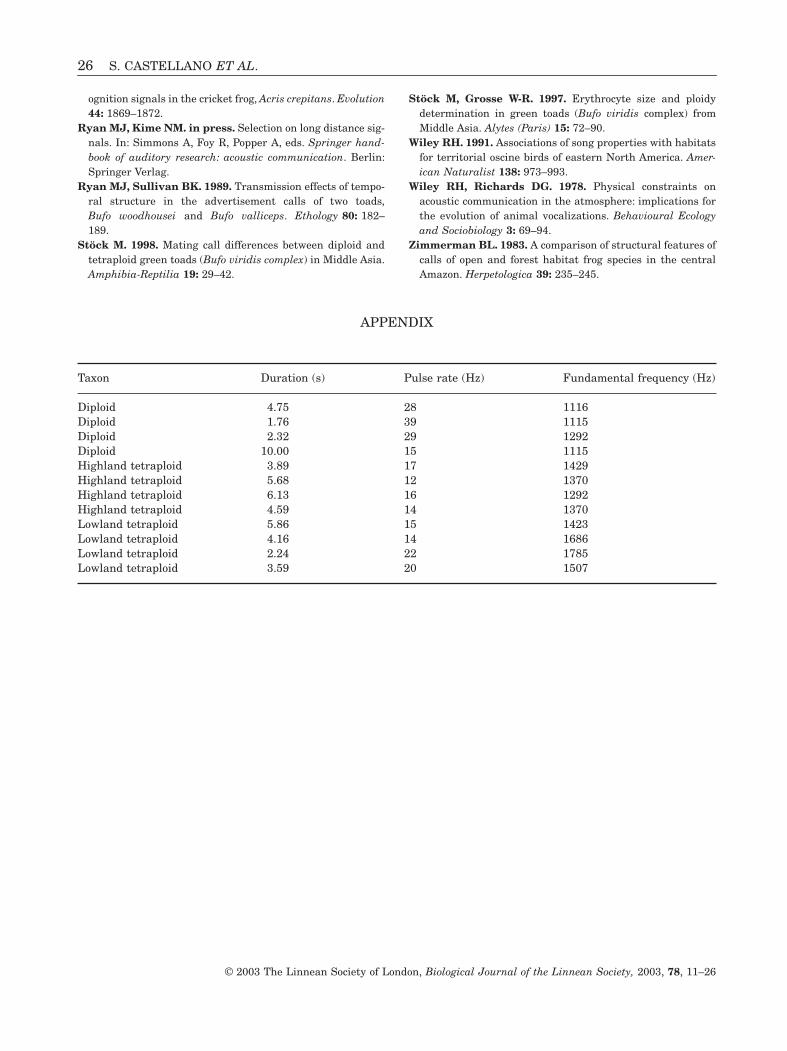
The tape employed in the transmission experimentscontained 12 natural calls, the acoustic properties ofwhich are shown in Appendix. These calls wereselected to cover the whole natural variation of funda-mental frequency and pulse rate observed in the taxa.Calls 1–4 were of diploids toads, calls 5–8 were ofhighland tetraploid toads, and calls 9–12 were of low-land tetraploid toads. Calls were previously normal-ized and therefore they had the same peak SPL. Sincecalls have different amplitude modulation rates, theyalso have different RMS SPLs. However, these differ-ences were not statistically significant among thethree taxa (Kruskal–Wallis
= 3.515; d.f. = 2; P > 0.1).
ANALYSES OF THE BROADCAST CALLS
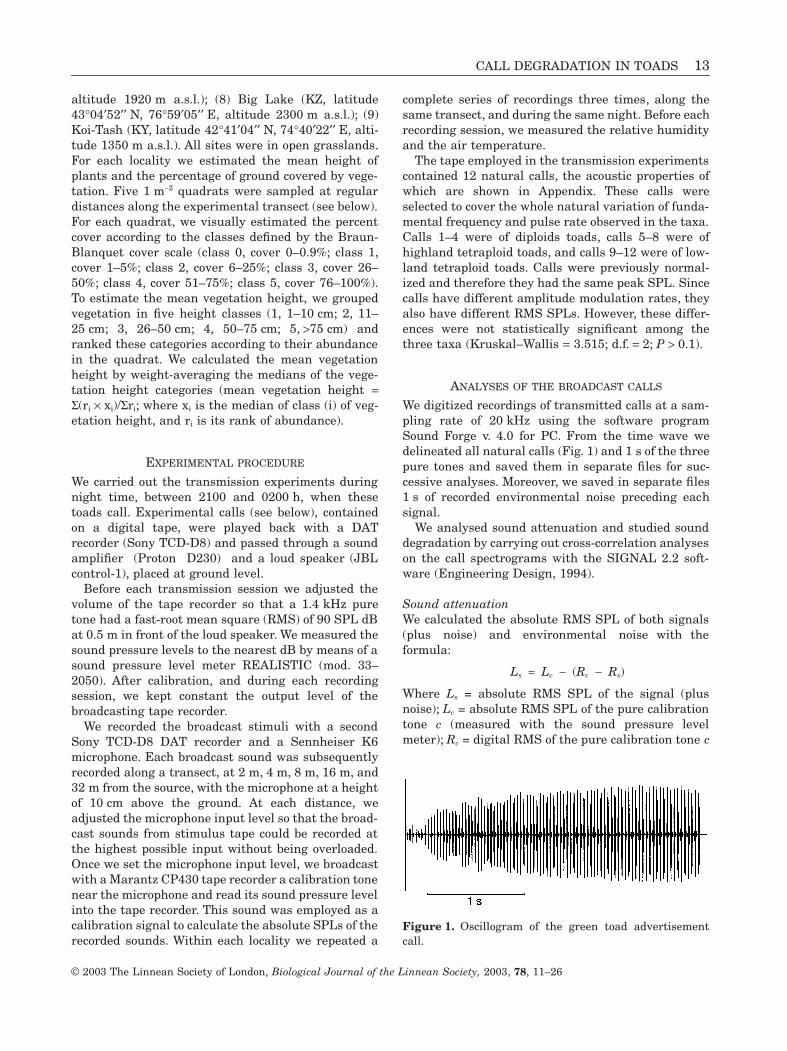
We digitized recordings of transmitted calls at a sam-pling rate of 20 kHz using the software programSound Forge v. 4.0 for PC. From the time wave wedelineated all natural calls (Fig. 1) and 1 s of the threepure tones and saved them in separate files for suc-cessive analyses. Moreover, we saved in separate files1 s of recorded environmental noise preceding eachsignal.
We analysed sound attenuation and studied sounddegradation by carrying out cross-correlation analyseson the call spectrograms with the SIGNAL 2.2 soft-ware (Engineering Design, 1994).
Sound attenuationWe calculated the absolute RMS SPL of both signals(plus noise) and environmental noise with theformula:
Ls = Lc - (Rc - Rs)
Where Ls = absolute RMS SPL of the signal (plusnoise); Lc = absolute RMS SPL of the pure calibrationtone c (measured with the sound pressure levelmeter); Rc = digital RMS of the pure calibration tone c
Figure 1. Oscillogram of the green toad advertisementcall.
14 S. CASTELLANO ET AL.
© 2003 The Linnean Society of London, Biological Journal of the Linnean Society, 2003, 78, 11–26
(measured after digitalization of the signal); Rs = dig-ital RMS of the signal s.
Since calls were longer than the maximum timeinterval over which the recorded RMS calculation waspossible (1 s), for each call we calculated the meanamplitude over the same 1 s interval (precision at thenearest ms).
For signal-to-noise SPL differences higher than7 dB, the contribution of the environmental noise tothe total sound pressure level (that is, the signal plusnoise SPL) was lower than the accuracy of the soundpressure meter we employed (± 1 dB). However, fordifferences lower than 7 dB, the environmental noisehad detectable effects. In these cases, therefore, weadjusted the signal SPL according to the formula(Magrab, 1975):
L’s = Ls + 10 Log (1 - 10-((Ls-Ln)/10))
where Ls = absolute RMS SPL of the signal (plusnoise); L’s = adjusted absolute RMS SPL of the signal s;Ln = absolute RMS SPL of the 1 s noise preceding thesignal.
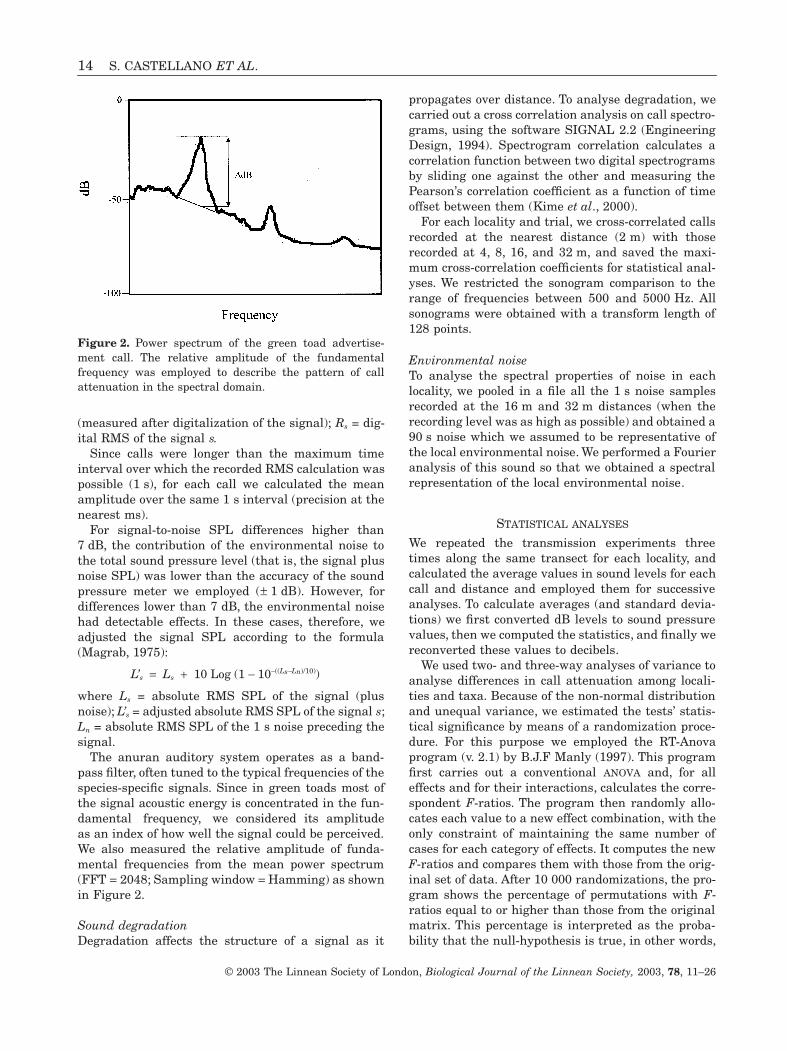
The anuran auditory system operates as a band-pass filter, often tuned to the typical frequencies of thespecies-specific signals. Since in green toads most ofthe signal acoustic energy is concentrated in the fun-damental frequency, we considered its amplitudeas an index of how well the signal could be perceived.We also measured the relative amplitude of funda-mental frequencies from the mean power spectrum(FFT = 2048; Sampling window = Hamming) as shownin Figure 2.
Sound degradationDegradation affects the structure of a signal as it
propagates over distance. To analyse degradation, wecarried out a cross correlation analysis on call spectro-grams, using the software SIGNAL 2.2 (EngineeringDesign, 1994). Spectrogram correlation calculates acorrelation function between two digital spectrogramsby sliding one against the other and measuring thePearson’s correlation coefficient as a function of timeoffset between them (Kime et al., 2000).
For each locality and trial, we cross-correlated callsrecorded at the nearest distance (2 m) with thoserecorded at 4, 8, 16, and 32 m, and saved the maxi-mum cross-correlation coefficients for statistical anal-yses. We restricted the sonogram comparison to therange of frequencies between 500 and 5000 Hz. Allsonograms were obtained with a transform length of128 points.
Environmental noiseTo analyse the spectral properties of noise in eachlocality, we pooled in a file all the 1 s noise samplesrecorded at the 16 m and 32 m distances (when therecording level was as high as possible) and obtained a90 s noise which we assumed to be representative ofthe local environmental noise. We performed a Fourieranalysis of this sound so that we obtained a spectralrepresentation of the local environmental noise.
STATISTICAL ANALYSES
We repeated the transmission experiments threetimes along the same transect for each locality, andcalculated the average values in sound levels for eachcall and distance and employed them for successiveanalyses. To calculate averages (and standard devia-tions) we first converted dB levels to sound pressurevalues, then we computed the statistics, and finally wereconverted these values to decibels.
We used two- and three-way analyses of variance toanalyse differences in call attenuation among locali-ties and taxa. Because of the non-normal distributionand unequal variance, we estimated the tests’ statis-tical significance by means of a randomization proce-dure. For this purpose we employed the RT-Anovaprogram (v. 2.1) by B.J.F Manly (1997). This programfirst carries out a conventional ANOVA and, for alleffects and for their interactions, calculates the corre-spondent F-ratios. The program then randomly allo-cates each value to a new effect combination, with theonly constraint of maintaining the same number ofcases for each category of effects. It computes the newF-ratios and compares them with those from the orig-inal set of data. After 10 000 randomizations, the pro-gram shows the percentage of permutations with F-ratios equal to or higher than those from the originalmatrix. This percentage is interpreted as the proba-bility that the null-hypothesis is true, in other words,
Figure 2. Power spectrum of the green toad advertise-ment call. The relative amplitude of the fundamentalfrequency was employed to describe the pattern of callattenuation in the spectral domain.
CALL DEGRADATION IN TOADS 15
© 2003 The Linnean Society of London, Biological Journal of the Linnean Society, 2003, 78, 11–26
that the counts for each effect combination are randomsamples of the same distribution.
We carried out two-way ANOVAs, with distance andtaxon as independent effects, to analyse differencesamong taxa for each locality. We also carried out three-way ANOVAs to test the environmental selectionhypothesis in which distance, taxon, and the type ofenvironment were considered as independent effects.We considered eight localities (Koi-tash was excludedbecause no recordings at 16 m and 32 m were con-ducted in this locality) and classified them accordingto two criteria: altitude and environmental noise. Inthe first case, we classified Damba, Kopa, Kapchagai,and Tulek as lowland localities, and Chonkurchak,Kok-jar, Charin and Big Lake as highland localities. Inthe second case, we distinguished three categoriesof environmental noise: (i) low noise (Chonkurchak,Charin and Damba); (ii) biological noise (Tulek,Kapchagai and Kopa); and (iii) atmospheric noise(Kok-jar and Big Lake). Since the randomization pro-gram we employed required the same number of rep-licates for each effect, and since the number oflocalities for the three categories of environmentalnoise were not the same, we carried out nine analysesof variance, comparing six localities at time, so that allpossible combinations were considered.
RESULTS
LOCALITIES AND THEIR ENVIRONMENTAL NOISE
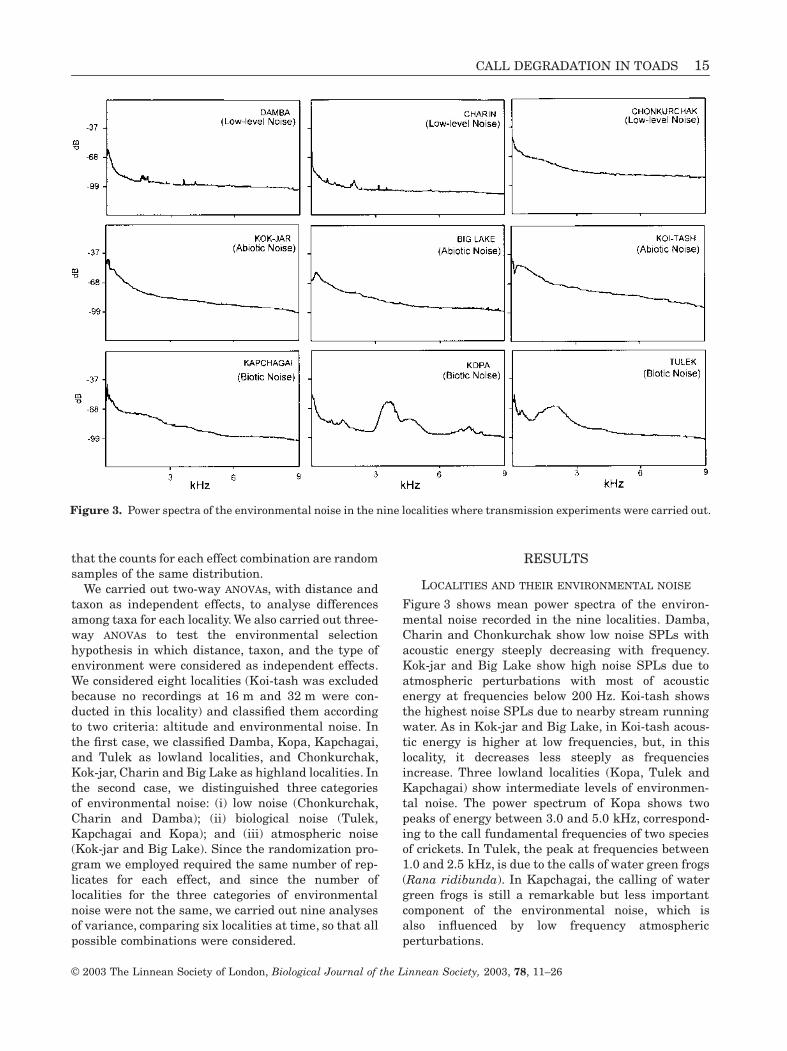
Figure 3 shows mean power spectra of the environ-mental noise recorded in the nine localities. Damba,Charin and Chonkurchak show low noise SPLs withacoustic energy steeply decreasing with frequency.Kok-jar and Big Lake show high noise SPLs due toatmospheric perturbations with most of acousticenergy at frequencies below 200 Hz. Koi-tash showsthe highest noise SPLs due to nearby stream runningwater. As in Kok-jar and Big Lake, in Koi-tash acous-tic energy is higher at low frequencies, but, in thislocality, it decreases less steeply as frequenciesincrease. Three lowland localities (Kopa, Tulek andKapchagai) show intermediate levels of environmen-tal noise. The power spectrum of Kopa shows twopeaks of energy between 3.0 and 5.0 kHz, correspond-ing to the call fundamental frequencies of two speciesof crickets. In Tulek, the peak at frequencies between1.0 and 2.5 kHz, is due to the calls of water green frogs(Rana ridibunda). In Kapchagai, the calling of watergreen frogs is still a remarkable but less importantcomponent of the environmental noise, which isalso influenced by low frequency atmosphericperturbations.
Figure 3. Power spectra of the environmental noise in the nine localities where transmission experiments were carried out.

16 S. CASTELLANO ET AL.
© 2003 The Linnean Society of London, Biological Journal of the Linnean Society, 2003, 78, 11–26
AMONG-LOCALITY DIFFERENCES IN SOUND PROPAGATION
Attenuation of callsFigure 4 shows, for each locality, the mean SPLs of thecall of the three taxa at different distances from thesource. Independent of taxon, we observed differentpatterns of attenuation with distance. We regressedthe absolute SPLs of calls against distances andemployed the absolute values of the regression coeffi-cients as an estimate of the sound attenuation rate. Byregressing these coefficients against the mean grassheight we found a significant positive relationship(N = 9; R = 0.756; b = 0.166; F1,7 = 9.355; P = 0.018): thetaller the grasses the greater the sound attenuation.On the other hand, we did not find any significantrelationships between attenuation and either the veg-etation cover (N = 9; R = 0.117; b = 0.009; F1, 7 = 0.098;P = NS) or the level of background noise (N = 9; R =0.156; b = -0.043; F1, 7 = 0.174; P = NS).
Diploid calls showed higher mean SPLs than bothhighland and lowland tetraploid calls in all localitiesbut Kopa. Table 1 shows results of two-way ANOVAs,
with distance and taxon as independent effects. In alllocalities the distance significantly affected call SPL.However, the call taxon showed significant effects inonly seven out of nine localities (in Kopa and Big Lakediploid, and highland and lowland tetraploid calls didnot show significantly different patterns of propaga-tion), and in none of them was the interaction betweendistance and taxon statistically significant.
Among the three taxa, lowland tetraploids showedthe larger differences relative to the other two species.By considering only diploid and lowland tetraploidcalls, we found significant differences in mean SPL inseven of nine localities: Kapchagai (F = 14.58; P =0.0008); Koi-tash (F = 23.44; P = 0.0001); Chonkur-chak (F = 27.70; P = 0.0001); Charin (F = 41.45; P =0.0001); Kok-jar (F = 11.36; P = 0.0022); Damba(F = 22.11; P = 0.0001); and Tulek (F = 14.30; P =0.0008). By comparing highland and lowland tetrap-loid calls, we found significant differences in meanSPL in six localities: Koi-tash (F = 14.50; P = 0.0026);Chonkurchak (F = 11.44; P = 0.0018); Charin(F = 17.01; P = 0.0006); Kok-jar (F = 9.49; P = 0.0058);Damba (F = 15.93; P = 0.0004); and Tulek (F = 9.87; P
Figure 4. Call attenuation in the temporal domain: SPL variation with distance in the calls of the three taxa. The dottedlines show the environmental noise SPLs (diploids:�; highland tetraploids: �; lowland tetraploids: �).
CALL DEGRADATION IN TOADS 17
© 2003 The Linnean Society of London, Biological Journal of the Linnean Society, 2003, 78, 11–26
= 0.0041). Finally, when we compared diploids andhighland tetraploids, we detected significant differ-ences only in three localities: Kapchagai (F = 4.5; P =0.0429), Chonkurchak (F = 6.54; P = 0.0169), wherediploid calls broadcast better than tetraploid calls, andKopa (F = 5.48; P = 0.028), where tetraploid callsbroadcast better than diploid calls.
Attenuation of the fundamental frequencyWe measured the relative amplitude of calls’ funda-mental frequency within each locality and distance(Fig. 5). Independent of the taxon, we estimated therate of attenuation by regressing frequency ampli-tudes against distances. In simple regression models,the rate of attenuation (that is, the absolute values of
the regression coefficients) was not significantly cor-related with either the vegetation height (N = 9; R =0.427; b = 0.108; F1,7 = 1.564; P = 0.251) or the vegeta-tion cover (N = 9; R = 0.042; b = -0.004; F1,7 = 0.013; P= 0.914) or the level of background noise (N = 9; R =0.554; b = 0.173; F1,7 = 3.107; P = 0.121), but it was sig-nificantly correlated with the coefficient of attenuationof the calls (b = 0.825; P = 0.005) and the level of back-ground noise (b = 0.209; P = 0.008). These results showthat the relative amplitude of the fundamental fre-quency depends on the absolute SPL of sounds but isaffected also by the masking effects of backgroundnoise.
In Table 2 we show results of two-way ANOVAs. Withthe only exception of Charin (P = 0.05), the relative
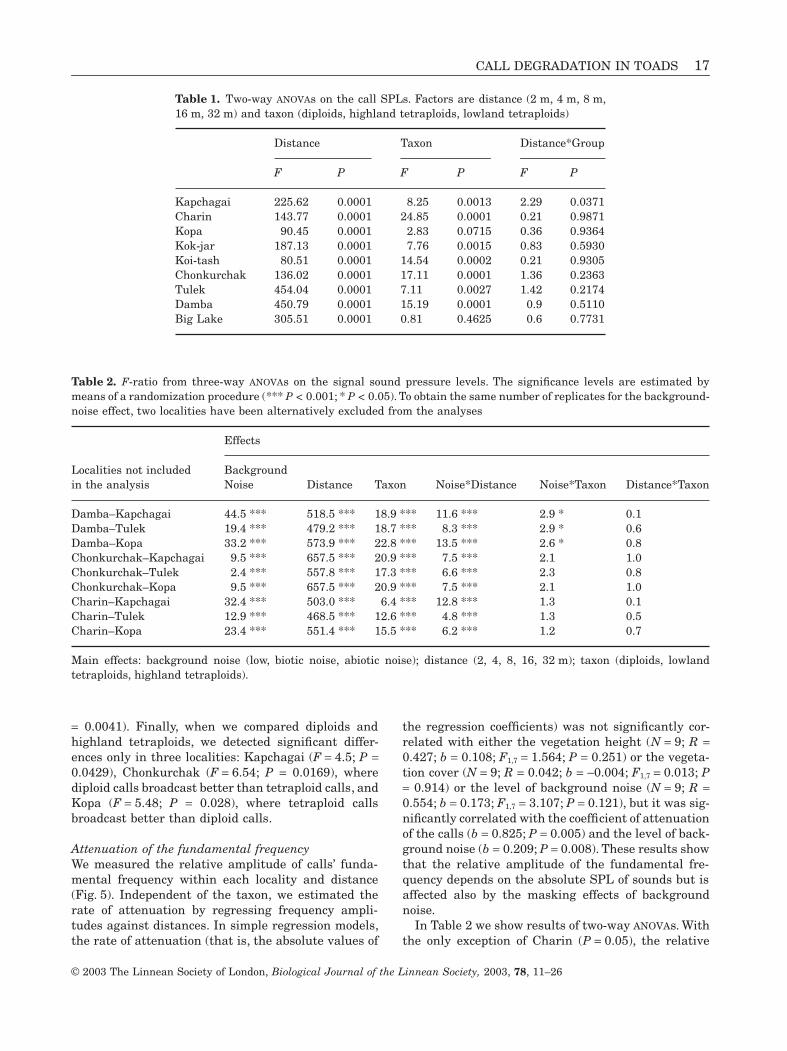
Table 1. Two-way ANOVAs on the call SPLs. Factors are distance (2 m, 4 m, 8 m,16 m, 32 m) and taxon (diploids, highland tetraploids, lowland tetraploids)
Distance Taxon Distance*Group
F P F P F P
Kapchagai 225.62 0.0001 8.25 0.0013 2.29 0.0371Charin 143.77 0.0001 24.85 0.0001 0.21 0.9871Kopa 90.45 0.0001 2.83 0.0715 0.36 0.9364Kok-jar 187.13 0.0001 7.76 0.0015 0.83 0.5930Koi-tash 80.51 0.0001 14.54 0.0002 0.21 0.9305Chonkurchak 136.02 0.0001 17.11 0.0001 1.36 0.2363Tulek 454.04 0.0001 7.11 0.0027 1.42 0.2174Damba 450.79 0.0001 15.19 0.0001 0.9 0.5110Big Lake 305.51 0.0001 0.81 0.4625 0.6 0.7731
Table 2. F-ratio from three-way ANOVAs on the signal sound pressure levels. The significance levels are estimated bymeans of a randomization procedure (*** P < 0.001; * P < 0.05). To obtain the same number of replicates for the background-noise effect, two localities have been alternatively excluded from the analyses
Localities not includedin the analysis
Effects
BackgroundNoise Distance Taxon Noise*Distance Noise*Taxon Distance*Taxon
Damba–Kapchagai 44.5 *** 518.5 *** 18.9 *** 11.6 *** 2.9 * 0.1Damba–Tulek 19.4 *** 479.2 *** 18.7 *** 8.3 *** 2.9 * 0.6Damba–Kopa 33.2 *** 573.9 *** 22.8 *** 13.5 *** 2.6 * 0.8Chonkurchak–Kapchagai 9.5 *** 657.5 *** 20.9 *** 7.5 *** 2.1 1.0Chonkurchak–Tulek 2.4 *** 557.8 *** 17.3 *** 6.6 *** 2.3 0.8Chonkurchak–Kopa 9.5 *** 657.5 *** 20.9 *** 7.5 *** 2.1 1.0Charin–Kapchagai 32.4 *** 503.0 *** 6.4 *** 12.8 *** 1.3 0.1Charin–Tulek 12.9 *** 468.5 *** 12.6 *** 4.8 *** 1.3 0.5Charin–Kopa 23.4 *** 551.4 *** 15.5 *** 6.2 *** 1.2 0.7
Main effects: background noise (low, biotic noise, abiotic noise); distance (2, 4, 8, 16, 32 m); taxon (diploids, lowlandtetraploids, highland tetraploids).
18 S. CASTELLANO ET AL.
© 2003 The Linnean Society of London, Biological Journal of the Linnean Society, 2003, 78, 11–26
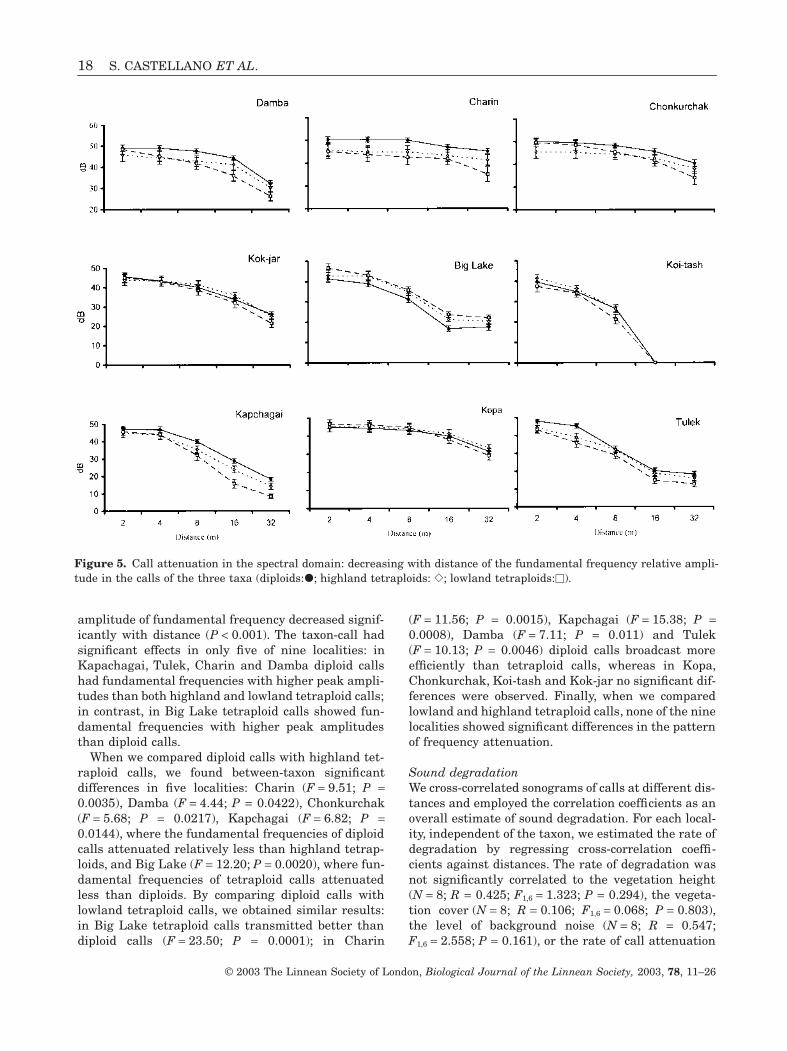
amplitude of fundamental frequency decreased signif-icantly with distance (P < 0.001). The taxon-call hadsignificant effects in only five of nine localities: inKapachagai, Tulek, Charin and Damba diploid callshad fundamental frequencies with higher peak ampli-tudes than both highland and lowland tetraploid calls;in contrast, in Big Lake tetraploid calls showed fun-damental frequencies with higher peak amplitudesthan diploid calls.
When we compared diploid calls with highland tet-raploid calls, we found between-taxon significantdifferences in five localities: Charin (F = 9.51; P =0.0035), Damba (F = 4.44; P = 0.0422), Chonkurchak(F = 5.68; P = 0.0217), Kapchagai (F = 6.82; P =0.0144), where the fundamental frequencies of diploidcalls attenuated relatively less than highland tetrap-loids, and Big Lake (F = 12.20; P = 0.0020), where fun-damental frequencies of tetraploid calls attenuatedless than diploids. By comparing diploid calls withlowland tetraploid calls, we obtained similar results:in Big Lake tetraploid calls transmitted better thandiploid calls (F = 23.50; P = 0.0001); in Charin
(F = 11.56; P = 0.0015), Kapchagai (F = 15.38; P =0.0008), Damba (F = 7.11; P = 0.011) and Tulek(F = 10.13; P = 0.0046) diploid calls broadcast moreefficiently than tetraploid calls, whereas in Kopa,Chonkurchak, Koi-tash and Kok-jar no significant dif-ferences were observed. Finally, when we comparedlowland and highland tetraploid calls, none of the ninelocalities showed significant differences in the patternof frequency attenuation.
Sound degradationWe cross-correlated sonograms of calls at different dis-tances and employed the correlation coefficients as anoverall estimate of sound degradation. For each local-ity, independent of the taxon, we estimated the rate ofdegradation by regressing cross-correlation coeffi-cients against distances. The rate of degradation wasnot significantly correlated to the vegetation height(N = 8; R = 0.425; F1,6 = 1.323; P = 0.294), the vegeta-tion cover (N = 8; R = 0.106; F1,6 = 0.068; P = 0.803),the level of background noise (N = 8; R = 0.547;F1,6 = 2.558; P = 0.161), or the rate of call attenuation
Figure 5. Call attenuation in the spectral domain: decreasing with distance of the fundamental frequency relative ampli-tude in the calls of the three taxa (diploids:�; highland tetraploids: �; lowland tetraploids:�).
CALL DEGRADATION IN TOADS 19
© 2003 The Linnean Society of London, Biological Journal of the Linnean Society, 2003, 78, 11–26
(N = 8; R = 0.409; F1,6 = 1.208; P = 0.314), but it wassignificantly correlated with the attenuation rateof the fundamental frequency (N = 8; R = 0.826;F1,6 = 12.91; P = 0.011).
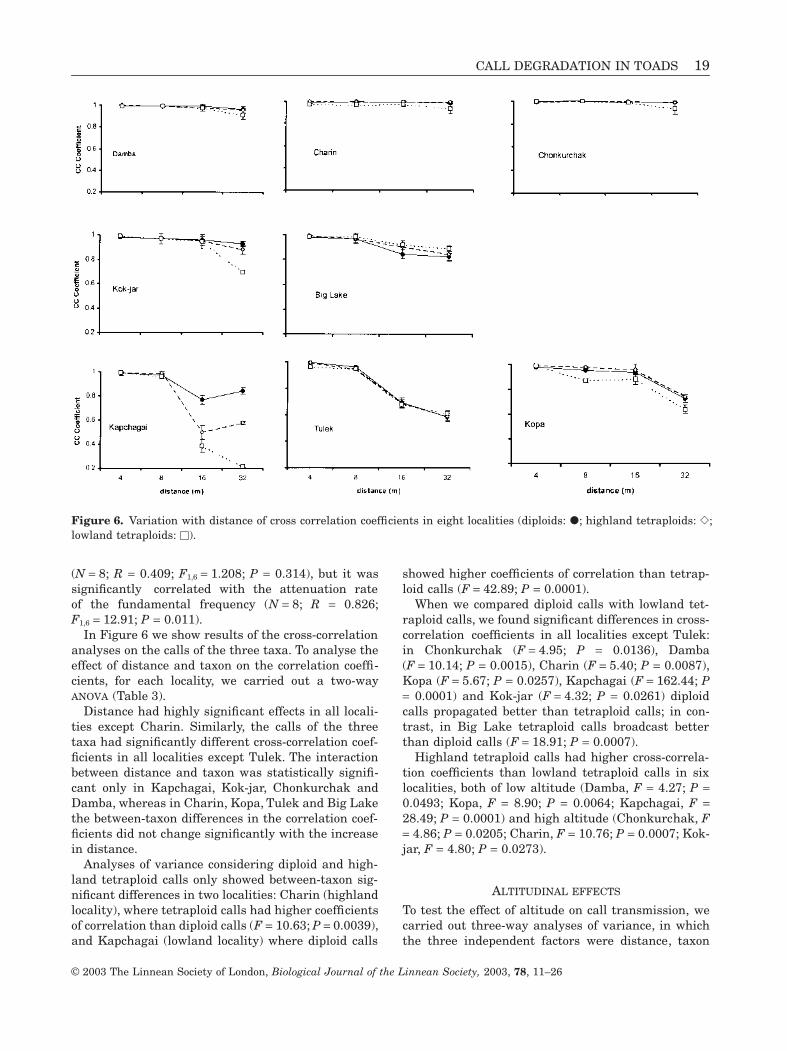
In Figure 6 we show results of the cross-correlationanalyses on the calls of the three taxa. To analyse theeffect of distance and taxon on the correlation coeffi-cients, for each locality, we carried out a two-wayANOVA (Table 3).
Distance had highly significant effects in all locali-ties except Charin. Similarly, the calls of the threetaxa had significantly different cross-correlation coef-ficients in all localities except Tulek. The interactionbetween distance and taxon was statistically signifi-cant only in Kapchagai, Kok-jar, Chonkurchak andDamba, whereas in Charin, Kopa, Tulek and Big Lakethe between-taxon differences in the correlation coef-ficients did not change significantly with the increasein distance.
Analyses of variance considering diploid and high-land tetraploid calls only showed between-taxon sig-nificant differences in two localities: Charin (highlandlocality), where tetraploid calls had higher coefficientsof correlation than diploid calls (F = 10.63; P = 0.0039),and Kapchagai (lowland locality) where diploid calls
showed higher coefficients of correlation than tetrap-loid calls (F = 42.89; P = 0.0001).
When we compared diploid calls with lowland tet-raploid calls, we found significant differences in cross-correlation coefficients in all localities except Tulek:in Chonkurchak (F = 4.95; P = 0.0136), Damba(F = 10.14; P = 0.0015), Charin (F = 5.40; P = 0.0087),Kopa (F = 5.67; P = 0.0257), Kapchagai (F = 162.44; P= 0.0001) and Kok-jar (F = 4.32; P = 0.0261) diploidcalls propagated better than tetraploid calls; in con-trast, in Big Lake tetraploid calls broadcast betterthan diploid calls (F = 18.91; P = 0.0007).
Highland tetraploid calls had higher cross-correla-tion coefficients than lowland tetraploid calls in sixlocalities, both of low altitude (Damba, F = 4.27; P =0.0493; Kopa, F = 8.90; P = 0.0064; Kapchagai, F =28.49; P = 0.0001) and high altitude (Chonkurchak, F= 4.86; P = 0.0205; Charin, F = 10.76; P = 0.0007; Kok-jar, F = 4.80; P = 0.0273).
ALTITUDINAL EFFECTS
To test the effect of altitude on call transmission, wecarried out three-way analyses of variance, in whichthe three independent factors were distance, taxon
Figure 6. Variation with distance of cross correlation coefficients in eight localities (diploids: �; highland tetraploids: �;lowland tetraploids: �).
20 S. CASTELLANO ET AL.
© 2003 The Linnean Society of London, Biological Journal of the Linnean Society, 2003, 78, 11–26
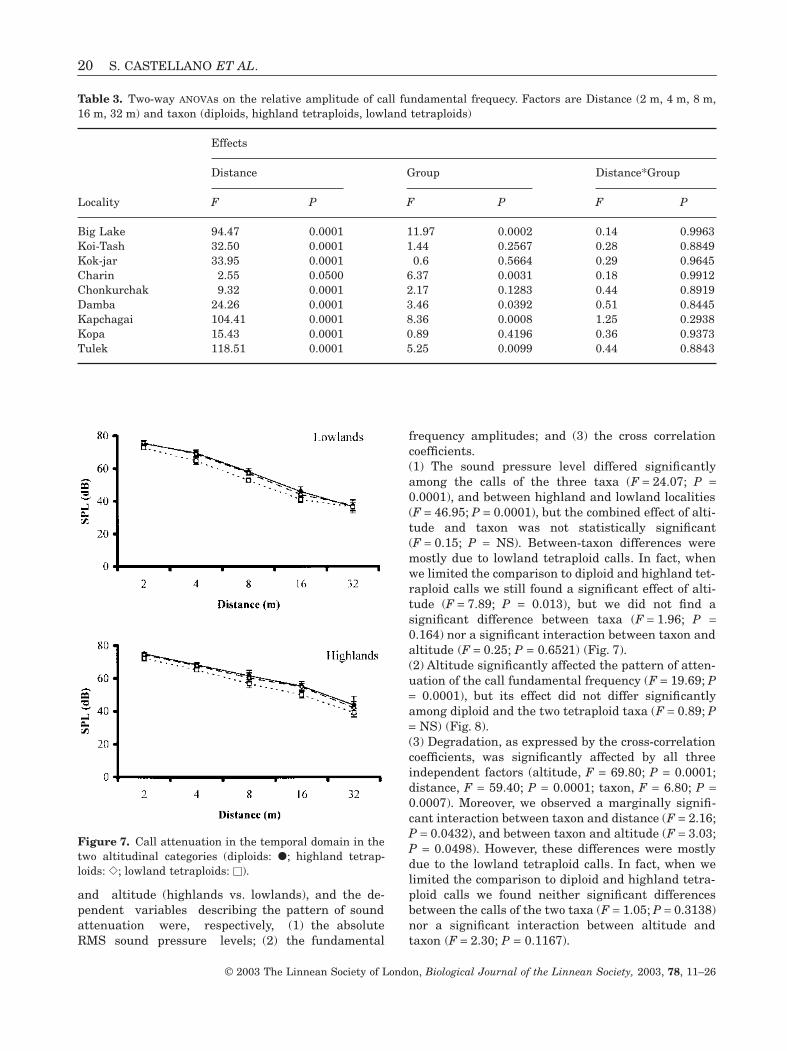
and altitude (highlands vs. lowlands), and the de-pendent variables describing the pattern of soundattenuation were, respectively, (1) the absoluteRMS sound pressure levels; (2) the fundamental
frequency amplitudes; and (3) the cross correlationcoefficients.(1) The sound pressure level differed significantlyamong the calls of the three taxa (F = 24.07; P =0.0001), and between highland and lowland localities(F = 46.95; P = 0.0001), but the combined effect of alti-tude and taxon was not statistically significant(F = 0.15; P = NS). Between-taxon differences weremostly due to lowland tetraploid calls. In fact, whenwe limited the comparison to diploid and highland tet-raploid calls we still found a significant effect of alti-tude (F = 7.89; P = 0.013), but we did not find asignificant difference between taxa (F = 1.96; P =0.164) nor a significant interaction between taxon andaltitude (F = 0.25; P = 0.6521) (Fig. 7).(2) Altitude significantly affected the pattern of atten-uation of the call fundamental frequency (F = 19.69; P= 0.0001), but its effect did not differ significantlyamong diploid and the two tetraploid taxa (F = 0.89; P= NS) (Fig. 8).(3) Degradation, as expressed by the cross-correlationcoefficients, was significantly affected by all threeindependent factors (altitude, F = 69.80; P = 0.0001;distance, F = 59.40; P = 0.0001; taxon, F = 6.80; P =0.0007). Moreover, we observed a marginally signifi-cant interaction between taxon and distance (F = 2.16;P = 0.0432), and between taxon and altitude (F = 3.03;P = 0.0498). However, these differences were mostlydue to the lowland tetraploid calls. In fact, when welimited the comparison to diploid and highland tetra-ploid calls we found neither significant differencesbetween the calls of the two taxa (F = 1.05; P = 0.3138)nor a significant interaction between altitude andtaxon (F = 2.30; P = 0.1167).
Table 3. Two-way ANOVAs on the relative amplitude of call fundamental frequecy. Factors are Distance (2 m, 4 m, 8 m,16 m, 32 m) and taxon (diploids, highland tetraploids, lowland tetraploids)
Locality
Effects
Distance Group Distance*Group
F P F P F P
Big Lake 94.47 0.0001 11.97 0.0002 0.14 0.9963Koi-Tash 32.50 0.0001 1.44 0.2567 0.28 0.8849Kok-jar 33.95 0.0001 0.6 0.5664 0.29 0.9645Charin 2.55 0.0500 6.37 0.0031 0.18 0.9912Chonkurchak 9.32 0.0001 2.17 0.1283 0.44 0.8919Damba 24.26 0.0001 3.46 0.0392 0.51 0.8445Kapchagai 104.41 0.0001 8.36 0.0008 1.25 0.2938Kopa 15.43 0.0001 0.89 0.4196 0.36 0.9373Tulek 118.51 0.0001 5.25 0.0099 0.44 0.8843
Figure 7. Call attenuation in the temporal domain in thetwo altitudinal categories (diploids: �; highland tetrap-loids: �; lowland tetraploids: �).
CALL DEGRADATION IN TOADS 21
© 2003 The Linnean Society of London, Biological Journal of the Linnean Society, 2003, 78, 11–26
In conclusion, independently of altitude, diploid andhighland tetraploid calls exhibited less attenuationand less degradation with distance than lowland tet-raploid calls.
ENVIRONMENTAL NOISE EFFECTS
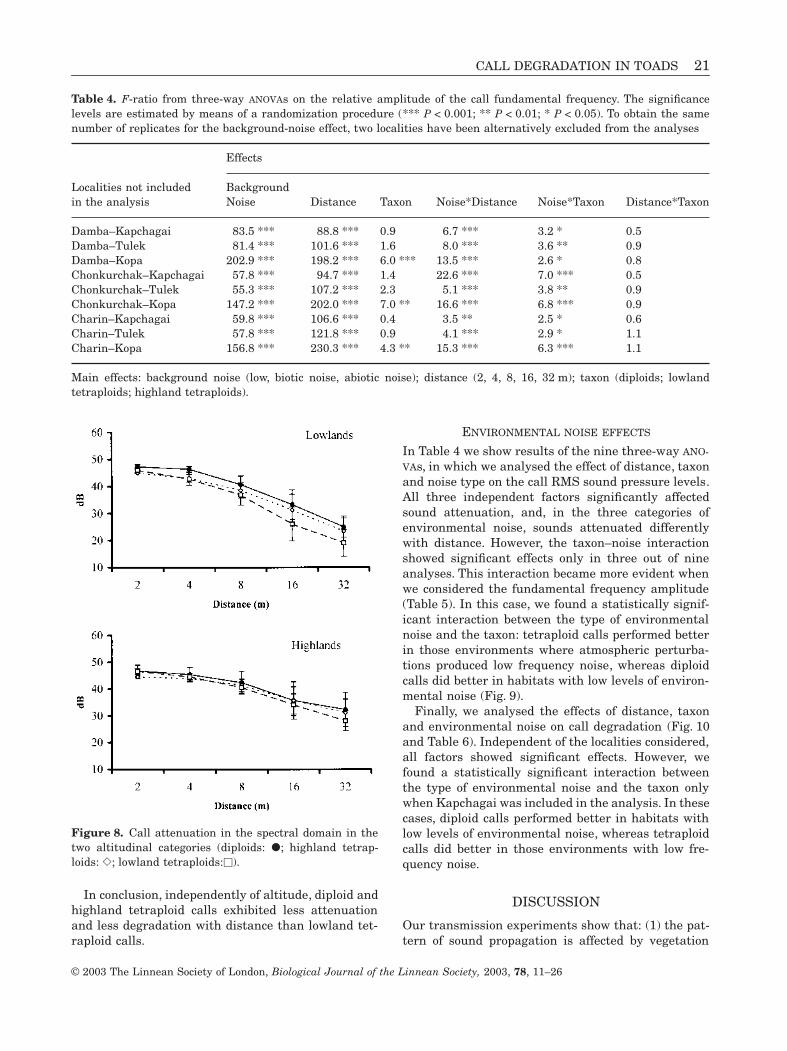
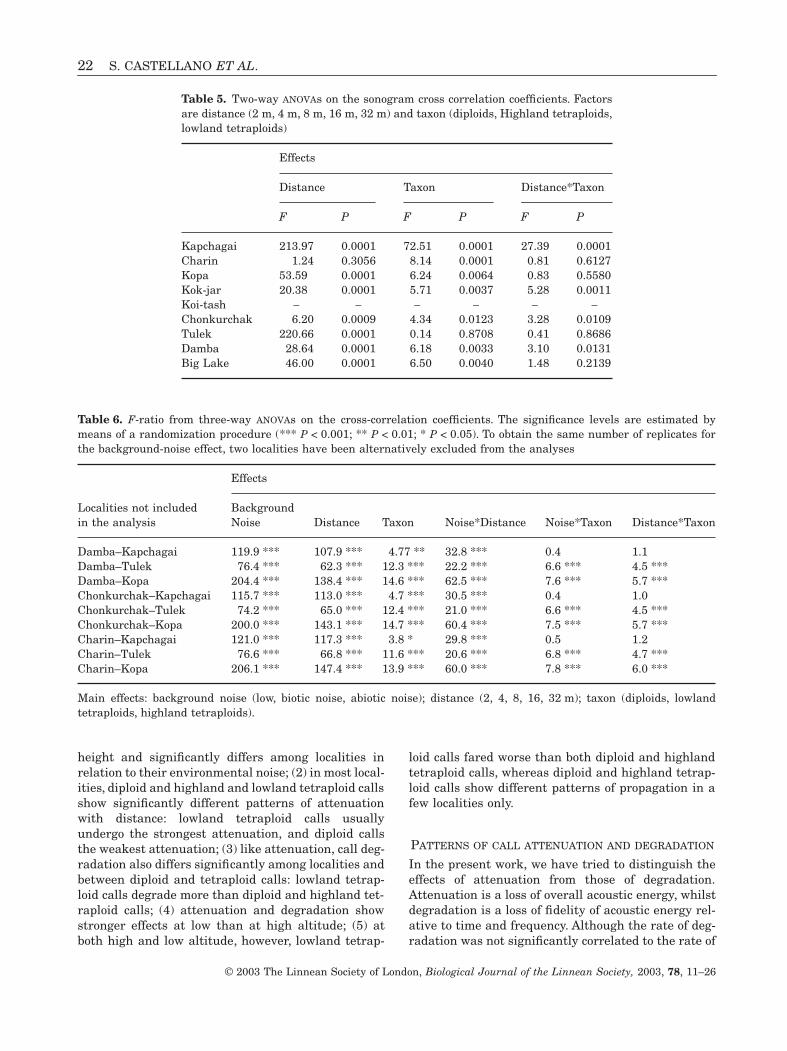
In Table 4 we show results of the nine three-way ANO-
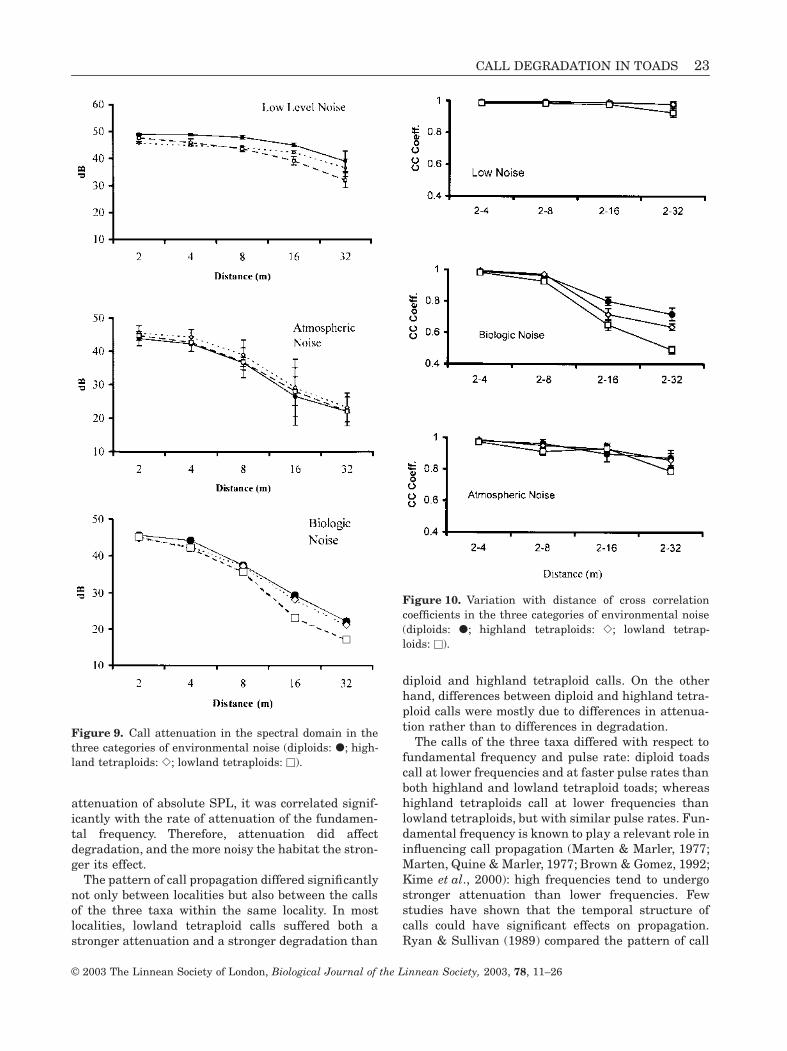
VAs, in which we analysed the effect of distance, taxonand noise type on the call RMS sound pressure levels.All three independent factors significantly affectedsound attenuation, and, in the three categories ofenvironmental noise, sounds attenuated differentlywith distance. However, the taxon–noise interactionshowed significant effects only in three out of nineanalyses. This interaction became more evident whenwe considered the fundamental frequency amplitude(Table 5). In this case, we found a statistically signif-icant interaction between the type of environmentalnoise and the taxon: tetraploid calls performed betterin those environments where atmospheric perturba-tions produced low frequency noise, whereas diploidcalls did better in habitats with low levels of environ-mental noise (Fig. 9).
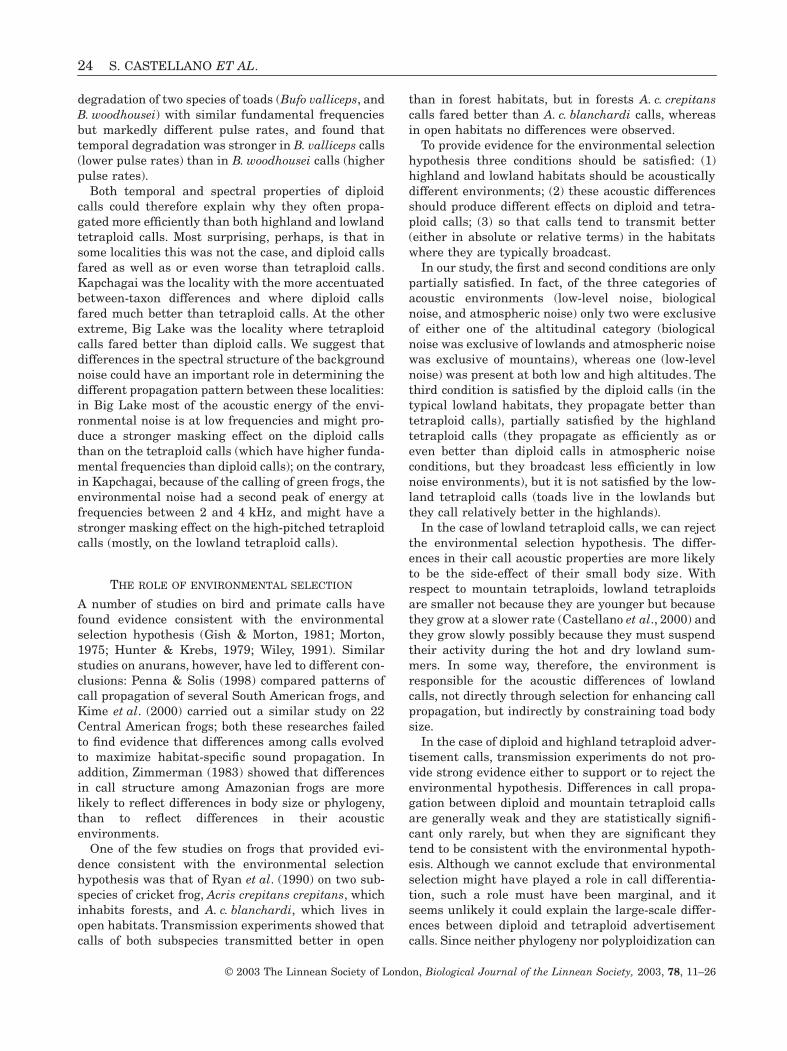
Finally, we analysed the effects of distance, taxonand environmental noise on call degradation (Fig. 10and Table 6). Independent of the localities considered,all factors showed significant effects. However, wefound a statistically significant interaction betweenthe type of environmental noise and the taxon onlywhen Kapchagai was included in the analysis. In thesecases, diploid calls performed better in habitats withlow levels of environmental noise, whereas tetraploidcalls did better in those environments with low fre-quency noise.
DISCUSSION
Our transmission experiments show that: (1) the pat-tern of sound propagation is affected by vegetation
Figure 8. Call attenuation in the spectral domain in thetwo altitudinal categories (diploids: �; highland tetrap-loids: �; lowland tetraploids:�).
Table 4. F-ratio from three-way ANOVAs on the relative amplitude of the call fundamental frequency. The significancelevels are estimated by means of a randomization procedure (*** P < 0.001; ** P < 0.01; * P < 0.05). To obtain the samenumber of replicates for the background-noise effect, two localities have been alternatively excluded from the analyses
Localities not includedin the analysis
Effects
BackgroundNoise Distance Taxon Noise*Distance Noise*Taxon Distance*Taxon
Damba–Kapchagai 83.5 *** 88.8 *** 0.9 6.7 *** 3.2 * 0.5Damba–Tulek 81.4 *** 101.6 *** 1.6 8.0 *** 3.6 ** 0.9Damba–Kopa 202.9 *** 198.2 *** 6.0 *** 13.5 *** 2.6 * 0.8Chonkurchak–Kapchagai 57.8 *** 94.7 *** 1.4 22.6 *** 7.0 *** 0.5Chonkurchak–Tulek 55.3 *** 107.2 *** 2.3 5.1 *** 3.8 ** 0.9Chonkurchak–Kopa 147.2 *** 202.0 *** 7.0 ** 16.6 *** 6.8 *** 0.9Charin–Kapchagai 59.8 *** 106.6 *** 0.4 3.5 ** 2.5 * 0.6Charin–Tulek 57.8 *** 121.8 *** 0.9 4.1 *** 2.9 * 1.1Charin–Kopa 156.8 *** 230.3 *** 4.3 ** 15.3 *** 6.3 *** 1.1
Main effects: background noise (low, biotic noise, abiotic noise); distance (2, 4, 8, 16, 32 m); taxon (diploids; lowlandtetraploids; highland tetraploids).
22 S. CASTELLANO ET AL.
© 2003 The Linnean Society of London, Biological Journal of the Linnean Society, 2003, 78, 11–26
height and significantly differs among localities inrelation to their environmental noise; (2) in most local-ities, diploid and highland and lowland tetraploid callsshow significantly different patterns of attenuationwith distance: lowland tetraploid calls usuallyundergo the strongest attenuation, and diploid callsthe weakest attenuation; (3) like attenuation, call deg-radation also differs significantly among localities andbetween diploid and tetraploid calls: lowland tetrap-loid calls degrade more than diploid and highland tet-raploid calls; (4) attenuation and degradation showstronger effects at low than at high altitude; (5) atboth high and low altitude, however, lowland tetrap-
loid calls fared worse than both diploid and highlandtetraploid calls, whereas diploid and highland tetrap-loid calls show different patterns of propagation in afew localities only.
PATTERNS OF CALL ATTENUATION AND DEGRADATION
In the present work, we have tried to distinguish theeffects of attenuation from those of degradation.Attenuation is a loss of overall acoustic energy, whilstdegradation is a loss of fidelity of acoustic energy rel-ative to time and frequency. Although the rate of deg-radation was not significantly correlated to the rate of
Table 5. Two-way ANOVAs on the sonogram cross correlation coefficients. Factorsare distance (2 m, 4 m, 8 m, 16 m, 32 m) and taxon (diploids, Highland tetraploids,lowland tetraploids)
Effects
Distance Taxon Distance*Taxon
F P F P F P
Kapchagai 213.97 0.0001 72.51 0.0001 27.39 0.0001Charin 1.24 0.3056 8.14 0.0001 0.81 0.6127Kopa 53.59 0.0001 6.24 0.0064 0.83 0.5580Kok-jar 20.38 0.0001 5.71 0.0037 5.28 0.0011Koi-tash - - - - - -Chonkurchak 6.20 0.0009 4.34 0.0123 3.28 0.0109Tulek 220.66 0.0001 0.14 0.8708 0.41 0.8686Damba 28.64 0.0001 6.18 0.0033 3.10 0.0131Big Lake 46.00 0.0001 6.50 0.0040 1.48 0.2139
Table 6. F-ratio from three-way ANOVAs on the cross-correlation coefficients. The significance levels are estimated bymeans of a randomization procedure (*** P < 0.001; ** P < 0.01; * P < 0.05). To obtain the same number of replicates forthe background-noise effect, two localities have been alternatively excluded from the analyses
Localities not includedin the analysis
Effects
BackgroundNoise Distance Taxon Noise*Distance Noise*Taxon Distance*Taxon
Damba–Kapchagai 119.9 *** 107.9 *** 4.77 ** 32.8 *** 0.4 1.1Damba–Tulek 76.4 *** 62.3 *** 12.3 *** 22.2 *** 6.6 *** 4.5 ***Damba–Kopa 204.4 *** 138.4 *** 14.6 *** 62.5 *** 7.6 *** 5.7 ***Chonkurchak–Kapchagai 115.7 *** 113.0 *** 4.7 *** 30.5 *** 0.4 1.0Chonkurchak–Tulek 74.2 *** 65.0 *** 12.4 *** 21.0 *** 6.6 *** 4.5 ***Chonkurchak–Kopa 200.0 *** 143.1 *** 14.7 *** 60.4 *** 7.5 *** 5.7 ***Charin–Kapchagai 121.0 *** 117.3 *** 3.8 * 29.8 *** 0.5 1.2Charin–Tulek 76.6 *** 66.8 *** 11.6 *** 20.6 *** 6.8 *** 4.7 ***Charin–Kopa 206.1 *** 147.4 *** 13.9 *** 60.0 *** 7.8 *** 6.0 ***
Main effects: background noise (low, biotic noise, abiotic noise); distance (2, 4, 8, 16, 32 m); taxon (diploids, lowlandtetraploids, highland tetraploids).
CALL DEGRADATION IN TOADS 23
© 2003 The Linnean Society of London, Biological Journal of the Linnean Society, 2003, 78, 11–26
attenuation of absolute SPL, it was correlated signif-icantly with the rate of attenuation of the fundamen-tal frequency. Therefore, attenuation did affectdegradation, and the more noisy the habitat the stron-ger its effect.
The pattern of call propagation differed significantlynot only between localities but also between the callsof the three taxa within the same locality. In mostlocalities, lowland tetraploid calls suffered both astronger attenuation and a stronger degradation than
diploid and highland tetraploid calls. On the otherhand, differences between diploid and highland tetra-ploid calls were mostly due to differences in attenua-tion rather than to differences in degradation.
The calls of the three taxa differed with respect tofundamental frequency and pulse rate: diploid toadscall at lower frequencies and at faster pulse rates thanboth highland and lowland tetraploid toads; whereashighland tetraploids call at lower frequencies thanlowland tetraploids, but with similar pulse rates. Fun-damental frequency is known to play a relevant role ininfluencing call propagation (Marten & Marler, 1977;Marten, Quine & Marler, 1977; Brown & Gomez, 1992;Kime et al., 2000): high frequencies tend to undergostronger attenuation than lower frequencies. Fewstudies have shown that the temporal structure ofcalls could have significant effects on propagation.Ryan & Sullivan (1989) compared the pattern of call
Figure 9. Call attenuation in the spectral domain in thethree categories of environmental noise (diploids: �; high-land tetraploids: �; lowland tetraploids: �).
Figure 10. Variation with distance of cross correlationcoefficients in the three categories of environmental noise(diploids: �; highland tetraploids: �; lowland tetrap-loids: �).
24 S. CASTELLANO ET AL.
© 2003 The Linnean Society of London, Biological Journal of the Linnean Society, 2003, 78, 11–26
degradation of two species of toads (Bufo valliceps, andB. woodhousei) with similar fundamental frequenciesbut markedly different pulse rates, and found thattemporal degradation was stronger in B. valliceps calls(lower pulse rates) than in B. woodhousei calls (higherpulse rates).
Both temporal and spectral properties of diploidcalls could therefore explain why they often propa-gated more efficiently than both highland and lowlandtetraploid calls. Most surprising, perhaps, is that insome localities this was not the case, and diploid callsfared as well as or even worse than tetraploid calls.Kapchagai was the locality with the more accentuatedbetween-taxon differences and where diploid callsfared much better than tetraploid calls. At the otherextreme, Big Lake was the locality where tetraploidcalls fared better than diploid calls. We suggest thatdifferences in the spectral structure of the backgroundnoise could have an important role in determining thedifferent propagation pattern between these localities:in Big Lake most of the acoustic energy of the envi-ronmental noise is at low frequencies and might pro-duce a stronger masking effect on the diploid callsthan on the tetraploid calls (which have higher funda-mental frequencies than diploid calls); on the contrary,in Kapchagai, because of the calling of green frogs, theenvironmental noise had a second peak of energy atfrequencies between 2 and 4 kHz, and might have astronger masking effect on the high-pitched tetraploidcalls (mostly, on the lowland tetraploid calls).
THE ROLE OF ENVIRONMENTAL SELECTION
A number of studies on bird and primate calls havefound evidence consistent with the environmentalselection hypothesis (Gish & Morton, 1981; Morton,1975; Hunter & Krebs, 1979; Wiley, 1991). Similarstudies on anurans, however, have led to different con-clusions: Penna & Solis (1998) compared patterns ofcall propagation of several South American frogs, andKime et al. (2000) carried out a similar study on 22Central American frogs; both these researches failedto find evidence that differences among calls evolvedto maximize habitat-specific sound propagation. Inaddition, Zimmerman (1983) showed that differencesin call structure among Amazonian frogs are morelikely to reflect differences in body size or phylogeny,than to reflect differences in their acousticenvironments.
One of the few studies on frogs that provided evi-dence consistent with the environmental selectionhypothesis was that of Ryan et al. (1990) on two sub-species of cricket frog, Acris crepitans crepitans, whichinhabits forests, and A. c. blanchardi, which lives inopen habitats. Transmission experiments showed thatcalls of both subspecies transmitted better in open
than in forest habitats, but in forests A. c. crepitanscalls fared better than A. c. blanchardi calls, whereasin open habitats no differences were observed.
To provide evidence for the environmental selectionhypothesis three conditions should be satisfied: (1)highland and lowland habitats should be acousticallydifferent environments; (2) these acoustic differencesshould produce different effects on diploid and tetra-ploid calls; (3) so that calls tend to transmit better(either in absolute or relative terms) in the habitatswhere they are typically broadcast.
In our study, the first and second conditions are onlypartially satisfied. In fact, of the three categories ofacoustic environments (low-level noise, biologicalnoise, and atmospheric noise) only two were exclusiveof either one of the altitudinal category (biologicalnoise was exclusive of lowlands and atmospheric noisewas exclusive of mountains), whereas one (low-levelnoise) was present at both low and high altitudes. Thethird condition is satisfied by the diploid calls (in thetypical lowland habitats, they propagate better thantetraploid calls), partially satisfied by the highlandtetraploid calls (they propagate as efficiently as oreven better than diploid calls in atmospheric noiseconditions, but they broadcast less efficiently in lownoise environments), but it is not satisfied by the low-land tetraploid calls (toads live in the lowlands butthey call relatively better in the highlands).
In the case of lowland tetraploid calls, we can rejectthe environmental selection hypothesis. The differ-ences in their call acoustic properties are more likelyto be the side-effect of their small body size. Withrespect to mountain tetraploids, lowland tetraploidsare smaller not because they are younger but becausethey grow at a slower rate (Castellano et al., 2000) andthey grow slowly possibly because they must suspendtheir activity during the hot and dry lowland sum-mers. In some way, therefore, the environment isresponsible for the acoustic differences of lowlandcalls, not directly through selection for enhancing callpropagation, but indirectly by constraining toad bodysize.
In the case of diploid and highland tetraploid adver-tisement calls, transmission experiments do not pro-vide strong evidence either to support or to reject theenvironmental hypothesis. Differences in call propa-gation between diploid and mountain tetraploid callsare generally weak and they are statistically signifi-cant only rarely, but when they are significant theytend to be consistent with the environmental hypoth-esis. Although we cannot exclude that environmentalselection might have played a role in call differentia-tion, such a role must have been marginal, and itseems unlikely it could explain the large-scale differ-ences between diploid and tetraploid advertisementcalls. Since neither phylogeny nor polyploidization can
CALL DEGRADATION IN TOADS 25
© 2003 The Linnean Society of London, Biological Journal of the Linnean Society, 2003, 78, 11–26
explain these differences (Castellano et al., 2002), therejection of the environmental selection hypothesisfurther strengthens the alternative adaptive hypoth-esis of reproductive character displacement, accordingto which selection favoured call differentiation toenhance reproductive isolation between diploid andtetraploid green toads.
ACKNOWLEDGEMENTS
We thank T. Dujsebayeva and V. Eremchenko for theirsupport in the field, and N. Kime for help in soundanalyses.
REFERENCES
Borkin LJ, Caune IA, Pisanetz EM, Rozanov YM. 1986.Karyotype and genome size in the Bufo viridis group. In:Rocek Z, ed. Studies in herpetology. Prague: Charles Univer-sity Press, 137–142.
Borkin LJ, Eremchenko VK, Helfenberger N, PanfilovAM, Rosanov JM. 2001. On the distribution of diploid, trip-loid, and tetraploid green toads (Bufo viridis complex) inSouth-eastern Kazakhstan. Russian Journal of Herpetology8: 45–53.
Borkin LJ, Vinogradov AE, Brushko ZK, Kuzmin SL.1996. New records of tetraploid toads (Bufo viridis group)from Alma-Ata and Taldy-Kurgan region, Kazakhstan. Rus-sian Journal of Herpetology 2: 174–175.
Bradbury JW, Veherencamp SL. 1998. Principles of animalcommunication. Sunderland, MA: Sinauer Associates, Inc.
Brenowitz EA, Wilczynski W, Zakon HH. 1984. Acousticcommunication in spring peepers. Environmental andbehavioral aspects. Journal of Comparative Physiology A155: 385–592.
Brown CH. 1989. The active space of blue monkey and grey-cheeked mangabey vocalizations. Animal Behaviour 37:1023–1034.
Brown CH, Gomez R. 1992. Functional design features inprimate vocal signals: the acoustic habitat and sound distor-tion. In: Nishida T, McGrew MC, Marler P, Pickford M,deWaal F, eds. Topics in primatology, Vol. I Human Origins.Tokyo: Tokyo University Press, 177–198.
Castellano S, Giacoma C, Dujsebayeva T. 2000. Morpho-metric and advertisement call geographic variation in poly-ploid green toads. Biological Journal of the Linnean Society70: 341–360.
Castellano S, Giacoma C, Dujsebayeva T, Odierna G,Balletto E. 1998. Morphometrical and acoustical compari-son between diploid and tetraploid green toads. BiologicalJournal of the Linnean Society 63: 257–281.
Castellano S, Tontini L, Giacoma C, Lattes A, Balletto E.2002. The evolution of the release and advertisement calls ingreen toads (Bufo viridis complex). Biological Journal of theLinnean Society, 77: 379–391.
Chappuis C. 1971. Un exemple de l’influence du milieu sur lesémission vocales des oisseaux: l’évolution des chants en forêtequtoriale. Terre Vie 25: 183–202.
Cosens SE, Falls BJ. 1984. A comparison of sound propaga-tion and song frequency in temperate marsh and grasslandhabitats. Behavioural Ecology and Sociobiology 15: 161–170.
Dujsebayeva T, Castellano S, Giacoma C, Balletto E,Odierna G. 1997. On the distribution of diploid and tetra-ploid green toads in South Kazakstan. Asiatic HerpetologicalResearch 7: 27–32.
Giacoma C, Castellano S. 2001. Advertisement call varia-tion and speciation in the Bufo viridis complex. In: Ryan MJ,ed. Anuran communication. Washington: Smithsonian Insti-tution Press, 205–219.
Gish SL, Morton ES. 1981. Structural adaptation to localhabitat acoustics in Carolina wren song. Zeitschrift fürTierpsychologie 56: 74–84.
Hunter ML, Krebs JR. 1979. Geographical variation in thesong of the great tit (Parus major) in relation to ecologicalfactors. Journal of Animal Ecology 48: 759–785.
Kadyrova BK, Mazik EY, Toktosunov AT. 1976. On thekaryotype of Bufo viridis from Kirgizia. Trudi KirgizskogoGosudarstvennogo Universiteta. Seriya BiologicheskichNauk (Zoologiya) 15: 63–68. [in Russian].
Kime NM, Turner WR, Ryan MJ. 2000. The transmission ofadvertisement calls in Central American frogs. BehaviouralEcology 11: 71–83.
Magrab ED. 1975. Environmental noise control. New York:John Wiley & Sons.
Manly BJF. 1997. Randomization and Montecarlo methods inbiology, 2nd edn. London: Chapman & Hall.
Marten K, Marler P. 1977. Sound transmission and itssignificance for animal vocalization I. Temperate habitats.Behavioural Ecology and Sociobiology 2: 271–290.
Marten K, Quine D, Marler P. 1977. Sound transmissionand its significance for animal vocalization II. Tropical foresthabitats. Behavioural Ecology and Sociobiology 2: 291–301.
Mezhzherin SV, Pisanets EM. 1995. Genetic structure andorigin of the tetraploid toad Bufo danatensis Pisantez, 1978(Amphibia, Bufonidae) from Central Asia: differentiation ofgeographic forms and genetic relationship between diploidand tetraploid species. Russian Journal of Genetics 31: 342–352.
Morton ES. 1975. Ecological sources of selection on aviansounds. American Naturalist 109: 17–34.
Odierna G, Aprea G, Morescalchi A, Balletto E. 1995. Poli-ploidia nel ‘group’ Bufo viridis, Laurenti 1768 (Amphibia,Salentia). Atti 56∞ Congresso U.Z.I. Messina: Universita diMessina, 90–91.
Penna M, Solis R. 1998. Frog call intensities and sound prop-agation in the South American temperate forest region.Behavioural Ecology and Sociobiology 42: 371–381.
Roth P, Ràb P. 1986. Karyotype analysis of the Bufo viridisgroup: systematic implications. In: Rocek Z, ed. Studies inherpetology. Prague: Charles University Press, 131–136.
Ryan MJ, Brenowitz EA. 1985. The role of body size, phy-logeny, and ambient noise in the evolution of bird song.American Naturalist 126: 87–100.
Ryan MJ, Cocroft RB, Wilczynski W. 1990. The role of envi-ronmental selection in intraspecific divergence of male rec-
26 S. CASTELLANO ET AL.
© 2003 The Linnean Society of London, Biological Journal of the Linnean Society, 2003, 78, 11–26
ognition signals in the cricket frog, Acris crepitans. Evolution44: 1869–1872.
Ryan MJ, Kime NM. in press. Selection on long distance sig-nals. In: Simmons A, Foy R, Popper A, eds. Springer hand-book of auditory research: acoustic communication. Berlin:Springer Verlag.
Ryan MJ, Sullivan BK. 1989. Transmission effects of tempo-ral structure in the advertisement calls of two toads,Bufo woodhousei and Bufo valliceps. Ethology 80: 182–189.
Stöck M. 1998. Mating call differences between diploid andtetraploid green toads (Bufo viridis complex) in Middle Asia.Amphibia-Reptilia 19: 29–42.
Stöck M, Grosse W-R. 1997. Erythrocyte size and ploidydetermination in green toads (Bufo viridis complex) fromMiddle Asia. Alytes (Paris) 15: 72–90.
Wiley RH. 1991. Associations of song properties with habitatsfor territorial oscine birds of eastern North America. Amer-ican Naturalist 138: 973–993.
Wiley RH, Richards DG. 1978. Physical constraints onacoustic communication in the atmosphere: implications forthe evolution of animal vocalizations. Behavioural Ecologyand Sociobiology 3: 69–94.
Zimmerman BL. 1983. A comparison of structural features ofcalls of open and forest habitat frog species in the centralAmazon. Herpetologica 39: 235–245.
APPENDIX
Taxon Duration (s) Pulse rate (Hz) Fundamental frequency (Hz)
Diploid 4.75 28 1116Diploid 1.76 39 1115Diploid 2.32 29 1292Diploid 10.00 15 1115Highland tetraploid 3.89 17 1429Highland tetraploid 5.68 12 1370Highland tetraploid 6.13 16 1292Highland tetraploid 4.59 14 1370Lowland tetraploid 5.86 15 1423Lowland tetraploid 4.16 14 1686Lowland tetraploid 2.24 22 1785Lowland tetraploid 3.59 20 1507