Deconstruction of the (paleo) polyploid grapevine genome based on the analysis of transposition...
10
Deconstruction of the (Paleo)Polyploid Grapevine Genome Based on the Analysis of Transposition Events Involving NBS Resistance Genes Giulia Malacarne 1. , Michele Perazzolli 1 * . , Alessandro Cestaro 1 , Lieven Sterck 2,3 , Paolo Fontana 1 , Yves Van de Peer 2,3 , Roberto Viola 1 , Riccardo Velasco 1 , Francesco Salamini 1 1 IASMA Research and Innovation Centre, Fondazione Edmund Mach, S. Michele all’Adige, Trento, Italy, 2 Department of Plant Systems Biology, VIB, Gent, Belgium, 3 Department of Plant Biotechnology and Bioinformatics, Ghent University, Gent, Belgium Abstract Plants have followed a reticulate type of evolution and taxa have frequently merged via allopolyploidization. A polyploid structure of sequenced genomes has often been proposed, but the chromosomes belonging to putative component genomes are difficult to identify. The 19 grapevine chromosomes are evolutionary stable structures: their homologous triplets have strongly conserved gene order, interrupted by rare translocations. The aim of this study is to examine how the grapevine nucleotide-binding site (NBS)-encoding resistance (NBS-R) genes have evolved in the genomic context and to understand mechanisms for the genome evolution. We show that, in grapevine, i) helitrons have significantly contributed to transposition of NBS-R genes, and ii) NBS-R gene cluster similarity indicates the existence of two groups of chromosomes (named as Va and Vc) that may have evolved independently. Chromosome triplets consist of two Va and one Vc chromosomes, as expected from the tetraploid and diploid conditions of the two component genomes. The hexaploid state could have been derived from either allopolyploidy or the separation of the Va and Vc component genomes in the same nucleus before fusion, as known for Rosaceae species. Time estimation indicates that grapevine component genomes may have fused about 60 mya, having had at least 40–60 mya to evolve independently. Chromosome number variation in the Vitaceae and related families, and the gap between the time of eudicot radiation and the age of Vitaceae fossils, are accounted for by our hypothesis. Citation: Malacarne G, Perazzolli M, Cestaro A, Sterck L, Fontana P, et al. (2012) Deconstruction of the (Paleo)Polyploid Grapevine Genome Based on the Analysis of Transposition Events Involving NBS Resistance Genes. PLoS ONE 7(1): e29762. doi:10.1371/journal.pone.0029762 Editor: Christos A. Ouzounis, The Centre for Research and Technology, Hellas, Greece Received June 26, 2011; Accepted December 5, 2011; Published January 11, 2012 Copyright: ß 2012 Malacarne et al. This is an open-access article distributed under the terms of the Creative Commons Attribution License, which permits unrestricted use, distribution, and reproduction in any medium, provided the original author and source are credited. Funding: The research was supported by the Provincia Autonoma di Trento. GM and MP were supported by the Post-Doc Projects 2006 ‘‘FLAVONOIDI’’ and ‘‘Resistevite’’ funded by the Provincia Autonoma di Trento. YVdP acknowledges support from Ghent University (Multidisciplinary Research Partnership ‘‘Bioinformatics: from nucleotides to networks’’) and the Interuniversity Attraction Poles Programme (IUAP P6/25), initiated by the Belgian State, Science Policy Office (BioMaGNet). The funders had no role in study design, data collection and analysis, decision to publish, or preparation of the manuscript. Competing Interests: The authors have declared that no competing interests exist. * E-mail: [email protected] . These authors contributed equally to this work. Introduction Plants have followed a reticulate type of evolution: in their natural history, taxa have frequently merged because of poly- ploidization events [1–3]. Although component genomes are known in some polyploid crops [4], in other taxa even the cytological approach may not resolve genome components. Because genome sequences are available [1,5,6], transposition events which have created large gene families [7], such as the nucleotide-binding site (NBS)-encoding resistance (NBS-R) genes, could be analyzed. If component genomes have been kept separated before a polyploidization event during evolution, the transposition event may be restricted to a fraction of the extant genome, and this would allows us to recognize the old and recent history of the species. NBS-R genes encode proteins with a nucleotide-binding site as part of the so-called NB-ARC domain [8] and sometimes with a leucine-rich repeat domain (LRR) [9,10]. NBS-R proteins may have, as an amino terminal sequence, a toll/interleukin-1 receptor (TIR) domain or a coiled-coil (CC) structure [11]. The NB-ARC domain is proposed to function as molecular switch that controls the activation state of the protein, and the other domains play role in defining pathogen recognition specificity and downstream signalling [8]. NBS-R genes occupy single loci or are organized in clusters [12]. In the latter case, gene duplication via unequal crossing over has been demonstrated to have the capacity to generate the clusters [13,14]. NBS-R gene clusters may include paralogous sequences giving rise to heterogeneous clusters [15,16]. Duplication of chromosomal segments hosting NBS-R genes or clusters has also been reported [17]. Thus, an extensive analysis of NBS-R gene organization can increase the understanding of the evolution of a complex polyploid genome. The problem in such an approach is that, although genome duplication leading to polyploidy has played a major role in angiosperm evolution [2,18], ancestral linkage groups tend to be dispersed on many rearranged chromosomes, with genomes having suffered wholesale gene losses [19,20]. Such evolutionary changes in structure and number of chromosomes make it difficult PLoS ONE | www.plosone.org 1 January 2012 | Volume 7 | Issue 1 | e29762
-
Upload
independent -
Category
Documents
-
view
3 -
download
0
Transcript of Deconstruction of the (paleo) polyploid grapevine genome based on the analysis of transposition...
Deconstruction of the (Paleo)Polyploid GrapevineGenome Based on the Analysis of Transposition EventsInvolving NBS Resistance GenesGiulia Malacarne1., Michele Perazzolli1*., Alessandro Cestaro1, Lieven Sterck2,3, Paolo Fontana1, Yves
Van de Peer2,3, Roberto Viola1, Riccardo Velasco1, Francesco Salamini1
1 IASMA Research and Innovation Centre, Fondazione Edmund Mach, S. Michele all’Adige, Trento, Italy, 2 Department of Plant Systems Biology, VIB, Gent, Belgium,
3 Department of Plant Biotechnology and Bioinformatics, Ghent University, Gent, Belgium
Abstract
Plants have followed a reticulate type of evolution and taxa have frequently merged via allopolyploidization. A polyploidstructure of sequenced genomes has often been proposed, but the chromosomes belonging to putative componentgenomes are difficult to identify. The 19 grapevine chromosomes are evolutionary stable structures: their homologoustriplets have strongly conserved gene order, interrupted by rare translocations. The aim of this study is to examine how thegrapevine nucleotide-binding site (NBS)-encoding resistance (NBS-R) genes have evolved in the genomic context and tounderstand mechanisms for the genome evolution. We show that, in grapevine, i) helitrons have significantly contributed totransposition of NBS-R genes, and ii) NBS-R gene cluster similarity indicates the existence of two groups of chromosomes(named as Va and Vc) that may have evolved independently. Chromosome triplets consist of two Va and one Vcchromosomes, as expected from the tetraploid and diploid conditions of the two component genomes. The hexaploid statecould have been derived from either allopolyploidy or the separation of the Va and Vc component genomes in the samenucleus before fusion, as known for Rosaceae species. Time estimation indicates that grapevine component genomes mayhave fused about 60 mya, having had at least 40–60 mya to evolve independently. Chromosome number variation in theVitaceae and related families, and the gap between the time of eudicot radiation and the age of Vitaceae fossils, areaccounted for by our hypothesis.
Citation: Malacarne G, Perazzolli M, Cestaro A, Sterck L, Fontana P, et al. (2012) Deconstruction of the (Paleo)Polyploid Grapevine Genome Based on the Analysisof Transposition Events Involving NBS Resistance Genes. PLoS ONE 7(1): e29762. doi:10.1371/journal.pone.0029762
Editor: Christos A. Ouzounis, The Centre for Research and Technology, Hellas, Greece
Received June 26, 2011; Accepted December 5, 2011; Published January 11, 2012
Copyright: � 2012 Malacarne et al. This is an open-access article distributed under the terms of the Creative Commons Attribution License, which permitsunrestricted use, distribution, and reproduction in any medium, provided the original author and source are credited.
Funding: The research was supported by the Provincia Autonoma di Trento. GM and MP were supported by the Post-Doc Projects 2006 ‘‘FLAVONOIDI’’ and‘‘Resistevite’’ funded by the Provincia Autonoma di Trento. YVdP acknowledges support from Ghent University (Multidisciplinary Research Partnership‘‘Bioinformatics: from nucleotides to networks’’) and the Interuniversity Attraction Poles Programme (IUAP P6/25), initiated by the Belgian State, Science PolicyOffice (BioMaGNet). The funders had no role in study design, data collection and analysis, decision to publish, or preparation of the manuscript.
Competing Interests: The authors have declared that no competing interests exist.
* E-mail: [email protected]
. These authors contributed equally to this work.
Introduction
Plants have followed a reticulate type of evolution: in their
natural history, taxa have frequently merged because of poly-
ploidization events [1–3]. Although component genomes are
known in some polyploid crops [4], in other taxa even the
cytological approach may not resolve genome components.
Because genome sequences are available [1,5,6], transposition
events which have created large gene families [7], such as the
nucleotide-binding site (NBS)-encoding resistance (NBS-R) genes,
could be analyzed. If component genomes have been kept
separated before a polyploidization event during evolution, the
transposition event may be restricted to a fraction of the extant
genome, and this would allows us to recognize the old and recent
history of the species.
NBS-R genes encode proteins with a nucleotide-binding site as
part of the so-called NB-ARC domain [8] and sometimes with a
leucine-rich repeat domain (LRR) [9,10]. NBS-R proteins may
have, as an amino terminal sequence, a toll/interleukin-1 receptor
(TIR) domain or a coiled-coil (CC) structure [11]. The NB-ARC
domain is proposed to function as molecular switch that controls
the activation state of the protein, and the other domains play role
in defining pathogen recognition specificity and downstream
signalling [8]. NBS-R genes occupy single loci or are organized in
clusters [12]. In the latter case, gene duplication via unequal
crossing over has been demonstrated to have the capacity to
generate the clusters [13,14]. NBS-R gene clusters may include
paralogous sequences giving rise to heterogeneous clusters [15,16].
Duplication of chromosomal segments hosting NBS-R genes or
clusters has also been reported [17].
Thus, an extensive analysis of NBS-R gene organization can
increase the understanding of the evolution of a complex polyploid
genome. The problem in such an approach is that, although
genome duplication leading to polyploidy has played a major role
in angiosperm evolution [2,18], ancestral linkage groups tend to be
dispersed on many rearranged chromosomes, with genomes
having suffered wholesale gene losses [19,20]. Such evolutionary
changes in structure and number of chromosomes make it difficult
PLoS ONE | www.plosone.org 1 January 2012 | Volume 7 | Issue 1 | e29762
not only to find a direct link between whole genome duplication
(WGD) and ploidy state of a species [21], but also to recognize the
founders of polyploid genomes.
Grapevine chromosomes, however, appear stable from an
evolutionary point of view. Grapevine chromosomes can be easily
assorted in triplets because an unexpected within triplet gene order
has persisted for many tens of millions of years [6,22]. Because of
this, transposition events can be analysed in grapevine in the
absence of confounding effects caused by chromosomal translo-
cations and fragment duplications [23].
In this paper, cluster similarity, phylogenetics, and transposition
events of NBS-R genes have been studied to evaluate alternative
hypotheses of how the triplicate state of the grapevine genome has
evolved.
Results
NBS-R genes and clusters: chromosome groupingThe grapevine Pinot Noir genome contain 391 predicted NBS-
R genes, of which 346 have been anchored to the genome. Of
the anchored NBS-R genes, 55 are single and 291 are grouped
into 52 clusters (CL), each consisting of 2 to 15 genes separated
by an average distance of 8.3 kilo bases (kb) (Table S1 and Table
S2). Clusters extend from 3.6 to 742 kb and, on average, include
7 non-NBS open reading frames. NBS-R genes preferentially map
on chromosomes 1, 3, 5, 7, 9, 12, 13, 15, 18 and 19. CC-type
NBS-R genes predominate: 111 have the LRR domain (CC-NBS-
LRR) and 32 lack the LRR domain (CC-NBS). Among all NBS-R
genes, 27 have the TIR and LRR domains (TIR-NBS-LRR), 6
have the TIR domain (TIR-NBS), 145 have the LRR domain
(NBS-LRR) and 70 have only the NB-ARC domain (NBS-tr). Of
the 29 anchored TIR-type genes, 23 are clustered and are
exclusively located on chromosomes 1, 5, 12, 13 and 18 (Table
S3).
Comparisons among 346 anchored NBS-R genes generated
23693 Ks values, indicating synonymous substitutions per
synonymous site. Of those, 22779 values are between genes of
different clusters and still not in cluster (single NBS-R genes),
denoted as Ks between genes (Ks-bg). Ks-bg was therefore used to
estimate the rate of synonymous substitutions between transposed
NBS-R genes that could give rise to two different clusters during
evolution. The remaining 914 Ks values were derived from
comparisons between genes of the same cluster (denoted as within
clusters, Ks-w) and indicated the rate of synonymous substitutions
between genes of the same cluster. Ks-bg scores had a mean of
1.75, while Ks-w scores had a mean of 0.90 (Figure S1). A
comparison of means and distributions of Ks-bg and Ks-w support
the inference that genes of the same cluster originated mainly by
tandem duplication [17].
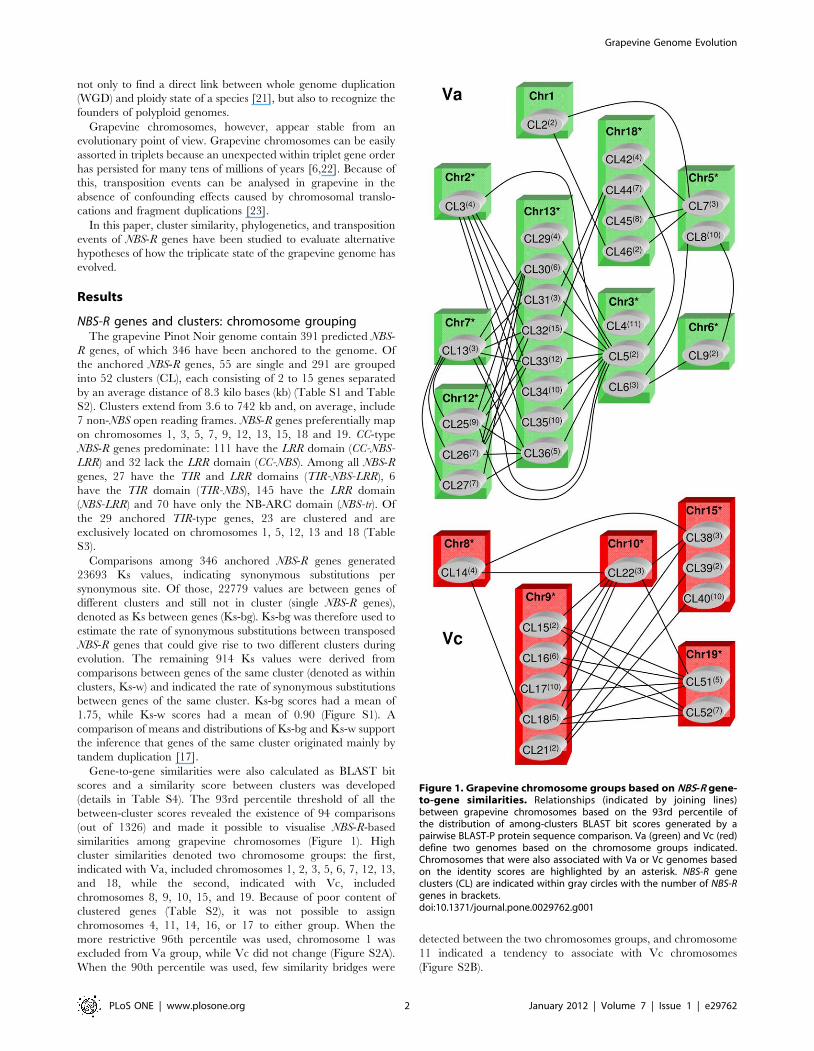
Gene-to-gene similarities were also calculated as BLAST bit
scores and a similarity score between clusters was developed
(details in Table S4). The 93rd percentile threshold of all the
between-cluster scores revealed the existence of 94 comparisons
(out of 1326) and made it possible to visualise NBS-R-based
similarities among grapevine chromosomes (Figure 1). High
cluster similarities denoted two chromosome groups: the first,
indicated with Va, included chromosomes 1, 2, 3, 5, 6, 7, 12, 13,
and 18, while the second, indicated with Vc, included
chromosomes 8, 9, 10, 15, and 19. Because of poor content of
clustered genes (Table S2), it was not possible to assign
chromosomes 4, 11, 14, 16, or 17 to either group. When the
more restrictive 96th percentile was used, chromosome 1 was
excluded from Va group, while Vc did not change (Figure S2A).
When the 90th percentile was used, few similarity bridges were
detected between the two chromosomes groups, and chromosome
11 indicated a tendency to associate with Vc chromosomes
(Figure S2B).
Figure 1. Grapevine chromosome groups based on NBS-R gene-to-gene similarities. Relationships (indicated by joining lines)between grapevine chromosomes based on the 93rd percentile ofthe distribution of among-clusters BLAST bit scores generated by apairwise BLAST-P protein sequence comparison. Va (green) and Vc (red)define two genomes based on the chromosome groups indicated.Chromosomes that were also associated with Va or Vc genomes basedon the identity scores are highlighted by an asterisk. NBS-R geneclusters (CL) are indicated within gray circles with the number of NBS-Rgenes in brackets.doi:10.1371/journal.pone.0029762.g001
Grapevine Genome Evolution
PLoS ONE | www.plosone.org 2 January 2012 | Volume 7 | Issue 1 | e29762
Va and Vc grouping was supported by the identity scores
derived from a global alignment between the NBS-R proteins
using the Needleman and Wunsch algorithm (chromosomes with
asterisks in Figure 1). Based on 14 of 19 grapevine chromosomes,
our results supported the hypothesis that NBS-R gene cluster
formation may have followed separate routes in at least two
different genomes, one putatively tetraploid (Va) and the second
diploid (Vc).
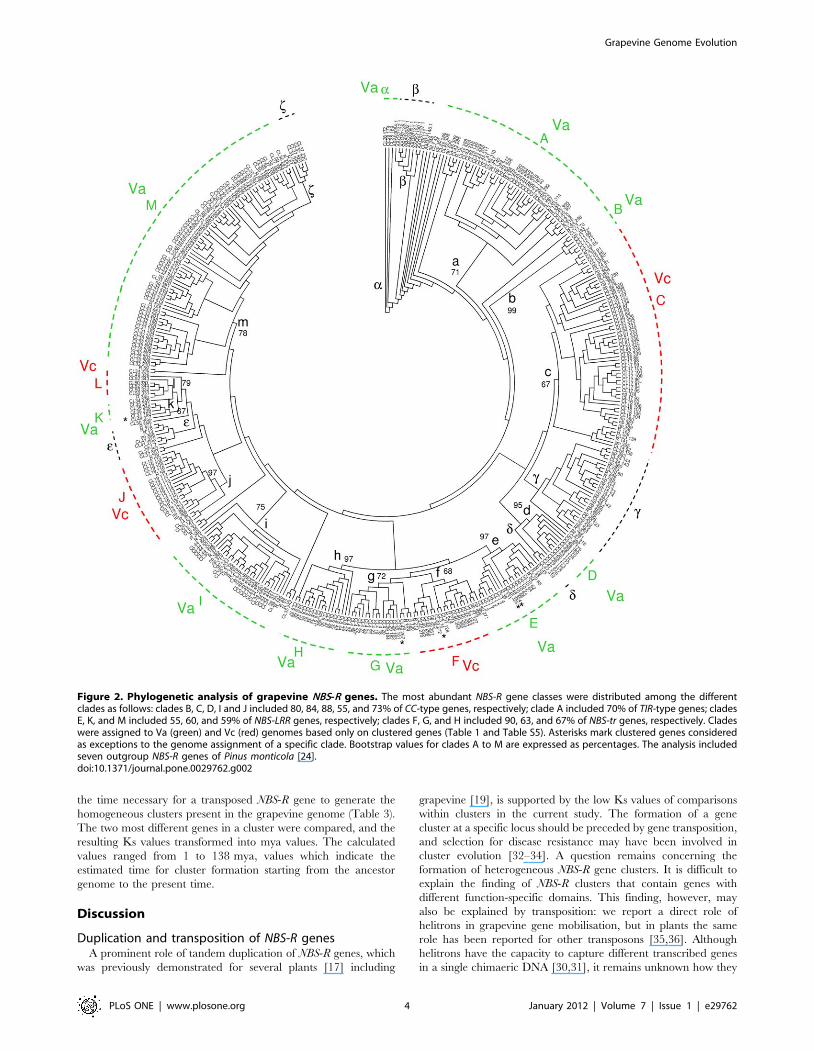
NBS-R gene phylogeny and the Va and Vc componentgenomes
If the Va and Vc component genomes evolved separately for a
sufficient period of time, NBS-R clusters in a phylogenetic tree should
tend to occupy topologies specific for each of the two putative
genomes. Conversely, in presence of high gene transposition rates
manifested by the extant number of NBS-R genes, a random
distribution of NBS-R genes is expected if all extant grapevine
chromosomes have always been included in the same nucleus.
In a NJ phylogenetic tree based on the NB-ARC protein
domain, 13 major clades (A to M) were found, and these were
specific for either Va or Vc genomes (Figure 2, Table 1 and Table
S4). Six additional subclades (a to f) were observed as singularities,
with few cases of disagreement with the rule specified above. They
corresponded to: subclade a (three Va genes of cluster CL28
located at the root of the tree); subclade b (one additional gene of
cluster CL28 and seven outgroup NBS-R genes of Pinus); subclade
c (genes that were not clustered or not chromosome assigned
together with nine Va- and Vc-clustered genes); and subclade e (six
Va- or Vc-clustered genes, three non-clustered genes, and one
unassigned gene). Subclades d and f (both with three genes) should
be considered exceptions to the Va-Vc specificity rule.
The topology of gymnosperm outgroup NBS-R genes points to
Va clades a and A as the oldest from an evolutionary perspective
[24]. Moreover, clades A to M include genes located in more than
one chromosome, but these chromosomes always belong to either
group Va or Vc (Table S5). In all chromosomes associated with
Vc, at least one cluster of the genes mapping to clade C is present
(Figure 2 and Table S6). In general, genes of the same cluster have
almost contiguous tree topologies, as expected if local gene tandem
duplication was the mechanism generating clusters [19,25–27].
The plotting of chromosomes and gene clades against gene
classes provided further circumstantial evidence of the existence of
Va and Vc genomes: two NBS-R gene classes were Va-genome
specific, and these were TIR-NBS-LRR and TIR-NBS genes (four
Vc single TIR-type genes are discussed later). Also, clade M, which
consists of NBS-LRR genes, tends to be associated with Va genome
(Table 1, Table S4 and Table S5). The subclade distribution of the
few NBS-R genes belonging to chromosomes that are not assigned
to any component genome (genome-unassigned chromosomes) is
reported in Table S7.
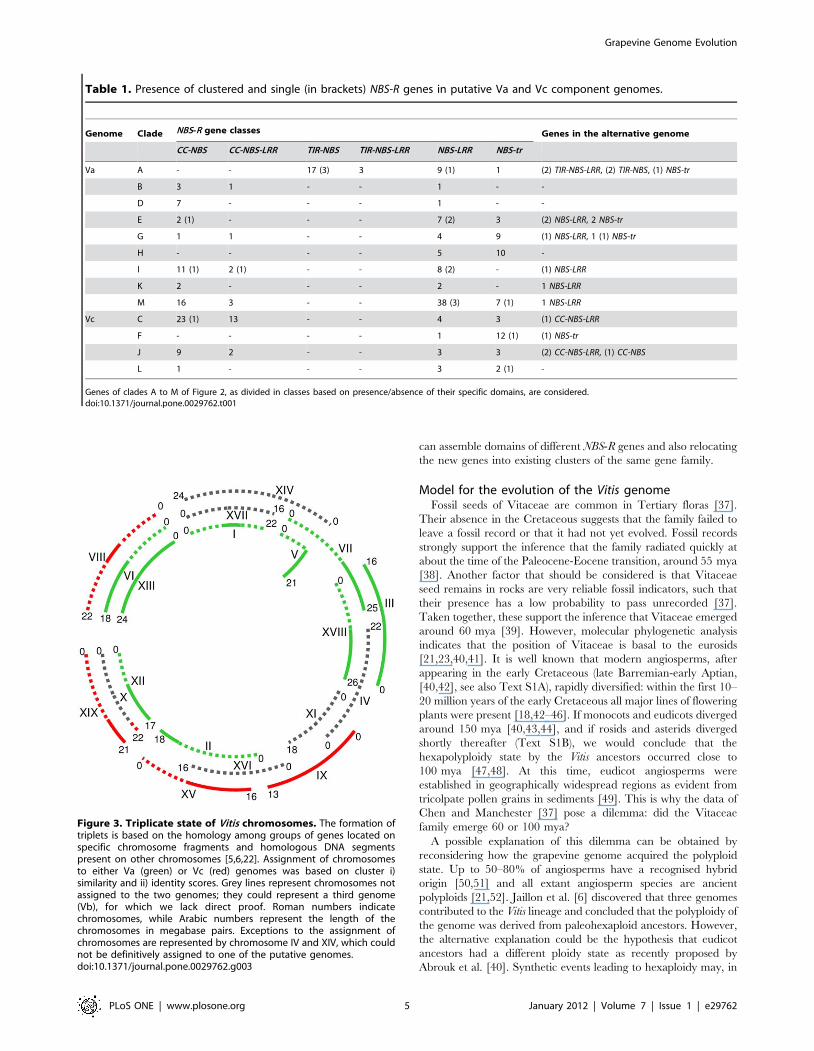
Genome duplicationsBased on within-genome collinearity Jaillon et al. [6] previously
showed that the grapevine genome has a triplicate structure. We
have used the same approach to define grapevine chromosome
triplets and have assigned chromosomes to either the Va, green (g),
or the Vc, red (r), genomes (Figure 3 and Figure S3). If the
ancestral Va and Vc genomes can indeed be distinguished from
one another, each chromosome triplet should consist of two Va
and one Vc chromosomes (assigning a tetraploid condition to the
larger Va genome). In Figure S3, grey (y) indicates genome-
unassigned chromosomes. Of 10 possible combinations of triplets
with different colours (g, r, y), only five have been found (Figure
S3) and these are triplets of: ‘‘2g and 1r’’, ‘‘1g, 1r and 1y’’, ‘‘1r and
2y’’, ‘‘1g and 2y’’, and ‘‘2g and 1y’’. All these combinations,
together with the combination ‘‘3y’’, are compatible with the
hypothesis that each triplet should consist of one Vc and two Va
chromosomes. No triplet matched the hypothesis of incompatible
combinations of chromosomes ‘‘1g and 2r’’, ‘‘1y and 2r’’, ‘‘3r’’,
and ‘‘3g’’, with the exception of the triplet of chromosomes 10, 12,
and 19 and a portion of green triplets of chromosomes 3, 7, and 18
(Figure S3). However, the assignment of chromosome 10 to the Vc
genome was based on the NBS-R genes of cluster CL22, which
maps at the very end of the chromosome, a position which may
have been recently acquired because of chromosome end
transpositions, as described for rye [28]. Based on dot plot
analysis (as reported for apple by Velasco et al. [29]), the region of
chromosome 10 hosting cluster CL22 is not orthologous to either
chromosomes 12 or 19. For this reason, only the tip of
chromosome 10 is coloured red in Figure 3.
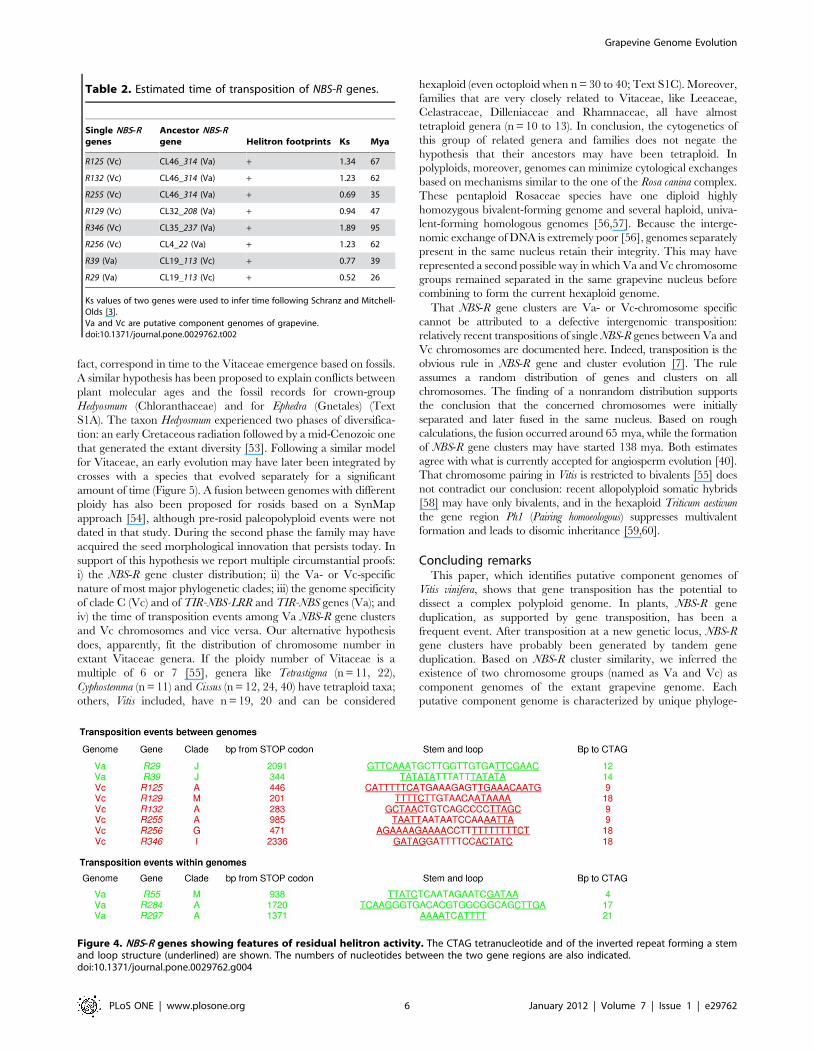
Expansion of NBS-R genes and clustersGene expansion mediated by transposition is revealed by
considering single NBS-R genes. Genes R125, R132, R255, and
R321 (clade A) map to Vc chromosomes 9, 10, 15, and 19,
respectively (Table 2 and Table S1). Because NBS-R clusters of
clade A are absent in Vc, these genes could represent
transpositions from Va clusters to Vc chromosomes. The complete
sequence of the four Vc genes was compared to that of all Va
genes: gene 314 (CL46, chromosome 18) had the lowest Ks, and
we therefore assigned to it the highest probability to be the
progenitor of the four putatively transposed gene copies (Table 2).
The five genes mentioned above have contiguous phylogenetic
topologies (Figure 2). In addition and as expected for genes
transposed by helitrons [30,31], their DNA sequence reveals, at
the expected position, the CTAG motif and the inverted repeats
that form a stem and loop structure (Figure 4). Also, the genes R10,
R284, and R297, which map to Va genome, belong to clade A and
have a low Ks score with the gene 314. In R284 and R297, the
helitron footprints are present: they also should derive from intra-
Va genome transpositions (Figure 4).
Similar analyses were conducted for R79 and R131 of clade E,
R256 of clade G, R346 of clade I, and R129 of clade M. All map to
Vc chromosomes, and clustered genes of the corresponding clades
are present only in Va chromosomes (Table 1). Of these single
genes, R256, R346, and R129 have putative helitron fingerprints
(Figure 4 and Table S8), and their ancestors could be, respectively,
clustered genes 22 (CL4) for clade G, 237 (CL35) for clade I, and
208 (CL32) for clade M. Also the gene R55 of clade M, specific to
Va genome, has the helitron footprints and could derive from the
putative ancestor 208 (CL32) by an intra-Va genome transposition.
Similar results were obtained for Va genes R29, R39, and R58
(clade J). Clustered genes of this clade were present only in Vc
genome (Table 1), and among these gene 113 of cluster CL19 was
found the most similar to the three single genes. Single genes R29
and R39 also have helitron footprints (Figure 4).
Table S8 summarizes the role of helitron-mediated gene
transposition in the origin of single NBS-R genes. Of the single
genes listed in the table (excluding those marked with n.d.) 29.4%
should have apparently resulted from helitron-mediated transpo-
sition.
The Va to Vc transposed NBS-R genes can be used to estimate
the time from their transposition, i.e., the date when their
component genomes fused. Ks values from progenitor genes and
their helitron-mobilized copies were converted to time values using
the algorithm described by Schranz and Mitchell-Olds [3], and
the estimated time did not exceed 67 mya, with one exception
(R346, 95 mya, Table 2). The same algorithm was used to predict
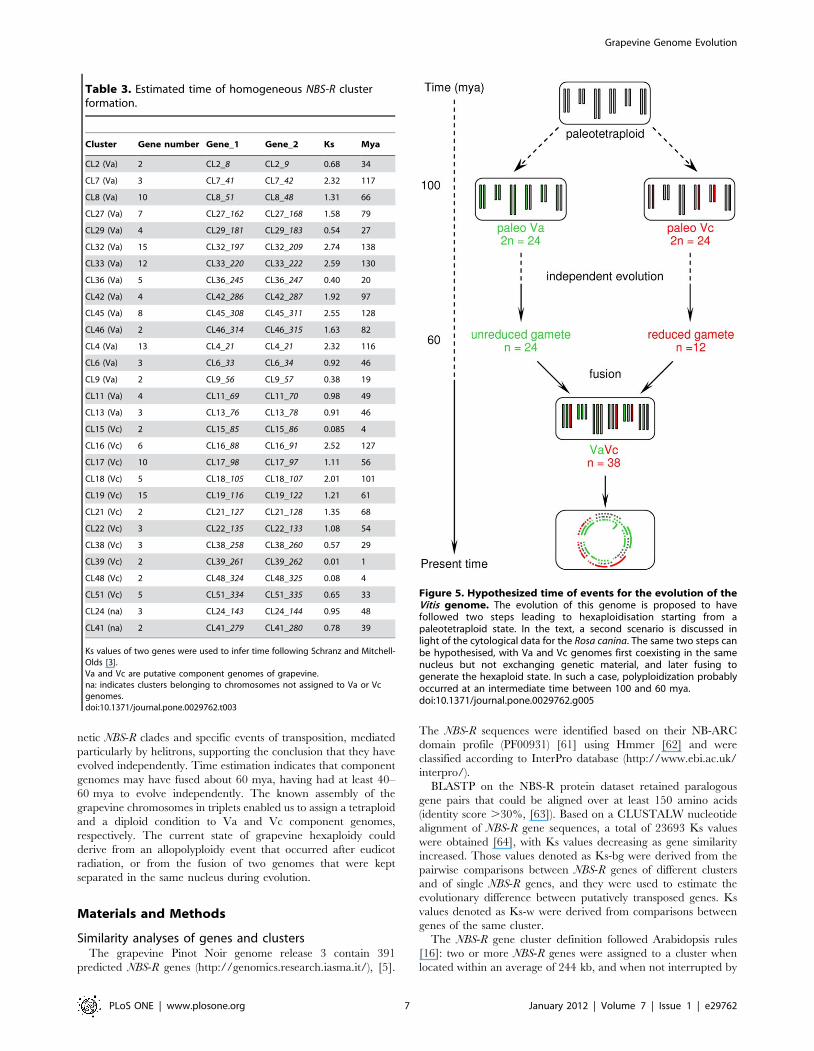
Grapevine Genome Evolution
PLoS ONE | www.plosone.org 3 January 2012 | Volume 7 | Issue 1 | e29762
the time necessary for a transposed NBS-R gene to generate the
homogeneous clusters present in the grapevine genome (Table 3).
The two most different genes in a cluster were compared, and the
resulting Ks values transformed into mya values. The calculated
values ranged from 1 to 138 mya, values which indicate the
estimated time for cluster formation starting from the ancestor
genome to the present time.
Discussion
Duplication and transposition of NBS-R genesA prominent role of tandem duplication of NBS-R genes, which
was previously demonstrated for several plants [17] including
grapevine [19], is supported by the low Ks values of comparisons
within clusters in the current study. The formation of a gene
cluster at a specific locus should be preceded by gene transposition,
and selection for disease resistance may have been involved in
cluster evolution [32–34]. A question remains concerning the
formation of heterogeneous NBS-R gene clusters. It is difficult to
explain the finding of NBS-R clusters that contain genes with
different function-specific domains. This finding, however, may
also be explained by transposition: we report a direct role of
helitrons in grapevine gene mobilisation, but in plants the same
role has been reported for other transposons [35,36]. Although
helitrons have the capacity to capture different transcribed genes
in a single chimaeric DNA [30,31], it remains unknown how they
Figure 2. Phylogenetic analysis of grapevine NBS-R genes. The most abundant NBS-R gene classes were distributed among the differentclades as follows: clades B, C, D, I and J included 80, 84, 88, 55, and 73% of CC-type genes, respectively; clade A included 70% of TIR-type genes; cladesE, K, and M included 55, 60, and 59% of NBS-LRR genes, respectively; clades F, G, and H included 90, 63, and 67% of NBS-tr genes, respectively. Cladeswere assigned to Va (green) and Vc (red) genomes based only on clustered genes (Table 1 and Table S5). Asterisks mark clustered genes consideredas exceptions to the genome assignment of a specific clade. Bootstrap values for clades A to M are expressed as percentages. The analysis includedseven outgroup NBS-R genes of Pinus monticola [24].doi:10.1371/journal.pone.0029762.g002
Grapevine Genome Evolution
PLoS ONE | www.plosone.org 4 January 2012 | Volume 7 | Issue 1 | e29762
can assemble domains of different NBS-R genes and also relocating
the new genes into existing clusters of the same gene family.
Model for the evolution of the Vitis genomeFossil seeds of Vitaceae are common in Tertiary floras [37].
Their absence in the Cretaceous suggests that the family failed to
leave a fossil record or that it had not yet evolved. Fossil records
strongly support the inference that the family radiated quickly at
about the time of the Paleocene-Eocene transition, around 55 mya
[38]. Another factor that should be considered is that Vitaceae
seed remains in rocks are very reliable fossil indicators, such that
their presence has a low probability to pass unrecorded [37].
Taken together, these support the inference that Vitaceae emerged
around 60 mya [39]. However, molecular phylogenetic analysis
indicates that the position of Vitaceae is basal to the eurosids
[21,23,40,41]. It is well known that modern angiosperms, after
appearing in the early Cretaceous (late Barremian-early Aptian,
[40,42], see also Text S1A), rapidly diversified: within the first 10–
20 million years of the early Cretaceous all major lines of flowering
plants were present [18,42–46]. If monocots and eudicots diverged
around 150 mya [40,43,44], and if rosids and asterids diverged
shortly thereafter (Text S1B), we would conclude that the
hexapolyploidy state by the Vitis ancestors occurred close to
100 mya [47,48]. At this time, eudicot angiosperms were
established in geographically widespread regions as evident from
tricolpate pollen grains in sediments [49]. This is why the data of
Chen and Manchester [37] pose a dilemma: did the Vitaceae
family emerge 60 or 100 mya?
A possible explanation of this dilemma can be obtained by
reconsidering how the grapevine genome acquired the polyploid
state. Up to 50–80% of angiosperms have a recognised hybrid
origin [50,51] and all extant angiosperm species are ancient
polyploids [21,52]. Jaillon et al. [6] discovered that three genomes
contributed to the Vitis lineage and concluded that the polyploidy of
the genome was derived from paleohexaploid ancestors. However,
the alternative explanation could be the hypothesis that eudicot
ancestors had a different ploidy state as recently proposed by
Abrouk et al. [40]. Synthetic events leading to hexaploidy may, in
Table 1. Presence of clustered and single (in brackets) NBS-R genes in putative Va and Vc component genomes.
Genome Clade NBS-R gene classes Genes in the alternative genome
CC-NBS CC-NBS-LRR TIR-NBS TIR-NBS-LRR NBS-LRR NBS-tr
Va A - - 17 (3) 3 9 (1) 1 (2) TIR-NBS-LRR, (2) TIR-NBS, (1) NBS-tr
B 3 1 - - 1 - -
D 7 - - - 1 - -
E 2 (1) - - - 7 (2) 3 (2) NBS-LRR, 2 NBS-tr
G 1 1 - - 4 9 (1) NBS-LRR, 1 (1) NBS-tr
H - - - - 5 10 -
I 11 (1) 2 (1) - - 8 (2) - (1) NBS-LRR
K 2 - - - 2 - 1 NBS-LRR
M 16 3 - - 38 (3) 7 (1) 1 NBS-LRR
Vc C 23 (1) 13 - - 4 3 (1) CC-NBS-LRR
F - - - - 1 12 (1) (1) NBS-tr
J 9 2 - - 3 3 (2) CC-NBS-LRR, (1) CC-NBS
L 1 - - - 3 2 (1) -
Genes of clades A to M of Figure 2, as divided in classes based on presence/absence of their specific domains, are considered.doi:10.1371/journal.pone.0029762.t001
Figure 3. Triplicate state of Vitis chromosomes. The formation oftriplets is based on the homology among groups of genes located onspecific chromosome fragments and homologous DNA segmentspresent on other chromosomes [5,6,22]. Assignment of chromosomesto either Va (green) or Vc (red) genomes was based on cluster i)similarity and ii) identity scores. Grey lines represent chromosomes notassigned to the two genomes; they could represent a third genome(Vb), for which we lack direct proof. Roman numbers indicatechromosomes, while Arabic numbers represent the length of thechromosomes in megabase pairs. Exceptions to the assignment ofchromosomes are represented by chromosome IV and XIV, which couldnot be definitively assigned to one of the putative genomes.doi:10.1371/journal.pone.0029762.g003
Grapevine Genome Evolution
PLoS ONE | www.plosone.org 5 January 2012 | Volume 7 | Issue 1 | e29762
fact, correspond in time to the Vitaceae emergence based on fossils.
A similar hypothesis has been proposed to explain conflicts between
plant molecular ages and the fossil records for crown-group
Hedyosmum (Chloranthaceae) and for Ephedra (Gnetales) (Text
S1A). The taxon Hedyosmum experienced two phases of diversifica-
tion: an early Cretaceous radiation followed by a mid-Cenozoic one
that generated the extant diversity [53]. Following a similar model
for Vitaceae, an early evolution may have later been integrated by
crosses with a species that evolved separately for a significant
amount of time (Figure 5). A fusion between genomes with different
ploidy has also been proposed for rosids based on a SynMap
approach [54], although pre-rosid paleopolyploid events were not
dated in that study. During the second phase the family may have
acquired the seed morphological innovation that persists today. In
support of this hypothesis we report multiple circumstantial proofs:
i) the NBS-R gene cluster distribution; ii) the Va- or Vc-specific
nature of most major phylogenetic clades; iii) the genome specificity
of clade C (Vc) and of TIR-NBS-LRR and TIR-NBS genes (Va); and
iv) the time of transposition events among Va NBS-R gene clusters
and Vc chromosomes and vice versa. Our alternative hypothesis
does, apparently, fit the distribution of chromosome number in
extant Vitaceae genera. If the ploidy number of Vitaceae is a
multiple of 6 or 7 [55], genera like Tetrastigma (n = 11, 22),
Cyphostemma (n = 11) and Cissus (n = 12, 24, 40) have tetraploid taxa;
others, Vitis included, have n = 19, 20 and can be considered
hexaploid (even octoploid when n = 30 to 40; Text S1C). Moreover,
families that are very closely related to Vitaceae, like Leeaceae,
Celastraceae, Dilleniaceae and Rhamnaceae, all have almost
tetraploid genera (n = 10 to 13). In conclusion, the cytogenetics of
this group of related genera and families does not negate the
hypothesis that their ancestors may have been tetraploid. In
polyploids, moreover, genomes can minimize cytological exchanges
based on mechanisms similar to the one of the Rosa canina complex.
These pentaploid Rosaceae species have one diploid highly
homozygous bivalent-forming genome and several haploid, univa-
lent-forming homologous genomes [56,57]. Because the interge-
nomic exchange of DNA is extremely poor [56], genomes separately
present in the same nucleus retain their integrity. This may have
represented a second possible way in which Va and Vc chromosome
groups remained separated in the same grapevine nucleus before
combining to form the current hexaploid genome.
That NBS-R gene clusters are Va- or Vc-chromosome specific
cannot be attributed to a defective intergenomic transposition:
relatively recent transpositions of single NBS-R genes between Va and
Vc chromosomes are documented here. Indeed, transposition is the
obvious rule in NBS-R gene and cluster evolution [7]. The rule
assumes a random distribution of genes and clusters on all
chromosomes. The finding of a nonrandom distribution supports
the conclusion that the concerned chromosomes were initially
separated and later fused in the same nucleus. Based on rough
calculations, the fusion occurred around 65 mya, while the formation
of NBS-R gene clusters may have started 138 mya. Both estimates
agree with what is currently accepted for angiosperm evolution [40].
That chromosome pairing in Vitis is restricted to bivalents [55] does
not contradict our conclusion: recent allopolyploid somatic hybrids
[58] may have only bivalents, and in the hexaploid Triticum aestivum
the gene region Ph1 (Pairing homoeologous) suppresses multivalent
formation and leads to disomic inheritance [59,60].
Concluding remarksThis paper, which identifies putative component genomes of
Vitis vinifera, shows that gene transposition has the potential to
dissect a complex polyploid genome. In plants, NBS-R gene
duplication, as supported by gene transposition, has been a
frequent event. After transposition at a new genetic locus, NBS-R
gene clusters have probably been generated by tandem gene
duplication. Based on NBS-R cluster similarity, we inferred the
existence of two chromosome groups (named as Va and Vc) as
component genomes of the extant grapevine genome. Each
putative component genome is characterized by unique phyloge-
Figure 4. NBS-R genes showing features of residual helitron activity. The CTAG tetranucleotide and of the inverted repeat forming a stemand loop structure (underlined) are shown. The numbers of nucleotides between the two gene regions are also indicated.doi:10.1371/journal.pone.0029762.g004
Table 2. Estimated time of transposition of NBS-R genes.
Single NBS-Rgenes
Ancestor NBS-Rgene Helitron footprints Ks Mya
R125 (Vc) CL46_314 (Va) + 1.34 67
R132 (Vc) CL46_314 (Va) + 1.23 62
R255 (Vc) CL46_314 (Va) + 0.69 35
R129 (Vc) CL32_208 (Va) + 0.94 47
R346 (Vc) CL35_237 (Va) + 1.89 95
R256 (Vc) CL4_22 (Va) + 1.23 62
R39 (Va) CL19_113 (Vc) + 0.77 39
R29 (Va) CL19_113 (Vc) + 0.52 26
Ks values of two genes were used to infer time following Schranz and Mitchell-Olds [3].Va and Vc are putative component genomes of grapevine.doi:10.1371/journal.pone.0029762.t002
Grapevine Genome Evolution
PLoS ONE | www.plosone.org 6 January 2012 | Volume 7 | Issue 1 | e29762
netic NBS-R clades and specific events of transposition, mediated
particularly by helitrons, supporting the conclusion that they have
evolved independently. Time estimation indicates that component
genomes may have fused about 60 mya, having had at least 40–
60 mya to evolve independently. The known assembly of the
grapevine chromosomes in triplets enabled us to assign a tetraploid
and a diploid condition to Va and Vc component genomes,
respectively. The current state of grapevine hexaploidy could
derive from an allopolyploidy event that occurred after eudicot
radiation, or from the fusion of two genomes that were kept
separated in the same nucleus during evolution.
Materials and Methods
Similarity analyses of genes and clustersThe grapevine Pinot Noir genome release 3 contain 391
predicted NBS-R genes (http://genomics.research.iasma.it/), [5].
The NBS-R sequences were identified based on their NB-ARC
domain profile (PF00931) [61] using Hmmer [62] and were
classified according to InterPro database (http://www.ebi.ac.uk/
interpro/).
BLASTP on the NBS-R protein dataset retained paralogous
gene pairs that could be aligned over at least 150 amino acids
(identity score .30%, [63]). Based on a CLUSTALW nucleotide
alignment of NBS-R gene sequences, a total of 23693 Ks values
were obtained [64], with Ks values decreasing as gene similarity
increased. Those values denoted as Ks-bg were derived from the
pairwise comparisons between NBS-R genes of different clusters
and of single NBS-R genes, and they were used to estimate the
evolutionary difference between putatively transposed genes. Ks
values denoted as Ks-w were derived from comparisons between
genes of the same cluster.
The NBS-R gene cluster definition followed Arabidopsis rules
[16]: two or more NBS-R genes were assigned to a cluster when
located within an average of 244 kb, and when not interrupted by
Figure 5. Hypothesized time of events for the evolution of theVitis genome. The evolution of this genome is proposed to havefollowed two steps leading to hexaploidisation starting from apaleotetraploid state. In the text, a second scenario is discussed inlight of the cytological data for the Rosa canina. The same two steps canbe hypothesised, with Va and Vc genomes first coexisting in the samenucleus but not exchanging genetic material, and later fusing togenerate the hexaploid state. In such a case, polyploidization probablyoccurred at an intermediate time between 100 and 60 mya.doi:10.1371/journal.pone.0029762.g005
Table 3. Estimated time of homogeneous NBS-R clusterformation.
Cluster Gene number Gene_1 Gene_2 Ks Mya
CL2 (Va) 2 CL2_8 CL2_9 0.68 34
CL7 (Va) 3 CL7_41 CL7_42 2.32 117
CL8 (Va) 10 CL8_51 CL8_48 1.31 66
CL27 (Va) 7 CL27_162 CL27_168 1.58 79
CL29 (Va) 4 CL29_181 CL29_183 0.54 27
CL32 (Va) 15 CL32_197 CL32_209 2.74 138
CL33 (Va) 12 CL33_220 CL33_222 2.59 130
CL36 (Va) 5 CL36_245 CL36_247 0.40 20
CL42 (Va) 4 CL42_286 CL42_287 1.92 97
CL45 (Va) 8 CL45_308 CL45_311 2.55 128
CL46 (Va) 2 CL46_314 CL46_315 1.63 82
CL4 (Va) 13 CL4_21 CL4_21 2.32 116
CL6 (Va) 3 CL6_33 CL6_34 0.92 46
CL9 (Va) 2 CL9_56 CL9_57 0.38 19
CL11 (Va) 4 CL11_69 CL11_70 0.98 49
CL13 (Va) 3 CL13_76 CL13_78 0.91 46
CL15 (Vc) 2 CL15_85 CL15_86 0.085 4
CL16 (Vc) 6 CL16_88 CL16_91 2.52 127
CL17 (Vc) 10 CL17_98 CL17_97 1.11 56
CL18 (Vc) 5 CL18_105 CL18_107 2.01 101
CL19 (Vc) 15 CL19_116 CL19_122 1.21 61
CL21 (Vc) 2 CL21_127 CL21_128 1.35 68
CL22 (Vc) 3 CL22_135 CL22_133 1.08 54
CL38 (Vc) 3 CL38_258 CL38_260 0.57 29
CL39 (Vc) 2 CL39_261 CL39_262 0.01 1
CL48 (Vc) 2 CL48_324 CL48_325 0.08 4
CL51 (Vc) 5 CL51_334 CL51_335 0.65 33
CL24 (na) 3 CL24_143 CL24_144 0.95 48
CL41 (na) 2 CL41_279 CL41_280 0.78 39
Ks values of two genes were used to infer time following Schranz and Mitchell-Olds [3].Va and Vc are putative component genomes of grapevine.na: indicates clusters belonging to chromosomes not assigned to Va or Vcgenomes.doi:10.1371/journal.pone.0029762.t003
Grapevine Genome Evolution
PLoS ONE | www.plosone.org 7 January 2012 | Volume 7 | Issue 1 | e29762
more than 21 open reading frames encoding non-NBS proteins.
This cluster definition agrees well with Yang et al. [19] which used
200 kb as a distance between two contiguous NBS-R genes.
Phylogenetic and sequence analysesThe maximum-likelihood phylogenetic tree (based on 500
bootstrap values) was constructed with PHYML [65], consider-
ing only the NB-ARC aminoacid sequence (295 aa) and using
the JTT-F matrix of ML distances as the starting topology.
Domains were included in clusters of protein sequences using the
CD-HIT program [66], and a representative sequence was
identified for each cluster. Core multiple sequence alignments
(MSAs) were obtained using MAFFT [67] and extended by
adding the sequences of other clusters based on T-COFFEE
[68]. Seven Pinus monticola NBS-R genes [24] were included as
outgroups.
Va and Vc component genomesA pairwise BLAST-P analysis of the complete protein sequence
of 346 chromosome-anchored NBS-R genes generated gene-to-
gene similarities as BLAST bit scores. Because of the time required
for duplication events, clustered NBS-R genes could be used to
evaluate ancient evolution events. Between-cluster BLAST bit
scores were calculated on the average of n6k gene BLAST bit
score comparisons, where n and k represent the number of genes
of two different clusters. To select clusters significantly more
similar among them, thresholds corresponding to the 90th, 93rd
and 96th percentile of all scores were considered. The 93rd
threshold corresponded to a mean score of 1330 BLAST bit units
and selected, from a total of 1326 cluster comparisons, 94 cases of
clusters having genes that were molecularly very related. The E-
value of the 93rd percentile was lower than E2300, equal to the
probability that similarity scores were due to a random association
of grapevine genes.
Using the Needleman and Wunsch algorithm with the
BLOSUM62 similarity matrix, we calculated the identity among
all NBS-R protein sequences to test the BLAST-P analysis. The
average identity score among clusters was based on n6k protein
comparisons (n and k as above). The same procedure was used to
select clusters that were significantly related.
Within-genome collinearityAn all-against-all BLASTP of the whole predicted protein data
set (31063 codified by the anchored NBS-R genes) identified
paralogous gene pairs if their two sequences were alignable over a
length of more than 150 amino acids with an identity score higher
than 30% [63]. The set of paralogs was used to detect duplicated/
collinear segments by running i-ADHoRe version 2.0 [69], with
the gap size set to 40 genes (the maximum distance between
consecutive paralogs or anchors used to define a duplicated
segment) and the p-value cutoff set to 0.001.
Helitron-mediated NBS-R gene transpositionThe 39 region of single NBS-R genes was inspected (www.
emboss.org) to identify inverted repeats forming a putative stem
and loop structure (28-bp threshold, mismatch 21 and maxrepeat
30 bp). Also the CTAG signature following a regular expression
script was searched by imposing a cut-off between CTAG and
stem-loop structure [30]. Kapitonov and Jurka [30] have proposed
three models of helitron transposition that differ in type and size of
DNA sequences that remain in situ. All models accept that the stem
and loop structure and the CTAG signature remain at the excision
site in the 39 of the mobilized genes.
Time of transposition and cluster formation eventsTime of transposition events was calculated from Ks values
between putative progenitor genes and their putative helitron-
transposed copies on the basis of the divergence time between
Cleomaceae and Brassicaceae (a Ks value of 0.82 corresponds to
41 mya), as estimated by Schranz and Mitchell-Olds [3]. Among
clustered genes, progenitors of putatively transposed genes were
selected when having, in gene-to-gene comparisons, the lowest Ks
value. Time of homogenous NBS-R cluster formation was inferred
based on Ks-w values.
Supporting Information
Figure S1 Distribution of Ks-bg and Ks-w scores. Ks-bg
scores were calculated by comparing protein products of NBS-R
genes of different clusters and of single NBS-R genes. Ks-w scores
were derived from pairwise comparisons of products of NBS-R
genes belonging to the same cluster.
(TIF)
Figure S2 Relationships between grapevine chromo-somes based on the 96th (A) and 90th (B) percentile ofthe distribution of BLAST bit scores among clusters.BLAST bit scores were generated by a pairwise BLAST-P protein
sequence comparison. Va (green) and Vc (red) define two genomes
based on the chromosome groups indicated.
(TIF)
Figure S3 Putative Va and Vc grapevine genomes. The
formation of homologous triplets is based on the homology among
groups of genes located on specific chromosome fragments.
Chromosomes were assigned to Va (green) and Vc (red) genomes
by cluster similarity results and by identity scores.
(TIF)
Table S1 Grapevine NBS-R genes of Pinot Noir genomesequence Release 3 (http://genomics.research.iasma.it/).(XLS)
Table S2 Organization and distribution of NBS-R genesin the Pinot Noir grapevine genome.(DOC)
Table S3 Chromosome organization of NBS-R genes inthe Pinot Noir grapevine genome.(DOC)
Table S4 NBS-R gene cluster size and structure, andtheir chromosomal position, phylogenetic subclade, andsimilarity (BLAST bit scores higher than the 93rdpercentile) with others NBS-R gene clusters.(DOC)
Table S5 NBS-R gene clusters present in A to Mphylogenetic subclades and assignment to Va and Vcgenomes.(DOC)
Table S6 Assignment of grapevine chromosomes to Vaand Vc genomes together with NBS-R gene cluster andtheir phylogenetic subclades.
(DOC)
Table S7 Distribution of NBS-R genes based on phylo-genetic subclades and on specific protein domains ofclustered (CL) and single (R) NBS-R genes present on theunassigned chromosomes 4, 11, 14, 16, and 17.(DOC)
Grapevine Genome Evolution
PLoS ONE | www.plosone.org 8 January 2012 | Volume 7 | Issue 1 | e29762
Table S8 Presence in 55 single (R) and six clustered(CL) NBS-R genes of features of helitron transpositiveactivity, which include the CTAG tetranucleotide and theinverted repeat forming the stem and loop structure.The table includes some of the putative ancestor genes from which
single genes may have originated.
(DOC)
Text S1 Supporting text and references. S1A. Angiosperm
phylogeny. S1B. Rosids fossils. S1C. The family of Vitaceae.
(DOC)
Acknowledgments
The authors dedicate this article to the memory of Katharina Schneider,
who unexpectedly passed away. The authors thank Vittorio Sgaramella for
critical reading the manuscript.
Author Contributions
Conceived and designed the experiments: GM MP FS. Performed the
experiments: AC PF LS YVdP GM MP. Analyzed the data: GM MP
YVdP FS. Contributed reagents/materials/analysis tools: R. Velasco R.
Viola. Wrote the paper: GM MP R. Velasco R. Viola FS.
References
1. Schmutz J, Cannon SB, Schlueter J, Ma JX, Mitros T, et al. (2010) Genome
sequence of the palaeopolyploid soybean. Nature 463: 178–183.
2. Tang H, Wang X, Bowers JE, Ming R, Alam M, et al. (2008) Unraveling ancient
hexaploidy through multiply-aligned angiosperm gene maps. Genome Res 18:
1944–1954.
3. Schranz ME, Mitchell-Olds T (2006) Independent ancient polyploidy events in
the sister families Brassicaceae and Cleomaceae. Plant Cell 18: 1152–1165.
4. Comai L (2000) Genetic and epigenetic interactions in allopolyploid plants. Plant
Mol Biol 43: 387–399.
5. Velasco R, Zharkikh A, Troggio M, Cartwright DA, Cestaro A, et al. (2007) A
high quality draft consensus sequence of the genome of a heterozygous grapevine
variety. PLoS ONE 2: e1326.
6. Jaillon O, Aury JM, Noel B, Policriti A, Clepet C, et al. (2007) The grapevine
genome sequence suggests ancestral hexaploidization in major angiosperm
phyla. Nature 449: 463–467.
7. Freeling M, Lyons E, Pedersen B, Alam M, Ming R, et al. (2008) Many or most
genes in Arabidopsis transposed after the origin of the order Brassicales.
Genome Res 18: 1924–1937.
8. van Ooijen G, Mayr G, Kasiem MM, Albrecht M, Cornelissen BJ, et al. (2008)
Structure-function analysis of the NB-ARC domain of plant disease resistance
proteins. J Exp Bot 59: 1383–1397.
9. Leister D, Ballvora A, Salamini F, Gebhardt C (1996) A PCR-based approach
for isolating pathogen resistance genes from potato with potential for wide
application in plants. Nat Genet 14: 421–429.
10. Yu YG, Buss GR, Maroof MA (1996) Isolation of a superfamily of candidate
disease-resistance genes in soybean based on a conserved nucleotide-binding site.
Proc Natl Acad Sci U S A 93: 11751–11756.
11. Meyers BC, Dickerman AW, Michelmore RW, Sivaramakrishnan S, Sobral BW,
et al. (1999) Plant disease resistance genes encode members of an ancient and
diverse protein family within the nucleotide-binding superfamily. Plant J 20:
317–332.
12. Kanazin V, Marek LF, Shoemaker RC (1996) Resistance gene analogs are
conserved and clustered in soybean. Proc Natl Acad Sci U S A 93:
11746–11750.
13. Leister D, Kurth J, Laurie DA, Yano M, Sasaki T, et al. (1998) Rapid
reorganization of resistance gene homologues in cereal genomes. Proc Natl Acad
Sci U S A 95: 370–375.
14. Meyers BC, Kaushik S, Nandety RS (2005) Evolving disease resistance genes.
Curr Opin Plant Biol 8: 129–134.
15. Michelmore RW, Meyers BC (1998) Clusters of resistance genes in plants evolve
by divergent selection and a birth-and-death process. Genome Res 8:
1113–1130.
16. Richly E, Kurth J, Leister D (2002) Mode of amplification and reorganization of
resistance genes during recent Arabidopsis thaliana evolution. Mol Biol Evol 19:
76–84.
17. Leister D (2004) Tandem and segmental gene duplication and recombination in
the evolution of plant disease resistance genes. Trends Genet 20: 116–122.
18. Soltis DE, Bell CD, Kim S, Soltis PS (2008) Origin and early evolution of
angiosperms. Ann N Y Acad Sci 1133: 3–25.
19. Yang S, Zhang X, Yue JX, Tian D, Chen JQ (2008) Recent duplications
dominate NBS-encoding gene expansion in two woody species. Mol Genet
Genomics 280: 187–198.
20. Bowers JE, Abbey C, Anderson S, Chang C, Draye X, et al. (2003) A high-
density genetic recombination map of sequence-tagged sites for Sorghum, as a
framework for comparative structural and evolutionary genomics of tropical
grains and grasses. Genetics 165: 367–386.
21. Tang H, Bowers JE, Wang X, Ming R, Alam M, et al. (2008) Synteny and
collinearity in plant genomes. Science 320: 486–488.
22. Van de Peer Y, Fawcett JA, Proost S, Sterck L, Vandepoele K (2009) The
flowering world: a tale of duplications. Trends Plant Sci 14: 680–688.
23. Freeling M (2009) Bias in plant gene content following different sorts of
duplication: tandem, whole-genome, segmental, or by transposition. Annu Rev
Plant Biol 60: 433–453.
24. Liu JJ, Ekramoddoullah AKM (2007) The CC-NBS-LRR subfamily in Pinus
monticola: Targeted identification, gene expression, and genetic linkage with
resistance to Cronartium ribicola. Phytopathology 97: 728–736.
25. Meyers BC, Morgante M, Michelmore RW (2002) TIR-X and TIR-NBSproteins: two new families related to disease resistance TIR-NBS-LRR proteins
encoded in Arabidopsis and other plant genomes. Plant J 32: 77–92.
26. Zhu H, Cannon SB, Young ND, Cook DR (2002) Phylogeny and genomicorganization of the TIR and non-tIR NBS-LRR resistance gene family in
Medicago truncatula. Mol Plant Microbe Interact 15: 529–539.
27. Xu Q, Wen X, Deng X (2007) Phylogenetic and evolutionary analysis of NBS-
encoding genes in Rosaceae fruit crops. Mol Phylogenet Evol 44: 315–324.
28. Flavell RB (1984) DNA transposition – a major contributor to plantchromosome structure. Bioessays 1: 21–22.
29. Velasco R, Zharkikh A, Affourtit J, Dhingra A, Cestaro A, et al. (2010) The
genome of the domesticated apple (Malus6domestica Borkh.). Nat Genet 42:833–839.
30. Kapitonov VV, Jurka J (2007) Helitrons on a roll: eukaryotic rolling-circletransposons. Trends Genet 23: 521–529.
31. Morgante M, Brunner S, Pea G, Fengler K, Zuccolo A, et al. (2005) Gene
duplication and exon shuffling by helitron-like transposons generate intraspeciesdiversity in maize. Nat Genet 37: 997–1002.
32. Ameline-Torregrosa C, Wang BB, O’Bleness MS, Deshpande S, Zhu HY, et al.
(2008) Identification and characterization of nucleotide-binding site-Leucine-rich repeat genes in the model plant Medicago truncatula. Plant Physiol 146: 5–21.
33. Friedman AR, Baker BJ (2007) The evolution of resistance genes in multi-
protein plant resistance systems. Curr Opin Genet Dev 17: 493–499.
34. Shen J, Araki H, Chen L, Chen JQ, Tian D (2006) Unique evolutionary
mechanism in R-genes under the presence/absence polymorphism in Arabidopsis
thaliana. Genetics 172: 1243–1250.
35. Falginella L, Castellarin SD, Testolin R, Gambetta GA, Morgante M, et al.
(2010) Expansion and subfunctionalisation of flavonoid 39,59-hydroxylases in thegrapevine lineage. BMC Genomics 11: 562.
36. Jiang N, Bao Z, Zhang X, Eddy SR, Wessler SR (2004) Pack-MULE
transposable elements mediate gene evolution in plants. Nature 431: 569–573.
37. Chen I, Manchester SR (2007) Seed morphology of modern and fossil
Ampelocissus (Vitaceae) and implications for phytogeography. Am J Bot 94:1534–1553.
38. Tiffney BH (1994) An estimate of the early Tertiary palaeoclimate of the
southern Arctic. In: Boulter MC, Fisher HV, eds. Cenozoic plants and climatesof the Arctic. Berlin: Springer. pp 267–295.
39. This P, Lacombe T, Thomas MR (2006) Historical origins and genetic diversity
of wine grapes. Trends Genet 22: 511–519.
40. Abrouk M, Murat F, Pont C, Messing J, Jackson S, et al. (2010) Palaeogenomics
of plants: synteny-based modelling of extinct ancestors. Trends Plant Sci 15:
479–487.
41. Jansen RK, Kaittanis C, Saski C, Lee SB, Tomkins J, et al. (2006) Phylogenetic
analyses of Vitis (Vitaceae) based on complete chloroplast genome sequences:effects of taxon sampling and phylogenetic methods on resolving relationships
among rosids. BMC Evol Biol 6: 32.
42. Moore MJ, Bell CD, Soltis PS, Soltis DE (2007) Using plastid genome-scale datato resolve enigmatic relationships among basal angiosperms. Proc Natl Acad Sci
USA 104: 19363–19368.
43. Friis EM, Raunsgaard Pedersen K, Crane PR (2006) Cretaceous angiospermflowers: Innovation and evolution in plant reproduction. Palaeogeogr Palaeo-
climatol Palaeoecol 232: 251–293.
44. Chaw SM, Chang CC, Chen HL, Li WH (2004) Dating the monocot-dicotdivergence and the origin of core eudicots using whole chloroplast genomes.
J Mol Evol 58: 424–441.
45. Crane PR, Herendeen P, Friis EM (2004) Fossils and plant phylogeny. Am J Bot
91: 1683–1699.
46. Friedman AR, Moore RC, Purugganan MD (2004) The evolution of plantdevelopment. Am J Bot 91: 1726–1741.
47. Schneider H, Schuettpelz E, Pryer KM, Cranfill R, Magallon S, et al. (2004)
Ferns diversified in the shadow of angiosperms. Nature 428: 553–557.
48. Wikstrom N, Savolainen V, Chase MW (2001) Evolution of the angiosperms:
calibrating the family tree. Proc Biol Sci 268: 2211–2220.
49. Hughes NF (1994) The Enigma of Angiosperm Origins. Cambridge: CambridgeUniversity Press. 303 p.
50. Arnold ML (1994) Natural hybridisation and evolution. Oxford: OxfordUniversity Press. 215 p.
Grapevine Genome Evolution
PLoS ONE | www.plosone.org 9 January 2012 | Volume 7 | Issue 1 | e29762
51. Stebbins GL (1950) Variation and evolution in plants. New York: Columbia
University Press. 643 p.52. Cui L, Wall PK, Leebens-Mack JH, Lindsay BG, Soltis DE, et al. (2006)
Widespread genome duplications throughout the history of flowering plants.
Genome Res 16: 738–749.53. Friis EM, Pedersen KR, Crane PR (2005) When Earth started blooming:
insights from the fossil record. Curr Opin Plant Biol 8: 5–12.54. Lyons E, Pedersen B, Kane J, Freeling M (2008) The value of nonmodel
genomes and an example using SynMap within CoGe to dissect the hexaploidy
that predates the Rosids. Trop Plant Biol 1: 181–190.55. Patel GI, Olmo HP (1955) Cytogenetics of Vitis: I. the hybrid V. vinifera6V.
rotundifolia. Am J Bot 42: 141–159.56. Nybom H, Esselink GD, Werlemark G, Leus L, Vosman B (2006) Unique
genomic configuration revealed by microsatellite DNA in polyploid dogroses,Rosa sect. Caninae. J Evolution Biol 19: 635–648.
57. Ritz CM, Schmuths H, Wissemann V (2005) Evolution by reticulation:
European dogroses originated by multiple hybridization across the genus Rosa.J Hered 96: 4–14.
58. Borgato L, Conicella C, Pisani F, Furini A (2007) Production andcharacterization of arboreous and fertile Solanum melongena+Solanum marginatum
somatic hybrid plants. Planta 226: 961–969.
59. Al-Kaff N, Knight E, Bertin I, Foote T, Hart N, et al. (2008) Detailed dissectionof the chromosomal region containing the Ph1 locus in wheat Triticum aestivum:
with deletion mutants and expression profiling. Ann Bot 101: 863–872.
60. Martinez-Perez E, Shaw P, Moore G (2001) The Ph1 locus is needed to ensure
specific somatic and meiotic centromere association. Nature 411: 204–207.
61. Finn RD, Mistry J, Schuster-Bockler B, Griffiths-Jones S, Hollich V, et al. (2006)
Pfam: clans, web tools and services. Nucleic Acids Res 34: D247–D251.
62. Durbin R, Eddy SR, Krogh A, Mitchison GJ (1998) Biological Sequence
Analysis: Probabilistic Models of Proteins and Nucleic Acids. Cambridge:
Cambridge University Press. 368 p.
63. Li WH, Gu ZL, Wang HD, Nekrutenko A (2001) Evolutionary analyses of the
human genome. Nature 409: 847–849.
64. Zhang Z, Li J, Zhao XQ, Wang J, Wong GK, et al. (2006) KaKs_Calculator:
calculating Ka and Ks through model selection and model averaging. Genomics
Proteomics Bioinformatics 4: 259–263.
65. Guindon S, Gascuel O (2003) A simple, fast, and accurate algorithm to estimate
large phylogenies by maximum likelihood. Syst Biol 52: 696–704.
66. Li W, Godzik A (2006) Cd-hit: a fast program for clustering and comparing large
sets of protein or nucleotide sequences. Bioinformatics 22: 1658–1659.
67. Katoh K, Kuma K, Toh H, Miyata T (2005) MAFFT version 5: improvement in
accuracy of multiple sequence alignment. Nucleic Acids Res 33: 511–518.
68. Notredame C, Higgins DG, Heringa J (2000) T-Coffee: A novel method for fast
and accurate multiple sequence alignment. J Mol Biol 302: 205–217.
69. Simillion C, Janssens K, Sterck L, Van de Peer Y (2008) i-ADHoRe 2.0: an
improved tool to detect degenerated genomic homology using genomic profiles.
Bioinformatics 24: 127–128.
Grapevine Genome Evolution
PLoS ONE | www.plosone.org 10 January 2012 | Volume 7 | Issue 1 | e29762