Paleo sea levels reconsidered from direct observation of paleoshoreline position during Glacial...
19
Paleo sea levels reconsidered from direct observation of paleoshoreline position during Glacial Maxima (for the last 500,000 yr) Marina Rabineau a, ⁎ , Serge Berné b , Jean-Louis Olivet b , Daniel Aslanian b , François Guillocheau c , Philippe Joseph d a CNRS, UMR6538,Domaines Océaniques, IUEM, 29280 Plouzané, France b IFREMER, DRO/GM,BP 70, 29280 Plouzané, France c Géosciences Rennes, Université de Rennes 1, 35042 Rennes, France d IFP, Division Géologie-Géochimie, BP311, 92 506 Rueil Malmaison, France Received 7 September 2005; received in revised form 13 June 2006; accepted 18 September 2006 Available online 3 November 2006 Editor: V. Courtillot Abstract The drastic climatic changes which characterise the cooling trend of the last few million years of Earth history led to variations in eustatic sea level that had tremendous impact on the geology and ecology of continental margins. Reconstructing a sea-level curve back in time is not an easy task. Observations of shoreline positions are always a local measurement of Relative Sea Level that needs to be corrected from the effect of tectonic and thermal subsidence, sediment loading, compaction and glacio-hydro isostasy. Extensive studies have been done for the last deglaciation and for the last 100,000 yr cycle. But very few studies deal with position of sea level during earlier cycles, simply because conditions are very rarely favourable for the preservation of such witnesses. The shelf of the Golfe du Lion (Western Mediterranean) reveals a unique record of shoreline paleopositions during glacial maxima of at least the last five circa 100 kyr glacial/interglacial cycles. In fact it is the entire glacial deltaic lobe of up to 50 m thick (from delta front or shoreface to prodelta) that has been preserved in place and which provides direct and independent constraints for relative sea-level minima. We measure a relative sea level of: - 112m, - 128, - 134, - 246 and - 262 m for MIS 2, 6, 8, 10 and 12 respectively. After corrections taking into account postdepositional movement of strata (subsidence), we find, that sea level dropped to a depth of - 102 ± 6 m during the last three glaciations (MIS2, MIS6, MIS8) but reached exceptionally low values of more than - 150±10 m during the preceding glaciations MIS10 and MIS 12 at about 340 and 434 kyr BP. This general time framework and sedimentological interpretation has been confirmed by preliminary results from two deep drillings during the PROMESS cruise (july 2004), which validate our methodology. However, no detailed and absolute datings of such witnesses are available so far, so that we cannot prove that these levels are the lowest ever reached during each glacials, but they correspond undoubtedly to the last preserved shoreface before rapid sea-level rise. We also suggest that the abrupt change in sea-level maxima might be the overprint of 400 kyr orbital periodicity cycles. Last but not least, these results prove that the Golfe du Lion is indeed a unique laboratory to study paleoclimates and sea-level variations on a larger time scale. Further work is needed for a complete Earth and Planetary Science Letters 252 (2006) 119 – 137 www.elsevier.com/locate/epsl ⁎ Corresponding author. Tel.: +33 2 98 49 87 28; fax: +33 2 98 49 87 60. E-mail address: [email protected] (M. Rabineau). 0012-821X/$ - see front matter © 2006 Elsevier B.V. All rights reserved. doi:10.1016/j.epsl.2006.09.033
-
Upload
univ-rennes1 -
Category
Documents
-
view
0 -
download
0
Transcript of Paleo sea levels reconsidered from direct observation of paleoshoreline position during Glacial...
tters 252 (2006) 119–137www.elsevier.com/locate/epsl
⁎
Earth and Planetary Science Le
Paleo sea levels reconsidered from direct observation ofpaleoshoreline position during Glacial Maxima
(for the last 500,000 yr)
Marina Rabineau a,⁎, Serge Berné b, Jean-Louis Olivet b, Daniel Aslanian b,François Guillocheau c, Philippe Joseph d
a CNRS, UMR6538,Domaines Océaniques, IUEM, 29280 Plouzané, Franceb IFREMER, DRO/GM,BP 70, 29280 Plouzané, France
c Géosciences Rennes, Université de Rennes 1, 35042 Rennes, Franced IFP, Division Géologie-Géochimie, BP311, 92 506 Rueil Malmaison, France
Received 7 September 2005; received in revised form 13 June 2006; accepted 18 September 2006Available online 3 November 2006
Editor: V. Courtillot
Abstract
The drastic climatic changes which characterise the cooling trend of the last few million years of Earth history led to variationsin eustatic sea level that had tremendous impact on the geology and ecology of continental margins. Reconstructing a sea-levelcurve back in time is not an easy task. Observations of shoreline positions are always a local measurement of Relative Sea Levelthat needs to be corrected from the effect of tectonic and thermal subsidence, sediment loading, compaction and glacio-hydroisostasy. Extensive studies have been done for the last deglaciation and for the last 100,000 yr cycle. But very few studies deal withposition of sea level during earlier cycles, simply because conditions are very rarely favourable for the preservation of suchwitnesses. The shelf of the Golfe du Lion (Western Mediterranean) reveals a unique record of shoreline paleopositions duringglacial maxima of at least the last five circa 100 kyr glacial/interglacial cycles. In fact it is the entire glacial deltaic lobe of up to50 m thick (from delta front or shoreface to prodelta) that has been preserved in place and which provides direct and independentconstraints for relative sea-level minima. We measure a relative sea level of: −112m, −128, −134, −246 and −262 m for MIS 2, 6,8, 10 and 12 respectively. After corrections taking into account postdepositional movement of strata (subsidence), we find, that sealevel dropped to a depth of −102±6 m during the last three glaciations (MIS2, MIS6, MIS8) but reached exceptionally low valuesof more than −150±10 m during the preceding glaciations MIS10 and MIS 12 at about 340 and 434 kyr BP. This general timeframework and sedimentological interpretation has been confirmed by preliminary results from two deep drillings during thePROMESS cruise (july 2004), which validate our methodology. However, no detailed and absolute datings of such witnesses areavailable so far, so that we cannot prove that these levels are the lowest ever reached during each glacials, but they correspondundoubtedly to the last preserved shoreface before rapid sea-level rise. We also suggest that the abrupt change in sea-level maximamight be the overprint of 400 kyr orbital periodicity cycles. Last but not least, these results prove that the Golfe du Lion is indeed aunique laboratory to study paleoclimates and sea-level variations on a larger time scale. Further work is needed for a complete
Corresponding author. Tel.: +33 2 98 49 87 28; fax: +33 2 98 49 87 60.E-mail address: [email protected] (M. Rabineau).
0012-821X/$ - see front matter © 2006 Elsevier B.V. All rights reserved.doi:10.1016/j.epsl.2006.09.033
120 M. Rabineau et al. / Earth and Planetary Science Letters 252 (2006) 119–137
glacio-hydro-sedimento isostatic modelling of each sequence and each glacial to further constraint local sea level versus global sealevel and quantify, in particular the relative effect of glacio-hydro isostatic effect (which differ according to ice sheet extend) butalso of erosion–sedimentation isostatic effect (erosion on land and deposition on the outer shelf and slope).© 2006 Elsevier B.V. All rights reserved.
Keywords: sea-level changes; sea-level amplitudes; glacioeustatism; shoreline position; climatic cycles; glacial maxima; subsidence; Golfe du Lion;Gulf of Lions; Mediterranean Sea
1. Introduction
Throughout the Quaternary, sea-level evolution isdirectly linked to climate variations and the inducedthrob of ice sheets. During the last decades, extensiveefforts have been made to obtain a subcontinuous recordof paleoclimatic changes from the study of marine,continental or ice cores with, in particular, great progressin the use of isotopic ratios. However, such data do notgive direct access to sea-level history. A simple linearrelationship between the oxygen isotope record andglobal continental ice volume [1] or a more elaboraterelationship [2] is often taken as a first approximationbut is known to be too simplistic [3,1,2]. Direct proofsof sea-level position such as morphologic, diagenetic ororganic features (e.g. marine notches, terraces, arche-ological data, beach rocks, peats or coral construc-tions…) can be obtained from geological evidence oncontinental margins to calibrate the curves. But sea levelobtained in that way is a local Relative Sea level (RSL)as the Earth surface is subject to subsidence or uplift.This Relative Sea level needs to be corrected from theeffects of tectonic and thermal subsidence, sedimentloading and compaction, glacio-hydro isostasy, gravita-tional potential, in order to obtain a Corrected Sea level(CSL). To do so with confidence, the geological contextof the studied area needs to be chosen carefully andknown in great detail. In any case, neither of these twoapproaches alone (isotopic and geological) is sufficientto reconstruct a continuous calibrated sea-level curve;we need to compare and combine their results. This hasbeen done successfully for the last deglaciation (from20 to 0 cal-kyr BP) using corals, dating methods (14Cand U/Th) [4–9], glacio-hydro-isostatic models [10–12]or hydraulic model of water exchange [13]. Few studiesalso tried to calibrate the last interglacial and the entirelast glacial cycle (OIS 5 to OIS 3) in the same way usingcorals and dating methods [5,14–21] but also stalag-mites, speleothems and dating methods [22,23] or againusing glacio-hydrostatic models [24–26]. However, thecomparison of all these studies shows that even the sealevel at the Last Glacial Maximum (LGM) is still not so
well constrained and that discrepancies subsist betweenestimates (Table 1 and Fig. 1). On a longer time scale,apart from the original study of Rohling [27] usingvariations in salinity in the Red Sea as observed in coresand related to sea-level variations for the last 500,000 yrand the following work of Siddall using hydraulicmodelling in the Red Sea [13], and the new longdrillings in reefs [28], there have been very few studiesusing direct geological field evidence to estimatequantitative paleo-sea-level amplitudes, especially forlow stands and earlier glacials (Table 1). The work ofFerland [29] is one of the few attempts based onsediment cores on the shelf. The present work providesnew estimates of Corrected sea-level amplitude for thelast five glacials on the outer shelf of the Golfe du Lion,Western Mediterranean Sea.
2. Method: using seismic images to measure sea-level amplitude
Many factors of global, regional or local scale havelong been recognised to control the overall geometry anddeposition of sediments. Seismic stratigraphy wasdeveloped at the end of the 70′s, to address part of thosequestions that were critical for petroleum exploration[30–36] but this type of work deals with long-term evo-lution of sea level with sequences of the order of 1 Ma.
On shorter time scales, (i.e. Pleistocene), many studieshave also been undertaken on continental margins. Theyare too numerous to be cited. However, we note that, toour knowledge, very few attempts have been made to usethese observations to estimate sea level. This was alsopartly due to the inability to drill in shallow water, that haslong hampered progress in reconstructing sea-levelhistory [37]. So, in most studies paleoclimatic curvesderived from isotopic data were used as a reference andsequences observed on the field were correlated directlyto the paleoclimatic curves (e.g. [38,39]). One attempt ofamplitude determination after the work of [40,41] wasproposed by Skene using numerical stratigraphic model-ling [42] that led him to a modification of sea-level curves(see his curve in Fig. 1).
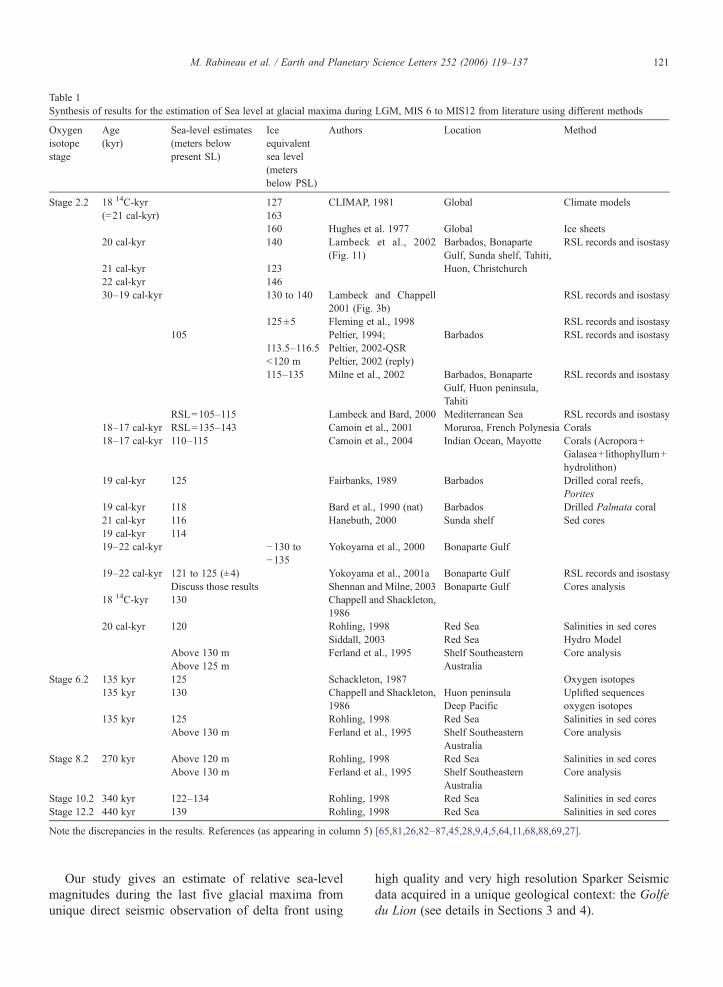
Table 1Synthesis of results for the estimation of Sea level at glacial maxima during LGM, MIS 6 to MIS12 from literature using different methods
Oxygenisotopestage
Age(kyr)
Sea-level estimates(meters belowpresent SL)
Iceequivalentsea level(metersbelow PSL)
Authors Location Method
Stage 2.2 18 14C-kyr 127 CLIMAP, 1981 Global Climate models(=21 cal-kyr) 163
160 Hughes et al. 1977 Global Ice sheets20 cal-kyr 140 Lambeck et al., 2002
(Fig. 11)Barbados, BonaparteGulf, Sunda shelf, Tahiti,Huon, Christchurch
RSL records and isostasy
21 cal-kyr 12322 cal-kyr 14630–19 cal-kyr 130 to 140 Lambeck and Chappell
2001 (Fig. 3b)RSL records and isostasy
125±5 Fleming et al., 1998 RSL records and isostasy105 Peltier, 1994; Barbados RSL records and isostasy
113.5–116.5 Peltier, 2002-QSRb120 m Peltier, 2002 (reply)115–135 Milne et al., 2002 Barbados, Bonaparte
Gulf, Huon peninsula,Tahiti
RSL records and isostasy
RSL=105–115 Lambeck and Bard, 2000 Mediterranean Sea RSL records and isostasy18–17 cal-kyr RSL=135–143 Camoin et al., 2001 Moruroa, French Polynesia Corals18–17 cal-kyr 110–115 Camoin et al., 2004 Indian Ocean, Mayotte Corals (Acropora+
Galasea+ lithophyllum+hydrolithon)
19 cal-kyr 125 Fairbanks, 1989 Barbados Drilled coral reefs,Porites
19 cal-kyr 118 Bard et al., 1990 (nat) Barbados Drilled Palmata coral21 cal-kyr 116 Hanebuth, 2000 Sunda shelf Sed cores19 cal-kyr 11419–22 cal-kyr −130 to
−135Yokoyama et al., 2000 Bonaparte Gulf
19–22 cal-kyr 121 to 125 (±4) Yokoyama et al., 2001a Bonaparte Gulf RSL records and isostasyDiscuss those results Shennan and Milne, 2003 Bonaparte Gulf Cores analysis
18 14C-kyr 130 Chappell and Shackleton,1986
20 cal-kyr 120 Rohling, 1998 Red Sea Salinities in sed coresSiddall, 2003 Red Sea Hydro Model
Above 130 m Ferland et al., 1995 Shelf Southeastern Core analysisAbove 125 m Australia
Stage 6.2 135 kyr 125 Schackleton, 1987 Oxygen isotopes135 kyr 130 Chappell and Shackleton,
1986Huon peninsulaDeep Pacific
Uplifted sequencesoxygen isotopes
135 kyr 125 Rohling, 1998 Red Sea Salinities in sed coresAbove 130 m Ferland et al., 1995 Shelf Southeastern
AustraliaCore analysis
Stage 8.2 270 kyr Above 120 m Rohling, 1998 Red Sea Salinities in sed coresAbove 130 m Ferland et al., 1995 Shelf Southeastern
AustraliaCore analysis
Stage 10.2 340 kyr 122–134 Rohling, 1998 Red Sea Salinities in sed coresStage 12.2 440 kyr 139 Rohling, 1998 Red Sea Salinities in sed cores
Note the discrepancies in the results. References (as appearing in column 5) [65,81,26,82–87,45,28,9,4,5,64,11,68,88,69,27].
121M. Rabineau et al. / Earth and Planetary Science Letters 252 (2006) 119–137
Our study gives an estimate of relative sea-levelmagnitudes during the last five glacial maxima fromunique direct seismic observation of delta front using
high quality and very high resolution Sparker Seismicdata acquired in a unique geological context: the Golfedu Lion (see details in Sections 3 and 4).
122 M. Rabineau et al. / Earth and Planetary Science Letters 252 (2006) 119–137
3. Studied site: the Golfe du Lion, an unique site tostudy sea-level variations
The Golfe du Lion offers a perfect natural laboratoryfor sea-level calibration of glacial maxima for theclimatic cycles during Plio-Pleistocene (Fig. 2) as: (a)the Mediterranean Sea has been connected to the globalocean throughout Plio-Quaternary time, so that sea-levelvariations are directly linked to Arctic and Antarctic icecaps fluctuations (b) The Golfe du Lion is a youngmargin resulting from the rotation of the Corso-Sardinianblock between about 21 Myr and 15 Myr [43,44]. Thesubsidence is still underway at present and continuallycreates a large amount of space to be filled by sediments(i.e. an accommodation); (c) During the Last GlacialMaximum, mountain glaciers covered a large part of theAlps, and there were smaller glaciers in the Pyrenees andthe Massif Central. However, neither the drainage basinsnor the shelf was covered by ice (Fig. 2-B). Moreover,the Golfe du Lion is situated sufficiently far from formerice sheets (hundreds of kilometers) for important glacio-isostasy of the margin to be excluded, so that sea levelfollows, in a first approximation, the eustatic changes(Cit. [45], p.204); (d) The mountain glaciers did not
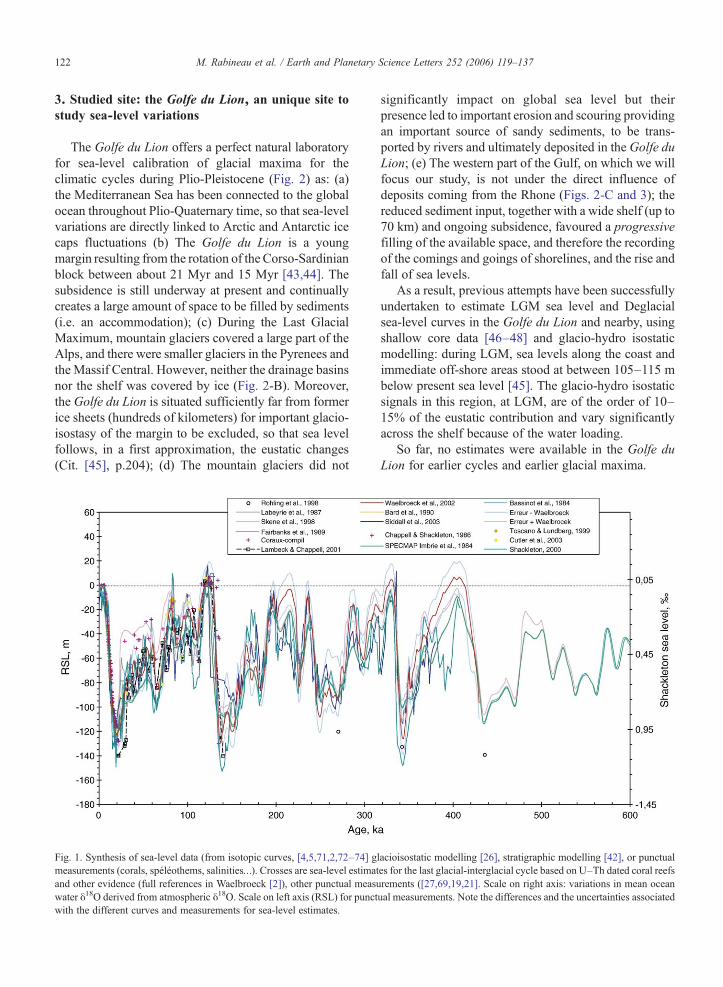
Fig. 1. Synthesis of sea-level data (from isotopic curves, [4,5,71,2,72–74] gmeasurements (corals, spéléothems, salinities…). Crosses are sea-level estimatand other evidence (full references in Waelbroeck [2]), other punctual measuwater δ18O derived from atmospheric δ18O. Scale on left axis (RSL) for punctwith the different curves and measurements for sea-level estimates.
significantly impact on global sea level but theirpresence led to important erosion and scouring providingan important source of sandy sediments, to be trans-ported by rivers and ultimately deposited in the Golfe duLion; (e) The western part of the Gulf, on which we willfocus our study, is not under the direct influence ofdeposits coming from the Rhone (Figs. 2-C and 3); thereduced sediment input, together with a wide shelf (up to70 km) and ongoing subsidence, favoured a progressivefilling of the available space, and therefore the recordingof the comings and goings of shorelines, and the rise andfall of sea levels.
As a result, previous attempts have been successfullyundertaken to estimate LGM sea level and Deglacialsea-level curves in the Golfe du Lion and nearby, usingshallow core data [46–48] and glacio-hydro isostaticmodelling: during LGM, sea levels along the coast andimmediate off-shore areas stood at between 105–115 mbelow present sea level [45]. The glacio-hydro isostaticsignals in this region, at LGM, are of the order of 10–15% of the eustatic contribution and vary significantlyacross the shelf because of the water loading.
So far, no estimates were available in the Golfe duLion for earlier cycles and earlier glacial maxima.
lacioisostatic modelling [26], stratigraphic modelling [42], or punctuales for the last glacial-interglacial cycle based on U–Th dated coral reefsrements ([27,69,19,21]. Scale on right axis: variations in mean oceanual measurements. Note the differences and the uncertainties associated
123M. Rabineau et al. / Earth and Planetary Science Letters 252 (2006) 119–137
4. Defining Paleoshoreline positions through timeand duration of sequences
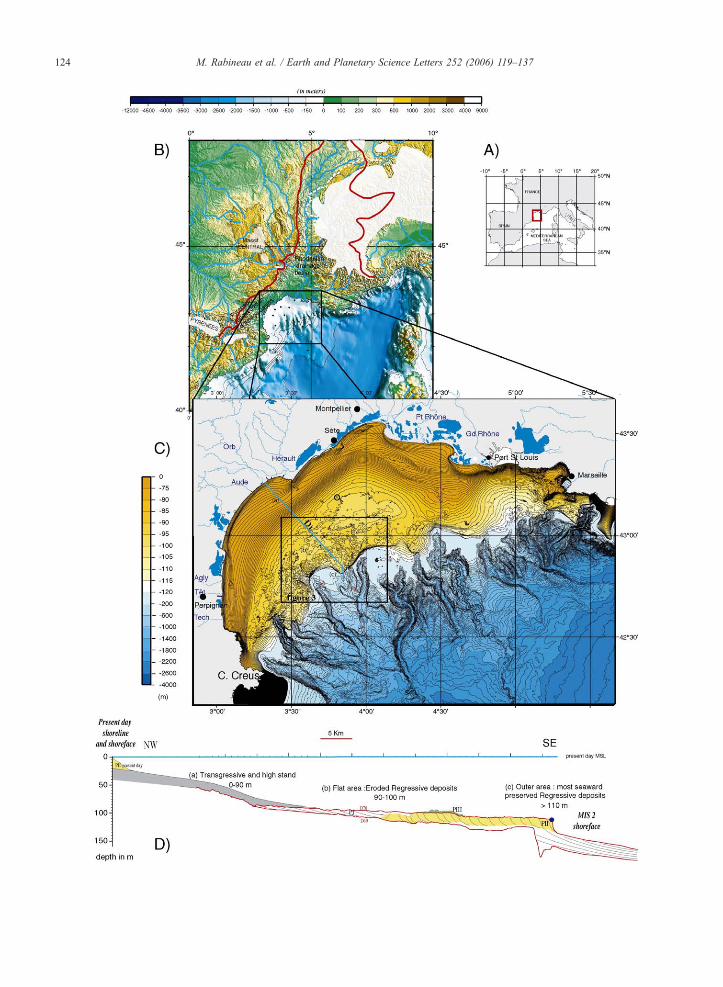
The recent compilation of bathymetric data [49]shows that the continental shelf comprises three mainareas (Figs. 2-C and D and 3).
(a) On the inner part, between the present coast 0 mand isobath 90 m (around 30 km seaward of thecoast), bathymetric contour lines indicate a stepfrom 0–10 m corresponding to present day prismPII (shoreface sandy deposits), then smoothcontour lines with bulges related to the subaqueouspart (prodeltas) of transgressive and high standdeltaic lobes that have been mapped, sampled anddated (post 18 kyr-C14) ([46,50–52]).
(b) On the outer part, between 90 and 100 m,bathymetric contour lines indicate a very flatarea with smaller scale rough morphology. Adistinct notch or step occurs at the end of this areaat 110 m (Fig. 3). Shallow cores (few meters long)indicate that sediments outcropping (from 90 to110 m) are sands [53] (see also Fig. 2 in [54]).
(c) Between 120 and 160 m, isobaths are smoothagain on interfluves with silty to muddy prodeltaicoffshore deposits.
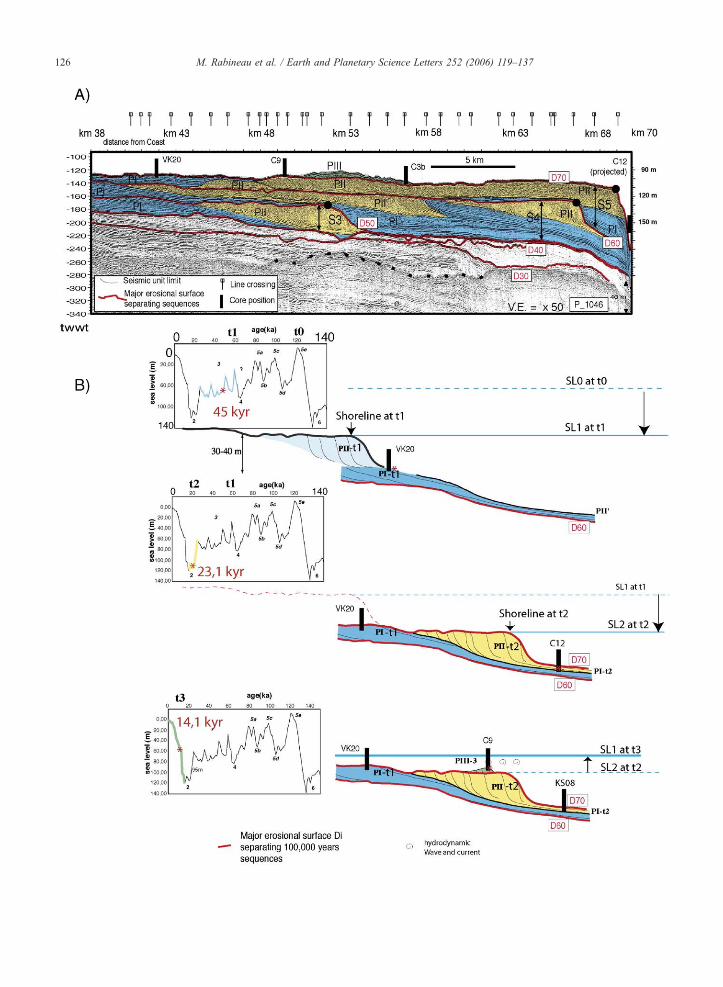
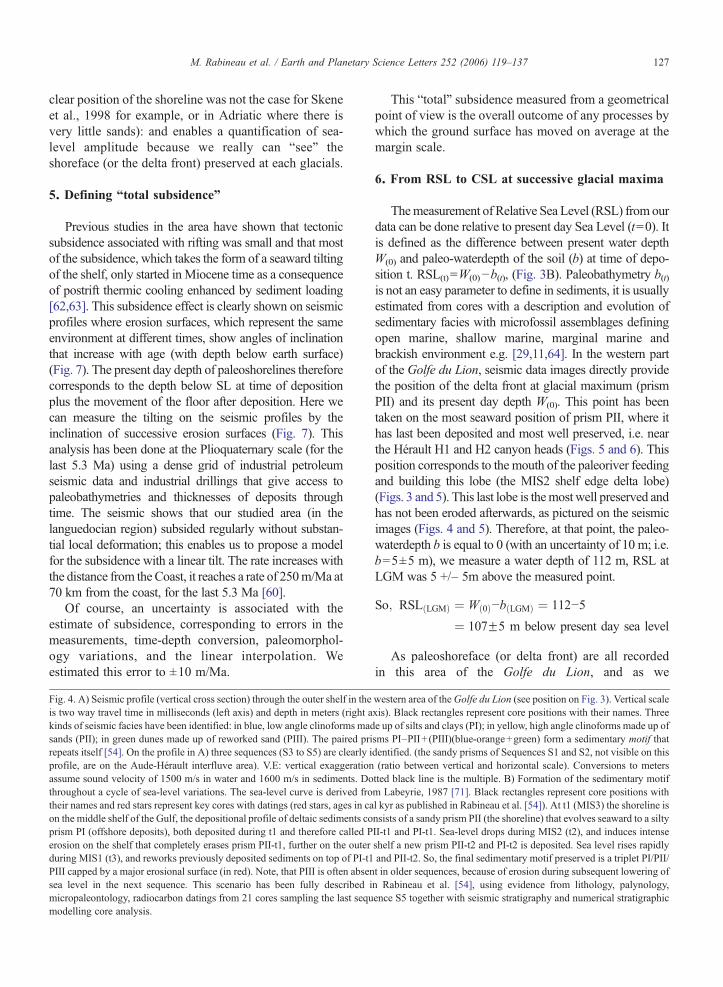
The compilation and 3D analysis of Very HighResolution seismic data (Sparker and 2.5 kHz data)combined with the analysis of shallow cores, shows thatthe sedimentation repeats through time with a distinctsedimentary motif PI/PII/(PIII) developed betweenmajor erosion surfaces D30, D40, D50, D60 and D70[54] (Fig. 4-A and B). Five sequences S1, S2, S3, S4 andS5 are therefore stacked vertically and separated by theerosion surfaces, clearly identifiable on seismic profiles.
Evidence integrating lithology, palynology, micropa-leontology, from 21 cores sampling the last sequence S5with 14 radiocarbon datings together with seismicstratigraphy and numerical stratigraphic modelling dem-onstrate that the top of PII-t2, which corresponds to thestep observed on the outer shelf (Fig. 3) represents thepreserved position of the delta front/shoreface during theLGM and that the outcome motif preserved on the outershelf is the result of one 100,000 yr climatic cycle [54].
S5 is the result of deposition/erosion throughout acycle of variation of sea level (MIS3/MIS2/MIS1) assummarised on Fig. 4-B. MIS5 was deposited during thehigh stand on the inner shelf (as in present dayconditions), and eroded during following sea levellowering. PI-t1 was deposited during MIS3, (Core VK-20 shows a prodeltaic, upper offshore paleoenvironment
(Ostracodes (mostly infralittoral species, 60 m waterdepth) dated at 45 cal-kyr BP, steppic pollens andDinokystes of cold period). PII-t2 and PI-t2 aredeposited during MIS2: paleoenvironments of PI-t2 inC12 are shallow (30–40 m according to Pteropodes andForaminifera) and dated at 23.1 cal-kyr BP, Paleoenvir-onment of PII-t2 is very shallow (delta front-uppershoreface (5–10 m water depth) with in some places theformation of beachrocks at the top (0 m water depth)dated between 21 cal-kyr and 15.5 cal-kyr [55,56]. PIII-t3 is very limited in thickness, it takes the form ofreworking sand dunes that are deposited during MIS1(C9 shows both cold and warm Foraminifera, dated at14,139 cal-kyr). A full description of this data set ispublished in Rabineau et al. [54]. More detailed workhas also been undertaken for the transgressive dunes[57] and the last sequence [56].
The geometry of this area represents the ancestrallandscape as it stood some 20 thousand years ago (duringMIS2) with little reworking during the subsequent rapidtransgression [58,59]. We showed [60,54] that the motifPI/PII/(PIII) is complete, only, in the western part of theGulf (around the Aude-Hérault canyons). Towards theEast (the Rhône) and to the South (Cap Creus) PII isoften missing (not deposited or eroded).
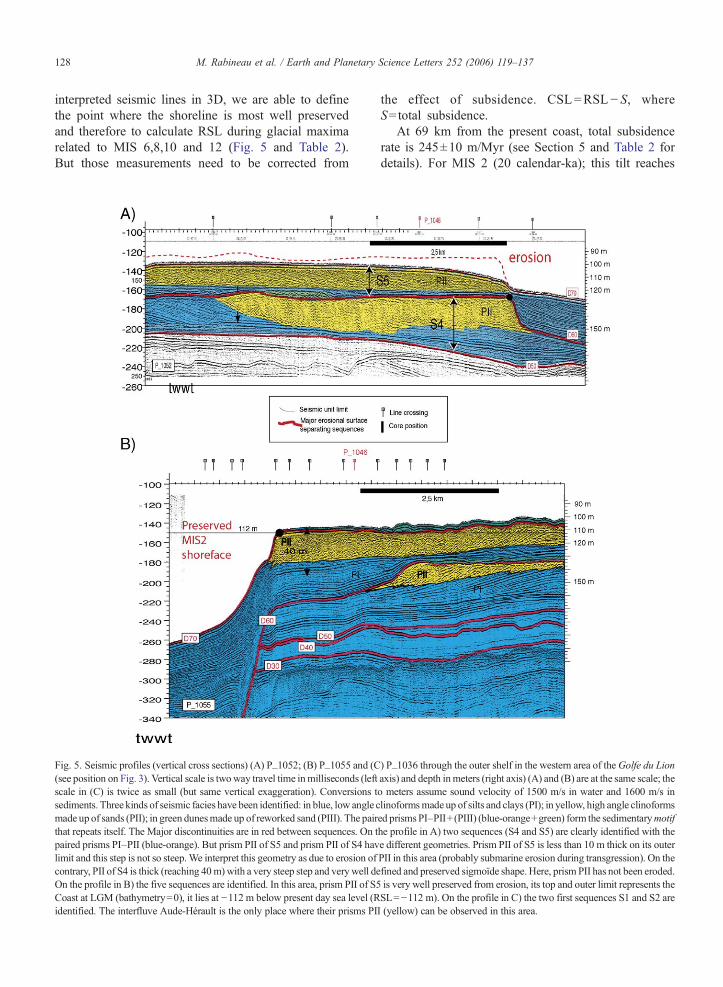
In depth, seismic profiles show a total of fivesequences of prisms PI/PII/(PIII)(S1 to S5), separatedby major erosional surfaces: D30, D40, D50, D60, D70(Figs. 3 and 4). Each prism PII corresponds to thedeposition and preservation of the shoreline–shorefaceof glacial times. The preservation of the shoreline–shoreface is not the same everywhere, i.e. erosion occurs(subaerial and submarine) (Fig. 5). So, defining the zonewhere shoreline is the most well preserved needs adetailed 3D interpretation of all seismic lines. This hasbeen done in great detail in the Aude-Hérault area withdetailed maps of all units and surfaces [59,60,54]. Thiswork enables us to map the shoreline at the time ofglacial maxima and to define the outer limit of bestpreserved glacial delta front as seen on seismic profiles(Fig. 5) and mapped in 3D (Fig. 6).
We tested the hypothesis that each of the sequenceswas being deposited during a cycle of the same order ofmagnitude and duration as S5, i.e.: 100000 yr. Thishypothesis effectively enabled us to reproduce correctgeometries using numerical stratigraphic modelling[60,54]. So the last 5 erosion surfaces and preserveddelta front-shoreface correspond to delta front related toMIS2, MIS6, MIS8, MIS10 and MIS12.
Preliminary results from two deep drillings realisedduring the PROMESS cruise (july 2004) confirm theoverall chronostratigraphic framework for the last
124 M. Rabineau et al. / Earth and Planetary Science Letters 252 (2006) 119–137
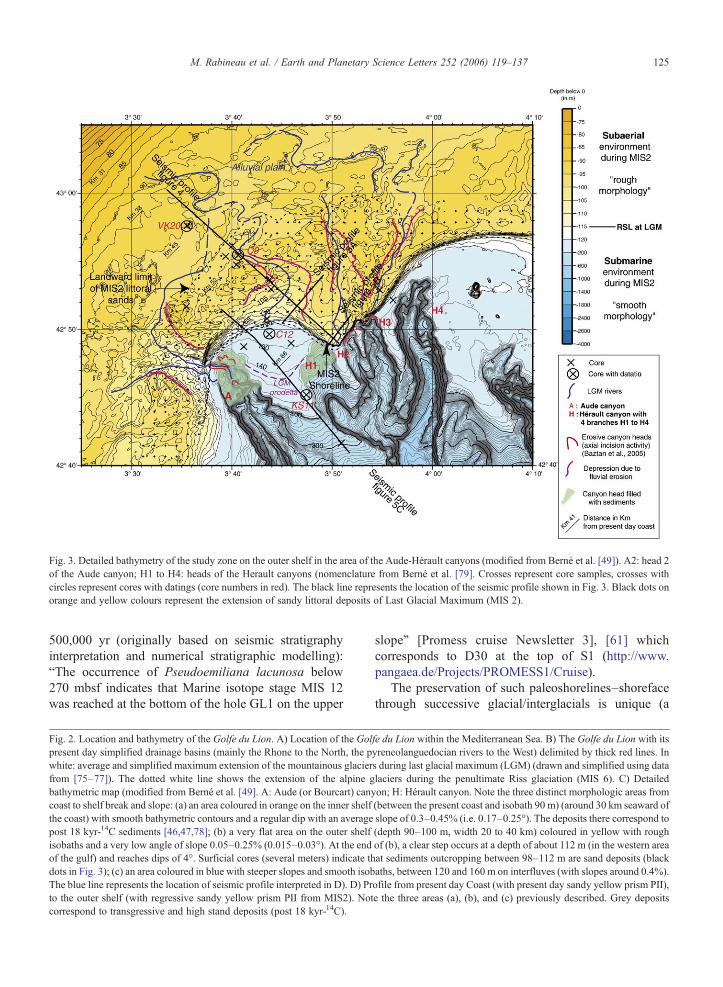
Fig. 3. Detailed bathymetry of the study zone on the outer shelf in the area of the Aude-Hérault canyons (modified from Berné et al. [49]). A2: head 2of the Aude canyon; H1 to H4: heads of the Herault canyons (nomenclature from Berné et al. [79]. Crosses represent core samples, crosses withcircles represent cores with datings (core numbers in red). The black line represents the location of the seismic profile shown in Fig. 3. Black dots onorange and yellow colours represent the extension of sandy littoral deposits of Last Glacial Maximum (MIS 2).
125M. Rabineau et al. / Earth and Planetary Science Letters 252 (2006) 119–137
500,000 yr (originally based on seismic stratigraphyinterpretation and numerical stratigraphic modelling):“The occurrence of Pseudoemiliana lacunosa below270 mbsf indicates that Marine isotope stage MIS 12was reached at the bottom of the hole GL1 on the upper
Fig. 2. Location and bathymetry of the Golfe du Lion. A) Location of the Golpresent day simplified drainage basins (mainly the Rhone to the North, the pwhite: average and simplified maximum extension of the mountainous glacierfrom [75–77]). The dotted white line shows the extension of the alpine gbathymetric map (modified from Berné et al. [49]. A: Aude (or Bourcart) canycoast to shelf break and slope: (a) an area coloured in orange on the inner shelfthe coast) with smooth bathymetric contours and a regular dip with an averagepost 18 kyr-14C sediments [46,47,78]; (b) a very flat area on the outer shelfisobaths and a very low angle of slope 0.05–0.25% (0.015–0.03°). At the endof the gulf) and reaches dips of 4°. Surficial cores (several meters) indicate thdots in Fig. 3); (c) an area coloured in blue with steeper slopes and smooth isobThe blue line represents the location of seismic profile interpreted in D). D) Prto the outer shelf (with regressive sandy yellow prism PII from MIS2). Notcorrespond to transgressive and high stand deposits (post 18 kyr-14C).
slope” [Promess cruise Newsletter 3], [61] whichcorresponds to D30 at the top of S1 (http://www.pangaea.de/Projects/PROMESS1/Cruise).
The preservation of such paleoshorelines–shorefacethrough successive glacial/interglacials is unique (a
fe du Lion within the Mediterranean Sea. B) The Golfe du Lion with itsyreneolanguedocian rivers to the West) delimited by thick red lines. Ins during last glacial maximum (LGM) (drawn and simplified using datalaciers during the penultimate Riss glaciation (MIS 6). C) Detailedon; H: Hérault canyon. Note the three distinct morphologic areas from(between the present coast and isobath 90 m) (around 30 km seaward ofslope of 0.3–0.45% (i.e. 0.17–0.25°). The deposits there correspond to(depth 90–100 m, width 20 to 40 km) coloured in yellow with roughof (b), a clear step occurs at a depth of about 112 m (in the western areaat sediments outcropping between 98–112 m are sand deposits (blackaths, between 120 and 160 m on interfluves (with slopes around 0.4%).ofile from present day Coast (with present day sandy yellow prism PII),e the three areas (a), (b), and (c) previously described. Grey deposits
126 M. Rabineau et al. / Earth and Planetary Science Letters 252 (2006) 119–137
127M. Rabineau et al. / Earth and Planetary Science Letters 252 (2006) 119–137
clear position of the shoreline was not the case for Skeneet al., 1998 for example, or in Adriatic where there isvery little sands): and enables a quantification of sea-level amplitude because we really can “see” theshoreface (or the delta front) preserved at each glacials.
5. Defining “total subsidence”
Previous studies in the area have shown that tectonicsubsidence associated with rifting was small and that mostof the subsidence, which takes the form of a seaward tiltingof the shelf, only started in Miocene time as a consequenceof postrift thermic cooling enhanced by sediment loading[62,63]. This subsidence effect is clearly shown on seismicprofiles where erosion surfaces, which represent the sameenvironment at different times, show angles of inclinationthat increase with age (with depth below earth surface)(Fig. 7). The present day depth of paleoshorelines thereforecorresponds to the depth below SL at time of depositionplus the movement of the floor after deposition. Here wecan measure the tilting on the seismic profiles by theinclination of successive erosion surfaces (Fig. 7). Thisanalysis has been done at the Plioquaternary scale (for thelast 5.3 Ma) using a dense grid of industrial petroleumseismic data and industrial drillings that give access topaleobathymetries and thicknesses of deposits throughtime. The seismic shows that our studied area (in thelanguedocian region) subsided regularly without substan-tial local deformation; this enables us to propose a modelfor the subsidence with a linear tilt. The rate increases withthe distance from theCoast, it reaches a rate of 250m/Ma at70 km from the coast, for the last 5.3 Ma [60].
Of course, an uncertainty is associated with theestimate of subsidence, corresponding to errors in themeasurements, time-depth conversion, paleomorphol-ogy variations, and the linear interpolation. Weestimated this error to ±10 m/Ma.
Fig. 4. A) Seismic profile (vertical cross section) through the outer shelf in theis two way travel time in milliseconds (left axis) and depth in meters (right akinds of seismic facies have been identified: in blue, low angle clinoforms madsands (PII); in green dunes made up of reworked sand (PIII). The paired prirepeats itself [54]. On the profile in A) three sequences (S3 to S5) are clearly iprofile, are on the Aude-Hérault interfluve area). V.E: vertical exaggerationassume sound velocity of 1500 m/s in water and 1600 m/s in sediments. Dothroughout a cycle of sea-level variations. The sea-level curve is derived frotheir names and red stars represent key cores with datings (red stars, ages in caon the middle shelf of the Gulf, the depositional profile of deltaic sediments coprism PI (offshore deposits), both deposited during t1 and therefore called Perosion on the shelf that completely erases prism PII-t1, further on the outerduring MIS1 (t3), and reworks previously deposited sediments on top of PI-t1PIII capped by a major erosional surface (in red). Note, that PIII is often absensea level in the next sequence. This scenario has been fully described imicropaleontology, radiocarbon datings from 21 cores sampling the last sequmodelling core analysis.
This “total” subsidence measured from a geometricalpoint of view is the overall outcome of any processes bywhich the ground surface has moved on average at themargin scale.
6. From RSL to CSL at successive glacial maxima
Themeasurement of Relative Sea Level (RSL) from ourdata can be done relative to present day Sea Level (t=0). Itis defined as the difference between present water depthW(0) and paleo-waterdepth of the soil (b) at time of depo-sition t. RSL(t)=W(0)−b(t), (Fig. 3B). Paleobathymetry b(t)is not an easy parameter to define in sediments, it is usuallyestimated from cores with a description and evolution ofsedimentary facies with microfossil assemblages definingopen marine, shallow marine, marginal marine andbrackish environment e.g. [29,11,64]. In the western partof the Golfe du Lion, seismic data images directly providethe position of the delta front at glacial maximum (prismPII) and its present day depth W(0). This point has beentaken on the most seaward position of prism PII, where ithas last been deposited and most well preserved, i.e. nearthe Hérault H1 and H2 canyon heads (Figs. 5 and 6). Thisposition corresponds to the mouth of the paleoriver feedingand building this lobe (the MIS2 shelf edge delta lobe)(Figs. 3 and 5). This last lobe is themost well preserved andhas not been eroded afterwards, as pictured on the seismicimages (Figs. 4 and 5). Therefore, at that point, the paleo-waterdepth b is equal to 0 (with an uncertainty of 10 m; i.e.b=5±5 m), we measure a water depth of 112 m, RSL atLGM was 5 +/– 5m above the measured point.
So; RSLðLGMÞ ¼ Wð0Þ−bðLGMÞ ¼ 112−5
¼ 107F5 m below present day sea level
As paleoshoreface (or delta front) are all recordedin this area of the Golfe du Lion, and as we
western area of theGolfe du Lion (see position on Fig. 3). Vertical scalexis). Black rectangles represent core positions with their names. Threee up of silts and clays (PI); in yellow, high angle clinoforms made up ofsms PI–PII+ (PIII)(blue-orange+green) form a sedimentary motif thatdentified. (the sandy prisms of Sequences S1 and S2, not visible on this(ratio between vertical and horizontal scale). Conversions to meterstted black line is the multiple. B) Formation of the sedimentary motifm Labeyrie, 1987 [71]. Black rectangles represent core positions withl kyr as published in Rabineau et al. [54]). At t1 (MIS3) the shoreline isnsists of a sandy prism PII (the shoreline) that evolves seaward to a siltyII-t1 and PI-t1. Sea-level drops during MIS2 (t2), and induces intenseshelf a new prism PII-t2 and PI-t2 is deposited. Sea level rises rapidlyand PII-t2. So, the final sedimentary motif preserved is a triplet PI/PII/t in older sequences, because of erosion during subsequent lowering ofn Rabineau et al. [54], using evidence from lithology, palynology,ence S5 together with seismic stratigraphy and numerical stratigraphic
128 M. Rabineau et al. / Earth and Planetary Science Letters 252 (2006) 119–137
interpreted seismic lines in 3D, we are able to definethe point where the shoreline is most well preservedand therefore to calculate RSL during glacial maximarelated to MIS 6,8,10 and 12 (Fig. 5 and Table 2).But those measurements need to be corrected from
Fig. 5. Seismic profiles (vertical cross sections) (A) P_1052; (B) P_1055 and (C(see position on Fig. 3). Vertical scale is twoway travel time inmilliseconds (leftscale in (C) is twice as small (but same vertical exaggeration). Conversions tsediments. Three kinds of seismic facies have been identified: in blue, low angle cmade up of sands (PII); in green dunesmade up of reworked sand (PIII). The pairthat repeats itself. The Major discontinuities are in red between sequences. On tpaired prisms PI–PII (blue-orange). But prism PII of S5 and prism PII of S4 havlimit and this step is not so steep.We interpret this geometry as due to erosion ofcontrary, PII of S4 is thick (reaching 40m)with a very steep step and verywell deOn the profile in B) the five sequences are identified. In this area, prism PII of S5Coast at LGM (bathymetry=0), it lies at −112 m below present day sea level (Ridentified. The interfluve Aude-Hérault is the only place where their prisms PI
the effect of subsidence. CSL=RSL− S, whereS=total subsidence.
At 69 km from the present coast, total subsidencerate is 245±10 m/Myr (see Section 5 and Table 2 fordetails). For MIS 2 (20 calendar-ka); this tilt reaches
) P_1036 through the outer shelf in the western area of theGolfe du Lionaxis) and depth inmeters (right axis) (A) and (B) are at the same scale; theo meters assume sound velocity of 1500 m/s in water and 1600 m/s inlinoformsmade up of silts and clays (PI); in yellow, high angle clinoformsed prismsPI–PII+(PIII) (blue-orange+green) form the sedimentarymotifhe profile in A) two sequences (S4 and S5) are clearly identified with thee different geometries. Prism PII of S5 is less than 10 m thick on its outerPII in this area (probably submarine erosion during transgression). On thefined and preserved sigmoïde shape.Here, prism PII has not been eroded.is very well preserved from erosion, its top and outer limit represents theSL=−112 m). On the profile in C) the two first sequences S1 and S2 areI (yellow) can be observed in this area.
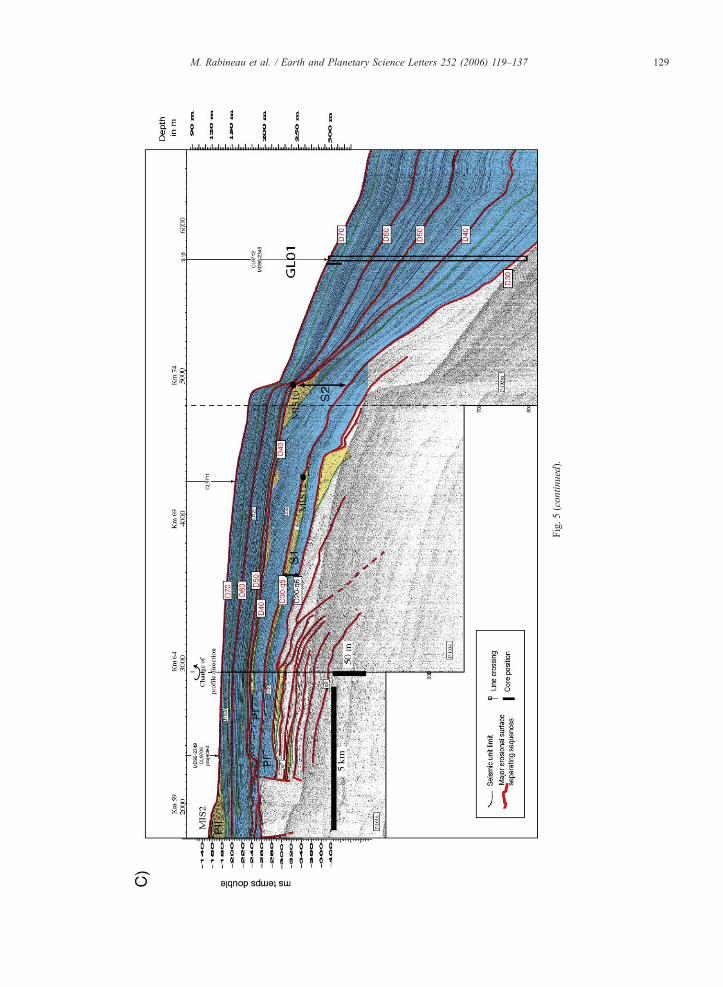
Fig.5(contin
ued).
129M. Rabineau et al. / Earth and Planetary Science Letters 252 (2006) 119–137
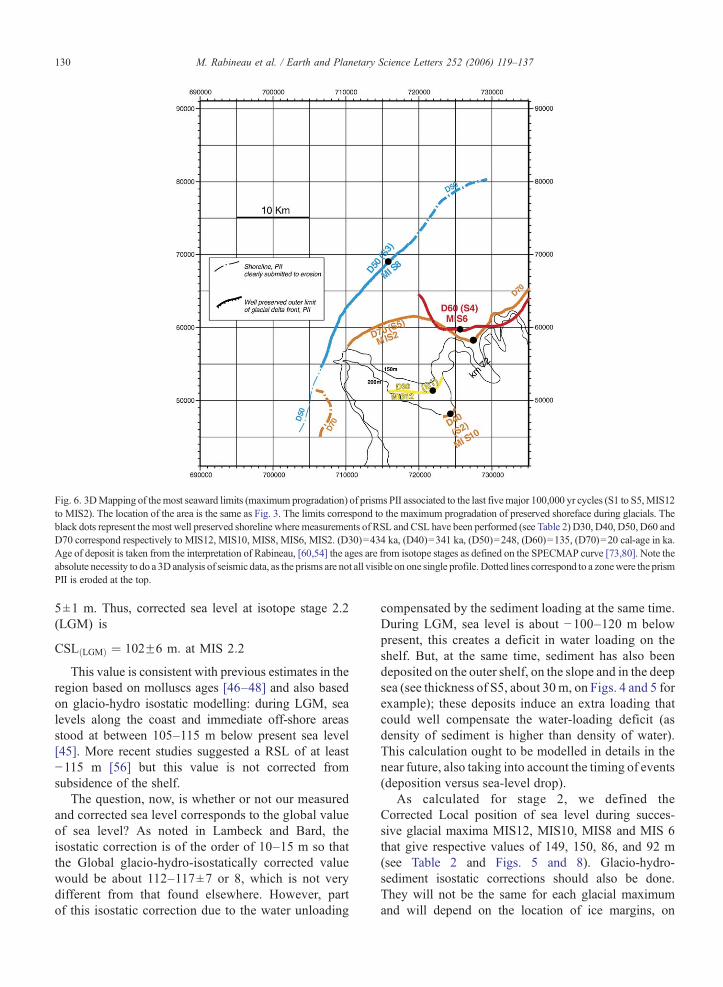
Fig. 6. 3DMapping of themost seaward limits (maximum progradation) of prisms PII associated to the last fivemajor 100,000 yr cycles (S1 to S5,MIS12to MIS2). The location of the area is the same as Fig. 3. The limits correspond to the maximum progradation of preserved shoreface during glacials. Theblack dots represent the most well preserved shoreline where measurements of RSL and CSL have been performed (see Table 2) D30, D40, D50, D60 andD70 correspond respectively to MIS12, MIS10, MIS8, MIS6, MIS2. (D30)=434 ka, (D40)=341 ka, (D50)=248, (D60)=135, (D70)=20 cal-age in ka.Age of deposit is taken from the interpretation of Rabineau, [60,54] the ages are from isotope stages as defined on the SPECMAP curve [73,80]. Note theabsolute necessity to do a 3Danalysis of seismic data, as the prisms are not all visible on one single profile.Dotted lines correspond to a zonewere the prismPII is eroded at the top.
130 M. Rabineau et al. / Earth and Planetary Science Letters 252 (2006) 119–137
5±1 m. Thus, corrected sea level at isotope stage 2.2(LGM) is
CSLðLGMÞ ¼ 102F6 m: at MIS 2:2
This value is consistent with previous estimates in theregion based on molluscs ages [46–48] and also basedon glacio-hydro isostatic modelling: during LGM, sealevels along the coast and immediate off-shore areasstood at between 105–115 m below present sea level[45]. More recent studies suggested a RSL of at least−115 m [56] but this value is not corrected fromsubsidence of the shelf.
The question, now, is whether or not our measuredand corrected sea level corresponds to the global valueof sea level? As noted in Lambeck and Bard, theisostatic correction is of the order of 10–15 m so thatthe Global glacio-hydro-isostatically corrected valuewould be about 112–117±7 or 8, which is not verydifferent from that found elsewhere. However, partof this isostatic correction due to the water unloading
compensated by the sediment loading at the same time.During LGM, sea level is about −100–120 m belowpresent, this creates a deficit in water loading on theshelf. But, at the same time, sediment has also beendeposited on the outer shelf, on the slope and in the deepsea (see thickness of S5, about 30 m, on Figs. 4 and 5 forexample); these deposits induce an extra loading thatcould well compensate the water-loading deficit (asdensity of sediment is higher than density of water).This calculation ought to be modelled in details in thenear future, also taking into account the timing of events(deposition versus sea-level drop).
As calculated for stage 2, we defined theCorrected Local position of sea level during succes-sive glacial maxima MIS12, MIS10, MIS8 and MIS 6that give respective values of 149, 150, 86, and 92 m(see Table 2 and Figs. 5 and 8). Glacio-hydro-sediment isostatic corrections should also be done.They will not be the same for each glacial maximumand will depend on the location of ice margins, on
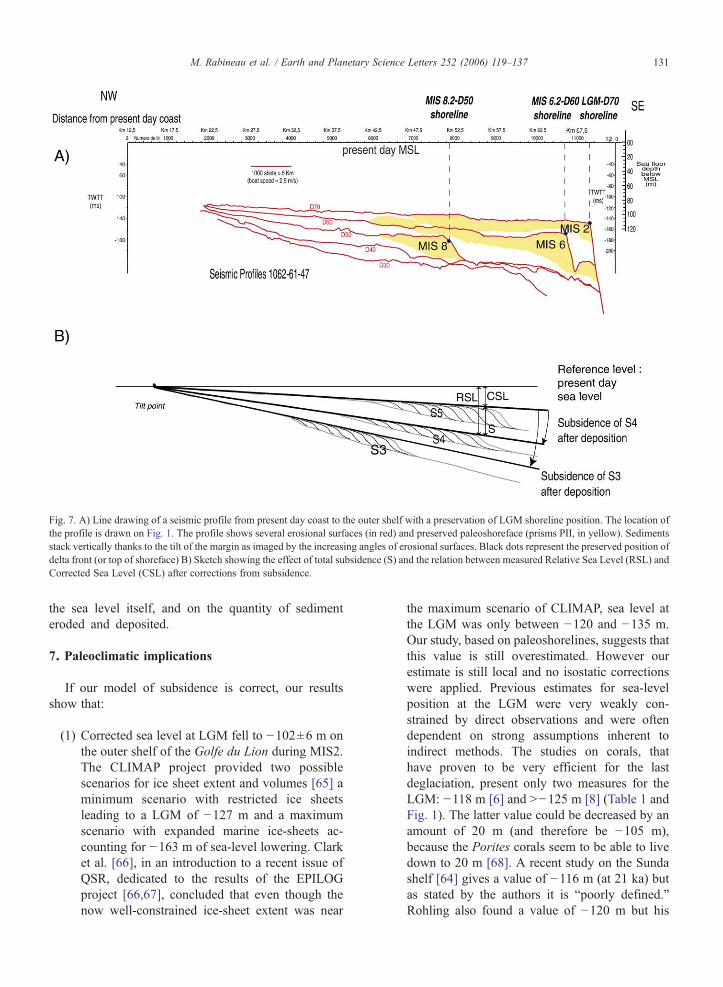
Fig. 7. A) Line drawing of a seismic profile from present day coast to the outer shelf with a preservation of LGM shoreline position. The location ofthe profile is drawn on Fig. 1. The profile shows several erosional surfaces (in red) and preserved paleoshoreface (prisms PII, in yellow). Sedimentsstack vertically thanks to the tilt of the margin as imaged by the increasing angles of erosional surfaces. Black dots represent the preserved position ofdelta front (or top of shoreface) B) Sketch showing the effect of total subsidence (S) and the relation between measured Relative Sea Level (RSL) andCorrected Sea Level (CSL) after corrections from subsidence.
131M. Rabineau et al. / Earth and Planetary Science Letters 252 (2006) 119–137
the sea level itself, and on the quantity of sedimenteroded and deposited.
7. Paleoclimatic implications
If our model of subsidence is correct, our resultsshow that:
(1) Corrected sea level at LGM fell to −102±6 m onthe outer shelf of the Golfe du Lion during MIS2.The CLIMAP project provided two possiblescenarios for ice sheet extent and volumes [65] aminimum scenario with restricted ice sheetsleading to a LGM of −127 m and a maximumscenario with expanded marine ice-sheets ac-counting for −163 m of sea-level lowering. Clarket al. [66], in an introduction to a recent issue ofQSR, dedicated to the results of the EPILOGproject [66,67], concluded that even though thenow well-constrained ice-sheet extent was near
the maximum scenario of CLIMAP, sea level atthe LGM was only between −120 and −135 m.Our study, based on paleoshorelines, suggests thatthis value is still overestimated. However ourestimate is still local and no isostatic correctionswere applied. Previous estimates for sea-levelposition at the LGM were very weakly con-strained by direct observations and were oftendependent on strong assumptions inherent toindirect methods. The studies on corals, thathave proven to be very efficient for the lastdeglaciation, present only two measures for theLGM: −118 m [6] and N−125 m [8] (Table 1 andFig. 1). The latter value could be decreased by anamount of 20 m (and therefore be −105 m),because the Porites corals seem to be able to livedown to 20 m [68]. A recent study on the Sundashelf [64] gives a value of −116 m (at 21 ka) butas stated by the authors it is “poorly defined.”Rohling also found a value of −120 m but his
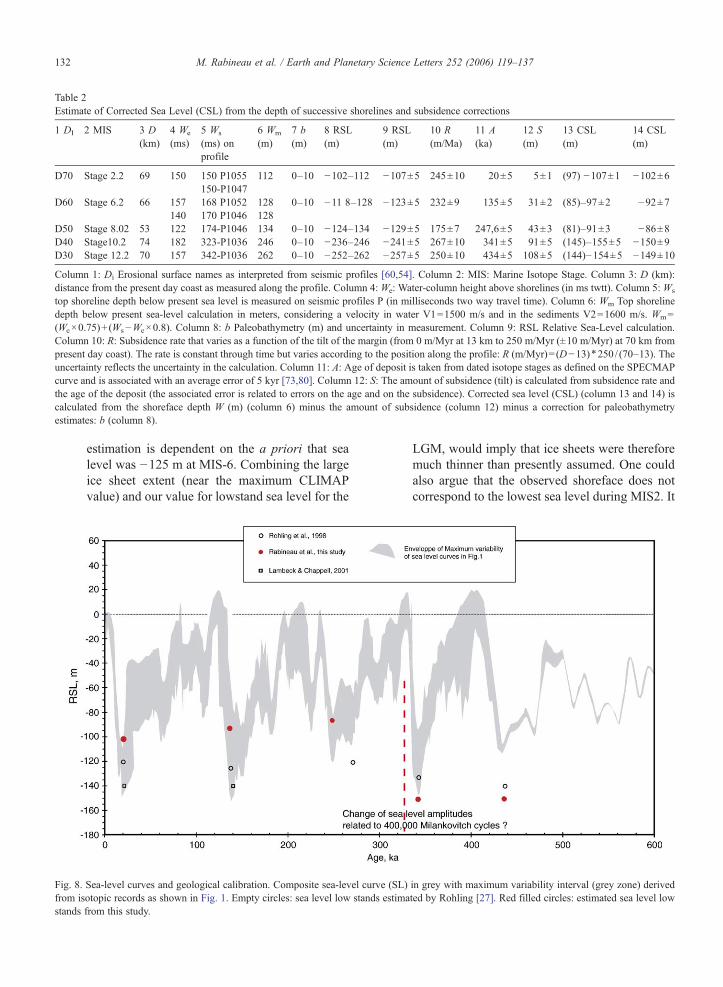
Table 2Estimate of Corrected Sea Level (CSL) from the depth of successive shorelines and subsidence corrections
1 DI 2 MIS 3 D(km)
4 We
(ms)5 Ws
(ms) onprofile
6 Wm
(m)7 b(m)
8 RSL(m)
9 RSL(m)
10 R(m/Ma)
11 A(ka)
12 S(m)
13 CSL(m)
14 CSL(m)
D70 Stage 2.2 69 150 150 P1055 112 0–10 −102–112 −107±5 245±10 20±5 5±1 (97) −107±1 −102±6150-P1047
D60 Stage 6.2 66 157 168 P1052 128 0–10 −11 8–128 −123±5 232±9 135±5 31±2 (85)–97±2 −92±7140 170 P1046 128
D50 Stage 8.02 53 122 174-P1046 134 0–10 −124–134 −129±5 175±7 247,6±5 43±3 (81)–91±3 −86±8D40 Stage10.2 74 182 323-P1036 246 0–10 −236–246 −241±5 267±10 341±5 91±5 (145)–155±5 −150±9D30 Stage 12.2 70 157 342-P1036 262 0–10 −252–262 −257±5 250±10 434±5 108±5 (144)−154±5 −149±10
Column 1: Di Erosional surface names as interpreted from seismic profiles [60,54]. Column 2: MIS: Marine Isotope Stage. Column 3: D (km):distance from the present day coast as measured along the profile. Column 4: We: Water-column height above shorelines (in ms twtt). Column 5: Ws
top shoreline depth below present sea level is measured on seismic profiles P (in milliseconds two way travel time). Column 6: Wm Top shorelinedepth below present sea-level calculation in meters, considering a velocity in water V1=1500 m/s and in the sediments V2=1600 m/s. Wm=(We×0.75)+ (Ws−We×0.8). Column 8: b Paleobathymetry (m) and uncertainty in measurement. Column 9: RSL Relative Sea-Level calculation.Column 10: R: Subsidence rate that varies as a function of the tilt of the margin (from 0 m/Myr at 13 km to 250 m/Myr (±10 m/Myr) at 70 km frompresent day coast). The rate is constant through time but varies according to the position along the profile: R (m/Myr)= (D−13)⁎250/ (70–13). Theuncertainty reflects the uncertainty in the calculation. Column 11: A: Age of deposit is taken from dated isotope stages as defined on the SPECMAPcurve and is associated with an average error of 5 kyr [73,80]. Column 12: S: The amount of subsidence (tilt) is calculated from subsidence rate andthe age of the deposit (the associated error is related to errors on the age and on the subsidence). Corrected sea level (CSL) (column 13 and 14) iscalculated from the shoreface depth W (m) (column 6) minus the amount of subsidence (column 12) minus a correction for paleobathymetryestimates: b (column 8).
132 M. Rabineau et al. / Earth and Planetary Science Letters 252 (2006) 119–137
estimation is dependent on the a priori that sealevel was −125 m at MIS-6. Combining the largeice sheet extent (near the maximum CLIMAPvalue) and our value for lowstand sea level for the
Fig. 8. Sea-level curves and geological calibration. Composite sea-level curvfrom isotopic records as shown in Fig. 1. Empty circles: sea level low standsstands from this study.
LGM, would imply that ice sheets were thereforemuch thinner than presently assumed. One couldalso argue that the observed shoreface does notcorrespond to the lowest sea level during MIS2. It
e (SL) in grey with maximum variability interval (grey zone) derivedestimated by Rohling [27]. Red filled circles: estimated sea level low
133M. Rabineau et al. / Earth and Planetary Science Letters 252 (2006) 119–137
is true that no detailed and absolute datation ofsuch shoreface is available so far, so that we donot prove that these levels are the lowest everreached during each glacials. However, we do notobserve shoreface at lower depth on the shelf.
(2) Corrected sea level during MIS6 on the outer shelfof the Golfe du Lion, is also much higher, −92±7 m, than usually assumed (around −125 m). Infact, sea level during MIS 6 is even more poorlyconstrained; most studies are indirect, mainlybased on oxygen isotopic data, which are not adirect function of sea level [69,1]. The study fromFerland et al., gives a sea-level drop to a depth lessthan 125 m because cores showed no evidence ofsubaerial erosion. No glacio-hydro isostatic mod-elling has ever been undertaken for MIS6, the icevolume of the Eurasian ice sheet may have beenlarger than during stage 2, this isostatic contribu-tion may also well have been larger and thecalculation needs to be done.
(3) Our local sea-level measurement on the outer shelfof the Golfe du Lion, imply important differencesin sea-level minima: MIS 2, 6, 8 are of the samemagnitude and the lowstands dropped to a muchlower value during MIS 10 and 12. This abruptchange occurs around 350-kyr and we suggest thatit could be related (together with the change incycles duration and magnitude at 800-kyr) to the400 kyr cycles associated with the excentricity ofthe Earth that have surprisingly rarely beenobserved in most paleoclimatic records [70].
(4) At MIS 10 and 12, sea level dropped to −150±9and −149±10 m respectively. Rohling [27] usinga very different and original method (extremehigh-salinity conditions recorded in cores fromthe Red Sea) also found greater glaciations duringMIS 10 and 12 (Table 2). Not taking into accountthe absolute value (based on the a priori that SLwas −125 at MIS6), Rohling found glaciations15 m greater during MIS10 and 12 compared toMIS6 (Fig. 8). Our lowstand estimates reflectmuch more extreme glaciations during MIS 10and MIS12 (60 m greater) than MIS6. Previousstudies always concluded that MIS 12 is moreintense than stage 10. Here, we found the sameorder of magnitude. One could argue that thesequence deposited during MIS 10 was totallyeroded, implying a misdating of the oldest twosequences which would then be older. However,this hypothesis would require an especiallyintense glaciation during MIS 8 in order toerode a complete sequence, for which there is no
present evidence (see Fig. 5C for example wheresequences are fully preserved on the upper slopeat the location of GL1 PROMESS core).
8. Conclusions
Knowledge of glacio-eustatic changes is essential forthe estimation of ice volumes, for a better understandingof the rates and amplitudes of glacial build-up and decay.
Direct field evidence gathered in the Golfe du Lion,gives a geological validation of 100,000 yr glacial–interglacial cycles, which are recorded by the prograda-tion–retrogradation of the shoreline as a consequence ofsea-level fluctuations. The record and preservation ofpaleoshorelines and shorefaces on the outer shelf correctedfrom the model of subsidence of the margin allow theassessment of sea-level lowering during successiveglaciations. We conclude that glaciations were muchmilder during MIS 8, 6, 2, with a drop of sea level smallerthan glaciations during MIS 10 and MIS 12 with a dropof sea level much higher than previously publishedestimates. These results are conditioned by our globalmodel for subsidence. As no detailed and absolutedatations of such shorefaces are available so far, wecannot prove that these levels are the lowest ever reachedduring each glacials.
We also suggest that the abrupt change in theseextreme glaciations recorded in the sedimentary patternof the Golfe du Lionmay mark the imprint of 400,000 yrcycles associated with orbital excentricity [70]. Wefurther raise the question: could the transition from40,000 to 100,000 yr cycles that occurred around800 kyr have the same origin ? Further attention needs tobe drawn to the 400,000 yr cycle and its consequenceson the Earth's climate.
The preliminary results of the very recent drillingPROMESS seem to be in agreement with all our resultsand validate our methodology. They also show that allsequences are preserved in the Golfe du Lion. Such arecord is outstanding on continental margins, theGolfe duLion is therefore a unique Laboratory to study sea level inrelation to paleoclimates, because of a subtle and rarecombination of factors (shelf width, high subsidence rate,sandy sediment flow but lower than in front of the Rhône,moderate wave energy, no tides). In our study, only theuppermost part of the sedimentary column in theGolfe duLion has been studied in detail. Deeper sediments need tobe explored and dated for sea-level research in order to testand extend our results further back in time and toinvestigate important events such as the onset of NorthernHemisphere glaciations (around 2.6 Ma). Our resultsprovide a step towards using sea-level minima from
134 M. Rabineau et al. / Earth and Planetary Science Letters 252 (2006) 119–137
continental margin sediment patterns to calibrate oxygenisotope data for the entire Plioquaternary.
We insist on the need to take into account subsidenceeffect (s.l.), which is important even in this tectonicallystable passive margin and relatively short time intervals(500,000 yr). If the subsidence did not exist, sequenceswould not be preserved, erosion during successivelowstands would completely erase previously depositedsequences (as this is the case on the shelf of the Bay ofBiscay margins during Quaternary for example). This isthe reason why this place, the Golfe du Lion, is unique.Preservation of sequences is only due to subsidence.Preservation of glacial shoreface is also due to the rapidrise in sea level after deposition. These observation andresults ought to be used for a detailed “glacio-hydro-sedimento” isostatic modelling of each sequence andeach glacial to further constraint local sea level versusglobal sea levels, and quantify, in particular the relativeeffect of glacio-hydro isostatic effect (which differaccording to ice sheet extend) but also of erosion–sedimentation isostatic effect (erosion on land anddeposition on the outer shelf and slope).
Acknowledgements
The final manuscript greatly benefited from thecomments and advices of Kurt Lambeck. We thankDavid Needham for fruitful discussions and a criticalreview of the manuscript. Didier Granjeon for guidanceand help on stratigraphic simulation. M. Rotuno, T.Marsset, G. Lericolais, J-F. Bourillet, J-L Rubino, F.Trincardi, for useful discussions at an early stage of thiswork; D. Paillard, E. Michel and C.Waelbroeck and J-C.Duplessy for advice on the manuscript and data onisotopic curves. E. Ledrezen for her long-term assis-tance. David Needham and Barbara Harris for their finalreview as English native speakers. This research wasmainly funded by IFREMER and CNRS. Additionalsupport comes from IFP (Christian Ravenne, RémiEschard), the French GDR Marges (French “Margins”programme) and from the European Community throughthe Eurostrataform (EVK3-CT-2002-00079) and Pro-mess 1 (EVR1-CT-2002-40024) projects. This is con-tribution 1014 to IUEM publication European InstituteforMarine Studies (Brest, France) and contribution 2172of French “GDR Marges” program.
Appendix A. Supplementary data
Supplementary data associated with this article canbe found, in the online version, at doi:10.1016/j.epsl.2006.09.033.
References
[1] N.J. Shackleton, Oxygen isotopes, ice volume and sea level,Quat. Sci. Rev. 6 (1987) 183–190.
[2] C. Waelbroeck, L.D. Labeyrie, E. Michel, J.-C. Duplessy, J.McManus, K. Lambeck, E. Balbon, M. Labracherie, Sea leveland deep water changes derived from benthic Foraminiferaisotopic record, Quat. Sci. Rev. 21 (1–3) (2002) 295–305.
[3] A.C. Mix, W.F. Ruddiman, Oxygen-isotope analyses andPleistocene ice volumes, Quat. Res. 21 (1) (1984) 1–20.
[4] R.G. Fairbanks, A 17,000-year glacio-eustatic sea level record:influence of glacial melting ates on the Younger Dryas event anddeep-ocean circulation, Nature 342 (1989) 637–642.
[5] E. Bard, B. Hamelin, R.G. Fairbanks, U–Th ages obtained bymass spectrometry in corals from Barbados: sea level during thepast 130,000 years, Nature 346 (1990) 456–458.
[6] E. Bard, B. Hamelin, M. Arnold, L. Montaggioni, G. Cabioch, G.Faure, F. Rougerie, Deglacial sea-level record form Tahiti coralsand the timing of global meltwater discharge, Nature 382 (1996)241–244.
[7] J. Chappell, A. Omura, T. Esat, M. McCulloch, J. Pandolfi, Y.Ota, B. Pillans, Reconciliation of late Quaternary sea levelsderived from coral terraces at Huon Peninsula with deep seaoxygen isotope records, Earth Planet. Sci. Lett. 141 (1996)227–236.
[8] E. Bard, M. Arnold, B. Hamelin, N. Tisnerat-Laborde, G.Cabioch, Radiocarbon calibration by means of mass spectromet-ric 230Th/234U and 14C ages of corals, An updated data baseincluding samples from Barbados, Mururoa and Tahiti, Radio-carbon 40 (3) (1998) 1085–1092.
[9] G.F. Camoin, L.F. Montaggioni, C.J.R. Braithwaite, Late glacialto post glacial sea levels in the Western Indian Ocean, Mar. Geol.206 (1_4) (2004) 119–146.
[10] K. Lambeck, Sea-level change along the French Atlantic andChannel coasts since the time of the Last Glacial Maximum,Palaeogeogr. Palaeoclimatol. Palaeoecol. 129 (1997) 1–22.
[11] Y. Yokoyama, K. Lambeck, D.D.P., P. Johnston, L.K. Fifield,Timing of the Last Glacial Maximum from observed sea-levelminima, Nature 406 (2000) 713–716.
[12] Y. Yokoyama, K. Lambeck, P. De Deckker, P. Johnston, L.K.Fifield, Timing of the Last Glacial Maximum from observed sea-level minima: correction, Nature 412 (2001) 99.
[13] M. Siddall, R.E. J., A. Almogi-Labin, C. Hemleben, D.Meischner, I. Schmelzer, D.A. Smeed, Sea-level fluctuationsduring the last glacial cycle, Nature 423 (2003) 853–858.
[14] M. Stein, G.J. Wasserburg, P. Aharon, J.H. Chen, Z.R. Zhu, A.Bloom, J. Chappell, TIMS U-series dating and stable isotopes ofthe Last Interglacial event in Papua New Guinea, Geochim.Cosmochim. Acta 57 (1993) 2541–2554.
[15] Z.R. Zhu, K.-H. Wyrwoll, L.B. Collins, J.H. Chen, G.J.Wasserburg, A. Eisenhauer, High-precision U-series dating ofLast Interglacial events by mass spectrometry: HoutmanAbrolhos Islands, western Australia, Earth Planet. Sci. Lett.118 (1–4) (1993) 281–293.
[16] C.D. Gallup, R.L. Edwards, R.G. Johnston, The timing of highsea levels over the past 200,000 years, Science 263 (1994)796–800.
[17] B.J. Szabo, K.R. Ludwig, D.R. Muhs, K.R. Simmons, Thorium-230 ages of corals and duration of the last interglacial sea-levelhigh stand on Oahu, Hawaii, Science 266 (1994) 93–96.
[18] C.H. Stirling, T.M. Esat, M.T. McCulloch, K. Lambeck, High-precision U-series dating of corals from western Australia and
135M. Rabineau et al. / Earth and Planetary Science Letters 252 (2006) 119–137
implications for the timing and duration of the Last Interglacial,Earth Planet. Sci. Lett. 135 (1995) 115–130.
[19] M.A. Toscano, J. Lundberg, Submerged Late Pleistocene reefs onthe tectonically-stable S.E. Florida margin: high precisiongeochronology, stratigraphy, resolution of Substage 5a sea-levelelevation, and orbital forcing, Quat. Sci. Rev. 18 (1999) 753–767.
[20] J. Chappell, Sea level changes force by ice breakouts in the LastGlacial cycle: new results from coral terraces, Quat. Sci. Rev. 21(2002) 1229–1240.
[21] K.B. Cutler, R.L. Edwards, F.W. Taylor, H. Cheng, J. Adkins, C.D.Gallup, P.M. Cutler, G.S. Burr, A.L. Bloom, Rapid sea-level fall anddeep-ocean temperature change since the last interglacial period,Earth Planet. Sci. Lett. 206 (2003) 253–271.
[22] E. Bard, F. Antonioli, S. Silenzi, Sea-level during the penultimateinterglacial period based on submerged stalagmite from Argenta-rola Cave (Italy), Earth Planet. Sci. Lett. 196 (3–4) (2002) 135–146.
[23] F. Antonioli, E. Bard, E.-K. Potter, S. Silenzi, S. Improta, 215-kaHistory of sea-level oscillations from marine and continentallayers in Argentarola Cave Speleothems (Italy), Glob. Planet.Change 43 (2004) 57–78.
[24] Y. Yokoyama, T.M. Esat, K. Lambeck, Coupled climate and sea-level changes deduced from Huon Peninsula, Papua NewGuinea, Earth Planet. Sci. Lett. 193 (2001) 579–587.
[25] Y. Yokoyama, T.M. Esat, K. Lambeck, Last Glacial sea-levelchange deduced from uplifted coral terraces of Huon Peninsula,Papua New Guinea, Quat. Int. 83–85 (2001) 275–283.
[26] K. Lambeck, J. Chappell, Sea level change through the LastGlacial Cycle, Science 292 (2001) 679–686.
[27] E.J. Rohling, M. Fenton, F.J. Jorissen, P. Bertrand, G. Ganssen, J.P.Caulet, Magnitudes of sea level lowstands of past 500,000 years,Nature 394 (1998) 162–165.
[28] G.F. Camoin, P. Ebren, A. Eisenhauer, E. Bard, G. Faure, A300,000-yr coral reef record of sea-level changes, Mururoa atoll(Tuamotu archipelago, French Polynesia), Palaeogeogr. Palaeo-climatol. Palaeoecol. 175 (2001) 325–341.
[29] M. Ferland, P. Roy, C. Murray-Wallace, Glacial lowstanddeposits on the outer continental shelf of Southeastern Australia,Quat. Res. 44 (1995) 294–299.
[30] C.E. Payton, Seismic stratigraphy – applications to hydrocarbonexploitation, Amer. Assoc. Petroleum Geol. Memoir, vol. 26,AAPG, Tulsa, Oklahoma, 1977, 516 pp.
[31] H.W. Posamentier, M.T. Jervey, P.R. Vail, Eustatic controls onclastic deposition I. Conceptual framework, in: C.K. Wilgus,B.S. Hastings, C.G.S.C. Kendall, H.W. Posamentier, C.A.Ross, J.C. Van Wagoner (Eds.), Sea-Level Changes-anIntegrated Approach, SEPM Spec. Pub., vol. 42, SEPM,Tulsa, 1988, pp. 102–124.
[32] H.W. Posamentier, P.R. Vail, Eustatic controls on clastic depositionII. Sequences and system tract models, in: C.K. Wilgus, B.S.Hastings, C.G.S.C. Kendall, H.W. Posamentier, C.A. Ross, J.C.Van Wagoner (Eds.), Sea-Level Changes-an Integrated Approach,SEPM Spec. Pub., vol. 42, SEPM, Tulsa, 1988, pp. 125–154.
[33] P.R. Vail, J.P. Colin, R.J. Du Chene, J. Kuchly, F. Mediavilla, V.Trifilieff, La stratigraphie séquentielle et son application auxcorrélations chronostratigraphiques dans le Jurassique du Bassinde Paris, Bull. Soc. Géol. Fr. 8 (7) (1987) 1301–1321.
[34] B.U. Haq, J. Hardenbol, P. Vail, Chronology of fluctuating sealevels since the Triassic (250 million years ago to present),Science 235 (1987) 1156–1167.
[35] B.U. Haq, J. Hardenbol, P. Vail, Mesozoic and Cenozoicchronostratigraphy and cycles of sea-level change, SEPMSpecial Publication, vol. 42, 1988, pp. 71–108.
[36] J. Hardenbol, J. Thierry, M.B. Farley, P.-C. de Graciansky, P.R.Vail, Mesozoic and Cenozoic sequence chronostratigraphicframework of European basins, in: P.-C. de Graciansky, J.Hardenbol, T. Jacquin, P.R.E. Vail (Eds.), Mesozoic andCenozoic Sequence Stratigraphy of European Basins, SEPM,Special Publication, vol. 60, 1998, pp. 11–18, Charts 11-18.
[37] IODP-IPSC, Earth, oceans and life, Scientific Investigation of theEarth System Using Multiple Drilling Platforms and NewTechnologies, 2001, 110 pp.
[38] J. Torres, B. Savoye, P. Cochonat, The effects of Late Quaternarysea-level changes on the Rhône slope sedimentation (northwesternMediterranean), as indicated by seismic stratigraphy, J. Sediment.Res., Sect. B Stratigr. Glob. Stud. 65 (3) (1995) 368–387.
[39] F. Trincardi, A. Correggiari, Quaternary forced-regressiondeposits in the Adriatic Basin and the record of composite sea-level cycles, in: D. Hunt, R. Gawthorpe (Eds.), SedimentaryResponses to Forced Regressions, vol. 134, Geological SocietySpecial Publication, London, 2000.
[40] A.E. Aksu, T.J. Calon, D.J.W. Piper, S. Turgut, E. Izdar,Architecture of late orogenic Quaternary basins in the northeast-ern Mediterranean Sea, Tectonics 210 (1992) 191–213.
[41] J.A. Berry, D.J.W. Piper, Seismic stratigraphy of the Scotia Rise:record of continental margin glaciation, Geo Mar. Lett. 13 (1993)197–206.
[42] K.I. Skene, D.J.W. Piper, A.E. Aksu, J.P.M. Syvitski, Evaluationof the global oxygen isotope curve as a proxy for Quaternary sealevel by modeling of delta progradation, J. Sediment. Res. 68 (6)(1998) 1077–1092.
[43] J.L. Olivet, La cinematique de la plaque Iberique | Kinematics ofthe Iberian Plate, Bull. Cent. Rech. Explor. Prod. Elf-Aquitaine20 (1) (1996) 131–195.
[44] F. Speranza, I.M. Villa, L. Sagnotti, F. Florindo, D. Cosentino, P.Cipollari, M. Matei, Age of the Corsica-Sardinia rotation andLiguro-Provencal Basin spreading: new paleomagnetic and Ar/Ar evidence, Tectonophysics 347 (4) (2002) 231–251.
[45] K. Lambeck, E. Bard, Sea-level change along the FrenchMediterranean coast fro the past 30000 years, Earth Planet.Sci. Lett. 175 (2000) 203–222.
[46] J.C. Aloïsi, A. Monaco, J. Thommeret, Y. Thommeret, Evolutionpaléogéographique du plateau continental languedocien dans lecadre du golfe du Lion; Analyse comparée des données sismiques,sédimentologiques et radiométriques concernant le Quaternairerécent, Rev. Géogr. Phys. Géol. Dyn. 17 (1) (1975) 13–22.
[47] J. Labeyrie, C. Lalou, A. Monaco, J. Thommeret, Chronologiedes niveaux eustatiques sur la côte du Roussillon de-33000 ansB.P. à nos jours, C. R. Acad. Sci. Paris 282 (1976) 349–352.
[48] J.C. Aloïsi, Sea Level Variations on the French MediterraneanMargin during the Holocene, Paleoclimate Research; Paläklima-forshung n°spec, 1993, 25 pp.
[49] S. Berné, D. Carré, B. Loubrieu, J.-P. Mazé, A. Normand, Cartemorphobathymétrique du Golfe du Lion à l' échelle 1/100 000ème (2001), IFREMER et Région Languedoc Roussillon, Brest.
[50] B. Gensous, D. Williamson, M. Tesson, Late-Quaternarytransgressive and highstand deposits of a deltaic shelf (Rhônedelta, France), in: H.W. Posamentier, C.P. Summerhayes, B.A.Haq, G.P. Allen (Eds.), Sequence Stratigraphy and FaciesAssociations, International Association of SedimentologistsSpec. Pub., vol. 18, Blackwell, Oxford, 1993, pp. 97–212.
[51] T. Marsset, V. Bellec, Late Pleistocene–Holocene deposits of theRhône inner continental shelf (France): detailed mapping andcorrelation with previous continental and marine studies,Sedimentology 49 (2002) 255–276.
136 M. Rabineau et al. / Earth and Planetary Science Letters 252 (2006) 119–137
[52] S. Berné, J.C. Aloïsi, J. Baztan, B. Dennielou, L. Droz, T. DosReis, J. Lofi, Y. Méar, M. Rabineau, Notice de la carte morpho-bathymétrique du Golfe du Lion, vol. 1, IFREMER et RégionLanguedoc Roussillon, Brest, 2002, 48 pp.
[53] J.C. Aloïsi, H. Got, A. Monaco, C. Duboul-Razavet, Cartegéologique du précontinent pyrénéo-languedocien au 1/250 000(1973) pp., Musée Océanographique de Monaco.
[54] M. Rabineau, S. Berne, D. Aslanian, J.-L. Olivet, P. Joseph, F.Guillocheau, J.-F. Bourillet, E. Ledrezen, D. Granjeon, Sedi-mentary sequences in the Gulf of Lion: a record of 100,000 yearsclimatic cycles, Mar. Pet. Geol. 22 (6–7) (2005) 775–804.
[55] P. Bernier, S. Berné, M. Rabineau, J. Baztan, Les Pierres de Sète :un indicateur paléobathymétrique et paléoenvironnemental,Atelier Golfe du Lion du GDR Marges, 2000, pp. 8, Paris.
[56] G. Jouet, S. Berné, M. Rabineau, M.-A. Bassetti, P. Bernier, B.Dennielou, Flores-Jose-Abel, Sierro-Francisco-Javier and M.Taviani, Shoreface migrations at the shelf edge and sea-levelchanges around the Last Glacial Maximum (Gulf of Lions, NWMediterranean), Mar. Geol. (in press).
[57] M.-A. Bassetti, G. Jouet, F. Dufois, S. Berné, M. Rabineau, M.Taviani, De-glacial sedimentary processes and deposits in theouter continental shelf of the Gulf of Lions (western Mediter-ranean), Mar. Geol. (in press).
[58] S. Berné, G. Lericolais, T. Marsset, J.F. Bourillet, M. de Batist,Erosional offshore sand ridges and lowstand shorefaces:examples from tide and wave dominated environments ofFrance, J. Sediment. Res. 68 (4) (1998) 540–555.
[59] M. Rabineau, S. Berné, E. Ledrezen, G. Lericolais, T. Marsset,M. Rotunno, 3D architecture of lowstand and transgressiveQuaternary sand bodies on the outer shelf of the Gulf of Lion,France, Mar. Pet. Geol. 15 (5) (1998) 439–452.
[60] M. Rabineau, Un modèle géométrique et stratigraphique desséquences de dépôts quaternaires de la plate-forme du Golfe duLion : enregistrement des cycles glacioeustatiques de 100 000ans, Thèse de Doctorat, Université de Rennes 1, IFREMER andIFP, (2001), (392+ 370) p. (392 vols), http://www.ifremer.fr/docelec.
[61] E. Colmenero-Hidalgo, J. Gravalosa, J.-A. Flores, F.-J. Sierro, S.Berne, M. Canals, A. Cattaneo, G. Floch, B. Dennielou, J.Frigola, R. Gelfort, D. Ridente, T. Schoolmeester, N. Sultan, G.Tulloch, H.-J. Wallrabe-Adams, PROMESS 1 preliminaryresults; new high resolution coccolithophore records for the lasthalf million years, J. Nannoplankton Res. 26 (2) (2004) 22.
[62] B. De Voogd, R. Nicolich, J.L. Olivet, F. Fanucci, J. Burrus, A.Mauffret, G. Pascal, A. Argnani, J.M. Auzende, M. Bernabini, C.Bois, L. Carmignani, A. Fabbri, I. Finetti, A. Galdeano, C.Y.Gorini, P. Labaume, D. Lajat, P. Patriat, B. Pinet, J. Ravat, F.Ricci Lucchi, S. Vernassa, First deep seismic reflection transectfrom the Gulf of Lions to Sardinia (ECORS-CROP profiles inWestern Mediterranean), in: R. Meissner (Ed.), ContinentalLithosphere: Deep Seismic Reflections, Geodynamic Series,vol. 22, American Geophysical Union, 1991, pp. 265–274.
[63] C. Gorini, A. Mauffret, P. Guennoc, A. Le Marrec, Structure ofthe Gulf of Lions (Northwestern Mediterranean Sea), in: A.Mascle (Ed.), Hydrocarbon and Petroleum Geology of France,Springer-Verlag, Berlin, 1994, pp. 223–243.
[64] T. Hanebuth, K. Stattegger, P.M. Grootes, Rapid flooding of theSunda Shelf: a Late-Glacial sea-level record, Science 288 (2000)1033–1035.
[65] P.M. Climap, Seasonal Reconstruction of the Earth's Surface atthe Last Glacial Maximum, Geological Society of America Mapand Chart Series, vol. 36, 1981.
[66] P.U. Clark, A.C. Mix, E. Bard, Ice sheets and sea level of the LastGlacial Maximum, EOS Transactions (2001) 241-246-247.
[67] A.C. Mix, E. Bard, R. Schneider, Environmental processes of theice age: land, oceans, glaciers (EPILOG), Quat. Sci. Rev. 20(2001) 627–657.
[68] Y. Yokoyama, P. De Deckker, K. Lambeck, P. Johnston, L.K. Fifield,Sea-level at Last Glacial Maximum: evidence from northwesternAustralia to constrain ice volumes for oxygen isotope stage 2,Palaeogeogr. Palaeoclimatol. Palaeoecol. 165 (2001) 281–297.
[69] J. Chappell, N.J. Shackleton, Oxygen isotopes and sea level,Nature 324 (6093) (1986) 137–140.
[70] D. Paillard, Glacial cycles: toward a new paradigm, Rev.Geophys. 39 (3) (2001) 325–346.
[71] L.D. Labeyrie, Variations in mode of formation and temperatureof oceanic deep waters over the past 125,000 years, Nature 327(6122) (1987) 477–482.
[72] N.J. Shackleton, The 100,000-year Ice-Age cycle found to lagtemperature, carbon dioxide, and orbital eccentricity, Science 289(2000) 1897–1902.
[73] J. Imbrie, J.D. Hays, D.G. Martinson, A. McIntyre, A.C. Mix, J.J.Morley, N.G. Pisias, W.L. Prell, N.J. Shackleton, The orbitaltheory of Pleistocene climate: support from a revised chronologyof the marine δ O18 record, in: A. Berger, J. Imbrie, J. Hays, G.Kukla, B. Saltzman (Eds.), Milankovitch and climate. Series C:Mathematical and Physical Sciences, vol. 126, Kluwer AcademicPublishers, Hingham, Mass., 1984, pp. 269–305.
[74] F. Bassinot, L. Labeyrie, E. Vincent, X. Quidelleur, N.J.Lancelot, Y. Lancelot, The astronomical theory of climate andthe age of the Brunhes-Matuyama magnetic reversal, EarthPlanet. Sci. Lett. 126 (1994) 91–108.
[75] J. Ehlers, Quaternary and Glacial Geology, 1996 578 pp.[76] E. Chapron, Contrôle climatique et sismo-tectonique de la
sédimentation lacustre dans l'avant-pays alpin (Lac du Bourget)durant le Quaternaire récent, 1999, 261 pp.
[77] P. Antoine, J.L. De Beaulieu, P. Bintz, J.P. Brugal, M. Girard, J.L.Guadelli, M.T. Morzadec-Kerfourn, J. Renault-Miskovsky, A.Roblin-Jouve, B. Schmider, B. Van Vliet-Lanoe, J.D. Vigne, Lafrance pendant les deux derniers extrêmes climatiques, variabiliténaturelle des environnements, 1999, 59 pp.
[78] B. Gensous, M. Tesson, M. Arnold, Analyse en stratigraphieséquentielle des dépôts pléistocènes de la plateforme orientale duRhône (France): confrontation de l'analyse sismique et desdonnées de terrain, C. R. Acad. Sci. Paris 317 (1993) 803–810.
[79] S. Berné, B. Loubrieu, and the shipboard scientific party,Canyons et processus sédimentaires récents sur la marge duGolfe du Lion occidental. Premiers résultats de la compagneCALMAR. Canyons and recent sedimentary processes on thewestern Gulf of Lions margin. First results of the Calmar cruise,C. R. Acad. Sci. Paris 328 (1999) 471–477.
[80] D.G. Martinson, N.G. Pisias, J.D. Hays, J. Imbrie, T.C. Moore Jr.,N.J. Shackleton, Age dating and the orbital theory of the ice ages:development of a high-resolution 0 to 300,000-year chronos-tratigraphy, Quat. Res. 27 (1987) 1–29.
[81] T. Hughes, G.H. Denton, M.G. Grosswald, Was there a lateWürm Artic ice sheet? Nature 266 (5603) (1977) 596–602.
[82] K. Lambeck, Y. Yokoyama, A. Purcell, Into and out of the LastGlacial Maximum: sea-level change during the Oxygen Isotope 3and 2, Quat. Sci. Rev. 21 (2002) 343–360.
[83] K. Fleming, P. Johnston, D. Zwartz, Y. Yokoyama, K. Lambeck,J. Chappell, Refining the eustatic sea-level curve since the LastGlacial Maximum using far-and intermediate-field sites, EarthPlanet. Sci. Lett. 163 (1998) 327–342.
137M. Rabineau et al. / Earth and Planetary Science Letters 252 (2006) 119–137
[84] W.R. Peltier, Ice age paleotopography, Science 265 (1994) 195–201.[85] W.R. Peltier, On eustatic sea level history: last Glacial Maximum
to Holocene, Quat. Sci. Rev. 2 (2002) 377–396.[86] W.R. Peltier, Comments on the paper of Yokoyama et al. (2000),
entitled “Timing of the Last Glacial Maximum from observed sealevel minima”, Quat. Sci. Rev. 21 (2002) 409–414.
[87] G.A. Milne, J.X. Mitrovica, D.P. Schrag, Estimating pastcontinental ice volume from sea-level data, Quat. Sci. Rev. 21(2002) 361–376.
[88] I. Shennan, G.A. Milne, Sea-level observations around the LastGlacial Maximum from the Bonaparte Gulf, NWAustralia, Quat.Sci. Rev. 22 (2003) 1543–1547.


![@_ YR]WhRj ^R[`c 4RSZ_Ve cV[ZX e`URj - Daily Pioneer](https://static.fdokumen.com/doc/165x107/631f50b94573ad0c3e030007/-yrwhrj-rc-4rszve-cvzx-eurj-daily-pioneer.jpg)