Mass-balance reconstruction of a modern Vertisol: Implications for interpreting the geochemistry and...
26
Ž . Geoderma 95 2000 179–204 Mass-balance reconstruction of a modern Vertisol: implications for interpreting the geochemistry and burial alteration of paleo-Vertisols Steven G. Driese a, ) , Claudia I. Mora a , Cynthia A. Stiles a , R.M. Joeckel b , Lee C. Nordt c a Department of Geological Sciences, UniÕersity of Tennessee, KnoxÕille, TN 37996-1410, USA b Department of Natural Sciences, BelleÕue UniÕersity, BelleÕue, NE 68005-3098, USA c Department of Geology, Baylor UniÕersity, Waco, TX 76798-7354, USA Received 19 October 1998; received in revised form 26 May 1999; received in revised form 25 August 1999; accepted 31 August 1999 Abstract Utilizing identical sampling and analytical techniques, the morphological and chemical charac- Ž . teristics of a modern Vertisol Houston Black series, central Texas can be directly compared with Ž an Upper Mississippian paleo-Vertisol from the Appalachian basin Pennington Formation, . east-central Tennessee . Mass-balance reconstructions suggest retention of primary pedochemical Ž . patterns in the paleo-Vertisol, including patterns of soil volume change strain and transport Ž . functions translocations of many major and trace elements. Retention of primary pedochemical patterns suggests that Vertisols constitute nearly closed systems during burial diagenesis. Chemi- cal and mineralogical changes associated with burial diagenesis of the paleo-Vertisol include Ž . oxidation of organic carbon OC , illitization of smectites, dehydration and recrystallization of Fe–Mn oxyhydroxides, and dolomitization of pedogenic calcite. Significant differences in the chemical behavior of gilgai microhigh and microlow pedons in modern Vertisols have implica- tions for interpretation of geochemical data obtained from paleo-Vertisols. Overall wetter soil conditions and variable redox potential under gilgai microlows promote greater depths of leaching and mobility of redox-sensitive trace elements, including Co, Cr, Cu, Mn, Ni, and V. Gilgai microhighs behave as evaporative ‘‘wicks’’ that draw moisture and soluble phases towards the Ž . soil surface, resulting in precipitation of metal hydrosylate complexes and sulfates gypsum at the capillary fringe and shallower depths of leaching and fixation of trace elements. Paleoprecipitation ) Corresponding author. Tel.: q 1-423-974-6002; Fax: q 1-423-974-2368. Ž . E-mail address: [email protected] S.G. Driese . 0016-7061r00r$ - see front matter q 2000 Elsevier Science B.V. All rights reserved. Ž . PII: S0016-7061 99 00074-9
Transcript of Mass-balance reconstruction of a modern Vertisol: Implications for interpreting the geochemistry and...
Ž .Geoderma 95 2000 179–204
Mass-balance reconstruction of a modern Vertisol:implications for interpreting the geochemistry and
burial alteration of paleo-Vertisols
Steven G. Driese a,), Claudia I. Mora a, Cynthia A. Stiles a,R.M. Joeckel b, Lee C. Nordt c
a Department of Geological Sciences, UniÕersity of Tennessee, KnoxÕille, TN 37996-1410, USAb Department of Natural Sciences, BelleÕue UniÕersity, BelleÕue, NE 68005-3098, USA
c Department of Geology, Baylor UniÕersity, Waco, TX 76798-7354, USA
Received 19 October 1998; received in revised form 26 May 1999; received in revised form 25August 1999; accepted 31 August 1999
Abstract
Utilizing identical sampling and analytical techniques, the morphological and chemical charac-Ž .teristics of a modern Vertisol Houston Black series, central Texas can be directly compared with
Žan Upper Mississippian paleo-Vertisol from the Appalachian basin Pennington Formation,.east-central Tennessee . Mass-balance reconstructions suggest retention of primary pedochemical
Ž .patterns in the paleo-Vertisol, including patterns of soil volume change strain and transportŽ .functions translocations of many major and trace elements. Retention of primary pedochemical
patterns suggests that Vertisols constitute nearly closed systems during burial diagenesis. Chemi-cal and mineralogical changes associated with burial diagenesis of the paleo-Vertisol include
Ž .oxidation of organic carbon OC , illitization of smectites, dehydration and recrystallization ofFe–Mn oxyhydroxides, and dolomitization of pedogenic calcite. Significant differences in thechemical behavior of gilgai microhigh and microlow pedons in modern Vertisols have implica-tions for interpretation of geochemical data obtained from paleo-Vertisols. Overall wetter soilconditions and variable redox potential under gilgai microlows promote greater depths of leachingand mobility of redox-sensitive trace elements, including Co, Cr, Cu, Mn, Ni, and V. Gilgaimicrohighs behave as evaporative ‘‘wicks’’ that draw moisture and soluble phases towards the
Ž .soil surface, resulting in precipitation of metal hydrosylate complexes and sulfates gypsum at thecapillary fringe and shallower depths of leaching and fixation of trace elements. Paleoprecipitation
) Corresponding author. Tel.: q1-423-974-6002; Fax: q1-423-974-2368.Ž .E-mail address: [email protected] S.G. Driese .
0016-7061r00r$ - see front matter q 2000 Elsevier Science B.V. All rights reserved.Ž .PII: S0016-7061 99 00074-9
( )S.G. Driese et al.rGeoderma 95 2000 179–204180
estimates from paleosols, based on the depth to the top of the pedogenic carbonate horizon, shouldtherefore utilize field, petrographic and geochemical data for characterizing maximum depths ofleaching, loss or gain of exchangeable bases, and calcification, rather than relying solely uponfield data. q 2000 Elsevier Science B.V. All rights reserved.
Keywords: Vertisol; Paleo-Vertisol; mass-balance reconstruction; geochemistry; paleosol diagene-sis
1. Introduction
ŽAlthough Vertisols constitute only about 2% of the world’s soils today Dudal.and Eswaran, 1988 , Paleozoic redbed deposits throughout the Appalachian
basin stratigraphic succession contain clay-rich paleosols interpreted as analo-Ž .gous to Vertisols Mora and Driese, 1999 . The high cohesion and bulk density
Ž .of Vertisols Soil Survey Staff, 1994; Coulombe et al., 1996 may lead to theirŽpreferential preservation in ancient stratigraphic sequences Caudill et al., 1997;
.Mora and Driese, 1999 . Although many excellent summaries of the pedogenicprocesses, and physical, chemical and mineralogical properties of modern
ŽVertisols are available Newman, 1986; Wilding and Puentes, 1988; Ahmad and.Mermut, 1996 , many of the sampling and analytical approaches routinely
employed by pedologists cannot be directly applied to, or interpreted in,Ž .geological i.e., rock studies of paleo-Vertisols. Geological studies must further
consider physical and geochemical changes attending burial diagenesis andŽ .lithification of paleosols Retallack, 1990, 1991 . As a result, it is often difficult
for geologists, who seek to interpret the ancient record of climates and surfaceenvironments recorded by paleosols, to translate the considerable amount ofphysical and chemical data available on modern soils. The principal objectives
Ž .of this study are to: 1 determine residual weathering patterns, expressed asgeochemical trends, of a modern Vertisol utilizing sampling, analytical and
Ž .interpretive techniques typical of paleosol studies, and 2 compare a range ofthe modern Vertisol pedochemical characteristics with geochemical properties of
Ž .a Paleozoic Upper Mississippian paleo-Vertisol from the Appalachian basinŽ .Caudill et al., 1992, 1996, 1997 .
A characteristic feature of many modern Vertisols is the occurrence of surfacehummock and swale topography known as gilgai. Relief between microhigh andmicrolow areas typically ranges from 10 to 30 cm, with 2–7 m lateral spacingsbetween adjacent microhighs; the microrelief is related to lateral displacement of
Žsoil material in response to seasonal shrink–swell processes Newman, 1986;. Ž .Soil Survey Staff, 1994 . Wilding et al. 1991 summarized morphological,
physical, and chemical variability between microhigh and microlow topographicŽelements of gilgai in two Vertisols from Texas Houston Black and Lake
.Charles series . Distinct differences in the chemical and hydrological behavior
( )S.G. Driese et al.rGeoderma 95 2000 179–204 181
of gilgai microhighs and microlows during pedogenesis may continue into soildiagenesis. The third objective of this study is to consider the implications ofvariations in chemistry controlled by gilgai topography on interpretation ofpaleosol paleoenvironment.
2. Materials and methods
2.1. Vertisol
Ž .In mid-June of 1995, the US Natural Resource Conservation Service NRCS ,in conjunction with researchers from Texas A&M University and the Universityof Tennessee, excavated two large pits in a Vertisol assigned to the Houston
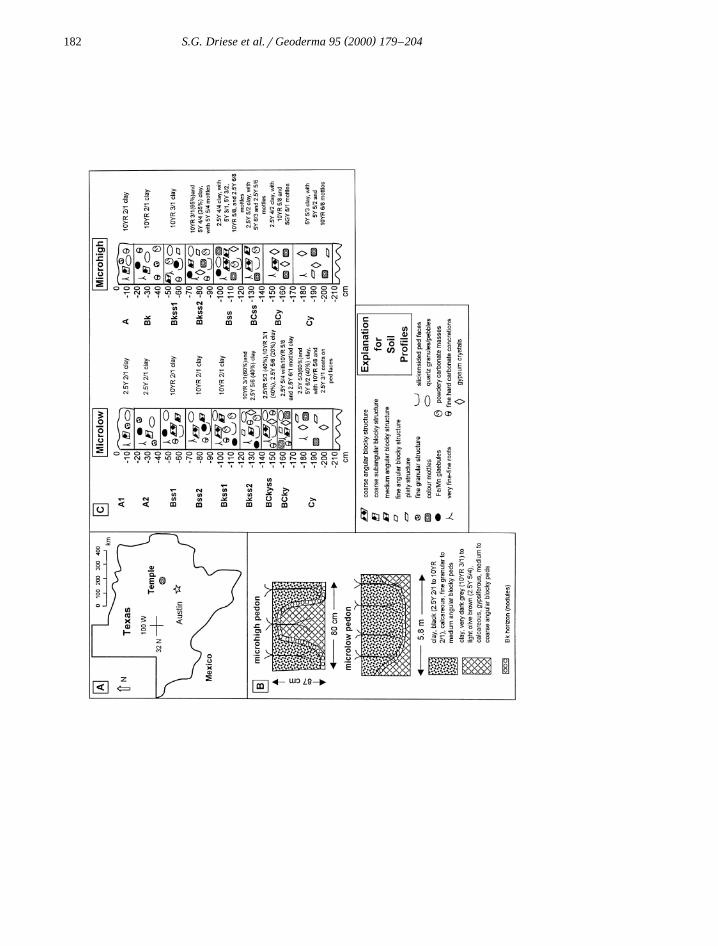
Ž .Black series, in Bell County, near Temple, TX Fig. 1A . Two pedons wereŽmeasured using standard pedological techniques Soil Survey Staff, 1994; Fig.
.1B,C . Bulk samples were collected at 10-cm intervals along vertical profilesthrough a gilgai microhigh and a laterally adjacent microlow.
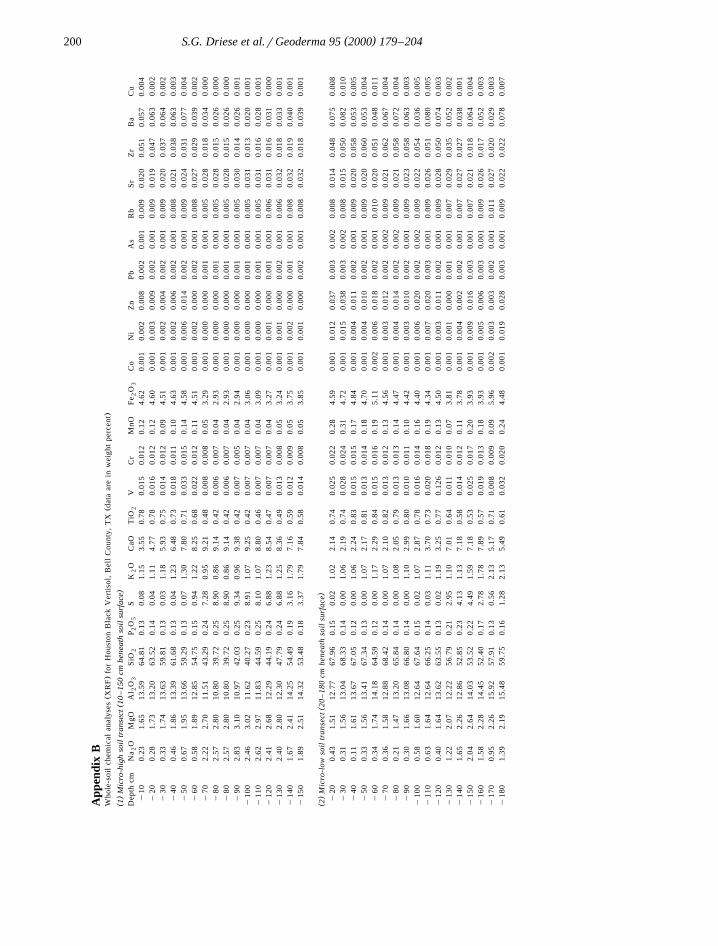
After manual removal of macroscale organic matter and oven drying at 608C,pressed pellets were prepared from bulk, powdered soil samples and analyzedfor selected major, minor and trace elements using an EG&G ORTEC TEFA III
Ž . Ž .tube-excited X-ray fluorescence XRF analyzer Singer and Janitzky, 1986 .The XRF analytical protocol employed appropriate high-sulfur clay soil andshale standards and reports major elements in oxide weight percent and traceelements in parts per million. Bulk density was determined by paraffin coating
Ž . Ž .of air-dried soil clods Blake and Hartge, 1986 . Bulk organic carbon OC wasdetermined by combustion using a Leco CNS-2000 Analyzer and bulk inorganic
Ž . Žcarbon IC was determined by weight loss after dissolution in HCl Williams,.1948 . Precise locality information, bulk density and all soil and paleosol
chemical analyses are provided in Appendices A–C that may be accessed athttp: rr geoweb.gg.utk.edurutk geosciencesr paleopedologyr paleopedology– –home.htm, or are available from the authors.
2.2. Paleo-Vertisol
Sampling and analytical procedures were essentially identical for a paleo-Ž .Vertisol Late Mississippian exposed in outcrop near Monterey, TN, except that
the XRF protocol utilized high-iron clay soil and shale standards and bulk OCŽ .and IC were not measured due to low concentrations of OC Mora et al., 1996
Žand to the pervasive dolomite replacement of the pedogenic calcite Caudill et.al., 1992 . Paleopedology and micromorphology of the paleosol were previously
Ž .reported in Caudill et al. 1992, 1996 and are not reported here.
( )S.G. Driese et al.rGeoderma 95 2000 179–204182
( )S.G. Driese et al.rGeoderma 95 2000 179–204 183
2.3. ConstitutiÕe mass-balance reconstruction
Ž . Ž .Whole-soil Vertisol and whole-rock paleo-Vertisol XRF chemical dataŽwere evaluated using a mass-balance approach, following Brimhall et al. 1988,
. Ž .1991a,b . This approach evaluates chemical variations in a soil due to: 1 theclosed-system effects of residual enrichment and volumetric changes in the soil
Ž .matrix, and 2 open-system transport of material into or out of the soil. Thesevalues can be characterized without making a direct volume measurement; onlyelement concentration and bulk density measurements are necessary. The readeris referred to the original papers for complete development of pertinent equa-tions.
The choice of representative parent material is a critical aspect of mass-bal-ance reconstructions and can be a particular problem for studies of Vertisols,which may develop in fining-upward sediments, and in environments withcumulative sediment influx and pedogenesis. A number of approaches can beemployed to define the original material, including use of the unweatheredC-horizon material, or determining average bulk compositions of similar, un-weathered sedimentary packages in the same geologic sequence. Mass-balancereconstructions may still be useful to define relative trends of depletion or
Ž .enrichment in a particular class of paleo soils, even if the magnitude of changeis not well-constrained because of uncertainty in the composition of parentmaterial.
Residual enrichment is a measure of the in situ concentration of an elementdue to removal of more mobile constituents and is evaluated as a function ofbulk density:
C rj,w ps
C rj,p w
where C is the concentration of element j, in the weathered material, C isj,w j,p
the concentration of j in the parent material, and r and r are the bulkp w
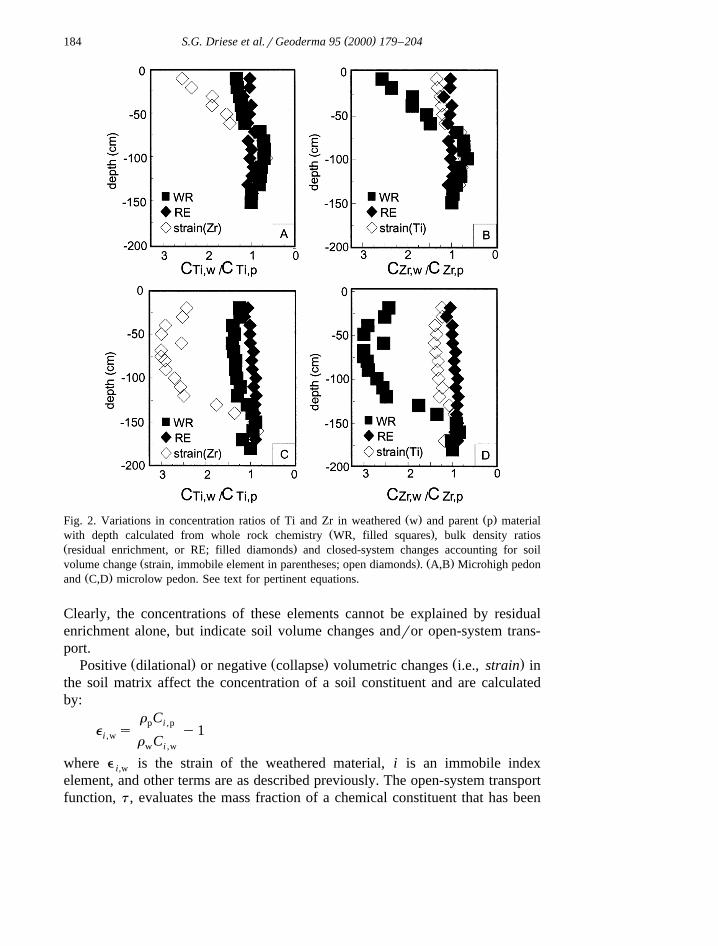
densities of the parent and weathered material, respectively. In Fig. 2A–D bulkdensity ratios for the modern soil pedons are compared to concentration ratios ofZr and Ti, two elements commonly assumed to be immobile during pedogenesis.
Ž .Fig. 1. A Location of pit in Houston Black soil series near Temple, Bell County, TX. SeeŽ .Appendix A for more precise locality information. B Generalized sketches of gilgai microhigh
Ž .and gilgai microlow pedons exposed in pit in modern Vertisol. C Schematic sections illustratingŽ .properties of gilgai microhigh and microlow pedons illustrated in B , based on field descriptions
and supplemented by micromorphology. Horizon designations shown on left of each column. Seelegend for definition of symbols.
( )S.G. Driese et al.rGeoderma 95 2000 179–204184
Ž . Ž .Fig. 2. Variations in concentration ratios of Ti and Zr in weathered w and parent p materialŽ .with depth calculated from whole rock chemistry WR, filled squares , bulk density ratios
Ž .residual enrichment, or RE; filled diamonds and closed-system changes accounting for soilŽ . Ž .volume change strain, immobile element in parentheses; open diamonds . A,B Microhigh pedon
Ž .and C,D microlow pedon. See text for pertinent equations.
Clearly, the concentrations of these elements cannot be explained by residualenrichment alone, but indicate soil volume changes andror open-system trans-port.
Ž . Ž . Ž .Positive dilational or negative collapse volumetric changes i.e., strain inthe soil matrix affect the concentration of a soil constituent and are calculatedby:
r Cp i ,pe s y1i ,w
r Cw i ,w
where e is the strain of the weathered material, i is an immobile indexi,w
element, and other terms are as described previously. The open-system transportfunction, t , evaluates the mass fraction of a chemical constituent that has been
( )S.G. Driese et al.rGeoderma 95 2000 179–204 185
Ž . Ž .gained i.e., t)0 or lost t-0, to a minimum value of y1%, or y100%during soil formation. Mass transport of a constituent, j, in the weatheredmaterial is measured by:
r Cw i ,wt s e q1 y1Ž .i ,w i ,w
r Cp i ,p
where all terms are as described previously.Determination of strain and open-system transport requires identification of
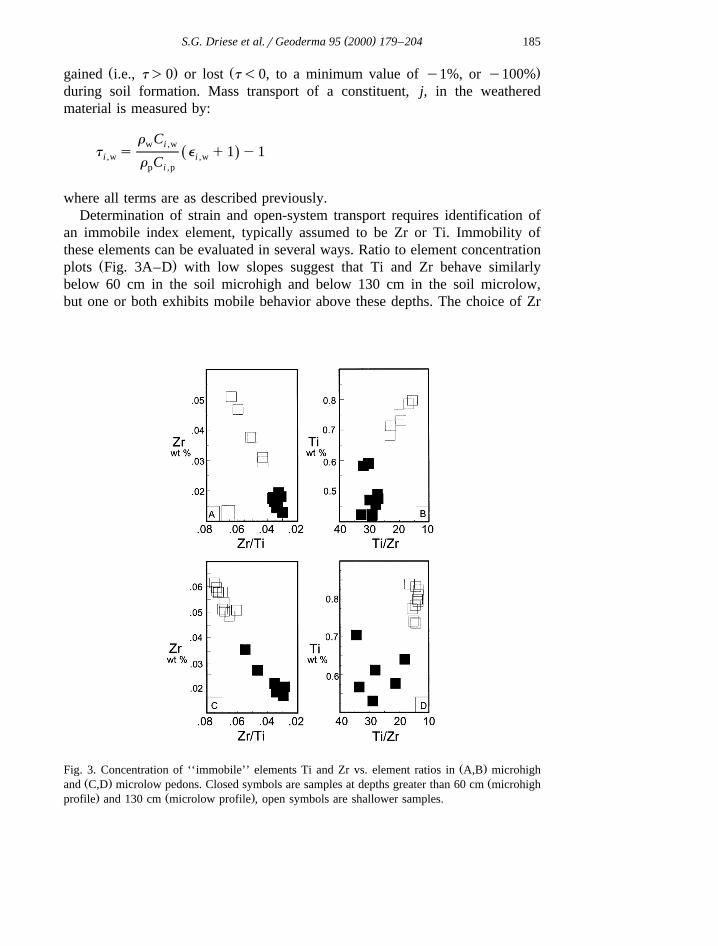
an immobile index element, typically assumed to be Zr or Ti. Immobility ofthese elements can be evaluated in several ways. Ratio to element concentration
Ž .plots Fig. 3A–D with low slopes suggest that Ti and Zr behave similarlybelow 60 cm in the soil microhigh and below 130 cm in the soil microlow,but one or both exhibits mobile behavior above these depths. The choice of Zr
Ž .Fig. 3. Concentration of ‘‘immobile’’ elements Ti and Zr vs. element ratios in A,B microhighŽ . Žand C,D microlow pedons. Closed symbols are samples at depths greater than 60 cm microhigh. Ž .profile and 130 cm microlow profile , open symbols are shallower samples.
( )S.G. Driese et al.rGeoderma 95 2000 179–204186
Žas an index element would indicate a net loss in Ti at the top of the soil Fig..2C,D , yet the concentration of Ti increases upward in the soils and there is
a slight increase in bulk density. These observations suggest that Ti is a more
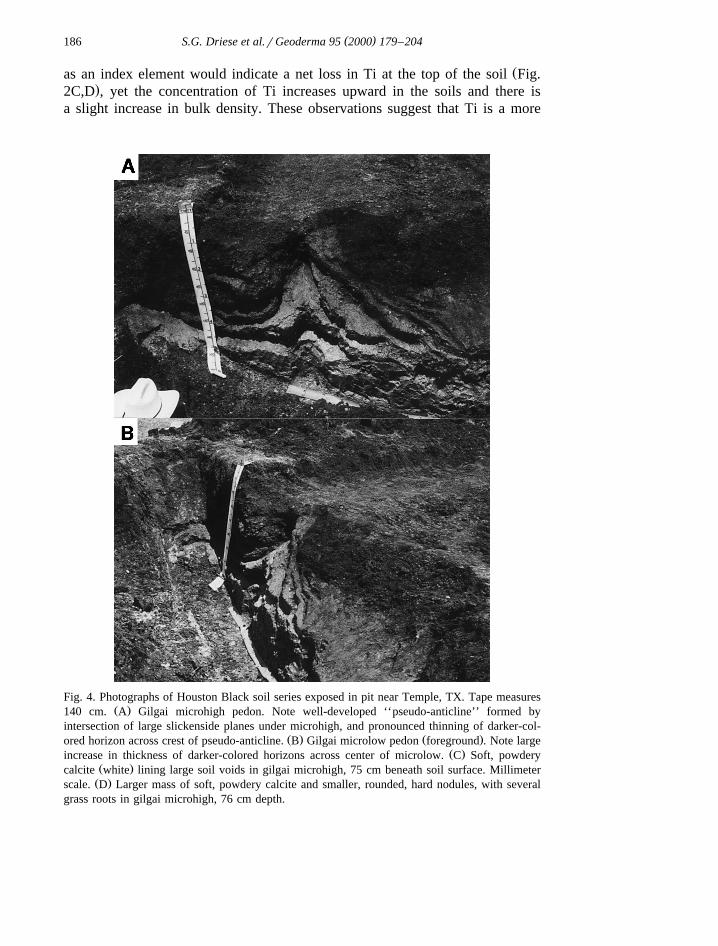
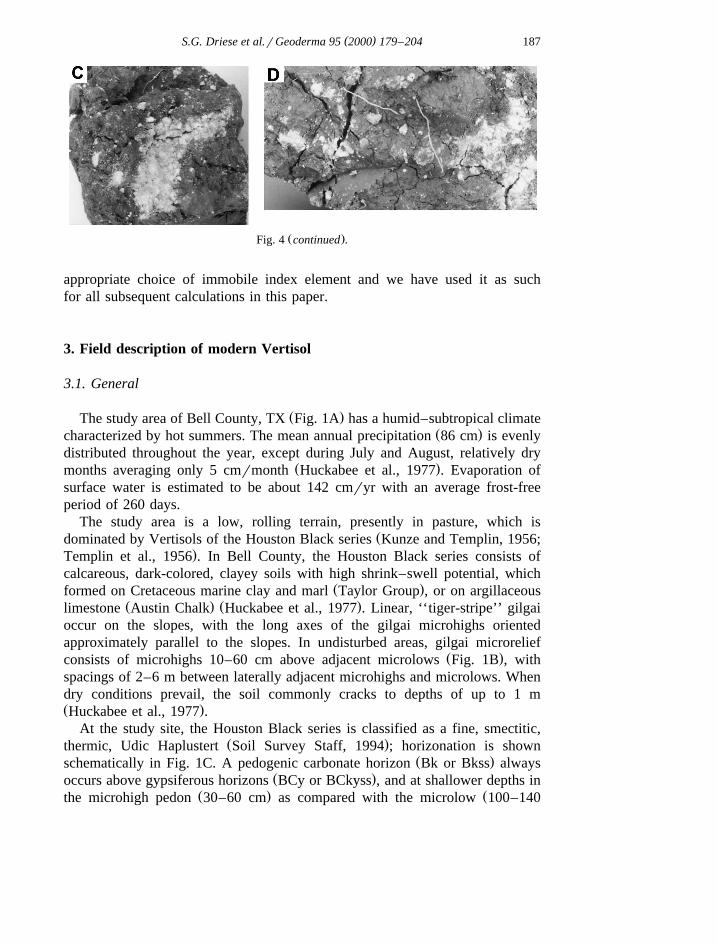
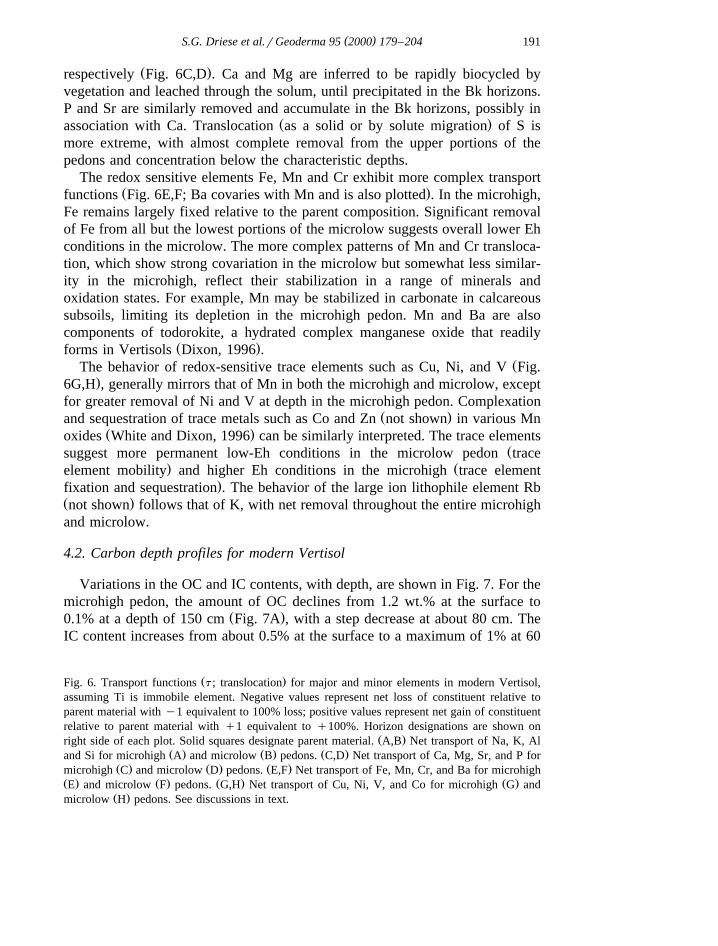
Fig. 4. Photographs of Houston Black soil series exposed in pit near Temple, TX. Tape measuresŽ .140 cm. A Gilgai microhigh pedon. Note well-developed ‘‘pseudo-anticline’’ formed by
intersection of large slickenside planes under microhigh, and pronounced thinning of darker-col-Ž . Ž .ored horizon across crest of pseudo-anticline. B Gilgai microlow pedon foreground . Note large
Ž .increase in thickness of darker-colored horizons across center of microlow. C Soft, powderyŽ .calcite white lining large soil voids in gilgai microhigh, 75 cm beneath soil surface. MillimeterŽ .scale. D Larger mass of soft, powdery calcite and smaller, rounded, hard nodules, with several
grass roots in gilgai microhigh, 76 cm depth.
( )S.G. Driese et al.rGeoderma 95 2000 179–204 187
Ž .Fig. 4 continued .
appropriate choice of immobile index element and we have used it as suchfor all subsequent calculations in this paper.
3. Field description of modern Vertisol
3.1. General
Ž .The study area of Bell County, TX Fig. 1A has a humid–subtropical climateŽ .characterized by hot summers. The mean annual precipitation 86 cm is evenly
distributed throughout the year, except during July and August, relatively dryŽ .months averaging only 5 cmrmonth Huckabee et al., 1977 . Evaporation of
surface water is estimated to be about 142 cmryr with an average frost-freeperiod of 260 days.
The study area is a low, rolling terrain, presently in pasture, which isŽdominated by Vertisols of the Houston Black series Kunze and Templin, 1956;
.Templin et al., 1956 . In Bell County, the Houston Black series consists ofcalcareous, dark-colored, clayey soils with high shrink–swell potential, which
Ž .formed on Cretaceous marine clay and marl Taylor Group , or on argillaceousŽ . Ž .limestone Austin Chalk Huckabee et al., 1977 . Linear, ‘‘tiger-stripe’’ gilgai
occur on the slopes, with the long axes of the gilgai microhighs orientedapproximately parallel to the slopes. In undisturbed areas, gilgai microrelief
Ž .consists of microhighs 10–60 cm above adjacent microlows Fig. 1B , withspacings of 2–6 m between laterally adjacent microhighs and microlows. Whendry conditions prevail, the soil commonly cracks to depths of up to 1 mŽ .Huckabee et al., 1977 .
At the study site, the Houston Black series is classified as a fine, smectitic,Ž .thermic, Udic Haplustert Soil Survey Staff, 1994 ; horizonation is shown
Ž .schematically in Fig. 1C. A pedogenic carbonate horizon Bk or Bkss alwaysŽ .occurs above gypsiferous horizons BCy or BCkyss , and at shallower depths in
Ž . Žthe microhigh pedon 30–60 cm as compared with the microlow 100–140
( )S.G. Driese et al.rGeoderma 95 2000 179–204188
. Ž .cm . The first slickensided horizons Bss or Bkss commonly occur at a depth of40–50 cm. The parent material consists of low-permeability smectitic, pyriticmarine shales with sparse fossil allochem-rich layers and is gypsiferous due to
Ž .oxidation of framboidal pyrite. Strata comprising the parent material Cy areŽ . Ž .assigned to the Taylor Group Cretaceous Huckabee et al., 1977 .
3.2. Microhigh pedon
The gilgai microhigh pedon was exposed by a pit approximately 1.5 m deepŽ .and 3 m wide Fig. 1B . Black clay with a surface horizon granular structure
thins across the crest of the microhigh and the subjacent pedogenic carbonateŽ . Ž .Bk horizon approaches to within 20 cm of the soil surface Fig. 4A . Thedeeper subsoil consists of a very dark gray to light olive brown, highlygypsiferous clay with fining-upward coarse angular–blocky structure and nu-merous large-scale slickenside surfaces. Saprolitic parent material appears 160cm below the soil surface.
3.3. Microlow pedon
A second soil pit approximately 2 m deep and 6 m wide exposed a gilgaiŽ .microlow with two connecting microhighs Fig. 1B . A black clay surface
horizon with a granular or crumb structure, grades downward into clay withcoarse angular–blocky structure and abundant calcite nodules, and thickensacross the microlow; the subjacent pedogenic carbonate horizon occurs at a
Ž .maximum depth of 100 cm below the soil surface Fig. 4B . The deeper subsoilconsists of a very dark gray to light olive brown, highly gypsiferous clay withcoarse angular–blocky structure and numerous large-scale slickenside surfaces.Parent material occurs 180 cm below the soil surface.
3.4. Pedogenic carbonate
Pedogenic carbonate first appears within 20–30 cm of the soil surface in themicrohigh and 50 cm in the microlow, persisting to depths of 100 and 140 cm,respectively. Pedogenic carbonate assumes two basic morphologies, typical of
Žmany modern Vertisols Fig. 4C,D; Blokhuis et al., 1968; Rabenhorst et al.,.1984 . The dominant morphology consists of irregular masses of soft, powdery,
friable calcite up to several cm in diameter. These masses are confined to soilŽpores and extend diffusely into the adjacent clay matrix ‘‘orthic’’ carbonate;
.Wieder and Yaalon, 1974 interpreted as undergoing precipitation. The second,less prominent, morphology consists of dense, hard calcite nodules, less than 1
Žcm in diameter, with sharp margins ‘‘disorthic’’ carbonate; Wieder and Yaalon,.1974 interpreted as having experienced dissolution processes. Slickensides
( )S.G. Driese et al.rGeoderma 95 2000 179–204 189
across the surfaces of hard calcite nodules indicate pedoturbation of the nodulesby active shrink–swell processes.
4. Whole-soil and paleosol chemistry
4.1. Mass-balance reconstruction of modern Vertisol
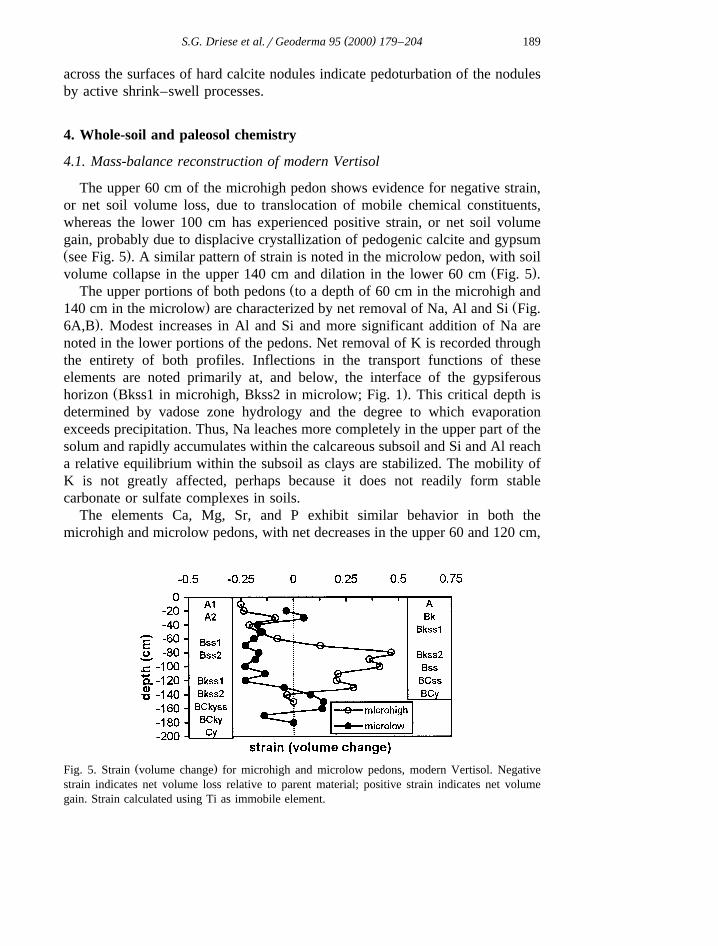
The upper 60 cm of the microhigh pedon shows evidence for negative strain,or net soil volume loss, due to translocation of mobile chemical constituents,whereas the lower 100 cm has experienced positive strain, or net soil volumegain, probably due to displacive crystallization of pedogenic calcite and gypsumŽ .see Fig. 5 . A similar pattern of strain is noted in the microlow pedon, with soil
Ž .volume collapse in the upper 140 cm and dilation in the lower 60 cm Fig. 5 .ŽThe upper portions of both pedons to a depth of 60 cm in the microhigh and
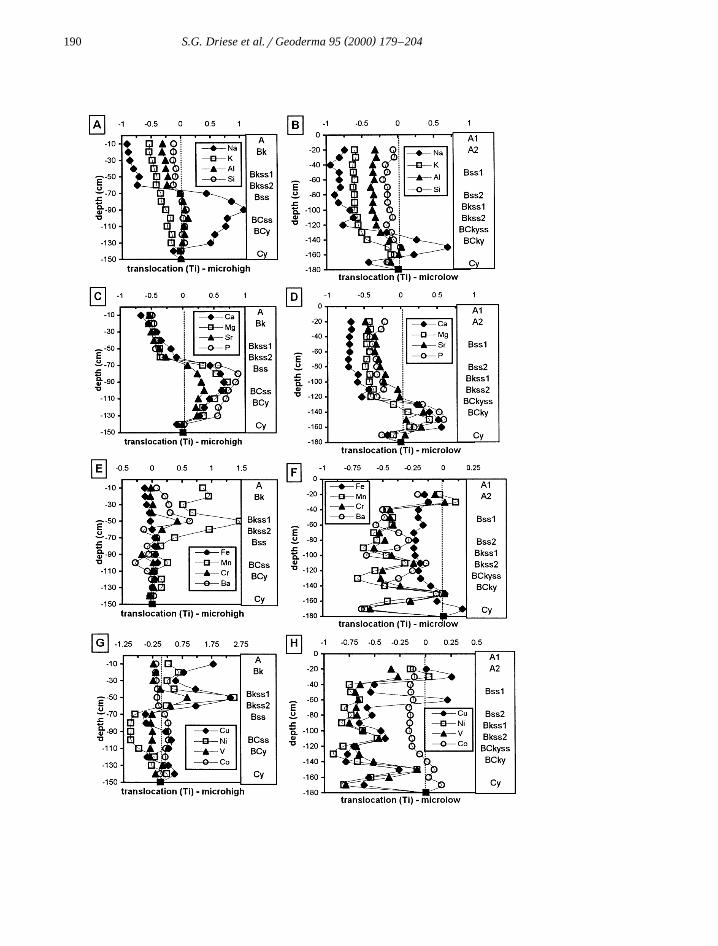
. Ž140 cm in the microlow are characterized by net removal of Na, Al and Si Fig..6A,B . Modest increases in Al and Si and more significant addition of Na are
noted in the lower portions of the pedons. Net removal of K is recorded throughthe entirety of both profiles. Inflections in the transport functions of theseelements are noted primarily at, and below, the interface of the gypsiferous
Ž .horizon Bkss1 in microhigh, Bkss2 in microlow; Fig. 1 . This critical depth isdetermined by vadose zone hydrology and the degree to which evaporationexceeds precipitation. Thus, Na leaches more completely in the upper part of thesolum and rapidly accumulates within the calcareous subsoil and Si and Al reacha relative equilibrium within the subsoil as clays are stabilized. The mobility ofK is not greatly affected, perhaps because it does not readily form stablecarbonate or sulfate complexes in soils.
The elements Ca, Mg, Sr, and P exhibit similar behavior in both themicrohigh and microlow pedons, with net decreases in the upper 60 and 120 cm,
Ž .Fig. 5. Strain volume change for microhigh and microlow pedons, modern Vertisol. Negativestrain indicates net volume loss relative to parent material; positive strain indicates net volumegain. Strain calculated using Ti as immobile element.
( )S.G. Driese et al.rGeoderma 95 2000 179–204190
( )S.G. Driese et al.rGeoderma 95 2000 179–204 191
Ž .respectively Fig. 6C,D . Ca and Mg are inferred to be rapidly biocycled byvegetation and leached through the solum, until precipitated in the Bk horizons.P and Sr are similarly removed and accumulate in the Bk horizons, possibly in
Ž .association with Ca. Translocation as a solid or by solute migration of S ismore extreme, with almost complete removal from the upper portions of thepedons and concentration below the characteristic depths.
The redox sensitive elements Fe, Mn and Cr exhibit more complex transportŽ .functions Fig. 6E,F; Ba covaries with Mn and is also plotted . In the microhigh,
Fe remains largely fixed relative to the parent composition. Significant removalof Fe from all but the lowest portions of the microlow suggests overall lower Ehconditions in the microlow. The more complex patterns of Mn and Cr transloca-tion, which show strong covariation in the microlow but somewhat less similar-ity in the microhigh, reflect their stabilization in a range of minerals andoxidation states. For example, Mn may be stabilized in carbonate in calcareoussubsoils, limiting its depletion in the microhigh pedon. Mn and Ba are alsocomponents of todorokite, a hydrated complex manganese oxide that readily
Ž .forms in Vertisols Dixon, 1996 .ŽThe behavior of redox-sensitive trace elements such as Cu, Ni, and V Fig.
.6G,H , generally mirrors that of Mn in both the microhigh and microlow, exceptfor greater removal of Ni and V at depth in the microhigh pedon. Complexation
Ž .and sequestration of trace metals such as Co and Zn not shown in various MnŽ .oxides White and Dixon, 1996 can be similarly interpreted. The trace elements
Žsuggest more permanent low-Eh conditions in the microlow pedon trace. Želement mobility and higher Eh conditions in the microhigh trace element
.fixation and sequestration . The behavior of the large ion lithophile element RbŽ .not shown follows that of K, with net removal throughout the entire microhighand microlow.
4.2. Carbon depth profiles for modern Vertisol
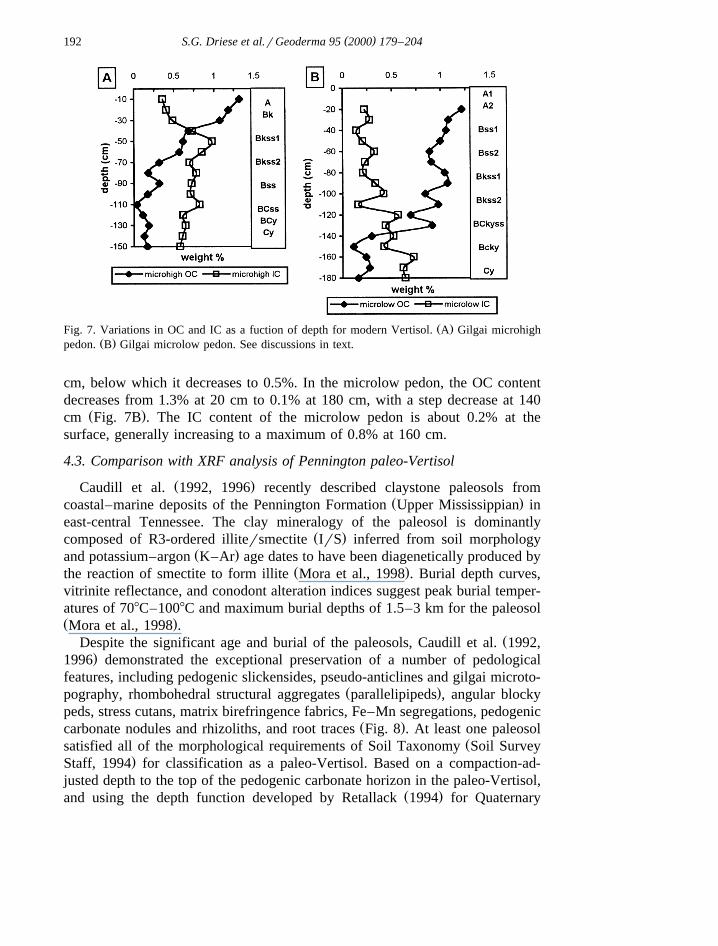
Variations in the OC and IC contents, with depth, are shown in Fig. 7. For themicrohigh pedon, the amount of OC declines from 1.2 wt.% at the surface to
Ž .0.1% at a depth of 150 cm Fig. 7A , with a step decrease at about 80 cm. TheIC content increases from about 0.5% at the surface to a maximum of 1% at 60
Ž .Fig. 6. Transport functions t ; translocation for major and minor elements in modern Vertisol,assuming Ti is immobile element. Negative values represent net loss of constituent relative toparent material with y1 equivalent to 100% loss; positive values represent net gain of constituentrelative to parent material with q1 equivalent to q100%. Horizon designations are shown on
Ž .right side of each plot. Solid squares designate parent material. A,B Net transport of Na, K, AlŽ . Ž . Ž .and Si for microhigh A and microlow B pedons. C,D Net transport of Ca, Mg, Sr, and P for
Ž . Ž . Ž .microhigh C and microlow D pedons. E,F Net transport of Fe, Mn, Cr, and Ba for microhighŽ . Ž . Ž . Ž .E and microlow F pedons. G,H Net transport of Cu, Ni, V, and Co for microhigh G and
Ž .microlow H pedons. See discussions in text.
( )S.G. Driese et al.rGeoderma 95 2000 179–204192
Ž .Fig. 7. Variations in OC and IC as a fuction of depth for modern Vertisol. A Gilgai microhighŽ .pedon. B Gilgai microlow pedon. See discussions in text.
cm, below which it decreases to 0.5%. In the microlow pedon, the OC contentdecreases from 1.3% at 20 cm to 0.1% at 180 cm, with a step decrease at 140
Ž .cm Fig. 7B . The IC content of the microlow pedon is about 0.2% at thesurface, generally increasing to a maximum of 0.8% at 160 cm.
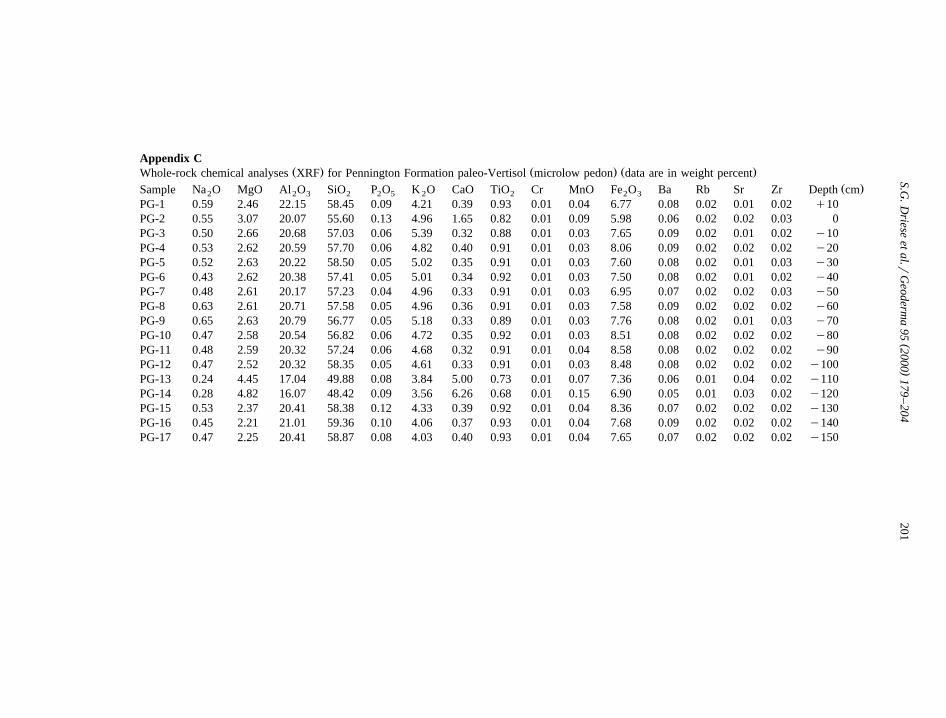
4.3. Comparison with XRF analysis of Pennington paleo-Vertisol
Ž .Caudill et al. 1992, 1996 recently described claystone paleosols fromŽ .coastal–marine deposits of the Pennington Formation Upper Mississippian in
east-central Tennessee. The clay mineralogy of the paleosol is dominantlyŽ .composed of R3-ordered illitersmectite IrS inferred from soil morphology
Ž .and potassium–argon K–Ar age dates to have been diagenetically produced byŽ .the reaction of smectite to form illite Mora et al., 1998 . Burial depth curves,
vitrinite reflectance, and conodont alteration indices suggest peak burial temper-atures of 708C–1008C and maximum burial depths of 1.5–3 km for the paleosolŽ .Mora et al., 1998 .
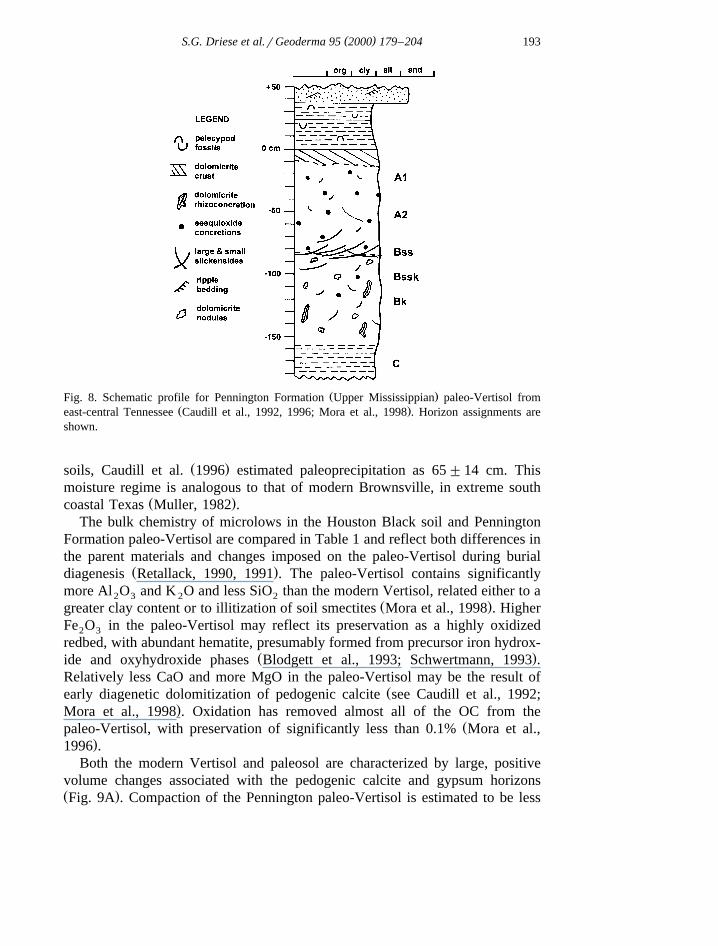
ŽDespite the significant age and burial of the paleosols, Caudill et al. 1992,.1996 demonstrated the exceptional preservation of a number of pedological
features, including pedogenic slickensides, pseudo-anticlines and gilgai microto-Ž .pography, rhombohedral structural aggregates parallelipipeds , angular blocky
peds, stress cutans, matrix birefringence fabrics, Fe–Mn segregations, pedogenicŽ .carbonate nodules and rhizoliths, and root traces Fig. 8 . At least one paleosol
Žsatisfied all of the morphological requirements of Soil Taxonomy Soil Survey.Staff, 1994 for classification as a paleo-Vertisol. Based on a compaction-ad-
justed depth to the top of the pedogenic carbonate horizon in the paleo-Vertisol,Ž .and using the depth function developed by Retallack 1994 for Quaternary
( )S.G. Driese et al.rGeoderma 95 2000 179–204 193
Ž .Fig. 8. Schematic profile for Pennington Formation Upper Mississippian paleo-Vertisol fromŽ .east-central Tennessee Caudill et al., 1992, 1996; Mora et al., 1998 . Horizon assignments are
shown.
Ž .soils, Caudill et al. 1996 estimated paleoprecipitation as 65"14 cm. Thismoisture regime is analogous to that of modern Brownsville, in extreme south
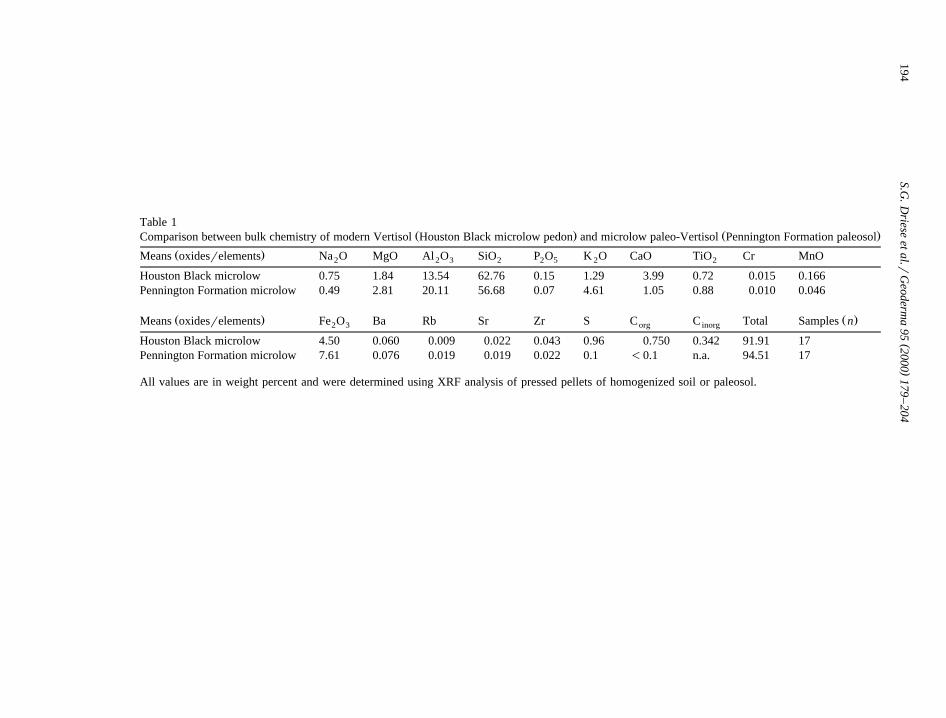
Ž .coastal Texas Muller, 1982 .The bulk chemistry of microlows in the Houston Black soil and Pennington
Formation paleo-Vertisol are compared in Table 1 and reflect both differences inthe parent materials and changes imposed on the paleo-Vertisol during burial
Ž .diagenesis Retallack, 1990, 1991 . The paleo-Vertisol contains significantlymore Al O and K O and less SiO than the modern Vertisol, related either to a2 3 2 2
Ž .greater clay content or to illitization of soil smectites Mora et al., 1998 . HigherFe O in the paleo-Vertisol may reflect its preservation as a highly oxidized2 3
redbed, with abundant hematite, presumably formed from precursor iron hydrox-Ž .ide and oxyhydroxide phases Blodgett et al., 1993; Schwertmann, 1993 .
Relatively less CaO and more MgO in the paleo-Vertisol may be the result ofŽearly diagenetic dolomitization of pedogenic calcite see Caudill et al., 1992;
.Mora et al., 1998 . Oxidation has removed almost all of the OC from theŽpaleo-Vertisol, with preservation of significantly less than 0.1% Mora et al.,
.1996 .Both the modern Vertisol and paleosol are characterized by large, positive
volume changes associated with the pedogenic calcite and gypsum horizonsŽ .Fig. 9A . Compaction of the Pennington paleo-Vertisol is estimated to be less
()
S.G.D
rieseet
al.rG
eoderma
952000
179–
204194
Table 1Ž . Ž .Comparison between bulk chemistry of modern Vertisol Houston Black microlow pedon and microlow paleo-Vertisol Pennington Formation paleosol
Ž .Means oxidesrelements Na O MgO Al O SiO P O K O CaO TiO Cr MnO2 2 3 2 2 5 2 2
Houston Black microlow 0.75 1.84 13.54 62.76 0.15 1.29 3.99 0.72 0.015 0.166Pennington Formation microlow 0.49 2.81 20.11 56.68 0.07 4.61 1.05 0.88 0.010 0.046
Ž . Ž .Means oxidesrelements Fe O Ba Rb Sr Zr S C C Total Samples n2 3 org inorg
Houston Black microlow 4.50 0.060 0.009 0.022 0.043 0.96 0.750 0.342 91.91 17Pennington Formation microlow 7.61 0.076 0.019 0.019 0.022 0.1 -0.1 n.a. 94.51 17
All values are in weight percent and were determined using XRF analysis of pressed pellets of homogenized soil or paleosol.
( )S.G. Driese et al.rGeoderma 95 2000 179–204 195
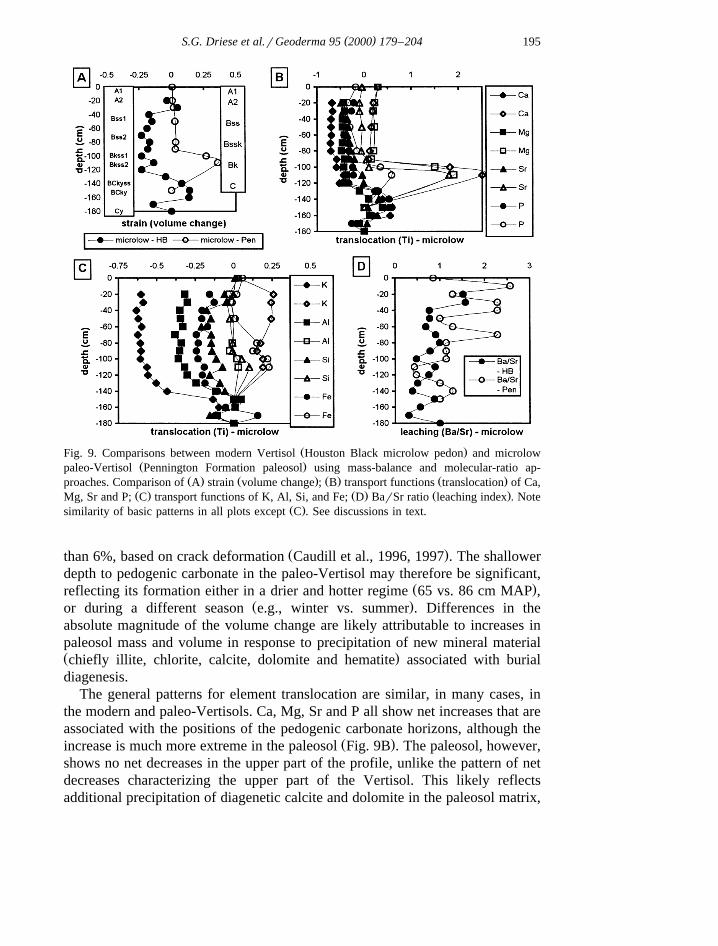
Ž .Fig. 9. Comparisons between modern Vertisol Houston Black microlow pedon and microlowŽ .paleo-Vertisol Pennington Formation paleosol using mass-balance and molecular-ratio ap-
Ž . Ž . Ž . Ž .proaches. Comparison of A strain volume change ; B transport functions translocation of Ca,Ž . Ž . Ž .Mg, Sr and P; C transport functions of K, Al, Si, and Fe; D BarSr ratio leaching index . Note
Ž .similarity of basic patterns in all plots except C . See discussions in text.
Ž .than 6%, based on crack deformation Caudill et al., 1996, 1997 . The shallowerdepth to pedogenic carbonate in the paleo-Vertisol may therefore be significant,
Ž .reflecting its formation either in a drier and hotter regime 65 vs. 86 cm MAP ,Ž .or during a different season e.g., winter vs. summer . Differences in the
absolute magnitude of the volume change are likely attributable to increases inpaleosol mass and volume in response to precipitation of new mineral materialŽ .chiefly illite, chlorite, calcite, dolomite and hematite associated with burialdiagenesis.
The general patterns for element translocation are similar, in many cases, inthe modern and paleo-Vertisols. Ca, Mg, Sr and P all show net increases that areassociated with the positions of the pedogenic carbonate horizons, although the
Ž .increase is much more extreme in the paleosol Fig. 9B . The paleosol, however,shows no net decreases in the upper part of the profile, unlike the pattern of netdecreases characterizing the upper part of the Vertisol. This likely reflectsadditional precipitation of diagenetic calcite and dolomite in the paleosol matrix,
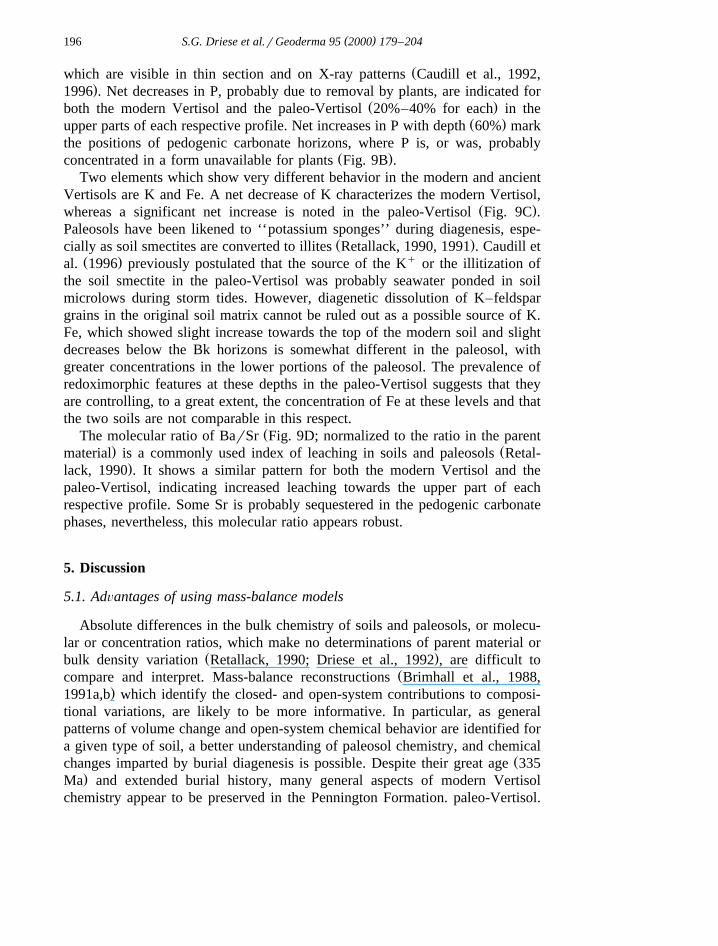
( )S.G. Driese et al.rGeoderma 95 2000 179–204196
Žwhich are visible in thin section and on X-ray patterns Caudill et al., 1992,.1996 . Net decreases in P, probably due to removal by plants, are indicated for
Ž .both the modern Vertisol and the paleo-Vertisol 20%–40% for each in theŽ .upper parts of each respective profile. Net increases in P with depth 60% mark
the positions of pedogenic carbonate horizons, where P is, or was, probablyŽ .concentrated in a form unavailable for plants Fig. 9B .
Two elements which show very different behavior in the modern and ancientVertisols are K and Fe. A net decrease of K characterizes the modern Vertisol,
Ž .whereas a significant net increase is noted in the paleo-Vertisol Fig. 9C .Paleosols have been likened to ‘‘potassium sponges’’ during diagenesis, espe-
Ž .cially as soil smectites are converted to illites Retallack, 1990, 1991 . Caudill etŽ . qal. 1996 previously postulated that the source of the K or the illitization of
the soil smectite in the paleo-Vertisol was probably seawater ponded in soilmicrolows during storm tides. However, diagenetic dissolution of K–feldspargrains in the original soil matrix cannot be ruled out as a possible source of K.Fe, which showed slight increase towards the top of the modern soil and slightdecreases below the Bk horizons is somewhat different in the paleosol, withgreater concentrations in the lower portions of the paleosol. The prevalence ofredoximorphic features at these depths in the paleo-Vertisol suggests that theyare controlling, to a great extent, the concentration of Fe at these levels and thatthe two soils are not comparable in this respect.
ŽThe molecular ratio of BarSr Fig. 9D; normalized to the ratio in the parent. Žmaterial is a commonly used index of leaching in soils and paleosols Retal-
.lack, 1990 . It shows a similar pattern for both the modern Vertisol and thepaleo-Vertisol, indicating increased leaching towards the upper part of eachrespective profile. Some Sr is probably sequestered in the pedogenic carbonatephases, nevertheless, this molecular ratio appears robust.
5. Discussion
5.1. AdÕantages of using mass-balance models
Absolute differences in the bulk chemistry of soils and paleosols, or molecu-lar or concentration ratios, which make no determinations of parent material or
Ž .bulk density variation Retallack, 1990; Driese et al., 1992 , are difficult toŽcompare and interpret. Mass-balance reconstructions Brimhall et al., 1988,
.1991a,b which identify the closed- and open-system contributions to composi-tional variations, are likely to be more informative. In particular, as generalpatterns of volume change and open-system chemical behavior are identified fora given type of soil, a better understanding of paleosol chemistry, and chemical
Žchanges imparted by burial diagenesis is possible. Despite their great age 335.Ma and extended burial history, many general aspects of modern Vertisol
chemistry appear to be preserved in the Pennington Formation. paleo-Vertisol.
( )S.G. Driese et al.rGeoderma 95 2000 179–204 197
Positive soil strain resulting from crystallization of pedogenic carbonate and theŽ .general pattern of major element distribution concur Fig. 9A,B . Exchangeable
bases and trace elements appear to be the most mobile constituents duringVertisol diagenesis.
5.2. Influence of gilgai microtopography on soil chemistry and hydrology
ŽGilgai are characteristic features of most modern Vertisols Dudal and.Eswaran, 1988 and distinctive differences in physico-chemical parameters are
indicated for gilgai microhighs and microlows. These differences include highermoisture content, clay content, shrinkage, cracking expression, OC, and ex-changeable cations in microlows and higher carbonates, exchangeable bases and
Ž .cohesive strength in microhighs Wilding et al., 1991 .Ž .Mass-balance calculations Figs. 5, 6 confirm previous observations that
microhigh and microlow pedons of Vertisols are, indeed, distinctly differentphysical and chemical systems. The microlow is characterized by translocationŽ .as solid or solute of exchangeable bases such as Na, K, Ca, and Mg, whichbecome concentrated in zones of precipitation of pedogenic calcite and gypsum,
Ž .as well as less significant mobility of P, Al, Fe, and Si Fig. 6A–F . Averagedepths of leaching for the modern Vertisol are 60 cm for the microhigh and 120cm for the microlow. Lower Eh conditions are suggested for the microlowpedon, as evidenced by net removal of redox-sensitive trace elements, such as
Ž .Co, Cr, Cu, Mn, and V, relative to the microhigh pedon Fig. 6E–H . Significantnet increases of S, Na, and the elements cited above suggest significant transportand fixation of these constituents in the microhigh pedon relative to the
Ž .microlow Fig. 6 . These patterns might record evaporative-driven transport ofsoil–water carrying dissolved constituents derived from the microlows followingcrystallization of sulfate and oxidation of reduced metals in the core of themicrohigh; similar gypsification has been documented in Vertisols of New
Ž .Caledonia Podwojewski, 1995 .
5.3. Implications for paleoclimate research
We initially hypothesized that microlow pedons of paleo-Vertisols mightbehave as more open chemical systems during burial diagenesis because of theirgreater depths of soil cracking and greater density of soil fractures and slicken-sides. However, because of the strong similarity of depth-functions for strainand translocation patterns for many constituents in microlow pedons of themodern and paleo-Vertisol, the extent of chemical reorganization during burial
Ž .diagenesis is perhaps not nearly as great as we originally hypothesized Fig. 9 .Indeed, the behavior of Vertisols after burial may approximate that of closedsystems, as has been suggested by previous studies of burial compaction and
Žcolor patterns in paleo-Vertisols Caudill and Driese, 1998, in press; Caudill et.al., 1997 .
( )S.G. Driese et al.rGeoderma 95 2000 179–204198
Another important aspect is our general observation that microhigh pedonshave a poorer preservation potential in the geologic record due to their highertopography. Several cm to a few dm are commonly planed off paleo-Vertisols
Ž .by channel belt migration in fluvial depositional systems and by marineŽtransgression in coastal-margin depositional systems; see examples in Mora and.Driese, 1999 . Microlow pedons, in contrast, should have a higher preservation
potential due to their lower topography.The close correspondence between modern Vertisols and their ancient analogs
in the geological record indicated by field, micromorphological and mass-bal-ance reconstructions suggests that they share many pedogenic processes andenvironmentalrclimate-responses. Thus, differences in the physical and chemi-cal behavior of pedons occupying different positions within gilgai microtopogra-phy might also be expected to be recorded in paleo-Vertisols. This wouldcomplicate interpretation of paleoprecipitation regimes based on depth to Bk or
Ž .K horizons e.g., Retallack, 1994, 1997 ; in the modern Vertisol, these depthsdiffered by almost 100%. We recommend, for consistency and based on
Ž .preservation potential arguments presented above , that only microlow portionsŽof paleo-Vertisols be utilized for paleoprecipitation estimation cf., Caudill et
.al., 1996 , and that the depths of leaching and top of the pedogenic carbonateŽhorizon be determined using a combination of criteria i.e., field, micromorpho-
.logical, and geochemical , rather than simple field measurement.Further work will rigorously test these concepts by extending mass-balance
approaches to other paleosols in the Appalachian basin succession. Less diage-netically altered and geologically younger paleo-Vertisols, such as those de-
Ž .scribed in the Miocene–Pliocene of West Texas by Gustavson 1991a,b wouldalso be favorable candidates for study. If variations in paleosol chemistry due tooriginal microhigh or microlow site position exist, these differences must beconsidered in any interpretation of past weathering and climate.
6. Summary
Ž . Ž .1 The mass-balance chemistry of a modern Vertisol Houston Black seriesin Texas shows evidence for significant differences in chemical behaviorbetween gilgai microhigh and microlow pedons. The overall wetter soil andlower Eh conditions of gilgai microlows impart greater depths of leaching andgreater mobility of redox-sensitive trace elements compared to gilgai micro-highs. Gilgai microhighs behave as evaporative ‘‘wicks’’ that draw moistureand soluble phases towards the soil surface, resulting in precipitation of metals
Ž .and sulfates gypsum at the capillary fringe.Ž .2 Direct comparisons of mass-balance chemistry as a function of soil depth
indicate significant retention of pedochemical patterns in the paleo-Vertisol,including patterns of soil volume change, and transport functions for many
( )S.G. Driese et al.rGeoderma 95 2000 179–204 199
major and trace elements. The chemical patterns suggest that modern Vertisolsbehave, to first approximation, as nearly closed chemical systems shortly afterburial. Chemical and mineralogical changes associated with burial diagenesisinclude oxidation of OC, illitization of smectites, dehydration and recrystalliza-tion of Fe–Mn oxyhydroxides, and dolomitization of pedogenic calcite inpaleo-Vertisols.
Ž .3 Geologists studying paleo-Vertisols may make direct comparisons ofmass-balance chemistry with modern Vertisols, but must discriminate betweengilgai microhigh and microlow portions of the paleosol. Geologists, by analogywith modern Vertisols, should expect to observe very different chemical patternsfor different portions of the paleo-gilgai microrelief. We recommend samplingpaleo-Vertisols in microlow positions, because these are more likely to have thefull soil profile preserved after burial.
Ž .4 Paleoprecipitation estimates made using either modern or paleo-Vertisolsand the depth to the top of the pedogenic carbonate horizons should utilize
Žmicrolow pedons and the full range of available data i.e., field, micromorpho-.logic, and geochemical for characterizing maximum depths of leaching, base
loss or gain, and calcification, rather than relying solely upon field data.
Acknowledgements
We thank Drs. A.R. Mermut, R. Southard, and V.P. Wright for thoughtfulreviews. This research was partially supported by NSF Grant EAR-9418183
Žawarded to Driese and Mora, and by NSF Post-Doctoral Fellowship EAR-.9404252 awarded to Joeckel. We gratefully acknowledge the cooperation of the
Ž .US Natural Resource Conservation Service NRCS , as well as the helpfulŽ .discussions with Drs. L.P. Wilding and R. Drees Texas A&M Univ. . Dr. O.C.
Ž .Kopp, V. Hale, and J. Elick Univ. of Tennessee provided laboratory assistancewith X-ray fluorescence analysis of the modern soil samples. Drs. K.J. TobinŽ . Ž .Univ. of Illinois-Chicago and M.R. Caudill Kent State Univ. provided bothfield sampling and analytical assistance with the Pennington Formation samples.
Appendix A. Locations of Vertisol and paleo-Vertisol sample sites1
A.1. Houston Black series: fine, smectitic, thermic Udic Haplustert
Typical pedon from the intersection of FM 53 and FM 437 in Zabcikville,southeast of town of Temple, Bell County, Texas: 7.2 km southeast on FM 437;
1 Appendices A–C will be available at: http:rrgeoweb.gg.utk.edurutk geosciencesr–paleopedologyrpaleopedology home.htm.–
( )S.G. Driese et al.rGeoderma 95 2000 179–204200
App
endi
xB
Ž.
Ž.
Who
le-s
oil
chem
ical
anal
yses
XR
Ffo
rH
oust
onB
lack
Ver
tiso
l,B
ell
Cou
nty,
TX
data
are
inw
eigh
tpe
rcen
t
()
()
1M
icro
-hig
hso
iltr
anse
ct10
–15
0cm
bene
ath
soil
surf
ace
Dep
thcm
Na
OM
gOA
lO
SiO
PO
SK
OC
aOT
iOV
Cr
MnO
Fe
OC
oN
iZ
nP
bA
sR
bS
rZ
rB
aC
u2
23
22
52
22
3
y10
0.23
1.65
13.5
964
.81
0.13
0.08
1.15
3.55
0.78
0.01
50.
012
0.12
4.62
0.00
10.
002
0.00
80.
002
0.00
10.
009
0.02
00.
051
0.05
70.
004
y20
0.28
1.73
13.2
063
.52
0.14
0.04
1.11
4.77
0.78
0.01
60.
012
0.12
4.60
0.00
10.
003
0.00
90.
002
0.00
10.
009
0.01
90.
047
0.06
30.
002
y30
0.33
1.74
13.6
359
.81
0.13
0.03
1.18
5.93
0.75
0.01
40.
012
0.09
4.51
0.00
10.
002
0.00
40.
002
0.00
10.
009
0.02
00.
037
0.06
40.
002
y40
0.46
1.86
13.3
961
.68
0.13
0.04
1.23
6.48
0.73
0.01
80.
011
0.10
4.63
0.00
10.
002
0.00
60.
002
0.00
10.
008
0.02
10.
038
0.06
30.
003
y50
0.67
1.95
13.6
659
.29
0.13
0.07
1.30
7.80
0.71
0.03
30.
015
0.14
4.58
0.00
10.
006
0.01
40.
002
0.00
10.
009
0.02
40.
031
0.07
70.
004
y60
0.58
1.89
12.8
554
.75
0.15
0.94
1.22
8.25
0.68
0.02
20.
012
0.11
4.51
0.00
10.
002
0.00
00.
002
0.00
10.
008
0.02
70.
029
0.03
90.
002
y70
2.22
2.70
11.5
143
.29
0.24
7.28
0.95
9.21
0.48
0.00
80.
008
0.05
3.29
0.00
10.
000
0.00
00.
001
0.00
10.
005
0.02
80.
018
0.03
40.
000
y80
2.57
2.80
10.8
039
.72
0.25
8.90
0.86
9.14
0.42
0.00
60.
007
0.04
2.93
0.00
10.
000
0.00
00.
001
0.00
10.
005
0.02
80.
015
0.02
60.
000
y80
2.57
2.80
10.8
039
.72
0.25
8.90
0.86
9.14
0.42
0.00
60.
007
0.04
2.93
0.00
10.
000
0.00
00.
001
0.00
10.
005
0.02
80.
015
0.02
60.
000
y90
2.83
3.10
10.9
742
.03
0.25
9.34
0.96
9.38
0.42
0.00
70.
005
0.04
2.94
0.00
10.
000
0.00
00.
001
0.00
10.
005
0.03
00.
014
0.02
60.
001
y10
02.
463.
0211
.62
40.2
70.
238.
911.
079.
250.
420.
007
0.00
70.
043.
060.
001
0.00
00.
000
0.00
10.
001
0.00
50.
031
0.01
30.
020
0.00
1y
110
2.62
2.97
11.8
344
.59
0.25
8.10
1.07
8.80
0.46
0.00
70.
007
0.04
3.09
0.00
10.
000
0.00
00.
001
0.00
10.
005
0.03
10.
016
0.02
80.
001
y12
02.
412.
6812
.29
44.1
90.
246.
881.
238.
540.
470.
007
0.00
70.
043.
270.
001
0.00
10.
000
0.00
10.
001
0.00
60.
031
0.01
60.
031
0.00
0y
130
2.40
2.80
12.3
047
.79
0.24
6.88
1.25
8.36
0.49
0.01
30.
008
0.05
3.24
0.00
10.
001
0.00
00.
002
0.00
10.
006
0.03
20.
018
0.03
30.
001
y14
01.
672.
4114
.25
54.4
90.
193.
161.
797.
160.
590.
012
0.00
90.
053.
750.
001
0.00
20.
000
0.00
10.
001
0.00
80.
032
0.01
90.
040
0.00
1y
150
1.89
2.51
14.3
253
.48
0.18
3.37
1.79
7.84
0.58
0.01
40.
008
0.05
3.85
0.00
10.
001
0.00
00.
002
0.00
10.
008
0.03
20.
018
0.03
90.
001
()
()
2M
icro
-low
soil
tran
sect
20–
180
cmbe
neat
hso
ilsu
rfac
ey
200.
431.
5112
.77
67.9
60.
150.
021.
022.
140.
740.
025
0.02
20.
284.
590.
001
0.01
20.
037
0.00
30.
002
0.00
80.
014
0.04
80.
075
0.00
8y
300.
311.
5613
.04
68.3
30.
140.
001.
062.
190.
740.
028
0.02
40.
314.
720.
001
0.01
50.
038
0.00
30.
002
0.00
80.
015
0.05
00.
082
0.01
0y
400.
111.
6113
.67
67.0
50.
120.
001.
062.
240.
830.
015
0.01
50.
174.
840.
001
0.00
40.
011
0.00
20.
001
0.00
90.
020
0.05
80.
053
0.00
5y
500.
331.
5613
.41
67.3
40.
130.
001.
072.
170.
810.
013
0.01
40.
184.
700.
001
0.00
40.
010
0.00
20.
001
0.00
90.
020
0.06
00.
053
0.00
4y
600.
341.
7414
.18
64.5
90.
120.
001.
172.
290.
840.
015
0.01
60.
195.
110.
002
0.00
60.
018
0.00
20.
001
0.01
00.
020
0.05
10.
048
0.01
1y
700.
361.
5812
.88
68.4
20.
140.
001.
072.
100.
820.
013
0.01
20.
134.
560.
001
0.00
30.
012
0.00
20.
002
0.00
90.
021
0.06
20.
067
0.00
4y
800.
211.
4713
.20
65.8
40.
140.
001.
082.
050.
790.
013
0.01
30.
144.
470.
001
0.00
40.
014
0.00
20.
002
0.00
90.
021
0.05
80.
072
0.00
4y
900.
301.
6613
.08
66.8
00.
140.
001.
102.
990.
800.
010
0.01
10.
104.
420.
001
0.00
30.
010
0.00
20.
001
0.00
90.
023
0.05
80.
063
0.00
3y
100
0.58
1.60
12.6
467
.64
0.15
0.02
1.07
2.87
0.78
0.01
60.
014
0.16
4.40
0.00
10.
006
0.02
00.
002
0.00
20.
009
0.02
20.
054
0.03
60.
005
y11
00.
631.
6412
.64
66.2
50.
140.
031.
113.
700.
730.
020
0.01
80.
194.
340.
001
0.00
70.
020
0.00
30.
001
0.00
90.
026
0.05
10.
080
0.00
5y
120
0.40
1.64
13.6
263
.55
0.13
0.02
1.19
3.25
0.77
0.12
60.
012
0.13
4.50
0.00
10.
003
0.01
10.
002
0.00
10.
009
0.02
80.
050
0.07
40.
003
y13
01.
222.
0712
.22
56.7
90.
212.
951.
107.
010.
640.
011
0.01
00.
073.
810.
001
0.00
10.
000
0.00
10.
001
0.00
70.
029
0.03
50.
052
0.00
2y
140
1.65
2.26
12.8
652
.85
0.23
4.13
1.13
7.18
0.58
0.01
40.
012
0.11
3.78
0.00
10.
004
0.00
20.
002
0.00
10.
007
0.02
70.
027
0.03
80.
001
y15
02.
042.
6414
.03
53.5
20.
224.
491.
597.
180.
530.
025
0.01
70.
203.
930.
001
0.00
90.
016
0.00
30.
001
0.00
70.
021
0.01
80.
064
0.00
4y
160
1.58
2.28
14.4
552
.40
0.17
2.78
1.78
7.89
0.57
0.01
90.
013
0.18
3.93
0.00
10.
005
0.00
60.
003
0.00
10.
009
0.02
60.
017
0.05
20.
003
y17
00.
952.
2615
.92
57.9
10.
130.
562.
135.
170.
710.
008
0.00
90.
095.
960.
002
0.00
30.
003
0.00
20.
001
0.01
10.
027
0.02
00.
029
0.00
3y
180
1.39
2.19
15.4
859
.75
0.16
1.28
2.13
5.49
0.61
0.03
20.
020
0.24
4.48
0.00
10.
019
0.02
80.
003
0.00
10.
009
0.02
20.
022
0.07
80.
007
()
S.G.D
rieseet
al.rG
eoderma
952000
179–
204201
Appendix CŽ . Ž . Ž .Whole-rock chemical analyses XRF for Pennington Formation paleo-Vertisol microlow pedon data are in weight percent
Ž .Sample Na O MgO Al O SiO P O K O CaO TiO Cr MnO Fe O Ba Rb Sr Zr Depth cm2 2 3 2 2 5 2 2 2 3
PG-1 0.59 2.46 22.15 58.45 0.09 4.21 0.39 0.93 0.01 0.04 6.77 0.08 0.02 0.01 0.02 q10PG-2 0.55 3.07 20.07 55.60 0.13 4.96 1.65 0.82 0.01 0.09 5.98 0.06 0.02 0.02 0.03 0PG-3 0.50 2.66 20.68 57.03 0.06 5.39 0.32 0.88 0.01 0.03 7.65 0.09 0.02 0.01 0.02 y10PG-4 0.53 2.62 20.59 57.70 0.06 4.82 0.40 0.91 0.01 0.03 8.06 0.09 0.02 0.02 0.02 y20PG-5 0.52 2.63 20.22 58.50 0.05 5.02 0.35 0.91 0.01 0.03 7.60 0.08 0.02 0.01 0.03 y30PG-6 0.43 2.62 20.38 57.41 0.05 5.01 0.34 0.92 0.01 0.03 7.50 0.08 0.02 0.01 0.02 y40PG-7 0.48 2.61 20.17 57.23 0.04 4.96 0.33 0.91 0.01 0.03 6.95 0.07 0.02 0.02 0.03 y50PG-8 0.63 2.61 20.71 57.58 0.05 4.96 0.36 0.91 0.01 0.03 7.58 0.09 0.02 0.02 0.02 y60PG-9 0.65 2.63 20.79 56.77 0.05 5.18 0.33 0.89 0.01 0.03 7.76 0.08 0.02 0.01 0.03 y70PG-10 0.47 2.58 20.54 56.82 0.06 4.72 0.35 0.92 0.01 0.03 8.51 0.08 0.02 0.02 0.02 y80PG-11 0.48 2.59 20.32 57.24 0.06 4.68 0.32 0.91 0.01 0.04 8.58 0.08 0.02 0.02 0.02 y90PG-12 0.47 2.52 20.32 58.35 0.05 4.61 0.33 0.91 0.01 0.03 8.48 0.08 0.02 0.02 0.02 y100PG-13 0.24 4.45 17.04 49.88 0.08 3.84 5.00 0.73 0.01 0.07 7.36 0.06 0.01 0.04 0.02 y110PG-14 0.28 4.82 16.07 48.42 0.09 3.56 6.26 0.68 0.01 0.15 6.90 0.05 0.01 0.03 0.02 y120PG-15 0.53 2.37 20.41 58.38 0.12 4.33 0.39 0.92 0.01 0.04 8.36 0.07 0.02 0.02 0.02 y130PG-16 0.45 2.21 21.01 59.36 0.10 4.06 0.37 0.93 0.01 0.04 7.68 0.09 0.02 0.02 0.02 y140PG-17 0.47 2.25 20.41 58.87 0.08 4.03 0.40 0.93 0.01 0.04 7.65 0.07 0.02 0.02 0.02 y150
( )S.G. Driese et al.rGeoderma 95 2000 179–204202
0.8 km east on gravel road; 0.5 km north on field road; 30 m northeast intoŽpasture. Reference map sheet a62, Bell County soil survey map Huckabee et
.al., 1977 .
( ) (A.2. Pennington Formation Upper Mississippian : paleo-Vertisol Caudill et)al., 1992, 1996
Roadcut exposures along both east- and westbound lanes of Interstate High-way 40, 8 km east of town of Monterey, Putnam County, TN. Map coordinates:36807X40YN, 85822X30Y W, Monterey, TN, 7.5X topographic quadrangle.
References
Ahmad, N., Mermut, A.R., 1996. In: Vertisols and Technologies for Their Management: Develop-ments in Soil Science 24 Elsevier, New York, 549 pp.
Blake, G.R., Hartge, K.H., 1986. Bulk density. In: Methods of Soil Analysis: Part I. Physical andŽ .Mineralogical Methods. 2nd edn. Klute, A. Ed. , Soil Sci. Soc. Am. Agron. Monogr. 9pp.
363–375.Blodgett, R.H., Crabaugh, J.P., McBride, E.F., 1993. The color of red beds — a geologic
Ž .perspective. In: Bigham, J.M., Ciolkosz, E.J. Eds. , Soil Color, Soil Sci. Soc. Am. Spec. Publ.31pp. 127–159.
Blokhuis, W.A., Pape, Th., Slager, S., 1968. Morphology and distribution of pedogenic carbonatein some Vertisols of the Sudan. Geoderma 2, 173–200.
Brimhall, G.H., Lewis, C.J., Ague, J.J., Dietrich, W.E., Hampel, J., Teague, T., Rix, P., 1988.Metal enrichment in bauxites by deposition of chemically mature aeolian dust. Nature 333,819–824.
Brimhall, G.H., Lewis, C.J., Ford, C., Bratt, J., Taylor, G., Warin, O., 1991a. Quantitativegeochemical approach to pedogenesis: importance of parent material reduction, volumetricexpansion, and eolian influx in laterization. Geoderma 51, 51–91.
Brimhall, G.H., Chadwick, O.A., Lewis, C.J., Compston, W., Williams, I.S., Danti, K.J., Dietrich,W.E., Power, M., Hendricks, D., Bratt, J., 1991b. Deformational mass transfer and invasiveprocesses in soil evolution. Science 255, 695–702.
Caudill, M.R., Driese, S.G., 1998. Transgression-driven rises in ancient, coastal groundwaterŽ .tables: evidence from vertic paleosols of Late Pennsylvanian Lower Conemaugh Group
Ž .cyclothems. Geol. Soc. Am., Abstr. Prog. 30 2 , 9.Caudill, M.R., Driese, S.G., in press. Transgression-driven rises in ancient, coastal groundwater
Ž .tables: evidence from vertic paleosols of Late Pennsylvanian Lower Conemaugh Groupcyclothems. Sediment Geol.
Caudill, M.R., Mora, C.I., Tobin, K.J., Driese, S.G., 1992. Preliminary interpretations of paleosolsassociated with Late Mississippian marginal marine deposits, Pennington Formation, Mon-terey, Tennessee. In: Paleosols, Paleoweathering Surfaces, and Sequence Boundaries. Driese,
Ž .S.G., Mora, C.I., Walker, K.R. Eds. , Univ.Tenn. Stud. Geol. 22pp. 57–78.Caudill, M.R., Driese, S.G., Mora, C.I., 1996. Preservation of a paleo-Vertisol and an estimate of
Late Mississippian paleo-precipitation. J. Sediment Res., Sect. A 66, 58–70.Caudill, M.R., Driese, S.G., Mora, C.I., 1997. Physical compaction of vertic palaeosols: implica-
tions for burial diagenesis and palaeoprecipitation estimates. Sedimentology 44, 673–685.
( )S.G. Driese et al.rGeoderma 95 2000 179–204 203
Coulombe, C.E., Dixon, J.B., Wilding, L.P., 1996. Mineralogy and chemistry of Vertisols. In:Ž .Ahmad, N., Mermut, A. Eds. , Vertisols and Technologies for Their Management: Develop-
ments in Soil Science 24 Elsevier, New York, pp. 115–200.Dixon, J.B., 1996. Manganese oxides in soils and weathered rocks. Agron. Abstr. 321, Am. Soc.
Agron., Madison, WI.Driese, S.G., Mora, C.I., Cotter, E., Foreman, J.L., 1992. Paleopedology and stable isotope
geochemistry of Late Silurian vertic paleosols, Bloomsburg Formation, central Pennsylvania. J.Sediment. Petrol. 62, 825–841.
Dudal, R., Eswaran, H., 1988. Distribution, properties and classification of Vertisols. In: Wilding,Ž .L.P., Puentes, R. Eds. , Vertisols: Their Distribution, Properties, Classification and Manage-
ment. Texas A&M University Printing Center, College Station, pp. 1–22.Gustavson, T.C., 1991a. Arid basin depositional systems and paleosols: Fort Hancock and Camp
Ž .Rice Formations Pliocene–Pleistocene , Hueco Bolson, West Texas and adjacent Mexico.Texas Bur. Econ. Geol., Rep. Invest. 198, 49 pp.
Gustavson, T.C., 1991b. In: Buried Vertisols in lacustrine facies of the Pliocene Fort HancockFormation, Hueco Bolson, West Texas and Chihuahua, Mexico. Geol. Soc. Am. Bull. 103pp.448–460.
Huckabee, J.W. Jr., Thompson, D.R., Wyrick, J.C., Pavlat, E.G., 1977. Soil Survey of BellCounty, Texas.. US Dept. Agric., Soil Cons. Serv. and Texas Agric. Exper. Stat., 75pp.qmaps.
Kunze, G.W., Templin, E.H., 1956. Houston Black Clay, the type Grumosol: II. Mineralogicaland chemical characterization. Soil Sci. Soc. Am. Proc. 20, 91–96.
Mora, C.I., Driese, S.G., 1999. Palaeoclimatic significance and stable carbon isotopes of Palaeo-zoic red bed paleosols, Appalachian Basin, USA and Canada. Thiry, M., Simon-Coincon, R.Ž .Eds. , Palaeoweathering, Palaeosurfaces and Related Continental Deposits. Int. Assoc. Sedi-mentol., Spec. Publ. 27, 61–84.
Mora, C.I., Driese, S.G., Colarusso, L.A., 1996. Middle to Late Paleozoic atmospheric CO from2
soil carbonate and organic matter. Science 271, 1105–1107.Mora, C.I., Sheldon, B.T., Elliott, W.C., Driese, S.G., 1998. An oxygen isotope study of illite and
calcite in three Appalachian Paleozoic vertic paleosols. J. Sediment. Res. 68, 456–464.Muller, M.J., 1982. Selected Climatic Data for a Global Set of Standard Stations for Vegetation
Science. In: Tasks for Vegetation Science. Dr. W. Junk Publ., The Hague, 306 pp.Newman, A.L, 1986. Vertisols in Texas. US Dept. Agric., Soil Cons. Serv, Temple, TX, 206 pp.Podwojewski, P., 1995. The occurrence and interpretation of carbonate and sulfate minerals in a
sequence of Vertisols in New Caledonia. Geoderma 65, 223–248.Rabenhorst, M.C., Wilding, L.P., West, L.T., 1984. Identification of pedogenic carbonates using
stable carbon isotope and microfabric analyses. Soil Sci. Soc. Am. J. 48, 125–132.Retallack, G.J., 1990. Soils of the Past: An Introduction to Paleopedology. Unwin–Hyman,
Boston, 520 pp.Retallack, G.J., 1991. Untangling the effects of burial alteration and ancient soil formation. Annu.
Rev. Earth Planet. Sci. 19, 183–206.Retallack, G.J., 1994. The environmental factor approach to the interpretation of paleosols. In:
Factors of Soil Formation: A Fiftieth Anniversary Retrospective. Amundson, R., Harden, J.,Ž .Singer, M. Eds. , Soil Sci. Soc. Am. Spec. Publ. 33pp. 31–64.
Retallack, G.J., 1997. Neogene expansion of the North American prairie. Palaios 12, 380–390.Schwertmann, U., 1993. Relations between iron oxides, soil color, and soil formation. In: Soil
Ž .Color. Bigham, J.M., Ciolkosz, E.J. Eds. , Soil Sci. Soc. Am. Spec. Publ. 31pp. 51–69.Singer, M.J., Janitzky, P., 1986. Field and laboratory procedures used in a soil chronosequence
study. US Geol. Surv. Bull. 1648, 49 pp.Soil Survey Staff, 1994. Keys to Soil Taxonomy. 6th edn. US Dept. Agric., Soil Man. Supp.
Serv.,, Blacksburg, VA, 524 pp.
( )S.G. Driese et al.rGeoderma 95 2000 179–204204
Templin, E.H., Mowery, I.C., Kunze, G.W., 1956. Houston Black Clay, the type Grumosol: I.Field morphology and geography. Soil Sci. Soc. Am. Proc. 20, 88–90.
White, G.N., Dixon, J.B., 1996. Iron and manganese distribution in nodules from a young TexasVertisol. Soil Sci. Soc. Am. J. 60, 1254–1262.
Wieder, M., Yaalon, D.H., 1974. Effect of matrix composition on carbonate nodule recrystalliza-tion. Geoderma 11, 95–121.
Wilding, L.P., Puentes, R., 1988. Vertisols: Their Distribution, Properties, Classification andManagement. Texas A&M University Printing Center, College Station, 193 pp.
Wilding, L.P., Williams, D., Miller, W., Cook, T., Eswaran, H., 1991. Close interval spatialŽ .variability of Vertisols: a case study in Texas. In: Kimble, J.M. Ed. , Proceedings of the Sixth
Ž .International Soil Correlation Meeting VI ISCOM — Characterization, Classification, andUtilization of Cold Aridisols and Vertisols. USDA, Soil Cons. Serv., Nat. Soil Surv. Center,Lincoln, pp. 232–247.
Williams, D.E., 1948. A rapid manometric method for the determination of carbonate in soils. SoilSci. Soc. Am. Proc. 13, 127–129.