ecology of gracilaria tikvahiae mclachlan (gigartinales ... - CORE
Upload
paris-sorbonneCategory
view
4download
0
Journal of Ecology
2001
89
, 436–450
© 2001 British Ecological Society
436
Blackwell Science, Ltd
Population dynamics and stage structure in a haploid-diploid red seaweed,
Gracilaria gracilis
CAROLYN ENGEL, PER ÅBERG*, OSCAR E. GAGGIOTTI†, CHRISTOPHE DESTOMBE and MYRIAM VALERO
Laboratoire de Génétique et Evolution des Populations Végétales, CNRS UPRESA 8016, GDR 1002, FR 1818, Université de Lille I, Bât. SN2, 59655 Villeneuve d’Ascq Cedex, France,
*
Department of Marine Botany, Goteborg University, Box 461, 405 30 Goteborg, Sweden,
†
Department of Zoology, University of Cambridge, Downing Street, Cambridge CB2 3EJ, UK
Summary
1
Many red seaweeds are characterized by a haploid-diploid life cycle in which popula-tions consist of dioecious haploid (gametophyte) and diploid (tetrasporophyte) individualsas well as an additional diploid zygote-derived sporangium (carposporophyte) stage. Ademographic analysis of
Gracilaria gracilis
populations was carried out to explore andevaluate the population dynamics and stage structure of a typical haploid-diploid redseaweed.
2
Four
G. gracilis
populations were studied at two sites on the French coast of the Straitof Dover. Survival, reproduction and recruitment rates were measured in each popu-lation for up to 4 years. Eight two-sex stage-based population projection matrices werebuilt to describe their demography.
3
All four populations were characterized by high survival and low recruitment rates.Population growth rates (
λ
) were similar between populations and between years andranged from 1.03 to 1.17. In addition, generation times were found to be as long as42 years.
4
Sex and ploidy ratios were variable across populations and over time. Femalefrequencies ranged from 0.31 to 0.59 and tetrasporophyte frequencies from 0.44 to 0.63.However, in most cases, the observed population structures were not significantlydifferent from the calculated stage distributions.
5
Eigenvalue elasticity analysis showed that
λ
was most sensitive to changes in matrixtransitions that corresponded to survival of the gametophyte and tetrasporophyte stages.In contrast, the contribution of the fertility elements to
λ
was small. Eigenvector elasticityanalysis also showed that survival elements had the greatest impact on sex and ploidy ratios.
Key-words
: algal demography, eigenvector elasticity analysis, ploidy ratio, sex ratio,two-sex projection matrix model
Journal of Ecology
(2001)
89
, 436–450
Introduction
Marine algae show a wide diversity of life cycles, spanningthe continuum of the relative importance of the growthand development of haploid and diploid phases: haploid,haploid-diploid and diploid cycles are all representedin seaweeds (De Wreede & Klinger 1988; Valero
et al
.1992; Bell 1994). However, little is known about the
demographic characteristics and consequences of thecomplexities of these life histories.
Matrix population models can accommodate com-plex life cycles and integrate both population dynamicsand population structure, which are determined by thevital rates (mortality, recruitment, reproduction, growth)associated with the different stages of a life cycle.Projection of these matrix models elegantly summar-izes the consequences of the stage-specific vital rates interms of population structure and population growthrate, or mean population fitness (Caswell 1989; Stearns1992). While matrix models have been developed fordifferent life cycles found in marine algae (Ang & DeWreede 1990), they have been applied to only a handful of
Correspondence: M. Valero, Laboratoire de Génétique etEvolution des Populations Végétales, CNRS UPRESA 8016,GDR 1002, FR 1818, Université de Lille I, Bât. SN2, 59655Villeneuve d’Ascq Cedex, France (fax: 33.3.20.43.69.79;e-mail: [email protected]).
JEC567.fm Page 436 Tuesday, May 15, 2001 2:24 PM
437
Demography of the red seaweed,
Gracilaria gracilis
© 2001 British Ecological Society,
Journal of Ecology
,
89
, 436–450
species (e.g. Ang & De Wreede 1990, 1993; Ang
et al
.1990; Åberg 1992; Chapman 1993; Santos 1993; Santos& Nyman 1998). In addition, although many of thesespecies are dioecious, all of these models are one-sexlinear models – as are most matrix models of plant oranimal species (but see Bierzychudek 1982; Meagher1982; Cipollini
et al
. 1994; Legendre
et al
. 1999) –thereby ignoring at least some of the dynamics asso-ciated with sexual reproduction, that is, that male andfemale fertility are interdependent. Furthermore, thedynamics and determinants of the relative frequenciesof the different phases of the more complex algal lifecycles have been largely unexplored.
Red seaweeds typically have complex haploid-diploidlife cycles that are sometimes referred to as triphasic.The three phases are a diploid (tetrasporophyte) phase,a haploid (gametophyte), usually dioecious phaseand an additional diploid, zygote-derived sporangium(carposporophyte) phase. While the gametophyte andtetrasporophyte stages are independent, the carpos-porophyte stage develops on the gametophyte thallus. Asin all sexual life cycles, the three phases are intercon-nected through meiosis and syngamy. Meiosis takesplace on the tetrasporophyte plants, giving rise tohaploid tetraspores. Tetraspores develop into gameto-phytes, which produce gametes by mitosis. Fertilization(syngamy) occurs on the female gametophyte and thefertilized female gamete develops into a carposporophyte.Cystocarps are macroscopic hemispherical swellingsobserved on the surface of female branches, withinwhich the carposporophyte produces thousands ofdiploid carpospores. Finally, completing the cycle, eachcarpospore can develop into a tetrasporophyte. Thus,the alternating haploid and diploid phases in mosthaploid-diploid red algae occur as biologically distinctstages. Paradoxically, the recruitment and the relativefrequencies of the gametophyte stage depend on thevital rates of the tetrasporophyte stage, and
vice versa
(Destombe
et al
. 1989).Populations of the red haploid-diploid alga
Gracilariagracilis
consist of four readily observable stages: cysto-carps, tetrasporophytes, female gametophytes and malegametophytes. Thus this species provides an excellentopportunity to explore the demography of a typical redseaweed life history. Moreover, using stage-specificvital rates as matrix elements, a matrix model approachto the study of population dynamics allows a finelytuned evaluation of the interplay between phases.Specifically, analysis of matrices provides insight intothe contribution of the various stage-specific life historyparameters to population fitness and to populationstage structure. Eigenvalue elasticity analyses measurethe fitness responses of a population to small changesin the matrix elements (Caswell 1989; for review seeBenton & Grant 1999). By extension, the eigenvectorelasticity analysis measures the effect of small changesin the matrix elements on the population structure, i.e.on the ploidy (tetrasporophyte:gametophyte) ratio andthe sex (female:male) ratio.
The aim of this paper is to explore and evaluate thepopulation dynamics and stage structure of a typicalred seaweed,
G. gracilis
. Vital rates were measured forup to 4 years in four populations located in the Straitof Dover. The ultimate consequences of spatial andtemporal variation in these vital rates are investigatedusing two-sex matrix models that accommodate thetetrasporophyte, gametophyte and carposporophytestages. Using eigenvalue elasticity analyses, we identifythe demographic parameters that most influencepopulation fitness. Further, we develop an eigenvectorelasticity analysis of population structure to explorethe effects of small proportional changes in the matrixelements on sex and ploidy ratios.
Methods
In
Gracilaria gracilis
, the tetrasporophytic, femalegametophytic and male gametophytic individuals areisomorphic. The thallus is an erect system of deciduousspaghetti-like branches that grow from the holdfast,fixing the individual to the substrate. Male and tetra-sporophytic individuals can be distinguished by theirreproductive structures, which are readily visible undera dissecting microscope, while female individuals arerecognized by the presence of cystocarps.
This study was carried out in the Strait of Doverregion, where previous studies have established thatreproductive maturity, growth and cystocarp produc-tion reach a maximum in August–September (Destombe1987; Destombe
et al
. 1988, 1989). After September,branches weaken and break off, and all three typesof individual are quiescent in the winter months. Newbranches grow back in the spring (March–April).Reproductive structures – tetrasporangia (the site ofmeiosis) in tetrasporophytes, and gametangia in game-tophytes – are uniformly distributed along the branchand are produced as the branch grows (Kling & Bodard1987). Each tetrasporangium produces four tetrasporesand the primary sex (female:male) ratio of tetrasporesis 1:1. Male gametangia develop into concave malecrypts, each producing thousands of male gametes.Female reproductive structures produce a single gamete.Cystocarps reach maturity
c.
1 month after fertilization;the carpospores are liberated over 6–10 weeks (Lefebvre
et al
. 1987). Cystocarps do not survive from year to yearand are lost when the female branches senesce. Likewise,there is no spore bank: tetraspores and carposporeseither settle or disintegrate (cf. Destombe
et al
. 1992).Spores that settle and germinate form a basal holdfastand the first branches appear after
c.
3 weeks (Destombe
et al
. 1993). However, these recruits are not detectable bef-ore the following year, when they reach
c
. 2 cm in length.
G. gracilis
individuals occupy intertidal rock poolswhere they remain immersed at ebb tide. The rockyintertidal zone in the study area is a dynamic landscapecomposed of bedrock, rock outcrops and sand. Rock
JEC567.fm Page 437 Tuesday, May 15, 2001 2:24 PM
438
C. Engel
et al
.
© 2001 British Ecological Society,
Journal of Ecology
,
89
, 436–450
pools are patchily distributed; those occupied by
G. gracilis
are found below the mean tide level. Four rock pools, eachcontaining a group of plants described as a population,were studied at Cape Gris-Nez (50
°
53
′
N, 1
°
35
′
E) andat Audresselles (50
°
49
′
N, 1
°
35
′
E), 3 km further south,on the French coast of the Strait of Dover. Two rockpools were selected at different tide levels at each site(Table 1). High and low populations are, respectively,noted as GNH and GNL at Gris-Nez and AuH andAuL at Audresselles. Due to differences in the slopeof the shore, GNH and GNL are separated by a dis-tance of 25 m, while AuH and AuL are separated by100 m.
Plants within the rock pools were mapped relative to apair of fixed points. In this study, we followed individualplants (genets), delimited by the branches arisingfrom a single holdfast. It is often difficult to distinguishgenets of algae (e.g. Åberg 1989; Lindgren
et al
. 1998),but for
G. gracilis
, previous studies have confirmed, withgenetic markers, that branches of a common holdfastare genetically identical while branches arising fromdifferent holdfasts are genetically distinct (Wattier
et al
.1997; Engel
et al
. 1999). To estimate the vital rates,between two and four censuses were carried out, once ayear, in each population (see Table 1).
At every census, maximum thallus length andmaximum thallus diameter were recorded for eachindividual observed in the rock pool. Total individualbiomass was represented by the volume of a cylinder ofthis length and diameter. For
G.
gracilis
, as for otheralgal species (e.g. Åberg 1990; Lindgren
et al
. 1998), thisestimate is non-destructive, easy to make in the fieldand significantly correlated with dry weight (
R
2
=
0.87;
P
< 0.0001;
n
=
74). Due to the deciduous nature ofbranches, measurements taken at the end of the grow-ing season estimate the current year’s growth. As theproduction of gametangia and tetrasporangia is alsoa function of branch growth in
G. gracilis
(see above),volume provides an index of both annual net growthand fecundity (i.e. gamete or spore production). Finally,several branches of each individual were sampled andexamined under a dissecting microscope to establishthe ploidy level and sex of each individual based on theobserved reproductive structures.
To assess the total number of cystocarps producedby a population, we counted, for every female, thecystocarps found on the 10-cm distal extremity of threebranches. Cystocarp production was estimated for eachfemale by multiplying the average number of cystocarpscm
–3
of thallus (assuming a branch diameter of 1 mm)by the total volume of the female individual. The sumof the individual female cystocarp production estimatesthus gives an estimate of the number of cystocarpsproduced by one population during one reproductiveseason (cf. Destombe 1987).
A total of 554 individuals was sampled in the fourpopulations (Table 1). The field data provided detailedinformation on the fate of each individual plant in eachpool from one year to the next. From these data, webuilt eight stage-based population projection matrices.
Matrix construction
Matrices were constructed on the basis of a life-cyclediagram representing four stages of a rhodophytehaploid-diploid life cycle: cystocarps (
C
), tetrasporo-phytes (
T
) and female (
F
) and male (
M
) gameto-phytes (Fig. 1a). (Letters are used as subscripts toindicate the respective stages throughout the restof the paper.) Males were explicitly included in thematrix in order to fully explore the dynamics of popu-lation structure in terms of sex and ploidy ratios.
For the construction of the matrices, we made twoassumptions: (i) censuses were carried out after theproduction of cystocarps and (ii) mortality took placebefore reproduction. Stage-specific reproductive outputentries (
f
) were calculated as functions of recruitmentinto the following stage, i.e. as effective fertilities.Cystocarp fertility (
f
TC
) was calculated by dividing thenumber of tetrasporophyte recruits in year
t
+ 1 by thenumber of cystocarps produced in year
t
. Likewise,tetrasporophyte fertilities (
f
FT
and
f
MT
) were based onthe recruitment rates of females and males. Finally,male and female fertilities (
f
CF
and
f
CM
) were assumedto be frequency-dependent; that is, each depends onthe relative abundance of the other sex. The fertilityfunctions were derived from the number of cystocarpsproduced in one reproductive season (
n
C
) using theharmonic mean birth function (Caswell 1989):
Table 1 Characteristics of the four tide pools studied
Pool Tide level*(m) Pool surface area (m2) No of plants sampled† Census years
GNH 2.8 4.5 208 1995/96/97/98GNL 1.3 14.0 115 1997‡/98AuH 4.9 17.5 164 1996/97/98AuL 2.3 16.5 67 1996/97/98
*Above chart datum according to http://www.shom.fr; the mean tide level is 4.91 m on the French coast of the Strait of Dover. †Over period of study. Not all individuals were necessarily alive at one time. ‡Census carried out in June. All other censuses took place in September.
JEC567.fm Page 438 Tuesday, May 15, 2001 2:24 PM

439
Demography of the red seaweed,
Gracilaria gracilis
© 2001 British Ecological Society,
Journal of Ecology
,
89
, 436–450
where
k
is the clutch size, or the average number ofcystocarps produced by one male and one femalegametophyte, and
n
F
and
n
M
are the number of femalesand males, respectively. Thus male and female fertility,respectively, are given by:
and
The dynamics of a
G. gracilis
population can thus bedescribed by the non-linear projection matrix A (Fig. 1b),the elements
a
ij
of which represent the transitions fromstage
j
to stage
i
over 1 year. The corresponding projec-tion equation is given by:
n
(
t
+ 1)
=
A
n
n(
t
)
where the vector n(
t
)
=
[
n
C
n
T
n
F
n
M
], represents thenumbers in each of the four stage classes and the sub-script
n
indicates that A depends on
n
F
and
n
M
.
As A
n
is continuous and frequency-dependent, anon-trivial equilibrium population structure exists thatcan be obtained directly from the life cycle graph usingthe z-transform method (Caswell 1989). The populationgrowth rate at equilibrium,
λ
, is obtained from thecharacteristic equation:
eqn 1
Bootstrap confidence intervals for
λ
were obtainedusing the bias-corrected percentile method (Caswell1989) with a bootstrap sample size of 5000.
The relative stage distribution at equilibrium is givenby the dominant right eigenvector w:
eqn 2
As at equilibrium
f
CF
and
f
CM
are themselves func-tions of w, equations 1 and 2 must be solved simul-taneously to obtain
λ
and w. From these stable stagedistributions, we obtained the relative proportions ofthe tetrasporophyte, and female and male gametophytestages.
The stage-specific reproductive values are given bythe dominant left eigenvector, v:
Reproductive values express the probable contribu-tion of a stage class to future population growth throughcurrent and expected reproduction.
The damping ratio (
ρ
) is a measure of how fast apopulation will converge to the stable stage distributionand is defined as the dominant eigenvalue (
λ
1
) dividedby the absolute value of the largest subdominanteigenvalue (
λ
2
) (Caswell 1989).Finally, using the methodology presented by Caswell
(1989) it is possible to obtain an expression for themean generation time (i.e. mean age of parents ofoffspring produced at stable stage distribution) ( ) in
t
he stable population. For the life cycle presented inFig. 1 we obtain:
for i
=
1, 2
where
and
nC
2knF nM
nF nM+--------------------=
Fig. 1 Life-cycle graph for Gracilaria gracilis (a) and its cor-responding population projection matrix (b). Circles representthe different stages included in the model (filled = diploidstages; C = cystocarp, T = tetrasporophyte; open = haploidstages; F = female gametophyte, M = male gametophyte) andarrows represent the possible transitions (aij) from stage classj to stage class i over 1 year’s time. Matrix elements (aij) aresubdivided into fertility ( f ) and survival (P).
fCF
knM
nF nM+--------------------= fCM
knF
nF nM+--------------------=
1fTC
λ λ − PT( )------------------------
fFT fCF
λ − PF( )--------------------
fMT fCM
λ − PM( )----------------------+=
wC 1=
wT
fTC
λ − PT----------------=
wF
fTC fFT
λ − PT( ) λ − PF( )-----------------------------------------=
wMfTC fMT
λ − PT( ) λ − PM( )------------------------------------------=
vc 1=
vTfCF fFT
λ − PT( ) λ − PF( )------------------------------------------
fCM fMT
λ − PT( ) λ − PM( )-------------------------------------------+=
vF
fCF
λ − PF( )--------------------=
vM
fCM
λ − PM( )----------------------=
A
A = −λ ∂Li
∂λ--------
i∑
λ λ1=
L1
fTC fFT fCF
λ λ − PT( ) λ − PF( )---------------------------------------------=
L2
fTC fMT fCM
λ λ − PT( ) λ − PM( )----------------------------------------------=
JEC567.fm Page 439 Tuesday, May 15, 2001 2:24 PM
440C. Engel et al.
© 2001 British Ecological Society, Journal of Ecology, 89, 436–450
Eigenvalue elasticity analysis
Eigenvalue elasticities (eij) are calculated by measuringthe proportional change in λ caused by proportionalchanges in one of the aij matrix elements (Caswell 1989,equation 6.38, p. 132).
Eigenvector elasticity analysis
As we were interested in exploring the effects of smallchanges in the matrix elements on the sex and ploidyratios, we developed an eigenvector elasticity analysis.We measured the relative changes in the stable stagedistribution (w) when small changes were made to thematrix elements. We proceeded as follows. Matrixelement aij was multiplied by a factor (x) close to, butsmaller than, unity. Population growth was simulatedfrom t = 0 to t = 200, and a new stable stage distribution(w’) was obtained. Elasticities of the matrix elementsequal the change in the frequency of females (sij) or thefrequency of diploids (gij):
where 1/(1 − x) is a scaling factor correcting for theabsolute size of factor x. Factor x was first set to 0.99and then the process was repeated with a factor closerto unity (0.999, 0.9999, etc.) until the sij and gij valuesconverged to stable values (5 significant digits). Ascystocarp production remains constant in the simula-tions, a change in the initial values of fCF and fCM has noeffect on the final stable matrix. We thus performed anelasticity analysis on k. We decreased k by the samefactor used for the matrix elements and proceeded asabove. The subsequent change in the sex ratio (i.e. sk)was divided evenly among fCF and fCM so that sCF,sCM = 0.5sk. As we are dealing with relative frequencieswhich add up to unity, the sum of the sij’s, and of thegij’s, is zero. However, absolute values cannot be com-pared between matrices.
s were used to test for differences in volume,survival and recruitment according to sex, census year(or interval) and population. The factor populationwas designated random while census year (or interval)and stage were treated as fixed factors. Volume wastested using a three-way with replication. Thedata set was balanced by taking a random sample of 10individuals per stage from census years 1997 and 1998for all four populations. Survival and recruitment were
tested using a three-way without replication. Onlydata from the 1996–97 and 1997–98 census periodsof the GNH, AuH and AuL pools were selected toobtain balanced data sets. Error terms were definedbased on three-factor mixed model expected meansquares, although the three-way interaction couldnot be tested as there are no replicates. The assump-tion of homogeneity of variances was tested withCochran’s test (Winer et al. 1991). Fourth-root (volume)and arcsine (survival probabilities) transformationssuccessfully reduced significantly heterogeneousvariances.
Results
Vital rates
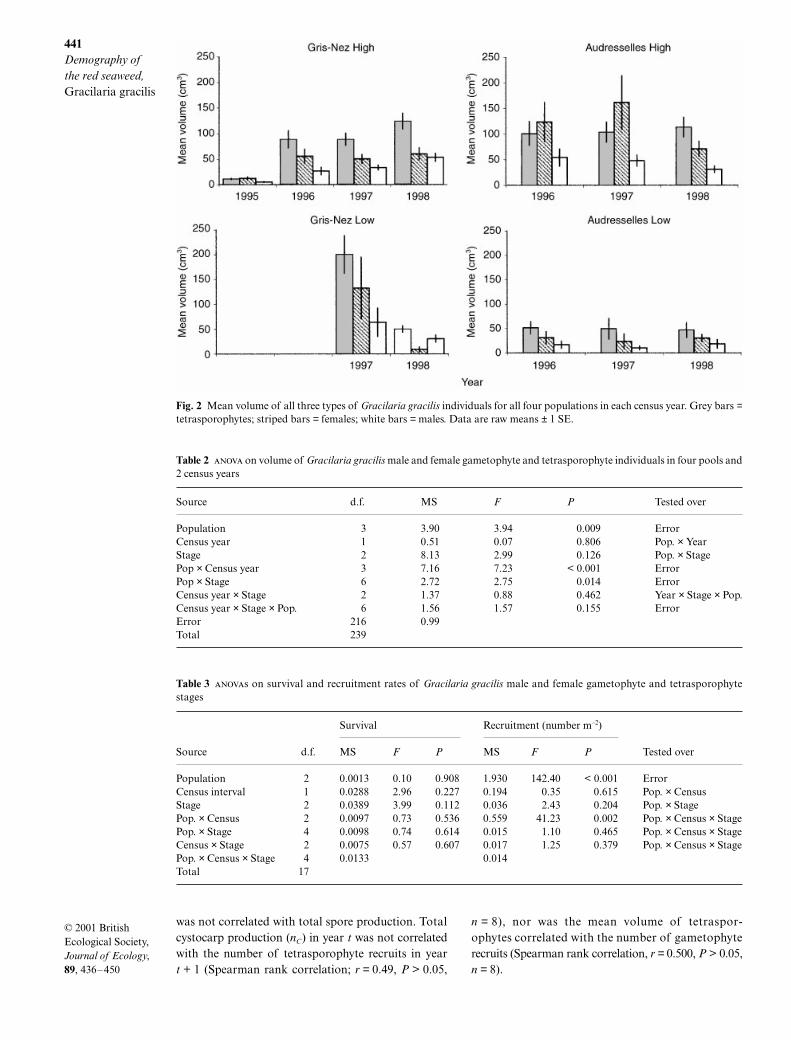
We used individual volume to assess annual net growthand fecundity. Figure 2 shows the mean volume of tetra-sporophytes, females and males for each populationand year. The three-factor showed two significantinteractions, between stage and population and betweenpopulation and year (Table 2); as the interactions involvedall three main effects, these are not discussed individu-ally. Males were almost always smaller than females andtetrasporophytes. Females were either smaller than (inpopulations GNL and AuL) or similar in size to tetra-sporophytes (populations GNH and AuH) (Fig. 2).The mean size of individuals increased from 1997 to1998 in GNH and AuL, but decreased in the GNL andAuH populations. This pattern suggests that net growth(or fecundity) typically shows yearly variation but thatthere were no regional-scale environmental events thataffected all populations similarly. This yearly variationin size is probably caused by small-scale, stochastic,pool-level processes.
Survival was high for all three types of individual inall the populations and census periods (mean survivalprobability ± SE, %CV: tetrasporophytes, 0.98 ± 0.01,1.5%; females, 0.96 ± 0.02, 6.5%; males, 0.95 ± 0.02,4.5%; n = 8). These survival rates did not differ signi-ficantly between stages, between years, or between yearswithin populations (Table 3).
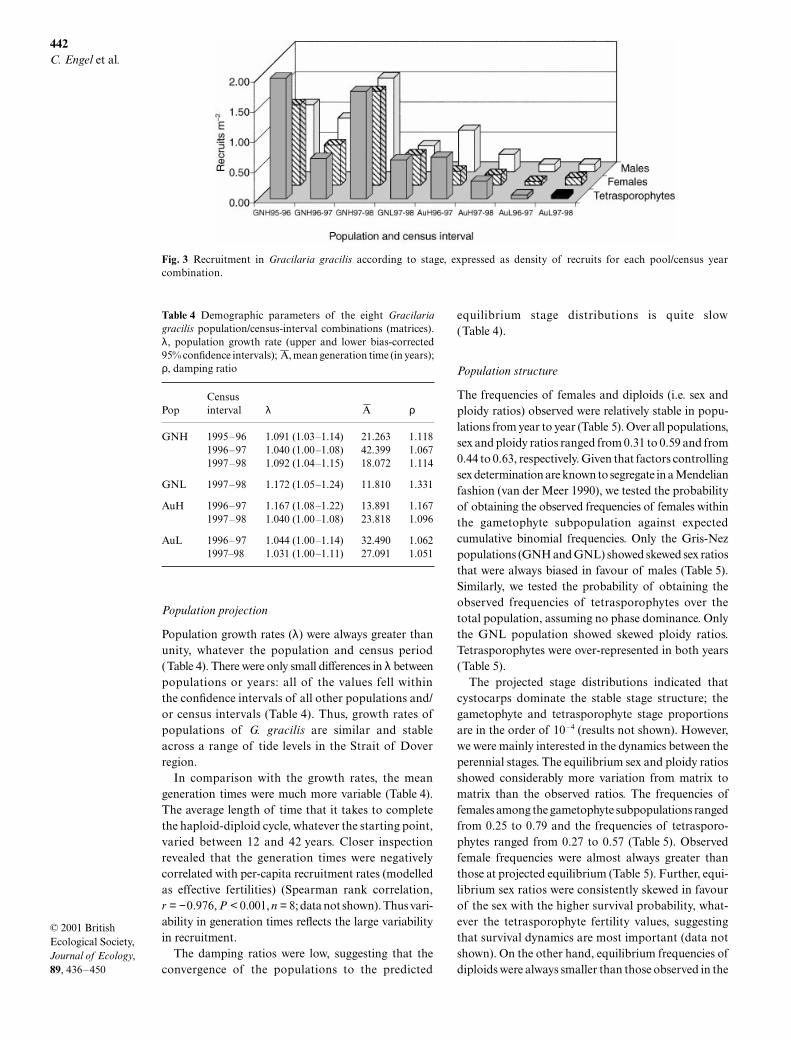
At least one individual was recruited into each stageat all census intervals in all populations (mean 5.29 recruitsstage–1 years–1, SE 0.66) (Fig. 3). Recruitment was morevariable than survival (%CV, tetrasporophytes, 33.7%;females 35.0%; males, 27.8%; n = 8). Some of this vari-ation can be explained by population-specific yearlyvariation (significant population × census interval inter-action, Table 3) which precludes interpretation of thesignificant population main effect. Overall recruitmentincreased from the 1996–97 to the 1997–98 census intervalin the GNH population while it decreased in the AuHpopulation (Fig. 3). Neither the stage factor nor anyinteractions including stage accounted for any signi-ficant variation. Further, the variation in recruitment
sij
wF
wF wM+-------------------- −w′F
w′F w′M+--------------------
1 − x------------------------------------------------=
gij
wT
wT +wF + wM--------------------------------- −
w′TwT + w′F + w′M---------------------------------
1 − x---------------------------------------------------------------------------=
JEC567.fm Page 440 Tuesday, May 15, 2001 2:24 PM
441Demography of the red seaweed, Gracilaria gracilis
© 2001 British Ecological Society, Journal of Ecology, 89, 436–450
was not correlated with total spore production. Totalcystocarp production (nC) in year t was not correlatedwith the number of tetrasporophyte recruits in yeart + 1 (Spearman rank correlation; r = 0.49, P > 0.05,
n = 8), nor was the mean volume of tetraspor-ophytes correlated with the number of gametophyterecruits (Spearman rank correlation, r = 0.500, P > 0.05,n = 8).
Fig. 2 Mean volume of all three types of Gracilaria gracilis individuals for all four populations in each census year. Grey bars =tetrasporophytes; striped bars = females; white bars = males. Data are raw means ± 1 SE.
Table 2 on volume of Gracilaria gracilis male and female gametophyte and tetrasporophyte individuals in four pools and2 census years
Table 3 s on survival and recruitment rates of Gracilaria gracilis male and female gametophyte and tetrasporophytestages
Source d.f. MS F P Tested over
Population 3 3.90 3.94 0.009 ErrorCensus year 1 0.51 0.07 0.806 Pop. × YearStage 2 8.13 2.99 0.126 Pop. × StagePop × Census year 3 7.16 7.23 < 0.001 ErrorPop × Stage 6 2.72 2.75 0.014 ErrorCensus year × Stage 2 1.37 0.88 0.462 Year × Stage × Pop.Census year × Stage × Pop. 6 1.56 1.57 0.155 ErrorError 216 0.99Total 239
Survival Recruitment (number m–2)
Tested overSource d.f. MS F P MS F P
Population 2 0.0013 0.10 0.908 1.930 142.40 < 0.001 ErrorCensus interval 1 0.0288 2.96 0.227 0.194 0.35 0.615 Pop. × CensusStage 2 0.0389 3.99 0.112 0.036 2.43 0.204 Pop. × StagePop. × Census 2 0.0097 0.73 0.536 0.559 41.23 0.002 Pop. × Census × StagePop. × Stage 4 0.0098 0.74 0.614 0.015 1.10 0.465 Pop. × Census × StageCensus × Stage 2 0.0075 0.57 0.607 0.017 1.25 0.379 Pop. × Census × StagePop. × Census × Stage 4 0.0133 0.014Total 17
JEC567.fm Page 441 Tuesday, May 15, 2001 2:24 PM
442C. Engel et al.
© 2001 British Ecological Society, Journal of Ecology, 89, 436–450
Population projection
Population growth rates (λ) were always greater thanunity, whatever the population and census period(Table 4). There were only small differences in λ betweenpopulations or years: all of the values fell withinthe confidence intervals of all other populations and/or census intervals (Table 4). Thus, growth rates ofpopulations of G. gracilis are similar and stableacross a range of tide levels in the Strait of Doverregion.
In comparison with the growth rates, the meangeneration times were much more variable (Table 4).The average length of time that it takes to completethe haploid-diploid cycle, whatever the starting point,varied between 12 and 42 years. Closer inspectionrevealed that the generation times were negativelycorrelated with per-capita recruitment rates (modelledas effective fertilities) (Spearman rank correlation,r = −0.976, P < 0.001, n = 8; data not shown). Thus vari-ability in generation times reflects the large variabilityin recruitment.
The damping ratios were low, suggesting that theconvergence of the populations to the predicted
equilibrium stage distributions is quite slow(Table 4).
Population structure
The frequencies of females and diploids (i.e. sex andploidy ratios) observed were relatively stable in popu-lations from year to year (Table 5). Over all populations,sex and ploidy ratios ranged from 0.31 to 0.59 and from0.44 to 0.63, respectively. Given that factors controllingsex determination are known to segregate in a Mendelianfashion (van der Meer 1990), we tested the probabilityof obtaining the observed frequencies of females withinthe gametophyte subpopulation against expectedcumulative binomial frequencies. Only the Gris-Nezpopulations (GNH and GNL) showed skewed sex ratiosthat were always biased in favour of males (Table 5).Similarly, we tested the probability of obtaining theobserved frequencies of tetrasporophytes over thetotal population, assuming no phase dominance. Onlythe GNL population showed skewed ploidy ratios.Tetrasporophytes were over-represented in both years(Table 5).
The projected stage distributions indicated thatcystocarps dominate the stable stage structure; thegametophyte and tetrasporophyte stage proportionsare in the order of 10 –4 (results not shown). However,we were mainly interested in the dynamics between theperennial stages. The equilibrium sex and ploidy ratiosshowed considerably more variation from matrix tomatrix than the observed ratios. The frequencies offemales among the gametophyte subpopulations rangedfrom 0.25 to 0.79 and the frequencies of tetrasporo-phytes ranged from 0.27 to 0.57 (Table 5). Observedfemale frequencies were almost always greater thanthose at projected equilibrium (Table 5). Further, equi-librium sex ratios were consistently skewed in favourof the sex with the higher survival probability, what-ever the tetrasporophyte fertility values, suggestingthat survival dynamics are most important (data notshown). On the other hand, equilibrium frequencies ofdiploids were always smaller than those observed in the
Fig. 3 Recruitment in Gracilaria gracilis according to stage, expressed as density of recruits for each pool/census yearcombination.
Table 4 Demographic parameters of the eight Gracilariagracilis population/census-interval combinations (matrices).λ, population growth rate (upper and lower bias-corrected95% confidence intervals); , mean generation time (in years);ρ, damping ratio
PopCensus interval λ ρ
GNH 1995–96 1.091 (1.03–1.14) 21.263 1.1181996–97 1.040 (1.00–1.08) 42.399 1.0671997–98 1.092 (1.04–1.15) 18.072 1.114
GNL 1997–98 1.172 (1.05–1.24) 11.810 1.331
AuH 1996–97 1.167 (1.08–1.22) 13.891 1.1671997–98 1.040 (1.00–1.08) 23.818 1.096
AuL 1996–97 1.044 (1.00–1.14) 32.490 1.0621997–98 1.031 (1.00–1.11) 27.091 1.051
A
A
JEC567.fm Page 442 Tuesday, May 15, 2001 2:24 PM
443Demography of the red seaweed, Gracilaria gracilis
© 2001 British Ecological Society, Journal of Ecology, 89, 436–450
populations (Table 5). Using the log likelihood ratio,G, we compared the observed and calculated stage dis-tributions. The results show that observed populationstructures were generally close to those expected atequilibrium (Table 5). Only three population/census-interval combinations showed significant departurefrom the calculated equilibrium distribution. Ingeneral, the differences were due to changes in theoverall structure of the population. AuH1996–97and AuL1997–98 showed large differences betweenobserved and equilibrium sex and ploidy ratios, whileGNH1997–98 showed substantial divergence primarilyin the sex ratio (Table 5).
Reproductive values
The highest reproductive values were associated withthe tetrasporophyte stage in all but one case (AuH1996–97, Table 6). Within the gametophyte stage, femaleshad reproductive values larger than or equal to males insix out of eight matrices. In general, populations havesimilar reproductive patterns across tide levels, sites,and in time.
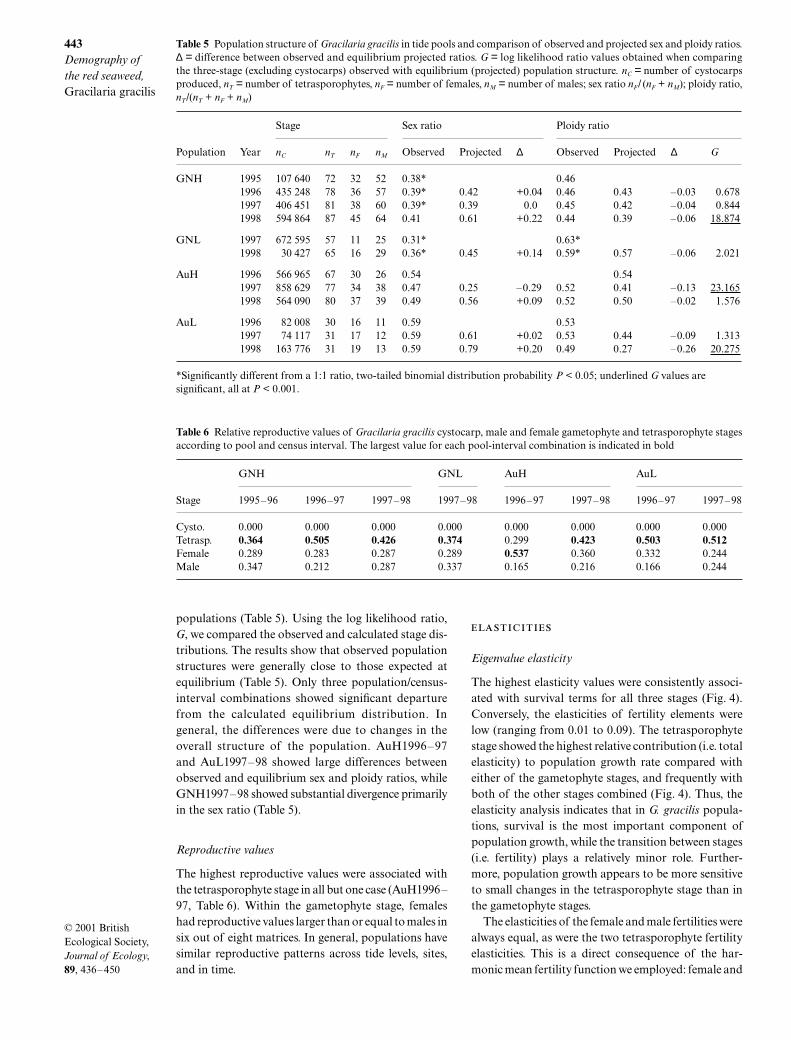
Eigenvalue elasticity
The highest elasticity values were consistently associ-ated with survival terms for all three stages (Fig. 4).Conversely, the elasticities of fertility elements werelow (ranging from 0.01 to 0.09). The tetrasporophytestage showed the highest relative contribution (i.e. totalelasticity) to population growth rate compared witheither of the gametophyte stages, and frequently withboth of the other stages combined (Fig. 4). Thus, theelasticity analysis indicates that in G. gracilis popula-tions, survival is the most important component ofpopulation growth, while the transition between stages(i.e. fertility) plays a relatively minor role. Further-more, population growth appears to be more sensitiveto small changes in the tetrasporophyte stage than inthe gametophyte stages.
The elasticities of the female and male fertilities werealways equal, as were the two tetrasporophyte fertilityelasticities. This is a direct consequence of the har-monic mean fertility function we employed: female and
Table 5 Population structure of Gracilaria gracilis in tide pools and comparison of observed and projected sex and ploidy ratios.∆ = difference between observed and equilibrium projected ratios. G = log likelihood ratio values obtained when comparingthe three-stage (excluding cystocarps) observed with equilibrium (projected) population structure. nC = number of cystocarpsproduced, nT = number of tetrasporophytes, nF = number of females, nM = number of males; sex ratio nF/ (nF + nM); ploidy ratio,nT/(nT + nF + nM)
Table 6 Relative reproductive values of Gracilaria gracilis cystocarp, male and female gametophyte and tetrasporophyte stagesaccording to pool and census interval. The largest value for each pool-interval combination is indicated in bold
Stage Sex ratio Ploidy ratio
Population Year nC nT nF nM Observed Projected ∆ Observed Projected ∆ G
GNH 1995 107 640 72 32 52 0.38* 0.461996 435 248 78 36 57 0.39* 0.42 +0.04 0.46 0.43 –0.03 0.6781997 406 451 81 38 60 0.39* 0.39 0.0 0.45 0.42 –0.04 0.8441998 594 864 87 45 64 0.41 0.61 +0.22 0.44 0.39 –0.06 18.874
GNL 1997 672 595 57 11 25 0.31* 0.63*1998 30 427 65 16 29 0.36* 0.45 +0.14 0.59* 0.57 –0.06 2.021
AuH 1996 566 965 67 30 26 0.54 0.541997 858 629 77 34 38 0.47 0.25 –0.29 0.52 0.41 –0.13 23.1651998 564 090 80 37 39 0.49 0.56 +0.09 0.52 0.50 –0.02 1.576
AuL 1996 82 008 30 16 11 0.59 0.531997 74 117 31 17 12 0.59 0.61 +0.02 0.53 0.44 –0.09 1.3131998 163 776 31 19 13 0.59 0.79 +0.20 0.49 0.27 –0.26 20.275
*Significantly different from a 1:1 ratio, two-tailed binomial distribution probability P < 0.05; underlined G values are significant, all at P < 0.001.
GNH GNL AuH AuL
Stage 1995–96 1996–97 1997–98 1997–98 1996–97 1997–98 1996–97 1997–98
Cysto. 0.000 0.000 0.000 0.000 0.000 0.000 0.000 0.000Tetrasp. 0.364 0.505 0.426 0.374 0.299 0.423 0.503 0.512Female 0.289 0.283 0.287 0.289 0.537 0.360 0.332 0.244Male 0.347 0.212 0.287 0.337 0.165 0.216 0.166 0.244
JEC567.fm Page 443 Tuesday, May 15, 2001 2:24 PM
444C. Engel et al.
© 2001 British Ecological Society, Journal of Ecology, 89, 436–450
male fertilities are interdependent. Thus male and femalefertilities and production rates (through tetrasporophytefertility) contribute equally to the population growth rate.
Eigenvector elasticities
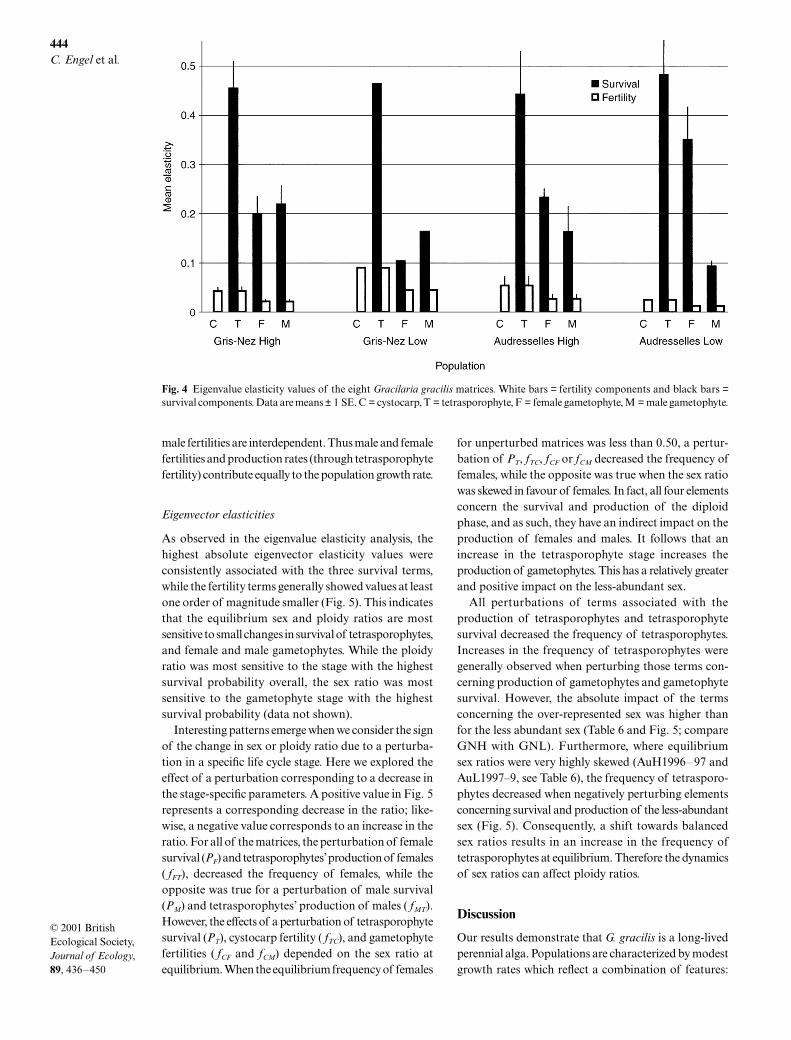
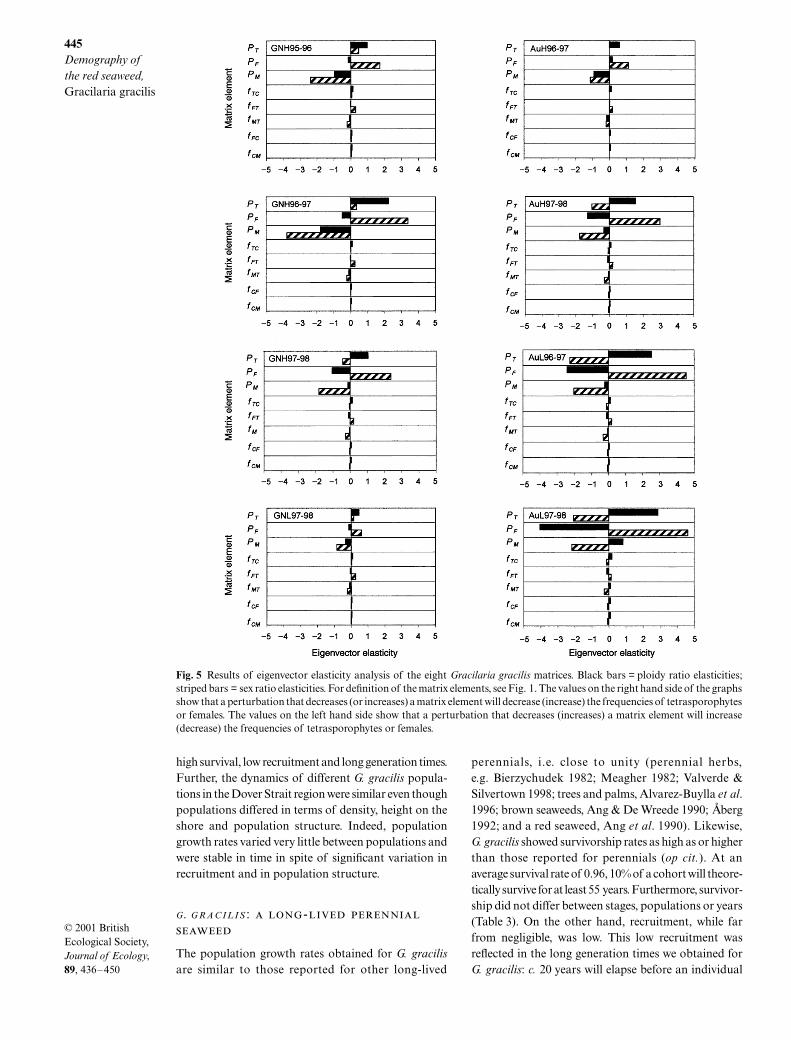
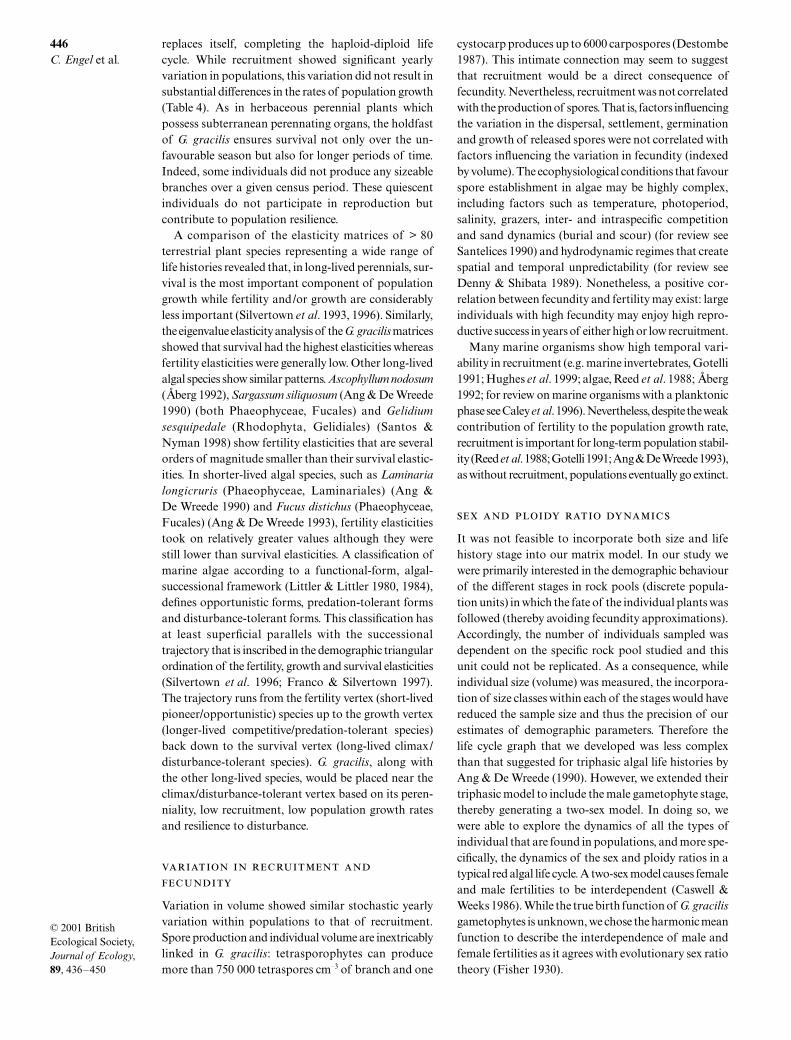
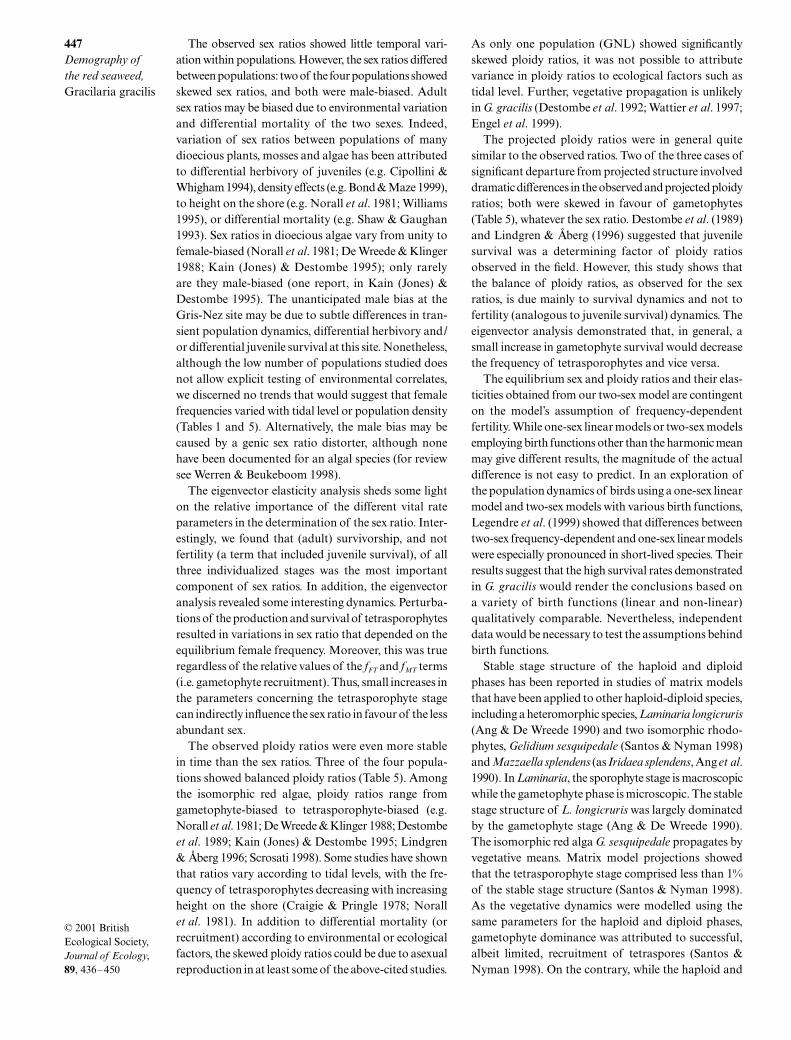
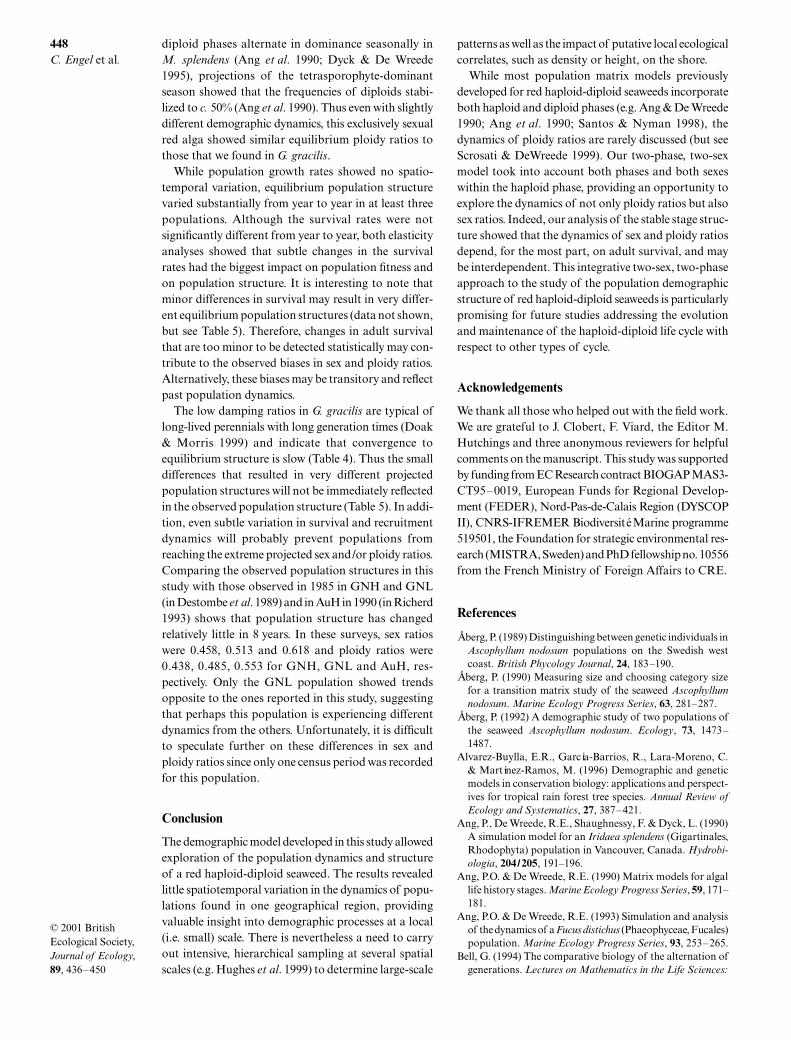
As observed in the eigenvalue elasticity analysis, thehighest absolute eigenvector elasticity values wereconsistently associated with the three survival terms,while the fertility terms generally showed values at leastone order of magnitude smaller (Fig. 5). This indicatesthat the equilibrium sex and ploidy ratios are mostsensitive to small changes in survival of tetrasporophytes,and female and male gametophytes. While the ploidyratio was most sensitive to the stage with the highestsurvival probability overall, the sex ratio was mostsensitive to the gametophyte stage with the highestsurvival probability (data not shown).
Interesting patterns emerge when we consider the signof the change in sex or ploidy ratio due to a perturba-tion in a specific life cycle stage. Here we explored theeffect of a perturbation corresponding to a decrease inthe stage-specific parameters. A positive value in Fig. 5represents a corresponding decrease in the ratio; like-wise, a negative value corresponds to an increase in theratio. For all of the matrices, the perturbation of femalesurvival (PF) and tetrasporophytes’ production of females( fFT), decreased the frequency of females, while theopposite was true for a perturbation of male survival(PM) and tetrasporophytes’ production of males ( fMT).However, the effects of a perturbation of tetrasporophytesurvival (PT), cystocarp fertility ( fTC), and gametophytefertilities ( fCF and fCM) depended on the sex ratio atequilibrium. When the equilibrium frequency of females
for unperturbed matrices was less than 0.50, a pertur-bation of PT, fTC, fCF or fCM decreased the frequency offemales, while the opposite was true when the sex ratiowas skewed in favour of females. In fact, all four elementsconcern the survival and production of the diploidphase, and as such, they have an indirect impact on theproduction of females and males. It follows that anincrease in the tetrasporophyte stage increases theproduction of gametophytes. This has a relatively greaterand positive impact on the less-abundant sex.
All perturbations of terms associated with theproduction of tetrasporophytes and tetrasporophytesurvival decreased the frequency of tetrasporophytes.Increases in the frequency of tetrasporophytes weregenerally observed when perturbing those terms con-cerning production of gametophytes and gametophytesurvival. However, the absolute impact of the termsconcerning the over-represented sex was higher thanfor the less abundant sex (Table 6 and Fig. 5; compareGNH with GNL). Furthermore, where equilibriumsex ratios were very highly skewed (AuH1996–97 andAuL1997–9, see Table 6), the frequency of tetrasporo-phytes decreased when negatively perturbing elementsconcerning survival and production of the less-abundantsex (Fig. 5). Consequently, a shift towards balancedsex ratios results in an increase in the frequency oftetrasporophytes at equilibrium. Therefore the dynamicsof sex ratios can affect ploidy ratios.
Discussion
Our results demonstrate that G. gracilis is a long-livedperennial alga. Populations are characterized by modestgrowth rates which reflect a combination of features:
Fig. 4 Eigenvalue elasticity values of the eight Gracilaria gracilis matrices. White bars = fertility components and black bars =survival components. Data are means ± 1 SE. C = cystocarp, T = tetrasporophyte, F = female gametophyte, M = male gametophyte.
JEC567.fm Page 444 Tuesday, May 15, 2001 2:24 PM
445Demography of the red seaweed, Gracilaria gracilis
© 2001 British Ecological Society, Journal of Ecology, 89, 436–450
high survival, low recruitment and long generation times.Further, the dynamics of different G. gracilis popula-tions in the Dover Strait region were similar even thoughpopulations differed in terms of density, height on theshore and population structure. Indeed, populationgrowth rates varied very little between populations andwere stable in time in spite of significant variation inrecruitment and in population structure.
G. G R A C I L I S : -
The population growth rates obtained for G. gracilisare similar to those reported for other long-lived
perennials, i.e. close to unity (perennial herbs,e.g. Bierzychudek 1982; Meagher 1982; Valverde &Silvertown 1998; trees and palms, Alvarez-Buylla et al.1996; brown seaweeds, Ang & De Wreede 1990; Åberg1992; and a red seaweed, Ang et al. 1990). Likewise,G. gracilis showed survivorship rates as high as or higherthan those reported for perennials (op cit.). At anaverage survival rate of 0.96, 10% of a cohort will theore-tically survive for at least 55 years. Furthermore, survivor-ship did not differ between stages, populations or years(Table 3). On the other hand, recruitment, while farfrom negligible, was low. This low recruitment wasreflected in the long generation times we obtained forG. gracilis: c. 20 years will elapse before an individual
Fig. 5 Results of eigenvector elasticity analysis of the eight Gracilaria gracilis matrices. Black bars = ploidy ratio elasticities;striped bars = sex ratio elasticities. For definition of the matrix elements, see Fig. 1. The values on the right hand side of the graphsshow that a perturbation that decreases (or increases) a matrix element will decrease (increase) the frequencies of tetrasporophytesor females. The values on the left hand side show that a perturbation that decreases (increases) a matrix element will increase(decrease) the frequencies of tetrasporophytes or females.
JEC567.fm Page 445 Tuesday, May 15, 2001 2:24 PM
446C. Engel et al.
© 2001 British Ecological Society, Journal of Ecology, 89, 436–450
replaces itself, completing the haploid-diploid lifecycle. While recruitment showed significant yearlyvariation in populations, this variation did not result insubstantial differences in the rates of population growth(Table 4). As in herbaceous perennial plants whichpossess subterranean perennating organs, the holdfastof G. gracilis ensures survival not only over the un-favourable season but also for longer periods of time.Indeed, some individuals did not produce any sizeablebranches over a given census period. These quiescentindividuals do not participate in reproduction butcontribute to population resilience.
A comparison of the elasticity matrices of > 80terrestrial plant species representing a wide range oflife histories revealed that, in long-lived perennials, sur-vival is the most important component of populationgrowth while fertility and/or growth are considerablyless important (Silvertown et al. 1993, 1996). Similarly,the eigenvalue elasticity analysis of the G. gracilis matricesshowed that survival had the highest elasticities whereasfertility elasticities were generally low. Other long-livedalgal species show similar patterns. Ascophyllum nodosum(Åberg 1992), Sargassum siliquosum (Ang & De Wreede1990) (both Phaeophyceae, Fucales) and Gelidiumsesquipedale (Rhodophyta, Gelidiales) (Santos &Nyman 1998) show fertility elasticities that are severalorders of magnitude smaller than their survival elastic-ities. In shorter-lived algal species, such as Laminarialongicruris (Phaeophyceae, Laminariales) (Ang &De Wreede 1990) and Fucus distichus (Phaeophyceae,Fucales) (Ang & De Wreede 1993), fertility elasticitiestook on relatively greater values although they werestill lower than survival elasticities. A classification ofmarine algae according to a functional-form, algal-successional framework (Littler & Littler 1980, 1984),defines opportunistic forms, predation-tolerant formsand disturbance-tolerant forms. This classification hasat least superficial parallels with the successionaltrajectory that is inscribed in the demographic triangularordination of the fertility, growth and survival elasticities(Silvertown et al. 1996; Franco & Silvertown 1997).The trajectory runs from the fertility vertex (short-livedpioneer/opportunistic) species up to the growth vertex(longer-lived competitive/predation-tolerant species)back down to the survival vertex (long-lived climax/disturbance-tolerant species). G. gracilis, along withthe other long-lived species, would be placed near theclimax/disturbance-tolerant vertex based on its peren-niality, low recruitment, low population growth ratesand resilience to disturbance.
Variation in volume showed similar stochastic yearlyvariation within populations to that of recruitment.Spore production and individual volume are inextricablylinked in G. gracilis: tetrasporophytes can producemore than 750 000 tetraspores cm–3 of branch and one
cystocarp produces up to 6000 carpospores (Destombe1987). This intimate connection may seem to suggestthat recruitment would be a direct consequence offecundity. Nevertheless, recruitment was not correlatedwith the production of spores. That is, factors influencingthe variation in the dispersal, settlement, germinationand growth of released spores were not correlated withfactors influencing the variation in fecundity (indexedby volume). The ecophysiological conditions that favourspore establishment in algae may be highly complex,including factors such as temperature, photoperiod,salinity, grazers, inter- and intraspecific competitionand sand dynamics (burial and scour) (for review seeSantelices 1990) and hydrodynamic regimes that createspatial and temporal unpredictability (for review seeDenny & Shibata 1989). Nonetheless, a positive cor-relation between fecundity and fertility may exist: largeindividuals with high fecundity may enjoy high repro-ductive success in years of either high or low recruitment.
Many marine organisms show high temporal vari-ability in recruitment (e.g. marine invertebrates, Gotelli1991; Hughes et al. 1999; algae, Reed et al. 1988; Åberg1992; for review on marine organisms with a planktonicphase see Caley et al. 1996). Nevertheless, despite the weakcontribution of fertility to the population growth rate,recruitment is important for long-term population stabil-ity (Reed et al. 1988; Gotelli 1991; Ang & De Wreede 1993),as without recruitment, populations eventually go extinct.
It was not feasible to incorporate both size and lifehistory stage into our matrix model. In our study wewere primarily interested in the demographic behaviourof the different stages in rock pools (discrete popula-tion units) in which the fate of the individual plants wasfollowed (thereby avoiding fecundity approximations).Accordingly, the number of individuals sampled wasdependent on the specific rock pool studied and thisunit could not be replicated. As a consequence, whileindividual size (volume) was measured, the incorpora-tion of size classes within each of the stages would havereduced the sample size and thus the precision of ourestimates of demographic parameters. Therefore thelife cycle graph that we developed was less complexthan that suggested for triphasic algal life histories byAng & De Wreede (1990). However, we extended theirtriphasic model to include the male gametophyte stage,thereby generating a two-sex model. In doing so, wewere able to explore the dynamics of all the types ofindividual that are found in populations, and more spe-cifically, the dynamics of the sex and ploidy ratios in atypical red algal life cycle. A two-sex model causes femaleand male fertilities to be interdependent (Caswell &Weeks 1986). While the true birth function of G. gracilisgametophytes is unknown, we chose the harmonic meanfunction to describe the interdependence of male andfemale fertilities as it agrees with evolutionary sex ratiotheory (Fisher 1930).
JEC567.fm Page 446 Tuesday, May 15, 2001 2:24 PM
447Demography of the red seaweed, Gracilaria gracilis
© 2001 British Ecological Society, Journal of Ecology, 89, 436–450
The observed sex ratios showed little temporal vari-ation within populations. However, the sex ratios differedbetween populations: two of the four populations showedskewed sex ratios, and both were male-biased. Adultsex ratios may be biased due to environmental variationand differential mortality of the two sexes. Indeed,variation of sex ratios between populations of manydioecious plants, mosses and algae has been attributedto differential herbivory of juveniles (e.g. Cipollini &Whigham 1994), density effects (e.g. Bond & Maze 1999),to height on the shore (e.g. Norall et al. 1981; Williams1995), or differential mortality (e.g. Shaw & Gaughan1993). Sex ratios in dioecious algae vary from unity tofemale-biased (Norall et al. 1981; De Wreede & Klinger1988; Kain (Jones) & Destombe 1995); only rarelyare they male-biased (one report, in Kain (Jones) &Destombe 1995). The unanticipated male bias at theGris-Nez site may be due to subtle differences in tran-sient population dynamics, differential herbivory and/or differential juvenile survival at this site. Nonetheless,although the low number of populations studied doesnot allow explicit testing of environmental correlates,we discerned no trends that would suggest that femalefrequencies varied with tidal level or population density(Tables 1 and 5). Alternatively, the male bias may becaused by a genic sex ratio distorter, although nonehave been documented for an algal species (for reviewsee Werren & Beukeboom 1998).
The eigenvector elasticity analysis sheds some lighton the relative importance of the different vital rateparameters in the determination of the sex ratio. Inter-estingly, we found that (adult) survivorship, and notfertility (a term that included juvenile survival), of allthree individualized stages was the most importantcomponent of sex ratios. In addition, the eigenvectoranalysis revealed some interesting dynamics. Perturba-tions of the production and survival of tetrasporophytesresulted in variations in sex ratio that depended on theequilibrium female frequency. Moreover, this was trueregardless of the relative values of the fFT and fMT terms(i.e. gametophyte recruitment). Thus, small increases inthe parameters concerning the tetrasporophyte stagecan indirectly influence the sex ratio in favour of the lessabundant sex.
The observed ploidy ratios were even more stablein time than the sex ratios. Three of the four popula-tions showed balanced ploidy ratios (Table 5). Amongthe isomorphic red algae, ploidy ratios range fromgametophyte-biased to tetrasporophyte-biased (e.g.Norall et al. 1981; De Wreede & Klinger 1988; Destombeet al. 1989; Kain (Jones) & Destombe 1995; Lindgren& Åberg 1996; Scrosati 1998). Some studies have shownthat ratios vary according to tidal levels, with the fre-quency of tetrasporophytes decreasing with increasingheight on the shore (Craigie & Pringle 1978; Norallet al. 1981). In addition to differential mortality (orrecruitment) according to environmental or ecologicalfactors, the skewed ploidy ratios could be due to asexualreproduction in at least some of the above-cited studies.
As only one population (GNL) showed significantlyskewed ploidy ratios, it was not possible to attributevariance in ploidy ratios to ecological factors such astidal level. Further, vegetative propagation is unlikelyin G. gracilis (Destombe et al. 1992; Wattier et al. 1997;Engel et al. 1999).
The projected ploidy ratios were in general quitesimilar to the observed ratios. Two of the three cases ofsignificant departure from projected structure involveddramatic differences in the observed and projected ploidyratios; both were skewed in favour of gametophytes(Table 5), whatever the sex ratio. Destombe et al. (1989)and Lindgren & Åberg (1996) suggested that juvenilesurvival was a determining factor of ploidy ratiosobserved in the field. However, this study shows thatthe balance of ploidy ratios, as observed for the sexratios, is due mainly to survival dynamics and not tofertility (analogous to juvenile survival) dynamics. Theeigenvector analysis demonstrated that, in general, asmall increase in gametophyte survival would decreasethe frequency of tetrasporophytes and vice versa.
The equilibrium sex and ploidy ratios and their elas-ticities obtained from our two-sex model are contingenton the model’s assumption of frequency-dependentfertility. While one-sex linear models or two-sex modelsemploying birth functions other than the harmonic meanmay give different results, the magnitude of the actualdifference is not easy to predict. In an exploration ofthe population dynamics of birds using a one-sex linearmodel and two-sex models with various birth functions,Legendre et al. (1999) showed that differences betweentwo-sex frequency-dependent and one-sex linear modelswere especially pronounced in short-lived species. Theirresults suggest that the high survival rates demonstratedin G. gracilis would render the conclusions based ona variety of birth functions (linear and non-linear)qualitatively comparable. Nevertheless, independentdata would be necessary to test the assumptions behindbirth functions.
Stable stage structure of the haploid and diploidphases has been reported in studies of matrix modelsthat have been applied to other haploid-diploid species,including a heteromorphic species, Laminaria longicruris(Ang & De Wreede 1990) and two isomorphic rhodo-phytes, Gelidium sesquipedale (Santos & Nyman 1998)and Mazzaella splendens (as Iridaea splendens, Ang et al.1990). In Laminaria, the sporophyte stage is macroscopicwhile the gametophyte phase is microscopic. The stablestage structure of L. longicruris was largely dominatedby the gametophyte stage (Ang & De Wreede 1990).The isomorphic red alga G. sesquipedale propagates byvegetative means. Matrix model projections showedthat the tetrasporophyte stage comprised less than 1%of the stable stage structure (Santos & Nyman 1998).As the vegetative dynamics were modelled using thesame parameters for the haploid and diploid phases,gametophyte dominance was attributed to successful,albeit limited, recruitment of tetraspores (Santos &Nyman 1998). On the contrary, while the haploid and
JEC567.fm Page 447 Tuesday, May 15, 2001 2:24 PM
448C. Engel et al.
© 2001 British Ecological Society, Journal of Ecology, 89, 436–450
diploid phases alternate in dominance seasonally inM. splendens (Ang et al. 1990; Dyck & De Wreede1995), projections of the tetrasporophyte-dominantseason showed that the frequencies of diploids stabi-lized to c. 50% (Ang et al. 1990). Thus even with slightlydifferent demographic dynamics, this exclusively sexualred alga showed similar equilibrium ploidy ratios tothose that we found in G. gracilis.
While population growth rates showed no spatio-temporal variation, equilibrium population structurevaried substantially from year to year in at least threepopulations. Although the survival rates were notsignificantly different from year to year, both elasticityanalyses showed that subtle changes in the survivalrates had the biggest impact on population fitness andon population structure. It is interesting to note thatminor differences in survival may result in very differ-ent equilibrium population structures (data not shown,but see Table 5). Therefore, changes in adult survivalthat are too minor to be detected statistically may con-tribute to the observed biases in sex and ploidy ratios.Alternatively, these biases may be transitory and reflectpast population dynamics.
The low damping ratios in G. gracilis are typical oflong-lived perennials with long generation times (Doak& Morris 1999) and indicate that convergence toequilibrium structure is slow (Table 4). Thus the smalldifferences that resulted in very different projectedpopulation structures will not be immediately reflectedin the observed population structure (Table 5). In addi-tion, even subtle variation in survival and recruitmentdynamics will probably prevent populations fromreaching the extreme projected sex and/or ploidy ratios.Comparing the observed population structures in thisstudy with those observed in 1985 in GNH and GNL(in Destombe et al. 1989) and in AuH in 1990 (in Richerd1993) shows that population structure has changedrelatively little in 8 years. In these surveys, sex ratioswere 0.458, 0.513 and 0.618 and ploidy ratios were0.438, 0.485, 0.553 for GNH, GNL and AuH, res-pectively. Only the GNL population showed trendsopposite to the ones reported in this study, suggestingthat perhaps this population is experiencing differentdynamics from the others. Unfortunately, it is difficultto speculate further on these differences in sex andploidy ratios since only one census period was recordedfor this population.
Conclusion
The demographic model developed in this study allowedexploration of the population dynamics and structureof a red haploid-diploid seaweed. The results revealedlittle spatiotemporal variation in the dynamics of popu-lations found in one geographical region, providingvaluable insight into demographic processes at a local(i.e. small) scale. There is nevertheless a need to carryout intensive, hierarchical sampling at several spatialscales (e.g. Hughes et al. 1999) to determine large-scale
patterns as well as the impact of putative local ecologicalcorrelates, such as density or height, on the shore.
While most population matrix models previouslydeveloped for red haploid-diploid seaweeds incorporateboth haploid and diploid phases (e.g. Ang & De Wreede1990; Ang et al. 1990; Santos & Nyman 1998), thedynamics of ploidy ratios are rarely discussed (but seeScrosati & DeWreede 1999). Our two-phase, two-sexmodel took into account both phases and both sexeswithin the haploid phase, providing an opportunity toexplore the dynamics of not only ploidy ratios but alsosex ratios. Indeed, our analysis of the stable stage struc-ture showed that the dynamics of sex and ploidy ratiosdepend, for the most part, on adult survival, and maybe interdependent. This integrative two-sex, two-phaseapproach to the study of the population demographicstructure of red haploid-diploid seaweeds is particularlypromising for future studies addressing the evolutionand maintenance of the haploid-diploid life cycle withrespect to other types of cycle.
Acknowledgements
We thank all those who helped out with the field work.We are grateful to J. Clobert, F. Viard, the Editor M.Hutchings and three anonymous reviewers for helpfulcomments on the manuscript. This study was supportedby funding from EC Research contract BIOGAP MAS3-CT95–0019, European Funds for Regional Develop-ment (FEDER), Nord-Pas-de-Calais Region (DYSCOPII), CNRS-IFREMER Biodiversité Marine programme519501, the Foundation for strategic environmental res-earch (MISTRA, Sweden) and PhD fellowship no. 10556from the French Ministry of Foreign Affairs to CRE.
References
Åberg, P. (1989) Distinguishing between genetic individuals inAscophyllum nodosum populations on the Swedish westcoast. British Phycology Journal, 24, 183–190.
Åberg, P. (1990) Measuring size and choosing category sizefor a transition matrix study of the seaweed Ascophyllumnodosum. Marine Ecology Progress Series, 63, 281–287.
Åberg, P. (1992) A demographic study of two populations ofthe seaweed Ascophyllum nodosum. Ecology, 73, 1473–1487.
Alvarez-Buylla, E.R., García-Barrios, R., Lara-Moreno, C.& Martínez-Ramos, M. (1996) Demographic and geneticmodels in conservation biology: applications and perspect-ives for tropical rain forest tree species. Annual Review ofEcology and Systematics, 27, 387–421.
Ang, P., De Wreede, R.E., Shaughnessy, F. & Dyck, L. (1990)A simulation model for an Iridaea splendens (Gigartinales,Rhodophyta) population in Vancouver, Canada. Hydrobi-ologia, 204/205, 191–196.
Ang, P.O. & De Wreede, R.E. (1990) Matrix models for algallife history stages. Marine Ecology Progress Series, 59, 171–181.
Ang, P.O. & De Wreede, R.E. (1993) Simulation and analysisof the dynamics of a Fucus distichus (Phaeophyceae, Fucales)population. Marine Ecology Progress Series, 93, 253–265.
Bell, G. (1994) The comparative biology of the alternation ofgenerations. Lectures on Mathematics in the Life Sciences:
JEC567.fm Page 448 Tuesday, May 15, 2001 2:24 PM
449Demography of the red seaweed, Gracilaria gracilis
© 2001 British Ecological Society, Journal of Ecology, 89, 436–450
Theories for the Evolution of Haploid-Diploid Life Cycles(ed. M. Kirkpatrick), pp. 1–26. American MathematicalSociety, Providence, Rhode Island.
Benton, T.G. & Grant, A. (1999) Elasticity analysis as animportant tool in evolutionary and population ecology.Trends in Ecology and Evolution, 14, 467–471.
Bierzychudek, P. (1982) The demography of jack-in-the-pulpit,a forest perennial that changes sex. Ecological Monographs,52, 335–351.
Bond, W.J. & Maze, K.E. (1999) Survival costs and reproduct-ive benefits of floral display in a sexually dimorphic dioeciousshrub, Leucadendron xanthoconus. Evolutionary Ecology,13, 1–18.
Caley, M.J., Carr, M.H., Hixon, M.A., Hughes, T.P., Jones, G.P.& Menge, B.A. (1996) Recruitment and the local dynamicsof open marine populations. Annual Review of Ecology andSystematics, 27, 477–500.
Caswell, H. (1989) Matrix Population Models. Sinauer,Sunderland, Massachusetts.
Caswell, H. & Weeks, D.E. (1986) Two-sex models: chaos,extinction, and other dynamic consequences of sex. Amer-ican Naturalist, 128, 707–735.
Chapman, A.R.O. (1993) ‘Hard’ data for matrix modelling ofLaminaria digitata (Laminariales, Phaeophyta) populations.Hydrobiologia, 260/261, 263–267.
Cipollini, M.L., Wallace-Stenft, D.A. & Whigham, D.F.(1994) A model of patch dynamics, seed dispersal, and sexratio in the dioecious shrub Lindera benzoin (Lauraceae).Journal of Ecology, 82, 621–633.
Cipollini, M.L. & Whigham, D.F. (1994) Sexual dimorphismand cost of reproduction in the dioecious shrub Lindera benzoin(Lauraceae). American Journal of Botany, 81, 65–75.
Craigie, J.S. & Pringle, J.D. (1978) Spatial distribution oftetrasporophytes and gametophytes in four maritimepopulations of Chondrus crispus. Canadian Journal of Botany,56, 2910–2914.
De Wreede, R.E. & Klinger, T. (1988) Reproductive strategiesin algae. Plant Reproductive Ecology: Patterns and Strategies(eds J. Lovett-Doust & L. Lovett-Doust), pp. 267–284.Oxford University Press, Oxford.
Denny, M.W. & Shibata, M.F. (1989) Consequences of surf-zoneturbulence for settlement and external fertilization. TheAmerican Naturalist, 134, 859–889.
Destombe, C. (1987) Biologie des populations de l’algue rougeGracilaria verrucosa Hudson (Papenfuss) (Gigartinales),intérêt et implication en aquaculture. PhD thesis, Universitédes Sciences et Techniques de Lille Flandres-Artois, Lille,France.
Destombe, C., Godin, J., Bodard, M. (1988) The decay phasein the life history of Gracilaria verrucosa: the consequencesin intensive cultivation. Algal Biotechnology (eds T. Stadler,J. Mollion, M.-C. Verdus et al.), pp. 287–303. Elsevier, London.
Destombe, C., Godin, J., Lefebvre, C.L., Dehorter, O. &Vernet, P. (1992) Differences in dispersal abilities of haploidand diploid spores of Gracilaria verrucosa (Gracilariales,Rhodophyta). Botanica Marina, 35, 93–98.
Destombe, C., Godin, J., Nocher, M., Richerd, S. & Valero, M.(1993) Differences in response between haploid and diploidisomorphic phases of Gracilaria verrucosa (Rhodophyta:Gigartinales) exposed to artificial environmental conditions.Hydrobiologia, 260/261, 131–137.
Destombe, C., Valero, M., Vernet, P. & Couvet, D. (1989)What controls haploid-diploid ratio in the red alga, Gracilariaverrucosa? Journal of Evolutionary Biology, 2, 317–338.
Doak, D.F. & Morris, W. (1999) Detecting population-levelconsequences of ongoing environmental change withoutlong-term monitoring. Ecology, 80, 1537–1551.
Dyck, L.J. & De Wreede, R.E. (1995) Patterns of seasonaldemographic change in the alternate isomorphic stages ofMazzaella splendens (Gigartinales, Rhodophyta). Phycologia,34, 390–395.
Engel, C., Wattier, R., Destombe, C. & Valero, M. (1999)Performance of non-motile male gametes in the sea: analysisof paternity and fertilization success in a natural popula-tion of a red seaweed, Gracilaria gracilis. Proceedings of theRoyal Society of London, Biological Series, 266, 1879–1886.
Fisher, R.A. (1930) The Genetical Theory of Natural Selec-tion. Oxford University Press, Oxford.
Franco, M. & Silvertown, J. (1997) Life history variation inplants: an exploration of the fast-slow continuum. PlantLife Histories: Ecology, Phylogeny, and Evolution (eds J.W.Silvertown, M. Franco & J.L. Harper), pp. 210–227. Cam-bridge University Press, Cambridge.
Gotelli, N.J. (1991) Demographic models for Leptogorgiavirgulata, a shallow-water gorgonian. Ecology, 72, 457–467.
Hughes, T.P., Baird, A.H., Dinsdale, E.A., Moltschaniwskyj,N.A., Pratchett, M.S., Tanner, J.E. & Willis, B.L. (1999)Patterns of recruitment and abundance of corals along theGreat Barrier Reef. Nature, 397, 59–63.
Kain ( Jones), J.M. & Destombe, C. (1995) A review of the lifehistory, reproduction and phenology of Gracilaria. Journalof Applied Phycology, 7, 269–281.
Kling, R. & Bodard, M. (1987) Morphogenesis of the frond ofGracilaria verrucosa (Hudson) Papenfuss: the differenti-ation of vegetative and sexual areas. Proceedings of theInternational Seaweed Symposium, 12, 205–206. Inter-national Seaweed Association.
Lefebvre, C., Destombe, C. & Godin, J. (1987) Le fonctionne-ment du carposporophyte de Gracilaria verrucosa et sesrépercussions sur la stratégie de reproduction. Cryptogamie,Algologie, 8, 113–126.
Legendre, S., Clobert, J., Møller, A.P. & Sorci, G. (1999)Demographic stochasticity and social mating system in theprocess of extinction of a small population: the case ofPasserines introduced to New Zealand. The AmericanNaturalist, 153, 449–463.
Lindgren, A. & Åberg, P. (1996) Proportion of life cycle stagesof Chondrus crispus and its population structure: a comparisonbetween a marine and an estuarine environment. BotanicaMarina, 39, 263–268.
Lindgren, A., Bouza, N., Åberg, P. & Sosa, P. (1998) Spatialand temporal variation in distribution of Gelidium canariensis(Rhodophyta) from natural populations of the CanaryIslands. Journal of Applied Phycology, 10, 273–278.
Littler, M.M. & Littler, D.S. (1980) The evolution of thallusform and survival strategies in benthic marine macroalgae:field and laboratory tests of a functional form model. TheAmerican Naturalist, 116, 25–44.
Littler, M.M. & Littler, D.S. (1984) Relationships betweenmacroalgal functional form groups and substrata stabilityin a subtropical rocky-intertidal system. Journal of Exper-imental Marine Biology and Ecology, 74, 13–34.
Meagher, T.R. (1982) The population biology of Chamaelir-ium luteum, a dioecious member of the Lily family: two-sexpopulation projections and stable population structure.Ecology, 63, 1701–1711.
Norall, T.L., Mathieson, A.C. & Kilar, J.A. (1981) Reproduct-ive ecology of four subtidal red algae. Journal of ExperimentalMarine Biology and Ecology, 54, 119–136.
Reed, D.C., Laur, D.R. & Ebeling, A.W. (1988) Variation inalgal dispersal and recruitment: the importance of episodicevents. Ecological Monographs, 58, 321–335.
Richerd, S. (1993) Evolution de l’alternance de phases haploïdeet diploïde dans les cycles de reproduction: aspects théoriqueset expérimentaux chez l’algue rouge Gracilaria verrucosa.PhD thesis, Université de Paris 6, Paris, France.
Santelices, B. (1990) Patterns of reproduction, dispersal andrecruitment in seaweeds. Oceanography and Marine BiologyAnnual Review, 28, 177–276.
Santos, R. (1993) Plucking or cutting Gelidium sesquipedale?A demographic simulation of harvest impact using a popu-lation projection model. Hydrobiologia, 260/261, 269–276.
JEC567.fm Page 449 Tuesday, May 15, 2001 2:24 PM

450C. Engel et al.
© 2001 British Ecological Society, Journal of Ecology, 89, 436–450
Santos, R. & Nyman, M. (1998) Population modelling ofGelidium sesquipedale (Rhodophyta, Gelidiales). Journal ofApplied Phycology, 10, 261–272.
Scrosati, R. (1998) Population structure and dynamics of theclonal alga Mazzaella cornucopiae (Rhodophyta, Gigarti-naceae) from Barkley Sound, Pacific Coast of Canada.Botanica Marina, 41, 483–493.
Scrosati, R. & DeWreede, R.E. (1999) Demographic modelsto simulate the stable ratio between ecologically similargametophytes and tetrasporophytes in population of theGigartinaceae (Rhodophyta). Phycological Research, 47,153–157.
Shaw, A.J. & Gaughan, J.F. (1993) Control of sex ratios inhaploid populations of the moss, Ceratodon purpureus.American Journal of Botany, 80, 584–591.
Silvertown, J., Franco, M. & Menges, E. (1996) Interpretationof elasticity matrices as an aid to the management of plantpopulations for conservation. Conservation Biology, 10,591–597.
Silvertown, J., Franco, M., Pisanty, I. & Mendoza, A. (1993)Comparative plant demography – relative importance oflife-cycle components to the finite rate of increase in woodyand herbaceous perennials. Journal of Ecology, 81, 465–476.
Stearns, S.C. (1992) The Evolution of Life Histories. OxfordUniversity Press, Oxford.
Valero, M., Richerd, S., Perrot, V. & Destombe, C. (1992)Evolution of alternation of haploid and diploid phases inlife cycles. Trends in Ecology and Evolution, 7, 25–29.
Valverde, T. & Silvertown, J. (1998) Variation in the demo-graphy of a woodland understorey herb (Primula vulgaris)along the forest regeneration cycle: projection matrixanalysis. Journal of Ecology, 86, 545–562.
van der Meer, J. (1990) Genetics. Biology of the Red Algae(eds K.M. Cole & R.G. Sheath), pp. 103–121. CambridgeUniversity Press, Cambridge.
Wattier, R., Dallas, J.F., Destombe, C., Saumitou-Laprade, P.& Valero, M. (1997) Single locus microsatellites in Gracilari-ales (Rhodophyta): high level of genetic variability withinGracilaria gracilis and conservation in related species. Journalof Phycology, 33, 868–880.
Werren, J.H. & Beukeboom, L.W. (1998) Sex determination,sex ratios, and genetic conflict. Annual Review of Ecologyand Systematics, 29, 233–261.
Williams, S.L. (1995) Surfgrass (Phyllospadix torreyi) repro-duction: reproductive phenology, resource allocation, andmale rarity. Ecology, 76, 1953–1970.
Winer, B.J., Brown, D.R. & Michels, K. (1991) StatisticalPrinciples in Experimental Design. McGraw-Hill, New York.
Received 10 February 2000 revision accepted 30 November 2000
JEC567.fm Page 450 Tuesday, May 15, 2001 2:24 PM
Copyright © 2022 FDOKUMEN