Density-dependent regulation in an invasive seaweed: responses at plant and modular levels
10
Journal of Ecology 2002 90 , 820 – 829 © 2002 British Ecological Society Blackwell Science, Ltd Density-dependent regulation in an invasive seaweed: responses at plant and modular levels FRANCISCO ARENAS†, ROSA M. VIEJO* and CONSOLACIÓN FERNÁNDEZ Unidad de Ecología, Departamento de Biología de Organismos y Sistemas, Universidad de Oviedo, Asturias, Spain Summary 1 The effects of density on the vital rates, growth form and population size structure of the invasive seaweed Sargassum muticum (Yendo) Fensholt were evaluated experimentally. 2 The initial difference in plant number between the highest and the lowest density (200 and 6400 plants m − 2 ) was considerably reduced by the end of the experiment. Surpris- ingly, this was mostly due to numbers increasing at lower densities, probably because microscopic forms were not removed during the experimental thinning. 3 The allometric length–dry mass relationship fitted a simple linear model on log-log scale for both the highest and the lowest densities, but had different slopes. At higher densities plants became taller and thinner as a consequence of variations in the production and growth of modules. 4 Mean size (dry mass) and the development of size hierarchies of plants were affected by both the addition of further (microscopic) recruits and asymmetrical competition among plants. Plant length distributions were also influenced by changes in the growth form of plants. The length hierarchies of main branches also suggested the presence of asymmetrical competition at this modular level. 5 Density influenced both mean size and morphology of the plants and thus induced changes in reproduction. The negative effect of density on individual plant size reduced the percentage of fertile plants and possibly their annual reproductive allocation, but these effects may be attenuated by morphological responses. 6 The responses of S. muticum to crowding are closely linked to its ability to colonize bare space. The massive reproductive output and very limited dispersal range account for local and dense recruitment patterns. Our results suggest that the responses of S. muticum to crowding allow the establishment of dense populations with high persistence and resistance to colonization by other species. Key-words : allometry, growth form, intraspecific competition, Sargassum muticum , size hierarchies Journal of Ecology (2002) 90 , 820 – 829 Introduction The impact of density on the population dynamics of terrestrial plants has been extensively investigated over the past few decades (e.g. Harper 1977; Antonovics & Levin 1980; Thomas & Weiner 1989; Rice 1990; Weiner 1990; Yastrebov 1996). Some of the best-characterized population responses to increased plant density are the reduction of vital rates and the development of size and reproductive inequalities among neighbours (e.g. Weiner 1985; Weiner & Thomas 1986; Schmitt et al . 1987; Rice 1990; Weiner 1990; but see Turner & Rab- inowitz 1983; Ellison 1987). The modular construction of plants enables indi- viduals to respond to crowding not only by changes in growth rates, but also by plastic changes in their archi- tectures. Thus, many species display stem elongation and reduced branching when they grow at higher den- sities (see Hutchings & de Kroon 1994). Within popu- lations, these changes in the shape of plants are commonly dependent on their ranking in a size hier- archy, with a higher relative elongation of small ‘suppressed’ plants in relation to large ‘dominant’ ones (Geber 1989; Weiner et al . 1990; Weiner & Thomas *Correspondence and present address: Dipartimento di Sci- enze dell’Uomo e dell’Ambiente, Via A. Volta 6, I-56126 Pisa, Italy (fax +39 05049694; tel. +39 050500943/500018; e-mail [email protected]). †Present address: Marine Biological Association of the UK, The Laboratory, Citadel Hill, Plymouth, UK.
Transcript of Density-dependent regulation in an invasive seaweed: responses at plant and modular levels

Journal of Ecology
2002
90
, 820–829
© 2002 British Ecological Society
Blackwell Science, Ltd
Density-dependent regulation in an invasive seaweed: responses at plant and modular levels
FRANCISCO ARENAS†, ROSA M. VIEJO* and CONSOLACIÓN FERNÁNDEZ
Unidad de Ecología, Departamento de Biología de Organismos y Sistemas, Universidad de Oviedo, Asturias, Spain
Summary
1
The effects of density on the vital rates, growth form and population size structure of theinvasive seaweed
Sargassum muticum
(Yendo) Fensholt were evaluated experimentally.
2
The initial difference in plant number between the highest and the lowest density (200and 6400 plants m
−
2
) was considerably reduced by the end of the experiment. Surpris-ingly, this was mostly due to numbers increasing at lower densities, probably becausemicroscopic forms were not removed during the experimental thinning.
3
The allometric length–dry mass relationship fitted a simple linear model on log-logscale for both the highest and the lowest densities, but had different slopes. At higherdensities plants became taller and thinner as a consequence of variations in theproduction and growth of modules.
4
Mean size (dry mass) and the development of size hierarchies of plants were affectedby both the addition of further (microscopic) recruits and asymmetrical competitionamong plants. Plant length distributions were also influenced by changes in the growthform of plants. The length hierarchies of main branches also suggested the presence ofasymmetrical competition at this modular level.
5
Density influenced both mean size and morphology of the plants and thus inducedchanges in reproduction. The negative effect of density on individual plant size reducedthe percentage of fertile plants and possibly their annual reproductive allocation, butthese effects may be attenuated by morphological responses.
6
The responses of
S. muticum
to crowding are closely linked to its ability to colonizebare space. The massive reproductive output and very limited dispersal range accountfor local and dense recruitment patterns. Our results suggest that the responses of
S. muticum
to crowding allow the establishment of dense populations with highpersistence and resistance to colonization by other species.
Key-words
: allometry, growth form, intraspecific competition,
Sargassum muticum
,size hierarchies
Journal of Ecology
(2002)
90
, 820–829
Introduction
The impact of density on the population dynamics ofterrestrial plants has been extensively investigated overthe past few decades (e.g. Harper 1977; Antonovics &Levin 1980; Thomas & Weiner 1989; Rice 1990; Weiner1990; Yastrebov 1996). Some of the best-characterizedpopulation responses to increased plant density are thereduction of vital rates and the development of size and
reproductive inequalities among neighbours (e.g.Weiner 1985; Weiner & Thomas 1986; Schmitt
et al
.1987; Rice 1990; Weiner 1990; but see Turner & Rab-inowitz 1983; Ellison 1987).
The modular construction of plants enables indi-viduals to respond to crowding not only by changes ingrowth rates, but also by plastic changes in their archi-tectures. Thus, many species display stem elongationand reduced branching when they grow at higher den-sities (see Hutchings & de Kroon 1994). Within popu-lations, these changes in the shape of plants arecommonly dependent on their ranking in a size hier-archy, with a higher relative elongation of small‘suppressed’ plants in relation to large ‘dominant’ ones(Geber 1989; Weiner
et al
. 1990; Weiner & Thomas
*Correspondence and present address: Dipartimento di Sci-enze dell’Uomo e dell’Ambiente, Via A. Volta 6, I-56126 Pisa,Italy (fax +39 05049694; tel. +39 050500943/500018; [email protected]).†Present address: Marine Biological Association of the UK,The Laboratory, Citadel Hill, Plymouth, UK.
JEC_720.fm Page 820 Monday, September 23, 2002 11:06 AM

821
Density-dependence in an invasive seaweed
© 2002 British Ecological Society,
Journal of Ecology
,
90
, 820–829
1992; Yokozawa & Hara 1995; Berntson & Wayne2000). The morphological changes have often beenshown to be adaptive in terms of growth and reproduc-tion (Schmitt
et al
. 1995; Dudley & Schmitt 1996;Dorn
et al
. 2000).Density dependence has been considerably less
investigated in seaweed stands, although the results ofmanipulative experiments over the last decade indi-cated that algal responses to crowding are often similarto those observed in terrestrial plants. Hence, negativeeffects of density on survival and growth are commonin algal populations (Reed 1990; Ang & De Wreede1992; Kendrik 1994; Creed
et al
. 1996, 1998). Never-theless, the effect of density on the reproductive outputof macroalgae is still poorly documented, as is thedevelopment of size and reproductive hierarchies (butsee Schiel 1985; Reed 1990; Creed
et al
. 1998). Dynam-ics of modules have been investigated in a few seaweeds,mostly clonal red algae (e.g. Santos 1995; Scrosati &Servière-Zaragoza 2000) but studies relating genetcompetition to clone dynamics are rare (see Lazo &Chapman 1998; Viejo & Åberg 2001). Moreover, to ourknowledge the interplay of density, growth form andsize inequality has not yet been explored in seaweeds.
In this study we investigated density dependence in abrown seaweed with high invasive potential,
Sargassummuticum
(Yendo) Fensholt. This is a Japanese speciesthat rapidly spread after attached individuals were firstfound in Europe in the 1970s (Critchley
et al
. 1983). Itslocalized pattern of dispersal (Deysher & Norton 1982)helps the quick establishment of
S. muticum
popula-tions once individuals have colonized a new habitat.The species occupies mainly sheltered shores, where itoften forms dense monospecific stands (Jephson &Gray 1977; Critchley
et al
. 1983; Fernández
et al
. 1990).The growth form of
S. muticum
is modular andapproaches the structural complexity of terrestrialplants (Chamberlain
et al
. 1979; Yoshida 1983). Aplant (genet) of
S. muticum
is attached to the substra-tum by a perennial holdfast that gives rise to a singlestem (Fig. 1). Every year, several apically extendingmain branches emerge from the stem and produce well-developed secondary branches (Fig. 1), which in turnmay give rise to higher-order branches.
We examined the effects of density on the vital ratesof
S. muticum
, as well as the development of size (drymass) and length hierarchies. The morphologicalresponses to crowding (i.e. production and growth ofmodules) and its relationship with size distributionswere also analysed. Modularity was considered at thescales of main (primary) and secondary branching.
Materials and methods
-
The field experiment was carried out in Aramar, a shel-tered bay near Cape Peñas, on the north coast of Spain(43
°
36
′
41
″
N, 5
°
46
′
29
″
W) from June 1995 to June
1996. The invasive brown seaweed
S. muticum
was firstdetected in this area in 1988 and its percentage cover inthe low intertidal has been close to 100% since 1991(Fernández 1999).
On European coasts,
S. muticum
exhibits a verycharacteristic annual growth-cycle, although there aresome differences in phenology among areas (seeJephson & Gray 1977; Givernaud
et al
. 1991; Fernández1999). In the north of Spain, main branches arise fromthe stem during autumn and grow throughout winterand spring until the onset of the reproductive period, inlate spring. The reproductive period ends in August(Fernández 1999) and only the holdfast and stemremain as perennial structures.
In June 1995, 50 concrete floor tiles (30
×
30
×
5 cm)were seeded with
S. muticum
propagules
in situ
, byimmersing them for 2 months under a canopy of repro-ductive plants in a flat area of the bay, 0.2–0.3 m abovethe lowest tidal level. Plants used as inoculum weresubsequently removed from the area. Tiles that wereprofusely colonized by propagules of
S. muticum
(
n
= 40) were used in the experiment. In November1995, when recruits were 1–2 cm long, tiles were ran-domly assigned to five different experimental densitytreatments (eight tiles per density) equivalent to 200,400, 800, 3200 and 6400 recruits m
−
2
. In the studiedarea, average natural densities of recruits (estimatedfrom sampled plots of 0.25 m
2
) ranged from 761 to 974plants m
−
2
(Fernández 1999; Arenas & Fernández2000), with a maximum value of 12 380 plants m
−
2
(F.Arenas, unpublished data). Recruits were thinned tothe required initial density by dividing the surface ofthe tile into 18, 5
×
10 cm rectangles and scraping offrecruits with forceps to leave only 1, 2, 4, 16 and 32individuals per rectangle.
Every effort was made to remove individuals com-pletely, by gouging and scraping the tiles. Tiles were
Fig. 1 Scheme of the typical morphology of a Sargassummuticum plant. Dmb = dominant (longest) main branch;Mb = main branch; Sb = secondary branch; S = stem; H =holdfast; R = reproductive structure (androgynous receptacle);Av = air vesicle; L = leave-like structures.
JEC_720.fm Page 821 Monday, September 23, 2002 11:06 AM

822
F. Arenas, R. M. Viejo & C. Fernandez
© 2002 British Ecological Society,
Journal of Ecology
,
90
, 820–829
placed 200 cm apart to avoid physical interactionbetween plants from different tiles. These plots simu-lated the clumped distribution of
S. muticum
at Ara-mar, where plants are frequently found attached toboulders immersed in sand or embedded in mud.Zones adjacent to the plots were kept clean of adultplants throughout the course of the experiment.
In order to study the effect of density on survival, thenumber of plants per plot was assessed bimonthly fromNovember 1995 to June 1996. All plants were countedin the plots at the lowest experimental densities (200and 400 plants m
−
2
) but at 800, 3200 and 6400 plants m
−
2
estimates were derived from counts in 10 subsamples(5
×
5 cm), except in May and June 1996, when all indi-viduals were counted. Working at low intertidal levelsimposes logistic constraints and for each census there-fore we sampled only four to seven randomly selectedtiles per density.
Light has been cited as a major factor limiting thegrowth and survival of competing seaweeds (e.g. Ang &De Wreede 1992; Creed
et al
. 1998). Total daily irradi-ance data (MJ m
−
2
) for the period of November 1995 toJune 1996 were kindly provided by the nearest meteor-ological observatory (CMT Asturias, Oviedo, Spain),located at about 28 km from the study site.
The impact of density on the mean dry mass andlength of plants, and on size distributions, was invest-igated in May 1996, at the end of the growing season,and June 1996, when plants became reproductive. InMay, half of the plots (four for each density) werecollected from the shore and transported to thelaboratory. Plants were then carefully removed, rinsedin fresh water, and total length of each individual wasmeasured to the nearest millimetre, and number andlength of main branches noted, before drying for 48 hat 60
°
C and weighing (
±
0.0001 g).Plastic morphological responses to density were
assessed in some larger plants in which they were moreevident. Five well-developed individuals (> 0.07 g drymass) were thus selected from each of the May-collectedplots (20 per density) and (i) the length and dry mass ofthe longest main branch, (ii) number, length and drymass of secondary branches on this main branch, and(iii) length and dry mass of the rest of main branches,were measured for each plant.
The rest of the plots were collected in June, coincid-ing with the onset of reproduction. One plot was lostfrom the three lowest densities (200, 400 and 800 plantsm
−
2
). Each plant in the remaining three to four plots perdensity was counted and assessed for reproductivestatus, total length and number and length of mainbranches. To investigate if crowding has an impact onthe probability and/or timing of reproduction, thenumbers of both fertile plants and plants having imma-ture reproductive structures (receptacles) were counted,in order to estimate the proportion of plants that wouldbecome fertile later in the reproductive season.
The separation, counting and weighing of recept-acles is very time-consuming because a single plant
bears hundreds of thousands of receptacles (Norton1977; Norton & Deysher 1989), often a few millimetresin size. Reproductive allocation was therefore assessedonly for secondary branches and only at one low (400plants m
−
2
) and one high (6400 plants m
−
2
) density. Sec-ondary branches (30–40, from a total of seven to eightplants at each density) were randomly selected from thelongest main branch of plants, their receptacles separ-ated and the total dry mass of both receptacles andvegetative tissue measured.
The change in plant number in the plots between twoconsecutive times was expressed as a percentage. Vari-ation in plant number among treatments (i.e. experi-mental densities) was analysed using an analysis ofvariance with density as a fixed factor. Cochran’s testswere used to test data for homogeneity of variances(Winer
et al
. 1991). Differences among means aftersignificant
F
-tests were analysed by Student-Newman-Keuls (SNK) tests.
To investigate the effect of density on growth form,the allometric relationship between individual lengthand dry mass was analysed for the lowest and thehighest experimental densities (i.e. 200 and 6400plants m
−
2
) in the plots collected in May. A randomsample of 270 plants of at least 1 cm length was takenper density. For each density, the log (dry mass)–log(length) data were fitted to both linear and quadraticregressions (standard least square regressions withplant length as the independent variable). The slopesof the linear models were compared by analysis ofcovariance. Analyses of covariance were also usedfor testing the effects of density on: (i) plant length(plant dry mass as covariate); (ii) dry mass of the long-est main branch (plant dry mass as covariate); and(iii) number of secondary branches of the longest mainbranch (covariate: length of the main branch) inthe 20 sampled individuals (see above). Slopes werehomogeneous in all the cases. Student’s
t
-tests andBonferroni corrections were used for posthoc comparisonon adjusted means after significant
F
-tests. Finally, ananalysis of variance was used for testing the effect ofdensity on number of main branches per plant (therewas no relationship between this variable and plantsize) and differences among means were analysed bya SNK test.
In order to examine the hierarchy in the dry massand length distributions of both plants and mainbranches, unbiased Gini coefficients (Weiner & Solbrig1984) were calculated for each plot. This coefficient is astatistical measure of inequality in the size distribution,having a minimum value of 0, where all the individuals(or branches) are equal, and a theoretical maximum of1, where all individuals but one have size 0. Analyses ofvariance were used to compare the Gini coefficientsat different densities and times (May, June). Whenpossible, posthoc pooling procedures were used to
JEC_720.fm Page 822 Monday, September 23, 2002 11:06 AM

823
Density-dependence in an invasive seaweed
© 2002 British Ecological Society,
Journal of Ecology
,
90
, 820–829
remove the non-significant
P
> 0.25 interaction termdensity
×
time, to increase the power of the test for themain factors (Underwood 1997).
Analysis of covariance was used to test the effect ofcrowding in the reproductive allocation of secondarybranches. Furthermore, the relationship betweenreproductive and vegetative dry mass was examined totest if reproductive allocation of secondary branchesincreased with branch size. The value of the y-interceptand its 95% confidence limits were calculated usingstandard least-square linear regression to evaluate ifthe y-intercept was significantly < 0 (see Samson &Werk 1986; Klinkhamer
et al
. 1990).
Results
The number of plants in the plots exhibited successivephases of reduction and increase over time (Fig. 2a).The number of plants declined in most of the treatmentsfrom November to January (Fig. 2a), when irradiancelevels were minimal (Fig. 2b). Survival over this perioddeclined with initial experimental density (significanteffect of density, analysis of variance,
F
4,21
= 9.82,
P
< 0.001), from 91.7% at the lowest density treatment(200 plants m
−
2
) to 60.3 at the highest one, although
plots thinned to 400 plants m
−
2
increased in density byan average of 5.6%.
Surprisingly, the number of plants visible increasedfrom January to May in all treatments, as did irradiancelevels (Fig. 2). These increases were density-dependentfrom January to March (analysis of variance,
F
4,21
=16.38,
P
< 0.001), being greatest at the lowest initialdensity (Fig. 2a; SNK test, 200 > 800 > 400
c
. 3200
c
.6400 plants m
−
2
).In the last period, May to June, all the treatments
again experienced reductions in plant number (Fig. 2a),although this mortality was not density-dependent(Table 1, non-significant interaction, density
×
time).Over the whole period, net mortality was only observedat the two highest initial densities, the remainder show-ing a net increase (Fig. 2a). The initial 32-fold differ-ence among the highest and the lowest densities (6400vs. 200 plants m
−
2
) was reduced to eight by the end ofthe experiment (4444 vs. 551 plants m
−
2
, mean values).
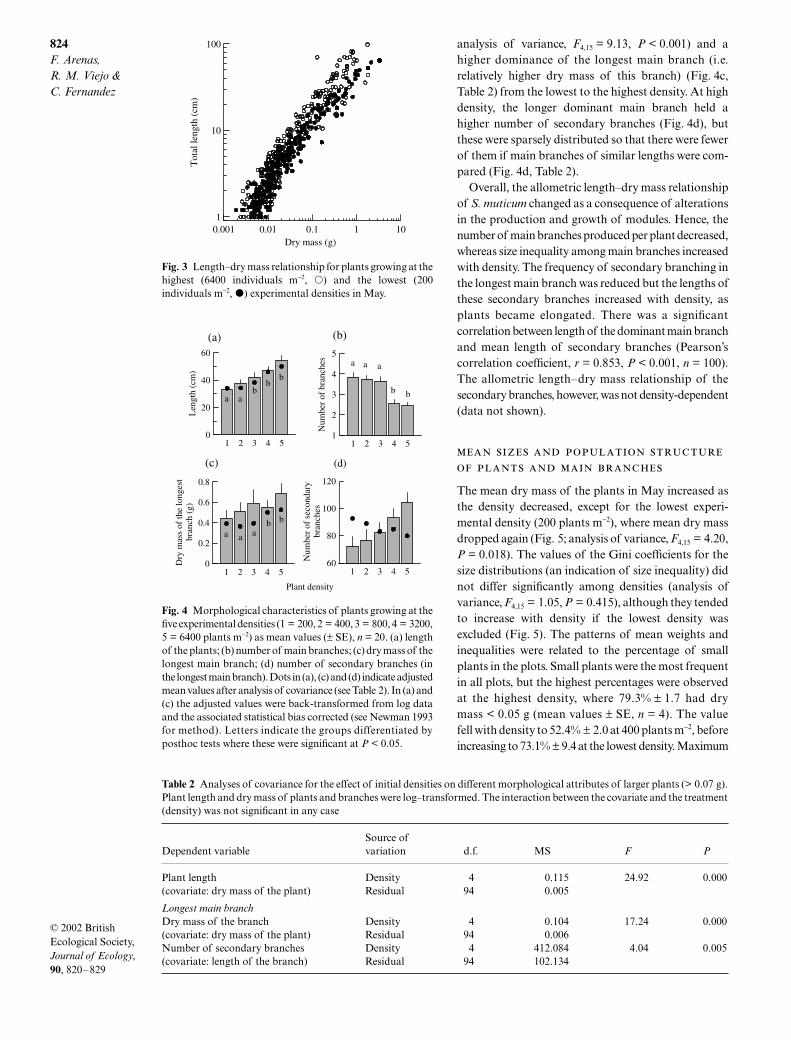
Density-dependent changes in the architecture ofplants were evident in May. The allometric relationshipbetween length and dry mass changed with density(Fig. 3). This relationship fitted a linear regression in alog-log plot for both the high and the low densitiestested (
r
2
= 0.904 and 0.903, respectively,
P
< 0.0001 inboth cases). Although quadratic regressions were alsohighly significant (
P
< 0.0001), they only slightlyincreased the amount of variance explained in relationto the linear model (< 1.5% for either density). Theslope of the linear model (log dry mass = a + b loglength) was lower for the high density (1.28 vs. 1.43;analysis of covariance, density
×
length,
F
1,535
= 15.64,
P
< 0.001). This indicated that plants were moreelongated at the highest density and differences betweendensities became more evident in large plants (Fig. 3).
In fact, when large plants (> 0.07 g dry mass) of allfive experimental densities were compared, weobserved a gradual elongation (Fig. 4a, Table 2), adecrease in the number of main branches (Fig. 4b;
Fig. 2 (a) Temporal variation in the number of plants for thedifferent experimental densities. Mean ± SE values are shown,number of plots equals four in January, May and June andseven in November and March, except where indicated. (b)Temporal variation in total daily irradiance from November1995 to June 1996 (monthly mean ± SE).
Table 1 Analysis of variance for the effects of initial densitieson plant number during May to June 1996. As counts weredone in different plots each time, the measures wereindependent and the factor time was included in the analysis.The dependent variable was the log proportion of final toinitial densities (initial in November, final in May or June,respectively). The interaction density × time was not signi-ficant (P = 0.397) and pooled residual MS was calculated.Variances were homogeneous
Source of variation d.f. MS F P
Density 4 0.387 8.06 0.000Time 1 0.204 4.25 0.048Residual 31 0.048
Data from three missing plots were replaced by the mean value of the group, and 3 d.f. subtracted from residual.
JEC_720.fm Page 823 Monday, September 23, 2002 11:06 AM
824
F. Arenas, R. M. Viejo & C. Fernandez
© 2002 British Ecological Society,
Journal of Ecology
,
90
, 820–829
analysis of variance,
F
4,15
= 9.13,
P
< 0.001) and ahigher dominance of the longest main branch (i.e.relatively higher dry mass of this branch) (Fig. 4c,Table 2) from the lowest to the highest density. At highdensity, the longer dominant main branch held ahigher number of secondary branches (Fig. 4d), butthese were sparsely distributed so that there were fewerof them if main branches of similar lengths were com-pared (Fig. 4d, Table 2).
Overall, the allometric length–dry mass relationshipof
S. muticum
changed as a consequence of alterationsin the production and growth of modules. Hence, thenumber of main branches produced per plant decreased,whereas size inequality among main branches increasedwith density. The frequency of secondary branching inthe longest main branch was reduced but the lengths ofthese secondary branches increased with density, asplants became elongated. There was a significantcorrelation between length of the dominant main branchand mean length of secondary branches (Pearson’scorrelation coefficient,
r
= 0.853,
P
< 0.001,
n
= 100).The allometric length–dry mass relationship of thesecondary branches, however, was not density-dependent(data not shown).
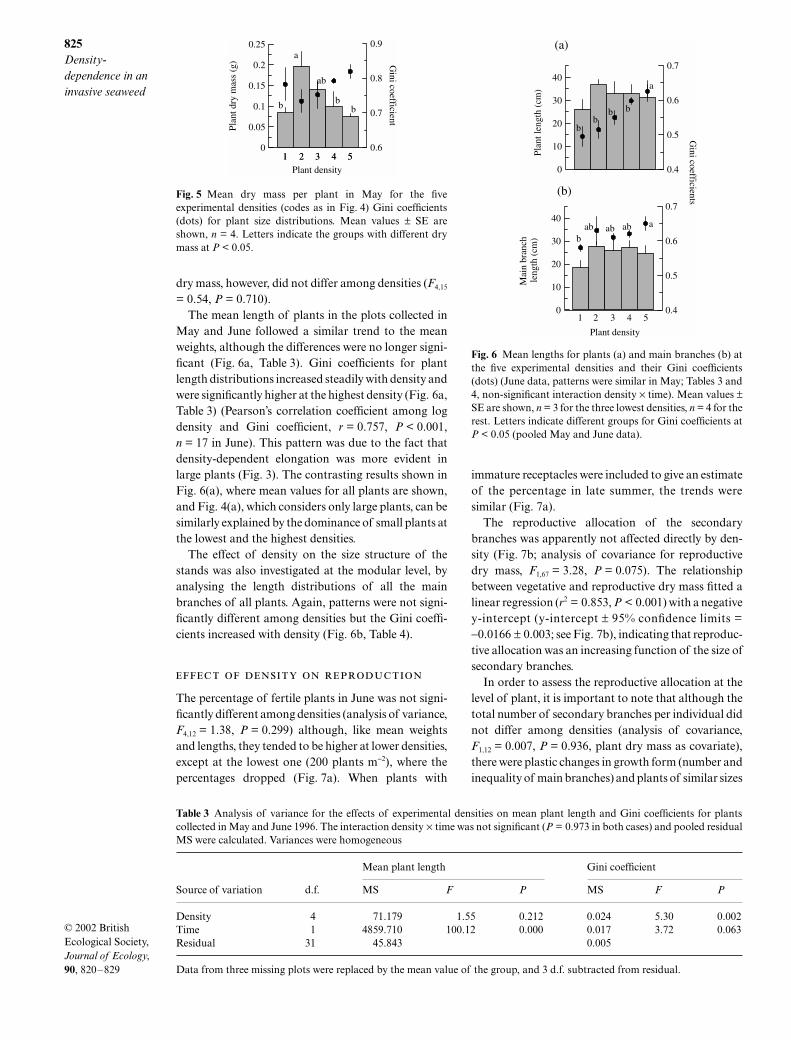
The mean dry mass of the plants in May increased asthe density decreased, except for the lowest experi-mental density (200 plants m
−
2
), where mean dry massdropped again (Fig. 5; analysis of variance,
F
4,15
= 4.20,
P
= 0.018). The values of the Gini coefficients for thesize distributions (an indication of size inequality) didnot differ significantly among densities (analysis ofvariance,
F
4,15
= 1.05,
P
= 0.415), although they tendedto increase with density if the lowest density wasexcluded (Fig. 5). The patterns of mean weights andinequalities were related to the percentage of smallplants in the plots. Small plants were the most frequentin all plots, but the highest percentages were observedat the highest density, where 79.3%
±
1.7 had drymass < 0.05 g (mean values
±
SE,
n
= 4). The valuefell with density to 52.4%
±
2.0 at 400 plants m
−
2
, beforeincreasing to 73.1%
±
9.4 at the lowest density. Maximum
Fig. 3 Length–dry mass relationship for plants growing at thehighest (6400 individuals m−2, �) and the lowest (200individuals m−2, �) experimental densities in May.
Fig. 4 Morphological characteristics of plants growing at thefive experimental densities (1 = 200, 2 = 400, 3 = 800, 4 = 3200,5 = 6400 plants m−2) as mean values (± SE), n = 20. (a) lengthof the plants; (b) number of main branches; (c) dry mass of thelongest main branch; (d) number of secondary branches (inthe longest main branch). Dots in (a), (c) and (d) indicate adjustedmean values after analysis of covariance (see Table 2). In (a) and(c) the adjusted values were back-transformed from log dataand the associated statistical bias corrected (see Newman 1993for method). Letters indicate the groups differentiated byposthoc tests where these were significant at P < 0.05.
Table 2
Analyses of covariance for the effect of initial densities on different morphological attributes of larger plants (> 0.07 g).Plant length and dry mass of plants and branches were log–transformed. The interaction between the covariate and the treatment(density) was not significant in any case
Dependent variableSource ofvariation d.f. MS
F P
Plant length Density 4 0.115 24.92 0.000(covariate: dry mass of the plant) Residual 94 0.005
Longest main branch
Dry mass of the branch Density 4 0.104 17.24 0.000(covariate: dry mass of the plant) Residual 94 0.006Number of secondary branches Density 4 412.084 4.04 0.005(covariate: length of the branch) Residual 94 102.134
JEC_720.fm Page 824 Monday, September 23, 2002 11:06 AM
825
Density-dependence in an invasive seaweed
© 2002 British Ecological Society,
Journal of Ecology
,
90
, 820–829
dry mass, however, did not differ among densities (
F
4,15
= 0.54, P = 0.710).The mean length of plants in the plots collected in
May and June followed a similar trend to the meanweights, although the differences were no longer signi-ficant (Fig. 6a, Table 3). Gini coefficients for plantlength distributions increased steadily with density andwere significantly higher at the highest density (Fig. 6a,Table 3) (Pearson’s correlation coefficient among logdensity and Gini coefficient, r = 0.757, P < 0.001,n = 17 in June). This pattern was due to the fact thatdensity-dependent elongation was more evident inlarge plants (Fig. 3). The contrasting results shown inFig. 6(a), where mean values for all plants are shown,and Fig. 4(a), which considers only large plants, can besimilarly explained by the dominance of small plants atthe lowest and the highest densities.
The effect of density on the size structure of thestands was also investigated at the modular level, byanalysing the length distributions of all the mainbranches of all plants. Again, patterns were not signi-ficantly different among densities but the Gini coeffi-cients increased with density (Fig. 6b, Table 4).
The percentage of fertile plants in June was not signi-ficantly different among densities (analysis of variance,F4,12 = 1.38, P = 0.299) although, like mean weightsand lengths, they tended to be higher at lower densities,except at the lowest one (200 plants m−2), where thepercentages dropped (Fig. 7a). When plants with
immature receptacles were included to give an estimateof the percentage in late summer, the trends weresimilar (Fig. 7a).
The reproductive allocation of the secondarybranches was apparently not affected directly by den-sity (Fig. 7b; analysis of covariance for reproductivedry mass, F1,67 = 3.28, P = 0.075). The relationshipbetween vegetative and reproductive dry mass fitted alinear regression (r2 = 0.853, P < 0.001) with a negativey-intercept (y-intercept ± 95% confidence limits =−0.0166 ± 0.003; see Fig. 7b), indicating that reproduc-tive allocation was an increasing function of the size ofsecondary branches.
In order to assess the reproductive allocation at thelevel of plant, it is important to note that although thetotal number of secondary branches per individual didnot differ among densities (analysis of covariance,F1,12 = 0.007, P = 0.936, plant dry mass as covariate),there were plastic changes in growth form (number andinequality of main branches) and plants of similar sizes
Fig. 5 Mean dry mass per plant in May for the fiveexperimental densities (codes as in Fig. 4) Gini coefficients(dots) for plant size distributions. Mean values ± SE areshown, n = 4. Letters indicate the groups with different drymass at P < 0.05.
Table 3 Analysis of variance for the effects of experimental densities on mean plant length and Gini coefficients for plantscollected in May and June 1996. The interaction density × time was not significant (P = 0.973 in both cases) and pooled residualMS were calculated. Variances were homogeneous
Source of variation d.f.
Mean plant length Gini coefficient
MS F P MS F P
Density 4 71.179 1.55 0.212 0.024 5.30 0.002Time 1 4859.710 100.12 0.000 0.017 3.72 0.063Residual 31 45.843 0.005
Data from three missing plots were replaced by the mean value of the group, and 3 d.f. subtracted from residual.
Fig. 6 Mean lengths for plants (a) and main branches (b) atthe five experimental densities and their Gini coefficients(dots) (June data, patterns were similar in May; Tables 3 and4, non-significant interaction density × time). Mean values ±SE are shown, n = 3 for the three lowest densities, n = 4 for therest. Letters indicate different groups for Gini coefficients atP < 0.05 (pooled May and June data).
JEC_720.fm Page 825 Monday, September 23, 2002 11:06 AM

826F. Arenas, R. M. Viejo & C. Fernandez
© 2002 British Ecological Society, Journal of Ecology, 90, 820–829
had longer secondary branches in the dominant mainbranch when growing at higher densities.
Discussion
Responses of the invasive seaweed S. muticum tocrowding appear remarkably similar to those of higherplants. Plastic changes in the birth rate and growth ofmodules that regulate the accumulation of biomass,and reduced genet mortality, may allow the establish-ment and persistence of highly dense populations,despite the presence of asymmetric competition.
: ‘ ’
Net mortality over the whole experimental period wasonly detected at the two highest densities. The numberof visible plants increased strikingly, especially in thelowest density between January and May, when irradi-ance levels rose (Fig. 2). In this region, S. muticumis only fertile in late spring and summer (Arenas &Fernández 1998), and this increase must therefore be dueto growth of germlings that were not visible during theexperimental thinning, or non-removal of microscopicplant fragments. The presence of a bank of microscopicgermlings with a delayed development has beendemonstrated for many seaweed species (see Hoffman
& Santelices 1991 for a review), and S. muticum also hasan extraordinary capacity for regenerating from smallfragments of holdfasts (Fletcher & Fletcher 1975).
These sources of recruits could play a similar role tothat of seed or seedling banks in terrestrial plant popu-lations, reducing the amplitude of the fluctuations aboutan equilibrium population (MacDonald & Watkinson1981), as described by Ang (1991) and Creed et al.(1996) for two seaweed species. The existence of suchreserves may enable successful invaders like S. muticumto recover from canopy loss following disturbance.
Density-dependent changes in the average form ofplants have been detected in some kelp species, whichexhibit stipe elongation in crowded stands (Hymansonet al. 1990; Reed 1990; Holbrook et al. 1991; Sjøtunet al. 1998). To our knowledge, however, this is the firstmarine study where the effect of competition on plantform was also investigated allometrically and whereplastic changes in morphology were related to themodular character of the alga.
Density changed the slope of the allometric length–dry mass relationship in S. muticum, with plants grow-ing at higher densities becoming taller and thinner(Fig. 3). In terrestrial systems the log-log allometryoften becomes non-linear in crowded stands, as a resultof a higher relative elongation of small ‘suppressed’plants in relation to large ‘dominant’ ones (e.g. Geber1989; Weiner & Thomas 1992; Yokozawa & Hara 1995;Berntson & Wayne 2000). This was not observed inS. muticum, where plants changed shape across densities,but the allometric growth pattern was similar for plantsof different size within a stand.
The birth rate of modules (main branches) decreasedwith density (Fig. 4). Such regulation may preventovercrowding in clonal phanerogams with tightlyaggregated modules (i.e. with a ‘phalanx’ growth form;Lovett Doust 1981; Schmid & Harper 1985; de Kroon& Kwant 1991) and in some bryophytes (van derHoeven & During 1997). The results of this and a pre-vious study on the brown alga Ascophyllum nodosum(Viejo & Åberg 2001), demonstrated that similarmechanisms could take place in seaweeds and couldexplain the absence of self-thinning in several species ofclonal red algae (Scrosati & Servière-Zaragoza 2000).
Table 4 Analysis of variance for the effects of experimental densities on mean length of main branches and Gini coefficients ofthe length branch structure. The plots were collected at two different times: May and June 1996. The interaction density × timewas not significant and pooled residual MS were calculated. Variances were homogeneous
Source of variation d.f.
Mean length Gini coefficients
MS F P MS F P
Density 4 50.229 1.67 0.517 0.009 4.38 0.006Time 1 2107.171 70.16 0.001 0.089 41.27 0.000Residual 31 30.033 0.002
Data from three missing plots were replaced by the mean value of the group, and 3 d.f. subtracted from residual.
Fig. 7 (a) Percentages of fertile and potentially fertile(hatched and open bars, respectively) plants in June for thefive experimental densities. Mean values ± SE are shown, n =3 for the three lowest densities, n = 4 for the two highestdensities. (b) Relationship between the vegetative andreproductive dry mass of secondary branches at 400 (�) and6400 (�) plants m−2.
JEC_720.fm Page 826 Monday, September 23, 2002 11:06 AM

827Density-dependence in an invasive seaweed
© 2002 British Ecological Society, Journal of Ecology, 90, 820–829
Elongation of the dominant main branch and areduction of the frequency of secondary branchingat high density (Fig. 4) may be similar to the ‘shadeavoidance responses’ (Smith 1982) of terrestrial plants.Such responses to crowding are adaptive (Schmittet al. 1995; Dudley & Schmitt 1996; Dorn et al. 2000)and are mediated by phytochrome (Smith 1982; Casal& Smith 1989). Algal canopies are similarly exposed tochanges in light quality, which could be detected bytheir phytochrome-like photoreceptors (Salles et al.1996).
The trend for dry mass inequality to increase withdensity supports the presence of asymmetrical com-petition (see also Weiner 1985; Weiner & Thomas 1986for terrestrial plants; Reed 1990; Creed et al. 1998 forseaweeds). Light competition appears to be critical inestablishing the pattern of dominant and suppressedindividuals in both terrestrial and marine systems(Schmitt et al. 1987; Creed et al. 1998). Nutrients,which are above- rather than below-ground resourcesfor seaweeds, may, however, also be more readilyavailable for larger plants, as reduced water movementaround small fronds can lead to them being nutrientlimited (Denny 1988).
The pattern is actually reversed at the lowest density(Fig. 5), but this was probably the consequence ofrecruit addition, rather than a reflection of reducedperformance. In seaweed stands, negative effects atlower densities have occasionally been reported (e.g.Hay 1981; Schiel 1985; Bertness & Leonard 1997) andrelated, for species living at low intertidal and subtidallevels, to increases in physical battering and abrasion(Schiel 1985). Our experiment was, however, conductedin a wave-protected area and the percentages of brokenplants were similar at 200 and 400 plants m−2 (5.1% and6.2%, respectively).
The progressive elongation of S. muticum as densityincreases affected all plants within a stand and there istherefore a spreading of the length distributions and aprogressive increase in length inequality as densityincreases (Fig. 6a). The distributions of main branchlengths suggested that asymmetric competition wasalso operating at the modular level (Fig. 6b), whichis related to the functional independence of mainbranches within a plant (Chamberlain et al. 1979). Suchlength effects may be harder to detect in terrestrialplants (e.g. Geber 1989 and references therein), becauseelongation commonly affects small individuals morethan large individuals.
In terrestrial systems the effects of density on thereproductive output and reproductive effort are oftenindirect, mediated by changes in the size of the plants
(e.g. Samson & Werk 1986). The mean size of S. muticumplants decreased with density, with the exception of thelowest density, and this was related to the percentage offertile plants (Fig. 7a). Furthermore, the reproductiveallocation of secondary branches was size-dependent,which suggested the same pattern for the whole plantswithin a stand (see also Arenas & Fernández 1998).However, comparison among densities is confoundedby differences in both size and morphology. Plants ofidentical dry mass growing at higher densities exhibiteda longer main branch with longer secondary branches,which would tend to diminish the size-dependentdifferences in reproduction.
- S. M U T I C U M
The responses of S. muticum to crowding are closelylinked to the way this aggressive invader (Norton 1976)colonizes and occupies new habitat. It is self-fertile andhas effective means of long-range dispersal, as driftingfragments become fertile while suspended. Theembryos of S. muticum, however, are fast-sinking,multicellular propagules, which account for especiallydense local colonization patterns (Deysher & Norton1982). The growth form of S. muticum is similar to thephalanx strategy of terrestrial clonal plants, with a verycompact structure of closely spaced ramets (LovettDoust 1981). It combines the fast growth of the ramets(main branches) with the persistence of the perennialbasal part (Norton 1976). The morphological plasti-city of the species in the production of modules (mainbranches) and branch elongation reduces interferenceamong neighbours, allowing plants to grow in locallydense populations with low mortality and diminishingthe effects of density on reproduction. S. muticum alsoexhibits mechanisms to compensate for eventualcanopy losses, further enabling rapid colonization, andconsolidation and persistence of local populations,preventing invasion by other species.
Acknowledgements
We thank David Gutiérrez, Victoria López-Dóriga,Emilio Marañón, Marcos Méndez and Rosa Menéndezfor their help with experimental manipulation in thefield. We are also grateful to Lindsay Haddon, Hans deKroon, Brezo Martínez, Ricardo Scrosati, JacobWeiner and two anonymous referees for their valuablecritical comments on the manuscript. This study wasfunded by the EU MASTIII project EUROROCK(MAS3-CT95-0012).
References
Ang, P.O. (1991) Natural dynamics of a Fucus distichus(Phaeophyceae, Fucales) population: reproduction andrecruitment. Marine Ecology Progress Series, 78, 71–85.
JEC_720.fm Page 827 Monday, September 23, 2002 11:06 AM
828F. Arenas, R. M. Viejo & C. Fernandez
© 2002 British Ecological Society, Journal of Ecology, 90, 820–829
Ang, P.O. & De Wreede, R.E. (1992) Density-dependence in apopulation of Fucus distichus. Marine Ecology ProgressSeries, 90, 169–181.
Antonovics, J. & Levin, D.A. (1980) The ecological andgenetic consequences of density-dependent regulation inplants. Annual Review of Ecology and Systematics, 11, 411–452.
Arenas, F. & Fernández, C. (1998) Ecology of Sargassummuticum (Phaeophyta) on the North Coast of Spain. III.Reproductive ecology. Botanica Marina, 41, 209–216.
Arenas, F. & Fernández, C. (2000) Size structure and dynam-ics in a population of Sargassum muticum (Phaeophyceae).Journal of Phycology, 36, 1012–1020.
Berntson, G.M. & Wayne, P.M. (2000) Characterizing the sizedependence of resource acquisition within crowded plantpopulations. Ecology, 81, 1072–1085.
Bertness, M.D. & Leonard, G.H. (1997) The role of positiveinteractions in communities: lessons from intertidal habi-tats. Ecology, 78, 1976–1989.
Casal, J.J. & Smith, H. (1989) The function, action and adap-tive significance of phytochrome in light-grown plants.Plant, Cell and Environment, 12, 855–862.
Chamberlain, A.H.L., Gorham, J., Kaen, D.F. & Lewey, S.A.(1979) Laboratory growth studies on Sargassum muticum(Yendo) Fensholt. Botanica Marina, 22, 11–19.
Creed, J.C., Kain, J.M. & Norton, T.A. (1998) An experimen-tal evaluation of density and plant size in two large brownseaweeds. Journal of Phycology, 34, 39–52.
Creed, J.C., Norton, T.A. & Kain, J.M. (1996) Are neighboursharmful or helpful in Fucus vesiculosus populations?Marine Ecology Progress Series, 133, 191–201.
Critchley, A.T., Farham, W.F. & Morrell, S.L. (1983) A chro-nology of new European sites of attachment for the invasivebrown alga, Sargassum muticum 1973–81. Journal of theMarine Biological Association of the United Kingdom, 63,799–811.
Denny, M.W. (1988) Biology and the Mechanics of the Wave-Swept Environment. Princeton University Press, Princeton.
Deysher, L. & Norton, T.A. (1982) Dispersal and coloniza-tion in Sargassum muticum (Yendo) Fensholt. Journal ofExperimental Marine Biology and Ecology, 56, 179–195.
Dorn, L.A., Hammond-Pyle, E. & Schmitt, J. (2000) Plasticityto light cues and resources in Arabidopsis thaliana: testingfor adaptive value and costs. Evolution, 54, 1982–1994.
Dudley, S.A. & Schmitt, J. (1996) Testing the adaptiveplasticity hypothesis: density-dependent selection onmanipulated stem length in Impatiens capensis. AmericanNaturalist, 147, 445–465.
Ellison, A.M. (1987) Density-dependent dynamics of Salicor-nia europaea monocultures. Ecology, 68, 737–741.
Fernández, C. (1999) Ecology of Sargassum muticum(Phaeophyta) on the north coast of Spain. IV. Sequence ofcolonization on a shore. Botanica Marina, 42, 553–562.
Fernández, C., Gutiérrez, L.M. & Rico, J.M. (1990) Ecologyof Sargassum muticum on the north coast of Spain. Prelim-inary observations. Botanica Marina, 33, 423–428.
Fletcher, R.L. & Fletcher, S.M. (1975) Studies on the recentlyintroduced brown alga Sargassum muticum (Yendo) Fen-sholt. I. Ecology and reproduction. Botanica Marina, 18,149–156.
Geber, M.A. (1989) Interplay of morphology and developmenton size inequality: a Polygonum greenhouse study. Ecolo-gical Monographs, 59, 267–288.
Givernaud, T., Cosson, J. & Givernaud-Mouradi, A. (1991)Étude des populations de Sargassum Muticum (Yendo)Fensholt sur les côtes de Basse-Normandie (France).Estuaries and Coasts: Spatial and Temporal Intercompari-sons. ECSA 19 Symposium (eds M. Elliot & J.P. Ducrotoy),pp. 129–132. Olsen & Olsen, Fredensborg Denmark.
Harper, J.L. (1977) Population Biology of Plants. AcademicPress, London.
Hay, M. (1981) The functional morphology of turf-formingseaweeds: persistence in stressful marine habitats. Ecology,62, 739–750.
van der Hoeven, E.C. & During, H.J. (1997) The effect ofdensity on size frequency distributions in chalk grasslandbryophyte populations. Oikos, 80, 533–539.
Hoffman, A.J. & Santelices, B. (1991) Banks of algal micro-scopic form: hypothesis on their functioning and com-parison with seed banks. Marine Ecology Progress Series,79, 185–194.
Holbrook, N.M., Denny, M.W. & Koehl, M.A.R. (1991)Intertidal ‘trees’: consequences of aggregation on themechanical and photosynthetic properties of sea-palmsPostelsia palmaeformis Ruprecht. Journal of ExperimentalMarine Biology and Ecology, 146, 39–47.
Hutchings, M.J. & de Kroon, H. (1994) Foraging in plants:the role of morphological plasticity in resource acquisition.Advances in Ecological Research, 25, 59–238.
Hymanson, Z.P., Reed, D.C., Foster, M.S. & Carter, J.W.(1990) The validity of using morphological characteristicsas predictor of age in the kelp Pterygophora californica(Laminariales, Phaeophyta). Marine Ecology ProgressSeries, 59, 295–304.
Jephson, N.A. & Gray, P.W.G. (1977) Aspects of the ecologyof. Sargassum Muticum (Yendo) Fensholt, in the Solentregion of the British Isles. I. The growth cycle and epiphytes.Biology of Benthic Organisms. 11th European Symposiumof Marine Biology (eds B.F. Keegan, P.O. O’Ceidigh &P.J.S. Boaden), pp. 367–375. Pergamon, Oxford.
Kendrik, G.A. (1994) Effects of propagule settlement densityand adult canopy on survival of recruits of Sargassum spp.(Sargassaceae: Phaeophyta). Marine Ecology ProgressSeries, 103, 129–140.
Klinkhamer, P.G., Jong, T.J. & Meelis, E. (1990) How to testfor proportionality in the reproductive effort of plants.American Naturalist, 135, 291–300.
de Kroon, H. & Kwant, R. (1991) Density-dependent growthresponses in two clonal herbs: regulation of shoot density.Oecologia, 86, 298–304.
Lazo, M.L. & Chapman, A.R.O. (1998) Components ofcrowding in a modular seaweed: sorting through the con-tradictions. Marine Ecology Progress Series, 174, 257–267.
Lovett Doust, L. (1981) Population dynamics and localspecialization in a clonal perennial (Ranunculus repens). I.The dynamics of ramets in contrasting habitats. Journal ofEcology, 69, 743–755.
MacDonald, N. & Watkinson, A.R. (1981) Models of anannual plant population with seedbank. Journal of Theo-retical Biology, 93, 643–653.
Newman, M.C. (1993) Regression analysis of log-transformeddata: statistical bias and its correction. EnvironmentalToxicology and Chemistry, 12, 1129–1133.
Norton, T.A. (1976) Why is Sargassum muticum so invasive?British Phycological Journal, 11, 197–198.
Norton, T.A. (1977) The growth and development of Sargas-sum muticum (Yendo) Fensholt. Journal of ExperimentalMarine Biology and Ecology, 26, 41–53.
Norton, T.A. & Deysher, L.E. (1989) The reproductiveecology of Sargassum muticum (Yendo) at different lati-tudes. Reproduction, Genetics, and Distributions of MarineOrganisms. Proceedings of 23rd European Marine BiologySymposium (eds J.S. Ryland & P.A. Tyler), pp. 115–125.Olsen & Olsen, Fredensborg Denmark.
Reed, D.C. (1990) An experimental evaluation of densitydependence in a subtidal algal population. Ecology, 71,2286–2296.
Rice, K.J. (1990) Reproductive hierarchies in Erodium: effectsof variation in plant density and rainfall distribution.Ecology, 71, 1316–1322.
Salles, S., Aguilera, J. & Figueroa, F.L. (1996) Light field inalgal canopies: changes in spectral light ratios and growth
JEC_720.fm Page 828 Monday, September 23, 2002 11:06 AM
829Density-dependence in an invasive seaweed
© 2002 British Ecological Society, Journal of Ecology, 90, 820–829
of Porphyra leucosticta Thur. Le Jol. Scientia Marina, 60(Suppl.), 29–38.
Samson, D.A. & Werk, K. (1986) Size-dependent effects in theanalysis of reproductive effort in plants. American Natural-ist, 127, 667–680.
Santos, R. (1995) Size structure and inequality in a com-mercial stand of the seaweed Gelidium sesquipedale. MarineEcology Progress Series, 119, 253–263.
Schiel, D.R. (1985) Growth, survival and reproduction of twospecies of marine algae at different densities in naturalstands. Journal of Ecology, 73, 199–217.
Schmid, B. & Harper, J.L. (1985) Clonal growth in grasslandperennials. I. Density and pattern-dependent competitionamong plants with different growth forms. Journal ofEcology, 73, 793–808.
Schmitt, J., Eccleston, J. & Ehrhardt, D.W. (1987) Dominanceand suppression in experimental radish population.Journal of Ecology, 75, 651–665.
Schmitt, J., McCormac, A.C. & Smith, H. (1995) A test of theadaptive plasticity hypothesis using transgenic and mutantplants disabled in phytochrome-mediated elongationresponses to neighbors. American Naturalist, 146, 937–953.
Scrosati, R. & Servière-Zaragoza, E. (2000) Ramet dynamicsfor the clonal seaweed Pterocladiella capillacea (Rhodophyta,Gelidiales): a comparison with Chondrus crispus and withMazzaella cornucopiae (Gigartinales). Journal of Phycology,36, 1061–1068.
Sjøtun, K., Fredriksen, S. & Rueness, J. (1998) Effect of can-opy biomass and wave exposure on growth in Laminariahyperborea (Laminariaceae: Phaeophyta). EuropeanJournal of Phycology, 33, 337–343.
Smith, H. (1982) Light quality, photoperception and plantstrategy. Annual Review of Plant Physiology, 33, 481–518.
Thomas, S.C. & Weiner, J. (1989) Growth, death and sizedistribution change in an Impatiens pallida population.Journal of Ecology, 77, 524–536.
Turner, M.D. & Rabinowitz, D. (1983) Factors affecting
frequency distributions of plant mass: the absence ofdominance and suppression in competing monocultures ofFestuca paradoxa. Ecology, 64, 469–475.
Underwood, A.J. (1997) Experiments in Ecology, Their Log-ical Design and Interpretation Using Analysis of Variance.Cambridge University Press, Cambridge.
Viejo, R.M. & Åberg, P. (2001) The effects of density on thevital rates of a modular seaweed. Marine Ecology ProgressSeries, 221, 105–115.
Weiner, J. (1985) Size hierarchies in experimental populationsof annual plants. Ecology, 66, 743–752.
Weiner, J. (1990) Asymmetric competition in plant popula-tions. Trends in Ecology and Evolution, 5, 360–364.
Weiner, J., Berntson, G.M. & Thomas, S.C. (1990) Competi-tion and growth form in a woodland annual. Journal ofEcology, 78, 459–469.
Weiner, J. & Solbrig, O.T. (1984) The meaning and measure-ment of size hierarchies in plant populations. Oecologia, 61,334–336.
Weiner, J. & Thomas, S.C. (1986) Size variability and com-petition in plant monocultures. Oikos, 47, 211–222.
Weiner, J. & Thomas, S.C. (1992) Competition and allometryin three species of annual plants. Ecology, 73, 648–656.
Winer, B.J., Brown, D.R. & Michels, K.M. (1991) StatisticalPrinciples in Experimental Design. McGraw-Hill, NewYork.
Yastrebov, A.B. (1996) Different types of heterogeneity andplant competition in monospecific stands. Oikos, 75, 89–97.
Yokozawa, M. & Hara, T. (1995) Foliage profile, size structureand stem diameter-plant height relationship in crowdedplant populations. Annals of Botany, 76, 271–285.
Yoshida, T. (1983) Japanese species of Sargassum subgenusBactrophycus (Phaeophyta, Fucales). Journal of the Facultyof Sciences Hokkaido University Series V. Botany, 13, 99–246.
Received 3 January 2002 revision accepted 14 June 2002
JEC_720.fm Page 829 Monday, September 23, 2002 11:06 AM