THE rUNDAMENTAL STATE-VARIABLE rREQUENCY fflATRIX ...
157
THE rUNDAMENTAL STATE-VARIABLE rREQUENCY fflATRIX ~y JAMES OTTO mATOUS Bachelor of Science Wichita State ~hiversity Wichita, l(ansas 1957 Master of Science Wichita State University Wichita, Kansas 1963 Submitted to the faculty of the Graduate College of the Oklahoma State University in partial fulfillment of the require- ments for the degree of DOCTOR Or PHILOSOPHY may, 1967
-
Upload
khangminh22 -
Category
Documents
-
view
1 -
download
0
Transcript of THE rUNDAMENTAL STATE-VARIABLE rREQUENCY fflATRIX ...

THE rUNDAMENTAL STATE-VARIABLE
rREQUENCY fflATRIX
~y
JAMES OTTO mATOUS
Bachelor of Science Wichita State ~hiversity
Wichita, l(ansas 1957
Master of Science Wichita State University
Wichita, Kansas 1963
Submitted to the faculty of the Graduate College of the Oklahoma State University in partial fulfillment of the require
ments for the degree of DOCTOR Or PHILOSOPHY
may, 1967

THE FUNDAMENTAL STATE-VARIABLE
f"REQUENCY MATRIX
Thesis Approwedg
:_:::.;>~~sis fuser
11.a ~ i2rd <29?! (l ~a=-.<
f(--n. I<,~ ..
~n of t~fe College
ii

~ OKLAHOhi\A f STATE UNIVEl<SITY ) .
t: LIBRARY !
l ~ JAN 1 ti 1968 ,, r, i·
l . ~ .... ~ ...... -:,,..:.,_ ·.~~:'"'-~ •, ...-~ .~~ '!"""~ ... -.1:.-·--t-·· .. ,~.-- ....... ,;Y',"'t.'.t"'.··'>,:9
ACKNOWLEDGMENT
All documents such as this which finalizes an important
phase of the writer's life are the results of inspiration
contributed by many individuals. To all those from whom I
have received inspiration I extend my deepest appreciation.
My sincere thanks to Dr. E. c. ritch for his constant
encouragement and confidence during my entire doctorate pro-
gram, to Dr. William A. Blackwall for acting as my technical
adviser and for his sincere interest in my work, and to
Dr. Karl N. Raid and Professor Paul A. mcCollum for their
contributions to my graduate program as members of my gradu-
ate committee.
To Frank H. Winters and the Caterpillar Tractor Company
my t hanks for the confidence and financial assistance. Also,
thanks to the members of the Catepillar Project Messrs. Jerry
G. Mrazek, James£. Bose, and M. Allen Ross for their inval
uable assistance and friendship throughout the project.
To my wife, Naomi, and my son, Steve, both of whom made
my years of graduate study possible as wall as worthy, my
sincere thanks.
351)523

Chapter
I•
II.
III.
TABLE Or CONTENTS
INTRODUCTION • • • • • • • • • • • • • • • • • •
State-Variable Models ••••••••• Fundamental State-Variable rrequency
Canonical Form ••••••••••••
• •
• •
SIGNirICANT HISTORICAL CONTRIBUTIONS • • • • • 0
Page
1
3
5
9
Brockett•s State MQdel Transfer runction •• 10 System rrequency Response Using State Models
in Jordan Canonical Form • • • • • • • • • 12 System Frequency Response Using State Models
in Ratimnal Canonical Form •••••••• 15 Smith's Method •••••••••••• 18 Ausman•s. method • • • • • • • • • • • • 26
Summary •••••••••••••••••• 41
MATA!~ DISPLAY OF SYSTEM FREQUENCY SPECTRUMS • • 43
General Theory of the Fundamental StateVariable Frequency matrix •••••••• 44
The Fundamental State-Variable Frequency Matrix •••••••••••••••••• 45
Frequency Canonical Form From Original System Models ••••• · •• ~ •••• 47
Frequency Canonical Form Derived From State Models •••••••••••• 51
Spectrum Band-pass Matrices •••••••• 53 Frequency Spectrum Data From Model
Coefficients ••••••••••••••• 59 Summary •••••••••••••••••• 75
IV. FREQUENCY CANONICAL FORM SYNTHESIS ANO COMPENSA-TION APPLICATIONS •• • ••••••••••••• 77
Basic Feedback Control • • • • • • • • • • • 78 Synthesis in State Space •••••••••• 80 Compensation in State Space •••••••• 84 Sensitivity Cbeck in State Space •••••• 91 Summary •••••••• ; ••••••••• 96
iv

Chapter Page
V. STATE MODELS DERIVED rROM EXPERIMENTAL DATA ••• 97
State Models rrom Frequency Response Data • 97
VI. SUMMARY OF SYSTEMS ANALYSIS ANO SYNTHESIS VIA USE OF THE FREQUENCY CANONICAL STATE MODEL ••• 105
Obtaining the Frequency Canonical Form ••• 1©5 Analysis Using the Frequency Canonical
Form ••••••••••••••••••• 106 Synthesis Using the Frequency Canonical
Form ••••••••••••••••••• 108 Compernsation Using the Frequency Canonical
Form ••••••••••••••••••• 109 System Modeling From Experimental Data
Using the rrequency Canonical rorm •••• 110
VII. CONCLUSIONS ANO RECOMMENDATIONS • • • • • • • • • 112
SELECTED BIBLIOGRAPHY • • • • • • • • • • • • • • • • • 117
APPENDIX A - State-Variable Diagrams From Direct Programming Methods • • • • • • • • • • • 119
APPENDIX B - Resonant Peak Transmissibilities • • • • • 128
APPENDI·x C - Stability Evaluation for Third and Fourth Order Systems •••••••••••••• 136
APPENDIX D - Principles of State-Variable Modeling ••• 143
V

f"igure
2-1.
2-2.
2-3.
2-4.
2-5.
2-6.
2-7.
LI ST Of" f"I GURE S
Contours of Term-pair Templets Representing Logarithmic Plots of .ta .tb{.02, Shown Oriented for a= b = 1 ••••••••• • • •
Contours of Term-pair Templets Representing Logarithmic Plots of :ta W .tbW3, Shown Oriented for a = b = 1 ••••••••••
Summing Templet With Illustration of Its Use
• •
• • Amplitude Temple, and Angle Scale • • • • • • • • Simple Second Order System • • • • • • • • • • •
Underdamped Second Order System. • • • • • • • • Two Oegree-of-f"reedom Mechanical System. • • • •
Page
21
22
24
25
31
34
36
3-1. State Diagram for f"requency Canonical f"orm
3-2.
3-3.
3-4.
3-5.
Derived f"rom tbe ' State Diagram for the Rational Canon! cal f"orm • • • • • · • • • • • • • • • • • 49
First Order Approxima tic,n for Simple Mode Spectrum • • • .. • • • • • • • • • • • • • • •
First Order Approximation for Underdamped Mode Frequency Response Spectrum • • • • • • • • • •
First Order Approximation for Multiple mode Frequency Response Spectrum • • • • • •
Transmission f"unction Representation for Frequency Response Spectrums With Damping Function Varied ••••••••
Transmission function Representation for f"requency Response Spectrums for Various Mode Separations •••••••
vi
• • • •
• • • •
• • • •
64
68
70
71
72

Figure Page
3-7. Transmission Function Representation for Frequency Response Spectrums With Coincident Transmission Bandwidth Boundaries ••••••• 73
4-1. Comparison of Frequency Spectrums for a System With and Without Unity Feedback •••••••• 81
4-2. Synthesized System Frequency Response Spectrum by use of the Frequency Canonical State model •• 83
Resonant Peak Transmission Asymptote Function Variation ••••••••••••••••• • • 85
4-4. Effect of Zeroth Order Transmission Function on Fre~uency Response Spectrums ••••••••• 87
4-5. Electrical Network • • • • • • • • • • • • • • • .9.3
5-1. Frequency Canonical State Model Linear System Identification ••••••••• . • •••••• 100
5-2. Frequency Canonical State Modal Identification of Arbitrarily Drawn Spectrum ••••••••• 102
A-1. State Model Diagram for Tau's Direct Programming method •••••••••••••• • ••••• 123
A-2. State Model Diagram for the Rational Canonical Form Direct Programming Method •••••••• 125
8-1. Mode Damping Characteristi cs 0 0 0 0 0 0 • • • • 130
132 Resonant Peak Transmissibility Di fferential.
Illustration of Resonant Peak Determination.
• •
• • 135
C-1. Illustration of Stable System Frequency Response Spectrum Transmission functions •••••••• 138
.C-2. Illustration of Unstable System Transmission Func tions ••••••••••••••••••• 140
C-3. Illustration of Very Lightly Damped System Transmission Functions and Calculation of Peak Transmissibility ••••••••••••• 142
vii

A
a
B
b
b Wm m
b wm-1 m-1
C
C
C
D
D
db
• •
LIST Of" SYMBOLS
n by n - dimensional differential transition matrix •
• • mode description integer.
• •
0 •
coefficients of homogeneous system mathematical model.
n by p - dimensional input matrix.
•• mode description integer •
• • coefficient of system mathematical model forcing function.
• • transmission asymptote functions.
• • transmission bandwidth boundaries.
• • q by n - dimensional output matrix.
•• ·capacitance in electrical network.
•• mode description integer.
•• output matrix elements.
• • q by p - dimensional transmission matrix.
•• damping coefficient in mechanical system.
• 0 decibels, -20Log 10 T.
• • f"undamental State-Variable f"requency Matrix.
•• complex functions •
• • imaginary part of the characteristic polynomial when written as a complex function.
viii

I
i
J
j
m
m
n
p
Q
R
R
s
T
• •
• •
• •
• 0
LIST OF SYMBOLS (Continued)
identity matrix whose main diagonal is all ones with all the other entries zeros.
integer 0,1,2, ••• ,etc.
Jordan Canonical Form of the differential transition matrix.
• • con'Stant •
• • spring coefficient in mechanical system •
• • inductance in electrical network •
• • integer 0,1,2, ••• ,etc.
• • modal matrix.
•• mass of mechanical system.
• •
• •
• •
• •
0 •
• 0
• 0
• •
integer subscript 0,1,2, ••• ,etc.
integer subscript 0,1,2, ••• ,etc.
(n+q) by (n+q) - dimensional coefficient matrix.
(n+q) by n - dimensional coefficient matrix.
(n+q) by p - dimensional coefficient matrix.
Rational Canonical Form of the differential transition matrix.
resistance in electrical network •
real part of the characteristic polynomial when written as a complex function •
• • roots of the characteristic polynomial.
• • Spectrum Band-pass Matrix displaying entries which characterize the frequency spectrum in a specific frequency range •
• • Laplace Transform complex variable.
•• system transmissibility or gain, j t 1.
ix

V
U/
X
• X
2
2'
w
•
[ r [ r
0
•
LIST OF SYMBOLS (Continued)
• • p - dimensional input vector.
•• n+q - dimensional column vector with components x1' x 2 ••• xn, Y1' y2• •. Yq•
•• n - dimensional state vector with components x1, x2,•••xn•
• • n - dimensional . derivative of the state vector.
•• q - dimensional output matrix.
0 • n - dimensional frequency state vector with components 2 1, 2 2, ••• 2 1, -2 • n- n
•• n - dimensional derivative of the frequency state vector.
• • compensator lead time constant.
•• compensator lag time constant •
• • Frequency Canonical Form input matrix •
• • Frequency Transformation Matrix.
• • driving frequency.
•• natural undamped mode frequency.
• • frequency transform time.
• • differentiation with respect to time •
• • differentiation with respect to frequency transform time.
• 0 matrix notation.
• • transpose of a matrix.
• • inverse of a matrix.
• • approximately equal •
X

CHAPTER I
INTRODUCTION
The state-variable approach to the analysis of scien
tific problems, which includes nearly all the engineering 1 disci plines, is far from newo For many years this basic
approach has been used by physicists in the description of
dynamic occurrences in classical mechanics and quantum
mechanics. However, many of the more recent advancements in
the topological mathematical theory which are directly appli-
cable to state space analysis have not, as yet, been employed
by either the physicist or the engineer. Also, there exist
many concepts in both of these fields of applied mathematics
which have not been put in a proper perspective with refer-
ence to state models. Due to the increased interest in the
state- variable methods as applied to control system analysis,
a great deal of emphasis is being placed on the integration
of classical and modern control methods. 2
'1The term "state-variable" infers the description of system models in finite dimensional state space. These models contain explicit mathematical descriptions df the system's state in a vector matrix form. Appendix D shows a method for modeling systems in state space.
2modern control methods and modern control approach to system analysis are the techniques of control system analysis employing state-variable models.
1

2
Motivation for the increased emphasis on state-variable
methods by systems engineers stems from two sources. The
first source is the increased efforts being placed on
optimization. Most optimization procedures have been devel
oped from a state space standpoint. Thus, in order to apply
these theories to physical systems consistency of model
domain and optimization technique domain is a necessity.
State-variable representations for physical systems provides
this time domain match with the optimization theoriesD
The second source of motivation is the need for organ
izing the analysis methods from the systems viewpoint. tor
the analysis of linear time invariant systems classical con
trol theory provides transform techniques which allow the
system equations to be readily solved. However, when this
class of systems is extended to include time variance, these
transform techniques are no longer readily applicable. tur
ther, when nonlinear terms are introduced classical theory
employs a variety of techniques to obt~in a system evalua
tion. Thus, classical theory does not possess any particular
technique which can be extended to cover all classes of sys
tem models. The state-variable methods can be extended to
model both stationary as well as nonstationary systems and
linear as well as nonlinear systems coupled with the time
variance or time invariance characters. This property of
the state-variable approach offeDs the framework for a more
unified organization of systems analysis.
3
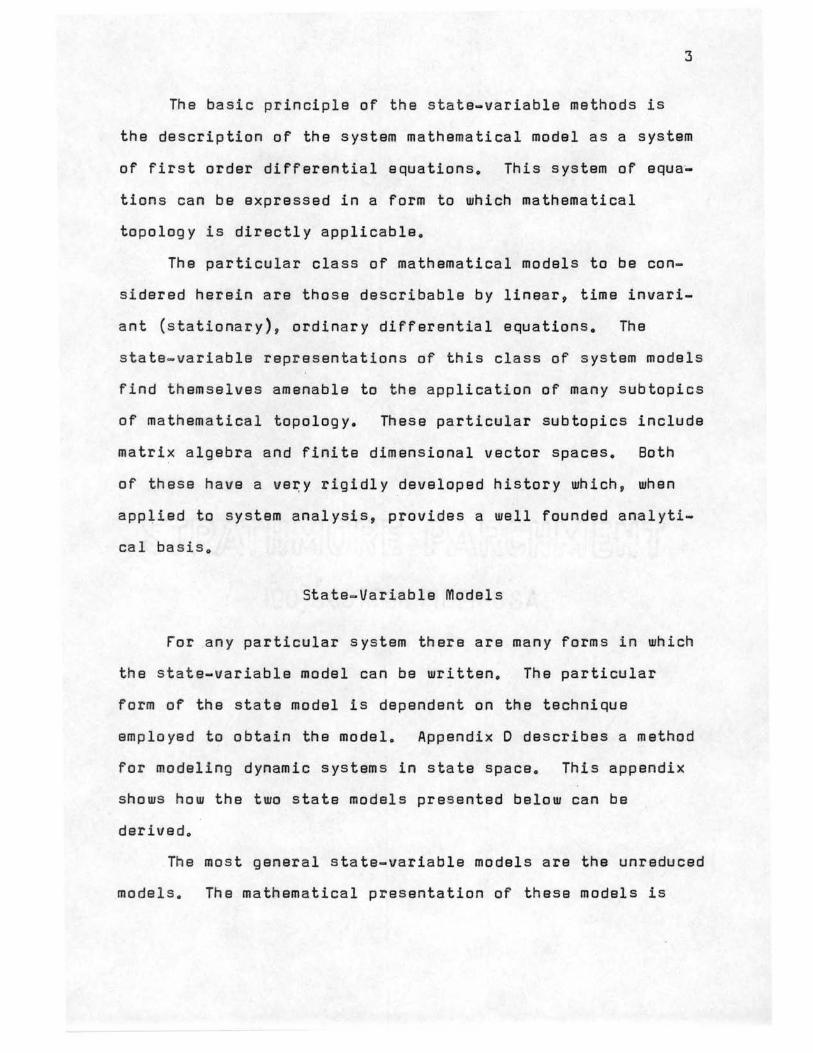
The basic principle of the state-variable methods is
the description of the system mathematical model as a system
of first order differential equations. This system of aqua~
tions can be expressed in a form to which mathematical
topology is directly applicable.
The particular class of mathematical models to be con
sidered herein are those describable by linear, time invari
ant (stationary), ordinary differential equations. The
state-variable representations of this class of system models
find themselves amenable to the application of many subtopics
of mathematical topology. These particular subtopics include
matrix algebra and finite dimensional vector spaces. Both
of these have a ve~y rigidly developed history which, when
applied to system analysis, provides a well founded analyti
cal basis 0
State-Variable Models
For any particular system there are many forms in which
the state-variable model can be written. The particular
form of the state model is dependent on the technique
employed to obtain the model. Appendix D describes a method
for modeling dynamic systems in state space. This appendix
shows how the two state models presented below can be
derived.
The most general state-variable models are the unreduced
models. The mathematical presentation of these models is

4
described in the following manner (1). 3 A system of linear,
first or~er, differential equations with constant coeffi
cients can be expressed completely by the matrix equation
where
p w = B ~ + R V (1-1)
w = ~(t) -[x] which is an {n+q) - dimensional column
- ~ :actor with components X1, X2,,,,Xn, Y1,
Y2,•••Yq•
x = ~(t) =then - dimensional state vector with compo-
1 = 1(t) = the q dimensional output vector.
v = ~(t) = the p - dimensional input vector with compo-
nents v1 , v2 , v3 ,~ •• vp.
x = x(t) =then - dimensional derivatives of state
vectors.
P = a coefficient matrix of dimension (n+q) by
(n+q).
Q = a coefficient matrix of dimension (n+q) by n.
R = a coefficient matrix of dimension {n+q) by p.
Reduction of the unreduced model to standard state space
form gives the following two equations
• X = =
A X + 8 V
C X + D V
(1-2)
(1-3)
• where~,~'~' and 1 are vectors as defined in the unreduced
3Numbers appearing in parentheses . within the text refer to references on pages 117 and 118.

modelo The coefficient matrices are as follows
A= n by n differential transition matrix
8 = n by p input matrix .
C = q by n output matrix
D = q by p transmission matrix.
5
The elements of the coefficient matrices are constants.
These constants are either real or complex and for any par
ticular system one form of the state-variable model can have
elements which are complex numbers while another form of the
state-variable model for the same system may have elements
which are all .real numbers. Therefore, a single state
variable model for a system is not unique. As many state
models can be written for a system as there are combinations
of the significant constants associated with any particular
system. Three of the more familiar forms of the differential
transition matrix are the Jordan, Rational, and Phase
Variable Canonical forms. The system characteristics
explicitly displayed by the elements of the Jordan Canonical
form are the system's charact~ristic modes (roots). The
Rational Canonical and the Phase~Variable Canonical forms
display the coefficients of the system's characteristic
equation as elements in the differ~ntial transition matrix.
fundamental State-Variable
frequency Canonical form
Due to the lack of uniqueness of the state model forms
including any of the Canonical forms discussed above, the

6
analysis procedures used in classical control theory can be
represented in one form or another by the coefficient matri
ces associated with the state-variable models. This fact
permits modern control theory to provide the much needed
unification of control theory from a system analysis
approach.
One of the analysis procedures which produces most of
the system cha~acteristics employed in classical control
theory is the system real frequency responseo The frequency
response method evaluates the system closed loop character
istics by investigating the open loop transfer function.
The frequency response approach has not as yet been employed
in the modern approach to system analysis, At the present
time the frequency response transfer function of a system
described by a state-variable model is obtained from the
state model in exactly the same form as it appears in classi
cal system analysis. Direct application of classical tech
niques is much easier 0 With presently available modern con
trol techniques it is not advantageous to follow the same or
similar paths followed in the development of classical con
trol theory.
There are various available means for constructing a
system's frequency response spectrum from the state-variable
models as will be shown in the following chapter. These
techniques are based on the parallel developments in classi
cal control theory; however, since no additional information
is obtained, no particular advantage is gained by employing

7
the state-variable approach instead of the well known trans
fer function method.
The "Fundamental State-Variable Frequency Matrix"
developed in this dissertation demonstrates that from a fre
quency response standpoint there is a definite advantage to
system state-variable modeling. The need for this matrix
will occur particularly when a system modeled in state space
is to be analyzed through its frequency response spectrum.
The "Fundamental State-Variable Frequency Matrix" displays
explicitly the critical gains, a~ymptotes, and frequencies
associated with the system frequency response. These funda
mental characteristics are derived from the entries in the
"fundamental State-Variable Frequency Matrix"o
The information derived from the basic theory of the
"Fundamental State-Variable frequency Matrix" has application
to compensation and synthesis as well as analysis. This
theory has a rather unique inverse in its application by
direct utilization of experimental frequency response infor
mation. Since the frequency matrix contains critical gains,
asymp~otes, and f~equencies, experimental frequency response
data can be used to fill out the matrixo Thus, the state
variable model can be systematically derived from test data.
Since the state models are not unique, it is possible
to obtain the "Fundamental State-Variable frequency Matrix"
from a system's mathematical model in one of two ways.
first, the state model can be written by any one of the
standard available means which results in a canonical form.

8
With this model a transformation is performed resulting in
the frequency matrix~ The transformation necessary to
transform state models into the Frequency Canonical Form is
developed in this .dissertationo Second, the state model can
be written directly in the frequency Canonical Form by a
direct programming method developed in this dissertationo

CHAPTER II
SIGNirICANT HISTORICAL CONTRIBUTIONS
The use of state-variable models has only recently
received a great deal of emphasis by systems engineers.
Consequently 9 no work has been exerted to express the sys
tem's frequency response spectrum utilizing modern control
theory state models. However, four methods are presented by
which the frequency response spectrum can be constructed
from state-variable models. The first of these methods was
developed from Brockett•s work (2). Brockett•s work 9 as
will be shown, develops the transfer function of the system
in a matrix form from which the frequency spectrum can be
constructed using Bede's Theorems. The remaining thr~e m~th
ods presented employ work of other investigators which has
been modified by the author to use state models instead of
the frequency domain transfer f~nction. The first of these
methods to obtain the frequency response from a state model
is restricted to those systems which have simple forcing
functions. This method employs the Jordan Canonical form of
the state model. The pther two methods of drawing the fre
quency response spectrum from a 'State model involves the combining
together of individually developed techniques. One of these,
developed by Smith (3), which has some limitations, uses a
9

10
direct programming technique to produce tha state model in
canonical form and a graphical method for drawing the fre
quency response spectrum. The other one uses the same means
of developing the state model but the frequency response
spectrum is obtained by a method developed by Ausman (4).
The direct programming techniques referred to are discussed
· in Appendix A.
Brockett's State Model Transfer runction
Brockett•s work considered the class of linear, time-
invariant system5 which can be described by the reduced
state-variable models shown in the following vector matrix
equations.
x(t)
1(t)
= ~ ~(t) + ~ ~(t) '
= f ~(t) + D ~(t)
(2-1)
(2-2)
In these equations ~(t) and 1(t) are the system input and
output matrices, respectively, and ~(t) is the system state
variable matrix. In this work it is assumed that ~(t) and
1(t) are vectors of the same dimension, say q, and that ~(t)
is a vector of dimension n. Particular emphasis is placed
on the class of systems which have a single input and a
single output. This is reflected in the state moqel by set
ting the dimension q equal to oneo Consequently, ~(t) and
1(t) are one by one column vectors and are written as v(t)
and y(t). The particular state-variable model used by
Brockett is shown below.
x(t)
y(t)
= ~ ~(t) + B v(t)
= f ~(t) + D v(t)
(2-3)
(2-4)

11
Equations (2-3) and (2-4) can be transformed by use of
Laplace Transformations. The result of this transformation
is
s ~(s) - ~(O) = 1 ~(s) + ~ v(s)
y(s) = £ !(s) + D v(s)
(2-5)
(2-6)
Equation (2-5) must be solved for ~(s) in order to obtain
the transfer function.
s ~(s) - 1 ~(s) = ~(O) + 8 v(s) (2-7)
or
(ls - 1) ~(s) = ~(O) + ~ v(s) (2-8)
where
I is the identity matrix.
By post multiplying Equation (2-8) by (ls - ~)- 1 the result
is
~(s) = (ls - ~)- 1 ~(O) + (ls - ~)- 1 ~ v(s) (2-9)
Substituting Equation (2-9) into Equation (2-6) produces an
expression of y(s) in terms of ~(O) and v(s).
y(s) = £(ls - ~)- 1 ~(O)
+£(ls - 1)-1 ~ v(s) + D v(s) (2-10)
The column vector ~(O) represents all the initial conditions
imposed on the system. ror zero initial conditions Equation
(2~10) reduces to
(2-11)
The system transfer function as derived from the state
variable model is as shown in Equation (2-12).

12
~f:l = [f (l. 5 - ~,-1 ! + £] (2-12)
Since the inverse of a matrix can be written as the
adjoint of the matrix divided by the determinant of the
matrix, Equation (2-12) can be rewritten as follows.
= C adj(I s - A) B ..... - -
11 s - 1 l + D (2-13)
With this system transfer function the frequency respo.nse
speptrum can be drawn by use of Bede's Theorems (5).
This method presents no advantage over the standard
transfer function methods other than the fact that the state
model was involved. If the analysis was initiated from the
basic system mathematical model, then there is a definite
disadvantage of following Brockett•s procedure. This disad
vantage is in the evaluation of the vector matrix equation
to obtain the transfer function.
System frequen6y Response Using State Models
in Jordan Canonical form
The general form of the state-variable model in Jordan
Canonical form for systems with distinct eigenvalues or
unrepea ted roots is shown in ~quation (2-14).

13
• 0 0 0 0 1 X1 r1 • • • X I 1
• 0 x2 r2 0 0 • • .. 0 x2 1
• • • • • •
• • • • • • = + V (2-14)
• • • • • •
• • • • • •
• • • Q • • 0
0 xn • • • • • 0 rn xn 1
y = [ C1 c2 • • • • • en] X1 + [a] V
x2
•
• (2-15)
•
0
0
X n
The elements in the differential transition matrix are either
real numbers or complex numbers. The real or nonimaginary
entries are over-damped system modes for negative entries
and undamped or unstable system modes for positive entries.
Complex elements will always occur in conjugate pairs since
the polynomials considered have real coefficients. There-
fore, complex elements with negative real parts are under-
damped oscillatory system modes while those with positive

14
real parts represent undamped or unstable oscillatory system
modes. The frequencies of the complex and the real entries
are the corner frequencies for the system's lag frequency 1 response spectrum. With this information it is possible to
construct the asymptotes of actual lag frequency response
spectrum and, by using Soda's Theorems from classical control
theory, to draw the actual lag spectrum.
By examining both Equations (2-14) and (2-15) it is
evident that the coefficients of the system forcing function
are not explicitly displayed. Herein occurs the limitation
for the use of state models in Jordan Canonical Form to
determine system frequency response spectrums. There is no
explicit information displayed in the state model such as
forcing function coefficients which will contribute to the
construction of the lead frequency response spectrum for a
system. This statement is correct with the exception of
simple farcing functions, e.g. simple sinuso·rdal inputs. F'o·r
very simple system inputs the fo~cing function coefficients
appear explicitly in the input matrix. Hence, sufficient
information is displayed to allow the construction of the
total frequency response spectrum.
1The lag . frequency response spectrum is that part of a frequency response spectrum constructed by using only the numerator of the transfer function. Also the lead frequency spectrum is that part of the frequency fesponse spectrum constructed by using only the denominator pf the transfer function or characteristic equation.

System rrequency Response Using State Models
in Rational Canonical form
The methods presented in this section to obtain the
system frequency response spectrum will involve state-
15
variable models in the Rational Canonical rorm. However,
the Phase-Variable Canonical rorm can also be used equally
as well for finding the frequency response of a system from
its state model. 2 The basic difference in the uses of these
two canonical forms is in the representation of the system
gain. Since the Rational Canonical form presents the total
gain in a combined form the developments in the following
sections will be much clearer by using this form of the
state model. Methods by which the state model can be derived
in either Phase-Variable Canonical form or Rational Canonical
form from the system mathematical model are presented in
Appendix A.
In general terms, the state model used in the following
two sections will be as shown in Equations (2-16) and (2-17).
2The differences in the Rational Canonical form and the Phase-Variable Canonical form are primarily the locations of the coefficients of the characteristic and forcing function polynomials in the coefficient matrices. The differential transition matrix of the two Canonical forms display explicitly the coefficients of the characteristic function and are transposes of one another. The coefficients of the forcing function appear in the input matrix in the Rational Canonical Form while these coefficients appear in the output matrix in the Phase-Variable Canonical form.

16
• 0 0 0 0 ao bo
X1 • • • -- X an 1 a n
0 1 0 0 0 a1 b1
x2 • • 0
an x2 an
• 0 • • • • •
• • • • • • •
= + bm V (2-16) 0 0 • • 0 0
an
• • • • • • 0
• .. • 0 • • •
a • 0 0 1 n-1 0 xn • • • • -- xn an
0
• (2-17)
0
•
•
If the i nput matrix is normalized with r espect to the bm/an
entry in the input matrix 1 which is equivalent to normaliz
ing t he system 'fo rcing function with res pect to the highes t
order te r ms 1 the r esult i s a s s hown i n t he following s tate
model.

17
0 0 0 0 0
ao bo X • • 0 X1 o 1 a n m
• 1 0 0 0 a1 b1
x2 • • • x2 o an .m
0 0 0 • • 0 •
0 • 0 0 • • b • = +
m -an V (2-18)
• , 0 0 • • 1 -0 0 0 0 • 0 0
• • • 0 • • •
• 0 0 1 an-1 0 xn • 0 • • -- X
an n
The scalar multiplying the input matrix is the gain of the
system which is the result. of normalizing both the numerator
and the denominator polynomials of the system's transfer
function.
The power of the state-variable techniques lies in the
analysis of more complex systems, e.g. systems whose maths-
matical modal is simultaneous, coupled, differential equa
tions. In order to simplify the presa~tation of state-
variable techniques it is necessary to use examples of a
rather simple nature, even though these examples may be
handl~d equally well by classical system analysis techniques.

18
511! th• s ffletbod
Sm! tb • s method for constructing tbe frequency respoMe
spectrum of a dynamic system involves tha use of tamplets
(3) and can be applied to state models. The method devel
oped from Bode's Theorems for constructing dynamic system
frequency spectrums can also be performed by ~sa of templets .
However, the templets which Smith developed do not require
that the numerator and denominator be factored to find the
corner frequencies and asymptotes as do those based on Bode ' s
Th eorems. The basic technique for Smith's method involves
the use of a series of templets to construct the frequency
spectrum from the unfactored system transfer function .
Smith's method is applicable to a rational algebraic function
of a complex variable as mall as to transfer functions when
the transform variable ii is replaced by JW.
In classical control analysis the denominator of the
transfer function is the characteristic equ~tion and the
numerator is the forcing function. The stata model used
with S111i th• s method for co~structing tbe. frequency spec·eru11
is the Rational Canonical rorm. In this form the coeffi
cients of both the characteristic polynomial or characteris
tic equation and the forcing function are displayed explic
itly.
I n.i ti ally Sm! th• s method deals 111! th the separate poly
nomials from the term-pair standpoint. A term-pair is the
grouping of the real and imaginary parts of the particular
polynomial under investigation into pairs of successive

19
tarmso The informatio~ required by Smith's method can be
obtained from the entries in the Rational Canonical form of
the differential transition matrixo
0 0 0 ao
• • • • --a WO
n
1 0 0 81
• 0 • • a n
0 1 0 •
0 0 • • A = ( 2-19)
0 • • 0
0 • 0 0
0 • 0 •
a n-1 0 0 0 0 • 0 1 --an wn-1
The elements in the right-hand column are the negative of
the coefficients of the characteristic polynomial with the
coefficient of the highest power normalized. To construct
the lag frequency spectrum from the state modal employing
Smith's method the real and imaginary ·part of the character
istic and forcing function polynomials are written in the
following form.
=

where
20
(2-21)
R(u.J)c = real part of the characteristic polynomial
when written as a complex function.
I(u.J)c = imaginary part of the characteristic polyno
mial when written as a complex function.
uJ = the driving frequency.
Each of the pairs of terms in the parentheses is a term-pair.
Noting that each of the separate terms represent linear func
tions of W when the !agar i thm of each terms is employed,
Smith constructed a series of templets he calls term-pair
contours or term-pair templets. Illustrations of these tem
plets are shown in figures 2-1 and 2-2. With these templets
it is possible to construct separate spectrums for each term-
pair included in the real and imaginary part of the charac
teristic polynomial. This construction is done by placing
the appropriate term-pair te,mplet at the intersection of the
two linear representations for the proper term-pair and draw-, '
ing the cbntour di.ctated by the coefficients involved~ This
procedure is repeated for all term-pairs in both the real
and imaginary parts resulting in the term-pair spectrums.
The next step in the construction of the frequency
response spectrum is to obtain the spectrum for the real
part and also the spectrum for the imaginary part by adding
the separate composite contours. This step is accomplished

0
1. ....
. • 1
21
1/IJ-= .// ~
1// I
I I
/; a + bW 2 --~ I
J$// af I - -------0--
---.__ I w "- I
a - bW 2 -c..._\// r_s bW 2 - a
\ I ' \
• 1 1
w
figure 2-1. Contour s of Term-pair Templets Representing Loga2ithmic Plots of :ta ;t bW , Shown Oriented for a= b = 1.
·-

10
-
1
• 1
it /,
'I ; I; bW~l/1
aw +
~3 / 'j l'b I
I'/ !/ / /?-, , / I w •W~ V / I / I
IV I /j/ . I 3
~w - "''' ,,,tc I ~/ aw - bW3 I
«?_;
I/~ I
• 1 1
w
figure 2 ... 2. Contours of Term~pair Temple ts Representing Lqgar~thmic Plots of :!:aw .t bw 9 Shown Oriented for a= b = 1.
22

23
by using another templet which is shown in rigure 2-3. With
this templet it is possible to either obtain the sum or dif
ference of two term-pair contours. The summing of term-pairs
is accomplished by placing the templet shown in rigure 2-3
over the contours with the reference point on the lower coA
tour at the value of the driving frequency c.u 1 at which the
sum is to be found. The upper contour is set on curve a at
c.u 1 and the sum is read at the intersection of curve band
the driving frequency. This process is continued until all
the contours for the term-pairs of the real part of the
characteristic polynomial are summed. rinally, the term-pair
contours for the im~ginary part of the characteristic poly
nomial are summed. The results of these operations are two
spectrum distributions, one for the rea,l part and one fo.r
the imaginary part of the characteristic polynomial.
The next step is to obtain the amplitude and phase shift
from these t :wo spectrum distributions. This is accomp lished
by use of another templet which is shown in rigure 2-4. This
templet is used in a similar manner as the previous templat
shown in rigure 2-3. The lower of the real or imaginary
spectrum distribution is placed at the reference point in
rigure 2-4a at various driving frequencies and the upper
spectrum distribution is placed under the curve eat the
corresponding frequencies. At each frequency the amplitude
is read under curve f. figure 2-4b is · used to obtain the
phase angle in a similar manner. The sum total of all this
manip.Jlation is the la~ frequency response spectrum for the system.

I I I I I I I I 111 I I I I I I I I I I I 111 I I I I I I I I I r lru•ve" f±ill 1111 I I~ •·-· • t
I i~-h I 1 ' --....:__:1 I I I I P+Q :.,.,; ~I I ;--.;;:::::: ~ I I I I
I ;f" /.1 .......... 1 . I I I .... ~ ..... ~ F'1(W)~
/ / ..:.-. --=-..;. ~....... - , I I I I - i--,;../ ,_ ~ ,--. ----
!! :r Jo. - - - ~ '-- I I i --~ I I I I I ~ i7 7-, -....:. ------- ........... ~ 0 / I ).' j _ %f Reference Point . /
~ 1111 1111 ---- V ~...::--A._o_ -------- ----- /, 0 ·-- .. ,, - ./
.:=. - 1 /~-.J l ~ Curve c,\ Y' I ;s,-,~-~ 1 . ~/j ! ! I 2 • I~ 3 1 '~ V, '\::F' (W >I
- ---- t:.-d I I I I NIIIIIIIII I I I lllhlf11111 I I I Ill
I I I I I I ~I 1111 I I ~IJu~v~ I) I I I I I I ~---1 , I I
W1
. F'igure 2=3o
c.u(Logarithmic Scale)
Summing Templet With Illustration of Its Use
N .p.

Curve f
--- Curve e
---- Reference Point
(a) Amplitude Templet
I , , , , 1 , , , I , • , , I ' , , 'I ' , • • 1 ···'I'',, I'"' I' '"I'''' I',,, I' l_t , I' , , , I ' , , , I , , , , I , , , , I I+ R+ 80 75 70 65 60 55 50 45 40 35 30 25 20 15 10 5 I+ R- 100 105 110 120 130 140 150 160 165 170 175 I- R- 260 255 250 240 230 1220 210 200 195 190 185 I- R+ 280 285 . 290 300 310 320 330 340 345 350 355
-a. r ::>
(b) Angle Scale
figure 2-40 Amplitude Templet and Angle Scale i') Ul

26
To obtain the lead frequency response spectrum the
coefficients of the forcing function appearing explicitly in
the input matrix of the Rational Canonical state model are
employed in exactly the same manner as the coefficients of
the characteristic polynomial. Once the lead and lag fre
quency response spectrums have bean constructed then ,the
total frequency response spectrum is obtained. A mere point
by point graphical subtraction of the lag spectrum from the
lead spectrum can be employed to obtain the total spectrum
since both are logarithmic functions. Also a similar point
by point graphical subtraction can be used to obtain the
phase shift.
Smith's method will provide the frequency response spec
trum for a system; however, as the order of the system
increases the number of templets necessary also increases.
Specifically, it is necessary to have (n-1)/2 templets for
an nth order system. Also, the templets employed are fash
ioned to one specific grid of logarithm paper. If frequency
response data is to be constructed on logarithm paper of a
different scale another set of templets must be used.
Smith's method is based directly on the information
displayed explicitly in the Rational Canonical state model;
however, the complexity and restrictions imposed deem prac~
tical utilization nearly impossible.
Ausman•s Method
Ausman•s method for the construction of a dynamic sys
tem's frequency response spectrum results primarily in the

27
frequency versus amplitude response spectrumo ror most
practical applications the frequency versus amplitude
response spectrum is a graphic description of the transmis
sibility or filter characteristics of the systemo This fact
is characteristic of time invariant linear systems. The
time invariant linear filter will alter the amplitude and
the phase relationships of the input signal 1 but the charac~
teristic frequencies of the input as seen at the output are
identical to those seen at the inputo Ausman•s method pre
sents a technique for constructing the transmissibility or
gain plot of a dynamic system without factoring the polyno
mials involved.,
Since Ausman's method does not require that the charac
teristic polynomial or the forcing function polynomial be
factored the Rational Canonical state model will provide
sufficient information for direct applicationo This conclu
sion is substantiated by the illustrations which followo
The only ~alue which the Rational Canonical state model does
not display explicitly is the coefficient associated with
the highest derivativeo The coefficients of the character
istic polynomial appearing in the differential transition
matrix of Rational Canonical state models reflect normaliza
tion with respect to the coefficient of the highest dsriva
tiveo The coefficient of the highest derivatiV'e is 11 there ...
fore 9 implicit within the differential transition matrix as
well as the input matrixo The general form of linear time
invariant system's mathematical model is shown in Equation (2.,.22)0

28
+ 0 0 0 + (2-22)
The Rational Canonical state model for the system represented
dynamically by Equation (2-22) is shown in Equations (2-17)
and (2-18) ..
Application of Ausman 9 s method in conjunction with the
Rational Canonical Form of the state model is demonstrated
by the three illustration.a belowo The first two illustra-
tions of system models consist of the two fundamental types
of stable modeso The final illustration deals with a much
more general dynamic system analogous to most physically
realizable systems.,
This first illustration involves a simple second order
system which has dynamics characteriz•d by two aperiodic
(cn.Perdamped) modes., The. general ma thema ti cal model for this
type of system is shown below.,
(2-23)
The state-variable model written in Rational Canonical Form
for this system is
i1 0 ao
1 a2 ><1 bo - + - V (2-24)
" 1 B1 a2
0 x2 -~ x2 82

29
(2 ... 2s)
Ausman•s method for the construction of system trans
missibility spectrums works •1th separate ccimbinations of
all the individual terms in both the numerator and denomina-
tor of system transfer functions. The Rational Canonical
F'orm of the state model displays the transfer function coef
ficient.a explici tlyo Therefore 11 it is possible to construct
system frequency response spectrums by using state models in
conjunction with Ausman•s methodo The construction of the
frequency spectrum ·by Ausman•s Method involves forming tbe
ratio of successive numerator terms with the denominator
terms of system transfer functions. Th$ coefficients dis
played in the Rational C.anon!cal F'orm· of the etate model
must 11 therefore 11 be. multiplied by appropriate powers of the
driving frequency w so that wh.eu11 combinations of terms are
made from state model entries, the result will be the same
as those formed using the terms from the system• s transfer
functiono The powers of the driving frequency (c.J used are
equal to the subscript of the coefficient entry in the
Rational CanoAica.1 F'orm of the state model 11 BoQo a 0/an must
be multiplied by w 0, am/an must be multipl,i.ed by Wm, etc •
. F'or the state model shown in Equattons (2-24) and
(2-25). the trtnsmiss!bility characteristics are obtained by
multiplying the entries in the differential transition
coefficient matrix by the appropriate power of W and then

30
dividing each of these into the scalar gain b0/a 2o Each of
the quotients is an asymptote to system's transmissibility
spectrum. This procedure produces all the asymptotes except
the transmission asymptote at high frequencies. The high
frequency asymptote is the gain scalar divided by c.,; raised
to a power equal to the highest order derivative in the sys 0
tem model in differential form. This exact procedure can be
used to construct transmissibility sµectrums for nth order
systems. When tbe forcing function polynamial contains many
terms the dominance of each term js established by forming
the ratio of successive termso The ratios establish the
frequencies where dominance changes from one forqimg fanction
term to the next. Tbe application of the c.ambination of
Ausman 1 s Method with t.he, system state model snown in Equa
tions (2-24) and (2-25) is shown in the following paragraphs.
When the driving frequency W becomes very small 11 the
coefficient a 0 predomina~es over the other two colfficiepts.
The transmissibility takes the ~alue shown below~·
(2-26)
Equation (2-26) is represented dashed horizontal line
in Figure 2-5 labeled "b0/a 0"o Similarly, at wary high
driving· frequ~ncies the coefficient a 2 ·pr~dominates ~var the
other termso The transmissibility ~t this frequency is
shown in Equation (2Q27)o

II)
""" m .c ""' u m 0
I
~
I
I 1
I bo
?"o '~----- I -----, I~
'~ I
,,.,
I
bo -~ ;;__ a1W
- ~~ I
' \ '~ ' ,, ' - \ ' bo
l l
\ a 2V + 8 1Y + 8 0Y = bav i \ \·)a.µ
~'\ J .. ~I ~ ~~
~ . ,, I I
W - Radians/Seconds
rigure 2-5~ Simple Sacond Order System
-
(.,.1 -lo

Limit T W--roo
b ' 0
a w2 2
32
(2-27)
Equation (2-27) is represented by the dashed line of slope
minus 2 (40 db per decade) labele,d ub 0/a2_W 2".
Assuming for the purpose of tbis illustration that tbe
dynamic system has two aperiodic modes, the intermediate
range of driving frequencies is dominated by the co~fficient
a 1• ror this particular situation the transmissibility
within this range of driving frequencies is
T = a2
a1 1 -w a2
(2-28)
Equation (2-28) is represented in Figure 2~5 by the dashed
line labeled ••b 0/a1 W" of slope 1 (20 db per decade).
With the three functions sketched on the graph as shown
in rigure 2-5 it is apparent ~hich coefficient predominates
at any partic~lar driving frequency. It also becomes appar
ent that at the driving rrequencies where the dashed lines
cross, the transmissibility mas two eq~ally weighted repre
sentations. tor example, where b0/a0 crosses o0/a1c.u the
value of a 0 is exactly equal in magnitude to 'a1c.u, but a 0 is
90- ctegrees- ctirr-srent irT ph"eis-irrg which makes a0 and a 1 W equal
' ta one another and tbe tr•a~missibility is approximately
bl)
1 (2-29)

Similarly at the crossing of b0/a1W and b0/a 2W 2
a w 2 = 2
b 0
bo
33
(2-30)
The two points on the transmissibility curve and the
three lines drawn previously permit the frequency response
spectrum to be completely defined as shown by the solid line
in F'igure 2-50
The second illustration involves a dynamic'system whose
mathematical model is the same as that for.'the previous
illustration except that its characteristic mode is an under
damped oscillatiorl'o The applica~ion of Ausman• s method to
this type of system follows the exact procedure as that for
the system with aperiodic modeso The exception to this first
procedure is when the intermediate frequency range is con
sideredo
To begin with P the two dashed lines b0/a0 and b0/a 2w 2
are drawn as shown iA f"igure 2-6 for the large and small
driving frequency rangeso Now when the intermediate range
dominancy is evaluated by drawing the.dashed line labeled
''b0/a1 w 0~ it. is foumd that this line is everywhere above at
least one of the other two (b 0/a0 and b0/a 2w2 )o f"or this
situation the a 1 coefficient never dominates over a range of
driving frequencies but rather at the driving frequency where
b0/a0 and b0/a 2 w 2 cross b0/a 1 W dominateso At tbis particu
lar driving frequency b0/a0 is eq~al in magnitude to

II) .... Cl>
.J:l
.,.f
u II) 0
I ...
I 1 I I [=-~-+-~~~= -, I I I I - I I ,, I I ' ',
,~---4--_J_._(u = Jao - ' :-.... - I -
r======--t----+-==-=~~1~.a~2~·== ..- _ ,,~ b0--+--JLJ r-~--+--_L-T (: 2bo1 T 1·. 't-- - a1w • a --::, -r
t==--+-+=COJ·=· ·-·~ - ,-, -I I - - -
-:-" I I ,,-r-+1--- - · ·
r--~---,-_J_' _· _·. 6: - ~-- _, - l T I .-'ic-- - & ........ _ O . /
1 ,---- _.1,1 -/'2..---W ~ 2 O ..
-. /V - 1 , -:,..- -- ' • - . • a --. 0 -- '~ 2
F~~~=t==~r~P+=1=+f=Pfr~'"'~,~~ --t--~ " -' " ~r---+--LJ-1 I " I I ~
a2V + a , "!.----~-_L_J
· 1 Y • • 0 Y • bo• . •· ~ ~ba . 72/''Z"~-§d-+--L.J a w2 _,_ :· . ' -
t========~~====~==~==~~~~~~========~====~~~ - ~ ... -.J.....-..1
' ~ -I - .~ . ~
-~~
W - Radians/Seconds rigure 2-6. Underdamped Second Order System
(.,3 . ,Ila.

bc/a 2~ 2 9 but b0/a 0 is opposite in sign to b0/a 2w2 which
indicates a phase shift of 180 degrees. Therefore, b0/a0
and b0/a 2w 2 camcel leaving
35
= bo -a1w
(2-31)
where
vJn is the natural undamped freq~ency of the system.
Equation (2-31) is represented by the dashed line labeled
01 bofa1 Wit shown in F'igure 2-6.
Two additional points which aid in defining the fre ...
quency response spectrum for highly underdamped systems ares
1) the point w~ere the line b0/a2<'..u 2 crosses the transmissi
bility curwe which is approximately 2b0/a0 and 2) the point
where the b0/a 0 line crosses the traMsmissibility curve which
is a't a frequency of ~2a0Ja 2o
The lines and points which were calculated in this
example are all shown in rigure 2-6. With this information
the frequency response spectrum for an underdamped second
order dynamic system is essentially completely defined. This
frequency response spectrum is shown by the solid line in
rigure 2-So
The third illustration is the two degree-of-freedom
mechanical system appearing schematically in the upper right
hand corner of Figure 2-70 The mathematical model for this
system is two simultaneous liAaar coupled ordinary differen-
tial equationso
(2-32)

I . ' I ' I ••. ' I I . I ,.,/ I-~ . K 1 k / V, . ". I
I I Fi" 111 I I I 11)\ : k : m K1 /i '-< ~ , , {. mw2 · I ~ ...... ~ ~,, I
mw I'~ I I 1 I ,1 ' ~ I '\. , ....... ~ .). I K1 O> I t-;;-J\..I I k--f :! D /V \1 I l V
g I Mw ~ I 0 I j~ I --.-+-
I~ I- I I I I I I I 111 J I I I I 11 I: W\,_ri
m V, + { Y 1 - Y 2) o + K 1 Y 1 = K 1 v 11 I j Dk 3 ~ . ~mmw ~~ I I. I I I I I I I
1 ' ~,1---1 K1 11111
I · l fl~mw 2 W1 ff'i M
I ii ·~,I I u I
1 l Y1+
my2 + {~ - y1 )D + ky2 = kv
W- Radians/Seconds
rigura 2-70 Two Degree-of-freedom Mechanical System
tN CJ\

37
(2-33)
The state~variable model written in Rational Canonical \
rerm for tnis system considered as a singl$-inp~t single
output system is
0 0 (J 0
kl<1 kl<1 X1 -iiilr' X1 iiii':i
D(K1 + k) D(K + k) 0 . 1 x2 1 0 0 - mm x2 mK 1 mk 1
ia=· (mK 1 klYl) +iilr V (2-34)
+ O·
0 1 0 X3 1-"':~ X3 ... mffl
0 0 0 1 o(m + m) 0 "4 - mM X4
Y1 = [o o 0 1] X1
)(2 (2 ... 35)
X3
X4
where
y1 is the single-output
A similar state model can be written for this system consid
ered as a simgle-input siAgle-eutput witA y2 used as tne o~t
t:'HJto
Construction of the freq~ency response spectrum for a
general system as illustrated here involves the determination
of the frequency bands over which the separate coefficients
domi~at~o This is done by calculating the boundary

38
frequencies where dominancy changes from one term to anothero
Specifically, the band boundaries are
kK 1
w1 mK 1 kl<1
:a: D (i< 1 I<) = o(k1 k) + oJ, ( 2-36)
mK 1 -and
D(K 1 + k)
ml<1 D(K 1 + k) W2 ~ g mk 1
(2-37)
These boundary frequencies which separate the three bands of
dominance are shown in rigure 2-7 as vertical dashed lines.
Also shown, are the dominating input matrix elements desig
nating the frequency band ~ominated by eacho
Once these bards are defined the construction of the
transmissibility curve can begin 0 Starting at t~e low fre~
quency and t~e transmissibility is represented approximately
by
Limit w~o r ..
'f
kK 1 K1
ml<', ~ kK 1 . iilYr'"
Continuing across the first frequency band
T o (R1 + k} miff W
D(k 1 + k)w
or
T
1 ( 2 ... 38)
(2-39)
(2-40)

and finally in this frequency band
T
or
• = 0 mk 1 + ktYi 2 mM w
T ;
kk (mK 1 + kM)W 2
k
oow 2 I' ! .
39
(2-41)
(2-42)
E qUa tions ( 2-38 )i, (2 ... 40), and ( 2-42) are shown in F'igure 2-7
by dashed lines and are labeled ap~ropriately. With these
lines and applicable points calculated in a similar fashion
as that shown in the previous two illustrations, the trans
missibility curve is defined sufficiently within the first
dominant band.
Now the second dominant input matrix element is used to
calculate the transmissibility in tbe next dominant frequency
band. The next three lines shown in Figure 2-7 areg
D(K 1 +
mf< 1 T • i (ml< 1 t
mm o:r
k) mK 1 w air
kM) · 2 w
T D Mw
D(K 1 + k) = (mk1 kM)eu +
Continuing on through this frequency band
T
D (K 1 +. k) · mM w
l)(M + m}w3 mM · · · (M + m)W 2
(2 .. 43)
(2-44)
(2-45)

413
or
T • k ·= MW 2 • (2-46)
and
D(K 1 + k) T • f -mMW 3
(2 .. 47)
or
T • Dk = mMW3 0
(2-4~)
Again Equations (2-44), (2-46), and (2-48) are shown as
dashed lines in rigure 2-7.
The final frequency band is the higb frequency range.
In this range the dominant coefficients are meiely those
*hicb multiply the input matrix or the gain scalar.
Lim! t T mKW 2 k w ..... oo = mKw' = mw2 ( 2-49)
This eq~ation is also shewn in rigure 2-7 and labeled appro
priatelyo
By using all the limes constructed as shown and also
using t~e principles illustrated in tbe first two illustra~
tiaAs the frequency response spectrum for this system c~n be
effectively constructed. The general principles demonstrated
nere in conjunction with state-variable models in Rational I Canonical form are readily adaptable to the moat general
case and, taus, provide a powerful tool for both analysis
and synthesis since explicit information is utilized \ ... -"
throughout.

41
On the whole little was mentioned about the phase shift
associated with the frequency response spectrums. This
places no hardship on the technique since once the amplitude
spectrum is obtained the phase shift can be obtained (15).
ror example, lines whose slopes are plus 20 decibels per
decade (+1) correspond to plus 90 degree phase shift, lines
of zero slope correspond to zero phase shift, lines whose
slopes are minus 20 decibels p•r decade (-1) correspond to
minus 90 degrees phase shift, lines of slope minus 40 deci
bels per decade (-2) correspond to minus 180 phase shift,
etc.
Summary
None of the procedures described in this chapter appear
in literature in the manner specified herein. All the sepa
rate articles used have their own implication aside from
that for which they were employed here using state models.
Therefore 9 the author has contributed the mechanisms by which
each of the methods ~resented in the articles could be used
with state models. Some of the methods have an obvious
application in relationship to the state-variable models;
however, others, such as Smith's and Ausman•s method, did
not have obvious imp.lications toward a combination with state
models. The genera.! use of the state model in Ra ti anal
Canonical rorm in conjunction with Ausman•s techniques shows
that a very general set of rul~s exists for the construction
of frequency response spectrums from state-variable models.

42
These rules are outlined my the third illustration in the
"Ausman' s method" .sub-section of trnis chapter. Hmwever,
these rules are quite complex and involved which require
that the user be ~ot Dnly very familiar with frequency
response techniques but also very familia.r with state space
modeling.
The development of the "rundamental State-Variable
rrequency matrix" presented in the following chapter contains
specific rules which dictate t.he important characteristics
of the frequerncy r·esponse for physical systems. This par
ticular Canonical rorm of the state-vari~ble model presents
the basic characteristics of system frequeAcy-response spec
trums explicitly in tne matrices generated from the
"rundamental State-Variable rrequency Matrix". This explicit
matrix display of a system's tran~missibility or frequency
response spectrum removes tbe requirement that tbs user be
very familiar wit~ freqmemcy response techniques from clas
sical control theory.

CHAPTER III
MATRIX DISPLAY Of SYSTEM FREQUENCY SPECTRUMS
The previous chapter presents several ways by which the
frequency response spectrums for dynamic systems can be
obtained through use of different forms of the system's
state-variable model 0 The particular forms of the state
model utilized most frequently were the Jordan Canonical rorm
and the Rational Canonical formo Since these ~tate model
forms were developed to display particular characteristics
. other than those of the system frequency responae, all of
the methods developed thus far assume rather extensive knowl
edge of system analysis employing frequency response proce=
dureso The .result of the development of the "Fundamental
State-Variable frequency Matrix" contained in this chapter
is an explicit display of system frequency response spectrum
characteristicso With these spectrum characteristics the
entiri response spectrum can be drawn by merely examining
the state-variable model in the frequency Canonical form. A
summary of the analysis techniques for the use of the
frequency Canonical form is presented in Chapter VI.
43

General Theory of the Fundamental
State-Variable rrequency Matrix
44
The basic concept of the rundamental State-Variable
Frequency Matrix is the explicit disclosure of the frequency
transmissibility possessed by all physical systems. Since
it is not possible to display the entire transmission spec
trum in a finite dimensional matrix, the entries in the
Fundamental State-Variable Frequency Matrix consist of two
fundamental frequency transmission or gain characteristicso
These two characteristics arei 1) transmission bandwidth or
frequency boundaries and 2) transmission spectrum asymptote
functiopso The transmission bandwidth boundaries establish
the band-pass widths in which particular transmission
s~ectrum asymptote functions are applicableo The
transmission-spectrum asymptote functions determine three
characteristics of the system frequency response spectrum
within a specific bandwidth range. These three characteris~
tics ares 1) system gain at specific transmission frequen
cies, 2) system characteristic mode frequencies, and
3) spectrum asymptotes9
The spectrum characteristics as they appear as entries
in the fundamental State-Variable rrequency Matrix can be
visualized by consideration of the individual functional
contributions of each of the coefficients in the ordinary
linear constant coefficient model in differential formo
from this standpoint it is possible to consider the general

45
modal form for either a lead or a lag mode. This general
modal form for constant coefficients will be as shown below
where
(3-1)
ri,j = the general modes, which always appear as
complex pairs if the mode is oscillatory.
a, b, aod c • mode describing integers and are positive
for stable modes which is the only type
considered.
With this general modal description the total lead and
lag modal spectrum can be visualized by superposition in the
time domain. These spectrums are describable by the coeffi
cients associated with the various derivatives in the char
acteristic and forciqg functions of the system modal. The
model coefficients which describe these spectrums can be
seen by considering the generai form of timeJinvariant linear
ordinary differential eq~ations.
dn dn-1, a 5!1. a .2...I + 8 n-1dtn-t + + + aoy =
"dt0 0 0 0
1dt m dm-1 b dv b .!L! V b V (3-2) + b - + + +
mdtm m-1dtm-1 0 o,o
1;;: a
The coefficients of the forcing function establish the trans
mission bandwidth boundaries by forming the ratio of succes
sive coefficients startiAg with the zeroth term and progres
sing to the higher order terms. The proof that these ratios
do establish the band-pass boundaries is presar.,te:d lat'Sr in
this chapter. ror example, the band-pass bo~ndaries are
46
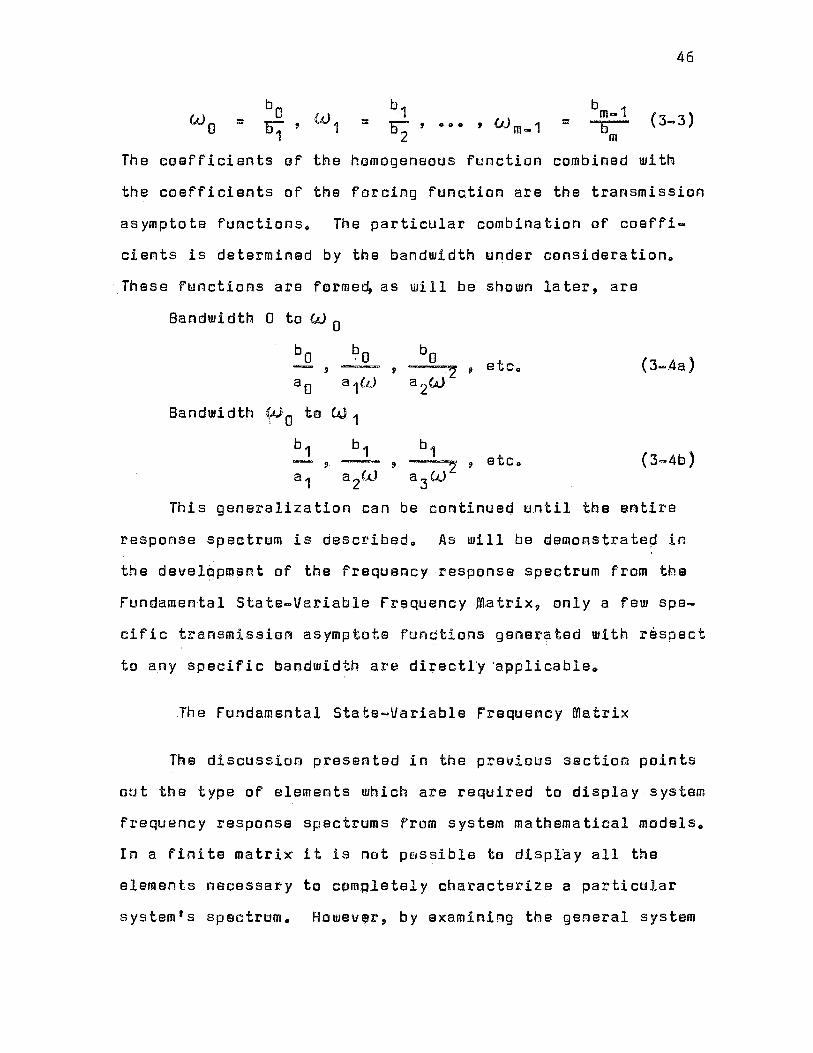
bo b1 b m-1 <.uo ''V ( 3-3) ·- °1 , ~~ 1 ::;
~ ' 0 O 0 ' vJ m ... 1 = -s;-
The coefficients of the homogeneous function combined with
the coefficients of the forcing function are the transmission
asymptote functions., The particular combination of coeffi ...
cients is determined by the bandwidth under considerationo
These functions are forme~ as will be shown later, are
Bandwidth O to W 0
bo ~o a 0 a 1ctJ
8andwi dth ~ 0 to W 1
(3-.4a)
( 3-4b)
This generalization can be continued until the entire
response spectrum is describedo As will be demonstratep in
the devel~pment of the frequency response spectrum from the
Fundamental State-Variable Frequency ,M.atrix, only a few spe
cific transmission asymptote fun~tions generated with r•spect
to any specific bandwidth are directly ·applicableo
The Fundamental State-Variable Frequency Matrix
The discussion presented in the previous section points
out the type of elements which are required to display system
frequency response spectrums from system mathematical modelso
In a finite matrix it is not possible to displ~y all the
elements necessary to completely characterize a particular
system's spectrum. Howev,r, by examining the general system

47
model shown in Equation (3-2) it will be shown later that a
transformation of the independent variable will introduce
the necessary frequency variable into a finite matrix array
so that the characteristics of the system's frequency spec
trum are displayed explicitlyo The matrix array which dis
plays this explicit information is the rundamental State
Variable rrequency Matrixo Since a system's state model is
not unique it is possible to obtain the rrequancy Canonical
rorm 9 which contains the Fundamental State-Variable Frequency
Matrix, from other forms of the state modelo This is done
by use of the Frequency Transform matrixo The following two
sections show the particular mechanicsiinvolved in obtaining
the Fundamental State~Variable Frequency Matrix from either
the differential form or a state model form of a linear time
invariant system mathematical modelo
rreguency Canonical~ From Original System Models
Tbe general form of time invariant linear mathematical
models is shown in Equation (3-2)o The procedure by which
the state model rrequency Canonical Form is developed is I
I.
initiated by ~freq~ency-transforming" tbe independent uaria-
bleo This transformation i's t i,; T / w o 1 Application of tn! s
t~ansformation to the general time invariant model results
in Equation (3-S)o
1This Mfrequency-transforming" is not to pa confused with an opel'ational transformation wb ere tha operation of differentiation is represented by an operator nor is it to be confused with the substitution of j 0JJ r'or so

48
' &l a1w + aay I .d-r
+ b w.f!! + b. v 1 d'T 0
(3-5)
This frequency transformed model can be solved fer the
zeroth order terms which produces n
bnv - a0 y = a w"U + ••• u n. d1'n
+ [a wmflmy .. b wmdmv] + • • • + [a1w.2.I .. b1w2] (3-i) m d1'm m dTm d'T d1"
The state-variable diagram d~rived from Equation (3-~) is
show~ in rig~re 3-1. The state-variable model in the
rrequency Canonical rorm can be der~ved. from this diagram by
considering the owtput ef each integrator as a state-\
variable. Hence 9 each of the inputs to the integrators
define a first order differential equation. This system af
first order differential equationa writteA in matrix form is
as shown below
z\ 0 0 • • • 0 ao z, z•
2 a w" n 0 0 a,w 22
0 0 0 • .. '"· 1r • anw n z• m • . .. 0 l'i a uJ ;~\ m I•,,,
z m
0 0 • • • • z• n-1 • 0 0 a wn .. 2
n-2 2 n-1 z' a 0 n · n-1
0 Cl • anw an-1w . -z A n

zm+2 zn-1
---------dny m+1
bo ao + 8 rri+1 wm+1d y --.-v - y = - + .••.•
anwn anw n dTn anwn dTm+1
[ m m m m ] + [ •1 Wn dy _ b1w n dv] + amW d y - bmW d V + .... anW n d7m anWn dTm a W dT a W dT ·
n n .
F'igu re 3 ... 1 o Stata Diagram for frequency Canonical form Derived from the State Diagram for the Rational Canonical form
Zn
Zn
.!'.a,, I.O

y = [o .... o -1] 0
0
z n-1 -z n
50
(3-7)
(3 ... 8)
This form of the state-variable model is the Frequency
Canonical Form and the differential transition matrix is the
Fundamental State-V~riable Frequency Matrixo Rewriting
Equations (3-7) and (3-8) in general state-variable form
produces
where
.z :a: -z ' :::
n z' f r (3-9) anc.u = z + V -y :: 'I' z ( 3-10)
the frequency Canonical form state variables •
ai/dT~ differential of the Frequency Canonical
form state-variables with respect to 'T/uJo f = Fundamental State-Variable Frequency Matrix.
f = Frequency Canonical form input Matrix.
y = output.
-· T = Frequency Canonical Form output matrix.

51
F'requency Canonical~ Derived f!!!! State models
The F"requency Canonical F"orm and accompanying F'undamen
tal State-Variable F'requency matrix can be derived from otber '
forms of the state models by linear transformations. Spe
cifically, tbe F"requency Canonical F'o~m is derived very
readily by transformation of the state model from the
Rational Canonical f"orm. The Rational Canonical F"orm is
transformed into the F'requency Canonical F'orm by means of
the transformation matrix .Q shomn in Equation (3~11).
The
.n = -
inverse of this
n-1
n-1 0 Ci 0 w o· •
0 wn-2 0 • • 0
0 0 0 0 0 0
0 0 0 0
0 • • 0
I) 0 0 • 0 wO
transformation matrix is
= 1
w"
w a o • • a a w2 o • • o
0 0
0 0
0 0
0
O O 0
0
•
• • 0
0
0
0
w"
(3-12)
Th~ reduced state model in aational Cadonical F'orm is
~· = R X + B V

52
where R is the differential transition matrix in Rational
Canonical Form as shown below
0 0 0 ao
• --a n 1 0 "' 0 0
R = {] • 0 0 ( 3 ... 15)
0 • 0 0
0 1 an-1 • • --~n
and 8 is the input matrix the transpose of which is shown
below
= [:~ .. :~ o. a] (3-16)
By forming the transformation~= f2 !, the transformation
for x = uJ .Q !'• These transformations can be substituted
directly into Equations (3-13) and (3-14) producing
<.u g I' = li Q I + !! ll\, - (3-17)
y ::: £ Q ! ( 3-18)
Premultiplying Equation (3 ... 17) by 1/w Q-1 results in
Z. 1 ri_ -1 R n 1 in, ... 1 ::: - J.,,&, ~t, Z + - :ti. 8 V
fa)- --- w- (3-19)
It is seen from Equation (3-9) that
1 r, _ .L n-1 s aw" w -
O'
In general 1 if it is possible to transform the state
model for a system into the Rational Canonical rorm~ then

53
this transformation can be combined with the transform
matrix .Q to obtain the Frequency Canonical Form. For
models with distinct eigenvalues the differential transition
matrix A can be transformed into the Jordan Canonical Form
by using the modal Matrix m (6 and 9). The Rational
Canonical Form of the state model can also be transformed
into the Jordan Canonical Form by some transformation matrix
N (9 and 10). The combination of the m and N matrices form
a matrix which will transform A into the Rational Canonical
form .B_.
R = = p-1 A p (3-20)
Spectru~ Band-pass matrices 2
The Fundamental State-Variable Frequency matrix is uti-
lized to calculate the transmission asymptote functions for
each of the bandwidths displayed in the input matrix. These
bandwidths are determined by dividing the Frequency Canonical
Form by the successive entries in the input matrix. Each of
the state models formed by this division consists of a
Spectrum Band-pass Matrix and an input matrix containing the
bandwidth boundary applicable to the accompanyi ng Spectrum
Band-pass matrix.
2spectrum Band-pass matrices are matrices derived from the Fundamental State-Variable Frequency matrix which display frequency spectrum characteristics within a specific bandwidth frequency range.

54
In general, bandwidth boundaries are determined by
examining the generated input matrix and equating the unity
entry to the entry immediately following. The result of
equating these two input matrix entries is an equation
explicit in W. Solving this equation for <JJ produces the
upper boundary of the frequency range for which the associ
ated Spectrum . Band-pass Matrix has been formed. The partic~
ular transmission asymptote function .entries applicable
within any two bandwidth boundaries are found by examining
the Spectrum Band-pass Matrices for the frequency bands
before and after the one under immediate consideration. One
of the asymptote functions in the previous Spectrum Band-pass
matrix will be equal to an entry in the partictilar matrix
under investigation at the bandwidth boundary frequency.
This equality of successive Spectrum Band-pass matrix
entries determines the first . entry in the matrix which is
applicable in this fr~quency range. A similar equality as
that discussed above also exists between an entry in the
Spectrum Band-pass matrix describing the spectrum in the
bandwidth following that under investigation and an entry in
the presently considered Band-pass Matrix. Only this time -,
the frequency where the two functions are equal is the next
bandwidth boundary frequency. This process determines the
last functional entry in the Band-pass matrix considered
which is applicable in this particular frequency bandwidth.
This procedure can be conducted for the entire frequency

55
range QOVerned by the physical characteristics display~d in
the math~matical state modal.
In general, the frequency response spectrum for a system
can be determined from the following matrices
0 0 0 ao
• • • Ea anwn 0
60 • • • • 0
0 • • • 1
F (3-21) Ea - = 0 0 • 0
0 • • 0
• • • n • n-1 0
anw an-1W • 0 • • 60 60
= (3-22)
The transmission bandwidth boundary for the Spectrµm ~anrl-
pa$s matrix shown in Equation (3-22) i :s determined from
b1w 1 Wo
bo (3-23) tiiJ = or = F.j
The applicable entries in the matrix in Equa tio'n (3~21)
include all the entries up to and including the entry which
is equal to an entry in the 1/b1W f matrix a_t the frequency
w 0 • The entry in the 1/b1W £:. matrix applicable in this
equality is the first asymptote function applicable in the
next bandwidth. The frequency respon$e spectrum in the kth
bandwidth is shown i n Equation (3-24 ).

1 r b k-kw
1 rr b wkk
=
0
anw n
b wk k
0
0
•
0
0 • •
0 • ..
•
•
•
..
0
0
0
..
0
n af'lw
0 O O 0
b wk k ·.
0 1
k+1 bk+1W
b wk k
a 0 b wk
k
•
0
•
.. W n-1 a 1 . n-
m b w m
56
(3-24)
The transmission bandwidtn boundary for E~uation (3-24) is
Considet as an example of the formation of the Spectrum
Bamd-pass matrices the third order iystem described in I
frequency Canonical form as follows
z• 1 [) 0 ao' 21 b(I
3 z' a w3 0 a 3w 2 3 a 1W z2 + bW 1 v(3c.27)
z' 0 3 2 0 3 a 3w a 2W -z3

57
y = [a 0 -1] 21
( 3-28) 22
-Z3
By .dividing the frequency Canonical form input matrix by b0
the tran~mission bandwidth boundary le.Jo is calculated. As
will be shown later this is done by equating the unity entry
which occurs to the next entry as !shown below
b1W
1 = ~ (3-29a)
bo -- ~ = "S:j (3-29b)
The Spectrum Band-pass Matrices formed from the fundamental
State-Variable frequ.~cy Matrix are
0 0 ao ii:
3 0
~o 1 f a 3w
0 a1w
(3-30) = a;- = 60 ' ~ 3 2 0
a3w a2w
60 60
0 0 ao
b1w . ,/,, 3 -
(;21 - 1. F 83~ _,_:.: 0
a1w (3-31) ::
61~- = 61w 61w 3 2
Cl 83W a 2w 61w 61w
When W = b0/b1 is substituted into both of Equations (3-2 4)
and (3-25) the entry a 1W/b0 in Equation (3-24) is equal to

58
the a1<.cJ/b1<.cJ entry in Equation (3-25). These two transmis
sion asymptote functions are equal at the transmission band
widtt.l boundary <.cJ 0 • At tbi·S frequency the dominaace from .§.0
to s1 occurs. Therefore, the first part of the frequency
spectrum is cbaracter.ized by tills entries a0/b0 and a 1<.cJ/b0
in the .§.0 Spectrum Band-pass matrix; and the second part of
the spectrum . is characterized by the entries a 1<.cJ/b1<u,
a 2<.cJ 2/b1 <.cJ, and a 3<.cJ 3 /b1W in the §1 . Sp~ctrum Band-pass
matrix.
The actual construction of the frequency resporse spec
trum is performed by expressing the transmission asymptote
fwnctions in decibels. ror use in the method described above
involving the rundamental State-Variable rrequency matrix
the transmission asymptote functions expressed in decibels
are defined as shomn below
Transmission Asymptote runct!ons = -20Log 10
l al <.cJ --.... kdb bkW
(3-32)
These functions are straight lines when plotted on semi-log
graph paper.
bk TAr = 20Log 10 a"9 + (1-k)20Log 10w
k (3-33)
These straight lines determine the three characteristics of
the frequency response spectrum discussed on pag~ 44. The
gains, natural frequencies, and asymptotes of the spectrum
are displayed by these functionally straight lines. The
astual utilization of these lines is illustrated in the next
section where specific illustrations are used .to develo~ the

59
mathematics which substantiates the particular functional
significance of the transmission asymptote functions and the
transmission bandwidth boundaries.
frequency Spectrum Data from Model Coefficients
frequency response spectrums for physical systems repre
sent steady-state system performance characteri.stics. for
linear time invariant models the transmissibility spectrum
is a measure of the amplification or attenuation in driving
frequency magnitude which occurs at the output of the system.
Since the output frequency is exactly equal to the input fre
quency the amplitude of the driving frequency and the phasing
of the driving frequency are the only things altered. Conse
quently, the particular or the steady-state solution of the
mathematical model excited by a sinusoidal input is all that
need be considered for a complete description of system fre-
quency response spectrums.
The steady-state frequency response spectrum for linear
time invaria~t systems is described math~matically by the
system transfer function · wi'th the complex transform variable
s replaced by j lu, where W represents the , sinus.oi dal driving
frequehcy. The transfer function for a general ntfu order
system is as follows.
+ ••• ( 3-34)

If t~e substitution discussed above is made i~to Equation I
(3-30), the transmissibility of the system is given by
b Sm + + ·+
60
••• b1s bo T = jl f m (3-35) =
V j(.u Sn n + a 1s + + a1s + ao an n- ••• ?
At very low fraquenc"ies the transmissibility
an asymptote function of b0/a0, i.e.
Limit T w-o =
= jW
approaches
(3-36)
Similarily at very high driving frequencies the transmissi-I
bility approaches an asymptote function ·of bm:wm/anwn. The
result of these terms predominating the numerator and the
deMomin?}tor is
Lim! t T w-oo =
b uJm m · n
anW (3-37)
The intermediate range ~f the spectrum is determined by
the successive use of the ratios of the terms in the numera-
tor with all the terms in the denominatorp such as k 1 bkuJ /a1W • This determination proceeds by first determin-
ing the frequency range of applicability for each of the
numerator terms. The mathematical basis for establishing
these dominant r~nges is developed by considering the magoi
tude associated with the steady state part of the time solu-' '
tion (11). The kth and 1th terms in the numerator of the
steady state time . solution can be written as follows in
Equation (3-38).

61
[. ( 1 ) n-1 . n-1
... - . an-1W (3-38)
where
k = 1 + 1
The boundary of dominance changes between the above
numerator terms, with respect to the transmissibility, occurs
where the magnitudes of the successive terms are equal. This
equality between the successive terms in Equation (3-38) can
be written as
bkWk = 'bl Wl
Solving Equation (3-39) for W produces
bl Wl = °k
(3-39)
(3-40)
Equation (3-40) substantiates the use of the coefficients
associated with the forcing function in establishing the
transmission bandwidth boundaries in the frequency response
spectrum.

62
The transmission asymptote functions which characterize
the frequency spectrum can be established by considering
Equation (3-31) written in tbe fol~owing way.
T bo
+ • • • + ( 3-41) ans"+ ••• + a1s+a0 ansn + ••• + a1s+a0 s=j(J.J
=
If each of the terms of the transmissibility equation shown
above are examined for the intermediate spectrum frequency
range, it is seen that the numerator defines the dominant
term contained in the forcing function. Each of the terms
within the absolute value sign describe. the frequency
response spectrum within the defined band-pass range. for·
very low frequencies the asymio,tot·e f'uriction is b0/a0 since
all the other terms are very nearly zero at low frequencies. I
The difference between the asymptote function and the actual
spectrum is the contribution of all the other terms which
have a finite value everywhere e~cept at zero frequency. for
very high frequency a similar description of the spectrum
with respect to the asymptote function b Wm /a Wn caa be m n visualized as presented in Equations (3-32) and (3-33). As
can be seen by the previous discussion the asymptote func
tions thus far substantiated are essenti~lly first order
approximations to the actual spectrum. · The inclusion of more
and more terms iR the general model to describe any particu-
lar range of frequencies will assure closer and closer
approximations to the actual response spectrum. However, the
additia, of terms to tbe first order approximation·s increases the
complexity of calculation in an exponential manner.

63
The substantiation of the intermediate range transmis
sion asymptotes is best presented by considering the general
system modes (4). These modes are described by the following
example.
T :: (3-42) a 2s + a 1s + a0 s = jlu
As has already been established the asymptote functions
associated with the above example for the very low and very
high frequencies are b0/a0 and b0/a 2W 29 respective,ly. One
of two things can occur in the intermediate frequency fangs.
first, the eigenvalues of the characteristic equations can
be distinct. If this is the case then by Bede's Theorems
the asymptotic approximations have corner frequencies of
(3-43a)
and
a1 l/(*;) 2 ao W2 = + ~ + - - (3-43b)
a2 a2
(~) 2 ao
for > (3-43c) a2
The slope of the asymptote between these two corner frequen-
cies is a minus 1 or a minus 20 decibels per decade. The
corner frequencies and the asymptotic approximations based on
Bode 1 s Theorems are shown in figure 3-2. The equation for
this asymptotic approximation in the intermediate frequency
range is .shown in Equation (3-44).

111 .... Cl) .0 .... u Cl)
0
I ._
I ---
I -20L,." ~ ~1 L ! J w" 1 ------,---t~,r 2 I '-I ',
I 1-~~" ,-\----t-~-+-+--1---i-..u_J I I " I',, I I\ r-----l-,---L11-: ~,--S',, I+ ao I I '\.. ' I \----t---+--+-+--+-_J_J_j_J.
W3 = a ~I I ':\. 1',. ti 1 I ,-, ~+--', -
I : I'',,, s- Asymptotic
a, 1 _J 2
/2/1 .P1,~ -- Approximation
2a2 2a,: 'l a1 -4a0a2 I ',, I ~'~-: I I I I 1111
r-----t---+---+-t-++-+-i-_j_3~ ', I a1 1 I ~-,~ ,:-sW2 = •ra;+ra; "a/-4a0a 2
I '\,. '\ I I I I I I I I I I I I a W "~\,-!- a1 I
-20Log10 ~ --2)~ I\' 1--S--W 4 = a O \T~-: I 2
I I I I I I ~_\, I \11-t--+--i---l-W_J
Bede's
~1 =
-
r-----t--~~-t--+-~-t--~-+-----1~1 \ -,1 I I a~eu 2 1 1 1 \.,:5°-!0log10 --:1i:-
r--1--t--+-l---++-+-+--t----_j_~-J-\ I 1 1 ° 1\
W - Radians/Seconds
figure 3-20 first Order Approximation for Simple Mode Spectrum 0\ .i:,.

65
20Log 10 T = 20Log 10 a 1 2
-20Log 10 w (3-44)
The equation for the asymptote function described herein is
20Log 10 T = (3-45)
As shown by these two equations and also in Figure 3-2, the
slopes of the two asymptotes are a minus one or a minus 20
decibels per decadeo The actual equation for the frequency
spectrum in decibels is
- a 2 W + ja2w + a 0 20Log 10 T = 20Log10 ( 3-46)
The frequency where the low frequency range asymptote and
the high frequency range asymptote are equal is uJ = ~ as shown in Figure 3-2. At this frequency the actual fre-
quency spectrum has a transmissibility as shown below.
20Log10 T .. (3-47)
The asymptotic value of the frequency response spectrum from
Soda's Theorems is
20Log 10 T ba ~r -Va12 - 4a0a 1 }3-48) = 20Log10 2a a 'a'" La1 -0 2 0
The value for the asymptote function at W= ~ao/a2 is
20Log 10 T = (3-49)

66
The value of the asymptote function at any other frequency is
not equal to the actual spectrum since, if an increment of
frequency is added to or subtracted from ~, Equation
(3-49) is no longer equal to Equation (3-47). Therefore, the
asymptote function is tangent to the actual spectrum at this
frequency. As is evident from Figure 3-2 and Equation
(3-49) the Spectrum :Asymptote functions for this type of
system represents an excellent first order approximat~ono
Several extremely importa~t facts become evident upon close I
examination of Figure 3-2. These ares 1) at the corner
frequencies of the asymptote functions the actual. spec~rum
is 2.4 decibels down, 2) the corner frequencies are not the
characteristic roots - they are W 3 = a0/a1 and W 4 = a 1/a2,
and 3) the asymptote function is truly tangent to the actual
spectrum at W = ~a0Ja 2 • These facts aid in determining
the actual frequency respmnse spectrum much more accurately
without having to factor the characteristic polynomial.
The second case in considering the -intermedia ta fre-
quency range is when the eigenvalues are complex conjugates
or the system is underdamped. F"or this case the low and high
frequency asymptote functions cross one another at the fre-
quency shown below.
=
or
W= ~ ( 3-5 0)

67
At this frequency both terms are equal but b0/a.2w 2 is 180
out of phase with the b0/a0 term so that the transmissibility
is exactly
20Log10 T = (3-51)
At W = ~ (the natural undamped frequency) the term
b0/a1 CAJ is completely dominant and this is the only frequency
where the asymptote function b0/a 1 W is dominant. Therefore,
the value of this asymptote functioA at the frequency
~ is a point on the actual frequency spectrum. These
facts are displayed in figure 3-3. Curves from which the
frequency of maximum transmissibility and a curve from which
the difference in transmissibility can be obtained are con-
tained in Appendix B.
The discuss ion presented above substantiates the fact
that the spectrum asymptdte functions ~ill provide the basic
characteristics of a system's frequency response spectrum
employing the unfactored system model. The models used were
the two basic modal forms which make-up the mathematical
models for all linear time invariant models. The cascading
or superposition of several of the basic models to form a
complex system brings forth a limitation to the use of the
entire range of spectrum asymptote functions. This limita
tion involves primarily the relative frequency locations of
modes and particularly the determination of the transmissi
bility at the natur~l undamped modal frequencies. When the
system modes are within a decade of. one another the value for

a, ....c Q) .c .... u Q)
0
I-
,,-1-w = {f- · I ,,., a2
•a IT ', •,w -20Log 10 ~~ :- -,<2----20Log10 ,;:-
I I I ' I I 0
I -:!'.-~--L~_J_.:__l'~,L j._~ I - R a
0 - 1, W - 2a;
-20Log 10 '6:' 1-,~ \
0 ~~~'" 2 '.\ a 2 w ,
-20Log O ~ ~ :\.-\.
0 '~
',~ ~
t~ "-''\. '-.: -.;:
~\.. ~ ~ ~
W - Radians/Seconds
f.igure 3-3. First Order Approximation for Underdamped . Mode Frequency Response Spectrum
~
0\ CD

69
the transmissibility at the natural frequency of oscillatory
modes determined by the appropriate asymptote function falls
below the actual transmissibility characteristic of the sys
tem. Homeyer, the asymptote functions which approximate the
general spectrum characteristics are still applicable. Tbis
situation is illustrated in Figure 3-4. The striking thing
about the asymptote functions is that they will locate the
undamped natural frequencies of the oscillatory modes and,
as can be seen from Figure 3-4, produce a somewhat closer
asymptote approximation than that constructed using Bode 1 s
Theorems, which is also shown in Figure 3-4.
Further illustrative substantiation af the basic prin
ciples involved iA the construction of frequency response
spectrums from the Fundamental State-Variable Frequency
matrix is shown in Figures 3-5, 3-6, and 3-7. These figures
contain frequency response spectrums af systems whose char
acteristic polynomials are of order three.
Figure 3-5 shows the way the transmission asymptote
functions adjust the first order approximation for th~ spec
trum when nothing but the damping of an underdamped mode
associated with the s~stem is varied. · .Also in this figure
the phenomena of mode interaction is evidenced by the asymp
tote function which is only dominate a~ the natur~l undamped
mode frequency. The transmissibility approximated by these
particular asymptote functions are consistantly lower than
the actual transmissibility.

I
-~-~~~~~~-~--~---bo Dominates b1w Dominates b2W Dominates--
I 1---------+----+-----+---~--+---+l--+--t--t-------t-----t---l-1---+----<l---+--+-+--I
I I
\--l--- l--+-+--+--+-+- -----+----+--1 I I
--+- +--+--+-+------+----+--1-1---+---+l---+--+--t---l T I ! ' I I "o I 13
-20Log 10 'li:' j ', a 3w
1--------+--- e2w - - -- ,- ,:__-+-----t--'--, -+--+--+-t---t--+-1
0 ----1-d:~ -l~'{,-,}---20Log10 ~ -20Log10 """"Ei::-- 'I:-, I ' I
,! 0 't', I I i ,~, r-... 1- - , ---1--1-----1-+--4---+---I -.; ,, ,,J, ), \ I I g w2 I );ft'"',..__,_, __ 4----+--'
~
2 / v ', ...._ \ I
-~,\.---1\----+-1, \ I I \ \ I
·'""'10 ,;w- ;zj,__, : Bode I s \ \ l-1---+--1----1---1---1--1 1----------t----+---+---, ',\ I
Asymptotic \J, I I A8prqxifarion \\\\ -1 :--1--1---+-+--+-+--I
W 4\ \ I a4 X I
I I I I I I I 111 -20Log1:,:r ~t i--+-1 --+----11 l-+---1 +--+---11 I I
-20Log 10 ~ __ j~~- _
F' ig u re 3-4 0
2 1\,1 I i '~,
w - Radians/Seconds
firs t Or der App r oximation for Multiple Mode _ freque ncy Response Spectrum -.J
Cl

., ... G)
.c .... u G)
0
...
I I I I I ~ I I I I I I I l I I I I I I . b w 2- -
2 -b Dominates 1-r--oominates 0 I I
a 0 I I i::·' 1 °' ! i-+--+--t-t-r-, ~- I I
~, I '~ I -2 ~~- ~ -.. a2w ~ -'\:--: : ' -20Log10 '6:w" ~----.. '~-, I 1
'~ -+-I I ·, ~ I I L. -----r-· --~~-' I I
I. ~ I I +--t--+--;-~---, I I 'S~ : ' I :
I I I 1~~{0: I ' I ' ' · ' ··'1-=......,,__,o,o,;+-c-+.l ~ 1 1 1
a1w-"'2/,~:~~ I. I I I . G)_ - I 1 1 I I I I _,o,.T I I ~rnwrr;v=~---C:1~~~ ~l_~J!.,,; :Y ~I
G)--- I 11 11 1 , , @---- , I\ ! 1----- @ -·-·- ·- -20Log10 ~ ~, \~ - [
fi gure 3=5 •
I \ I w - Radians/Seconds
Transmissi on Functi on Representati on fo r fre qu ency . Res pons e Spec trums With Damping Function Va ri ed -J
,_l>

II) .... m .0 -i u m
0
I-
...... I l ,---------:.,- ' ~
._',,L I''. ~ · Modes Within One Decade '-..: :-,-._~ ',,...._ t,~ 1 of One Another .
~,.!..'II
'{ "--..I Modes Approximately With , ~ :,... i---- \. I
One Decade Separation . . '\.j'\ ~Ll ' ~ ,, l\ ~ I 1 '\~.... 'l,h_
I I I ~ '\ ',
...... 1~~1~ '~-l ...... " ' ' ffJ.', f'\ ' .... ' ' - I ',~~ ~
-~L----~ I J ',~ ',,, I ;11 ',,. f\ '~ '\ '..._ ~ ':-.. ~
fflod" With Over tj , ,~ One Decade Separation ",.~~ """,.,,.,,."~
figure 3-oo
'~.··.·~~ ~, ~" W - Radians/Seconds
Transmission function Representation for F'requeney Respons·e Spectrums for Various Mode Separations
-.J N

0) ... m .c .... tJ m
0
I-
I I I . i I J,) I II : I
I Dom,ioddat,~ . l=+H=. t 11 fiFI 11 . . . . . l:
Figure 3=7o
w- Radians/Seconds
TraRsmission Function Representation for Frequency Response Spectrt.Jms·With Coincident Transmission Bandwidth Boundaries .-..:,
c.,,;i

74
F'igt!lre 3 ... 5 shows tt'le manner in which the asymptote func ..
tion wbich is dominate at the nat~ral undamped mode frequency
will approach tbe actual transmissibility as made separation
is effected.
F'igure 3-7 shows what the respm"se spectrum woald look
like if a transmission bandwidth were coincidental. This
coincidental transmission bandwidth becomes evident when tne
Spectrum Sand-pass matrices are calculated. Normally 1 suc
cessive Spectrum Band-pass matrices will nave at least one
entry which is equal to an eAtry in the previous Spectrum
Band-pass matrix and also an entry equal to an entry in tne
following Spectrum Band-pass matri~ as discussed before.
Trar1smissicn band-pass btuuullaries which ~re coincident wi tb
the followimg bowndaries are cbaracterized by Spectrum Band
pass Matrices which have no entries equal to any eRtry in
either the previous or fallomiag Spectrum Bandapass Matrix.
Appendix C presents a means of mealing with very lightly
damped third order systems a~d -lsm ,a cr!t~rion for the ' I
stability of tt,irs ar1d fourth order systems by· the tJse or I
the transmissioA asymptcte.functio~8o
In g11:u11eral ll tne asymptote ftrn1cti·ons can be .used ta
apprexima te the ac.ta:Ja:l frequ ~iH.11cy response SJ!)ectram mf an mth
order system. This is also tiue for b~gher order systems
.sifilce m.ost stable,· wall behaved systems tend to be adequately
represented by well separated break frequencies (4).

75
Samma.r y
Tm!s chapter has swbstant!ated tbat the implicit fre
q~ency response characteristics of physical systems can be
displayed explicitlyo This was accomplished thraugb tAe use
of the rlllru:Jamental State-Variable F'requemcy Ma trixo This
frequency Canonical F'orm of the state-variable model is a
nalural additio~ to the more familiar Jmrdan and Rational
Canonical rormso As is denu,nstrated, the F'reqt1ency Canonical
rorm can be obtained fro~ system mathematical models directly
or by transformation' from any form ~f tbe state model 0
With the state model in the F'requency Canonical F"orm,.·
Spectrum Band-pass matrices can be calculated. Tbese
Spectrum Sand-pass Ma trices contain the transmis.siom asymp;.
tote functions from which tbe frequency response spectrum is
constr11:mct~u::lo Also, dt1ring the generation of the Spectrum
Band-pass matricesp the transmis~io~ bandwidtb beuAdaries are
determi~edo The bandwidth bo~ndaries establish tbe range of
f'requemcies to which the associated Spectrum Band-pass matrix
is applicableo
This chapter also comtains a rigorous mathematical sub
stantiation of the entries in the r~ndamental State~Var!able
Matrix as significant functions for characterizing system
frequency l'!!Sponse spectrums wi thmtJt having to factor poly ...
namialso The transmission asymptote functions have bee.n
mathematically sbowA to be representative first order approx
imations to the frequency respo~se spectr~mo Also, p~cilllf is

76
shown that under specified mode separatiom these asymptote
functions provide the exact traasmissibility for umderdamped
frequencieso Along with ·this proof the calculation of the
transmission bandwidtb boundaries from the entries in the
frequency Canonical Form input matrix .has been mathematically
substaatiatedo ll1i th these frequency spectrum characteristics
it is possible to isolate all the characteristic modes of any
time in~ariant linear systemo
The basis of the construction of system frequency
response spectrums by using the fundamental State-Variable
Frequency matrix stems from the implicit characteristics of
the coefficients of the unfactored characteristic and foraing
function polynomialso rrom this basic system model mode
representation the nat~ral interaction of modes places a
practical limitation on the application of the transmission
asymptote f1t1lllctionso However 9 this limitation is only on the
determination of the actual transmissibility at a mode's
natural undamped frequencyo This limitation inval~es main
taining modes at a minimum distance of one decade separationo
· In general 9 the first order approximation for a system's
frequency response spectrum obtained by using the rundamental
State~Variable rraquency Matrix is closer to the actual spec
trum than that obtained by using Bode' s Theoremso Not only
will this first order approximatiom obtained by using tRs
Freqoency Canonical F'orm be more representative but also the
approximation can be obtained without faatori~g any palyna
mialso

CHAPTER IV
FREQUENCY CANONICAL fORM SYNTHESIS ANO
COMPENSATION APPLICATIONS
The use of frequency response spectrum information to
represent the dynamic behavior of a system is especially
wplaable in sy-tem synthesis and aompensationo Many times
the excitation to which a system is subjected can be repre
sented by a finite rourier Serieso Witb this means available
to represent a" excitation, system performance under this
excitation can be obtained through the use of its frequency
response spectr~mo Alomg witb the steady state perfQrmance
much ean oe learneq about the tran~ient p:erformanc:e by exam=
ining the frequency.respense spectrum of a modelo for these
reasons the rrequency Canonical rorm of state-variable mGdels
is very useful in the synthesis and compensatiom of dynamic
systemso
The uni qua features provided .bY · the frequency Canonical
rorm for synthesis and compensation are the explicit. display
of the transmission bandwidths and the t!'ansmission asymptote
functionso With this information it is possible to construct
mathematical models for systems to meet predesignated fre~
quency domain specificationso The construction process is
dome by superposition of model components described
77

78
explicitly in the desired frequency spectrum. Also, systems
whose dynamic characteristics are unaccepta~le can be com
pensated by direct adjustment mf significant entries in the
Spectrum Band-pass Matrices. These modifi~d entries can then
be reflected directly into the system model. This discassion
leads to the tat3ic of sensi tiv! ty of system parameters.
Although nothing extensive will b~ presented, the sensitivity
of system components can be examined on a very preliminary
level through the use sf the frequency Canonical rorm sf
system models.
Basic feedback Control
The most ftu1damental characteristic af dyr»amic control
systems analysis is that o( feedback. The effect of UB!ty
feedback on tbs basic mathem..atical model is tne imcrease of
the ceeff icients in the o.pen 10013 characteri~tic, eqt11a tion. by
an amount oorrespending to particular coefficieqts in the.
forping function. T-is increase of coefftcients is done by
add:i,ng t~~ coefficients associated with equal erders of
derivatives. This modificat_:ton, o.f. _the_ coefficients is illus ... ~~:------ - ·---
trated below. The general nth order linear system .witb no
feedback. ts described by
••• + •• 0
+ b V ' fl (4 ... t)

79
Wham unity feed.back is employed the system model becomes as
that shown in
a d'\, + ndtn
Equation (4-2).,
( : . )dmy ooo + am+ bm m +
dt
(4 ... 2)
for physically realizable systems considered herein,
unity feedback is interpreted in the Frequency Canonical form
as the addition of the input column matrix t, the last column
of the fundamental State-Variable frequency Matrixo The
effect of unity feedback on the frequency Canonical. ~orm can
be illustrated by tine followingo Consider the. system wl1ose
dynamic characteristics are represented by
d3! +· d2 dv 1 ~ + 416.=.... + 800y dt ' dt dt
2 g d V + 105£! + 500V
dt dt (4-3)
The state model far this system in Frequency Canonical form
can be writtern by inspection when Equations (3-2) 9 (3-7),
and (3 ... 8) are employed as a comparison. The result is thie
followi~g state model
z~ 0 0 800 z1 500
w3 z• 2 = w3 a 416W 22 + 105W V (4-4)
zV 3 0 w3 1ow2 -z3 ld 2
(4-5)

8 []
The state model for this system with uAity feedback is
z• " 1 0 0 1300 2 11 5El0
3 z• (;J3 a 521W '2j 105W (4-6) -W :, 2 = + V
Z3, 0 w3 11w 2 ..,z3 w2
Thf'§ form of· the state model is st.iii · the f'requeilcy CanoRical
f'orm and the· y equation is unchanged. The frequency respo~se
spe.ctrum for this system witb and without feedback is shown
in f'igure 4 ... 10
This simplified concept of feedback principles as
applied to the f'requency Canonical f'orm of state models can
be extended t~ ~ore complex feedback loops. When the feed
back loop comtains other than unity. gain the manmer in wmicm
the different coefficients are added is dictated by tile fu~c
tional form of the dynamics contained in the feedback lo~po
The changes im tbe entries of the state msdel follow rather
logically depending on the contents of the feedback lcopo
ror other tharn simple gains in the feedback laop t~e eRtries
in the input matrix will also be alteredo Tne specific man
Aer in which tbese emtries in both the Fundamental State
Variable freqaency Matrix and the input matrix vary will be
discussed in a follawing sectien wmere compensation is can
sideredot
Synthesis in State Space
Synthesi,s in state sp-ace empleyimg the f'requency
Canonical State Model follows similarly to system analysis

I I I I I I I 11 110seJ I I I I 111 I J I I • J • Dominates ·, Dominate;::
I I I --..... I No 1 ___ _
I I I I
-t---t--1""-l"--1'-"'i---t-rl
. I r
H----+--l!--+-~1---f----l I
a, f'eedback : ~ ,-------i I ~ I u 1---+---I g I
I-
1 · I.
''~!--t---t-t-tl
I
I I I I I I I · I I I I I I I I I I :---+-----1 I
I I I I I , --:- No F'eedback \.~ l ___ ---1 f\. . I . -·· --unity f"eedback -~ l
l\~---
F'igure 4 ... 1.
K1,~ I~,,~ w - Radians/Seconds
l·,
Comparison of rrequency Spectrums for a System Uli th aad Wi tnaut Uf:li ty reedback · I.D
..I>

82
employing th.is state modelo The procedure of synthesis
involves initially tbe cmnstruction ef the specified fre
quency response spectrum' by using st:raigtilt, lines wbose slopes i .
are multiples of 20 decibels per decadeo This piecewise
linear spectr~m approximation describes the transmission
asymptote functions. A typical illustration of these func
tions is sbown 1- Figure 4-2. Every frequency where this
first order approximation has a decrease in slope of 20 deci
bels per dercade is a tramsmission bandwidth boundary. At
frequer:icies ml1ere the s.,lope decreases by 40 decibels per
decade a coincidence of barndwidtm boundary occurs. In other
wordst when a coiAcidenQe of baAdwidt~ boundary occurs tbe
deminance of input matrix elememts skips an entry in the
input ma trixo The bandwidtl;1 fre1:1u~ncy bou.ndary where tnis
obcars is the sq~are root of the. elem~nt in tbe input matrix
wbicm was skippedo
Figure 4-2 s~ows the freqgency response spectram of a. ;.
system. which was synthesized by first drawing the transmis
siofll asymptote ftu,cti1iu1se1 Ulitb tbese ftrnctional first arde.r
approximations fer tAe f·ren1mency response of a desired system
it is possible to write the state model in Frequ~ncy
Cano mi cal F'ormo By ref ering ta E~ua ti oms (3 ... 7) and ( 3-8)
the state model is written as shewn ini Equatioms (4-7) aad

111 ..... m .D ... u m
0
....
-
I 2 ! a 2w ~ j 71-20Log10 61w -1- -C_j_++++tttt---=rJ/l\}\1,1
L_--f-t-t~;.;;a,w V \ I _(_{-20Loo,~ o,w" / \
-20L•o10 6:::i y JJ:r~ _..!._ __ \.,~ =:rs· .. _J____jf-+-t-t1 ~.· 'drt-~-, - : , - 1-, . I ,, \----1---+---t-,. - . -'-t/ '
//1 I • ' ' I \1.-1._t--t-t-1 ? ~~'\
L~======~~-+~+--t-t-t-ti~~~~~~;;:~.' ~i),t'\. B3W /V ' .I'\. -20Log 10 1i:"w7 ·1 ',-).-1-~~~~~~~~~~~~~~~~~~~~~~~~~~~~~~1 'f"\.
I '.'.D. d=!=++H-Ht--tt~ '', I
W - Radians/Seconds
figure 4~2o Synthesized System frequency Response Spectrum by use of the Frequency Canonical State model CD
t.,.l

84
Zl 13 g 38B.2
0.176W 3 z• 2 = 0.11a w3 ll 15S.5W
z; 0 00 176,W 3·
1.aw 2
+[ewaf• (4-7)
y • [ B B •1] (4-B)
-z.3
The actual spectrum for the system represented by the above
state model is also shown im Figure 4-2.
In many cases tne mmdeled frequency respense spectrum
will Aot exactly meet tbe required freeiuency domain specif!-'
cations. However, by using the metbods discussed in·tbe fol•
lowing section on cempensation the modeled frequeQcy respo~se
spectrum caA be altered s~ch tbat the specified requirements
·are adeu1uatel y met.
CompeAsatien in State $pace
The specific c~aractel'istics of t"e F'.reqmenoy Car:uu,ica1
rorm possess features w~ich permit tbe ptinciiple of compen
sation to be applied easily. The oscillat~~, mode peaks
which always occur within transmission bandwidth boundaries
are relativ'31J irutependent of the boundaries involved.
Therefore, it is possible to adjust· this peak transmissibility

85
by merely changing the entry in the r~ndameatal State
Variable rreq~ency Matrix which governs the associated trans
missibility. This particular feature is demonstrated in
rigure 4-3. As seen im this figure the transmissibility at
the natural undamped frequency is easily adjusted to nearly
any desired value.
Adjustment of break frequencies possesses the feature
that any change in tnese freq~encies also changes tbe t;ans
mission bandwidth\ boundaries. Since tl:1e actual break fre-, .
quencies associated witra the transmission asymptote fuactian
generally ar, not tbe syst~m characteristic mode frequencies,
this feature permits the shifting a~ound of amy bandwidth
boundary ta meet any specification to improve the frequency
respons~ of the represented system. In situations wbere
oscillatary mode f~e~uencies are altered the peak tra•smis
sibili ty associated with till is mode will also b,e chamged.
rigure 4-4 illustrates the typical e~fect af changing the
mode frequency with tba normalized transmissibility function
for the peak val~e unchanged. This operation places no
limitation on the use of the Frequency Canonical rorm in
compensation since the peak tramsmissibility is virtually
independe~t sf the transmission bandwidth boundary and, thus,
·can be adjusted independently.
O.ften campensatioA infers the addi tien of equipqsent to . ',
obtain a dasired system performamce. Generally tbe ~dditicn
of compensation elements !Dv.olves increasirag tt:le order of
either tine characteristic and/or the forcing f1anctianso The

I 11 -20Log10
,, ...-z._/- f-t .... ,
1---------i-----i;-----+--t----t--t----t-t--t-------,~l---1-----+---1
i I l I 111 Trn~:~~ ~ ~-+---+--'----4"
~ ~z:=111· ~J__
"'N 7 ~ \
'ii.
w- Radians/Seconds
figure 4""3o Resonant Peak Transmission Asymptote Function Variation
CD m

fl) .... Q)
.0 .... 0 Q)
a
I-
.....
W - Radians/Seconds
Figure 4•4. Effect of Zeroth Order Transmission function on Frequency Response Spectrums
CD -J

ea
procedure for performing compensation from this standpoint
entails merely the addltion of elements in the F'requemcy
Matrix arid/or the iAput matrix. Tbis operation is similar to
the addition of feedback with other than a pure gain in the
feedback lmop. The following discussion demonstr·ates tne
procedure employed when compensatinn is performed ~sing t~e
F'requency Canonical F'orm in state ~p~ce.
The classical compensation configurations used in pres
ent day control system theery are lag-lead and lead-lag.
These can be used el tbe:r; in tl:le feedback loap or in tile for
ward loop. Tne particular det~ils of the use to which eitnar ' '
\
of these configurations i~ either the feedback or farward
loops caR be made are sucb .that a single illustratiom will
demoastra te the principles involved. .In p~:rticular td th the
wse af tne frequency Canonical State Model these .principles
can be demomstrated by comsidering tme general modal.
z' fJ g • • • a am z1
z2 an WR 0 • 0 • B a 1W z2 • · i
0 0 o, 0 • • A
anw•, 0 = • 0 0 • •
• 0 • • • •
0 0 0 () ·• 0
z• n 0 0 • • 0 aw" n 8 n-1 wra-1 -z n
(4~9)

•
0
•
-z n
89
(4-10)
As ~llastrated previouslyp unity feedback is performed by
adding the input column matrix to the last column of the
fundamental frequency matrix. F"o.r the general .lag-lead or
lead-lag configuration in the f~edback loop the frequency
Canonical State IYlodel can be developed as shown below.
:z • 1 Cl 0 • • .. 0 pao
z' 2 an wn+1 0 0 0
0 0 0 0 0
wn+1 0 ~amw m an 0 = 0 0
0 • 0 0 •
0 0 0 0 0
z~+1 Cl wn+1 (3 Br/,d n
0 0 0 0 an
0 0 0 0 0
0 0 0 0 80 w + ;
0 0 0
0 0 ·o
0 0 0 0 a r:n- 1 wn

90
0 • • • • 0
0 ci • Cl .Cl
• • •
+ Ct bW m • • m
• • (I
• • •
CJ • • • • 0 13
0 • • • • 0 a z1
• • b(lJ •
• • • •
+ • 0 b m-1 •
• • 0 •
• • • •
El • • • • 0 (jJ ""' 2 n+1
b0 W 0
··. 2 b1u.) bo
• • + (3 b wm+1 + m b m-1
'fl (4-11)
0 0
• •
0 0

y = [c a tll -1] :Z:1
• (4~12)
•
-z 1 m+
~n frequency domain notation tbe configttratisA in the feed
back loop reflected !A Equation (4-11) is (s+Cl)/(s+,d.).
Thls type af compensatien is characterized in the fre
queAcy spectr~• by the •ddition ef ~Ae tradsmission asymptote
ftsr1cticu1 and one transmission bandwidth boundart• ,Ia ef feet ·,
the state m~del ~apresentatimn shown in Equation (4-11) can
be accomplisned grapl3ically by iwerk.ing with the spe .. c;tram .. I
represemt.a tion.
Sens! tivi ty Che.ck in State Space
The system frequency perfor$ance sensitivity of vario~s
system contributions or components can also be investLgated.
This sens! ti.vi ty lnvestigation can be doae by direct imsp.ec
tion of tbe elements sf t~e Spectrum Band-pass Matrices. The
transmission asymptote functions in these matrices describe
the break frequencies mf the oscillatory modes and, to some
extent, also provide the actttal transmissibility at these
break frequencies. IA the previous discussion an cmm~ensa
tion it was pointed out how tbe varimus types of transmissia•
asymptote fuactioffls affect the actual spectrum. At unity
freq~ency tbe intercepts ef the asymptote function are com
posites of all tbe components of the actual physical system.

92
Eacb Qf these componemts have a physical character which may
change due to environmental changeso Tbus, the system fre
quency response spectrum will nave a time variant character
.as well. The effect of this possible time variance can be . '
checked by examination of the sensitivity of the frequency
spectrum described by the Fundamental State-Variable
Frequerncy Matrix.
To illustrate this, the state model for the network
showR in F'igure 4 ... 5 ·is as shown in Equation (4-t3').
a 3W 3
z• 1
z2. z• 3
ao =
81 =
a2 =
r 0 0 ao
3 Cl = a 3 W a1w
0 3 a w 2 83(.u 2
2 . 2 (L1/c)+R 1R2+R 1 +R 2
L1R1+L1R2+R1L2
a3 = L1L2
b1 + R1R2
r 1 z1 Cl
z2 + b1W ei (4 ... 13)
-z3 0
( 4-1.4)
from this frequency Canonical Form of the state model
the entire frequency spectrum amd variations in the spectrt1m

f
r
or
C
Figure 4-50 Electrical Network
l T
93

94
can be visualizedo rormation of the Spectrum Band-pass
Matrices produces
' 0 ·3 ..
a3W
51w
0
(4-15)
The entry al/b1 W indicates that the spectrum wi 11 have a
plus 20db per decade asymptote at low frequencieso The next
entry a 1 W/b1 W srnows an increase in asymptote. slope to zero.
The a 2w 2/b 1 w entry shows a miraus 20db per decade asymptote
slope and a 3uJ 3/b1uJ shows a minus 40db per decade asymptote
slapeo from this examination of matrix entries it is possi
ble to ,show that an underdamped mode can occur at ome of two
frequencies. These frequencies are calculated in the follow
ing wayo An underdamped mode may occur at t~e frequency
where
ao s,w (4 ... 16)
which produces in terms of the system components a natural
undamped freque~cy of
(4-17)
or the underdamped frequency where
(4-18) I

95
which is a natural frequency of
= ~ = -,Jr~c2{?, + e1R2 + R/ + e/) (4-1,)
A study of the compoments represented in Eq~ations (4-17)
and (4-1~) will indicate tbe 10,ation sensitivity af the
modal frequenriy spectr~m within tbe spectium with respect to
any single component or cemb~nations of components.
It is also possible to investigate t~e traasmissibility
at tn ese frequencies in regards to tine system companeu,t
variatio~s. These traasmissib!lities are 'determined oy the
I 2 asymptote functions a,1 W 1::i1w aAd a 2w /b1w, respe~tively .•
ror tbe first possible n~tural undamped frequency calculated
in Equation (4-17) the transmissibJlity at this frequency is
b T = 20Log10 a11 = w=w.,n
(4 ... 20)
and for the natural undamped frequency calculated !A Eq~ation
(4-19) the transmissim~lity is
T = w= wl'l b1
20leg1 o a2w =
R1 11 2 , . (4-21)
wberi, tbe w ia Equation (4-21) is that shown iR EquatitiH'l fl
(4-19).
Sanaitivity studies can be performed in a_ simila~ •anAer
fo~ most any system wbicb is adequately des~ribed by·linear
time invariant ordinary differential equations.

96
Summary
The freq~ency Canonical Form for state models of physi
cal systems provides a powerful tool for control system
designers ancl analystso Its features are such that it can
be used in many capacities to help the engineer solve day to . . I
day control problemso Many times the complexity of the
system is such that a cli gi tal computer would be necessary
to obtain the rootA ef the cbaracteristiQ 1 and forcing func
tion polynomialt~ This form of the state model allows the
engineer to perform the operations of aaalysis 9 syntnesisp
and compensation without reverting to the digital computer.

CHAPTER V
STATE MODELS DERIVED rRom
EXPERIMENTAL DATA
An important feature which the ruadameAtal State
Variable rrequency Matrix provides is its capability of being
derived from experimental frequency response datao Although
msst physical systems are not linear or statianary and, con
sequently? experimental frequency response data of these sys
tems contain tne effects of nonlinearities and time varying
coefficients$ many of these systems can qe adequately repre
sented by linear time invariant models~ The linear$ time
invariant state model for this class of physical systems can
be derived from its frequency response data through the use
of the rumdamemtal State-Variable F'requ~ncy matrix.
State Models rrom Frequency Response Data
The development of the rundamental State-Variable fre
quency Matrix showed that the ent~ies ici.this matrix are t
first order approximations to the actu1al system frequency
spectrumo This fact is the.basis for the derivation of state
space moclels ftom experimental freq~ency response spectrumso
To derive the F'undamai,tal F'requency matrix the entries
in Spe_ctrum Band-pass Matrices must first be obtainedo This
97

98
is accomplished by canstrtJcting a first order appre~imation
to the experimer:atal spectrum data. Since all the transmis ... ·,
sion· asym.ptote functions have slopes whicb are multiples of
20 decibels per decade, this first order approximation mast
co.nsist of straight line segments. whose slopes are multiples
of 20 decibels par decade. rmr simple breaks where the slope
changes by only 20db per decade, these breaks are established
by tbe approximation deviating from the actual spectr~m by
approximately 3 decibelso
Once a first order approximation is drawn, t~en the
trarasmissie,n bandwidth botu1daries can be estimated. Tnes.e
boundaries occur at every frequeacy where the first order
approximation has a decrease in slope. For decreases im
slope of only 20 decibels tbe bo~ndary dictates simply a
chamge ef dominance trom one input matrix element to tb~
next. Howeverp if tbe decrease in slope is 40 decibels per
decade then this dictates a ceincidence of transmission band
width boundarieso The rrequeAcy associated witb this coinci
dence is a bo~ndary wbose valbe is the sqmare ro,t of 'am
input matrix elememte1 Also, the cnaf,lge in dominance across
this boundary is from the element ·before to the element after
this partic~lar elememt iR tbe input matrix.
The restalts or this construction are··tne transmission
bandwidth bm~~da~ies and the transmission asymptote fonc
tioAs. In order to eval~ate the separate coefficie~ts which
make up tbesa.. bauf;:l.daries ar1d · ft:1nctio11s, it is necessary to
assume that the derived model is normalized with respect to

99
bm~ In other words 9 bm is assumed to be ,qua! to unity. No
generality is sacrificed with this assumption since many
operations in system analysis work 111! th this normalized form ..
With bm = 1 then all the entries in the input matrix can be
calculated from the transmission boundarieso Once tnese
coefficiernts are obtained then the remaining elements of the
fundamental frequency Matrix and 9 finally, the frequency
Canonical State Model fmrm can be writteno
Tbe utilization of this procedure far obtaining sta ta
models from frequency spectrum data may involve the proce
dures discussed in the previous chapter under compensation ' I
to ascertain an adequate fit of the experimental da tao This
is d~e to the lack of concrete knowled~e about the inter-
action of system modes$
Tn illustrate the utilization of this prmcedure consider
the frequency response spectrum data shown in Figure 5-10
The actual state model represented in this figure in
Frequency Canonical Farm is
z• 0 0 Cl 1600 21 ,.
(] 1
w4 z• w4 0 0 776W "z2 300W 2 + :ca w4 411o6W 2 40W 2 zv 0 0 Z3 3
z• (J w4 3 . 3 Cl 5o6W ..,z4 w
4
'ii (s ... 1)
(5-2)

I I
~~_,_~~I I I I
:IT.' I; I
~~-l--~-t I
fl I ~ I
~ I ~ I ~ I o I
I ~ I
I . I I I I
I I
F'.i,gure 5~1 o
W - Radians/Seconds
Frequency Canonical State Model Linear . System Identification
I I I
~
0 CD

The state model derived from this spectrum data is
o9W4
z• 4
0
0
0
0
1500
675W
0
0
o 9W 4 0 376W 2
0 .,9W 4 3 0 7W 3
T
+ [a 21sw 39,sw 2 w3] •
y m [a O -1] Z1 z2:
Z3
-24
1 IJ1
(5-3)
(5-4)
The frequency response spectrum for the stats model of Equa
tions (5-3) and (5-4) are also shown in figure 5-10 .Once a
state model has been fit i~provaments in this fit can ba made
by inspection and the appropriate matrix element can be
adjusted ta reflect the improved fit.,
In order to illustrate the use of this procedure in a
general situation ths spectr~m shown in Figure 5-2 was drawn
in an arbitrary fashion using rrench Curves only to obtain a
smooth spectrum., The resulting spectrum fit is also shown
' in this figure 0 No attempt has b~an made ta impr~we the
spectrum derived from the pro~edure developed in this chap
ter for obtaining the state model from experimental fr~quency

I I I I I
I I I I I I I 11 II II I I I I I I I I I I I I
I I I II
I I I I I
I- I I I I
I
~ I
I 1 · F'unctions
I I .
W - Radians/Seconds
f igura s ... 2 .• ~:-,1,~i:S-~u.ency Caru:mi cai Sta ta Mod,~l I den ti fica tion _ - ~· of Arbitrarily Drawn Spectrum -o·
NI

103
response datao It is pGssible to improve the linear time
invariant representation if it is necessary. The rrequancy
Canonical farm of the state model representative of the
derived or fitted spectrum is shown below.
z~ 0 0 576.0 z1
10 4W 3 z• 3 0 2373W g 10.4W z 0 .. 2 ·.2
z• 3 a 10 0 4W 3 2ow 2··
-~3
+ [96.0 42,0W W2rv (5 ... 5)
(5-6)
The two illustrations presented abo,e represe~t a rather
general application of the fundamental State-Variable
frequency matrix method to state space modeling whicb can be
derived from experimental frequency response data. The
modeled spectrum s~own in both Figures 5-1 and 5-2 were
derived on the first modeliAg attempt. CDns~qu~ntly, Ro
effort has been exerted ta improve the model althc~gh it is ' possible to it.erat~ a~d poss!bly obtain batter spectrum f!tso
These figures demon•trate the clossness possibls on the first
try if care is tak-en in the selecti©'lrt of the a$ymptotes.
This modeling technique has several features which make
its application rather si•ple. One feature is tbat the break

104
frequencies are not necessarily the raats of the character
istic and forcing polynomial functionso This feature removes
the task of having to try to guess at representative corner
frequencieso Another is the ability to model peak transmis
sibilities without worrying about the mode representative
damping ratioo Also 1 in effect 9 the coefficients generated
are the coefficients of the linear time invariant model
represented by its frequency response spectrumo

CHAPTER VI
SUMMARY OF SYSTEMS ANALYSIS AND SYNTHESIS
VIA USE OF THE FREQUENCY
CANONICA~ STATE fflODEL
The procedures outlined in this chapter summarize the
detailed discussions regarding the application of the
Frequency Canonical Form presented in the previous chapters.
The type of systems to which the following procedures are
applicable are those which are adequately modeled by lineart
time invariant; ordinary differential equations. In general,
these procedures are applied to the category of systems hav
ing a single input and a single output. The models for most
physically dynami~ systems can .be adjusted to fit in this
category by successively pairing the inputs and outputs.
Obtaining the Frequency Canonical form
Initially the system mathematical representation caR be
in either the ordinary differential form or some state model
form. If the model is in differential form the direct pro
gramming t,chnique shown in Figure 3-1 can be applied. This
procedure results directly in the Fr•quency Canonical Form.
If the system model is initially in some stateqvariable form
it can be transformed into the frequency Canonical Form by
105

106
first transforming the state model into Rational Canonical
F'orm and then applying the Frequency Transformation. This
transformation is
where
also
z• 1f""l-1 f""I 1,(""\c,t1 =w!£ lil3:.+c:u~ 8v
Z ' L r'l-1 • ::a: W ~ X
Z :: n-1 X
.Q = i, by n F'reguency Transformali_g!l Matrix (see
Equation (3-11)) ..
x • state""variables for state model in Rational
Canonical F'orm.
(6-1)
R • Rational Canonical form of differential transition
8 = ineut column matrix.
'fl ~ ineut vector.
Beth mf the procedures discussed above will result in
the rrequency Canonical Form for the system's state model.
Analysis Using the Frequency Canonical rorm
To cons.truct the first mrder appro:dmation for the sys-
tern frequency response spectrum the following steps are sug-
gestedo
1o Divide tbe rundamental State-Variable rreqaanay
Matrix and the input matrix by the first entry in

167
the input matrixo Tbis prod~ces the first S~ectrum
Band-pass Ma trixo Tne elements of this matrix are
the transmission asymptote functionso
2.. The range of frequencies to which this first
Spectrum Band-pass matrix is applicable is calcu
lated by equating tne first ~ntry in the input
matrix (after. the division indica tad above) ta 'f;he
second entry., This produces the first transmission
bandwidth boundary ..
3., The first two steps are repeated by using all suc
cessive entries in the input matrix starting with
the rundamental State-Variable rrequency matrix iA
each instance., This produces m Spectrum Sand-pass
Matrices and m transmission bandwidth boundaries 9
where mis the order of the forcing function poly
nomialo
4o The first order approximation of the freq~ency
response spectrum is constructed by starting at the
low frequency using the first Spectrum Band-pass
Matrix geRaratedo The first entry in the rigbt~hand
column of this matrix is used as the first asymptote
of the spectrum approximation., (All these functians
are straight lines on log-log paper and they all
have slopes which are multiples of 20 decibels p~r
decacleo)
5., The asymJ!!)tote functions of the first Spectrum MatlC'!x
(in th• right-hand> column) are used successiwely

-108
um1til tills transmissibili ty calct,la ted by an asymp
tote function in the first•Spectrum Matrix is
exactly equal to the tr~nsmissibility· calculated by
an asymptote function in the next Spectrum Matrix
at the transmission boundary frequency. At this
point the next Spectrum·Band-pass matrix is used to
construct the first order approximation in the next
frequency band.
6. Tne poi~ts where a change in Spectrum Band-pass
Matrices to be used will always occur an the trans
mission boundary frequency and its occurrence will
always be indicated by the equality sf asymptate
functions iA successive matrices as discussed abeve.
ror systems whose modes are separated by more than a
decade this first or-er a~prmximation will not only res~lt
in good straight line approximations for.the system freq~ency
response spectrums but it will alss produce v.frtually the
exact t.ransm!ssibili ty for the oscillatory mm(j'es at, th~ par
ticular modes• undamped natural frequency. The undamped
natural fr~quency is displayed explicitly in the rundamental
. State-Variable rrequency matrix for ·any arrangement of mode
separations.
Synthesis Using the rrequency Canonical rorm,
Synthesis using the rrequency Canonical r~rm proceeds
as follows.

109
1. Construct a first order approximation on log=log
paper for the desired frequency response to be pos
sessed by a system~ These first order apprmxima
tions must all bave slopes which are some multiple
of 20 decibels per decade.
2. At every fraquency where the approximation has a
decrease iA slope calculat·e· the elements of the:1
input matrix. This is done by starting at the
highest frequency where the approximation has a
decrease in slo~e. This frequency is equal to
bm_ 1/m111\ Assuming bm = 1 then bm-l caA be calcu-
la tad. The mext frequency where the slope decrea~es
is equal ta_ bm ... 2/bm ... 1' etc. Using the previous! y
determined value all the elements of the input
matrix can be determined.
3. The first order approximations drawn in step 1 are
the transmission asymptote functions~ rrom these
str~ight lines all the entries in the rundamental
State-Variable Frequency Matrix can ba calcal,ted
and 9 thus 9 the system state model ih the frequency
Canonical fsrm is obtained.
Compensation Using the frequency Canonical form
System compensation emplmying the Frequency Canonical
form involves the knowledge of specific features of the
transmission asymptote fnnctlons. These featares are as
shown below.

110
1 o Asymptote ft.rnctions which determine the transmissi
bili ty at oscillatory mode frequencies are virtually
independent of the bandwidth boundaries but are
sensitive to the closeness of other system modes.
2o All other asymptote functions govern the. bandwidtR
boundaries and, therefore, adjustme~ts i~ theae
functions will be propagated to higher frequencies
in the spactrumo
In general, compensation can be performed either graphi
cally aad then interpreted into the state model ar the state
model can be worked with directly~
System Modeling from Experimental Data ,, .. r
Using the Frequency Canonical rorm
The procedure for state model identification from
experimental frequency spectrums follows much the same chan
nels as outlined for synthesiso
1o Initially9 the experimental data must be approxi
mated by straight lines on log-log papero Tbesa
straight lines must have slopes which are multiple•
of 20 decibels ~er decadso
~20 Every frequency wher~: this first order approximation
decreases in slope is a transmission bandwidth
boundaryo These boundary frequencies are usea to
calculate the entries in the imput matrixo By
starting at the highest bandwidth frequemcy boundary
which is equal ta bm_1/bm where mis the number of

111
bandwidth boundaries, and setting bm ~ 19 the~ bm~ 1
is determineq .. Tbe next boundary frequency is
bm. 2/bm_ 1 from which bm~ 2 is determined, etc .. until
all the elements in the input matrix are obtained.
3. The straight lines which make-up the first order
approximation for the experimental data are the
asymptote functioms.. These functions are ratios of
the inp~t matrix elements and the frequency Matrix
elements .. Since all the input matrix elements have
been obtained, then all the elements in the
frequency Matrix can also.be obtained.
This procedure results in the state model rep~esentative
of the first order approximation drawn initially .. If, after
chscking tbe frequency response spectrum' computed from the
derived state model with that of the actu~l system 9 it is
found that the derived model is not adequate 9 then some
adjustments in·the first order approximation can be perfoirmed
easily in attempts to obtain a more adeciuate model.. This
procedure can be mechanized on a digital computer witb an
error criterion used ta determine adequate first Qrder
approximations and 9 thus 9 model frequency response spectr~mao
This chapter has summarized the various applicatiwns to
which the rreciuency Canonical State M~del rorm developed in
this dissertation are amenable .. Several details peculiar to
specific situati~ns are not included in this mbapter. How
ever adequate det~ils as well as illustrations are provided
in the chapters dealing with the particular applicationo

CHAPTER VII
CONCLUSIONS ANO RECOMMENDATIONS
It has' been demonstrated in this dissertation that
linear time invariant models for physical systems, whether in
differential form or some state-variable form, can be
expressed in the frequency Canonicjl rormo This State Space
Camonical F'orm can be used to display the frec:iuency charac
teristics inherent in all' dynalllic sy.stem~ in an explicit
manner. The particular procedure developed herein produces
the transmission bandwidths which are peculiar to the funda
mental modes of the system as well as a transmissibility
description of the modes. All this info~mation is obtained
without resorting to any sort of factorization of the system
characteristic and forcing functions whiclil 11 up t~ the p:res ...
ant, has been the only way to ascertain this system charac
teristic datao
Based om an exhaustive literature survey and the
experience of the author 11 to his knowledge no work has been
done with system frequency response spectrums in conjunction
with state space system modelso Tha;efore, the following
topics which are developed in this dissertation will con
tribute to extending the frontiers of knowledge in state
space analysis of linearv time invariant dynamic systemso
112

113
1. F"our procedures are developed by which presently
known classical control techniques can be used in
comjunction with state models to obtain the fre
quency response spectrums for dynamic systems fr~m
the representative mathematical models. These pro
cedures necessitate a rather extensive knowledge
and experience in frequency response techniques om
the part of the user.
2. A aew addition to the more familiar Jordan,
Rational, and Phase-Variable Canonical Forms in
state space is developed. This addition is the
Frequency Canonical Form for state-variable models.
3., Along with th.a f"requer:acy Canonical Form two methods
are developed ta obtain this particular Canonical
rormo The first method uses~ frequency transfor
mation and a direct pr~gramming procedure te pro=
duce the rrequency Canenical Form from the system'•
mathematical model in differential form~ The other
method involves tbe development of a Frequency
Transform matrixo This matrix directly transforms
a state model from Rational Camonical form to
F'requ.ertcy Canoni.cal f"ormo Since there are standard
tranbformations which will tramsform any state model
into Rational Canonical Form, this frequency
Transform Matrix will essentially transform any
system state model into the rrequency Camonical
Form.

114
4. The differential transition coefficient matrix of
the frequency Canonical F'orm is the uF'undamantal
State-Variable F'requemcy 1Ylatrix'0 • Explicit in ·this
matrix are first order approximations of the fre
quericy response spectrum of the modeled system.
s. The first order approximations explicit in the
"F'undamental State-Variable F'requeAcy Matrix" are
better approximations than the asymptotic approxima
tions which Bode' s 'Theorems produce. Also, it is
not necessary ·ta factor tll e psl ynornial s iFivol ved as
is the case in the use of Soda's Theorems.
6. The frequency Canonical Form provides extremely
us~ful app~icatisns of state models to the field of
dynamic systems analysis. This dissertation demo~
s'trates the usefulness of the F'requency Canonical
form in system analysis, synthesis, and c~mpensa
tiono
7. At present to the author's knowledge there has been
no method developed by which state models can be
derived from experimental datao The "fundamental
State-Variable F'requency M~trix~ prowides a means
for the ideatification of state models frQm experi=
mental frequency respons1e datao
All the contributions contained in this dissertatiorn
which are list~d above suggest much more research in the
rrequency Canonical State Space. Therefore 9 the autb~r

115
recommends the fellowiAg topics as areas wbictl will p)!;'odt.u:;e
significant contributions in state space analysis.
1. The phase shift associated wi tb tbe frequency spec
trums developed by the use of .the rrequency
Canonical rarm of the state model can be obtained
by Sode' s Tbeoreu~s (15). This phase shift spectrum
can also be derived by an explicit matrix display
af state model coefficient mat~ices.
2. Transformatioms for the state model which res~lt irn
more caAonical forms peculiar ta engineering disc!~
plines, for example state model forms specifically
for stability evaluation which will provide obvious
compensation possibilities, wmald contribute to tne
systems analysis field through the use of state
model techniqwes.
3. The extension of the frequency respo~se spectr~m
explicit display in state models for ne~linaar sys
tems will provide a maj~r con\rib~tion to system
analysis by state space techniques. The can~~ical
form of the state model for .this class of systems
cmuld conceivably be made up ef cesffi~ieat matrices
displaying explicitly all the j~mp frequencies
.pec:uiliar to any specif.le system whem ,exci tad by a
sim~soidal excitation.
4. Sigma plots which are employed iA. classical cGntrol
tbeory to determlriae the close):t loop real roots from '
the OJH!ll"!l loop transfer function by sttbsti t11Jting ... (J

116
for sin the open loop transfer fwnctioA can··possi
bly be cbaracterized by state model coefficient
matrices. These matrices could then be transformed
to dis.play the -0,losed loop poles explicitly withaut
reverting to the construction of sigma plmts.(16).
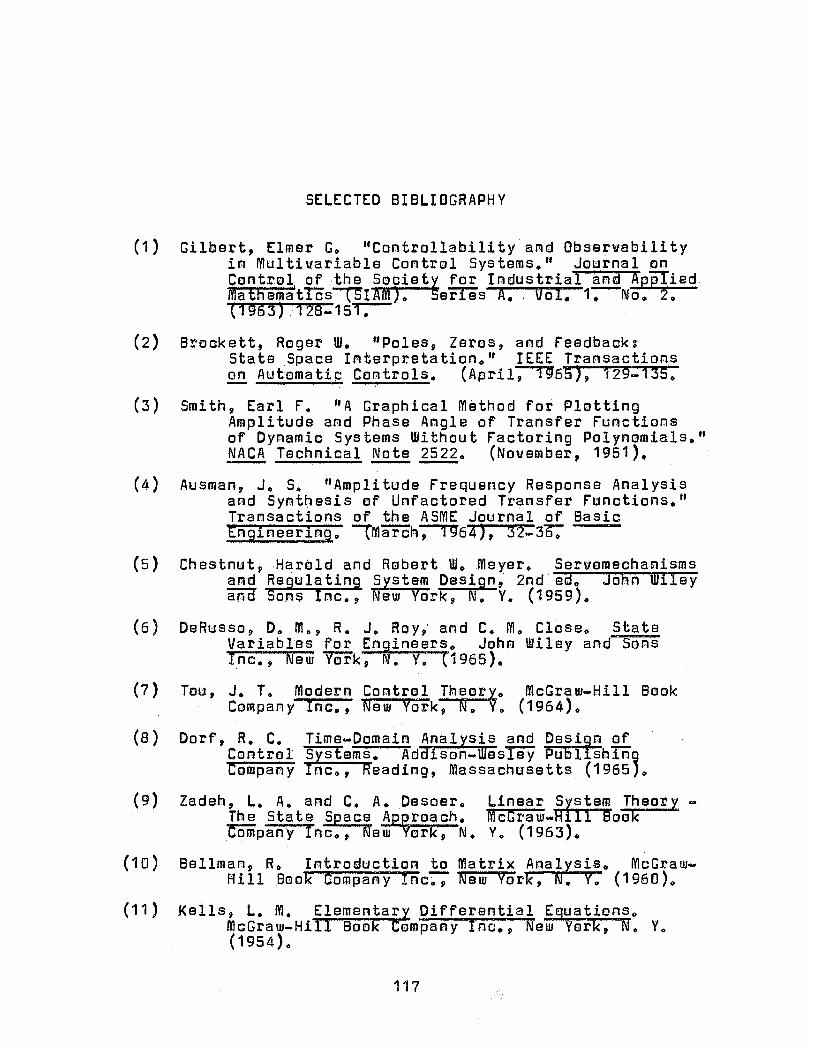
(1)
(2)
(3)
(4)
(S)
(6)
(7)
(8)
(9)
(10)
( 11)
SELECTED BIBLIOGRAPHY
Gilbert, Elmer G. "Controllabil~ty and Observability in fflultiwariable Control Systems." Jomrnal on Control; of the Societ~ for Industrial and Apj:i!ied fflatfiamat!cs-c]"IAM). aFies A •. Voi. 1. No. 2. (1963) ··128-15.,.---
Brockett, Roger w. "Poles, Zeros, and feed~ack: State Space Interpretation." IEEE Transactions .2!J. AutomatiJ: Controls. (April-;--,1'65), 129-135.
Smith, Earl f. "A Graphical Method for Plotting Amplitude and Phase Angle of Transfer functions of Dynamic Systems Without factoring Polynomials." NACA Technical Note 2522. (November, 1951 ). , ----- . ' - ---- -
Ausman, J. s. "Amplitude frequency Response Analysis and Synthesis of Unfactored Transfer functions." Transactions of the ASME Journal of Basic Engineering. -C-march;--rgsa), 32-30.
Chestnut, Harold and Rabert w. Meter. Servomechanisms and Regulating System Design; 2nd'ed. John Wiley arid Sons Inc., New York, N. Y. (1959).
DeRusso, D. M., R. J. Roy, and c. M. Close.· State Variabl~s for En~ineers. John Wiley and Sons Inc., New "Vi:irk, . ., Y. (1965).
Tou, J. T. Modern Contra! Theor,~ McGraw-Hill Book Company Inc., New York, N., • (1964).
Dorf, R. C. Time-Domain Analysis and Oesi9n of Control Systems. Adcilson-Wes!iy Publistit!i'g Company Inc., Reading, Massachusetts {1965}.
Zadeh, L. A. and c. A. Desoer. Linear srstem Theory -The State Space Ap,roacb. McGraw-A 11 Book . Company Inc., New ork, N. Y. (1963).
Bellman, R. Introduction !2, Matrix Analysis. McGrawHill Book Company Inc~, New York, N. v. (1960).
Kells, L. m. Elementary Differential Equations. McGraw-Hill Book Company Inc., New York, N. V. (1954).
117

( 12)
( 13)
( 14)
(15)
(16)
116
Chidambara, m1 Ro "The Transformatidn to (Phase~ Variable) Canonical F'ormo" IEEE Transactions on Au toma tic Centro lo ( October-;-,'J6S), 492-4950 -
Johnson, C. O. and W. Mo Wonham. "A Note on the Transformation to Canonical (Ph~se-Variable) F'orm." IEEE Transactions on Automatic Control. (July, 1"9'n)', 312-313.
Mufti, I~ H. "On the Reduction of a System to · Canobical (Phase-Variable) F'orm." IEEE
Transactions on Al,J tom a tic Con tro 1 o (A·pri 1, 1965), 2cl6-2 or.
Bode 9 Ho Wo Network·Analysis and F'eedback Am~lifier Design. D. Van Nostrand Company, Inc., • ew York, Kl. v. (1945) ..
Mcfh1er, D. T. 9 I. L. Ashk·enas, and C. L. Guerre. "A · Systems Analysis View of Longitudinal F'lying
Qualities. 11 Pligm_t .. Control Laboratory WrightPatterson AF' s; ·ohio, WADD TR 60-43. (January, 1960). · - - - -

APPENDIX A
STATE-VARIABLE DIAGRAMS tROM DIRECT
PROGRAMMING METHODS

STATE-VARIABLE DIAGRAMS FROM DIRECT
PROGRAMMING METHODS
There are two basic direct programming methods which
produce vector state models in well known canonical formso
The first of these programming methods is Tou•s direct pro
gramming method from which the resulting state model appears
in Phase-Variable Canonical Form (12, 13, and 14). The
Phase-Variable Canonical Form is merely the transpose of the
Rational Canonical Form. The second direct programming
method results in Rational Canonical Form state models.
The particular feature existing in these forms for the
state models is the explicit display of the coefficients
associated with the characteristic equation and the coeffi
cients associated with the form of the forcing function.,
The basic difference in the state models produced by these
direct programming methods, other than the rearrangement of
the elements in the differential transition ~atrix, is the
explicit display of the forcing function coefficients.
The general mathematical model to which these methods
are applicable are single input - single output linear sta
tionary ordinary differential equationso These system
models can be expressed in the following formo
120

121
0 0 0 + b \I (J (A-1)
tor a physically realizable system mis always equal to or
less than n.
Tou•s Direct Programming Method
Tau's direct programming method works with the system
transfer function which can be found by transforming Equa
tion (A-1) by using Laplace Transformations. The system
transfer function resulting is
y (s) = b .. m s. m/
b m-1 + s . m-1 + • • • + b0
v (s) (A-2) + ••• + ao
-n Dividing both the numerator and denominator bys produces
b ,, m-n .b. "m-n-1 , . b· ,-.··· .. n ms + ffi. 18 .· ,t,•oo + ·oS .
= . . -1 - _2 . ..n v(s) (A-3) an+ an-1$ + an-2$ + Ooo + aoS
y(s)
If the following substitution is made into Equation (A-3)
e (s) = v{s) (A-4)
the resu 1 t is
y(s) = (bmsm-n + bm_ 1sm-n-1 + ••• + b0s-n) e(s) (A-5)
Equation (A-4) is equivalent to the following
e(s) ..... -The state model diagram for this system can be drawn by
using Equations (A-5) and (A-6). The state model diagram
for this general linear stationary single input - single

output system is shown in F"igure A-1. The vector matrix
state~variable model resulting from this figure is shown
below form= n-1 •
• 0 1 0 0 0 0 X1 • • Xt • 0 0 1 0 0 0 x2 • • x2
• • • • • • 0 •
122
0 = • • • 0 0 0 + 0 V (A-7)
0 • • .. 0 0 • 0
0 0 0 0 1 Cl xn-1 xn .. 1
.. ao a1 an-1 1 xn -- -- 0 • 0 • xn -an an an an
•
0 (A-8)
0
The standard way the characteristic equation is
expressed is in a normalized form. The normalization is, in
general, performed with respect to the highest derivative ..
In other words the entries in the differential transition
matrix in Equation (A-7) are the negative of the coeffi
cients of the characteristic pdlynomial for the system.
This form of the differential coefficient matrix is called

-1 s els
xn
-2 I s el s J I ----x I
n-1
-n+ 1 ,. S 8tS
x2 x, -n ( s e_s
Figure A-1 0 State Model Diagram for Tou•s Direct Programming Method ~
I',.) c.,:i

124
tne Phase-Variable Canonieal rorm. The entry in the column
matrix multiplying vis the normalizing coefficient. As
seen iR Eq~ation (A-8) the coefficients of the forcing func
tion are displayed explicitly in the output matrix.
Rational Canonical Form Direct
Programming method
The Ratiomal Canonical rorm direct programming method
works directly with the system mathematical model; nowevar,
for convenience, the differentials are usually replaced by
the operator p where pn = d"/dt". Performing this substitu
tion on Equation (A-1) produces n n-1 a p y + an .. 1P y + 0 •• + a1py + afly = n
b p m
'ii m + m-1
bm-1P V + ••• + b1pv + b0v (A-9)
If [quation (A-9) is solved for the ~eo~th order terms, the
result is
ror m = n, Equation
b0 v - a0 y =
Form n
(anpn + an-1Pn-1 + ••• + a1p)y
- (b pm+ b 1pm-1 + ••• + b1~)v (A-10) m m-(A-10) can be rewritten as
"( ) n-1( P any - bmv + P an-1Y -
+ ••• +. p(a1y - b1v)
n n-1 amp y + an-1P y
m+1 me ) + ••• + am+ 1P , + p_ a~y - bmv
+ ••• + p 2(a 2y - b2v) + p(a1y - b1v) (A-12)
The state model diagram for Equation (A-12) is sbown in
F'igure A-2.

~--,r---------.-- ----------,
y
n
--- ---- - - - - - ----------------
q =
=
bo -v an
n p y
ao - -y
an
an-1 n-1 + ·--p y + •••
an am+1 m+1
+ --p y an
m[am + p any bmv]
an
+ ••• 2[a2 b2 J + P any - anv [
a 1 b1 J + p -y + -v an an
Figure A-2o State Model Diagram for the Rational Canonical form Direct Programming Method
~
N U1

The state model derived from the diagram shown in
rigure A-2 is shown below.
• 0 0 0 0 ><1 •
• 1 0 0 Cl x2 •
0 0 • •
xm = • 0 0
0 • •
• 1 xn-1 •
• 0 0 xn • " "'
0 ao --an
0 81 --an
" •
am 0 --a n
• • . a : n, . .:. 2
(].;;.--a n
1 8 n-1 --an
X1 !
><2
•
xm
•
xn-1
xn
0
•
• X n
+
bo all
b1 -an
•
b m V
an
0
•
CJ
126
(A-1 3)
(A-14)
The elements in the right hand column of the differern
tial transition matrix in Equation (A-13) are the negative
of the coefficients of the charac~eristic polynomial. As
discussed previously, the division by a represents the nor-n ! .
malizing of the characteristic polynomial with respect to

127
the highest derivative. This form of the differential
transition matrix is called the Rational Cano~ical rorm.
The coefficients of the forcing function appear implicitly
in the input mat~ix. An explicit display of these coeffi
cients is easily obtained by removing the normalizing coef
ficient used to normalize the characteristic polynomial.
128

APPENDIX 8
RESONANT PEAK TRANSMISSIBILITIES
128

RESONANT PEAK TRANSfflISSIBILITIES
In the development of system fre~uency response spec
trums by the use of the rrequency Canonical rorm the trans
missibility at the natural undamped mode frequency is
obtained explicitly. However~ this value of transmissi
bility is not the maximum that will occur. The actual ma~i-
mum occurs at a lower frequency. This frequency where tAe \
actual maximum ,ccurs is a fu~ction of the damping existing
as well as the ~atural un~amped mode frequency. Specifi
cally, the frequency where the maximum transmissibility
occurs is
where
(8-1)
1t·. = damping ratio : I
'CA.JP= frequency of maximum transmissib!lity
·in = natural undamped mode frequency
1 he frequency of maximum transmissibility .has been cor-
related with the natural undamped mode frequency and the
ratio 1/a. Tnis correlation is shown in F"igure 8-1. Tbis
figure can be utilized for the entire frequency range. Tbe I i
range ~f 1/a can be varie~ to encompass almost all possible
values of 1/a which will occur. ror ranges of 1/a from
.17857 to 1. 7857 the frequency range covers frequencies from
129

fl) 1J C 0 0 a,
U)
' fl) C a, ....
1J a,
0::
... I
.JI. 0 ... •
Cl.
3
130
f"igure 8-1. Mode Damping Characteristics

131
0 to 100 A shift in the range of 1/a to the range 107857 to
17.857 shifts the frequency range to the range Oto 1.0.
Therefore, the scale designation on the abscissa is
.! • 10k a
The scale designated on the ordinate is
w " 1ok-1 p
(B-2)
(8-3)
and the natural undamped mode frequency lines within the
graph are
w " 1ok-1 n
Orace the range of W n has been selected such that the
(8 ... 4)
required value of wn is within the range, then the appro-
priate value fork is used to establish the scale of tbe
abscissa. The result of the use of Figure B-1 is the fre-
quency cf maximum transmissibility,,
The next thing which must be obtained is the value of
maximum transmissibility,, This is possible by the use of
figure 8-2 in conjunction with Figure 8-1. Within the graph
of figure 8-1 are lines of constant damping ratio',, Each
point determined by the values 1/a and W. bas an associated n
value of~" With the value of S fI'--0m Figure B-1, F'!gure 8-2
can be entered and a AT in decibels obtained. This incre ...
ment in transmi$>Sibility is .an increment which when added to l
the transmissibility at the natural undamped mode frequemcy
will produce the maximum transmissibili ty. As indicated
previously, the maximum occurs at lc)p" 2 ~ ~ 4 .El.+ 100y = 2v dt dt
(8-5)

.B
~
~ .6
., ,,,.~ ,,,,.,. /
/ .
.4
' • 11
V /
,,
V ~
_...
/ /
/ V ,,.
.:2
.OB V
/"
• 06 ./' ;,,v
.04
.02
.. os ., , .,6T - Decibels
·'-"t.3
F'igure 8-2. Resonant Peak Tran$.m_:tssibili ty Diffe;ential N

133
The vector matrix state moclel ia F',reqaency Canonical F'orm is
w2 z' 0 100 21 2 = w2·
+ 'II
z• 4W -z2 0 2
Thea the transmission bandwidth boundaries are O and
The Spectrum Band-pass matrix is
s = a 1 go
W 2 4W 22
(B-6)
(B-7)
•
(B-8)
F'rom Equatiem (8-8) the transmission asymptote function for
the low frequency rang~ expressed in decibels is I
. 100 - 20Log10 2 = 2BLog 10 .02 = 33.99db (B-9)
The transmission asymptote function for tbe high frequency
range is ... 2 L w
- 20 0~10 2 = 20Log10 2 - 20Log 10 lc.J 2
' 2 6. 02 - 20Log10 W (B-10) =
The intersection of these two transmission asymptote func
tions is
10
(B-11a)
(B-11b)
The magnitude .of transmission asymptote fuaction
-20Log10 4W/2 at W = 10 is snown in Equatiom (8-12).

134
T = 26 0 02db (B-12)
The transmissibility spectrum as well as the asymp
totic approximation generated from the transmission asymp
totic.functions are shown in figure 8-3.
The value of 1/4 is used to enter figure B-1 along the
abscissa and a frequency w = 1 O is used wi tnin the graph. n
· f"or W · :: 10 tbe value of k is 1. Employing this factor to n
obtain the correct abscissa location the value of frequency
where maximum transmissibility occurs is W = 9.59. lhe p '
damping ratio is ~ = o. 2. With this value of damping ratio
the incremental increase in transmissibility obtained from
F"igare 8-2 is ~ T = o. 175 decibels. The maximum transmissi
bili ty occuring at W = 9o59 radians per second is
Tmax = 26.02 - o.175 = 25.845db
as shown in figure 8-3.
(B-13)

0) ... O> .0 .... 0 m
0
t-
--20
-40
~60
l
AT t ' a,w
_ · · _ _ I,, ?-20Log10 ~
! I I I I/ 'I -- 0 . TJ::f'~"!- ,. I : I :_j_. r-- c--1---- , -1 ! (tt," \
.20Log10 ~ * WP --:2.:..: I ' i 0 . I I I' ', . Jn4 ~,,~ ",I .
• c.,2 ~ -20Log 10 2 ~~
bo . ' '\:"\,. ~
. '\: ~ ... ~
~ 2 4 6 8 10 20 40
w - Radians/Seconds
rigure 8-30 Illustration of Resonant Peak Determination
60
~
c.,.:i U1

APPENDIX C
STABILITY EVALUATION roR THIRD ANO
F'OURTH ORDER svs.n:ms (4)
136

STABILITY EVALUATION rOR THIRD AND
. FOURTH ORDER SYSTEMS (4)
The stability of systems wbase characteristic polynp~
nomials are third or fourth arder can be determined by merely
inspecting the Spectrum Band-pass Matrices. As is obvious
to some extent the degree of stability can be estimated by
applicable peak transmissibility calculations. This appendix
deals primarily with absolute instability and the determina
tion of peak transmissihility for third and fourth order
systems which are very lightly damped.
To illustrate the primciples involved in tnis stability
evaluation the freque~cy spectrum for, the following system
state m~del in Frequency Canonical Form is shown in Figure
C""'1•
z; m CJ ao 21 0
a w3 3 z• 2 = a w3
3 [) a,w z2 + b1W V (C-1)
z' 3 CJ a w 3 3 a w 2
2 -z3 Cl
(C-2)
137

3 a3w
-20Log10 b.j°w
Ill ~-. ',<1 -,- _J.-1---t-n ~ '1 '
!! I ~ '.
] I ~~~'*{~~~ I I I I _Jl-+-1 +I mr I I 11 I . l-~:'.t, ~,· ,
figure c-1 .. W - Radlans/Seconds
Illustration of Stable System rrequency Response Spectrum Transmission functions
~T I~,
....
...I> (.,;I (D

139
Tbe Spectrtam Band-pass Matrix for tbis state model is
shown in E~uation (C-3).
s = (C-3)
Tn e natmral undamped mede fr·equ e11ay associated with the
oscillatory system mode occurs where
or
2 azw . 6 w .
1 (C-4)
(C-5)
Tbis freqiaancy is dete.rmined by tl:le intersection mf tnese
twm transmission asym~tote functions crossing as sbown in
f"igure C-1.
t ~ 3/ Suppose that ne asymptote fttnction a 3W c1w is
greater thaA the asymptote f1:1nctimn a 1W/brW at the fre
quenl';y W = ~a0Ja 2• Tt.is C?Dmdi tion is shown in F"igure c ... 2.
Matn.ematically, tbis indicates that
(C-6)
or
(C-7)
which is the same as
(C-8)

OJ "Q C 0 u m It)
"';jj-c Ill
---··:a
1110~1+-+-W-...
Cl i r-~~-t~-+~-i-~1--1
syaqJ:iea - J.
Ill a: I
3
•· N 0
u Q) ,.. ::, Ol ....
140
la.. '

141
However, oae of the criterioms for stability developed by
Routh is that tbese ~oefficients of the characteristic poly
nomial in tne aeeve combination be greater tban zero. ·Tnis
means tbat the system is a non-minimum ptrase system and,
tnerefore, tne frequency spectrum does not exist.
Systems wbicb barely meet the stab!li ty criterion
reqt:t!re special but quite logical consideratioA ln order to
estimate tf:!Je resonance values ef transmissibili ty. The fre-·
quency spectrum shc:nin in F"igttre C-3 represents such a syst"m•
At the frequency W = Va1Ja3 tbe asymptote functions \ 3
a 1 W/~ 1w and a 3 w /b1W are equal but 180 degrees et:tt of
phase. Therefore, these two terms cancel one anotber produc
ing t~e value of the transmissibility as shown below.
T = 1 {C-9) a a .w 2
0 2 61w - -s1-w-. -
and specifically
b1 ~ a2a1
a --0 . a 3
{T) W ·;: = (C-10)
This equation indicates the boundary of stability since the
denominator mwst be greater tman zere. This sp~cial trans
mission resonance cal cu la tion is reu11Jired only wheR two pairs
of transmission asymp·tste ftmctions are equal at the same
freciu ency~
In gen~r~l, most fourth order systems can be handled in
exactly tbe same way as discussed in this appendix.

I
I-
j
T db = 20Log1 O m l+-t- .-+--+-t-H--ru b1 83
a, ao-a2a3
\ s -1----t----+----t--+---t---t---t--t
~ ',..,,1 -20Log10 •,w' ~~nl .... I
¥' '-i,~11111 W - Radi~ns/Seconds
Figure C-3o Illustration of Vary.Lightly Damped System Transmission Functions and Calculation of Peak Transmissibility
,.;,a.
~ N

APPENDIX D
PRINC,IPLE:S or. SJATE:-VARJ.ABLE _IYIODE:LING
143

PRINCIPLES or STATE-VARIABLE fflODELING
Al though s-ta ts-variable anal y,sis cu, be extended te
erncom~ass mmst systems describable )y ordinary differe~tial
equatiems, the development cmllltaimed in this appem~ix is for·
sys.tams wtdcb fall .. into title class called linear time invari
ant. This class of ordinary differential equations cam be
illustrated by th• following second order model in differen
tial form.
(D-1)
!he basis mf state~variable modeling is the ~xpressioa sf
Equation (D-1) as a system ef first order ardirnary differen
tial equations. This expression of state models is obtained •'
by making algebraic substitutions wbicn consist a,f limear
combinations of the zeroth, first? seoend, and so fertb
derivatives appearing in the differential form af the system
model. These algebraic sabstitutians defi~e tbs s~ates or
state-variables of the system. In .tbe case of a simgla
infl)ut - si1t1gle output system, tll!s s-ubst! tutiom is pe.rt'ormed
as sho_wn belew 0
X 1 = y (o ... 2a)
)(2 = !1 • * (D-2b)
• d2 (D-2c) "3 = x2 = ~
144

145
If this algebraic substitution is perfmrmed ea Eqmatiom
(D-1) tbe following system of first order equations results
• £lx 1 + x2 + Ov
- a9x1 - a1x 2 + bav
(D-3a)
(0-3b)
y = x1 .~ ox 2 + ~v (D-3c)
EquatioAs (D-3) can be written in tbe following umreduced
state-variable fmrm
1 El B
0 a2 0
o a 1
Ill
1
-ao -ao 1 B
P w • Q.x·+ R v ... _ -...- --
+
(D-5) Equation (D-5) is the generalized umreduced state space model
''
for time invariant linear system wi tn multiple inputs and
multiple outputs.
Equatiens (D-3) can be grouped wit~ the &Cfuatioms
involving the der~vatives af the state-vari.ables in cute group
and tne equations imvolv!mg t.ne outputs in the o th~'r ~ Tbe
result of this groupimg written in state-variable f~rm is
the following reduced model •
• 0 1 fJ X1 X1 • ao a1 +. V
0 b x2 ,.._ -- x2 a2 a2 0
(D-6a)
j

This system of eqttations ls writtem in general form for a
multiple input - multiple oatput system im tme fellowiRg
state-variabla •otatiom.
146
Jc = A X + 8 ., (D-7a) - -l. z C X + 0 V (D-7bJ-- - - -
The coefficient matrices shown in this appendix contain all
canstaRts. These constant matrices are characteristic of
· time irnvariaAt linear state space system models.

VITA
James Otto Mateus
Candida ta for the De,gree of
Doctor cif Philosophy
Thesis: THE F'UNDAME:NTAL STATE-VARI ABLE F'REQUENCY MATRIX
Major F'ield: Engineering
Biog.raphi cal:
Personal Oatas Born in Lincoln, Nebraska, September 26, 1933, the son of Stanley E. and Rose Matous.
Educations Attended grade school in Omaha, Nebraska, Wichita, Kansas, and Little Rock, Arkansas; graduated from Wichita High School North in May, 1952; received the Bachelor of Science degree and the Master of Science degree from Wichita State U~iversity, with i major in Aeronautical Engineering, in June, 1957, and June, 1963, respectively; completed requirements for the Doctor of Philosophy degr~e in August, 1966.
Professional Experiences During the summer of 1956, was employed as an aerodynamicist at Beech Aircraft Corporation, Wichita, Kansas; during the s~~mer of 1957 was employed as a missile engineer at Douglas Missile Division, Santa Monica, California; from Ssptember, 1957, to August, 1961, was employed as an aerodynamicist engineer at Beech Aircraft Corporation, Wichita, Kansas; from August, 1961p to September, 1963, was employed as an Associate Research.Engineer "A" at The Boeing Companyp Wichita, Kansas; from September, 1963, to May, 1964, was employed as a research assistant in the F'luid Power and Controls Laboratory at Oklahoma State University, Stillwater, Oklahoma; during the summer of 1964, was employ~d as an aerodynamicist at The Boeing Company, Wichita, Kansas; from September, 1964, to September, 1966, was employed as a research project leader in the F'luid Power and Controls Laborator~ at Okiahoma State University, Stillwater, Oklahoma.
Professional Organizations: A Registered Professional Engineer in the State of. Oklahoma, a member of the .Oklahoma Society of Professional Engineers, and a member of the Pi mu Epsilon Honorary Mathematics rraterni ty.