Model convergence and state variable update in forest gap models
12
ELSEVIER Ecological Modelling 89 (1996) 197-208 ElOlOGllAl mODELLInG Model convergence and state variable update in forest gap models Harald Bugmann a,*, Andreas Fischlin a, Felix Kienast b a Systems Ecology, Institute of Terrestrial Ecology, Swiss Federal Institute of Technology Zurich (ETHZ), CH-8952 Schlieren, Switzerland b Swiss Federal Institute of Forest, Snow and Landscape Research, Department of Landscape Ecology, CH-8903 Birmensdorf, Germany Received 10 March 1995; accepted 16 May 1995 Abstract During the last 25 years, models of the JABOWA/FORET type ('gap models') were increasingly applied to study forest succession. By adding more and more details, they have grown to rather complex systems, but little is known about the importance of the numerous ecological processes included in the models and about their exact mathematical properties from a systems theoretical point of view. Based on the stochastic gap model FORECE developed for European forests we analysed two generally relevant aspects of gap models: (1) the sample size needed to reliably compute the statistical properties of the model behaviour; (2) inconsistencies in the mechanism used to update the state variables. It was found that 150-200 simulation runs are required to warrant the convergence of the average species-specific biomass values. This sample size is considerably larger than that used in most previous studies. The analysis of the mechanism used for updating the state variables revealed that it does not conform to the requirements of systems theory. A new consistent update mechanism is presented, which even leads to more efficient calculations. While the FORECE model produces only minor differences of the simulated species-specific biomass values when using the old vs. the new update mechanism, the frequency distribution of stem numbers may be affected significantly. It is concluded that rigorous systems theoretical and statistical investigations of the properties of forest gap models are required to render the application of those models more robust. It is proposed to revise the update mechanism for the state variables in the existing forest gap models as outlined in the present study. The design of future simulation studies with these models should be improved so as to sample sufficiently large numbers of about 200 simulation runs. Keywords: Forest ecosystems; Statistics; Succession; Systems theory; Vegetation dynamics 1. Introduction • Present address: Potsdam Institute for Climate Impact Research, P.O. Box 60 12 03, D-14412 Potsdam, Germany. Fax: (+ 49-330 288 2600; e-mail: [email protected] Forests are highly complex ecosystems, and field investigations on their long-term behaviour are hindered considerably by many stochastic in- 0304-3800/96/$15.00 © 1996 Elsevier Science B.V. All rights reserved SSDI 0304-3800(95)00135-2
Transcript of Model convergence and state variable update in forest gap models

ELSEVIER Ecological Modelling 89 (1996) 197-208
ElOlOGllAlmODELLInG
Model convergence and state variable update in forest gapmodels
Harald Bugmann a,*, Andreas Fischlin a, Felix Kienast b
a Systems Ecology, Institute of Terrestrial Ecology, Swiss Federal Institute of Technology Zurich (ETHZ), CH-8952 Schlieren,Switzerland
b Swiss Federal Institute of Forest, Snow and Landscape Research, Department of Landscape Ecology, CH-8903 Birmensdorf, Germany
Received 10 March 1995; accepted 16 May 1995
Abstract
During the last 25 years, models of the JABOWA/FORET type ('gap models') were increasingly applied to studyforest succession. By adding more and more details, they have grown to rather complex systems, but little is knownabout the importance of the numerous ecological processes included in the models and about their exactmathematical properties from a systems theoretical point of view.
Based on the stochastic gap model FORECE developed for European forests we analysed two generally relevantaspects of gap models: (1) the sample size needed to reliably compute the statistical properties of the modelbehaviour; (2) inconsistencies in the mechanism used to update the state variables.
It was found that 150-200 simulation runs are required to warrant the convergence of the average species-specificbiomass values. This sample size is considerably larger than that used in most previous studies. The analysis of themechanism used for updating the state variables revealed that it does not conform to the requirements of systemstheory. A new consistent update mechanism is presented, which even leads to more efficient calculations. While theFORECE model produces only minor differences of the simulated species-specific biomass values when using the oldvs. the new update mechanism, the frequency distribution of stem numbers may be affected significantly.
It is concluded that rigorous systems theoretical and statistical investigations of the properties of forest gapmodels are required to render the application of those models more robust. It is proposed to revise the updatemechanism for the state variables in the existing forest gap models as outlined in the present study. The design offuture simulation studies with these models should be improved so as to sample sufficiently large numbers of about200 simulation runs.
Keywords: Forest ecosystems; Statistics; Succession; Systems theory; Vegetation dynamics
1. Introduction
• Present address: Potsdam Institute for Climate ImpactResearch, P.O. Box 60 12 03, D-14412 Potsdam, Germany.Fax: (+ 49-330 288 2600; e-mail: [email protected]
Forests are highly complex ecosystems, andfield investigations on their long-term behaviourare hindered considerably by many stochastic in-
0304-3800/96/$15.00 © 1996 Elsevier Science B.V. All rights reservedSSDI 0304-3800(95)00135-2

198 H. Bugmann et al. / Ecological Modelling 89 (J996) 197-208
fluences as well as the spatial and temporal scalesinvolved. Ecological modelling has been increasingly applied in forest science to overcome thelimits imposed on field investigations and to makelong-term projections of forest dynamics possible(e.g. Shugart et al., 1973; Soliins et al., 1976;Shugart, 1984). Another important role of modelling is the synthesis of information and thegeneration of hypotheses on the systems understudy in order to gain a better understanding ofimportant ecological processes.
The forest gap model approach has proven tobe useful in many respects (ct. Shugart, 1984).The first models (Botkin et al., 1972) have beenrather simple, but subsequent research has led tomore complicated models, culminating in modelsincluding detailed information such as soil processes (Pastor and Post, 1985), phytosociologicalconcepts (Kienast, 1987), explicit modelling oftree crown structure (Leemans and Prentice,1989), and detailed treatment of ecophysiological(Friend et al., 1993) and biophysical processes(Bonan and van Cleve, 1992; Martin, 1992). Theincreasing complexity of forest gap models mayhave helped to make detailed and presumablymore accurate projections of forest succession,but it has little furthered the analysis of forests tobetter understand their dynamics.
Forest gap models are stochastic models.Therefore, it is a standard practice to performmany independent simulation runs and to average the resulting species-specific biomasses andstem numbers. It is evident that the choice of anappropriate sample size is important in order tobe able to derive typical model behaviour. Moreover, many studies involving forest gap modelshave dealt with the assessment of the effects of achange in environmental factors, such as air pollution or climate change (e.g., Solomon et al.,1981; Shugart and Emanuel, 1985; Solomon, 1986;Dale and Franklin, 1989; Kienast, 1991; Urban etal., 1993; Bugmann, 1994). Due to the complexityof gap models, which refutes any analytical approach, significant differences between two setsof model runs can not be derived easily. Are thedifferent results from two simulation experimentscaused by the different environmental conditions
or merely by the stochastic nature of the model?Hence the convergence behaviour of the outputof a forest gap model is crucial for the analysis aswell as the application of these models.
Although ecological models usually are built ina straightforward way oriented toward someproblem of theoretical or practical relevance, theyare inevitably based on systems theory, e.g.through the choice of either a discrete or a continuous-time system, which imposes certain restrictions on the formulation of equations as wellas the estimation of parameters. A consistentformulation and use of an ecological model has toadhere to the formal restrictions imposed by theunderlying systems theoretical approach; otherwise incorrect or completely artificial simulationresults may be obtained. The use of ad-hoc simulation tools for studying complex systems increases the likelihood of obtaining numericalartefacts due to inconsistencies between the numerical implementation and the true mathematical properties of the model (Cellier and Fischlin,1982; Cellier, 1984; Fischlin, 1991).
The investigations presented in this paper arepart of a larger effort aimed at providing thesystems theoretical basis for simplifying forestgap models and to make them accessible to adetailed statistical and ecological analysis (cf.Bugmann, 1994). Focusing on the FORECE model(Kienast, 1987) as a case study, we first investigate the convergence of model output, i.e. howmany simulation runs have to be performed toallow for meaningful calculation of statisticalproperties of the model output. We then examinethe state variable update in the model as a firststep toward model simplification and present amore efficient forest gap model for central European conditions. The findings from the case studyare generalized by comparison with other studieswhere gap models were developed and/or applied (Botkin et al., 1972; Shugart and West,1977; Pastor and Post, 1985; Solomon, 1986; Leemans and Prentice, 1989; Martin, 1992). Ouranalysis reveals that many forest gap models,although formulated as discrete-time systems, donot conform to the formal requirements definedby systems theory.

H. Bugmann et al. / Ecological Modelling 89 (1996) 197-208 199
2. Methods
2.1. Modelling approach
The forest simulator FORECE (Kienast, 1987)used for the present study is a gap model of theJABOWA/FORET type (Shugart and West, 1980)based on previous models of Botkin et ai. (1972),Shugart and West (1977), Dale and Hemstn~m
(1984), and Pastor and Post (1985). A detaileddescription of the model is given in Kienast (1987)and Kienast and Kuhn (1989a). The simulatorruns on the basis of 1/12-ha patches, which isequivalent to forest succession models developedfor the Appalachian region of the Eastern UnitedStates (Shugart, 1984). Stand development on aforest patch is simulated by calculating establishment, growth, and death of individual trees as amixture of deterministic and stochastic processes.To obtain forest development at the ecosystemlevel, the successional patterns of patches frommany simulation runs are averaged. This conceptis supported by various plant succession studieswhich show that a forest ecosystem may be described by the average growth dynamics of amultitude of patches with different successionalages (Watt, 1947; Bray, 1956; Curtis, 1959; Forman and Godron, 1981).
Forest succession is driven by extrinsic andintrinsic variables of the species and the stand.Variables extrinsic to the stand are summerwarmth, spring frost, soil moisture, and browsing.Variables intrinsic to the species are maximumpotential growth rate and mortality, while shading and crowding are variables intrinsic to thestand. Each model starts with a randomly selected number of saplings in a patch to simulatetree establishment. Unfavourable environmentalfactors and site conditions control the exclusionof species from the establishment process.
Growth of each individual tree is simulated bydecreasing the maximum potential diametergrowth rate at its respective age by environmentalfactors that are less than optimum. To do so,growth multipliers for each limiting factor arecalculated, and the maximum growth rate is reduced according to the difference between thesmallest growth multiplier and its optimum value
(often called 'Liebig's Law of the Minimum').The form of the maximum growth equation issimilar to a logistic equation; it is based on theassumption that annual biomass increment is proportional to the amount of sunlight the leavesreceive (Botkin et aI., 1972).
Death of the trees is determined by a Poissonprocess parameterized by allowing only 1% of allindividuals to reach the maximum physiologicalage, which is a model parameter. Furthermore,trees are also removed from the patch if they aregrowing slower than a certain threshold of relative or absolute minimum growth.
The growth curve for optimum diametergrowth of each species was obtained by fitting themaximum growth equation to data from yieldtables (Kienast, 1987). The species-specific parameters describing shade tolerance, soil moisture requirements, maximum age etc. were derived from silvics books and phytosociologicalvegetation descriptions (Amann, 1954; Mitscherlich, 1970; Bernatzky, 1978; Ellenberg, 1986).
2.2. Model convergence
At a given point in time species biomass andthe numbers of trees sampled from multiple simulation runs of forest gap models are rarely normally distributed (Bugmann, 1994). Therefore, thecoefficient of variation (Zar, 1984) does not provide a robust estimate of model convergence. Forhighly skewed distributions, a more robust statistical measure such as the quotient q is needed(Eq. 1): the interval between the 10% and the90% percentile (P90 - PIO) is a robust measurefor the range of the samples, and the median(med) characterizes their location. Note that qshould converge toward a non-zero value as thesample size approaches infinity.
P90 - PlOq = (1)
med
For the present case study we chose the siteBern in Switzerland (Kienast, 1987); it is representative of beech forests, which cover a largearea of central Europe (Ellenberg, 1986). Thesite-specific parameters were taken from Kienast(1987). The q value was calculated for three key

200 H. Bugmann et al. / Ecological Modelling 89 (J996) 197-208
(2)
Unfortunately, many gap models work on stateand auxiliary variables which are continually being updated (e.g. Botkin et aL, 1972; Shugart andWest, 1977; Pastor and Post, 1985; Kienast, 1987;Leemans and Prentice, 1989). For example, theFORECE model (Kienast, 1987) features the procedure sequence BIRTH, GROW, and KILL, whichremoves some of the saplings added during thesame time step, although they would formallyenter the system only in the next time step (Fig. 2left). Moreover, some gap models repeatedly calculate auxiliary variables within one time step,such as the leaf area index, although they wouldformally depend only on x(t) and u(t) (Kienast,1987). --
Given states and inputs at time t, the followingcomputational sequence results in a correct updating of the new states at time t + ~t: (1) determining which trees will die, (2) calculating the
x2(t+M)
=f(XI(t+~t),X2(t),... ,xn(t),~(t)) (2')
whereas the state transition function for statevariable x I is formally correct, since
XI(t+~t) =f(x l (t),X 2(t),'" ,xn(t),~(t))
=f(~(t),~(t») (2")
2.3. State vector update
~(t + ~t) =f(~(t),~(t))
Typically forest gap models are implementedas discrete-time models (t = 0,1,2, ... ) with a timestep (~t) of one year (d. Bugmann, 1994). Thismeans that establishment, growth and death oftrees must depend only on the current state vector x(t) and input vector u(t) (Zeigler, 1976;Fischlin et aL, 1994; Eq. 2). -
Eq. 2 implies that in the implementation ofsuch a model no parts of the state vector must beupdated continually during the calculation of asingle time step. For example, if a state variableXl currently has the value xl(t) and is updatedimmediately to xl(t + ~t) before the new valuexit + at) of another state variable x 2, being afunction of Xl' is calculated, Eq. 2 is violatedbecause
500400
Fagus silvatica biomass
100
.........................................................................................................
10
0.5
-0.5 +---..-,....--.-,..---.--r-~-r-....---.
a 200 300Lag (years)
Fig. 1. Typial autocorrelation function (ACF) in the forest gapmodel FORECE V1.0, showing the ACF of the biomass ofFagus silvatica at the site Bern (Switzerland). The dotted linesindicate the 95% confidence limits for ACF = O.
species, i.e. Abies alba with a low abundance atthe beginning and intermediate abundance during the later stages; Fagus silvatica with highabundance at the beginning and intermediateabundance after about 600 years; and Ulmusscabra, a species with low abundance throughoutthe succession (Kienast, 1987; plant nomenclature is according to Hess et aL, 1980). The analysis was performed at three disparate points intime, i.e. the simulation years 400, 800 and 1200,where autocorrelation becomes negligible (Fig.1).
Since the original implementation of theFORECE model (Kienast, 1987) does not supportflexible simulation studies, e.g. it does not allowfor performing more than 50 simulation runs at atime, it was re-implemented using the simulationsoftware ModelWorks (Fischlin et aL, 1994) withinthe RAMSES simulation environment on AppleMacintosh computers (Fischlin, 1991). Hereby themodel had to be translated into the programminglanguage Modula-2 (Wirth, 1985; Wirth et aL,1992), which facilitated the access to the programming library DialogMachine (Fischlin et aL,1987) supporting interactive simulations in a research situation. With this model version, calledFORECE V1.0, we performed 4000 simulation runson an Apple Macintosh II computer. From thisdata base random samples of size n were takento calculate the quotient from Eq. 1. The procedure was repeated 10 times for each of the following sample sizes: n = 5, 10, 25, 50, 75, 100,125, 150, 200, 250, 300, 350, 400. Finally, thestatistical properties of the full sample of 4000runs were calculated.
~
uce 0.0

H. Bugmann et al. / Ecological Modelling 89 (1996) 197-208 201
Mortality Establ ishment
separate storage location, which holds the newstate vector x(t + at); all updates to the statevector x(t) must be deferred and reserved to theend ofill time step calculations (e.g., Fischlin etal., 1994).
2.4. Quantitative comparison of model versions
Fig. 2. Sequence of procedure calculations as incorporated inthe simulation model FORECE V1.O (left) leading to systemstheoretical inconsistencies, and a corrected sequence (FORECE
V1.1 right). Arrows to the left and the right symbolize thetransition from one time step of the simulation model to thenext; the other arrows indicate the sequence of calculationwithin a single time step.
growth increment of the trees which will survive,and (3) establishment of saplings within at (Fig.2 right). However, most forest gap models do notconform to this scheme (Table 1). Since a correctupdate mechanism avoids repeated calculation ofsome variables within the same at, e.g. leaf areaindex, simulations become more efficient: In thecase of the FORECE model, the version with acorrect updating is approximately 25% faster. Thiscorrect updating mechanism was implemented ina successor of FORECE 1.0, i.e. FORECE version1.1.
Another correct and more general solution tothe update problem is of course to assign duringa time step new state values temporarily only to a
Modifying the state vector update is one ofmany possible alterations of interest that can bemade to the stochastic process underlying a forestgap model. In all these cases the question ariseswhether the two stochastic processes yield ecologically different results at the level of stand dynamics. Earlier studies (e.g. Kienast, 1991) dealing with the quantitative comparison of severalmodel versions have relied on the t-test althoughits assumptions, e.g. the normal distribution ofthe variables, often are not met in forest gapmodels (Bugmann, 1994). Furthermore, the frequency distribution of most variables of interestchanges over time. Therefore nonparametric testsappear more appropriate for comparing modelversions. In this study, the following set of methods were used to detect differences betweenFORECE V1.0 and FORECE V1.1 along a transect:1. Graphical eye-ball comparison of time series
of species-specific biomass values; of coursethis allowed an overall qualitative evaluationof model behaviour only.
2. Starting in the simulation year 100, the non-
Table 1Comparison of various forest gap models with respect to the typical number of simulation runs performed, the patch size used, thecorresponding size of the equilibrium landscape (equals the number of simulations times patch size), and the procedure sequenceused for the state vector update (E stands for Establishment, G for Growth and M for Mortality). A consistent sequence ofcalculation would be M-G-E (cf. last row)
Model name
JABOWA
FORET
LINKAGES
FORENA
FORECE
FORSKA
EXE
Number of Patch size Equilibrium State vector Referencesimulations (m2) landscape update
size (ha)
100 100 1.0 E-M-G Botkin et al. (1972)100 833 8.3 M-E-G Shugart and West (1977)20 833 1.7 E-G-M Pastor and Post (1985)10 833 0.8 M-E-G Solomon (1986)50 833 4.2 E-G-M Kienast (1987)
5 1000 0.5 E-G-M Leemans and Prentice (1989)10 833 0.8 E-G-M Martin (1992)
200 833 16.7 M-G-E this study

202 H. Bugmann et al. / Ecological Modelling 89 (1996) 197-208
parametric Mann-Whitney V-test (Sokal andRohlf, 1981) was used to compare frequencydistributions of key species every 200 years.
The time interval was chosen to minimize autocorrelation (cf. Fig. 1). Not all species werecompared in this way, since biomass values
14Abies alba Abies alba Abies alba
12
Year 400 Year 800 Year 120010
8
4
6
1'.1
12 of'
:'
1 i;
I ! !
" ..~; :;" :
: .• I
i :·,I
•:. I
~' I •
~ ,
1 , 1
I I i i I I: : :
400300200100400 0300200100400 0300200100o ~-~,.....-.......--......--... 'f---.....--__-__..--...,.. +---,.....-.......--......--.,..
o
14
'C 1241
E 10
Fagus silvatica
Year 400 ..
Fagus silvatica
Year 800 i,
Fagus silvatica
Year 1200
8c
I•
~ I
, :
..I
,I
•·.., •
400300200100400 0300200100400 0300200100o +--....,.--.....-....,.--~ -+O--..,....-......--.....-....,.l +--......--.....- ......--..,..
o
25 Ulmus scabra Ulmus scabra Ulmus scabra
20 Year 400 Year 800 Year 1200
III: I •
I ! :
... .I. :
.1
.' I' I !1 '
I :
1 ,
i I .! . :I •
5 L.: I~ 1~ ,
10
15
400300200100400 0300200100400 0300200100o +--....,.--.....-....,.--~ ;.--.....- __--.......-....,.1
o
Number of simulations
Fig. 3. Convergence of the FORECE model V1.0, estimated by the coefficient q (Eq. 1) as a function of the number of simulationruns n. The horizontal line in each panel is the value of q for n = 4000, which is the best estimate of a conjectured boundary value.For each value of n. q was calculated 10 times independently. For small n, some extremely large values of q had to be clipped forconvenience.

H. Bugmann et al. / Ecological Modelling 89 (J996) 197-208 203
and numbers of a species are not independentfrom that of all the others due to light limitation and the maximum carrying capacity assumed in the model (Kienast, 1987).
3. Eye-ball comparison of the frequency distribution of those variables for which the V-testyielded significant differences (P < 0.05).Model comparisons were made at the sites
Airolo, Basel, Bern, Locarno, Sion and Zermatt(all located in Switzerland; Kienast, 1987; Kienastand Kuhn, 1989a, b; Bugmann, 1994), which arerepresentative of typical forest communities alongan altitudinal transect in the European Alps (Ellenberg and Kl6tzli, 1972; Kienast and Kuhn,1989a, b). At each site two hundred simulationruns were performed for each model version. Thedata were analysed using the statistics packageSYSTAT on an Apple Macintosh IIfx.
3. Results and discussion
3.1. Model convergence
For all three key species we found similarpatterns of the q values in all analysed years (Eq.1; Fig. 3): For small sample sizes (n < 100), q ishighly variable, and only larger sample sizes (100< n < 200) show a clear tendency of convergence.Beyond a sample size of n = 200, q appears tohave converged and no further significant reductions in q can be detected. The funnel-shapedfunction (Fig. 3) of q corresponds to theoreticalexpectations, but model convergence is slow, reflecting the highly stochastic nature of gap models.
Hence the FORECE model requires approximately 200 simulations runs to calculate reliablemodel outputs such as means of species specificbiomass, a result similar to that obtained in apilot study (Bugmann and Fischlin, 1992). Wesurmise that this result is also valid for manyother forest gap models because their structure isquite similar to that of FORECE (Botkin, 1993;Bugmann et al., 1996). The recommended samplesize n = 200 is markedly larger than that of n :::;50, which appears to have become a generallyaccepted standard (Table 1).
The quasi-equilibrium landscape concept holdsthat the vegetation attributes exhibit constancy atthe landscape level when the size of the typicaldisturbance is small relative to the size of thelandscape (Whittaker, 1953; Bormann and Likens,1979). Shugart (1984, p. 165) quantified this concept and suggested that the minimum landscapearea required for the quasi-equilibrium is about50 times the size of a disturbance. The size of apatch in forest gap models is chosen so as torepresent the typical disturbance size (Shugartand West, 1979), from which Shugart (1984) concluded that 50 patches should be sufficient tocalculate the properties of the quasi-equilibriumlandscape in forest gap models. However, thepresent study indicates that such a small samplesize can be regarded as a an absolute minimum atbest, and that only larger sample sizes warrantthe desired precision (Fig. 3, Table 1).
Busing and White (1993) showed that the physical structure (e.g. total basal area and totalbiomass) of an old-growth hemlock-hardwoodforest in Tennessee can be approximated well byShugart's 50: 1 rule. However, the species composition at the landscape level, i.e. the relative basalarea of the species, did not yet equilibrate at anarea 50 times the disturbance size (Busing andWhite, 1993). Hence their findings corroboratethe results of the present convergence analysis.Generally our findings do not question the principle of a quasi-equilibrium landscape (Bormannand Likens, 1979); they just modify its quantification (Shugart, 1984).
For many gap models, e.g. FORECE, it is timeconsuming to perform more than 50 simulationruns due to their complexity. It would thereforebe desirable to simplify the models in order toallow for more efficient calculations. Attempts inthis direction have been undertaken e.g. by Reed(1980), Fulton (1991), and Bugmann (1994).
3.2. State vector update
The graphical comparisons of the simulationresults did not reveal any striking differencesbetween FORECE 1.0 and 1.1 at any of the studysites. The results from the statistical analysis,however, suggest that the sites can be grouped

204 H. Bugmann et al. / Ecological Modelling 89 (I996) 197-208
FORECE V1.1, site Airolo, 200 runs250
200Ill] Populus tremula
'"EJ Betula verrucosa~• Ulmus scabra 150
0 Fraxinus excelsior'"&3 Acer pseudoplatanus '"to 100
ED Fagus silvatica EII Picea abies .~
lD• Abies alba 50
01200 0 400 800 1200
Year400 800
Year
50
200
FORECE V1.0, site Airolo, 200 runs250
'":: 100E.2lD
..~-_ 150
~0.15
~ 0.15 30 (")0 III
III~ 0:
r.l0: >-3
'" 0.10r.l
'" 0.10 20 ZZ 0
H0 Eo<H0: 0.05
Eo< 0.05 10 00:0 '"'" 0
~0:
'"'" 0 BOO 1600 2400 3200 4000
NRTOT
I IIn-nrhI
o BOO 1600 2400 3200 4000
NRTOT
30 (")
~20
10
Fig. 4. Top: Forest succession as simulated for the site Airolo, starting from a bare patch. Cumulative species-specific biomassvalues are shown for the original model FORECE 1.0 (left, Kienast, 1987) and FORECE 1.1 incorporating an improved state vectorupdata (this study, right). Bottom: Frequency distribution of the total number of stems per hectare (NRTOT) at the site Airolo in thesimulation year 500 from the original (left) and the modified FORECE model (right). The distributions are significantly different atP < 0.01. The modified model is characterized by a higher occurrence of stem numbers between 1500 and 2500 ha -l, but theoverall shape of the distributions remains quite similar.
into two classes: Airolo, Basel and Bern showedonly few significant differences between the twomodel versions, whereas Locarno, Sion and Zermatt exhibit a larger number of differences.
Table 2Results of the Mann-Whitney V-test comparing the twomodel versions FORECE 1.0 and 1.1 with respect to thespecies-specific biomass of the eight most abundant treespecies, total biomass, total number, and leaf area index(LAn for the site Airolo
Species Year
3.2.1. Sites with small differencesA typical example from this group is the site
Airolo (Fig. 4). Both models exhibit similar speciescomposition, and total aboveground biomass isalmost identical (Fig. 4 top). The comparison ofthe frequency distributions by means of the V-testis given in Table 2. Out of the 66 investigatedcases, only 5 (7.6%) show differences that aresignificant at P < 0.05 (Table 2). The individualexamination of each of the latter 5 cases revealedno striking differences between the two modelversions, nor was it possible to detect a consistentpattern of the deviations. Only in two cases, i.e.
100 300 500 700 900 1100
Abies albaPicea abiesFagus silvaticaAcer pseudoplatanusFraxinus excelsiorUlmus scabraBetula verrucosaPopulus tremulaTotal biomassTotal numberLAI
Significance levels: O' P < 0.1; • P < 0.05; P < 0.01;, • ': P < 0.001.
H. Bugmann et al. / Ecological Modelling 89 (J996) 197-208
10000G>
"...,8000u
G>.<l
"G>Co 6000......"., 4000....0 :"
~GI 2000 .~ $"d
Year 100
•
0
I I·
~. 8 · I I 0
~i · •0
$I
~I
~ ~$ $Year 300 Year 500 Year 700 Year 900
205
810000
BODO
: 6000
· 4000·
~•.. 2000
$Year 1100
0
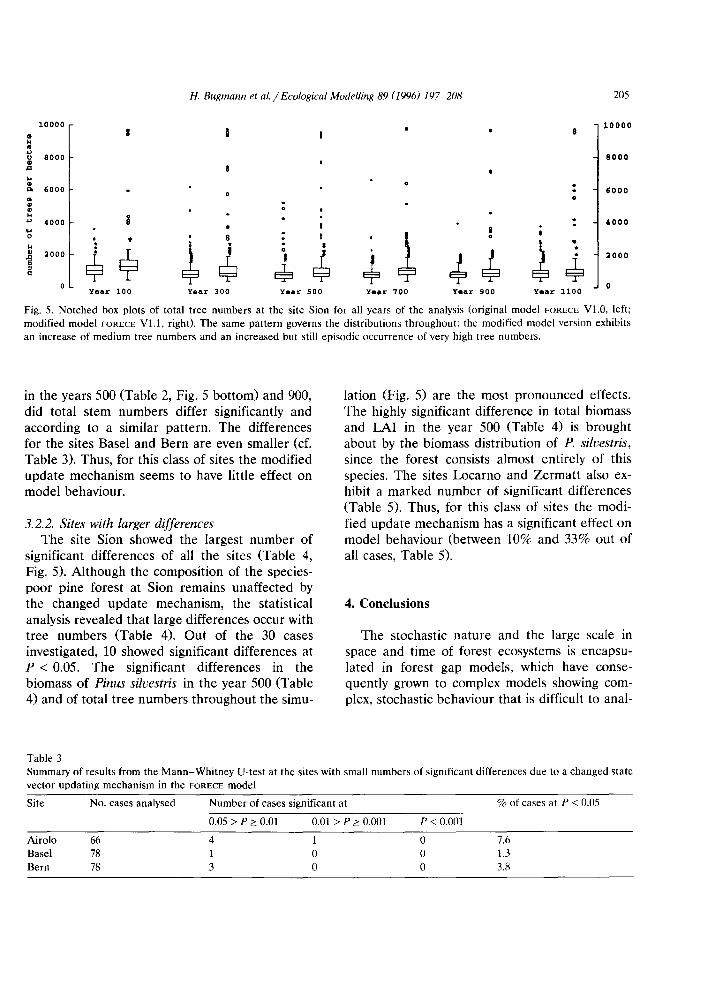
Fig. 5. Notched box plots of total tree numbers at the site Sion for all years of the analysis (original model FORECE V1.0, left;modified model FORECE V1.1, right). The same pattern governs the distributions throughout: the modified model version exhibitsan increase of medium tree numbers and an increased but still episodic occurrence of very high tree numbers.
in the years 500 (Table 2, Fig. 5 bottom) and 900,did total stem numbers differ significantly andaccording to a similar pattern. The differencesfor the sites Basel and Bern are even smaller (cf.Table 3). Thus, for this class of sites the modifiedupdate mechanism seems to have little effect onmodel behaviour.
3.2.2. Sites with larger differencesThe site Sion showed the largest number of
significant differences of all the sites (Table 4,Fig. 5). Although the composition of the speciespoor pine forest at Sion remains unaffected bythe changed update mechanism, the statisticalanalysis revealed that large differences occur withtree numbers (Table 4). Out of the 30 casesinvestigated, 10 showed significant differences atP < 0.05. The significant differences in thebiomass of Pinus silvestris in the year 500 (Table4) and of total tree numbers throughout the simu-
lation (Fig. 5) are the most pronounced effects.The highly significant difference in total biomassand LAI in the year 500 (Table 4) is broughtabout by the biomass distribution of P. silvestris,since the forest consists almost entirely of thisspecies. The sites Locarno and Zermatt also exhibit a marked number of significant differences(Table 5). Thus, for this class of sites the modified update mechanism has a significant effect onmodel behaviour (between 10% and 33% out ofall cases, Table 5).
4. Conclusions
The stochastic nature and the large scale inspace and time of forest ecosystems is encapsulated in forest gap models, which have consequently grown to complex models showing complex, stochastic behaviour that is difficult to anal-
Table 3Summary of results from the Mann-Whitney U-test at the sites with small numbers of significant differences due to a changed statevector updating mechanism in the FORECE model
Site No. cases analysed Number of cases significant at % of cases at P < 0.05
AiroloBaselBern
667878
0.05 > P 2: 0.01
413
0.01 > P 2: 0.001
1oo
P < 0.001
ooo
7.61.33.8

206 H. Bugmann et al. / Ecological Modelling 89 (1996) 197-208
Table 4Results of the Mann-Whitney U-test comparing the twomodel versions FORECE 1.0 and 1.1 with respect to thespecies-specific biomass of the eight most abundant treespecies, total biomass, total number, and leaf area index(LAO for the site Sion
yse. The last 20 years have seen a steady proliferation of ever more sophisticated forest gap models, and they have heuristically proven to be useful for many purposes. Yet, to understand theirunderlying assumptions and limitations, we believe that they should be analysed carefully.Specifically, the statistical, systems theoretical andecological basis of these complex models shouldbe explored further. Then their range of applicability can be determined better, making it possible to plan appropriate simulation experiments,which then will produce optimally valid results.
The results from the analysis of model convergence emphasize the need to investigate the statistical properties of the time series produced byforest gap models (d. Emanuel et al., 1978). Forthe FORECE model we found that it is necessary tosample some 200 runs to compute species composition reliably, and' we surmise that a similarsample size is required also for many other gapmodels. However, in most studies published to
Significance levels: 0: P < 0.1; ': P < 0.05;"': P < 0.001.
Species
Pinus silvestrisQuercus pubescensTotal biomassTotal numberLAI
Year
100 300 500 700 900 1100
P < 0.01;
date only 10 to 50 simulation runs have beenperformed (Table 1). We suggest that other forestgap models should also be checked for theirconvergence properties. This would enable to testwhether the recommended sample size of about200 runs is generally valid for gap models. Although such an analysis may be painstaking, wesuggest that the more complex the model, themore important it is. An appropriate sample sizeis especially crucial if several model versions areto be compared, e.g. during model development,in sensitivity analyses, and when the models areapplied to study the effects of, for example, airpollution and climatic change.
The implementation of a consistent updatemechanism of the state variables in the FORECE
model did not lead to dramatic changes of modelbehaviour, although the correct updating is fundamentally different from a systems theoreticalpoint of view. This appears to confirm the findingof Shugart (1984) that no single part of a forestgap model is very sensitive to its exact formulation. However, the update mechanism influencedthe distribution of tree numbers significantly,which may be essential in studies that compareand validate gap models (e.g. Leemans, 1992).Therefore we recommend to revise forest gapmodels so that they include a consistent updatemechanism for their state variables. This mayeven lead to an improvement in the efficiency ofthe simulation model: in the case of FORECE, theversion with a correct updating is even approximately 25% faster. Although published a longtime ago, the systems theoretical foundations ofecological modelling (Wymore, 1976, 1984; Zeigler, 1976, 1979) are still neither fully recognized
Table 5Summary of results from the Mann-Whitney U-test for the sites with larger numbers of significant differences due to a changedstate vector updating mechanism in the FORECE model
Site No. cases analysed Number of cases significant at % of cases at P < 0.05
0.05 > P::: 0.01 0.01 > P ::: 0.001 P < 0.001
Locarno 78 8 2 1 14.1Sian 30 3 2 5 33.3Zermatt 48 4 0 10.4

H. Bugmann et al. / Ecological Modelling fi9 (1996) 197-208 207
nor applied in practice (ct. Fischlin, 1991). Weconclude that complex simulation models of ecological systems need to be implemented in formalways adhering to systems theoretical foundations.
The complexity of current gap models alsogives rise to the question whether the essence ofthe original ecological hypothesis of forest dynamics underlying these models (Botkin et aI.,1972) is responsible for the quite realistic behaviour of the models (Shugart, 1984), or whethertheir behaviour is simply due to additionl detailscluttering the core structure of the models. Recent studies suggest that simpler models couldprovide equally valid descriptions of forest dynamics (cf. Bugmann and Martin, 1995). Suchmodels would be easier to interpret ecologicallyand would allow for a more detailed analysis oftheir behaviour, taking advantage of the userinterface of modern personal computers andworkstations instead of batch-oriented host computers.
Not only would these developments enabledetailed analyses of the sensitivity and stability offorest gap models, but their large-scale application in the context of, for example, landscapeecology would also become feasible. We are convinced that analyses of this promising class ofecological models bear the potential to considerably increase our quantitative understanding offorest dynamics.
References
Amann, G., 1954. Baume und Straucher des Waldes, 15th ed.1988. Neumann-Neudamm, Melsungen, 232 pp.
Bernatzky, A., 1978. Tree Ecology and Preservation. Developments in Agricultural and Managed-Forest Ecology, Vo!.2. Elsevier, Amsterdam, 357 pp.
Bonan, G.B. and van Cleve, K., 1992. Soil temperature, nitrogen mineralization, and carbon source-sink relationshipsin boreal forests. Can. J. For. Res., 22: 629-639.
Bormann, F.H. and Likens, G.E., 1979. Pattern and Process ina Forested Ecosystem: Disturbance, Development and theSteady State. Springer, New York, 253 pp.
Botkin, D.B., 1993. Forest Dynamics: An Ecological Mode!.Oxford University Press, Oxford, 309 pp.
Botkin, D.B., Janak, J.F. and Wallis, J.R., 1972. Some ecological consequences of a computer model of forest growth. J.Eco!., 60: 849-872.
Bray, J.R., 1956. Gap-phase replacement in a maple-basswoodforest. Ecology, 37: 598-600.
Bugmann, H., 1994. On the ecology of mountainous forests ina changing climate: A simulation study. Ph.D. thesis no.10638, Swiss Federal Institute of Technology Zurich,Switzerland, 258 pp.
Bugmann, H. and Fischlin, A., 1992. Ecological processes inforest gap models - analysis and improvement. In: A.Teller, P. Mathy and J.N.R. Jeffers (Editors), Responsesof Forest Ecosystems to Environmental Changes. Elsevier,London, pp. 953-954.
Bugmann, H. and Martin, Ph., 1995. How physics and biologymatter in forest gap models. Clim. Change, 29: 251-257.
Bugmann, H.K.M., Yan X., Sykes, M.T., Martin, Ph., Lindner, M., Desanker, P.V. and Cumming, S.G., 1996. Acomparison of forest gap models: Model structure andbehaviour. Clim. Change, in press.
Busing, R.T. and White, P.S., 1993. Effects of area on oldgrowth forest attributes: implications for the equilibriumlandscape concept. Landscape Eco!., 8: 119-126.
Cellier, F.E., 1984. How to enhance the robustness of simulation software. In: T.I. Oren, B.P. Zeigler and M.S. Elzas(Editors), Simulation and Model-based Methodologies: AnIntegrative View. Springer, Berlin, pp. 519-537.
Cellier, F.E. and Fischlin, A., 1982. Computer-assisted modelling of ill-defined systems. In: R. Trappl, GJ. Klir andF.R. Pichler (Editors), Progress in Cybernetics and Systems Research. University of Vienna, Austria, pp. 417-429.
Curtis, J.T., 1959. The Vegetation of Wisconsin. University ofWisconsin Press, Madison.
Dale, V.H. and Franklin, J.F., 1989. Potential effects of climate change on stand development in the Pacific Northwest. Can. J. For. Res., 19: 1581-1590.
Dale, V.H. and Hemstnllm, M., 1984. CLIMACS: A computermodel of forest stand development for western Oregonand Washington. Res. Paper PNW-327, Pacific Forest andRange Experiment Station, U.S. Department of Agriculture, Forest Service.
Ellenberg, H., 1986. Vegetation Mitteleuropas mit den Alpenin okologischer Sicht, 4th ed. Verlag Eugen Ulmer,Stuttgart. 989 pp.
Ellenberg, H. and Klotzli, F., 1972. Waldgesellschaften undWaldstandorte der Schweiz. Eidg. Anst. Forst!. Versuchswes., Mitt., 48: 587-930.
Emanuel, W.R., West, D.C. and Shugart, H.H., 1978. Spectralanalysis of forest model time series. Eco!. Mode!., 4~
313-326.Fischlin, A., 1991. Interactive modeling and simulation of
environmental systems on workstations. In: D.P.F. Moller(Editor), Analysis of Dynamic Systems in Medicine, Biology, and Ecology. Springer, Berlin, pp. 131-145.
Fischlin, A., Mansour, M.A., Rimvall, M. and Schaufelberger,W., 1987. Simulation and computer aided control systemdesign in engineering education. In: 1. Troch, P. Kopacekand F. Breitenecker (Editors), Simulation of Control Systems. Pergamon Press, Oxford, pp. 51-60.
Fischlin, A., Gyalistras, D., Roth, 0., Ulrich, M., Thony, J.,

208 H. BlI!!mann el al. / Ecolm;ical Modelling 89 {J99(i) 197-208
Nemecek, T., Bugmann, H. and Thommen, F.. 1994. ModelWorks 2.2: An interactive simulation environment forpersonal computers and workstations. Internal Report No.14, Systems Ecology Group, ETH Zurich, 323 PI'.
Forman, R.T.T. and Godron, M.. 1981. Patches and structuralcomponents for a landscape ecology. BioScience, 31: 733740.
Friend, AD., Shugart, H.H. and Running, S.W., 1993. Aphysiology-based gap model of forest dynamics. Ecology,74: 792-797.
Fulton, M., 1991. A computationally efficiellt forest succession model: Design and initial tests. For. Ecol. Manage.,42: 23-34.
Hess, RE., Landolt, E. and Hilzel. R., 1980. Flora derSchweiz, Vol. 4, 2nd ed. Birkhauser, Basel.
Kienast, F., 1987. FORECE - A forest succession model forsouthern central Europe. Oak Ridge National Laboratory,Oak Ridge, TN, ORNL/TM: 1e5-;5, G'; pjJ.
Kienast, E, 1991. Simulated effects of increasing CO 2 on thesuccessional characteristics of Alpine forest ecosystems.Landscape ECG!., 5: 225 22~.
Kienast, F. and Kuhn, N., 1989a. Simulating forest successionalong ecological gradients in southern Central Europe.Vegetatio, 79: 7-20.
Kienast, F. and Kuhn, N., 1989b. Computergestiitzte Simulation von \Valdcnt\\'icklungcl1. ~Ct~V.::i2. Z. Fors~·"vcs., l~a:
189-701.Leemans, R., 1992. The biological component of the simula
tion model for boreal forest dynamics. In: H.R Shugart,R. Leemans and G.B. Bonan (Editors), A Systems Analysis of lhe Giobal Boreai Forest. Cambridge UniversityPress, Cambridge, pp. 428-445.
Le('T[1ans, R. and Prentir(', I.e., 1Q8Q. FORSKA. a gen~f"1
forest succession model. Institute of Ecological Botany,Uppsala, 70 PI'.
Martin, Ph., 1992. EXE: A climatically sensitive model tostudy climate cnauge ami CO2 enrichmenr effects onforests. Aust. J. Bot., 40: 7i7-735.
Mitscherlich, G., 1970. Wald, Wachstum und Umwelt - Formund Wachstum von Baum und Bestand. J.D. Sau.:rlanuer·sVerlag, Frankfurt am Main, 142 PI'.
Pastor, J. and Post, W.M., 1985. Development of a linkedforest productivity-soil process model. U.S. Dept. of Energy, ORNL/TM-9519.
Reed, K.L., 1980. An ecological approach to modeling growthof forest trees. For. Sci., 26: 33-50.
Shugart, H.H., 1984. A Theory of Forest Dynamics. TheEcological Implications of Forest Succession Models.Springer, New York, 278 PI'.
Shugart, H.H. and Emanuel, W.R., 1985. Carbon dioxideincrease: the implications at the ecosystem level. PlantCell Environ., 8: 381-386.
Shugart, H.R and West. D.e.. 1977. D.:velopment of anAppalachi~n deciduous forest succession model and its~rrlicatjon to assessment of the impact of the chestnutblight. J. Environ. Manage., 5: 161-179.
Shug~rt. HH and West, D.C., 1979. Size and pattern ofsimulated forest stands. For. Sci., 25: 120-122.
Shugart, H.H. and West, DC, 1980. Forest succession models. BioScience, 30: 308-313.
Shugart, H.H., Crow, T.R. and Hett, J.M., 1973. Forest succession models: a rationale and methodology for modelingforest succession Jver large regions. For. Sci., 19: 203-212.
Sokal, RR. and Rohlf, F.J., 1981. Biometry. Freeman, NewYcrlr 859 rp.
Sollins. Ph., Harris. W.F. and Edwards, N.T., 1976. Simulatingthe physiology of a temperate deciduous forest. In: B.e.Patten (Editor), Systems Analysis and Simulation in Ecology, Vol. 4. Academic Press, New York, PI'. 173-218.
SvlGil1ul"l, A.r..L, i98G. TlaJlL')~cJlt lCL')VUUSe of forests to CO zinduced climate cnange: simulation modeling experimentsin eastern North America. Oecologia, 68: 567-579.
SG~GmG~, ~'\.~"t, ""Vc:;t, D.C. una Svloffion, l.A., 1981. Simulating the role of climate change and species immigration inforest succession. In: D.e. West, H.H. Shugart and D.B.Botkin (Editors), Forest Succession: Concepts and Application. Springer, New York, PI'. 154-177.
Urban, D.L., Harmon, M.E. and Halpern, Ch.B., 1993. Poten·ti~1 r"~!",on~e of p~rific nnrthwestern forests to climaticchange, effects of stand age and initial composition. Clim.Change, 23: 247-266.
Watt, AS., 1947. Pattern and process in the plant community.J. Ecol., 35: 1-22.
Wh'ttaker, R.R, 1953. A consideration Gf clim;lx theory: Thec1innx as a popnhtion and pattern Ecnl. Monogr., :?J:41-78.
Wirth, N., 1985. Programming in Modula-2. Third, correctededition. Springer-Verlag, Berlin, 202 PI'.
Wirth, N., Gutknecht, J., Reiz, W., Schar, H., Seiler, H.,Vetterli, e. and Fischlin, A, 1992. MacMETH - A fastModula-2 language system for the Apple Macintosh. UserManual, 1nshtut fiir Inlormatlk CfHZ, Ziirich, 116 PI'.
\Vymorc, A.W., 1976. Systems Engineering Methodology forInterdisciplinary Teams. John Wiley and Sons, New York.
Wymore, AW., 1984. Theory of systems. In: e.R Vick ande.V. Ramamoorthy (Editors), Handbook of Software Engineering. Van NO',:~'and Reinhold Company, New York.
Zar, J.R, 1984. Biostatistical Analysis. Prentice-Hall, Englewood Cliffs, NJ, 718 PI'.
Zeigler, B.P., 1976. Theory of Modelling and Simulation. JohnWiley, New York, 435 Pl'.
Zeigler, B.P., 1979. Multilevel multiformalism modeling: anecosystem example. In: E. Halfon (Editor), TheoreticalSystems Ecology. Academic Press, New York, PI'. 17-54.