Biological Convergence of Cancer Signatures
12
Biological Convergence of Cancer Signatures Xavier Sole ´ 1 , Nu ´ ria Bonifaci 1,2 , Nu ´ ria Lo ´ pez-Bigas 3 , Antoni Berenguer 1 , Pilar Herna ´ ndez 2 , Oscar Reina 4 , Christopher A. Maxwell 2 , Helena Aguilar 2 , Ander Urruticoechea 2 , Silvia de Sanjose ´ 4 , Francesc Comellas 5 , Gabriel Capella ´ 2 , Vı´ctor Moreno 1 , Miguel Angel Pujana 1,2 * 1 Bioinformatics and Biostatistics Unit, Catalan Institute of Oncology, IDIBELL, L’Hospitalet, Barcelona, Spain, 2 Translational Research Laboratory, Catalan Institute of Oncology, IDIBELL, L’Hospitalet, Barcelona, Spain, 3 Research Unit on Biomedical Informatics of IMIM/UPF, Barcelona Biomedical Research Park, Barcelona, Spain, 4 Unit of Infections and Cancer, CIBERESP, Epidemiology Research of Cancer Program, Catalan Institute of Oncology, IDIBELL, L’Hospitalet, Barcelona, Spain, 5 Department of Applied Mathematics IV, Technical University of Catalonia, Castelldefels, Barcelona, Spain Abstract Gene expression profiling has identified cancer prognostic and predictive signatures with superior performance to conventional histopathological or clinical parameters. Consequently, signatures are being incorporated into clinical practice and will soon influence everyday decisions in oncology. However, the slight overlap in the gene identity between signatures for the same cancer type or condition raises questions about their biological and clinical implications. To clarify these issues, better understanding of the molecular properties and possible interactions underlying apparently dissimilar signatures is needed. Here, we evaluated whether the signatures of 24 independent studies are related at the genome, transcriptome or proteome levels. Significant associations were consistently observed across these molecular layers, which suggest the existence of a common cancer cell phenotype. Convergence on cell proliferation and death supports the pivotal involvement of these processes in prognosis, metastasis and treatment response. In addition, functional and molecular associations were identified with the immune response in different cancer types and conditions that complement the contribution of cell proliferation and death. Examination of additional, independent, cancer datasets corroborated our observations. This study proposes a comprehensive strategy for interpreting cancer signatures that reveals common design principles and systems-level properties. Citation: Sole ´ X, Bonifaci N, Lo ´ pez-Bigas N, Berenguer A, Herna ´ndez P, et al. (2009) Biological Convergence of Cancer Signatures. PLoS ONE 4(2): e4544. doi:10.1371/journal.pone.0004544 Editor: Gustavo Stolovitzky, IBM Thomas J. Watson Research Center, United States of America Received October 7, 2008; Accepted January 16, 2009; Published February 20, 2009 Copyright: ß 2009 Sole et al. This is an open-access article distributed under the terms of the Creative Commons Attribution License, which permits unrestricted use, distribution, and reproduction in any medium, provided the original author and source are credited. Funding: The la Caixa Foundation grant BM 05/254 (MAP) and the Spanish Ministry of Health grants FIS 05/1006 (VM) and 06/0545 (MAP), RCESP C03/09 and RTICCC C03/10 (VM and GC). CAM is supported by a Beatriu de Pinos fellowship from the AGAUR agency of the Catalan Government, HA is supported by a postdoctoral fellowship of the Spanish Ministry of Health and MAP is a Ramon y Cajal Researcher with the Spanish Ministry of Education and Science. The funders had no role in study design, data collection and analysis, decision to publish, or preparation of the manuscript. Competing Interests: The authors have declared that no competing interests exist. * E-mail: [email protected]. Introduction Recent years have seen the description of a large number of gene expression profiles or signatures with clinical value for the accurate prognostic or predictive characterization of cancer patients or tumors. Breast cancer is probably the paradigm of such studies, with at least three different signatures currently being tested in clinical trials and commercially available for routine clinical practice in oncology [1,2]. However, the lack of overlap in the selected genes has raised fundamental questions about their biological and clinical implications [3,4]. This situation is not unique to breast cancer prognosis, and the description of new expression profiles suggests that it is common to other cancer types or conditions_i.e. metastases and treatments [5]. Reasons to this paradox may be methodological disparities [6] and statistical constraints created by the large number of genes examined with respect to the relatively small number of samples profiled [7–9]. Importantly, a recent study by Perou and colleagues [10] established the common prognostic value of some breast cancer signatures, despite the lack of overlap in gene identities. This observation confirmed the clinical relevance of the signatures and suggested that they may efficiently capture a common tumor cell phenotype(s) [11]. This putative common phenotype for breast cancer and for other neoplasias must be defined if we are to better understand the significance of signatures. Some of the early descriptions of signatures noted the presence of specific biological processes over-represented in the correspond- ing gene lists. Among these processes, individual genes involved in the cell cycle and apoptosis were highlighted (e.g. [12,13]). More recent evidence points to specific genes that are globally associated with breast cancer prognosis and related to cell proliferation among other processes or pathways [14–21]. However, it is still unclear how this evidence characterizes different molecular levels and how the levels integrate into a systems-level model containing gene and/or protein interactions for breast cancer and for human cancer in general. Here, we used an integrative approach to determine the existence of a putative common tumor cell phenotype(s) associated with different cancer types and conditions. The study identified common molecular properties and network interactions associated with cell proliferation and death, and revealed associations with the immune response. Our results highlight the importance of studying signatures from a systems- level perpective. PLoS ONE | www.plosone.org 1 February 2009 | Volume 4 | Issue 2 | e4544
-
Upload
independent -
Category
Documents
-
view
3 -
download
0
Transcript of Biological Convergence of Cancer Signatures
Biological Convergence of Cancer SignaturesXavier Sole1, Nuria Bonifaci1,2, Nuria Lopez-Bigas3, Antoni Berenguer1, Pilar Hernandez2, Oscar Reina4,
Christopher A. Maxwell2, Helena Aguilar2, Ander Urruticoechea2, Silvia de Sanjose4, Francesc Comellas5,
Gabriel Capella2, Vıctor Moreno1, Miguel Angel Pujana1,2*
1 Bioinformatics and Biostatistics Unit, Catalan Institute of Oncology, IDIBELL, L’Hospitalet, Barcelona, Spain, 2 Translational Research Laboratory, Catalan Institute of
Oncology, IDIBELL, L’Hospitalet, Barcelona, Spain, 3 Research Unit on Biomedical Informatics of IMIM/UPF, Barcelona Biomedical Research Park, Barcelona, Spain, 4 Unit of
Infections and Cancer, CIBERESP, Epidemiology Research of Cancer Program, Catalan Institute of Oncology, IDIBELL, L’Hospitalet, Barcelona, Spain, 5 Department of
Applied Mathematics IV, Technical University of Catalonia, Castelldefels, Barcelona, Spain
Abstract
Gene expression profiling has identified cancer prognostic and predictive signatures with superior performance toconventional histopathological or clinical parameters. Consequently, signatures are being incorporated into clinical practiceand will soon influence everyday decisions in oncology. However, the slight overlap in the gene identity between signaturesfor the same cancer type or condition raises questions about their biological and clinical implications. To clarify these issues,better understanding of the molecular properties and possible interactions underlying apparently dissimilar signatures isneeded. Here, we evaluated whether the signatures of 24 independent studies are related at the genome, transcriptome orproteome levels. Significant associations were consistently observed across these molecular layers, which suggest theexistence of a common cancer cell phenotype. Convergence on cell proliferation and death supports the pivotalinvolvement of these processes in prognosis, metastasis and treatment response. In addition, functional and molecularassociations were identified with the immune response in different cancer types and conditions that complement thecontribution of cell proliferation and death. Examination of additional, independent, cancer datasets corroborated ourobservations. This study proposes a comprehensive strategy for interpreting cancer signatures that reveals common designprinciples and systems-level properties.
Citation: Sole X, Bonifaci N, Lopez-Bigas N, Berenguer A, Hernandez P, et al. (2009) Biological Convergence of Cancer Signatures. PLoS ONE 4(2): e4544.doi:10.1371/journal.pone.0004544
Editor: Gustavo Stolovitzky, IBM Thomas J. Watson Research Center, United States of America
Received October 7, 2008; Accepted January 16, 2009; Published February 20, 2009
Copyright: � 2009 Sole et al. This is an open-access article distributed under the terms of the Creative Commons Attribution License, which permits unrestricteduse, distribution, and reproduction in any medium, provided the original author and source are credited.
Funding: The la Caixa Foundation grant BM 05/254 (MAP) and the Spanish Ministry of Health grants FIS 05/1006 (VM) and 06/0545 (MAP), RCESP C03/09 andRTICCC C03/10 (VM and GC). CAM is supported by a Beatriu de Pinos fellowship from the AGAUR agency of the Catalan Government, HA is supported by apostdoctoral fellowship of the Spanish Ministry of Health and MAP is a Ramon y Cajal Researcher with the Spanish Ministry of Education and Science. The fundershad no role in study design, data collection and analysis, decision to publish, or preparation of the manuscript.
Competing Interests: The authors have declared that no competing interests exist.
* E-mail: [email protected].
Introduction
Recent years have seen the description of a large number of
gene expression profiles or signatures with clinical value for the
accurate prognostic or predictive characterization of cancer
patients or tumors. Breast cancer is probably the paradigm of
such studies, with at least three different signatures currently
being tested in clinical trials and commercially available for
routine clinical practice in oncology [1,2]. However, the lack of
overlap in the selected genes has raised fundamental questions
about their biological and clinical implications [3,4]. This
situation is not unique to breast cancer prognosis, and the
description of new expression profiles suggests that it is common
to other cancer types or conditions_i.e. metastases and
treatments [5]. Reasons to this paradox may be methodological
disparities [6] and statistical constraints created by the large
number of genes examined with respect to the relatively small
number of samples profiled [7–9]. Importantly, a recent study
by Perou and colleagues [10] established the common
prognostic value of some breast cancer signatures, despite the
lack of overlap in gene identities. This observation confirmed
the clinical relevance of the signatures and suggested that they
may efficiently capture a common tumor cell phenotype(s) [11].
This putative common phenotype for breast cancer and for
other neoplasias must be defined if we are to better understand
the significance of signatures.
Some of the early descriptions of signatures noted the presence
of specific biological processes over-represented in the correspond-
ing gene lists. Among these processes, individual genes involved in
the cell cycle and apoptosis were highlighted (e.g. [12,13]). More
recent evidence points to specific genes that are globally associated
with breast cancer prognosis and related to cell proliferation
among other processes or pathways [14–21]. However, it is still
unclear how this evidence characterizes different molecular levels
and how the levels integrate into a systems-level model containing
gene and/or protein interactions for breast cancer and for human
cancer in general. Here, we used an integrative approach to
determine the existence of a putative common tumor cell
phenotype(s) associated with different cancer types and conditions.
The study identified common molecular properties and network
interactions associated with cell proliferation and death, and
revealed associations with the immune response. Our results
highlight the importance of studying signatures from a systems-
level perpective.
PLoS ONE | www.plosone.org 1 February 2009 | Volume 4 | Issue 2 | e4544
Results
Genomic properties: E2Fs and the estrogen receptor (ER)To identify common properties among cancer signatures we
compiled the literature gene lists from 24 studies (Table S1). These
represent 19 prognostic signatures, two signatures focused mainly
on metastasis, and seven predictive treatment response signatures.
All signatures used corresponded to validated sets of genes at the
same level. We first examined the molecular properties or network
topology characteristics of genes and/or proteins in these
signatures at the genome, transcriptome and proteome levels.
Next, the identified properties and network associations were
corroborated in independent expression datasets of different
cancer types and conditions (Fig. 1).
Properties at the genome level were evaluated by probing the
relative enrichment in predicted transcription factor binding site
motifs at the promoters of signature genes (see Methods). In
these analyses the top-ranked motifs across several signatures
were from the E2F family. Significant over-representation of
E2F motifs was identified in ,45% (13/28) of the signatures
tested, including prognostic (bladder, breast and central nervous
system (CNS) cancers, and three multi-cancer signatures) and
predictive signatures (docetaxel in breast tumors, EGFR
tyrosine kinase inhibitors (TKIs) in lung tumors and pemetrexed
in advanced solid tumors) (false discovery rate (FDR)-adjusted P
values,0.05) (Fig. 2A). In contrast, only one signature (the
immune response prognostic signature in estrogen receptor
(ER)-negative breast cancer [22]) showed under-representation
of E2F motifs. This observation will be discussed in the
following sections.
To evaluate motif predictions in the promoter sequences of
signature genes, we examined experimental data from chromatin
immunoprecipitation assays of transcription factors [23,24]. This
analysis corroborated the major role of E2F transcriptional
programs. Approximately 65% of signatures showed significant
over-representation of E2F1-AP2 and/or E2F4 binding sites
(Fig. 2B). The strongest over-representations were detected in
prognostic_particularly breast cancer_and predictive treatment
response signatures for E2F1-AP2 sites. Nevertheless, specificities
were also suggested for the immune response, which showed
under-representation of E2F1-AP2, and for predictive signatures
that did not show differential representation of E2F4 in any case.
The E2Fs are key regulators of cell proliferation and death
[25,26], and common deregulation of E2F-mediated transcrip-
tional programs is a hallmark of cancer transcriptomes [27]. The
link with the potential for cell proliferation was further evaluated
by examining transcripts with periodic expression through the cell
cycle [28], which indicates a direct or indirect role in phase(s) of
cell division, and by analyzing ER functional genomic data [29].
Significant over-representation of periodically expressed genes was
observed in ,45% of the signatures, most of which were
prognostic signatures for different cancer types (Fig. 2C). Detailed
examination of cell cycle phases showed specific over-representa-
tion of genes with an expression peak at G2 and G2/M, which is
in agreement with their role in cell division (data not shown). In
addition, consistent with the link between cell proliferation and the
ER signaling pathway [30], significant over-representation of ER
binding sites and/or ER-mediated transcriptional regulation was
identified in most of the signatures (,90%), irrespective of their
type or condition (Fig. 2D). This high overlap with ER regulation
probably reflects an strong association with cell proliferation
beyond cancer hormone-dependencies.
Overall, all except two of the signatures examined here showed
significant over-representation of one or more of the molecular
evidences associated with the regulation of cell proliferation and
death. The exceptions were the immune response signature, which
may reflect the involvement of different biological processes, and
the B-cell lymphoma prognosis signature, which may be explained
by the statistical power needed to detect differences in the smallest
gene set examined (n = 19). Similarities for these signatures at
additional molecular levels will be presented in the following
sections.
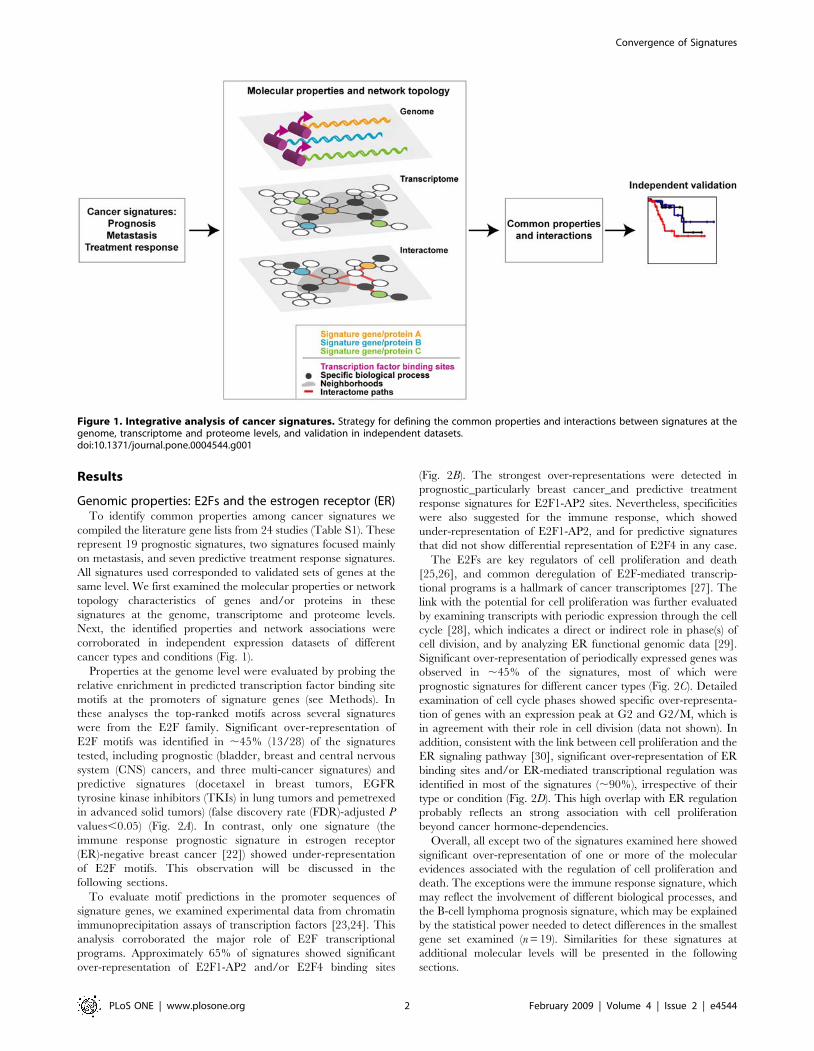
Figure 1. Integrative analysis of cancer signatures. Strategy for defining the common properties and interactions between signatures at thegenome, transcriptome and proteome levels, and validation in independent datasets.doi:10.1371/journal.pone.0004544.g001
Convergence of Signatures
PLoS ONE | www.plosone.org 2 February 2009 | Volume 4 | Issue 2 | e4544

Additional programs of cell proliferation, death andmetastasis
In an examination for additional mechanisms of transcriptional
regulation of signatures, motifs of AHR, EGR1, MYB and MYC
were found to be over-represented in a second term. These over-
representations were not as widespread as for E2Fs or ER, which
suggests that they play only a minor role, but different cancer types
and conditions were included: an EGR1 motif was found to be
over-represented in CNS and colorectal cancers and the b-catenin
multi-cancer prognostic signatures, the breast cancer lung
metastasis signature and the predictive signatures of cisplatin
and dasatinib (FDR-adjusted P values,0.05) (Fig. 2E). In
agreement with these observations, we found the lung metastasis
signature to contain 22% (12/54) of the genes predicted elsewhere
to be EGR1 transcriptional targets [31–34] and the wound
response was previously shown to be coordinated with MYC
amplification [35]. In addition, over-representation of an AHR
motif is consistent with its association with ER to regulate cell
proliferation [36].
Next, the significance of motif representations was evaluated
by analyzing gene expression correlations in representative
cancer datasets. Thus, we computed correlations using the
Pearson correlation coefficient (PCC) between the seven
transcription factors presented above and genes associated
with breast cancer prognosis [12] or with the response to
docetaxel treatment in breast cancer [37], and compared them
with genes non-differentially expressed in these conditions.
Higher absolute PCCs between transcription factors and genes
associated with prognosis or treatment response were identified
in all cases for genes and/or microarray probes (Mann-
Whitney (MW) test P values,0.001) (Fig. 3). The prognosis
dataset contained a single representative microarray probe for
each transcription factor, therefore all of them showed
significant differences (Fig. 3A). The treatment response dataset
contained several probes for some factors, which were
evaluated individually to identify technical or biological
differences. In this dataset, AHR, EGR1 and HIF1A were each
represented by a single probe and all of them showed
significantly higher correlations with response (Fig. 3B). E2F1,
E2F4, MYC and MYB had more than one probe each, with
discordant results in some cases but with average PCCs
significantly associated with response in three of them
Figure 2. Genomic and transcriptomic properties of cancer signatures associated with the potential for cell proliferation andrepressed cell death. A, representation of E2F motifs based on JASPAR and TRANSFAC matrices and the Poisson distribution, with P valuesadjusted using the FDR approach for analyses-columns. Values are shown as detailed in the inset: red/orange indicates significant over-representation and blue indicates significant under-representation. The E2F1_Q6 motif represents the putative action of E2F1 and MYC. B,representation of E2F1-AP2 and E2F4 binding sites from chromatin immunoprecipitation (chip) assays using the same statistical methodology asdescribed above. The E2F4 data correspond to the joint analysis of cell cycle phases [23]. C, representation of genes with periodic expression throughthe cell cycle. D, representation of ER transcriptional regulation from chromatin immunoprecipitation assays or transcriptional changes in MCF7 cells.E, representation of additional promoter motifs using TRANSFAC matrices. The wound response signature without cell cycle-associated genes isindicated by the suffix ‘‘(-cc)’’, and the ‘‘total set’’ signature of ER-negative breast cancer contains the immune response plus other biologicalprocesses such as the cell cycle. The dasatinib predictive signature is divided into two sets for the effect in prostate and breast cancer respectively.The colorectal prognostic signatures are as defined in Table S1.doi:10.1371/journal.pone.0004544.g002
Convergence of Signatures
PLoS ONE | www.plosone.org 3 February 2009 | Volume 4 | Issue 2 | e4544

Convergence of Signatures
PLoS ONE | www.plosone.org 4 February 2009 | Volume 4 | Issue 2 | e4544

(Fig. 3B), whereas E2F4 remained unclassifiable as two probes
were significantly correlated and two were not (data not
shown).
To further evaluate these observations, we computed
correlations between the seven transcription factors and 5,000
randomly selected sets equivalent to the size of the differentially
expressed gene sets above. Higher PCCs were observed for most
transcription factors in both cancer conditions, with the
exception of E2F4 in prognosis and treatment response (P
values obtained using the empirical distribution of random
PCCs (empirical P values) were of 0.16 and 0.11, respectively).
Overall, the identification of significant correlations with at least
six of the seven factors tested supports the motif predictions and
suggests the existence of common transcriptional programs that
converge on cell proliferation and death, as well as metastasis as
revealed by EGR1 [33].
Analysis of motifs and expression correlations also revealed an
association between the apparently dissimilar immune response set
and different prognosis signatures. Although it under-represented
E2F1 motifs, the immune response shared over-representation of a
MYB motif with the 21-gene, wound response breast cancer, and
bladder cancer prognostic signatures (Fig. 2E). Over-representa-
tion of this factor in the immune response is consistent with its role
in hematopoiesis [38], and its over-representation in other
signatures is consistent with the emerging involvement of the
immune response in the prognosis of different cancer types [39].
The high correlations observed in Fig. 3A between MYB and genes
globally associated with breast cancer prognosis (i.e. not limited by
the ER status) support this hypothesis. Associations of this
signature at other molecular levels will be presented in the
following sections.
Transcriptomic correlations between signaturesGiven the identification of common transcriptional programs,
global expression correlations between signatures should be higher
than expected by chance. Using a breast cancer dataset [40] and
the average PCC across all microarray probe pairs between any
two signatures, significant co-expression was identified in approx-
imately half of the analyses when compared to 10,000 equivalent,
randomly selected gene sets (empirical P values,0.05) (Fig. 4A).
These results support the existence of functional and molecular
associations between many apparently dissimilar signatures,
despite the fact that the dataset used had evident technical and
biological specificities. Furthermore, the immune response signa-
ture showed significant co-expression with 15 of the signatures
studied (data not shown), which also supports convergence on this
process.
To further test the link to cell proliferation and death at the
transcriptomic level, and excluding a priori information on
expression levels or profiles that could bias the analysis, we
examined correlations with gene sets selected using only the
criteria for the Gene Ontology (GO) terms Cell Death and Mitosis.
These sets were exclusively defined by selecting Entrez genes
annotated with those terms, and then used in comparisons in the
same way as any other signature. Using 10,000 equivalent random
sets, absolute correlations between these GO sets and the
signatures were found to be significantly higher in $12
comparisons (Fig. 4B, left). The Cell Death set was significantly
correlated with five signatures and the Mitosis set was significantly
correlated with 11 signatures of different cancer types or
conditions. Importantly, differences in the GO sets relative to
random were of the same magnitude as comparisons between
signatures (Fig. 4C).
This analysis suggested that measuring the expression levels of
genes known to participate in specific biological processes is likely
to be of prognostic or predictive value in different situations.
However, the analysis was constrained by the possible presence of
non-informative expression or sub-sets of genes with different
behavior within the GO sets. Thus, reducing the dimensionality of
Cell Death and Mitosis sets using a principal component analysis
that captured ,80% of the variance raised the number of
significant correlations to 12 and 14 sets, respectively (Fig. 4B,
right); these numbers corresponded to a total of ,60% of the
signatures examined, irrespective of their type or condition.
Interactome network associationsFunctional relationships between proteins can be identified as
direct interactions, complex memberships or relatively close
connections in the network of protein-protein interactions or
interactome network. Given the evidence at the genomic and
transcriptomic levels presented above, we hypothesized that
proteins encoded by apparently dissimilar signatures will be more
closely located in the interactome network than expected by
chance. For this analysis we used a dataset consisting mainly of
experimentally identified protein-protein interactions, excluding
homodimers and orthology-based predictions, and calculated the
shortest path between any two nodes or proteins in the giant
network component (i.e., the component containing the largest
number of connected proteins) [41].
All signature comparisons showed shortest path distributions
skewed toward smaller values than expected from the giant
component (Fig. 5). Statistical evaluation using the non-parametric
MW test identified significant differences with respect to the giant
component distribution in 90% of comparisons. The smallest
shortest paths were identified for the 21-gene prognostic, and
dasatinib and EGFR TKI predictive signatures, although the
results may be subject to bias because these sets contain several
proteins that are widely studied in the literature and therefore have
high network centrality.
To further evaluate these differences, we randomly selected
1,000 sets of 50 proteins with similar average degree centrality to
the signatures and obtained their shortest path distributions. Most
of the cancer signatures were more closely located than expected
by chance and also close to the Cell Death and Mitosis complete
sets (empirical P values,0.05 marked with dots in Fig. 5A and B).
According to these observations, examination of GO annotations
in the direct and one-hop neighborhoods of signatures identified
significant over-representation of Cell Cycle or Cell Death terms
or their children in all cases (FDR-adjusted P values,0.05) (GO
term details not shown), which reinforces the hypothesis that the
signature gene products are molecularly and functionally associ-
ated with these processes.
Figure 3. Expression correlations with defined transcription factors. A, expression correlations between seven transcription factors_genenames shown at the top of each graph_and genes differentially expressed for breast cancer prognosis measured by metastasis events up to 5 years(pink curves) relative to non-differentially expressed genes in this condition (brown curves). The graphs show absolute PCC values. B, same analysisfor differentially expressed genes after docetaxel treatment of breast cancer patients relative to non-differentially expressed genes in this condition.Results for E2F1, E2F4, MYB and MYC are for average values of all microarray probes representing each factor, whereas the insets show the results forindividual probes with significant differences.doi:10.1371/journal.pone.0004544.g003
Convergence of Signatures
PLoS ONE | www.plosone.org 5 February 2009 | Volume 4 | Issue 2 | e4544

Next, signatures were depicted as nodes in a network in which
the length of the edges is proportional to the average shortest path
to the Cell Death and Mitosis sets (Figure 5C, left). In this network,
most signatures were found close to these central processes when
compared to 100 random sets with equivalent degree centrality
(Figure 5C, right). Distant signatures represented modest associa-
tions at the different molecular levels examined above, such as the
prognostic signatures for B-cell lymphoma, colorectal cancer and
hypoxia response. These observations suggested correlation across
different molecular levels. Thus, negative correlations for all
signatures were observed between PCC co-expression values and
interactome shortest path distances (average r = 20.31 and
s = 0.16; Mantel test P value = 0.059), which is consistent with
functional relationships [42–45]. Consequently, higher co-expres-
sion between signatures partially correlated with smaller shortest
paths between them in the interactome network. These observa-
tions highlight the importance of the integrative study, which
revealed previously unidentified relationships in gene lists.
The immune response signature was also located close to the
Cell Death and Mitosis sets (MW test P values,0.001) (Figure
Figure 4. Transcriptomic correlations between signatures and with defined biological processes. A, heat map of average PCCs betweencancer signatures in a breast cancer gene expression dataset [40]. Significant co-expression (empirical P values,0.05) is indicated by dots. Note thatthe matrix is not symmetrical because the results were dependent on the size of each gene set; therefore, the larger gene sets (e.g. wound responseor invasiveness) showed significant co-expression with many other signatures, perhaps partly due to the fact that they had greater statistical powerwith which to detect them. Each dot corresponds to the comparison between a signature on the left (simulated set) and a signature at the bottom.The Cell Death and Mitosis sets are highlighted in pink. B, left panel, list of signatures that showed significant correlation with the Cell Death orMitosis complete GO sets. Right panel, list of signatures that showed significant correlation with the Cell Death or Mitosis sets, but only using theirprincipal components. C, observed (discontinuous red line) versus expected (black curve for 10,000 randomly selected sets) average PCCs betweenthe Mitosis set and the 70-gene set, the Cell Death set, or genes with periodic expression through the cell cycle.doi:10.1371/journal.pone.0004544.g004
Convergence of Signatures
PLoS ONE | www.plosone.org 6 February 2009 | Volume 4 | Issue 2 | e4544

Convergence of Signatures
PLoS ONE | www.plosone.org 7 February 2009 | Volume 4 | Issue 2 | e4544

S1A). Consequently, examination of the proportion of GO
annotations in the one-hop neighborhood of this signature
identified over-representations of terms related to cell proliferation
and death, while the direct interactors only showed over-
representation of terms associated with the immune system (Figure
S1B). Thus, although the gene products with prognostic value for
ER-negative breast cancer are not directly connected to the
common processes identified above, they are significantly
associated in a second term, as well as transcriptionally co-
expressed and co-regulated with many signatures.
Evaluation of properties and interactions in independentdatasets
The observations described above were evaluated in two
independently generated signatures of cancer conditions. A recent
study described a lung metastasis signature of breast cancer using a
different methodological approach [46]. We found ,70% (15/21)
of the genes in this signature to contain E2F TRANSFAC motifs
and ,60% (13/21) to be targets of E2F1-AP2 and/or ER. In
addition, significant correlations with eight prognostic signatures
were identified, seven of them of breast cancer (empirical P
values,0.001) (results of the analyses of this signature are detailed
in Table S2). The correlation with Mitosis was higher than
expected (empirical P,0.001), while the correlation with Cell
Death was non-significant (empirical P = 0.18). Finally, gene
products in this signature showed smaller average shortest paths
than expected with 21 of the 28 signatures, including Cell Death,
Mitosis and the lung metastasis signature presented previously [31]
(empirical P values,0.05).
To further corroborate our observations, we selected a
different neoplastic condition from the recent literature:
metastatic colorectal cancer treated with the EGFR inhibitor
cetuximab (ErbituxH) [47]. Previous studies suggest that EGFR
mutations are associated with the response to TKIs but not to
cetuximab [48,49]. We evaluated our observations by examining
the distribution of gene annotations in the rank of hazard ratios
(HRs) that measures the response to cetuximab treatment by
progression-free survival. In this analysis, cell proliferation and
the immune response were identified as the processes with the
greatest effect on the response (Fig. 6). Importantly, the set of
genes whose high expression most strongly associate to response
was for a wound-like phenotype that was previously shown to
provide prognosis value for breast, lung and gastric cancer [50].
The next associated high-expression sets were for doxorubicin
treatment in gastric cancer, breast cancer prognosis (70-gene)
and prognosis of different cancer types not examined in this
study (hepatocellular carcinoma and multiple myeloma progno-
sis). Moreover, high-expression of E2F1, hypoxia and MYC
targets was also associated with the response with similar
strength (Fig. 6A). Collectively, these observations endorse the
biological convergence of signatures.
The analysis of the cetuximab dataset also revealed a
complementary behavior of cell proliferation and the immune
response consistent with the representation of E2F1 motifs shown
above. Patients with high expression of cell proliferation-related
genes and low expression of immune response-related genes
responded to treatment (Fig. 6B), whilst there were no patients
with high expression values of both processes. Hence, a strong
anti-correlation was observed between genes annotated with the
GO term Immune Response and genes annotated with Mitosis
(r = 20.79) (Fig. 6C). This observation leads to speculate that these
processes play balancing roles in prognosis and treatment
response. Good responders to cetuximab may show strong
dependence on a ‘‘cell proliferation-on’’ molecular program, while
non-responders could be sensitive to immune system-based
therapy.
Discussion
Despite the low degree of overlap in terms of gene identity,
apparently dissimilar cancer signatures converge on specific
biological processes. Convergence is defined by significant
molecular and functional associations between genes and/or
proteins: i/ predicted promoter motifs; ii/ experimentally
identified DNA binding sites; iii/ cell cycle-periodic profiles;
iv/ ER-mediated transcriptional regulation; v/ co-expression
with defined transcription factors; vi/ co-expression between
signatures and with specific GO gene sets; and, vii/ close
proximity in the interactome network and neighborhood over-
representation in these same GO terms. Consequently, this study
suggests the existence of common design principles in a system-
level cellular model—illustrated by transcriptome-interactome
correlations—not only of prognostic signatures but also of
metastasis and treatment response signatures. Overall, the
integrative study highlights the importance of analyzing
signatures beyond gene names, which provides a better global
understanding by revealing previously unidentified properties
and associations.
Biological convergence has important implications for the
interpretation of signatures. Given a single gene whose transcript
levels are associated with differences in patient outcome, this
observation should be interpreted a priori in the context of cell
proliferation, death or the immune response processes. For
example, BRCA1 and BRCA2 have different cellular functions,
with a degree of overlap, but each of them is present in several
prognostic and predictive signatures, probably because their
transcript levels reproduce precisely the potential for cell
proliferation. This potential is defined by the presence of genes
with periodic expression through the cell cycle, and other analyses
at the genome, transcriptome and proteome levels shown here
provide strong evidence of common properties and interactions.
Therefore, further conclusions concerning gene functions such as
DNA repair and its role in prognosis should be considered,
controlling for the possible confounding effect of biological
convergence.
From a mechanistic point of view, this study indicates the
existence of a cancer cell phenotype that decisively influences
critical aspects of neoplasia. This observation follows on from the
long-known global importance of the potential for cell prolifera-
Figure 5. Proximity between gene products of signatures in the interactome network. A, heat map of average shortest paths betweenproteins encoded by signatures. This analysis was performed using only the giant network component. An example of shortest path differences withrespect to the giant component is shown in the right panel for the comparison between the complete Cell Death and Mitosis GO sets. B, heat map ofcomparisons of 1,000 randomly selected 50-protein sets in the giant component. Right panel, density plot of average shortest path in randomlyselected sets: the 5% lower values are highlighted, which correspond to an average shortest path ,4.09. Comparisons between signatures below thisempirical cut-off are shown by dots in A. C, left panel, network representation of average shortest paths between Cell Death and Mitosis and cancersignatures as shown in the inset. Edges lengths are proportional to the average shortest path values. Right panel, network representation of averageshortest paths between Cell Death and Mitosis and cancer signatures or randomly selected protein sets with equivalent degree centrality.doi:10.1371/journal.pone.0004544.g005
Convergence of Signatures
PLoS ONE | www.plosone.org 8 February 2009 | Volume 4 | Issue 2 | e4544

tion and repressed cell death in tumorigenesis [51], while
reinforcing the emerging role of the immune response in prognosis
and prediction [39]. However, while this study provides the first
evidence of convergence of prognostic, metastasis and predictive
signatures in these processes, other processes or signaling pathways
are probably represented and specificities may exist. For instance,
the potential for metastasis also depends on the activity of
processes such as extracellular matrix remodeling. Similar systems-
level analyses of a larger number of metastasis signatures may
reveal properties masked here by the restriction of the study to
mainly prognostic and predictive sets. Nonetheless, some prog-
nostic or predictive sets are not independent of the potential for
developing metastasis [10]. Future research may reveal a more
complex molecular wiring diagram of the processes participating
in cancer signatures.
Materials and Methods
Cancer signaturesWe compiled 28 signatures from 24 studies, comprising 19
prognostic signatures, two signatures focused mainly on metastasis,
and seven predictive treatment response signatures, as detailed in
Table S1. Note that the 21-gene breast cancer prognosis signature
was originally described as a predictive set for tamoxifen treatment
[52] and the intrinsic subtype signature [53] corresponds to a
validated set taken from the original report [13]. We also
examined the wound response prognosis signature without
including the initially identified cell cycle-associated genes [40]
and the predictive signature for dasatinib treatment response
subdivided for prostate and breast cancer [54]. Gene names or
microarray probes were taken from the original publications and
Figure 6. Asymmetric distribution of gene annotations in the response to cetuximab treatment. A, left panel, GSEA results for thestrongest associated phenotype with high-expression genes predicting treatment response (log2 HR.0). Central panel, expression analysis plot ofthe extreme gene expression (EREG), which was also noted in the original publication [47]. Right panel, additional phenotypic and GO term sets withhigh-expression genes associated to treatment response at FDR Q values,1%. B, left panel, GSEA results for the strongest associated phenotype withlow-expression genes predicting treatment response (log2 HR,0). Central panel, expression analysis plot of the extreme gene expression (IL15). Rightpanel, additional phenotypic and GO term sets with low-expression genes associated to treatment response at FDR Q values,1%. C, Histogram plotof average expression values of genes annotated with the Immune Response or Mitosis across samples in the cetuximab dataset. Average GO setexpression values show a negative correlation with ordered metastatic samples.doi:10.1371/journal.pone.0004544.g006
Convergence of Signatures
PLoS ONE | www.plosone.org 9 February 2009 | Volume 4 | Issue 2 | e4544
mapped to Entrez GeneIDs using the BioMart and Bioconductor
[55] tools and by manual curation of each signature.
Genomic analysesTranscription factor (TF) motifs in promoter sequences
1 kilobase (kb) upstream of the transcription start site were
predicted using MatScan [56] and position weight matrices from
JASPAR [57] and TRANSFAC [58] (111 and 625 motifs,
respectively). Probabilities were calculated using the Poisson
distribution as an approximation to the binomial as follows
f k,lð Þ~ lk :e{l
k!
n o(where l~n:p, p~proportion of genes with a
defined motif that are part of the signature and n = total number of
genes with this motif in the genome). Promoter sequences (21 kb)
of Ensembl protein-encoding gene entries (n<18,800) were used as
a common reference for the motif analyses. Corrections for
multiple comparisons were computed using the false discovery rate
(FDR) approach [59]. Chromatin immunoprecipitation data and
periodically expressed genes were taken from the respective
references [23,24,28] or from the relevant repositories [29] and
examined using the same methodology. The ER binding sites
identified by chromatin immunoprecipitation assays were assigned
to a single GeneID based on the closest known gene locus (59-end)
in the May 2004 version of the human genome in the UCSC
Genome Browser.
Transcriptomic analysesTranscriptional targets of the ER signaling pathway were
examined using preprocessed and normalized data [29]. Correla-
tions of transcription factors were performed by defining differen-
tially expressed genes at FDR,1% in breast cancer prognosis
measured with metastasis events within 5 years [12], which
correspond to 179 microarray probes, or by defining differentially
expressed genes at FDR,5% in docetaxel treatment response [37],
which correspond to 1,525 probes. Differences in PCC distributions
were assessed using the Mann-Whitney (MW) and Kolmogorov
Smirnov non-parametric tests, with similar results. Average
correlations in pairwise signature comparisons were calculated
using all probes in the signature gene lists and compared to
equivalent probe sets randomly selected from the same breast
cancer dataset [40]. Dimensionality was reduced by applying a
principal component analysis (PCA) until ,80% of the variance in
gene expression was captured, which represented ,25 genes in the
Cell Death or Mitosis Gene Ontology (GO) sets (originally
containing 58 and 117 genes, respectively). For the analysis of
cetuximab treatment response, we computed a Cox proportional
hazards model for each microarray probe, using the progression-
free survival as the time variable, and dividing the sample set into
two equally-sized groups according to the expression level of the
corresponding probe (low versus high). Ranks according to the log-
hazard ratio were used as input lists for the Gene Set Enrichment
Analysis (GSEA) [60]. The GSEA was run for all curated and GO
datasets found in MSigDB database. We used default values for all
the parameters except for the median probe instead of the max
probe as the collapse method when multiple probe sets map to the
same gene. The evaluation of correlation between the Immune
Response (n = 311) and Mitosis GO sets in the dataset of cetuximab
treatment response was performed averaging expression values of
both gene sets in each metastasis sample. The R programming
language was used for analyses and graphics.
Interactome analysesThe human interactome network was built by combining
three previously published datasets consisting mainly of
experimentally verified interactions [41]. The dataset based on
the Human Protein Reference Database (HPRD) contains
compiled and filtered binary protein interactions from available
databases. High-confidence yeast two-hybrid interactions were
then incorporated and orthology-based predictions and homo-
dimers were excluded to avoid specific bias. Proteins with no
assigned GeneID were also excluded from our analyses. The
numbers of proteins or nodes and interactions or edges in the
complete dataset were 8,519 and 35,492, respectively. The
percentage of signature gene products mapped in this dataset
ranged between 40 and 85. Shortest paths were calculated using
only the giant network component and the geodesic formulation
given by Freeman in the R programming language [41].
Differences in the distributions of shortest paths were assessed
using the MW test. Empirical simulations using 50-protein sets
were selected as the average size of cancer signatures, using only
nodes from the giant component with average degree centrality
equivalent to the signatures. The average degree of signatures,
excluding three outliers that contain widely studied genes (21-
gene, dasatinib prostate and breast, and EGFR TKIs), was 7.48,
while the average degree of 1,000 random sets was 7.53. To
evaluate the relationship between gene co-expression and
interactome distances, a correlation coefficient was calculated
between average PCCs in each signature-pair and the
corresponding average short path in the giant network
component, which was then evaluated to the null hypothesis
of no-correlation between the two measures using the Mantel
test. The representation of GO terms in neighborhoods was
assessed using the shortest path measure and the hypergeometric
distribution and FDR P value adjustment, taking as a reference
all proteins in the giant component and excluding signature
proteins in each case. The Onto-Express tool was used for this
analysis [61].
Supporting Information
Figure S1 Topological associations of the immune response
signature in the interactome network. A, left panel, shortest path
distributions between the immune response and the Cell Death
and Mitosis sets (yellow and green curves, respectively) relative to
the giant component (black curve). Right panel, strategy for
evaluating differences in proportions of GO annotations in the
direct and one-hop interactome network neighborhoods. B, over-
represented GO terms in the direct and one-hop neighborhoods of
the immune response signature.
Found at: doi:10.1371/journal.pone.0004544.s001 (2.22 MB EPS)
Table S1
Found at: doi:10.1371/journal.pone.0004544.s002 (0.03 MB
XLS)
Table S2
Found at: doi:10.1371/journal.pone.0004544.s003 (0.03 MB
XLS)
Acknowledgments
We thank Javier Dıez for helpful comments and for contributing to
discussions on this study.
Author Contributions
Conceived and designed the experiments: XS NLB MAP. Performed the
experiments: XS NB NLB AB. Analyzed the data: XS NB NLB AB PH
OR FC. Contributed reagents/materials/analysis tools: CAM HA AU SdS
FC GC VM MAP. Wrote the paper: MAP.
Convergence of Signatures
PLoS ONE | www.plosone.org 10 February 2009 | Volume 4 | Issue 2 | e4544

References
1. Nuyten DS, van de Vijver MJ (2008) Using microarray analysis as a prognostic
and predictive tool in oncology: focus on breast cancer and normal tissuetoxicity. Semin Radiat Oncol 18: 105–114.
2. Morris SR, Carey LA (2007) Gene expression profiling in breast cancer. Curr
Opin Oncol 19: 547–551.
3. Michiels S, Koscielny S, Hill C (2007) Interpretation of microarray data incancer. Br J Cancer 96: 1155–1158.
4. Eden P, Ritz C, Rose C, Ferno M, Peterson C (2004) ‘‘Good Old’’ clinical
markers have similar power in breast cancer prognosis as microarray geneexpression profilers. Eur J Cancer 40: 1837–1841.
5. Lin YH, Friederichs J, Black MA, Mages J, Rosenberg R, et al. (2007) Multiple
gene expression classifiers from different array platforms predict poor prognosisof colorectal cancer. Clin Cancer Res 13: 498–507.
6. Sherlock G (2005) Of fish and chips. Nat Methods 2: 329–330.
7. Son CG, Bilke S, Davis S, Greer BT, Wei JS, et al. (2005) Database of
mRNA gene expression profiles of multiple human organs. Genome Res 15:443–450.
8. Ein-Dor L, Zuk O, Domany E (2006) Thousands of samples are needed to
generate a robust gene list for predicting outcome in cancer. Proc Natl AcadSci U S A 103: 5923–5928.
9. Roepman P, Kemmeren P, Wessels LF, Slootweg PJ, Holstege FC (2006)
Multiple robust signatures for detecting lymph node metastasis in head and neckcancer. Cancer Res 66: 2361–2366.
10. Fan C, Oh DS, Wessels L, Weigelt B, Nuyten DS, et al. (2006) Concordance
among gene-expression-based predictors for breast cancer. N Engl J Med 355:560–569.
11. Massague J (2007) Sorting out breast-cancer gene signatures. N Engl J Med 356:
294–297.
12. van ’t Veer LJ, Dai H, van de Vijver MJ, He YD, Hart AA, et al. (2002) Geneexpression profiling predicts clinical outcome of breast cancer. Nature 415:
530–536.
13. Perou CM, Sorlie T, Eisen MB, van de Rijn M, Jeffrey SS, et al. (2000)Molecular portraits of human breast tumours. Nature 406: 747–752.
14. Chang JT, Nevins JR (2006) GATHER: a systems approach to interpreting
genomic signatures. Bioinformatics 22: 2926–2933.
15. Wennmalm K, Miller LD, Bergh J (2007) A gene signature in breast cancer.N Engl J Med 356: 1887–1888; author reply 1887–1888.
16. Yu JX, Sieuwerts AM, Zhang Y, Martens JW, Smid M, et al. (2007) Pathway
analysis of gene signatures predicting metastasis of node-negative primary breastcancer. BMC Cancer 7: 182.
17. Shen R, Ghosh D, Chinnaiyan AM (2004) Prognostic meta-signature of breast
cancer developed by two-stage mixture modeling of microarray data. BMCGenomics 5: 94.
18. Zhang Z, Chen D, Fenstermacher DA (2007) Integrated analysis of independent
gene expression microarray datasets improves the predictability of breast canceroutcome. BMC Genomics 8: 331.
19. Vuaroqueaux V, Urban P, Labuhn M, Delorenzi M, Wirapati P, et al. (2007)
Low E2F1 transcript levels are a strong determinant of favorable breast canceroutcome. Breast Cancer Res 9: R33.
20. Hernandez P, Sole X, Valls J, Moreno V, Capella G, et al. (2007) Integrative
analysis of a cancer somatic mutome. Mol Cancer 6: 13.
21. Shen R, Chinnaiyan AM, Ghosh D (2008) Pathway analysis reveals functionalconvergence of gene expression profiles in breast cancer. BMC Med Genomics
1: 28.
22. Teschendorff AE, Miremadi A, Pinder SE, Ellis IO, Caldas C (2007) Animmune response gene expression module identifies a good prognosis subtype in
estrogen receptor negative breast cancer. Genome Biol 8: R157.
23. Balciunaite E, Spektor A, Lents NH, Cam H, Te Riele H, et al. (2005) Pocketprotein complexes are recruited to distinct targets in quiescent and proliferating
cells. Mol Cell Biol 25: 8166–8178.
24. Jin VX, Rabinovich A, Squazzo SL, Green R, Farnham PJ (2006) Acomputational genomics approach to identify cis-regulatory modules from
chromatin immunoprecipitation microarray data–a case study using E2F1.
Genome Res 16: 1585–1595.25. Hallstrom TC, Mori S, Nevins JR (2008) An E2F1-dependent gene expression
program that determines the balance between proliferation and cell death.
Cancer Cell 13: 11–22.26. Du W, Pogoriler J (2006) Retinoblastoma family genes. Oncogene 25:
5190–5200.
27. Rhodes DR, Kalyana-Sundaram S, Mahavisno V, Barrette TR, Ghosh D, et al.(2005) Mining for regulatory programs in the cancer transcriptome. Nat Genet
37: 579–583.
28. Whitfield ML, Sherlock G, Saldanha AJ, Murray JI, Ball CA, et al. (2002)Identification of genes periodically expressed in the human cell cycle and their
expression in tumors. Mol Biol Cell 13: 1977–2000.
29. Carroll JS, Meyer CA, Song J, Li W, Geistlinger TR, et al. (2006) Genome-wide
analysis of estrogen receptor binding sites. Nat Genet 38: 1289–1297.30. Butt AJ, Sutherland RL, Musgrove EA (2007) Live or let die: oestrogen
regulation of survival signalling in endocrine response. Breast Cancer Res 9: 306.
31. Minn AJ, Gupta GP, Siegel PM, Bos PD, Shu W, et al. (2005) Genes thatmediate breast cancer metastasis to lung. Nature 436: 518–524.
32. Krones-Herzig A, Mittal S, Yule K, Liang H, English C, et al. (2005) Early
growth response 1 acts as a tumor suppressor in vivo and in vitro via regulation
of p53. Cancer Res 65: 5133–5143.
33. Fahmy RG, Dass CR, Sun LQ, Chesterman CN, Khachigian LM (2003)
Transcription factor Egr-1 supports FGF-dependent angiogenesis during
neovascularization and tumor growth. Nat Med 9: 1026–1032.
34. Ishikawa H, Shozu M, Okada M, Inukai M, Zhang B, et al. (2007) Early growth
response gene-1 plays a pivotal role in down-regulation of a cohort of genes in
uterine leiomyoma. J Mol Endocrinol 39: 333–341.
35. Adler AS, Lin M, Horlings H, Nuyten DS, van de Vijver MJ, et al. (2006)
Genetic regulators of large-scale transcriptional signatures in cancer. Nat Genet
38: 421–430.
36. Pliskova M, Vondracek J, Vojtesek B, Kozubik A, Machala M (2005)
Deregulation of cell proliferation by polycyclic aromatic hydrocarbons in
human breast carcinoma MCF-7 cells reflects both genotoxic and nongenotoxic
events. Toxicol Sci 83: 246–256.
37. Chang JC, Wooten EC, Tsimelzon A, Hilsenbeck SG, Gutierrez MC, et al.
(2005) Patterns of resistance and incomplete response to docetaxel by
gene expression profiling in breast cancer patients. J Clin Oncol 23:
1169–1177.
38. Greig KT, Carotta S, Nutt SL (2008) Critical roles for c-Myb in hematopoietic
progenitor cells. Semin Immunol.
39. Ambs S, Marincola FM, Thurin M (2008) Profiling of immune response to guide
cancer diagnosis, prognosis, and prediction of therapy. Cancer Res 68:
4031–4033.
40. Chang HY, Nuyten DS, Sneddon JB, Hastie T, Tibshirani R, et al. (2005)
Robustness, scalability, and integration of a wound-response gene expression
signature in predicting breast cancer survival. Proc Natl Acad Sci U S A 102:
3738–3743.
41. Hernandez P, Huerta-Cepas J, Montaner D, Al-Shahrour F, Valls J, et al. (2007)
Evidence for systems-level molecular mechanisms of tumorigenesis. BMC
Genomics 8: 185.
42. Ge H, Liu Z, Church GM, Vidal M (2001) Correlation between transcriptome
and interactome mapping data from Saccharomyces cerevisiae. Nat Genet 29:
482–486.
43. Grigoriev A (2001) A relationship between gene expression and protein
interactions on the proteome scale: analysis of the bacteriophage T7 and the
yeast Saccharomyces cerevisiae. Nucleic Acids Res 29: 3513–3519.
44. Jansen R, Greenbaum D, Gerstein M (2002) Relating whole-genome expression
data with protein-protein interactions. Genome Res 12: 37–46.
45. Kemmeren P, van Berkum NL, Vilo J, Bijma T, Donders R, et al. (2002) Protein
interaction verification and functional annotation by integrated analysis of
genome-scale data. Mol Cell 9: 1133–1143.
46. Landemaine T, Jackson A, Bellahcene A, Rucci N, Sin S, et al. (2008) A Six-
Gene Signature Predicting Breast Cancer Lung Metastasis. Cancer Res 68:
6092–6099.
47. Khambata-Ford S, Garrett CR, Meropol NJ, Basik M, Harbison CT, et al.
(2007) Expression of epiregulin and amphiregulin and K-ras mutation status
predict disease control in metastatic colorectal cancer patients treated with
cetuximab. J Clin Oncol 25: 3230–3237.
48. Janne PA, Engelman JA, Johnson BE (2005) Epidermal growth factor receptor
mutations in non-small-cell lung cancer: implications for treatment and tumor
biology. J Clin Oncol 23: 3227–3234.
49. Tsuchihashi Z, Khambata-Ford S, Hanna N, Janne PA (2005) Responsiveness to
cetuximab without mutations in EGFR. N Engl J Med 353: 208–209.
50. Chang HY, Sneddon JB, Alizadeh AA, Sood R, West RB, et al. (2004)
Gene expression signature of fibroblast serum response predicts human
cancer progression: similarities between tumors and wounds. PLoS Biol 2:
E7.
51. Hanahan D, Weinberg RA (2000) The hallmarks of cancer. Cell 100: 57–70.
52. Paik S, Shak S, Tang G, Kim C, Baker J, et al. (2004) A multigene assay to
predict recurrence of tamoxifen-treated, node-negative breast cancer.
N Engl J Med 351: 2817–2826.
53. Hu Z, Fan C, Oh DS, Marron JS, He X, et al. (2006) The molecular
portraits of breast tumors are conserved across microarray platforms. BMC
Genomics 7: 96.
54. Wang XD, Reeves K, Luo FR, Xu LA, Lee F, et al. (2007) Identification of
candidate predictive and surrogate molecular markers for dasatinib in prostate
cancer: rationale for patient selection and efficacy monitoring. Genome Biol 8:
R255.
55. Durinck S, Moreau Y, Kasprzyk A, Davis S, De Moor B, et al. (2005) BioMart
and Bioconductor: a powerful link between biological databases and microarray
data analysis. Bioinformatics 21: 3439–3440.
56. Blanco E, Messeguer X, Smith TF, Guigo R (2006) Transcription factor map
alignment of promoter regions. PLoS Comput Biol 2: e49.
57. Bryne JC, Valen E, Tang MH, Marstrand T, Winther O, et al. (2007)
JASPAR, the open access database of transcription factor-binding
profiles: new content and tools in the 2008 update. Nucleic Acids Res 36:
D102–106.
Convergence of Signatures
PLoS ONE | www.plosone.org 11 February 2009 | Volume 4 | Issue 2 | e4544

58. Matys V, Fricke E, Geffers R, Gossling E, Haubrock M, et al. (2003)
TRANSFAC: transcriptional regulation, from patterns to profiles. Nucleic AcidsRes 31: 374–378.
59. Benjamini Y, Hochberg Y (1995) Controlling the false discovery rate: a practical
and powerful approach to multiple testing. Journal of the Royal StatisticalSociety Series B-Statistical Methodology 57: 289–300.
60. Subramanian A, Kuehn H, Gould J, Tamayo P, Mesirov JP (2007) GSEA-P: a
desktop application for Gene Set Enrichment Analysis. Bioinformatics 23:3251–3253.
61. Khatri P, Voichita C, Kattan K, Ansari N, Khatri A, et al. (2007) Onto-
Tools: new additions and improvements in 2006. Nucleic Acids Res 35:W206–211.
Convergence of Signatures
PLoS ONE | www.plosone.org 12 February 2009 | Volume 4 | Issue 2 | e4544