Random Variable With Stochastic
8
Research Article Application of Gray Markov SCGM(1,1) c Model to Prediction of Accidents Deaths in Coal Mining Jian-yi Lan and Ying Zhou School of Energy Science and Engineering, Henan Polytechnic University, Jiaozuo 454000, China Correspondence should be addressed to Jian-yi Lan; [email protected] Received 30 July 2014; Revised 28 September 2014; Accepted 28 September 2014; Published 4 November 2014 Academic Editor: Vladimir Strezov Copyright © 2014 J.-y. Lan and Y. Zhou. is is an open access article distributed under the Creative Commons Attribution License, which permits unrestricted use, distribution, and reproduction in any medium, provided the original work is properly cited. e prediction of mine accident is the basis of aviation safety assessment and decision making. Gray prediction is suitable for such kinds of system objects with few data, short time, and little fluctuation, and Markov chain theory is just suitable for forecasting stochastic fluctuating dynamic process. Analyzing the coal mine accident human error cause, combining the advantages of both Gray prediction and Markov theory, an amended Gray Markov SCGM(1,1) c model is proposed. e gray SCGM(1,1) c model is applied to imitate the development tendency of the mine safety accident, and adopt the amended model to improve prediction accuracy, while Markov prediction is used to predict the fluctuation along the tendency. Finally, the new model is applied to forecast the mine safety accident deaths from 1990 to 2010 in China, and, 2011–2014 coal accidents deaths were predicted. e results show that the new model not only discovers the trend of the mine human error accident death toll but also overcomes the random fluctuation of data affecting precision. It possesses stronger engineering application. 1. Introduction Coal is an important basic energy and raw material in China, and it accounts for 70% of primary energy [1]. However, due to the complexity and particularity of the coal mine, safety accidents cannot be well controlled, and it still is the key factor to restrict coal production capacity. On the other hand, the influence of coal mine safety accidents, in particular major accidents, is extremely bad, which can create serious losses to people’s life and property [2]. Mine production system is a complex system, and the combined effects on various factors lead to coal mine safety accidents. Many scholars and experts consider that human error or people’s unsafe behavior is the main reason for coal mine safety accidents by analyzing cause of accidents, and it accounts for more than 90% in all coal mine safety accidents [3–5]. Coal underground mining is used as the primary mining method in China, comparing to the surface mining, there are too many affecting factors in the underground, and human factors are the most important affecting factors in these factors. According to HFACS analysis methods in the coal mine accident, human factors are relatively complex and changeable [6], so more affecting data are unknown; it is a gray system. Low prediction accuracy can be avoided due to historical data lack or inaccuracy by applying the Gray SCGM(1,1) c model to predict the coal mine safety accidents. At present, main methods for predicting safety accident include experience model, regression model, and the gray prediction method. Ting et al. had predicted the highway accident by using the empirical model [7]. Xiao-fu and Ya-dong had applied regression model to forecast the ship traffic accident [8]. Using the regression models and empirical models to predict accident requires large amounts of historical data. However, accidents are mainly human error accident in the coal mine. Due to human error is affect by many factors, and in a dynamic time-varying system with low accident data and the non-line random changes, so it is not suitable to use these methods for prediction. In the gray accident prediction, Shan et al. had predicted mine safety accident use of unbiased gray model [9]. Meng and Cefeng had applied gray correlation on human error accident prediction in the nuclear power plant [10]. Mu-dan et al. and Rui-bo et al. had, respectively, applied the GM(1, 1) model and residual GM(1, 1) model to predict coal mine Hindawi Publishing Corporation International Scholarly Research Notices Volume 2014, Article ID 632804, 7 pages http://dx.doi.org/10.1155/2014/632804
Transcript of Random Variable With Stochastic
Research ArticleApplication of Gray Markov SCGM(11)c Model to Prediction ofAccidents Deaths in Coal Mining
Jian-yi Lan and Ying Zhou
School of Energy Science and Engineering Henan Polytechnic University Jiaozuo 454000 China
Correspondence should be addressed to Jian-yi Lan lanjy1972126com
Received 30 July 2014 Revised 28 September 2014 Accepted 28 September 2014 Published 4 November 2014
Academic Editor Vladimir Strezov
Copyright copy 2014 J-y Lan and Y ZhouThis is an open access article distributed under theCreative CommonsAttribution Licensewhich permits unrestricted use distribution and reproduction in any medium provided the original work is properly cited
The prediction of mine accident is the basis of aviation safety assessment and decision making Gray prediction is suitable for suchkinds of system objects with few data short time and little fluctuation and Markov chain theory is just suitable for forecastingstochastic fluctuating dynamic process Analyzing the coal mine accident human error cause combining the advantages of bothGray prediction andMarkov theory an amendedGrayMarkov SCGM(11)c model is proposedThegray SCGM(11)cmodel is appliedto imitate the development tendency of the mine safety accident and adopt the amended model to improve prediction accuracywhileMarkov prediction is used to predict the fluctuation along the tendency Finally the newmodel is applied to forecast theminesafety accident deaths from 1990 to 2010 in China and 2011ndash2014 coal accidents deaths were predicted The results show that thenew model not only discovers the trend of the mine human error accident death toll but also overcomes the random fluctuation ofdata affecting precision It possesses stronger engineering application
1 Introduction
Coal is an important basic energy and rawmaterial in Chinaand it accounts for 70 of primary energy [1] Howeverdue to the complexity and particularity of the coal minesafety accidents cannot be well controlled and it still is thekey factor to restrict coal production capacity On the otherhand the influence of coalmine safety accidents in particularmajor accidents is extremely bad which can create seriouslosses to peoplersquos life and property [2]
Mine production system is a complex system and thecombined effects on various factors lead to coal mine safetyaccidents Many scholars and experts consider that humanerror or peoplersquos unsafe behavior is the main reason for coalmine safety accidents by analyzing cause of accidents and itaccounts for more than 90 in all coal mine safety accidents[3ndash5] Coal underground mining is used as the primarymining method in China comparing to the surface miningthere are too many affecting factors in the undergroundand human factors are the most important affecting factorsin these factors According to HFACS analysis methods inthe coal mine accident human factors are relatively complex
and changeable [6] so more affecting data are unknown itis a gray system Low prediction accuracy can be avoideddue to historical data lack or inaccuracy by applying theGray SCGM(11)c model to predict the coal mine safetyaccidents At present main methods for predicting safetyaccident include experience model regression model andthe gray prediction method Ting et al had predicted thehighway accident by using the empirical model [7] Xiao-fuand Ya-dong had applied regression model to forecast theship traffic accident [8] Using the regression models andempirical models to predict accident requires large amountsof historical data However accidents aremainly human erroraccident in the coal mine Due to human error is affect bymany factors and in a dynamic time-varying system withlow accident data and the non-line random changes so itis not suitable to use these methods for prediction In thegray accident prediction Shan et al had predicted minesafety accident use of unbiased gray model [9] Meng andCefeng had applied gray correlation on human error accidentprediction in the nuclear power plant [10] Mu-dan et aland Rui-bo et al had respectively applied the GM(1 1)model and residual GM(1 1) model to predict coal mine
Hindawi Publishing CorporationInternational Scholarly Research NoticesVolume 2014 Article ID 632804 7 pageshttpdxdoiorg1011552014632804
2 International Scholarly Research Notices
accidents [11 12] Appling the gray model to predict accidentthe prediction effect and scope had been further improved[13 14] However qualitative analysis intensity should notbe impressive enough and the prediction accuracy shouldbe less if these gray models were individually applied Themain reason is that themodel requires data sequencemust beexponential distribution and fitting will be poor when datasequence fluctuations are comparatively large
Based on system cloud gray prediction model features in[15] combining the advantages of both Gray prediction andMarkov theory according to the coal mine accident deathsprovided by the State Administration of Coal Mine Safetyreferencing the literature [16 17] an amended Gray MarkovSCGM(11)c model is proposed The gray SCGM(11)c modelis applied to imitate the development tendency of the minesafety accident and the amended model is to improve pre-diction accuracy while Markov prediction is used to predictthe fluctuation along the tendency so as to further improvethe prediction accuracy on random volatile accident data
2 Establishing Prediction Model
21 Gray SCGM(11)c Model Established
211 Model Selection According to the actual accidentssituation in coal mine human error of the coal mines is notregular there are some characteristics which include occur-rences randomly scattered raw data samples lack and imper-fect and uncertain information Modeling is more difficultto use probabilistic statistical methods or mathematical sta-tistics Gray Markov SCGM(11)c prediction model possessesthese characteristic as less information required easy calcu-lation high accuracy and so on It does not list factors dataaffecting research object but finds useful information andexplores the inherent laws from their own time data sequenceestablishing model to predict The Gray Markov SCGM(11)cprediction model is the ideal model to forecast coal minesafety incidents
212 Data Processing Taking account of randomness ofhuman error data in mines original time series 119909(0) of coalmine safety accident deaths can be expressed
119909(0)= 119909(0)(1) 119909
(0)(2) 119909
(0)(119899) (1)
First 119909(0) is integrated as follows
119909(1)= 119909(1)(2) 119909
(1)(3) 119909
(1)(119899)
here 119909(1) (119896) =119896
sum
119898=2
119909(0)(119898) 119896 = 2 3 119899
(2)
119909(0) is a close mean value generated sequence for 119909(0)
119909(0)= 119909(0)(2) 119909
(0)(3) 119909
(0)(119899)
here 119909(0) (119896 + 1) = 119909(0)(119896 + 1) + 119909
(0)(119896)
2
(3)
213 Response Function Human error is random to leadaccidents in coal mine so majority of accidents are dynamicGiven that integral sequence of safety accident deaths timeseries is expressed as 119909(1)(119896) that is associated with satis-faction trend of nonhomogeneous index discrete function as119891119903(119896) = 119887119890
119886(119896minus1)minus 119888 thus the data of 119909(1)(119896) is fit to 119891119903(119896)
According to gray system cloud forecast method the systemgray SCGM(11)c prediction model can be expressed as
119889119909(1)(119896)
119889119896
= 119886119909(1)(119896) + 119880 119896 ge 2 (4)
Its time response function can be expressed as
119909(1)(119896) = [(119909
(1)(1) +
119880
119886
)] sdot 119890119886119896minus
119880
119886
(5)
Here
119886 = lnsum119899
119896=3 119909(0)(119896 minus 1) 119909
(0)(119896)
sum119899
119896=3 (119909(0)(119896 minus 1))
2
119887=
(119899 minus 1)sum119899
119896=2 119890119886(119896minus1)
119909(1)(119896) minus (sum
119899
119896=2 119890119886(119896minus1)
)(sum119899
119896=2 119909(1)(119896))
(119899 minus 1)sum119899
119896=2 1198902119886(119896minus1)
minus (sum119899
119896=2 119890119886(119896minus1)
)2
119888 =
1
119899 minus 1
[(
119899
sum
119896=2
119890119886(119896))119887 minus
119899
sum
119896=2
119909(1)(119896)]
(6)
Given 119909(1)(1) = 119887 minus 119888 119880 = 119886119888 119909(1)(119896) is reverted thesystem gray SCGM(11)c predictionmodel of original datawillbe expressed as
119909(0)(119896) =
2119887 (1 minus 119890minus119886)
1 + 119890minus119886
sdot 119890119886(119896minus1)
(7)
119884 (119896) =
119909(0)(119896)
119909(0)(119896)
(8)
120576 (119896) = 119909(0)(119896) minus 119909
(0)(119896) Δ119896 =
|120576 (119896)|
119909(0)(119896)
(9)
119884(119896) 120576(119896) and Δ119896 are gray fitting accuracy indicatorswhich reflected the degree of deviation of the predicted valuesto the original data
22 Establishment of the Residual Amended SCGM(11)cModel Statistics data fluctuations of coal mine accidentsdeaths are larger and the regularity is not very strong asuncertainty of the personrsquos behaviorTherefore the predictionaccuracy should not be too good if the SCGM(11)c model issolely applied to predict accident deaths of coalmine In orderto improve the prediction rate and better meet the actual sit-uation the prediction model should be corrected to improvethe accuracy Amended principle and steps are as follows
(1) The first time residuals data sequence is got inaccordance with the predicted value and actual value
120576(0)(119896) = 119909
(0)(119896) minus 119909
(0)(119896) 119896 = 1 2 119899 (10)
120576(0)(119896) = 120576
(0)(1) 120576(0)(2) 120576
(0)(119899) (11)
(2) Processing residuals correction sequence
International Scholarly Research Notices 3
Given 119872 = (1 + 119890minus119886)minus1(1 minus 119890
minus119886)119887 the SCGM(11)c
prediction will be expressed as 119909(0)(119896) = 2119890119886(119896minus1)
119872 If120576(0)(119896) ge 0 (119896 = 1 2 119899) the residual amended
SCGM(11)c model will be expressed as 120576(0)(119896) = 21198901198861(119896minus1)119872111988611198721 and 1198871 can be obtained in accordance with 119886119872 and119887 used methodThe first time residuals corrected SCGM(11)cmodel can be expressed as follows
119909(0)
1205761
(119896) = 2 (119890119886(119896minus1)
119872minus 1198901198861(119896minus1)
1198721) (12)
If 120576(0)(119896) lt 0 (119896 = 1 2 119899) the first time residualscorrected SCGM(11)c model can be expressed as follows
119909(0)
1205761
(119896) = 2 (119890119886(119896minus1)
119872+ 1198901198861(119896minus1)
1198721) (13)
In general a prediction model can be repeatedly cor-rected residuals and the residuals can be negative the timedimensions are also not equal If the first time residualsamendment cannot meet the forecast accuracy requiredit should do residual correction according to the aboveamended principles until the accuracy meets requirementsThe residual correction generic model can be expressed asfollows
119909(0)
120576119895
(119896) = 2(119890119886(119896minus1)
119872
119899
sum
119895=1
119890119886119895(119896minus1)
1198721) (14)
23 Establishment of Amended Markov SCGM(11)c ModelThe SCGM(11)c prediction fitting curve is essentially anexponential curve and the prediction result is a relativelysmooth curve Because human error accidents are main partof coal mine accidents the SCGM(11)c model solely appliedcannot meet forecast accuracy requirements Markov theoryhas no aftereffect that is to say ldquothe future state of the systemis only related to the current state and has nothing to dowith the past staterdquo Meanwhile Markov model is adoptedto predict states trends through probability transfers it canadapt to the randomness and variability of state ApplyingMarkov theory to correct the SCGM(11)c predictionmodel ofcoal mine accident deaths can better solve the variability andrandomness of accidents caused by human errors to improvethe prediction accuracy
231 State Divided The annual change of the number ofdeaths in coalmine accidents is a dynamic nonstationary ran-dom process and thus the prediction fitting precision indi-cators also are variability and randomness Because boundaryand connotation of the different annual state are changeablean adaptive state divided criterion needs to be determinedand the criterion should be consistent with basic timing trendof the coal mine accident deathsThus 119884(119896) was divided into119898 states and each state can be expressed as
119864119894 isin [otimes1119894 otimes2119894] 119894 = 1 2 119898 (15)
Here otimes1119894 = 119884(119896) + 119860 119894 otimes2119894 = 119884(119896) + 119861119894In the formula 119864119894 is expressed as 119894 state otimes1119894 and otimes2119894
are respectively expressed as the upper and lower bounds of
the 119894 state and119860 119894 and 119861119894 are constants determined accordingto prediction data Because119884(119896) is a time functionotimes1119894 andotimes2119894will be changed with time so the state possesses variability
When the state is divided the numbers of different inter-vals are reasonably divided according to the actual situationIf raw data are less the interval division should be less so as toincrease the number of transfers between the various statesand thus the transfer law can be more objectively reflectedbetween states Conversely if raw data are more the intervaldivision should be less in order to excavate more informationfrom a large number of data to improve the prediction accu-racy It is suitable to adapt clustering classification method todetermine class number and classification intervals due to lessdata and uncertain status of human error accidents in the coalmine
232 Construction of State Transition Rate Matrix The orig-inal number of samples is expressed as 119872119894119895(119896) from thestate 119864119894 transiting to the sate 119864119895 by 119896 step and the numberof occurrences of the state 119864119894 is expressed as 119872119894 so statetransition probability is expressed as follows
119875119894119895 (119896) =
119872119894119895 (119896)
119872119894
119894 119895 = 1 2 119898 (16)
119898times119898 state transition probability matrix can be obtainedas follows
119875 (119896) =
[
[
[
[
[
11987511 (119896) 11987512 (119896) sdot sdot sdot 1198751119898 (119896)
11987521 (119896) 11987522 (119896) sdot sdot sdot 1198752119898 (119896)
1198751198981 (119896) 1198751198982 (119896) sdot sdot sdot 119875119898119898 (119896)
]
]
]
]
]
(17)
233 The Predictive Value Determined The state transitionprobability matrix 119875(119896) reflects all statistical regularities ofstate transition and the future system state steering can bepredicted by investigating the matrix In the actual analysisof the process one step transition probability matrix 119875(1)is generally only examined Given that predicted momentobject is in the state 119864119896 investigating the 119896 row of 119875(1) canget the following
(1) If max119901119894119895 = 119901119896119897 the next time system should mostlikely shift from the state 119864119896 to the state 119864119897
(2) If there are two or more probability values identicalor similar to 119896 row in the matrix 119875(1) the futurestate steering will be difficult to determine it needsto consider probability transition matrix 119875(2) or 119875(119899)(119899 ge 3)
The systemrsquos future state will be determined by investi-gating state transition probability matrix and gray changeinterval of relative prediction value in the future momentsalso will be determined it can be expressed as [otimes1119894 otimes2119894]Predicted value of the future moment can be expressed as theinterval median as 1198841015840(119896)
1198841015840(119896) =
1199090(119896)
11990910158400(119896)
=
1
2
(otimes1119894 + otimes2119894) = 119884 (119896) +1
2
(119860 119894 + 119861119894)
(18)
4 International Scholarly Research Notices
0
1990
1991
1993
1995
1997
1999
1992
1994
1996
1998
2000
2001
2003
2005
2007
2009
2002
2004
2006
2008
2010
Year
0
2
4
6
Dea
th ra
te p
er
mill
ion
tons
Acci
dent
dea
th
roll
2
4
6
8times10
3
Accidents deathDeath rate per million tons
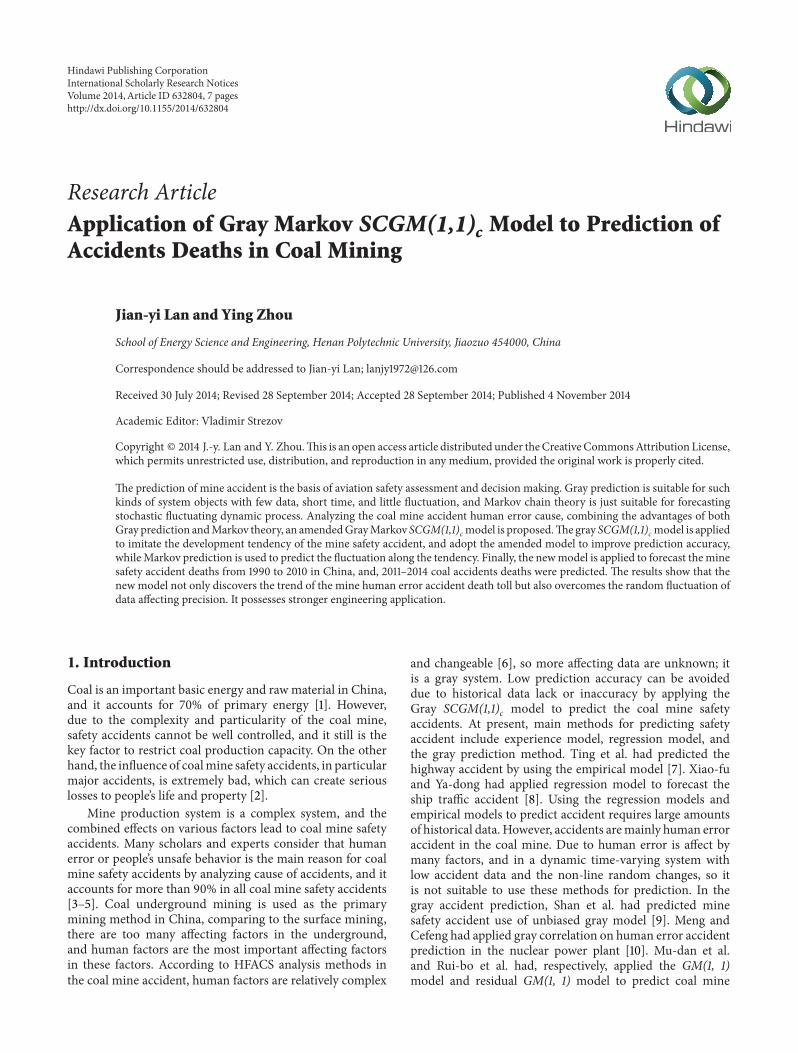
Figure 1 The statistics of megaton death rate and toll from 1990 to2010 in China
3 Forecast Instances
Chinese coal mining is primarily underground mining themain mining methods used include blasting mining generalmechanizedmining and comprehensivemechanizedminingfrom 1990 to 2010 Different methods lead to frequency ofthe coal mine accidents is not same In general blastingmining and general mechanized mining were usually appliedin the town local small coal mine their production capacityis relatively small and mining technology and managementlevel are relatively lower compared to large coal mines soaccidents rate is high In contrast to these small coal minesthe large state-owned coal mines mainly used comprehensivemechanized mining technology their production capacityis relatively large management level is relatively advancedand the accidents rate is lower Over the last decade dueto the small and medium sized coal mines integrated andstrengthened security management in China their pro-duction capacity and mining technology were graduallyimproved so the number of occurrences of accidents in thecoal mine was declined According to statistics data of 1990ndash2010 coal mine accident death provided by Coal Mine SafetyAdministration the trend of accidents deaths in coal minecan be fitted by applying the gray SCGM(11)c model andprediction accuracy can be improved by the residualmodifiedmodel Finally deaths are validly predicted by using thegray Markov SCGM(11)c model The raw data are shown inTable 1 the trend of coal mine accident deaths and death rateper million ton from 1990 to 2010 are shown in Figure 1
31 The Establishment of SCGM(11)c Model SCGM(11)cmodel of coal mine accident death toll is established by usingaccidents mortality data of coal mines from 1990 to 2010 inChina
119909(0)(119896) =
2119887 (1 minus 119890minus119886)
1 + 119890minus119886
sdot 119890119886(119896minus1)
(19)
In the prediction model (19) 119886 and 119887 are the mostimportant parameters they are mainly dependent on the rawdata to reflect the development trend of data Here coal mineaccident deaths for 20 years in China were taken as raw datato predict in order to find the trend of coal mine deathsTherefore it is important to select the sample data accordingto the formulas (5) and (6) 119886 and 119887 can be calculated Here119886 = minus0039436 119887 = minus236878
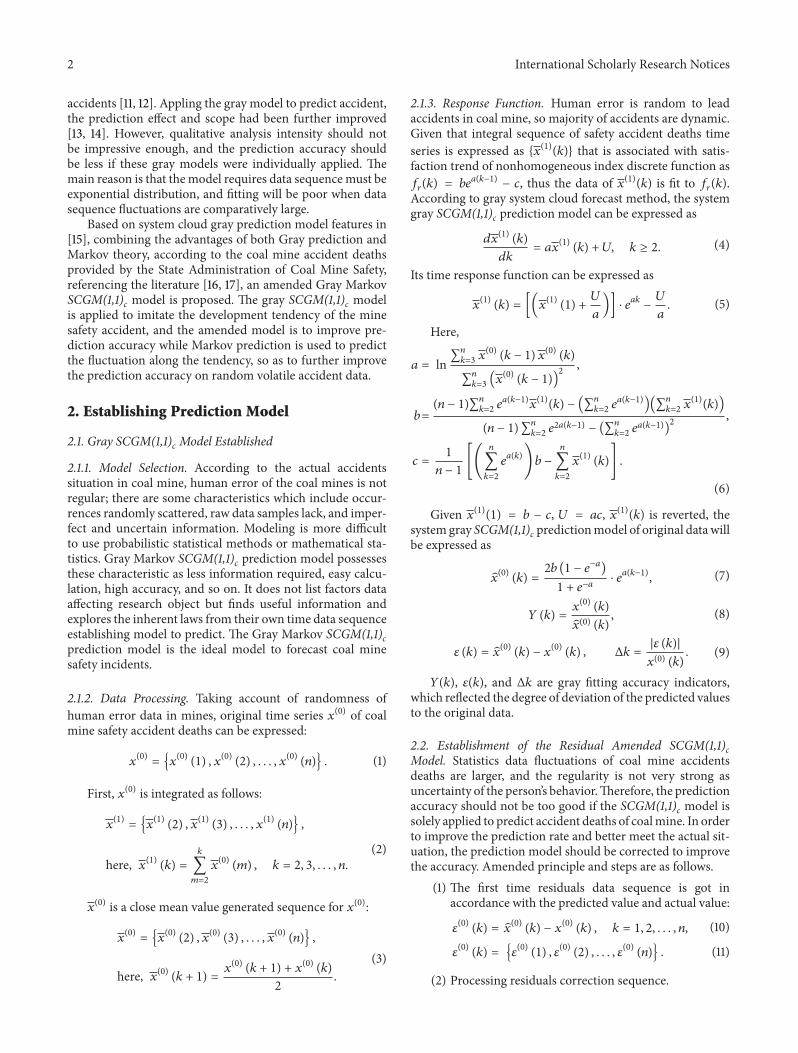
Table 1 Prediction and comparison of the coalmine accident deathsfrom 1990 to 2010 in China
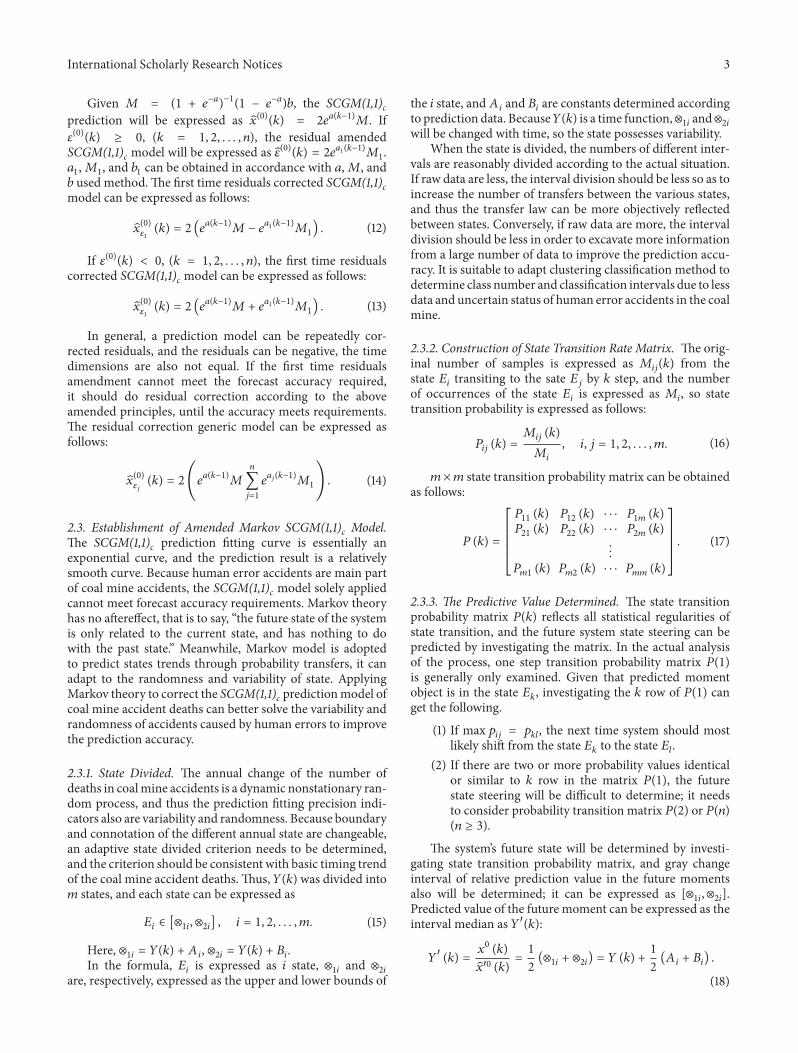
Year Actual value Prediction value1990 7185 01991 6269 77161992 5854 74511993 5152 71961994 6574 69491995 6222 67101996 6496 64791997 6141 62571998 6304 60421999 6478 58352000 5798 56352001 5670 54412002 6995 52542003 6702 50742004 6027 48992005 5986 47312006 4746 45692007 3786 44122008 2631 42612009 2631 41142010 2433 3987
Applying the formula (19) prediction value of coal minesafety accident deaths can be got and then the gray fittingaccuracy indicators also can be calculated by the formula(8) which reveal overall development trend of safety accidentdeath toll in coal mine Specific forecast and actual values areshown in Table 1
32 Residuals Corrected SCGM(11)c Forecast In accordancewith Table 1 according to (10) the residual initial sequencecan be attained and then one correction residual predictionmodel can be expressed as
120576(0)(119896) = 2119890
1198861(119896minus1) 1 minus 119890
1198861
1 + 1198901198861
1198871(20)
Here 1198861 = minus00632 1198871 = minus218276According to the formula (14) a residual modification
prediction value of safety accident deaths can be obtainedand the results are shown in Table 2
33 The Residual Modification Markov SCGM(11)c ForecastComparing Tables 1 and 2 it is shown that forecast fittingaccuracy of the SCGM(11)c model has been improved afterresidual modification but volatility of the gray fitting accu-racy indicators is larger from analyzing Table 2 In order tosolve this question it needs to adoptMarkov chain predictionfor further enhancing accuracy and lowering the volatilityThe prediction fitting indicators data in Table 2 are dividedto 4 states by hierarchical clustering and the results areshown in Table 3 The corresponding states of each year canbe determined according to the divided states and applying
International Scholarly Research Notices 5
Table 2 Prediction and comparison of the coal mine accidentdeaths from 1990 to 2010 in China
Year Actual value Amendedprediction value
Actualvalueprediction
value1990 71851991 6269 6501 961992 5854 6310 931993 5152 6125 841994 6574 5944 1111995 6222 5766 1081996 6496 5565 881997 6141 5425 1131998 6304 6823 931999 6478 6568 1192000 5798 6323 1182001 5670 6087 1112002 6995 5860 1142003 6702 5643 1192004 6027 5433 1112005 5986 5233 1142006 4746 5040 942007 3786 3970 952008 2631 3846 692009 2631 3725 712010 2433 3592 68
Table 3 State division of deaths prediction for coal mine
No Divided state Actual valuepredictionvalue
1198641 Strong decreasing year 60ndash751198642 Poor decreasing year 75ndash901198643 Poor increasing year 90ndash1051198644 Strong increasing year 105ndash120
the formula (16) the state transferred introductionmatrix canbe obtained and the first step state transitionmatrix is shownas follows
119875 (1) =
[
[
[
[
[
[
[
[
1 0 0 0
0 0 0 1
1
6
1
6
1
2
1
6
0
1
10
3
10
3
5
]
]
]
]
]
]
]
]
(21)
The future coal mine accident deaths toll can be predictedbased on the above state transition probability matrix acci-dent deaths in 2003 year be in the state E4 according tothe state transition probability method examining the statetransition probability matrix 119875(1) line 4 can get
max1199014119895 = 11990144 119895 = 1 2 3 4 (22)
0
2004
2005
2007
2009
2011
2013
2006
2008
2010
2012
2004
2005
2007
2009
2011
2013
2006
2008
2010
2012
Years
Years
Actual value
Acci
dent
de
aths
2
4
6
Pred
ictio
n er
ror
times103
2
1
0
SCGM(11)c model
SCGM(11)c model
Amended SCGM(11)c model
Amended SCGM(11)c model
Markov SCGM(11)c model
Markov SCGM(11)c model
Figure 2 Curve fitting about coal mine death toll of differentprediction models and error analysis chart
After a year transition under the control of coal mineaccidents the death toll of coal mine accidents in 2004 wasmost likely in the stateE4 According toTable 3 interval of thestateE3 is [105 12] that isotimes13 = 105 andotimes12 = 12 Becauseotimes1119894 = 119884(119896) + 119860 119894 otimes2119894 = 119884(119896) + 119861119894 and 119884(119896) = 119 in 2004according to Table 2 119860 119894 = otimes13 minus 119884(119870) = 105 minus 119 = minus014119861119894 = otimes23 minus 119884(119896) = 12 minus 119 = 001 Using the gray MarkovSCGM(11)c model the death toll of coal mine accidents in2008 is most likely expressed as
1198841015840(119896) = 119884 (119870) +
1
2
(119860 119894 + 119861119894)
= 119 +
1
2
(minus014 + 001) = 1125
1199091015840(0)
(2004) = 1199091015840(0)
(2004) sdot 1198841015840(119896) = 5433 times 1125 asymp 6112
(23)
In general in order to facilitate the calculation the aboveequation can also be expressed as
1199091015840(0)
(2004) = 1199091015840(0)
(2004) sdot
1
2
(otimes13 + otimes23)
= 5433 times
1
2
(105 + 120) = 6112
(24)
Similarly according to the formula (21) and Table 2accidents deaths of coal mine from 2004 to 2013 can bepredicted prediction error comparison of the amended resid-uals SCGM(11)c model and the amended residuals MarkovSCGM(11)c is shown in Table 4
Error analysis and predictive value fitting of three meth-ods are shown in Figure 2
Comparing Tables 1 2 and 4 we know that Table 2was amended by using residuals prediction model on
6 International Scholarly Research Notices
Table 4 Prediction comparison of deaths from 2004 to 2013
Year Actual value Amended 119878119862119866119872(1 1)119888 model Amended Markov 119878119862119866119872(1 1)119888 modelPrediction value Relative error Prediction value Relative error
2004 6027 5433 0099 6112 00142005 5986 5233 0126 5887 00172006 4746 5040 0062 4914 00352007 3786 3970 0049 3870 00222008 2631 3846 0462 3749 04252009 2631 3725 0416 2328 01152010 2433 3592 0476 2424 00042011 1973 3357 0701 2265 01472012 1384 2142 0548 1446 00452013 1067 1934 0813 1305 0223
the basis of Table 1 and the prediction accuracy had beenappropriately improved For Table 4 comparing the residualamended model and Markov prediction model can be seenthat the residual amended SCGM(11)c model cannot handleabnormal events because its prediction parameters are fixedAs Chinarsquos coal enterprises are affected by the economicsituation form abroad and home their production had beenin low period and some coal was not continuously producedtheywere basically in an abnormal state in the last three yearsso these factors would have a big impact on mine accidentforecast National and local government paid more attentionto safety management in the coal mine and each coal minestrengthened management and prevention on human errorthey would also affect the accuracy of general forecastingmethods However theMarkov SCGM(11)c predictionmodelis only depend on the previous state the relationship withother states is very small so it very better solves the abnormalaccident Its prediction error is significantly smaller thanthat of the amended SCGM(11)c model On the other handcomparing accidents deaths of coal mine from 2004 to 2013in China the number of deaths was 6027 in 2004 and thisfigure became 1067 in 2013 in the recent ten years theaverage decline rate of accidents deaths in coal mine is 168According to this downward trend accidents deaths of coalmine in China will be about 889 in 2014
As Figure 2 shows that the fitting degree of the MarkovSCGM(11)c model is the best the amended SCGM(11)c isbetter and SCGM(11)c model is the worstWhile error changeof the Markov SCGM(11)c is minimal it illustrates that theMarkov SCGM(11)c forecast model can be used as a goodmethod to predict the accident deaths of coal mine in Chinacomparing to the other two methods its prediction result foraccident deaths of coal mine is basically corresponded withdeaths decline trend in nearly 10 years
4 Conclusions
The prediction gained by applying the amended residualsMarkov SCGM(11)c model is closer to the actual value inother words its error is smaller and it can better reflect therelationship between the coal mine safety accident death and
the number of data series so the prediction is reliable Theamended residuals Markov SCGM(11)c model combines theadvantages of both the single-factor system cloud gray modeland Markov chain using residual to amend the system graycloud it can take full advantage of the information given bythe historical data of coal mine accidents and overcome thedata random volatile effects on prediction precision
Conflict of Interests
The authors declare that there is no conflict of interestsregarding the publication of this paper
Acknowledgments
Financial support for this work provided by the NationalScience Foundation of China (no 51074066 no 54179466and no 6134004) and the Doctoral Scientific Fund Project ofHenan Polytechnic University (no SZB2013-08) is gratefullyacknowledged
References
[1] J-P Sun ldquoResearch on coal-mine safe production conceptionrdquoJournal of the China Coal Society vol 36 no 2 pp 313ndash316 2011
[2] C Shugang Z Liqiang and L Yanbao ldquoThe causing model ofaccidents and preventing system of small minesrdquo Journal of theChina Coal Society vol 33 no 6 pp 629ndash634 2008
[3] S-C Tian H-X Li and L Wang ldquoThree types hazard theoryand prevention of coalmine accidentsrdquo Journal of the ChinaCoalSociety vol 31 no 6 pp 706ndash710 2006
[4] H Chen H Qi O Wang and R-Y Long ldquoThe research on thestructural equation model of affecting factors of deliberate vio-lation in coalmine fatal accidents in Chinardquo System EngineeringTheory and Practice vol 27 no 8 pp 127ndash136 2007
[5] C Hong Q Hui S Xuefeng and T Hui ldquoThe structural modelof affecting factors of management misconduct in coalminefatal accidents in Chinardquo Journal of the China Coal Society vol31 no 5 pp 689ndash696 2006
[6] J M Patterson and S A Shappell ldquoOperator error and systemdeficiencies analysis of 508 mining incidents and accidents
International Scholarly Research Notices 7
from Queensland Australia using HFACSrdquo Accident Analysisand Prevention vol 42 no 4 pp 1379ndash1385 2010
[7] X U Ting Z Xiao-duan W-L Wang and Y-L He ldquoHighwayaccidents statistical analysis with panel data modelrdquo Journal ofBeijingUniversity of Technology vol 36 no 4 pp 495ndash499 2010
[8] L Xiao-fu and Y Ya-dong ldquoApplication of regression analysismethod in vessel traffic accident forecastingrdquo Journal of WuhanUniversity of Technology vol 30 no 3 pp 546ndash548 2006
[9] Y Shan J Chen H Guo and G Lio ldquoApplication of UnbiasedGrey-forecasting model in prediction of million tons death rateof coal minerdquoChina Safety Science Journal vol 21 no 9 pp 22ndash27 2011
[10] L Meng and Y Cefeng ldquoDynamic grey correlation analysis ofhuman error in nuclear power plantsrdquo Nuclear Power Engineer-ing vol 31 no 3 pp 74ndash77 2010
[11] M Mu-dan S Yuan and W Wei ldquoPrediction of coal mine dis-astrous accidents based on gray GM(11) model and its algo-rithmrdquo Coal Technolgy vol 29 no 12 2010
[12] Y Rui-bo J Cheng H Zheng and X Rao ldquoApplication of GM(11) model with residual error corrections in the prediction ofcoal mine accidentrdquoMine RampD vol 31 no 1 pp 73ndash76 2011
[13] Y Wang and Z Li ldquoResearch on the road traffic accident shortterm prediction based on Grey Systemrsquos SCGM (1 1)b ModelrdquoTechnolgy and Economy on Areas of Communication vol 11 no5 pp 33ndash35 2009
[14] P Lv and X Zhou ldquoApplication of gray Markov model in thecoal mine safety faulty forecastrdquo Journal of Anhui University ofScience and Technology vol 26 no 1 pp 10ndash13 2006
[15] S Liu and N Xie Grey System Theory and Its ApplicationScience Press Beijing China 2008
[16] C Zhang C-B Ma and J-D Xu ldquoApply gray MarkovSCGM(11)c model to predict air disaster death tollrdquo SystemEngineering Theory and Practice vol 26 no 5 pp 135ndash1442006
[17] X-C Jiang and S-F Chen ldquoApplication of weighted MarkovSCGM(1 1)C model to predict drought crop areardquo SystemEngineeringTheory and Practice vol 29 no 9 pp 179ndash185 2009
Submit your manuscripts athttpwwwhindawicom
VLSI Design
Hindawi Publishing Corporationhttpwwwhindawicom Volume 2014
International Journal of
RotatingMachinery
Hindawi Publishing Corporationhttpwwwhindawicom Volume 2014
Hindawi Publishing Corporation httpwwwhindawicom
Journal ofEngineeringVolume 2014
Hindawi Publishing Corporationhttpwwwhindawicom Volume 2014
Shock and Vibration
Hindawi Publishing Corporationhttpwwwhindawicom Volume 2014
Mechanical Engineering
Advances in
Hindawi Publishing Corporationhttpwwwhindawicom Volume 2014
Civil EngineeringAdvances in
Acoustics and VibrationAdvances in
Hindawi Publishing Corporationhttpwwwhindawicom Volume 2014
Hindawi Publishing Corporationhttpwwwhindawicom Volume 2014
Electrical and Computer Engineering
Journal of
Hindawi Publishing Corporationhttpwwwhindawicom Volume 2014
Distributed Sensor Networks
International Journal of
The Scientific World JournalHindawi Publishing Corporation httpwwwhindawicom Volume 2014
SensorsJournal of
Hindawi Publishing Corporationhttpwwwhindawicom Volume 2014
Modelling amp Simulation in EngineeringHindawi Publishing Corporation httpwwwhindawicom Volume 2014
Hindawi Publishing Corporationhttpwwwhindawicom Volume 2014
Active and Passive Electronic Components
Hindawi Publishing Corporationhttpwwwhindawicom Volume 2014
Chemical EngineeringInternational Journal of
Control Scienceand Engineering
Journal of
Hindawi Publishing Corporationhttpwwwhindawicom Volume 2014
Antennas andPropagation
International Journal of
Hindawi Publishing Corporationhttpwwwhindawicom Volume 2014
Hindawi Publishing Corporationhttpwwwhindawicom Volume 2014
Navigation and Observation
International Journal of
Advances inOptoElectronics
Hindawi Publishing Corporation httpwwwhindawicom
Volume 2014
RoboticsJournal of
Hindawi Publishing Corporationhttpwwwhindawicom Volume 2014
2 International Scholarly Research Notices
accidents [11 12] Appling the gray model to predict accidentthe prediction effect and scope had been further improved[13 14] However qualitative analysis intensity should notbe impressive enough and the prediction accuracy shouldbe less if these gray models were individually applied Themain reason is that themodel requires data sequencemust beexponential distribution and fitting will be poor when datasequence fluctuations are comparatively large
Based on system cloud gray prediction model features in[15] combining the advantages of both Gray prediction andMarkov theory according to the coal mine accident deathsprovided by the State Administration of Coal Mine Safetyreferencing the literature [16 17] an amended Gray MarkovSCGM(11)c model is proposed The gray SCGM(11)c modelis applied to imitate the development tendency of the minesafety accident and the amended model is to improve pre-diction accuracy while Markov prediction is used to predictthe fluctuation along the tendency so as to further improvethe prediction accuracy on random volatile accident data
2 Establishing Prediction Model
21 Gray SCGM(11)c Model Established
211 Model Selection According to the actual accidentssituation in coal mine human error of the coal mines is notregular there are some characteristics which include occur-rences randomly scattered raw data samples lack and imper-fect and uncertain information Modeling is more difficultto use probabilistic statistical methods or mathematical sta-tistics Gray Markov SCGM(11)c prediction model possessesthese characteristic as less information required easy calcu-lation high accuracy and so on It does not list factors dataaffecting research object but finds useful information andexplores the inherent laws from their own time data sequenceestablishing model to predict The Gray Markov SCGM(11)cprediction model is the ideal model to forecast coal minesafety incidents
212 Data Processing Taking account of randomness ofhuman error data in mines original time series 119909(0) of coalmine safety accident deaths can be expressed
119909(0)= 119909(0)(1) 119909
(0)(2) 119909
(0)(119899) (1)
First 119909(0) is integrated as follows
119909(1)= 119909(1)(2) 119909
(1)(3) 119909
(1)(119899)
here 119909(1) (119896) =119896
sum
119898=2
119909(0)(119898) 119896 = 2 3 119899
(2)
119909(0) is a close mean value generated sequence for 119909(0)
119909(0)= 119909(0)(2) 119909
(0)(3) 119909
(0)(119899)
here 119909(0) (119896 + 1) = 119909(0)(119896 + 1) + 119909
(0)(119896)
2
(3)
213 Response Function Human error is random to leadaccidents in coal mine so majority of accidents are dynamicGiven that integral sequence of safety accident deaths timeseries is expressed as 119909(1)(119896) that is associated with satis-faction trend of nonhomogeneous index discrete function as119891119903(119896) = 119887119890
119886(119896minus1)minus 119888 thus the data of 119909(1)(119896) is fit to 119891119903(119896)
According to gray system cloud forecast method the systemgray SCGM(11)c prediction model can be expressed as
119889119909(1)(119896)
119889119896
= 119886119909(1)(119896) + 119880 119896 ge 2 (4)
Its time response function can be expressed as
119909(1)(119896) = [(119909
(1)(1) +
119880
119886
)] sdot 119890119886119896minus
119880
119886
(5)
Here
119886 = lnsum119899
119896=3 119909(0)(119896 minus 1) 119909
(0)(119896)
sum119899
119896=3 (119909(0)(119896 minus 1))
2
119887=
(119899 minus 1)sum119899
119896=2 119890119886(119896minus1)
119909(1)(119896) minus (sum
119899
119896=2 119890119886(119896minus1)
)(sum119899
119896=2 119909(1)(119896))
(119899 minus 1)sum119899
119896=2 1198902119886(119896minus1)
minus (sum119899
119896=2 119890119886(119896minus1)
)2
119888 =
1
119899 minus 1
[(
119899
sum
119896=2
119890119886(119896))119887 minus
119899
sum
119896=2
119909(1)(119896)]
(6)
Given 119909(1)(1) = 119887 minus 119888 119880 = 119886119888 119909(1)(119896) is reverted thesystem gray SCGM(11)c predictionmodel of original datawillbe expressed as
119909(0)(119896) =
2119887 (1 minus 119890minus119886)
1 + 119890minus119886
sdot 119890119886(119896minus1)
(7)
119884 (119896) =
119909(0)(119896)
119909(0)(119896)
(8)
120576 (119896) = 119909(0)(119896) minus 119909
(0)(119896) Δ119896 =
|120576 (119896)|
119909(0)(119896)
(9)
119884(119896) 120576(119896) and Δ119896 are gray fitting accuracy indicatorswhich reflected the degree of deviation of the predicted valuesto the original data
22 Establishment of the Residual Amended SCGM(11)cModel Statistics data fluctuations of coal mine accidentsdeaths are larger and the regularity is not very strong asuncertainty of the personrsquos behaviorTherefore the predictionaccuracy should not be too good if the SCGM(11)c model issolely applied to predict accident deaths of coalmine In orderto improve the prediction rate and better meet the actual sit-uation the prediction model should be corrected to improvethe accuracy Amended principle and steps are as follows
(1) The first time residuals data sequence is got inaccordance with the predicted value and actual value
120576(0)(119896) = 119909
(0)(119896) minus 119909
(0)(119896) 119896 = 1 2 119899 (10)
120576(0)(119896) = 120576
(0)(1) 120576(0)(2) 120576
(0)(119899) (11)
(2) Processing residuals correction sequence
International Scholarly Research Notices 3
Given 119872 = (1 + 119890minus119886)minus1(1 minus 119890
minus119886)119887 the SCGM(11)c
prediction will be expressed as 119909(0)(119896) = 2119890119886(119896minus1)
119872 If120576(0)(119896) ge 0 (119896 = 1 2 119899) the residual amended
SCGM(11)c model will be expressed as 120576(0)(119896) = 21198901198861(119896minus1)119872111988611198721 and 1198871 can be obtained in accordance with 119886119872 and119887 used methodThe first time residuals corrected SCGM(11)cmodel can be expressed as follows
119909(0)
1205761
(119896) = 2 (119890119886(119896minus1)
119872minus 1198901198861(119896minus1)
1198721) (12)
If 120576(0)(119896) lt 0 (119896 = 1 2 119899) the first time residualscorrected SCGM(11)c model can be expressed as follows
119909(0)
1205761
(119896) = 2 (119890119886(119896minus1)
119872+ 1198901198861(119896minus1)
1198721) (13)
In general a prediction model can be repeatedly cor-rected residuals and the residuals can be negative the timedimensions are also not equal If the first time residualsamendment cannot meet the forecast accuracy requiredit should do residual correction according to the aboveamended principles until the accuracy meets requirementsThe residual correction generic model can be expressed asfollows
119909(0)
120576119895
(119896) = 2(119890119886(119896minus1)
119872
119899
sum
119895=1
119890119886119895(119896minus1)
1198721) (14)
23 Establishment of Amended Markov SCGM(11)c ModelThe SCGM(11)c prediction fitting curve is essentially anexponential curve and the prediction result is a relativelysmooth curve Because human error accidents are main partof coal mine accidents the SCGM(11)c model solely appliedcannot meet forecast accuracy requirements Markov theoryhas no aftereffect that is to say ldquothe future state of the systemis only related to the current state and has nothing to dowith the past staterdquo Meanwhile Markov model is adoptedto predict states trends through probability transfers it canadapt to the randomness and variability of state ApplyingMarkov theory to correct the SCGM(11)c predictionmodel ofcoal mine accident deaths can better solve the variability andrandomness of accidents caused by human errors to improvethe prediction accuracy
231 State Divided The annual change of the number ofdeaths in coalmine accidents is a dynamic nonstationary ran-dom process and thus the prediction fitting precision indi-cators also are variability and randomness Because boundaryand connotation of the different annual state are changeablean adaptive state divided criterion needs to be determinedand the criterion should be consistent with basic timing trendof the coal mine accident deathsThus 119884(119896) was divided into119898 states and each state can be expressed as
119864119894 isin [otimes1119894 otimes2119894] 119894 = 1 2 119898 (15)
Here otimes1119894 = 119884(119896) + 119860 119894 otimes2119894 = 119884(119896) + 119861119894In the formula 119864119894 is expressed as 119894 state otimes1119894 and otimes2119894
are respectively expressed as the upper and lower bounds of
the 119894 state and119860 119894 and 119861119894 are constants determined accordingto prediction data Because119884(119896) is a time functionotimes1119894 andotimes2119894will be changed with time so the state possesses variability
When the state is divided the numbers of different inter-vals are reasonably divided according to the actual situationIf raw data are less the interval division should be less so as toincrease the number of transfers between the various statesand thus the transfer law can be more objectively reflectedbetween states Conversely if raw data are more the intervaldivision should be less in order to excavate more informationfrom a large number of data to improve the prediction accu-racy It is suitable to adapt clustering classification method todetermine class number and classification intervals due to lessdata and uncertain status of human error accidents in the coalmine
232 Construction of State Transition Rate Matrix The orig-inal number of samples is expressed as 119872119894119895(119896) from thestate 119864119894 transiting to the sate 119864119895 by 119896 step and the numberof occurrences of the state 119864119894 is expressed as 119872119894 so statetransition probability is expressed as follows
119875119894119895 (119896) =
119872119894119895 (119896)
119872119894
119894 119895 = 1 2 119898 (16)
119898times119898 state transition probability matrix can be obtainedas follows
119875 (119896) =
[
[
[
[
[
11987511 (119896) 11987512 (119896) sdot sdot sdot 1198751119898 (119896)
11987521 (119896) 11987522 (119896) sdot sdot sdot 1198752119898 (119896)
1198751198981 (119896) 1198751198982 (119896) sdot sdot sdot 119875119898119898 (119896)
]
]
]
]
]
(17)
233 The Predictive Value Determined The state transitionprobability matrix 119875(119896) reflects all statistical regularities ofstate transition and the future system state steering can bepredicted by investigating the matrix In the actual analysisof the process one step transition probability matrix 119875(1)is generally only examined Given that predicted momentobject is in the state 119864119896 investigating the 119896 row of 119875(1) canget the following
(1) If max119901119894119895 = 119901119896119897 the next time system should mostlikely shift from the state 119864119896 to the state 119864119897
(2) If there are two or more probability values identicalor similar to 119896 row in the matrix 119875(1) the futurestate steering will be difficult to determine it needsto consider probability transition matrix 119875(2) or 119875(119899)(119899 ge 3)
The systemrsquos future state will be determined by investi-gating state transition probability matrix and gray changeinterval of relative prediction value in the future momentsalso will be determined it can be expressed as [otimes1119894 otimes2119894]Predicted value of the future moment can be expressed as theinterval median as 1198841015840(119896)
1198841015840(119896) =
1199090(119896)
11990910158400(119896)
=
1
2
(otimes1119894 + otimes2119894) = 119884 (119896) +1
2
(119860 119894 + 119861119894)
(18)
4 International Scholarly Research Notices
0
1990
1991
1993
1995
1997
1999
1992
1994
1996
1998
2000
2001
2003
2005
2007
2009
2002
2004
2006
2008
2010
Year
0
2
4
6
Dea
th ra
te p
er
mill
ion
tons
Acci
dent
dea
th
roll
2
4
6
8times10
3
Accidents deathDeath rate per million tons
Figure 1 The statistics of megaton death rate and toll from 1990 to2010 in China
3 Forecast Instances
Chinese coal mining is primarily underground mining themain mining methods used include blasting mining generalmechanizedmining and comprehensivemechanizedminingfrom 1990 to 2010 Different methods lead to frequency ofthe coal mine accidents is not same In general blastingmining and general mechanized mining were usually appliedin the town local small coal mine their production capacityis relatively small and mining technology and managementlevel are relatively lower compared to large coal mines soaccidents rate is high In contrast to these small coal minesthe large state-owned coal mines mainly used comprehensivemechanized mining technology their production capacityis relatively large management level is relatively advancedand the accidents rate is lower Over the last decade dueto the small and medium sized coal mines integrated andstrengthened security management in China their pro-duction capacity and mining technology were graduallyimproved so the number of occurrences of accidents in thecoal mine was declined According to statistics data of 1990ndash2010 coal mine accident death provided by Coal Mine SafetyAdministration the trend of accidents deaths in coal minecan be fitted by applying the gray SCGM(11)c model andprediction accuracy can be improved by the residualmodifiedmodel Finally deaths are validly predicted by using thegray Markov SCGM(11)c model The raw data are shown inTable 1 the trend of coal mine accident deaths and death rateper million ton from 1990 to 2010 are shown in Figure 1
31 The Establishment of SCGM(11)c Model SCGM(11)cmodel of coal mine accident death toll is established by usingaccidents mortality data of coal mines from 1990 to 2010 inChina
119909(0)(119896) =
2119887 (1 minus 119890minus119886)
1 + 119890minus119886
sdot 119890119886(119896minus1)
(19)
In the prediction model (19) 119886 and 119887 are the mostimportant parameters they are mainly dependent on the rawdata to reflect the development trend of data Here coal mineaccident deaths for 20 years in China were taken as raw datato predict in order to find the trend of coal mine deathsTherefore it is important to select the sample data accordingto the formulas (5) and (6) 119886 and 119887 can be calculated Here119886 = minus0039436 119887 = minus236878
Table 1 Prediction and comparison of the coalmine accident deathsfrom 1990 to 2010 in China
Year Actual value Prediction value1990 7185 01991 6269 77161992 5854 74511993 5152 71961994 6574 69491995 6222 67101996 6496 64791997 6141 62571998 6304 60421999 6478 58352000 5798 56352001 5670 54412002 6995 52542003 6702 50742004 6027 48992005 5986 47312006 4746 45692007 3786 44122008 2631 42612009 2631 41142010 2433 3987
Applying the formula (19) prediction value of coal minesafety accident deaths can be got and then the gray fittingaccuracy indicators also can be calculated by the formula(8) which reveal overall development trend of safety accidentdeath toll in coal mine Specific forecast and actual values areshown in Table 1
32 Residuals Corrected SCGM(11)c Forecast In accordancewith Table 1 according to (10) the residual initial sequencecan be attained and then one correction residual predictionmodel can be expressed as
120576(0)(119896) = 2119890
1198861(119896minus1) 1 minus 119890
1198861
1 + 1198901198861
1198871(20)
Here 1198861 = minus00632 1198871 = minus218276According to the formula (14) a residual modification
prediction value of safety accident deaths can be obtainedand the results are shown in Table 2
33 The Residual Modification Markov SCGM(11)c ForecastComparing Tables 1 and 2 it is shown that forecast fittingaccuracy of the SCGM(11)c model has been improved afterresidual modification but volatility of the gray fitting accu-racy indicators is larger from analyzing Table 2 In order tosolve this question it needs to adoptMarkov chain predictionfor further enhancing accuracy and lowering the volatilityThe prediction fitting indicators data in Table 2 are dividedto 4 states by hierarchical clustering and the results areshown in Table 3 The corresponding states of each year canbe determined according to the divided states and applying
International Scholarly Research Notices 5
Table 2 Prediction and comparison of the coal mine accidentdeaths from 1990 to 2010 in China
Year Actual value Amendedprediction value
Actualvalueprediction
value1990 71851991 6269 6501 961992 5854 6310 931993 5152 6125 841994 6574 5944 1111995 6222 5766 1081996 6496 5565 881997 6141 5425 1131998 6304 6823 931999 6478 6568 1192000 5798 6323 1182001 5670 6087 1112002 6995 5860 1142003 6702 5643 1192004 6027 5433 1112005 5986 5233 1142006 4746 5040 942007 3786 3970 952008 2631 3846 692009 2631 3725 712010 2433 3592 68
Table 3 State division of deaths prediction for coal mine
No Divided state Actual valuepredictionvalue
1198641 Strong decreasing year 60ndash751198642 Poor decreasing year 75ndash901198643 Poor increasing year 90ndash1051198644 Strong increasing year 105ndash120
the formula (16) the state transferred introductionmatrix canbe obtained and the first step state transitionmatrix is shownas follows
119875 (1) =
[
[
[
[
[
[
[
[
1 0 0 0
0 0 0 1
1
6
1
6
1
2
1
6
0
1
10
3
10
3
5
]
]
]
]
]
]
]
]
(21)
The future coal mine accident deaths toll can be predictedbased on the above state transition probability matrix acci-dent deaths in 2003 year be in the state E4 according tothe state transition probability method examining the statetransition probability matrix 119875(1) line 4 can get
max1199014119895 = 11990144 119895 = 1 2 3 4 (22)
0
2004
2005
2007
2009
2011
2013
2006
2008
2010
2012
2004
2005
2007
2009
2011
2013
2006
2008
2010
2012
Years
Years
Actual value
Acci
dent
de
aths
2
4
6
Pred
ictio
n er
ror
times103
2
1
0
SCGM(11)c model
SCGM(11)c model
Amended SCGM(11)c model
Amended SCGM(11)c model
Markov SCGM(11)c model
Markov SCGM(11)c model
Figure 2 Curve fitting about coal mine death toll of differentprediction models and error analysis chart
After a year transition under the control of coal mineaccidents the death toll of coal mine accidents in 2004 wasmost likely in the stateE4 According toTable 3 interval of thestateE3 is [105 12] that isotimes13 = 105 andotimes12 = 12 Becauseotimes1119894 = 119884(119896) + 119860 119894 otimes2119894 = 119884(119896) + 119861119894 and 119884(119896) = 119 in 2004according to Table 2 119860 119894 = otimes13 minus 119884(119870) = 105 minus 119 = minus014119861119894 = otimes23 minus 119884(119896) = 12 minus 119 = 001 Using the gray MarkovSCGM(11)c model the death toll of coal mine accidents in2008 is most likely expressed as
1198841015840(119896) = 119884 (119870) +
1
2
(119860 119894 + 119861119894)
= 119 +
1
2
(minus014 + 001) = 1125
1199091015840(0)
(2004) = 1199091015840(0)
(2004) sdot 1198841015840(119896) = 5433 times 1125 asymp 6112
(23)
In general in order to facilitate the calculation the aboveequation can also be expressed as
1199091015840(0)
(2004) = 1199091015840(0)
(2004) sdot
1
2
(otimes13 + otimes23)
= 5433 times
1
2
(105 + 120) = 6112
(24)
Similarly according to the formula (21) and Table 2accidents deaths of coal mine from 2004 to 2013 can bepredicted prediction error comparison of the amended resid-uals SCGM(11)c model and the amended residuals MarkovSCGM(11)c is shown in Table 4
Error analysis and predictive value fitting of three meth-ods are shown in Figure 2
Comparing Tables 1 2 and 4 we know that Table 2was amended by using residuals prediction model on
6 International Scholarly Research Notices
Table 4 Prediction comparison of deaths from 2004 to 2013
Year Actual value Amended 119878119862119866119872(1 1)119888 model Amended Markov 119878119862119866119872(1 1)119888 modelPrediction value Relative error Prediction value Relative error
2004 6027 5433 0099 6112 00142005 5986 5233 0126 5887 00172006 4746 5040 0062 4914 00352007 3786 3970 0049 3870 00222008 2631 3846 0462 3749 04252009 2631 3725 0416 2328 01152010 2433 3592 0476 2424 00042011 1973 3357 0701 2265 01472012 1384 2142 0548 1446 00452013 1067 1934 0813 1305 0223
the basis of Table 1 and the prediction accuracy had beenappropriately improved For Table 4 comparing the residualamended model and Markov prediction model can be seenthat the residual amended SCGM(11)c model cannot handleabnormal events because its prediction parameters are fixedAs Chinarsquos coal enterprises are affected by the economicsituation form abroad and home their production had beenin low period and some coal was not continuously producedtheywere basically in an abnormal state in the last three yearsso these factors would have a big impact on mine accidentforecast National and local government paid more attentionto safety management in the coal mine and each coal minestrengthened management and prevention on human errorthey would also affect the accuracy of general forecastingmethods However theMarkov SCGM(11)c predictionmodelis only depend on the previous state the relationship withother states is very small so it very better solves the abnormalaccident Its prediction error is significantly smaller thanthat of the amended SCGM(11)c model On the other handcomparing accidents deaths of coal mine from 2004 to 2013in China the number of deaths was 6027 in 2004 and thisfigure became 1067 in 2013 in the recent ten years theaverage decline rate of accidents deaths in coal mine is 168According to this downward trend accidents deaths of coalmine in China will be about 889 in 2014
As Figure 2 shows that the fitting degree of the MarkovSCGM(11)c model is the best the amended SCGM(11)c isbetter and SCGM(11)c model is the worstWhile error changeof the Markov SCGM(11)c is minimal it illustrates that theMarkov SCGM(11)c forecast model can be used as a goodmethod to predict the accident deaths of coal mine in Chinacomparing to the other two methods its prediction result foraccident deaths of coal mine is basically corresponded withdeaths decline trend in nearly 10 years
4 Conclusions
The prediction gained by applying the amended residualsMarkov SCGM(11)c model is closer to the actual value inother words its error is smaller and it can better reflect therelationship between the coal mine safety accident death and
the number of data series so the prediction is reliable Theamended residuals Markov SCGM(11)c model combines theadvantages of both the single-factor system cloud gray modeland Markov chain using residual to amend the system graycloud it can take full advantage of the information given bythe historical data of coal mine accidents and overcome thedata random volatile effects on prediction precision
Conflict of Interests
The authors declare that there is no conflict of interestsregarding the publication of this paper
Acknowledgments
Financial support for this work provided by the NationalScience Foundation of China (no 51074066 no 54179466and no 6134004) and the Doctoral Scientific Fund Project ofHenan Polytechnic University (no SZB2013-08) is gratefullyacknowledged
References
[1] J-P Sun ldquoResearch on coal-mine safe production conceptionrdquoJournal of the China Coal Society vol 36 no 2 pp 313ndash316 2011
[2] C Shugang Z Liqiang and L Yanbao ldquoThe causing model ofaccidents and preventing system of small minesrdquo Journal of theChina Coal Society vol 33 no 6 pp 629ndash634 2008
[3] S-C Tian H-X Li and L Wang ldquoThree types hazard theoryand prevention of coalmine accidentsrdquo Journal of the ChinaCoalSociety vol 31 no 6 pp 706ndash710 2006
[4] H Chen H Qi O Wang and R-Y Long ldquoThe research on thestructural equation model of affecting factors of deliberate vio-lation in coalmine fatal accidents in Chinardquo System EngineeringTheory and Practice vol 27 no 8 pp 127ndash136 2007
[5] C Hong Q Hui S Xuefeng and T Hui ldquoThe structural modelof affecting factors of management misconduct in coalminefatal accidents in Chinardquo Journal of the China Coal Society vol31 no 5 pp 689ndash696 2006
[6] J M Patterson and S A Shappell ldquoOperator error and systemdeficiencies analysis of 508 mining incidents and accidents
International Scholarly Research Notices 7
from Queensland Australia using HFACSrdquo Accident Analysisand Prevention vol 42 no 4 pp 1379ndash1385 2010
[7] X U Ting Z Xiao-duan W-L Wang and Y-L He ldquoHighwayaccidents statistical analysis with panel data modelrdquo Journal ofBeijingUniversity of Technology vol 36 no 4 pp 495ndash499 2010
[8] L Xiao-fu and Y Ya-dong ldquoApplication of regression analysismethod in vessel traffic accident forecastingrdquo Journal of WuhanUniversity of Technology vol 30 no 3 pp 546ndash548 2006
[9] Y Shan J Chen H Guo and G Lio ldquoApplication of UnbiasedGrey-forecasting model in prediction of million tons death rateof coal minerdquoChina Safety Science Journal vol 21 no 9 pp 22ndash27 2011
[10] L Meng and Y Cefeng ldquoDynamic grey correlation analysis ofhuman error in nuclear power plantsrdquo Nuclear Power Engineer-ing vol 31 no 3 pp 74ndash77 2010
[11] M Mu-dan S Yuan and W Wei ldquoPrediction of coal mine dis-astrous accidents based on gray GM(11) model and its algo-rithmrdquo Coal Technolgy vol 29 no 12 2010
[12] Y Rui-bo J Cheng H Zheng and X Rao ldquoApplication of GM(11) model with residual error corrections in the prediction ofcoal mine accidentrdquoMine RampD vol 31 no 1 pp 73ndash76 2011
[13] Y Wang and Z Li ldquoResearch on the road traffic accident shortterm prediction based on Grey Systemrsquos SCGM (1 1)b ModelrdquoTechnolgy and Economy on Areas of Communication vol 11 no5 pp 33ndash35 2009
[14] P Lv and X Zhou ldquoApplication of gray Markov model in thecoal mine safety faulty forecastrdquo Journal of Anhui University ofScience and Technology vol 26 no 1 pp 10ndash13 2006
[15] S Liu and N Xie Grey System Theory and Its ApplicationScience Press Beijing China 2008
[16] C Zhang C-B Ma and J-D Xu ldquoApply gray MarkovSCGM(11)c model to predict air disaster death tollrdquo SystemEngineering Theory and Practice vol 26 no 5 pp 135ndash1442006
[17] X-C Jiang and S-F Chen ldquoApplication of weighted MarkovSCGM(1 1)C model to predict drought crop areardquo SystemEngineeringTheory and Practice vol 29 no 9 pp 179ndash185 2009
Submit your manuscripts athttpwwwhindawicom
VLSI Design
Hindawi Publishing Corporationhttpwwwhindawicom Volume 2014
International Journal of
RotatingMachinery
Hindawi Publishing Corporationhttpwwwhindawicom Volume 2014
Hindawi Publishing Corporation httpwwwhindawicom
Journal ofEngineeringVolume 2014
Hindawi Publishing Corporationhttpwwwhindawicom Volume 2014
Shock and Vibration
Hindawi Publishing Corporationhttpwwwhindawicom Volume 2014
Mechanical Engineering
Advances in
Hindawi Publishing Corporationhttpwwwhindawicom Volume 2014
Civil EngineeringAdvances in
Acoustics and VibrationAdvances in
Hindawi Publishing Corporationhttpwwwhindawicom Volume 2014
Hindawi Publishing Corporationhttpwwwhindawicom Volume 2014
Electrical and Computer Engineering
Journal of
Hindawi Publishing Corporationhttpwwwhindawicom Volume 2014
Distributed Sensor Networks
International Journal of
The Scientific World JournalHindawi Publishing Corporation httpwwwhindawicom Volume 2014
SensorsJournal of
Hindawi Publishing Corporationhttpwwwhindawicom Volume 2014
Modelling amp Simulation in EngineeringHindawi Publishing Corporation httpwwwhindawicom Volume 2014
Hindawi Publishing Corporationhttpwwwhindawicom Volume 2014
Active and Passive Electronic Components
Hindawi Publishing Corporationhttpwwwhindawicom Volume 2014
Chemical EngineeringInternational Journal of
Control Scienceand Engineering
Journal of
Hindawi Publishing Corporationhttpwwwhindawicom Volume 2014
Antennas andPropagation
International Journal of
Hindawi Publishing Corporationhttpwwwhindawicom Volume 2014
Hindawi Publishing Corporationhttpwwwhindawicom Volume 2014
Navigation and Observation
International Journal of
Advances inOptoElectronics
Hindawi Publishing Corporation httpwwwhindawicom
Volume 2014
RoboticsJournal of
Hindawi Publishing Corporationhttpwwwhindawicom Volume 2014
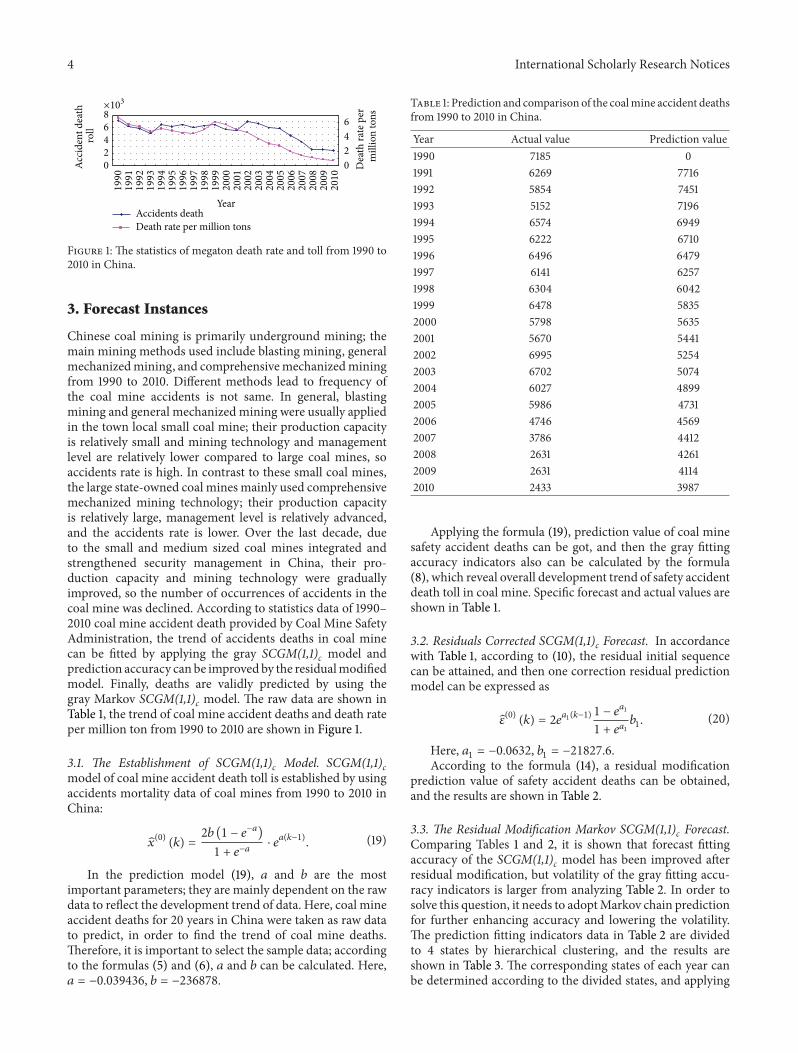
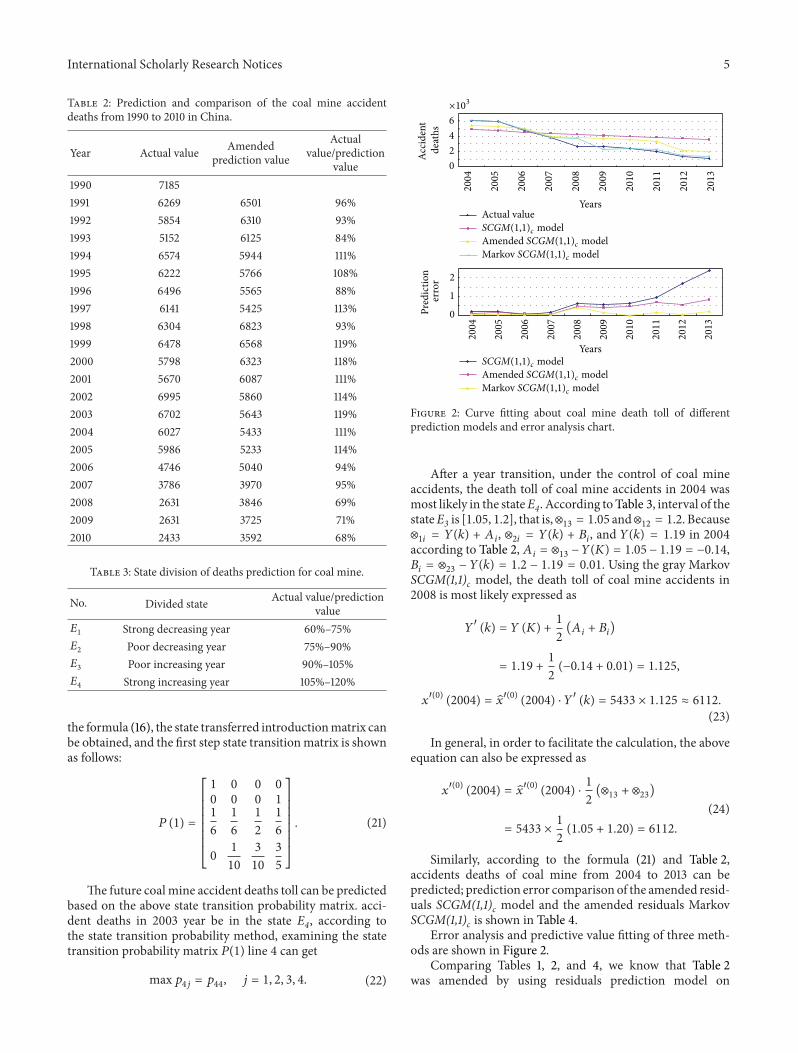
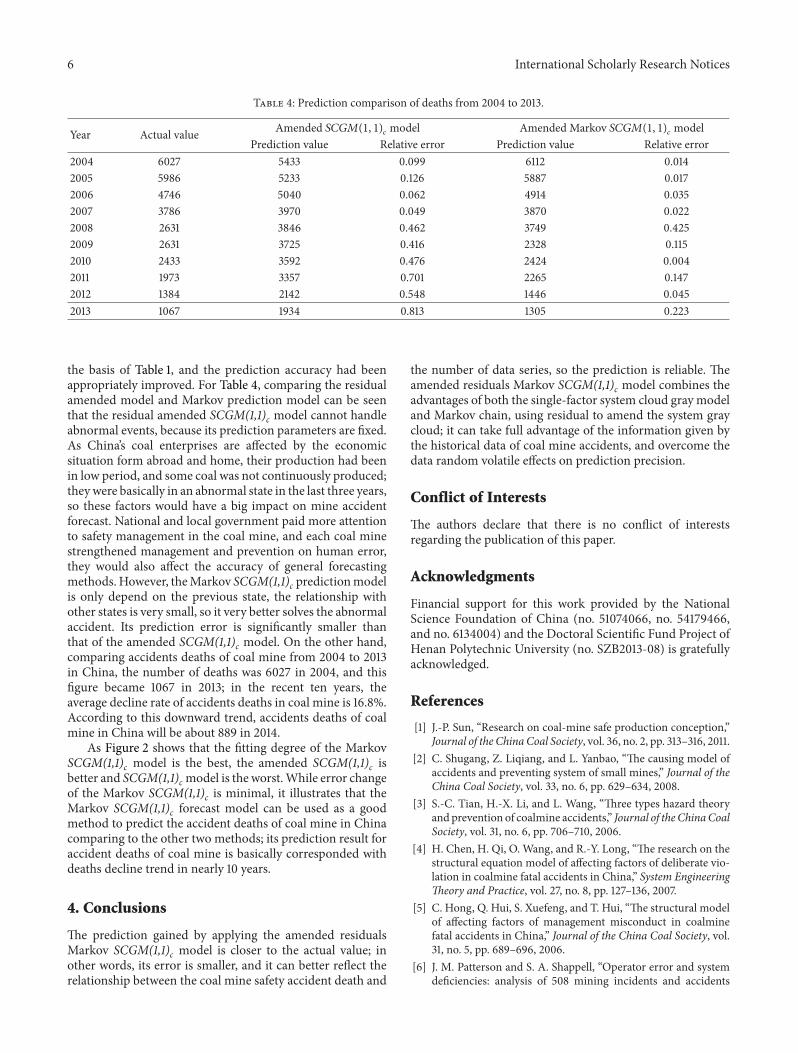