Nationwide Variable Insurance Trust
176
Semiannual Report June 30, 2021 (Unaudited) Nationwide Variable Insurance Trust Index Funds NVIT Bond Index Fund NVIT International Index Fund NVIT Mid Cap Index Fund NVIT S&P 500 Index Fund NVIT Small Cap Index Fund
-
Upload
khangminh22 -
Category
Documents
-
view
1 -
download
0
Transcript of Nationwide Variable Insurance Trust
Semiannual ReportJune 30, 2021 (Unaudited)
Nationwide Variable Insurance Trust
Index FundsNVIT Bond Index FundNVIT International Index FundNVIT Mid Cap Index FundNVIT S&P 500 Index FundNVIT Small Cap Index Fund
Nationwide Funds®
Commentary in this report is provided by the portfolio manager(s) of each Fund as of the date of this report and is subject to change at any time based on market or other conditions.
Third-party information has been obtained from sources that Nationwide Fund Advisors (NFA), the investment adviser to the Funds, deems reliable. Portfolio composition is accurate as of the date of this report and is subject to change at any time and
This report and the holdings provided are for informational purposes only and are not intended to be relied on as investment
Statement Regarding Availability of Quarterly Portfolio Holdings
at http://www.sec.gov
Trust also makes this information available to investors on http://nationwide.com/mutualfundsnvit
Statement Regarding Availability of Proxy Voting Record
(the “Proxy Voting Guidelines”) and to provide a summary of those Proxy Voting Guidelines used to vote the securities held
http://nationwide.com/mutualfundsnvit http://www.sec.gov.
Before purchasing a variable annuity, you should carefully consider the investment objectives, risks, charges and expenses of the annuity and its underlying investment options. The product prospectus and underlying fund prospectuses contain this and other important information. Underlying fund prospectuses can be obtained from your investment professional or by contacting Nationwide at 800-848-6331. Read the prospectus carefully before you make a purchase.
NVIT Funds are not sold to individual investors. These investment options are underlying subaccounts and cannot be purchased directly by the public. They are only available through variable products issued by life insurance companies.
Nationwide Funds Group (NFG) comprises Nationwide Fund Advisors, Nationwide Fund Distributors LLC and Nationwide Fund Management LLC. Together they provide advisory, distribution and administration services, respectively, to Nationwide Funds. Nationwide Fund Advisors (NFA) is the investment adviser to Nationwide Funds.
Variable products are issued by Nationwide Life Insurance Company or Nationwide Life and Annuity Insurance Company,
Management, LLC (NWAM).
Company. ©2021
Table of Contents
Message to Investors 1
Fund Overview
Shareholder Expense Example 8
Statements of Investments 10
Statements of Assets and Liabilities 116
Statements of Operations 120
Statements of Changes in Net Assets 122
Financial Highlights
Notes to Financial Statements
Supplemental Information 161
Management Information
166

This page intentionally left blank
Dear Investor,
During this unprecedented time of challenge and volatility, Nationwide continues to diligently care for our associates, communities, and ultimately, you our investors. We remain steadfastly committed to protecting people, businesses, and
2021, as vaccine optimism, a reopening of the economy and
U.S. economic activity improved from the unprecedented challenges from the outbreak, though the lasting implications remain unclear.
7% growth for the full calendar year, which would be the fastest
the reporting period, with the S&P 500® Index (“S&P 500”)
the reporting period.
to 2020. The removal of political uncertainty and prospect for a vaccine rollout was balanced against valuation concerns, resulting in a 1% decline in January. The remainder of the
months of the 6-month reporting period, ranging from 1% to 5%. The government has greatly aided the recovery through
accommodative monetary regime. This has driven a sharp
is driving the improved economic data. For the full reporting
the second-best start to a year since 1998. Fixed income returns were mixed, with higher interest rates punishing long-dated bonds, but improving spreads aiding credit-sensitive investments.
International markets participated in the risk-on environment,
period. Following an extended period of underperformance due
by outperforming the S&P 500, though performance faded late
rollout and economic recovery.
The market rally was notable for broad participation, compared with the narrow leadership of large-cap technology names over the past several years. Nearly all risk assets saw impressive gains, though value indexes outperformed growth and small-cap indexes staged an impressive rebound versus large-cap
Staples and Materials sectors lagged.
Fixed-income markets were mixed, with a sharp move higher in long-term interest rates offsetting the improving credit spreads. The Federal Reserve continues to stimulate aggressively, with the Fed Funds target rate effectively 0% and the bond-buying
sheet has nearly doubled in the past 18 months, with current
the reporting period, with the 10-year Treasury yield rising from
with the majority of movement late in the period on increasing bets that the Fed will raise interest rates next year. Credit spreads narrowed throughout the period as investors searched for market yield.
The market movement has been impressive but substantial challenges remain to bring the economy back to a sense of normalcy and self-sustaining without the use of aggressive
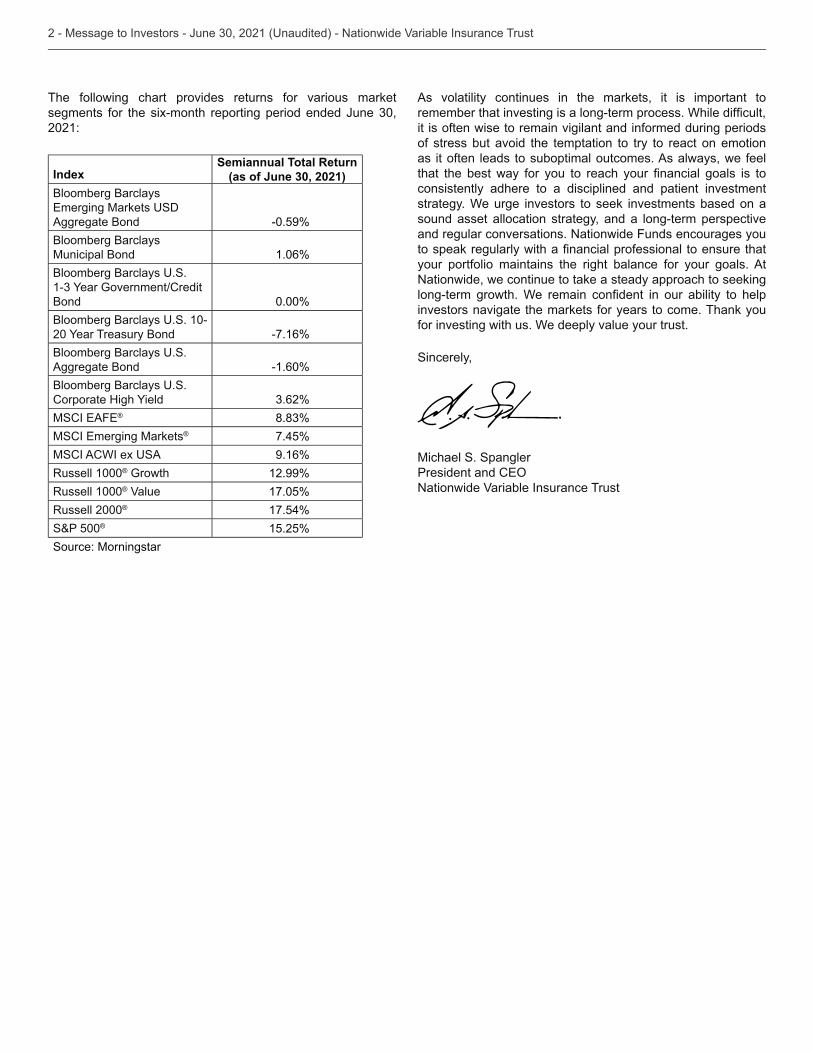
The following chart provides returns for various market
2021:
IndexSemiannual Total Return
(as of June 30, 2021)Bloomberg Barclays
Aggregate Bond -0.59% Bloomberg Barclays Municipal Bond 1.06%
Bond 0.00%
-7.16%
Aggregate Bond -1.60%
®
® 7.45% 9.16%
Russell 1000® Growth 12.99% Russell 1000® Value 17.05% Russell 2000® 17.54% S&P 500® 15.25% Source: Morningstar
As volatility continues in the markets, it is important to
it is often wise to remain vigilant and informed during periods of stress but avoid the temptation to try to react on emotion as it often leads to suboptimal outcomes. As always, we feel
consistently adhere to a disciplined and patient investment strategy. We urge investors to seek investments based on a sound asset allocation strategy, and a long-term perspective and regular conversations. Nationwide Funds encourages you
your portfolio maintains the right balance for your goals. At Nationwide, we continue to take a steady approach to seeking
investors navigate the markets for years to come. Thank you for investing with us. We deeply value your trust.
Sincerely,
Michael S. Spangler
Nationwide Variable Insurance Trust
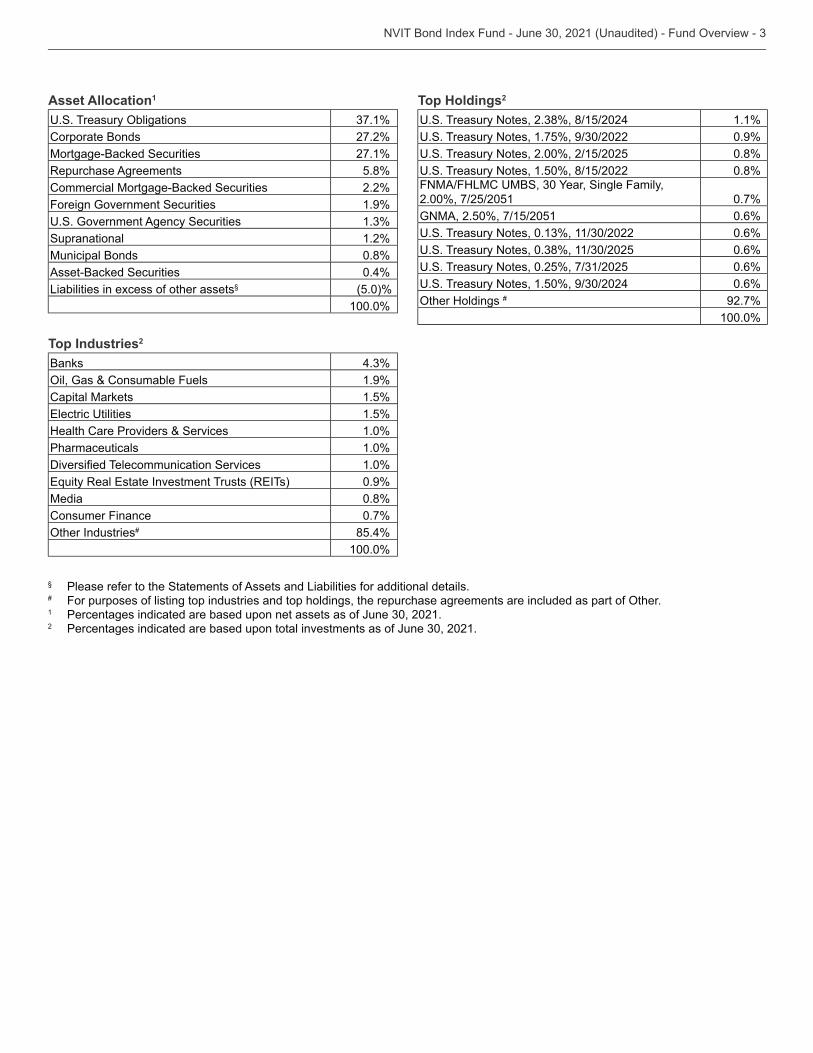
Asset Allocation1
Corporate Bonds 27.2%Mortgage-Backed Securities 27.1%Repurchase Agreements 5.8%Commercial Mortgage-Backed Securities 2.2%Foreign Government Securities 1.9%
Supranational 1.2%Municipal Bonds 0.8%Asset-Backed Securities 0.4%Liabilities in excess of other assets§ (5.0)%
100.0%
Top Industries2
Banks1.9%
Capital Markets 1.5%1.5%
Health Care Providers & Services 1.0%Pharmaceuticals 1.0%
1.0%0.9%
Media 0.8%Consumer Finance 0.7%
# 85.4%100.0%
Top Holdings2
1.1%0.9%0.8%0.8%
2.00%, 7/25/2051 0.7%GNMA, 2.50%, 7/15/2051 0.6%
0.6%0.6%0.6%0.6%
# 92.7%100.0%
§ Please refer to the Statements of Assets and Liabilities for additional details.#
1
2
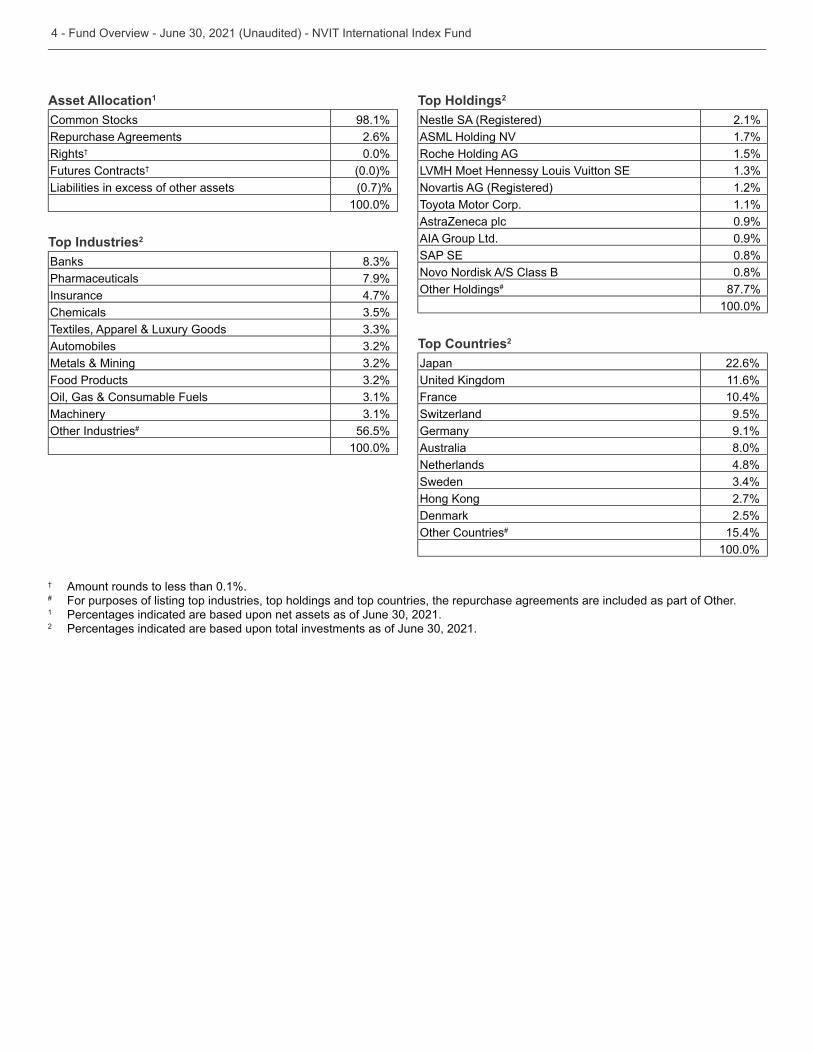
Asset Allocation1
Common Stocks 98.1%Repurchase Agreements 2.6%Rights† 0.0%Futures Contracts† (0.0)%Liabilities in excess of other assets (0.7)%
100.0%
Top Industries2
BanksPharmaceuticals 7.9%Insurance 4.7%ChemicalsTextiles, Apparel & Luxury GoodsAutomobilesMetals & MiningFood Products
Machinery# 56.5%
100.0%
Top Holdings2
Nestle SA (Registered) 2.1% ASML Holding NV 1.7% Roche Holding AG 1.5%
Novartis AG (Registered) 1.2% Toyota Motor Corp. 1.1% AstraZeneca plc 0.9% AIA Group Ltd. 0.9%
0.8% Novo Nordisk A/S Class B 0.8%
# 87.7%100.0%
Top Countries2
Japan 22.6%11.6%
France 10.4%Switzerland 9.5%Germany 9.1%Australia 8.0%Netherlands 4.8%Sweden
2.7%Denmark 2.5%
# 15.4%100.0%
† Amount rounds to less than 0.1%.#
1
2
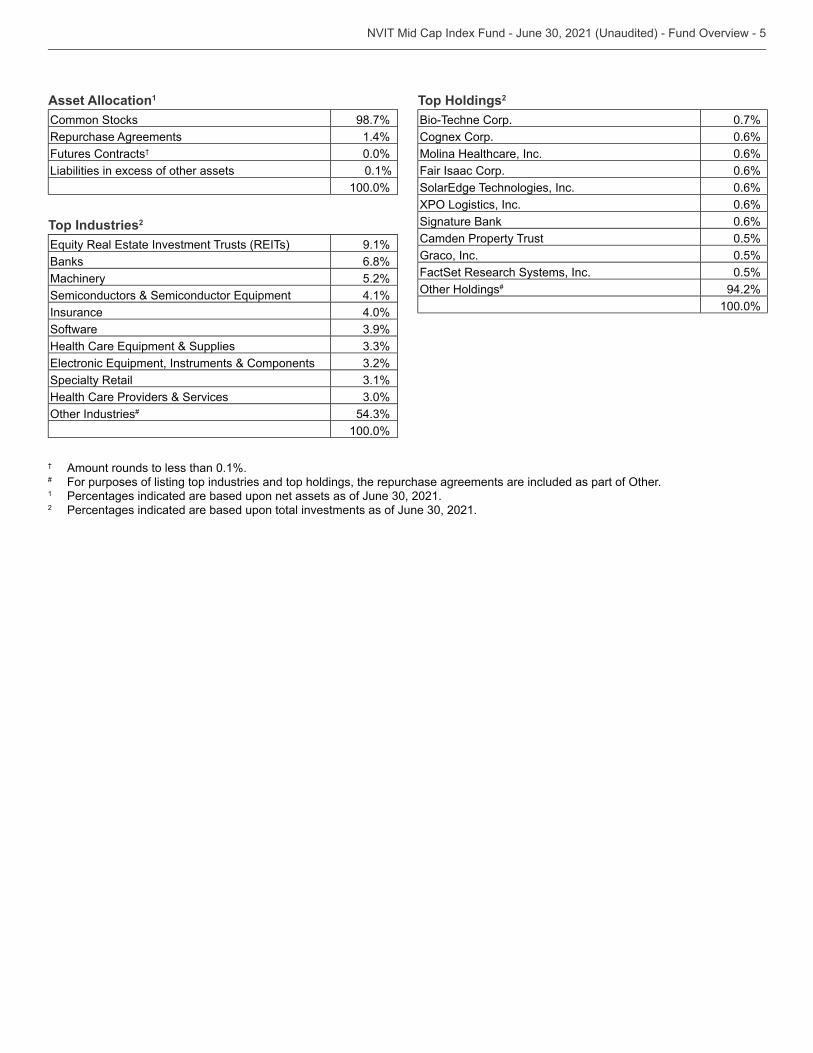
Asset Allocation1
Common Stocks 98.7%Repurchase Agreements 1.4%Futures Contracts† 0.0%Liabilities in excess of other assets 0.1%
100.0%
Top Industries2
9.1%Banks 6.8%Machinery 5.2%
4.1%Insurance 4.0%Software
Specialty RetailHealth Care Providers & Services
#
100.0%
Top Holdings2
Bio-Techne Corp. 0.7%Cognex Corp. 0.6%Molina Healthcare, Inc. 0.6%Fair Isaac Corp. 0.6%
Technologies, Inc. 0.6%0.6%
Signature Bank 0.6%Camden Property Trust 0.5%Graco, Inc. 0.5%FactSet Research Systems, Inc. 0.5%
# 94.2%100.0%
† Amount rounds to less than 0.1%.#
1
2
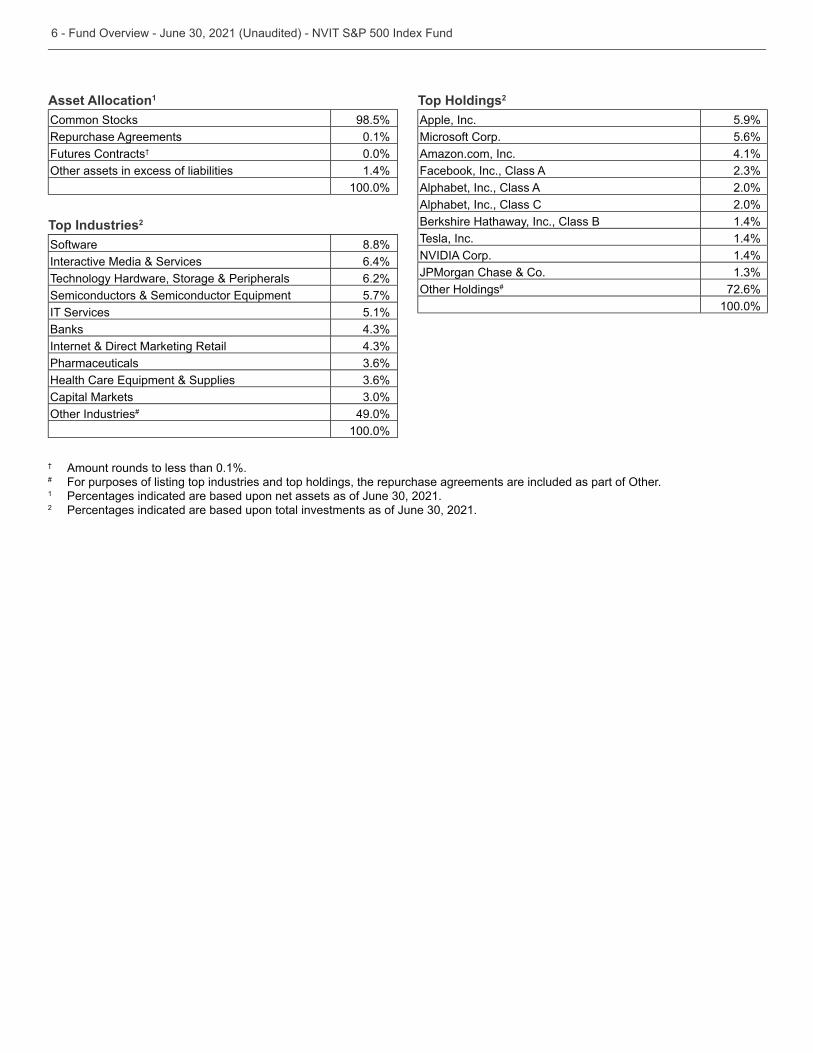
Asset Allocation1
Common Stocks 98.5%Repurchase Agreements 0.1%Futures Contracts† 0.0%
1.4%100.0%
Top Industries2
Software 8.8%Interactive Media & Services 6.4%Technology Hardware, Storage & Peripherals 6.2%
5.7%IT Services 5.1%BanksInternet & Direct Marketing RetailPharmaceuticals
Capital Markets# 49.0%
100.0%
Top Holdings2
Apple, Inc. 5.9%Microsoft Corp. 5.6%Amazon.com, Inc. 4.1%Facebook, Inc., Class AAlphabet, Inc., Class A 2.0%Alphabet, Inc., Class C 2.0%Berkshire Hathaway, Inc., Class B 1.4%Tesla, Inc. 1.4%NVIDIA Corp. 1.4%JPMorgan Chase & Co.
# 72.6%100.0%
† Amount rounds to less than 0.1%.#
1
2
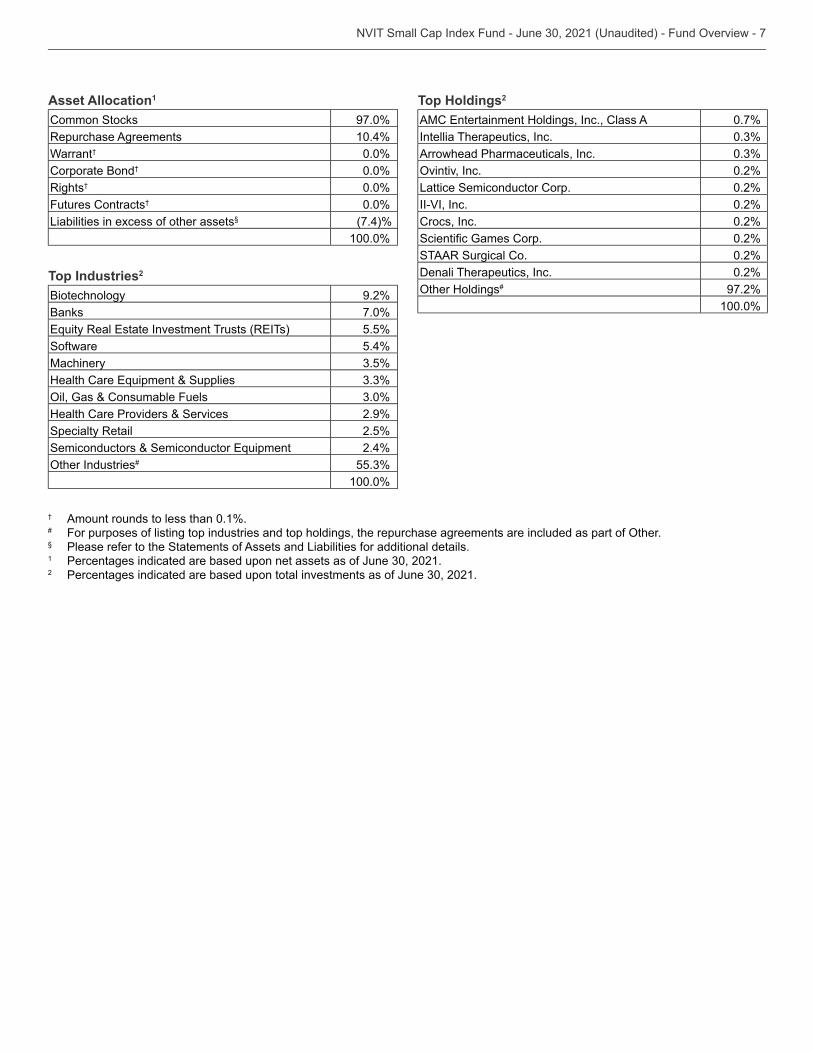
Asset Allocation1
Common Stocks 97.0%Repurchase Agreements 10.4%Warrant† 0.0%Corporate Bond† 0.0%Rights† 0.0%Futures Contracts† 0.0%Liabilities in excess of other assets§ (7.4)%
100.0%
Top Industries2
Biotechnology 9.2%Banks 7.0%
5.5%Software 5.4%Machinery
Health Care Providers & Services 2.9%Specialty Retail 2.5%
2.4%#
100.0%
Top Holdings2
0.7%Intellia Therapeutics, Inc.Arrowhead Pharmaceuticals, Inc.
, Inc. 0.2%Lattice Semiconductor Corp. 0.2%II-VI, Inc. 0.2%Crocs, Inc. 0.2%
0.2%STAAR Surgical Co. 0.2%Denali Therapeutics, Inc. 0.2%
# 97.2%100.0%
† Amount rounds to less than 0.1%.#
§ Please refer to the Statements of Assets and Liabilities for additional details.1
2
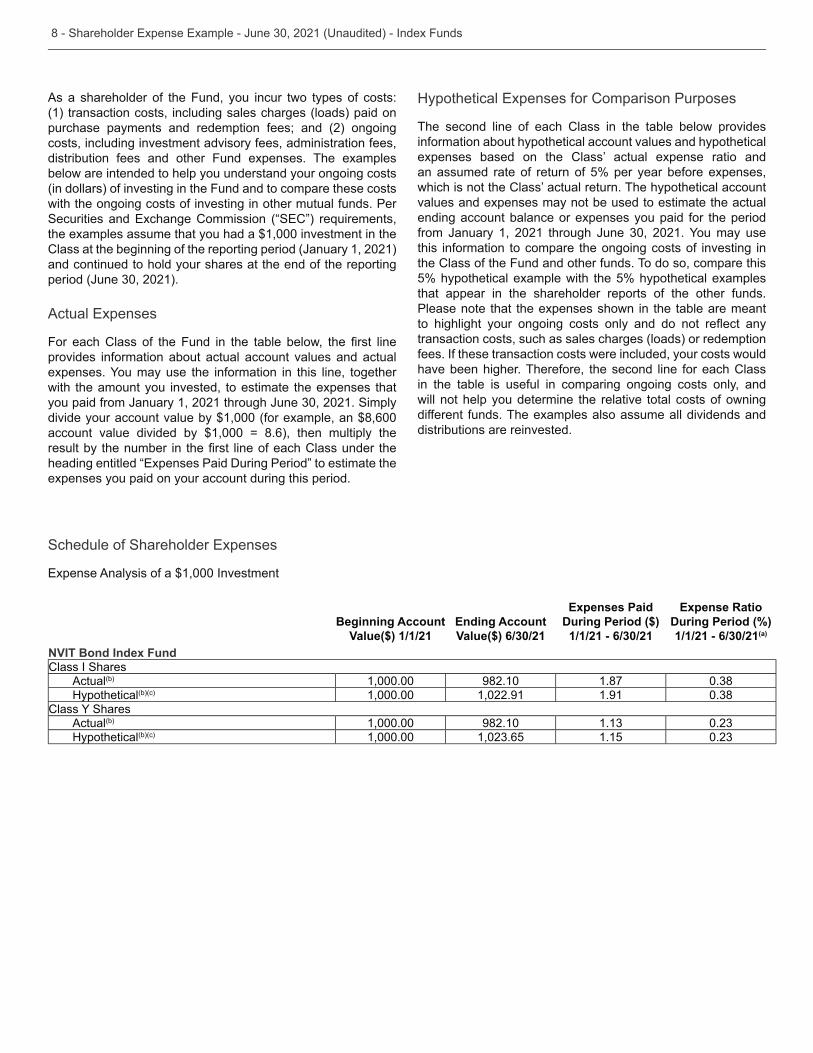
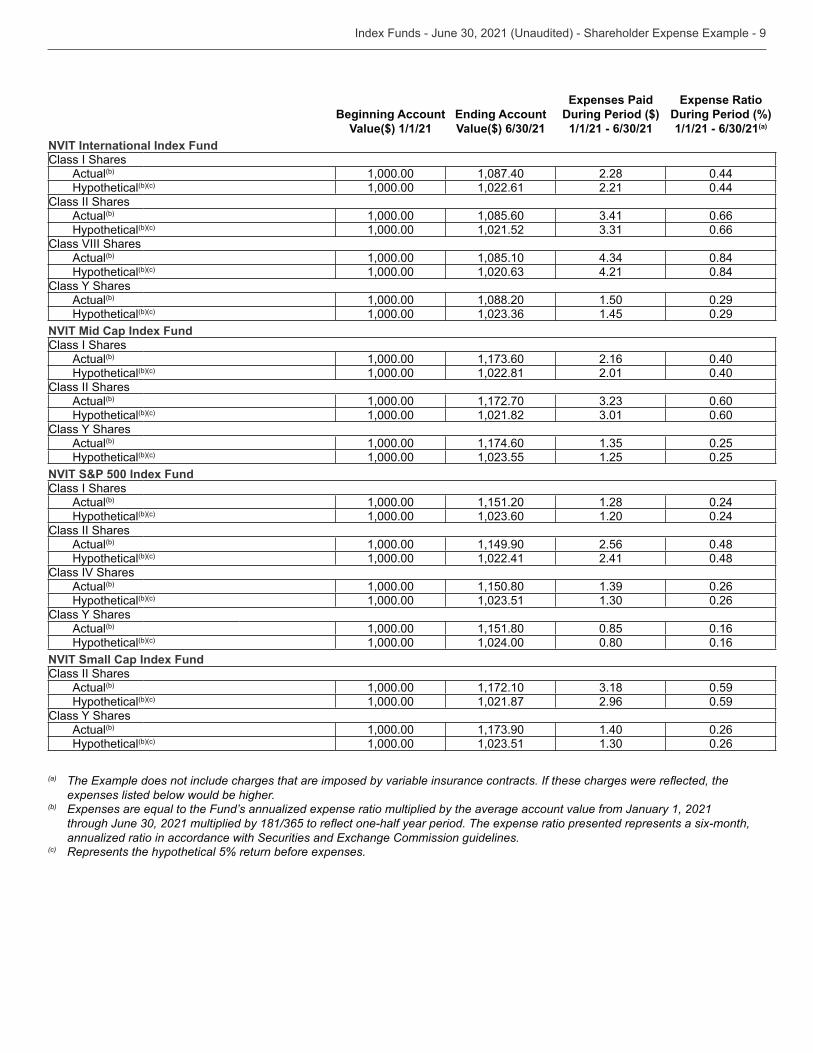
As a shareholder of the Fund, you incur two types of costs: (1) transaction costs, including sales charges (loads) paid on purchase payments and redemption fees; and (2) ongoing costs, including investment advisory fees, administration fees, distribution fees and other Fund expenses. The examples below are intended to help you understand your ongoing costs (in dollars) of investing in the Fund and to compare these costs with the ongoing costs of investing in other mutual funds. Per
the examples assume that you had a $1,000 investment in the Class at the beginning of the reporting period (January 1, 2021) and continued to hold your shares at the end of the reporting
provides information about actual account values and actual
with the amount you invested, to estimate the expenses that
divide your account value by $1,000 (for example, an $8,600 account value divided by $1,000 = 8.6), then multiply the
expenses you paid on your account during this period.
The second line of each Class in the table below provides information about hypothetical account values and hypothetical
an assumed rate of return of 5% per year before expenses,
values and expenses may not be used to estimate the actual ending account balance or expenses you paid for the period
this information to compare the ongoing costs of investing in the Class of the Fund and other funds. To do so, compare this 5% hypothetical example with the 5% hypothetical examples that appear in the shareholder reports of the other funds. Please note that the expenses shown in the table are meant
transaction costs, such as sales charges (loads) or redemption fees. If these transaction costs were included, your costs would have been higher. Therefore, the second line for each Class in the table is useful in comparing ongoing costs only, and will not help you determine the relative total costs of owning different funds. The examples also assume all dividends and distributions are reinvested.
Beginning Account Value($) 1/1/21
Ending Account Value($) 6/30/21
Expenses Paid During Period ($) 1/1/21 6/30/21
Expense Ratio During Period (%) 1/1/21 6/30/21(a)
NVIT Bond Index FundClass I Shares
Actual(b) 1,000.00 982.10 1.87Hypothetical(b)(c) 1,000.00 1,022.91 1.91
Actual(b) 1,000.00 982.10Hypothetical(b)(c) 1,000.00 1.15
Beginning Account Value($) 1/1/21
Ending Account Value($) 6/30/21
Expenses Paid During Period ($) 1/1/21 6/30/21
Expense Ratio During Period (%) 1/1/21 6/30/21(a)
NVIT International Index FundClass I Shares
Actual(b) 1,000.00 1,087.40 2.28 0.44Hypothetical(b)(c) 1,000.00 1,022.61 2.21 0.44
Class II SharesActual(b) 1,000.00 1,085.60 0.66Hypothetical(b)(c) 1,000.00 1,021.52 0.66
Class VIII SharesActual(b) 1,000.00 1,085.10 0.84Hypothetical(b)(c) 1,000.00 4.21 0.84
Actual(b) 1,000.00 1,088.20 1.50 0.29Hypothetical(b)(c) 1,000.00 1.45 0.29
NVIT Mid Cap Index FundClass I Shares
Actual(b) 1,000.00 2.16 0.40Hypothetical(b)(c) 1,000.00 1,022.81 2.01 0.40
Class II SharesActual(b) 1,000.00 1,172.70 0.60Hypothetical(b)(c) 1,000.00 1,021.82 0.60
Actual(b) 1,000.00 1,174.60 0.25Hypothetical(b)(c) 1,000.00 1.25 0.25
NVIT S&P 500 Index FundClass I Shares
Actual(b) 1,000.00 1,151.20 1.28 0.24Hypothetical(b)(c) 1,000.00 1.20 0.24
Class II SharesActual(b) 1,000.00 1,149.90 2.56 0.48Hypothetical(b)(c) 1,000.00 1,022.41 2.41 0.48
Class IV SharesActual(b) 1,000.00 1,150.80 0.26Hypothetical(b)(c) 1,000.00 0.26
Actual(b) 1,000.00 1,151.80 0.85 0.16Hypothetical(b)(c) 1,000.00 1,024.00 0.80 0.16
NVIT Small Cap Index FundClass II Shares
Actual(b) 1,000.00 1,172.10 0.59Hypothetical(b)(c) 1,000.00 1,021.87 2.96 0.59
Actual(b) 1,000.00 1.40 0.26Hypothetical(b)(c) 1,000.00 0.26
(a)
expenses listed below would be higher.(b)
annualized ratio in accordance with Securities and Exchange Commission guidelines.(c)
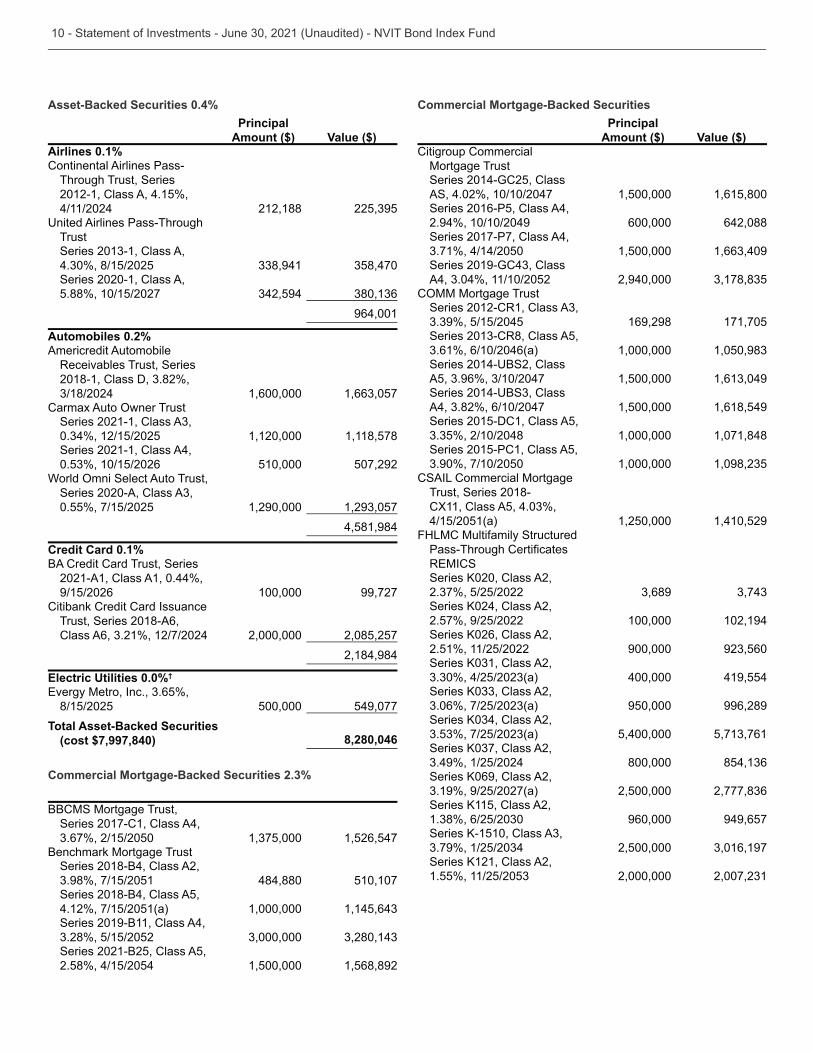
0.4%Principal
Amount ($) Value ($)Airlines 0.1%Continental Airlines Pass-
Through Trust, Series 2012-1, Class A, 4.15%, 4/11/2024 212,188
Trust
Series 2020-1, Class A, 5.88%, 10/15/2027
964,001
Automobiles 0.2%Americredit Automobile
Receivables Trust, Series
1,600,000
1,120,000 1,118,578Series 2021-1, Class A4,
510,000 507,292
0.55%, 7/15/2025 1,290,000 4,581,984
Credit Card 0.1%BA Credit Card Trust, Series
2021-A1, Class A1, 0.44%, 9/15/2026 100,000 99,727
Citibank Credit Card Issuance Trust, Series 2018-A6,
2,000,000 2,085,257 2,184,984
Electric Utilities 0.0%†
8/15/2025 500,000 549,077
(cost $7,997,840) 8,280,046
2.3%
BBCMS Mortgage Trust, Series 2017-C1, Class A4,
1,526,547Benchmark Mortgage Trust
Series 2018-B4, Class A2, 484,880 510,107
Series 2018-B4, Class A5, 4.12%, 7/15/2051(a) 1,000,000 Series 2019-B11, Class A4,
Series 2021-B25, Class A5, 2.58%, 4/15/2054 1,500,000 1,568,892
Principal
Amount ($) Value ($)Citigroup Commercial
Mortgage Trust Series 2014-GC25, Class AS, 4.02%, 10/10/2047 1,500,000 1,615,800Series 2016-P5, Class A4, 2.94%, 10/10/2049 600,000 642,088Series 2017-P7, Class A4,
1,500,000
2,940,000
169,298 171,705
1,000,000
1,500,000
1,500,000 1,618,549Series 2015-DC1, Class A5,
1,000,000 1,071,848Series 2015-PC1, Class A5,
1,000,000 CSAIL Commercial Mortgage
Trust, Series 2018-
4/15/2051(a) 1,250,000 1,410,529FHLMC Multifamily Structured
2.57%, 9/25/2022 100,000 102,194
2.51%, 11/25/2022 900,000
400,000 419,554
950,000 996,289
5,400,000
800,000
2,500,000
960,000 949,657
2,500,000
2,000,000
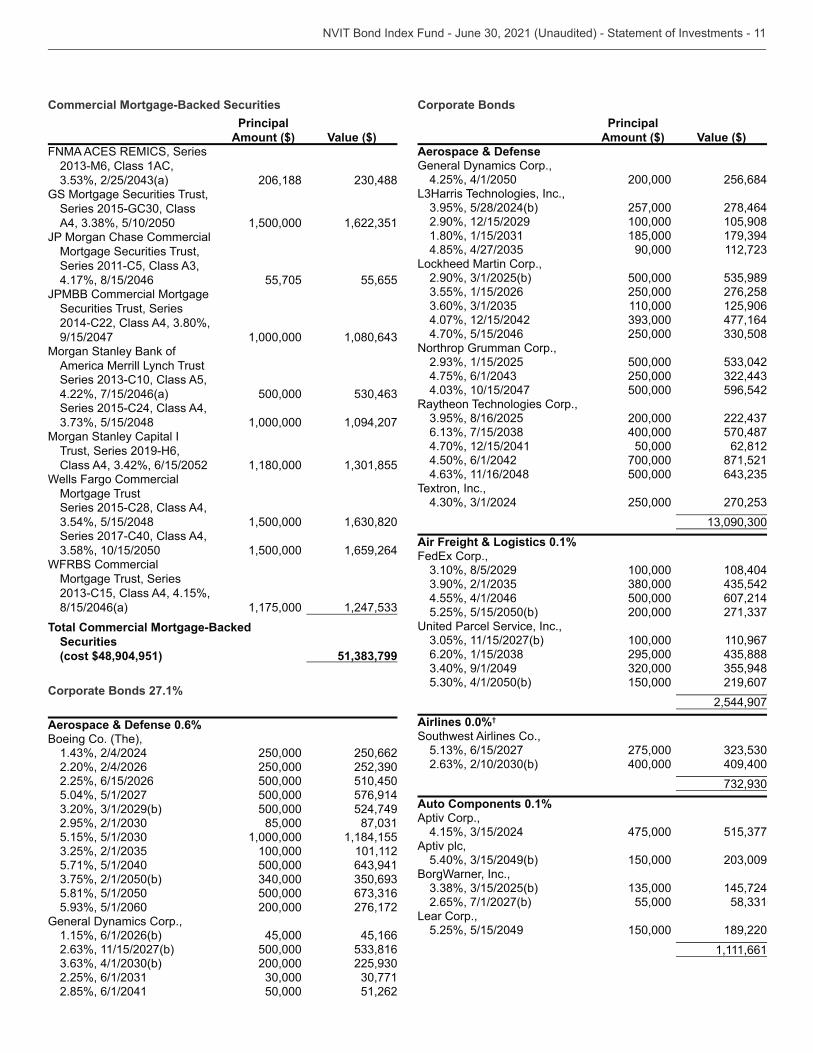
Principal
Amount ($) Value ($)
206,188 GS Mortgage Securities Trust,
1,500,000 JP Morgan Chase Commercial
Mortgage Securities Trust,
4.17%, 8/15/2046 55,705 55,655JPMBB Commercial Mortgage
Securities Trust, Series
9/15/2047 1,000,000 Morgan Stanley Bank of
America Merrill Lynch Trust
4.22%, 7/15/2046(a) 500,000 Series 2015-C24, Class A4,
1,000,000 1,094,207Morgan Stanley Capital I
Trust, Series 2019-H6, 1,180,000
Wells Fargo Commercial Mortgage Trust Series 2015-C28, Class A4,
1,500,000 Series 2017-C40, Class A4,
1,500,000 1,659,264WFRBS Commercial
Mortgage Trust, Series
8/15/2046(a) 1,175,000
Securities (cost $48,904,951) 51,383,799
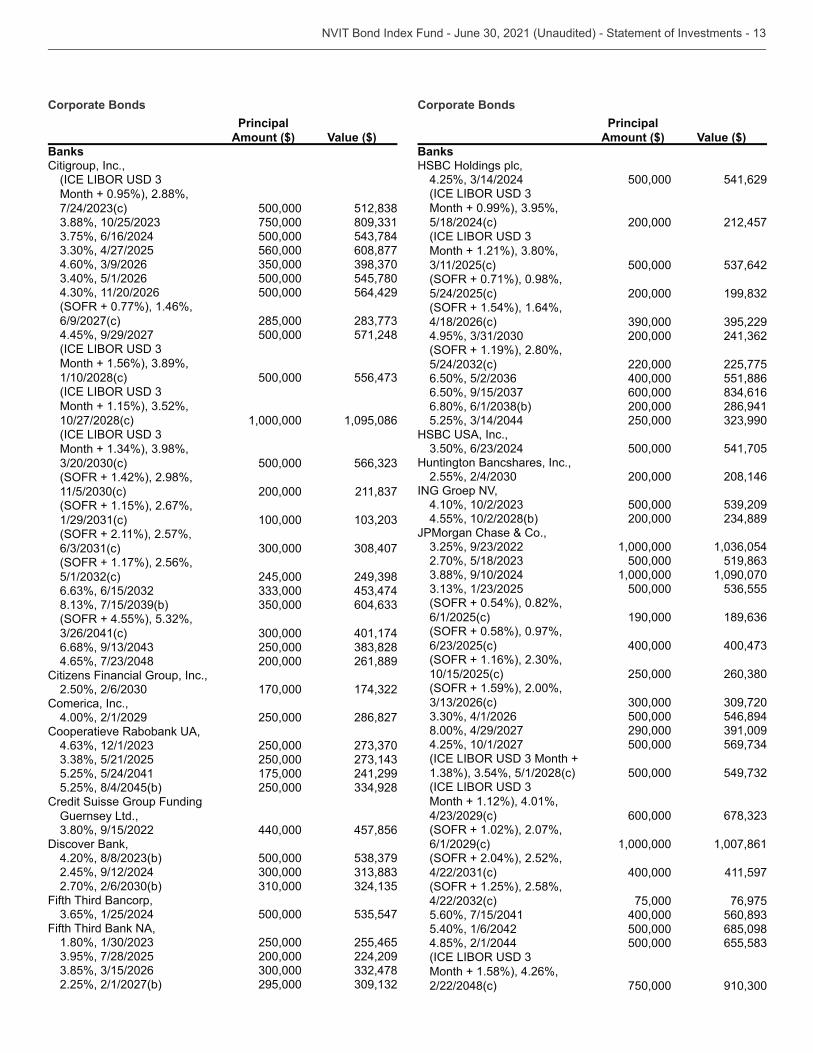
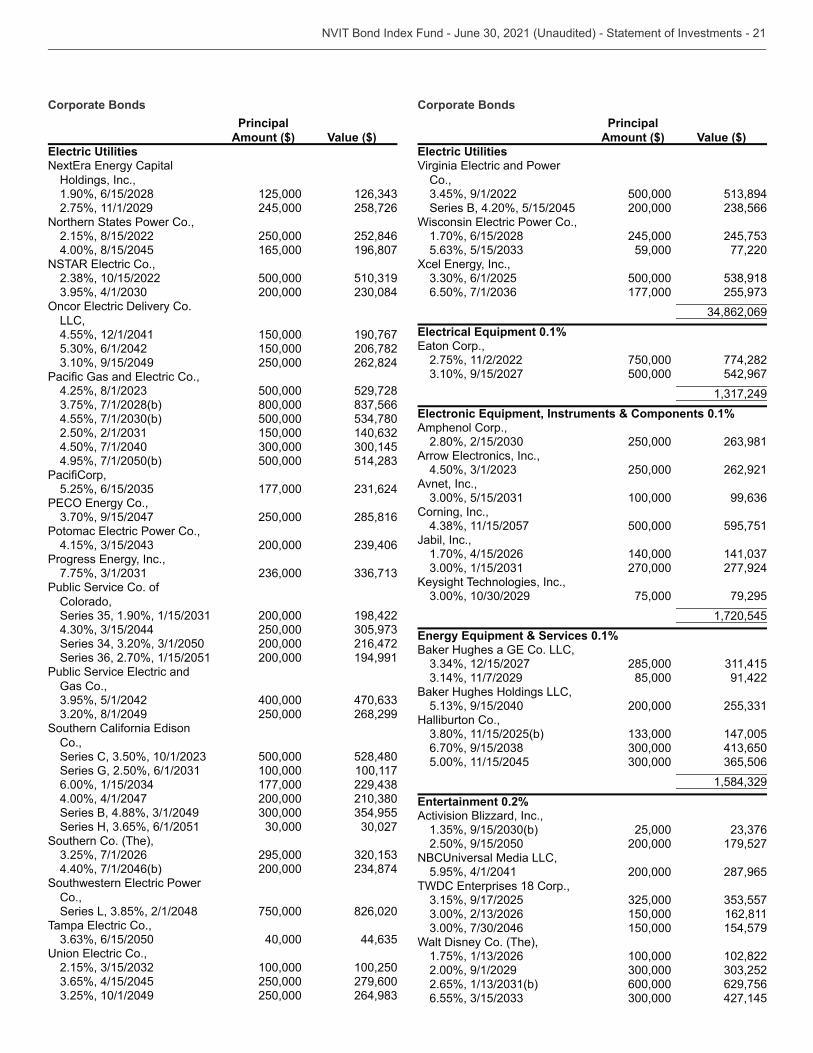
Corporate Bonds 27.1%
Aerospace & Defense 0.6%Boeing Co. (The),
250,000 250,6622.20%, 2/4/2026 250,000 2.25%, 6/15/2026 500,000 510,4505.04%, 5/1/2027 500,000 576,914
500,000 524,749 85,000 1,000,000 1,184,155 100,000 101,112
5.71%, 5/1/2040 500,000
5.81%, 5/1/2050 500,000 200,000 276,172
General Dynamics Corp.,1.15%, 6/1/2026(b) 45,000 45,166
500,000 200,000
2.85%, 6/1/2041 50,000 51,262
Corporate Bonds
Principal
Amount ($) Value ($)Aerospace & DefenseGeneral Dynamics Corp.,
4.25%, 4/1/2050 200,000 256,684,
257,000 278,4642.90%, 12/15/2029 100,000 105,908
185,000 90,000
Lockheed Martin Corp., 500,000 250,000 276,258 110,000 125,906
4.07%, 12/15/2042 477,1644.70%, 5/15/2046 250,000
Northrop Grumman Corp., 500,000 250,000 500,000 596,542
Raytheon Technologies Corp., 200,000 400,000 570,487
4.70%, 12/15/2041 50,000 62,8124.50%, 6/1/2042 700,000 871,521
500,000 Textron, Inc.,
250,000
Air Freight & Logistics 0.1%,
100,000 108,404
4.55%, 4/1/2046 500,000 607,2145.25%, 5/15/2050(b) 200,000
, 100,000 110,967 295,000 150,000 219,607
2,544,907Airlines 0.0%†
Southwest Airlines Co., 275,000 400,000 409,400
Auto Components 0.1%Aptiv Corp.,
475,000 Aptiv plc,
150,000 BorgWarner, Inc.,
145,7242.65%, 7/1/2027(b) 55,000
Lear Corp.,5.25%, 5/15/2049 150,000 189,220
1,111,661
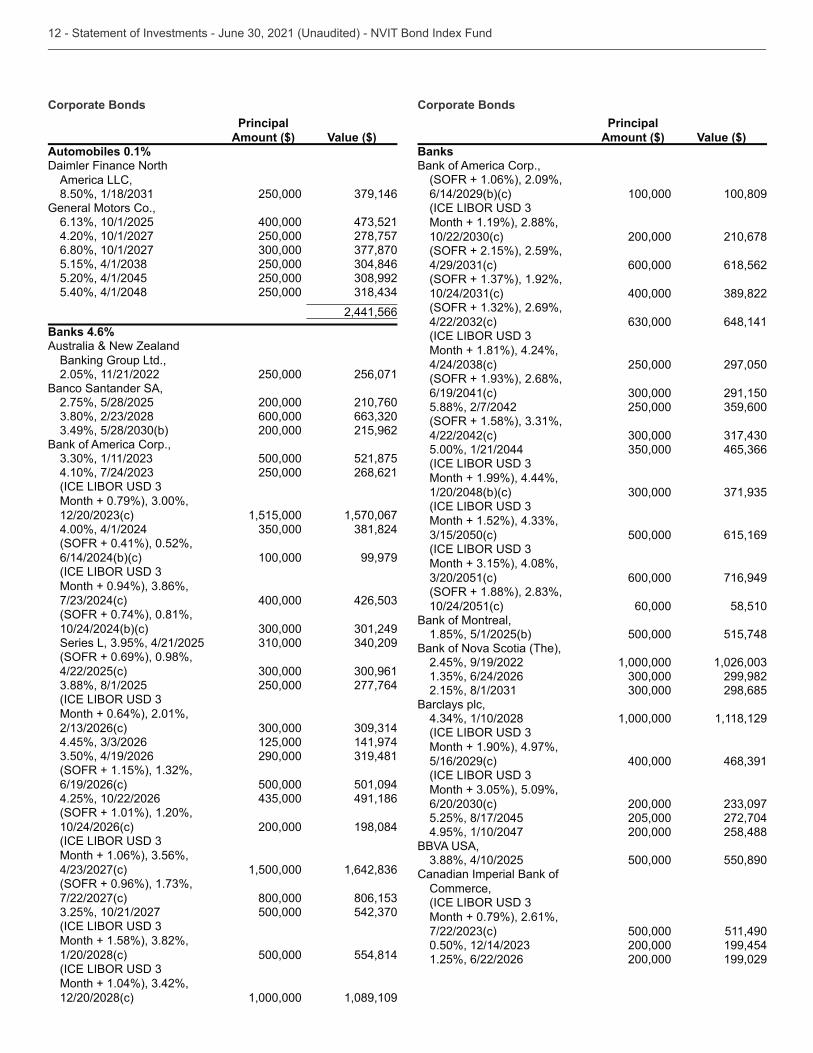
Corporate Bonds
Principal
Amount ($) Value ($)Automobiles 0.1%Daimler Finance North
America LLC, 250,000
General Motors Co., 400,000
4.20%, 10/1/2027 250,000 278,7576.80%, 10/1/2027
250,000 5.20%, 4/1/2045 250,000 5.40%, 4/1/2048 250,000
2,441,566Banks 4.6%Australia & New Zealand
Banking Group Ltd.,2.05%, 11/21/2022 250,000 256,071
Banco Santander SA,2.75%, 5/28/2025 200,000 210,760
600,000 200,000 215,962
Bank of America Corp., 500,000 521,875 250,000 268,621
1,515,000 1,570,0674.00%, 4/1/2024
6/14/2024(b)(c) 100,000 99,979
400,000
10/24/2024(b)(c)
4/22/2025(c) 250,000 277,764
Month + 0.64%), 2.01%, 125,000 141,974 290,000
6/19/2026(c) 500,000 501,0944.25%, 10/22/2026 491,186
10/24/2026(c) 200,000 198,084
1,500,000
7/22/2027(c) 800,000 500,000
1/20/2028(c) 500,000 554,814
12/20/2028(c) 1,000,000 1,089,109
Corporate Bonds
Principal
Amount ($) Value ($)BanksBank of America Corp.,
6/14/2029(b)(c) 100,000 100,809
Month + 1.19%), 2.88%, 200,000 210,678
600,000 618,562
400,000
648,141
Month + 1.81%), 4.24%, 250,000 297,050
6/19/2041(c) 291,1505.88%, 2/7/2042 250,000
4/22/2042(c) 5.00%, 1/21/2044
Month + 1.99%), 4.44%, 1/20/2048(b)(c)
500,000 615,169
600,000 716,949
10/24/2051(c) 60,000 58,510Bank of Montreal,
1.85%, 5/1/2025(b) 500,000 515,748Bank of Nova Scotia (The),
2.45%, 9/19/2022 1,000,000 299,982 298,685
Barclays plc, 1,000,000 1,118,129
Month + 1.90%), 4.97%, 5/16/2029(c) 400,000
200,000 5.25%, 8/17/2045 205,000 272,7044.95%, 1/10/2047 200,000 258,488
, 500,000 550,890
Canadian Imperial Bank of Commerce,
Month + 0.79%), 2.61%, 500,000 511,490 200,000 199,454
1.25%, 6/22/2026 200,000 199,029
Corporate Bonds
Principal
Amount ($) Value ($)BanksCitigroup, Inc.,
Month + 0.95%), 2.88%, 500,000 750,000 500,000 560,000 608,877 500,000 545,780 500,000 564,429
6/9/2027(c) 285,000 4.45%, 9/29/2027 500,000 571,248
1/10/2028(c) 500,000
10/27/2028(c) 1,000,000 1,095,086
500,000
200,000
100,000
245,000
401,174 250,000 200,000 261,889
Citizens Financial Group, Inc., 170,000
Comerica, Inc.,4.00%, 2/1/2029 250,000 286,827
, 250,000 250,000
5.25%, 5/24/2041 175,000 241,2995.25%, 8/4/2045(b) 250,000
Credit Suisse Group Funding Guernsey Ltd.,
440,000 457,856Discover Bank,
500,000 2.45%, 9/12/2024
Fifth Third Bancorp,
500,000 Fifth Third Bank NA,
250,000 255,465 200,000 224,209
2.25%, 2/1/2027(b) 295,000
Corporate Bonds
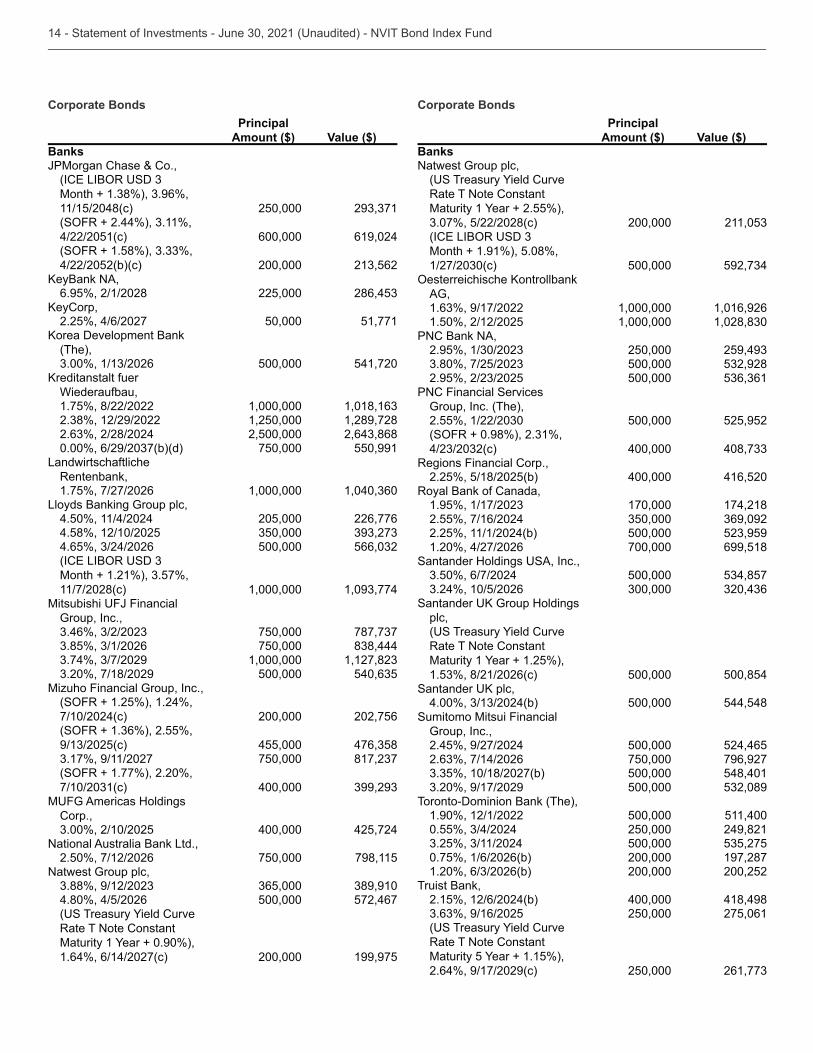
Principal
Amount ($) Value ($)BanksHSBC Holdings plc,
500,000 541,629
5/18/2024(c) 200,000 212,457
500,000
5/24/2025(c) 200,000
4/18/2026(c) 200,000
220,000 225,775 400,000 551,886 600,000 200,000 286,941 250,000
, 500,000 541,705
Huntington Bancshares, Inc., 200,000 208,146
ING Groep NV, 500,000
4.55%, 10/2/2028(b) 200,000 JPMorgan Chase & Co.,
1,000,000 500,000 1,000,000 1,090,070 500,000
6/1/2025(c) 190,000
400,000
10/15/2025(c) 250,000
500,000 546,894
8.00%, 4/29/2027 290,000 4.25%, 10/1/2027 500,000
500,000
Month + 1.12%), 4.01%, 600,000
6/1/2029(c) 1,000,000 1,007,861
400,000 411,597
75,000 76,9755.60%, 7/15/2041 400,000 5.40%, 1/6/2042 500,000 685,0984.85%, 2/1/2044 500,000
Month + 1.58%), 4.26%, 2/22/2048(c) 750,000
Corporate Bonds
Principal
Amount ($) Value ($)BanksJPMorgan Chase & Co.,
11/15/2048(c) 250,000
4/22/2051(c) 600,000 619,024
4/22/2052(b)(c) 200,000 ,
6.95%, 2/1/2028 225,000 ,
2.25%, 4/6/2027 50,000 51,771
(The), 500,000 541,720
Wiederaufbau,1.75%, 8/22/2022 1,000,000
1,250,000 1,289,728 2,500,000 750,000 550,991
Landwirtschaftliche Rentenbank,1.75%, 7/27/2026 1,000,000
Lloyds Banking Group plc,4.50%, 11/4/2024 205,000 226,7764.58%, 12/10/2025
500,000
11/7/2028(c) 1,000,000
Group, Inc., 750,000 750,000 1,000,000 500,000
Mizuho Financial Group, Inc.,
7/10/2024(c) 200,000 202,756
455,000 750,000
400,000
Corp., 400,000 425,724
National Australia Bank Ltd.,2.50%, 7/12/2026 750,000 798,115
Natwest Group plc,
4.80%, 4/5/2026 500,000 572,467
Rate T Note Constant
1.64%, 6/14/2027(c) 200,000 199,975
Corporate Bonds
Principal
Amount ($) Value ($)BanksNatwest Group plc,
Rate T Note Constant
200,000
Month + 1.91%), 5.08%, 500,000
AG, 1,000,000 1,016,926
1.50%, 2/12/2025 1,000,000 PNC Bank NA,
250,000 500,000 500,000
PNC Financial Services Group, Inc. (The),
500,000 525,952
400,000 Regions Financial Corp.,
2.25%, 5/18/2025(b) 400,000 416,520Royal Bank of Canada,
170,000 174,2182.55%, 7/16/2024 2.25%, 11/1/2024(b) 500,000 1.20%, 4/27/2026 700,000 699,518
, 500,000
plc,
Rate T Note Constant
500,000 500,854,
500,000 544,548Sumitomo Mitsui Financial
Group, Inc.,2.45%, 9/27/2024 500,000 524,465
750,000 796,927 500,000 548,401 500,000
Toronto-Dominion Bank (The),1.90%, 12/1/2022 500,000 511,400
250,000 249,821 500,000
0.75%, 1/6/2026(b) 200,000 197,287 200,000 200,252
Truist Bank,2.15%, 12/6/2024(b) 400,000 418,498
250,000 275,061
Rate T Note Constant
2.64%, 9/17/2029(c) 250,000
Corporate Bonds
Principal
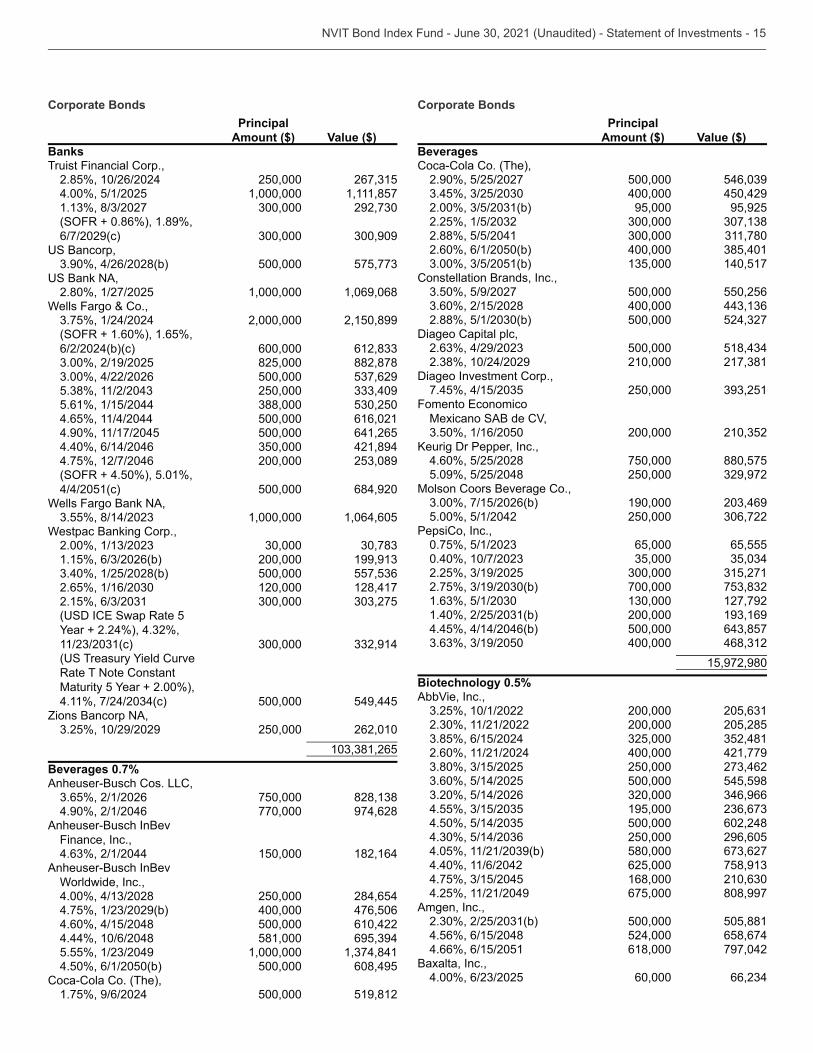
Amount ($) Value ($)BanksTruist Financial Corp.,
2.85%, 10/26/2024 250,000 4.00%, 5/1/2025 1,000,000 1,111,857
6/7/2029(c) ,
500,000 ,
2.80%, 1/27/2025 1,000,000 1,069,068Wells Fargo & Co.,
2,000,000 2,150,899
6/2/2024(b)(c) 600,000 825,000 882,878 500,000 250,000
5.61%, 1/15/2044 4.65%, 11/4/2044 500,000 616,0214.90%, 11/17/2045 500,000 641,2654.40%, 6/14/2046 421,8944.75%, 12/7/2046 200,000
4/4/2051(c) 500,000 684,920Wells Fargo Bank NA,
1,000,000 1,064,605Westpac Banking Corp.,
200,000 500,000 120,000 128,417
Rate T Note Constant
500,000 549,445Zions Bancorp NA,
250,000 262,010
Beverages 0.7%Anheuser-Busch Cos. LLC,
750,000 4.90%, 2/1/2046 770,000 974,628
Anheuser-Busch InBev Finance, Inc.,
150,000 182,164Anheuser-Busch InBev
Worldwide, Inc., 250,000 284,654 400,000 476,506
4.60%, 4/15/2048 500,000 610,4224.44%, 10/6/2048 581,000
1,000,000 4.50%, 6/1/2050(b) 500,000 608,495
Coca-Cola Co. (The),1.75%, 9/6/2024 500,000 519,812
Corporate Bonds
Principal
Amount ($) Value ($)BeveragesCoca-Cola Co. (The),
2.90%, 5/25/2027 500,000 400,000 450,429 95,000 95,925
2.88%, 5/5/2041 2.60%, 6/1/2050(b) 400,000
140,517Constellation Brands, Inc.,
500,000 550,256 400,000 500,000
Diageo Capital plc, 500,000 210,000
Diageo Investment Corp., 250,000
Mexicano SAB de CV, 200,000
,4.60%, 5/25/2028 750,000 880,5755.09%, 5/25/2048 250,000
Molson Coors Beverage Co., 190,000
5.00%, 5/1/2042 250,000 PepsiCo, Inc.,
65,000 65,555 700,000 127,792 200,000
4.45%, 4/14/2046(b) 500,000 400,000
15,972,980Biotechnology 0.5%AbbVie, Inc.,
200,000 200,000 205,285
2.60%, 11/21/2024 400,000 421,779 250,000 500,000 545,598 195,000 500,000 602,248 250,000 296,605 580,000
4.40%, 11/6/2042 625,000 168,000
4.25%, 11/21/2049 675,000 808,997Amgen, Inc.,
500,000 505,8814.56%, 6/15/2048 524,000 658,6744.66%, 6/15/2051 618,000 797,042
Baxalta, Inc., 60,000
Corporate Bonds
Principal
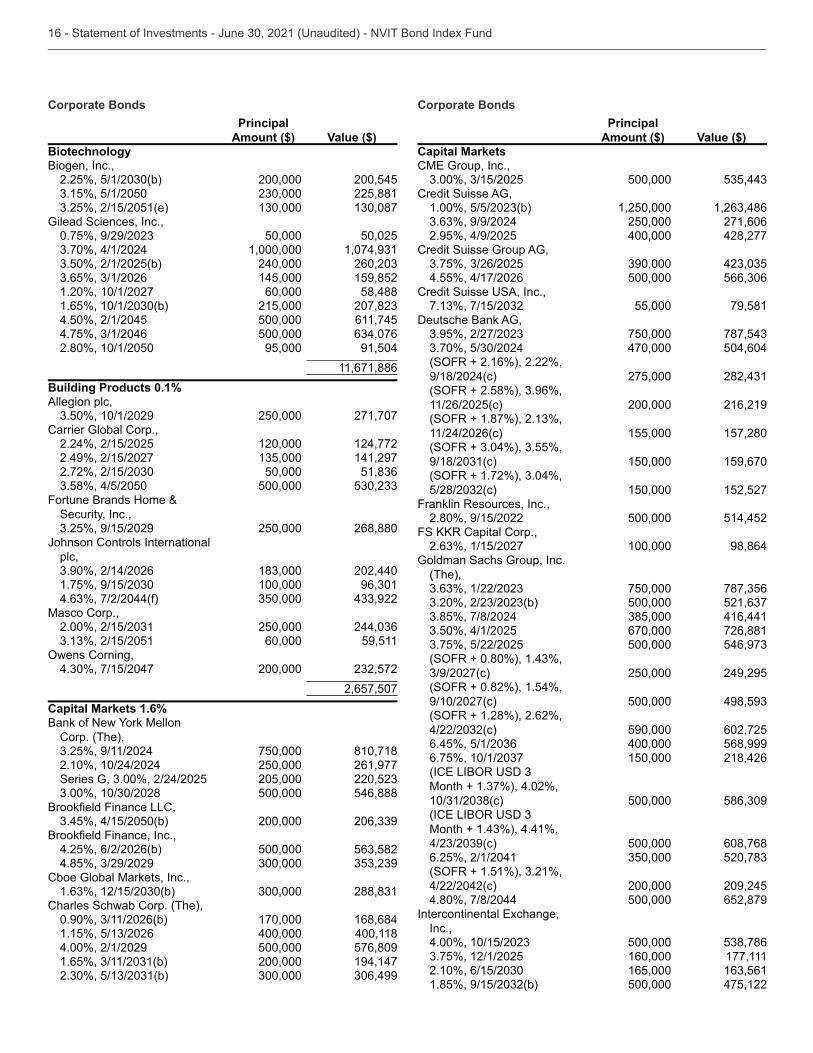
Amount ($) Value ($)BiotechnologyBiogen, Inc.,
200,000 200,545 225,881
Gilead Sciences, Inc., 50,000 50,025 1,000,000 240,000 145,000 159,852
1.20%, 10/1/2027 60,000 58,488 215,000
4.50%, 2/1/2045 500,000 611,745 500,000
2.80%, 10/1/2050 95,000 91,504 11,671,886
Building Products 0.1%Allegion plc,
250,000 271,707Carrier Global Corp.,
2.24%, 2/15/2025 120,000 124,7722.49%, 2/15/2027 141,297
50,000 500,000
Fortune Brands Home & Security, Inc.,
250,000 268,880Johnson Controls International
plc, 202,440 100,000
Masco Corp., 250,000 60,000 59,511
, 200,000
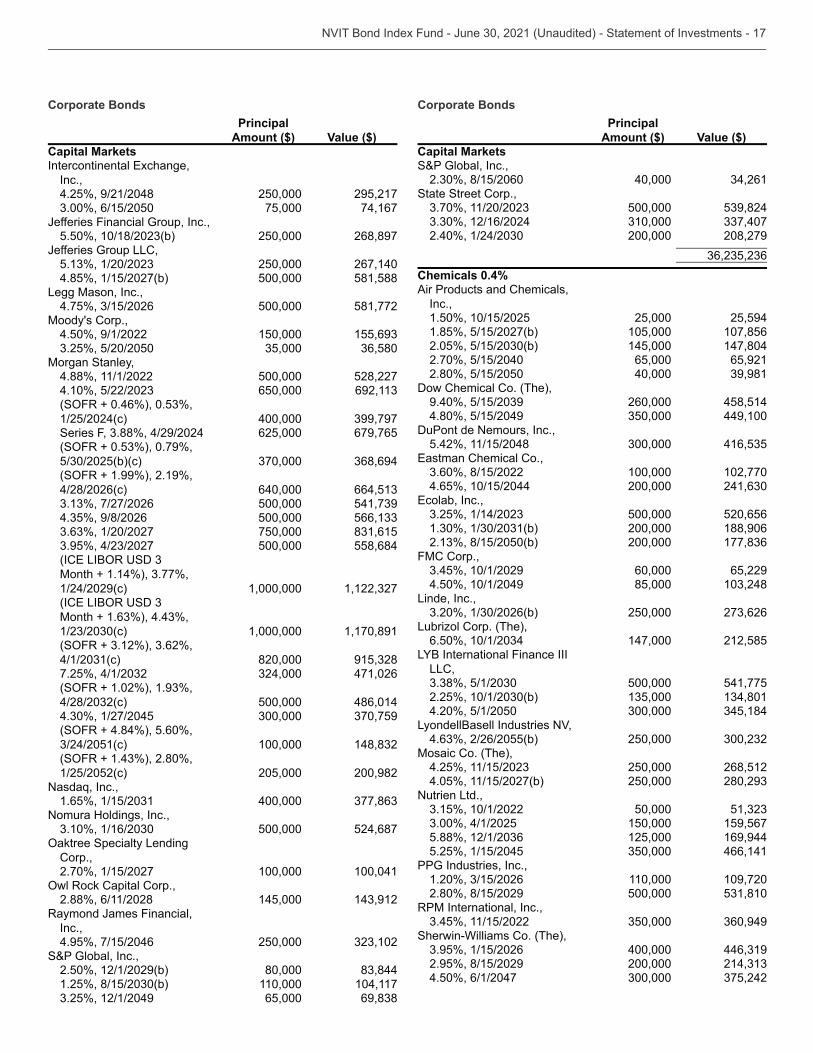
2,657,507Capital Markets 1.6%
Corp. (The), 750,000 810,718
2.10%, 10/24/2024 250,000 261,977 205,000 500,000 546,888
, 200,000
,4.25%, 6/2/2026(b) 500,000
Cboe Global Markets, Inc.,
Charles Schwab Corp. (The),
170,000 168,684 400,000 400,118
4.00%, 2/1/2029 500,000 576,809 200,000 194,147
Corporate Bonds
Principal
Amount ($) Value ($)Capital Markets
, 500,000
Credit Suisse AG, 1,250,000 250,000 271,606
2.95%, 4/9/2025 400,000 428,277Credit Suisse Group AG,
4.55%, 4/17/2026 500,000
, 55,000 79,581
Deutsche Bank AG, 750,000 470,000 504,604
9/18/2024(c) 275,000
11/26/2025(c) 200,000 216,219
11/24/2026(c) 155,000 157,280
150,000 159,670
150,000 152,527Franklin Resources, Inc.,
2.80%, 9/15/2022 500,000 514,452,
100,000 98,864Goldman Sachs Group, Inc.
(The), 750,000 500,000 416,441 670,000 726,881 500,000
250,000 249,295
9/10/2027(c) 500,000
590,000 602,725 400,000 568,999 150,000 218,426
500,000
500,000 608,7686.25%, 2/1/2041
4/22/2042(c) 200,000 209,2454.80%, 7/8/2044 500,000 652,879
Inc., 500,000 160,000 177,111 165,000 500,000 475,122
Corporate Bonds
Principal
Amount ($) Value ($)Capital Markets
Inc.,
4.25%, 9/21/2048 250,000 295,217 75,000 74,167
Jefferies Financial Group, Inc., 250,000 268,897
Jefferies Group LLC, 250,000 267,140
4.85%, 1/15/2027(b) 500,000 581,588Legg Mason, Inc.,
500,000 581,772Moody's Corp.,
4.50%, 9/1/2022 150,000
Morgan Stanley,4.88%, 11/1/2022 500,000 528,227
650,000
1/25/2024(c) 400,000 625,000 679,765
4/28/2026(c) 640,000 500,000 500,000 750,000 500,000 558,684
1/24/2029(c) 1,000,000
1,000,000 1,170,891
820,000 471,026
500,000 486,014
100,000
1/25/2052(c) 205,000 200,982,
400,000 Nomura Holdings, Inc.,
500,000 524,687
Corp.,2.70%, 1/15/2027 100,000 100,041
,2.88%, 6/11/2028 145,000
Raymond James Financial, Inc.,4.95%, 7/15/2046 250,000
S&P Global, Inc.,2.50%, 12/1/2029(b) 80,000
110,000 104,117 65,000
Corporate Bonds
Principal
Amount ($) Value ($)Capital MarketsS&P Global, Inc.,
40,000 State Street Corp.,
500,000 200,000 208,279
Chemicals 0.4%Air Products and Chemicals,
Inc.,1.50%, 10/15/2025 25,000 25,5941.85%, 5/15/2027(b) 105,000 107,856
145,000 147,8042.70%, 5/15/2040 65,000 65,9212.80%, 5/15/2050 40,000
Dow Chemical Co. (The), 260,000 458,514
4.80%, 5/15/2049 449,100DuPont de Nemours, Inc.,
5.42%, 11/15/2048 ,
100,000 102,7704.65%, 10/15/2044 200,000
, 500,000 520,656 200,000 188,906 200,000
FMC Corp., 60,000 65,229
4.50%, 10/1/2049 85,000 Linde, Inc.,
250,000 Lubrizol Corp. (The),
147,000 212,585
LLC, 500,000 541,775
4.20%, 5/1/2050 LyondellBasell Industries NV,
250,000 Mosaic Co. (The),
250,000 268,5124.05%, 11/15/2027(b) 250,000
Nutrien Ltd., 50,000 150,000 159,567 125,000 169,944
5.25%, 1/15/2045 466,141PPG Industries, Inc.,
110,000 109,7202.80%, 8/15/2029 500,000
RPM International, Inc.,
Sherwin-Williams Co. (The), 400,000
2.95%, 8/15/2029 200,000 4.50%, 6/1/2047
Corporate Bonds
Principal
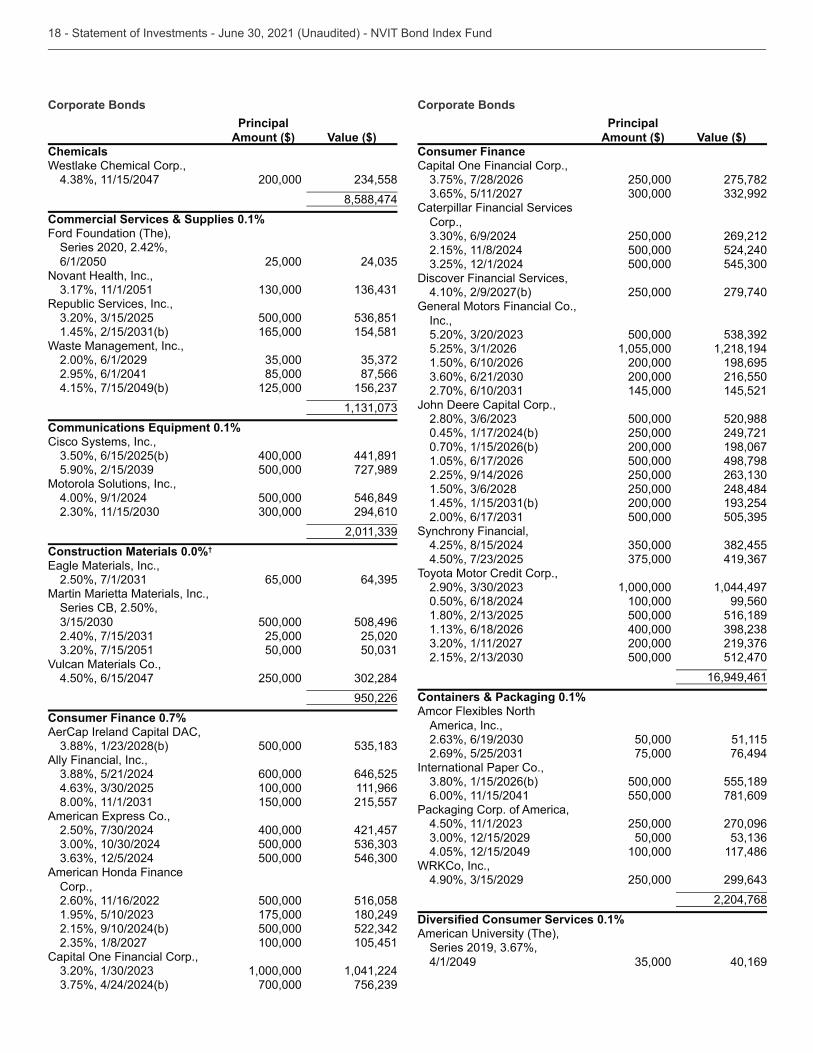
Amount ($) Value ($)ChemicalsWestlake Chemical Corp.,
200,000 8,588,474
Commercial Services & Supplies 0.1%Ford Foundation (The),
Series 2020, 2.42%, 6/1/2050 25,000
Novant Health, Inc.,
Republic Services, Inc., 500,000 165,000 154,581
Waste Management, Inc.,2.00%, 6/1/2029 2.95%, 6/1/2041 85,000 87,5664.15%, 7/15/2049(b) 125,000
Communications Equipment 0.1%Cisco Systems, Inc.,
400,000 441,891 500,000 727,989
Motorola Solutions, Inc.,4.00%, 9/1/2024 500,000 546,849
294,610
Construction Materials 0.0%†
, 65,000
Martin Marietta Materials, Inc.,Series CB, 2.50%,
500,000 508,496 25,000 25,020 50,000
Vulcan Materials Co.,4.50%, 6/15/2047 250,000
950,226Consumer Finance 0.7%AerCap Ireland Capital DAC,
500,000 Ally Financial, Inc.,
600,000 646,525 100,000 111,966 150,000 215,557
, 400,000 421,457 500,000 500,000
American Honda Finance Corp.,2.60%, 11/16/2022 500,000 516,058
175,000 180,2492.15%, 9/10/2024(b) 500,000
100,000 105,451,
1,000,000 1,041,224 700,000
Corporate Bonds
Principal
Amount ($) Value ($)Consumer Finance
250,000 275,782
Caterpillar Financial Services Corp.,
250,000 269,2122.15%, 11/8/2024 500,000 524,240
500,000 Discover Financial Services,
4.10%, 2/9/2027(b) 250,000 279,740General Motors Financial Co.,
Inc., 500,000 1,055,000 1,218,194
1.50%, 6/10/2026 200,000 198,695 200,000 216,550 145,000 145,521
John Deere Capital Corp., 500,000 520,988
0.45%, 1/17/2024(b) 250,000 249,7210.70%, 1/15/2026(b) 200,000 198,0671.05%, 6/17/2026 500,000 498,7982.25%, 9/14/2026 250,000
250,000 248,484 200,000 500,000
Synchrony Financial,4.25%, 8/15/2024
Toyota Motor Credit Corp.,
1,000,000 1,044,4970.50%, 6/18/2024 100,000 99,560
500,000 516,189 400,000 200,000 500,000 512,470
16,949,461Containers & Packaging 0.1%Amcor Flexibles North
America, Inc., 50,000 51,115 75,000 76,494
International Paper Co., 500,000 555,189
6.00%, 11/15/2041 550,000 781,609Packaging Corp. of America,
250,000 270,096 50,000
4.05%, 12/15/2049 100,000 117,486,
250,000 2,204,768
0.1%,
4/1/2049 40,169
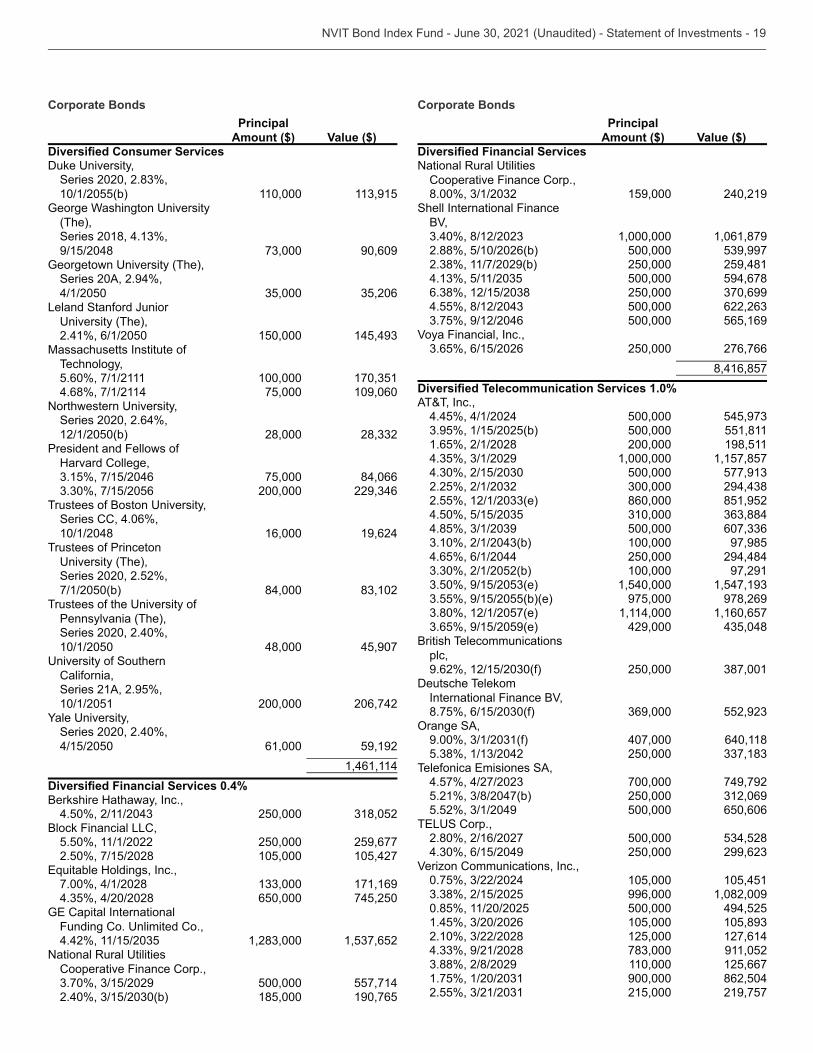
Corporate Bonds
Principal
Amount ($) Value ($)
,
10/1/2055(b) 110,000
(The),
9/15/2048 90,609,
Series 20A, 2.94%, 4/1/2050
Leland Stanford Junior ,
2.41%, 6/1/2050 150,000 Massachusetts Institute of
Technology,5.60%, 7/1/2111 100,000 4.68%, 7/1/2114 75,000 109,060
,Series 2020, 2.64%, 12/1/2050(b) 28,000
President and Fellows of Harvard College,
75,000 84,066 200,000
,Series CC, 4.06%, 10/1/2048 16,000 19,624
Trustees of Princeton ,
Series 2020, 2.52%, 7/1/2050(b) 84,000
Pennsylvania (The),Series 2020, 2.40%, 10/1/2050 48,000 45,907
California,Series 21A, 2.95%, 10/1/2051 200,000 206,742
,Series 2020, 2.40%, 4/15/2050 61,000 59,192
1,461,114 0.4%
Berkshire Hathaway, Inc., 250,000
Block Financial LLC,5.50%, 11/1/2022 250,000 259,6772.50%, 7/15/2028 105,000 105,427
,7.00%, 4/1/2028 171,169
650,000 745,250
,
Cooperative Finance Corp., 500,000 557,714 185,000 190,765
Corporate Bonds
Principal
Amount ($) Value ($)
Cooperative Finance Corp.,
159,000 240,219Shell International Finance
BV, 1,000,000 1,061,879
2.88%, 5/10/2026(b) 500,000 250,000 259,481 500,000 594,678 250,000 500,000 500,000 565,169
Voya Financial, Inc., 250,000 276,766
8,416,857 1.0%
AT&T, Inc.,4.45%, 4/1/2024 500,000
500,000 551,8111.65%, 2/1/2028 200,000 198,511
1,000,000 1,157,857 500,000 860,000 851,952 500,000 100,000 97,985
4.65%, 6/1/2044 250,000 294,484 100,000 97,291 1,540,000 975,000 978,269 1,114,000 1,160,657 429,000
British Telecommunications plc,
250,000 Deutsche Telekom
International Finance BV,
, 407,000 640,118 250,000
, 700,000 749,792 250,000 500,000 650,606
,2.80%, 2/16/2027 500,000
250,000 Verizon Communications, Inc.,
105,000 105,451 996,000 1,082,009
0.85%, 11/20/2025 500,000 494,525 105,000 125,000 127,614 911,052 110,000 125,667 900,000 862,504 215,000 219,757
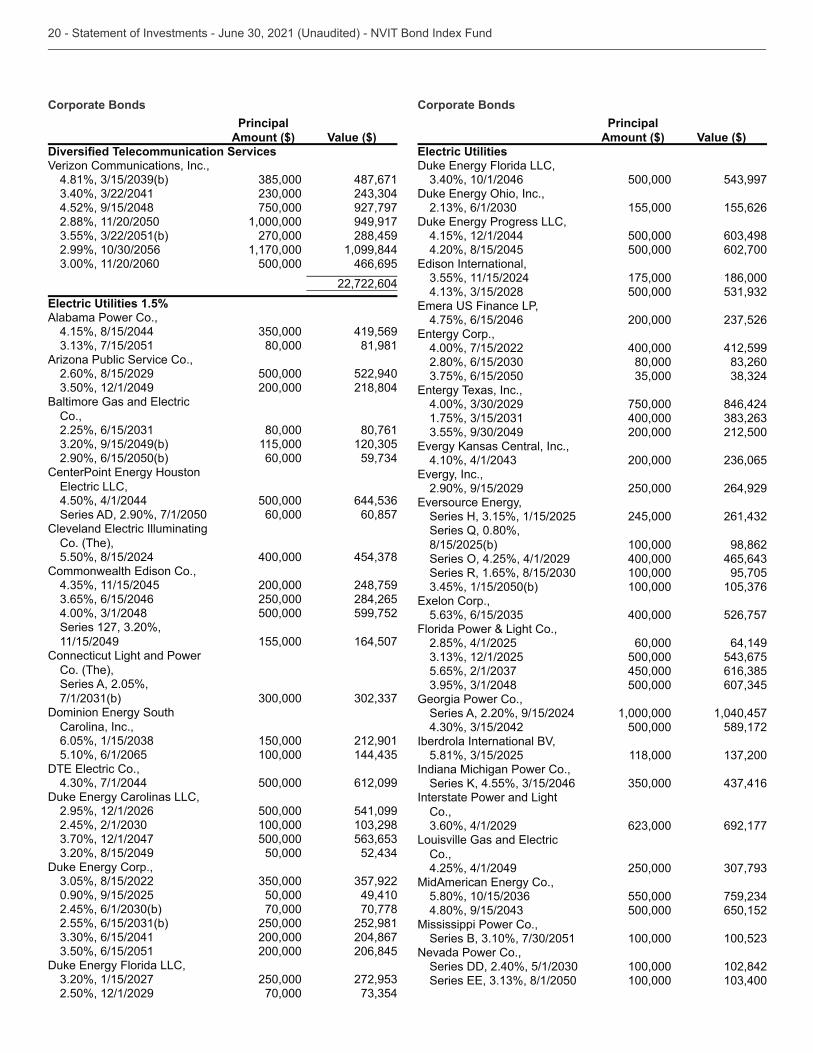
Corporate Bonds
Principal
Amount ($) Value ($)
Verizon Communications, Inc.,
487,671
4.52%, 9/15/2048 750,000 927,7972.88%, 11/20/2050 1,000,000 949,917
270,000 288,459 1,170,000 1,099,844 500,000 466,695
22,722,604Electric Utilities 1.5%Alabama Power Co.,
4.15%, 8/15/2044 419,569 80,000 81,981
Arizona Public Service Co.,2.60%, 8/15/2029 500,000 522,940
200,000 218,804
Co., 80,000 80,761 115,000
2.90%, 6/15/2050(b) 60,000
,4.50%, 4/1/2044 500,000 Series AD, 2.90%, 7/1/2050 60,000 60,857
Co. (The),5.50%, 8/15/2024 400,000
, 200,000 248,759 250,000 284,265 500,000 599,752
11/15/2049 155,000 164,507Connecticut Light and Power
Co. (The),Series A, 2.05%,
Carolina, Inc., 150,000 212,901
5.10%, 6/1/2065 100,000 ,
500,000 612,099,
2.95%, 12/1/2026 500,000 541,099 100,000 500,000 50,000
,
0.90%, 9/15/2025 50,000 49,410 70,000 70,778 250,000 252,981 200,000 204,867 200,000 206,845
, 250,000
2.50%, 12/1/2029 70,000
Corporate Bonds
Principal
Amount ($) Value ($)Electric Utilities
500,000 ,
155,000 155,626,
4.15%, 12/1/2044 500,000 4.20%, 8/15/2045 500,000 602,700
, 175,000 186,000 500,000
,4.75%, 6/15/2046 200,000
,4.00%, 7/15/2022 400,000 412,599
80,000
, 750,000 846,424 400,000 200,000 212,500
, 200,000
,2.90%, 9/15/2029 250,000 264,929
, 245,000
Series Q, 0.80%, 8/15/2025(b) 100,000 98,862
400,000 100,000 95,705 100,000
, 400,000 526,757
Florida Power & Light Co.,2.85%, 4/1/2025 60,000 64,149
500,000 450,000 500,000
Georgia Power Co.,Series A, 2.20%, 9/15/2024 1,000,000 1,040,457
500,000 589,172Iberdrola International BV,
118,000 Indiana Michigan Power Co.,
Interstate Power and Light
Co., 692,177
Co.,4.25%, 4/1/2049 250,000
, 550,000 500,000 650,152
Mississippi Power Co., 100,000
Nevada Power Co., 100,000 102,842 100,000
Corporate Bonds
Principal
Amount ($) Value ($)Electric Utilities
Holdings, Inc.,1.90%, 6/15/2028 125,000 2.75%, 11/1/2029 245,000 258,726
Northern States Power Co.,2.15%, 8/15/2022 250,000 252,8464.00%, 8/15/2045 165,000 196,807
, 500,000 200,000
LLC,4.55%, 12/1/2041 150,000 190,767
150,000 206,782 250,000 262,824
, 500,000 529,728 800,000 500,000 150,000
4.50%, 7/1/2040 4.95%, 7/1/2050(b) 500,000
, 177,000
, 250,000 285,816
, 200,000
,
Public Service Co. of Colorado,
200,000 198,422 250,000 200,000 216,472 200,000 194,991
Gas Co., 400,000 250,000 268,299
Co., 500,000 528,480 100,000 100,117 177,000
4.00%, 4/1/2047 200,000
Southern Co. (The), 295,000
4.40%, 7/1/2046(b) 200,000
Co., 750,000 826,020
, 40,000
, 100,000 100,250 250,000 279,600 250,000
Corporate Bonds
Principal
Amount ($) Value ($)Electric Utilities
Co., 500,000
Series B, 4.20%, 5/15/2045 200,000 ,
1.70%, 6/15/2028 245,000 59,000 77,220
, 500,000 177,000
Electrical Equipment 0.1%
,2.75%, 11/2/2022 750,000 774,282
500,000 542,967
Electronic Equipment, Instruments & Components 0.1%Amphenol Corp.,
250,000 ,
250,000 262,921Avnet, Inc.,
100,000 Corning, Inc.,
500,000 595,751Jabil, Inc.,
1.70%, 4/15/2026 140,000 270,000 277,924
, 75,000 79,295
1,720,545Energy Equipment & Services 0.1%
, 285,000 85,000 91,422
Baker Hughes Holdings LLC, 200,000
Halliburton Co., 147,005
5.00%, 11/15/2045
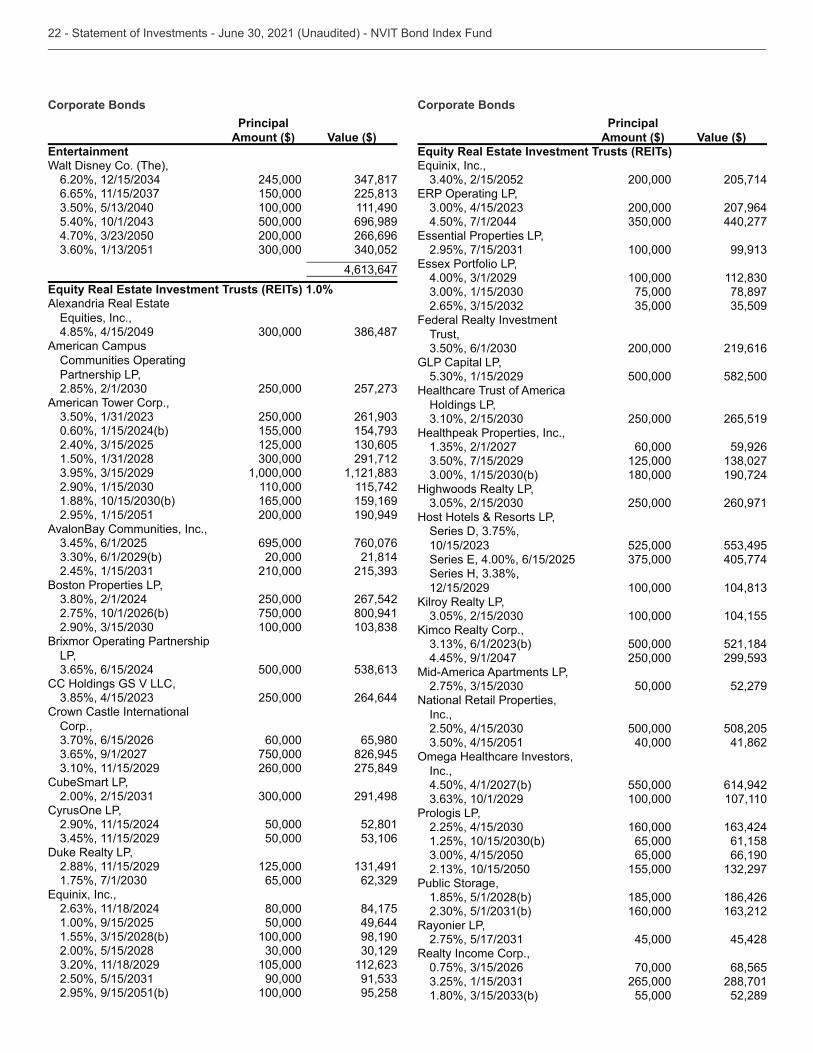
Entertainment 0.2%Activision Blizzard, Inc.,
25,000 2.50%, 9/15/2050 200,000 179,527
,5.95%, 4/1/2041 200,000 287,965
, 150,000 162,811 150,000 154,579
Walt Disney Co. (The), 100,000 102,822
2.00%, 9/1/2029 600,000 629,756 427,145
Corporate Bonds
Principal
Amount ($) Value ($)EntertainmentWalt Disney Co. (The),
245,000 150,000 100,000 111,490 500,000 696,989 200,000 266,696
Equity Real Estate Investment Trusts (REITs) 1.0%
,4.85%, 4/15/2049
American Campus
Partnership LP, 250,000
American Tower Corp., 250,000
0.60%, 1/15/2024(b) 155,000 125,000 291,712 1,000,000 110,000 115,742 165,000 159,169
2.95%, 1/15/2051 200,000 190,949AvalonBay Communities, Inc.,
695,000 760,076 20,000 21,814 210,000
Boston Properties LP, 250,000 267,542
2.75%, 10/1/2026(b) 750,000 800,941 100,000
LP, 500,000
CC Holdings GS V LLC, 250,000 264,644
Crown Castle International Corp.,
60,000 65,980 750,000 826,945 260,000 275,849
CubeSmart LP, 291,498
,2.90%, 11/15/2024 50,000 52,801
50,000 Duke Realty LP,
2.88%, 11/15/2029 125,000 65,000
, 80,000 84,175
1.00%, 9/15/2025 50,000 49,644 100,000 98,190
2.00%, 5/15/2028 105,000 90,000
2.95%, 9/15/2051(b) 100,000 95,258
Corporate Bonds
Principal
Amount ($) Value ($)Equity Real Estate Investment Trusts (REITs)
200,000 205,714,
200,000 207,9644.50%, 7/1/2044 440,277
, 100,000
, 100,000 75,000 78,897
Federal Realty Investment Trust,
200,000 219,616GLP Capital LP,
500,000 582,500Healthcare Trust of America
Holdings LP, 250,000 265,519
Healthpeak Properties, Inc., 60,000 59,926 125,000 180,000 190,724
Highwoods Realty LP, 250,000 260,971
Host Hotels & Resorts LP,
525,000 405,774
12/15/2029 100,000 ,
100,000 104,155,
500,000 521,1844.45%, 9/1/2047 250,000
Mid-America Apartments LP, 50,000 52,279
National Retail Properties, Inc.,
500,000 508,205 40,000 41,862
Inc.,4.50%, 4/1/2027(b) 550,000 614,942
100,000 107,110Prologis LP,
160,000 65,000 61,158 65,000 66,190 155,000
Public Storage,1.85%, 5/1/2028(b) 185,000 186,426
160,000 Rayonier LP,
45,000 45,428Realty Income Corp.,
70,000 68,565 265,000 288,701 55,000 52,289
Corporate Bonds
Principal
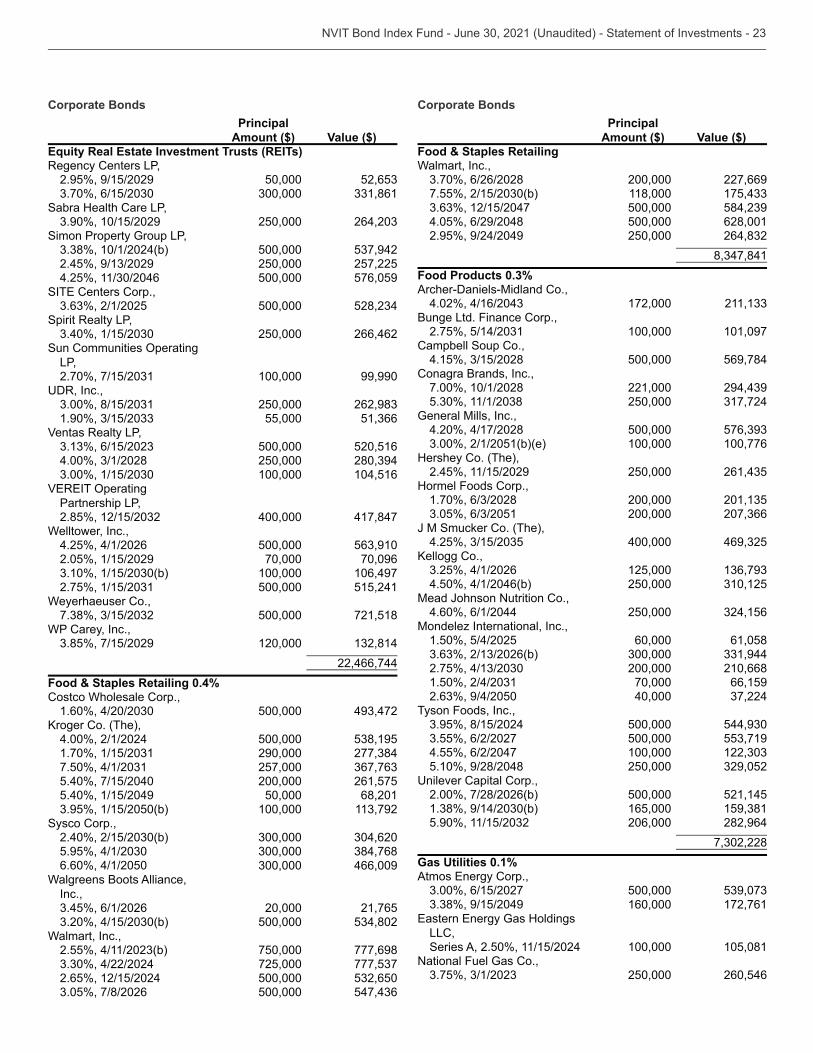
Amount ($) Value ($)Equity Real Estate Investment Trusts (REITs)Regency Centers LP,
2.95%, 9/15/2029 50,000
Sabra Health Care LP, 250,000
Simon Property Group LP, 500,000 250,000 257,225 500,000 576,059
, 500,000
Spirit Realty LP, 250,000 266,462
LP, 100,000 99,990
, 250,000 55,000
Ventas Realty LP, 500,000 520,516 250,000 100,000 104,516
Partnership LP, 400,000 417,847
Welltower, Inc.,4.25%, 4/1/2026 500,000 2.05%, 1/15/2029 70,000 70,096
100,000 106,497 500,000 515,241
Weyerhaeuser Co., 500,000 721,518
WP Carey, Inc., 120,000
22,466,744Food & Staples Retailing 0.4%Costco Wholesale Corp.,
500,000 ,
4.00%, 2/1/2024 500,000 290,000 257,000
5.40%, 7/15/2040 200,000 261,5755.40%, 1/15/2049 50,000 68,201
100,000 Sysco Corp.,
6.60%, 4/1/2050 466,009Walgreens Boots Alliance,
Inc., 20,000 21,765 500,000
Walmart, Inc., 750,000 777,698 725,000
2.65%, 12/15/2024 500,000 500,000
Corporate Bonds
Principal
Amount ($) Value ($)Food & Staples RetailingWalmart, Inc.,
200,000 227,669 118,000 500,000
4.05%, 6/29/2048 500,000 628,0012.95%, 9/24/2049 250,000
Food Products 0.3%Archer-Daniels-Midland Co.,
172,000 Bunge Ltd. Finance Corp.,
100,000 101,097Campbell Soup Co.,
500,000 569,784Conagra Brands, Inc.,
7.00%, 10/1/2028 221,000 250,000
General Mills, Inc.,4.20%, 4/17/2028 500,000
100,000 100,776Hershey Co. (The),
2.45%, 11/15/2029 250,000 Hormel Foods Corp.,
200,000 200,000
J M Smucker Co. (The), 400,000
, 125,000
4.50%, 4/1/2046(b) 250,000 Mead Johnson Nutrition Co.,
4.60%, 6/1/2044 250,000 Mondelez International, Inc.,
1.50%, 5/4/2025 60,000 61,058 200,000 210,668 70,000 66,159 40,000
Tyson Foods, Inc., 500,000 500,000
4.55%, 6/2/2047 100,000 5.10%, 9/28/2048 250,000
,2.00%, 7/28/2026(b) 500,000 521,145
165,000 206,000 282,964
Gas Utilities 0.1%
, 500,000 160,000 172,761
LLC,Series A, 2.50%, 11/15/2024 100,000 105,081
National Fuel Gas Co., 250,000 260,546
Corporate Bonds
Principal
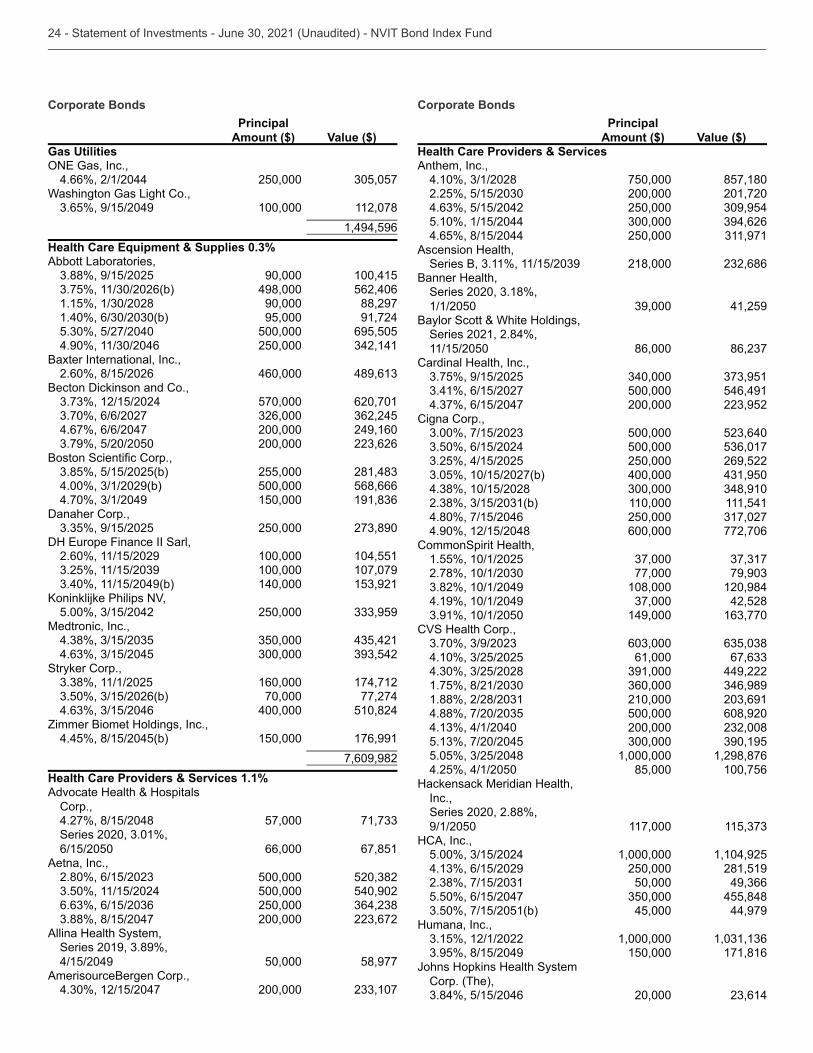
Amount ($) Value ($)Gas Utilities
,4.66%, 2/1/2044 250,000
Washington Gas Light Co., 100,000 112,078
1,494,596Health Care Equipment & Supplies 0.3%Abbott Laboratories,
90,000 100,415 498,000 562,406 90,000 88,297 95,000 91,724 500,000 695,505 250,000
Baxter International, Inc.,2.60%, 8/15/2026 460,000
Becton Dickinson and Co., 570,000 620,701
4.67%, 6/6/2047 200,000 249,160 200,000
, 255,000 500,000 568,666 150,000
Danaher Corp., 250,000
,2.60%, 11/15/2029 100,000 104,551
100,000 107,079 140,000
, 250,000
Medtronic, Inc.,
Stryker Corp., 160,000 174,712 70,000 77,274 400,000 510,824
Zimmer Biomet Holdings, Inc.,4.45%, 8/15/2045(b) 150,000 176,991
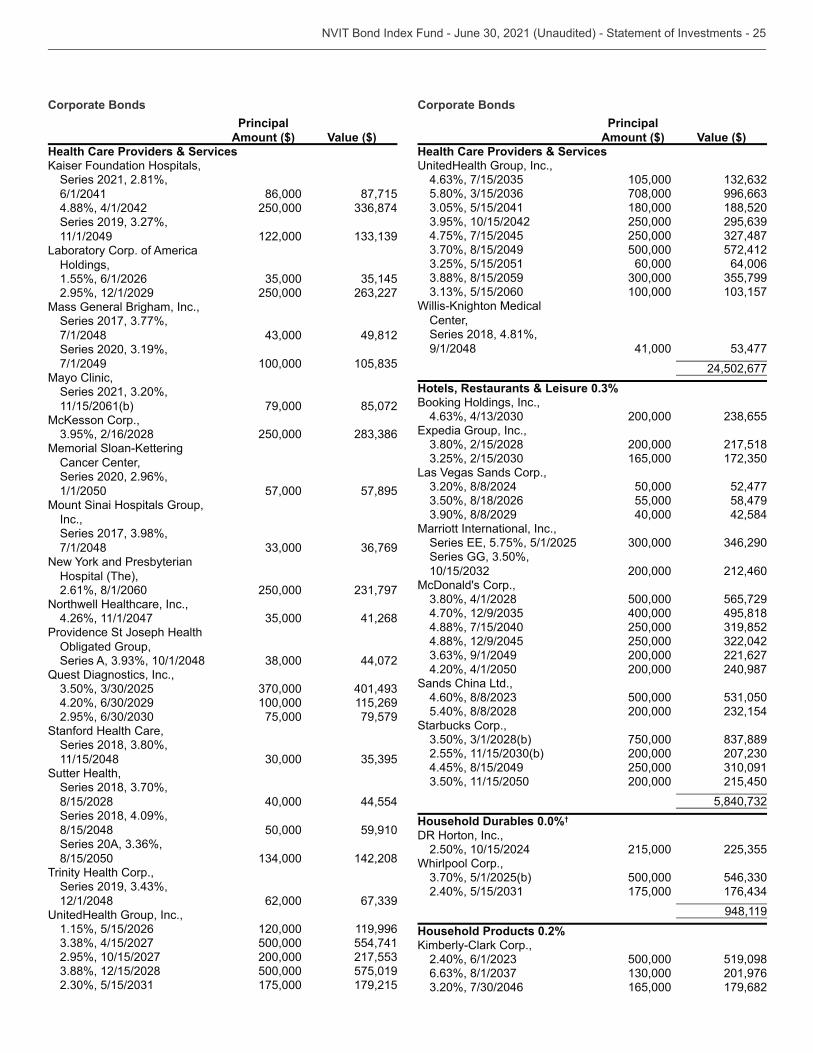
7,609,982Health Care Providers & Services 1.1%Advocate Health & Hospitals
Corp.,4.27%, 8/15/2048 57,000
6/15/2050 66,000 67,851Aetna, Inc.,
500,000 500,000 540,902 250,000 200,000
Allina Health System,
4/15/2049 50,000 58,977AmerisourceBergen Corp.,
200,000
Corporate Bonds
Principal
Amount ($) Value ($)Health Care Providers & ServicesAnthem, Inc.,
750,000 857,180 200,000 201,720 250,000
5.10%, 1/15/2044 4.65%, 8/15/2044 250,000
Ascension Health, 218,000
Banner Health,
1/1/2050 41,259Baylor Scott & White Holdings,
Series 2021, 2.84%, 11/15/2050 86,000
Cardinal Health, Inc., 500,000 546,491 200,000
Cigna Corp., 500,000 500,000 250,000 269,522 400,000 110,000 111,541
4.80%, 7/15/2046 250,000 4.90%, 12/15/2048 600,000 772,706
CommonSpirit Health,1.55%, 10/1/2025
77,000 108,000 120,984
4.19%, 10/1/2049 42,528 149,000
CVS Health Corp., 61,000 449,222 210,000 500,000 608,920 200,000 1,000,000 1,298,876
4.25%, 4/1/2050 85,000 100,756Hackensack Meridian Health,
Inc.,Series 2020, 2.88%, 9/1/2050 117,000
HCA, Inc., 1,000,000 1,104,925 250,000 281,519 50,000
5.50%, 6/15/2047 455,848 45,000 44,979
Humana, Inc., 1,000,000 150,000 171,816
Johns Hopkins Health System Corp. (The),
20,000
Corporate Bonds
Principal
Amount ($) Value ($)Health Care Providers & Services
,Series 2021, 2.81%, 6/1/2041 86,000 87,7154.88%, 4/1/2042 250,000
11/1/2049 122,000 Laboratory Corp. of America
Holdings,1.55%, 6/1/2026 2.95%, 12/1/2029 250,000
Mass General Brigham, Inc.,
7/1/2048 49,812
7/1/2049 100,000 Mayo Clinic,
11/15/2061(b) 79,000 85,072,
250,000
Cancer Center,Series 2020, 2.96%, 1/1/2050 57,000 57,895
Mount Sinai Hospitals Group, Inc.,
7/1/2048
Hospital (The),2.61%, 8/1/2060 250,000
Northwell Healthcare, Inc.,4.26%, 11/1/2047 41,268
Providence St Joseph Health ,
44,072Quest Diagnostics, Inc.,
100,000 115,269 75,000 79,579
Stanford Health Care,
11/15/2048 Sutter Health,
8/15/2028 40,000 44,554Series 2018, 4.09%, 8/15/2048 50,000 59,910
8/15/2050 142,208Trinity Health Corp.,
12/1/2048 62,000 ,
1.15%, 5/15/2026 120,000 119,996 500,000 554,741
2.95%, 10/15/2027 200,000 500,000 575,019 175,000 179,215
Corporate Bonds
Principal
Amount ($) Value ($)Health Care Providers & Services
105,000 708,000 180,000 188,520 250,000
4.75%, 7/15/2045 250,000 500,000 572,412 60,000 64,006 100,000
Center,Series 2018, 4.81%, 9/1/2048 41,000
24,502,677Hotels, Restaurants & Leisure 0.3%Booking Holdings, Inc.,
200,000 ,
200,000 217,518 165,000
Las Vegas Sands Corp., 50,000 52,477 55,000 58,479 40,000 42,584
Marriott International, Inc.,
200,000 212,460McDonald's Corp.,
500,000 565,729 400,000 495,818
4.88%, 7/15/2040 250,000 4.88%, 12/9/2045 250,000
200,000 221,6274.20%, 4/1/2050 200,000 240,987
Sands China Ltd., 500,000
5.40%, 8/8/2028 200,000 Starbucks Corp.,
750,000 200,000
4.45%, 8/15/2049 250,000 200,000 215,450
Household Durables 0.0%†
DR Horton, Inc.,2.50%, 10/15/2024 215,000
Whirlpool Corp., 500,000 175,000
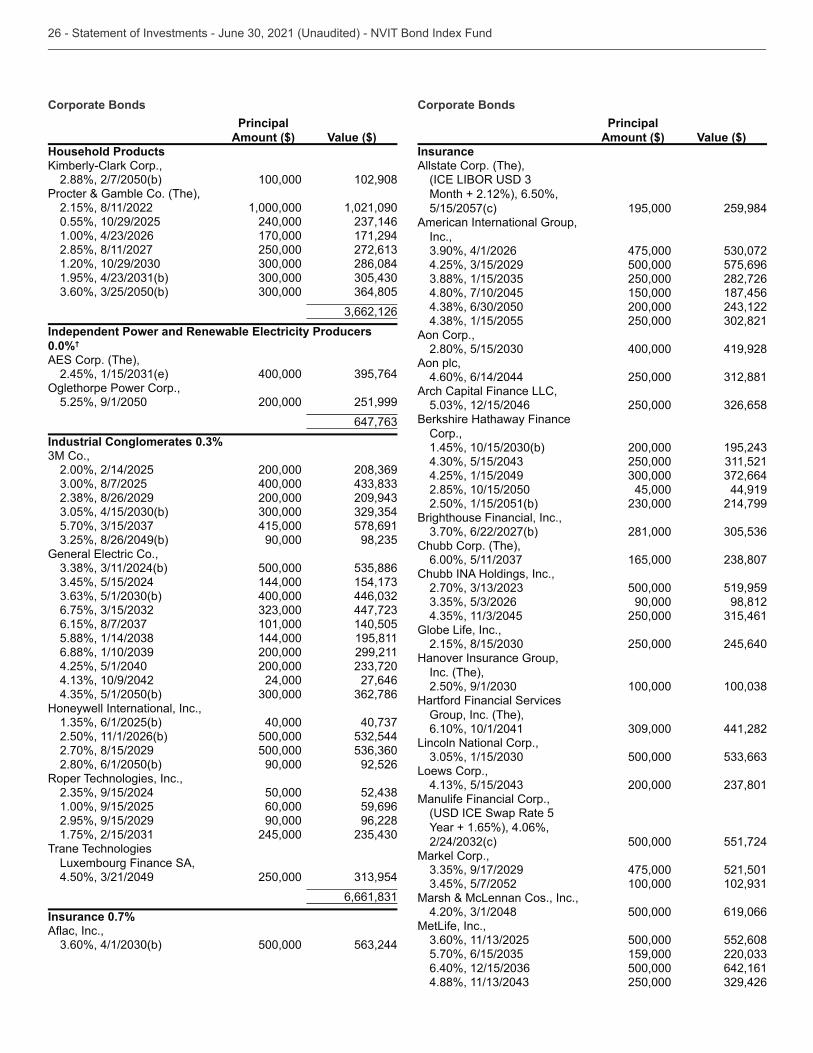
948,119Household Products 0.2%
, 500,000 519,098 201,976 165,000 179,682
Corporate Bonds
Principal
Amount ($) Value ($)Household Products
2.88%, 2/7/2050(b) 100,000 102,908Procter & Gamble Co. (The),
2.15%, 8/11/2022 1,000,000 1,021,0900.55%, 10/29/2025 240,000
170,000 171,2942.85%, 8/11/2027 250,000
286,084
Independent Power and Renewable Electricity Producers 0.0%†
, 400,000
,5.25%, 9/1/2050 200,000 251,999
Industrial Conglomerates 0.3%
,2.00%, 2/14/2025 200,000
400,000 200,000 415,000 578,691 90,000
, 500,000 144,000 400,000 101,000 140,505 144,000 195,811 200,000 299,211
4.25%, 5/1/2040 200,000 24,000 27,646
Honeywell International, Inc., 40,000
2.50%, 11/1/2026(b) 500,000 2.70%, 8/15/2029 500,000 2.80%, 6/1/2050(b) 90,000 92,526
Roper Technologies, Inc., 50,000
1.00%, 9/15/2025 60,000 59,6962.95%, 9/15/2029 90,000 96,228
245,000 Trane Technologies
Luxembourg Finance SA, 250,000
Insurance 0.7%
, 500,000
Corporate Bonds
Principal
Amount ($) Value ($)InsuranceAllstate Corp. (The),
Month + 2.12%), 6.50%, 5/15/2057(c) 195,000 259,984
American International Group, Inc.,
475,000 500,000 575,696 250,000 282,726
4.80%, 7/10/2045 150,000 187,456 200,000 250,000
Aon Corp., 400,000 419,928
Aon plc,4.60%, 6/14/2044 250,000
Arch Capital Finance LLC, 250,000
Berkshire Hathaway Finance Corp.,
200,000 250,000
4.25%, 1/15/2049 2.85%, 10/15/2050 45,000 44,9192.50%, 1/15/2051(b) 214,799
Brighthouse Financial, Inc., 281,000
Chubb Corp. (The), 165,000
Chubb INA Holdings, Inc., 500,000 519,959 90,000 98,812 250,000
Globe Life, Inc., 250,000 245,640
Hanover Insurance Group, Inc. (The),
100,000 Hartford Financial Services
Group, Inc. (The),6.10%, 10/1/2041 441,282
Lincoln National Corp., 500,000
Loews Corp., 200,000
Manulife Financial Corp.,
500,000 551,724Markel Corp.,
475,000 521,501 100,000
Marsh & McLennan Cos., Inc., 500,000 619,066
MetLife, Inc., 500,000 552,608 159,000 500,000 642,161 250,000
Corporate Bonds
Principal
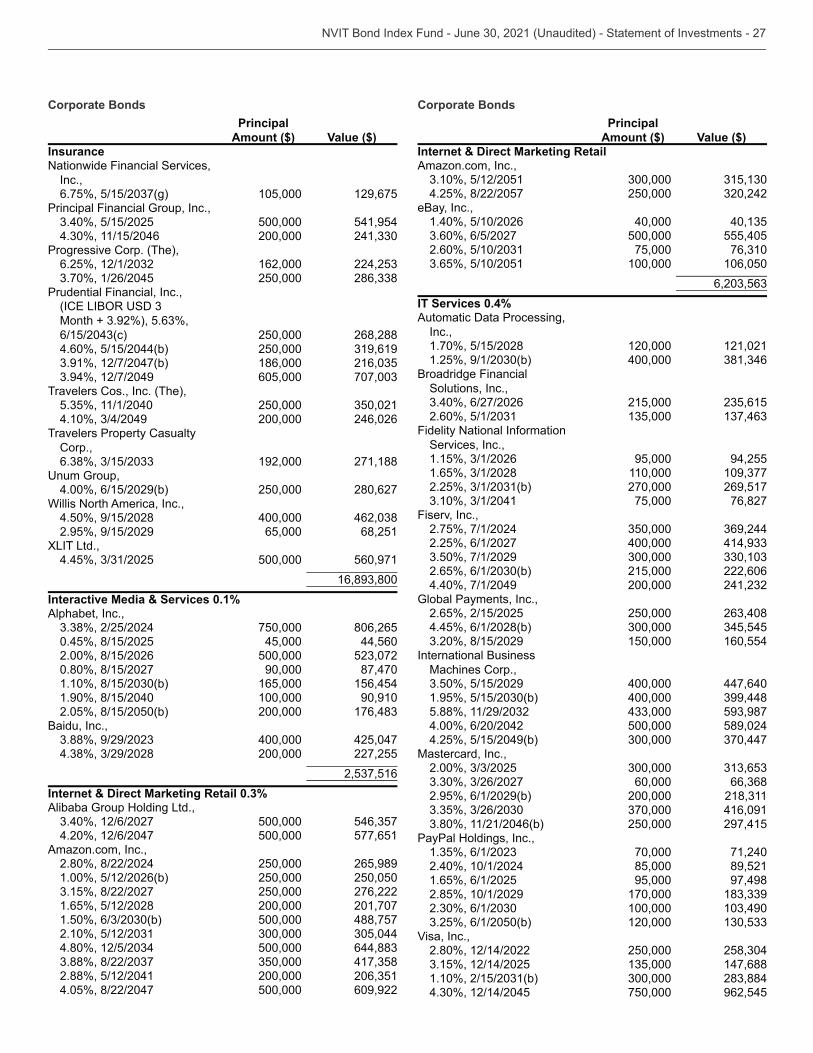
Amount ($) Value ($)InsuranceNationwide Financial Services,
Inc., 105,000 129,675
Principal Financial Group, Inc., 500,000 541,954 200,000
Progressive Corp. (The), 162,000 250,000
Prudential Financial, Inc.,
250,000 268,2884.60%, 5/15/2044(b) 250,000
186,000 605,000
Travelers Cos., Inc. (The), 250,000 200,000 246,026
Travelers Property Casualty Corp.,
192,000 271,188,
4.00%, 6/15/2029(b) 250,000 280,627Willis North America, Inc.,
4.50%, 9/15/2028 400,000 2.95%, 9/15/2029 65,000 68,251
XLIT Ltd., 500,000 560,971
Interactive Media & Services 0.1%Alphabet, Inc.,
750,000 806,2650.45%, 8/15/2025 45,000 44,5602.00%, 8/15/2026 500,000 0.80%, 8/15/2027 90,000 87,470
165,000 156,4541.90%, 8/15/2040 100,000 90,9102.05%, 8/15/2050(b) 200,000
Baidu, Inc., 400,000 425,047 200,000 227,255
Internet & Direct Marketing Retail 0.3%Alibaba Group Holding Ltd.,
500,000 4.20%, 12/6/2047 500,000 577,651
Amazon.com, Inc.,2.80%, 8/22/2024 250,000 265,9891.00%, 5/12/2026(b) 250,000 250,050
250,000 276,2221.65%, 5/12/2028 200,000 201,707
500,000 488,757 500,000
2.88%, 5/12/2041 200,000 4.05%, 8/22/2047 500,000 609,922
Corporate Bonds
Principal
Amount ($) Value ($)Internet & Direct Marketing RetailAmazon.com, Inc.,
4.25%, 8/22/2057 250,000
eBay, Inc.,1.40%, 5/10/2026 40,000
500,000 555,405 75,000 100,000 106,050
IT Services 0.4%Automatic Data Processing,
Inc.,1.70%, 5/15/2028 120,000 121,021
400,000 Broadridge Financial
Solutions, Inc., 215,000
Fidelity National Information Services, Inc.,
95,000 94,255 110,000 270,000 269,517 75,000 76,827
Fiserv, Inc.,2.75%, 7/1/2024 2.25%, 6/1/2027 400,000
215,000 222,606
4.40%, 7/1/2049 200,000 Global Payments, Inc.,
2.65%, 2/15/2025 250,000 4.45%, 6/1/2028(b)
150,000 160,554International Business
Machines Corp., 400,000 447,640 400,000
4.00%, 6/20/2042 500,000 589,0244.25%, 5/15/2049(b)
Mastercard, Inc., 60,000
2.95%, 6/1/2029(b) 200,000 416,091 250,000 297,415
PayPal Holdings, Inc., 70,000 71,240
2.40%, 10/1/2024 85,000 89,5211.65%, 6/1/2025 95,000 97,4982.85%, 10/1/2029 170,000
100,000 120,000
Visa, Inc.,2.80%, 12/14/2022 250,000
147,688 750,000 962,545
Corporate Bonds
Principal
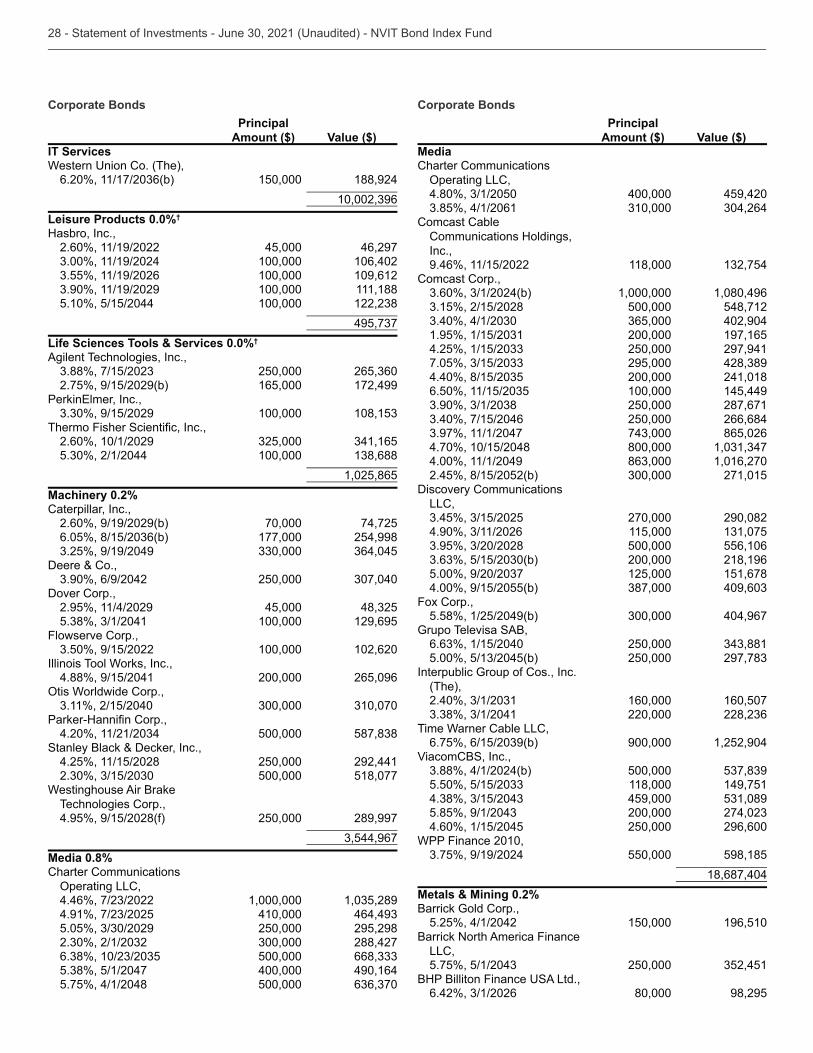
Amount ($) Value ($)IT Services
, 150,000 188,924
Leisure Products 0.0%†
Hasbro, Inc.,2.60%, 11/19/2022 45,000 46,297
100,000 106,402 100,000 109,612 100,000 111,188
5.10%, 5/15/2044 100,000
Life Sciences Tools & Services 0.0%†
Agilent Technologies, Inc., 250,000
2.75%, 9/15/2029(b) 165,000 172,499,
100,000 ,
2.60%, 10/1/2029 100,000
1,025,865Machinery 0.2%Caterpillar, Inc.,
2.60%, 9/19/2029(b) 70,000 74,725 177,000 254,998
Deere & Co., 250,000
Dover Corp.,2.95%, 11/4/2029 45,000
100,000 129,695Flowserve Corp.,
100,000 102,620Illinois Tool Works, Inc.,
4.88%, 9/15/2041 200,000 265,096,
,
500,000 Stanley Black & Decker, Inc.,
4.25%, 11/15/2028 250,000 292,441 500,000 518,077
Westinghouse Air Brake Technologies Corp.,4.95%, 9/15/2028(f) 250,000 289,997
Media 0.8%Charter Communications
, 1,000,000 410,000 250,000 295,298 288,427 500,000 400,000 490,164
5.75%, 4/1/2048 500,000
Corporate Bonds
Principal
Amount ($) Value ($)MediaCharter Communications
400,000 459,420
Comcast Cable Communications Holdings, Inc.,9.46%, 11/15/2022 118,000
Comcast Corp., 1,000,000 1,080,496 500,000 548,712 402,904 200,000 197,165 250,000 297,941 295,000 200,000 241,018 100,000 145,449 250,000 287,671 250,000 266,684 865,026
4.70%, 10/15/2048 800,000 4.00%, 11/1/2049 1,016,2702.45%, 8/15/2052(b) 271,015
Discovery Communications LLC,
270,000 290,082 115,000 500,000 556,106 200,000 218,196 125,000 151,678
4.00%, 9/15/2055(b) Fox Corp.,
5.58%, 1/25/2049(b) 404,967Grupo Televisa SAB,
250,000 250,000
Interpublic Group of Cos., Inc. (The),
160,000 160,507 220,000
Time Warner Cable LLC, 900,000 1,252,904
ViacomCBS, Inc., 500,000 118,000 149,751 459,000 200,000
4.60%, 1/15/2045 250,000 296,600WPP Finance 2010,
550,000 598,185 18,687,404
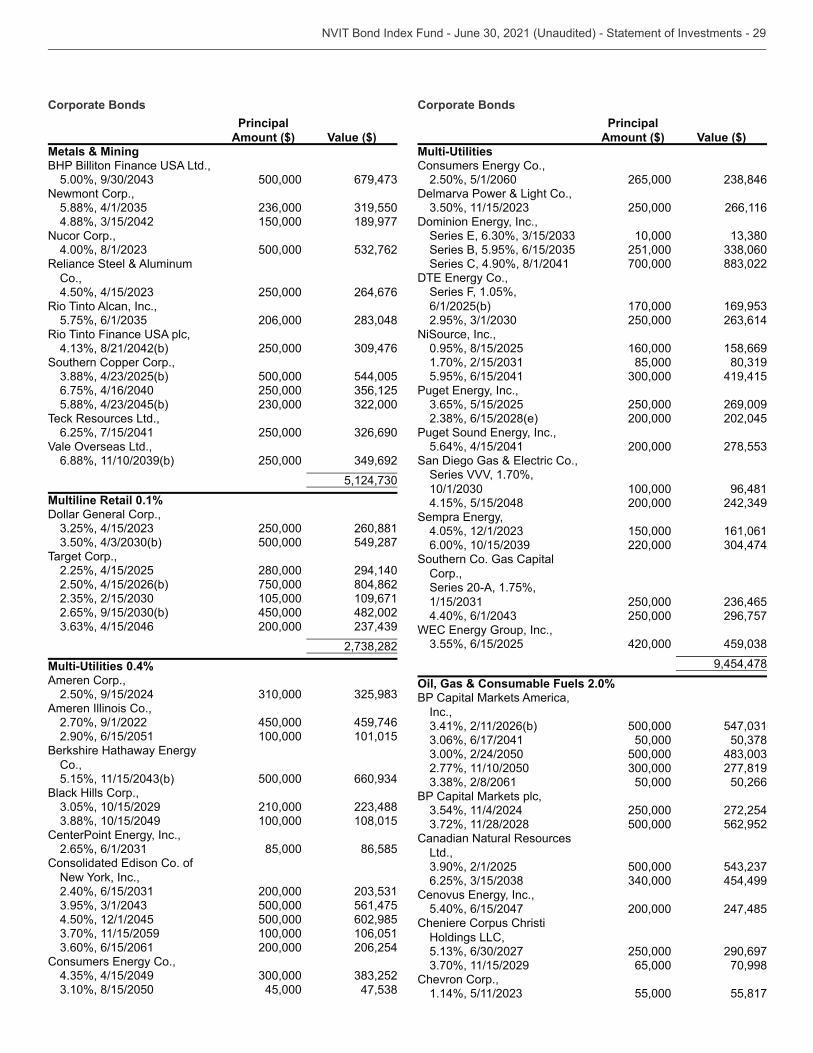
Metals & Mining 0.2%Barrick Gold Corp.,
5.25%, 4/1/2042 150,000 196,510Barrick North America Finance
LLC, 250,000
, 80,000 98,295
Corporate Bonds
Principal
Amount ($) Value ($)Metals & Mining
500,000 Newmont Corp.,
150,000 189,977
Nucor Corp., 500,000
Reliance Steel & Aluminum Co.,
250,000 264,676Rio Tinto Alcan, Inc.,
206,000 ,
250,000 Southern Copper Corp.,
500,000 544,0056.75%, 4/16/2040 250,000
Teck Resources Ltd.,
6.25%, 7/15/2041 250,000 ,
250,000
Multiline Retail 0.1%Dollar General Corp.,
250,000 260,881 500,000 549,287
Target Corp.,2.25%, 4/15/2025 280,000 294,1402.50%, 4/15/2026(b) 750,000 804,862
105,000 109,671 450,000 482,002 200,000
0.4%
Ameren Corp.,2.50%, 9/15/2024
Ameren Illinois Co.,2.70%, 9/1/2022 450,000 459,7462.90%, 6/15/2051 100,000 101,015
Co., 500,000
Black Hills Corp., 210,000 100,000 108,015
, 85,000 86,585
, 200,000 500,000 561,475
4.50%, 12/1/2045 500,000 602,985 100,000 106,051 200,000 206,254
, 45,000
Corporate Bonds
Principal
Amount ($) Value ($)
2.50%, 5/1/2060 265,000 Delmarva Power & Light Co.,
250,000 266,116,
10,000 251,000
Series C, 4.90%, 8/1/2041 700,000 ,
Series F, 1.05%, 6/1/2025(b) 170,000
250,000 NiSource, Inc.,
0.95%, 8/15/2025 160,000 158,669 85,000
5.95%, 6/15/2041 419,415,
250,000 269,009 200,000 202,045
,5.64%, 4/15/2041 200,000
,Series VVV, 1.70%,
100,000 96,4814.15%, 5/15/2048 200,000
, 150,000 161,061 220,000
Southern Co. Gas Capital Corp.,Series 20-A, 1.75%,
250,000 250,000 296,757
, 420,000
9,454,478Oil, Gas & Consumable Fuels 2.0%BP Capital Markets America,
Inc., 500,000 50,000 500,000
2.77%, 11/10/2050 277,819 50,000 50,266
BP Capital Markets plc, 250,000 272,254 500,000 562,952
Canadian Natural Resources Ltd.,
500,000 454,499
,5.40%, 6/15/2047 200,000 247,485
Cheniere Corpus Christi Holdings LLC,
250,000 290,697 65,000 70,998
Chevron Corp., 55,000 55,817
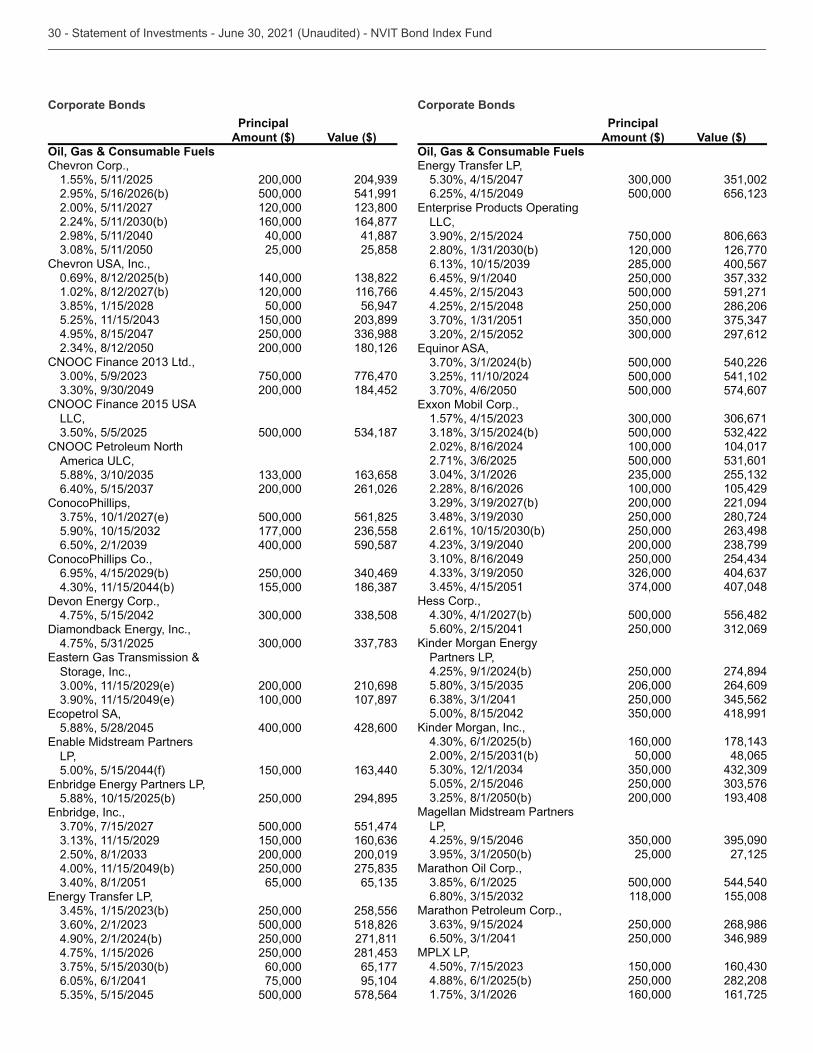
Corporate Bonds
Principal
Amount ($) Value ($)Oil, Gas & Consumable FuelsChevron Corp.,
1.55%, 5/11/2025 200,000 2.95%, 5/16/2026(b) 500,000 541,9912.00%, 5/11/2027 120,000
160,000 164,8772.98%, 5/11/2040 40,000 41,887
25,000 25,858,
0.69%, 8/12/2025(b) 140,000 1.02%, 8/12/2027(b) 120,000 116,766
50,000 56,947 150,000
4.95%, 8/15/2047 250,000 200,000 180,126
, 750,000 776,470 200,000 184,452
LLC, 500,000
, 200,000 261,026
ConocoPhillips, 500,000 561,825 177,000 400,000 590,587
ConocoPhillips Co.,6.95%, 4/15/2029(b) 250,000
155,000 ,
4.75%, 5/15/2042 ,
Storage, Inc., 200,000 210,698 100,000 107,897
,5.88%, 5/28/2045 400,000 428,600
LP,5.00%, 5/15/2044(f) 150,000
,5.88%, 10/15/2025(b) 250,000 294,895
, 500,000 551,474 150,000 200,000 200,019
4.00%, 11/15/2049(b) 250,000 65,000
, 250,000 258,556 500,000 518,826
4.90%, 2/1/2024(b) 250,000 271,8114.75%, 1/15/2026 250,000
60,000 65,1776.05%, 6/1/2041 75,000 95,104
500,000 578,564
Corporate Bonds
Principal
Amount ($) Value ($)Oil, Gas & Consumable Fuels
6.25%, 4/15/2049 500,000
LLC, 750,000 120,000 126,770 285,000 400,567
6.45%, 9/1/2040 250,000 500,000 591,271
4.25%, 2/15/2048 250,000 286,206 297,612
, 500,000 540,226 500,000 541,102 500,000 574,607
, 500,000
2.02%, 8/16/2024 100,000 104,017 500,000
2.28%, 8/16/2026 100,000 105,429 200,000 221,094 250,000 280,724 250,000 200,000 250,000 407,048
Hess Corp., 500,000 556,482
5.60%, 2/15/2041 250,000
Partners LP,4.25%, 9/1/2024(b) 250,000 274,894
206,000 264,609 250,000
5.00%, 8/15/2042 418,991,
160,000 50,000 48,065
5.05%, 2/15/2046 250,000 200,000
Magellan Midstream Partners LP,4.25%, 9/15/2046
25,000 27,125,
500,000 544,540 118,000 155,008
Marathon Petroleum Corp., 250,000 268,986 250,000
MPLX LP, 150,000
4.88%, 6/1/2025(b) 250,000 282,208 160,000 161,725
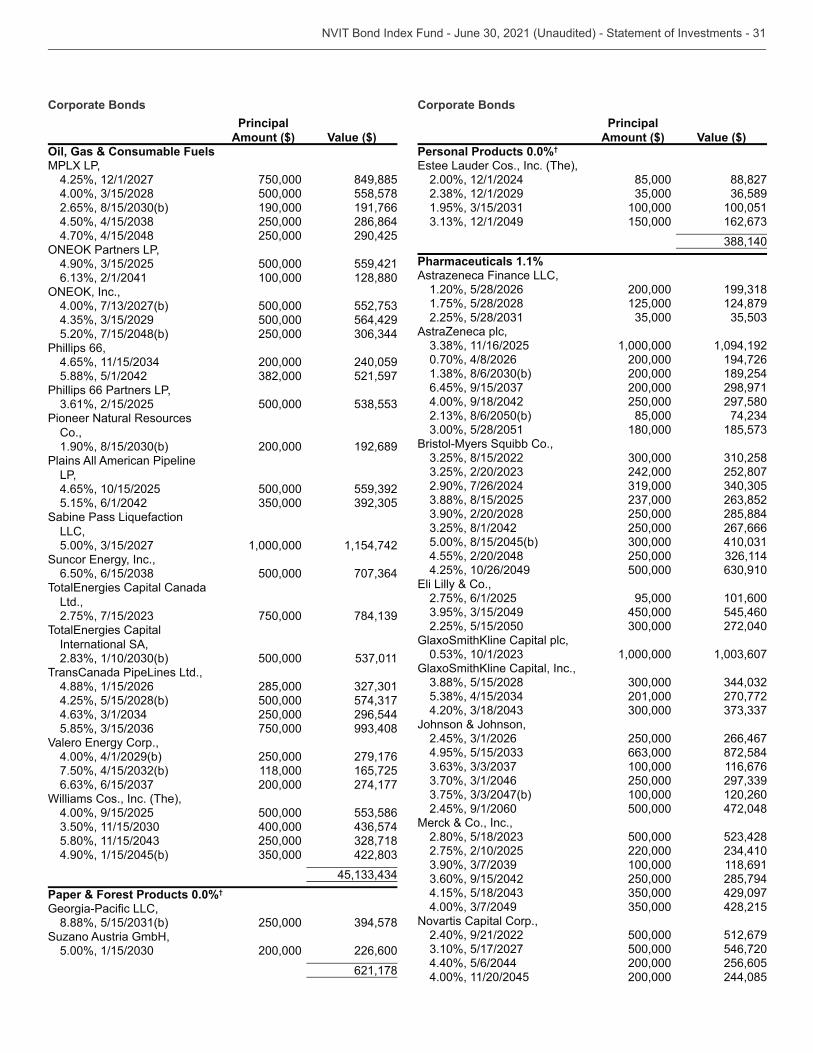
Corporate Bonds
Principal
Amount ($) Value ($)Oil, Gas & Consumable FuelsMPLX LP,
4.25%, 12/1/2027 750,000 849,885 500,000 558,578 190,000 191,766 250,000 286,864
4.70%, 4/15/2048 250,000 290,425,
500,000 559,421 100,000 128,880
, 500,000 500,000 564,429
5.20%, 7/15/2048(b) 250,000 Phillips 66,
200,000 240,0595.88%, 5/1/2042 521,597
Phillips 66 Partners LP, 500,000
Pioneer Natural Resources Co.,
200,000 192,689Plains All American Pipeline
LP,4.65%, 10/15/2025 500,000 5.15%, 6/1/2042
LLC, 1,000,000 1,154,742
, 500,000
Ltd., 750,000
International SA, 500,000
TransCanada PipeLines Ltd.,4.88%, 1/15/2026 285,000 4.25%, 5/15/2028(b) 500,000
250,000 296,544 750,000
,4.00%, 4/1/2029(b) 250,000 279,176
118,000 165,725 200,000 274,177
Williams Cos., Inc. (The),4.00%, 9/15/2025 500,000
400,000 250,000
4.90%, 1/15/2045(b)
Paper & Forest Products 0.0%†
, 250,000
Suzano Austria GmbH, 200,000 226,600
621,178
Corporate Bonds
Principal
Amount ($) Value ($)Personal Products 0.0%†
,2.00%, 12/1/2024 85,000 88,827
100,000 100,051 150,000
Pharmaceuticals 1.1%Astrazeneca Finance LLC,
1.20%, 5/28/2026 200,000 1.75%, 5/28/2028 125,000 124,879
AstraZeneca plc,
1,000,000 1,094,1920.70%, 4/8/2026 200,000 194,726
200,000 189,254 200,000 298,971
4.00%, 9/18/2042 250,000 297,580 85,000 180,000
, 242,000 252,807
2.90%, 7/26/2024 250,000 285,884 250,000 267,666
5.00%, 8/15/2045(b) 4.55%, 2/20/2048 250,000 4.25%, 10/26/2049 500,000
,2.75%, 6/1/2025 95,000 101,600
450,000 545,4602.25%, 5/15/2050 272,040
, 1,000,000
, 201,000 270,772
Johnson & Johnson, 250,000 266,467 872,584 100,000 116,676 250,000 100,000 120,260
2.45%, 9/1/2060 500,000 472,048Merck & Co., Inc.,
500,000 2.75%, 2/10/2025 220,000
100,000 118,691 250,000 285,794 429,097 428,215
Novartis Capital Corp.,2.40%, 9/21/2022 500,000 512,679
500,000 546,7204.40%, 5/6/2044 200,000 256,6054.00%, 11/20/2045 200,000 244,085
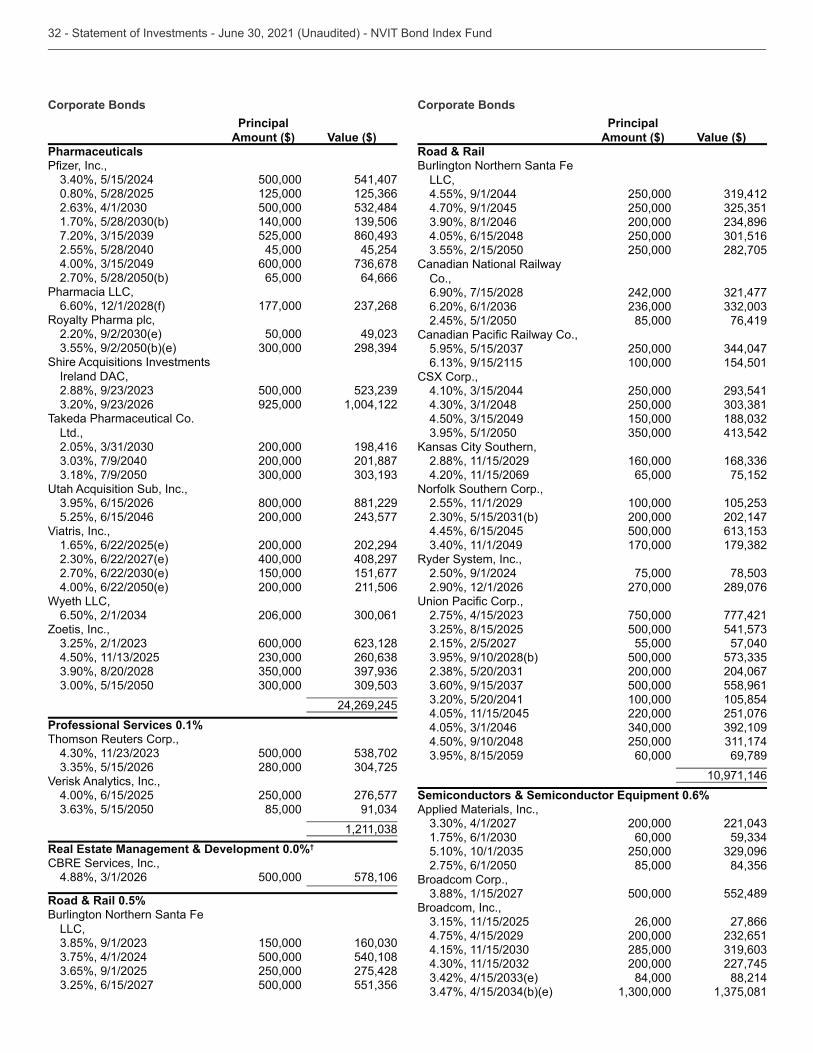
Corporate Bonds
Principal
Amount ($) Value ($)Pharmaceuticals
, 500,000 541,407
0.80%, 5/28/2025 125,000 500,000 140,000 525,000
2.55%, 5/28/2040 45,000 45,254 600,000
2.70%, 5/28/2050(b) 65,000 64,666Pharmacia LLC,
6.60%, 12/1/2028(f) 177,000 Royalty Pharma plc,
50,000
Ireland DAC, 500,000 925,000 1,004,122
Takeda Pharmaceutical Co. Ltd.,
200,000 198,416 200,000 201,887
, 800,000 881,229
5.25%, 6/15/2046 200,000 Viatris, Inc.,
1.65%, 6/22/2025(e) 200,000 202,294 400,000 408,297 150,000 151,677
4.00%, 6/22/2050(e) 200,000 211,506Wyeth LLC,
206,000 Zoetis, Inc.,
600,000
24,269,245Professional Services 0.1%Thomson Reuters Corp.,
500,000 280,000
Verisk Analytics, Inc.,4.00%, 6/15/2025 250,000 276,577
85,000
Real Estate Management & Development 0.0%†
, 500,000 578,106
Road & Rail 0.5%Burlington Northern Santa Fe
LLC, 150,000 500,000 540,108 250,000 275,428 500,000
Corporate Bonds
Principal
Amount ($) Value ($)Road & RailBurlington Northern Santa Fe
LLC,
4.55%, 9/1/2044 250,000 4.70%, 9/1/2045 250,000
200,000 4.05%, 6/15/2048 250,000
250,000 282,705Canadian National Railway
Co.,6.90%, 7/15/2028 242,000
2.45%, 5/1/2050 85,000 76,419
, 250,000 100,000 154,501
CSX Corp., 250,000 250,000 150,000
,2.88%, 11/15/2029 160,000 4.20%, 11/15/2069 65,000 75,152
Norfolk Southern Corp.,2.55%, 11/1/2029 100,000
200,000 202,1474.45%, 6/15/2045 500,000
170,000 Ryder System, Inc.,
2.50%, 9/1/2024 75,000 2.90%, 12/1/2026 270,000 289,076
, 750,000 777,421 500,000
2.15%, 2/5/2027 55,000 57,040 500,000 200,000 204,067 500,000 558,961 100,000 105,854
4.05%, 11/15/2045 220,000 251,076
4.50%, 9/10/2048 250,000 60,000 69,789
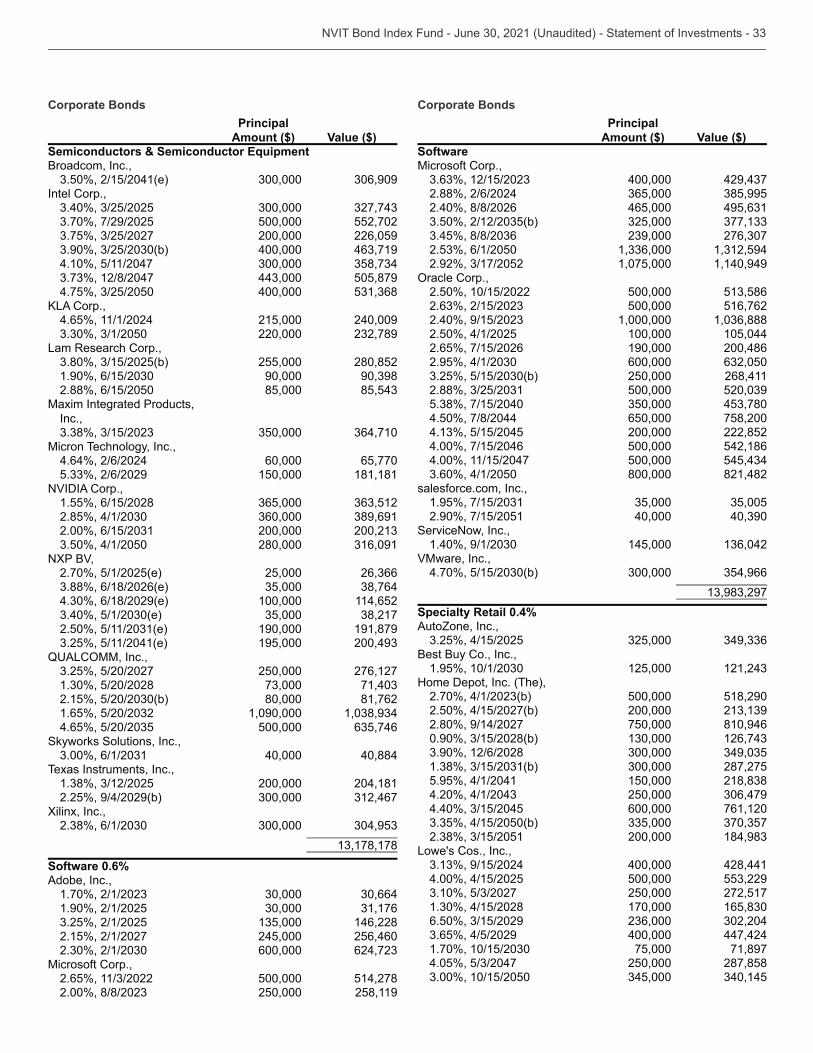
10,971,146Semiconductors & Semiconductor Equipment 0.6%Applied Materials, Inc.,
200,000 60,000 250,000
2.75%, 6/1/2050 85,000 Broadcom Corp.,
500,000 552,489Broadcom, Inc.,
26,000 27,8664.75%, 4/15/2029 200,000
285,000 200,000 227,745 84,000 88,214
Corporate Bonds
Principal
Amount ($) Value ($)Semiconductors & Semiconductor EquipmentBroadcom, Inc.,
Intel Corp.,
500,000 552,702 200,000 226,059 400,000
4.10%, 5/11/2047 505,879 400,000
,4.65%, 11/1/2024 215,000 240,009
220,000 Lam Research Corp.,
255,000 280,852 90,000
2.88%, 6/15/2050 85,000 Maxim Integrated Products,
Inc.,
Micron Technology, Inc.,4.64%, 2/6/2024 60,000 65,770
150,000 181,181NVIDIA Corp.,
1.55%, 6/15/2028 200,000 280,000
NXP BV,2.70%, 5/1/2025(e) 25,000
100,000 114,652 190,000 191,879 195,000
, 250,000 276,127 80,000 81,762 1,090,000 500,000
Skyworks Solutions, Inc., 40,000 40,884
Texas Instruments, Inc., 200,000 204,181
2.25%, 9/4/2029(b) Xilinx, Inc.,
Software 0.6%Adobe, Inc.,
1.90%, 2/1/2025
146,2282.15%, 2/1/2027 245,000 256,460
600,000 Microsoft Corp.,
500,000 514,278 250,000 258,119
Corporate Bonds
Principal
Amount ($) Value ($)SoftwareMicrosoft Corp.,
400,000 2.88%, 2/6/2024 2.40%, 8/8/2026 465,000
1,075,000 1,140,949
,2.50%, 10/15/2022 500,000
500,000 516,762 1,000,000
2.50%, 4/1/2025 100,000 105,0442.65%, 7/15/2026 190,000 200,486
600,000 250,000 268,411 500,000
4.50%, 7/8/2044 650,000 758,200 200,000 222,852
4.00%, 7/15/2046 500,000 542,1864.00%, 11/15/2047 500,000
800,000 821,482salesforce.com, Inc.,
2.90%, 7/15/2051 40,000
ServiceNow, Inc., 145,000
VMware, Inc.,
Specialty Retail 0.4%AutoZone, Inc.,
Best Buy Co., Inc.,
125,000 Home Depot, Inc. (The),
500,000 518,2902.50%, 4/15/2027(b) 200,000 2.80%, 9/14/2027 750,000 810,946
287,275
5.95%, 4/1/2041 150,000 250,000 600,000 761,120 200,000
Lowe's Cos., Inc., 400,000 428,441
4.00%, 4/15/2025 500,000 250,000 272,517 170,000 400,000 447,424 75,000 71,897 250,000 287,858
Corporate Bonds
Principal
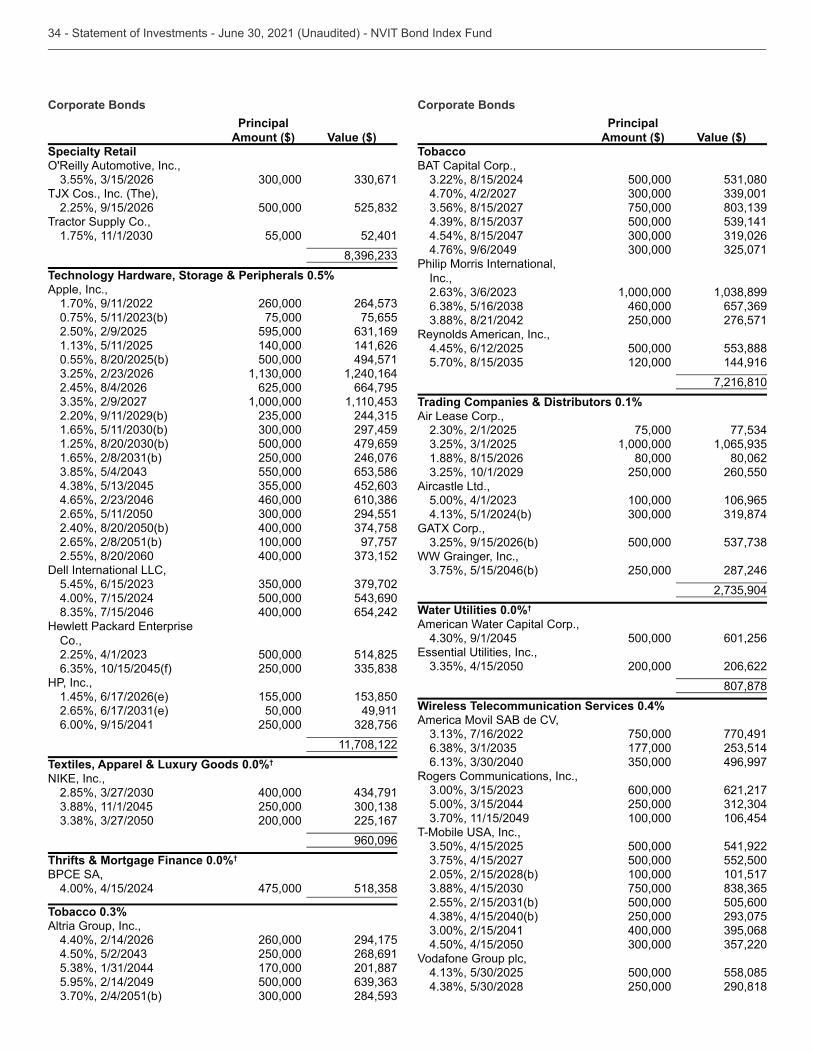
Amount ($) Value ($)Specialty Retail
,
TJX Cos., Inc. (The),2.25%, 9/15/2026 500,000
Tractor Supply Co., 55,000 52,401
Technology Hardware, Storage & Peripherals 0.5%Apple, Inc.,
1.70%, 9/11/2022 260,000 75,000 75,655
2.50%, 2/9/2025 595,000 140,000 141,626
0.55%, 8/20/2025(b) 500,000 494,571 1,240,164
2.45%, 8/4/2026 625,000 664,795 1,000,000
2.20%, 9/11/2029(b) 297,459 500,000 479,659 250,000 246,076 550,000 460,000
2.65%, 5/11/2050 294,5512.40%, 8/20/2050(b) 400,000 2.65%, 2/8/2051(b) 100,000 97,7572.55%, 8/20/2060 400,000
Dell International LLC,
4.00%, 7/15/2024 500,000 400,000 654,242
Co., 500,000 514,825 250,000
HP, Inc.,1.45%, 6/17/2026(e) 155,000
50,000 49,9116.00%, 9/15/2041 250,000
11,708,122Textiles, Apparel & Luxury Goods 0.0%†
, 400,000 250,000 200,000 225,167
960,096Thrifts & Mortgage Finance 0.0%†
,4.00%, 4/15/2024 475,000
Tobacco 0.3%Altria Group, Inc.,
4.40%, 2/14/2026 260,000 294,175 250,000 268,691 170,000 201,887
5.95%, 2/14/2049 500,000
Corporate Bonds
Principal
Amount ($) Value ($)TobaccoBAT Capital Corp.,
500,000 4.70%, 4/2/2027
750,000 500,000
4.54%, 8/15/2047 4.76%, 9/6/2049
Philip Morris International, Inc.,
1,000,000 460,000 250,000 276,571
Reynolds American, Inc.,4.45%, 6/12/2025 500,000
120,000 144,916 7,216,810
Trading Companies & Distributors 0.1%Air Lease Corp.,
75,000 1,000,000
1.88%, 8/15/2026 80,000 80,062 250,000 260,550
Aircastle Ltd., 100,000 106,965
GATX Corp., 500,000
WW Grainger, Inc., 250,000 287,246
Water Utilities 0.0%†
American Water Capital Corp., 500,000 601,256
, 200,000 206,622
807,878Wireless Telecommunication Services 0.4%America Movil SAB de CV,
750,000 770,491 177,000 496,997
Rogers Communications, Inc., 600,000 621,217 250,000 100,000 106,454
, 500,000 541,922 500,000 552,500
2.05%, 2/15/2028(b) 100,000 101,517 750,000 500,000 505,600 250,000 400,000
4.50%, 4/15/2050 Vodafone Group plc,
500,000 558,085 250,000 290,818
Corporate Bonds
Principal
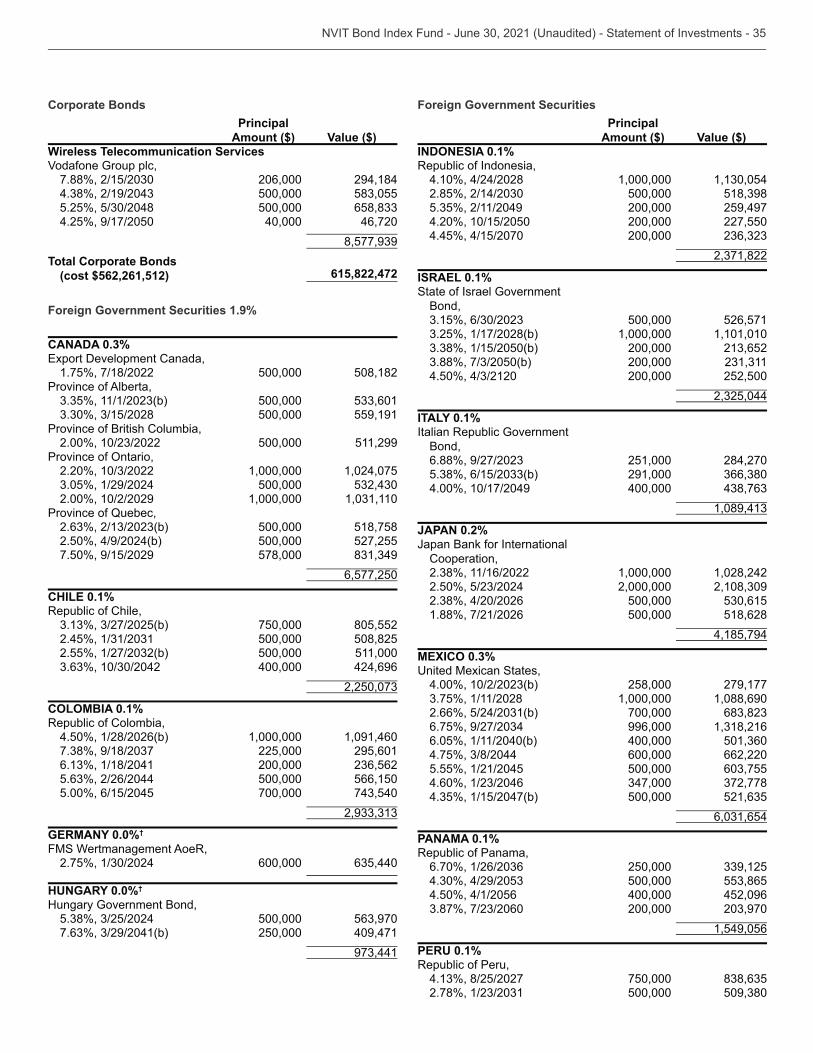
Amount ($) Value ($)Wireless Telecommunication ServicesVodafone Group plc,
206,000 294,184 500,000 500,000
4.25%, 9/17/2050 40,000 46,720
Total Corporate Bonds (cost $562,261,512) 615,822,472
Foreign Government Securities 1.9%
CANADA 0.3%,
1.75%, 7/18/2022 500,000 508,182Province of Alberta,
500,000 500,000 559,191
Province of British Columbia, 500,000 511,299
, 1,000,000 1,024,075 500,000
2.00%, 10/2/2029 1,000,000 Province of Quebec,
500,000 518,7582.50%, 4/9/2024(b) 500,000 527,2557.50%, 9/15/2029 578,000
6,577,250
CHILE 0.1%Republic of Chile,
750,000 805,552 500,000 508,825 500,000 511,000 400,000 424,696
COLOMBIA 0.1%Republic of Colombia,
4.50%, 1/28/2026(b) 1,000,000 1,091,460 225,000 295,601 200,000 500,000 566,150
5.00%, 6/15/2045 700,000
GERMANY 0.0%†
FMS Wertmanagement AoeR, 600,000
HUNGARY 0.0%†
Hungary Government Bond, 500,000 250,000 409,471
Foreign Government Securities
Principal
Amount ($) Value ($)INDONESIA 0.1%Republic of Indonesia,
4.10%, 4/24/2028 1,000,000 500,000 200,000 259,497
4.20%, 10/15/2050 200,000 227,5504.45%, 4/15/2070 200,000
ISRAEL 0.1%State of Israel Government
Bond, 500,000 526,571 1,000,000 1,101,010 200,000 200,000 200,000 252,500
ITALY 0.1%Italian Republic Government
Bond, 251,000 284,270 291,000
4.00%, 10/17/2049 400,000
JAPAN 0.2%Japan Bank for International
Cooperation, 1,000,000 1,028,242 2,000,000 500,000
1.88%, 7/21/2026 500,000 518,628 4,185,794
MEXICO 0.3%,
258,000 279,177 1,000,000 1,088,690 700,000 996,000
6.05%, 1/11/2040(b) 400,000 600,000 662,220
5.55%, 1/21/2045 500,000 500,000
PANAMA 0.1%Republic of Panama,
250,000 500,000
4.50%, 4/1/2056 400,000 452,096 200,000
1,549,056
PERU 0.1%Republic of Peru,
750,000 500,000
Foreign Government Securities
Principal
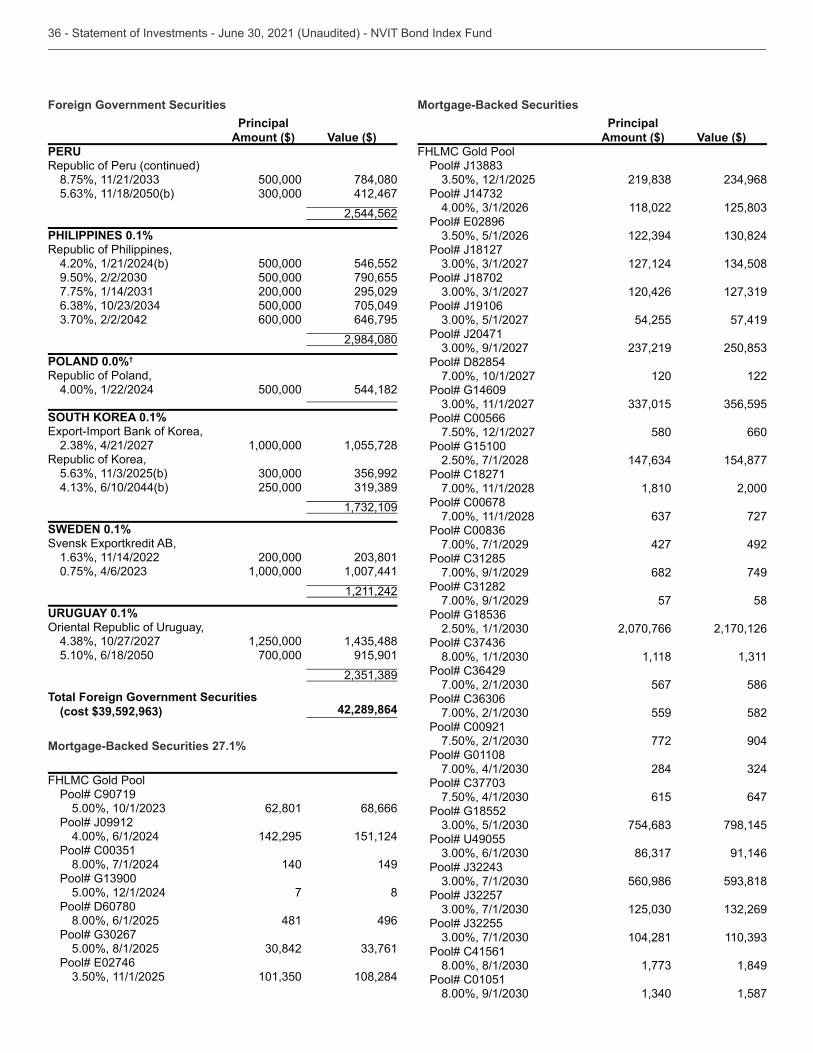
Amount ($) Value ($)PERU
Republic of Peru (continued)
500,000 784,080 412,467
2,544,562
PHILIPPINES 0.1%Republic of Philippines,
4.20%, 1/21/2024(b) 500,000 546,552 500,000 790,655 200,000 295,029 500,000 705,049 600,000 646,795
2,984,080
POLAND 0.0%†
Republic of Poland,4.00%, 1/22/2024 500,000 544,182
SOUTH KOREA 0.1%,
1,000,000 1,055,728,
250,000
SWEDEN 0.1%,
200,000 1,000,000 1,007,441
1,211,242
URUGUAY 0.1%,
1,250,000 5.10%, 6/18/2050 700,000 915,901
Total Foreign Government Securities (cost $39,592,963) 42,289,864
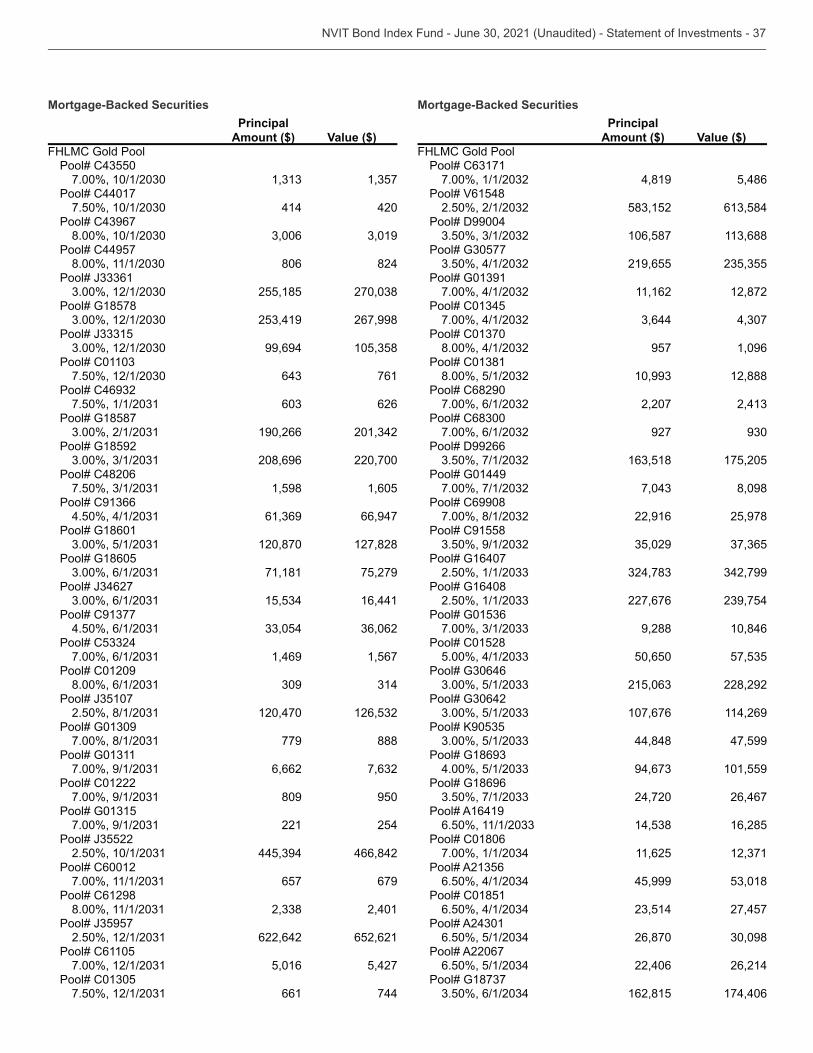
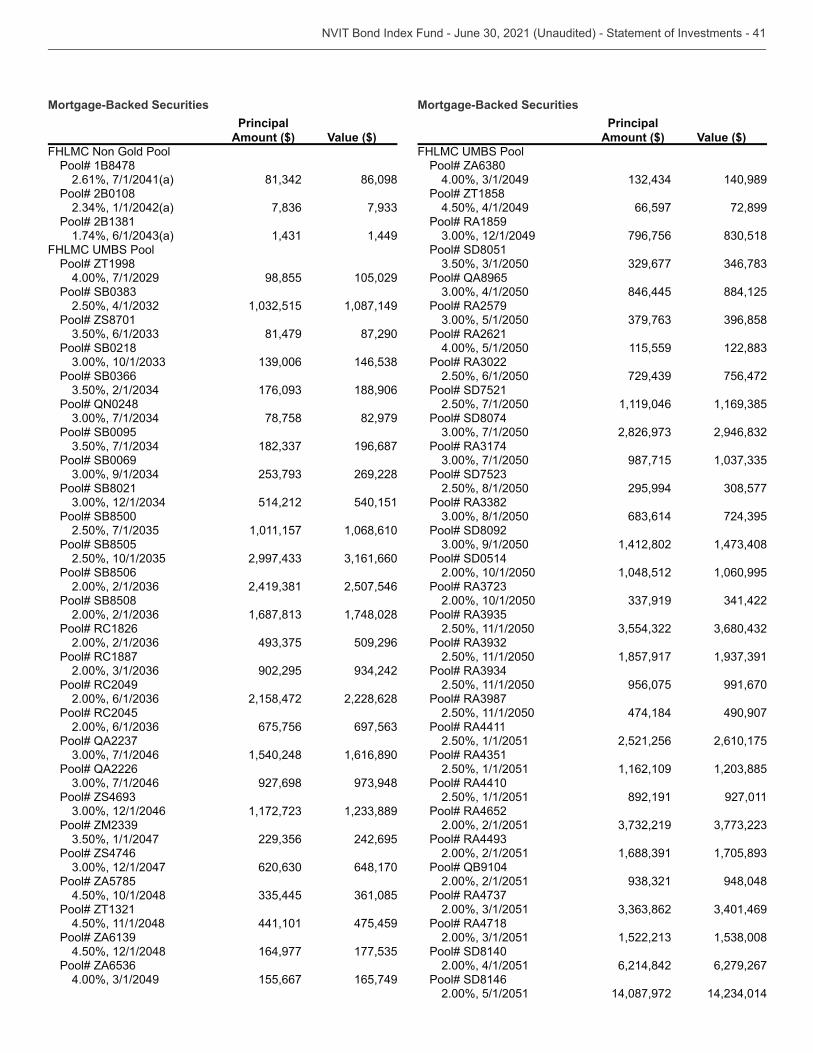
27.1%
FHLMC Gold PoolPool# C90719
62,801 68,666Pool# J09912
4.00%, 6/1/2024 142,295 151,124
8.00%, 7/1/2024 140 149
5.00%, 12/1/2024 7 8Pool# D60780
8.00%, 6/1/2025 481 496
5.00%, 8/1/2025
108,284
Principal
Amount ($) Value ($)FHLMC Gold Pool
118,022
Pool# J18127
127,124 Pool# J18702
120,426 Pool# J19106
54,255 57,419Pool# J20471
Pool# D82854
7.00%, 10/1/2027 120 122Pool# G14609
Pool# C00566
7.50%, 12/1/2027 580 660Pool# G15100
2.50%, 7/1/2028 154,877Pool# C18271
7.00%, 11/1/2028 1,810 2,000Pool# C00678
7.00%, 11/1/2028 727
7.00%, 7/1/2029 427 492
7.00%, 9/1/2029 682 749
7.00%, 9/1/2029 57 58
2,070,766 2,170,126
1,118
567 586
559 582Pool# C00921
772 904Pool# G01108
284
615 647Pool# G18552
798,145
91,146
560,986
104,281 Pool# C41561
1,849Pool# C01051
1,587
Principal
Amount ($) Value ($)FHLMC Gold Pool
Pool# C44017
414 420
Pool# C44957
806 824
255,185 Pool# G18578
267,998
99,694
761
626Pool# G18587
190,266 Pool# G18592
208,696 220,700Pool# C48206
1,598 1,605
66,947Pool# G18601
120,870 127,828Pool# G18605
71,181 75,279
16,441
1,469 1,567Pool# C01209
120,470
779 888
6,662 Pool# C01222
809 950
221 254
466,842Pool# C60012
657 679Pool# C61298
2,401
622,642 652,621Pool# C61105
5,016 5,427
661 744
Principal
Amount ($) Value ($)FHLMC Gold Pool
4,819 5,486Pool# V61548
Pool# D99004
106,587
219,655
11,162 12,872
957 1,096
12,888Pool# C68290
2,207
927 Pool# D99266
175,205Pool# G01449
8,098Pool# C69908
22,916 25,978Pool# C91558
Pool# G16407
Pool# G16408
227,676
9,288 10,846Pool# C01528
50,650
228,292
107,676 114,269
44,848 47,599
101,559Pool# G18696
24,720 26,467Pool# A16419
16,285Pool# C01806
11,625
45,999 Pool# C01851
27,457
26,870 Pool# A22067
22,406 26,214
162,815 174,406
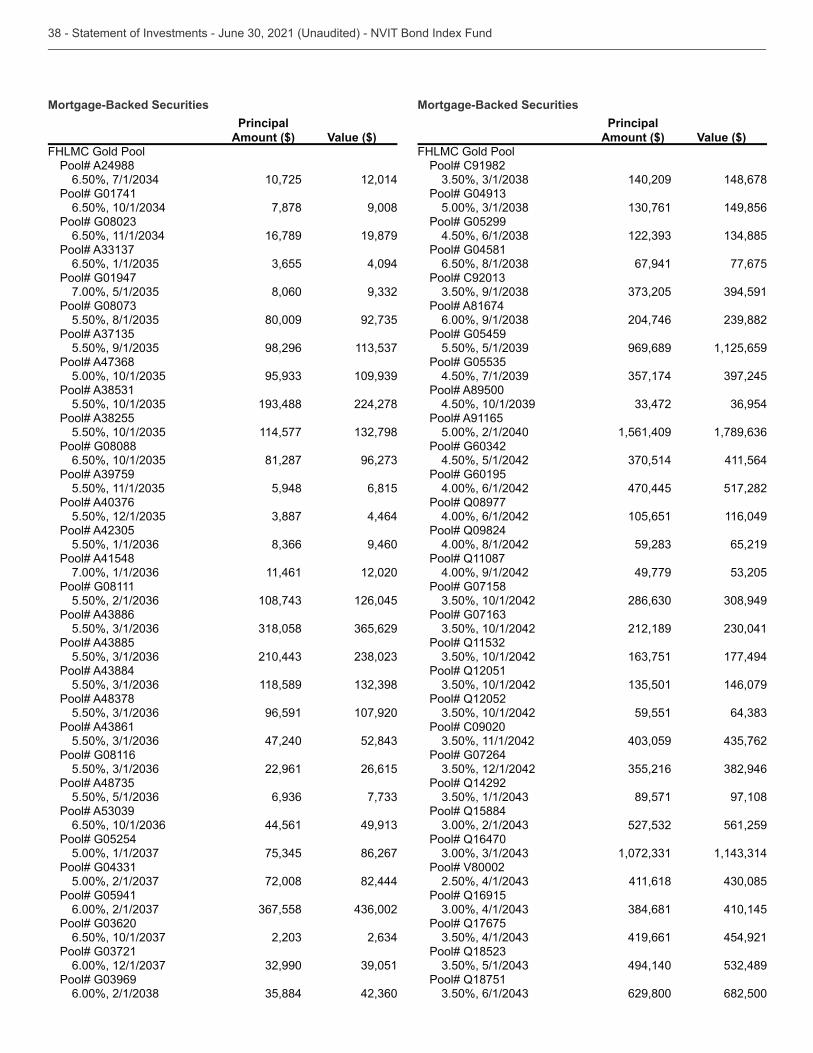
Principal
Amount ($) Value ($)FHLMC Gold Pool
Pool# A24988 10,725 12,014
Pool# G01741 7,878 9,008
16,789 19,879
4,094Pool# G01947
8,060
80,009
98,296
224,278
114,577 Pool# G08088
81,287
5,948 6,815
4,464
9,460Pool# A41548
11,461 12,020Pool# G08111
126,045
118,589
96,591 107,920
47,240 Pool# G08116
22,961 26,615
44,561 Pool# G05254
86,267
72,008 82,444Pool# G05941
Principal
Amount ($) Value ($)FHLMC Gold Pool
Pool# C91982 140,209 148,678
149,856Pool# G05299
Pool# G04581
67,941 77,675
Pool# A81674
204,746 Pool# G05459
969,689 1,125,659
Pool# A89500
Pool# A91165
5.00%, 2/1/2040 1,561,409
4.50%, 5/1/2042 411,564Pool# G60195
4.00%, 6/1/2042 470,445 517,282Pool# Q08977
4.00%, 6/1/2042 105,651 116,049Pool# Q09824
4.00%, 8/1/2042 65,219Pool# Q11087
4.00%, 9/1/2042 49,779 Pool# G07158
212,189
177,494Pool# Q12051
146,079Pool# Q12052
59,551 Pool# C09020
Pool# G07264
Pool# Q14292
89,571 97,108Pool# Q15884
561,259Pool# Q16470
Pool# V80002
411,618 Pool# Q16915
410,145Pool# Q17675
419,661 454,921
494,140 Pool# Q18751
629,800 682,500
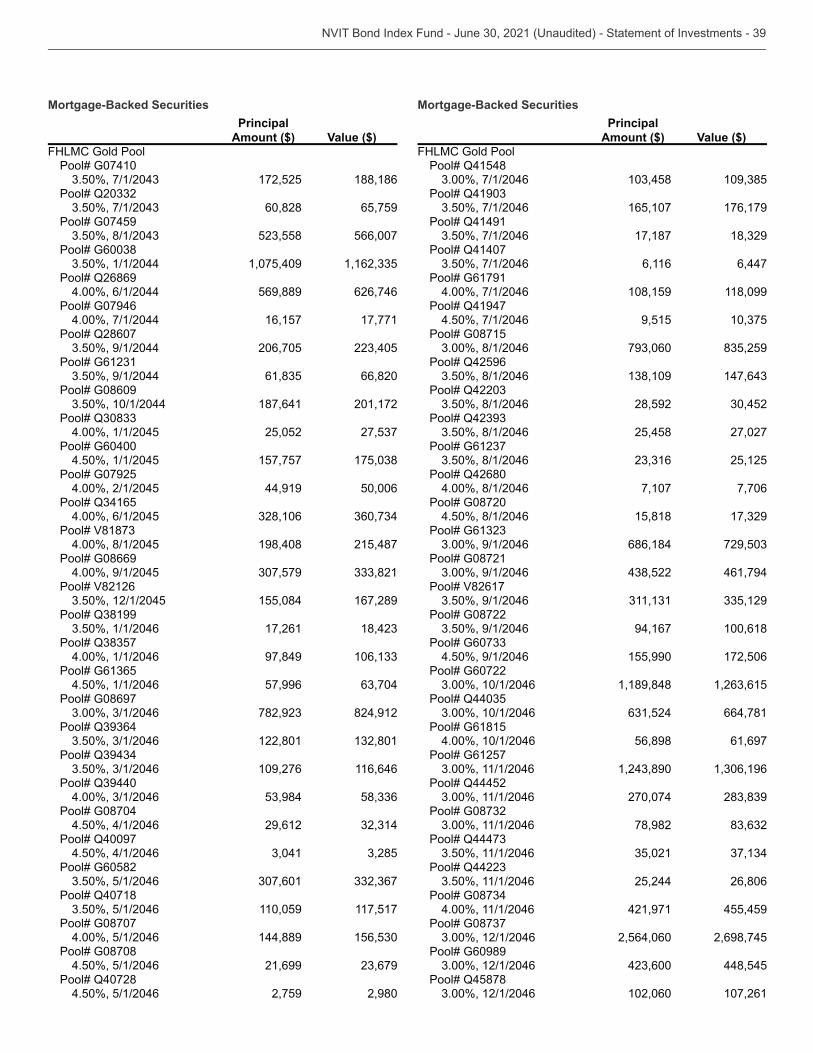
Principal
Amount ($) Value ($)FHLMC Gold Pool
Pool# G07410 172,525 188,186
60,828 65,759Pool# G07459
566,007
1,075,409 Pool# Q26869
4.00%, 6/1/2044 569,889 626,746Pool# G07946
4.00%, 7/1/2044 16,157 17,771Pool# Q28607
206,705
66,820Pool# G08609
187,641 201,172
4.00%, 1/1/2045 25,052 Pool# G60400
4.50%, 1/1/2045 157,757 Pool# G07925
4.00%, 2/1/2045 44,919 50,006
4.00%, 6/1/2045
4.00%, 8/1/2045 198,408 215,487Pool# G08669
4.00%, 9/1/2045 Pool# V82126
155,084 167,289
17,261
4.00%, 1/1/2046 97,849
4.50%, 1/1/2046 57,996 Pool# G08697
824,912
122,801
109,276 116,646
Pool# G08704
4.50%, 4/1/2046 29,612 Pool# Q40097
4.50%, 4/1/2046 Pool# G60582
Pool# Q40718
110,059 117,517Pool# G08707
4.00%, 5/1/2046 144,889 Pool# G08708
4.50%, 5/1/2046 21,699 Pool# Q40728
4.50%, 5/1/2046 2,759 2,980
Principal
Amount ($) Value ($)FHLMC Gold Pool
Pool# Q41548
165,107 176,179Pool# Q41491
17,187 Pool# Q41407
6,116 6,447Pool# G61791
4.00%, 7/1/2046 108,159 118,099Pool# Q41947
4.50%, 7/1/2046 9,515 Pool# G08715
Pool# Q42596
28,592
25,458 27,027
25,125Pool# Q42680
4.00%, 8/1/2046 7,107 7,706Pool# G08720
4.50%, 8/1/2046 15,818
686,184 Pool# G08721
461,794Pool# V82617
Pool# G08722
94,167 100,618
4.50%, 9/1/2046 155,990 172,506Pool# G60722
1,189,848
664,781Pool# G61815
4.00%, 10/1/2046 56,898 61,697Pool# G61257
Pool# Q44452
270,074
78,982
25,244 26,806
4.00%, 11/1/2046 421,971 455,459
2,564,060 2,698,745Pool# G60989
448,545Pool# Q45878
102,060 107,261
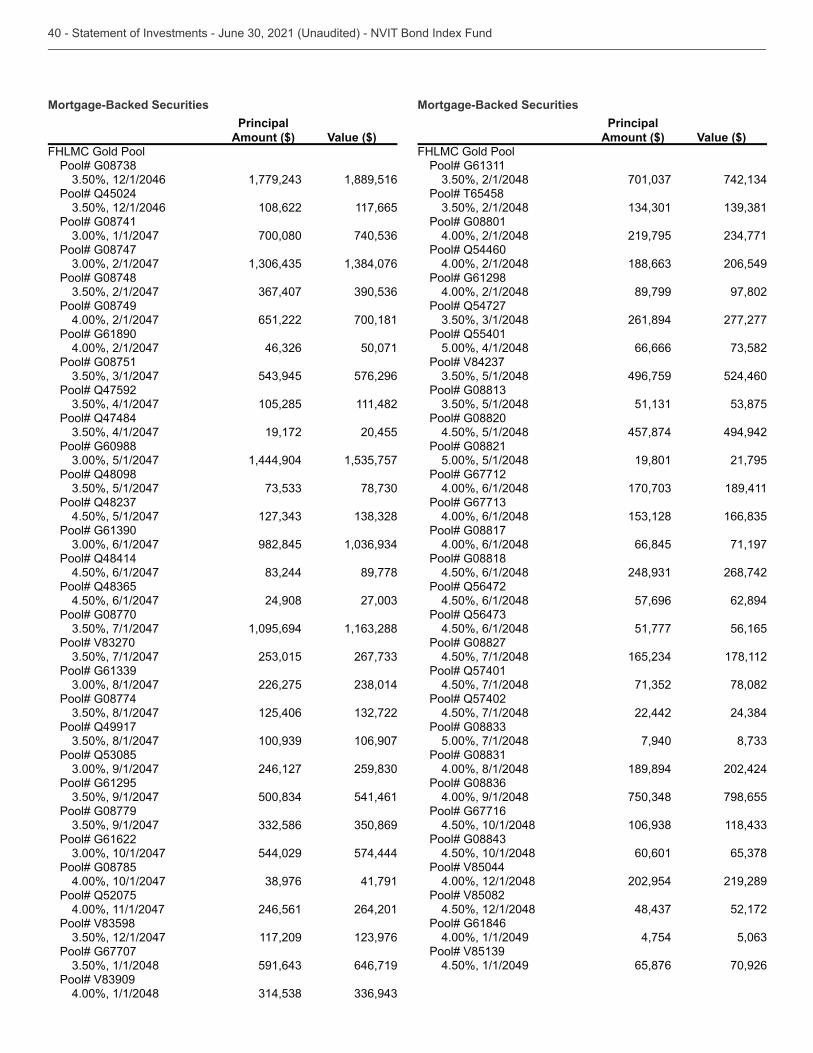
Principal
Amount ($) Value ($)FHLMC Gold Pool
1,889,516Pool# Q45024
108,622 117,665Pool# G08741
700,080 Pool# G08747
Pool# G08748
Pool# G08749
4.00%, 2/1/2047 651,222 700,181Pool# G61890
4.00%, 2/1/2047 50,071Pool# G08751
576,296Pool# Q47592
105,285 111,482Pool# Q47484
19,172 20,455Pool# G60988
1,444,904 Pool# Q48098
4.50%, 5/1/2047
982,845 Pool# Q48414
4.50%, 6/1/2047 89,778
4.50%, 6/1/2047 24,908 Pool# G08770
1,095,694
226,275 Pool# G08774
125,406 Pool# Q49917
106,907
246,127 Pool# G61295
541,461Pool# G08779
Pool# G61622
544,029 574,444Pool# G08785
4.00%, 10/1/2047 41,791Pool# Q52075
4.00%, 11/1/2047 246,561 264,201
117,209 Pool# G67707
646,719
4.00%, 1/1/2048
Principal
Amount ($) Value ($)FHLMC Gold Pool
Pool# T65458
Pool# G08801
4.00%, 2/1/2048 219,795 Pool# Q54460
4.00%, 2/1/2048 206,549Pool# G61298
4.00%, 2/1/2048 89,799 97,802Pool# Q54727
261,894 277,277Pool# Q55401
5.00%, 4/1/2048 66,666
496,759 524,460
Pool# G08820
4.50%, 5/1/2048 457,874 494,942Pool# G08821
5.00%, 5/1/2048 19,801 21,795Pool# G67712
4.00%, 6/1/2048 189,411
4.00%, 6/1/2048 Pool# G08817
4.00%, 6/1/2048 66,845 71,197Pool# G08818
4.50%, 6/1/2048 268,742Pool# Q56472
4.50%, 6/1/2048 57,696 62,894
4.50%, 6/1/2048 51,777 56,165Pool# G08827
4.50%, 7/1/2048 178,112Pool# Q57401
4.50%, 7/1/2048 78,082Pool# Q57402
4.50%, 7/1/2048 22,442
5.00%, 7/1/2048 7,940
4.00%, 8/1/2048 189,894 202,424
4.00%, 9/1/2048 798,655Pool# G67716
4.50%, 10/1/2048
4.50%, 10/1/2048 60,601 Pool# V85044
4.00%, 12/1/2048 202,954 219,289Pool# V85082
4.50%, 12/1/2048 52,172Pool# G61846
4.00%, 1/1/2049 4,754
4.50%, 1/1/2049 65,876 70,926
Principal
Amount ($) Value ($)FHLMC Non Gold Pool
Pool# 1B84782.61%, 7/1/2041(a) 86,098
Pool# 2B0108
1,449 Pool
Pool# ZT19984.00%, 7/1/2029 98,855 105,029
1,087,149Pool# ZS8701
81,479 87,290Pool# SB0218
188,906Pool# QN0248
78,758 82,979Pool# SB0095
196,687Pool# SB0069
269,228Pool# SB8021
514,212 540,151Pool# SB8500
1,011,157 1,068,610Pool# SB8505
Pool# SB8506
2,507,546Pool# SB8508
1,748,028Pool# RC1826
509,296Pool# RC1887
902,295 Pool# RC2049
2,158,472 2,228,628Pool# RC2045
675,756
1,540,248 1,616,890Pool# QA2226
927,698
242,695Pool# ZS4746
648,170Pool# ZA5785
4.50%, 10/1/2048
4.50%, 11/1/2048 441,101 475,459
4.50%, 12/1/2048 164,977
155,667 165,749
Principal
Amount ($) Value ($)
140,989Pool# ZT1858
4.50%, 4/1/2049 66,597 72,899Pool# RA1859
796,756 Pool# SD8051
Pool# QA8965
846,445 884,125Pool# RA2579
Pool# RA2621
4.00%, 5/1/2050 115,559
2.50%, 6/1/2050 756,472Pool# SD7521
2.50%, 7/1/2050 1,119,046 Pool# SD8074
987,715
2.50%, 8/1/2050 295,994
Pool# SD8092
1,412,802 Pool# SD0514
2.00%, 10/1/2050 1,048,512 1,060,995
2.00%, 10/1/2050
2.50%, 11/1/2050
2.50%, 11/1/2050 1,857,917
2.50%, 11/1/2050 956,075 991,670
2.50%, 11/1/2050 474,184 490,907Pool# RA4411
2.50%, 1/1/2051 2,521,256 2,610,175
2.50%, 1/1/2051 1,162,109 Pool# RA4410
2.50%, 1/1/2051 892,191 927,011Pool# RA4652
2.00%, 2/1/2051
2.00%, 2/1/2051 Pool# QB9104
2.00%, 2/1/2051 948,048
Pool# RA4718
Pool# SD8140
2.00%, 4/1/2051 6,214,842 6,279,267Pool# SD8146
2.00%, 5/1/2051 14,087,972
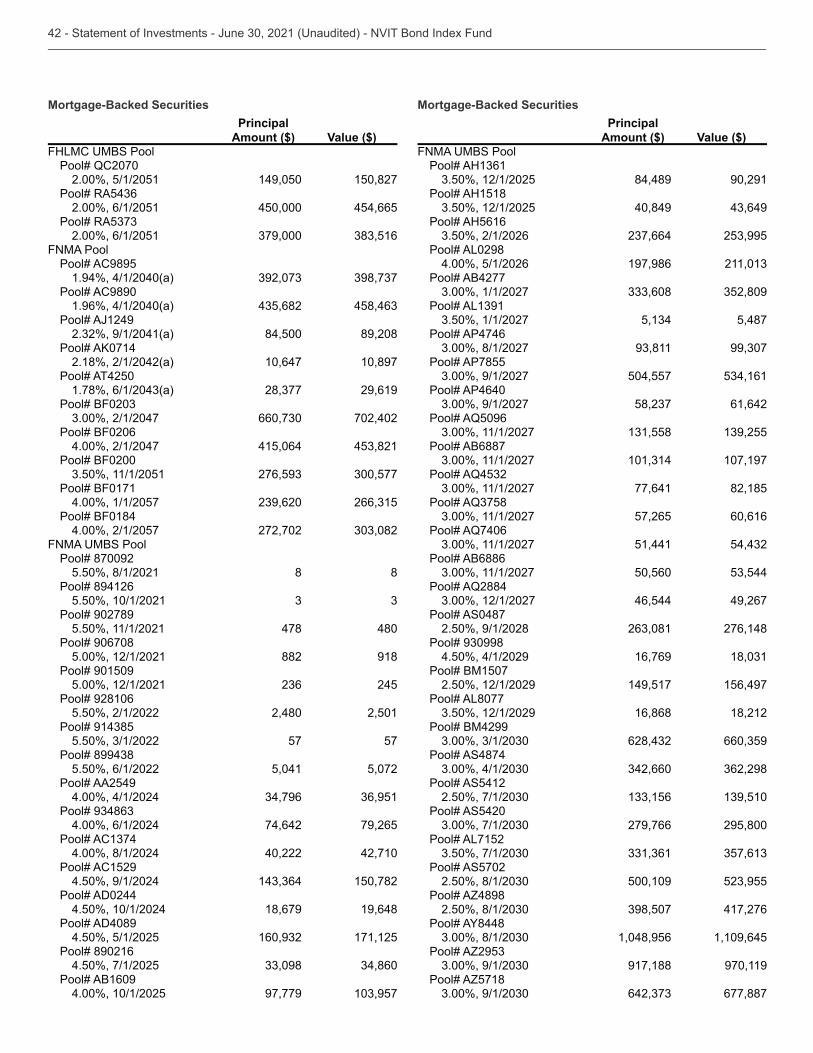
Principal
Amount ($) Value ($)
Pool# QC20702.00%, 5/1/2051 149,050 150,827
2.00%, 6/1/2051 450,000 454,665
2.00%, 6/1/2051 FNMA Pool
Pool# AC98951.94%, 4/1/2040(a)
Pool# AC98901.96%, 4/1/2040(a)
Pool# AJ1249 84,500 89,208
2.18%, 2/1/2042(a) 10,647 10,897Pool# AT4250
29,619
702,402Pool# BF0206
4.00%, 2/1/2047 415,064 Pool# BF0200
Pool# BF0171
4.00%, 1/1/2057 Pool# BF0184
4.00%, 2/1/2057 272,702 Pool
Pool# 8700925.50%, 8/1/2021 8 8
Pool# 8941265.50%, 10/1/2021
Pool# 9027895.50%, 11/1/2021 478 480
Pool# 9067085.00%, 12/1/2021 882 918
Pool# 9015095.00%, 12/1/2021 245
Pool# 9281065.50%, 2/1/2022 2,480 2,501
57 57
5.50%, 6/1/2022 5,041 5,072Pool# AA2549
4.00%, 4/1/2024
4.00%, 6/1/2024 74,642 79,265
4.00%, 8/1/2024 40,222 42,710Pool# AC1529
4.50%, 9/1/2024 150,782Pool# AD0244
4.50%, 10/1/2024 18,679 19,648Pool# AD4089
4.50%, 5/1/2025 171,125Pool# 890216
4.50%, 7/1/2025 Pool# AB1609
4.00%, 10/1/2025 97,779
Principal
Amount ($) Value ($)
84,489 90,291Pool# AH1518
40,849 Pool# AH5616
Pool# AL0298
4.00%, 5/1/2026 197,986 Pool# AB4277
5,487Pool# AP4746
Pool# AP7855
504,557 Pool# AP4640
61,642Pool# AQ5096
Pool# AB6887
107,197
77,641 82,185
57,265 60,616Pool# AQ7406
51,441 Pool# AB6886
50,560 Pool# AQ2884
46,544 49,267Pool# AS0487
2.50%, 9/1/2028 276,148
4.50%, 4/1/2029 16,769 Pool# BM1507
2.50%, 12/1/2029 149,517 156,497Pool# AL8077
16,868 18,212Pool# BM4299
Pool# AS4874
Pool# AS5412
Pool# AS5420
279,766 295,800Pool# AL7152
Pool# AS5702
500,109 Pool# AZ4898
417,276
1,048,956 1,109,645
917,188 970,119Pool# AZ5718
677,887
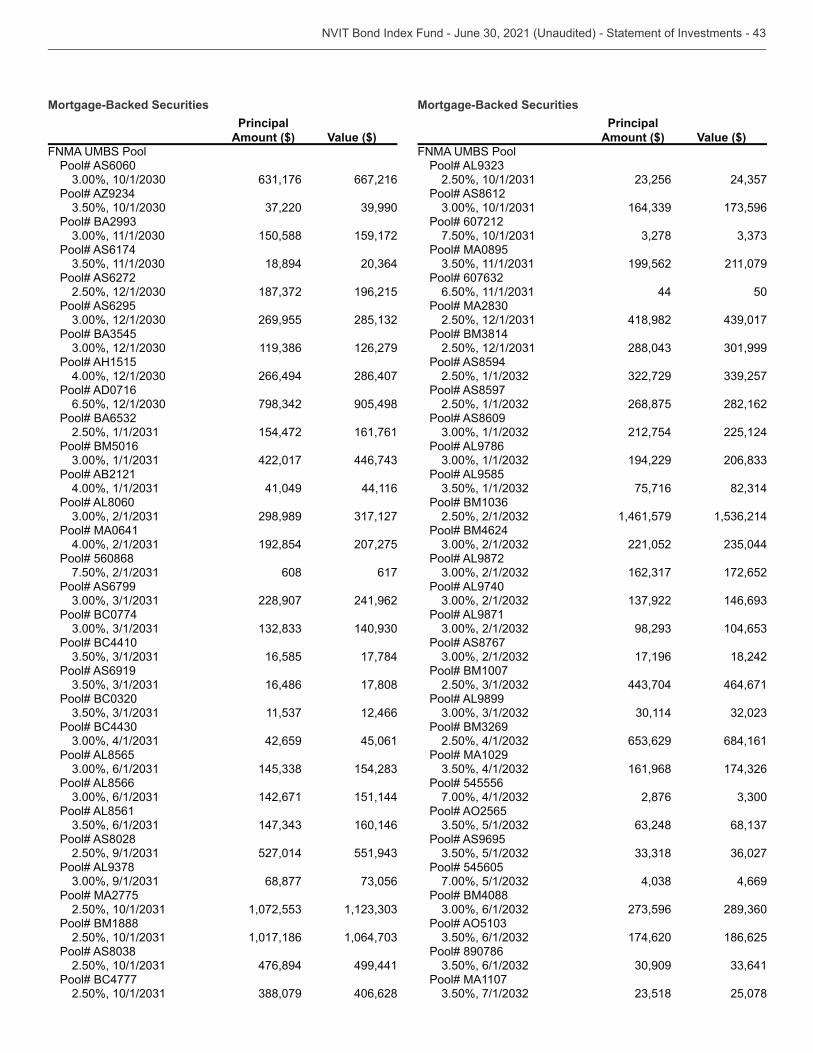
Principal
Amount ($) Value ($)
Pool# AS6060 667,216
150,588 159,172Pool# AS6174
18,894 Pool# AS6272
196,215Pool# AS6295
269,955
126,279Pool# AH1515
266,494 286,407Pool# AD0716
905,498
154,472 161,761Pool# BM5016
422,017 Pool# AB2121
41,049 44,116Pool# AL8060
298,989 Pool# MA0641
192,854 207,275Pool# 560868
608 617Pool# AS6799
228,907 241,962Pool# BC0774
Pool# BC4410
16,585 17,784Pool# AS6919
16,486 17,808
12,466
42,659 45,061Pool# AL8565
Pool# AL8566
142,671 151,144Pool# AL8561
160,146Pool# AS8028
527,014
68,877 Pool# MA2775
Pool# BM1888
1,017,186
476,894 499,441Pool# BC4777
406,628
Principal
Amount ($) Value ($)
Pool# AS8612
Pool# 607212
Pool# MA0895
199,562 211,079
44 50
418,982
Pool# AS8594
Pool# AS8597
268,875 282,162Pool# AS8609
212,754 225,124Pool# AL9786
194,229 Pool# AL9585
75,716
1,461,579 Pool# BM4624
221,052 Pool# AL9872
172,652Pool# AL9740
Pool# AL9871
Pool# AS8767
17,196 18,242Pool# BM1007
464,671Pool# AL9899
684,161Pool# MA1029
161,968 Pool# 545556
2,876
Pool# AS9695
Pool# 545605
4,669Pool# BM4088
174,620 186,625Pool# 890786
Pool# MA1107
25,078
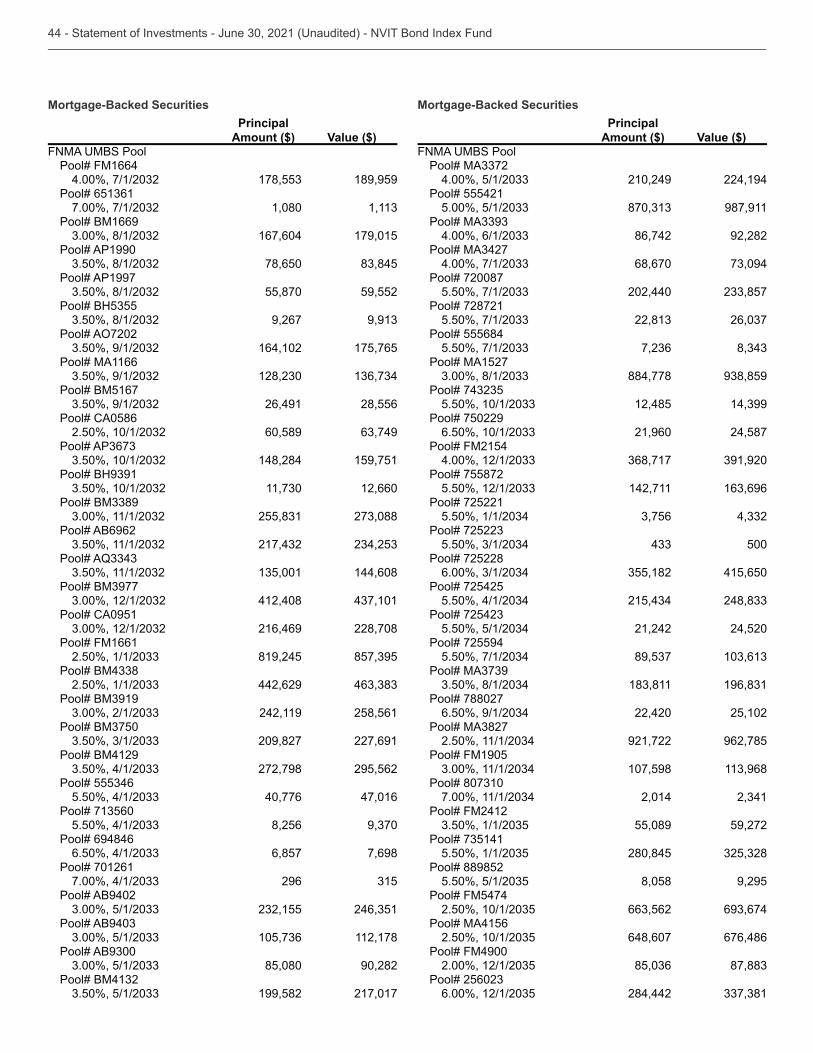
Principal
Amount ($) Value ($)
Pool# FM1664 189,959
1,080 Pool# BM1669
167,604 179,015Pool# AP1990
78,650 Pool# AP1997
55,870 59,552
9,267
164,102 175,765Pool# MA1166
Pool# BM5167
26,491 28,556Pool# CA0586
60,589
148,284 159,751
12,660
Pool# AB6962
144,608
412,408 Pool# CA0951
216,469 228,708Pool# FM1661
819,245
442,629
242,119 258,561
209,827 227,691Pool# BM4129
272,798 295,562
40,776 47,016
8,256 Pool# 694846
6,857 7,698Pool# 701261
296 Pool# AB9402
112,178
85,080 90,282
199,582 217,017
Principal
Amount ($) Value ($)
210,249 224,194Pool# 555421
987,911
86,742 92,282
68,670 Pool# 720087
202,440 Pool# 728721
Pool# 555684
Pool# MA1527
884,778
12,485 Pool# 750229
21,960 24,587Pool# FM2154
Pool# 755872
142,711 Pool# 725221
500Pool# 725228
415,650Pool# 725425
21,242 24,520Pool# 725594
Pool# 788027
22,420 25,102
921,722 962,785Pool# FM1905
107,598
2,014 Pool# FM2412
55,089 59,272
280,845 Pool# 889852
8,058 9,295Pool# FM5474
Pool# MA4156
648,607 676,486Pool# FM4900
284,442
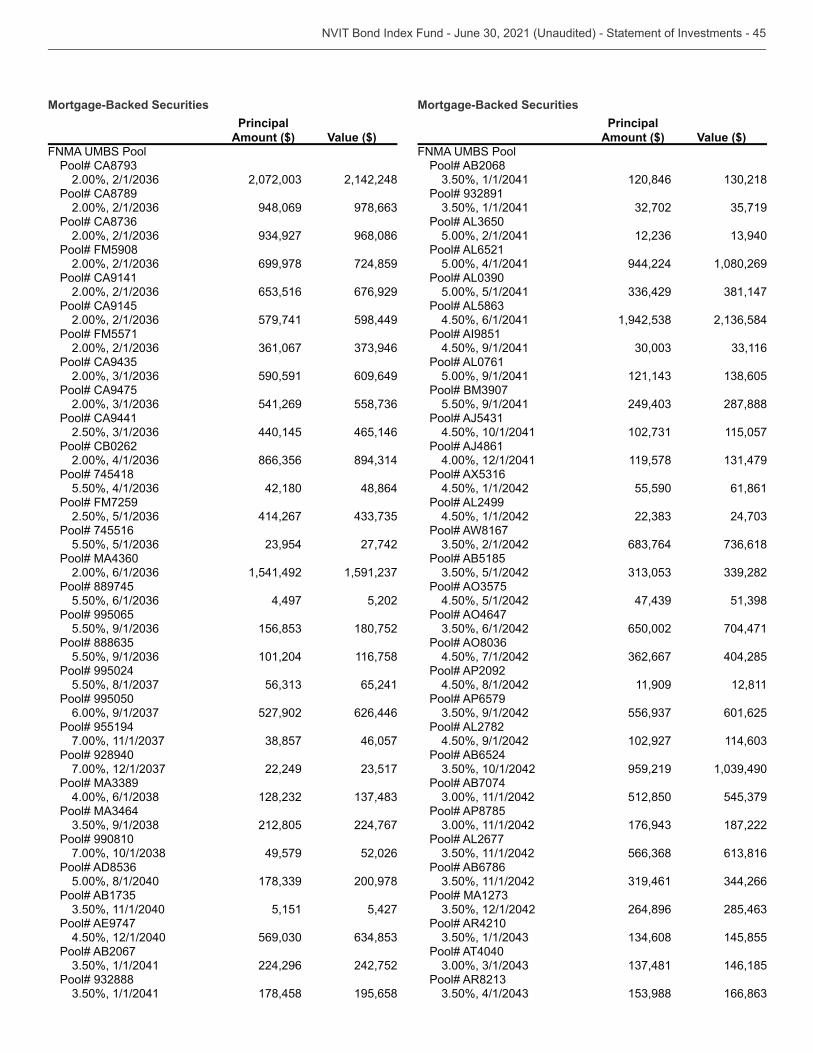
Principal
Amount ($) Value ($)
2,142,248Pool# CA8789
948,069
968,086Pool# FM5908
699,978 724,859Pool# CA9141
676,929Pool# CA9145
579,741 598,449Pool# FM5571
590,591 609,649Pool# CA9475
541,269 Pool# CA9441
440,145 465,146Pool# CB0262
Pool# 745418
42,180 48,864Pool# FM7259
414,267 Pool# 745516
27,742
1,541,492 Pool# 889745
4,497 5,202Pool# 995065
180,752
101,204 116,758Pool# 995024
65,241Pool# 995050
527,902 626,446Pool# 955194
46,057Pool# 928940
22,249
212,805 224,767Pool# 990810
49,579 52,026
5.00%, 8/1/2040 200,978
5,151 5,427
4.50%, 12/1/2040 Pool# AB2067
224,296 242,752
178,458 195,658
Principal
Amount ($) Value ($)
Pool# AB2068 120,846
5.00%, 2/1/2041 Pool# AL6521
5.00%, 4/1/2041 944,224 1,080,269
5.00%, 5/1/2041
4.50%, 6/1/2041 Pool# AI9851
4.50%, 9/1/2041 Pool# AL0761
5.00%, 9/1/2041
5.50%, 9/1/2041 287,888
4.50%, 10/1/2041 115,057Pool# AJ4861
4.00%, 12/1/2041 119,578
4.50%, 1/1/2042 55,590 61,861Pool# AL2499
4.50%, 1/1/2042 Pool# AW8167
Pool# AB5185
4.50%, 5/1/2042
650,002 704,471
4.50%, 7/1/2042 404,285Pool# AP2092
4.50%, 8/1/2042 11,909 12,811Pool# AP6579
601,625Pool# AL2782
4.50%, 9/1/2042 102,927 Pool# AB6524
959,219 Pool# AB7074
512,850 Pool# AP8785
187,222Pool# AL2677
Pool# AB6786
264,896 Pool# AR4210
145,855Pool# AT4040
146,185
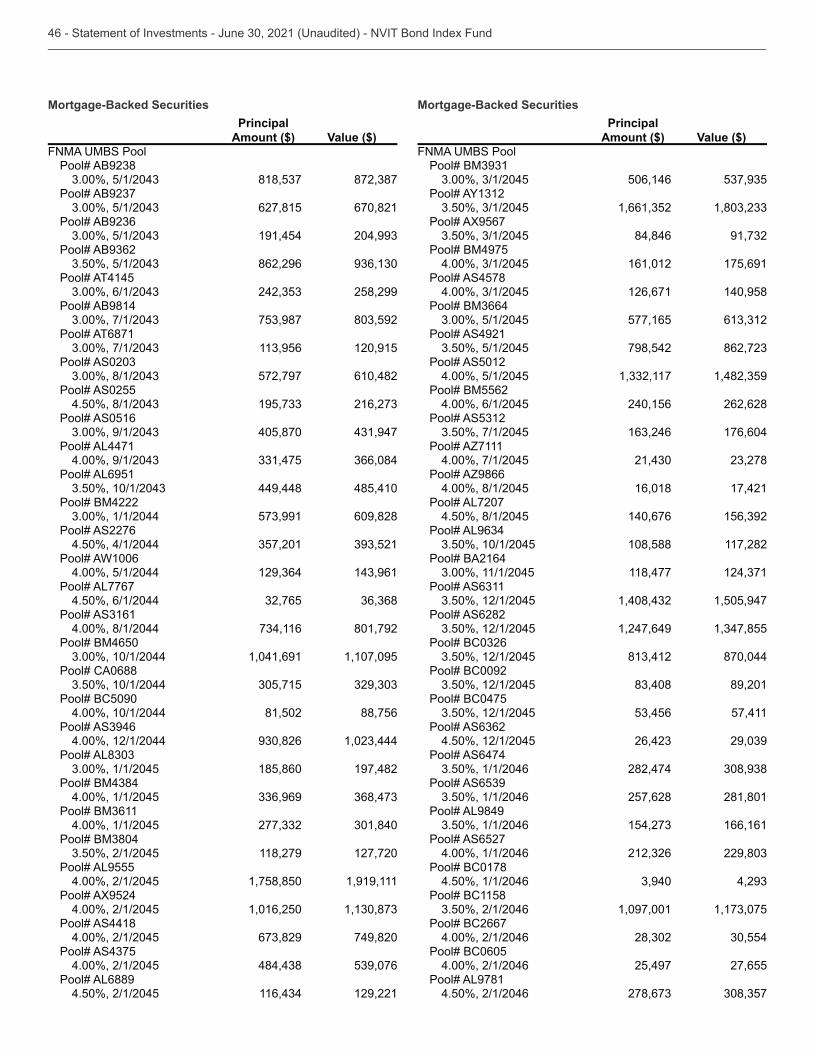
Principal
Amount ($) Value ($)
627,815 670,821
191,454
862,296 Pool# AT4145
258,299Pool# AB9814
Pool# AT6871
120,915
572,797 610,482Pool# AS0255
Pool# AS0516
405,870 Pool# AL4471
Pool# AL6951
449,448 485,410Pool# BM4222
609,828Pool# AS2276
4.50%, 4/1/2044 Pool# AW1006
4.00%, 5/1/2044 Pool# AL7767
4.50%, 6/1/2044
4.00%, 8/1/2044 801,792Pool# BM4650
1,041,691 1,107,095Pool# CA0688
Pool# BC5090
4.00%, 10/1/2044 81,502 88,756
4.00%, 12/1/2044
185,860 197,482
4.00%, 1/1/2045
4.00%, 1/1/2045
118,279 127,720Pool# AL9555
4.00%, 2/1/2045 1,758,850 1,919,111Pool# AX9524
4.00%, 2/1/2045 1,016,250 Pool# AS4418
4.00%, 2/1/2045 749,820
4.00%, 2/1/2045 Pool# AL6889
4.50%, 2/1/2045 129,221
Principal
Amount ($) Value ($)
506,146
Pool# AX9567
84,846 Pool# BM4975
161,012 175,691Pool# AS4578
126,671 140,958
577,165 Pool# AS4921
798,542 Pool# AS5012
4.00%, 5/1/2045 Pool# BM5562
4.00%, 6/1/2045 240,156 262,628
176,604Pool# AZ7111
4.00%, 7/1/2045 Pool# AZ9866
4.00%, 8/1/2045 16,018 17,421Pool# AL7207
4.50%, 8/1/2045 140,676
108,588 117,282Pool# BA2164
118,477
1,505,947Pool# AS6282
1,247,649
870,044Pool# BC0092
89,201Pool# BC0475
57,411
4.50%, 12/1/2045 Pool# AS6474
282,474
257,628 281,801Pool# AL9849
166,161Pool# AS6527
4.00%, 1/1/2046 Pool# BC0178
4.50%, 1/1/2046 Pool# BC1158
1,097,001 Pool# BC2667
4.00%, 2/1/2046 Pool# BC0605
4.00%, 2/1/2046 25,497 27,655Pool# AL9781
4.50%, 2/1/2046
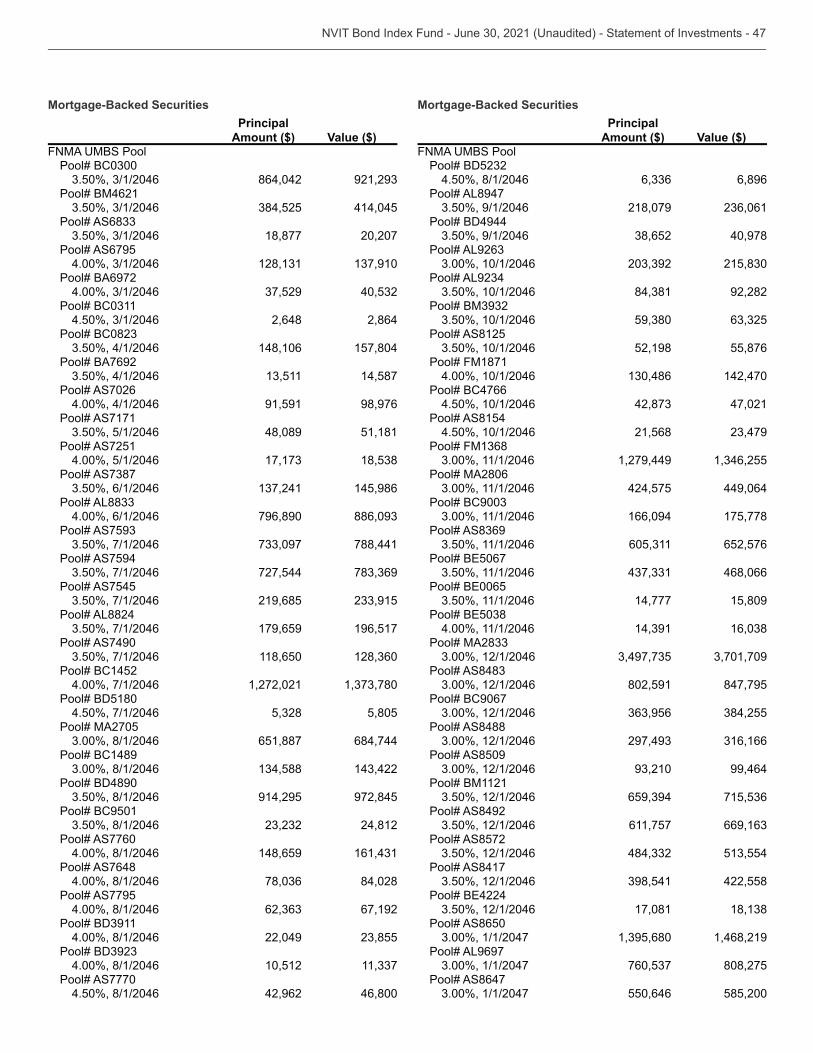
Principal
Amount ($) Value ($)
864,042 Pool# BM4621
414,045
18,877 20,207Pool# AS6795
Pool# BA6972
2,648 2,864
148,106 157,804Pool# BA7692
14,587Pool# AS7026
4.00%, 4/1/2046 91,591 98,976Pool# AS7171
48,089 51,181Pool# AS7251
4.00%, 5/1/2046
145,986
4.00%, 6/1/2046 796,890
788,441Pool# AS7594
727,544 Pool# AS7545
219,685 Pool# AL8824
179,659 196,517Pool# AS7490
118,650 Pool# BC1452
4.00%, 7/1/2046 1,272,021 Pool# BD5180
4.50%, 7/1/2046 5,805Pool# MA2705
651,887 684,744Pool# BC1489
Pool# BD4890
914,295 972,845Pool# BC9501
24,812Pool# AS7760
4.00%, 8/1/2046 148,659 Pool# AS7648
4.00%, 8/1/2046 84,028Pool# AS7795
4.00%, 8/1/2046 67,192
4.00%, 8/1/2046 22,049
4.00%, 8/1/2046 10,512 Pool# AS7770
4.50%, 8/1/2046 42,962 46,800
Principal
Amount ($) Value ($)
4.50%, 8/1/2046 6,896Pool# AL8947
218,079 Pool# BD4944
40,978
92,282
Pool# AS8125
52,198 55,876Pool# FM1871
4.00%, 10/1/2046 142,470Pool# BC4766
4.50%, 10/1/2046 47,021Pool# AS8154
4.50%, 10/1/2046 21,568
1,279,449 Pool# MA2806
424,575 449,064
166,094 175,778
652,576
468,066
14,777 15,809
4.00%, 11/1/2046
802,591 847,795Pool# BC9067
Pool# AS8488
Pool# AS8509
99,464Pool# BM1121
Pool# AS8492
611,757 Pool# AS8572
Pool# AS8417
422,558
17,081 Pool# AS8650
1,468,219Pool# AL9697
808,275Pool# AS8647
550,646 585,200
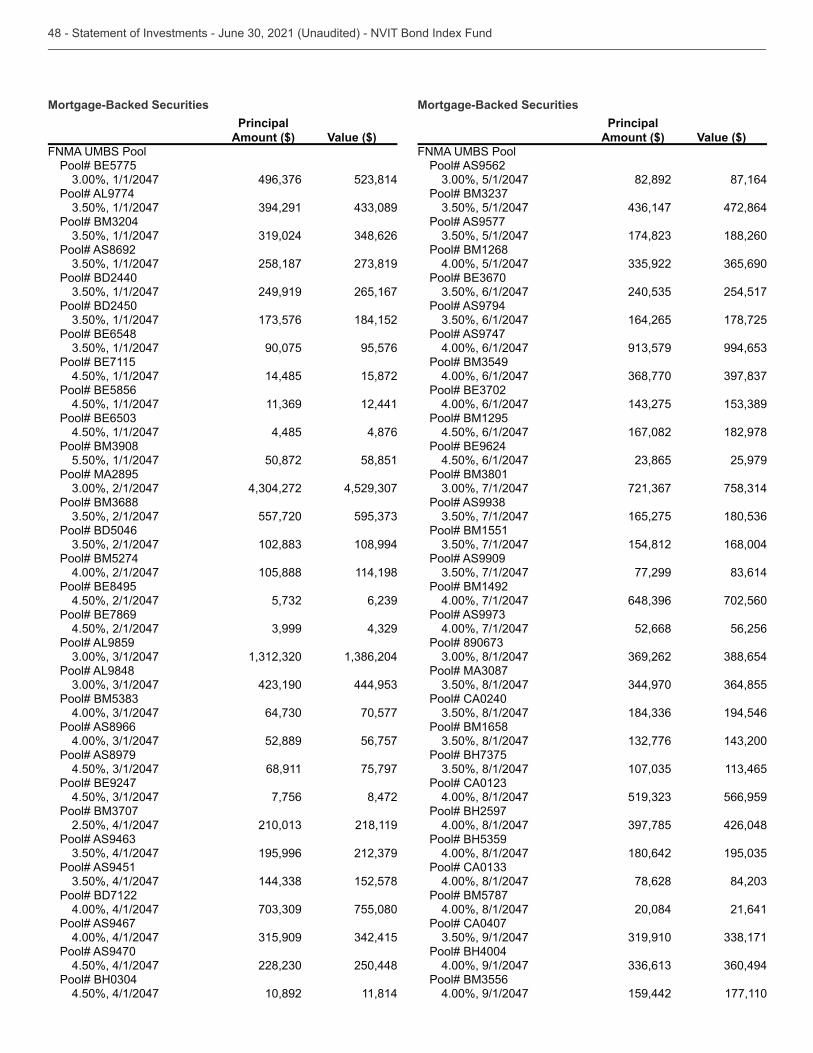
Principal
Amount ($) Value ($)
Pool# AL9774
Pool# AS8692
258,187 Pool# BD2440
249,919 265,167Pool# BD2450
184,152
90,075 95,576
4.50%, 1/1/2047 14,485 15,872
4.50%, 1/1/2047 12,441
4.50%, 1/1/2047 4,485 4,876
5.50%, 1/1/2047 50,872 58,851Pool# MA2895
557,720 Pool# BD5046
108,994Pool# BM5274
4.00%, 2/1/2047 105,888 114,198
4.50%, 2/1/2047
4.50%, 2/1/2047 Pool# AL9859
Pool# AL9848
70,577Pool# AS8966
52,889 56,757Pool# AS8979
68,911 75,797
7,756 8,472
2.50%, 4/1/2047 218,119
195,996 Pool# AS9451
152,578Pool# BD7122
4.00%, 4/1/2047 755,080Pool# AS9467
4.00%, 4/1/2047 Pool# AS9470
4.50%, 4/1/2047 250,448
4.50%, 4/1/2047 10,892 11,814
Principal
Amount ($) Value ($)
Pool# AS9562 82,892 87,164
472,864Pool# AS9577
188,260Pool# BM1268
4.00%, 5/1/2047
254,517Pool# AS9794
164,265 178,725Pool# AS9747
4.00%, 6/1/2047
4.00%, 6/1/2047
4.00%, 6/1/2047 Pool# BM1295
4.50%, 6/1/2047 167,082 182,978
4.50%, 6/1/2047 25,979
165,275 Pool# BM1551
154,812 168,004Pool# AS9909
77,299 Pool# BM1492
4.00%, 7/1/2047 702,560
4.00%, 7/1/2047 52,668 56,256
Pool# CA0240
194,546Pool# BM1658
4.00%, 8/1/2047 566,959Pool# BH2597
4.00%, 8/1/2047 426,048
4.00%, 8/1/2047 180,642
4.00%, 8/1/2047 78,628 Pool# BM5787
4.00%, 8/1/2047 20,084 21,641Pool# CA0407
Pool# BH4004
4.00%, 9/1/2047
4.00%, 9/1/2047 159,442 177,110
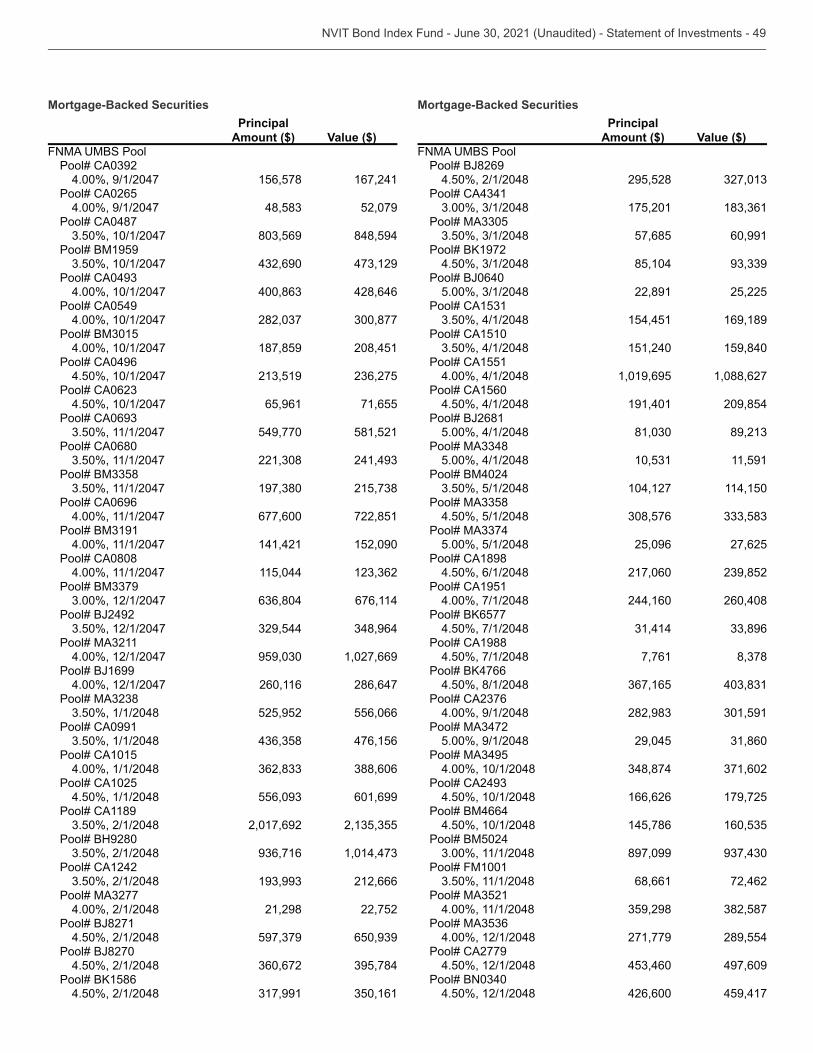
Principal
Amount ($) Value ($)
4.00%, 9/1/2047 156,578 167,241Pool# CA0265
4.00%, 9/1/2047 52,079Pool# CA0487
848,594Pool# BM1959
4.00%, 10/1/2047 428,646Pool# CA0549
4.00%, 10/1/2047
4.00%, 10/1/2047 187,859 208,451Pool# CA0496
4.50%, 10/1/2047
4.50%, 10/1/2047 65,961 71,655
549,770 581,521Pool# CA0680
Pool# CA0696
4.00%, 11/1/2047 677,600 722,851
4.00%, 11/1/2047 141,421 152,090Pool# CA0808
4.00%, 11/1/2047 115,044
676,114Pool# BJ2492
4.00%, 12/1/2047 1,027,669Pool# BJ1699
4.00%, 12/1/2047 260,116 286,647
525,952 556,066Pool# CA0991
476,156Pool# CA1015
4.00%, 1/1/2048 Pool# CA1025
4.50%, 1/1/2048 601,699Pool# CA1189
2,017,692 Pool# BH9280
Pool# CA1242
212,666
4.00%, 2/1/2048 21,298 22,752Pool# BJ8271
4.50%, 2/1/2048 Pool# BJ8270
4.50%, 2/1/2048
4.50%, 2/1/2048
Principal
Amount ($) Value ($)
Pool# BJ82694.50%, 2/1/2048 295,528
175,201
57,685 60,991
85,104 Pool# BJ0640
22,891 25,225
154,451 169,189Pool# CA1510
151,240 159,840Pool# CA1551
4.00%, 4/1/2048 1,019,695 1,088,627Pool# CA1560
4.50%, 4/1/2048 191,401 209,854Pool# BJ2681
5.00%, 4/1/2048
5.00%, 4/1/2048 11,591Pool# BM4024
104,127 114,150
4.50%, 5/1/2048
5.00%, 5/1/2048 25,096 27,625Pool# CA1898
4.50%, 6/1/2048 217,060 Pool# CA1951
4.00%, 7/1/2048 244,160 260,408
4.50%, 7/1/2048 Pool# CA1988
4.50%, 7/1/2048 7,761
4.50%, 8/1/2048
4.00%, 9/1/2048
5.00%, 9/1/2048 29,045
4.00%, 10/1/2048
4.50%, 10/1/2048 166,626 179,725Pool# BM4664
4.50%, 10/1/2048 145,786 Pool# BM5024
897,099 Pool# FM1001
68,661 72,462
4.00%, 11/1/2048
4.00%, 12/1/2048 271,779 289,554Pool# CA2779
4.50%, 12/1/2048 497,609
4.50%, 12/1/2048 426,600 459,417
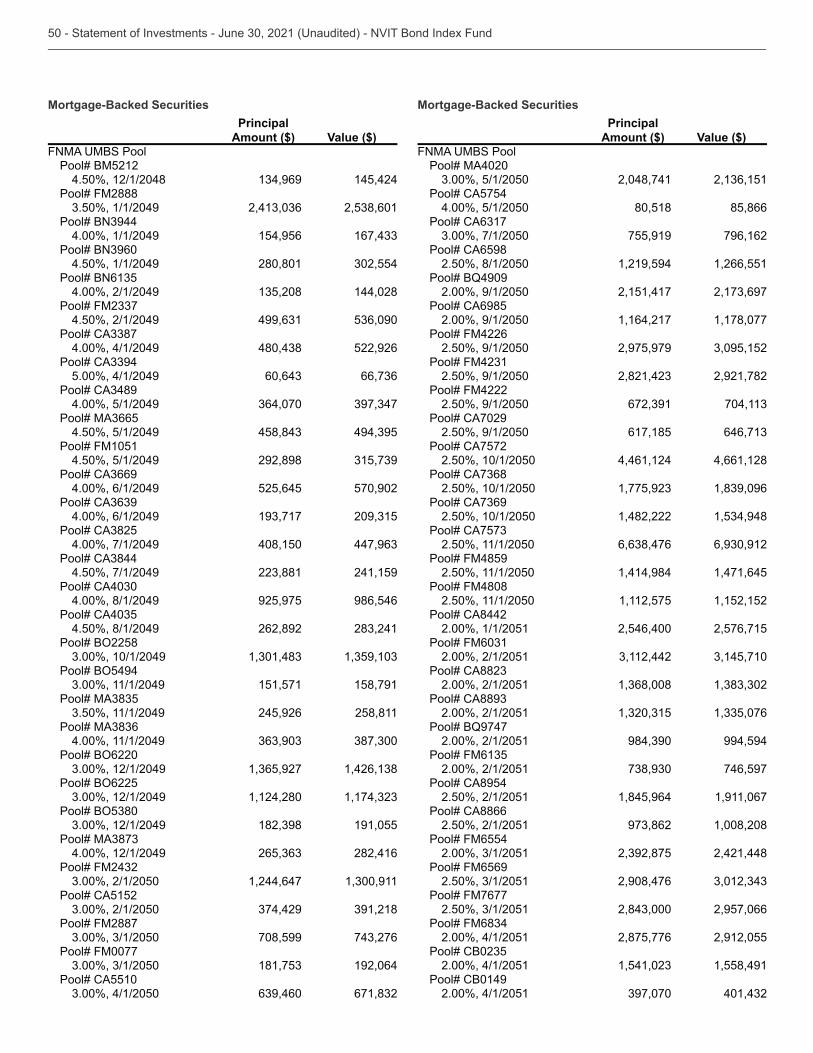
Principal
Amount ($) Value ($)
Pool# BM52124.50%, 12/1/2048 145,424
Pool# FM2888
4.00%, 1/1/2049 154,956
4.50%, 1/1/2049 280,801
4.00%, 2/1/2049 144,028
4.50%, 2/1/2049
4.00%, 4/1/2049 522,926
5.00%, 4/1/2049
4.00%, 5/1/2049
4.50%, 5/1/2049 Pool# FM1051
4.50%, 5/1/2049 292,898
4.00%, 6/1/2049 525,645 570,902
4.00%, 6/1/2049
4.00%, 7/1/2049 408,150
4.50%, 7/1/2049 241,159
4.00%, 8/1/2049 925,975 986,546
4.50%, 8/1/2049 262,892
151,571 158,791
245,926 258,811
4.00%, 11/1/2049
1,124,280
191,055
4.00%, 12/1/2049 282,416
1,244,647 Pool# CA5152
Pool# FM2887
708,599 Pool# FM0077
192,064Pool# CA5510
Principal
Amount ($) Value ($)
Pool# MA4020 2,048,741
Pool# CA57544.00%, 5/1/2050 80,518 85,866
755,919 796,162Pool# CA6598
2.50%, 8/1/2050 1,219,594 1,266,551Pool# BQ4909
2.00%, 9/1/2050 2,151,417 Pool# CA6985
2.00%, 9/1/2050 1,164,217 1,178,077Pool# FM4226
2.50%, 9/1/2050 2,975,979
2.50%, 9/1/2050 2,921,782Pool# FM4222
2.50%, 9/1/2050 Pool# CA7029
2.50%, 9/1/2050 617,185 Pool# CA7572
2.50%, 10/1/2050 4,461,124 4,661,128
2.50%, 10/1/2050
2.50%, 10/1/2050 1,482,222
2.50%, 11/1/2050 Pool# FM4859
2.50%, 11/1/2050 1,414,984 1,471,645Pool# FM4808
2.50%, 11/1/2050 1,112,575 1,152,152Pool# CA8442
2.00%, 1/1/2051 2,546,400 2,576,715
2.00%, 2/1/2051
2.00%, 2/1/2051
2.00%, 2/1/2051 Pool# BQ9747
2.00%, 2/1/2051 994,594
2.00%, 2/1/2051 746,597Pool# CA8954
2.50%, 2/1/2051 1,845,964 1,911,067Pool# CA8866
2.50%, 2/1/2051 1,008,208Pool# FM6554
2,421,448Pool# FM6569
2,908,476 Pool# FM7677
2,957,066
2.00%, 4/1/2051 2,875,776 2,912,055
2.00%, 4/1/2051 1,558,491Pool# CB0149
2.00%, 4/1/2051
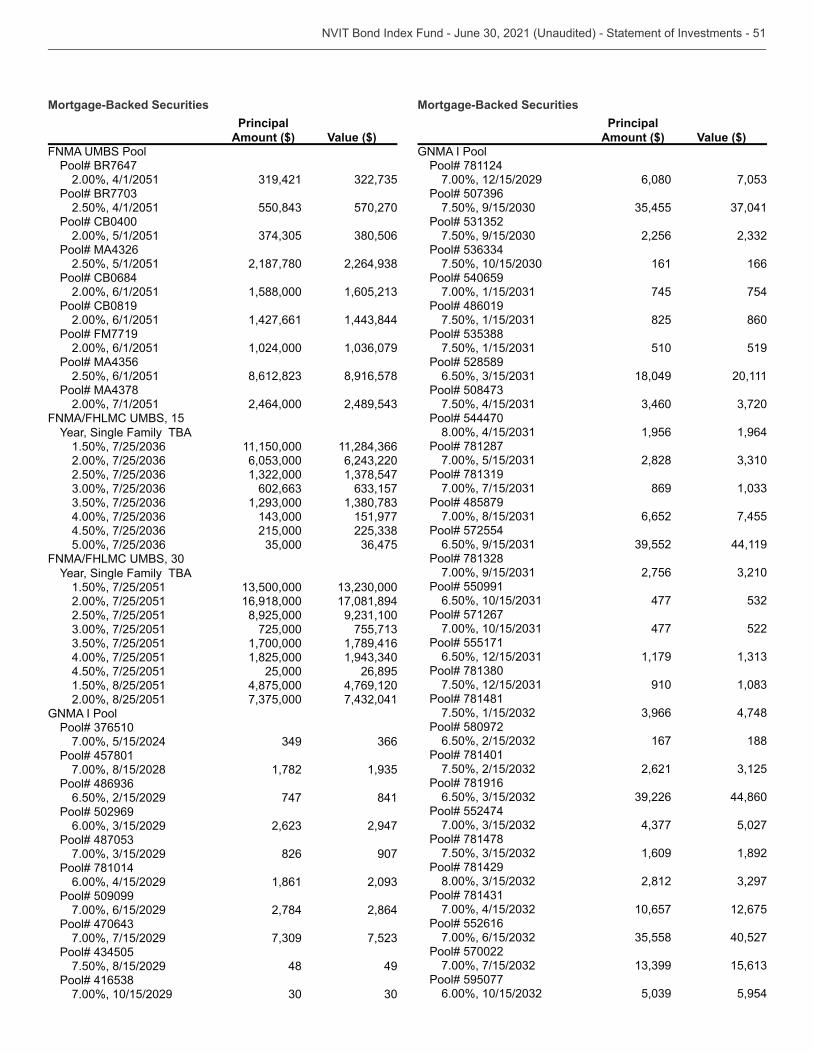
Principal
Amount ($) Value ($)
Pool# BR76472.00%, 4/1/2051
2.50%, 4/1/2051 570,270Pool# CB0400
2.00%, 5/1/2051
2.50%, 5/1/2051 2,187,780 Pool# CB0684
2.00%, 6/1/2051 1,588,000 Pool# CB0819
2.00%, 6/1/2051 1,427,661 Pool# FM7719
2.00%, 6/1/2051 1,024,000
2.50%, 6/1/2051 8,916,578
2.00%, 7/1/2051 2,464,000
TBA 11,150,000 151,977 215,000
TBA1.50%, 7/25/2051 2.00%, 7/25/2051 16,918,000 17,081,8942.50%, 7/25/2051 8,925,000
725,000 1,700,000 1,789,416
4.00%, 7/25/2051 1,825,000 4.50%, 7/25/2051 25,000 26,8951.50%, 8/25/2051 4,875,000 4,769,1202.00%, 8/25/2051
GNMA I Pool
7.00%, 5/15/2024 Pool# 457801
7.00%, 8/15/2028 1,782
6.50%, 2/15/2029 747 841Pool# 502969
2,947
826 907Pool# 781014
6.00%, 4/15/2029 1,861 Pool# 509099
7.00%, 6/15/2029 2,784 2,864
7.00%, 7/15/2029
7.50%, 8/15/2029 48 49
7.00%, 10/15/2029
Principal
Amount ($) Value ($)GNMA I Pool
Pool# 7811247.00%, 12/15/2029 6,080
2,256
161 166Pool# 540659
745 754Pool# 486019
825 860
510 519Pool# 528589
18,049 20,111
Pool# 544470
1,956 1,964Pool# 781287
2,828
869 Pool# 485879
6,652 7,455Pool# 572554
44,119
2,756 Pool# 550991
477 Pool# 571267
477 522Pool# 555171
1,179
910 Pool# 781481
4,748Pool# 580972
167 188Pool# 781401
2,621 Pool# 781916
44,860Pool# 552474
5,027Pool# 781478
1,609 1,892Pool# 781429
2,812
10,657 12,675Pool# 552616
40,527Pool# 570022
Pool# 595077
5,954
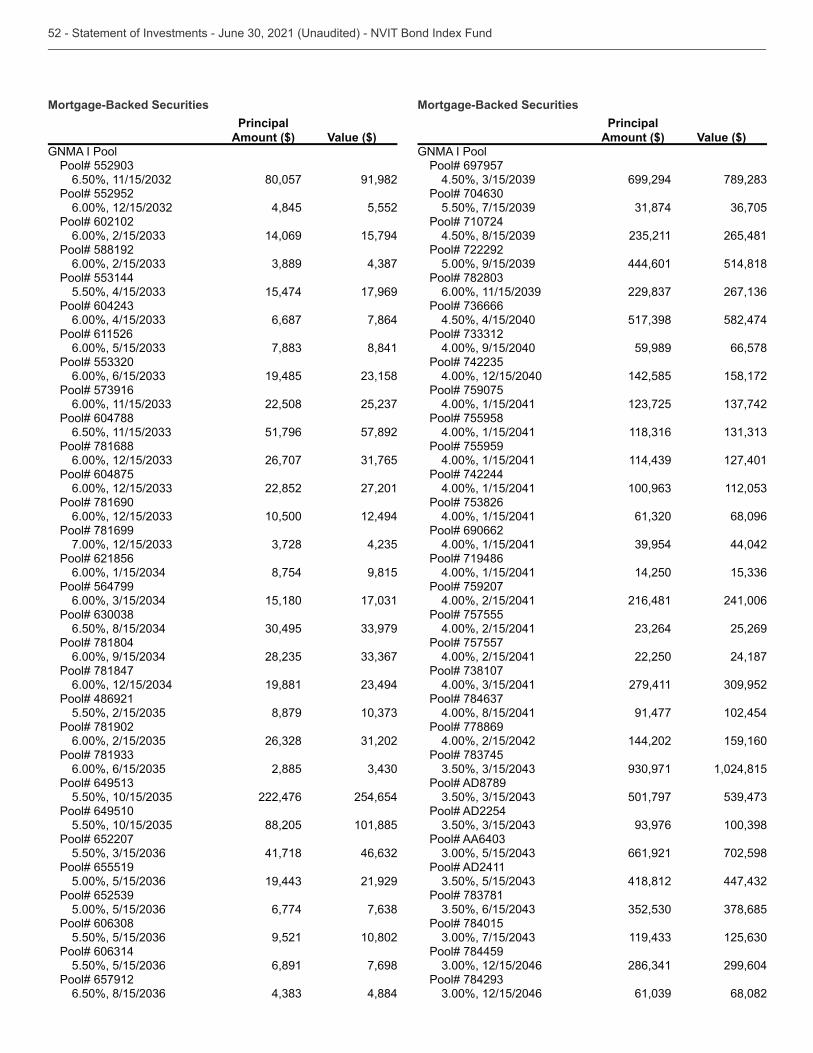
Principal
Amount ($) Value ($)GNMA I Pool
80,057 91,982Pool# 552952
4,845 5,552Pool# 602102
14,069 15,794Pool# 588192
15,474 17,969
6,687 7,864Pool# 611526
8,841
19,485
22,508 Pool# 604788
51,796 57,892Pool# 781688
26,707 Pool# 604875
22,852 27,201Pool# 781690
10,500 12,494Pool# 781699
Pool# 621856
8,754 9,815Pool# 564799
15,180
Pool# 781804
Pool# 781847
19,881 Pool# 486921
8,879 Pool# 781902
2,885
222,476 254,654Pool# 649510
88,205 101,885Pool# 652207
41,718 Pool# 655519
21,929
6,774
9,521 10,802
6,891 7,698Pool# 657912
4,884
Principal
Amount ($) Value ($)GNMA I Pool
Pool# 697957 699,294
Pool# 710724
265,481Pool# 722292
444,601 514,818
4.50%, 4/15/2040 582,474
4.00%, 9/15/2040 59,989 66,578
4.00%, 12/15/2040 142,585 158,172Pool# 759075
4.00%, 1/15/2041 Pool# 755958
4.00%, 1/15/2041 Pool# 755959
4.00%, 1/15/2041 127,401Pool# 742244
4.00%, 1/15/2041
4.00%, 1/15/2041 68,096Pool# 690662
4.00%, 1/15/2041 44,042Pool# 719486
4.00%, 1/15/2041 14,250 Pool# 759207
4.00%, 2/15/2041 216,481 241,006Pool# 757555
4.00%, 2/15/2041 25,269Pool# 757557
4.00%, 2/15/2041 22,250 24,187
279,411
4.00%, 8/15/2041 91,477 102,454Pool# 778869
4.00%, 2/15/2042 144,202 159,160
1,024,815Pool# AD8789
501,797 Pool# AD2254
661,921 702,598Pool# AD2411
418,812
Pool# 784015
Pool# 784459
299,604
68,082
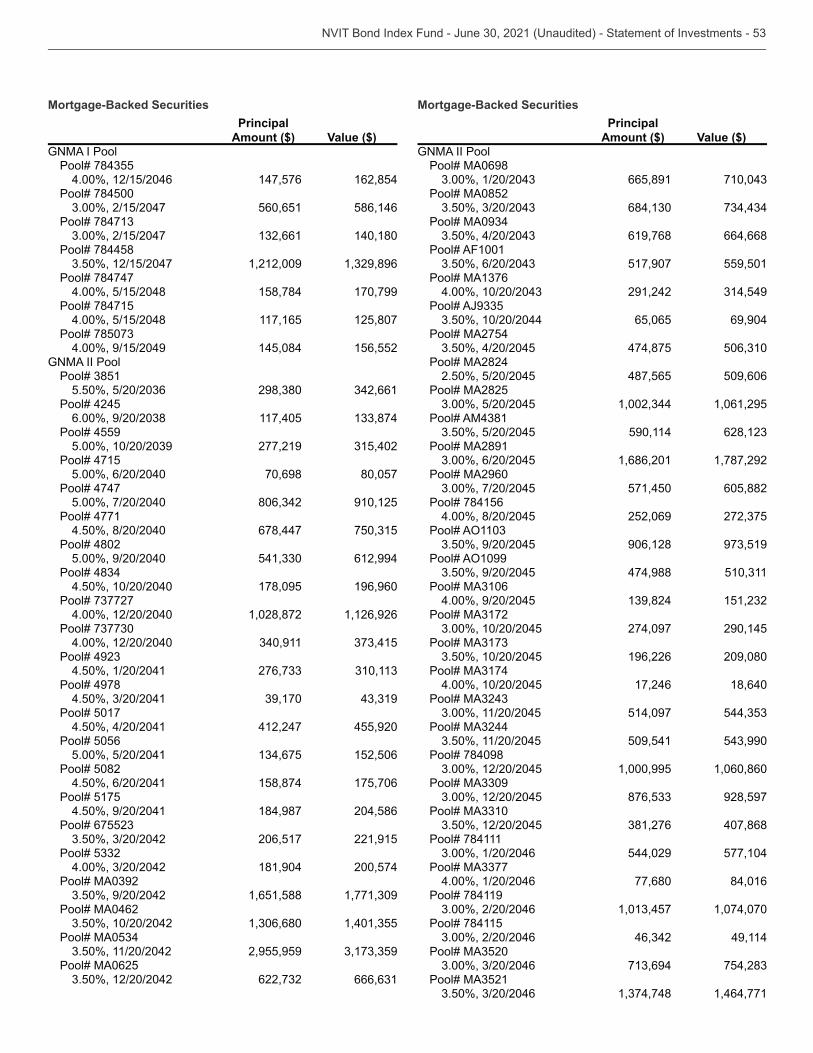
Principal
Amount ($) Value ($)GNMA I Pool
4.00%, 12/15/2046 147,576 162,854Pool# 784500
560,651 586,146
140,180Pool# 784458
1,212,009 Pool# 784747
4.00%, 5/15/2048 158,784 170,799Pool# 784715
4.00%, 5/15/2048 117,165 125,807
4.00%, 9/15/2049 145,084 156,552GNMA II Pool
Pool# 4245
117,405 Pool# 4559
277,219 Pool# 4715
5.00%, 6/20/2040 70,698 80,057Pool# 4747
5.00%, 7/20/2040 910,125Pool# 4771
4.50%, 8/20/2040 678,447 Pool# 4802
5.00%, 9/20/2040 612,994
4.50%, 10/20/2040 178,095 196,960
4.00%, 12/20/2040 1,028,872 1,126,926
4.00%, 12/20/2040
4.50%, 1/20/2041 Pool# 4978
Pool# 5017
4.50%, 4/20/2041 412,247 455,920Pool# 5056
5.00%, 5/20/2041 152,506Pool# 5082
4.50%, 6/20/2041 158,874 175,706Pool# 5175
4.50%, 9/20/2041 184,987 204,586
206,517 221,915
181,904 200,574
1,651,588 Pool# MA0462
2,955,959 Pool# MA0625
Principal
Amount ($) Value ($)GNMA II Pool
Pool# MA0698 665,891
Pool# MA0852
619,768 664,668Pool# AF1001
517,907 559,501
291,242
65,065 69,904Pool# MA2754
474,875 Pool# MA2824
2.50%, 5/20/2045 487,565 509,606Pool# MA2825
1,061,295
590,114 Pool# MA2891
1,686,201 1,787,292Pool# MA2960
571,450 605,882Pool# 784156
4.00%, 8/20/2045 252,069
906,128
474,988
4.00%, 9/20/2045
274,097 290,145
196,226 209,080
4.00%, 10/20/2045 17,246 18,640
514,097
509,541 Pool# 784098
1,000,995 1,060,860
928,597
407,868Pool# 784111
544,029 577,104
4.00%, 1/20/2046 77,680 84,016Pool# 784119
1,074,070Pool# 784115
49,114
1,464,771
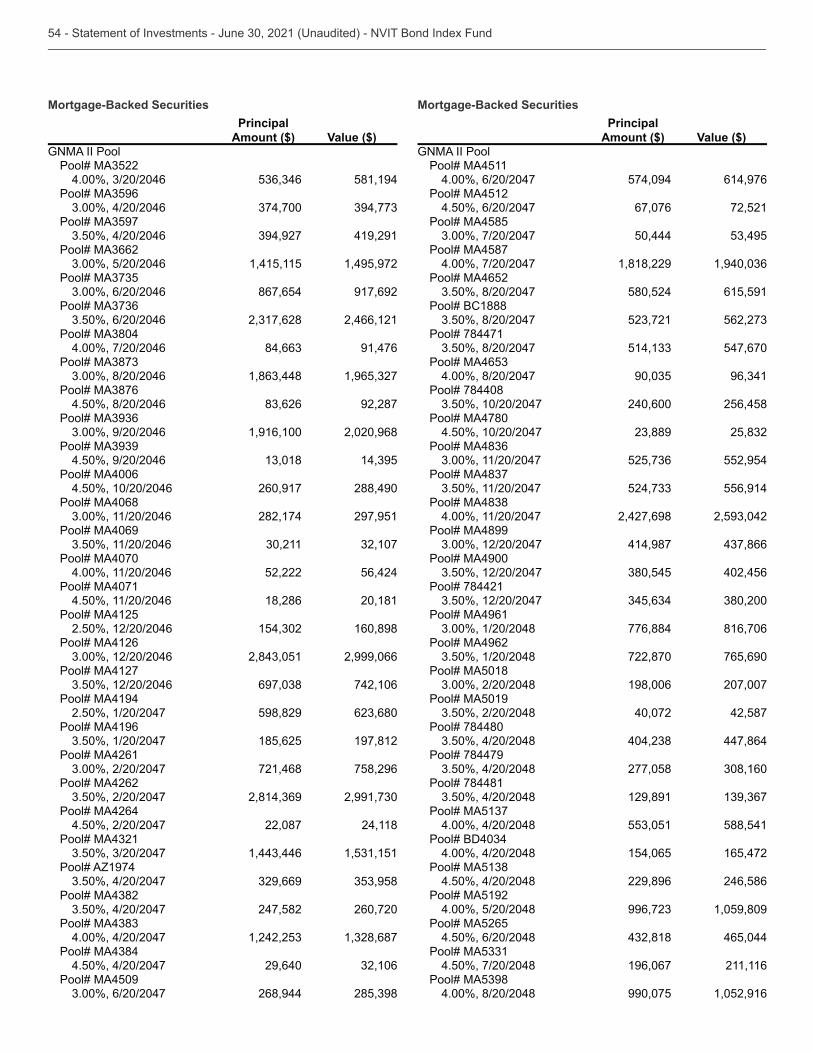
Principal
Amount ($) Value ($)GNMA II Pool
581,194
419,291
1,415,115 1,495,972
867,654 917,692
2,466,121
4.00%, 7/20/2046 91,476
4.50%, 8/20/2046 92,287
1,916,100 2,020,968
4.50%, 9/20/2046 Pool# MA4006
4.50%, 10/20/2046 260,917 288,490Pool# MA4068
282,174 297,951Pool# MA4069
Pool# MA4070
4.00%, 11/20/2046 52,222 56,424Pool# MA4071
4.50%, 11/20/2046 18,286 20,181Pool# MA4125
2.50%, 12/20/2046 160,898Pool# MA4126
2,999,066Pool# MA4127
742,106Pool# MA4194
2.50%, 1/20/2047 598,829 Pool# MA4196
185,625 197,812Pool# MA4261
721,468 758,296Pool# MA4262
Pool# MA4264
4.50%, 2/20/2047 22,087 24,118
Pool# AZ1974
247,582 260,720
4.00%, 4/20/2047
4.50%, 4/20/2047 29,640 Pool# MA4509
268,944
Principal
Amount ($) Value ($)GNMA II Pool
Pool# MA45114.00%, 6/20/2047 574,094 614,976
Pool# MA45124.50%, 6/20/2047 67,076 72,521
Pool# MA4585 50,444
Pool# MA45874.00%, 7/20/2047 1,818,229
Pool# MA4652 580,524 615,591
Pool# BC1888
Pool# 784471 547,670
4.00%, 8/20/2047 Pool# 784408
240,600 256,458Pool# MA4780
4.50%, 10/20/2047
552,954
556,914
4.00%, 11/20/2047 2,427,698 Pool# MA4899
414,987 Pool# MA4900
402,456Pool# 784421
Pool# MA4961
776,884 816,706Pool# MA4962
722,870 765,690Pool# MA5018
198,006 207,007Pool# MA5019
40,072 42,587Pool# 784480
447,864Pool# 784479
277,058 Pool# 784481
129,891
4.00%, 4/20/2048 588,541
4.00%, 4/20/2048 154,065 165,472
4.50%, 4/20/2048 229,896 246,586Pool# MA5192
4.00%, 5/20/2048 1,059,809Pool# MA5265
4.50%, 6/20/2048 465,044
4.50%, 7/20/2048 196,067 211,116
4.00%, 8/20/2048 990,075 1,052,916
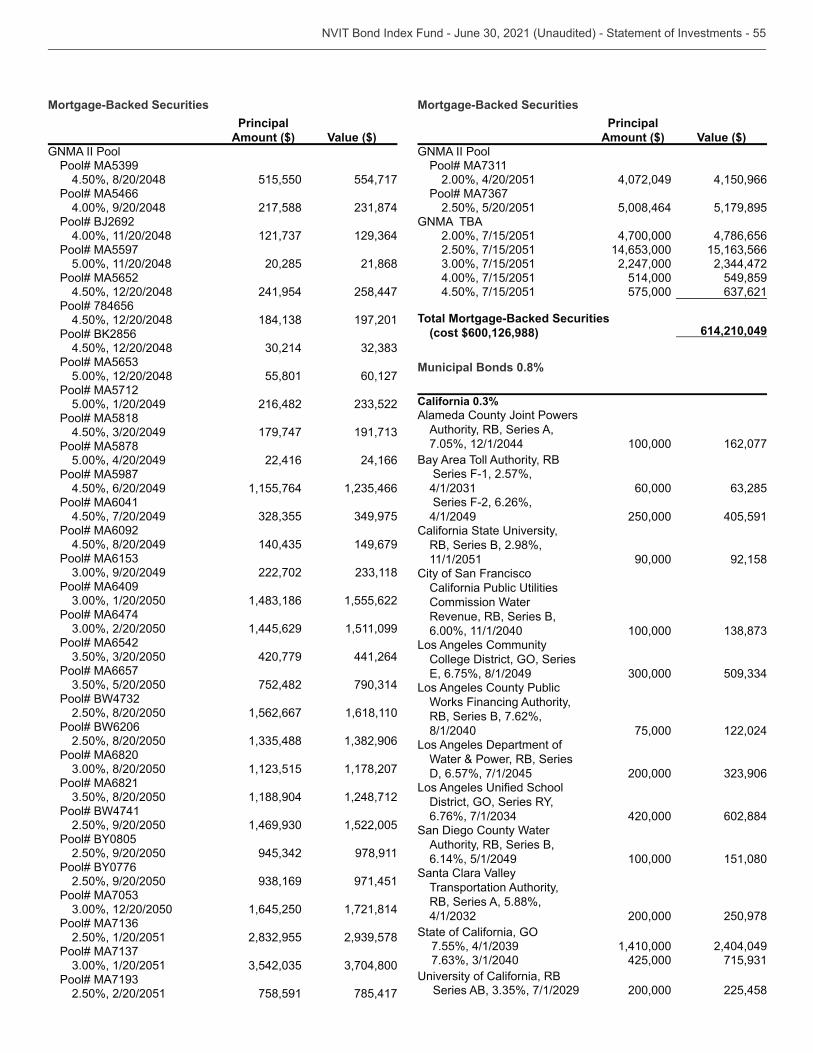
Principal
Amount ($) Value ($)GNMA II Pool
4.50%, 8/20/2048 515,550 554,717Pool# MA5466
4.00%, 9/20/2048 217,588 Pool# BJ2692
4.00%, 11/20/2048 Pool# MA5597
5.00%, 11/20/2048 20,285 21,868Pool# MA5652
4.50%, 12/20/2048 241,954 258,447Pool# 784656
4.50%, 12/20/2048 197,201
4.50%, 12/20/2048
5.00%, 12/20/2048 55,801 60,127Pool# MA5712
5.00%, 1/20/2049 216,482 Pool# MA5818
179,747 Pool# MA5878
5.00%, 4/20/2049 22,416 24,166Pool# MA5987
4.50%, 6/20/2049 1,155,764 Pool# MA6041
4.50%, 7/20/2049 Pool# MA6092
4.50%, 8/20/2049 149,679
222,702 Pool# MA6409
1,555,622Pool# MA6474
1,445,629 1,511,099Pool# MA6542
420,779 441,264Pool# MA6657
752,482
2.50%, 8/20/2050 1,562,667 1,618,110Pool# BW6206
2.50%, 8/20/2050 Pool# MA6820
1,178,207Pool# MA6821
1,188,904 1,248,712Pool# BW4741
2.50%, 9/20/2050 1,522,005
2.50%, 9/20/2050 978,911
2.50%, 9/20/2050 971,451
1,645,250 1,721,814
2.50%, 1/20/2051
2.50%, 2/20/2051 758,591 785,417
Principal
Amount ($) Value ($)GNMA II Pool
2.00%, 4/20/2051 4,072,049 4,150,966
2.50%, 5/20/2051 5,008,464 5,179,895GNMA TBA
2.00%, 7/15/2051 4,700,000 4,786,6562.50%, 7/15/2051
2,247,000 4.00%, 7/15/2051 514,000 549,8594.50%, 7/15/2051 575,000
(cost $600,126,988) 614,210,049
Municipal Bonds 0.8%
California 0.3% Alameda County Joint Powers
Authority, RB, Series A, 7.05%, 12/1/2044 100,000 162,077
Bay Area Toll Authority, RB Series F-1, 2.57%,
60,000 Series F-2, 6.26%, 4/1/2049 250,000 405,591
RB, Series B, 2.98%, 11/1/2051 90,000 92,158
City of San Francisco
Commission Water Revenue, RB, Series B, 6.00%, 11/1/2040 100,000
Los Angeles Community
Los Angeles County Public
Works Financing Authority, RB, Series B, 7.62%, 8/1/2040 75,000 122,024
Los Angeles Department of Water & Power, RB, Series D, 6.57%, 7/1/2045 200,000
420,000 602,884San Diego County Water
Authority, RB, Series B, 6.14%, 5/1/2049 100,000 151,080
Santa Clara Valley Transportation Authority, RB, Series A, 5.88%,
200,000 250,978
1,410,000 2,404,049 425,000
200,000 225,458
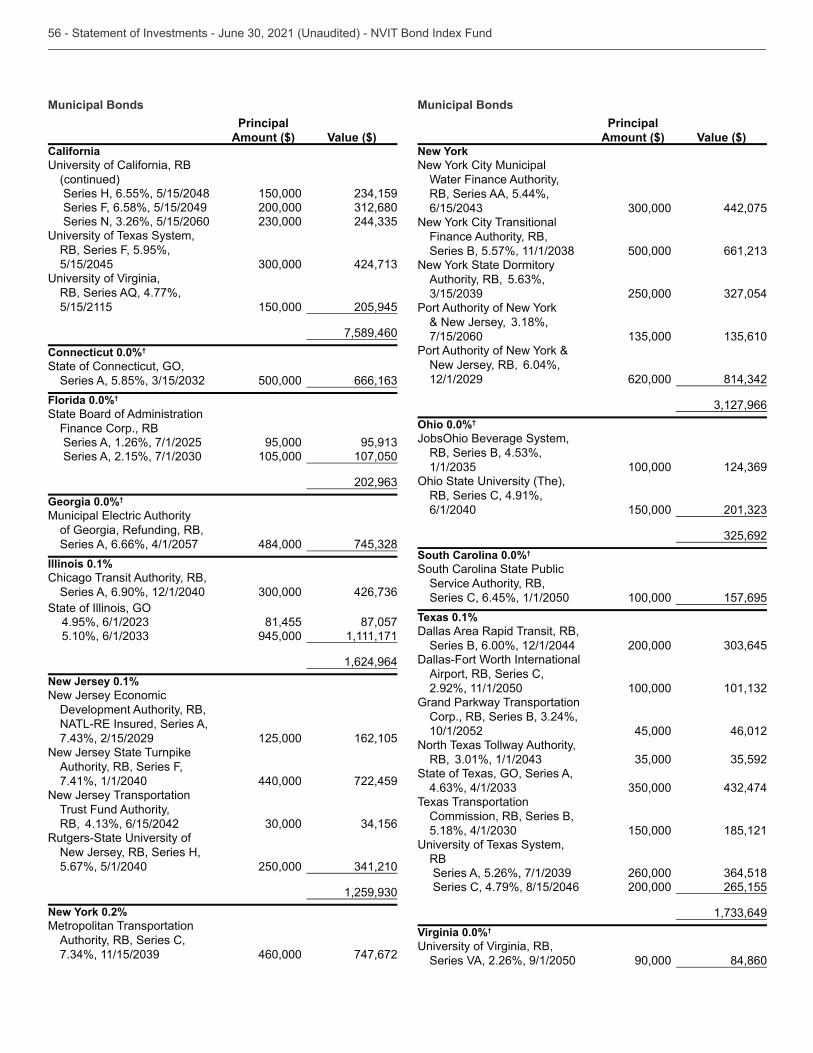
Municipal Bonds
Principal
Amount ($) Value ($)California
(continued)
Series H, 6.55%, 5/15/2048 150,000 Series F, 6.58%, 5/15/2049 200,000
RB, Series F, 5.95%, 5/15/2045
RB, Series AQ, 4.77%, 5/15/2115 150,000 205,945
7,589,460Connecticut 0.0%†
500,000 Florida 0.0%† State Board of Administration
Finance Corp., RB Series A, 1.26%, 7/1/2025 95,000
105,000 107,050
Georgia 0.0%†
of Georgia, Refunding, RB, Series A, 6.66%, 4/1/2057 484,000
Illinois 0.1% Chicago Transit Authority, RB,
Series A, 6.90%, 12/1/2040
81,455 87,057 945,000 1,111,171
1,624,964New Jersey 0.1%
Development Authority, RB,
125,000 162,105New Jersey State Turnpike
Authority, RB, Series F, 7.41%, 1/1/2040 440,000 722,459
New Jersey Transportation Trust Fund Authority, RB,
New Jersey, RB, Series H, 5.67%, 5/1/2040 250,000
New York 0.2% Metropolitan Transportation
Authority, RB, Series C, 460,000 747,672
Municipal Bonds
Principal
Amount ($) Value ($)New York
Water Finance Authority, RB, Series AA, 5.44%,
442,075
Finance Authority, RB, 500,000
Authority, RB,
250,000
& New Jersey,
7/15/2060
New Jersey, RB, 6.04%, 12/1/2029 620,000
Ohio 0.0%†
100,000
RB, Series C, 4.91%, 6/1/2040 150,000
South Carolina 0.0%† South Carolina State Public
Service Authority, RB, Series C, 6.45%, 1/1/2050 100,000 157,695
Texas 0.1% Dallas Area Rapid Transit, RB,
Series B, 6.00%, 12/1/2044 200,000 Dallas-Fort Worth International
Airport, RB, Series C, 2.92%, 11/1/2050 100,000
Grand Parkway Transportation
10/1/2052 45,000 46,012North Texas Tollway Authority,
RB,
Texas Transportation
Commission, RB, Series B, 150,000 185,121
RB 260,000
Series C, 4.79%, 8/15/2046 200,000 265,155
Virginia 0.0%†
Series VA, 2.26%, 9/1/2050 90,000 84,860
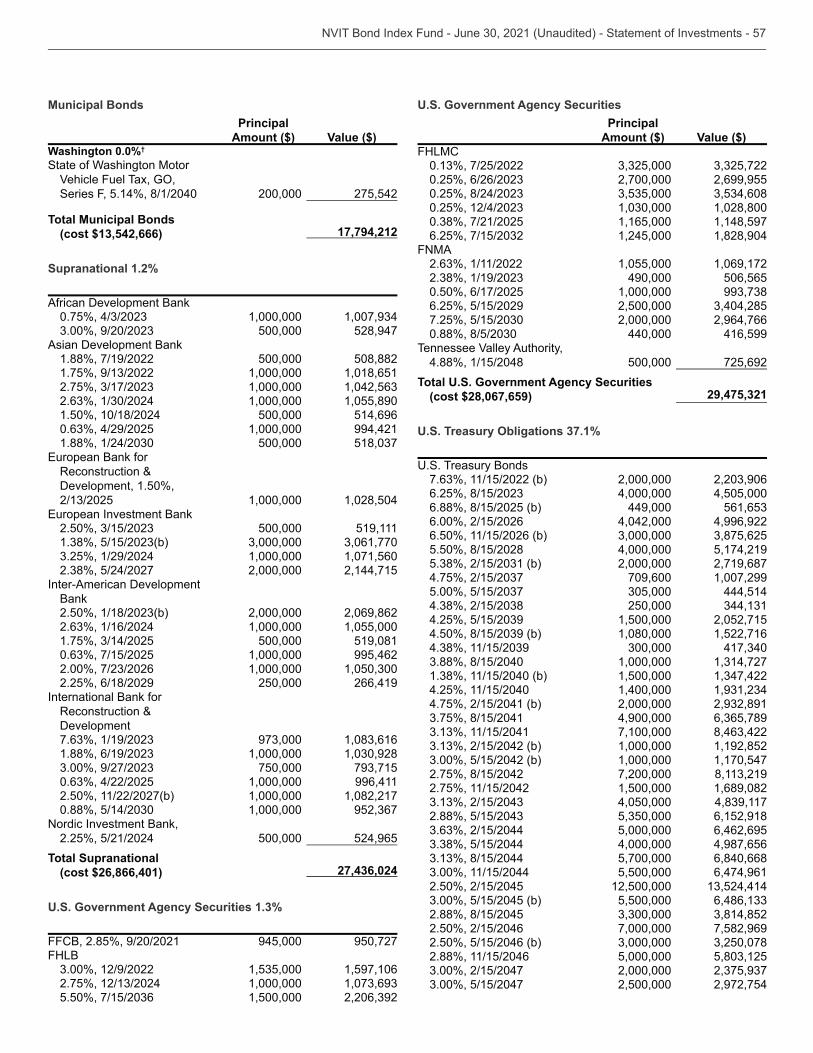
Municipal Bonds
Principal
Amount ($) Value ($)Washington 0.0%† State of Washington Motor
Series F, 5.14%, 8/1/2040 200,000 275,542
Total Municipal Bonds (cost $13,542,666) 17,794,212
Supranational 1.2%
African Development Bank 1,000,000 500,000 528,947
Asian Development Bank1.88%, 7/19/2022 500,000 508,882
1,000,000 1,018,651 1,000,000 1,000,000 1,055,890
1.50%, 10/18/2024 500,000 514,696 1,000,000 994,421 500,000
Reconstruction & Development, 1.50%,
1,000,000 1,028,504
500,000 519,111 1,000,000 1,071,560 2,000,000 2,144,715
Inter-American Development Bank
2,000,000 2,069,862 1,000,000 1,055,000 500,000 519,081 1,000,000 995,462 1,000,000
2.25%, 6/18/2029 250,000 266,419International Bank for
Reconstruction & Development
1,000,000 750,000 1,000,000 996,411
2.50%, 11/22/2027(b) 1,000,000 1,082,217 1,000,000
Nordic Investment Bank, 2.25%, 5/21/2024 500,000 524,965
Total Supranational (cost $26,866,401) 27,436,024
U.S. Government Agency Securities 1.3%
FFCB, 2.85%, 9/20/2021 945,000 950,727FHLB
1,597,106 1,000,000 1,500,000
U.S. Government Agency Securities
Principal
Amount ($) Value ($)FHLMC
2,700,000 2,699,955 1,028,800 1,165,000 1,148,597 1,245,000 1,828,904
FNMA 1,055,000 1,069,172 490,000 506,565
0.50%, 6/17/2025 1,000,000 6.25%, 5/15/2029 2,500,000
2,000,000 2,964,766 440,000 416,599
Tennessee Valley Authority, 4.88%, 1/15/2048 500,000 725,692
Total U.S. Government Agency Securities (cost $28,067,659) 29,475,321
U.S. Treasury Obligations 37.1%
2,000,000 4,000,000 4,505,000
6.88%, 8/15/2025 (b) 449,000 6.00%, 2/15/2026 4,042,000 4,996,9226.50%, 11/15/2026 (b) 5.50%, 8/15/2028 4,000,000 5,174,219
2,000,000 2,719,687 709,600 1,007,299 444,514 250,000 1,500,000 2,052,715 1,080,000 1,522,716 1,000,000 1,500,000
4.25%, 11/15/2040 1,400,000 4.75%, 2/15/2041 (b) 2,000,000
4,900,000 7,100,000 1,000,000 1,192,852 1,000,000 1,170,547
2.75%, 8/15/2042 7,200,000 2.75%, 11/15/2042 1,500,000 1,689,082
4,050,000 6,152,918 5,000,000 6,462,695 4,000,000 4,987,656 5,700,000 6,840,668 5,500,000 6,474,961
2.50%, 2/15/2045 12,500,000 5,500,000
2.88%, 8/15/2045 2.50%, 2/15/2046 7,000,000 7,582,9692.50%, 5/15/2046 (b) 2.88%, 11/15/2046 5,000,000
2,000,000 2,500,000 2,972,754

U.S. Treasury Obligations
Principal
Amount ($) Value ($)
2.75%, 8/15/2047 2,500,000 2.75%, 11/15/2047 4,200,000 4,781,109
5,000,000 5,960,156 5,500,000
2.88%, 5/15/2049 5,000,000 2.25%, 8/15/2049
800,000 851,8752.00%, 2/15/2050 500,000 491,2111.25%, 5/15/2050 (b) 1,700,000
5,000,000 6,800,000 6,107,250
1.88%, 2/15/2051 (b) 4,400,000 4,199,250
1.75%, 5/15/2022 (b) 1,000,000 4,000,000 4,060,625
1.50%, 8/15/2022 18,000,000 18,279,141 20,500,000 20,912,402 6,000,000 5,000,000 15,000,000 8,500,000 8,719,805 10,000,000 10,290,625 7,600,000 7,786,141 6,000,000 7,000,000 7,150,664 5,000,000 5,201,758 5,000,000 5,000,000 5,229,492 2,000,000 1,996,250 1,000,000 1,028,125 2,000,000 2,052,812 5,000,000 5,296,875 1,500,000 1,586,074 1,500,000 8,000,000 8,452,812 5,500,000 5,766,621 9,000,000
2.75%, 2/15/2024 2,500,000 2,654,980 7,000,000
2.50%, 5/15/2024 (b) 7,000,000 7,414,805 6,000,000 6,500,000 25,782,788 14,000,000 9,000,000 9,466,172 5,000,000
2.25%, 11/15/2024 7,550,000 7,981,176 4,002,469 5,000,000 5,291,016
2.00%, 2/15/2025 (b) 18,700,000
U.S. Treasury Obligations
Principal
Amount ($) Value ($)
7,500,000 15,000,000 14,716,406 6,500,000 7,066,719
2.00%, 8/15/2025 (b) 6,000,000 4,000,000 4,000,000 8,000,000 8,000,000 7,821,562
2.25%, 11/15/2025 8,500,000 15,200,000 14,926,281 10,000,000 9,810,547 8,000,000 8,500,000 8,810,781
0.50%, 2/28/2026 (b) 2,000,000 1,969,687 4,000,000 2,000,000 2,982,891 6,000,000 5,997,188
1.50%, 8/15/2026 9,700,000 9,987,969 4,500,000 4,606,699 10,000,000 8,000,000
2.25%, 2/15/2027 1,200,000 1,282,547 5,700,000 1,000,000 968,125
2.25%, 8/15/2027 8,876,461 8,000,000
2.25%, 11/15/2027 5,765,616 8,500,000 4,000,000
2.75%, 2/15/2028 (b) 10,000,000 2,991,094 1,500,000 1,505,918 5,000,000 5,015,625
2.88%, 5/15/2028 10,000,000 11,108,594 4,000,000 4,006,250
2.88%, 8/15/2028 11,500,000 12,789,707 7,000,000 8,772,000 9,619,046 5,700,000 6,150,879
1.75%, 11/15/2029 (b) 4,000,000 4,128,750 4,800,000 4,486,687 7,000,000 6,521,484 11,600,000 8,500,000 8,251,641 4,500,000 4,568,906
Total U.S. Treasury Obligations (cost $806,057,567) 841,721,848
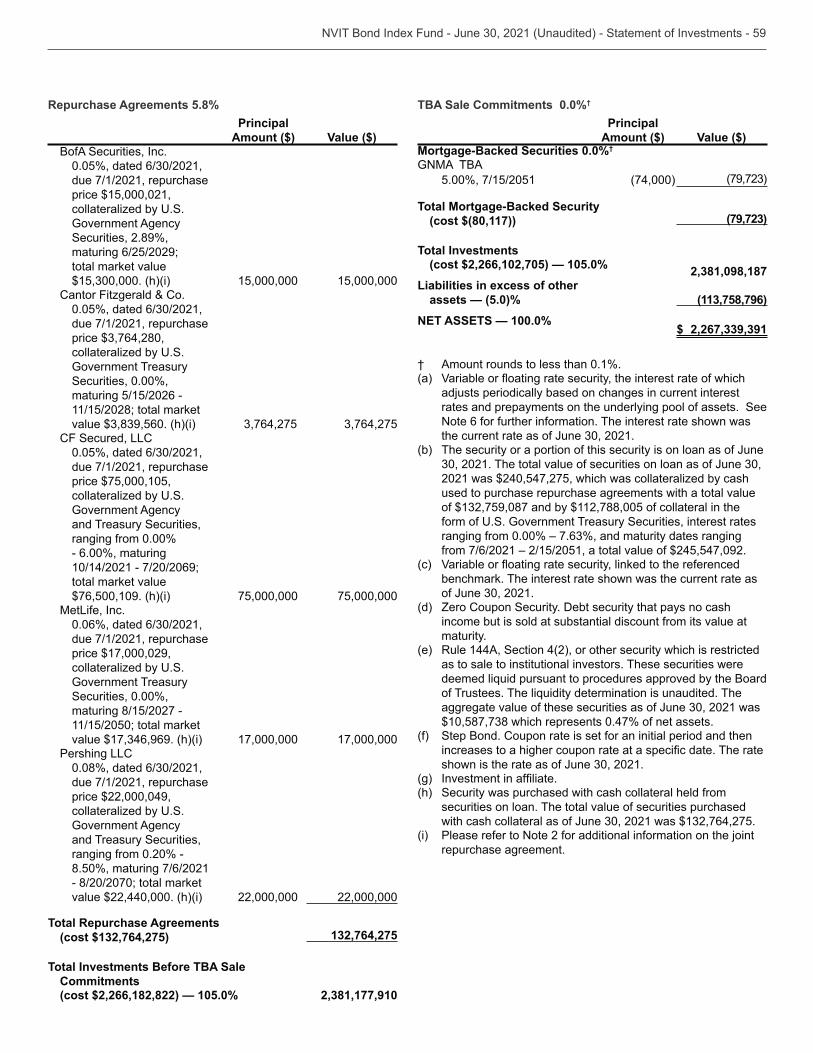
Repurchase Agreements 5.8%Principal
Amount ($) Value ($)BofA Securities, Inc.
due 7/1/2021, repurchase price $15,000,021,
Government Agency Securities, 2.89%, maturing 6/25/2029; total market value
15,000,000 15,000,000Cantor Fitzgerald & Co.
due 7/1/2021, repurchase
Government Treasury Securities, 0.00%, maturing 5/15/2026 - 11/15/2028; total market
CF Secured, LLC
due 7/1/2021, repurchase price $75,000,105,
Government Agency and Treasury Securities, ranging from 0.00% - 6.00%, maturing 10/14/2021 - 7/20/2069; total market value $76,500,109. (h)(i) 75,000,000 75,000,000
MetLife, Inc.
due 7/1/2021, repurchase price $17,000,029,
Government Treasury Securities, 0.00%, maturing 8/15/2027 - 11/15/2050; total market
17,000,000 17,000,000Pershing LLC
due 7/1/2021, repurchase price $22,000,049,
Government Agency and Treasury Securities, ranging from 0.20% - 8.50%, maturing 7/6/2021 - 8/20/2070; total market value $22,440,000. (h)(i) 22,000,000 22,000,000
Total Repurchase Agreements (cost $132,764,275) 132,764,275
Total Investments Before TBA Sale Commitments(cost $2,266,182,822) — 105.0% 2,381,177,910
TBA Sale Commitments 0.0%†
Principal Amount ($) Value ($)
0.0%†
GNMA TBA5.00%, 7/15/2051 (74,000)
(cost $(80,117)) (79,723)
Total Investments(cost $2,266,102,705) — 105.0% 2,381,098,187
Liabilities in excess of other assets — (5.0)% (113,758,796)
NET ASSETS — 100.0% $ 2,267,339,391
† Amount rounds to less than 0.1%.(a)
adjusts periodically based on changes in current interest rates and prepayments on the underlying pool of assets. See Note 6 for further information. The interest rate shown was
(b) The security or a portion of this security is on loan as of June
2021 was $240,547,275, which was collateralized by cash used to purchase repurchase agreements with a total value
from 7/6/2021 – 2/15/2051, a total value of $245,547,092.(c)
benchmark. The interest rate shown was the current rate as
(d) Zero Coupon Security. Debt security that pays no cash income but is sold at substantial discount from its value at maturity.
(e) Rule 144A, Section 4(2), or other security which is restricted as to sale to institutional investors. These securities were
(f) Step Bond. Coupon rate is set for an initial period and then
(g)(h) Security was purchased with cash collateral held from
securities on loan. The total value of securities purchased
(i) Please refer to Note 2 for additional information on the joint repurchase agreement.
FFCB Federal Farm Credit BankFHLB Federal Home Loan BankFHLMC Federal Home Loan Mortgage Corp.FNMA Federal National Mortgage AssociationGNMA Government National Mortgage Association
NATL National Public Finance Guarantee Corp.RB Revenue Bond
Reinsured
TBA To Be Announced; Security is subject to delayed delivery
Currency:
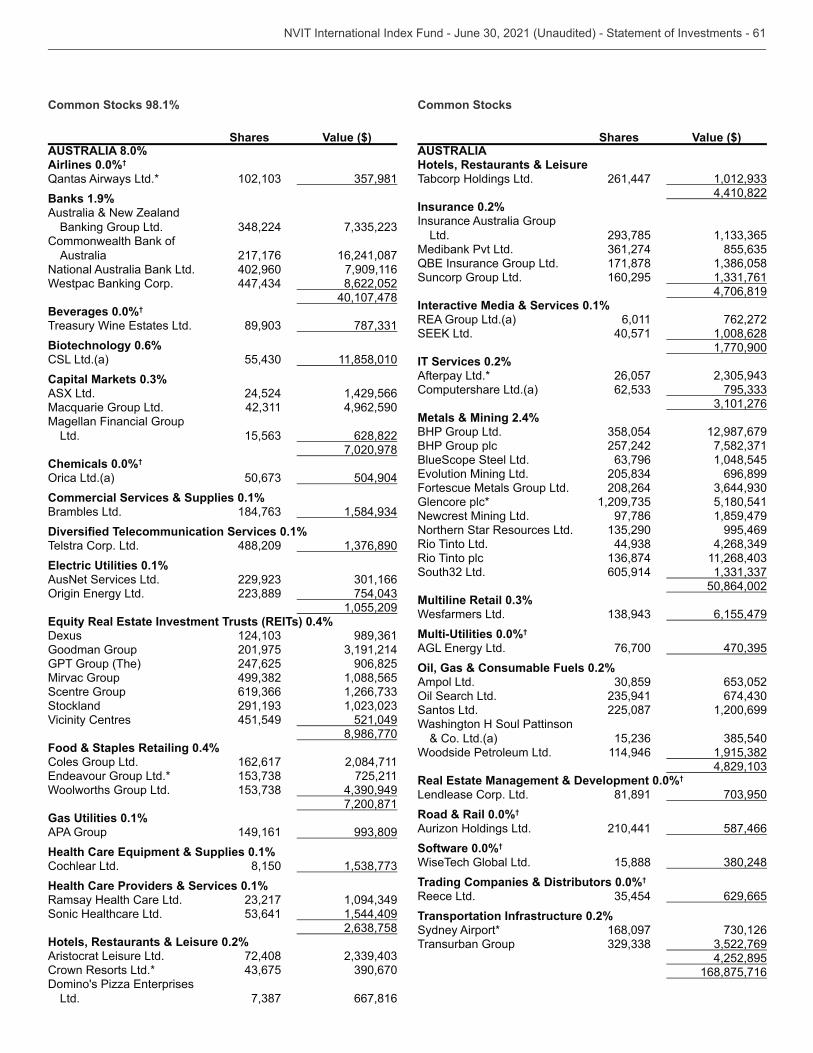
Common Stocks 98.1%
Shares Value ($)AUSTRALIA 8.0%Airlines 0.0%†
Qantas Airways Ltd.* Banks 1.9%Australia & New Zealand
Banking Group Ltd. Commonwealth Bank of
Australia 217,176 16,241,087National Australia Bank Ltd. 402,960 7,909,116Westpac Banking Corp. 8,622,052
40,107,478Beverages 0.0%†
Biotechnology 0.6%CSL Ltd.(a) 11,858,010Capital Markets 0.3%ASX Ltd. 24,524 1,429,566
4,962,590Magellan Financial Group
Ltd. 628,822 7,020,978
Chemicals 0.0%†
504,904Commercial Services & Supplies 0.1%Brambles Ltd.
0.1%Telstra Corp. Ltd. 488,209 Electric Utilities 0.1%AusNet Services Ltd.
1,055,209
Equity Real Estate Investment Trusts (REITs) 0.4%Dexus Goodman Group 201,975 GPT Group (The) 247,625 906,825Mirvac Group 1,088,565Scentre Group Stockland Vicinity Centres 451,549 521,049
8,986,770Food & Staples Retailing 0.4%Coles Group Ltd. 162,617 2,084,711
725,211Woolworths Group Ltd.
7,200,871Gas Utilities 0.1%APA Group 149,161 Health Care Equipment & Supplies 0.1%Cochlear Ltd. 8,150 Health Care Providers & Services 0.1%Ramsay Health Care Ltd. Sonic Healthcare Ltd. 1,544,409
Hotels, Restaurants & Leisure 0.2%Aristocrat Leisure Ltd. 72,408 Crown Resorts Ltd.*
Ltd. 667,816
Common Stocks
Shares Value ($)AUSTRALIAHotels, Restaurants & LeisureTabcorp Holdings Ltd. 261,447
4,410,822Insurance 0.2%Insurance Australia Group
Ltd. Medibank Pvt Ltd.
171,878 Suncorp Group Ltd. 160,295
4,706,819Interactive Media & Services 0.1%
6,011 762,272 40,571 1,008,628
1,770,900IT Services 0.2%Afterpay Ltd.* 26,057 Computershare Ltd.(a)
Metals & Mining 2.4%BHP Group Ltd. 12,987,679BHP Group plc 257,242 BlueScope Steel Ltd. 1,048,545
696,899Fortescue Metals Group Ltd. 208,264 Glencore plc* 5,180,541Newcrest Mining Ltd. 97,786 1,859,479Northern Star Resources Ltd. 995,469Rio Tinto Ltd. Rio Tinto plc
605,914 50,864,002
Multiline Retail 0.3%Wesfarmers Ltd. 6,155,479
0.0%†
76,700 Oil, Gas & Consumable Fuels 0.2%Ampol Ltd.
Santos Ltd. 225,087 1,200,699Washington H Soul Pattinson
& Co. Ltd.(a) Woodside Petroleum Ltd. 114,946
Real Estate Management & Development 0.0%†
Lendlease Corp. Ltd. 81,891 Road & Rail 0.0%†
Aurizon Holdings Ltd. 210,441 587,466Software 0.0%†
WiseTech Global Ltd. 15,888 Trading Companies & Distributors 0.0%†
Reece Ltd. 629,665Transportation Infrastructure 0.2%Sydney Airport* 168,097 Transurban Group
4,252,895 168,875,716
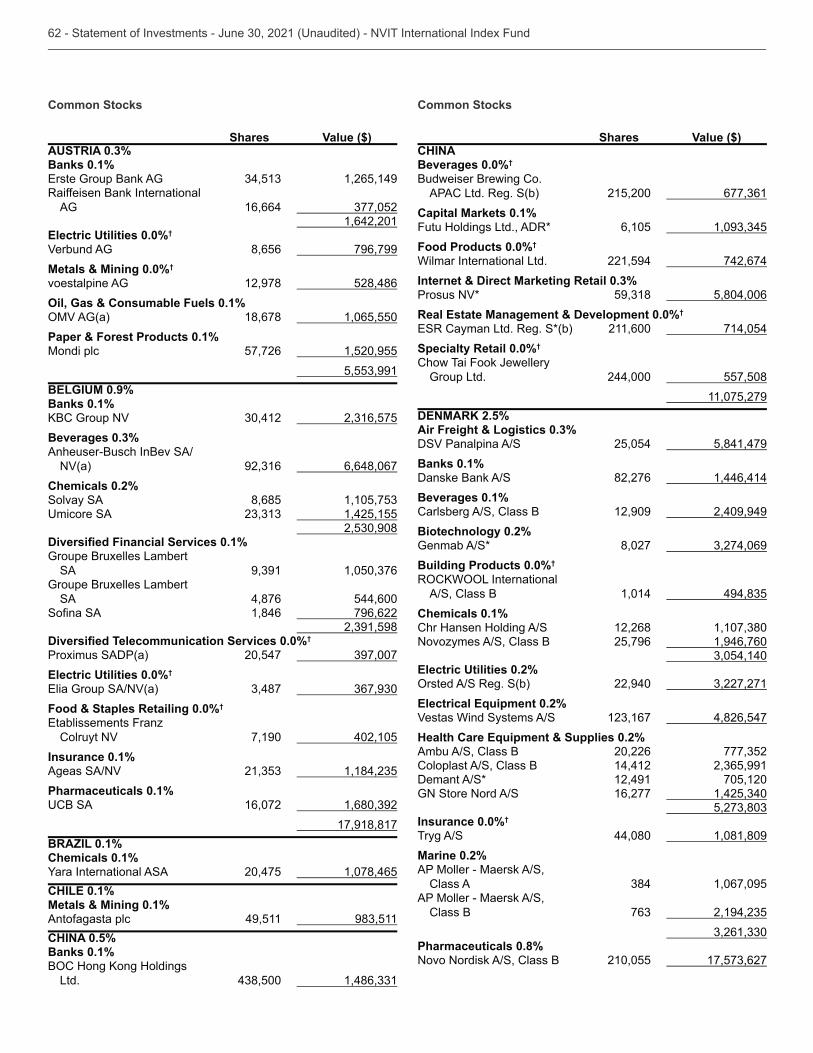
Common Stocks
Shares Value ($)AUSTRIA 0.3%Banks 0.1%
1,265,149Raiffeisen Bank International
AG 16,664 1,642,201
Electric Utilities 0.0%†
Verbund AG 8,656 796,799Metals & Mining 0.0%†
voestalpine AG 12,978 528,486Oil, Gas & Consumable Fuels 0.1%
18,678 1,065,550Paper & Forest Products 0.1%Mondi plc 57,726 1,520,955
BELGIUM 0.9%Banks 0.1%
Beverages 0.3%Anheuser-Busch InBev SA/
NV(a) 6,648,067Chemicals 0.2%Solvay SA 8,685
1,425,155
0.1%Groupe Bruxelles Lambert
SA Groupe Bruxelles Lambert
SA 4,876 544,600 1,846 796,622
0.0%†
Proximus SADP(a) 20,547 Electric Utilities 0.0%†
Food & Staples Retailing 0.0%†
Colruyt NV 7,190 402,105Insurance 0.1%Ageas SA/NV Pharmaceuticals 0.1%
16,072 17,918,817
BRAZIL 0.1%Chemicals 0.1%
20,475 1,078,465CHILE 0.1%Metals & Mining 0.1%Antofagasta plc 49,511 CHINA 0.5%Banks 0.1%
Ltd.
Common Stocks
Shares Value ($)CHINABeverages 0.0%†
Budweiser Brewing Co. APAC Ltd. Reg. S(b) 215,200
Capital Markets 0.1%Futu Holdings Ltd., ADR* 6,105 Food Products 0.0%†
Wilmar International Ltd. 221,594 742,674Internet & Direct Marketing Retail 0.3%Prosus NV* 5,804,006Real Estate Management & Development 0.0%†
211,600 714,054Specialty Retail 0.0%†
Chow Tai Fook Jewellery Group Ltd. 244,000 557,508
11,075,279DENMARK 2.5%Air Freight & Logistics 0.3%DSV Panalpina A/S 25,054 5,841,479Banks 0.1%Danske Bank A/S 82,276 1,446,414Beverages 0.1%Carlsberg A/S, Class B 12,909 2,409,949Biotechnology 0.2%Genmab A/S* 8,027 Building Products 0.0%†
A/S, Class B 1,014 Chemicals 0.1%Chr Hansen Holding A/S 12,268 Novozymes A/S, Class B 25,796 1,946,760
Electric Utilities 0.2%
22,940 Electrical Equipment 0.2%Vestas Wind Systems A/S 4,826,547Health Care Equipment & Supplies 0.2%Ambu A/S, Class B 20,226 Coloplast A/S, Class B 14,412 Demant A/S* 12,491 705,120GN Store Nord A/S 16,277
Insurance 0.0%†
Tryg A/S 44,080 1,081,809Marine 0.2%AP Moller - Maersk A/S,
Class A 1,067,095AP Moller - Maersk A/S,
Class B
Pharmaceuticals 0.8%Novo Nordisk A/S, Class B 210,055
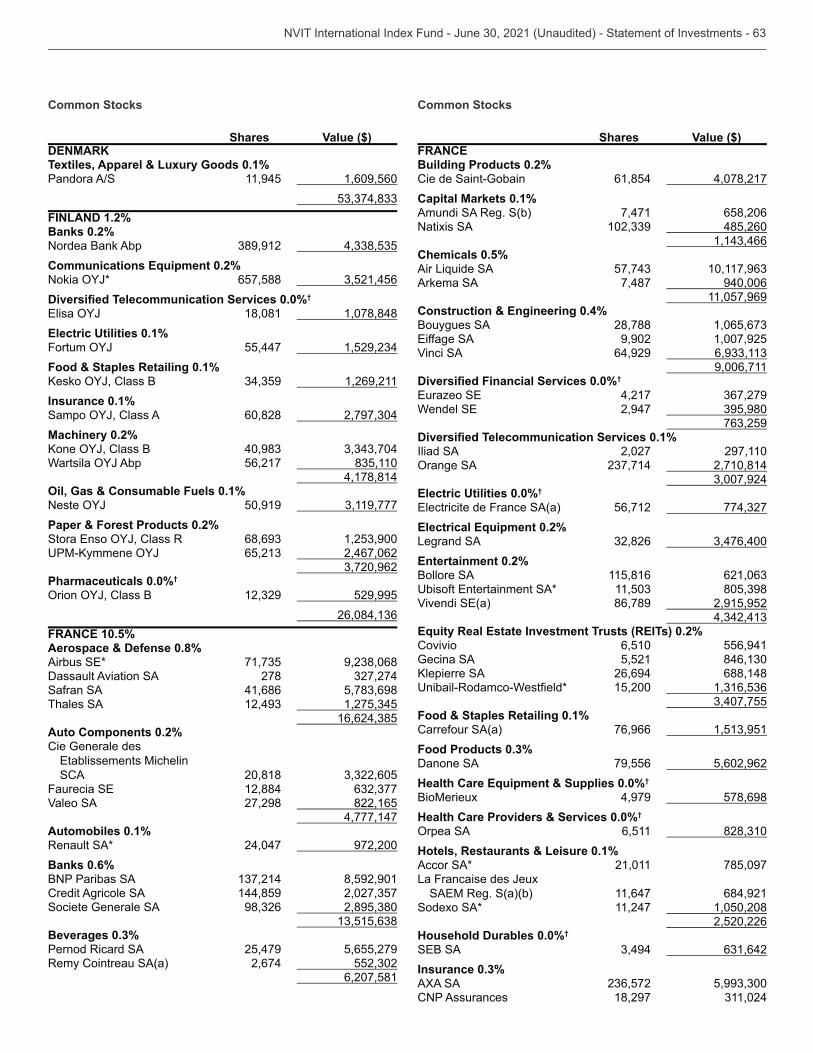
Common Stocks
Shares Value ($)DENMARKTextiles, Apparel & Luxury Goods 0.1%Pandora A/S 11,945 1,609,560
FINLAND 1.2%Banks 0.2%Nordea Bank Abp Communications Equipment 0.2%
657,588 0.0%†
18,081 1,078,848Electric Utilities 0.1%
55,447 Food & Staples Retailing 0.1%
1,269,211Insurance 0.1%
60,828 Machinery 0.2%
56,217
4,178,814Oil, Gas & Consumable Fuels 0.1%
50,919 Paper & Forest Products 0.2%
2,467,062
Pharmaceuticals 0.0%†
529,995
FRANCE 10.5%Aerospace & Defense 0.8%
Dassault Aviation SA 278 Safran SA 41,686 Thales SA
Auto Components 0.2%Cie Generale des
SCA 20,818 12,884
Valeo SA 27,298 822,165 4,777,147
Automobiles 0.1%Renault SA* 24,047 972,200Banks 0.6%BNP Paribas SA 8,592,901Credit Agricole SA 144,859 Societe Generale SA
Beverages 0.3%Pernod Ricard SA 25,479 5,655,279Remy Cointreau SA(a) 2,674
6,207,581
Common Stocks
Shares Value ($)FRANCEBuilding Products 0.2%Cie de Saint-Gobain 61,854 4,078,217Capital Markets 0.1%Amundi SA Reg. S(b) 7,471 658,206Natixis SA 485,260
Chemicals 0.5%
Arkema SA 7,487 940,006
11,057,969Construction & Engineering 0.4%Bouygues SA 28,788
9,902 1,007,925Vinci SA 64,929
9,006,711 0.0%†
4,217 2,947
0.1%
Iliad SA 2,027 297,110 2,710,814
Electric Utilities 0.0%†
56,712 Electrical Equipment 0.2%Legrand SA Entertainment 0.2%Bollore SA 115,816
86,789 2,915,952
Equity Real Estate Investment Trusts (REITs) 0.2%Covivio 6,510 556,941Gecina SA 5,521
26,694 688,148 15,200
Food & Staples Retailing 0.1%Carrefour SA(a) 76,966 Food Products 0.3%Danone SA 79,556 5,602,962Health Care Equipment & Supplies 0.0%†
BioMerieux 4,979 578,698Health Care Providers & Services 0.0%†
6,511 Hotels, Restaurants & Leisure 0.1%Accor SA* 21,011 785,097La Francaise des Jeux
11,647 684,921Sodexo SA* 11,247 1,050,208
2,520,226Household Durables 0.0%†
Insurance 0.3%AXA SA CNP Assurances 18,297
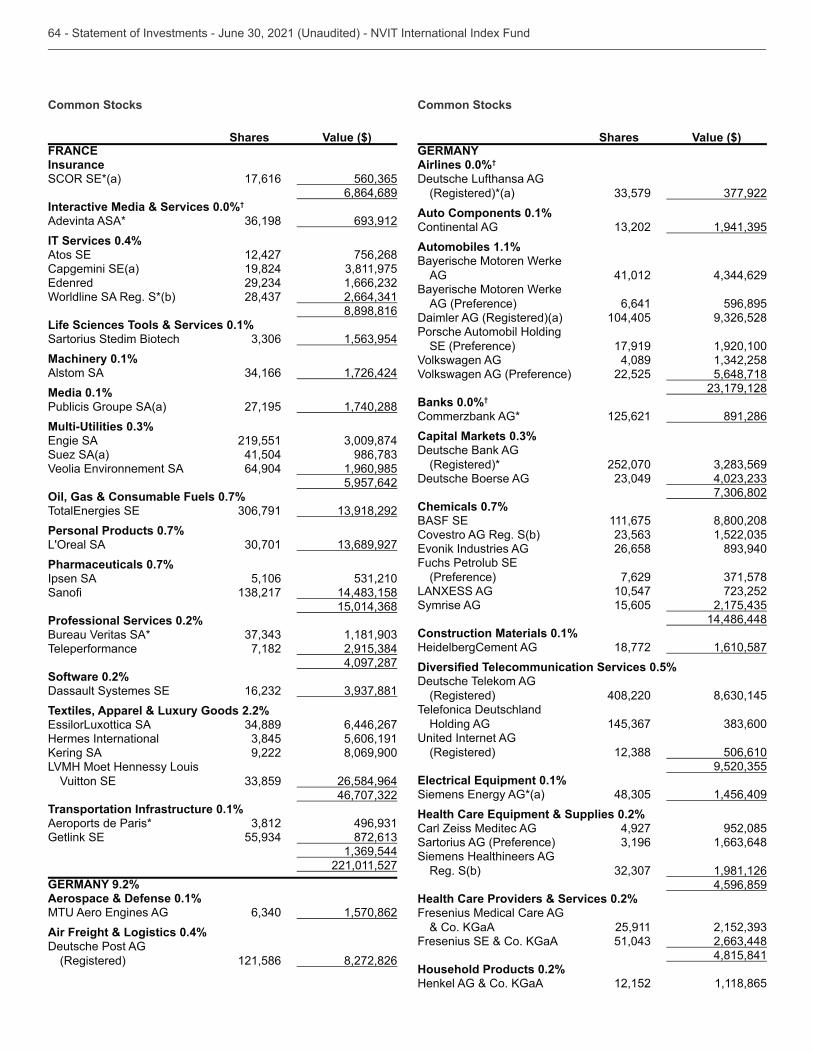
Common Stocks
Shares Value ($)FRANCEInsurance
17,616 6,864,689
Interactive Media & Services 0.0%†
Adevinta ASA* IT Services 0.4%
12,427 756,268 19,824
Worldline SA Reg. S*(b) 8,898,816
Life Sciences Tools & Services 0.1%Sartorius Stedim Biotech Machinery 0.1%Alstom SA 1,726,424Media 0.1%Publicis Groupe SA(a) 27,195 1,740,288
0.3% 219,551
Suez SA(a) 41,504 64,904 1,960,985
5,957,642Oil, Gas & Consumable Fuels 0.7%
Personal Products 0.7%
Pharmaceuticals 0.7%Ipsen SA 5,106
Professional Services 0.2%Bureau Veritas SA* Teleperformance 7,182
4,097,287Software 0.2%
Textiles, Apparel & Luxury Goods 2.2%
6,446,267Hermes International 5,606,191
9,222 8,069,900LVMH Moet Hennessy Louis
26,584,964
Transportation Infrastructure 0.1%Aeroports de Paris*
221,011,527
GERMANY 9.2%Aerospace & Defense 0.1%
1,570,862Air Freight & Logistics 0.4%Deutsche Post AG
(Registered) 121,586 8,272,826
Common Stocks
Shares Value ($)GERMANYAirlines 0.0%†
Deutsche Lufthansa AG (Registered)*(a)
Auto Components 0.1%Continental AG Automobiles 1.1%Bayerische Motoren Werke
AG 41,012 Bayerische Motoren Werke
AG (Preference) 6,641 596,895Daimler AG (Registered)(a) 104,405 Porsche Automobil Holding
17,919 1,920,100Volkswagen AG 4,089 Volkswagen AG (Preference) 22,525 5,648,718
Banks 0.0%†
Commerzbank AG* 125,621 891,286Capital Markets 0.3%Deutsche Bank AG
(Registered)* 252,070 Deutsche Boerse AG
Chemicals 0.7%
111,675 8,800,208Covestro AG Reg. S(b)
26,658
(Preference) 7,629 10,547
Symrise AG 15,605 14,486,448
Construction Materials 0.1%HeidelbergCement AG 18,772 1,610,587
0.5%Deutsche Telekom AG
(Registered) 408,220 Telefonica Deutschland
Holding AG
(Registered) 506,610
Electrical Equipment 0.1% 1,456,409
Health Care Equipment & Supplies 0.2%Carl Zeiss Meditec AG 4,927 952,085Sartorius AG (Preference) Siemens Healthineers AG
Reg. S(b) 1,981,126 4,596,859
Health Care Providers & Services 0.2%Fresenius Medical Care AG
25,911
4,815,841Household Products 0.2%
12,152 1,118,865
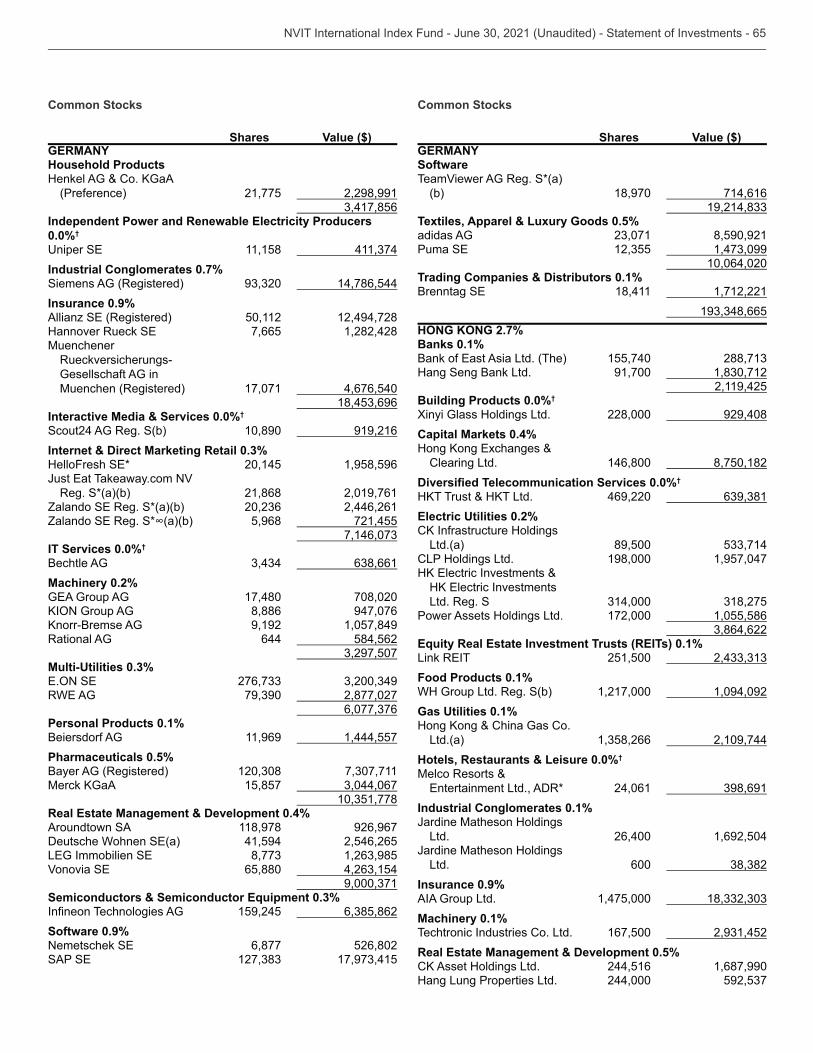
Common Stocks
Shares Value ($)GERMANYHousehold Products
(Preference) 21,775 2,298,991
Independent Power and Renewable Electricity Producers 0.0%†
11,158 Industrial Conglomerates 0.7%Siemens AG (Registered) 14,786,544Insurance 0.9%
50,112 12,494,728 7,665 1,282,428
Muenchener Rueckversicherungs-Gesellschaft AG in Muenchen (Registered) 17,071 4,676,540
Interactive Media & Services 0.0%†
Scout24 AG Reg. S(b) 10,890 919,216Internet & Direct Marketing Retail 0.3%
20,145 1,958,596
Reg. S*(a)(b) 21,868 2,019,761 2,446,261 5,968 721,455
IT Services 0.0%†
Bechtle AG Machinery 0.2%
17,480 708,020 8,886 947,076 9,192 1,057,849
Rational AG 644 584,562
0.3% 2,877,027
Personal Products 0.1%Beiersdorf AG 11,969 1,444,557Pharmaceuticals 0.5%Bayer AG (Registered)
15,857
Real Estate Management & Development 0.4%Aroundtown SA 118,978 926,967
41,594 2,546,265 65,880
Semiconductors & Semiconductor Equipment 0.3%
159,245 Software 0.9%
6,877 526,802
Common Stocks
Shares Value ($)GERMANYSoftwareTeamViewer AG Reg. S*(a)
(b) 18,970 714,616
Textiles, Apparel & Luxury Goods 0.5%adidas AG 8,590,921
10,064,020
Trading Companies & Distributors 0.1% 18,411 1,712,221
HONG KONG 2.7%Banks 0.1%
155,740 Hang Seng Bank Ltd. 91,700
2,119,425Building Products 0.0%†
Xinyi Glass Holdings Ltd. 228,000 929,408Capital Markets 0.4%
Clearing Ltd. 146,800 8,750,182 0.0%†
469,220 Electric Utilities 0.2%
Ltd.(a) 89,500 CLP Holdings Ltd. 198,000 1,957,047
Ltd. Reg. S Power Assets Holdings Ltd. 172,000 1,055,586
Equity Real Estate Investment Trusts (REITs) 0.1%
251,500 Food Products 0.1%WH Group Ltd. Reg. S(b) 1,217,000 1,094,092Gas Utilities 0.1%
Ltd.(a) 2,109,744Hotels, Restaurants & Leisure 0.0%†
Melco Resorts & 24,061
Industrial Conglomerates 0.1%Jardine Matheson Holdings
Ltd. 26,400 1,692,504Jardine Matheson Holdings
Ltd. 600 Insurance 0.9%AIA Group Ltd. 1,475,000 Machinery 0.1%Techtronic Industries Co. Ltd. 167,500 Real Estate Management & Development 0.5%
244,516 1,687,990Hang Lung Properties Ltd. 244,000
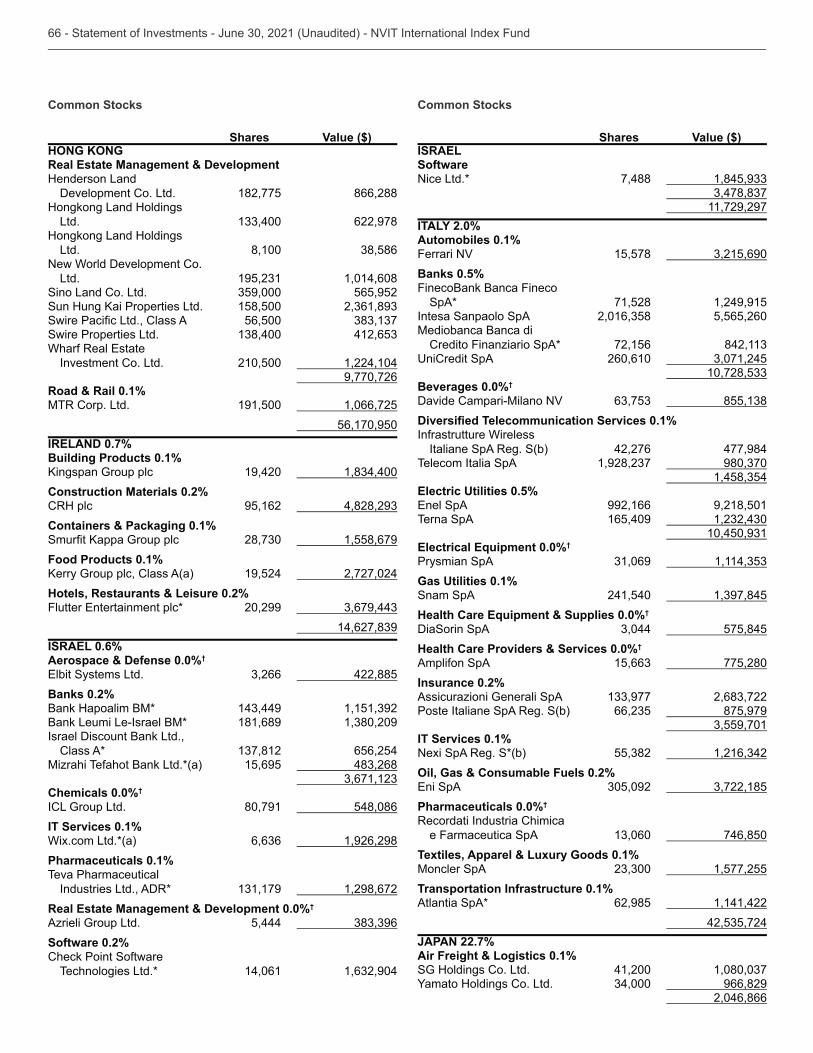
Common Stocks
Shares Value ($)HONG KONGReal Estate Management & DevelopmentHenderson Land
Development Co. Ltd. 182,775 866,288Hongkong Land Holdings
Ltd. 622,978Hongkong Land Holdings
Ltd. 8,100 New World Development Co.
Ltd. 1,014,608Sino Land Co. Ltd. 565,952
158,500 56,500
Swire Properties Ltd.
Investment Co. Ltd. 210,500 1,224,104 9,770,726
Road & Rail 0.1%MTR Corp. Ltd. 191,500 1,066,725
56,170,950IRELAND 0.7%Building Products 0.1%
19,420 Construction Materials 0.2%CRH plc 95,162 Containers & Packaging 0.1%
1,558,679Food Products 0.1%
19,524 2,727,024Hotels, Restaurants & Leisure 0.2%
20,299
ISRAEL 0.6%Aerospace & Defense 0.0%†
422,885Banks 0.2%Bank Hapoalim BM* Bank Leumi Le-Israel BM* 181,689 Israel Discount Bank Ltd.,
Class A* 656,254Mizrahi Tefahot Bank Ltd.*(a) 15,695
Chemicals 0.0%†
ICL Group Ltd. 80,791 548,086IT Services 0.1%Wix.com Ltd.*(a) 1,926,298Pharmaceuticals 0.1%Teva Pharmaceutical
Industries Ltd., ADR* 1,298,672Real Estate Management & Development 0.0%†
Azrieli Group Ltd. 5,444 Software 0.2%Check Point Software
Technologies Ltd.* 14,061
Common Stocks
Shares Value ($)ISRAELSoftwareNice Ltd.* 7,488
11,729,297
ITALY 2.0%Automobiles 0.1%Ferrari NV 15,578 Banks 0.5%FinecoBank Banca Fineco
SpA* 71,528 1,249,915Intesa Sanpaolo SpA 5,565,260Mediobanca Banca di
Credito Finanziario SpA* 72,156 260,610
Beverages 0.0%†
Davide Campari-Milano NV 0.1%
Infrastrutture Wireless Italiane SpA Reg. S(b) 42,276 477,984
Telecom Italia SpA
Electric Utilities 0.5% 992,166 9,218,501
Terna SpA 165,409
Electrical Equipment 0.0%†
Prysmian SpA Gas Utilities 0.1%Snam SpA 241,540 Health Care Equipment & Supplies 0.0%†
DiaSorin SpA 575,845Health Care Providers & Services 0.0%†
Amplifon SpA 775,280Insurance 0.2%Assicurazioni Generali SpA Poste Italiane SpA Reg. S(b) 875,979
IT Services 0.1%Nexi SpA Reg. S*(b) Oil, Gas & Consumable Fuels 0.2%
Pharmaceuticals 0.0%†
Recordati Industria Chimica e Farmaceutica SpA 746,850
Textiles, Apparel & Luxury Goods 0.1%Moncler SpA 1,577,255Transportation Infrastructure 0.1%Atlantia SpA* 62,985 1,141,422
JAPAN 22.7%Air Freight & Logistics 0.1%SG Holdings Co. Ltd. 41,200
966,829 2,046,866
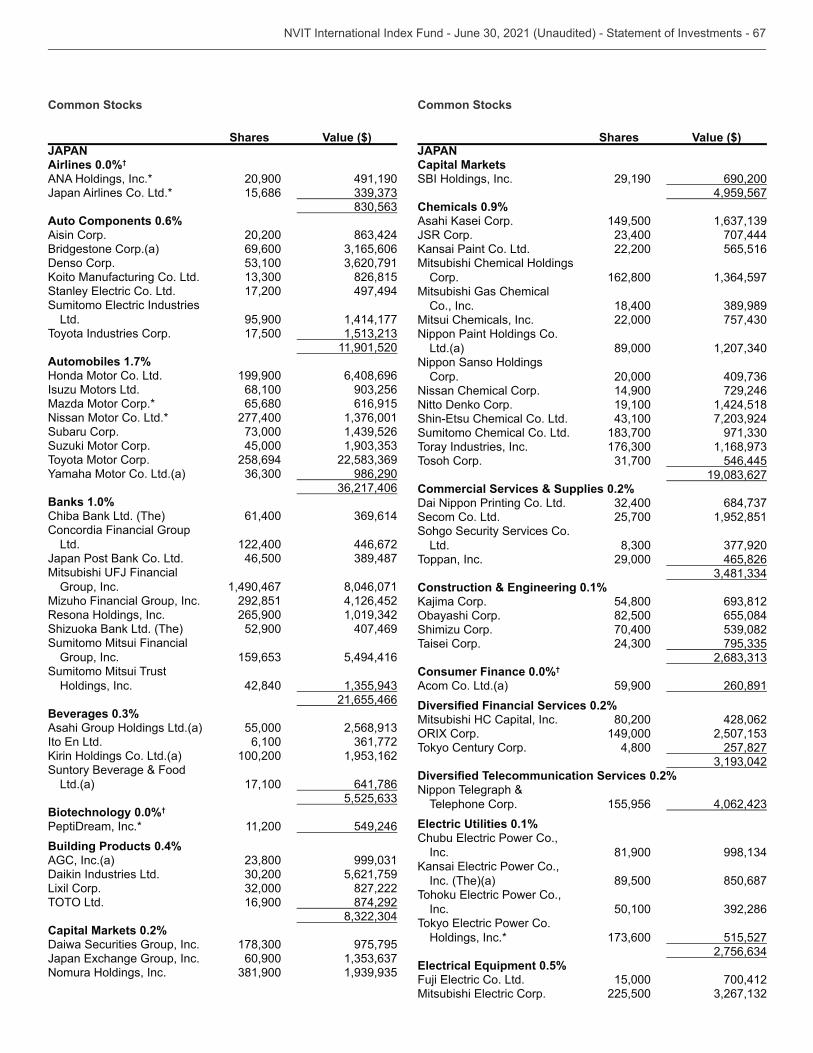
Common Stocks
Shares Value ($)JAPANAirlines 0.0%†
ANA Holdings, Inc.* 20,900 491,190Japan Airlines Co. Ltd.* 15,686
Auto Components 0.6%Aisin Corp. 20,200 Bridgestone Corp.(a) 69,600 Denso Corp.
826,815 17,200 497,494
Ltd. 95,900 1,414,177Toyota Industries Corp. 17,500
11,901,520Automobiles 1.7%Honda Motor Co. Ltd. 199,900 6,408,696Isuzu Motors Ltd. 68,100 Mazda Motor Corp.* 65,680 616,915Nissan Motor Co. Ltd.* 277,400 Subaru Corp. Suzuki Motor Corp. 45,000 Toyota Motor Corp. 258,694
986,290
Banks 1.0%Chiba Bank Ltd. (The) 61,400 Concordia Financial Group
Ltd. 122,400 446,672Japan Post Bank Co. Ltd. 46,500
Group, Inc. 1,490,467 8,046,071Mizuho Financial Group, Inc. 292,851 4,126,452Resona Holdings, Inc. 265,900 Shizuoka Bank Ltd. (The) 52,900 407,469Sumitomo Mitsui Financial
Group, Inc. 5,494,416Sumitomo Mitsui Trust
Holdings, Inc. 42,840 21,655,466
Beverages 0.3%Asahi Group Holdings Ltd.(a) 55,000
6,100 100,200
Suntory Beverage & Food Ltd.(a) 17,100 641,786
Biotechnology 0.0%†
PeptiDream, Inc.* 11,200 549,246Building Products 0.4%AGC, Inc.(a) Daikin Industries Ltd. 5,621,759Lixil Corp. 827,222
16,900 874,292
Capital Markets 0.2%Daiwa Securities Group, Inc. 975,795
60,900 Nomura Holdings, Inc.
Common Stocks
Shares Value ($)JAPANCapital MarketsSBI Holdings, Inc. 29,190 690,200
4,959,567Chemicals 0.9%
149,500 JSR Corp. 707,444
22,200 565,516Mitsubishi Chemical Holdings
Corp. 162,800 Mitsubishi Gas Chemical
Co., Inc. 18,400 Mitsui Chemicals, Inc. 22,000 Nippon Paint Holdings Co.
Ltd.(a) 89,000 Nippon Sanso Holdings
Corp. 20,000 Nissan Chemical Corp. 14,900 729,246Nitto Denko Corp. 19,100 1,424,518
Sumitomo Chemical Co. Ltd. Toray Industries, Inc. Tosoh Corp. 546,445
Commercial Services & Supplies 0.2%Dai Nippon Printing Co. Ltd. Secom Co. Ltd. 25,700 1,952,851Sohgo Security Services Co.
Ltd. Toppan, Inc. 29,000 465,826
Construction & Engineering 0.1%
54,800 82,500 655,084
Shimizu Corp. 70,400 Taisei Corp.
Consumer Finance 0.0%†
Acom Co. Ltd.(a) 59,900 260,891 0.2%
Mitsubishi HC Capital, Inc. 80,200 428,062 149,000
Tokyo Century Corp. 4,800 257,827
0.2%Nippon Telegraph &
Telephone Corp. 155,956 Electric Utilities 0.1%
Inc. 81,900
Inc. (The)(a) 89,500 850,687
Inc. 50,100
Holdings, Inc.* 515,527
Electrical Equipment 0.5% 15,000 700,412 225,500
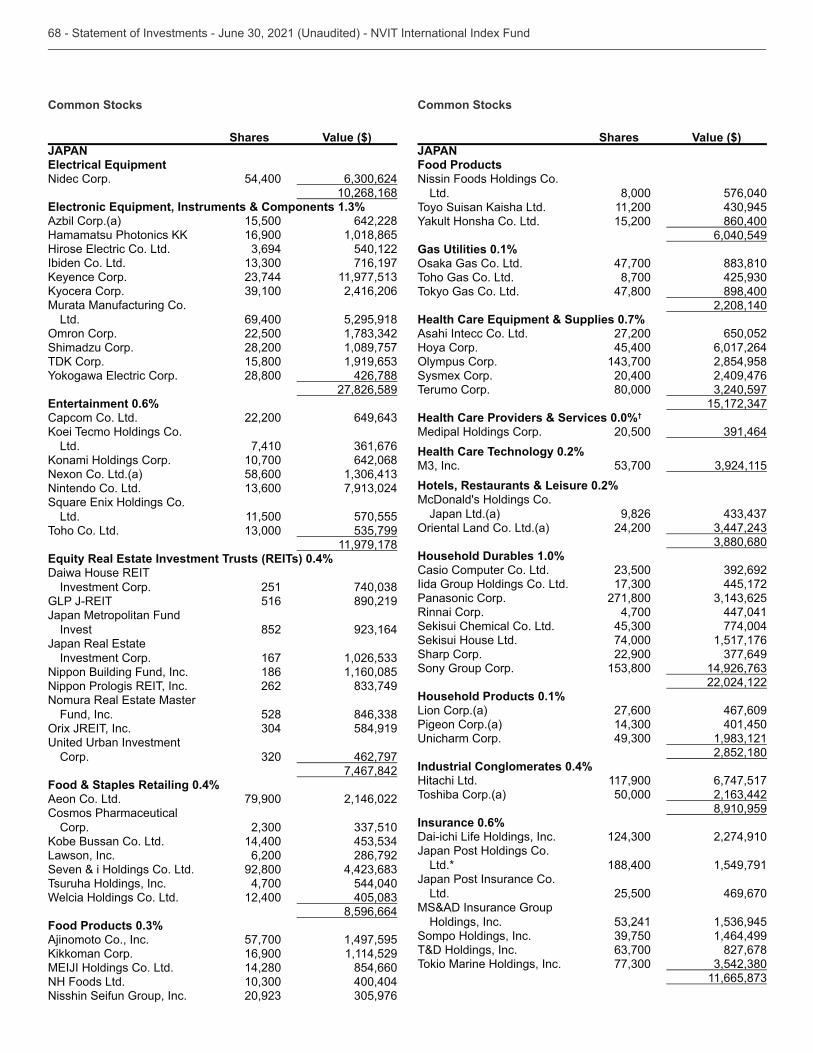
Common Stocks
Shares Value ($)JAPANElectrical EquipmentNidec Corp. 54,400
10,268,168Electronic Equipment, Instruments & Components 1.3%Azbil Corp.(a) 15,500 642,228
16,900 1,018,865 540,122
Ibiden Co. Ltd. 716,197 2,416,206
Murata Manufacturing Co. Ltd. 69,400 5,295,918
22,500 Shimadzu Corp. 28,200 1,089,757
15,800 28,800 426,788
27,826,589Entertainment 0.6%Capcom Co. Ltd. 22,200
Ltd. 7,410 10,700 642,068
Nexon Co. Ltd.(a) 58,600 Nintendo Co. Ltd.
Ltd. 11,500 570,555Toho Co. Ltd.
11,979,178Equity Real Estate Investment Trusts (REITs) 0.4%
Investment Corp. 251 516 890,219
Japan Metropolitan Fund Invest 852
Investment Corp. 167 Nippon Building Fund, Inc. 186 1,160,085
262
Fund, Inc. 528 584,919
Corp. 462,797 7,467,842
Food & Staples Retailing 0.4%Aeon Co. Ltd. 79,900 2,146,022Cosmos Pharmaceutical
Corp. 14,400
Lawson, Inc. 6,200 286,792Seven & i Holdings Co. Ltd. 92,800 Tsuruha Holdings, Inc. 4,700 544,040Welcia Holdings Co. Ltd. 12,400
8,596,664Food Products 0.3%Ajinomoto Co., Inc. 57,700 1,497,595
16,900 1,114,529 14,280 854,660
NH Foods Ltd. 400,404Nisshin Seifun Group, Inc.
Common Stocks
Shares Value ($)JAPANFood ProductsNissin Foods Holdings Co.
Ltd. 8,000 576,040 11,200 15,200 860,400
6,040,549Gas Utilities 0.1%
47,700 Toho Gas Co. Ltd. 8,700 Tokyo Gas Co. Ltd. 47,800 898,400
2,208,140Health Care Equipment & Supplies 0.7%Asahi Intecc Co. Ltd. 27,200 650,052Hoya Corp. 45,400 6,017,264
2,854,958Sysmex Corp. 20,400 2,409,476Terumo Corp. 80,000
Health Care Providers & Services 0.0%†
Medipal Holdings Corp. 20,500 Health Care Technology 0.2%
Hotels, Restaurants & Leisure 0.2%McDonald's Holdings Co.
Japan Ltd.(a) 9,826 24,200
Household Durables 1.0%Casio Computer Co. Ltd. Iida Group Holdings Co. Ltd. 445,172Panasonic Corp. 271,800 Rinnai Corp. 4,700 447,041Sekisui Chemical Co. Ltd. 774,004Sekisui House Ltd. 74,000 1,517,176Sharp Corp. 22,900 Sony Group Corp.
22,024,122Household Products 0.1%Lion Corp.(a) 27,600 467,609Pigeon Corp.(a) 401,450
2,852,180
Industrial Conglomerates 0.4%Hitachi Ltd. 117,900 6,747,517Toshiba Corp.(a) 50,000
8,910,959Insurance 0.6%Dai-ichi Life Holdings, Inc. 2,274,910Japan Post Holdings Co.
Ltd.* 188,400 1,549,791Japan Post Insurance Co.
Ltd. 25,500 469,670MS&AD Insurance Group
Holdings, Inc. Sompo Holdings, Inc. 1,464,499T&D Holdings, Inc. 827,678Tokio Marine Holdings, Inc.
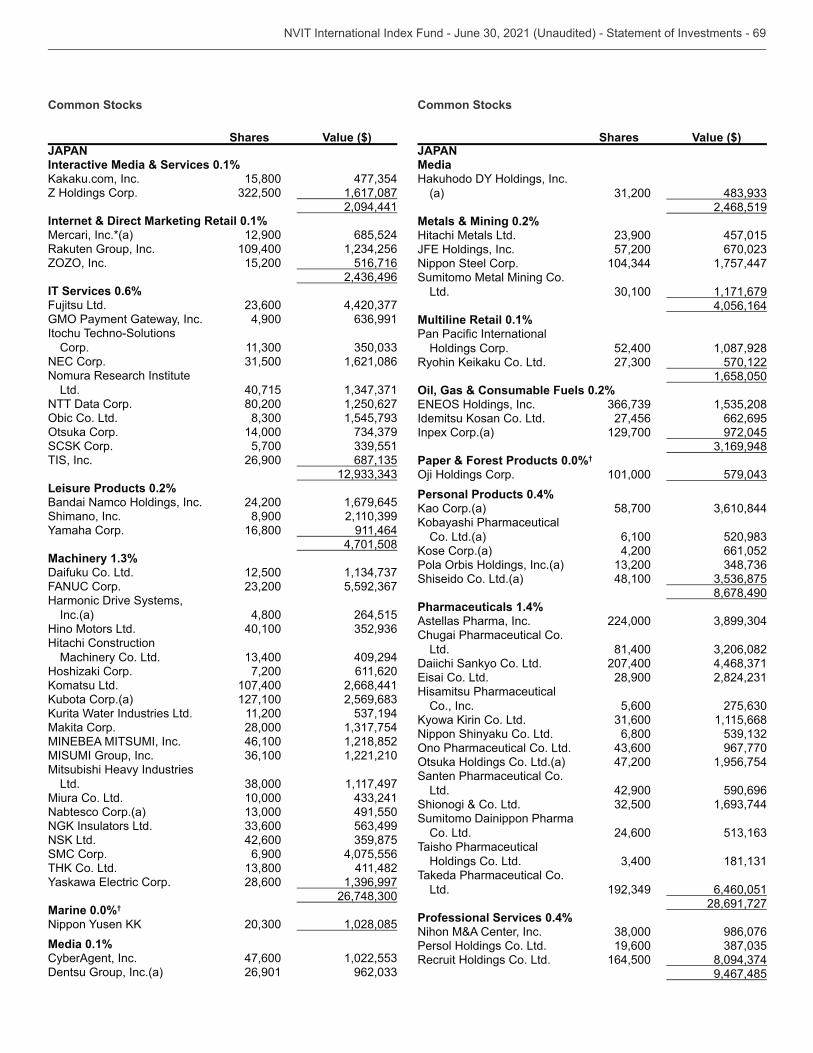
Common Stocks
Shares Value ($)JAPANInteractive Media & Services 0.1%
15,800 Z Holdings Corp. 1,617,087
2,094,441Internet & Direct Marketing Retail 0.1%Mercari, Inc.*(a) 12,900 685,524Rakuten Group, Inc. 109,400
15,200 516,716
IT Services 0.6%Fujitsu Ltd.
4,900 Itochu Techno-Solutions
Corp. 1,621,086
Nomura Research Institute Ltd. 40,715
NTT Data Corp. 80,200 1,250,627 14,000 5,700
TIS, Inc. 26,900
Leisure Products 0.2%Bandai Namco Holdings, Inc. 24,200 1,679,645Shimano, Inc. 8,900
16,800 911,464 4,701,508
Machinery 1.3%Daifuku Co. Ltd. 12,500
Harmonic Drive Systems,
Inc.(a) 4,800 264,515Hino Motors Ltd. 40,100 Hitachi Construction
Machinery Co. Ltd. 409,294Hoshizaki Corp. 7,200 611,620
107,400 2,668,441 127,100 11,200
Makita Corp. 28,000 46,100 1,218,852 1,221,210
Mitsubishi Heavy Industries Ltd. 1,117,497
Miura Co. Ltd. 10,000 Nabtesco Corp.(a) 491,550
42,600
SMC Corp. 6,900 4,075,556 411,482 28,600
Marine 0.0%†
1,028,085Media 0.1%CyberAgent, Inc. 47,600 Dentsu Group, Inc.(a) 26,901
Common Stocks
Shares Value ($)JAPANMedia
(a) 2,468,519
Metals & Mining 0.2%Hitachi Metals Ltd. 457,015
57,200 Nippon Steel Corp. 1,757,447Sumitomo Metal Mining Co.
Ltd. 1,171,679 4,056,164
Multiline Retail 0.1%
Holdings Corp. 52,400 1,087,928 570,122
1,658,050Oil, Gas & Consumable Fuels 0.2%
27,456 662,695
Inpex Corp.(a) 129,700 972,045
Paper & Forest Products 0.0%†
101,000 Personal Products 0.4%
58,700
Co. Ltd.(a) 6,100 4,200 661,052
Shiseido Co. Ltd.(a) 48,100 8,678,490
Pharmaceuticals 1.4%Astellas Pharma, Inc. 224,000 Chugai Pharmaceutical Co.
Ltd. 81,400 Daiichi Sankyo Co. Ltd. 207,400
28,900 Hisamitsu Pharmaceutical
Co., Inc. 5,600 1,115,668
Nippon Shinyaku Co. Ltd. 6,800 967,770 47,200 1,956,754
Santen Pharmaceutical Co. Ltd. 42,900 590,696
Shionogi & Co. Ltd. Sumitomo Dainippon Pharma
Co. Ltd. 24,600 Taisho Pharmaceutical
Holdings Co. Ltd. Takeda Pharmaceutical Co.
Ltd. 6,460,051 28,691,727
Professional Services 0.4%Nihon M&A Center, Inc. 986,076Persol Holdings Co. Ltd. 19,600 Recruit Holdings Co. Ltd. 164,500
9,467,485
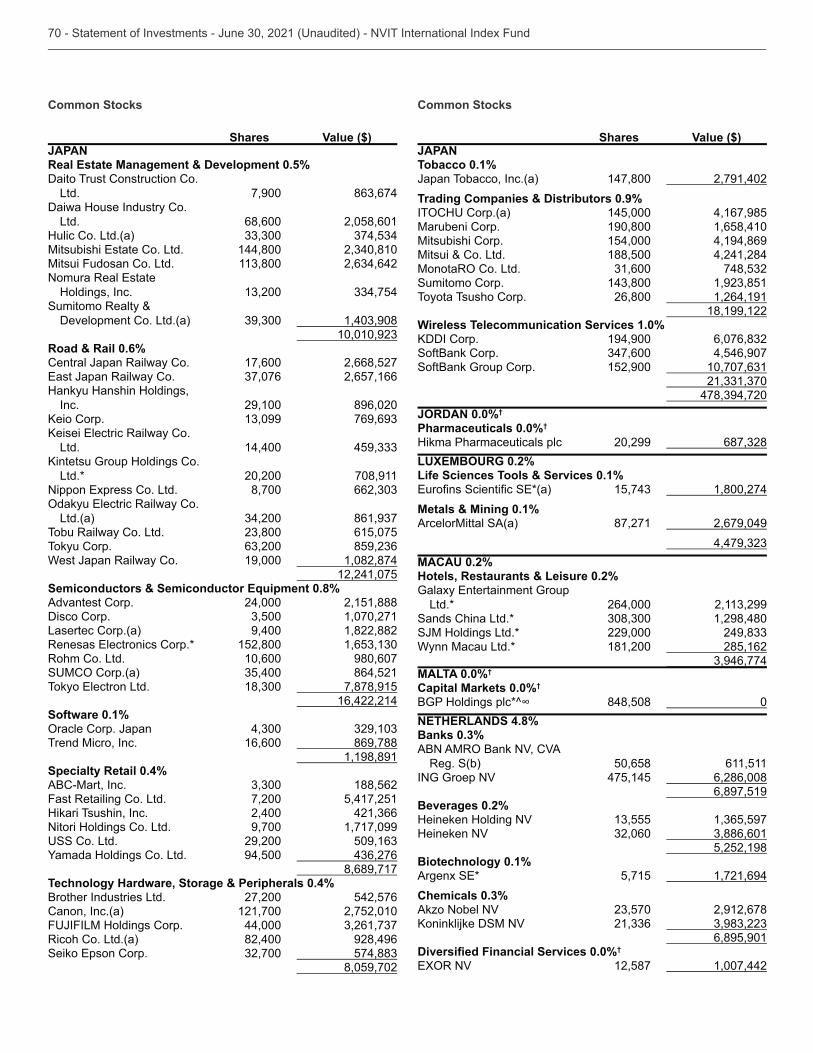
Common Stocks
Shares Value ($)JAPANReal Estate Management & Development 0.5%Daito Trust Construction Co.
Ltd. 7,900 Daiwa House Industry Co.
Ltd. 68,600 2,058,601Hulic Co. Ltd.(a)
144,800 Mitsui Fudosan Co. Ltd.
Holdings, Inc. Sumitomo Realty &
Development Co. Ltd.(a)
Road & Rail 0.6%Central Japan Railway Co. 17,600 2,668,527
2,657,166Hankyu Hanshin Holdings,
Inc. 29,100 896,020
Ltd. 14,400
Ltd.* 20,200 708,911 8,700
Ltd.(a) Tobu Railway Co. Ltd. 615,075Tokyu Corp. West Japan Railway Co. 19,000 1,082,874
12,241,075Semiconductors & Semiconductor Equipment 0.8%Advantest Corp. 24,000 2,151,888Disco Corp. 1,070,271Lasertec Corp.(a) 9,400 1,822,882
152,800 Rohm Co. Ltd. 10,600 980,607
864,521 7,878,915
16,422,214Software 0.1%
Trend Micro, Inc. 16,600 869,788
1,198,891Specialty Retail 0.4%ABC-Mart, Inc. 188,562Fast Retailing Co. Ltd. 7,200 5,417,251Hikari Tsushin, Inc. 2,400 Nitori Holdings Co. Ltd. 9,700 1,717,099
29,200 94,500
8,689,717Technology Hardware, Storage & Peripherals 0.4%Brother Industries Ltd. 27,200 542,576Canon, Inc.(a) 121,700 2,752,010
44,000 Ricoh Co. Ltd.(a) 82,400 928,496
8,059,702
Common Stocks
Shares Value ($)JAPANTobacco 0.1%Japan Tobacco, Inc.(a) 147,800 2,791,402Trading Companies & Distributors 0.9%
145,000 4,167,985Marubeni Corp. 190,800 1,658,410Mitsubishi Corp. 154,000 4,194,869Mitsui & Co. Ltd. 188,500 4,241,284
Sumitomo Corp. Toyota Tsusho Corp. 26,800 1,264,191
18,199,122Wireless Telecommunication Services 1.0%
194,900 SoftBank Corp. 4,546,907SoftBank Group Corp. 152,900
JORDAN 0.0%†
Pharmaceuticals 0.0%†
Hikma Pharmaceuticals plc 20,299 LUXEMBOURG 0.2%Life Sciences Tools & Services 0.1%
1,800,274Metals & Mining 0.1%ArcelorMittal SA(a) 87,271 2,679,049
MACAU 0.2%Hotels, Restaurants & Leisure 0.2%
Ltd.* 264,000 Sands China Ltd.* 1,298,480SJM Holdings Ltd.* 229,000 Wynn Macau Ltd.* 181,200 285,162
MALTA 0.0%†
Capital Markets 0.0%†
848,508 0NETHERLANDS 4.8%Banks 0.3%
Reg. S(b) 50,658 611,511ING Groep NV 475,145 6,286,008
6,897,519Beverages 0.2%Heineken Holding NV Heineken NV
5,252,198Biotechnology 0.1%
5,715 1,721,694Chemicals 0.3%Akzo Nobel NV 2,912,678
6,895,901
0.0%†
12,587 1,007,442
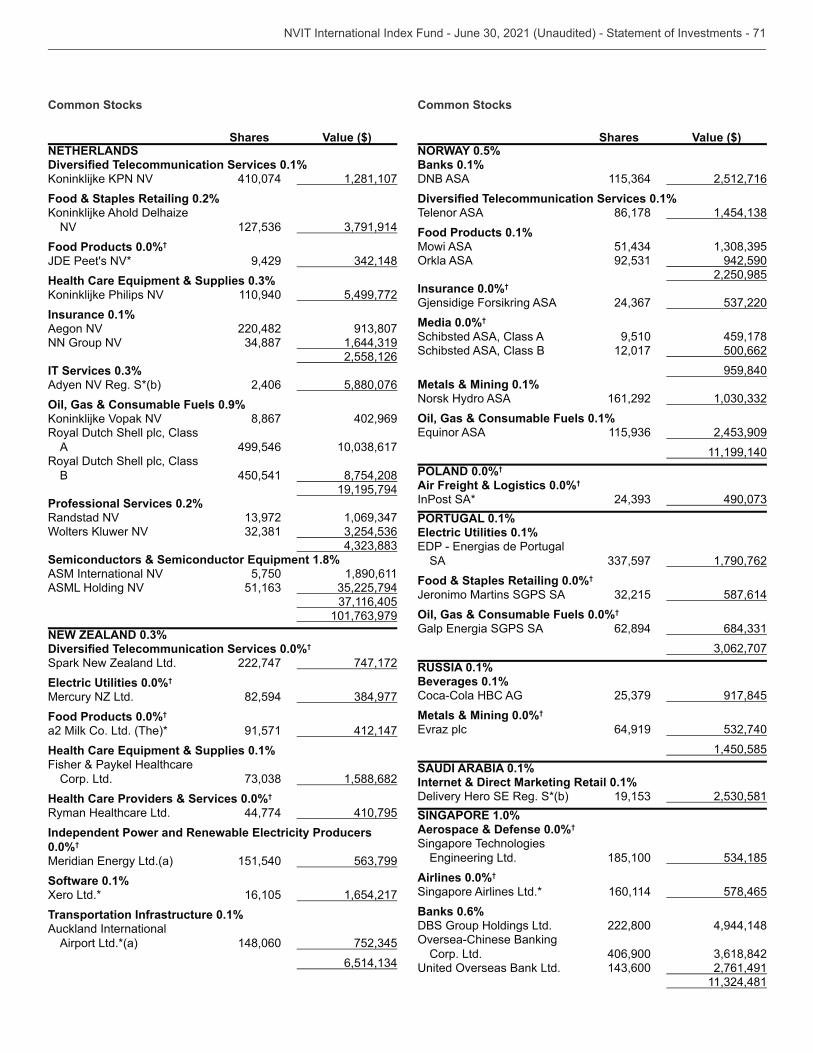
Common Stocks
Shares Value ($)NETHERLANDS
0.1% 410,074 1,281,107
Food & Staples Retailing 0.2%
NV Food Products 0.0%†
9,429 Health Care Equipment & Supplies 0.3%
110,940 5,499,772Insurance 0.1%Aegon NV 220,482 NN Group NV
2,558,126IT Services 0.3%Adyen NV Reg. S*(b) 2,406 5,880,076Oil, Gas & Consumable Fuels 0.9%
8,867 402,969Royal Dutch Shell plc, Class
A 499,546 Royal Dutch Shell plc, Class
B 450,541 8,754,208 19,195,794
Professional Services 0.2%Randstad NV
Semiconductors & Semiconductor Equipment 1.8%ASM International NV 5,750 1,890,611ASML Holding NV
NEW ZEALAND 0.3% 0.0%†
Spark New Zealand Ltd. 222,747 747,172Electric Utilities 0.0%†
Mercury NZ Ltd. 82,594 Food Products 0.0%†
a2 Milk Co. Ltd. (The)* 91,571 412,147Health Care Equipment & Supplies 0.1%Fisher & Paykel Healthcare
Corp. Ltd. 1,588,682Health Care Providers & Services 0.0%†
Ryman Healthcare Ltd. 44,774 410,795Independent Power and Renewable Electricity Producers 0.0%†
151,540 Software 0.1%Xero Ltd.* 16,105 1,654,217Transportation Infrastructure 0.1%Auckland International
Airport Ltd.*(a) 148,060
Common Stocks
Shares Value ($)NORWAY 0.5%Banks 0.1%DNB ASA 2,512,716
0.1%Telenor ASA 86,178 Food Products 0.1%Mowi ASA
942,590 2,250,985
Insurance 0.0%†
Gjensidige Forsikring ASA Media 0.0%†
Schibsted ASA, Class A 9,510 459,178Schibsted ASA, Class B 12,017 500,662
959,840Metals & Mining 0.1%Norsk Hydro ASA 161,292 Oil, Gas & Consumable Fuels 0.1%
11,199,140
POLAND 0.0%†
Air Freight & Logistics 0.0%†
InPost SA* PORTUGAL 0.1%Electric Utilities 0.1%
SA 1,790,762Food & Staples Retailing 0.0%†
Jeronimo Martins SGPS SA 587,614Oil, Gas & Consumable Fuels 0.0%†
62,894
RUSSIA 0.1%Beverages 0.1%Coca-Cola HBC AG 917,845Metals & Mining 0.0%†
64,919 1,450,585
SAUDI ARABIA 0.1%Internet & Direct Marketing Retail 0.1%
SINGAPORE 1.0%Aerospace & Defense 0.0%†
Singapore Technologies 185,100
Airlines 0.0%†
Singapore Airlines Ltd.* 160,114 578,465Banks 0.6%DBS Group Holdings Ltd. 222,800 4,944,148
Corp. Ltd. 406,900 2,761,491
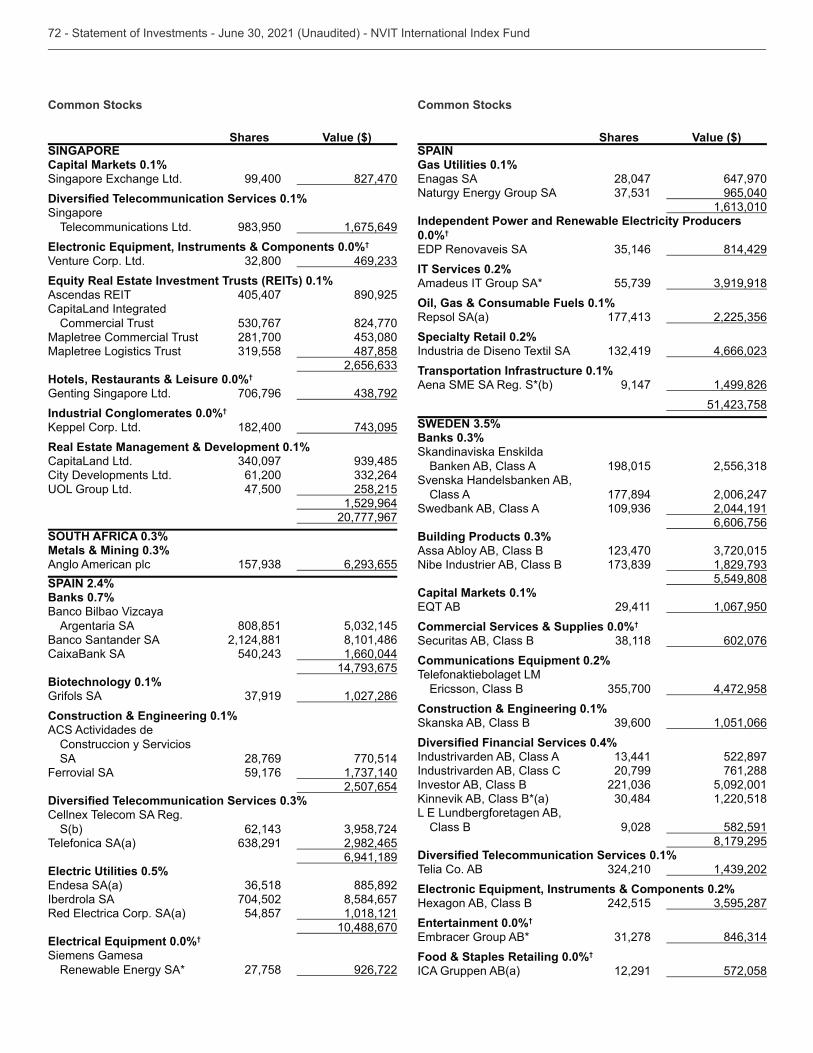
Common Stocks
Shares Value ($)SINGAPORECapital Markets 0.1%
99,400 827,470 0.1%
Singapore Telecommunications Ltd. 1,675,649
Electronic Equipment, Instruments & Components 0.0%†
Venture Corp. Ltd. Equity Real Estate Investment Trusts (REITs) 0.1%
405,407 890,925CapitaLand Integrated
Commercial Trust 824,770Mapletree Commercial Trust 281,700 Mapletree Logistics Trust 487,858
Hotels, Restaurants & Leisure 0.0%†
Genting Singapore Ltd. 706,796 Industrial Conglomerates 0.0%†
182,400 Real Estate Management & Development 0.1%CapitaLand Ltd. City Developments Ltd. 61,200
47,500 258,215 1,529,964 20,777,967
SOUTH AFRICA 0.3%Metals & Mining 0.3%Anglo American plc SPAIN 2.4%Banks 0.7%Banco Bilbao Vizcaya
Argentaria SA 808,851 Banco Santander SA 2,124,881 8,101,486CaixaBank SA 1,660,044
Biotechnology 0.1%Grifols SA 1,027,286Construction & Engineering 0.1%ACS Actividades de
Construccion y Servicios SA 28,769 770,514
Ferrovial SA 59,176 2,507,654
0.3%Cellnex Telecom SA Reg.
S(b) Telefonica SA(a) 2,982,465
6,941,189Electric Utilities 0.5%
885,892Iberdrola SA 704,502 8,584,657
54,857 1,018,121 10,488,670
Electrical Equipment 0.0%†
Siemens Gamesa 27,758 926,722
Common Stocks
Shares Value ($)SPAINGas Utilities 0.1%
28,047 647,970 965,040
Independent Power and Renewable Electricity Producers 0.0%†
814,429IT Services 0.2%Amadeus IT Group SA* Oil, Gas & Consumable Fuels 0.1%Repsol SA(a) Specialty Retail 0.2%Industria de Diseno Textil SA Transportation Infrastructure 0.1%
9,147 1,499,826
SWEDEN 3.5%Banks 0.3%
Banken AB, Class A 198,015 Svenska Handelsbanken AB,
Class A 177,894 2,006,247Swedbank AB, Class A 2,044,191
6,606,756Building Products 0.3%Assa Abloy AB, Class B Nibe Industrier AB, Class B
5,549,808Capital Markets 0.1%
29,411 1,067,950Commercial Services & Supplies 0.0%†
Securitas AB, Class B 602,076Communications Equipment 0.2%Telefonaktiebolaget LM
4,472,958Construction & Engineering 0.1%Skanska AB, Class B 1,051,066
0.4%Industrivarden AB, Class A 522,897Industrivarden AB, Class C 20,799 761,288Investor AB, Class B 5,092,001
1,220,518
Class B 9,028 582,591 8,179,295
0.1%Telia Co. AB Electronic Equipment, Instruments & Components 0.2%Hexagon AB, Class B 242,515 Entertainment 0.0%†
Food & Staples Retailing 0.0%†
ICA Gruppen AB(a) 12,291 572,058
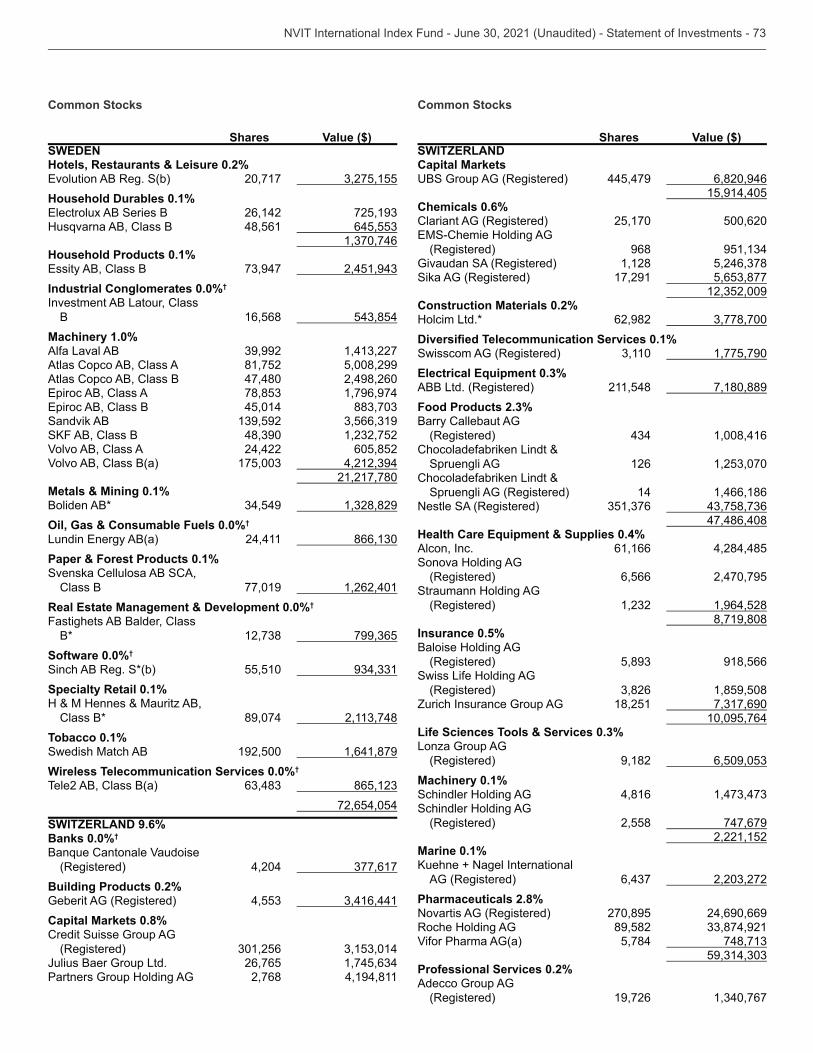
Common Stocks
Shares Value ($)SWEDENHotels, Restaurants & Leisure 0.2%
20,717 Household Durables 0.1%
26,142 48,561
Household Products 0.1%
Industrial Conglomerates 0.0%†
Investment AB Latour, Class B 16,568
Machinery 1.0%Alfa Laval AB Atlas Copco AB, Class A 81,752 5,008,299Atlas Copco AB, Class B 47,480 2,498,260
1,796,974 45,014
Sandvik AB
Volvo AB, Class A 24,422 605,852Volvo AB, Class B(a)
21,217,780Metals & Mining 0.1%Boliden AB* Oil, Gas & Consumable Fuels 0.0%†
24,411 Paper & Forest Products 0.1%Svenska Cellulosa AB SCA,
Class B 77,019 1,262,401Real Estate Management & Development 0.0%†
Fastighets AB Balder, Class B*
Software 0.0%†
Sinch AB Reg. S*(b) 55,510 Specialty Retail 0.1%H & M Hennes & Mauritz AB,
Class B* 89,074 Tobacco 0.1%Swedish Match AB 192,500 1,641,879Wireless Telecommunication Services 0.0%†
Tele2 AB, Class B(a) 72,654,054
SWITZERLAND 9.6%Banks 0.0%†
(Registered) 4,204 Building Products 0.2%Geberit AG (Registered) Capital Markets 0.8%Credit Suisse Group AG
(Registered) Julius Baer Group Ltd. 26,765 Partners Group Holding AG 2,768 4,194,811
Common Stocks
Shares Value ($)SWITZERLANDCapital Markets
445,479 6,820,946 15,914,405
Chemicals 0.6%Clariant AG (Registered) 25,170 500,620
(Registered) 968 Givaudan SA (Registered) 1,128 Sika AG (Registered) 17,291
Construction Materials 0.2%Holcim Ltd.* 62,982
0.1%Swisscom AG (Registered) 1,775,790Electrical Equipment 0.3%ABB Ltd. (Registered) 211,548 7,180,889Food Products 2.3%Barry Callebaut AG
(Registered) 1,008,416Chocoladefabriken Lindt &
Spruengli AG 126 Chocoladefabriken Lindt &
Spruengli AG (Registered) 14 1,466,186Nestle SA (Registered)
47,486,408Health Care Equipment & Supplies 0.4%Alcon, Inc. 61,166 4,284,485Sonova Holding AG
(Registered) 6,566 2,470,795Straumann Holding AG
(Registered) 1,964,528 8,719,808
Insurance 0.5%Baloise Holding AG
(Registered) 918,566Swiss Life Holding AG
(Registered) 1,859,508Zurich Insurance Group AG 18,251
10,095,764Life Sciences Tools & Services 0.3%Lonza Group AG
(Registered) 9,182 Machinery 0.1%Schindler Holding AG 4,816 Schindler Holding AG
(Registered) 2,558 747,679 2,221,152
Marine 0.1%
AG (Registered) Pharmaceuticals 2.8%Novartis AG (Registered) 270,895 24,690,669Roche Holding AG 89,582 Vifor Pharma AG(a) 5,784
Professional Services 0.2%Adecco Group AG
(Registered) 19,726
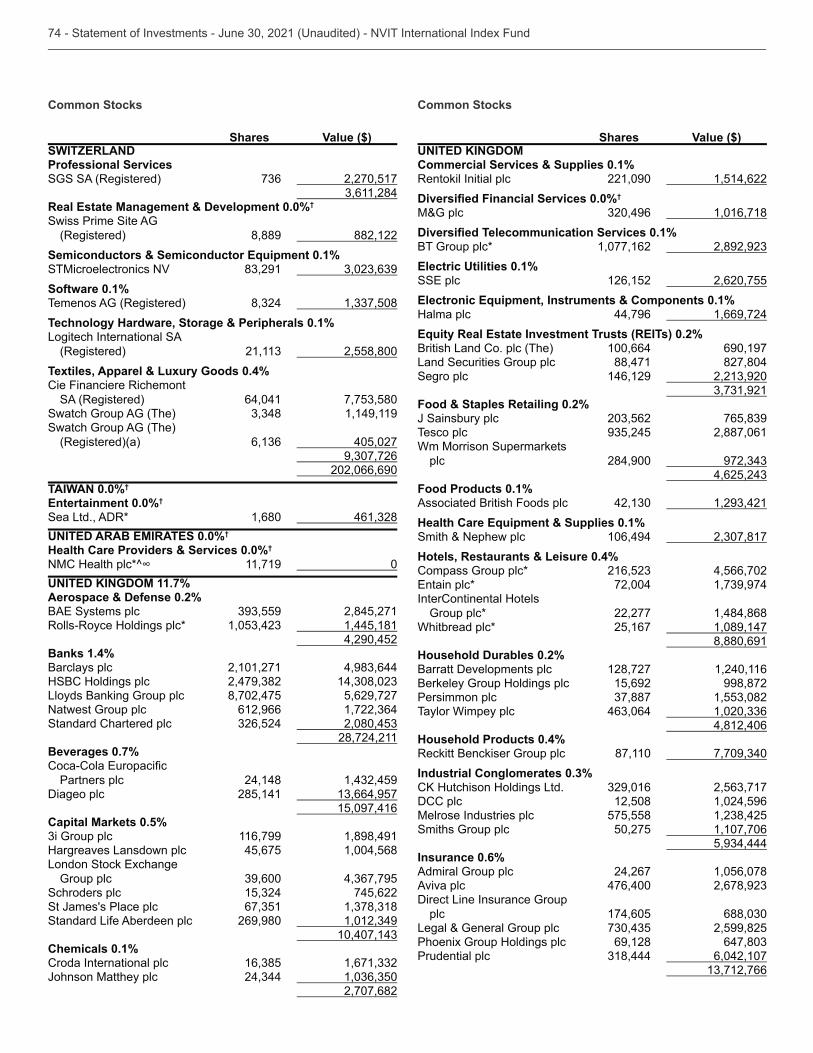
Common Stocks
Shares Value ($)SWITZERLANDProfessional ServicesSGS SA (Registered) 2,270,517
Real Estate Management & Development 0.0%†
Swiss Prime Site AG (Registered) 8,889 882,122
Semiconductors & Semiconductor Equipment 0.1%STMicroelectronics NV Software 0.1%Temenos AG (Registered) Technology Hardware, Storage & Peripherals 0.1%Logitech International SA
(Registered) 2,558,800Textiles, Apparel & Luxury Goods 0.4%Cie Financiere Richemont
SA (Registered) 64,041 Swatch Group AG (The) 1,149,119Swatch Group AG (The)
(Registered)(a) 405,027 202,066,690
TAIWAN 0.0%†
Entertainment 0.0%†
Sea Ltd., ADR* 1,680 UNITED ARAB EMIRATES 0.0%†
Health Care Providers & Services 0.0%†
11,719 0UNITED KINGDOM 11.7%Aerospace & Defense 0.2%
2,845,271Rolls-Royce Holdings plc* 1,445,181
4,290,452Banks 1.4%Barclays plc 2,101,271 HSBC Holdings plc Lloyds Banking Group plc 8,702,475 5,629,727Natwest Group plc 612,966 Standard Chartered plc
28,724,211Beverages 0.7%
Partners plc 24,148 Diageo plc 285,141
15,097,416Capital Markets 0.5%
116,799 1,898,491Hargreaves Lansdown plc 45,675 1,004,568
Group plc Schroders plc 745,622St James's Place plc Standard Life Aberdeen plc 269,980
Chemicals 0.1%Croda International plc Johnson Matthey plc
2,707,682
Common Stocks
Shares Value ($)UNITED KINGDOMCommercial Services & Supplies 0.1%Rentokil Initial plc 221,090 1,514,622
0.0%†
M&G plc 1,016,718 0.1%
BT Group plc* 1,077,162 Electric Utilities 0.1%
126,152 2,620,755Electronic Equipment, Instruments & Components 0.1%Halma plc 44,796 1,669,724Equity Real Estate Investment Trusts (REITs) 0.2%British Land Co. plc (The) 100,664 690,197Land Securities Group plc 88,471 827,804Segro plc 146,129
Food & Staples Retailing 0.2%J Sainsbury plc Tesco plc 2,887,061Wm Morrison Supermarkets
plc 284,900
Food Products 0.1%Associated British Foods plc Health Care Equipment & Supplies 0.1%Smith & Nephew plc 106,494 Hotels, Restaurants & Leisure 0.4%Compass Group plc* 4,566,702
72,004 InterContinental Hotels
Group plc* 22,277 1,484,868Whitbread plc* 25,167 1,089,147
8,880,691Household Durables 0.2%Barratt Developments plc 128,727 1,240,116Berkeley Group Holdings plc 15,692 998,872Persimmon plc Taylor Wimpey plc
4,812,406Household Products 0.4%Reckitt Benckiser Group plc 87,110 Industrial Conglomerates 0.3%
DCC plc 12,508 1,024,596Melrose Industries plc 575,558 Smiths Group plc 50,275 1,107,706
Insurance 0.6%Admiral Group plc 24,267 1,056,078Aviva plc 476,400 Direct Line Insurance Group
plc 174,605 Legal & General Group plc 2,599,825Phoenix Group Holdings plc 69,128 Prudential plc 6,042,107
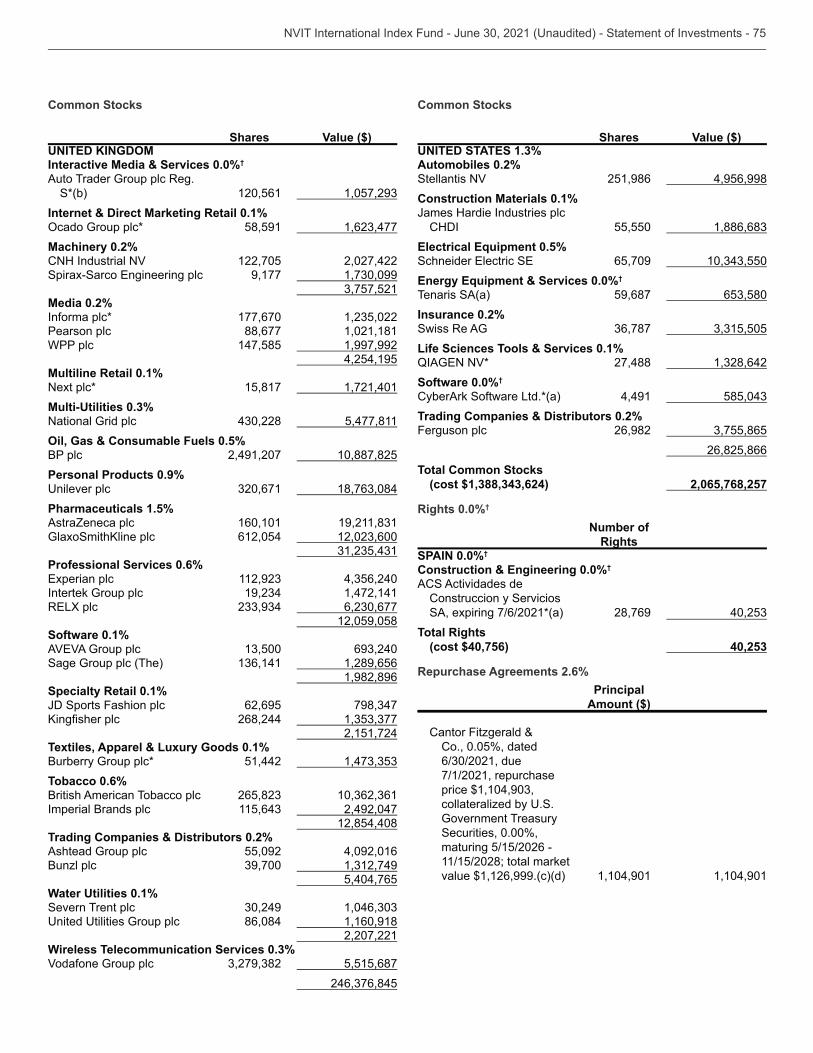
Common Stocks
Shares Value ($)UNITED KINGDOMInteractive Media & Services 0.0%†
Auto Trader Group plc Reg. S*(b) 120,561
Internet & Direct Marketing Retail 0.1% 58,591
Machinery 0.2%CNH Industrial NV 122,705 2,027,422
9,177
Media 0.2%Informa plc* 177,670 Pearson plc 88,677 1,021,181WPP plc 147,585 1,997,992
4,254,195Multiline Retail 0.1%Next plc* 15,817 1,721,401
0.3%National Grid plc 5,477,811Oil, Gas & Consumable Fuels 0.5%BP plc 2,491,207 10,887,825Personal Products 0.9%
Pharmaceuticals 1.5%AstraZeneca plc 160,101
612,054
Professional Services 0.6%
Intertek Group plc 1,472,141
12,059,058Software 0.1%
Sage Group plc (The) 1,289,656
1,982,896Specialty Retail 0.1%JD Sports Fashion plc 62,695
268,244 2,151,724
Textiles, Apparel & Luxury Goods 0.1%Burberry Group plc* 51,442 Tobacco 0.6%British American Tobacco plc Imperial Brands plc 2,492,047
12,854,408Trading Companies & Distributors 0.2%Ashtead Group plc 55,092 4,092,016Bunzl plc
5,404,765Water Utilities 0.1%Severn Trent plc
86,084 1,160,918 2,207,221
Wireless Telecommunication Services 0.3%Vodafone Group plc 5,515,687
Common Stocks
Shares Value ($)UNITED STATES 1.3%Automobiles 0.2%Stellantis NV 251,986 4,956,998Construction Materials 0.1%James Hardie Industries plc
CHDI 55,550 Electrical Equipment 0.5%
65,709 Energy Equipment & Services 0.0%†
Tenaris SA(a) 59,687 Insurance 0.2%Swiss Re AG Life Sciences Tools & Services 0.1%
27,488 Software 0.0%†
CyberArk Software Ltd.*(a) 4,491 Trading Companies & Distributors 0.2%Ferguson plc 26,982
26,825,866Total Common Stocks
(cost $1,388,343,624) 2,065,768,257
Rights 0.0%† Number of
RightsSPAIN 0.0%†
Construction & Engineering 0.0%†
ACS Actividades de Construccion y Servicios SA, expiring 7/6/2021*(a) 28,769
Total Rights (cost $40,756) 40,253
Repurchase Agreements 2.6% Principal
Amount ($)
Cantor Fitzgerald & Co., 0.05%, dated
7/1/2021, repurchase
Government Treasury Securities, 0.00%, maturing 5/15/2026 - 11/15/2028; total market value $1,126,999.(c)(d) 1,104,901 1,104,901
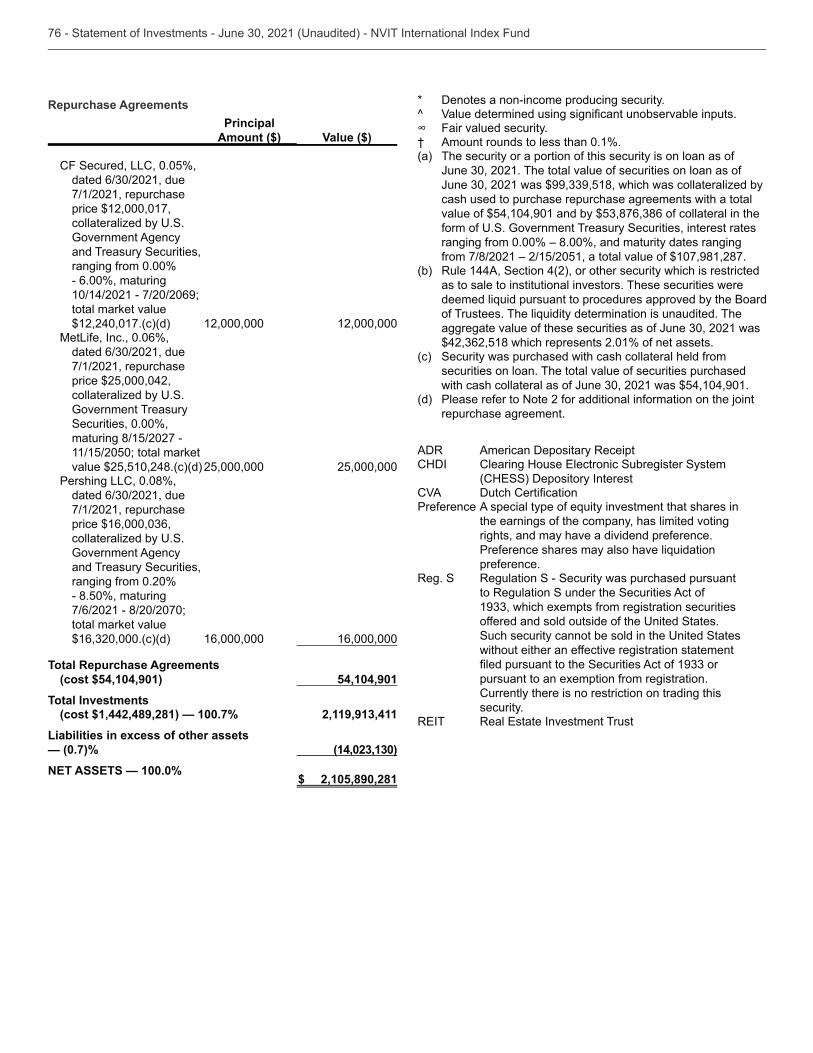
Repurchase Agreements
Principal
Amount ($) Value ($)
CF Secured, LLC, 0.05%,
7/1/2021, repurchase price $12,000,017,
Government Agency and Treasury Securities, ranging from 0.00% - 6.00%, maturing 10/14/2021 - 7/20/2069; total market value $12,240,017.(c)(d)
12,000,000 12,000,000
MetLife, Inc., 0.06%,
7/1/2021, repurchase price $25,000,042,
Government Treasury Securities, 0.00%, maturing 8/15/2027 - 11/15/2050; total market value $25,510,248.(c)(d)
25,000,000 25,000,000
Pershing LLC, 0.08%,
7/1/2021, repurchase
Government Agency and Treasury Securities, ranging from 0.20% - 8.50%, maturing 7/6/2021 - 8/20/2070; total market value
16,000,000 16,000,000
Total Repurchase Agreements (cost $54,104,901) 54,104,901
Total Investments(cost $1,442,489,281) — 100.7% 2,119,913,411
Liabilities in excess of other assets — (0.7)% (14,023,130)
NET ASSETS — 100.0% $ 2,105,890,281
* Denotes a non-income producing security.^
Fair valued security.† Amount rounds to less than 0.1%.(a) The security or a portion of this security is on loan as of
cash used to purchase repurchase agreements with a total
ranging from 0.00% – 8.00%, and maturity dates ranging from 7/8/2021 – 2/15/2051, a total value of $107,981,287.
(b) Rule 144A, Section 4(2), or other security which is restricted as to sale to institutional investors. These securities were
(c) Security was purchased with cash collateral held from securities on loan. The total value of securities purchased
(d) Please refer to Note 2 for additional information on the joint repurchase agreement.
ADR American Depositary ReceiptCHDI
CVAPreference
the earnings of the company, has limited voting rights, and may have a dividend preference.
preference.Reg. S Regulation S - Security was purchased pursuant
to Regulation S under the Securities Act of
without either an effective registration statement
pursuant to an exemption from registration. Currently there is no restriction on trading this security.
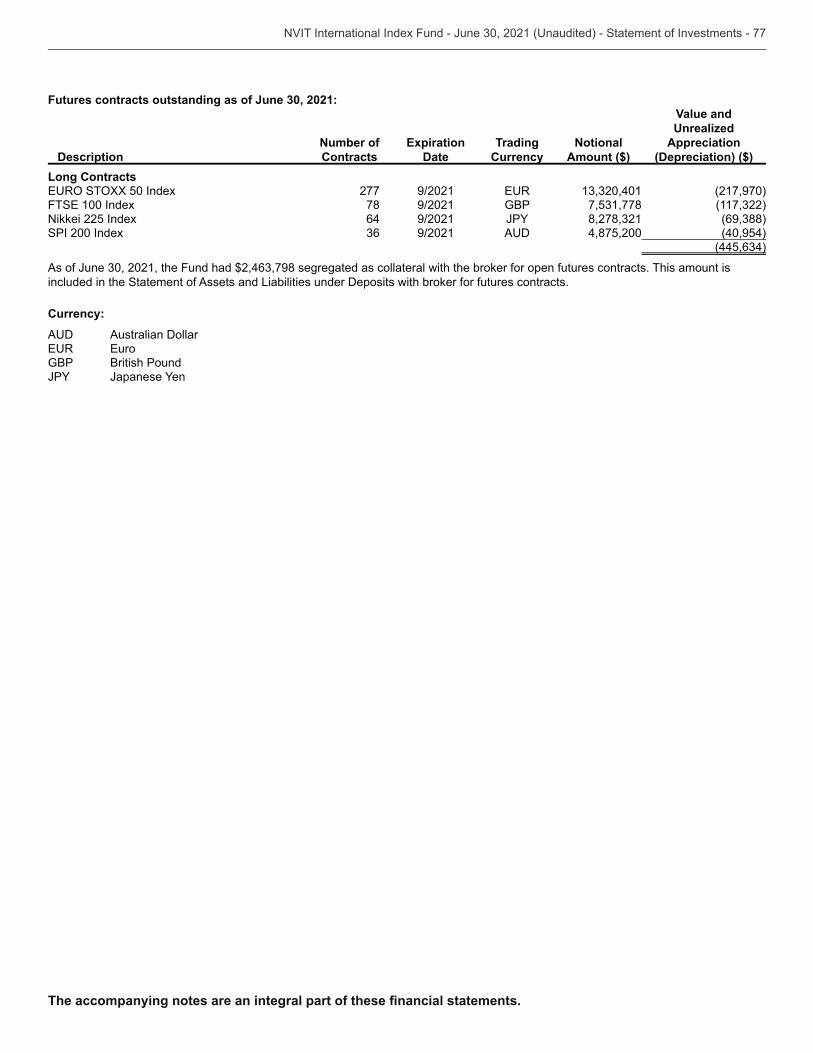
Futures contracts outstanding as of June 30, 2021:
DescriptionNumber of Contracts
Expiration Date
Trading Currency
Notional Amount ($)
Value and Unrealized
Appreciation (Depreciation) ($)
Long Contracts 277 9/2021 (217,970) 78 9/2021 GBP
Nikkei 225 Index 64 9/2021SPI 200 Index 9/2021 4,875,200 (40,954)
included in the Statement of Assets and Liabilities under Deposits with broker for futures contracts. Currency:
Australian Dollar
GBP British Pound
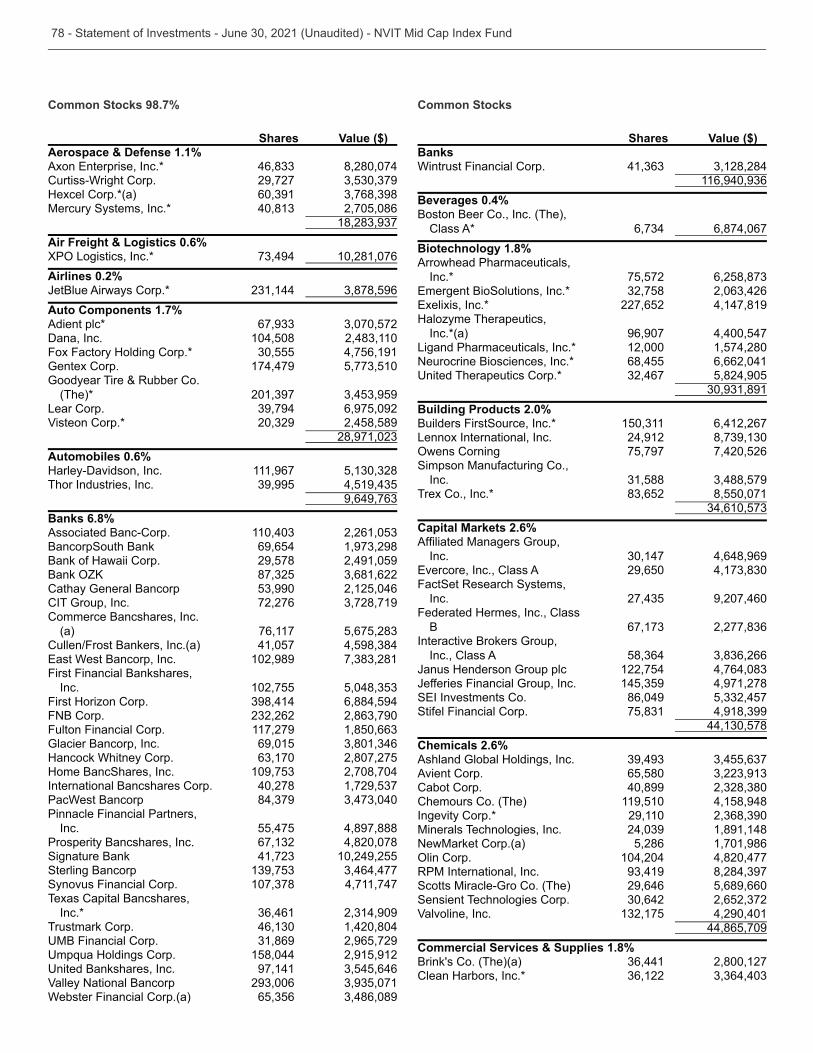
Common Stocks 98.7%
Shares Value ($)Aerospace & Defense 1.1%
8,280,074Curtiss-Wright Corp. 29,727 Hexcel Corp.*(a) Mercury Systems, Inc.* 2,705,086
Air Freight & Logistics 0.6%
10,281,076Airlines 0.2%JetBlue Airways Corp.* Auto Components 1.7%Adient plc* Dana, Inc. 104,508 Fox Factory Holding Corp.* 4,756,191Gentex Corp. 174,479 Goodyear Tire & Rubber Co.
(The)* Lear Corp. 6,975,092Visteon Corp.* 2,458,589
Automobiles 0.6%Harley-Davidson, Inc. 111,967 Thor Industries, Inc.
Banks 6.8%Associated Banc-Corp. BancorpSouth Bank 69,654 Bank of Hawaii Corp. 29,578 2,491,059
Cathay General Bancorp 2,125,046CIT Group, Inc. 72,276 Commerce Bancshares, Inc.
(a) 76,117 Cullen/Frost Bankers, Inc.(a) 41,057
102,989 First Financial Bankshares,
Inc. 102,755 First Horizon Corp. 6,884,594FNB Corp. Fulton Financial Corp. 117,279 Glacier Bancorp, Inc. 69,015 Hancock Whitney Corp. 2,807,275Home BancShares, Inc. 2,708,704International Bancshares Corp. 40,278 PacWest Bancorp Pinnacle Financial Partners,
Inc. 55,475 4,897,888Prosperity Bancshares, Inc. 4,820,078Signature Bank 10,249,255Sterling Bancorp Synovus Financial Corp. 4,711,747Texas Capital Bancshares,
Inc.* Trustmark Corp. 1,420,804
2,965,729 158,044 2,915,912
Bankshares, Inc. 97,141 Valley National Bancorp Webster Financial Corp.(a)
Common Stocks
Shares Value ($)BanksWintrust Financial Corp.
Beverages 0.4%Boston Beer Co., Inc. (The),
Class A* 6,874,067Biotechnology 1.8%Arrowhead Pharmaceuticals,
Inc.* 75,572 BioSolutions, Inc.*
, Inc.* 227,652 4,147,819Halozyme Therapeutics,
Inc.*(a) 96,907 4,400,547Ligand Pharmaceuticals, Inc.* 12,000 1,574,280Neurocrine Biosciences, Inc.* 68,455 6,662,041
5,824,905
Building Products 2.0%Builders FirstSource, Inc.* 6,412,267Lennox International, Inc. 24,912
75,797 7,420,526Simpson Manufacturing Co.,
Inc. Trex Co., Inc.* 8,550,071
Capital Markets 2.6%
Inc. 4,648,969, Inc., Class A 29,650
FactSet Research Systems, Inc. 9,207,460
Federated Hermes, Inc., Class B
Interactive Brokers Group, Inc., Class A
Janus Henderson Group plc 122,754 Jefferies Financial Group, Inc. 4,971,278
86,049 Stifel Financial Corp.
Chemicals 2.6%Ashland Global Holdings, Inc. Avient Corp. 65,580 Cabot Corp. 40,899 Chemours Co. (The) 119,510 4,158,948Ingevity Corp.* 29,110 Minerals Technologies, Inc. 1,891,148NewMarket Corp.(a) 5,286 1,701,986
104,204 4,820,477RPM International, Inc. Scotts Miracle-Gro Co. (The) 29,646 5,689,660Sensient Technologies Corp. Valvoline, Inc. 4,290,401
44,865,709Commercial Services & Supplies 1.8%Brink's Co. (The)(a) 2,800,127Clean Harbors, Inc.*
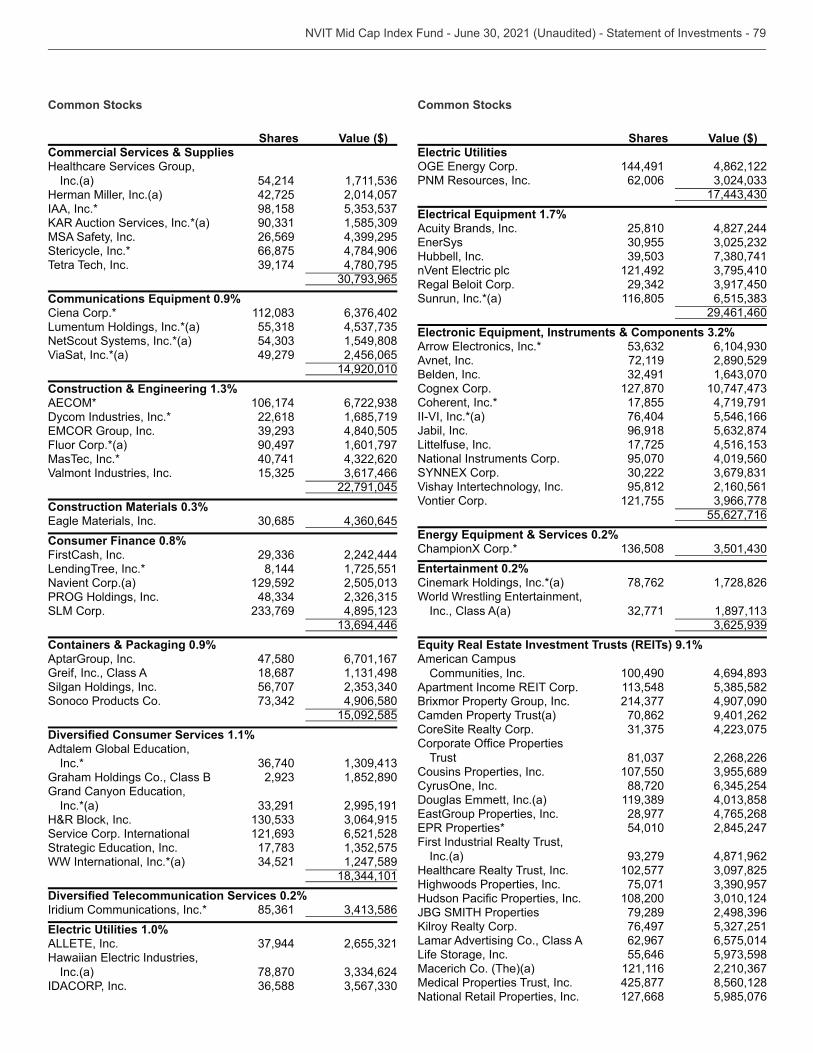
Common Stocks
Shares Value ($)Commercial Services & SuppliesHealthcare Services Group,
Inc.(a) 54,214 Herman Miller, Inc.(a) 42,725 2,014,057IAA, Inc.* 98,158
MSA Safety, Inc. 26,569 Stericycle, Inc.* 66,875 4,784,906Tetra Tech, Inc. 4,780,795
Communications Equipment 0.9%Ciena Corp.* Lumentum Holdings, Inc.*(a) NetScout Systems, Inc.*(a) 1,549,808ViaSat, Inc.*(a) 49,279 2,456,065
14,920,010Construction & Engineering 1.3%
106,174 Dycom Industries, Inc.* 22,618 1,685,719
4,840,505Fluor Corp.*(a) 90,497 1,601,797MasTec, Inc.* 40,741 Valmont Industries, Inc.
22,791,045Construction Materials 0.3%
Consumer Finance 0.8%FirstCash, Inc. 2,242,444LendingTree, Inc.* 8,144 1,725,551Navient Corp.(a) 129,592
SLM Corp.
Containers & Packaging 0.9%AptarGroup, Inc. 47,580 6,701,167Greif, Inc., Class A 18,687 Silgan Holdings, Inc. 56,707 Sonoco Products Co. 4,906,580
15,092,585 1.1%
AdtalemInc.*
Graham Holdings Co., Class B 1,852,890
Inc.*(a) 2,995,191H&R Block, Inc. Service Corp. International 6,521,528
WW International, Inc.*(a) 1,247,589
0.2%
Iridium Communications, Inc.* Electric Utilities 1.0%
Inc.(a) 78,870
Common Stocks
Shares Value ($)Electric Utilities
144,491 4,862,122PNM Resources, Inc. 62,006
Electrical Equipment 1.7%Acuity Brands, Inc. 25,810 4,827,244
Hubbell, Inc. nVent 121,492 Regal Beloit Corp. Sunrun, Inc.*(a) 116,805
29,461,460Electronic Equipment, Instruments & Components 3.2%
Avnet, Inc. 72,119 2,890,529Belden, Inc. Cognex Corp. 127,870 Coherent, Inc.* 17,855 4,719,791II-VI, Inc.*(a) 76,404 5,546,166Jabil, Inc. 96,918 Littelfuse, Inc. 17,725 National Instruments Corp. 95,070 4,019,560
Vishay Intertechnology, Inc. 95,812 2,160,561Vontier Corp. 121,755
55,627,716Energy Equipment & Services 0.2%ChampionX Corp.* Entertainment 0.2%Cinemark Holdings, Inc.*(a) 78,762 1,728,826
Inc., Class A(a)
Equity Real Estate Investment Trusts (REITs) 9.1%American Campus
Communities, Inc. 100,490
Brixmor Property Group, Inc. 4,907,090Camden Property Trust(a) 70,862 9,401,262CoreSite Realty Corp.
Trust 2,268,226Cousins Properties, Inc. 107,550
, Inc. 88,720
Properties, Inc. 28,977 4,765,268 54,010 2,845,247
First Industrial Realty Trust, Inc.(a) 4,871,962
Healthcare Realty Trust, Inc. 102,577 Highwoods Properties, Inc. 75,071
108,200 JBG SMITH Properties 79,289
76,497 Lamar Advertising Co., Class A 62,967 6,575,014Life Storage, Inc. 55,646 Macerich Co. (The)(a) 121,116 Medical Properties Trust, Inc. 425,877 8,560,128National Retail Properties, Inc. 127,668 5,985,076
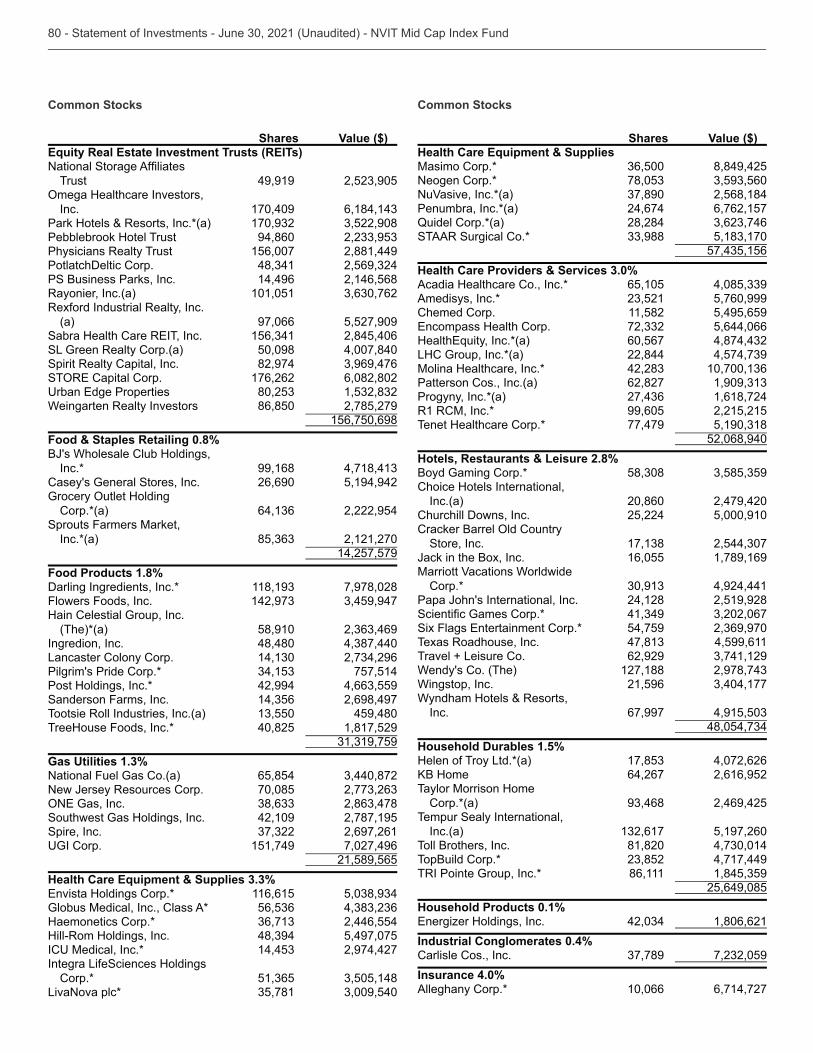
Common Stocks
Shares Value ($)Equity Real Estate Investment Trusts (REITs)
Trust 49,919
Inc. 170,409 Park Hotels & Resorts, Inc.*(a) Pebblebrook Hotel Trust 94,860 Physicians Realty Trust 156,007 2,881,449PotlatchDeltic Corp. PS Business Parks, Inc. 14,496 2,146,568Rayonier, Inc.(a) 101,051 Rexford Industrial Realty, Inc.
(a) 97,066 5,527,909 2,845,406
SL Green Realty Corp.(a) 50,098 4,007,840Spirit Realty Capital, Inc. 82,974
176,262 6,082,802
Weingarten Realty Investors 86,850 2,785,279 156,750,698
Food & Staples Retailing 0.8%BJ's Wholesale Club Holdings,
Inc.* 99,168 Casey's General Stores, Inc. 26,690 5,194,942
Corp.*(a) 2,222,954Sprouts Farmers Market,
Inc.*(a) 2,121,270 14,257,579
Food Products 1.8%Darling Ingredients, Inc.* 7,978,028Flowers Foods, Inc. Hain Celestial Group, Inc.
(The)*(a) 58,910 Ingredion, Inc. 48,480 Lancaster Colony Corp. Pilgrim's Pride Corp.* 757,514Post Holdings, Inc.* 42,994 Sanderson Farms, Inc. 2,698,497Tootsie Roll Industries, Inc.(a) 459,480TreeHouse Foods, Inc.* 40,825 1,817,529
Gas Utilities 1.3%National Fuel Gas Co.(a) 65,854 New Jersey Resources Corp. 70,085
Southwest Gas Holdings, Inc. 42,109 2,787,195Spire, Inc. 2,697,261
151,749 7,027,496 21,589,565
Health Care Equipment & Supplies 3.3% Holdings Corp.* 116,615
Globus Medical, Inc., Class A* Haemonetics Corp.* 2,446,554Hill-Rom Holdings, Inc. 5,497,075
2,974,427Integra LifeSciences Holdings
Corp.* LivaNova plc*
Common Stocks
Shares Value ($)Health Care Equipment & SuppliesMasimo Corp.* 8,849,425Neogen Corp.* NuVasive, Inc.*(a) 2,568,184Penumbra, Inc.*(a) 24,674 6,762,157Quidel Corp.*(a) 28,284 STAAR Surgical Co.*
Health Care Providers & Services 3.0%Acadia Healthcare Co., Inc.* 65,105 Amedisys, Inc.* 5,760,999Chemed Corp. 11,582 5,495,659
5,644,066, Inc.*(a) 60,567
LHC Group, Inc.*(a) 22,844 Molina Healthcare, Inc.* Patterson Cos., Inc.(a) 62,827 Progyny, Inc.*(a) 1,618,724R1 RCM, Inc.* 99,605 2,215,215Tenet Healthcare Corp.* 77,479
52,068,940Hotels, Restaurants & Leisure 2.8%Boyd Gaming Corp.* Choice Hotels International,
Inc.(a) 20,860 2,479,420Churchill Downs, Inc. 25,224 5,000,910
Store, Inc. Jack in the Box, Inc. 16,055 1,789,169Marriott Vacations Worldwide
Corp.* 4,924,441Papa John's International, Inc. 24,128 2,519,928
54,759
Texas Roadhouse, Inc. 4,599,611Travel + Leisure Co. 62,929 Wendy's Co. (The) 127,188 Wingstop, Inc. 21,596 Wyndham Hotels & Resorts,
Inc. 67,997
Household Durables 1.5%Helen of Troy Ltd.*(a) 4,072,626
64,267 2,616,952Taylor Morrison Home
Corp.*(a) 2,469,425Tempur Sealy International,
Inc.(a) 5,197,260Toll Brothers, Inc. 81,820 TopBuild Corp.* 4,717,449TRI Pointe Group, Inc.* 86,111
25,649,085Household Products 0.1%
1,806,621Industrial Conglomerates 0.4%Carlisle Cos., Inc. Insurance 4.0%Alleghany Corp.* 10,066 6,714,727
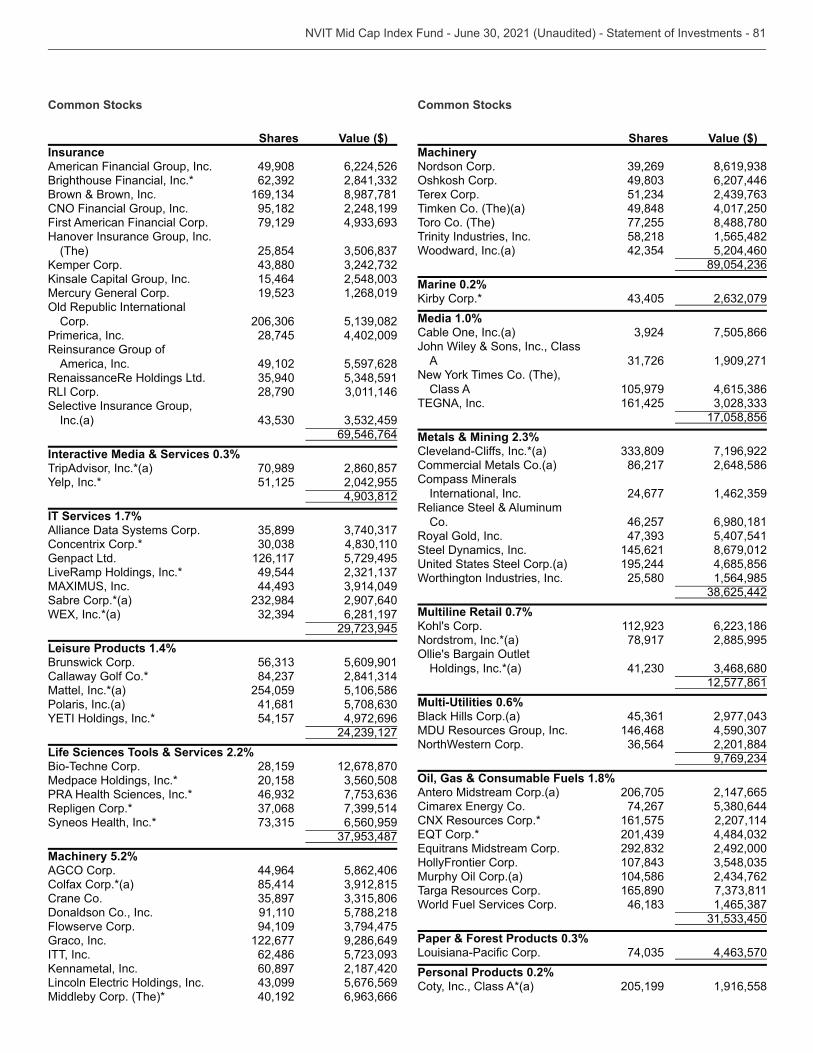
Common Stocks
Shares Value ($)InsuranceAmerican Financial Group, Inc. 49,908 6,224,526Brighthouse Financial, Inc.* Brown & Brown, Inc. 8,987,781
95,182 2,248,199First American Financial Corp. 79,129 Hanover Insurance Group, Inc.
(The) 25,854
Capital Group, Inc. 15,464 Mercury General Corp. 1,268,019
Corp. Primerica, Inc. 28,745 4,402,009Reinsurance Group of
America, Inc. 49,102 5,597,628RenaissanceRe Holdings Ltd. RLI Corp. 28,790 Selective Insurance Group,
Inc.(a) 69,546,764
Interactive Media & Services 0.3%TripAdvisor, Inc.*(a) 70,989 2,860,857
51,125 2,042,955
IT Services 1.7%Alliance Data Systems Corp. Concentrix Corp.* Genpact Ltd. 126,117 5,729,495LiveRamp Holdings, Inc.* 49,544
Sabre Corp.*(a) 2,907,640
6,281,197
Leisure Products 1.4%Brunswick Corp. 5,609,901Callaway Golf Co.* Mattel, Inc.*(a) 254,059 5,106,586Polaris, Inc.(a) 41,681
54,157 4,972,696
Life Sciences Tools & Services 2.2%Bio-Techne Corp. 28,159 12,678,870Medpace Holdings, Inc.* 20,158 PRA Health Sciences, Inc.* Repligen Corp.* Syneos Health, Inc.* 6,560,959
Machinery 5.2%
44,964 5,862,406Colfax Corp.*(a) 85,414 Crane Co. Donaldson Co., Inc. 91,110 5,788,218Flowserve Corp. 94,109 Graco, Inc. 122,677 9,286,649ITT, Inc. 62,486
60,897 2,187,420 5,676,569
Middleby Corp. (The)* 40,192
Common Stocks
Shares Value ($)MachineryNordson Corp.
6,207,446Terex Corp. Timken Co. (The)(a) 49,848 4,017,250Toro Co. (The) 77,255 8,488,780Trinity Industries, Inc. 58,218 1,565,482Woodward, Inc.(a) 5,204,460
Marine 0.2%
Media 1.0%
7,505,866John Wiley & Sons, Inc., Class
A 1,909,271
Class A 105,979 161,425
17,058,856Metals & Mining 2.3%Cleveland-Cliffs, Inc.*(a) 7,196,922Commercial Metals Co.(a) 86,217 2,648,586Compass Minerals
International, Inc. 24,677 Reliance Steel & Aluminum
Co. 46,257 6,980,181Royal Gold, Inc. 5,407,541Steel Dynamics, Inc. 145,621 8,679,012
195,244 4,685,856Worthington Industries, Inc. 25,580 1,564,985
Multiline Retail 0.7%
Nordstrom, Inc.*(a) 78,917 2,885,995
Holdings, Inc.*(a) 12,577,861
0.6%Black Hills Corp.(a)
146,468 NorthWestern Corp. 2,201,884
Oil, Gas & Consumable Fuels 1.8%Antero Midstream Corp.(a) 206,705 2,147,665
74,267 CNX Resources Corp.* 161,575 2,207,114
Midstream Corp. 2,492,000
HollyFrontier Corp. 104,586
Targa Resources Corp. 165,890 World Fuel Services Corp.
Paper & Forest Products 0.3%
Personal Products 0.2%Coty, Inc., Class A*(a) 205,199 1,916,558
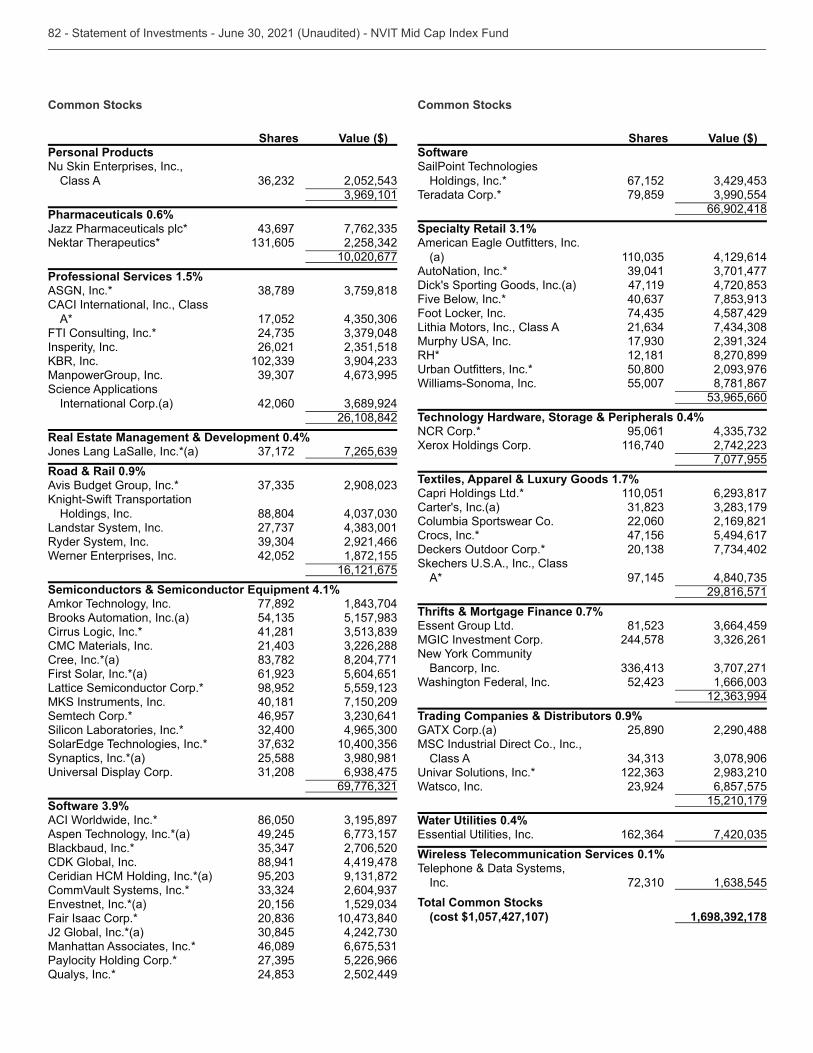
Common Stocks
Shares Value ($)Personal Products
Class A
Pharmaceuticals 0.6%Jazz Pharmaceuticals plc* Nektar Therapeutics*
10,020,677Professional Services 1.5%ASGN, Inc.* CACI International, Inc., Class
A* 17,052 FTI Consulting, Inc.* Insperity, Inc. 26,021
ManpowerGroup, Inc. Science Applications
International Corp.(a) 42,060 26,108,842
Real Estate Management & Development 0.4%Jones Lang LaSalle, Inc.*(a) Road & Rail 0.9%Avis Budget Group, Inc.*
Holdings, Inc. 88,804 Landstar System, Inc. Ryder System, Inc. 2,921,466
42,052 1,872,155 16,121,675
Semiconductors & Semiconductor Equipment 4.1%Amkor Technology, Inc. 77,892 Brooks Automation, Inc.(a) Cirrus Logic, Inc.* 41,281 CMC Materials, Inc. Cree, Inc.*(a) 8,204,771First Solar, Inc.*(a) 5,604,651Lattice Semiconductor Corp.* 98,952
40,181 7,150,209Semtech Corp.* 46,957 Silicon Laboratories, Inc.*
Technologies, Inc.* Synaptics, Inc.*(a) 25,588
Software 3.9%ACI Worldwide, Inc.* 86,050 Aspen Technology, Inc.*(a) 49,245 Blackbaud, Inc.* 2,706,520
88,941 4,419,478Ceridian HCM Holding, Inc.*(a) CommVault Systems, Inc.*
, Inc.*(a) 20,156 Fair Isaac Corp.* J2 Global, Inc.*(a) Manhattan Associates, Inc.* 46,089 Paylocity Holding Corp.* 5,226,966Qualys, Inc.* 2,502,449
Common Stocks
Shares Value ($)SoftwareSailPoint Technologies
Holdings, Inc.* 67,152 Teradata Corp.* 79,859
66,902,418Specialty Retail 3.1%
(a) 4,129,614AutoNation, Inc.* Dick's Sporting Goods, Inc.(a) 47,119 Five Below, Inc.* Foot Locker, Inc. 4,587,429Lithia Motors, Inc., Class A
RH* 12,181 8,270,899
50,800 Williams-Sonoma, Inc. 55,007 8,781,867
Technology Hardware, Storage & Peripherals 0.4%NCR Corp.* 95,061 Xerox Holdings Corp. 116,740
7,077,955Textiles, Apparel & Luxury Goods 1.7%Capri Holdings Ltd.* 110,051 Carter's, Inc.(a) Columbia Sportswear Co. 22,060 2,169,821Crocs, Inc.* 47,156 5,494,617Deckers Skechers
A* 97,145 29,816,571
Thrifts & Mortgage Finance 0.7% Group Ltd.
MGIC Investment Corp. 244,578
Bancorp, Inc. Washington Federal, Inc.
Trading Companies & Distributors 0.9%GATX Corp.(a) 25,890 2,290,488MSC Industrial Direct Co., Inc.,
Class A
Watsco, Inc. 6,857,575 15,210,179
Water Utilities 0.4%
Wireless Telecommunication Services 0.1%Telephone & Data Systems,
Inc. Total Common Stocks
(cost $1,057,427,107) 1,698,392,178
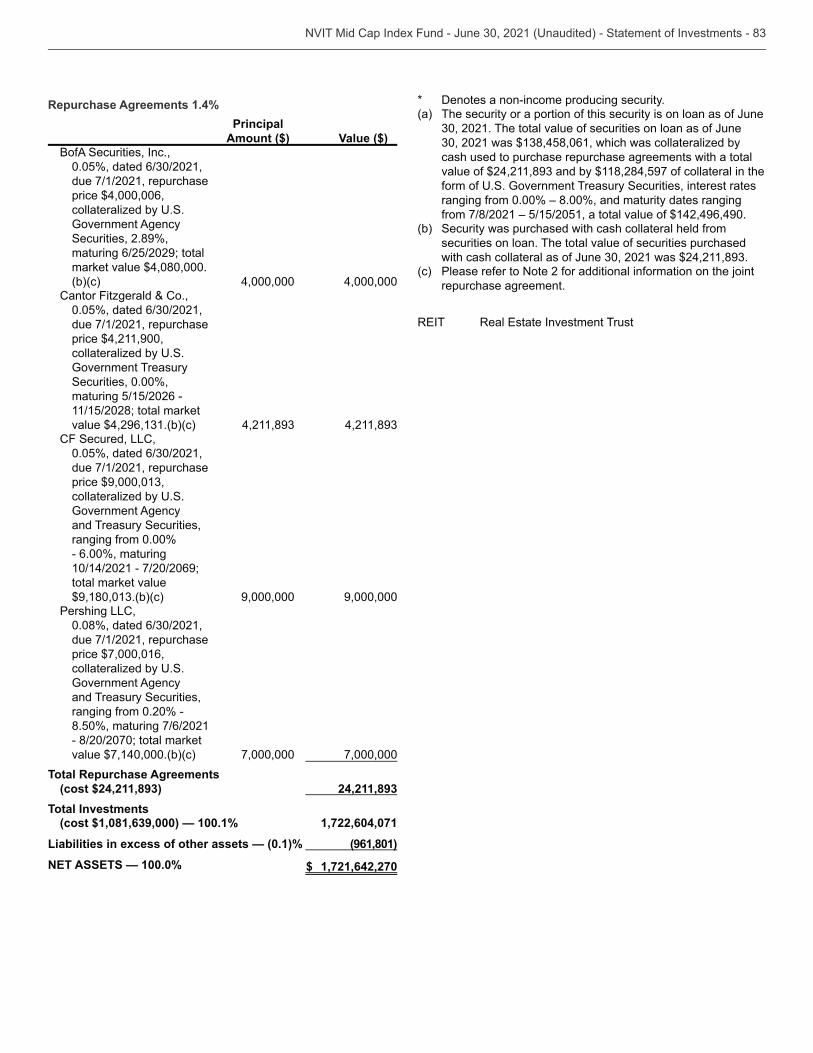
Repurchase Agreements 1.4% Principal
Amount ($) Value ($)BofA Securities, Inc.,
due 7/1/2021, repurchase price $4,000,006,
Government Agency Securities, 2.89%, maturing 6/25/2029; total market value $4,080,000.(b)(c) 4,000,000 4,000,000
Cantor Fitzgerald & Co.,
due 7/1/2021, repurchase price $4,211,900,
Government Treasury Securities, 0.00%, maturing 5/15/2026 - 11/15/2028; total market
CF Secured, LLC,
due 7/1/2021, repurchase
Government Agency and Treasury Securities, ranging from 0.00% - 6.00%, maturing 10/14/2021 - 7/20/2069; total market value
9,000,000 9,000,000Pershing LLC,
due 7/1/2021, repurchase price $7,000,016,
Government Agency and Treasury Securities, ranging from 0.20% - 8.50%, maturing 7/6/2021 - 8/20/2070; total market value $7,140,000.(b)(c) 7,000,000 7,000,000
Total Repurchase Agreements (cost $24,211,893) 24,211,893
Total Investments(cost $1,081,639,000) — 100.1% 1,722,604,071
Liabilities in excess of other assets — (0.1)% (961,801)
NET ASSETS — 100.0% $ 1,721,642,270
* Denotes a non-income producing security.(a) The security or a portion of this security is on loan as of June
cash used to purchase repurchase agreements with a total
ranging from 0.00% – 8.00%, and maturity dates ranging from 7/8/2021 – 5/15/2051, a total value of $142,496,490.
(b) Security was purchased with cash collateral held from securities on loan. The total value of securities purchased
(c) Please refer to Note 2 for additional information on the joint repurchase agreement.
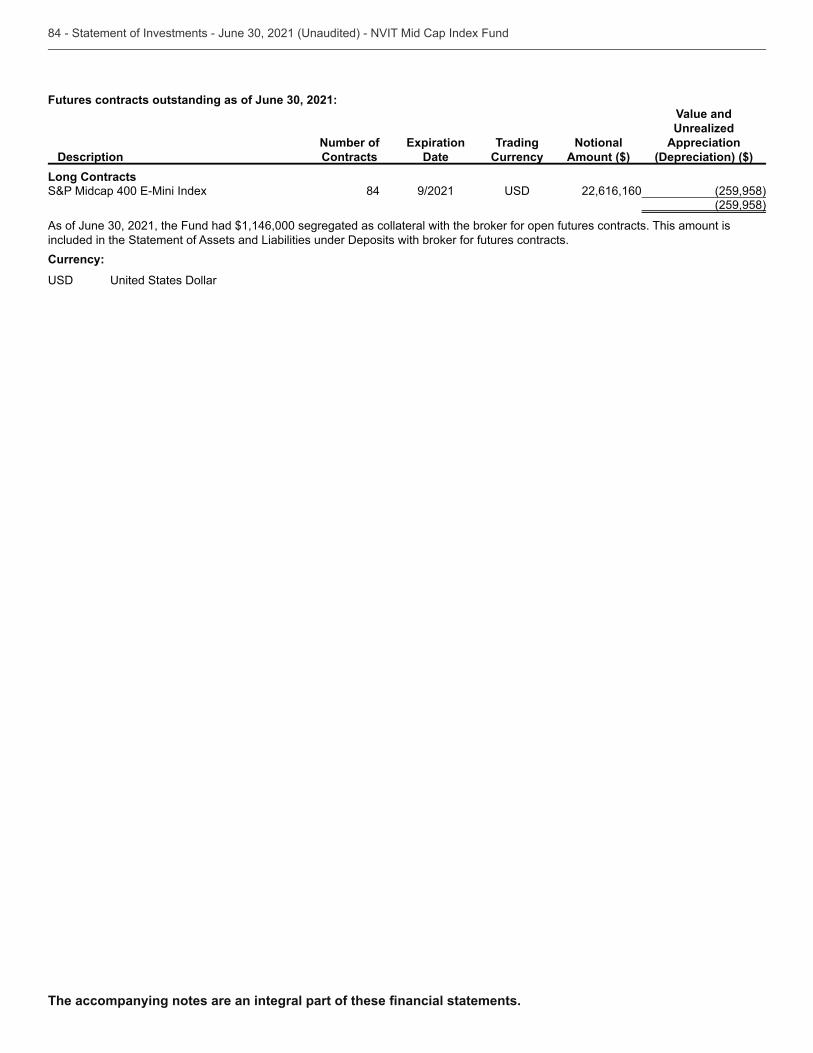
Futures contracts outstanding as of June 30, 2021:
DescriptionNumber of Contracts
Expiration Date
Trading Currency
Notional Amount ($)
Value and Unrealized
Appreciation (Depreciation) ($)
Long Contracts 84 9/2021 22,616,160 (259,958)
(259,958)
included in the Statement of Assets and Liabilities under Deposits with broker for futures contracts.Currency:
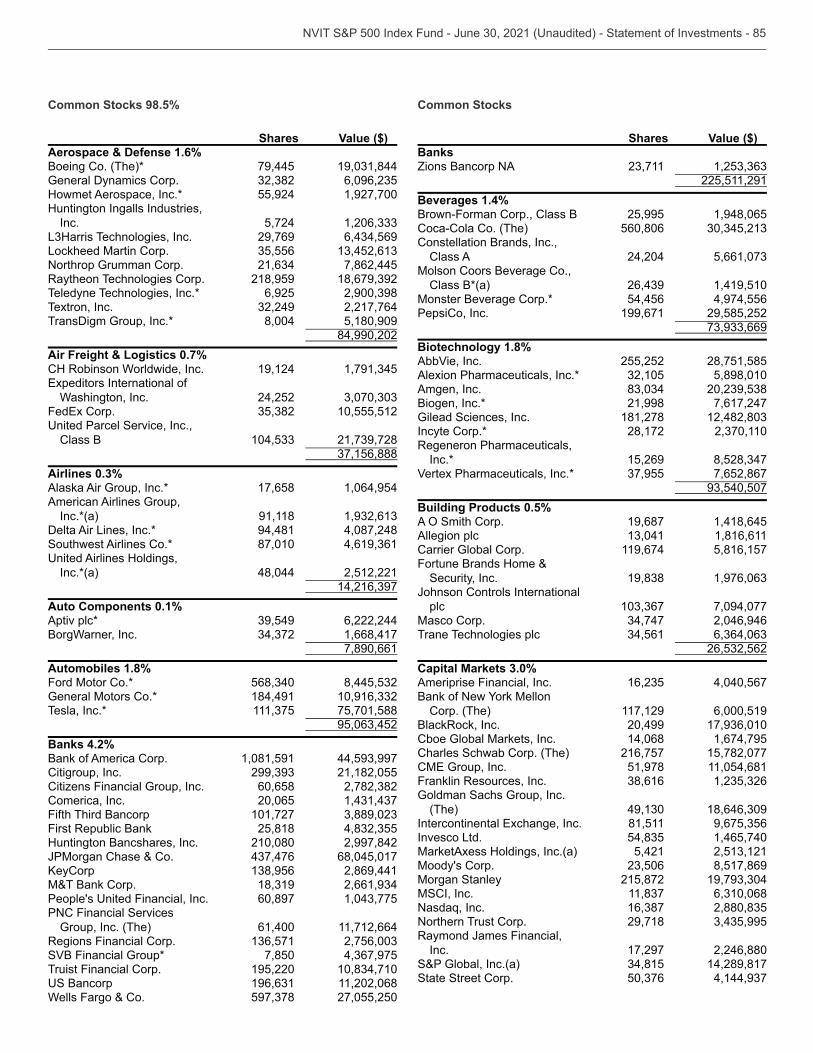
Common Stocks 98.5%
Shares Value ($)Aerospace & Defense 1.6%Boeing Co. (The)* 79,445 General Dynamics Corp. Howmet Aerospace, Inc.* 55,924 1,927,700Huntington Ingalls Industries,
Inc. 5,724 29,769
Lockheed Martin Corp. Northrop Grumman Corp. 7,862,445Raytheon Technologies Corp. 218,959 Teledyne Technologies, Inc.* 6,925 Textron, Inc. 2,217,764TransDigm Group, Inc.* 8,004 5,180,909
84,990,202Air Freight & Logistics 0.7%CH Robinson Worldwide, Inc. 19,124
Washington, Inc. 24,252 10,555,512
Class B
Airlines 0.3%Alaska Air Group, Inc.* 17,658 1,064,954American Airlines Group,
Inc.*(a) 91,118 Delta Air Lines, Inc.* 94,481 4,087,248Southwest Airlines Co.* 87,010
Inc.*(a) 48,044 2,512,221
Auto Components 0.1%Aptiv plc* 6,222,244BorgWarner, Inc. 1,668,417
7,890,661Automobiles 1.8%Ford Motor Co.* General Motors Co.* 184,491 Tesla, Inc.* 75,701,588
Banks 4.2%Bank of America Corp. 1,081,591 Citigroup, Inc. 21,182,055Citizens Financial Group, Inc. 60,658 Comerica, Inc. 20,065 Fifth Third Bancorp 101,727 First Republic Bank 25,818 Huntington Bancshares, Inc. 210,080 2,997,842JPMorgan Chase & Co. 68,045,017
2,869,441M&T Bank Corp.
60,897 PNC Financial Services
Group, Inc. (The) 61,400 11,712,664Regions Financial Corp. SVB Financial Group* 7,850 Truist Financial Corp. 195,220
11,202,068Wells Fargo & Co. 27,055,250
Common Stocks
Shares Value ($)BanksZions Bancorp NA
225,511,291Beverages 1.4%Brown-Forman Corp., Class B 25,995 1,948,065Coca-Cola Co. (The) 560,806 Constellation Brands, Inc.,
Class A 24,204 Molson Coors Beverage Co.,
Class B*(a) 1,419,510Monster Beverage Corp.* 54,456 4,974,556PepsiCo, Inc. 199,671 29,585,252
Biotechnology 1.8%AbbVie, Inc. 255,252 28,751,585Alexion Pharmaceuticals, Inc.* 5,898,010Amgen, Inc. Biogen, Inc.* 21,998 7,617,247Gilead Sciences, Inc. 181,278 Incyte Corp.* 28,172 Regeneron Pharmaceuticals,
Inc.* 15,269 Vertex Pharmaceuticals, Inc.* 7,652,867
Building Products 0.5%
19,687 1,418,645Allegion plc 1,816,611Carrier Global Corp. 119,674 5,816,157Fortune Brands Home &
Security, Inc. Johnson Controls International
plc 7,094,077Masco Corp. 2,046,946Trane Technologies plc
Capital Markets 3.0%Ameriprise Financial, Inc. 4,040,567
Corp. (The) 117,129 6,000,519BlackRock, Inc. 20,499 Cboe Global Markets, Inc. 14,068 1,674,795Charles Schwab Corp. (The) 216,757 15,782,077
51,978 11,054,681Franklin Resources, Inc. Goldman Sachs Group, Inc.
(The) 81,511
Invesco Ltd. 1,465,740MarketAxess Holdings, Inc.(a) 5,421 Moody's Corp. 8,517,869Morgan Stanley 215,872 MSCI, Inc.
Northern Trust Corp. 29,718 Raymond James Financial,
Inc. 17,297 2,246,880S&P Global, Inc.(a) 14,289,817State Street Corp.
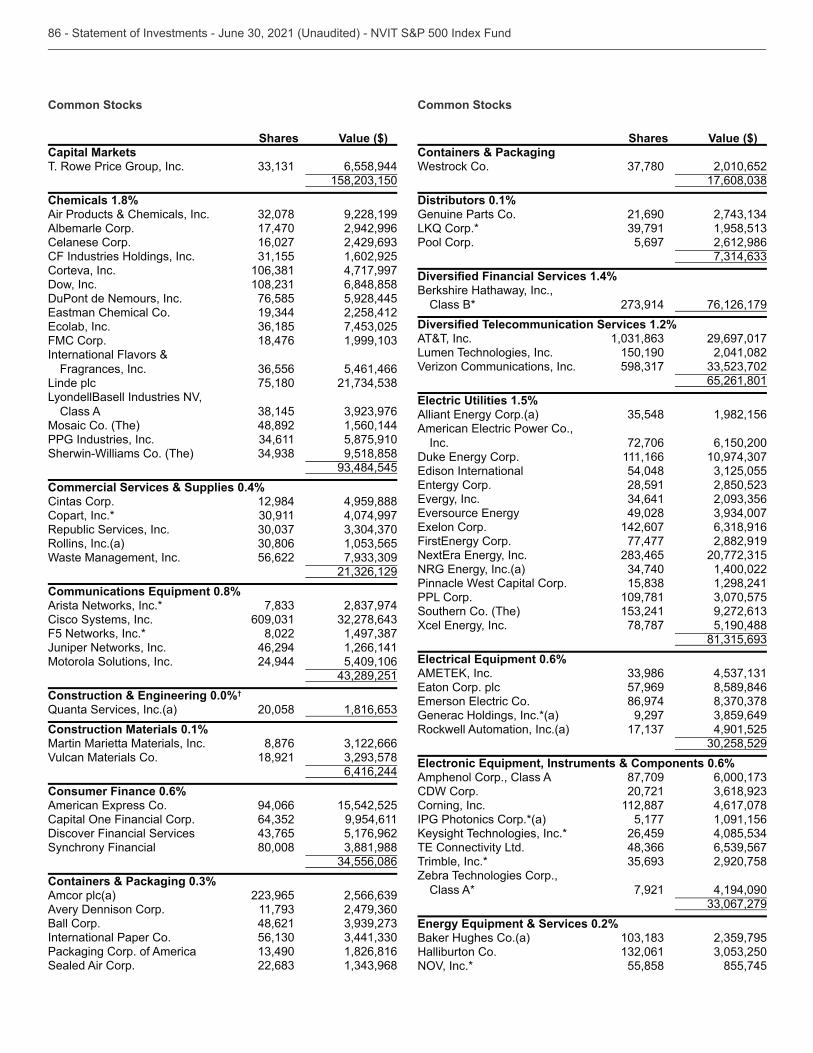
Common Stocks
Shares Value ($)Capital MarketsT. Rowe Price Group, Inc. 6,558,944
Chemicals 1.8%Air Products & Chemicals, Inc. 9,228,199Albemarle Corp. 17,470 2,942,996Celanese Corp. 16,027 CF Industries Holdings, Inc. 1,602,925Corteva, Inc. 4,717,997Dow, Inc. 6,848,858DuPont de Nemours, Inc. 76,585 5,928,445
2,258,412
FMC Corp. 18,476 International Flavors &
Fragrances, Inc. 5,461,466Linde plc 75,180 LyondellBasell Industries NV,
Class A Mosaic Co. (The) 48,892 1,560,144PPG Industries, Inc. 5,875,910Sherwin-Williams Co. (The) 9,518,858
Commercial Services & Supplies 0.4%Cintas Corp. 12,984 4,959,888Copart, Inc.* 4,074,997Republic Services, Inc. Rollins, Inc.(a) Waste Management, Inc. 56,622
Communications Equipment 0.8%Arista Networks, Inc.* Cisco Systems, Inc. F5 Networks, Inc.* 8,022 Juniper Networks, Inc. 46,294 1,266,141Motorola Solutions, Inc. 24,944 5,409,106
Construction & Engineering 0.0%†
Quanta Services, Inc.(a) 20,058 Construction Materials 0.1%Martin Marietta Materials, Inc. 8,876 Vulcan Materials Co. 18,921
6,416,244Consumer Finance 0.6%
94,066 15,542,525 9,954,611
Discover Financial Services 5,176,962Synchrony Financial 80,008
Containers & Packaging 0.3%Amcor plc(a) Avery Dennison Corp. Ball Corp. 48,621 International Paper Co. Packaging Corp. of America 1,826,816Sealed Air Corp.
Common Stocks
Shares Value ($)Containers & PackagingWestrock Co. 2,010,652
Distributors 0.1%Genuine Parts Co. 21,690
Pool Corp. 5,697 2,612,986
1.4%
Berkshire Hathaway, Inc., Class B* 76,126,179
1.2%AT&T, Inc. 29,697,017Lumen Technologies, Inc. 150,190 2,041,082Verizon Communications, Inc.
65,261,801Electric Utilities 1.5%
1,982,156
Inc. 72,706 6,150,200 111,166 54,048 28,591
, Inc. 49,028 142,607 77,477 2,882,919 1,400,022
Pinnacle West Capital Corp. 1,298,241PPL Corp. 109,781 Southern Co. (The)
78,787 5,190,488
Electrical Equipment 0.6% 57,969 8,589,846 86,974
Generac Holdings, Inc.*(a) 9,297 Rockwell Automation, Inc.(a) 4,901,525
Electronic Equipment, Instruments & Components 0.6%Amphenol Corp., Class A 87,709 CDW Corp. 20,721 Corning, Inc. 112,887 4,617,078IPG Photonics Corp.*(a) 5,177 1,091,156
Technologies, Inc.* 26,459
Trimble, Inc.* 2,920,758Zebra Technologies Corp.,
Class A* 7,921 4,194,090
Energy Equipment & Services 0.2%Baker Hughes Co.(a) Halliburton Co.
55,858 855,745
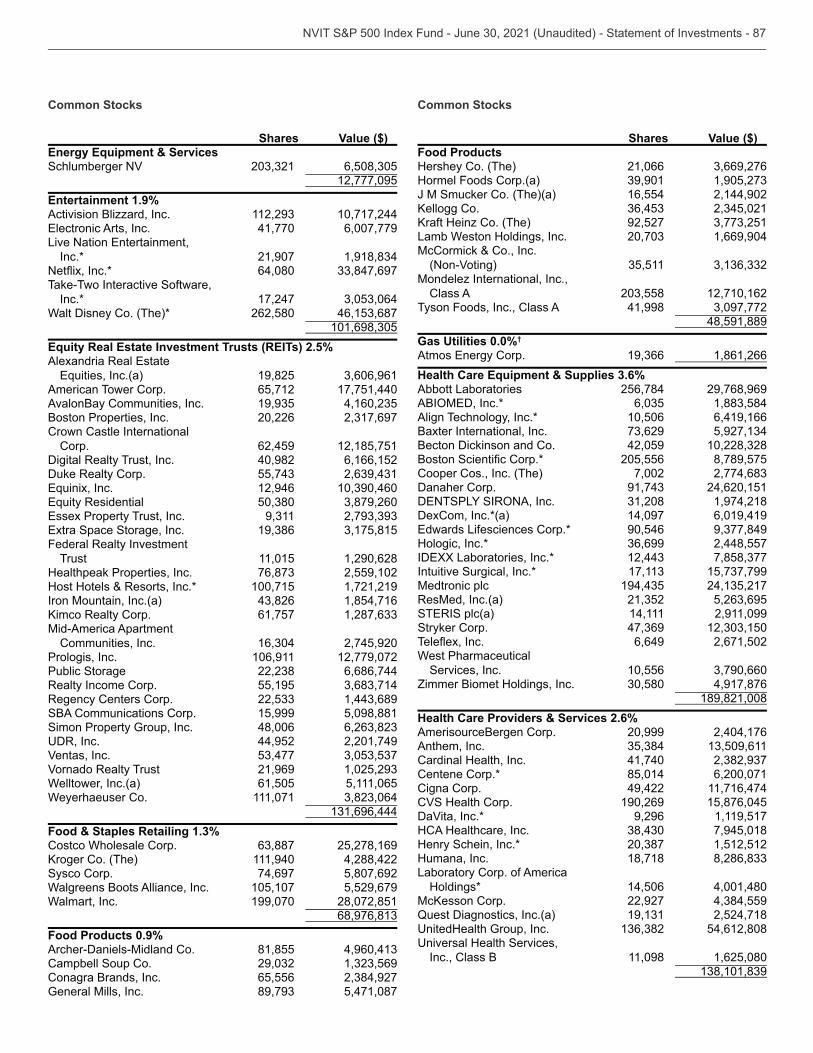
Common Stocks
Shares Value ($)Energy Equipment & ServicesSchlumberger NV
12,777,095Entertainment 1.9%Activision Blizzard, Inc. 10,717,244
41,770 6,007,779
Inc.* 21,907 64,080
Take-Two Interactive Software, Inc.* 17,247
Walt Disney Co. (The)* 262,580
Equity Real Estate Investment Trusts (REITs) 2.5%
19,825 American Tower Corp. 65,712 17,751,440AvalonBay Communities, Inc. Boston Properties, Inc. 20,226 Crown Castle International
Corp. 62,459 12,185,751Digital Realty Trust, Inc. 40,982 6,166,152Duke Realty Corp.
, Inc. 12,946
Federal Realty Investment Trust 11,015 1,290,628
Healthpeak Properties, Inc. 2,559,102Host Hotels & Resorts, Inc.* 100,715 1,721,219Iron Mountain, Inc.(a) 1,854,716
Realty Corp. 61,757 Mid-America Apartment
Communities, Inc. 2,745,920Prologis, Inc. 106,911 12,779,072Public Storage 6,686,744Realty Income Corp. 55,195 Regency Centers Corp. SBA Communications Corp. 15,999 5,098,881Simon Property Group, Inc. 48,006
44,952 2,201,749Ventas, Inc. Vornado Realty Trust 21,969 Welltower, Inc.(a) 61,505 5,111,065Weyerhaeuser Co. 111,071
Food & Staples Retailing 1.3%Costco Wholesale Corp. 25,278,169
111,940 4,288,422Sysco Corp. 74,697 5,807,692Walgreens Boots Alliance, Inc. 105,107 5,529,679Walmart, Inc. 199,070 28,072,851
Food Products 0.9%Archer-Daniels-Midland Co. 81,855 Campbell Soup Co. Conagra Brands, Inc. 65,556 General Mills, Inc. 5,471,087
Common Stocks
Shares Value ($)Food ProductsHershey Co. (The) 21,066 Hormel Foods Corp.(a) J M Smucker Co. (The)(a) 16,554 2,144,902
92,527
Lamb Weston Holdings, Inc. 1,669,904McCormick & Co., Inc.
(Non-Voting) Mondelez International, Inc.,
Class A 12,710,162Tyson Foods, Inc., Class A 41,998
48,591,889Gas Utilities 0.0%†
Atmos 1,861,266Health Care Equipment & Supplies 3.6%Abbott Laboratories 256,784 29,768,969
Align Technology, Inc.* 10,506 6,419,166Baxter International, Inc. Becton Dickinson and Co. 42,059
205,556 8,789,575Cooper Cos., Inc. (The) 7,002 Danaher Corp. 24,620,151
1,974,218DexCom, Inc.*(a) 14,097 6,019,419
90,546 Hologic, Inc.* 2,448,557
Intuitive Surgical, Inc.* Medtronic plc ResMed, Inc.(a)
14,111 2,911,099Stryker Corp.
6,649 2,671,502West Pharmaceutical
Services, Inc. 10,556 Zimmer Biomet Holdings, Inc. 4,917,876
189,821,008Health Care Providers & Services 2.6%AmerisourceBergen Corp. 20,999 2,404,176Anthem, Inc. Cardinal Health, Inc. 41,740 Centene Corp.* 85,014 6,200,071Cigna Corp. 49,422 11,716,474CVS Health Corp. 190,269 15,876,045DaVita, Inc.* 9,296 1,119,517HCA Healthcare, Inc. 7,945,018Henry Schein, Inc.* 1,512,512Humana, Inc. 18,718 Laboratory Corp. of America
Holdings* 14,506 4,001,480 22,927
Quest Diagnostics, Inc.(a) 2,524,718 54,612,808
Inc., Class B 11,098 1,625,080
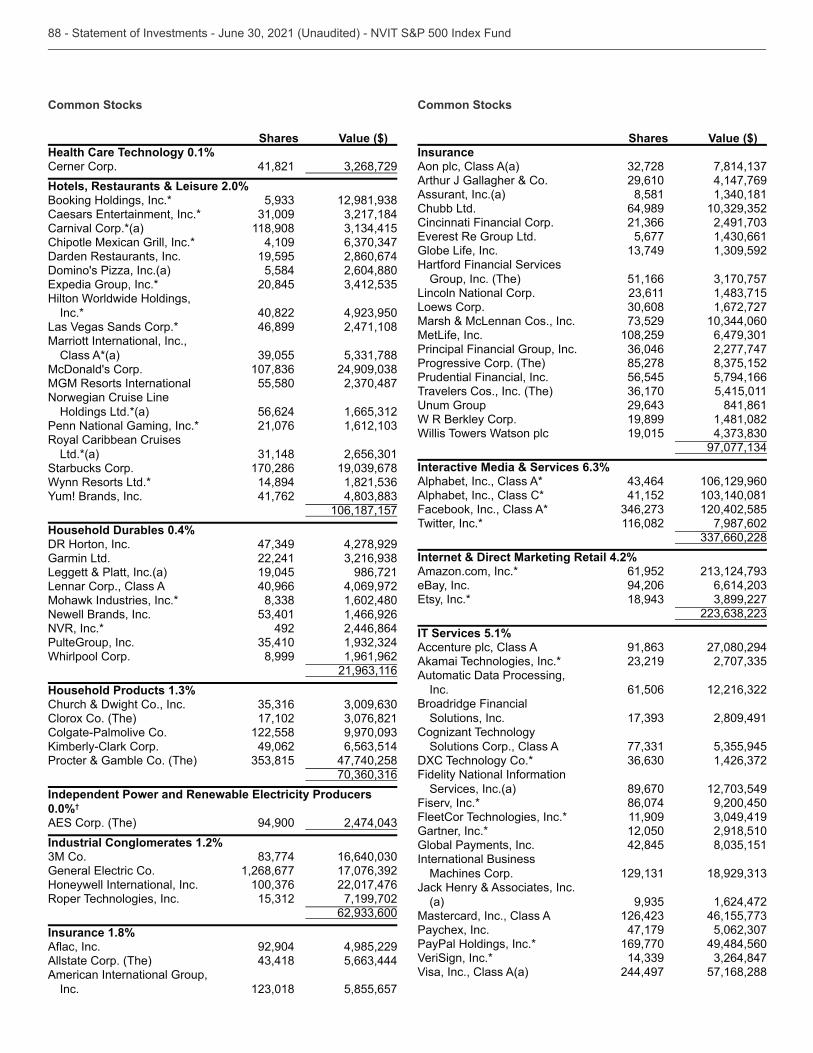
Common Stocks
Shares Value ($)Health Care Technology 0.1%Cerner Corp. 41,821 Hotels, Restaurants & Leisure 2.0%Booking Holdings, Inc.*
Carnival Corp.*(a) 118,908 Chipotle Mexican Grill, Inc.* 4,109 Darden Restaurants, Inc. 19,595 2,860,674Domino's Pizza, Inc.(a) 5,584 2,604,880
20,845 Hilton Worldwide Holdings,
Inc.* 40,822 Las Vegas Sands Corp.* 46,899 2,471,108Marriott International, Inc.,
Class A*(a) McDonald's Corp. MGM Resorts International 55,580 Norwegian Cruise Line
Holdings Ltd.*(a) 56,624 Penn National Gaming, Inc.* 21,076 Royal Caribbean Cruises
Ltd.*(a) Starbucks Corp. 170,286 Wynn Resorts Ltd.* 14,894
41,762 106,187,157
Household Durables 0.4%DR Horton, Inc. 4,278,929Garmin Ltd. 22,241 Leggett & Platt, Inc.(a) 19,045 986,721Lennar Corp., Class A 40,966 4,069,972Mohawk Industries, Inc.* 1,602,480Newell Brands, Inc. 1,466,926NVR, Inc.* 492 2,446,864PulteGroup, Inc. Whirlpool Corp. 8,999 1,961,962
Household Products 1.3%Church & Dwight Co., Inc. Clorox Co. (The) 17,102 Colgate-Palmolive Co. 122,558
49,062 Procter & Gamble Co. (The) 47,740,258
Independent Power and Renewable Electricity Producers 0.0%†
94,900 Industrial Conglomerates 1.2%
1,268,677
Honeywell International, Inc. 22,017,476Roper Technologies, Inc. 7,199,702
Insurance 1.8%
92,904 4,985,229Allstate Corp. (The) American International Group,
Inc. 5,855,657
Common Stocks
Shares Value ($)InsuranceAon plc, Class A(a) Arthur J Gallagher & Co. 29,610 4,147,769Assurant, Inc.(a) 8,581 Chubb Ltd. 64,989 Cincinnati Financial Corp.
5,677 Globe Life, Inc. Hartford Financial Services
Group, Inc. (The) 51,166 Lincoln National Corp. Loews Corp. 1,672,727Marsh & McLennan Cos., Inc. MetLife, Inc. 108,259 Principal Financial Group, Inc. 2,277,747Progressive Corp. (The) 85,278 Prudential Financial, Inc. 56,545 5,794,166Travelers Cos., Inc. (The) 5,415,011
841,861W R Berkley Corp. 19,899 1,481,082Willis Towers Watson plc 19,015
Interactive Media & Services 6.3%Alphabet, Inc., Class A* 106,129,960Alphabet, Inc., Class C* 41,152 Facebook, Inc., Class A* 120,402,585Twitter, Inc.* 116,082 7,987,602
Internet & Direct Marketing Retail 4.2%Amazon.com, Inc.* 61,952 eBay, Inc. 94,206
IT Services 5.1%Accenture plc, Class A 27,080,294Akamai Technologies, Inc.* Automatic Data Processing,
Inc. 61,506 Broadridge Financial
Solutions, Inc. 2,809,491Cognizant Technology
Solutions Corp., Class A DXC Technology Co.* Fidelity National Information
Services, Inc.(a) 89,670 Fiserv, Inc.* 86,074 9,200,450FleetCor Technologies, Inc.* 11,909 Gartner, Inc.* 12,050 2,918,510Global Payments, Inc. 42,845 International Business
Machines Corp. Jack Henry & Associates, Inc.
(a) 1,624,472Mastercard, Inc., Class A Paychex, Inc. 47,179 PayPal Holdings, Inc.* 169,770 49,484,560VeriSign, Inc.* Visa, Inc., Class A(a) 244,497 57,168,288
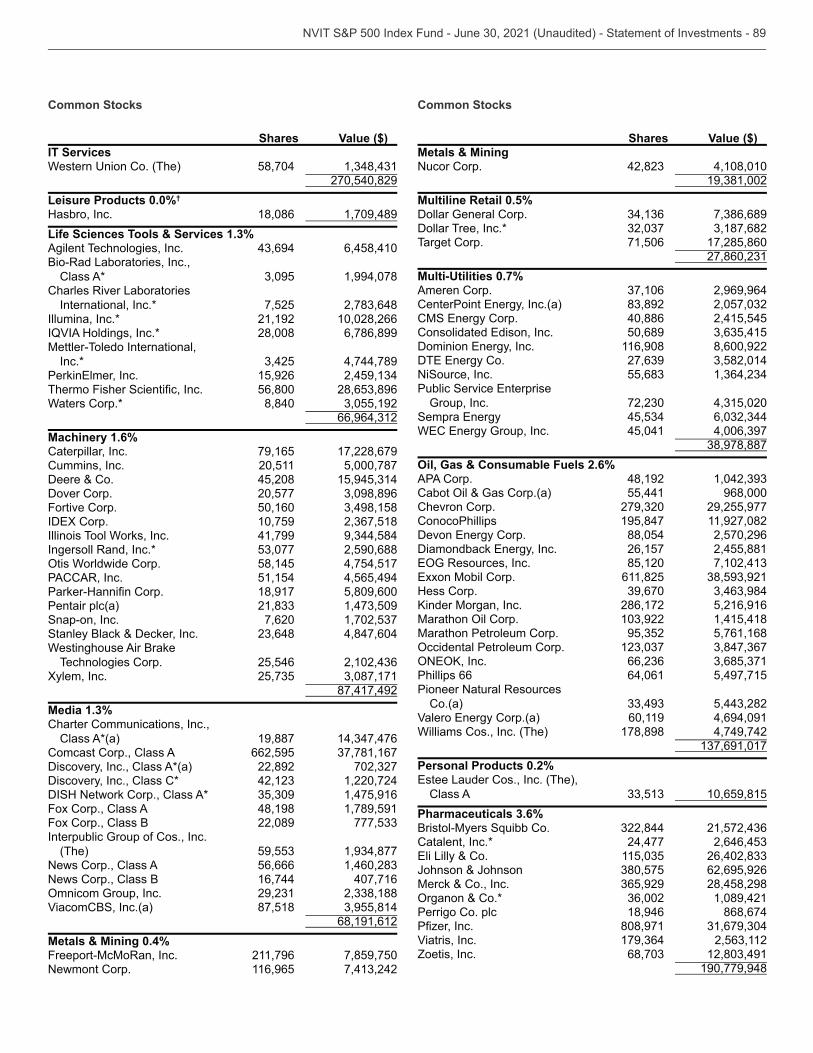
Common Stocks
Shares Value ($)IT Services
58,704 270,540,829
Leisure Products 0.0%†
Hasbro, Inc. 18,086 1,709,489Life Sciences Tools & Services 1.3%Agilent Technologies, Inc. 6,458,410Bio-Rad Laboratories, Inc.,
Class A* 1,994,078Charles River Laboratories
International, Inc.* 7,525 Illumina, Inc.* 21,192 10,028,266IQVIA Holdings, Inc.* 28,008 6,786,899Mettler-Toledo International,
Inc.* 4,744,789 15,926
Thermo 56,800 Waters Corp.* 8,840
Machinery 1.6%Caterpillar, Inc. 79,165 17,228,679Cummins, Inc. 20,511 5,000,787Deere & Co. 45,208 Dover Corp. 20,577 Fortive Corp. 50,160
10,759 Illinois Tool Works, Inc. 41,799 Ingersoll Rand, Inc.* 2,590,688
58,145 4,754,517PACCAR, Inc. 51,154 4,565,494
18,917 5,809,600Pentair plc(a) Snap-on, Inc. 7,620 Stanley Black & Decker, Inc. 4,847,604Westinghouse Air Brake
Technologies Corp. 25,546 Xylem, Inc.
87,417,492Media 1.3%Charter Communications, Inc.,
Class A*(a) 19,887 Comcast Corp., Class A 662,595 Discovery, Inc., Class A*(a) 22,892 Discovery, Inc., Class C* 1,220,724DISH Network Corp., Class A* 1,475,916Fox Corp., Class A 48,198 1,789,591Fox Corp., Class B 22,089 Interpublic Group of Cos., Inc.
(The) News Corp., Class A 56,666 News Corp., Class B 16,744 407,716
ViacomCBS, Inc.(a) 87,518
68,191,612Metals & Mining 0.4%Freeport-McMoRan, Inc. 211,796 7,859,750Newmont Corp. 116,965
Common Stocks
Shares Value ($)Metals & MiningNucor Corp. 4,108,010
Multiline Retail 0.5%Dollar General Corp. Dollar Tree, Inc.* Target Corp. 71,506 17,285,860
0.7%
Ameren Corp. 2,969,964 40,886 2,415,545 50,689 116,908 8,600,922
NiSource, Inc.
Group, Inc. 45,041
Oil, Gas & Consumable Fuels 2.6%APA Corp. 48,192
55,441 968,000Chevron Corp. 29,255,977ConocoPhillips 195,847 11,927,082
88,054 2,570,296 26,157 2,455,881 85,120 611,825
Hess Corp. 286,172 5,216,916 1,415,418
Marathon Petroleum Corp. 5,761,168
Phillips 66 64,061 5,497,715Pioneer Natural Resources
Co.(a) 60,119 4,694,091
Williams Cos., Inc. (The) 178,898 4,749,742
Personal Products 0.2%
Class A 10,659,815Pharmaceuticals 3.6%
Catalent, Inc.* 24,477
Johnson & Johnson 62,695,926Merck & Co., Inc. 28,458,298
& Co.* 1,089,421Perrigo Co. plc 18,946 868,674
808,971 Viatris, Inc. Zoetis, Inc.
190,779,948
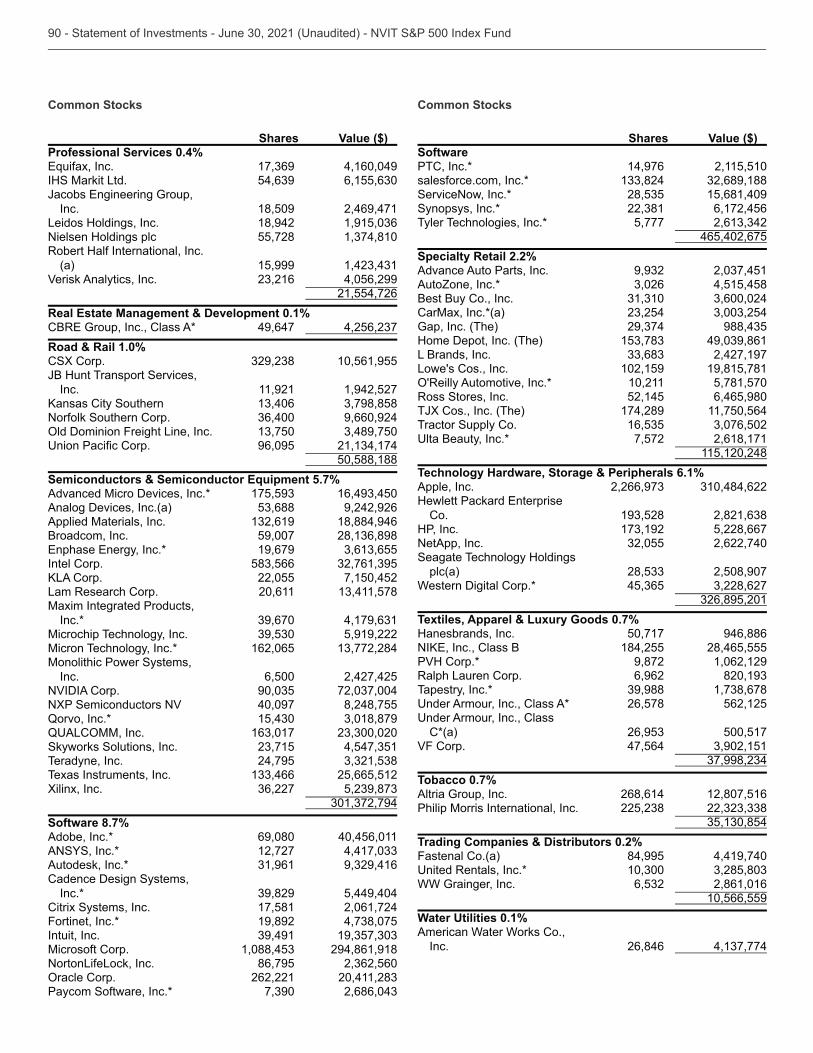
Common Stocks
Shares Value ($)Professional Services 0.4%
4,160,049IHS Markit Ltd.
Inc. 18,509 2,469,471Leidos Holdings, Inc. 18,942 Nielsen Holdings plc 55,728 Robert Half International, Inc.
(a) 15,999 Verisk Analytics, Inc. 4,056,299
21,554,726Real Estate Management & Development 0.1%
49,647 Road & Rail 1.0%CSX Corp. 10,561,955JB Hunt Transport Services,
Inc. 11,921 1,942,527
Norfolk Southern Corp. 9,660,924 96,095
50,588,188Semiconductors & Semiconductor Equipment 5.7%Advanced Micro Devices, Inc.* Analog Devices, Inc.(a) 9,242,926Applied Materials, Inc. 18,884,946Broadcom, Inc. 59,007
19,679 Intel Corp.
22,055 7,150,452Lam Research Corp. 20,611 Maxim Integrated Products,
Inc.* Microchip Technology, Inc. 5,919,222Micron Technology, Inc.* 162,065 Monolithic Power Systems,
Inc. 6,500 2,427,425NVIDIA Corp. NXP Semiconductors NV 40,097 8,248,755Qorvo, Inc.*
Skyworks Solutions, Inc. Teradyne, Inc. 24,795 Texas Instruments, Inc. 25,665,512Xilinx, Inc.
Software 8.7%Adobe, Inc.* 69,080 40,456,011
12,727 Autodesk, Inc.* Cadence Design Systems,
Inc.* 5,449,404Citrix Systems, Inc. 17,581 2,061,724Fortinet, Inc.* 19,892 Intuit, Inc. Microsoft Corp. 294,861,918NortonLifeLock, Inc. 86,795
262,221 Paycom Software, Inc.*
Common Stocks
Shares Value ($)SoftwarePTC, Inc.* 14,976 2,115,510salesforce.com, Inc.* ServiceNow, Inc.* 15,681,409Synopsys, Inc.* 6,172,456Tyler Technologies, Inc.* 5,777
465,402,675Specialty Retail 2.2%Advance Auto Parts, Inc. AutoZone, Inc.* 4,515,458Best Buy Co., Inc. CarMax, Inc.*(a) Gap, Inc. (The) Home Depot, Inc. (The) L Brands, Inc. 2,427,197Lowe's Cos., Inc. 102,159 19,815,781
10,211 5,781,570Ross Stores, Inc. 52,145 6,465,980TJX Cos., Inc. (The) 174,289 11,750,564Tractor Supply Co.
Beauty, Inc.* 7,572 2,618,171 115,120,248
Technology Hardware, Storage & Peripherals 6.1%Apple, Inc.
Co. HP, Inc. 5,228,667NetApp, Inc. 2,622,740Seagate Technology Holdings
plc(a) 2,508,907Western Digital Corp.*
Textiles, Apparel & Luxury Goods 0.7%Hanesbrands, Inc. 50,717 946,886
184,255 28,465,555PVH Corp.* 9,872 1,062,129Ralph Lauren Corp. 6,962 Tapestry, Inc.*
Armour, Inc., Class A* 26,578 562,125Armour, Inc., Class
C*(a) 500,517VF Corp. 47,564
Tobacco 0.7%Altria Group, Inc. 268,614 12,807,516Philip Morris International, Inc.
Trading Companies & Distributors 0.2%Fastenal Co.(a) 84,995 4,419,740
WW Grainger, Inc. 2,861,016
10,566,559Water Utilities 0.1%American Water Works Co.,
Inc. 26,846
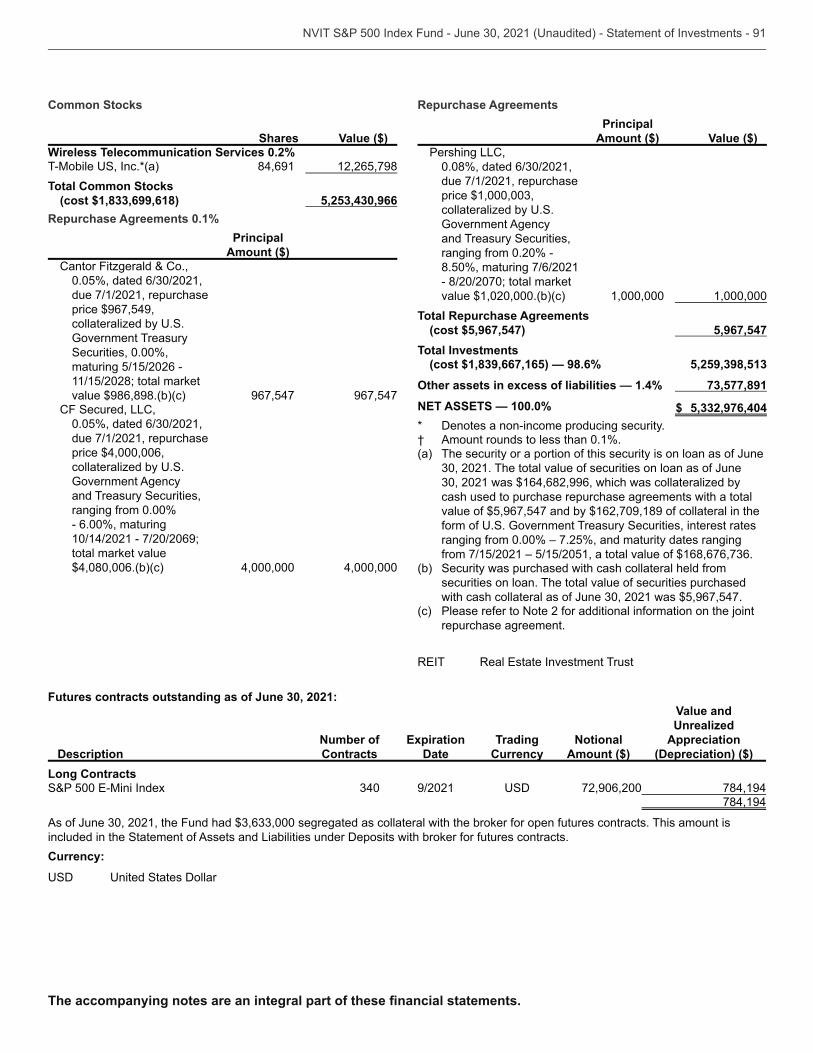
Common Stocks
Shares Value ($)Wireless Telecommunication Services 0.2%
84,691 12,265,798Total Common Stocks
(cost $1,833,699,618) 5,253,430,966Repurchase Agreements 0.1%
Principal Amount ($)
Cantor Fitzgerald & Co.,
due 7/1/2021, repurchase price $967,549,
Government Treasury Securities, 0.00%, maturing 5/15/2026 - 11/15/2028; total market value $986,898.(b)(c) 967,547 967,547
CF Secured, LLC,
due 7/1/2021, repurchase price $4,000,006,
Government Agency and Treasury Securities, ranging from 0.00% - 6.00%, maturing 10/14/2021 - 7/20/2069; total market value $4,080,006.(b)(c) 4,000,000 4,000,000
Repurchase Agreements
Principal
Amount ($) Value ($)Pershing LLC,
due 7/1/2021, repurchase
Government Agency and Treasury Securities, ranging from 0.20% - 8.50%, maturing 7/6/2021 - 8/20/2070; total market value $1,020,000.(b)(c) 1,000,000 1,000,000
Total Repurchase Agreements (cost $5,967,547) 5,967,547
Total Investments(cost $1,839,667,165) — 98.6% 5,259,398,513
Other assets in excess of liabilities — 1.4% 73,577,891
NET ASSETS — 100.0% $ 5,332,976,404* Denotes a non-income producing security.† Amount rounds to less than 0.1%.(a) The security or a portion of this security is on loan as of June
cash used to purchase repurchase agreements with a total value of $5,967,547 and by $162,709,189 of collateral in the
ranging from 0.00% – 7.25%, and maturity dates ranging
(b) Security was purchased with cash collateral held from securities on loan. The total value of securities purchased
(c) Please refer to Note 2 for additional information on the joint repurchase agreement.
Futures contracts outstanding as of June 30, 2021:
DescriptionNumber of Contracts
Expiration Date
Trading Currency
Notional Amount ($)
Value and Unrealized
Appreciation (Depreciation) ($)
Long Contracts 9/2021 72,906,200 784,194
784,194
included in the Statement of Assets and Liabilities under Deposits with broker for futures contracts.Currency:
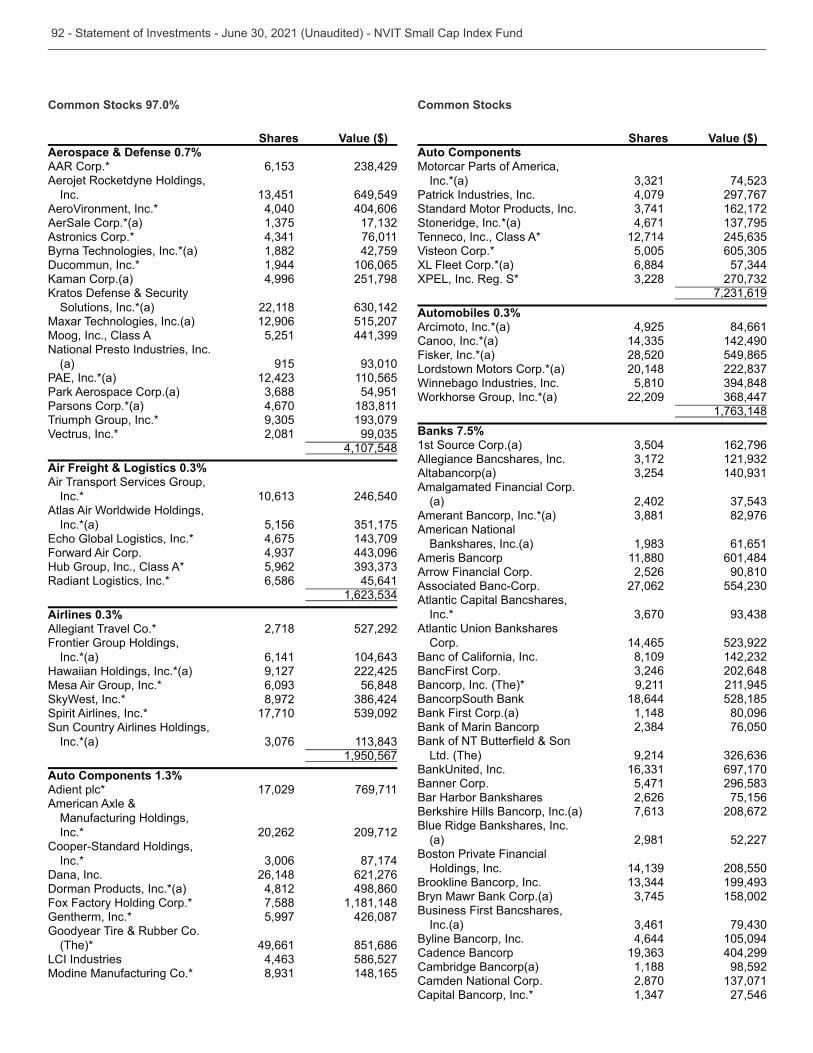
Common Stocks 97.0%
Shares Value ($)Aerospace & Defense 0.7%AAR Corp.* Aerojet Rocketdyne Holdings,
Inc. 649,549AeroVironment, Inc.* 4,040 404,606AerSale Corp.*(a) Astronics Corp.* 76,011Byrna Technologies, Inc.*(a) 1,882 42,759Ducommun, Inc.* 1,944 106,065
4,996 251,798
Solutions, Inc.*(a) 22,118 Maxar Technologies, Inc.(a) 12,906 515,207Moog, Inc., Class A 5,251 National Presto Industries, Inc.
(a) 915 110,565
Park Aerospace Corp.(a) 54,951Parsons Corp.*(a) 4,670 Triumph Group, Inc.* Vectrus, Inc.* 2,081
4,107,548Air Freight & Logistics 0.3%Air Transport Services Group,
Inc.* 246,540Atlas Air Worldwide Holdings,
Inc.*(a) 5,156 4,675
Forward Air Corp. Hub Group, Inc., Class A* 5,962 Radiant Logistics, Inc.* 6,586 45,641
Airlines 0.3%Allegiant Travel Co.* 2,718 527,292Frontier Group Holdings,
Inc.*(a) 6,141 Hawaiian Holdings, Inc.*(a) 9,127 222,425Mesa Air Group, Inc.* 56,848SkyWest, Inc.* 8,972 Spirit Airlines, Inc.* 17,710 Sun Country Airlines Holdings,
Inc.*(a) 1,950,567
Auto Components 1.3%Adient plc* 17,029 769,711American Axle &
Manufacturing Holdings, Inc.* 20,262 209,712
Cooper-Standard Holdings, Inc.* 87,174
Dana, Inc. 26,148 621,276Dorman Products, Inc.*(a) 4,812 498,860Fox Factory Holding Corp.* 7,588 1,181,148Gentherm, Inc.* 5,997 426,087Goodyear Tire & Rubber Co.
(The)* 49,661 851,686LCI Industries 586,527Modine Manufacturing Co.* 148,165
Common Stocks
Shares Value ($)Auto ComponentsMotorcar Parts of America,
Inc.*(a) Patrick Industries, Inc. 4,079 297,767Standard Motor Products, Inc. 162,172Stoneridge, Inc.*(a) 4,671 Tenneco, Inc., Class A* 12,714 Visteon Corp.* 5,005 XL Fleet Corp.*(a) 6,884
Automobiles 0.3%Arcimoto, Inc.*(a) 4,925 84,661Canoo, Inc.*(a) 142,490Fisker, Inc.*(a) 28,520 549,865Lordstown Motors Corp.*(a) 20,148 Winnebago Industries, Inc. 5,810 Workhorse Group, Inc.*(a) 22,209
Banks 7.5%1st Source Corp.(a) 162,796Allegiance Bancshares, Inc. Altabancorp(a) Amalgamated Financial Corp.
(a) 2,402 Amerant Bancorp, Inc.*(a) 82,976American National
Bankshares, Inc.(a) 61,651Ameris Bancorp 11,880 601,484Arrow Financial Corp. 2,526 90,810Associated Banc-Corp. 27,062 Atlantic Capital Bancshares,
Inc.*
Corp. 14,465 Banc of California, Inc. 8,109 BancFirst Corp. 202,648Bancorp, Inc. (The)* 9,211 211,945BancorpSouth Bank 18,644 528,185Bank First Corp.(a) 1,148 80,096Bank of Marin Bancorp 76,050
Ltd. (The) 9,214 697,170
Banner Corp. 5,471 Bar Harbor Bankshares 2,626 75,156Berkshire Hills Bancorp, Inc.(a) 208,672Blue Ridge Bankshares, Inc.
(a) 2,981 52,227Boston Private Financial
Holdings, Inc. 208,550Brookline Bancorp, Inc. Bryn Mawr Bank Corp.(a) 158,002Business First Bancshares,
Inc.(a) Byline Bancorp, Inc. 4,644 105,094Cadence Bancorp 404,299Cambridge Bancorp(a) 1,188 98,592Camden National Corp. 2,870 Capital Bancorp, Inc.* 27,546
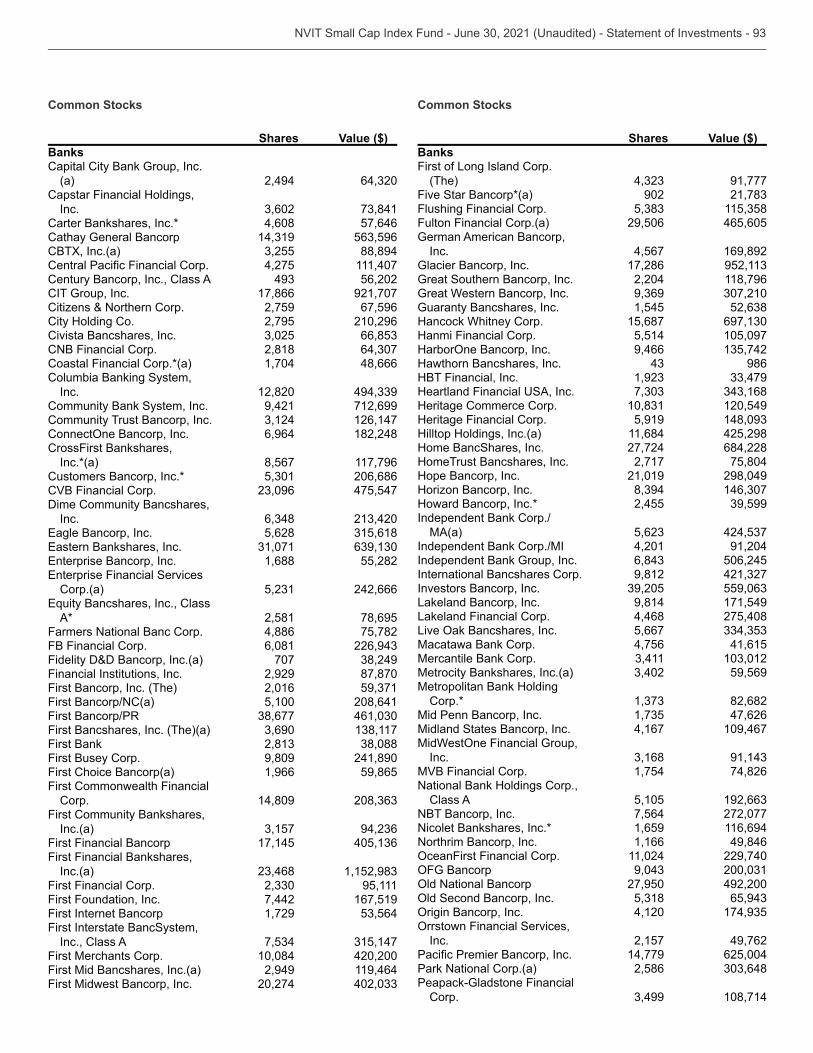
Common Stocks
Shares Value ($)BanksCapital City Bank Group, Inc.
(a) 2,494 Capstar Financial Holdings,
Inc. Carter Bankshares, Inc.* 4,608 57,646Cathay General Bancorp CBTX, Inc.(a) 88,894
4,275 111,407Century Bancorp, Inc., Class A 56,202CIT Group, Inc. 17,866 921,707Citizens & Northern Corp. 2,759 67,596City Holding Co. 2,795 210,296Civista Bancshares, Inc. CNB Financial Corp. 2,818 Coastal Financial Corp.*(a) 1,704 48,666Columbia Banking System,
Inc. 12,820 Community Bank System, Inc. 9,421 712,699Community Trust Bancorp, Inc. 126,147
6,964 182,248CrossFirst Bankshares,
Inc.*(a) 8,567 117,796Customers Bancorp, Inc.* 206,686CVB Financial Corp. 475,547Dime Community Bancshares,
Inc. 5,628 1,688 55,282
Corp.(a) 242,666
A* 2,581 78,695Farmers National Banc Corp. 4,886 75,782FB Financial Corp. 6,081 Fidelity D&D Bancorp, Inc.(a) 707 Financial Institutions, Inc. 2,929 87,870First Bancorp, Inc. (The) 2,016 First Bancorp/NC(a) 5,100 208,641First Bancorp/PR First Bancshares, Inc. (The)(a) First Bank First Busey Corp. 9,809 241,890First Choice Bancorp(a) 1,966 59,865First Commonwealth Financial
Corp. 14,809 First Community Bankshares,
Inc.(a) First Financial Bancorp 17,145 First Financial Bankshares,
Inc.(a) First Financial Corp. 95,111First Foundation, Inc. 7,442 167,519First Internet Bancorp 1,729 First Interstate BancSystem,
Inc., Class A First Merchants Corp. 10,084 420,200First Mid Bancshares, Inc.(a) 2,949 119,464First Midwest Bancorp, Inc. 20,274
Common Stocks
Shares Value ($)BanksFirst of Long Island Corp.
(The) 91,777Five Star Bancorp*(a) 902 Flushing Financial Corp. Fulton Financial Corp.(a) 29,506 465,605German American Bancorp,
Inc. 4,567 169,892Glacier Bancorp, Inc. 17,286 Great Southern Bancorp, Inc. 2,204 118,796Great Western Bancorp, Inc. Guaranty Bancshares, Inc. 1,545 Hancock Whitney Corp. 15,687 Hanmi Financial Corp. 5,514 105,097
9,466 Hawthorn Bancshares, Inc. 986HBT Financial, Inc.
Heritage Commerce Corp. 120,549Heritage Financial Corp. 5,919 Hilltop Holdings, Inc.(a) 11,684 425,298Home BancShares, Inc. 27,724 684,228HomeTrust Bancshares, Inc. 2,717 75,804Hope Bancorp, Inc. 21,019 298,049Horizon Bancorp, Inc. Howard Bancorp, Inc.* 2,455 Independent Bank Corp./
MA(a) Independent Bank Corp./MI 4,201 91,204Independent Bank Group, Inc. 506,245International Bancshares Corp. 9,812 Investors Bancorp, Inc. Lakeland Bancorp, Inc. 9,814 171,549Lakeland Financial Corp. 4,468 275,408
5,667 Macatawa Bank Corp. 4,756 41,615Mercantile Bank Corp. Metrocity Bankshares, Inc.(a) 59,569Metropolitan Bank Holding
Corp.* 82,682Mid Penn Bancorp, Inc. 47,626Midland States Bancorp, Inc. 4,167 109,467
Inc. MVB Financial Corp. 1,754 74,826National Bank Holdings Corp.,
Class A 5,105 NBT Bancorp, Inc. 7,564 272,077Nicolet Bankshares, Inc.* 1,659 116,694Northrim Bancorp, Inc. 1,166 49,846
11,024 229,740 27,950 492,200 4,120
Inc. 2,157 49,762 14,779 625,004
Park National Corp.(a) 2,586 Peapack-Gladstone Financial
Corp. 108,714
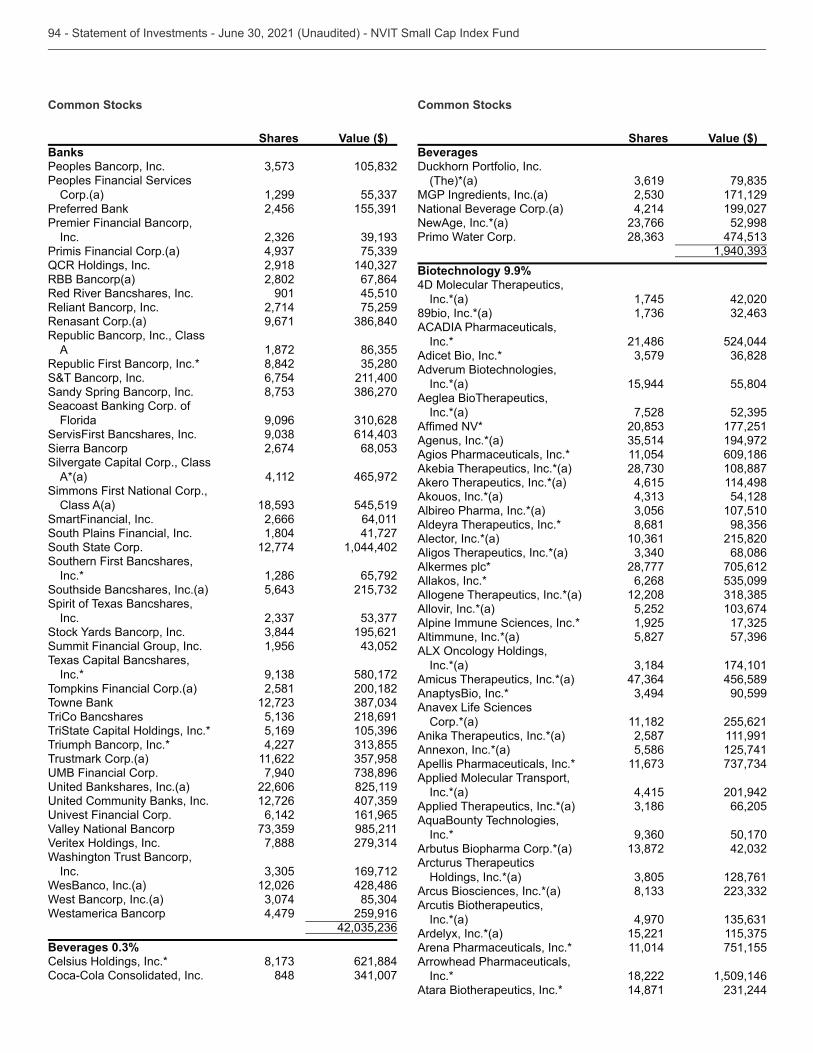
Common Stocks
Shares Value ($)BanksPeoples Bancorp, Inc. Peoples Financial Services
Corp.(a) 1,299 Preferred Bank 2,456 Premier Financial Bancorp,
Inc. Primis Financial Corp.(a) QCR Holdings, Inc. 2,918 RBB Bancorp(a) 2,802 67,864Red River Bancshares, Inc. 901 45,510Reliant Bancorp, Inc. 2,714 75,259Renasant Corp.(a) 9,671 Republic Bancorp, Inc., Class
A 1,872 Republic First Bancorp, Inc.* 8,842 S&T Bancorp, Inc. 6,754 211,400Sandy Spring Bancorp, Inc. Seacoast Banking Corp. of
Florida 9,096 ServisFirst Bancshares, Inc. Sierra Bancorp 2,674 Silvergate Capital Corp., Class
A*(a) 4,112 465,972Simmons First National Corp.,
Class A(a) 545,519SmartFinancial, Inc. 2,666 64,011South Plains Financial, Inc. 1,804 41,727South State Corp. 12,774 1,044,402Southern First Bancshares,
Inc.* 1,286 65,792Southside Bancshares, Inc.(a) Spirit of Texas Bancshares,
Inc. 195,621
Summit Financial Group, Inc. 1,956 Texas Capital Bancshares,
Inc.* 580,172Tompkins Financial Corp.(a) 2,581 200,182Towne Bank TriCo Bancshares 218,691TriState Capital Holdings, Inc.* 5,169 Triumph Bancorp, Inc.* 4,227 Trustmark Corp.(a) 11,622
7,940 22,606 825,119 12,726 6,142 161,965
Valley National Bancorp 985,211Veritex Holdings, Inc. 7,888 Washington Trust Bancorp,
Inc. 169,712WesBanco, Inc.(a) 12,026 428,486West Bancorp, Inc.(a) Westamerica Bancorp 4,479 259,916
Beverages 0.3%Celsius Holdings, Inc.* 621,884Coca-Cola Consolidated, Inc. 848
Common Stocks
Shares Value ($)BeveragesDuckhorn Portfolio, Inc.
(The)*(a) MGP Ingredients, Inc.(a) 171,129National Beverage Corp.(a) 4,214 199,027NewAge, Inc.*(a) 52,998Primo Water Corp.
Biotechnology 9.9%4D Molecular Therapeutics,
Inc.*(a) 1,745 42,02089bio, Inc.*(a) ACADIA Pharmaceuticals,
Inc.* 21,486 524,044Adicet Bio, Inc.* Adverum Biotechnologies,
Inc.*(a) 15,944 55,804Aeglea BioTherapeutics,
Inc.*(a) 7,528 177,251
Agenus, Inc.*(a) 194,972Agios Pharmaceuticals, Inc.* 11,054 609,186Akebia Therapeutics, Inc.*(a) 108,887Akero Therapeutics, Inc.*(a) 4,615 114,498Akouos, Inc.*(a) 54,128Albireo Pharma, Inc.*(a) 107,510Aldeyra Therapeutics, Inc.* 8,681 Alector, Inc.*(a) 215,820Aligos Therapeutics, Inc.*(a) 68,086Alkermes plc* 28,777 705,612Allakos, Inc.* 6,268 Allogene Therapeutics, Inc.*(a) 12,208 Allovir, Inc.*(a) 5,252 Alpine Immune Sciences, Inc.* 1,925 Altimmune, Inc.*(a) 5,827
Inc.*(a) 174,101Amicus Therapeutics, Inc.*(a) 456,589AnaptysBio, Inc.* 90,599Anavex Life Sciences
Corp.*(a) 11,182 255,621Anika Therapeutics, Inc.*(a) 2,587 111,991Annexon, Inc.*(a) 5,586 125,741Apellis Pharmaceuticals, Inc.* Applied Molecular Transport,
Inc.*(a) 4,415 201,942Applied Therapeutics, Inc.*(a) 66,205
Inc.* 50,170Arbutus Biopharma Corp.*(a) Arcturus Therapeutics
Holdings, Inc.*(a) 128,761Arcus Biosciences, Inc.*(a) Arcutis Biotherapeutics,
Inc.*(a) 4,970 Ardelyx, Inc.*(a) 15,221 Arena Pharmaceuticals, Inc.* 11,014 751,155Arrowhead Pharmaceuticals,
Inc.* 18,222 1,509,146Atara Biotherapeutics, Inc.* 14,871
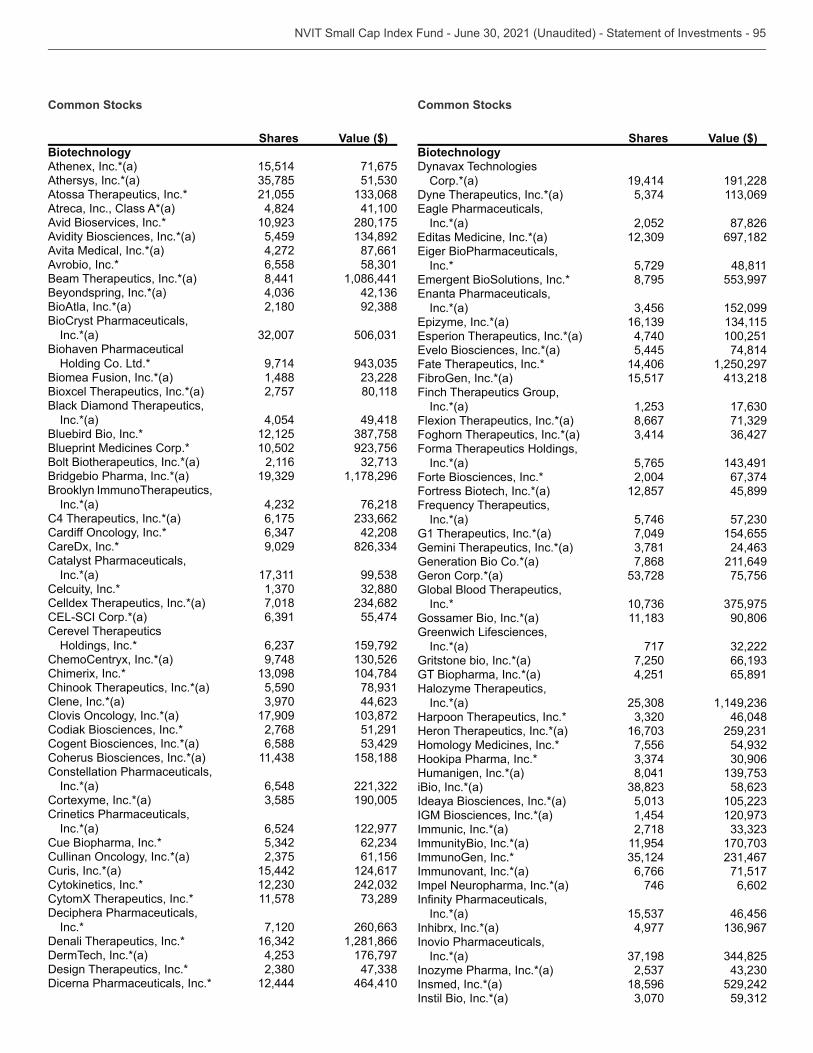
Common Stocks
Shares Value ($)BiotechnologyAthenex, Inc.*(a) 15,514 71,675Athersys, Inc.*(a) Atossa Therapeutics, Inc.* 21,055 Atreca, Inc., Class A*(a) 4,824 41,100Avid Bioservices, Inc.* 280,175Avidity Biosciences, Inc.*(a) 5,459 Avita Medical, Inc.*(a) 4,272 87,661Avrobio, Inc.* 6,558 Beam Therapeutics, Inc.*(a) 8,441 1,086,441Beyondspring, Inc.*(a) BioAtla, Inc.*(a) 2,180 BioCryst Pharmaceuticals,
Inc.*(a) Biohaven Pharmaceutical
Holding Co. Ltd.* 9,714 Biomea Fusion, Inc.*(a) 1,488 Bioxcel Therapeutics, Inc.*(a) 2,757 80,118Black Diamond Therapeutics,
Inc.*(a) 4,054 49,418Bluebird Bio, Inc.* 12,125 Blueprint Medicines Corp.* 10,502 Bolt Biotherapeutics, Inc.*(a) 2,116 Bridgebio Pharma, Inc.*(a) 1,178,296Brooklyn ImmunoTherapeutics,
Inc.*(a) 76,218C4 Therapeutics, Inc.*(a) 6,175
42,208CareDx, Inc.* 9,029 Catalyst Pharmaceuticals,
Inc.*(a) Celcuity, Inc.* Celldex Therapeutics, Inc.*(a) 7,018
55,474Cerevel Therapeutics
Holdings, Inc.* 159,792ChemoCentryx, Inc.*(a) 9,748 Chimerix, Inc.* 104,784Chinook Therapeutics, Inc.*(a) 5,590 Clene, Inc.*(a)
17,909 Codiak Biosciences, Inc.* 2,768 51,291Cogent Biosciences, Inc.*(a) 6,588 Coherus Biosciences, Inc.*(a) 158,188Constellation Pharmaceuticals,
Inc.*(a) 6,548 Cortexyme, Inc.*(a) 190,005Crinetics Pharmaceuticals,
Inc.*(a) 6,524 122,977Cue Biopharma, Inc.*
61,156Curis, Inc.*(a) 15,442 124,617Cytokinetics, Inc.* CytomX Therapeutics, Inc.* 11,578 Deciphera Pharmaceuticals,
Inc.* 7,120 Denali Therapeutics, Inc.* 1,281,866DermTech, Inc.*(a) 176,797Design Therapeutics, Inc.* Dicerna Pharmaceuticals, Inc.* 12,444 464,410
Common Stocks
Shares Value ($)BiotechnologyDynavax Technologies
Corp.*(a) 19,414 191,228Dyne Therapeutics, Inc.*(a)
Inc.*(a) 2,052 87,826 697,182
Inc.* 5,729 48,811 8,795
Inc.*(a) 152,099 4,740 100,251 5,445 74,814
Fate Therapeutics, Inc.* 14,406 1,250,297FibroGen, Inc.*(a) 15,517 Finch Therapeutics Group,
Inc.*(a) Flexion Therapeutics, Inc.*(a) 8,667 Foghorn Therapeutics, Inc.*(a) Forma Therapeutics Holdings,
Inc.*(a) 5,765 Forte Biosciences, Inc.* 2,004 Fortress Biotech, Inc.*(a) 12,857 45,899
Inc.*(a) 5,746 G1 Therapeutics, Inc.*(a) 7,049 154,655Gemini Therapeutics, Inc.*(a) Generation Bio Co.*(a) 7,868 211,649Geron Corp.*(a) 75,756Global Blood Therapeutics,
Inc.* Gossamer Bio, Inc.*(a) 90,806Greenwich Lifesciences,
Inc.*(a) 717 Gritstone bio, Inc.*(a) 7,250 GT Biopharma, Inc.*(a) 4,251 65,891Halozyme Therapeutics,
Inc.*(a) Harpoon Therapeutics, Inc.* 46,048Heron Therapeutics, Inc.*(a) Homology Medicines, Inc.* 7,556 Hookipa Pharma, Inc.* Humanigen, Inc.*(a) 8,041 iBio, Inc.*(a) Ideaya Biosciences, Inc.*(a) IGM Biosciences, Inc.*(a) 1,454 Immunic, Inc.*(a) 2,718 ImmunityBio, Inc.*(a) 11,954 ImmunoGen, Inc.* Immunovant, Inc.*(a) 6,766 71,517Impel Neuropharma, Inc.*(a) 746 6,602
Inc.*(a) 46,456Inhibrx, Inc.*(a) 4,977 Inovio Pharmaceuticals,
Inc.*(a) Inozyme Pharma, Inc.*(a) Insmed, Inc.*(a) 18,596 529,242Instil Bio, Inc.*(a)
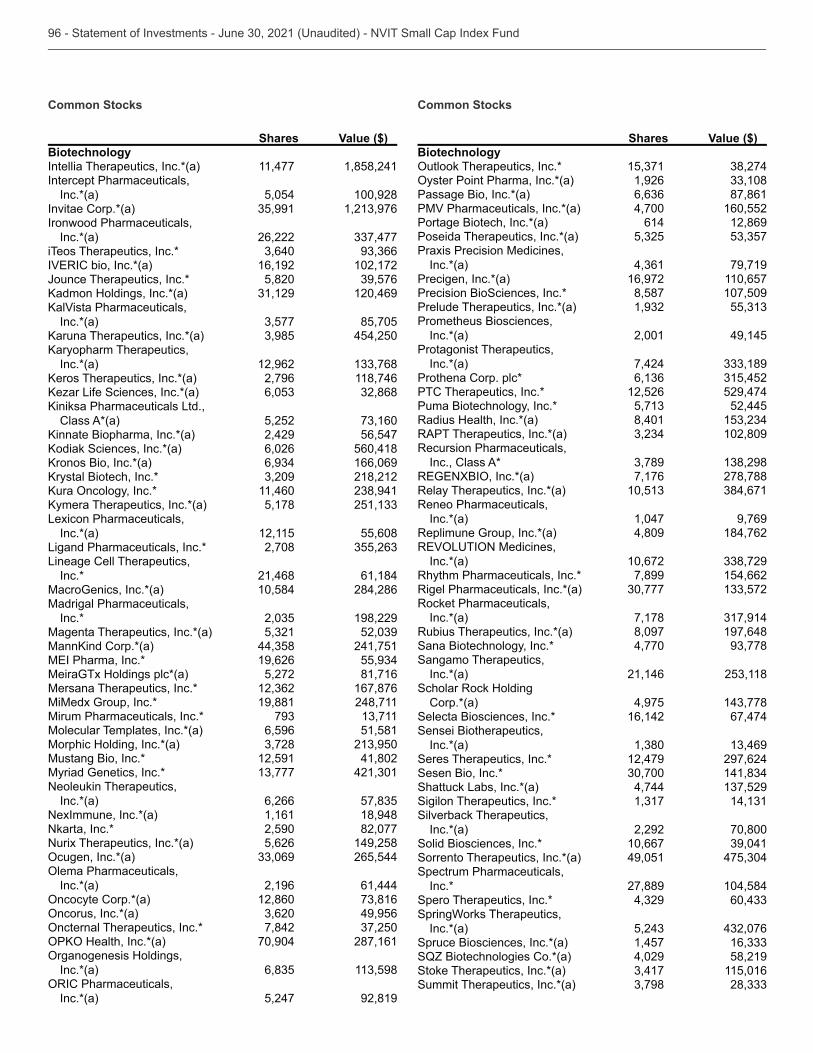
Common Stocks
Shares Value ($)BiotechnologyIntellia Therapeutics, Inc.*(a) 11,477 1,858,241Intercept Pharmaceuticals,
Inc.*(a) 5,054 100,928Invitae Corp.*(a) Ironwood Pharmaceuticals,
Inc.*(a) 26,222 iTeos Therapeutics, Inc.*
16,192 102,172Jounce Therapeutics, Inc.* 5,820
120,469
Inc.*(a) 85,705 454,250
Inc.*(a) 12,962 2,796 118,746
Class A*(a) 5,252 2,429 56,547 6,026 560,418 166,069 218,212 11,460 5,178
Lexicon Pharmaceuticals, Inc.*(a) 12,115 55,608
Ligand Pharmaceuticals, Inc.* 2,708 Lineage Cell Therapeutics,
Inc.* 21,468 61,184MacroGenics, Inc.*(a) 10,584 284,286Madrigal Pharmaceuticals,
Inc.* 198,229Magenta Therapeutics, Inc.*(a)
241,751 19,626
MeiraGTx Holdings plc*(a) 5,272 81,716Mersana Therapeutics, Inc.* 167,876MiMedx Group, Inc.* 19,881 248,711Mirum Pharmaceuticals, Inc.* Molecular Templates, Inc.*(a) 6,596 51,581Morphic Holding, Inc.*(a) Mustang Bio, Inc.* 12,591 41,802Myriad Genetics, Inc.* Neoleukin Therapeutics,
Inc.*(a) 6,266 NexImmune, Inc.*(a) 1,161 18,948Nkarta, Inc.* 2,590 82,077Nurix Therapeutics, Inc.*(a) 5,626 149,258
265,544
Inc.*(a) 2,196 61,444 12,860 49,956 7,842 70,904 287,161
Inc.*(a)
Inc.*(a) 5,247 92,819
Common Stocks
Shares Value ($)Biotechnology
1,926
Passage Bio, Inc.*(a) 87,861PMV Pharmaceuticals, Inc.*(a) 4,700 160,552Portage Biotech, Inc.*(a) 614 12,869Poseida Therapeutics, Inc.*(a) Praxis Precision Medicines,
Inc.*(a) 79,719Precigen, Inc.*(a) 16,972 110,657Precision BioSciences, Inc.* 8,587 107,509Prelude Therapeutics, Inc.*(a) Prometheus Biosciences,
Inc.*(a) 2,001 49,145Protagonist Therapeutics,
Inc.*(a) 7,424 Prothena Corp. plc* PTC Therapeutics, Inc.* 12,526 529,474Puma Biotechnology, Inc.* 52,445Radius Health, Inc.*(a) 8,401 RAPT Therapeutics, Inc.*(a) 102,809Recursion Pharmaceuticals,
Inc., Class A* 7,176 278,788
Relay Therapeutics, Inc.*(a) Reneo Pharmaceuticals,
Inc.*(a) 1,047 9,769Replimune Group, Inc.*(a) 4,809 184,762
Inc.*(a) 10,672 Rhythm Pharmaceuticals, Inc.* 7,899 154,662Rigel Pharmaceuticals, Inc.*(a) Rocket Pharmaceuticals,
Inc.*(a) 7,178 Rubius Therapeutics, Inc.*(a) 8,097 197,648Sana Biotechnology, Inc.* 4,770 Sangamo Therapeutics,
Inc.*(a) 21,146 Scholar Rock Holding
Corp.*(a) 4,975 Selecta Biosciences, Inc.* 16,142 67,474Sensei Biotherapeutics,
Inc.*(a) Seres Therapeutics, Inc.* 12,479 297,624Sesen Bio, Inc.* Shattuck Labs, Inc.*(a) 4,744 Sigilon Therapeutics, Inc.* Silverback Therapeutics,
Inc.*(a) 2,292 70,800Solid Biosciences, Inc.* 10,667 Sorrento Therapeutics, Inc.*(a) 49,051 Spectrum Pharmaceuticals,
Inc.* 27,889 104,584Spero Therapeutics, Inc.* SpringWorks Therapeutics,
Inc.*(a) Spruce Biosciences, Inc.*(a) 1,457 SQZ Biotechnologies Co.*(a) 4,029 58,219Stoke Therapeutics, Inc.*(a) 115,016Summit Therapeutics, Inc.*(a)
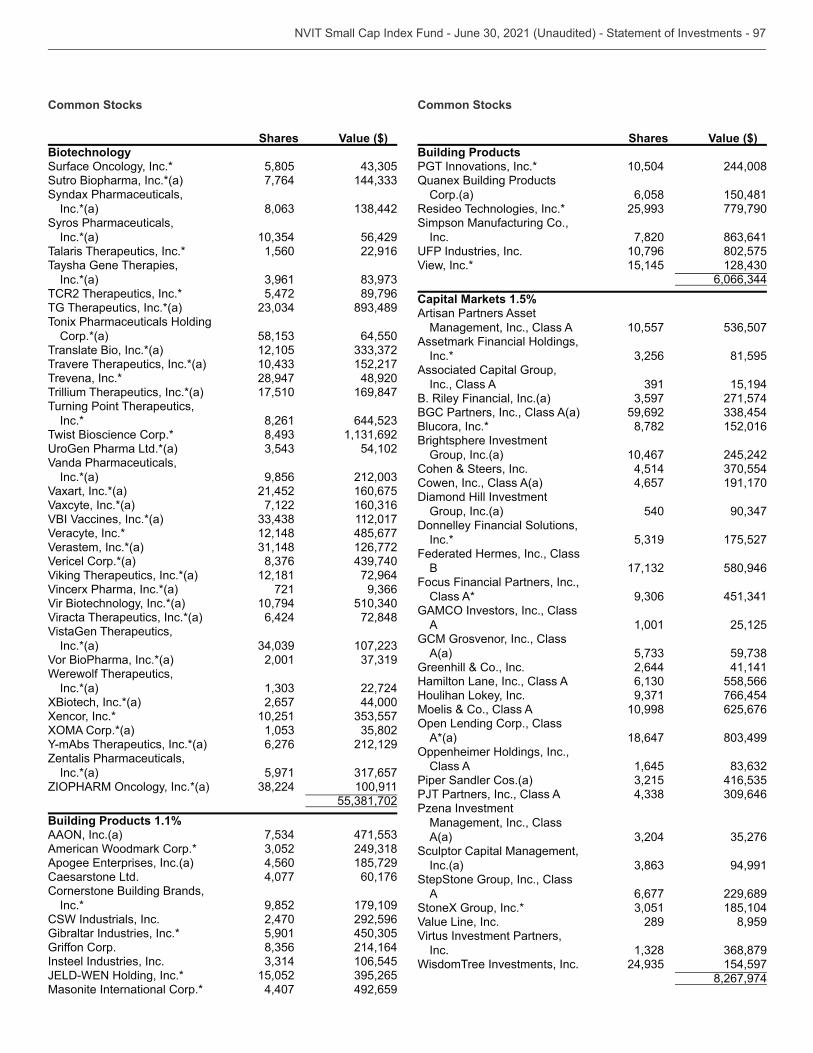
Common Stocks
Shares Value ($)Biotechnology
5,805 Sutro Biopharma, Inc.*(a) 7,764 Syndax Pharmaceuticals,
Inc.*(a) Syros Pharmaceuticals,
Inc.*(a) 56,429Talaris Therapeutics, Inc.* 1,560 22,916Taysha Gene Therapies,
Inc.*(a) TCR2 Therapeutics, Inc.* 5,472 89,796TG Therapeutics, Inc.*(a) Tonix Pharmaceuticals Holding
Corp.*(a) 64,550Translate Bio, Inc.*(a) 12,105 Travere Therapeutics, Inc.*(a) 152,217Trevena, Inc.* 28,947 48,920Trillium Therapeutics, Inc.*(a) 17,510 169,847Turning Point Therapeutics,
Inc.* 8,261 Twist Bioscience Corp.*
54,102Vanda Pharmaceuticals,
Inc.*(a) 9,856 Vaxart, Inc.*(a) 21,452 160,675Vaxcyte, Inc.*(a) 7,122 VBI Vaccines, Inc.*(a) 112,017Veracyte, Inc.* 12,148 485,677Verastem, Inc.*(a) 126,772Vericel Corp.*(a) Viking Therapeutics, Inc.*(a) 12,181 72,964Vincerx Pharma, Inc.*(a) 721 Vir Biotechnology, Inc.*(a) 10,794 Viracta Therapeutics, Inc.*(a) 6,424 72,848VistaGen Therapeutics,
Inc.*(a) Vor BioPharma, Inc.*(a) 2,001 Werewolf Therapeutics,
Inc.*(a) 22,724XBiotech, Inc.*(a) 2,657 44,000Xencor, Inc.* 10,251
6,276 212,129
Zentalis Pharmaceuticals, Inc.*(a) 5,971
100,911
Building Products 1.1%
American Woodmark Corp.* 4,560 185,729
Caesarstone Ltd. 4,077 60,176Cornerstone Building Brands,
Inc.* 9,852 179,109CSW Industrials, Inc. 2,470 292,596Gibraltar Industries, Inc.* 5,901 Griffon Corp. 214,164Insteel Industries, Inc. 106,545
15,052 Masonite International Corp.* 4,407 492,659
Common Stocks
Shares Value ($)Building ProductsPGT Innovations, Inc.* 10,504 244,008Quanex Building Products
Corp.(a) 6,058 150,481Resideo Technologies, Inc.* 779,790Simpson Manufacturing Co.,
Inc. 7,820 10,796 802,575
View, Inc.* 15,145
Capital Markets 1.5%Artisan Partners Asset
Management, Inc., Class A 10,557 Assetmark Financial Holdings,
Inc.* 81,595Associated Capital Group,
Inc., Class A 15,194B. Riley Financial, Inc.(a) 271,574BGC Partners, Inc., Class A(a) 59,692 Blucora, Inc.* 8,782 152,016Brightsphere Investment
Group, Inc.(a) 10,467 245,242Cohen & Steers, Inc. 4,514 Cowen, Inc., Class A(a) 4,657 191,170Diamond Hill Investment
Group, Inc.(a) 540 Donnelley Financial Solutions,
Inc.* 175,527Federated Hermes, Inc., Class
B 580,946Focus Financial Partners, Inc.,
Class A*
A 1,001 25,125GCM Grosvenor, Inc., Class
A(a) Greenhill & Co., Inc. 2,644 41,141Hamilton Lane, Inc., Class A 558,566Houlihan Lokey, Inc. 766,454Moelis & Co., Class A 10,998 625,676
A*(a) 18,647
Class A 1,645 Piper Sandler Cos.(a) PJT Partners, Inc., Class A Pzena Investment
Management, Inc., Class A(a)
Sculptor Capital Management, Inc.(a) 94,991
StepStone Group, Inc., Class A 6,677 229,689
StoneX Group, Inc.* 185,104Value Line, Inc. 289 8,959Virtus Investment Partners,
Inc. WisdomTree Investments, Inc. 154,597
8,267,974
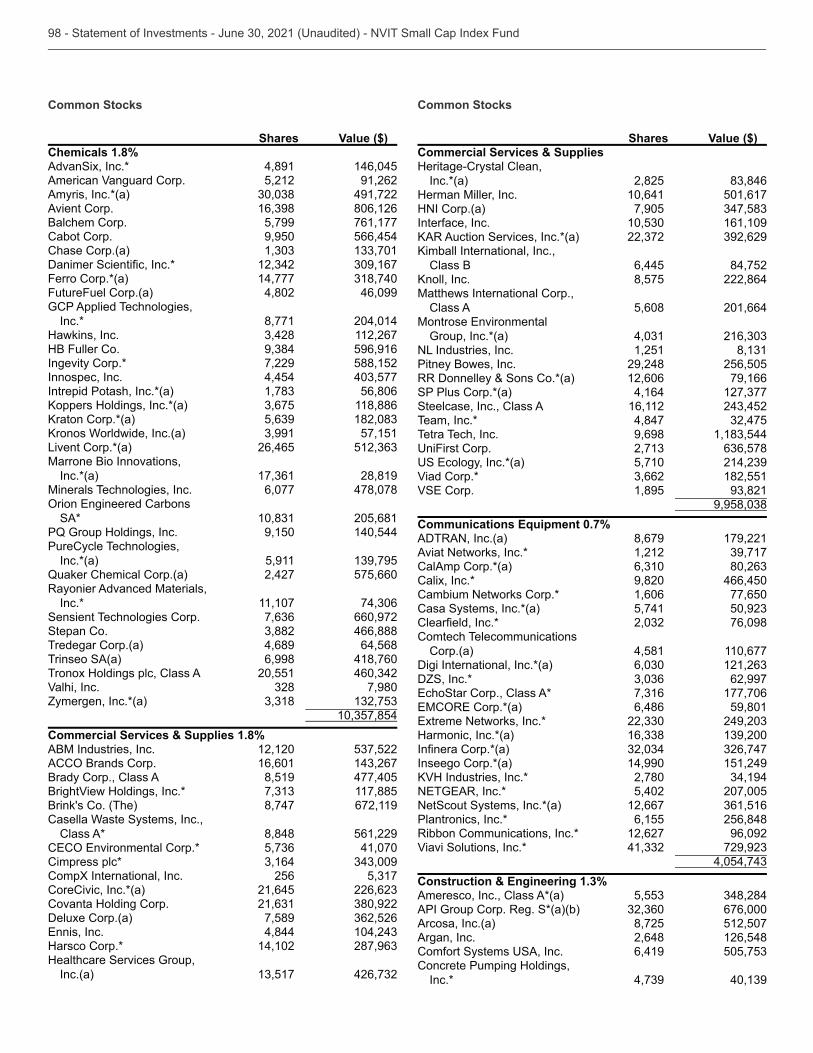
Common Stocks
Shares Value ($)Chemicals 1.8%AdvanSix, Inc.* 4,891 146,045American Vanguard Corp. 5,212 91,262Amyris, Inc.*(a) 491,722Avient Corp. 806,126Balchem Corp. 5,799 761,177Cabot Corp. 9,950 566,454Chase Corp.(a)
Ferro Corp.*(a) 14,777 FutureFuel Corp.(a) 4,802 46,099GCP Applied Technologies,
Inc.* 8,771 204,014Hawkins, Inc. 112,267HB Fuller Co. 596,916Ingevity Corp.* 7,229 588,152Innospec, Inc. 4,454 Intrepid Potash, Inc.*(a) 56,806
118,886 57,151
Livent Corp.*(a) 26,465 Marrone Bio Innovations,
Inc.*(a) 28,819Minerals Technologies, Inc. 6,077 478,078
SA* 205,681PQ Group Holdings, Inc. 9,150 140,544PureCycle Technologies,
Inc.*(a) 5,911 Quaker Chemical Corp.(a) 2,427 575,660Rayonier Advanced Materials,
Inc.* 11,107 Sensient Technologies Corp. 660,972Stepan Co. 466,888Tredegar Corp.(a) 4,689 64,568Trinseo SA(a) 6,998 418,760Tronox Holdings plc, Class A 20,551 Valhi, Inc. 7,980Zymergen, Inc.*(a)
Commercial Services & Supplies 1.8%ABM Industries, Inc. 12,120
16,601 Brady Corp., Class A 8,519 477,405BrightView Holdings, Inc.* 117,885Brink's Co. (The) 8,747 672,119Casella Waste Systems, Inc.,
Class A* 8,848 561,229 41,070
Cimpress plc* CompX International, Inc. 256 CoreCivic, Inc.*(a) 21,645 Covanta Holding Corp. Deluxe Corp.(a) 7,589
4,844 Harsco Corp.* 14,102 Healthcare Services Group,
Inc.(a)
Common Stocks
Shares Value ($)Commercial Services & SuppliesHeritage-Crystal Clean,
Inc.*(a) 2,825 Herman Miller, Inc. 10,641 501,617HNI Corp.(a) 7,905 Interface, Inc. 161,109
Class B 6,445 84,752 8,575 222,864
Matthews International Corp., Class A 5,608 201,664
Group, Inc.*(a) NL Industries, Inc. 1,251 Pitney Bowes, Inc. 29,248 256,505RR Donnelley & Sons Co.*(a) 12,606 79,166SP Plus Corp.*(a) 4,164 Steelcase, Inc., Class A 16,112 Team, Inc.* 4,847 Tetra Tech, Inc. 9,698
5,710
Viad Corp.* 182,551 1,895
Communications Equipment 0.7%ADTRAN, Inc.(a) 8,679 179,221Aviat Networks, Inc.* 1,212 CalAmp Corp.*(a) Calix, Inc.* 9,820 466,450Cambium Networks Corp.* 1,606 77,650Casa Systems, Inc.*(a) 5,741
76,098Comtech Telecommunications
Corp.(a) 4,581 110,677Digi International, Inc.*(a) DZS, Inc.* 62,997
177,706 6,486 59,801
Harmonic, Inc.*(a)
Inseego Corp.*(a) 14,990 151,249 2,780 5,402 207,005
NetScout Systems, Inc.*(a) 12,667 Plantronics, Inc.* 6,155 256,848Ribbon Communications, Inc.* 12,627 96,092Viavi Solutions, Inc.*
Construction & Engineering 1.3%Ameresco, Inc., Class A*(a) API Group Corp. Reg. S*(a)(b) 676,000Arcosa, Inc.(a) 8,725 512,507Argan, Inc. 2,648 126,548
6,419 Concrete Pumping Holdings,
Inc.*
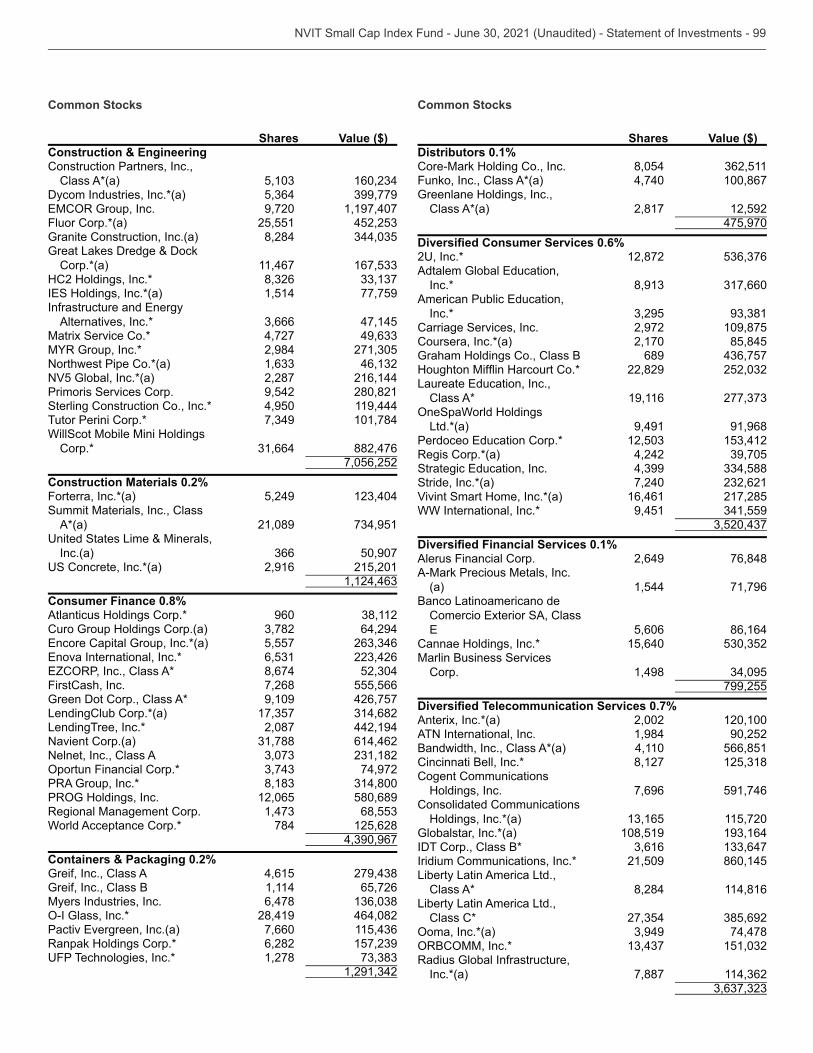
Common Stocks
Shares Value ($)Construction & EngineeringConstruction Partners, Inc.,
Class A*(a) Dycom Industries, Inc.*(a)
9,720 1,197,407Fluor Corp.*(a) 25,551 Granite Construction, Inc.(a) 8,284 Great Lakes Dredge & Dock
Corp.*(a) 11,467 HC2 Holdings, Inc.*
1,514 77,759
Alternatives, Inc.* 47,145Matrix Service Co.* 4,727
2,984 Northwest Pipe Co.*(a) NV5 Global, Inc.*(a) 2,287 216,144Primoris Services Corp. 9,542 280,821Sterling Construction Co., Inc.* 4,950 119,444Tutor Perini Corp.* 101,784WillScot Mobile Mini Holdings
Corp.* 882,476 7,056,252
Construction Materials 0.2%Forterra, Inc.*(a) 5,249 Summit Materials, Inc., Class
A*(a) 21,089
Inc.(a) 50,907 2,916 215,201
Consumer Finance 0.8%Atlanticus Holdings Corp.* 960 Curo Group Holdings Corp.(a) 64,294
5,557 8,674
FirstCash, Inc. 7,268 555,566Green Dot Corp., Class A* 9,109 426,757LendingClub Corp.*(a) LendingTree, Inc.* 2,087 442,194Navient Corp.(a) 614,462Nelnet, Inc., Class A
74,972PRA Group, Inc.*
12,065 580,689Regional Management Corp. World Acceptance Corp.* 784 125,628
Containers & Packaging 0.2%Greif, Inc., Class A 4,615 Greif, Inc., Class B 1,114 65,726Myers Industries, Inc. 6,478
28,419 464,082 7,660
Ranpak Holdings Corp.* 6,282 1,278
Common Stocks
Shares Value ($)Distributors 0.1%Core-Mark Holding Co., Inc. 8,054 Funko, Inc., Class A*(a) 4,740 100,867Greenlane Holdings, Inc.,
Class A*(a) 2,817 12,592 475,970
0.6% 12,872
Inc.*
Inc.* Carriage Services, Inc. 2,972 109,875Coursera, Inc.*(a) 2,170 85,845Graham Holdings Co., Class B 689
22,829
Class A* 19,116
Ltd.*(a) 9,491 91,968
Regis Corp.*(a) 4,242
Stride, Inc.*(a) 7,240 Vivint Smart Home, Inc.*(a) 16,461 217,285WW International, Inc.* 9,451
0.1%
Alerus Financial Corp. 2,649 76,848A-Mark Precious Metals, Inc.
(a) 1,544 71,796Banco Latinoamericano de
5,606 86,164Cannae Holdings, Inc.* 15,640 Marlin Business Services
Corp. 1,498 799,255
0.7%Anterix, Inc.*(a) 2,002 120,100ATN International, Inc. 1,984 90,252Bandwidth, Inc., Class A*(a) 4,110 566,851Cincinnati Bell, Inc.* 8,127 Cogent Communications
Holdings, Inc. 7,696 591,746Consolidated Communications
Holdings, Inc.*(a) 115,720Globalstar, Inc.*(a) 108,519 IDT Corp., Class B* Iridium Communications, Inc.* 21,509 860,145Liberty Latin America Ltd.,
Class A* 8,284 114,816Liberty Latin America Ltd.,
Class C* 74,478
Radius Global Infrastructure, Inc.*(a) 7,887
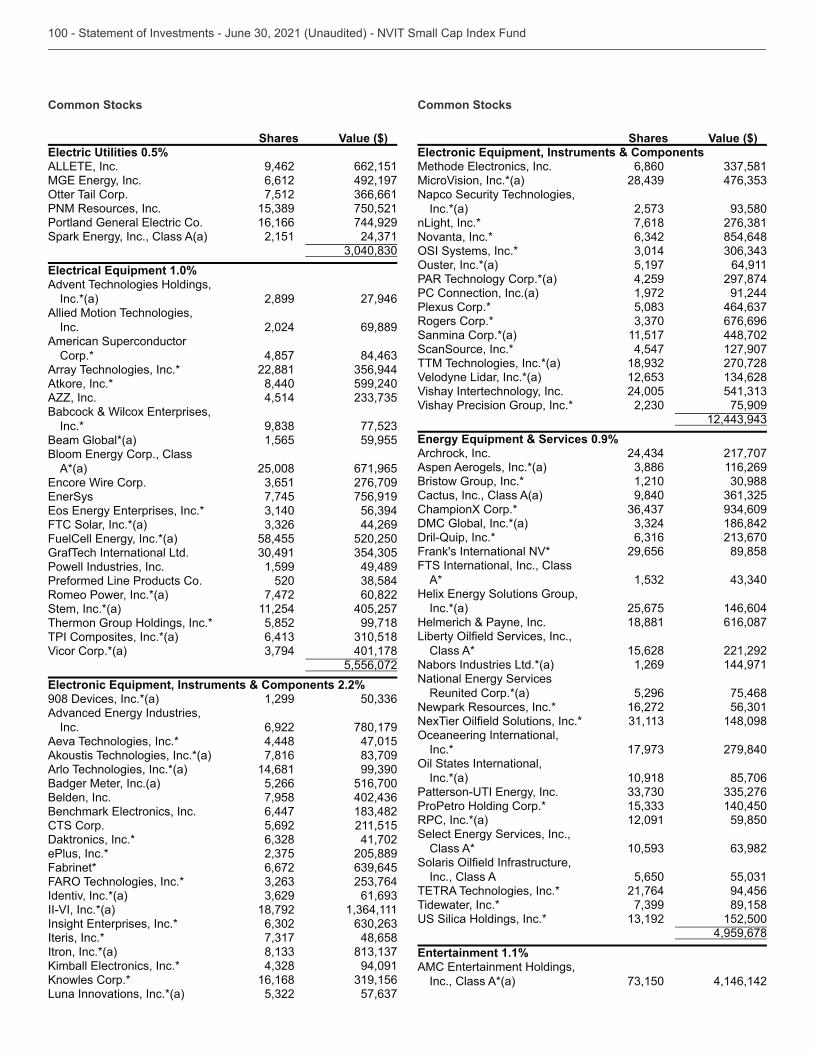
Common Stocks
Shares Value ($)Electric Utilities 0.5%
9,462 662,151 6,612 492,197 7,512
PNM Resources, Inc. 750,521 16,166 744,929 2,151
Electrical Equipment 1.0%Advent Technologies Holdings,
Inc.*(a) 2,899 27,946Allied Motion Technologies,
Inc. 2,024 69,889American Superconductor
Corp.* 4,857 Array Technologies, Inc.* 22,881 Atkore, Inc.* 8,440 599,240AZZ, Inc. 4,514
Inc.* Beam Global*(a) 1,565 59,955
A*(a) 25,008 671,965 276,709 7,745 756,919
FTC Solar, Inc.*(a) 44,269 58,455 520,250
GrafTech International Ltd. Powell Industries, Inc. 1,599 49,489Preformed Line Products Co. 520 Romeo Power, Inc.*(a) 7,472 60,822Stem, Inc.*(a) 11,254 405,257Thermon Group Holdings, Inc.* 5,852 99,718TPI Composites, Inc.*(a) Vicor Corp.*(a) 401,178
5,556,072Electronic Equipment, Instruments & Components 2.2%908 Devices, Inc.*(a) 1,299
Inc. 6,922 780,179Aeva Technologies, Inc.* 4,448 47,015Akoustis Technologies, Inc.*(a) 7,816 Arlo Technologies, Inc.*(a) 14,681 Badger Meter, Inc.(a) 5,266 516,700Belden, Inc. 7,958
6,447 CTS Corp. 5,692 211,515Daktronics, Inc.* 41,702ePlus, Inc.* 205,889Fabrinet* 6,672
Identiv, Inc.*(a) II-VI, Inc.*(a) 18,792
Iteris, Inc.* 48,658Itron, Inc.*(a)
94,091 16,168
Luna Innovations, Inc.*(a)
Common Stocks
Shares Value ($)Electronic Equipment, Instruments & Components
6,860 MicroVision, Inc.*(a) Napco Security Technologies,
Inc.*(a) nLight, Inc.* 7,618 Novanta, Inc.* 854,648
5,197 64,911
PAR Technology Corp.*(a) 4,259 297,874PC Connection, Inc.(a) 1,972 91,244Plexus Corp.* Rogers Corp.* 676,696Sanmina Corp.*(a) 11,517 448,702ScanSource, Inc.* 4,547 127,907TTM Technologies, Inc.*(a) 270,728Velodyne Lidar, Inc.*(a) Vishay Intertechnology, Inc. 24,005 Vishay Precision Group, Inc.* 75,909
Energy Equipment & Services 0.9%Archrock, Inc. 217,707Aspen Aerogels, Inc.*(a) 116,269Bristow Group, Inc.* 1,210 Cactus, Inc., Class A(a) 9,840 ChampionX Corp.* DMC Global, Inc.*(a) 186,842Dril-Quip, Inc.* Frank's International NV* 29,656 89,858FTS International, Inc., Class
A*
Inc.*(a) 25,675 146,604Helmerich & Payne, Inc. 18,881 616,087
Class A* 15,628 221,292Nabors Industries Ltd.*(a) 1,269 144,971
Reunited Corp.*(a) 5,296 75,468Newpark Resources, Inc.* 16,272
148,098
Inc.* 279,840
Inc.*(a) 10,918 85,706
ProPetro Holding Corp.* 140,450RPC, Inc.*(a) 12,091 59,850
Class A*
Inc., Class A 5,650 21,764 94,456
Tidewater, Inc.* 89,158 152,500
4,959,678Entertainment 1.1%
Inc., Class A*(a) 4,146,142
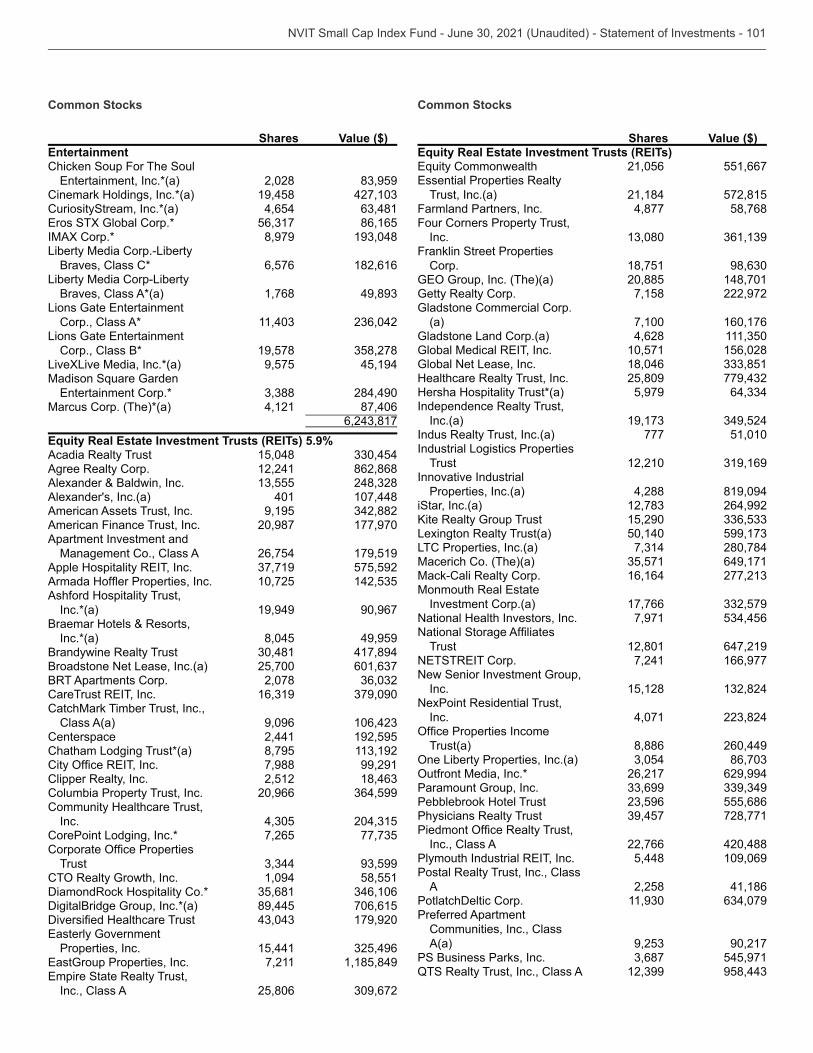
Common Stocks
Shares Value ($)EntertainmentChicken Soup For The Soul
2,028 Cinemark Holdings, Inc.*(a) 19,458 CuriosityStream, Inc.*(a) 4,654
86,165IMAX Corp.* 8,979 Liberty Media Corp.-Liberty
Braves, Class C* 6,576 182,616Liberty Media Corp-Liberty
Braves, Class A*(a) 1,768
Corp., Class A*
Corp., Class B* 19,578 LiveXLive Media, Inc.*(a) 9,575 45,194
284,490Marcus Corp. (The)*(a) 4,121 87,406
Equity Real Estate Investment Trusts (REITs) 5.9%Acadia Realty Trust 15,048 Agree Realty Corp. 12,241 862,868Alexander & Baldwin, Inc. Alexander's, Inc.(a) 401 107,448American Assets Trust, Inc. 9,195 American Finance Trust, Inc. 20,987 177,970Apartment Investment and
Management Co., Class A 26,754 179,519 575,592 10,725
Ashford Hospitality Trust, Inc.*(a) 19,949 90,967
Braemar Hotels & Resorts, Inc.*(a) 8,045 49,959
Brandywine Realty Trust 417,894Broadstone Net Lease, Inc.(a) 25,700 BRT Apartments Corp. 2,078
CatchMark Timber Trust, Inc.,
Class A(a) 9,096 Centerspace 2,441 192,595Chatham Lodging Trust*(a) 8,795
7,988 99,291Clipper Realty, Inc. 2,512 Columbia Property Trust, Inc. 20,966 Community Healthcare Trust,
Inc. CorePoint Lodging, Inc.* 7,265
Trust 1,094 58,551
DiamondRock Hospitality Co.* DigitalBridge Group, Inc.*(a) 89,445 706,615
179,920
Properties, Inc. 15,441 7,211 1,185,849
Inc., Class A 25,806
Common Stocks
Shares Value ($)Equity Real Estate Investment Trusts (REITs)
21,056 551,667
Trust, Inc.(a) 21,184 572,815Farmland Partners, Inc. 4,877 58,768Four Corners Property Trust,
Inc. Franklin Street Properties
Corp. 18,751 20,885 148,701
Getty Realty Corp. 7,158 222,972Gladstone Commercial Corp.
(a) 7,100 160,176Gladstone Land Corp.(a) 4,628
10,571 156,028Global Net Lease, Inc. 18,046 Healthcare Realty Trust, Inc. 25,809 Hersha Hospitality Trust*(a) 5,979 Independence Realty Trust,
Inc.(a) Indus Realty Trust, Inc.(a) 777 51,010Industrial Logistics Properties
Trust 12,210 Innovative Industrial
Properties, Inc.(a) 4,288 819,094iStar, Inc.(a) 264,992
15,290 Lexington Realty Trust(a) 50,140 LTC Properties, Inc.(a) 280,784Macerich Co. (The)(a) 649,171Mack-Cali Realty Corp. 16,164
Investment Corp.(a) 17,766 National Health Investors, Inc. 7,971
Trust 12,801 647,219 7,241 166,977
New Senior Investment Group, Inc. 15,128
NexPoint Residential Trust, Inc. 4,071
Trust(a) 8,886 260,449 26,217 629,994
Paramount Group, Inc. Pebblebrook Hotel Trust 555,686Physicians Realty Trust 728,771
Inc., Class A 22,766 420,488 5,448 109,069
Postal Realty Trust, Inc., Class A 2,258 41,186
PotlatchDeltic Corp. Preferred Apartment
Communities, Inc., Class A(a) 90,217
PS Business Parks, Inc. 545,971QTS Realty Trust, Inc., Class A
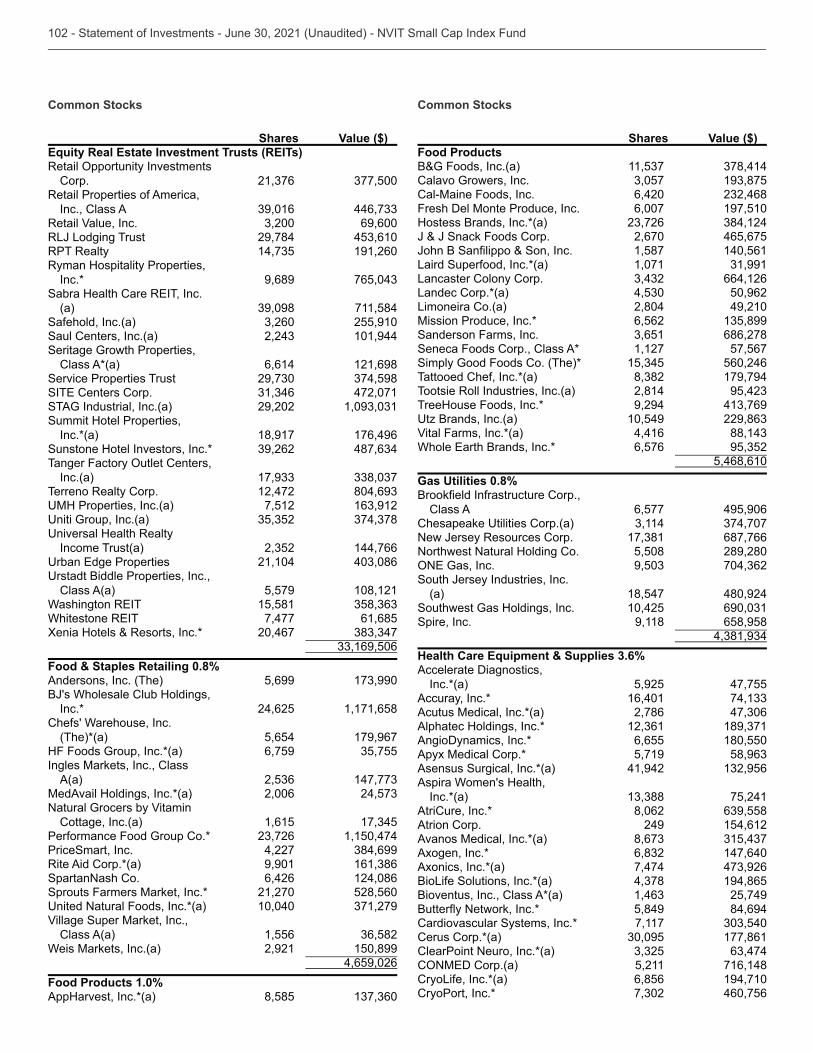
Common Stocks
Shares Value ($)Equity Real Estate Investment Trusts (REITs)
Corp. Retail Properties of America,
Inc., Class A Retail Value, Inc. 69,600RLJ Lodging Trust 29,784 RPT Realty 191,260Ryman Hospitality Properties,
Inc.* 9,689
(a) 711,584Safehold, Inc.(a) 255,910Saul Centers, Inc.(a) 101,944Seritage Growth Properties,
Class A*(a) 6,614 121,698Service Properties Trust
472,071STAG Industrial, Inc.(a) 29,202 Summit Hotel Properties,
Inc.*(a) 18,917 176,496Sunstone Hotel Investors, Inc.*
Inc.(a) Terreno Realty Corp. 12,472
7,512
Income Trust(a) 144,766 21,104
Class A(a) 5,579 108,121 15,581 7,477 61,685
Xenia Hotels & Resorts, Inc.* 20,467
Food & Staples Retailing 0.8%Andersons, Inc. (The) 5,699 BJ's Wholesale Club Holdings,
Inc.* 24,625 1,171,658Chefs' Warehouse, Inc.
(The)*(a) 5,654 179,967HF Foods Group, Inc.*(a) 6,759 Ingles Markets, Inc., Class
A(a) MedAvail Holdings, Inc.*(a) 2,006 Natural Grocers by Vitamin
Cottage, Inc.(a) 1,615 Performance Food Group Co.* 1,150,474PriceSmart, Inc. 4,227 Rite Aid Corp.*(a) 9,901 SpartanNash Co. 6,426 124,086Sprouts Farmers Market, Inc.* 21,270 528,560
10,040 Village Super Market, Inc.,
Class A(a) 1,556 Weis Markets, Inc.(a) 2,921 150,899
4,659,026Food Products 1.0%AppHarvest, Inc.*(a) 8,585
Common Stocks
Shares Value ($)Food ProductsB&G Foods, Inc.(a) Calavo Growers, Inc. Cal-Maine Foods, Inc. 6,420 Fresh Del Monte Produce, Inc. 6,007 197,510Hostess Brands, Inc.*(a) J & J Snack Foods Corp. 2,670 465,675
1,587 140,561Laird Superfood, Inc.*(a) 1,071 Lancaster Colony Corp. 664,126Landec Corp.*(a) 50,962Limoneira Co.(a) 2,804 49,210Mission Produce, Inc.* 6,562 Sanderson Farms, Inc. 686,278Seneca Foods Corp., Class A* 1,127 57,567Simply Good Foods Co. (The)* 560,246Tattooed Chef, Inc.*(a) 179,794Tootsie Roll Industries, Inc.(a) 2,814 TreeHouse Foods, Inc.* 9,294
10,549 Vital Farms, Inc.*(a) 4,416
6,576 5,468,610
Gas Utilities 0.8%
Class A 6,577 495,906
New Jersey Resources Corp. 687,766Northwest Natural Holding Co. 5,508 289,280
South Jersey Industries, Inc.
(a) 18,547 480,924Southwest Gas Holdings, Inc. 10,425 Spire, Inc. 9,118 658,958
Health Care Equipment & Supplies 3.6%Accelerate Diagnostics,
Inc.*(a) 5,925 47,755Accuray, Inc.* 16,401 Acutus Medical, Inc.*(a) 2,786 Alphatec Holdings, Inc.* AngioDynamics, Inc.* 6,655 180,550Apyx Medical Corp.* 5,719 Asensus Surgical, Inc.*(a) 41,942 Aspira Women's Health,
Inc.*(a) 75,241AtriCure, Inc.* 8,062 Atrion Corp. 249 154,612Avanos Medical, Inc.*(a) Axogen, Inc.* 147,640Axonics, Inc.*(a) 7,474 BioLife Solutions, Inc.*(a) 194,865Bioventus, Inc., Class A*(a) 25,749
5,849 84,694Cardiovascular Systems, Inc.* 7,117 Cerus Corp.*(a) 177,861ClearPoint Neuro, Inc.*(a)
5,211 716,148CryoLife, Inc.*(a) 6,856 194,710CryoPort, Inc.* 460,756
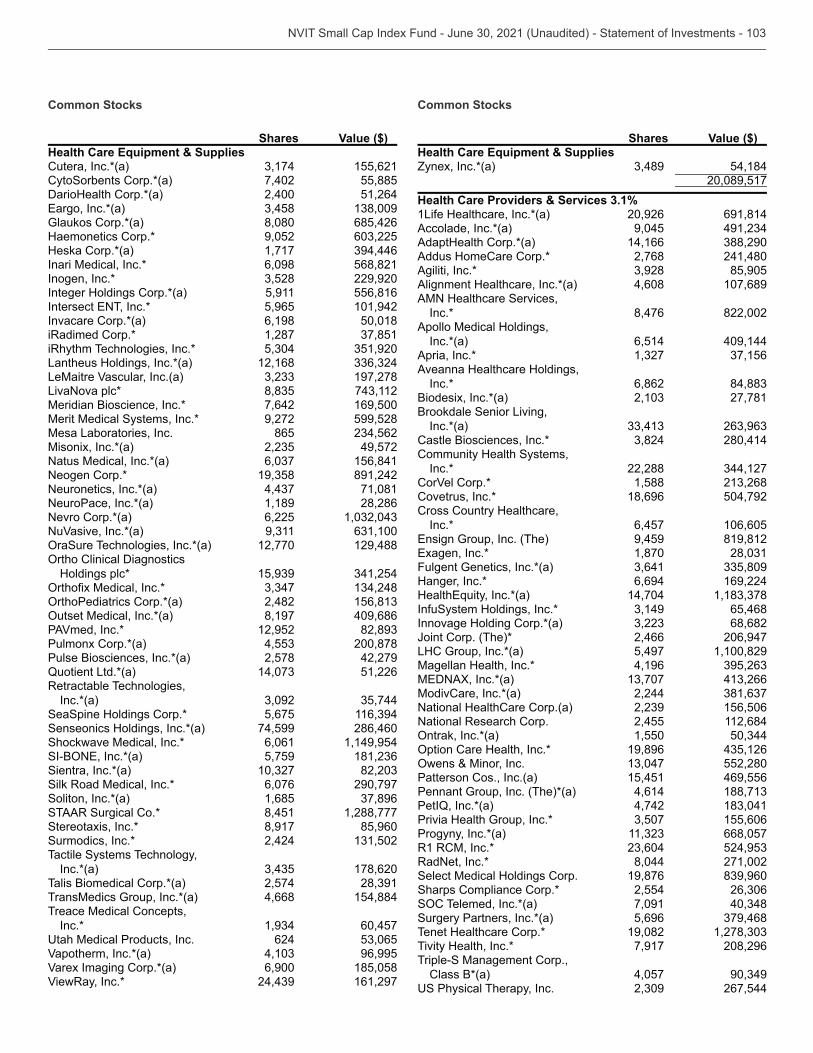
Common Stocks
Shares Value ($)Health Care Equipment & SuppliesCutera, Inc.*(a) 155,621CytoSorbents Corp.*(a) 7,402 55,885DarioHealth Corp.*(a) 2,400 51,264
Glaukos Corp.*(a) 8,080 685,426Haemonetics Corp.* 9,052 Heska Corp.*(a) 1,717 Inari Medical, Inc.* 6,098 568,821Inogen, Inc.* 229,920Integer Holdings Corp.*(a) 5,911 556,816
5,965 101,942Invacare Corp.*(a) 6,198 50,018iRadimed Corp.* 1,287 iRhythm Technologies, Inc.* Lantheus Holdings, Inc.*(a) 12,168 LeMaitre Vascular, Inc.(a) 197,278LivaNova plc* Meridian Bioscience, Inc.* 7,642 169,500Merit Medical Systems, Inc.* 9,272 599,528Mesa Laboratories, Inc. 865 Misonix, Inc.*(a) 49,572Natus Medical, Inc.*(a) 156,841Neogen Corp.* 891,242Neuronetics, Inc.*(a) 71,081NeuroPace, Inc.*(a) 1,189 28,286Nevro Corp.*(a) 6,225 NuVasive, Inc.*(a)
12,770 129,488
Holdings plc* 2,482 8,197 409,686
PAVmed, Inc.* 12,952 Pulmonx Corp.*(a) 200,878Pulse Biosciences, Inc.*(a) 2,578 42,279Quotient Ltd.*(a) 51,226Retractable Technologies,
Inc.*(a) SeaSpine Holdings Corp.* 5,675 Senseonics Holdings, Inc.*(a) 74,599 286,460Shockwave Medical, Inc.* 6,061 1,149,954
5,759 Sientra, Inc.*(a) Silk Road Medical, Inc.* 6,076 290,797Soliton, Inc.*(a) 1,685 STAAR Surgical Co.* 8,451 1,288,777Stereotaxis, Inc.* 8,917 85,960Surmodics, Inc.* 2,424 Tactile Systems Technology,
Inc.*(a) 178,620Talis Biomedical Corp.*(a) 2,574 TransMedics Group, Inc.*(a) 4,668 154,884Treace Medical Concepts,
Inc.* 60,457 624
Vapotherm, Inc.*(a) 96,995Varex Imaging Corp.*(a) 6,900 185,058ViewRay, Inc.* 161,297
Common Stocks
Shares Value ($)Health Care Equipment & SuppliesZynex, Inc.*(a) 54,184
20,089,517Health Care Providers & Services 3.1%1Life Healthcare, Inc.*(a) 20,926 691,814Accolade, Inc.*(a) 9,045 AdaptHealth Corp.*(a) 14,166 Addus HomeCare Corp.* 2,768 241,480Agiliti, Inc.* 85,905Alignment Healthcare, Inc.*(a) 4,608 107,689AMN Healthcare Services,
Inc.* 8,476 822,002Apollo Medical Holdings,
Inc.*(a) 6,514 409,144Apria, Inc.* Aveanna Healthcare Holdings,
Inc.* 6,862 Biodesix, Inc.*(a) 27,781Brookdale Senior Living,
Inc.*(a) Castle Biosciences, Inc.* 280,414Community Health Systems,
Inc.* 22,288 CorVel Corp.* 1,588 Covetrus, Inc.* 18,696 504,792Cross Country Healthcare,
Inc.* 6,457 106,605 9,459 819,812 1,870
Fulgent Genetics, Inc.*(a) Hanger, Inc.* 6,694 169,224
14,704 InfuSystem Holdings, Inc.* 65,468Innovage Holding Corp.*(a) 68,682Joint Corp. (The)* 2,466 206,947LHC Group, Inc.*(a) 5,497 1,100,829Magellan Health, Inc.* 4,196
ModivCare, Inc.*(a) 2,244 National HealthCare Corp.(a) 156,506National Research Corp. 2,455 112,684
1,550 19,896 552,280
Patterson Cos., Inc.(a) 15,451 469,556Pennant Group, Inc. (The)*(a) 4,614 PetIQ, Inc.*(a) 4,742 Privia Health Group, Inc.* 155,606Progyny, Inc.*(a) 668,057R1 RCM, Inc.* RadNet, Inc.* 8,044 271,002Select Medical Holdings Corp. 19,876 Sharps Compliance Corp.* 2,554
7,091 Surgery Partners, Inc.*(a) 5,696 Tenet Healthcare Corp.* 19,082 Tivity Health, Inc.* 7,917 208,296Triple-S Management Corp.,
Class B*(a) 4,057 267,544
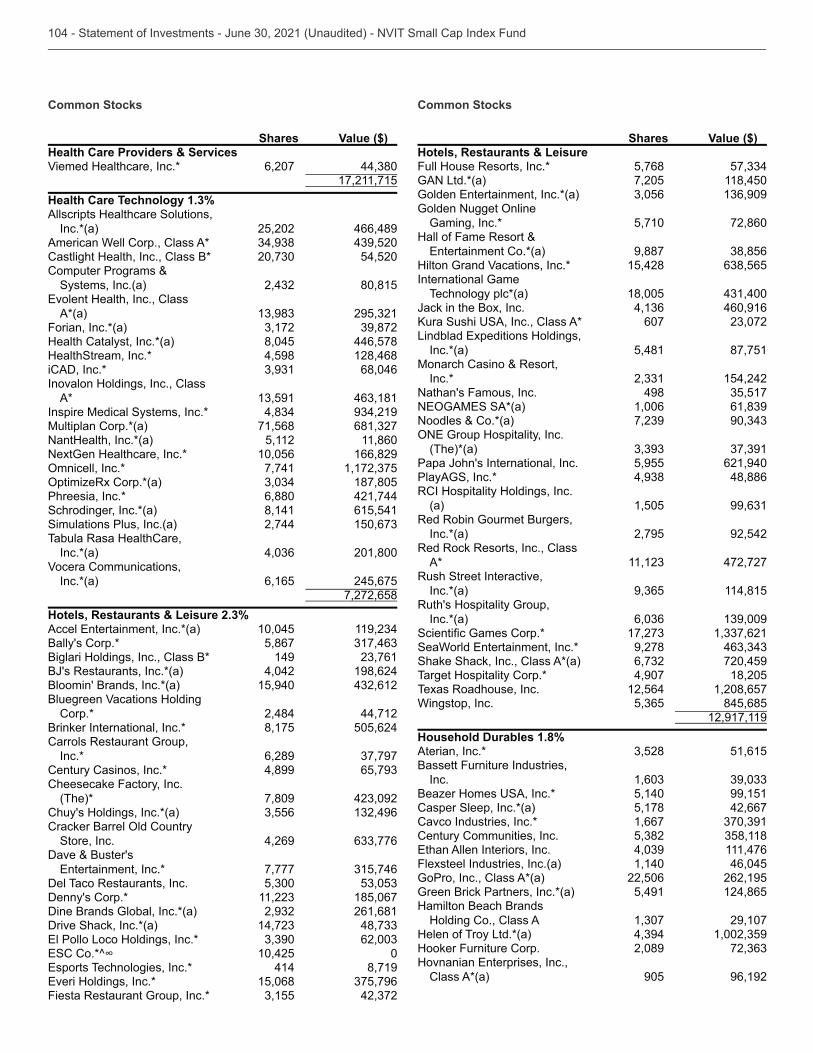
Common Stocks
Shares Value ($)Health Care Providers & ServicesViemed Healthcare, Inc.* 6,207
17,211,715Health Care Technology 1.3%Allscripts Healthcare Solutions,
Inc.*(a) 25,202 466,489American Well Corp., Class A* Castlight Health, Inc., Class B* 54,520Computer Programs &
Systems, Inc.(a) 80,815
A*(a) Forian, Inc.*(a) Health Catalyst, Inc.*(a) 8,045 446,578HealthStream, Inc.* 4,598 128,468iCAD, Inc.* 68,046Inovalon Holdings, Inc., Class
A* Inspire Medical Systems, Inc.* Multiplan Corp.*(a) 71,568 NantHealth, Inc.*(a) 5,112 11,860NextGen Healthcare, Inc.* 10,056 166,829
7,741 187,805
Phreesia, Inc.* 6,880 421,744Schrodinger, Inc.*(a) 8,141 615,541Simulations Plus, Inc.(a) 2,744 Tabula Rasa HealthCare,
Inc.*(a) 201,800Vocera Communications,
Inc.*(a) 6,165 245,675 7,272,658
Hotels, Restaurants & Leisure 2.3% 10,045
Bally's Corp.* 5,867 Biglari Holdings, Inc., Class B* 149 BJ's Restaurants, Inc.*(a) 4,042 198,624Bloomin' Brands, Inc.*(a) 15,940 Bluegreen Vacations Holding
Corp.* 2,484 44,712Brinker International, Inc.* 8,175 505,624Carrols Restaurant Group,
Inc.* 6,289 Century Casinos, Inc.* 4,899 Cheesecake Factory, Inc.
(The)* 7,809 Chuy's Holdings, Inc.*(a)
Store, Inc. 4,269 Dave & Buster's
7,777 Del Taco Restaurants, Inc. Denny's Corp.* 185,067Dine Brands Global, Inc.*(a) 261,681Drive Shack, Inc.*(a)
10,425 0 414 8,719 15,068
Fiesta Restaurant Group, Inc.*
Common Stocks
Shares Value ($)Hotels, Restaurants & LeisureFull House Resorts, Inc.* 5,768 GAN Ltd.*(a) 7,205 118,450
Gaming, Inc.* 5,710 72,860Hall of Fame Resort &
9,887 Hilton Grand Vacations, Inc.* 15,428 International Game
Technology plc*(a) 18,005 Jack in the Box, Inc. 460,916
607
Inc.*(a) 5,481 87,751Monarch Casino & Resort,
Inc.* 154,242Nathan's Famous, Inc. 498
1,006 Noodles & Co.*(a)
(The)*(a) Papa John's International, Inc. 5,955 621,940PlayAGS, Inc.* 48,886RCI Hospitality Holdings, Inc.
(a) 1,505 Red Robin Gourmet Burgers,
Inc.*(a) 2,795 92,542Red Rock Resorts, Inc., Class
A* 472,727Rush Street Interactive,
Inc.*(a) 114,815Ruth's Hospitality Group,
Inc.*(a) 9,278
Shake Shack, Inc., Class A*(a) 720,459Target Hospitality Corp.* 4,907 18,205Texas Roadhouse, Inc. 12,564 1,208,657Wingstop, Inc. 845,685
12,917,119Household Durables 1.8%Aterian, Inc.* 51,615Bassett Furniture Industries,
Inc. 5,140 99,151
Casper Sleep, Inc.*(a) 5,178 42,667Cavco Industries, Inc.* 1,667 Century Communities, Inc.
111,476Flexsteel Industries, Inc.(a) 1,140 46,045GoPro, Inc., Class A*(a) 22,506 262,195Green Brick Partners, Inc.*(a) 5,491 124,865Hamilton Beach Brands
Holding Co., Class A 29,107Helen of Troy Ltd.*(a) Hooker Furniture Corp. 2,089
Class A*(a) 905 96,192
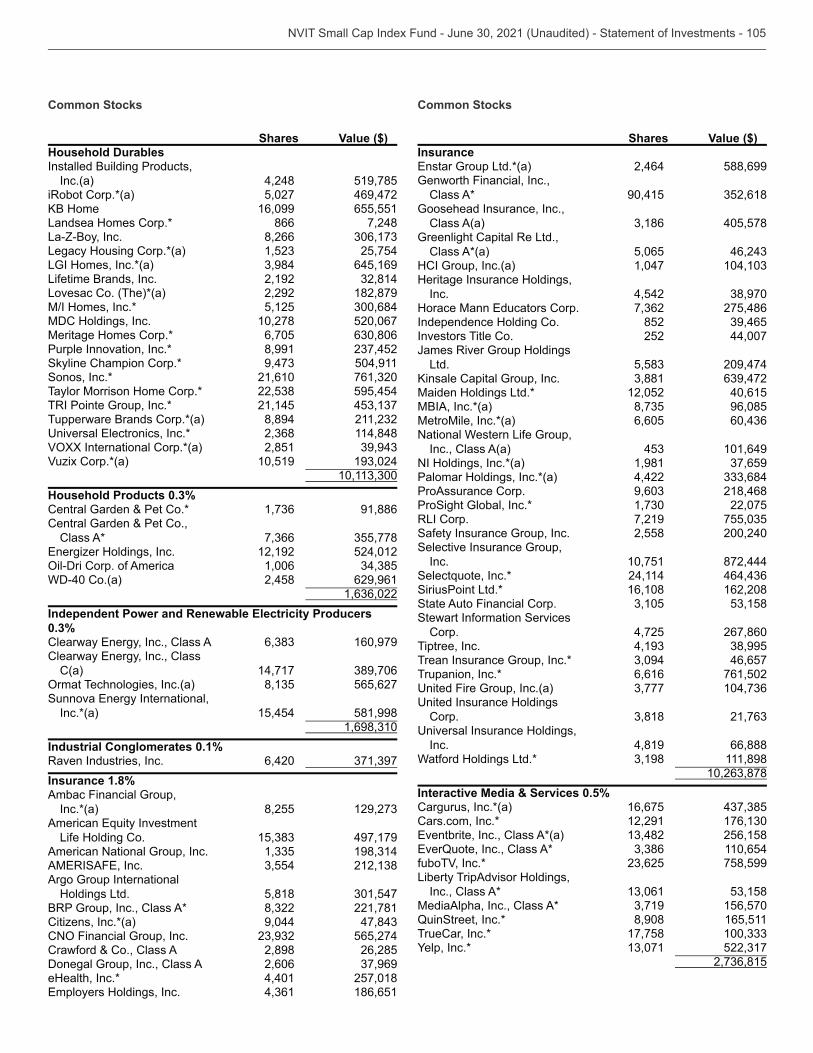
Common Stocks
Shares Value ($)Household DurablesInstalled Building Products,
Inc.(a) 4,248 519,785iRobot Corp.*(a) 5,027 469,472
16,099 655,551Landsea Homes Corp.* 866 7,248La-Z-Boy, Inc. 8,266 Legacy Housing Corp.*(a) 25,754LGI Homes, Inc.*(a) 645,169Lifetime Brands, Inc. 2,192 Lovesac Co. (The)*(a) 2,292 182,879M/I Homes, Inc.* 5,125 MDC Holdings, Inc. 10,278 520,067Meritage Homes Corp.* 6,705 Purple Innovation, Inc.* 8,991 Skyline Champion Corp.* 504,911Sonos, Inc.* 21,610 Taylor Morrison Home Corp.* 595,454TRI Pointe Group, Inc.* 21,145 Tupperware Brands Corp.*(a) 8,894
114,848 2,851
Vuzix Corp.*(a) 10,519
Household Products 0.3%Central Garden & Pet Co.* 91,886Central Garden & Pet Co.,
Class A* 12,192 524,012 1,006
WD-40 Co.(a) 2,458 629,961
Independent Power and Renewable Electricity Producers 0.3%
160,979
C(a) 14,717 565,627
Inc.*(a) 15,454 581,998
Industrial Conglomerates 0.1%Raven Industries, Inc. 6,420 Insurance 1.8%Ambac Financial Group,
Inc.*(a) 8,255
Life Holding Co. 497,179American National Group, Inc.
Argo Group International
Holdings Ltd. 5,818 BRP Group, Inc., Class A* 221,781Citizens, Inc.*(a) 9,044
565,274Crawford & Co., Class A 2,898 26,285Donegal Group, Inc., Class A 2,606 eHealth, Inc.* 4,401 257,018
186,651
Common Stocks
Shares Value ($)Insurance
2,464 588,699Genworth Financial, Inc.,
Class A* 90,415 Goosehead Insurance, Inc.,
Class A(a) 405,578Greenlight Capital Re Ltd.,
Class A*(a) 5,065 HCI Group, Inc.(a) 1,047 Heritage Insurance Holdings,
Inc. 4,542 275,486
Independence Holding Co. 852 Investors Title Co. 252 44,007James River Group Holdings
Ltd. 209,474
Maiden Holdings Ltd.* 12,052 40,615MBIA, Inc.*(a) 96,085MetroMile, Inc.*(a) 6,605 National Western Life Group,
Inc., Class A(a) 101,649NI Holdings, Inc.*(a) 1,981 Palomar Holdings, Inc.*(a) 4,422 ProAssurance Corp. 218,468ProSight Global, Inc.* 22,075RLI Corp. 7,219 Safety Insurance Group, Inc. 2,558 200,240Selective Insurance Group,
Inc. 10,751 872,444 24,114
SiriusPoint Ltd.* 16,108 162,208State Auto Financial Corp. Stewart Information Services
Corp. 4,725 267,860Tiptree, Inc. Trean Insurance Group, Inc.* 46,657Trupanion, Inc.* 6,616 761,502
Corp.
Inc. 4,819 66,888Watford Holdings Ltd.* 111,898
Interactive Media & Services 0.5%Cargurus, Inc.*(a) 16,675 Cars.com, Inc.* 12,291
256,158 110,654
fuboTV, Inc.* 758,599Liberty TripAdvisor Holdings,
Inc., Class A* MediaAlpha, Inc., Class A* 156,570QuinStreet, Inc.* 8,908 165,511TrueCar, Inc.* 17,758
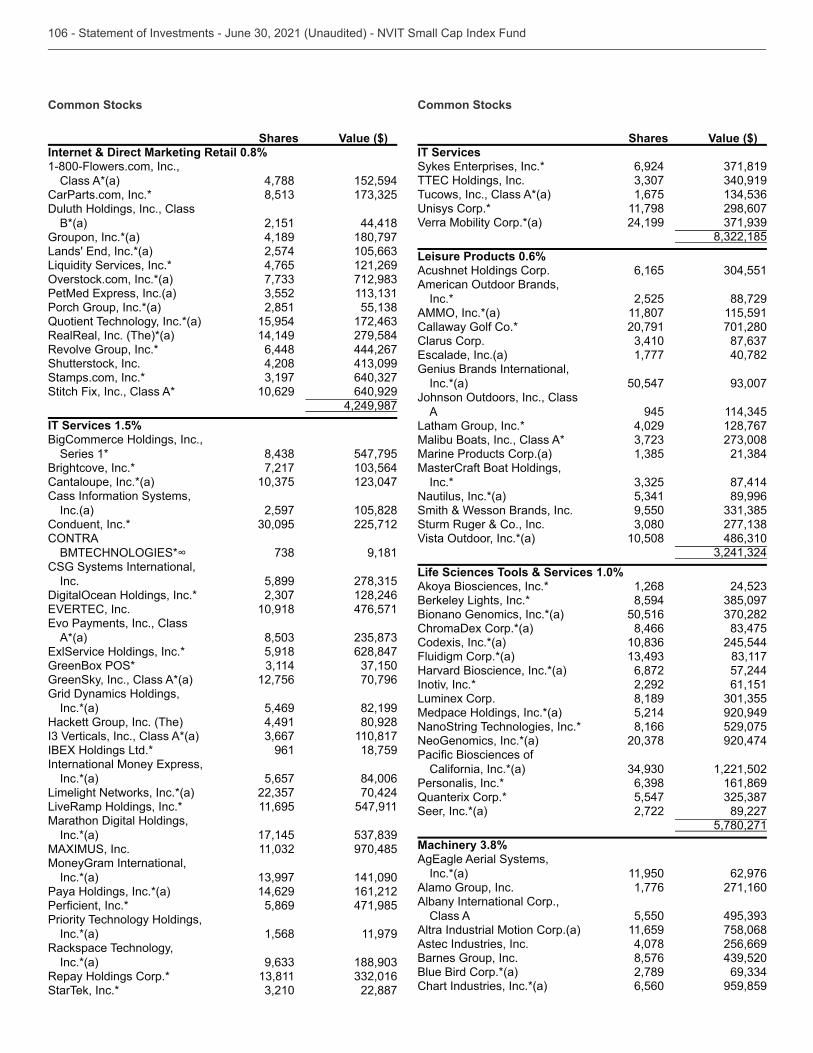
Common Stocks
Shares Value ($)Internet & Direct Marketing Retail 0.8%1-800-Flowers.com, Inc.,
Class A*(a) 4,788 152,594CarParts.com, Inc.* Duluth Holdings, Inc., Class
B*(a) 2,151 44,418Groupon, Inc.*(a) 4,189 180,797
2,574 4,765 121,269
Porch Group, Inc.*(a) 2,851 Quotient Technology, Inc.*(a) 15,954 RealReal, Inc. (The)*(a) 14,149 279,584Revolve Group, Inc.* 6,448 444,267Shutterstock, Inc. 4,208 Stamps.com, Inc.* Stitch Fix, Inc., Class A* 10,629 640,929
4,249,987IT Services 1.5%BigCommerce Holdings, Inc.,
Series 1* 547,795Brightcove, Inc.* 7,217 Cantaloupe, Inc.*(a) Cass Information Systems,
Inc.(a) 2,597 105,828Conduent, Inc.* 225,712
9,181CSG Systems International,
Inc. 5,899 128,246 10,918 476,571
A*(a) 5,918 628,847
GreenSky, Inc., Class A*(a) 12,756 70,796Grid Dynamics Holdings,
Inc.*(a) 5,469 82,199Hackett Group, Inc. (The) 4,491 80,928
110,817 961 18,759
Inc.*(a) 5,657 84,006Limelight Networks, Inc.*(a) 70,424LiveRamp Holdings, Inc.* 11,695 547,911Marathon Digital Holdings,
Inc.*(a) 17,145 970,485
MoneyGram International, Inc.*(a) 141,090
Paya Holdings, Inc.*(a) 14,629 161,212 5,869 471,985
Priority Technology Holdings, Inc.*(a) 1,568 11,979
Rackspace Technology, Inc.*(a)
Repay Holdings Corp.* StarTek, Inc.* 22,887
Common Stocks
Shares Value ($)IT Services
6,924
Tucows, Inc., Class A*(a) 1,675 11,798 298,607
Verra Mobility Corp.*(a) 24,199
Leisure Products 0.6%Acushnet Holdings Corp. 6,165
Inc.* 2,525 88,729 11,807 115,591
Callaway Golf Co.* 20,791 701,280Clarus Corp.
1,777 40,782Genius Brands International,
Inc.*(a) 50,547
A 945 Latham Group, Inc.* 4,029 128,767Malibu Boats, Inc., Class A* Marine Products Corp.(a) MasterCraft Boat Holdings,
Inc.* 87,414Nautilus, Inc.*(a) 89,996Smith & Wesson Brands, Inc. 9,550 Sturm Ruger & Co., Inc.
10,508
Life Sciences Tools & Services 1.0%Akoya Biosciences, Inc.* 1,268 Berkeley Lights, Inc.* 8,594 Bionano Genomics, Inc.*(a) 50,516 ChromaDex Corp.*(a) 8,466 Codexis, Inc.*(a) 245,544Fluidigm Corp.*(a) Harvard Bioscience, Inc.*(a) 6,872 57,244Inotiv, Inc.* 2,292 61,151Luminex Corp. 8,189 Medpace Holdings, Inc.*(a) 5,214 920,949NanoString Technologies, Inc.* 8,166 529,075NeoGenomics, Inc.*(a) 920,474
California, Inc.*(a) 1,221,502Personalis, Inc.* 161,869Quanterix Corp.* 5,547 Seer, Inc.*(a) 2,722 89,227
5,780,271Machinery 3.8%
Inc.*(a) 11,950 62,976Alamo Group, Inc. 1,776 271,160Albany International Corp.,
Class A 5,550 Altra Industrial Motion Corp.(a) 11,659 758,068Astec Industries, Inc. 4,078 256,669Barnes Group, Inc. 8,576 Blue Bird Corp.*(a) 2,789 Chart Industries, Inc.*(a) 6,560 959,859
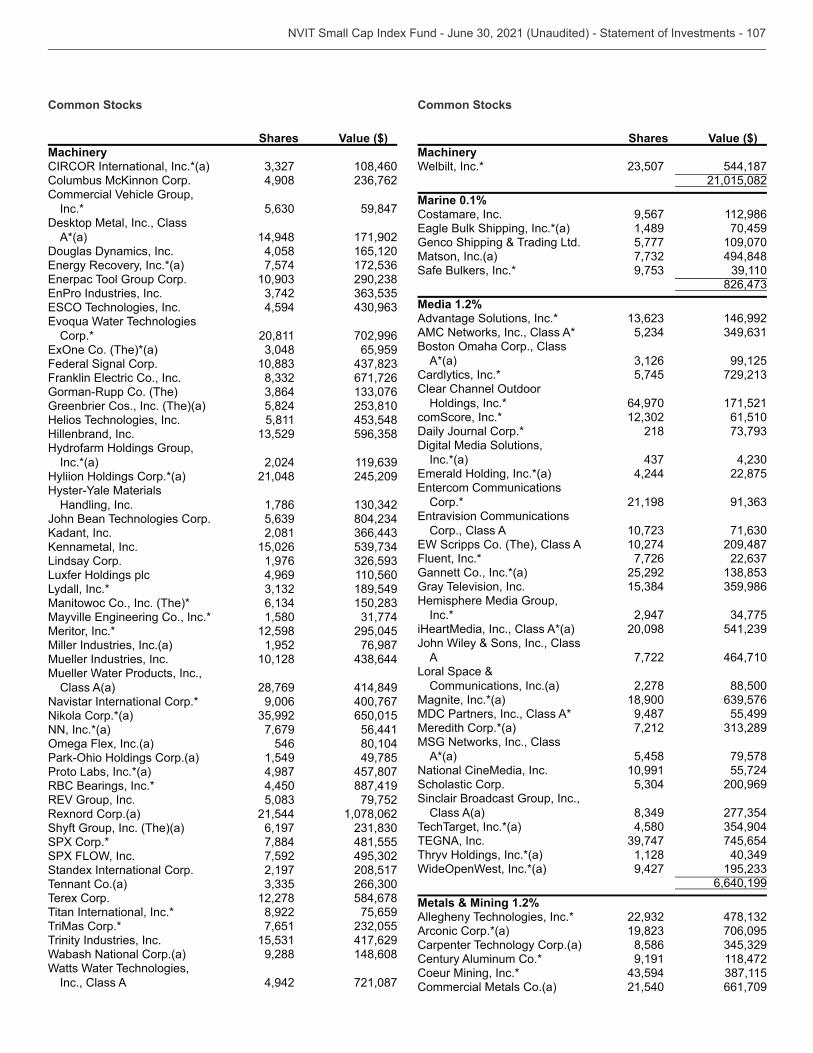
Common Stocks
Shares Value ($)Machinery
108,460 4,908
Commercial Vehicle Group, Inc.* 59,847
Desktop Metal, Inc., Class A*(a) 14,948 171,902
Douglas Dynamics, Inc. 4,058 165,120 7,574 4,594
Corp.* 20,811 702,996 65,959
Federal Signal Corp. 671,726
Gorman-Rupp Co. (The) Greenbrier Cos., Inc. (The)(a) 5,824 Helios Technologies, Inc. 5,811 Hillenbrand, Inc. Hydrofarm Holdings Group,
Inc.*(a) 2,024 Hyliion Holdings Corp.*(a) 21,048 245,209
Handling, Inc. 1,786 John Bean Technologies Corp.
2,081 15,026
Lindsay Corp. 1,976 Luxfer Holdings plc 4,969 110,560Lydall, Inc.* 189,549Manitowoc Co., Inc. (The)*
1,580 Meritor, Inc.* 12,598 295,045Miller Industries, Inc.(a) 1,952 76,987Mueller Industries, Inc. 10,128 Mueller Water Products, Inc.,
Class A(a) 28,769 414,849Navistar International Corp.* 9,006 400,767Nikola Corp.*(a) 650,015NN, Inc.*(a) 7,679 56,441
546 80,104 1,549 49,785
Proto Labs, Inc.*(a) 4,987 457,807RBC Bearings, Inc.* 4,450 887,419
79,752Rexnord Corp.(a) 21,544 1,078,062Shyft Group, Inc. (The)(a) 6,197 SPX Corp.* 7,884 481,555
7,592 Standex International Corp. 2,197 208,517Tennant Co.(a) Terex Corp. 12,278 584,678Titan International, Inc.* 8,922 75,659TriMas Corp.* 7,651 Trinity Industries, Inc. 417,629Wabash National Corp.(a) 9,288 148,608Watts Water Technologies,
Inc., Class A 4,942 721,087
Common Stocks
Shares Value ($)MachineryWelbilt, Inc.* 544,187
21,015,082Marine 0.1%Costamare, Inc. 9,567 112,986
1,489 70,459Genco Shipping & Trading Ltd. 5,777 109,070Matson, Inc.(a) 494,848Safe Bulkers, Inc.*
Media 1.2%Advantage Solutions, Inc.* 146,992AMC Networks, Inc., Class A*
A*(a) 99,125Cardlytics, Inc.* 5,745
Holdings, Inc.* 64,970 171,521comScore, Inc.* 61,510Daily Journal Corp.* 218 Digital Media Solutions,
Inc.*(a) 4,244 22,875
Corp.* 21,198
Corp., Class A 10,274 209,487
Fluent, Inc.* 7,726 Gannett Co., Inc.*(a) 25,292 Gray Television, Inc. Hemisphere Media Group,
Inc.* 2,947 iHeartMedia, Inc., Class A*(a) 20,098 John Wiley & Sons, Inc., Class
A 7,722 464,710Loral Space &
Communications, Inc.(a) 2,278 88,500Magnite, Inc.*(a) 18,900 MDC Partners, Inc., Class A* 9,487 55,499Meredith Corp.*(a) 7,212 MSG Networks, Inc., Class
A*(a) 5,458 79,578National CineMedia, Inc. 10,991 55,724Scholastic Corp. 200,969Sinclair Broadcast Group, Inc.,
Class A(a) TechTarget, Inc.*(a) 4,580
745,654Thryv Holdings, Inc.*(a) 1,128
9,427 6,640,199
Metals & Mining 1.2%Allegheny Technologies, Inc.* Arconic Corp.*(a) 706,095Carpenter Technology Corp.(a) 8,586 Century Aluminum Co.* 9,191 118,472Coeur Mining, Inc.* Commercial Metals Co.(a) 21,540 661,709
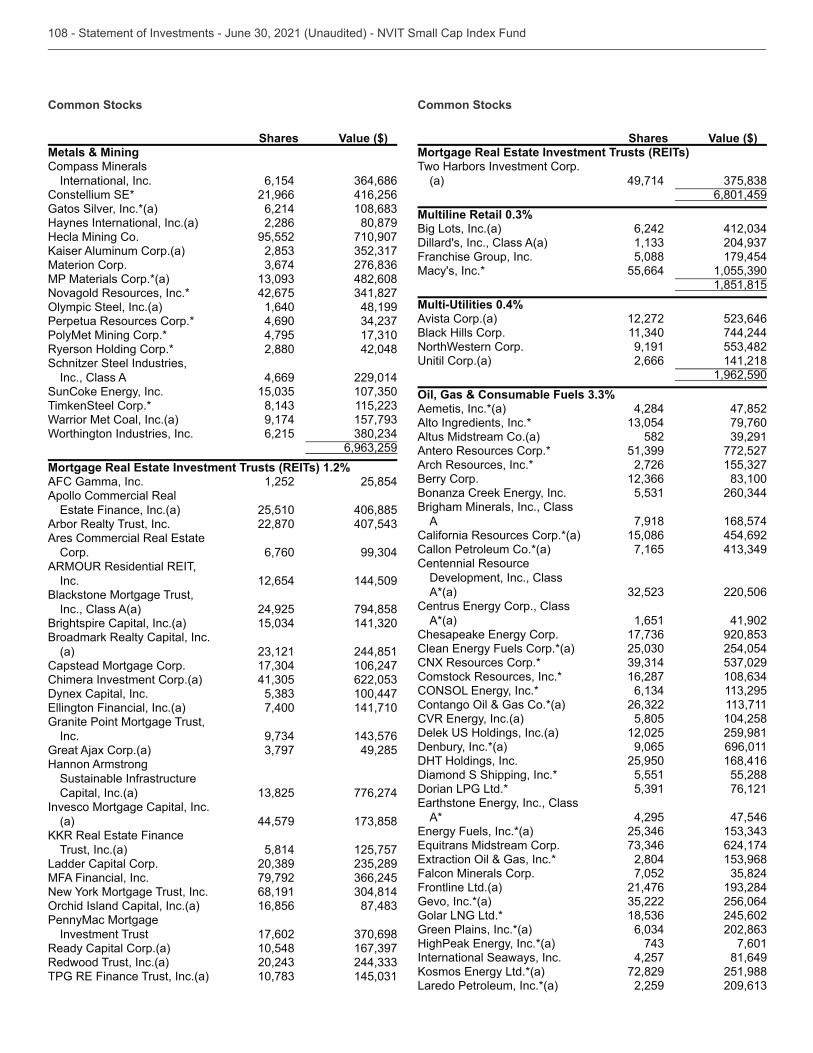
Common Stocks
Shares Value ($)Metals & MiningCompass Minerals
International, Inc. 6,154 21,966 416,256
Gatos Silver, Inc.*(a) 6,214 Haynes International, Inc.(a) 2,286 80,879Hecla Mining Co. 95,552 710,907
Materion Corp. MP Materials Corp.*(a) 482,608Novagold Resources, Inc.* 42,675
1,640 48,199Perpetua Resources Corp.* 4,690 PolyMet Mining Corp.* 4,795 Ryerson Holding Corp.* 2,880 42,048Schnitzer Steel Industries,
Inc., Class A 4,669 229,014
TimkenSteel Corp.* Warrior Met Coal, Inc.(a) 9,174 Worthington Industries, Inc. 6,215
Mortgage Real Estate Investment Trusts (REITs) 1.2%AFC Gamma, Inc. 1,252 25,854Apollo Commercial Real
25,510 406,885Arbor Realty Trust, Inc. 22,870
Corp. 6,760
Inc. 12,654 144,509Blackstone Mortgage Trust,
Inc., Class A(a) 24,925 794,858Brightspire Capital, Inc.(a) Broadmark Realty Capital, Inc.
(a) 244,851Capstead Mortgage Corp. 106,247Chimera Investment Corp.(a) Dynex Capital, Inc. 100,447
7,400 141,710Granite Point Mortgage Trust,
Inc. Great Ajax Corp.(a) 49,285Hannon Armstrong
Sustainable Infrastructure Capital, Inc.(a) 776,274
Invesco Mortgage Capital, Inc.(a) 44,579
Trust, Inc.(a) 5,814 125,757Ladder Capital Corp. MFA Financial, Inc. 79,792
68,191 16,856
PennyMac Mortgage Investment Trust 17,602
Ready Capital Corp.(a) 10,548 Redwood Trust, Inc.(a)
Common Stocks
Shares Value ($)Mortgage Real Estate Investment Trusts (REITs)Two Harbors Investment Corp.
(a) 49,714 6,801,459
Multiline Retail 0.3%Big Lots, Inc.(a) 6,242 Dillard's, Inc., Class A(a) Franchise Group, Inc. 5,088 179,454Macy's, Inc.* 55,664
1,851,815 0.4%
Avista Corp.(a) 12,272 Black Hills Corp. 744,244NorthWestern Corp. 9,191
2,666 141,218 1,962,590
Oil, Gas & Consumable Fuels 3.3%Aemetis, Inc.*(a) 4,284 47,852Alto Ingredients, Inc.* 79,760Altus Midstream Co.(a) 582 Antero Resources Corp.* 772,527Arch Resources, Inc.* 2,726 Berry Corp.
Brigham Minerals, Inc., Class
A 7,918 168,574California Resources Corp.*(a) 15,086 454,692Callon Petroleum Co.*(a) 7,165 Centennial Resource
Development, Inc., Class A*(a) 220,506
A*(a) 1,651 41,902 254,054
CNX Resources Corp.* Comstock Resources, Inc.* 16,287
5,805 104,258 12,025 259,981
Denbury, Inc.*(a) 9,065 696,011DHT Holdings, Inc. 25,950 168,416Diamond S Shipping, Inc.* 5,551 55,288Dorian LPG Ltd.* 76,121
A* 4,295 47,546 624,174 2,804
Falcon Minerals Corp. 7,052 Frontline Ltd.(a) 21,476 Gevo, Inc.*(a) 256,064Golar LNG Ltd.* 245,602Green Plains, Inc.*(a)
7,601International Seaways, Inc. 4,257 81,649
72,829 251,988Laredo Petroleum, Inc.*(a) 2,259
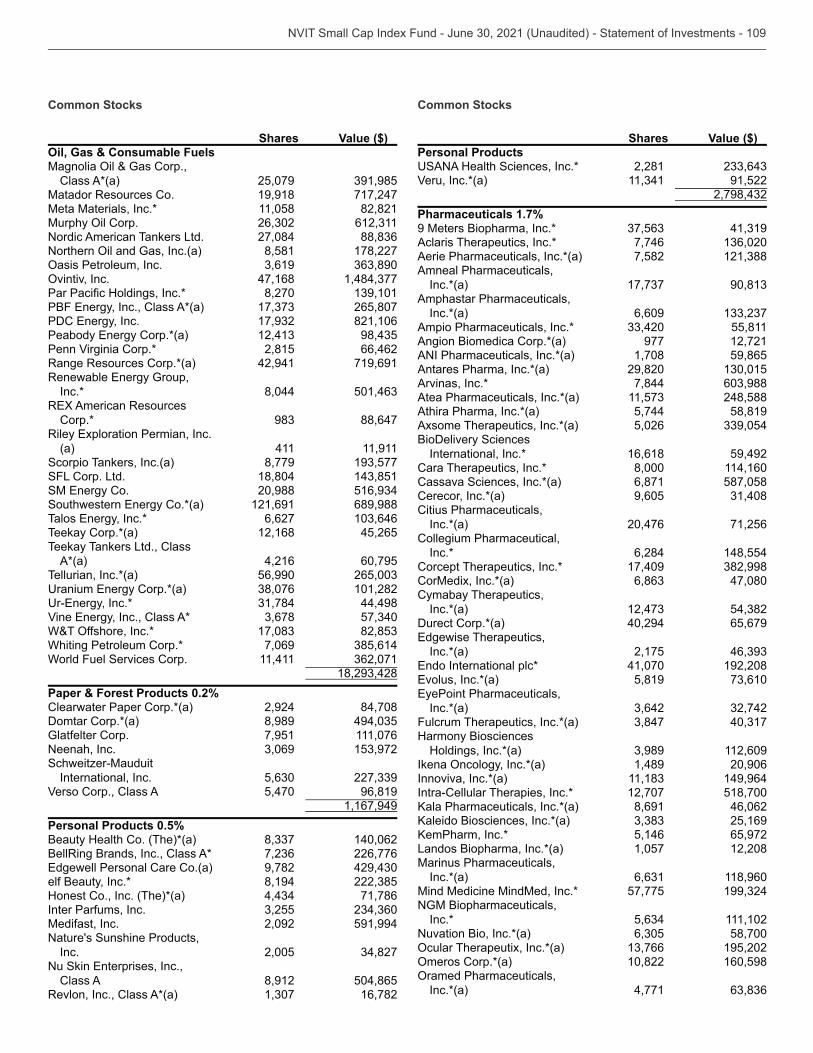
Common Stocks
Shares Value ($)Oil, Gas & Consumable Fuels
Class A*(a) 25,079 Matador Resources Co. 19,918 717,247Meta Materials, Inc.* 11,058 82,821
Nordic American Tankers Ltd. 27,084
8,581 178,227 47,168 8,270 265,807 821,106
Penn Virginia Corp.* 2,815 66,462Range Resources Corp.*(a) 42,941 719,691
Inc.* 8,044
Corp.* 88,647
(a) 411 11,911Scorpio Tankers, Inc.(a) 8,779 SFL Corp. Ltd. 18,804
20,988 121,691 689,988 6,627
Teekay Corp.*(a) 12,168 45,265Teekay Tankers Ltd., Class
A*(a) 4,216 60,795Tellurian, Inc.*(a) 56,990
101,282 44,498
Whiting Petroleum Corp.* 7,069 World Fuel Services Corp. 11,411
Paper & Forest Products 0.2%Clearwater Paper Corp.*(a) 2,924 84,708Domtar Corp.*(a) 8,989 Glatfelter Corp. 7,951 111,076Neenah, Inc. Schweitzer-Mauduit
International, Inc. Verso Corp., Class A 5,470 96,819
1,167,949Personal Products 0.5%Beauty Health Co. (The)*(a) 140,062BellRing Brands, Inc., Class A* 226,776
9,782 elf Beauty, Inc.* 8,194 Honest Co., Inc. (The)*(a) 71,786Inter Parfums, Inc. Medifast, Inc. 2,092 591,994Nature's Sunshine Products,
Inc. 2,005
Class A 8,912 504,865Revlon, Inc., Class A*(a) 16,782
Common Stocks
Shares Value ($)Personal Products
2,281 Veru, Inc.*(a) 91,522
Pharmaceuticals 1.7%9 Meters Biopharma, Inc.* Aclaris Therapeutics, Inc.* 7,746 Aerie Pharmaceuticals, Inc.*(a) 7,582 Amneal Pharmaceuticals,
Inc.*(a) Amphastar Pharmaceuticals,
Inc.*(a) 6,609 Ampio Pharmaceuticals, Inc.* 55,811Angion Biomedica Corp.*(a) 977 12,721ANI Pharmaceuticals, Inc.*(a) 1,708 59,865Antares Pharma, Inc.*(a) 29,820 Arvinas, Inc.* 7,844 Atea Pharmaceuticals, Inc.*(a) 248,588Athira Pharma, Inc.*(a) 5,744 58,819Axsome Therapeutics, Inc.*(a) 5,026 BioDelivery Sciences
International, Inc.* 16,618 59,492Cara Therapeutics, Inc.* 8,000 114,160Cassava Sciences, Inc.*(a) 6,871 587,058Cerecor, Inc.*(a) 9,605 Citius Pharmaceuticals,
Inc.*(a) 20,476 71,256Collegium Pharmaceutical,
Inc.* 6,284 148,554Corcept Therapeutics, Inc.* 17,409 CorMedix, Inc.*(a) 47,080Cymabay Therapeutics,
Inc.*(a) Durect Corp.*(a) 40,294 65,679
Inc.*(a) 2,175 41,070 192,208 5,819
Inc.*(a) Fulcrum Therapeutics, Inc.*(a) Harmony Biosciences
Holdings, Inc.*(a) 112,609 1,489 20,906
Innoviva, Inc.*(a) 149,964Intra-Cellular Therapies, Inc.* 12,707 518,700
8,691 46,062 25,169 5,146 65,972
Landos Biopharma, Inc.*(a) 1,057 12,208Marinus Pharmaceuticals,
Inc.*(a) 118,960Mind Medicine MindMed, Inc.* 57,775 NGM Biopharmaceuticals,
Inc.* 111,102Nuvation Bio, Inc.*(a) 58,700
195,202 10,822 160,598
Inc.*(a) 4,771
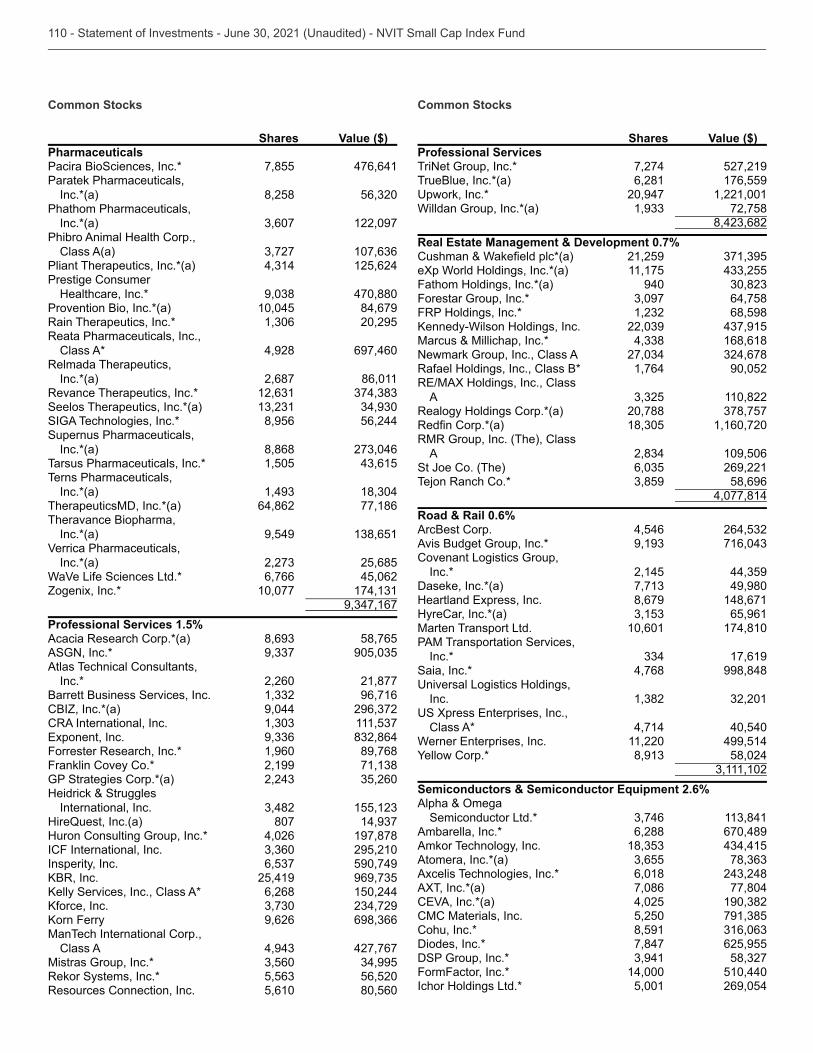
Common Stocks
Shares Value ($)PharmaceuticalsPacira BioSciences, Inc.* 7,855 476,641Paratek Pharmaceuticals,
Inc.*(a) 8,258 Phathom Pharmaceuticals,
Inc.*(a) 122,097Phibro Animal Health Corp.,
Class A(a) Pliant Therapeutics, Inc.*(a) 125,624Prestige Consumer
Healthcare, Inc.* 470,880Provention Bio, Inc.*(a) 10,045 84,679Rain Therapeutics, Inc.* 20,295Reata Pharmaceuticals, Inc.,
Class A* 4,928 697,460Relmada Therapeutics,
Inc.*(a) 2,687 86,011Revance Therapeutics, Inc.* Seelos Therapeutics, Inc.*(a) SIGA Technologies, Inc.* 8,956 56,244Supernus Pharmaceuticals,
Inc.*(a) 8,868 Tarsus Pharmaceuticals, Inc.* 1,505 Terns Pharmaceuticals,
Inc.*(a) TherapeuticsMD, Inc.*(a) 64,862 77,186Theravance Biopharma,
Inc.*(a) 9,549 Verrica Pharmaceuticals,
Inc.*(a) 25,685WaVe Life Sciences Ltd.* 6,766 45,062Zogenix, Inc.* 10,077
Professional Services 1.5%Acacia Research Corp.*(a) 58,765ASGN, Inc.* Atlas Technical Consultants,
Inc.* 2,260 21,877Barrett Business Services, Inc. 96,716CBIZ, Inc.*(a) 9,044 CRA International, Inc.
Forrester Research, Inc.* 1,960 89,768Franklin Covey Co.* 2,199 GP Strategies Corp.*(a) Heidrick & Struggles
International, Inc. HireQuest, Inc.(a) 807 Huron Consulting Group, Inc.* 4,026 197,878ICF International, Inc. 295,210Insperity, Inc. 590,749
25,419 6,268 150,244 9,626
ManTech International Corp., Class A 427,767
Mistras Group, Inc.* Rekor Systems, Inc.* 56,520Resources Connection, Inc. 5,610 80,560
Common Stocks
Shares Value ($)Professional ServicesTriNet Group, Inc.* 7,274 527,219TrueBlue, Inc.*(a) 6,281 176,559
20,947 1,221,001Willdan Group, Inc.*(a) 72,758
Real Estate Management & Development 0.7%
21,259 eXp World Holdings, Inc.*(a) 11,175 Fathom Holdings, Inc.*(a) 940 Forestar Group, Inc.* 64,758FRP Holdings, Inc.* 68,598
Marcus & Millichap, Inc.* 168,618Newmark Group, Inc., Class A Rafael Holdings, Inc., Class B* 1,764 90,052
A 110,822Realogy Holdings Corp.*(a) 20,788
1,160,720RMR Group, Inc. (The), Class
A 109,506St Joe Co. (The) 269,221Tejon Ranch Co.* 58,696
4,077,814Road & Rail 0.6%ArcBest Corp. 4,546 Avis Budget Group, Inc.* Covenant Logistics Group,
Inc.* 2,145 Daseke, Inc.*(a) 49,980
8,679 148,671HyreCar, Inc.*(a) 65,961Marten Transport Ltd. 10,601 174,810PAM Transportation Services,
Inc.* 17,619Saia, Inc.* 4,768 998,848
Inc.
Class A* 4,714 40,540 11,220 499,514 58,024
Semiconductors & Semiconductor Equipment 2.6%
Semiconductor Ltd.* Ambarella, Inc.* 6,288 670,489Amkor Technology, Inc. Atomera, Inc.*(a) Axcelis Technologies, Inc.* 6,018 AXT, Inc.*(a) 7,086 77,804
4,025 CMC Materials, Inc. 5,250 Cohu, Inc.* 8,591 Diodes, Inc.* 7,847 625,955DSP Group, Inc.* FormFactor, Inc.* 14,000 510,440Ichor Holdings Ltd.* 5,001 269,054
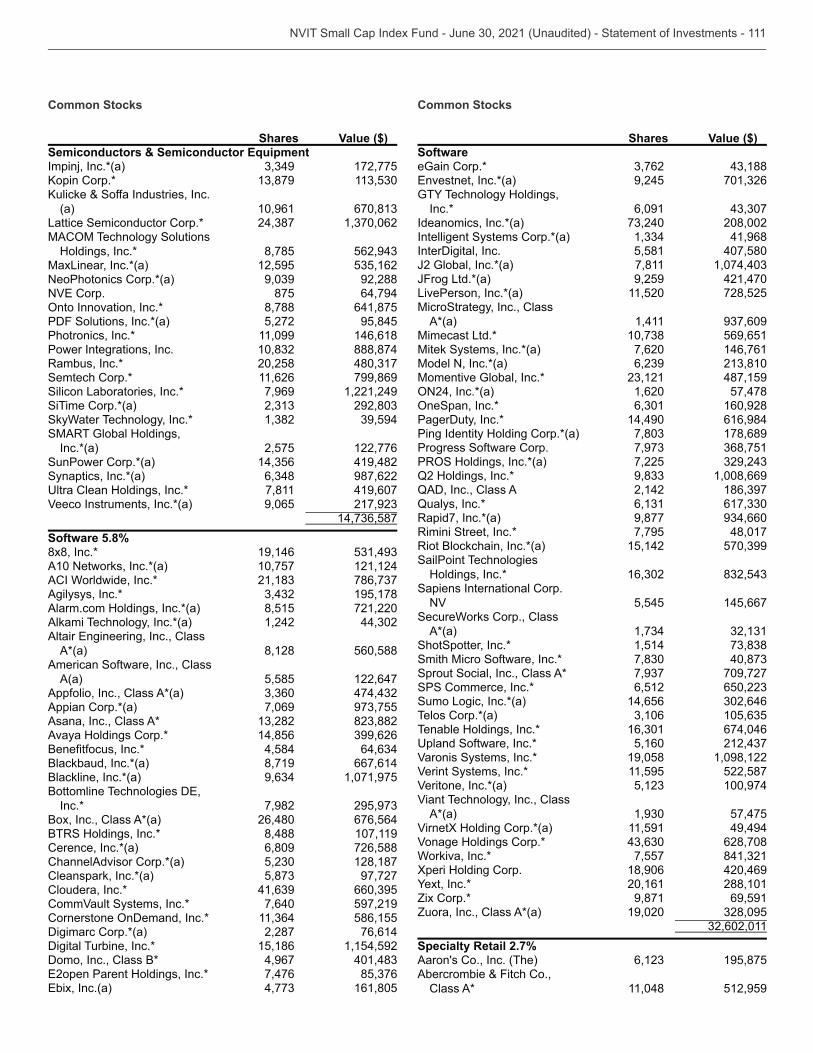
Common Stocks
Shares Value ($)Semiconductors & Semiconductor EquipmentImpinj, Inc.*(a) 172,775
(a) 10,961 Lattice Semiconductor Corp.*
Holdings, Inc.* 8,785 MaxLinear, Inc.*(a) 12,595 NeoPhotonics Corp.*(a) 92,288
875 64,794 8,788 641,875
PDF Solutions, Inc.*(a) 5,272 95,845Photronics, Inc.* 11,099 146,618Power Integrations, Inc. 888,874Rambus, Inc.* 20,258 Semtech Corp.* 11,626 799,869Silicon Laboratories, Inc.* 7,969 1,221,249SiTime Corp.*(a) SkyWater Technology, Inc.* SMART Global Holdings,
Inc.*(a) 2,575 122,776SunPower Corp.*(a) 419,482Synaptics, Inc.*(a) 987,622
7,811 419,607Veeco Instruments, Inc.*(a) 9,065
Software 5.8%8x8, Inc.* 19,146 A10 Networks, Inc.*(a) 10,757 121,124ACI Worldwide, Inc.* Agilysys, Inc.* 195,178Alarm.com Holdings, Inc.*(a) 8,515 721,220Alkami Technology, Inc.*(a) 1,242
A*(a) 8,128 560,588American Software, Inc., Class
A(a) 5,585 122,647Appfolio, Inc., Class A*(a) Appian Corp.*(a) 7,069 Asana, Inc., Class A* Avaya Holdings Corp.* 14,856
4,584 Blackbaud, Inc.*(a) 8,719 667,614Blackline, Inc.*(a) 1,071,975
Inc.* 7,982 Box, Inc., Class A*(a) 26,480 676,564BTRS Holdings, Inc.* 8,488 107,119Cerence, Inc.*(a) 6,809 726,588ChannelAdvisor Corp.*(a) 128,187Cleanspark, Inc.*(a) 97,727Cloudera, Inc.* CommVault Systems, Inc.* 7,640 597,219
586,155Digimarc Corp.*(a) 2,287 76,614Digital Turbine, Inc.* 15,186 1,154,592Domo, Inc., Class B* 4,967
7,476 161,805
Common Stocks
Shares Value ($)SoftwareeGain Corp.*
9,245
Inc.* 6,091 Ideanomics, Inc.*(a) 208,002Intelligent Systems Corp.*(a) 41,968InterDigital, Inc. 5,581 407,580J2 Global, Inc.*(a) 7,811 JFrog Ltd.*(a) 9,259 421,470LivePerson, Inc.*(a) 11,520 728,525MicroStrategy, Inc., Class
A*(a) 1,411 Mimecast Ltd.* 569,651Mitek Systems, Inc.*(a) 7,620 146,761Model N, Inc.*(a) Momentive Global, Inc.* 487,159
1,620 57,478 160,928
PagerDuty, Inc.* 14,490 616,984Ping Identity Holding Corp.*(a) 178,689Progress Software Corp.
7,225 Q2 Holdings, Inc.* 1,008,669QAD, Inc., Class A 2,142 Qualys, Inc.* Rapid7, Inc.*(a) 9,877 Rimini Street, Inc.* 7,795 48,017Riot Blockchain, Inc.*(a) 15,142 SailPoint Technologies
Holdings, Inc.* Sapiens International Corp.
NV 5,545 145,667SecureWorks Corp., Class
A*(a) ShotSpotter, Inc.* 1,514 Smith Micro Software, Inc.* Sprout Social, Inc., Class A* 709,727SPS Commerce, Inc.* 6,512 Sumo Logic, Inc.*(a) 14,656 Telos Corp.*(a) Tenable Holdings, Inc.* 674,046
5,160 Varonis Systems, Inc.* 19,058 1,098,122Verint Systems, Inc.* 11,595 522,587Veritone, Inc.*(a) 100,974Viant Technology, Inc., Class
A*(a) 57,475VirnetX Holding Corp.*(a) 11,591 49,494Vonage Holdings Corp.* 628,708Workiva, Inc.* 7,557 Xperi Holding Corp. 18,906 420,469
20,161 288,101Zix Corp.* 9,871 69,591Zuora, Inc., Class A*(a) 19,020
Specialty Retail 2.7%Aaron's Co., Inc. (The) 195,875Abercrombie & Fitch Co.,
Class A* 11,048 512,959

Common Stocks
Shares Value ($)Specialty Retail
Inc.*(a) 457,475
(a) 1,026,671America's Car-Mart, Inc.* 1,085 Arko Corp.*(a) Asbury Automotive Group,
Inc.*(a) 595,511At Home Group, Inc.* 11,794
Inc.* 6,855 49,424Bed Bath & Beyond, Inc.* 657,577Big 5 Sporting Goods Corp.(a) 95,119Blink Charging Co.*(a) 6,558 Boot Barn Holdings, Inc.* 5,171 Buckle, Inc. (The) 266,958Caleres, Inc. 6,660 181,751Camping World Holdings, Inc.,
Class A(a) 7,652 CarLotz, Inc.*(a) 7,675 41,905Cato Corp. (The), Class A Chico's FAS, Inc.* 22,008 Children's Place, Inc. (The)* Citi Trends, Inc.* 1,601 Conn's, Inc.* 81,804Container Store Group, Inc.
(The)* 5,622 Designer Brands, Inc., Class
A* 10,820 179,071Genesco, Inc.* 2,626 167,224Group 1 Automotive, Inc. GrowGeneration Corp.*(a) Guess?, Inc. 7,262 191,717Haverty Furniture Cos., Inc. 2,991 127,895Hibbett, Inc.*(a) 2,921 261,809
2,045 2,458
Lazydays Holdings, Inc.*(a) 1,255 27,610
Inc.*(a) 5,127 108,180MarineMax, Inc.*(a) Monro, Inc.(a) 5,978
4,518 602,566National Vision Holdings,
Inc.*(a) 14,675 8,826
A(a) 1,822 76,579Party City Holdco, Inc.* 19,784 184,585Rent-A-Center, Inc. 11,842 628,455Sally Beauty Holdings, Inc.*(a) Shift Technologies, Inc.*(a) 11,066 94,946Shoe Carnival, Inc.(a) 1,602 114,687Signet Jewelers Ltd.* 757,406Sleep Number Corp.*(a) Sonic Automotive, Inc., Class
A Sportsman's Warehouse
Holdings, Inc.* 7,804 Tilly's, Inc., Class A 4,152
Common Stocks
Shares Value ($)Specialty RetailTravelCenters of America,
Inc.*(a) 2,210 64,620 508,655
Winmark Corp. 607 Zumiez, Inc.*
Technology Hardware, Storage & Peripherals 0.3%
872,785Avid Technology, Inc.*(a) 6,504 Corsair Gaming, Inc.*(a) 160,924Diebold Nixdorf, Inc.* 12,946 166,227
8,072 67,159Quantum Corp.* 9,890 68,142Super Micro Computer, Inc.* 7,806 274,615Turtle Beach Corp.*(a) 2,686
1,950,220Textiles, Apparel & Luxury Goods 0.7%Crocs, Inc.* 11,612 Fossil Group, Inc.*(a) 8,400 119,952G-III Apparel Group Ltd.* 7,948 261,171
525,854Movado Group, Inc. 2,805
2,928 289,404 75,058
Rocky Brands, Inc. 1,245 69,222Steven Madden Ltd. 14,801 647,692Superior Group of Cos., Inc.(a) 2,019 48,274
2,412 58,756Vera Bradley, Inc.*(a) 4,569 56,610Wolverine World Wide, Inc. 14,657
Thrifts & Mortgage Finance 1.5%Axos Financial, Inc.*(a) 10,456 485,054Bridgewater Bancshares,
Inc.*(a) Capitol Federal Financial, Inc. 276,276Columbia Financial, Inc.*(a) 7,581
19,924 895,584Federal Agricultural Mortgage
Corp., Class C 1,660 164,174Finance of America Cos., Inc.,
Class A* Flagstar Bancorp, Inc. FS Bancorp, Inc. 664 Hingham Institution for
Savings 266 Home Bancorp, Inc. 58,575Home Point Capital, Inc.*(a) 1,076 HomeStreet, Inc.(a) 2,988
166,009Luther Burbank Corp. Merchants Bancorp 1,744 Meridian Bancorp, Inc.(a) 8,505 174,012Meta Financial Group, Inc. 272,541Mr. Cooper Group, Inc.* 12,791 422,871NMI Holdings, Inc., Class A* 15,177
8,708 142,811Northwest Bancshares, Inc. 21,078 287,504
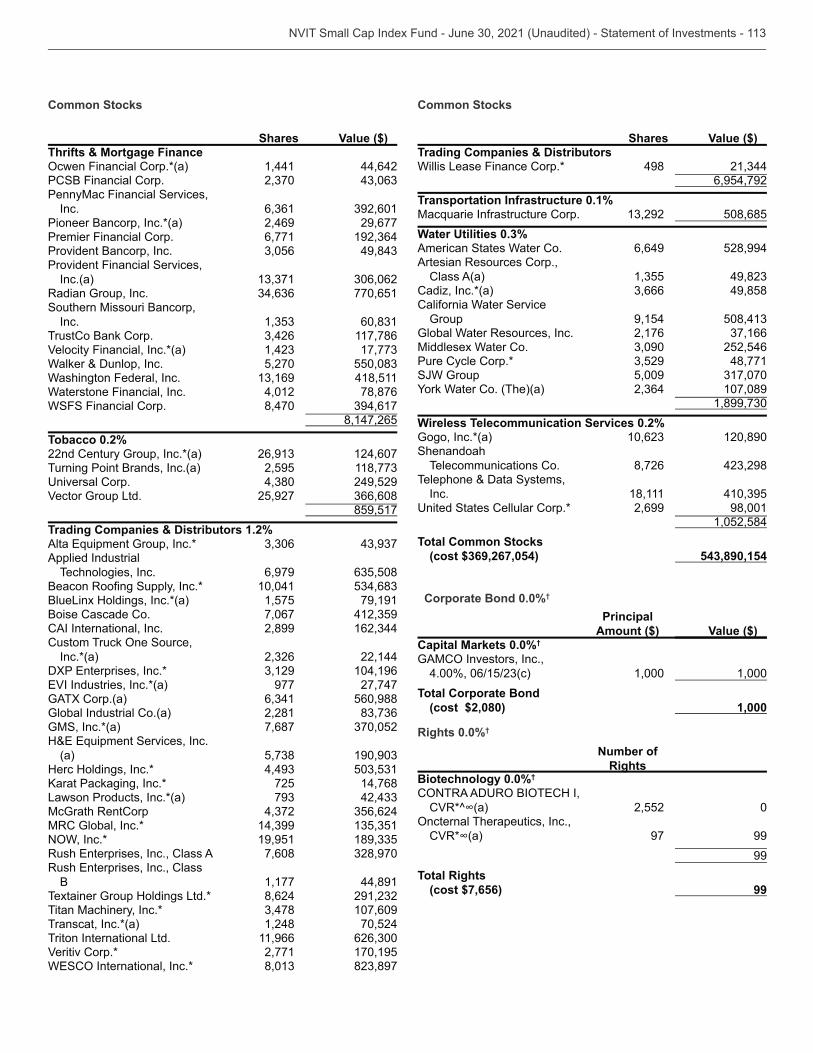
Common Stocks
Shares Value ($)Thrifts & Mortgage Finance
1,441 44,642PCSB Financial Corp. PennyMac Financial Services,
Inc. Pioneer Bancorp, Inc.*(a) 2,469 29,677Premier Financial Corp. 6,771 Provident Bancorp, Inc. Provident Financial Services,
Inc.(a) Radian Group, Inc. 770,651Southern Missouri Bancorp,
Inc. TrustCo Bank Corp. 117,786Velocity Financial, Inc.*(a) Walker & Dunlop, Inc. 5,270 Washington Federal, Inc. 418,511Waterstone Financial, Inc. 4,012 78,876WSFS Financial Corp. 8,470
8,147,265Tobacco 0.2%22nd Century Group, Inc.*(a) 124,607Turning Point Brands, Inc.(a) 2,595
249,529Vector Group Ltd. 25,927
859,517Trading Companies & Distributors 1.2%
Applied Industrial
Technologies, Inc. 6,979 10,041
BlueLinx Holdings, Inc.*(a) 1,575 79,191Boise Cascade Co. 7,067 CAI International, Inc. 2,899
Inc.*(a) 22,144 104,196 977 27,747
GATX Corp.(a) 560,988Global Industrial Co.(a) 2,281 GMS, Inc.*(a) 7,687
(a) Herc Holdings, Inc.*
725 14,768Lawson Products, Inc.*(a) McGrath RentCorp MRC Global, Inc.*
19,951 7,608
B 1,177 44,891Textainer Group Holdings Ltd.* 8,624 Titan Machinery, Inc.* 107,609Transcat, Inc.*(a) 1,248 70,524Triton International Ltd. 11,966 Veritiv Corp.* 2,771 170,195
Common Stocks
Shares Value ($)Trading Companies & DistributorsWillis Lease Finance Corp.* 498
6,954,792Transportation Infrastructure 0.1%
508,685Water Utilities 0.3%American States Water Co. 6,649 528,994Artesian Resources Corp.,
Class A(a) Cadiz, Inc.*(a) 49,858California Water Service
Group 9,154 Global Water Resources, Inc. 2,176 Middlesex Water Co. 252,546Pure Cycle Corp.* 48,771SJW Group 5,009
107,089
Wireless Telecommunication Services 0.2%Gogo, Inc.*(a) 120,890Shenandoah
Telecommunications Co. 8,726 Telephone & Data Systems,
Inc. 18,111 2,699 98,001
1,052,584Total Common Stocks
(cost $369,267,054) 543,890,154Corporate Bond
Corporate Bond 0.0%† Principal
Amount ($) Value ($)Capital Markets 0.0%†
1,000 1,000Total Corporate Bond
(cost $2,080) 1,000
Rights 0.0%† Number of
RightsBiotechnology 0.0%†
2,552 0
97 99 99
Total Rights (cost $7,656) 99
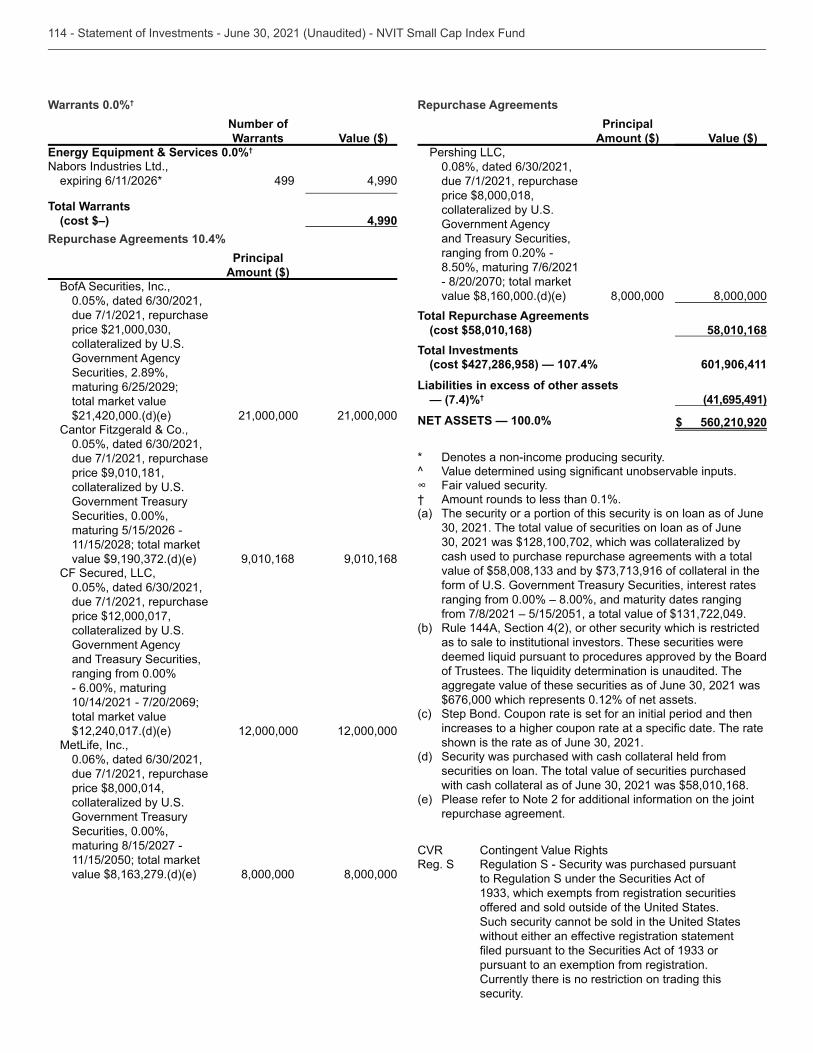
Warrants 0.0%† Number of Warrants Value ($)
Energy Equipment & Services 0.0%† Nabors Industries Ltd.,
expiring 6/11/2026* 499 4,990
Total Warrants (cost $–) 4,990
Repurchase Agreements 10.4% Principal
Amount ($)BofA Securities, Inc.,
due 7/1/2021, repurchase
Government Agency Securities, 2.89%, maturing 6/25/2029; total market value $21,420,000.(d)(e) 21,000,000 21,000,000
Cantor Fitzgerald & Co.,
due 7/1/2021, repurchase price $9,010,181,
Government Treasury Securities, 0.00%, maturing 5/15/2026 - 11/15/2028; total market
9,010,168 9,010,168CF Secured, LLC,
due 7/1/2021, repurchase price $12,000,017,
Government Agency and Treasury Securities, ranging from 0.00% - 6.00%, maturing 10/14/2021 - 7/20/2069; total market value $12,240,017.(d)(e) 12,000,000 12,000,000
MetLife, Inc.,
due 7/1/2021, repurchase price $8,000,014,
Government Treasury Securities, 0.00%, maturing 8/15/2027 - 11/15/2050; total market
8,000,000 8,000,000
Repurchase Agreements
Principal
Amount ($) Value ($)Pershing LLC,
due 7/1/2021, repurchase price $8,000,018,
Government Agency and Treasury Securities, ranging from 0.20% - 8.50%, maturing 7/6/2021 - 8/20/2070; total market value $8,160,000.(d)(e) 8,000,000 8,000,000
Total Repurchase Agreements (cost $58,010,168) 58,010,168
Total Investments(cost $427,286,958) — 107.4% 601,906,411
Liabilities in excess of other assets — (7.4)%† (41,695,491)
NET ASSETS — 100.0% $ 560,210,920
* Denotes a non-income producing security.^
Fair valued security.† Amount rounds to less than 0.1%.(a) The security or a portion of this security is on loan as of June
cash used to purchase repurchase agreements with a total llateral in the
ranging from 0.00% – 8.00%, and maturity dates ranging
(b) Rule 144A, Section 4(2), or other security which is restricted as to sale to institutional investors. These securities were
$676,000 which represents 0.12% of net assets.(c) Step Bond. Coupon rate is set for an initial period and then
(d) Security was purchased with cash collateral held from securities on loan. The total value of securities purchased
(e) Please refer to Note 2 for additional information on the joint repurchase agreement.
CVR Contingent Value RightsReg. S Regulation S - Security was purchased pursuant
to Regulation S under the Securities Act of
without either an effective registration statement
pursuant to an exemption from registration. Currently there is no restriction on trading this security.
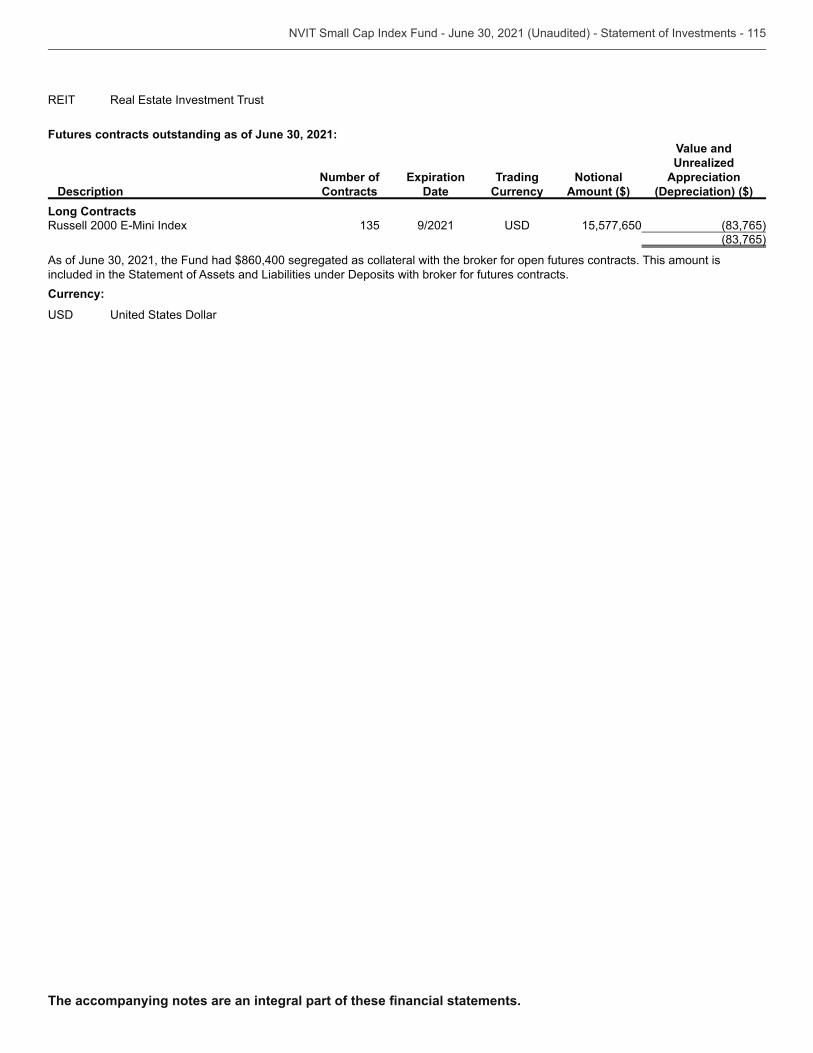
Futures contracts outstanding as of June 30, 2021:
DescriptionNumber of Contracts
Expiration Date
Trading Currency
Notional Amount ($)
Value and Unrealized
Appreciation (Depreciation) ($)
Long Contracts 9/2021 15,577,650
included in the Statement of Assets and Liabilities under Deposits with broker for futures contracts.Currency:
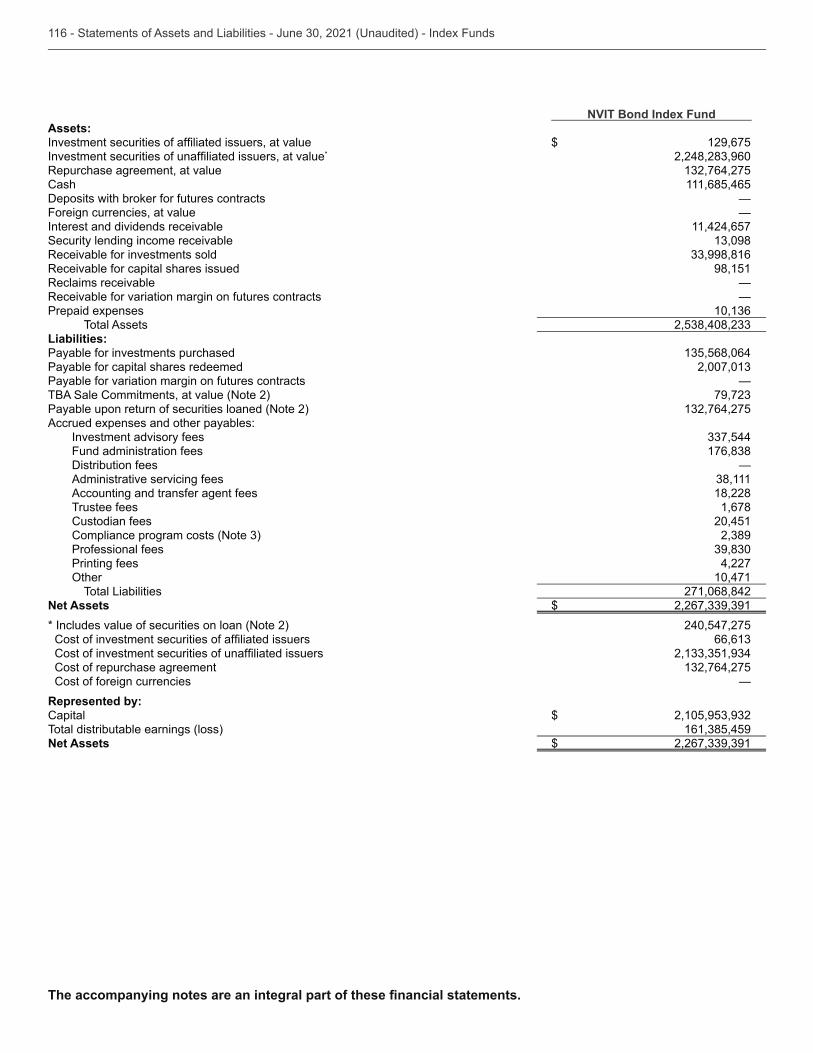
NVIT Bond Index FundAssets:
$ 129,675 *
Repurchase agreement, at value Cash 111,685,465 Deposits with broker for futures contracts — Foreign currencies, at value — Interest and dividends receivable 11,424,657 Security lending income receivable Receivable for investments sold Receivable for capital shares issued 98,151 Reclaims receivable — Receivable for variation margin on futures contracts — Prepaid expenses
Total Assets Liabilities:Payable for investments purchased Payable for capital shares redeemed Payable for variation margin on futures contracts — TBA Sale Commitments, at value (Note 2) Payable upon return of securities loaned (Note 2) Accrued expenses and other payables:
Investment advisory fees Fund administration fees Distribution fees — Administrative servicing fees Accounting and transfer agent fees 18,228 Trustee fees 1,678 Custodian fees 20,451
Professional fees Printing fees 4,227
10,471 Total Liabilities 271,068,842
Net Assets $ * Includes value of securities on loan (Note 2) 240,547,275
Cost of repurchase agreement Cost of foreign currencies — Represented by:Capital $ Total distributable earnings (loss) Net Assets $
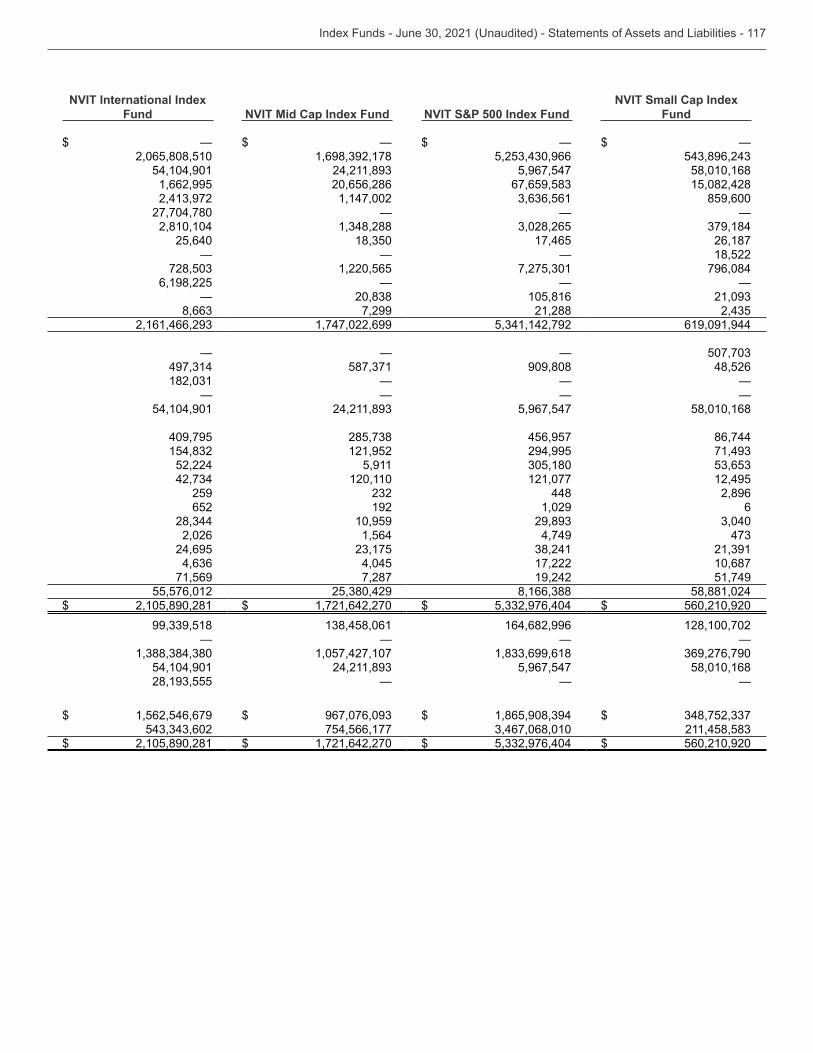
NVIT International Index Fund NVIT Mid Cap Index Fund NVIT S&P 500 Index Fund
NVIT Small Cap Index Fund
$ — $ — $ — $ — 2,065,808,510 54,104,901 5,967,547 58,010,168 1,662,995 20,656,286 15,082,428 1,147,002 859,600 27,704,780 — — — 2,810,104 25,640 17,465 26,187 — — — 18,522 1,220,565 796,084 6,198,225 — — — — 105,816 7,299 21,288 1,747,022,699 619,091,944
— — — 909,808 48,526 — — — — — — — 54,104,901 5,967,547 58,010,168
409,795 456,957 86,744 121,952 294,995 52,224 5,911 120,110 121,077 12,495 259 448 2,896 652 192 1,029 6 10,959 2,026 1,564 4,749 24,695 4,045 17,222 10,687 71,569 7,287 19,242 51,749 55,576,012 58,881,024 $ 2,105,890,281 $ 1,721,642,270 $ $ 560,210,920 164,682,996 128,100,702 — — — — 1,057,427,107 54,104,901 5,967,547 58,010,168 — — —
$ 1,562,546,679 $ $ $ 754,566,177 $ 2,105,890,281 $ 1,721,642,270 $ $ 560,210,920
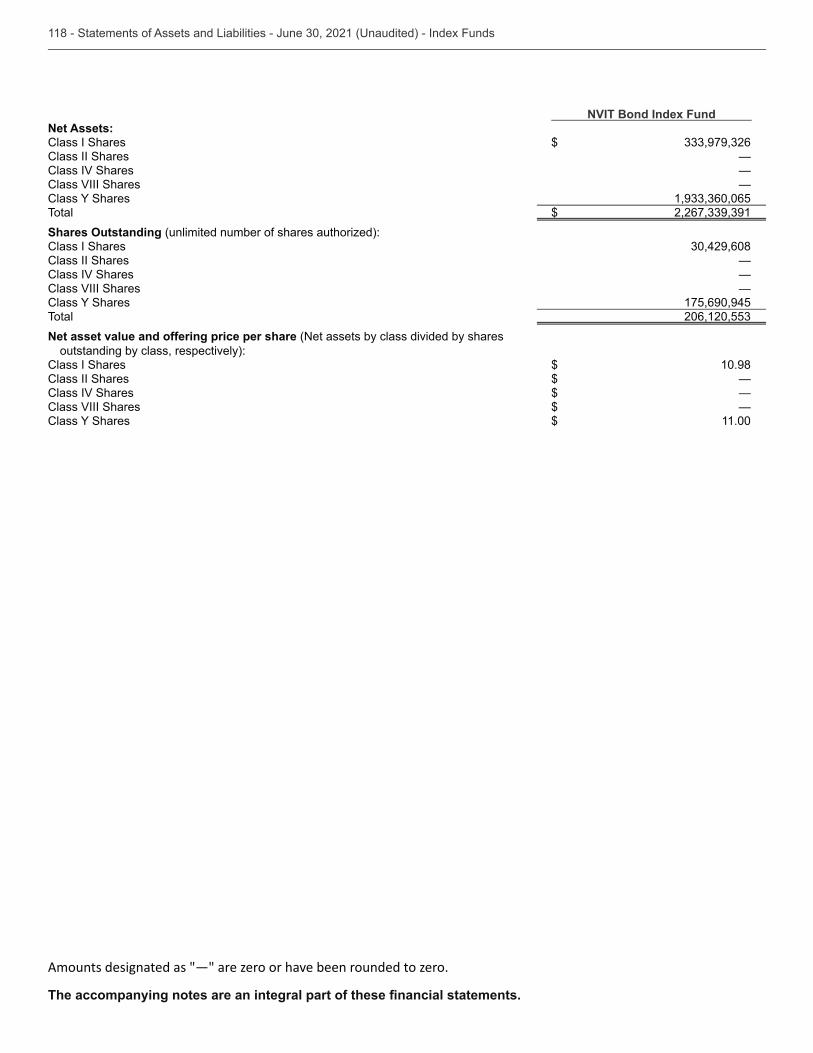
NVIT Bond Index FundNet Assets:Class I Shares $ Class II Shares — Class IV Shares — Class VIII Shares —
Total $ Shares Outstanding (unlimited number of shares authorized):Class I Shares Class II Shares — Class IV Shares — Class VIII Shares —
175,690,945 Total Net asset value and offering price per share (Net assets by class divided by shares
outstanding by class, respectively):Class I Shares $ 10.98 Class II Shares $ — Class IV Shares $ — Class VIII Shares $ —
$ 11.00
Amounts designated as "—" are zero or have been rounded to zero.
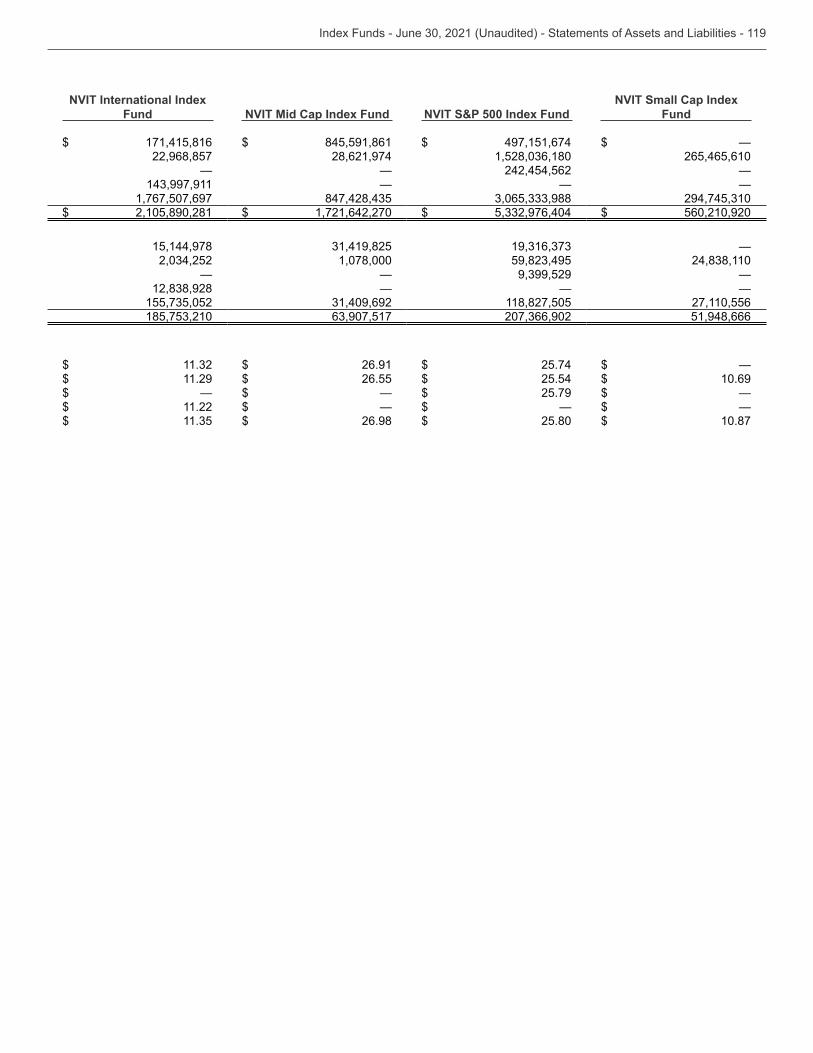
NVIT International Index Fund NVIT Mid Cap Index Fund NVIT S&P 500 Index Fund
NVIT Small Cap Index Fund
$ 171,415,816 $ 845,591,861 $ 497,151,674 $ — 22,968,857 28,621,974 265,465,610 — — 242,454,562 — — — — 1,767,507,697 $ 2,105,890,281 $ 1,721,642,270 $ $ 560,210,920
15,144,978 — 1,078,000 — — — — — — 118,827,505 27,110,556 51,948,666
$ $ 26.91 $ 25.74 $ — $ 11.29 $ 26.55 $ 25.54 $ 10.69 $ — $ — $ 25.79 $ — $ 11.22 $ — $ — $ — $ $ 26.98 $ 25.80 $ 10.87
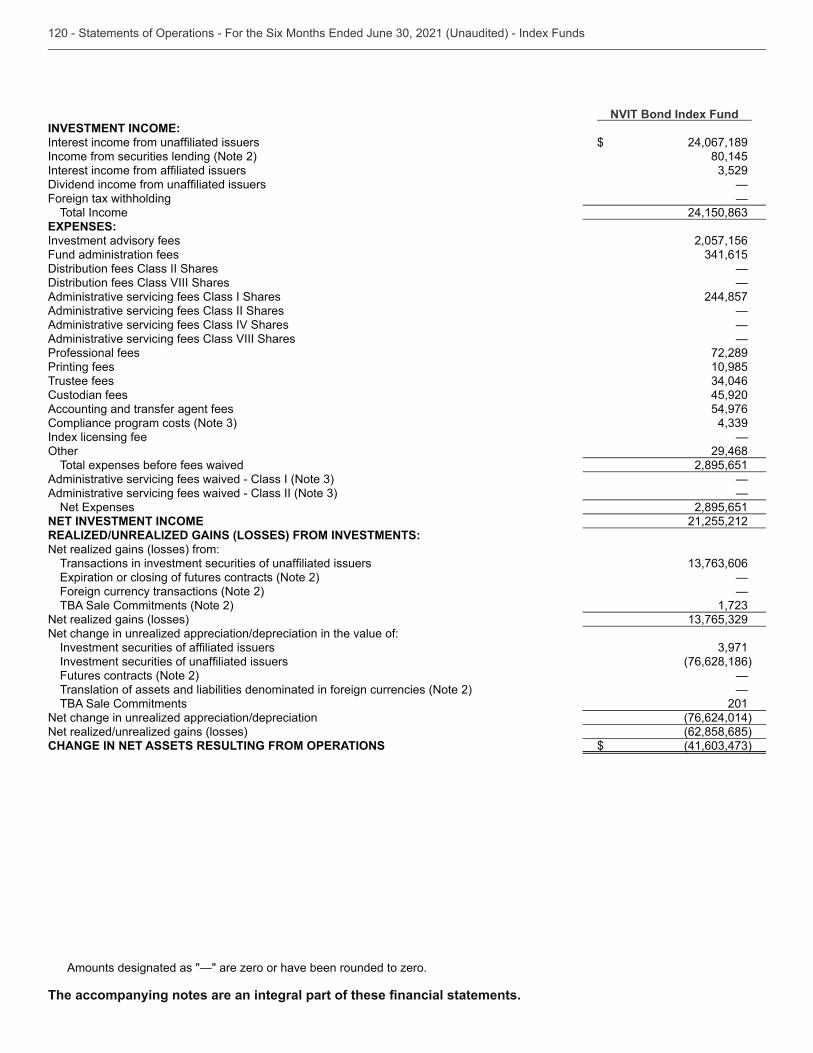
NVIT Bond Index FundINVESTMENT INCOME:
$ 24,067,189 Income from securities lending (Note 2) 80,145
—
Foreign tax withholding — Total Income
EXPENSES:Investment advisory fees 2,057,156 Fund administration fees Distribution fees Class II Shares — Distribution fees Class VIII Shares — Administrative servicing fees Class I Shares 244,857 Administrative servicing fees Class II Shares — Administrative servicing fees Class IV Shares — Administrative servicing fees Class VIII Shares — Professional fees 72,289 Printing fees 10,985 Trustee fees Custodian fees 45,920 Accounting and transfer agent fees 54,976
Index licensing fee —
29,468 Total expenses before fees waived 2,895,651
— — 2,895,651
NET INVESTMENT INCOME 21,255,212 REALIZED/UNREALIZED GAINS (LOSSES) FROM INVESTMENTS:Net realized gains (losses) from:
—
Foreign currency transactions (Note 2) — TBA Sale Commitments (Note 2)
Net realized gains (losses) Net change in unrealized appreciation/depreciation in the value of:
(76,628,186 )
Futures contracts (Note 2) — Translation of assets and liabilities denominated in foreign currencies (Note 2) — TBA Sale Commitments 201
Net change in unrealized appreciation/depreciation (76,624,014 )Net realized/unrealized gains (losses) (62,858,685 )CHANGE IN NET ASSETS RESULTING FROM OPERATIONS $
Amounts designated as "—" are zero or have been rounded to zero.
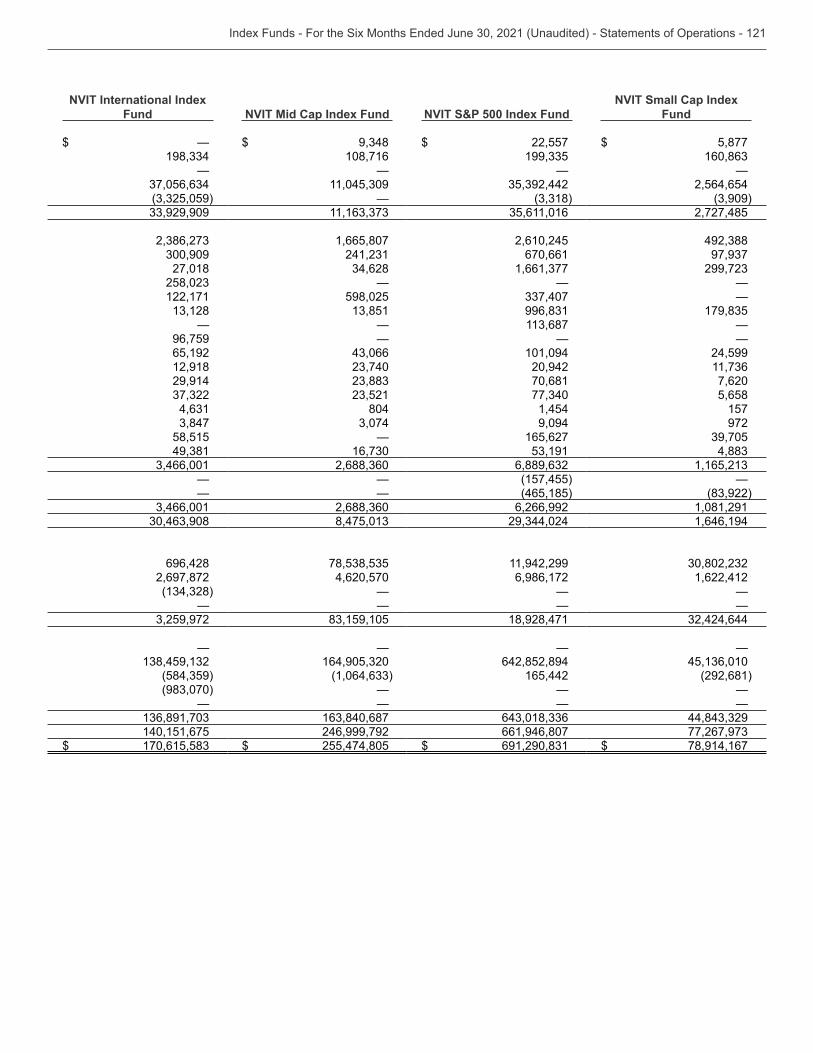
NVIT International Index Fund NVIT Mid Cap Index Fund NVIT S&P 500 Index Fund
NVIT Small Cap Index Fund
$ — $ $ 22,557 $ 5,877 108,716 — — — — 2,564,654 — 2,727,485
1,665,807 2,610,245 670,661 27,018 — — — 122,171 598,025 — — — — 96,759 — — — 65,192 101,094 24,599 12,918 20,942 29,914 70,681 7,620 5,658 804 1,454 157 9,094 972 58,515 — 165,627 — — (157,455 ) — — — (465,185 ) 6,266,992 1,081,291 1,646,194
696,428 11,942,299 2,697,872 4,620,570 6,986,172 1,622,412 — — — — — — — 18,928,471
— — — — 642,852,894 165,442 (292,681 ) — — — — — — — 140,151,675 246,999,792 661,946,807 $ $ 255,474,805 $ $ 78,914,167
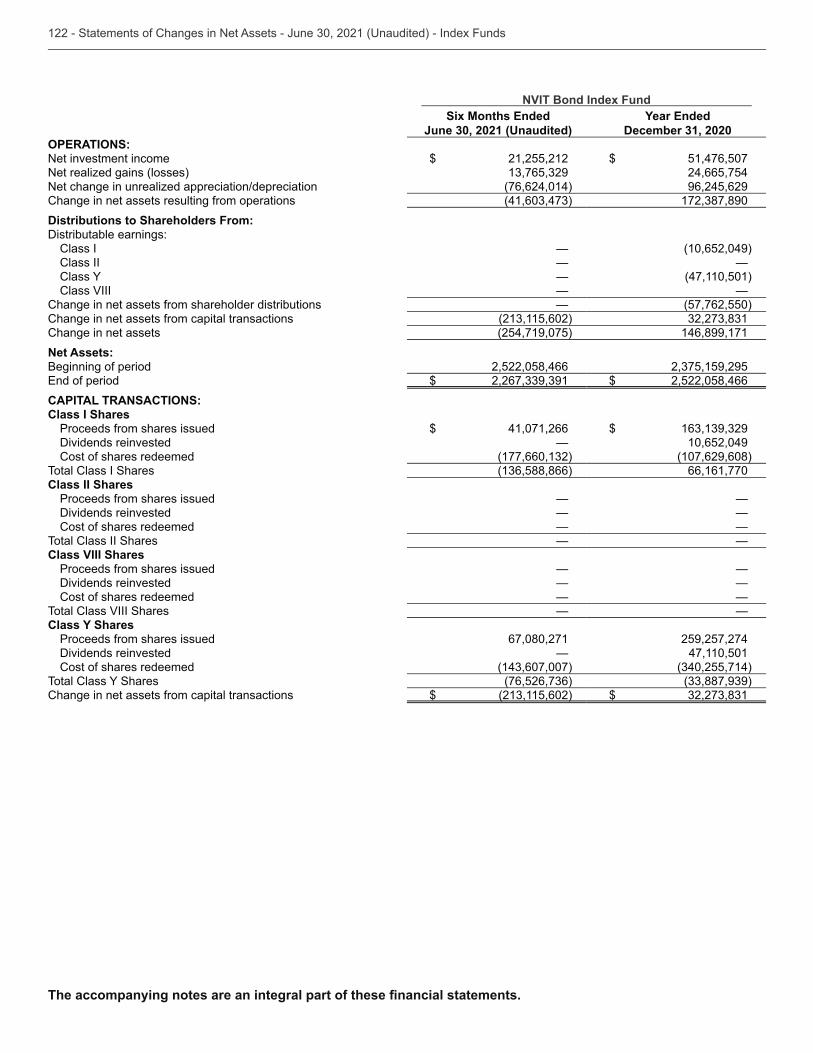
NVIT Bond Index FundSix Months Ended
June 30, 2021 (Unaudited)Year Ended
December 31, 2020OPERATIONS: Net investment income $ 21,255,212 $ 51,476,507 Net realized gains (losses) 24,665,754 Net change in unrealized appreciation/depreciation (76,624,014 ) 96,245,629 Change in net assets resulting from operations Distributions to Shareholders From:Distributable earnings:
Class I — (10,652,049 )Class II — —
— (47,110,501 )Class VIII — —
Change in net assets from shareholder distributions — (57,762,550 )Change in net assets from capital transactions Change in net assets (254,719,075 ) 146,899,171 Net Assets:Beginning of period 2,522,058,466
$ $ 2,522,058,466 CAPITAL TRANSACTIONS:Class I Shares
Proceeds from shares issued $ 41,071,266 $ Dividends reinvested — 10,652,049 Cost of shares redeemed (107,629,608 )
Total Class I Shares 66,161,770 Class II Shares
Proceeds from shares issued — — Dividends reinvested — — Cost of shares redeemed — —
Total Class II Shares — — Class VIII Shares
Proceeds from shares issued — — Dividends reinvested — — Cost of shares redeemed — —
Total Class VIII Shares — — Class Y Shares
Proceeds from shares issued 67,080,271 259,257,274 Dividends reinvested — 47,110,501 Cost of shares redeemed
Change in net assets from capital transactions $ $
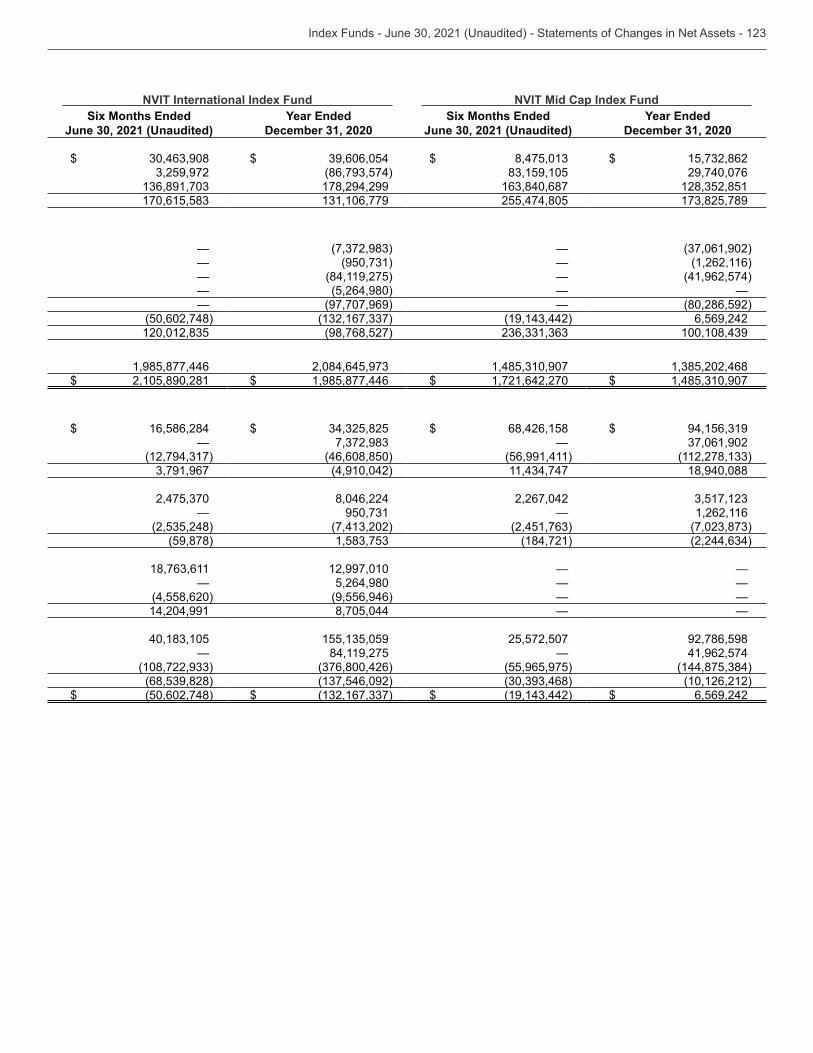
NVIT International Index Fund NVIT Mid Cap Index FundSix Months Ended
June 30, 2021 (Unaudited)Year Ended
December 31, 2020Six Months Ended
June 30, 2021 (Unaudited)Year Ended
December 31, 2020
$ $ $ $ 29,740,076 178,294,299 255,474,805
— — — — (1,262,116 ) — (84,119,275 ) — (41,962,574 ) — (5,264,980 ) — — — (97,707,969 ) — (80,286,592 ) (50,602,748 ) 6,569,242 (98,768,527 )
1,985,877,446 $ 2,105,890,281 $ 1,985,877,446 $ 1,721,642,270 $
$ 16,586,284 $ $ 68,426,158 $ — — (46,608,850 ) (56,991,411 ) (4,910,042 ) 18,940,088
8,046,224 2,267,042 — — 1,262,116 (59,878 ) (184,721 )
12,997,010 — — — 5,264,980 — — (4,558,620 ) (9,556,946 ) — — 14,204,991 8,705,044 — —
25,572,507 92,786,598 — 84,119,275 — 41,962,574 (55,965,975 ) (10,126,212 ) $ (50,602,748 ) $ $ $ 6,569,242
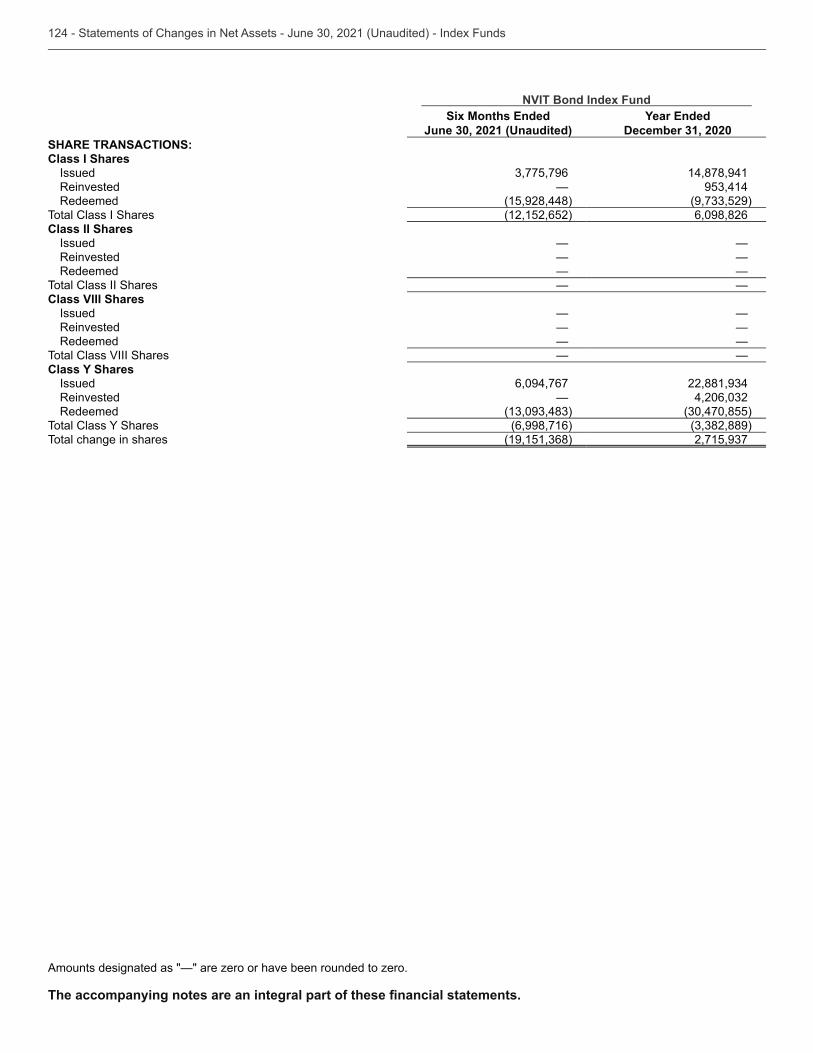
NVIT Bond Index FundSix Months Ended
June 30, 2021 (Unaudited)Year Ended
December 31, 2020SHARE TRANSACTIONS:Class I Shares
Issued 14,878,941 Reinvested — Redeemed (15,928,448 )
Total Class I Shares (12,152,652 ) 6,098,826 Class II Shares
Issued — — Reinvested — — Redeemed — —
Total Class II Shares — — Class VIII Shares
Issued — — Reinvested — — Redeemed — —
Total Class VIII Shares — — Class Y Shares
Issued 6,094,767 Reinvested — Redeemed
(6,998,716 ) Total change in shares
Amounts designated as "—" are zero or have been rounded to zero.
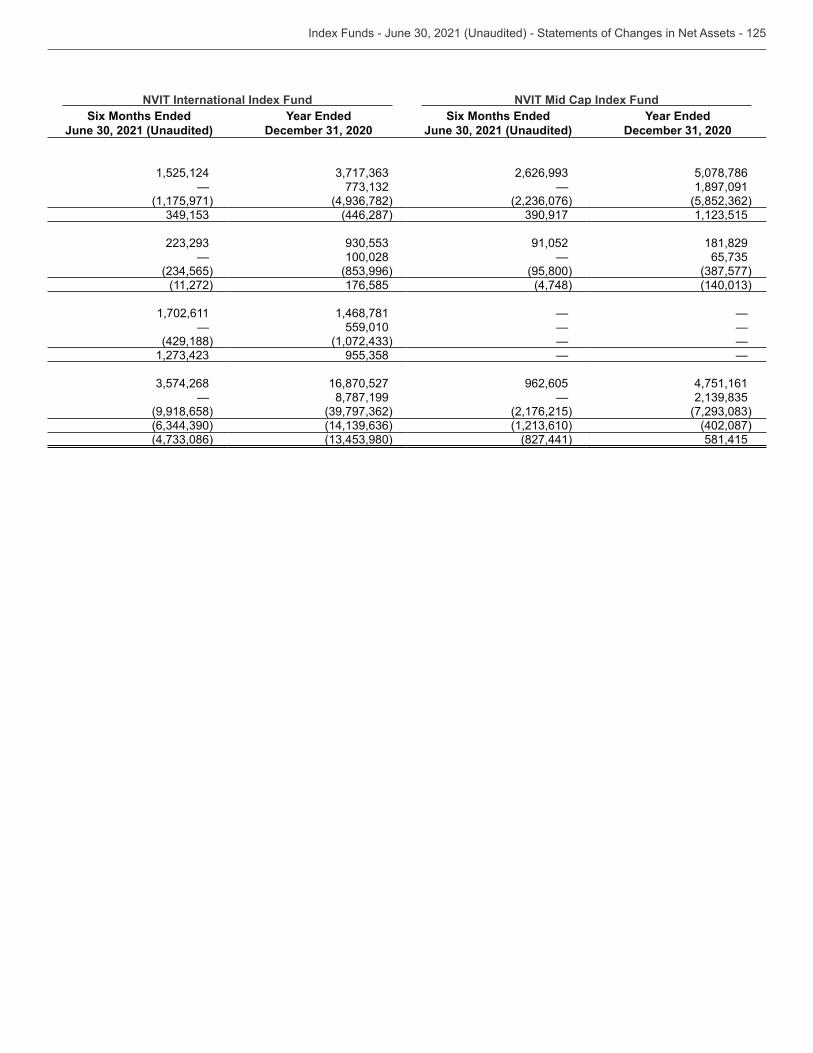
NVIT International Index Fund NVIT Mid Cap Index FundSix Months Ended
June 30, 2021 (Unaudited)Year Ended
December 31, 2020Six Months Ended
June 30, 2021 (Unaudited)Year Ended
December 31, 2020
1,525,124 5,078,786 — — 1,897,091 (1,175,971 ) (446,287 )
91,052 181,829 — 100,028 — (95,800 ) (11,272 ) 176,585 (4,748 )
1,702,611 1,468,781 — — — 559,010 — — (429,188 ) — — — —
16,870,527 962,605 4,751,161 — 8,787,199 — (9,918,658 ) (2,176,215 ) (402,087 ) (827,441 ) 581,415
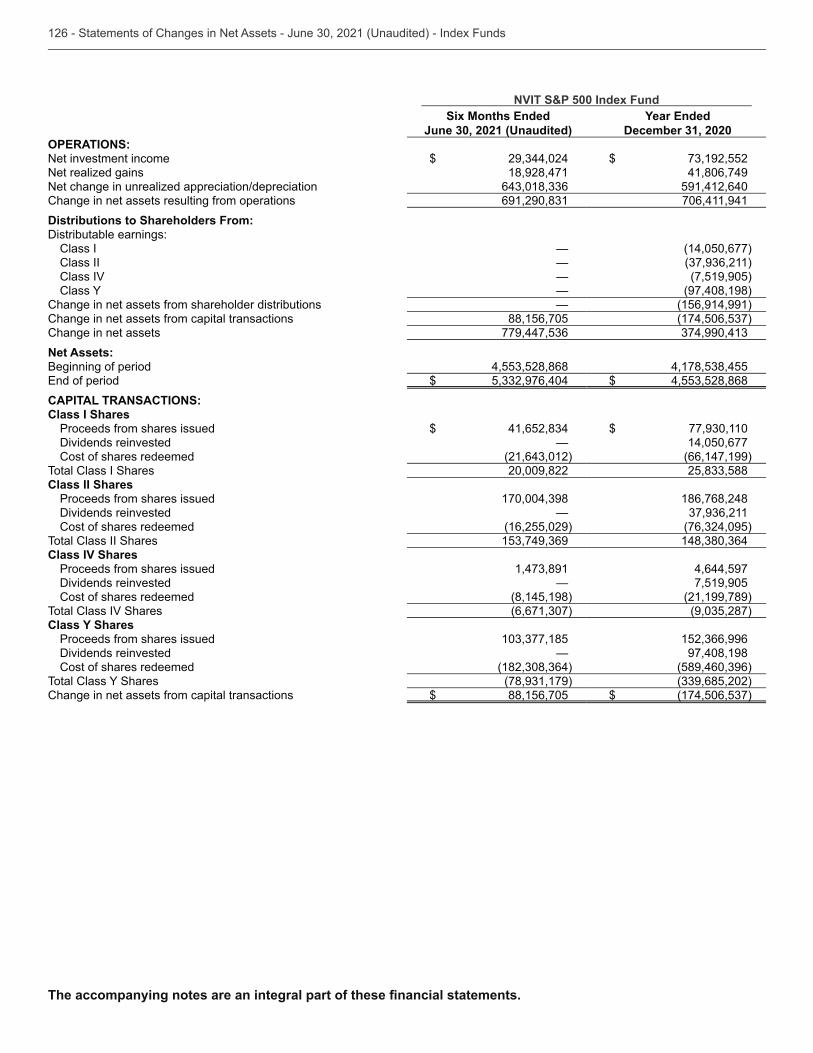
NVIT S&P 500 Index FundSix Months Ended
June 30, 2021 (Unaudited)Year Ended
December 31, 2020OPERATIONS: Net investment income $ $ Net realized gains 18,928,471 41,806,749 Net change in unrealized appreciation/depreciation 591,412,640 Change in net assets resulting from operations 706,411,941 Distributions to Shareholders From:Distributable earnings:
Class I — (14,050,677 )Class II — Class IV — (7,519,905 )
— (97,408,198 )Change in net assets from shareholder distributions — (156,914,991 )Change in net assets from capital transactions 88,156,705 Change in net assets Net Assets:Beginning of period
$ $ CAPITAL TRANSACTIONS:Class I Shares
Proceeds from shares issued $ $ Dividends reinvested — 14,050,677 Cost of shares redeemed (66,147,199 )
Total Class I Shares 20,009,822 Class II Shares
Proceeds from shares issued 186,768,248 Dividends reinvested — Cost of shares redeemed (16,255,029 )
Total Class II Shares Class IV Shares
Proceeds from shares issued 4,644,597 Dividends reinvested — 7,519,905 Cost of shares redeemed (8,145,198 ) (21,199,789 )
Total Class IV Shares Class Y Shares
Proceeds from shares issued Dividends reinvested — 97,408,198 Cost of shares redeemed
Change in net assets from capital transactions $ 88,156,705 $
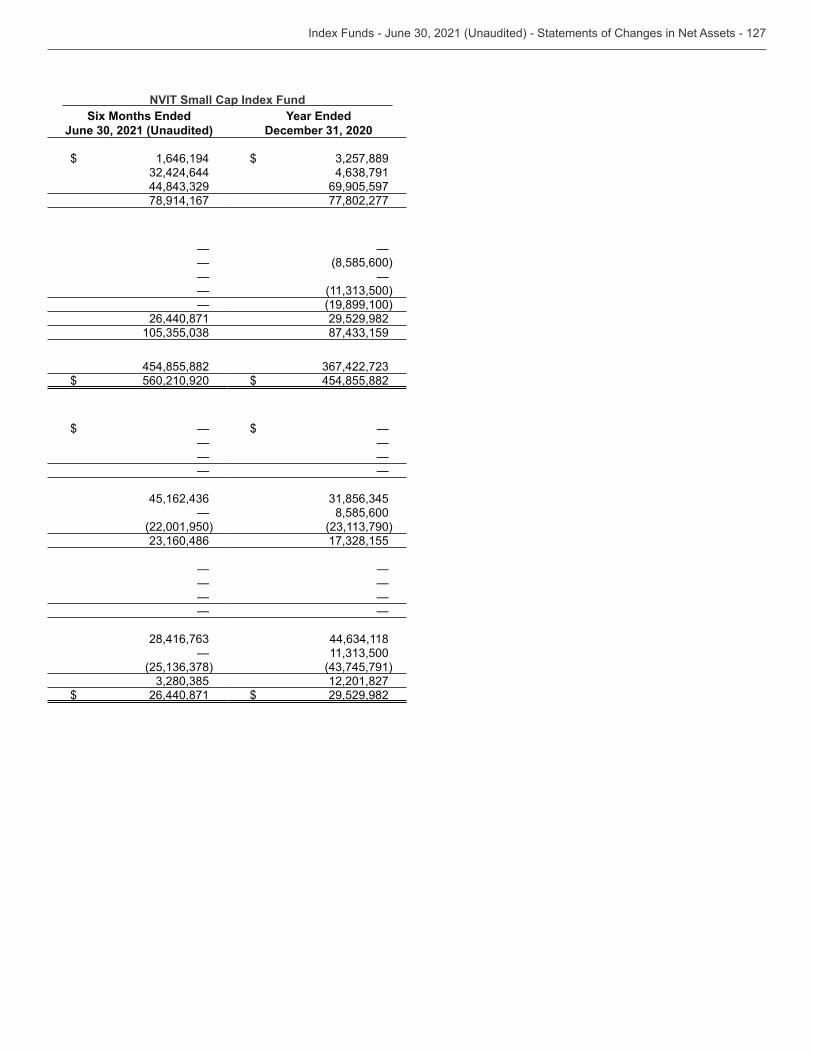
NVIT Small Cap Index FundSix Months Ended
June 30, 2021 (Unaudited)Year Ended
December 31, 2020
$ 1,646,194 $ 69,905,597 78,914,167 77,802,277
— — — (8,585,600 ) — — — — (19,899,100 ) 26,440,871 29,529,982
454,855,882 $ 560,210,920 $ 454,855,882
$ — $ — — — — — — —
— 8,585,600 (22,001,950 )
— — — — — — — —
— 12,201,827 $ 26,440,871 $ 29,529,982
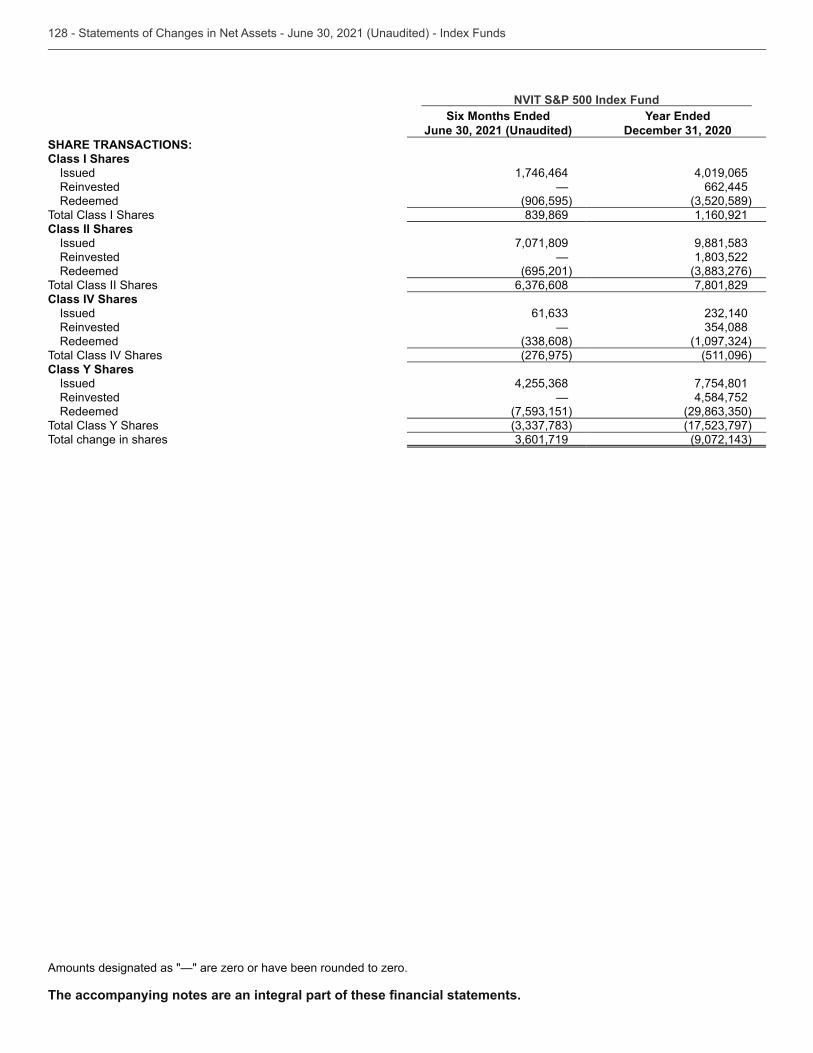
NVIT S&P 500 Index FundSix Months Ended
June 30, 2021 (Unaudited)Year Ended
December 31, 2020SHARE TRANSACTIONS:Class I Shares
Issued 1,746,464 4,019,065 Reinvested — 662,445 Redeemed (906,595 )
Total Class I Shares 1,160,921 Class II Shares
Issued 7,071,809 Reinvested — Redeemed (695,201 )
Total Class II Shares 7,801,829 Class IV Shares
Issued Reinvested — Redeemed
Total Class IV Shares (276,975 ) (511,096 )Class Y Shares
Issued 7,754,801 Reinvested — 4,584,752 Redeemed
Total change in shares
Amounts designated as "—" are zero or have been rounded to zero.
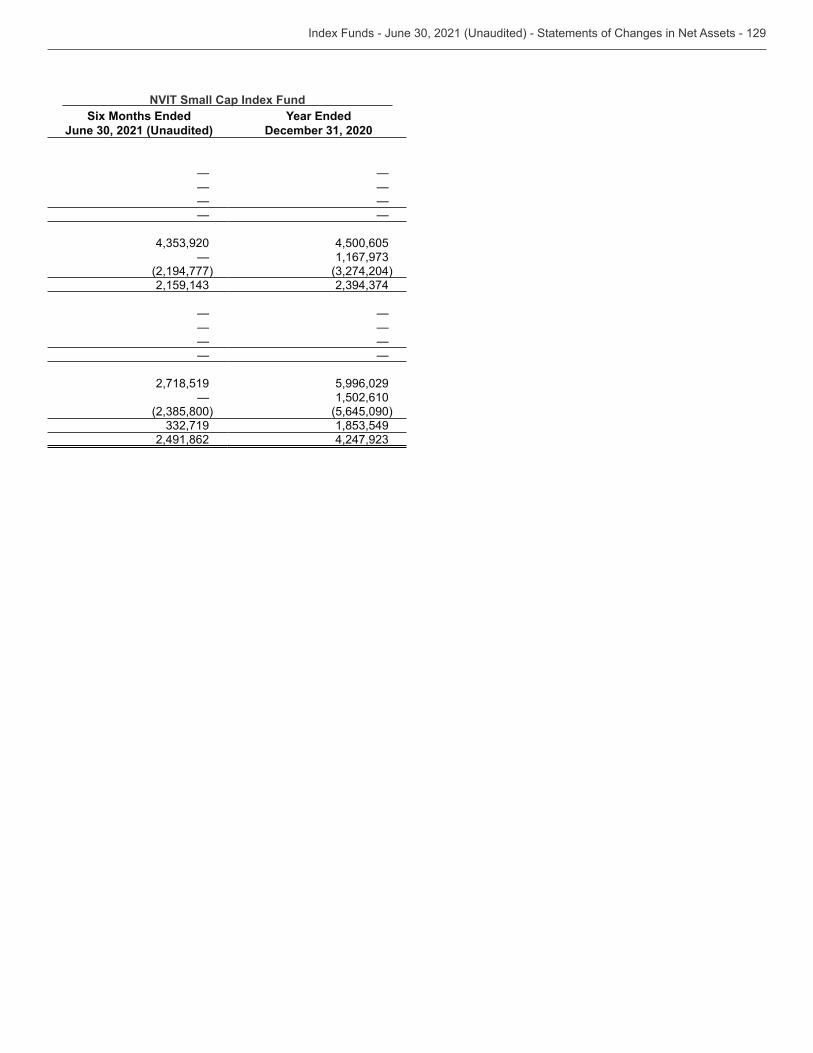
NVIT Small Cap Index FundSix Months Ended
June 30, 2021 (Unaudited)Year Ended
December 31, 2020
— — — — — — — —
4,500,605 — (2,194,777 )
— — — — — — — —
2,718,519 5,996,029 — 1,502,610 (5,645,090 ) 2,491,862
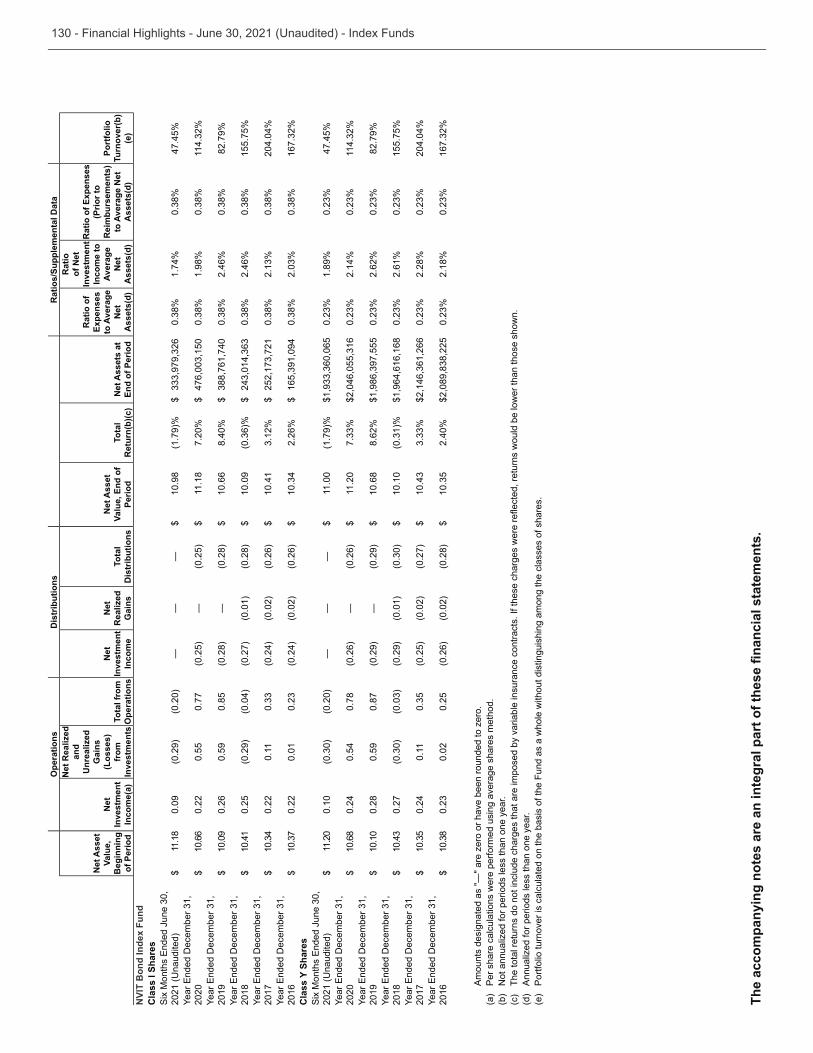
Ope
ratio
nsD
istr
ibut
ions
R
atio
s/Su
pple
men
tal D
ata
Net
Ass
et
Valu
e,
Beg
inni
ng
of P
erio
d
Net
In
vest
men
t In
com
e(a)
Net
Rea
lized
an
d U
nrea
lized
G
ains
(L
osse
s)
from
In
vest
men
tsTo
tal f
rom
O
pera
tions
Net
In
vest
men
t In
com
e
Net
R
ealiz
ed
Gai
nsTo
tal
Dis
trib
utio
ns
Net
Ass
et
Valu
e, E
nd o
f Pe
riod
Tota
l R
etur
n(b)
(c)
Net
Ass
ets
at
End
of P
erio
d
Rat
io o
f Ex
pens
es
to A
vera
ge
Net
A
sset
s(d)
Rat
io
of N
et
Inve
stm
ent
Inco
me
to
Aver
age
Net
A
sset
s(d)
Rat
io o
f Exp
ense
s (P
rior t
o R
eim
burs
emen
ts)
to A
vera
ge N
et
Ass
ets(
d)
Port
folio
Tu
rnov
er(b
)(e
)N
VIT
Bon
d In
dex
Fund
Cla
ss I
Shar
es
$ 11
.18
0.09
(0.2
9)(0
.20)
——
—
$ 10
.98
(1.7
9)%
$1.
74%
47.4
5%
2020
$ 10
.66
0.22
0.55
0.77
(0.2
5)—
(0
.25)
$ 11
.18
7.20
% $
1.98
%
2019
$ 10
.09
0.26
0.59
0.85
(0.2
8)—
(0
.28)
$ 10
.66
8.40
% $
2.46
%82
.79%
2018
$ 10
.41
0.25
(0.2
9)(0
.04)
(0.2
7)(0
.01)
(0.2
8) $
10.0
9 $
2.46
%15
5.75
%
2017
$0.
220.
11(0
.24)
(0.0
2)(0
.26)
$ 10
.41
$20
4.04
%
2016
$0.
220.
01(0
.24)
(0.0
2)(0
.26)
$2.
26%
$C
lass
Y S
hare
s
$ 11
.20
0.10
(0.2
0)—
—
— $
11.0
0(1
.79)
% $
1.89
%47
.45%
2020
$ 10
.68
0.24
0.54
0.78
(0.2
6)—
(0
.26)
$ 11
.20
$2.
14%
2019
$ 10
.10
0.28
0.59
0.87
(0.2
9)—
(0
.29)
$ 10
.68
8.62
% $
2.62
%82
.79%
2018
$0.
27(0
.29)
(0.0
1) $
10.1
0 $ 1
,964
,616
,168
2.61
%15
5.75
%
2017
$0.
240.
1 1(0
.25)
(0.0
2)(0
.27)
$ $
2.28
%20
4.04
%
2016
$0.
020.
25(0
.26)
(0.0
2)(0
.28)
$2.
40%
$2.
18%
A
mou
nts
desi
gnat
ed a
s "—
" are
zer
o or
hav
e be
en ro
unde
d to
zer
o.(a
)P
er s
hare
cal
cula
tions
wer
e pe
rform
ed u
sing
ave
rage
sha
res
met
hod.
(b)
Not
ann
ualiz
ed fo
r per
iods
less
than
one
yea
r.(c
)(d
)A
nnua
lized
for p
erio
ds le
ss th
an o
ne y
ear.
(e)
Por
tfolio
turn
over
is c
alcu
late
d on
the
basi
s of
the
Fund
as
a w
hole
with
out d
istin
guis
hing
am
ong
the
clas
ses
of s
hare
s.

This page intentionally left blank
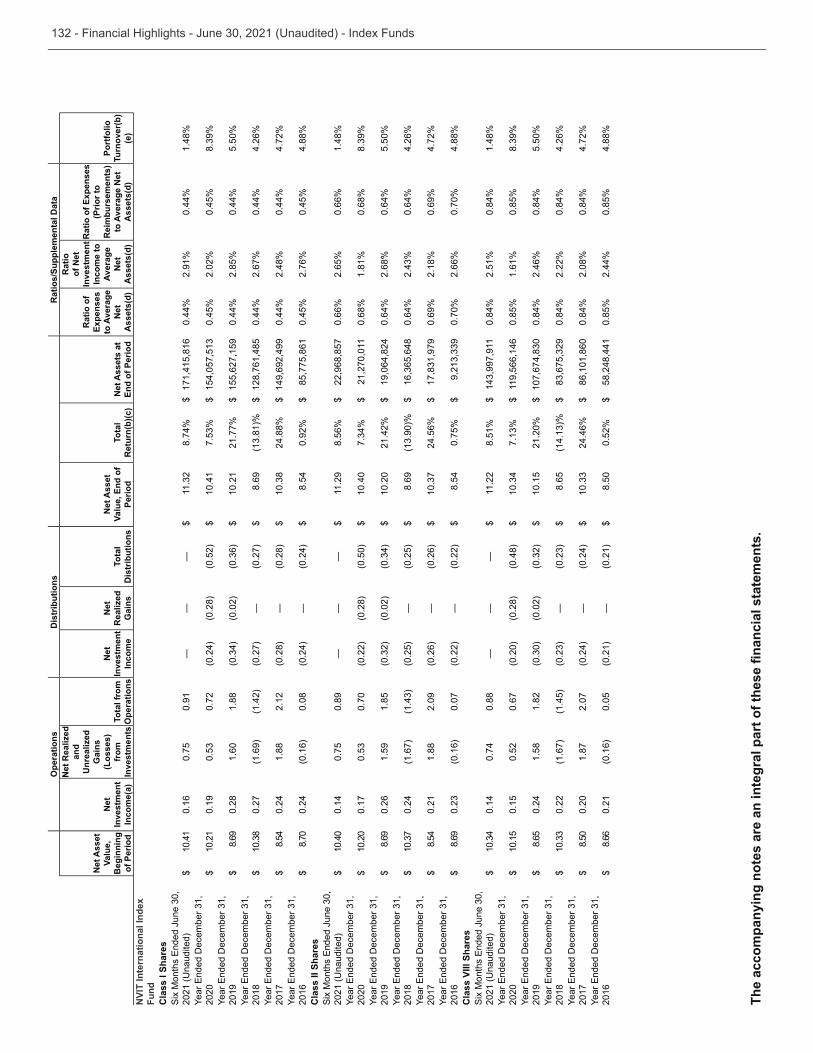
Ope
ratio
nsD
istr
ibut
ions
R
atio
s/Su
pple
men
tal D
ata
Net
Ass
et
Valu
e,
Beg
inni
ng
of P
erio
d
Net
In
vest
men
t In
com
e(a)
Net
Rea
lized
an
d U
nrea
lized
G
ains
(L
osse
s)
from
In
vest
men
tsTo
tal f
rom
O
pera
tions
Net
In
vest
men
t In
com
e
Net
R
ealiz
ed
Gai
nsTo
tal
Dis
trib
utio
ns
Net
Ass
et
Valu
e, E
nd o
f Pe
riod
Tota
l R
etur
n(b)
(c)
Net
Ass
ets
at
End
of P
erio
d
Rat
io o
f Ex
pens
es
to A
vera
ge
Net
A
sset
s(d)
Rat
io
of N
et
Inve
stm
ent
Inco
me
to
Aver
age
Net
A
sset
s(d)
Rat
io o
f Exp
ense
s (P
rior t
o R
eim
burs
emen
ts)
to A
vera
ge N
et
Ass
ets(
d)
Port
folio
Tu
rnov
er(b
)(e
)N
VIT
Inte
rnat
iona
l Ind
ex
Fund
Cla
ss I
Shar
es
$ 10
.41
0.16
0.75
0.91
——
—
$8.
74%
$ 17
1,41
5,81
60.
44%
2.91
%0.
44%
1.48
%
2020
$ 10
.21
0.19
0.72
(0.2
4)(0
.28)
(0.5
2) $
10.4
1 $
0.45
%2.
02%
0.45
%
2019
$ 8.
690.
281.
601.
88(0
.02)
$ 10
.21
21.7
7% $
155,
627,
159
0.44
%2.
85%
0.44
%5.
50%
2018
$0.
27(1
.69)
(1.4
2)(0
.27)
—
(0.2
7) $
8.69
$ 12
8,76
1,48
50.
44%
2.67
%0.
44%
4.26
%
2017
$ 8.
540.
241.
882.
12(0
.28)
—
(0.2
8) $
24.8
8% $
149,
692,
499
0.44
%2.
48%
0.44
%4.
72%
2016
$ 8.
700.
24(0
.16)
0.08
(0.2
4)—
(0
.24)
$ 8.
540.
92%
$ 85
,775
,861
0.45
%2.
76%
0.45
%4.
88%
Cla
ss II
Sha
res
$ 10
.40
0.14
0.75
0.89
——
—
$ 11
.29
8.56
% $
22,9
68,8
570.
66%
2.65
%0.
66%
1.48
%
2020
$ 10
.20
0.17
0.70
(0.2
2)(0
.28)
(0.5
0) $
10.4
0 $
21,2
70,0
110.
68%
1.81
%0.
68%
2019
$ 8.
690.
261.
591.
85(0
.02)
$ 10
.20
21.4
2% $
19,0
64,8
240.
64%
2.68
%0.
64%
5.50
%
2018
$0.
24(1
.67)
(0.2
5)—
(0
.25)
$ 8.
69 $
0.64
%0.
64%
4.26
%
2017
$ 8.
540.
211.
882.
09(0
.26)
—
(0.2
6) $
24.5
6% $
0.69
%2.
18%
0.69
%4.
72%
2016
$ 8.
69(0
.16)
0.07
(0.2
2)—
(0
.22)
$ 8.
540.
75%
$0.
70%
2.66
%0.
70%
4.88
%C
lass
VIII
Sha
res
$0.
140.
740.
88—
—
— $
11.2
28.
51%
$0.
84%
2.51
%0.
84%
1.48
%
2020
$ 10
.15
0.15
0.52
0.67
(0.2
0)(0
.28)
(0.4
8) $
$ 11
9,56
6,14
60.
85%
1.61
%0.
85%
2019
$ 8.
650.
241.
581.
82(0
.02)
$ 10
.15
21.2
0% $
0.84
%2.
46%
0.84
%5.
50%
2018
$0.
22(1
.67)
(1.4
5)—
$
8.65
$0.
84%
2.22
%0.
84%
4.26
%
2017
$ 8.
500.
201.
872.
07(0
.24)
—
(0.2
4) $
24.4
6% $
86,1
01,8
600.
84%
2.08
%0.
84%
4.72
%
2016
$ 8.
660.
21(0
.16)
0.05
(0.2
1)—
(0
.21)
$ 8.
500.
52%
$ 58
,248
,441
0.85
%2.
44%
0.85
%4.
88%
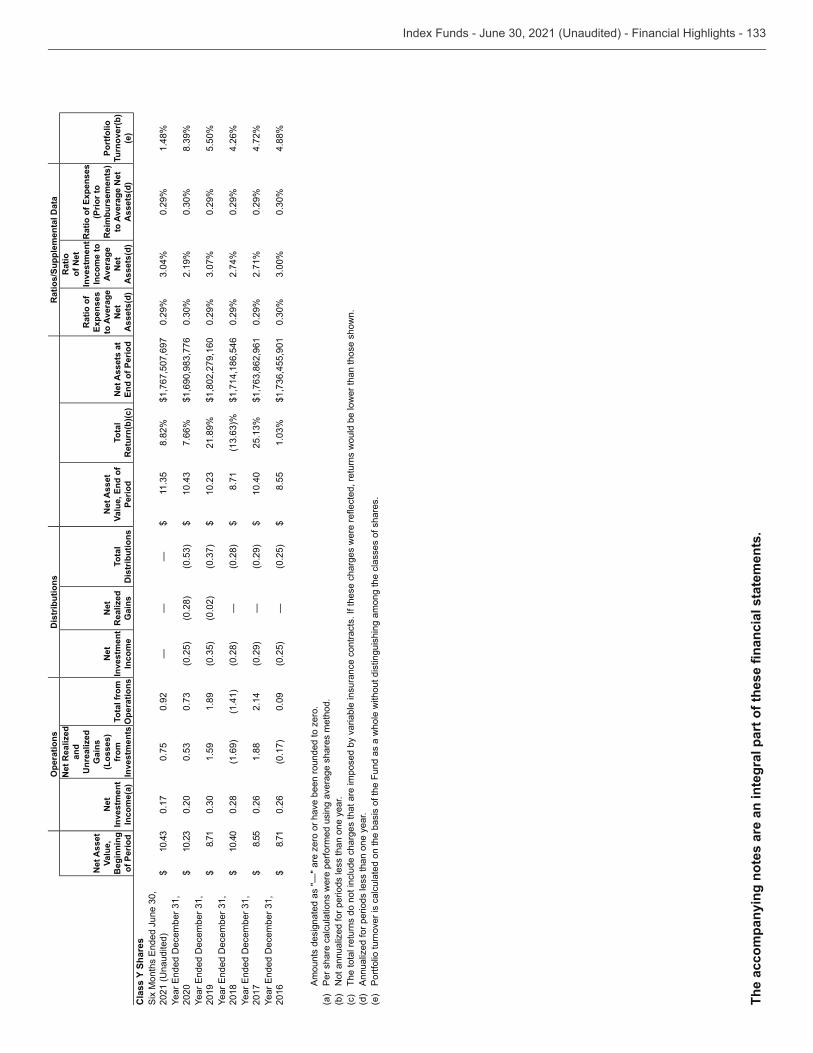
Ope
ratio
nsD
istr
ibut
ions
R
atio
s/Su
pple
men
tal D
ata
Net
Ass
et
Valu
e,
Beg
inni
ng
of P
erio
d
Net
In
vest
men
t In
com
e(a)
Net
Rea
lized
an
d U
nrea
lized
G
ains
(L
osse
s)
from
In
vest
men
tsTo
tal f
rom
O
pera
tions
Net
In
vest
men
t In
com
e
Net
R
ealiz
ed
Gai
nsTo
tal
Dis
trib
utio
ns
Net
Ass
et
Valu
e, E
nd o
f Pe
riod
Tota
l R
etur
n(b)
(c)
Net
Ass
ets
at
End
of P
erio
d
Rat
io o
f Ex
pens
es
to A
vera
ge
Net
A
sset
s(d)
Rat
io
of N
et
Inve
stm
ent
Inco
me
to
Aver
age
Net
A
sset
s(d)
Rat
io o
f Exp
ense
s (P
rior t
o R
eim
burs
emen
ts)
to A
vera
ge N
et
Ass
ets(
d)
Port
folio
Tu
rnov
er(b
)(e
)C
lass
Y S
hare
s
$0.
170.
750.
92—
—
— $
8.82
% $ 1
,767
,507
,697
0.29
%0.
29%
1.48
%
2020
$0.
20(0
.25)
(0.2
8) $
7.66
% $
2.19
%
2019
$ 8.
711.
591.
89(0
.02)
$21
.89%
$ 1,8
02,2
79,1
600.
29%
0.29
%5.
50%
2018
$ 10
.40
0.28
(1.6
9)(1
.41)
(0.2
8)—
(0
.28)
$ 8.
71 $ 1
,714
,186
,546
0.29
%2.
74%
0.29
%4.
26%
2017
$ 8.
550.
261.
882.
14(0
.29)
—
(0.2
9) $
10.4
0 $
0.29
%2.
71%
0.29
%4.
72%
2016
$ 8.
710.
26(0
.17)
0.09
(0.2
5)—
(0
.25)
$ 8.
55 $
4.88
%
A
mou
nts
desi
gnat
ed a
s "—
" are
zer
o or
hav
e be
en ro
unde
d to
zer
o.(a
)P
er s
hare
cal
cula
tions
wer
e pe
rform
ed u
sing
ave
rage
sha
res
met
hod.
(b)
Not
ann
ualiz
ed fo
r per
iods
less
than
one
yea
r.(c
)(d
)A
nnua
lized
for p
erio
ds le
ss th
an o
ne y
ear.
(e)
Por
tfolio
turn
over
is c
alcu
late
d on
the
basi
s of
the
Fund
as
a w
hole
with
out d
istin
guis
hing
am
ong
the
clas
ses
of s
hare
s.
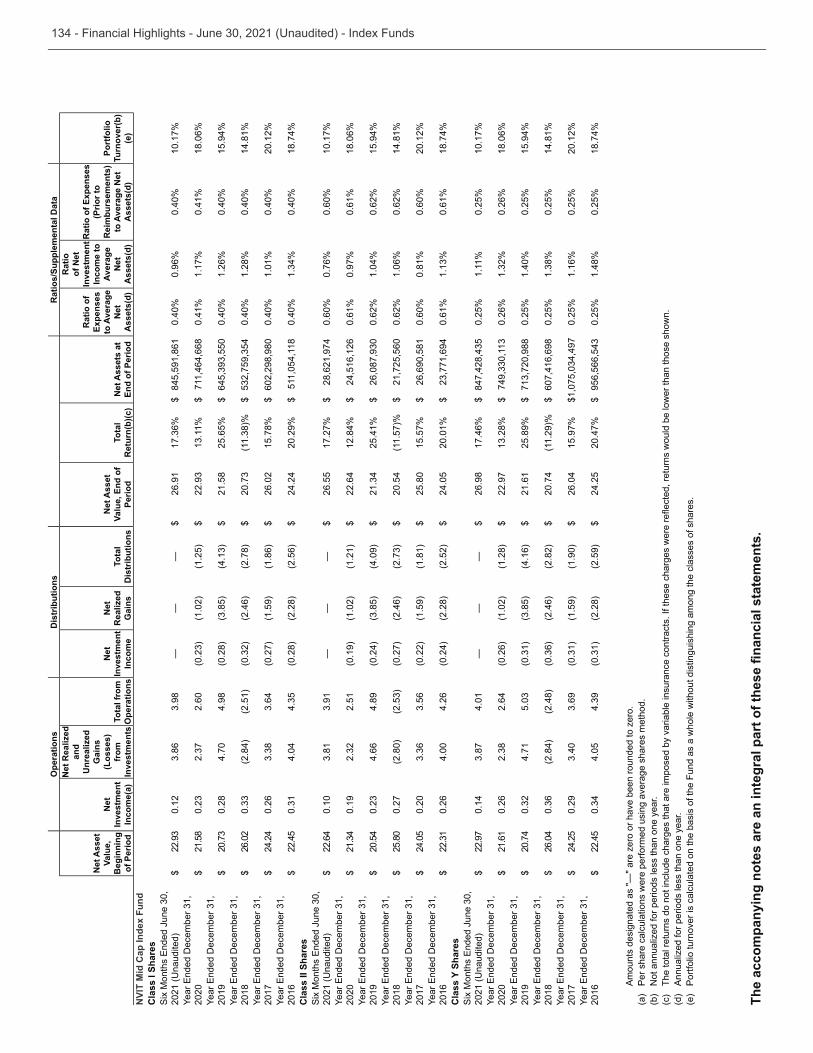
Ope
ratio
nsD
istr
ibut
ions
R
atio
s/Su
pple
men
tal D
ata
Net
Ass
et
Valu
e,
Beg
inni
ng
of P
erio
d
Net
In
vest
men
t In
com
e(a)
Net
Rea
lized
an
d U
nrea
lized
G
ains
(L
osse
s)
from
In
vest
men
tsTo
tal f
rom
O
pera
tions
Net
In
vest
men
t In
com
e
Net
R
ealiz
ed
Gai
nsTo
tal
Dis
trib
utio
ns
Net
Ass
et
Valu
e, E
nd o
f Pe
riod
Tota
l R
etur
n(b)
(c)
Net
Ass
ets
at
End
of P
erio
d
Rat
io o
f Ex
pens
es
to A
vera
ge
Net
A
sset
s(d)
Rat
io
of N
et
Inve
stm
ent
Inco
me
to
Aver
age
Net
A
sset
s(d)
Rat
io o
f Exp
ense
s (P
rior t
o R
eim
burs
emen
ts)
to A
vera
ge N
et
Ass
ets(
d)
Port
folio
Tu
rnov
er(b
)(e
)N
VIT
Mid
Cap
Inde
x Fu
ndC
lass
I Sh
ares
$0.
12—
—
— $
26.9
1 $
845,
591,
861
0.40
%0.
96%
0.40
%10
.17%
2020
$ 21
.58
2.60
(1.0
2)(1
.25)
$ $
711,
464,
668
0.41
%1.
17%
0.41
%18
.06%
2019
$0.
284.
704.
98(0
.28)
$ 21
.58
25.6
5% $
0.40
%1.
26%
0.40
%15
.94%
2018
$ 26
.02
(2.8
4)(2
.51)
(2.4
6)(2
.78)
$ $
0.40
%1.
28%
0.40
%14
.81%
2017
$ 24
.24
0.26
(0.2
7)(1
.59)
(1.8
6) $
26.0
215
.78%
$ 60
2,29
8,98
00.
40%
1.01
%0.
40%
20.1
2%
2016
$ 22
.45
4.04
(0.2
8)(2
.28)
(2.5
6) $
24.2
420
.29%
$ 51
1,05
4,11
80.
40%
0.40
%18
.74%
Cla
ss II
Sha
res
$ 22
.64
0.10
——
—
$ 26
.55
17.2
7% $
28,6
21,9
740.
60%
0.76
%0.
60%
10.1
7%
2020
$0.
192.
51(0
.19)
(1.0
2)(1
.21)
$ 22
.64
12.8
4% $
24,5
16,1
260.
61%
0.97
%0.
61%
18.0
6%
2019
$ 20
.54
4.66
4.89
(0.2
4)(4
.09)
$25
.41%
$0.
62%
1.04
%0.
62%
15.9
4%
2018
$ 25
.80
0.27
(2.8
0)(0
.27)
(2.4
6) $
20.5
4(1
1.57
)% $
21,7
25,5
600.
62%
1.06
%0.
62%
14.8
1%
2017
$ 24
.05
0.20
(0.2
2)(1
.59)
(1.8
1) $
25.8
015
.57%
$ 26
,690
,581
0.60
%0.
81%
0.60
%20
.12%
2016
$0.
264.
004.
26(0
.24)
(2.2
8)(2
.52)
$ 24
.05
20.0
1% $
0.61
%0.
61%
18.7
4%C
lass
Y S
hare
s
$ 22
.97
0.14
4.01
——
—
$ 26
.98
17.4
6% $
0.25
%1.
11%
0.25
%10
.17%
2020
$ 21
.61
0.26
2.64
(0.2
6)(1
.02)
(1.2
8) $
22.9
7 $
0.26
%0.
26%
18.0
6%
2019
$ 20
.74
4.71
(4.1
6) $
21.6
125
.89%
$0.
25%
1.40
%0.
25%
15.9
4%
2018
$ 26
.04
(2.8
4)(2
.48)
(2.4
6)(2
.82)
$ 20
.74
(11.
29)%
$ 60
7,41
6,69
80.
25%
0.25
%14
.81%
2017
$ 24
.25
0.29
(1.5
9)(1
.90)
$ 26
.04
15.9
7% $
0.25
%1.
16%
0.25
%20
.12%
2016
$ 22
.45
4.05
(2.2
8)(2
.59)
$ 24
.25
20.4
7% $
0.25
%1.
48%
0.25
%18
.74%
A
mou
nts
desi
gnat
ed a
s "—
" are
zer
o or
hav
e be
en ro
unde
d to
zer
o.(a
)P
er s
hare
cal
cula
tions
wer
e pe
rform
ed u
sing
ave
rage
sha
res
met
hod.
(b)
Not
ann
ualiz
ed fo
r per
iods
less
than
one
yea
r.(c
)(d
)A
nnua
lized
for p
erio
ds le
ss th
an o
ne y
ear.
(e)
Por
tfolio
turn
over
is c
alcu
late
d on
the
basi
s of
the
Fund
as
a w
hole
with
out d
istin
guis
hing
am
ong
the
clas
ses
of s
hare
s.

This page intentionally left blank
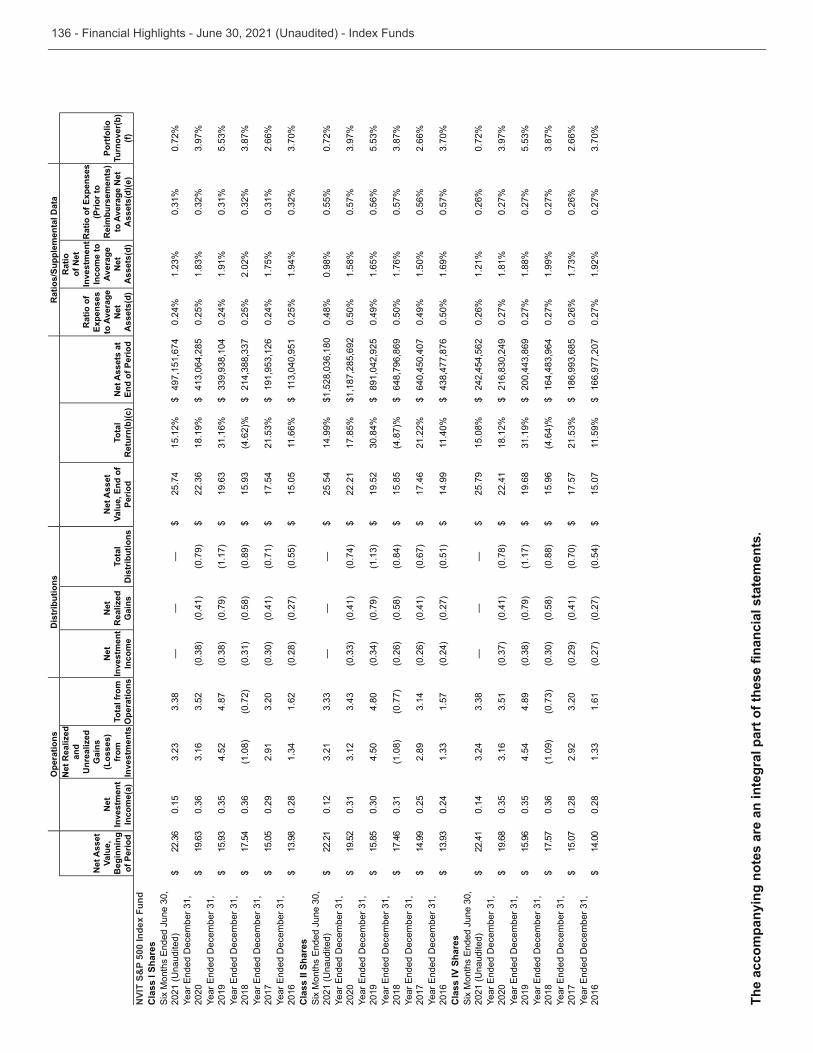
Ope
ratio
nsD
istr
ibut
ions
R
atio
s/Su
pple
men
tal D
ata
Net
Ass
et
Valu
e,
Beg
inni
ng
of P
erio
d
Net
In
vest
men
t In
com
e(a)
Net
Rea
lized
an
d U
nrea
lized
G
ains
(L
osse
s)
from
In
vest
men
tsTo
tal f
rom
O
pera
tions
Net
In
vest
men
t In
com
e
Net
R
ealiz
ed
Gai
nsTo
tal
Dis
trib
utio
ns
Net
Ass
et
Valu
e, E
nd o
f Pe
riod
Tota
l R
etur
n(b)
(c)
Net
Ass
ets
at
End
of P
erio
d
Rat
io o
f Ex
pens
es
to A
vera
ge
Net
A
sset
s(d)
Rat
io
of N
et
Inve
stm
ent
Inco
me
to
Aver
age
Net
A
sset
s(d)
Rat
io o
f Exp
ense
s (P
rior t
o R
eim
burs
emen
ts)
to A
vera
ge N
et
Ass
ets(
d)(e
)
Port
folio
Tu
rnov
er(b
)(f)
NVI
T S&
P 50
0 In
dex
Fund
Cla
ss I
Shar
es
$0.
15—
—
— $
25.7
415
.12%
$ 49
7,15
1,67
40.
24%
0.72
%
2020
$(0
.41)
(0.7
9) $
18.1
9% $
0.25
%
2019
$4.
524.
87(0
.79)
(1.1
7) $
$0.
24%
1.91
%
2018
$ 17
.54
(1.0
8)(0
.72)
(0.5
8)(0
.89)
$(4
.62)
% $
0.25
%2.
02%
2017
$ 15
.05
0.29
2.91
(0.4
1)(0
.71)
$ 17
.54
$0.
24%
1.75
%2.
66%
2016
$0.
281.
62(0
.28)
(0.2
7)(0
.55)
$ 15
.05
11.6
6% $
0.25
%1.
94%
Cla
ss II
Sha
res
$ 22
.21
0.12
——
—
$ 25
.54
14.9
9% $
0.48
%0.
98%
0.55
%0.
72%
2020
$ 19
.52
(0.4
1)(0
.74)
$ 22
.21
17.8
5% $ 1
,187
,285
,692
0.50
%1.
58%
0.57
%
2019
$ 15
.85
4.50
4.80
(0.7
9) $
19.5
2 $
891,
042,
925
0.49
%1.
65%
0.56
%
2018
$ 17
.46
(1.0
8)(0
.77)
(0.2
6)(0
.58)
(0.8
4) $
15.8
5(4
.87)
% $
648,
796,
869
0.50
%1.
76%
0.57
%
2017
$ 14
.99
0.25
2.89
(0.2
6)(0
.41)
(0.6
7) $
17.4
621
.22%
$ 64
0,45
0,40
70.
49%
1.50
%0.
56%
2.66
%
2016
$0.
241.
57(0
.24)
(0.2
7)(0
.51)
$ 14
.99
11.4
0% $
0.50
%1.
69%
0.57
%C
lass
IV S
hare
s
$ 22
.41
0.14
——
—
$ 25
.79
15.0
8% $
242,
454,
562
0.26
%1.
21%
0.26
%0.
72%
2020
$ 19
.68
(0.4
1)(0
.78)
$ 22
.41
18.1
2% $
0.27
%1.
81%
0.27
%
2019
$ 15
.96
4.54
4.89
(0.7
9)(1
.17)
$ 19
.68
$0.
27%
1.88
%0.
27%
2018
$ 17
.57
(1.0
9)(0
.58)
(0.8
8) $
15.9
6(4
.64)
% $
0.27
%1.
99%
0.27
%
2017
$ 15
.07
0.28
2.92
(0.2
9)(0
.41)
(0.7
0) $
17.5
7 $
0.26
%0.
26%
2.66
%
2016
$ 14
.00
0.28
1.61
(0.2
7)(0
.27)
(0.5
4) $
15.0
711
.59%
$ 16
6,97
7,20
70.
27%
1.92
%0.
27%
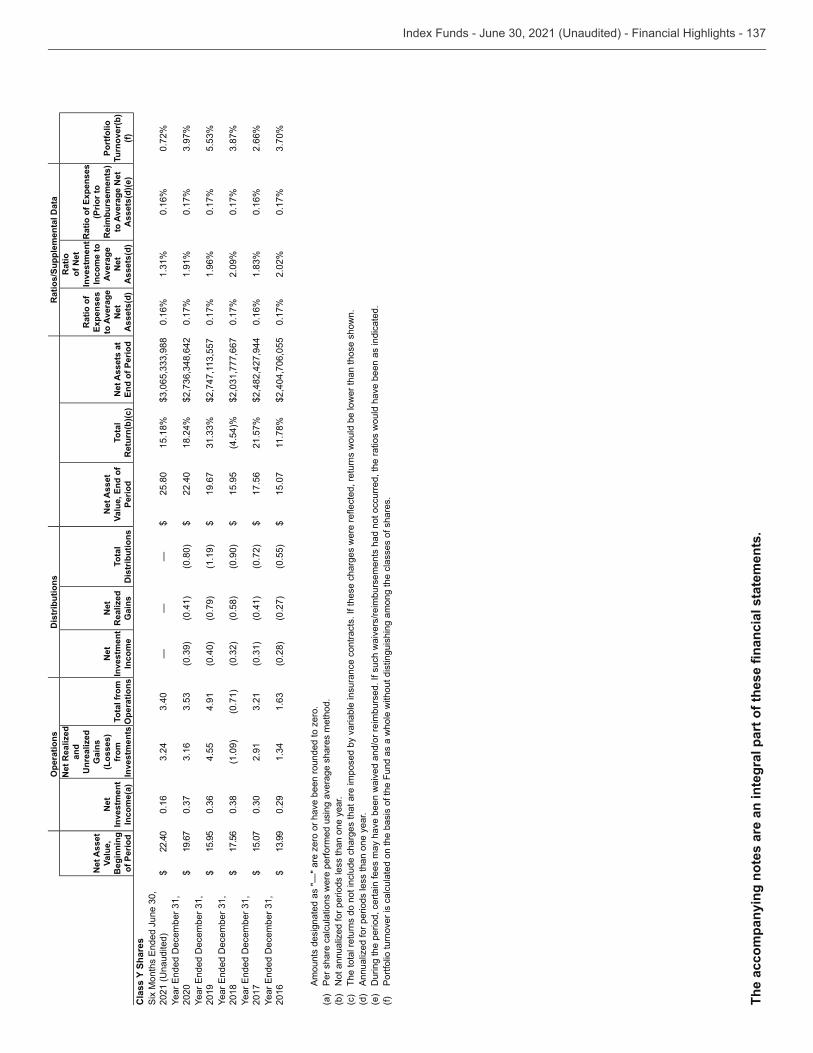
Ope
ratio
nsD
istr
ibut
ions
R
atio
s/Su
pple
men
tal D
ata
Net
Ass
et
Valu
e,
Beg
inni
ng
of P
erio
d
Net
In
vest
men
t In
com
e(a)
Net
Rea
lized
an
d U
nrea
lized
G
ains
(L
osse
s)
from
In
vest
men
tsTo
tal f
rom
O
pera
tions
Net
In
vest
men
t In
com
e
Net
R
ealiz
ed
Gai
nsTo
tal
Dis
trib
utio
ns
Net
Ass
et
Valu
e, E
nd o
f Pe
riod
Tota
l R
etur
n(b)
(c)
Net
Ass
ets
at
End
of P
erio
d
Rat
io o
f Ex
pens
es
to A
vera
ge
Net
A
sset
s(d)
Rat
io
of N
et
Inve
stm
ent
Inco
me
to
Aver
age
Net
A
sset
s(d)
Rat
io o
f Exp
ense
s (P
rior t
o R
eim
burs
emen
ts)
to A
vera
ge N
et
Ass
ets(
d)(e
)
Port
folio
Tu
rnov
er(b
)(f)
Cla
ss Y
Sha
res
$ 22
.40
0.16
——
—
$ 25
.80
15.1
8% $
0.16
%0.
16%
0.72
%
2020
$ 19
.67
(0.4
1)(0
.80)
$ 22
.40
18.2
4% $
0.17
%1.
91%
0.17
%
2019
$ 15
.95
4.55
4.91
(0.4
0)(0
.79)
(1.1
9) $
19.6
7 $
0.17
%1.
96%
0.17
%
2018
$ 17
.56
(1.0
9)(0
.71)
(0.5
8)(0
.90)
$ 15
.95
(4.5
4)%
$0.
17%
2.09
%0.
17%
2017
$ 15
.07
2.91
(0.4
1)(0
.72)
$ 17
.56
21.5
7% $ 2
,482
,427
,944
0.16
%0.
16%
2.66
%
2016
$0.
29(0
.28)
(0.2
7)(0
.55)
$ 15
.07
11.7
8% $ 2
,404
,706
,055
0.17
%2.
02%
0.17
%
A
mou
nts
desi
gnat
ed a
s "—
" are
zer
o or
hav
e be
en ro
unde
d to
zer
o.(a
)P
er s
hare
cal
cula
tions
wer
e pe
rform
ed u
sing
ave
rage
sha
res
met
hod.
(b)
Not
ann
ualiz
ed fo
r per
iods
less
than
one
yea
r.(c
)(d
)A
nnua
lized
for p
erio
ds le
ss th
an o
ne y
ear.
(e)
Dur
ing
the
perio
d, c
erta
in fe
es m
ay h
ave
been
wai
ved
and/
or re
imbu
rsed
. If s
uch
wai
vers
/reim
burs
emen
ts h
ad n
ot o
ccur
red,
the
ratio
s w
ould
hav
e be
en a
s in
dica
ted.
(f)P
ortfo
lio tu
rnov
er is
cal
cula
ted
on th
e ba
sis
of th
e Fu
nd a
s a
who
le w
ithou
t dis
tingu
ishi
ng a
mon
g th
e cl
asse
s of
sha
res.
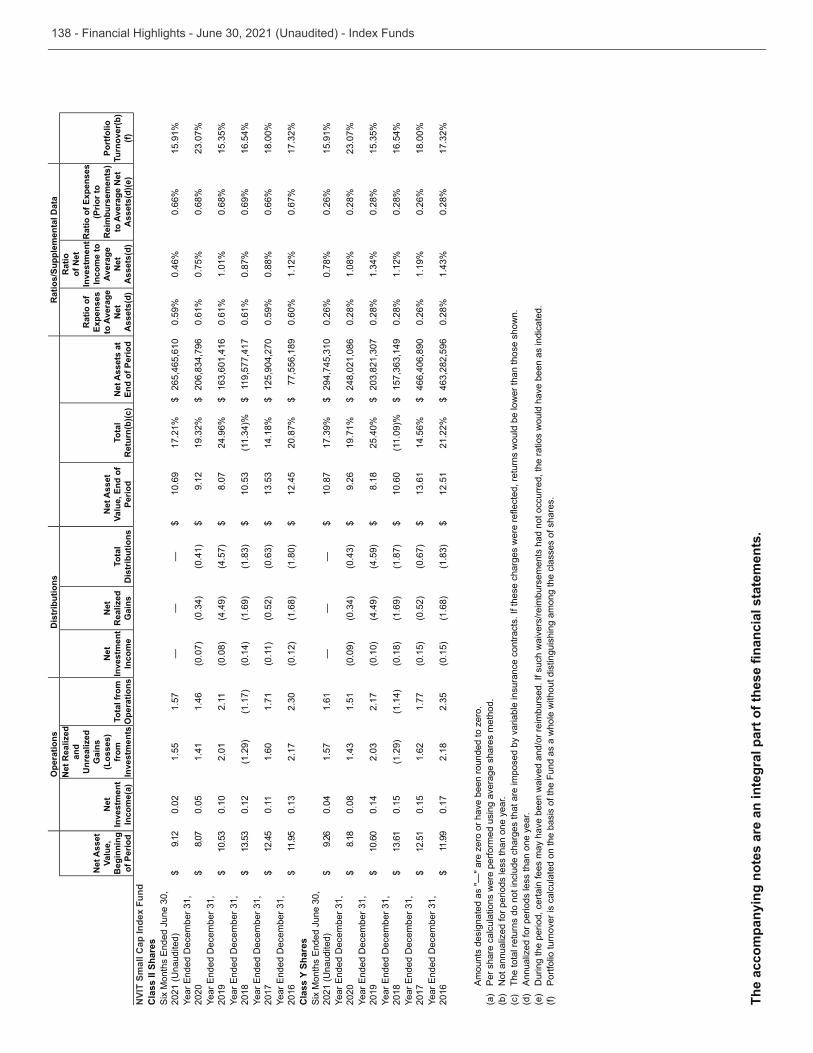
Ope
ratio
nsD
istr
ibut
ions
R
atio
s/Su
pple
men
tal D
ata
Net
Ass
et
Valu
e,
Beg
inni
ng
of P
erio
d
Net
In
vest
men
t In
com
e(a)
Net
Rea
lized
an
d U
nrea
lized
G
ains
(L
osse
s)
from
In
vest
men
tsTo
tal f
rom
O
pera
tions
Net
In
vest
men
t In
com
e
Net
R
ealiz
ed
Gai
nsTo
tal
Dis
trib
utio
ns
Net
Ass
et
Valu
e, E
nd o
f Pe
riod
Tota
l R
etur
n(b)
(c)
Net
Ass
ets
at
End
of P
erio
d
Rat
io o
f Ex
pens
es
to A
vera
ge
Net
A
sset
s(d)
Rat
io
of N
et
Inve
stm
ent
Inco
me
to
Aver
age
Net
A
sset
s(d)
Rat
io o
f Exp
ense
s (P
rior t
o R
eim
burs
emen
ts)
to A
vera
ge N
et
Ass
ets(
d)(e
)
Port
folio
Tu
rnov
er(b
)(f)
NVI
T Sm
all C
ap In
dex
Fund
Cla
ss II
Sha
res
$ 9.
120.
021.
551.
57—
—
— $
10.6
917
.21%
$ 26
5,46
5,61
00.
59%
0.46
%0.
66%
15.9
1%
2020
$ 8.
070.
051.
411.
46(0
.07)
(0.4
1) $
9.12
$0.
61%
0.75
%0.
68%
2019
$0.
102.
012.
11(0
.08)
(4.4
9)(4
.57)
$ 8.
0724
.96%
$0.
61%
1.01
%0.
68%
2018
$0.
12(1
.29)
(1.1
7)(0
.14)
(1.6
9) $
$ 11
9,57
7,41
70.
61%
0.87
%0.
69%
16.5
4%
2017
$ 12
.45
0.11
1.60
1.71
(0.1
1)(0
.52)
$14
.18%
$ 12
5,90
4,27
00.
59%
0.88
%0.
66%
18.0
0%
2016
$ 11
.95
2.17
(0.1
2)(1
.68)
(1.8
0) $
12.4
520
.87%
$ 77
,556
,189
0.60
%1.
12%
0.67
%C
lass
Y S
hare
s
$ 9.
260.
041.
571.
61—
—
— $
10.8
7 $
0.26
%0.
78%
0.26
%15
.91%
2020
$ 8.
180.
081.
51(0
.09)
$ 9.
2619
.71%
$ 24
8,02
1,08
60.
28%
1.08
%0.
28%
2019
$ 10
.60
0.14
2.17
(0.1
0)(4
.49)
(4.5
9) $
8.18
25.4
0% $
0.28
%0.
28%
2018
$0.
15(1
.29)
(1.1
4)(0
.18)
(1.6
9)(1
.87)
$ 10
.60
(11.
09)%
$0.
28%
1.12
%0.
28%
16.5
4%
2017
$ 1 2
.51
0.15
1.62
1.77
(0.1
5)(0
.52)
(0.6
7) $
14.5
6% $
466,
406,
890
0.26
%1.
19%
0.26
%18
.00%
2016
$ 11
.99
0.17
2.18
(0.1
5)(1
.68)
$ 12
.51
21.2
2% $
0.28
%0.
28%
A
mou
nts
desi
gnat
ed a
s "—
" are
zer
o or
hav
e be
en ro
unde
d to
zer
o.(a
)P
er s
hare
cal
cula
tions
wer
e pe
rform
ed u
sing
ave
rage
sha
res
met
hod.
(b)
Not
ann
ualiz
ed fo
r per
iods
less
than
one
yea
r.(c
)(d
)A
nnua
lized
for p
erio
ds le
ss th
an o
ne y
ear.
(e)
Dur
ing
the
perio
d, c
erta
in fe
es m
ay h
ave
been
wai
ved
and/
or re
imbu
rsed
. If s
uch
wai
vers
/reim
burs
emen
ts h
ad n
ot o
ccur
red,
the
ratio
s w
ould
hav
e be
en a
s in
dica
ted.
(f)P
ortfo
lio tu
rnov
er is
cal
cula
ted
on th
e ba
sis
of th
e Fu
nd a
s a
who
le w
ithou
t dis
tingu
ishi
ng a
mon
g th
e cl
asse
s of
sha
res.
1. Organization
Nationwide Variable Insurance Trust (“NVIT” or the “Trust”) is registered under the Investment Company Act of 1940, as amended (the “1940 Act”), as an open-end management investment company, organized as a statutory trust under the laws of the State of Delaware. The Trust has authorized an
without par value. The Trust currently offers shares to life
payable under variable life insurance policies and variable
its own objective(s) and investment strategies. This report
“Funds”).
Nationwide Fund Advisors (“NFA”) serves as investment adviser to the Funds. NFA is a wholly owned subsidiary of Nationwide Financial Services, Inc. (“NFS”), a holding company which is a direct wholly owned subsidiary of Nationwide Corporation. Nationwide Corporation, in turn, is owned by Nationwide Mutual Insurance Company and Nationwide Mutual Fire Insurance Company.
- NVIT Bond Index Fund ("Bond Index") - NVIT International Index Fund ("International Index") - NVIT Mid Cap Index Fund ("Mid Cap Index") - NVIT S&P 500 Index Fund ("S&P 500 Index") - NVIT Small Cap Index Fund ("Small Cap Index")
Shares of the Funds are held by separate accounts established by Nationwide Life Insurance Company (“NLIC”), a wholly owned subsidiary of NFS, Nationwide Life and Annuity Insurance Company, a wholly owned subsidiary of NLIC, other
that operate as a fund-of-funds, such as the NVIT Investor Destinations Funds.
The Funds, as applicable, currently offer Class I, Class II, Class
represents interests in the same portfolio of investments of that Fund and the classes are identical except for any differences in the distribution or service fees, administrative services fees,
or designations.
followed by the Funds in the accounting and the preparation
companies and follow accounting and reporting guidance in the Financial Accounting Standards Board (“FASB”) Accounting
in conformity with accounting principles generally accepted in
that affect the reported amounts of assets and liabilities, the disclosure of contingent assets and liabilities at the date of the
expenses for the period. The Funds utilize various methods to measure the value of their investments on a recurring basis. Amounts received upon the sale of such investments could differ from those estimated values and those differences could be material.
(a) Security Valuation
receive to sell an asset or pay to transfer a liability in an orderly transaction between market participants at the measurement date. Pursuant to procedures approved by the Board of Trustees of the Trust (the “Board of Trustees”), NFA assigns a
in accordance with a hierarchy that prioritizes the various types of inputs used to measure fair value. The hierarchy gives the
in active markets for identical assets (Level 1 measurements)
measurements) when market prices are not readily available or reliable.
The three levels of the hierarchy are summarized as follows.
Level 1 — Quoted prices in active markets for identical assets
prepayment speeds, credit risk, etc.)
investments)
valuation in its entirety. The inputs or methodology used to value investments are not intended to indicate the risk associated with investing in those investments.
available are valued at the current market value as of “Valuation Time”. Valuation Time is as of the close of regular
pricing service approved by the Board of Trustees. Prices are taken from the primary market or exchange on which each security trades. Shares of registered open-end management investment companies are valued at net asset value (“NAV”) as reported by such company. Shares of exchange traded funds
bid price provided by an independent pricing service. Master limited partnerships (“MLPs”) are publicly traded partnerships
MLPs valued in this manner are generally categorized as Level 1 investments within the hierarchy. Repurchase agreements are valued at amortized cost, which approximates fair value, and are generally categorized as Level 2 investments within the hierarchy.
at the bid evaluation price provided by an independent pricing
provided by independent pricing service providers may be
and other market data, reported trades or valuation estimates from their internal pricing models. The independent pricing
such as issuer details, interest rates, yield curves, prepayment speeds, credit risks/spreads, default rates, anticipated timing
and are generally categorized as Level 2 investments within the hierarchy. Debt obligations generally involve some risk of default with respect to interest and/or principal payments.
Municipal securities are valued as determined by an independent pricing service. The independent pricing service utilizes internal models and uses observable inputs such as: (i) yields or prices
and type; (ii) indications as to values from dealers; and (iii) general market conditions. Municipal securities are generally categorized as Level 2 investments within the hierarchy.
The Board of Trustees has delegated authority to NFA, and
(“NFM”), to assign a fair value under certain circumstances, as described below, pursuant to valuation procedures approved by the Board of Trustees. NFA and NFM have established a Fair Valuation Committee (“FVC”) to assign these fair valuations.
published price. Fair valuation of portfolio securities may occur on a daily basis.
Securities may be fair valued in certain circumstances, such as
an independent pricing service does not provide a value or the value provided by an independent pricing service is determined to be unreliable in the judgment of NFA/NFM or its designee;
announcements or news relating to natural disasters affecting
securities have defaulted or been delisted from an exchange and are no longer trading; or (vi) any other circumstance in
The FVC will assign a fair value according to fair value methodologies. Information utilized by the FVC to obtain a fair value may include, among others, the following: (i) a multiple of earnings; (ii) the discount from market value of a similar, freely traded security; (iii) the yield-to-maturity for debt issues; or (iv) a combination of these and other methods. Fair valuations
Valuation Time but after the close of the principal market on which a security trades that materially affect the value of such security. To arrive at the appropriate methodology, the FVC
to the security, as well as whether the security is traded on the domestic or foreign markets. The FVC monitors the results of fair valuation determinations and regularly reports the results to
that it might reasonably expect to receive upon the current sale of that security. That said, there can be no assurance that the fair value assigned to a security is the price at which a security could have been sold during the period in which the particular fair value was used to value the security. To the extent the
securities”) are generally fair valued daily by an independent fair value pricing service approved by the Board of Trustees.
on which such securities trade. Such securities are categorized as Level 2 investments within the hierarchy. If daily fair value prices from the independent fair value pricing service are not
the security is traded and categorized as Level 1 investments within the hierarchy. Values of foreign securities, currencies, and other assets and liabilities denominated in foreign
as provided by an independent pricing service approved by the Board of Trustees.
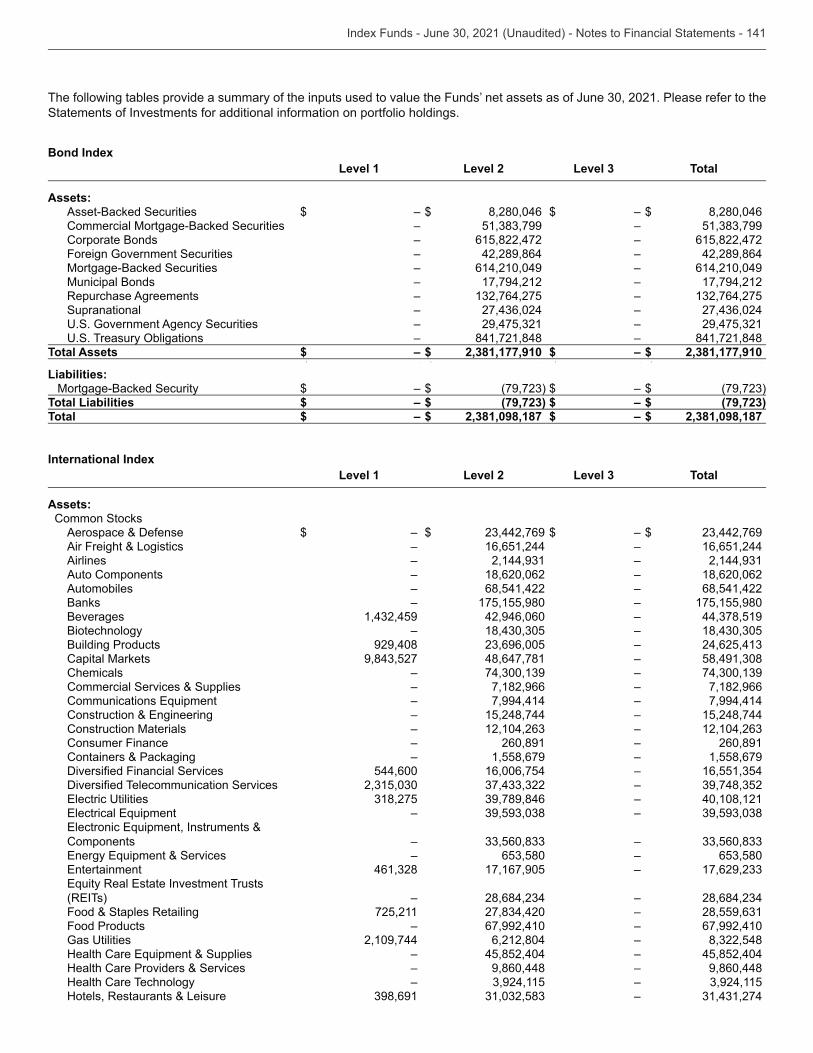
Statements of Investments for additional information on portfolio holdings.
Bond IndexLevel 1 Level 2 Level 3 Total
Assets:Asset-Backed Securities $ – $ 8,280,046 $ – $ 8,280,046 Commercial Mortgage-Backed Securities – – Corporate Bonds – 615,822,472 – 615,822,472 Foreign Government Securities – 42,289,864 – 42,289,864 Mortgage-Backed Securities – 614,210,049 – 614,210,049 Municipal Bonds – 17,794,212 – 17,794,212 Repurchase Agreements – – Supranational – –
– – – 841,721,848 – 841,721,848
Total Assets $ – $ 2,381,177,910 $ – $ 2,381,177,910 $ – $ – $ – $ –
Liabilities:Mortgage-Backed Security $ – $ $ – $
Total Liabilities $ – $ (79,723 ) $ – $ (79,723 )Total $ – $ 2,381,098,187 $ – $ 2,381,098,187
International IndexLevel 1 Level 2 Level 3 Total
Assets: Common Stocks
Aerospace & Defense $ – $ $ – $ Air Freight & Logistics – 16,651,244 – 16,651,244 Airlines – – Auto Components – 18,620,062 – 18,620,062 Automobiles – 68,541,422 – 68,541,422 Banks – 175,155,980 – 175,155,980 Beverages 42,946,060 – Biotechnology – – Building Products 929,408 – Capital Markets 48,647,781 – Chemicals – – Commercial Services & Supplies – 7,182,966 – 7,182,966
– 7,994,414 – 7,994,414 – 15,248,744 – 15,248,744
Construction Materials – – Consumer Finance – 260,891 – 260,891 Containers & Packaging – 1,558,679 – 1,558,679
544,600 16,006,754 – – – 40,108,121 – –
Components – – – – 17,167,905 –
– – Food & Staples Retailing 725,211 – Food Products – 67,992,410 – 67,992,410
2,109,744 6,212,804 – – 45,852,404 – 45,852,404
Health Care Providers & Services – 9,860,448 – 9,860,448 Health Care Technology – – Hotels, Restaurants & Leisure –
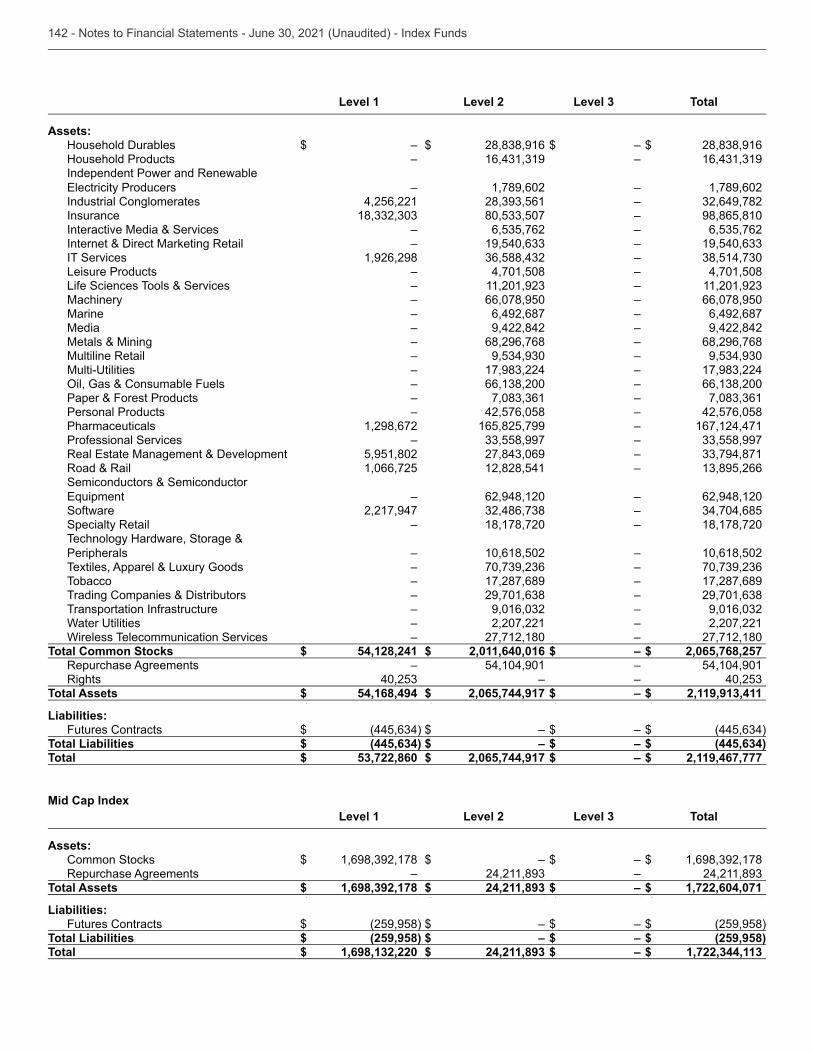
Level 1 Level 2 Level 3 Total
Assets: Household Durables $ – $ $ – $ Household Products – – Independent Power and Renewable
– 1,789,602 – 1,789,602 Industrial Conglomerates 4,256,221 – Insurance – 98,865,810 Interactive Media & Services – – Internet & Direct Marketing Retail – – IT Services 1,926,298 – Leisure Products – 4,701,508 – 4,701,508 Life Sciences Tools & Services – – Machinery – 66,078,950 – 66,078,950 Marine – 6,492,687 – 6,492,687 Media – 9,422,842 – 9,422,842 Metals & Mining – 68,296,768 – 68,296,768 Multiline Retail – –
– – – –
Paper & Forest Products – – Personal Products – 42,576,058 – 42,576,058 Pharmaceuticals 1,298,672 165,825,799 – 167,124,471 Professional Services – –
5,951,802 – Road & Rail 1,066,725 12,828,541 – Semiconductors & Semiconductor
– 62,948,120 – 62,948,120 Software 2,217,947 – Specialty Retail – 18,178,720 – 18,178,720 Technology Hardware, Storage & Peripherals – 10,618,502 – 10,618,502 Textiles, Apparel & Luxury Goods – – Tobacco – 17,287,689 – 17,287,689 Trading Companies & Distributors – – Transportation Infrastructure – –
– 2,207,221 – 2,207,221 Wireless Telecommunication Services – 27,712,180 – 27,712,180
Total Common Stocks $ 54,128,241 $ 2,011,640,016 $ – $ 2,065,768,257 Repurchase Agreements – 54,104,901 – 54,104,901 Rights – –
Total Assets $ 54,168,494 $ 2,065,744,917 $ – $ 2,119,913,411 $ – $ – $ – $ –
Liabilities:Futures Contracts $ $ – $ – $
Total Liabilities $ (445,634 ) $ – $ – $ (445,634 )Total $ 53,722,860 $ 2,065,744,917 $ – $ 2,119,467,777
Mid Cap IndexLevel 1 Level 2 Level 3 Total
Assets:Common Stocks $ $ – $ – $ Repurchase Agreements – –
Total Assets $ 1,698,392,178 $ 24,211,893 $ – $ 1,722,604,071 $ – $ – $ – $ –
Liabilities:Futures Contracts $ (259,958 ) $ – $ – $ (259,958 )
Total Liabilities $ (259,958 ) $ – $ – $ (259,958 )Total $ 1,698,132,220 $ 24,211,893 $ – $ 1,722,344,113
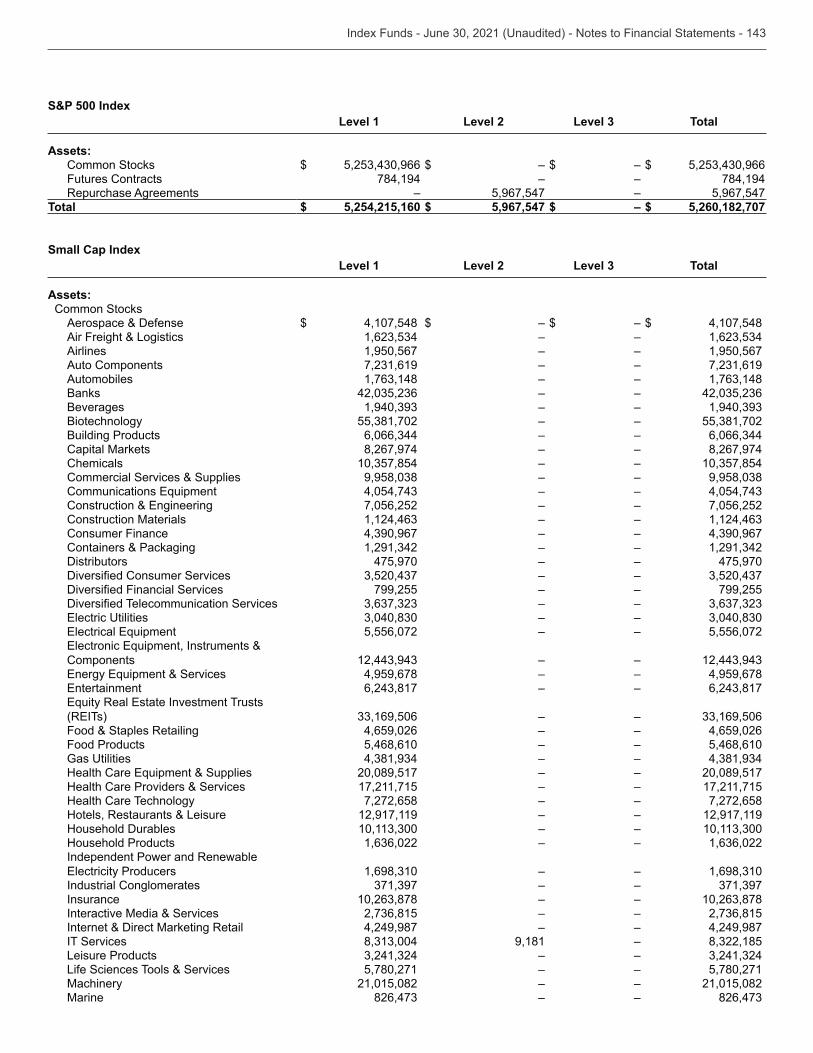
S&P 500 IndexLevel 1 Level 2 Level 3 Total
Assets:Common Stocks $ $ – $ – $ Futures Contracts 784,194 – – 784,194 Repurchase Agreements – 5,967,547 – 5,967,547
Total $ 5,254,215,160 $ 5,967,547 $ – $ 5,260,182,707
Small Cap IndexLevel 1 Level 2 Level 3 Total
Assets: Common Stocks
Aerospace & Defense $ 4,107,548 $ – $ – $ 4,107,548 Air Freight & Logistics – – Airlines 1,950,567 – – 1,950,567 Auto Components – – Automobiles – – Banks – – Beverages – – Biotechnology – – Building Products – – Capital Markets 8,267,974 – – 8,267,974 Chemicals – – Commercial Services & Supplies – –
– – 7,056,252 – – 7,056,252
Construction Materials – – Consumer Finance – – Containers & Packaging – – Distributors 475,970 – – 475,970
– – 799,255 – – 799,255 – – – – 5,556,072 – – 5,556,072
Components – – 4,959,678 – – 4,959,678 – –
– – Food & Staples Retailing 4,659,026 – – 4,659,026 Food Products 5,468,610 – – 5,468,610
– – 20,089,517 – – 20,089,517
Health Care Providers & Services 17,211,715 – – 17,211,715 Health Care Technology 7,272,658 – – 7,272,658 Hotels, Restaurants & Leisure 12,917,119 – – 12,917,119 Household Durables – – Household Products – – Independent Power and Renewable
– – Industrial Conglomerates – – Insurance – – Interactive Media & Services – – Internet & Direct Marketing Retail 4,249,987 – – 4,249,987 IT Services 9,181 – Leisure Products – – Life Sciences Tools & Services 5,780,271 – – 5,780,271 Machinery 21,015,082 – – 21,015,082 Marine – –
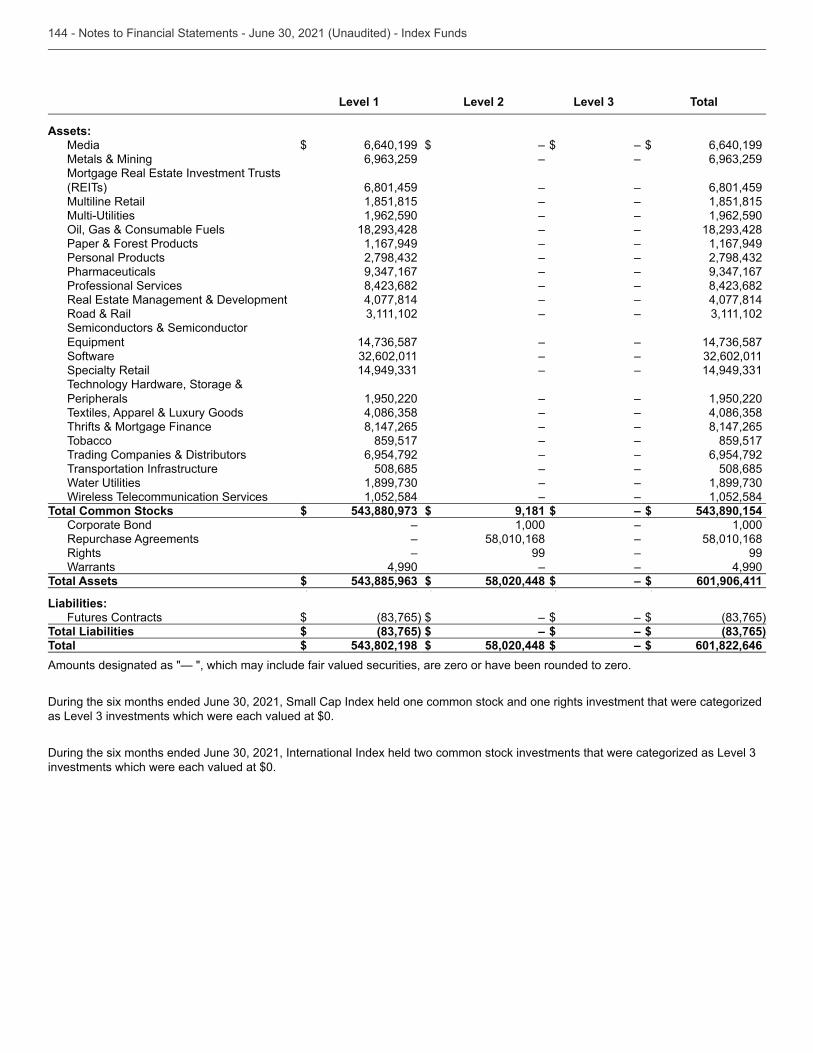
Level 1 Level 2 Level 3 Total
Assets: Media $ 6,640,199 $ – $ – $ 6,640,199 Metals & Mining – –
6,801,459 – – 6,801,459 Multiline Retail 1,851,815 – – 1,851,815
1,962,590 – – 1,962,590 – –
Paper & Forest Products 1,167,949 – – 1,167,949 Personal Products – – Pharmaceuticals – – Professional Services – –
4,077,814 – – 4,077,814 Road & Rail – – Semiconductors & Semiconductor
– – Software – – Specialty Retail – – Technology Hardware, Storage & Peripherals 1,950,220 – – 1,950,220 Textiles, Apparel & Luxury Goods – – Thrifts & Mortgage Finance 8,147,265 – – 8,147,265 Tobacco 859,517 – – 859,517 Trading Companies & Distributors 6,954,792 – – 6,954,792 Transportation Infrastructure 508,685 – – 508,685
– – Wireless Telecommunication Services 1,052,584 – – 1,052,584
Total Common Stocks $ 543,880,973 $ 9,181 $ – $ 543,890,154 Corporate Bond – 1,000 – 1,000 Repurchase Agreements – 58,010,168 – 58,010,168 Rights – 99 – 99 Warrants 4,990 – – 4,990
Total Assets $ 543,885,963 $ 58,020,448 $ – $ 601,906,411 $ – $ – $ – $ –
Liabilities:Futures Contracts $ $ – $ – $
Total Liabilities $ (83,765 ) $ – $ – $ (83,765 )Total $ 543,802,198 $ 58,020,448 $ – $ 601,822,646 Amounts designated as "— ", which may include fair valued securities, are zero or have been rounded to zero.
investments which were each valued at $0.
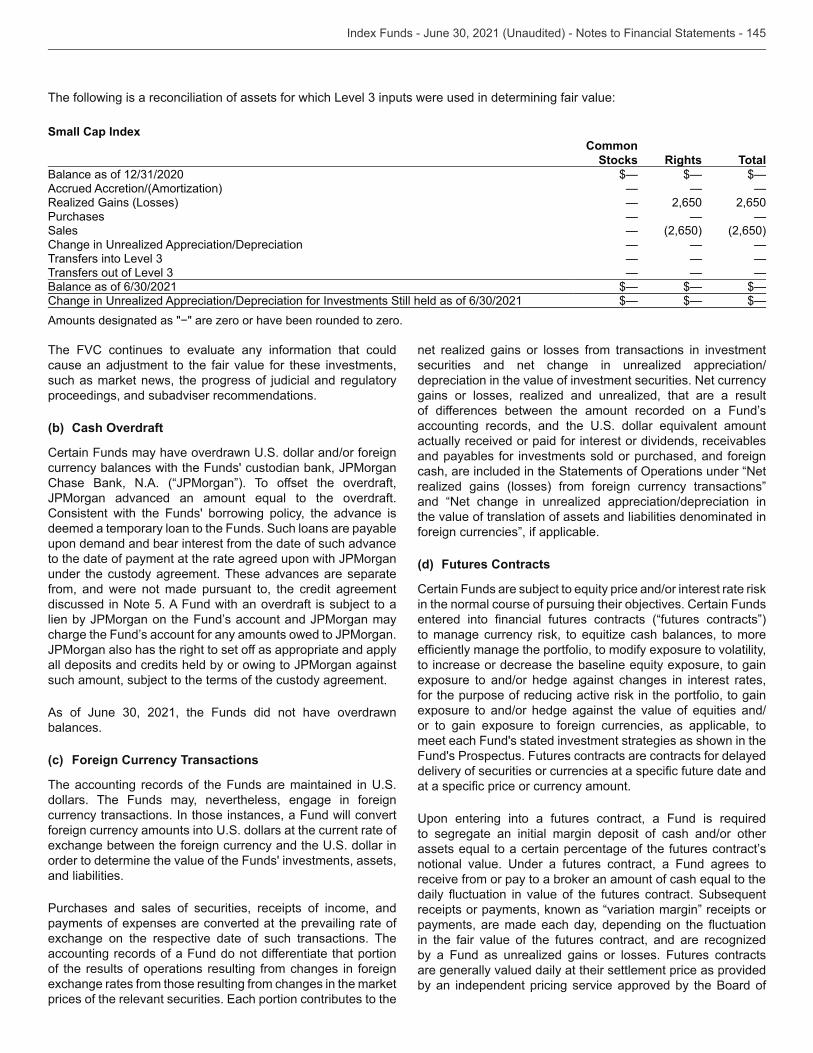
Small Cap IndexCommon
Stocks Rights Total$— $— $—
Accrued Accretion/(Amortization) — — —Realized Gains (Losses) — 2,650 2,650Purchases — — —Sales — (2,650) (2,650)
— — —— — —— — —
$— $— $—$— $— $—
The FVC continues to evaluate any information that could cause an adjustment to the fair value for these investments, such as market news, the progress of judicial and regulatory proceedings, and subadviser recommendations.
(b) Cash Overdraft
currency balances with the Funds' custodian bank, JPMorgan Chase Bank, N.A. (“JPMorgan”). To offset the overdraft,
Consistent with the Funds' borrowing policy, the advance is deemed a temporary loan to the Funds. Such loans are payable upon demand and bear interest from the date of such advance to the date of payment at the rate agreed upon with JPMorgan under the custody agreement. These advances are separate from, and were not made pursuant to, the credit agreement discussed in Note 5. A Fund with an overdraft is subject to a
JPMorgan also has the right to set off as appropriate and apply all deposits and credits held by or owing to JPMorgan against such amount, subject to the terms of the custody agreement.
balances.
(c) Foreign Currency Transactions
dollars. The Funds may, nevertheless, engage in foreign currency transactions. In those instances, a Fund will convert
order to determine the value of the Funds' investments, assets, and liabilities.
Purchases and sales of securities, receipts of income, and payments of expenses are converted at the prevailing rate of exchange on the respective date of such transactions. The accounting records of a Fund do not differentiate that portion of the results of operations resulting from changes in foreign exchange rates from those resulting from changes in the market
net realized gains or losses from transactions in investment securities and net change in unrealized appreciation/depreciation in the value of investment securities. Net currency gains or losses, realized and unrealized, that are a result
actually received or paid for interest or dividends, receivables and payables for investments sold or purchased, and foreign
realized gains (losses) from foreign currency transactions” and “Net change in unrealized appreciation/depreciation in the value of translation of assets and liabilities denominated in foreign currencies”, if applicable.
(d) Futures Contracts
in the normal course of pursuing their objectives. Certain Funds
exposure to and/or hedge against changes in interest rates, for the purpose of reducing active risk in the portfolio, to gain
or to gain exposure to foreign currencies, as applicable, to meet each Fund's stated investment strategies as shown in the Fund's Prospectus. Futures contracts are contracts for delayed
to segregate an initial margin deposit of cash and/or other
receipts or payments, known as “variation margin” receipts or
in the fair value of the futures contract, and are recognized by a Fund as unrealized gains or losses. Futures contracts are generally valued daily at their settlement price as provided by an independent pricing service approved by the Board of
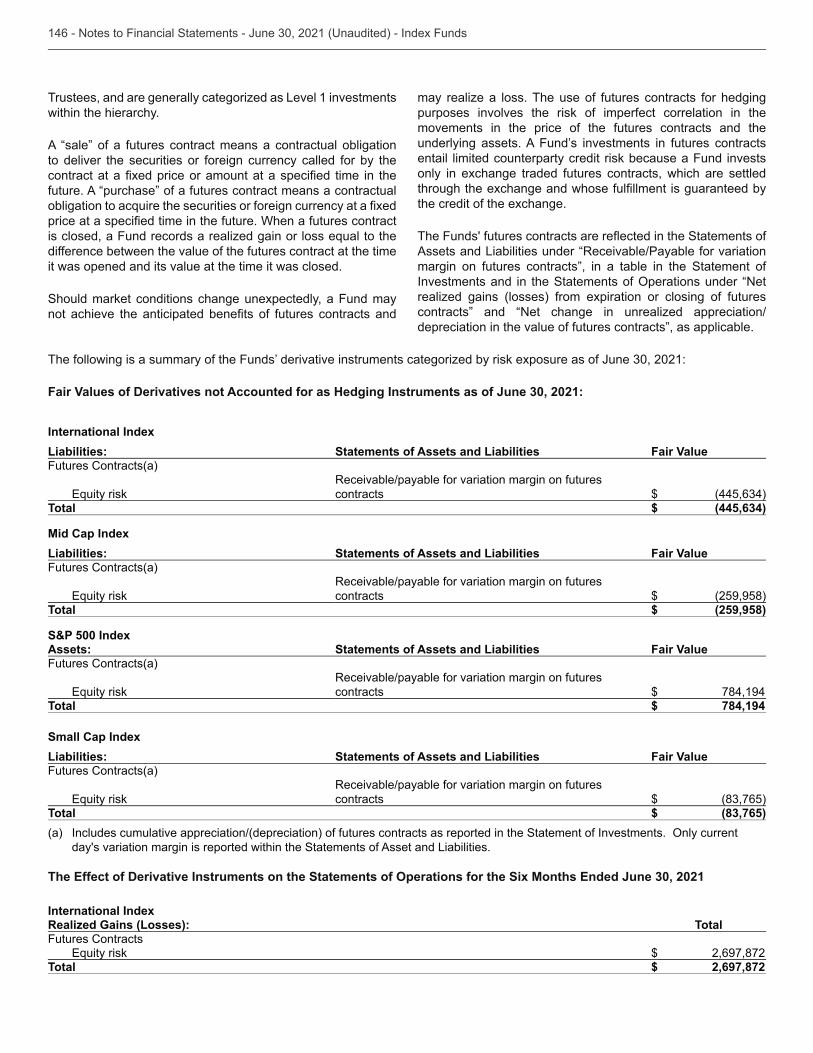
Trustees, and are generally categorized as Level 1 investments within the hierarchy.
A “sale” of a futures contract means a contractual obligation to deliver the securities or foreign currency called for by the
future. A “purchase” of a futures contract means a contractual
difference between the value of the futures contract at the time it was opened and its value at the time it was closed.
Should market conditions change unexpectedly, a Fund may
may realize a loss. The use of futures contracts for hedging purposes involves the risk of imperfect correlation in the movements in the price of the futures contracts and the
entail limited counterparty credit risk because a Fund invests only in exchange traded futures contracts, which are settled
the credit of the exchange.
Assets and Liabilities under “Receivable/Payable for variation margin on futures contracts”, in a table in the Statement of
realized gains (losses) from expiration or closing of futures contracts” and “Net change in unrealized appreciation/depreciation in the value of futures contracts”, as applicable.
Fair Values of Derivatives not Accounted for as Hedging Instruments as of June 30, 2021:
International IndexLiabilities: Statements of Assets and Liabilities Fair ValueFutures Contracts(a)
Receivable/payable for variation margin on futures contracts $
Total $ (445,634 )
Mid Cap IndexLiabilities: Statements of Assets and Liabilities Fair ValueFutures Contracts(a)
Receivable/payable for variation margin on futures contracts $ (259,958 )
Total $ (259,958 )
S&P 500 IndexAssets: Statements of Assets and Liabilities Fair ValueFutures Contracts(a)
Receivable/payable for variation margin on futures contracts $ 784,194
Total $ 784,194
Small Cap IndexLiabilities: Statements of Assets and Liabilities Fair ValueFutures Contracts(a)
Receivable/payable for variation margin on futures contracts $
Total $ (83,765 )(a)
day's variation margin is reported within the Statements of Asset and Liabilities.
The Effect of Derivative Instruments on the Statements of Operations for the Six Months Ended June 30, 2021
International IndexRealized Gains (Losses): TotalFutures Contracts
$ 2,697,872 Total $ 2,697,872
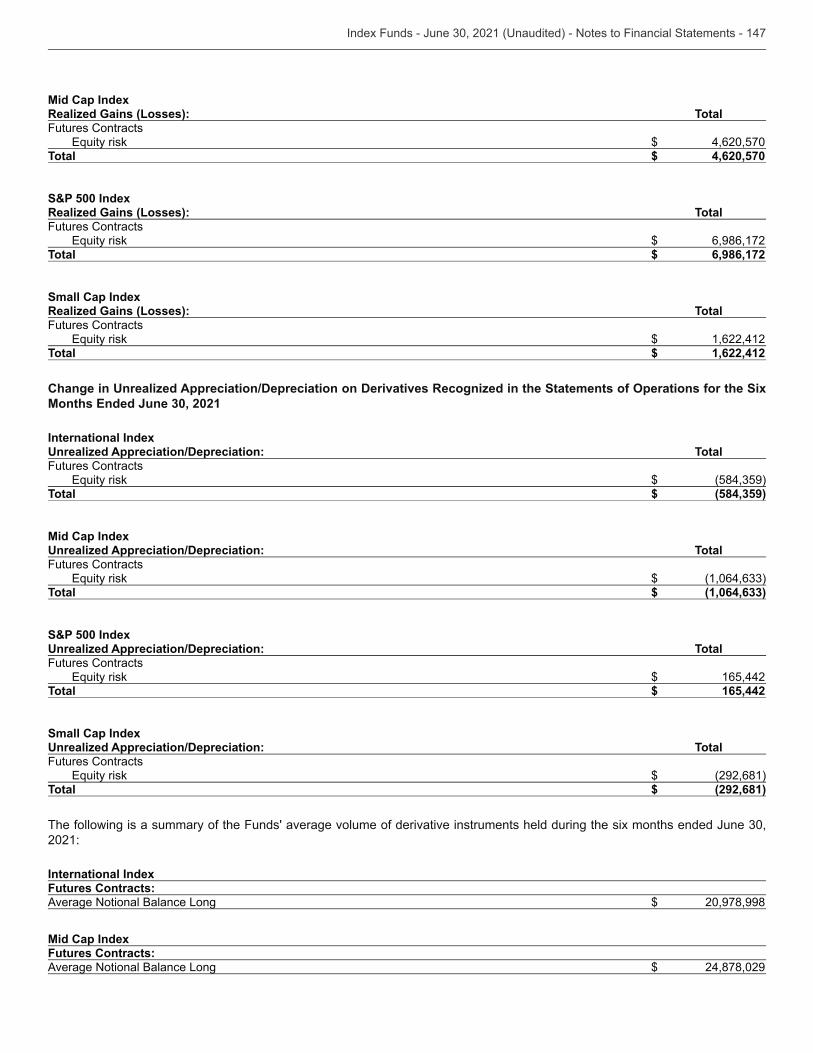
Mid Cap IndexRealized Gains (Losses): TotalFutures Contracts
$ 4,620,570 Total $ 4,620,570
S&P 500 IndexRealized Gains (Losses): TotalFutures Contracts
$ 6,986,172 Total $ 6,986,172
Small Cap IndexRealized Gains (Losses): TotalFutures Contracts
$ 1,622,412 Total $ 1,622,412
Change in Unrealized Appreciation/Depreciation on Derivatives Recognized in the Statements of Operations for the Six Months Ended June 30, 2021
International IndexUnrealized Appreciation/Depreciation: TotalFutures Contracts
$ Total $ (584,359 )
Mid Cap IndexUnrealized Appreciation/Depreciation: TotalFutures Contracts
$ Total $ (1,064,633 )
S&P 500 IndexUnrealized Appreciation/Depreciation: TotalFutures Contracts
$ 165,442 Total $ 165,442
Small Cap IndexUnrealized Appreciation/Depreciation: TotalFutures Contracts
$ (292,681 )Total $ (292,681 )
2021:
International IndexFutures Contracts:Average Notional Balance Long $ 20,978,998
Mid Cap IndexFutures Contracts:Average Notional Balance Long $ 24,878,029
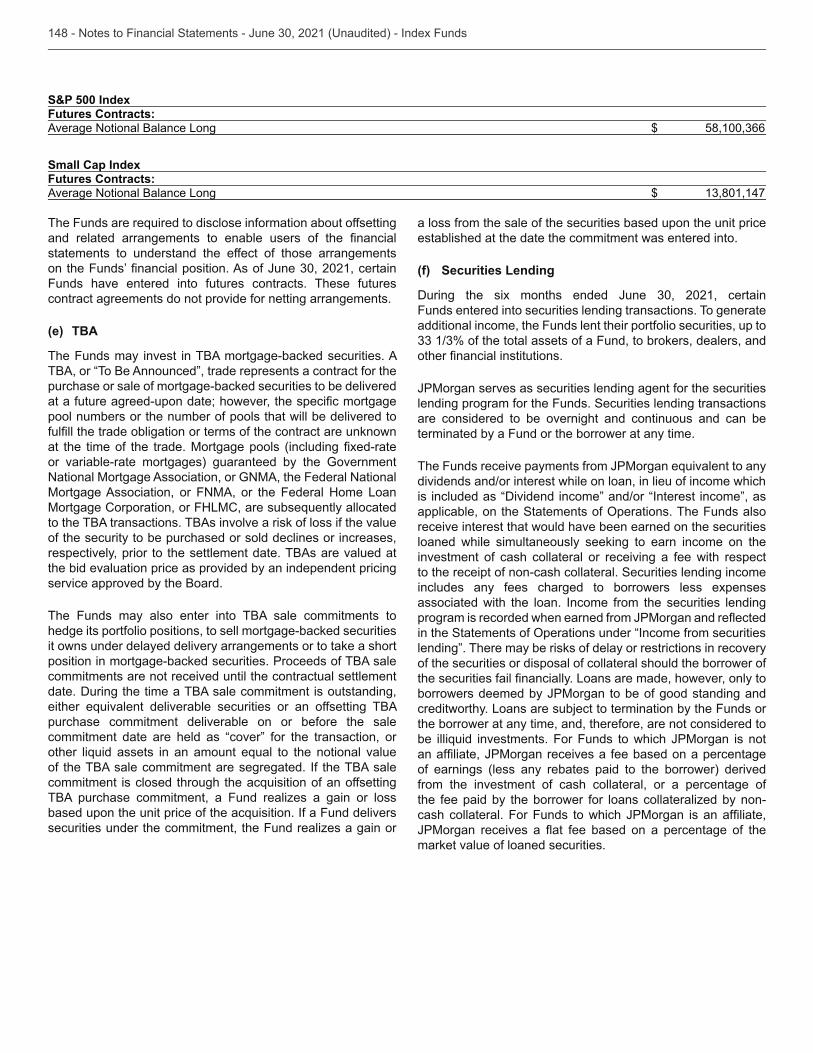
S&P 500 IndexFutures Contracts:Average Notional Balance Long $
Small Cap IndexFutures Contracts:Average Notional Balance Long $
statements to understand the effect of those arrangements
Funds have entered into futures contracts. These futures contract agreements do not provide for netting arrangements.
(e) TBA
The Funds may invest in TBA mortgage-backed securities. A TBA, or “To Be Announced”, trade represents a contract for the purchase or sale of mortgage-backed securities to be delivered
pool numbers or the number of pools that will be delivered to
or variable-rate mortgages) guaranteed by the Government National Mortgage Association, or GNMA, the Federal National Mortgage Association, or FNMA, or the Federal Home Loan
to the TBA transactions. TBAs involve a risk of loss if the value of the security to be purchased or sold declines or increases, respectively, prior to the settlement date. TBAs are valued at the bid evaluation price as provided by an independent pricing service approved by the Board.
The Funds may also enter into TBA sale commitments to hedge its portfolio positions, to sell mortgage-backed securities it owns under delayed delivery arrangements or to take a short position in mortgage-backed securities. Proceeds of TBA sale commitments are not received until the contractual settlement date. During the time a TBA sale commitment is outstanding,
purchase commitment deliverable on or before the sale commitment date are held as “cover” for the transaction, or
of the TBA sale commitment are segregated. If the TBA sale
TBA purchase commitment, a Fund realizes a gain or loss
securities under the commitment, the Fund realizes a gain or
a loss from the sale of the securities based upon the unit price established at the date the commitment was entered into.
(f) Securities Lending
Funds entered into securities lending transactions. To generate additional income, the Funds lent their portfolio securities, up to
JPMorgan serves as securities lending agent for the securities lending program for the Funds. Securities lending transactions are considered to be overnight and continuous and can be terminated by a Fund or the borrower at any time.
dividends and/or interest while on loan, in lieu of income which is included as “Dividend income” and/or “Interest income”, as
receive interest that would have been earned on the securities loaned while simultaneously seeking to earn income on the investment of cash collateral or receiving a fee with respect to the receipt of non-cash collateral. Securities lending income includes any fees charged to borrowers less expenses associated with the loan. Income from the securities lending
lending”. There may be risks of delay or restrictions in recovery of the securities or disposal of collateral should the borrower of
borrowers deemed by JPMorgan to be of good standing and creditworthy. Loans are subject to termination by the Funds or the borrower at any time, and, therefore, are not considered to
of earnings (less any rebates paid to the borrower) derived from the investment of cash collateral, or a percentage of the fee paid by the borrower for loans collateralized by non-
market value of loaned securities.
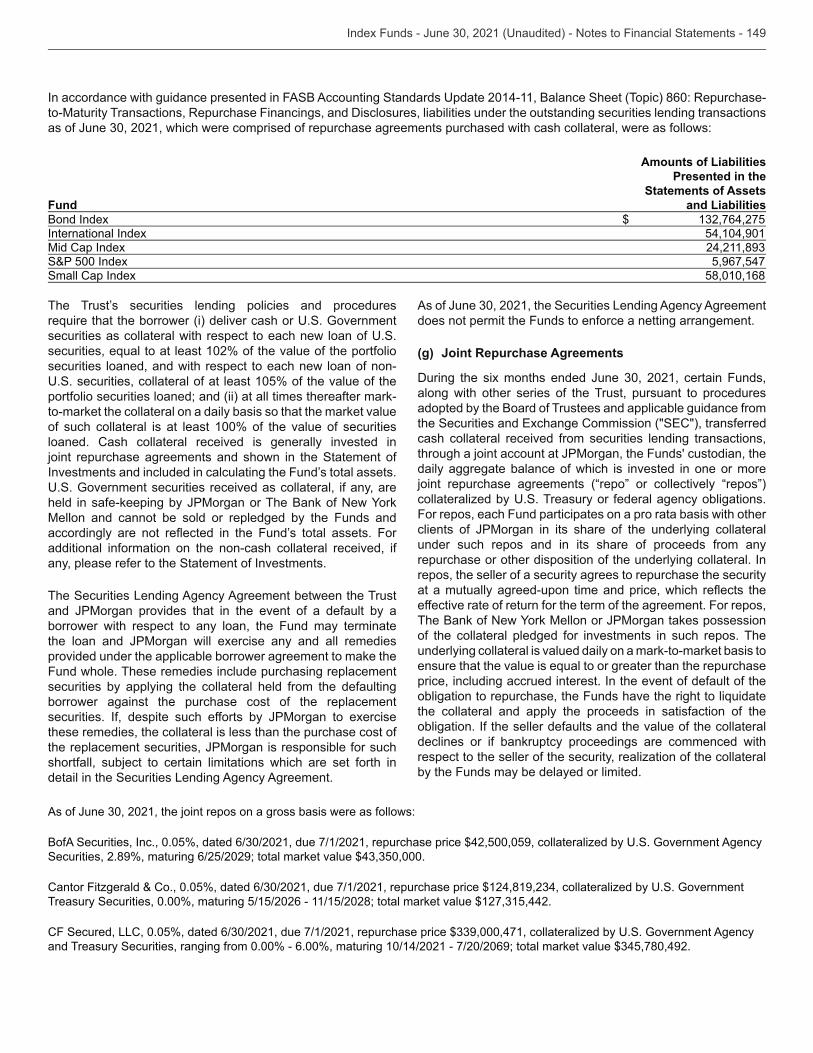
to-Maturity Transactions, Repurchase Financings, and Disclosures, liabilities under the outstanding securities lending transactions
Fund
Amounts of Liabilities Presented in the
Statements of Assets and Liabilities
Bond Index $ International Index 54,104,901 Mid Cap IndexS&P 500 Index 5,967,547 Small Cap Index 58,010,168
securities loaned, and with respect to each new loan of non-
portfolio securities loaned; and (ii) at all times thereafter mark-to-market the collateral on a daily basis so that the market value of such collateral is at least 100% of the value of securities loaned. Cash collateral received is generally invested in joint repurchase agreements and shown in the Statement of
Mellon and cannot be sold or repledged by the Funds and
additional information on the non-cash collateral received, if any, please refer to the Statement of Investments.
The Securities Lending Agency Agreement between the Trust and JPMorgan provides that in the event of a default by a borrower with respect to any loan, the Fund may terminate the loan and JPMorgan will exercise any and all remedies provided under the applicable borrower agreement to make the Fund whole. These remedies include purchasing replacement securities by applying the collateral held from the defaulting borrower against the purchase cost of the replacement securities. If, despite such efforts by JPMorgan to exercise these remedies, the collateral is less than the purchase cost of the replacement securities, JPMorgan is responsible for such shortfall, subject to certain limitations which are set forth in detail in the Securities Lending Agency Agreement.
does not permit the Funds to enforce a netting arrangement.
(g) Joint Repurchase Agreements
along with other series of the Trust, pursuant to procedures adopted by the Board of Trustees and applicable guidance from
cash collateral received from securities lending transactions, through a joint account at JPMorgan, the Funds' custodian, the daily aggregate balance of which is invested in one or more joint repurchase agreements (“repo” or collectively “repos”)
For repos, each Fund participates on a pro rata basis with other clients of JPMorgan in its share of the underlying collateral under such repos and in its share of proceeds from any repurchase or other disposition of the underlying collateral. In repos, the seller of a security agrees to repurchase the security
effective rate of return for the term of the agreement. For repos,
of the collateral pledged for investments in such repos. The underlying collateral is valued daily on a mark-to-market basis to
price, including accrued interest. In the event of default of the
the collateral and apply the proceeds in satisfaction of the obligation. If the seller defaults and the value of the collateral declines or if bankruptcy proceedings are commenced with respect to the seller of the security, realization of the collateral by the Funds may be delayed or limited.
BofA
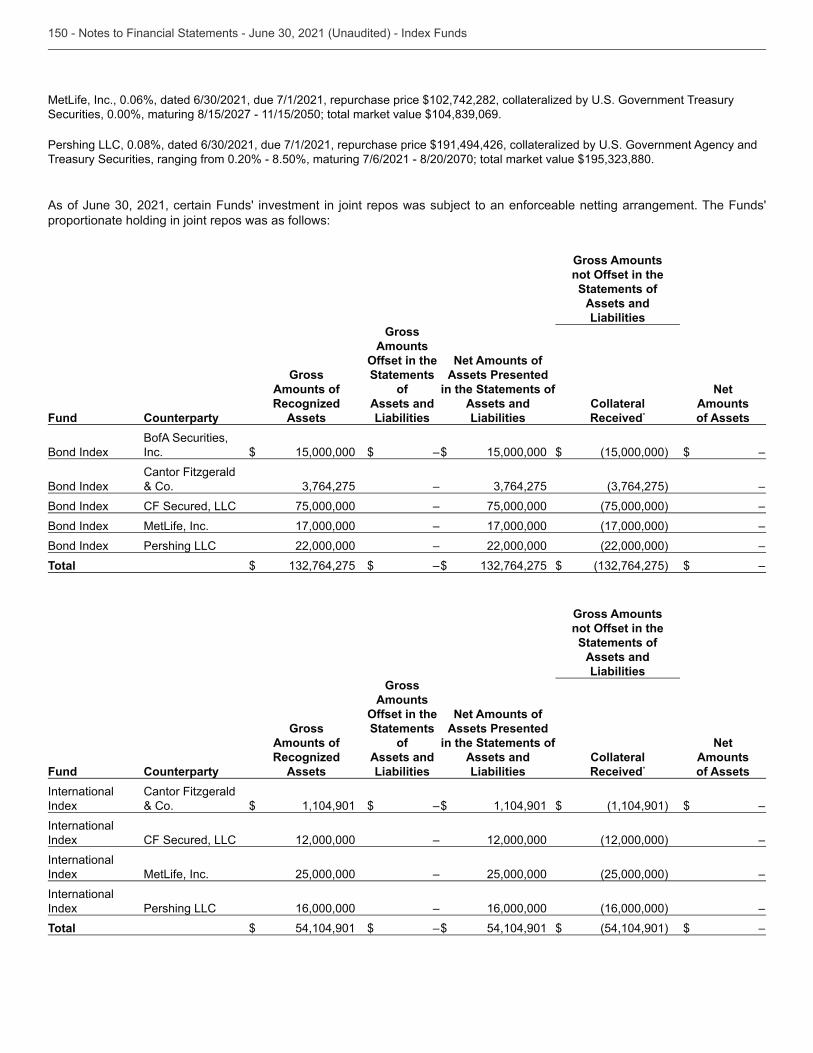
proportionate holding in joint repos was as follows:
Gross Amounts not Offset in the Statements of
Assets and Liabilities
Fund Counterparty
Gross Amounts of Recognized
Assets
Gross Amounts
Offset in the Statements
of Assets and Liabilities
Net Amounts of Assets Presented
in the Statements of Assets and Liabilities
Collateral Received*
Net Amounts of Assets
Bond IndexBofA Securities, Inc. $ 15,000,000 $ – $ 15,000,000 $ (15,000,000 ) $ –
Bond IndexCantor Fitzgerald & Co. – –
Bond Index CF Secured, LLC 75,000,000 – 75,000,000 (75,000,000 ) – Bond Index MetLife, Inc. 17,000,000 – 17,000,000 (17,000,000 ) – Bond Index Pershing LLC 22,000,000 – 22,000,000 (22,000,000 ) – Total $ $ – $ $ $ –
Gross Amounts not Offset in the Statements of
Assets and Liabilities
Fund Counterparty
Gross Amounts of Recognized
Assets
Gross Amounts
Offset in the Statements
of Assets and Liabilities
Net Amounts of Assets Presented
in the Statements of Assets and Liabilities
Collateral Received*
Net Amounts of Assets
International Index
Cantor Fitzgerald & Co. $ 1,104,901 $ – $ 1,104,901 $ (1,104,901 ) $ –
International Index CF Secured, LLC 12,000,000 – 12,000,000 (12,000,000 ) – International Index MetLife, Inc. 25,000,000 – 25,000,000 (25,000,000 ) – International Index Pershing LLC 16,000,000 – 16,000,000 (16,000,000 ) – Total $ 54,104,901 $ – $ 54,104,901 $ (54,104,901 ) $ –
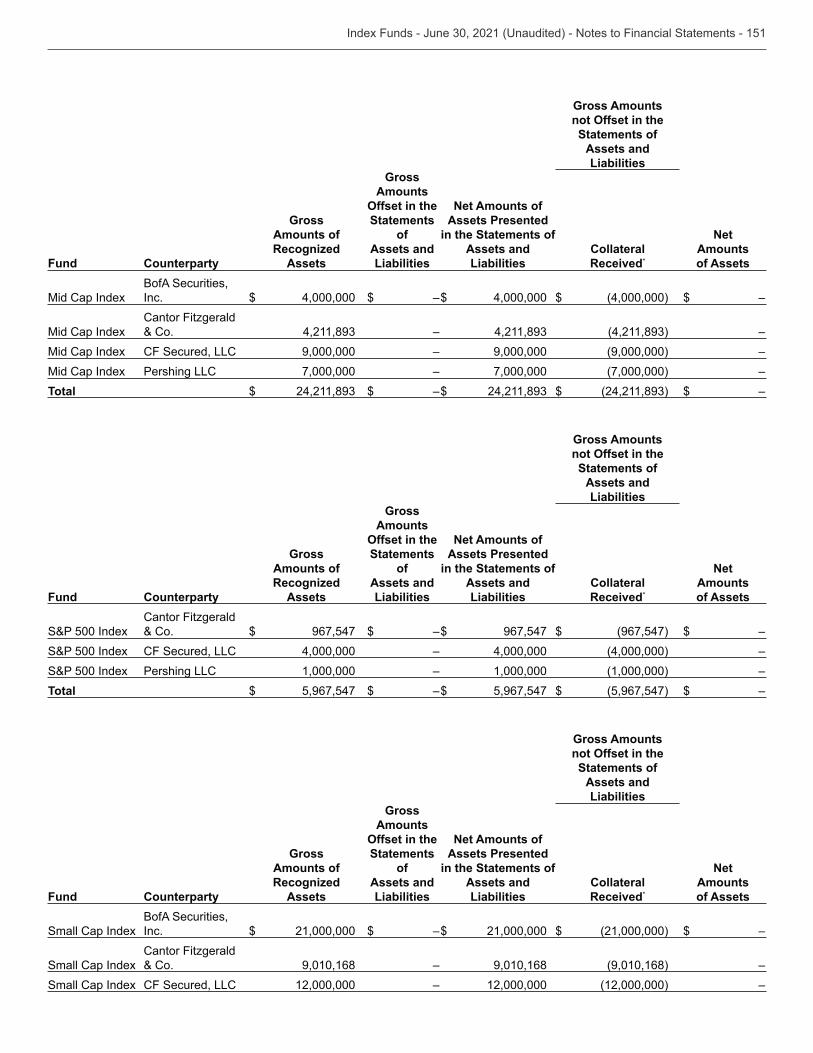
Gross Amounts not Offset in the Statements of
Assets and Liabilities
Fund Counterparty
Gross Amounts of Recognized
Assets
Gross Amounts
Offset in the Statements
of Assets and Liabilities
Net Amounts of Assets Presented
in the Statements of Assets and Liabilities
Collateral Received*
Net Amounts of Assets
Mid Cap IndexBofA Securities, Inc. $ 4,000,000 $ – $ 4,000,000 $ (4,000,000 ) $ –
Mid Cap IndexCantor Fitzgerald & Co. – –
Mid Cap Index CF Secured, LLC 9,000,000 – 9,000,000 (9,000,000 ) – Mid Cap Index Pershing LLC 7,000,000 – 7,000,000 (7,000,000 ) – Total $ $ – $ $ $ –
Gross Amounts not Offset in the Statements of
Assets and Liabilities
Fund Counterparty
Gross Amounts of Recognized
Assets
Gross Amounts
Offset in the Statements
of Assets and Liabilities
Net Amounts of Assets Presented
in the Statements of Assets and Liabilities
Collateral Received*
Net Amounts of Assets
S&P 500 IndexCantor Fitzgerald & Co. $ 967,547 $ – $ 967,547 $ (967,547 ) $ –
S&P 500 Index CF Secured, LLC 4,000,000 – 4,000,000 (4,000,000 ) – S&P 500 Index Pershing LLC 1,000,000 – 1,000,000 (1,000,000 ) – Total $ 5,967,547 $ – $ 5,967,547 $ (5,967,547 ) $ –
Gross Amounts not Offset in the Statements of
Assets and Liabilities
Fund Counterparty
Gross Amounts of Recognized
Assets
Gross Amounts
Offset in the Statements
of Assets and Liabilities
Net Amounts of Assets Presented
in the Statements of Assets and Liabilities
Collateral Received*
Net Amounts of Assets
Small Cap IndexBofA Securities, Inc. $ 21,000,000 $ – $ 21,000,000 $ (21,000,000 ) $ –
Small Cap IndexCantor Fitzgerald & Co. 9,010,168 – 9,010,168 (9,010,168 ) –
Small Cap Index CF Secured, LLC 12,000,000 – 12,000,000 (12,000,000 ) –
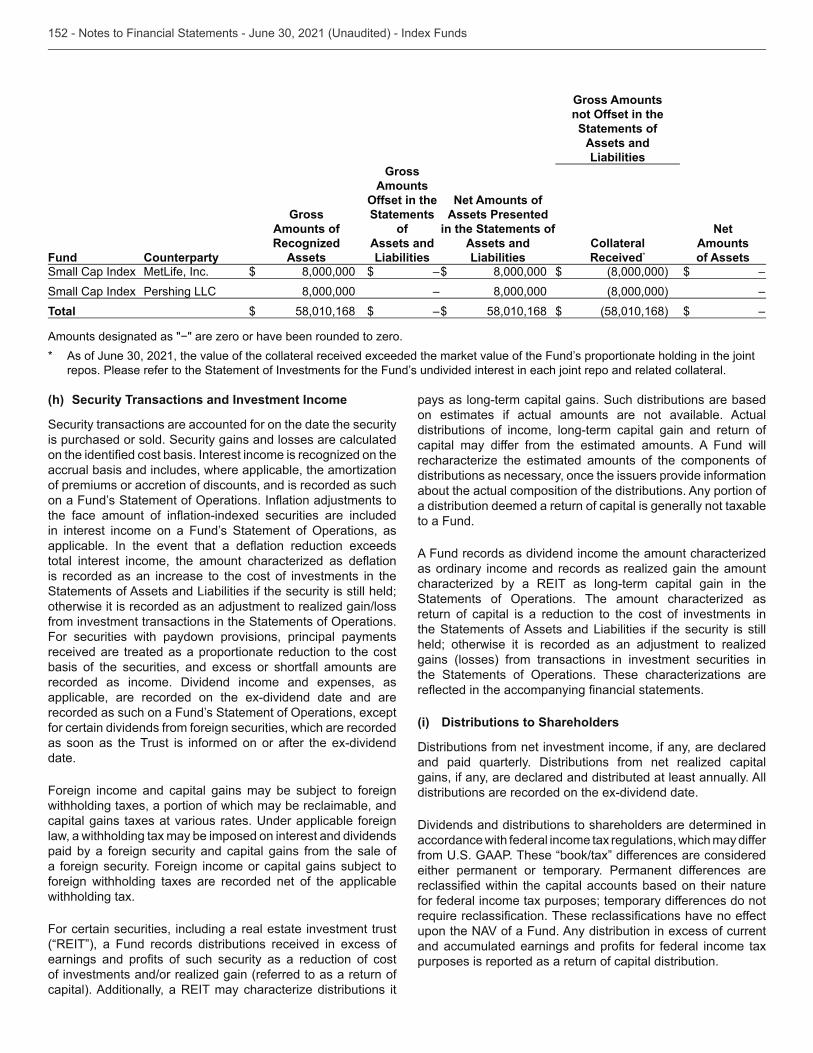
Gross Amounts not Offset in the Statements of
Assets and Liabilities
Fund Counterparty
Gross Amounts of Recognized
Assets
Gross Amounts
Offset in the Statements
of Assets and Liabilities
Net Amounts of Assets Presented
in the Statements of Assets and Liabilities
Collateral Received*
Net Amounts of Assets
Small Cap Index MetLife, Inc. $ 8,000,000 $ – $ 8,000,000 $ (8,000,000 ) $ – Small Cap Index Pershing LLC 8,000,000 – 8,000,000 (8,000,000 ) – Total $ 58,010,168 $ – $ 58,010,168 $ (58,010,168 ) $ –
*
(h) Security Transactions and Investment Income
Security transactions are accounted for on the date the security is purchased or sold. Security gains and losses are calculated
accrual basis and includes, where applicable, the amortization of premiums or accretion of discounts, and is recorded as such
is recorded as an increase to the cost of investments in the Statements of Assets and Liabilities if the security is still held; otherwise it is recorded as an adjustment to realized gain/loss
For securities with paydown provisions, principal payments received are treated as a proportionate reduction to the cost basis of the securities, and excess or shortfall amounts are recorded as income. Dividend income and expenses, as applicable, are recorded on the ex-dividend date and are
for certain dividends from foreign securities, which are recorded as soon as the Trust is informed on or after the ex-dividend date.
Foreign income and capital gains may be subject to foreign withholding taxes, a portion of which may be reclaimable, and
law, a withholding tax may be imposed on interest and dividends paid by a foreign security and capital gains from the sale of a foreign security. Foreign income or capital gains subject to foreign withholding taxes are recorded net of the applicable withholding tax.
For certain securities, including a real estate investment trust
of investments and/or realized gain (referred to as a return of
pays as long-term capital gains. Such distributions are based on estimates if actual amounts are not available. Actual distributions of income, long-term capital gain and return of capital may differ from the estimated amounts. A Fund will recharacterize the estimated amounts of the components of distributions as necessary, once the issuers provide information about the actual composition of the distributions. Any portion of a distribution deemed a return of capital is generally not taxable to a Fund.
A Fund records as dividend income the amount characterized as ordinary income and records as realized gain the amount
return of capital is a reduction to the cost of investments in the Statements of Assets and Liabilities if the security is still held; otherwise it is recorded as an adjustment to realized gains (losses) from transactions in investment securities in
(i) Distributions to Shareholders
Distributions from net investment income, if any, are declared
gains, if any, are declared and distributed at least annually. All distributions are recorded on the ex-dividend date.
Dividends and distributions to shareholders are determined in accordance with federal income tax regulations, which may differ
either permanent or temporary. Permanent differences are
for federal income tax purposes; temporary differences do not
upon the NAV of a Fund. Any distribution in excess of current
purposes is reported as a return of capital distribution.
(j) Federal Income Taxes
each year as, a “regulated investment company” ("RIC") by
Internal Revenue Code of 1986 (the "Code"), as amended, and to make distributions of net investment income and net
substantially all, federal income taxes. The aforementioned distributions may be made in cash or via consent dividends. Consent dividends, when authorized, become taxable to the shareholders as if they were paid in cash.
only if it is more likely than not that the position is sustainable, based solely on its technical merits and consideration of the
be taken in the course of preparing tax returns to determine whether it is more likely than not (i.e., greater than 50 percent) that each tax position will be sustained upon examination by a
taxing authority. The Funds are not aware of any tax positions for which it is reasonably possible that the total amounts of
twelve months.
returns in various foreign jurisdictions in which they invest. Generally, a Fund is subject to examinations by such taxing
the tax period.
(k) Allocation of Expenses, Income and Gains and Losses
proportionally among various or all series of the Trust. Income, fund level expenses, and realized and unrealized gains or losses are allocated to each class of shares of a Fund based on the value of the outstanding shares of that class relative to the
daily business affairs of the Funds in accordance with policies and procedures established by the Board of Trustees. NFA has selected the subadviser for each Fund as noted below, and provides investment management evaluation services in monitoring, on an ongoing basis, the performance of the subadvisers.
Fund SubadviserBond Index BlackRock Investment Management, LLC ("BlackRock")International Index BlackRockMid Cap Index BlackRockS&P 500 Index BlackRockSmall Cap Index BlackRock
to the following schedule.
Fund Fee ScheduleAdvisory Fee (annual rate)
Bond Index 0.195%0.155%0.145%
International Index 0.245%0.205%0.195%
Mid Cap Index 0.205%0.185%0.175%
S&P 500 Index 0.125%0.105%0.095%
Small Cap Index 0.19%0.17%0.16%
expense limitation agreement described below, were as follows:
FundEffective Advisory
Fee Rate Bond Index 0.18 %International Index Mid Cap Index 0.20 S&P 500 Index 0.11 Small Cap Index 0.19
connection with the purchase and sales of portfolio securities, short sale dividend expenses, Rule 12b-1 fees, fees paid pursuant to an Administrative Services Plan, excludable sub administration fees, other expenditures which are capitalized in accordance
2022.f
Fund ClassesAmount
(annual rate)Bond Index All Classes 0.29%International Index All ClassesMid Cap Index All ClassesS&P 500 Index All Classes 0.21%Small Cap Index All Classes 0.28%
advisory fees waived or other expenses reimbursed by NFA
exceed three years from the month in which the corresponding waiver or reimbursement to the Fund was made. However,
exceed $100 million and (ii) the total annual expense ratio of the class making such reimbursement is no higher than the
amount of the expense limitation that was in place at the time NFA waived the fees or reimbursed the expenses and does not cause the expense ratio to exceed the current expense limitation. Reimbursement by a Fund of amounts previously waived or reimbursed by NFA is not permitted except as
Limitation Agreement may be changed or eliminated only with the consent of the Board of Trustees.
fees or reimbursed expenses to certain Funds are:
FundFiscal Year 2018
AmountFiscal Year 2019
AmountFiscal Year 2020
Amount
Six Months Ended June 30, 2021
Amount TotalBond Index $ — $ — $ — $ — $ — International Index — — — — — Mid Cap Index — — — — — S&P 500 Index — — — — — Small Cap Index 28,464 6,125 — 45,424 Amounts designated as "—" are zero or have been rounded to zero.
Agreement.
NFM, a wholly owned subsidiary of NFS Distributors, Inc. (“NFSDI”) (a wholly owned subsidiary of NFS), provides
various administrative and accounting services for the Funds and serves as Transfer and Dividend Disbursing Agent for the Funds. NFM has entered into agreements with third-party service providers to provide certain sub-administration and sub-transfer agency services to the Funds. NFM pays the service providers a fee for these services.
sum of the following: (i) the amount payable by NFM to its sub-administrator and sub-transfer agent; and (ii) a percentage of the combined average daily net assets of the Trust and Nationwide Mutual Funds ("NMF"), a Delaware statutory trust and registered
Combined Fee Schedule0.025%
$25 billion and more 0.020%
Fund Administration and Transfer Agency Agreement.
In addition, the Trust pays out-of-pocket expenses reasonably incurred by NFM in providing services to the Funds and the Trust, including, but not limited to, the cost of pricing services that NFM utilizes.
Agency Agreement and a letter agreement between NFM and the Trust, the Trust has agreed to reimburse NFM for certain
the series of the Trust based upon their relative net assets.
of shares of the Funds. NFD is a wholly owned subsidiary of NFSDI. These fees are based on average daily net assets of the respective class of the Funds at an annual rate as listed in the following table.
FundClass II Shares
Class VIII Shares
Bond Index 0.25% N/AInternational Index 0.25% 0.40%Mid Cap Index 0.25% N/AS&P 500 Index 0.25% N/ASmall Cap Index 0.25% N/AN/A - Not Applicable.
FundDistribution Fee Waiver
(Annual Rate)International Index 0.05%
pay fees to servicing organizations, such as broker-dealers,
administrative support services to the shareholders of certain classes. These services may include, but are not limited to, the following: (i) establishing and maintaining shareholder accounts; (ii) processing purchase and redemption transactions;
(iii) arranging bank wires; (iv) performing shareholder sub-
(vi) other such services. These fees are calculated at an annual rate of up to 0.25% of the average daily net assets of Class I, Class II, and Class VIII shares of the Fund and up to 0.20% of the average daily net assets of Class IV shares of each Fund.
Fund Class I Class II Class IV Class VIIIBond Index 0.15 % N/A N/A N/A International Index 0.15 0.12 % N/A 0.15 %Mid Cap Index 0.15 0.10 N/A N/A S&P 500 Index 0.15 0.15 0.10 % N/A Small Cap Index N/A 0.15 N/A N/A
N/A — Not Applicable.
The Trust and NFS have entered into a written contract waiving administrative services fees of the Funds according to the following
FundClass I Shares
Class II Shares
S&P 500 Index 0.07% 0.07%Small Cap Index N/A 0.07%N/A - Not Applicable.
Fund AmountBond Index $ 244,857 International Index Mid Cap Index 611,876 S&P 500 Index 1,447,925 Small Cap Index
not be entitled to reimbursement by the Funds for any amount waived, were as follows:
Fund AmountS&P 500 Index $622,640Small Cap Index
executed by certain Funds pursuant to procedures adopted by the Board of Trustees of the Funds to ensure compliance with Rule 17a-7 under the 1940 Act (the “Procedures”). In general, cross trading is the buying or selling of portfolio securities
between a Fund and other series of the Trust, or between a Fund and other series of NMF. The Board of Trustees determines
effected in compliance with the Procedures.
which resulted in net realized gain (loss), as applicable, were as follows:
FundPurchases
at CostSales
ProceedsNet Realized
Gain/LossMid Cap Index $ $ $ S&P 500 Index – – Small Cap Index Amounts designated as "—" are zero or have been rounded to zero.
J
Bond Index
Security DescriptionShares/Principal at June 30, 2021
Market Value December 31,
2020 ($)
Purchases at Cost ($)
Proceeds from Sales
($)
Net Realized Gains (Losses)
($)Amortization(a)
($)
Change in Unrealized
Appreciation/ (Depreciation)
($)
Market Value June 30, 2021
($)
Dividend/Interest Income
($)
Capital Gain Distributions
($)Nationwide Financial
Services, Inc. 105,000 125,476 — — — 228 129,675 —
(a) Amortization is included in Dividend/Interest Income.
5. Line of Credit and Interfund Lending
The Trust and NMF (together, the “Trusts”) have entered into a credit agreement with JPMorgan, The Bank of New
“Lenders”), permitting the Trusts, in aggregate, to borrow up to $100,000,000. Advances taken by a Fund under this arrangement would be primarily for temporary or emergency
on $100,000,000. Such commitment fee shall be payable
June, September and December and on the termination date. Borrowings under this arrangement accrue interest at a rate of 1.25% per annum plus the higher of (a) if ascertainable and
settling two business days after such day, (b) the Federal Funds
Funding Rate in effect on such day; provided, however, that if the Federal Funds Rate calculated in accordance with the foregoing shall be less than zero, such rate shall be deemed to be zero percent (0%) for the purposes of this Agreement.
of credit. In addition, a Fund may not draw any portion of the
and remedies of the Lenders provided by law, each Lender
has the right, upon any amount becoming due and payable by the Fund, to set-off as appropriate and apply all deposits and credits held by or owing to such Lender against such amount, subject to the terms of the credit agreement. The line of credit is renewed annually, and next expires on July 8, 2021. During the
under the line of credit.
program among Funds managed by NFA. The program allows the participating Funds to borrow money from and loan money to each other for temporary purposes, subject to the conditions
the interfund loan rate on that day is more favorable to both the borrowing and lending Funds as compared to rates available through short-term bank loans or investments in overnight repurchase agreements and money market funds, respectively,
the program only if and to the extent that such participation is consistent with its investment objectives and limitations. Interfund loans have a maximum duration of seven days and may be called on one business day's notice. During the six
interfund lending.
6. Investment Transactions
Fund Purchases SalesBond Index $ 1,084,752,802 $ 1,271,708,165 International Index 72,655,864 Mid Cap Index S&P 500 Index 114,099,748 Small Cap Index 79,622,157
were as follows:
Fund Purchases SalesBond Index $158,051,471
7. Portfolio Investment Risks
Risks Associated with Interest Rates
interest rates decline and decrease when interest rates increase. Prices of longer-term securities generally change more in response to interest rate changes than prices of shorter-term securities. To the extent a Fund invests a substantial portion of
rising interest rates are more likely to cause the value of the
Risks Associated with Foreign Securities and Currencies Investments in securities of foreign issuers carry certain risks
future disruptive political and economic developments and the possible imposition of exchange controls or other unfavorable foreign government laws and restrictions. In addition, investments in certain countries may carry risks of expropriation
diplomatic developments that adversely affect investments in those countries.
Certain countries also may impose substantial restrictions on investments in their capital markets by foreign entities, including restrictions on investments in issuers in industries deemed sensitive to relevant national interests. These factors may limit the investment opportunities available and result in a
of issuers from developing countries.
Risks Associated with Variable Rate Securities — Mortgage-backed securities
receive a portion of principal and/or interest payments made on a pool of residential or commercial mortgage loans. Such
agencies or instrumentalities or may be issued by private issuers, generally originators in mortgage loans, including savings and loan associations, mortgage bankers, commercial banks, investment bankers, and special purpose entities. Adjustable rate mortgage-backed securities are collateralized by or represent interests in mortgage loans with variable rates of interest. These variable rates of interest reset periodically to
from increases in interest rates to the extent that interest rates rise to the point where they cause the current coupon of the underlying adjustable rate mortgages to exceed any maximum allowable annual or lifetime reset limits (or “cap rates”) for a particular mortgage. During periods of declining interest rates, income to the Fund derived from adjustable rate mortgage-backed securities which remain in a mortgage pool
backed securities, which will remain constant. Adjustable rate mortgages also have less potential for appreciation in value as
— Asset-backed securities are
established for the purpose of issuing securities and holding certain assets, such as credit card receivables or auto leases,
may be used to create an asset-backed security, including
swaps. Payments or distributions of principal and interest on asset-backed securities may be supported by nongovernmental credit enhancements similar to those utilized in connection with
assets underlying such securities, how well the entity issuing the security is insulated from the credit risk of the originator
of any credit enhancement of the securities. To the extent a
enforce the security interest as compared to mortgage-backed securities.
Collateralized Mortgage Obligations (“CMOs”) and
debt obligations which are collateralized by mortgage loans or
are interests in a trust composed of whole loans or private pass-throughscollateralized by Government National Mortgage Association
Ginnie Maes”), Federal National
Maes”), or Federal Home Loan Mortgage Corporation Pass-
collateralized by Mortgage Assets. Payments of principal and interest on the Mortgage Assets, and any reinvestment income
make scheduled distributions on the multiclass pass-through
in, mortgage loans, including savings and loan associations, mortgage banks, commercial banks, investment banks and special purpose subsidiaries of the foregoing. In order to form a
backed pass-through securities, or actual mortgage loans, and
distribution date. Principal prepayments on the Mortgage
and particularly during periods of rapid or unanticipated
classes and the ability of the structure to provide the anticipated
changes can result in volatility in the market value, and in some
Stripped Mortgage Securities — Stripped mortgage securities are derivative multiclass mortgage securities. Stripped mortgage securities are structured with two or more classes of securities that receive different proportions of the interest and principal distributions on a pool of mortgage assets. A common type of stripped mortgage security will have at least one class receiving only a small portion of the interest and a larger portion of the principal from the mortgage assets, while the other class will receive primarily interest and only a small portion of the principal. In the most extreme case, one class will receive
securities that are purchased at a substantial premium or discount generally are extremely sensitive not only to changes in prevailing interest rates but also to the rate of principal payments (including prepayments) on the related underlying mortgage assets, and a rapid rate of principal payments may
maturity. If the underlying mortgage assets experience greater than anticipated prepayments of principal, the Fund may fail to fully recoup its initial investment in these securities even if the securities have received the highest rating by a nationally recognized statistical rating organization.
Collateralized Debt Obligations (“CDOs”)type of asset-backed security and include, among other things,
is a trust typically collateralized by a pool of loans, which may include, among others, domestic and foreign senior secured loans, senior unsecured loans and subordinate corporate loans, including loans that may be rated below investment
registered under the securities laws. As a result, investments in
In addition to the risks associated with debt instruments (e.g.,
including, but not limited to: (i) the possibility that distributions
in value or default; (iii) the possibility that the Fund may invest
complex structure of the security may not be fully understood at the time of investment and may produce disputes with the issuer or unexpected investment results.
Risks Associated with REIT and Real Estate Investments
risks associated with direct ownership of real estate and with the real estate industry in general. These risks include possible declines in the value of real estate, possible lack of availability of mortgage funds, unexpected vacancies of properties, and the
TBA Commitments TBA commitments are forward agreements for the purchase
payment and delivery on an agreed upon future settlement date.
terms, including issuer, rate, and mortgage terms. When entering into TBA commitments, the Fund may take possession of or deliver the underlying mortgage-backed securities but can extend the settlement or roll the transaction. TBA commitments involve a risk of loss if the value of the security to be purchased or sold declines or increases, respectively, prior to settlement date.
certain liabilities arising out of the performance of their duties to
enters into contracts with its vendors and others that provide for
these arrangements is unknown, as this would involve future claims made against the Trust. Based on experience, however, the Trust expects the risk of loss to be remote.
9. New Accounting Pronouncements and Other Matters
stability of the repurchase market on which the rate is based.
2018. Markets are slowly developing in response to these new
change in rates, and how to appropriately adjust these rates at the time of transition, poses risks for the Fund. These risks are likely to persist until new reference rates and fallbacks for both legacy and new instruments and contracts are commercially accepted and market practices become settled. Management is currently evaluating the implications of the change and
10. Federal Tax Information
(depreciation) for each Fund was as follows:
FundTax Cost of Investments
Unrealized Appreciation
Unrealized Depreciation
Net Unrealized Appreciation/ (Depreciation)
Bond Index $ 2,266,492,685 $ $ (10,002,079 ) $ 114,685,225 International Index 1,517,141,828 717,745,717 (115,419,768 ) Mid Cap Index 1,089,685,076 S&P 500 Index 1,882,485,917 (62,181,902 ) Small Cap Index
The global pandemic outbreak of an infectious respiratory
has resulted in substantial market volatility and global business
restrictions, closed international borders, enhanced health screenings at ports of entry and elsewhere, disruption of and delays in healthcare service preparation and delivery,
operations, market closures, cancellations and restrictions, supply chain disruptions, lower consumer demand, and
as well as general concern and uncertainty. Instability in the
on attractive terms or at all. In particular, because of the current conditions in the credit markets, borrowers may be subject to increased interest expenses for borrowed money and
tightening underwriting standards. In addition, stock prices as well as yield could be negatively impacted to the extent that
of dividends or share buybacks.
national and local economic activity, and constrain access to capital and other sources of funding. Various recent government interventions have been aimed at curtailing the distress to
be no guarantee that these or other economic stimulus plans
currently unknown, which may exacerbate the other risks that apply to a Fund and could negatively affect Fund performance and the value of your investment in a Fund.
12. Subsequent Events
7, 2022. The renewed credit agreement provides for a similar arrangement that was effective during the six months ended
Interfund Lending”).
on the Funds and has determined that there are no additional
Nationwide LRMP disclosure
Rule 22e-4 under the Investment Company Act of 1940 (the
than money market funds) to adopt and implement a program
“Board”) has designated Nationwide Fund Management LLC (“NFM”) as the Program Administrator for each Fund. NFM
“LRMC”), composed of senior members from relevant groups in the Nationwide organization, to manage the Program for each of the Funds.
and procedures that provide for: (1) assessment, management,
procedures for addressing HLIM shortfalls, including reporting to the Board and, with respect to HLIM shortfalls lasting more
(on a non-public basis).
LRMC considers, as relevant, a variety of factors, including:
investments during both normal and reasonably foreseeable
projections for the Fund during both normal and reasonably
categories is based on the number of days it is reasonably expected to take to convert the investment to cash (for Highly
2021, the Program Administrator provided a written report to
2020. The report concluded that the Program is reasonably
has been implemented and is operating effectively.

This page intentionally left blank
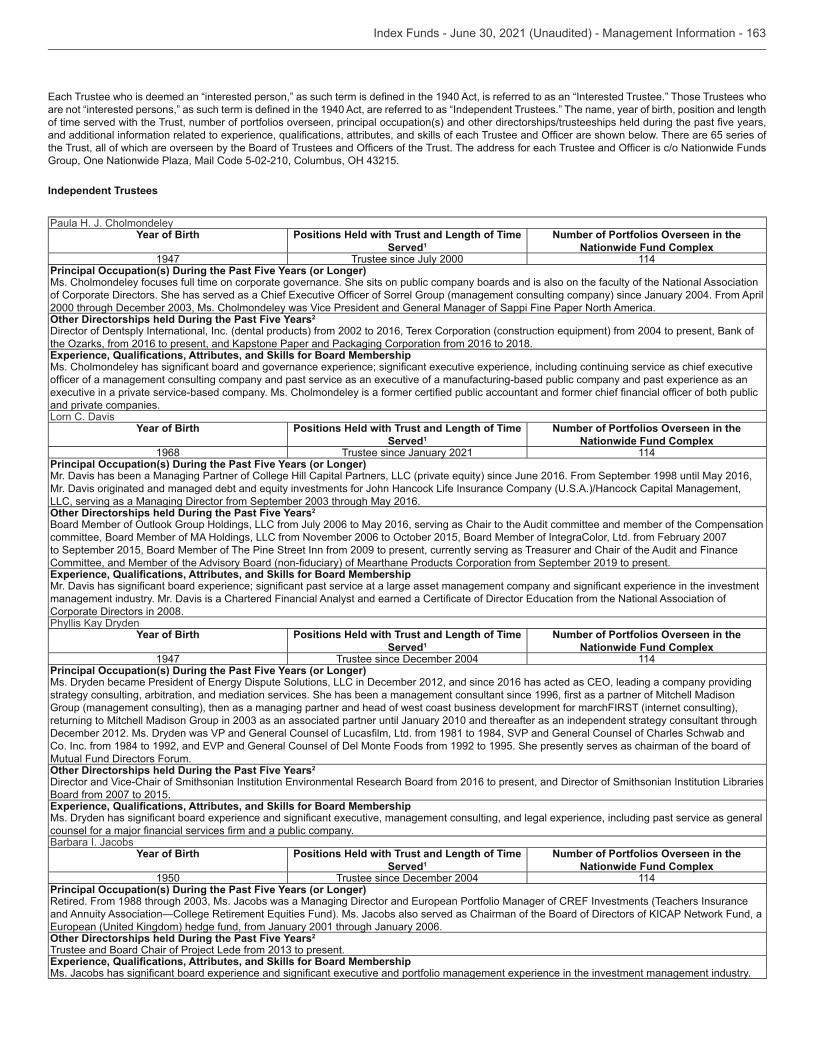
Independent Trustees
Paula H. J. CholmondeleyYear of Birth Positions Held with Trust and Length of Time
Served1 Number of Portfolios Overseen in the
Nationwide Fund Complex1947 Trustee since July 2000 114
Principal Occupation(s) During the Past Five Years (or Longer)Ms. Cholmondeley focuses full time on corporate governance. She sits on public company boards and is also on the faculty of the National Association
Other Directorships held During the Past Five Years2
and private companies.Lorn C. Davis
Year of Birth Positions Held with Trust and Length of Time Served1
Number of Portfolios Overseen in the Nationwide Fund Complex
1968 Trustee since January 2021 114Principal Occupation(s) During the Past Five Years (or Longer)
Other Directorships held During the Past Five Years2
to September 2015, Board Member of The Pine Street Inn from 2009 to present, currently serving as Treasurer and Chair of the Audit and Finance
Corporate Directors in 2008.
Year of Birth Positions Held with Trust and Length of Time Served1
Number of Portfolios Overseen in the Nationwide Fund Complex
1947 Trustee since December 2004 114Principal Occupation(s) During the Past Five Years (or Longer)
Group (management consulting), then as a managing partner and head of west coast business development for marchFIRST (internet consulting),
Mutual Fund Directors Forum.Other Directorships held During the Past Five Years2
Board from 2007 to 2015.
Barbara I. JacobsYear of Birth Positions Held with Trust and Length of Time
Served1Number of Portfolios Overseen in the
Nationwide Fund Complex1950 Trustee since December 2004 114
Principal Occupation(s) During the Past Five Years (or Longer)
Other Directorships held During the Past Five Years2
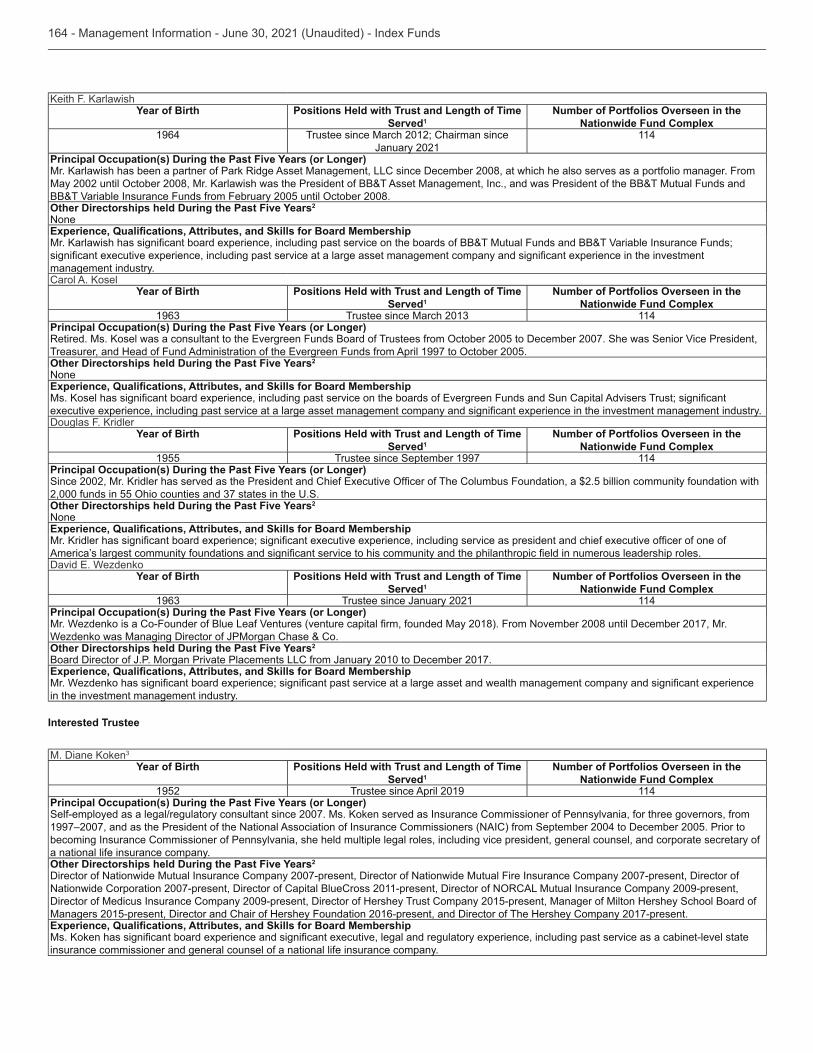
Year of Birth Positions Held with Trust and Length of Time Served1
Number of Portfolios Overseen in the Nationwide Fund Complex
1964 Trustee since March 2012; Chairman since January 2021
114
Principal Occupation(s) During the Past Five Years (or Longer)
Other Directorships held During the Past Five Years2
None
management industry.
Year of Birth Positions Held with Trust and Length of Time Served1
Number of Portfolios Overseen in the Nationwide Fund Complex
114Principal Occupation(s) During the Past Five Years (or Longer)
Other Directorships held During the Past Five Years2
None
Year of Birth Positions Held with Trust and Length of Time Served1
Number of Portfolios Overseen in the Nationwide Fund Complex
1955 Trustee since September 1997 114Principal Occupation(s) During the Past Five Years (or Longer)
Other Directorships held During the Past Five Years2
None
Year of Birth Positions Held with Trust and Length of Time Served1
Number of Portfolios Overseen in the Nationwide Fund Complex
Trustee since January 2021 114Principal Occupation(s) During the Past Five Years (or Longer)
Wezdenko was Managing Director of JPMorgan Chase & Co.Other Directorships held During the Past Five Years2
Board Director of J.P. Morgan Private Placements LLC from January 2010 to December 2017.
in the investment management industry.
Interested Trustee
Year of Birth Positions Held with Trust and Length of Time
Served1Number of Portfolios Overseen in the
Nationwide Fund Complex1952 Trustee since April 2019 114
Principal Occupation(s) During the Past Five Years (or Longer)
1997–2007, and as the President of the National Association of Insurance Commissioners (NAIC) from September 2004 to December 2005. Prior to becoming Insurance Commissioner of Pennsylvania, she held multiple legal roles, including vice president, general counsel, and corporate secretary of a national life insurance company.Other Directorships held During the Past Five Years2
Director of Nationwide Mutual Insurance Company 2007-present, Director of Nationwide Mutual Fire Insurance Company 2007-present, Director of
Director of Medicus Insurance Company 2009-present, Director of Hershey Trust Company 2015-present, Manager of Milton Hershey School Board of Managers 2015-present, Director and Chair of Hershey Foundation 2016-present, and Director of The Hershey Company 2017-present.
insurance commissioner and general counsel of a national life insurance company.
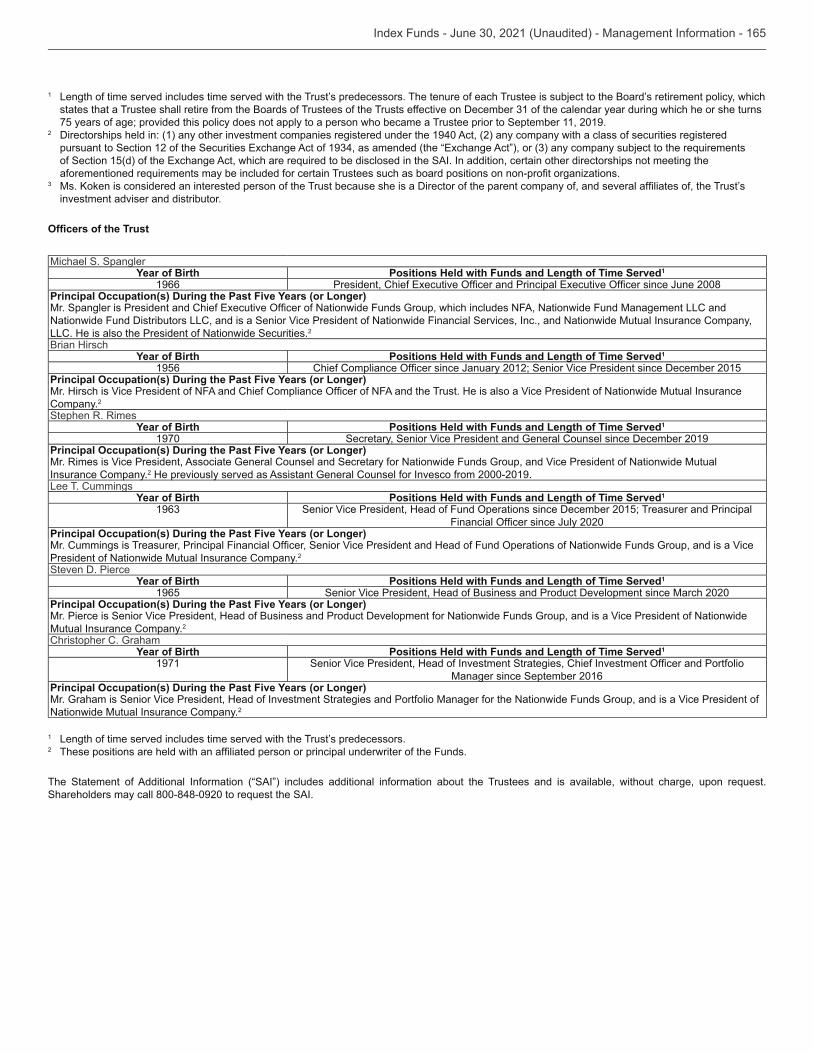
1
75 years of age; provided this policy does not apply to a person who became a Trustee prior to September 11, 2019.2 Directorships held in: (1) any other investment companies registered under the 1940 Act, (2) any company with a class of securities registered
investment adviser and distributor.
Michael S. SpanglerYear of Birth Positions Held with Funds and Length of Time Served1
1966Principal Occupation(s) During the Past Five Years (or Longer)
Nationwide Fund Distributors LLC, and is a Senior Vice President of Nationwide Financial Services, Inc., and Nationwide Mutual Insurance Company, LLC. He is also the President of Nationwide Securities.=
2
Brian HirschYear of Birth Positions Held with Funds and Length of Time Served1
1956Principal Occupation(s) During the Past Five Years (or Longer)
Company.=
2
Stephen R. RimesYear of Birth Positions Held with Funds and Length of Time Served1
1970 Secretary, Senior Vice President and General Counsel since December 2019Principal Occupation(s) During the Past Five Years (or Longer)Mr. Rimes is Vice President, Associate General Counsel and Secretary for Nationwide Funds Group, and Vice President of Nationwide Mutual Insurance Company.=
2 He previously served as Assistant General Counsel for Invesco from 2000-2019.Lee T. Cummings
Year of Birth Positions Held with Funds and Length of Time Served1
Principal Occupation(s) During the Past Five Years (or Longer)
President of Nationwide Mutual Insurance Company.=
2
Steven D. PierceYear of Birth Positions Held with Funds and Length of Time Served1
1965 Senior Vice President, Head of Business and Product Development since March 2020Principal Occupation(s) During the Past Five Years (or Longer)Mr. Pierce is Senior Vice President, Head of Business and Product Development for Nationwide Funds Group, and is a Vice President of Nationwide Mutual Insurance Company.=
2
Christopher C. GrahamYear of Birth Positions Held with Funds and Length of Time Served1
1971Manager since September 2016
Principal Occupation(s) During the Past Five Years (or Longer)Mr. Graham is Senior Vice President, Head of Investment Strategies and Portfolio Manager for the Nationwide Funds Group, and is a Vice President of Nationwide Mutual Insurance Company.=
2
1
2
Bloomberg Barclays U.S. Aggregate Total Return Index (USD):denominated investment grade bond market, including investment grade government bonds, investment grade corporate bonds, mortgage pass through securities, commercial mortgage backed securities and asset backed securities that are publicly for sale
Bloomberg Barclays U.S. Aggregate Bond Index:
commercial mortgage-backed securities (agency and non-agency).
Bloomberg Barclays U.S. Corporate High Yield 2% Issuer Capped Index: An unmanaged index that measures the performance of high-yield corporate bonds, with a maximum allocation of 2% to any one issuer.
An unmanaged index that measures the performance of
related issues, and corporates.
IndexSM: An index that measures the performance of
A market value-weighted index comprising agency mortgage-backed pass-through securities of the Government National Mortgage Association (Ginnie Mae), the Federal National Mortgage Association (Fannie Mae), and the Federal Home Loan Mortgage Corporation (Freddie Mac) with a minimum $150 million par amount outstanding and a weighted-average maturity of at least 1 year.
Bloomberg Barclays U.S. Government/Mortgage Index:
An unmanaged, market capitalization-
®): An unmanaged, market capitalization-weighted index that
Citigroup World Government Bond Index (WGBI) (Unhedged): An unmanaged, market capitalization-weighted index that is not
Note about Citigroup Indexes
Dow Jones U.S. Select Real Estate Securities IndexSM (RESI): An unmanaged index that measures the performance of publicly
FTSE World ex US Index:
FTSE World Index:
®
ICE BofA An unmanaged, one-security index, rebalanced monthly, that
ICE BofA Merrill Lynch Global High Yield Index (USD Hedged): An unmanaged, market capitalization-weighted index that gives
ICE BofA Merrill Lynch Global High Yield Index: An unmanaged, market capitalization-weighted index that gives a broad-based
Source
iMoneyNet Money Fund Average™ Government All Index: An average of government money market funds. Government
notes, and include both retail and institutional funds.
dollar-denominated sovereign bonds issued by emerging market countries as selected by JPMorgan.
J.P. Morgan MozaicSM Index (Series F): A rules-based, dynamic index that tracks the total return of a global mix of asset classes,
rebalances monthly in an effort to capture the continued performance of asset classes that have exhibited the highest recent returns.
Note about JPMorgan Indexes
Morningstar® Lifetime Allocation Indexes: A series of unmanaged, multi-asset-class indexes designed to benchmark target-
asset allocation of the indexes is based on the Lifetime Asset Allocation methodology developed by Ibbotson Associates, a Morningstar company.
Morningstar® Target Risk Indexes:to aggressive. The securities selected for the asset allocation indexes are driven by the rules-based indexing methodologies that power Morningstar's comprehensive index family.
• Aggressive Target Risk Index• Moderately Aggressive Target Risk Index• Moderate Target Risk Index• Moderately Conservative Target Risk Index• Conservative Target Risk Index
MSCI ACWI®:of large-cap and mid-cap stocks in global developed and emerging markets as determined by MSCI.
MSCI ACWI® ex USA:performance of large-cap and mid-cap stocks in global developed and emerging markets as determined by MSCI; excludes the
MSCI ACWI® ex USA Growth:measure the performance of large-cap and mid-cap growth stocks in global developed and emerging markets as determined by
MSCI EAFE® Index:
Canada.
MSCI World ex USA IndexSM:
market capitalization in each country. DM countries include: Australia, Austria, Belgium, Canada, Denmark, Finland, France,
MSCI World IndexSM:performance of large-cap and mid-cap stocks in global developed markets as determined by MSCI.
MSCI EAFE® Small Cap Index:
Canada.
MSCI EAFE® Value Index:
and Canada.
MSCI Emerging Markets® Index:measure the performance of large-cap and mid-cap stocks in emerging-country markets as determined by MSCI.
Note about MSCI Indexes
NYSE Arca Tech 100 Index: A price-weighted index composed of common stocks and American Depository Receipts (“ADRs”
Russell 1000® Index:
Russell 1000® Growth Index: An unmanaged index that measures the performance of the large-capitalization growth segment ® Index companies with higher price-to-book ratios and higher forecasted
growth values.
Russell 1000® Value Index: An unmanaged index that measures the performance of the large-capitalization value segment of the ® Index companies with lower price-to-book ratios and lower forecasted growth
values.
Russell 2000® Growth Index: An unmanaged index that measures the performance of the small-capitalization growth segment ® Index companies with higher price-to-book ratios and higher forecasted
growth values.
Russell 2000® Index:universe.
Russell 2000® Value Index: An unmanaged index that measures the performance of the small-capitalization value segment of the ® Index companies with lower price-to-book ratios and lower forecasted growth
values.
Russell 2500TM Growth Index: An unmanaged index that measures the performance of the small to mid-cap growth segment of
Russell 3000® Growth Index:show signs of above-average growth.
Russell 3000® Index:
Russell Midcap® Growth Index: An unmanaged index that measures the performance of the mid-capitalization growth segment ® Index companies with higher price-to-book ratios and higher forecasted
growth values.
Russell Midcap® Value Index: An unmanaged index that measures the performance of the mid-capitalization value segment of ® Index companies with lower price-to-book ratios and lower forecasted
growth values.
Note about Russell Indexes
such funds or securities or any index on which such funds or securities are based. Russell®
S&P 500® Index:
S&P MidCap 400® (S&P 400) Index:companies (those with a market capitalization of $1.4 billion to $5.9 billion).
S&P North American Technology Sector IndexTM: ® information technology sector as well as internet & direct marketing retail, interactive home entertainment, and interactive media & services sub-industries.
S&P Target Date® To Indexes: A series of 12 unmanaged, multi-asset class indexes consisting of the Retirement Income Index
subset of target date funds, each of which generally has an asset allocation mix and glide path featuring relatively conservative
retirement date.
Note about S&P Indexes

This page intentionally left blank

P.O. Box 701 Milwaukee, WI 53201-0701nationwide.com/mutualfunds
NSAR-IDX (8-21)