Findings from a Nationwide Study on Alcohol Consumption ...
11
Citation: Robert Lourdes, T.G.; Abd Hamid, H.A.; Riyadzi, M.R.; Rodzlan Hasani, W.S.; Abdul Mutalip, M.H.; Abdul Jabbar, N.; Mat Rifin, H.; Saminathan, T.A.; Ismail, H.; Mohd Yusoff, M.F. Findings from a Nationwide Study on Alcohol Consumption Patterns in an Upper Middle-Income Country. Int. J. Environ. Res. Public Health 2022, 19, 8851. https://doi.org/10.3390/ ijerph19148851 Academic Editors: Elisardo Becoña Iglesias and Zubair Kabir Received: 27 May 2022 Accepted: 12 July 2022 Published: 21 July 2022 Publisher’s Note: MDPI stays neutral with regard to jurisdictional claims in published maps and institutional affil- iations. Copyright: © 2022 by the authors. Licensee MDPI, Basel, Switzerland. This article is an open access article distributed under the terms and conditions of the Creative Commons Attribution (CC BY) license (https:// creativecommons.org/licenses/by/ 4.0/). International Journal of Environmental Research and Public Health Article Findings from a Nationwide Study on Alcohol Consumption Patterns in an Upper Middle-Income Country Tania Gayle Robert Lourdes 1, * , Hamizatul Akmal Abd Hamid 1 , Mohd Ruhaizie Riyadzi 1 , Wan Shakira Rodzlan Hasani 1 , Mohd Hatta Abdul Mutalip 1 , Norli Abdul Jabbar 2 , Halizah Mat Rifin 1 , Thamil Arasu Saminathan 1 , Hasimah Ismail 1 and Muhammad Fadhli Mohd Yusoff 1 1 Institute for Public Health, National Institutes of Health, Ministry of Health Malaysia, Shah Alam 40170, Malaysia; [email protected] (H.A.A.H.); [email protected] (M.R.R.); [email protected] (W.S.R.H.); [email protected] (M.H.A.M.); halizah.matrifi[email protected] (H.M.R.); [email protected] (T.A.S.); [email protected] (H.I.); [email protected] (M.F.M.Y.) 2 Disease Control Division, Ministry of Health Malaysia, Putrajaya 62590, Malaysia; [email protected] * Correspondence: [email protected] Abstract: Alcohol consumption is a risk factor for various diseases, especially non-communicable diseases (NCDs) and injuries. The reduction of the harmful use of alcohol is mentioned in Target 3.5 of the Sustainable Developmental Goals (SDG). This study aimed to determine factors associated with current alcohol drinking among Malaysians aged 15 years and above. Data from the National Health and Morbidity Survey (NHMS) 2019, a cross-sectional nationwide survey using a two-stage stratified random sampling design, was used. Current alcohol drinking was defined as having consumed any alcoholic beverage in the past 12 months. Descriptive statistics and multiple logistic regression analysis were employed. The prevalence of current drinkers was 11.5%; 95% CI: 9.8, 13.5. The majority (65%) consumed alcoholic beverages in Category 2, which is mainly beer. Current drinkers consumed alcohol mostly once a month (59.0%), one or two drinks (71.1%), on a typical day. Most respondents had six or more drinks less than once a month (27.6%). Sex, age, ethnicity, education, employment, and smoking were found to be significantly associated with current alcohol drinking. Marital status, locality of residence, and household income were not significantly associated. Alcohol drinking is a problem among certain vulnerable groups and should be tackled appropriately. Keywords: alcohol drinkers; above 15 years; NHMS; Malaysia 1. Introduction The harmful use of alcohol, which includes binge drinking and heavy episodic drink- ing (HED), not only causes health and social consequences for the drinker but also for the family and society at large. The Sustainable Developmental Goals (SDGs) in health Target 3.5 (“Strengthen the prevention and treatment of substance abuse, including narcotic drug abuse and harmful use of alcohol”) particularly emphasize the harmful use of alco- hol [1]. Alcohol consumption is undoubtedly a risk factor for non-communicable diseases (NCDs) [2]. The Global Action Plan for the Prevention and Control of Non-communicable Diseases (2013–2020) reported that the harmful use of alcohol is one of the four behavioral risk factors (tobacco use, unhealthy diet, physical inactivity, alcohol use) for three major NCDs (cardiovascular disease, cancer, chronic respiratory disease) [3]. A vast number of other diseases and injuries are also attributed to drinking alcohol, including alcohol dependence, liver cirrhosis, injuries due to violence, suicides, and road traffic accidents [1]. The attributable disability-adjusted life years (DALYs) were highest for tobacco smoking (170.9 million DALYs), followed by alcohol (85.0 million), and illicit drugs (27.8 million) [4]. According to a recent meta-analysis, there was evidence that a reduction Int. J. Environ. Res. Public Health 2022, 19, 8851. https://doi.org/10.3390/ijerph19148851 https://www.mdpi.com/journal/ijerph
-
Upload
khangminh22 -
Category
Documents
-
view
0 -
download
0
Transcript of Findings from a Nationwide Study on Alcohol Consumption ...
Citation: Robert Lourdes, T.G.; Abd
Hamid, H.A.; Riyadzi, M.R.; Rodzlan
Hasani, W.S.; Abdul Mutalip, M.H.;
Abdul Jabbar, N.; Mat Rifin, H.;
Saminathan, T.A.; Ismail, H.; Mohd
Yusoff, M.F. Findings from a
Nationwide Study on Alcohol
Consumption Patterns in an Upper
Middle-Income Country. Int. J.
Environ. Res. Public Health 2022, 19,
8851. https://doi.org/10.3390/
ijerph19148851
Academic Editors: Elisardo Becoña
Iglesias and Zubair Kabir
Received: 27 May 2022
Accepted: 12 July 2022
Published: 21 July 2022
Publisher’s Note: MDPI stays neutral
with regard to jurisdictional claims in
published maps and institutional affil-
iations.
Copyright: © 2022 by the authors.
Licensee MDPI, Basel, Switzerland.
This article is an open access article
distributed under the terms and
conditions of the Creative Commons
Attribution (CC BY) license (https://
creativecommons.org/licenses/by/
4.0/).
International Journal of
Environmental Research
and Public Health
Article
Findings from a Nationwide Study on Alcohol ConsumptionPatterns in an Upper Middle-Income CountryTania Gayle Robert Lourdes 1,* , Hamizatul Akmal Abd Hamid 1 , Mohd Ruhaizie Riyadzi 1,Wan Shakira Rodzlan Hasani 1, Mohd Hatta Abdul Mutalip 1 , Norli Abdul Jabbar 2, Halizah Mat Rifin 1 ,Thamil Arasu Saminathan 1 , Hasimah Ismail 1 and Muhammad Fadhli Mohd Yusoff 1
1 Institute for Public Health, National Institutes of Health, Ministry of Health Malaysia,Shah Alam 40170, Malaysia; [email protected] (H.A.A.H.); [email protected] (M.R.R.);[email protected] (W.S.R.H.); [email protected] (M.H.A.M.);[email protected] (H.M.R.); [email protected] (T.A.S.); [email protected] (H.I.);[email protected] (M.F.M.Y.)
2 Disease Control Division, Ministry of Health Malaysia, Putrajaya 62590, Malaysia; [email protected]* Correspondence: [email protected]
Abstract: Alcohol consumption is a risk factor for various diseases, especially non-communicablediseases (NCDs) and injuries. The reduction of the harmful use of alcohol is mentioned in Target 3.5of the Sustainable Developmental Goals (SDG). This study aimed to determine factors associated withcurrent alcohol drinking among Malaysians aged 15 years and above. Data from the National Healthand Morbidity Survey (NHMS) 2019, a cross-sectional nationwide survey using a two-stage stratifiedrandom sampling design, was used. Current alcohol drinking was defined as having consumedany alcoholic beverage in the past 12 months. Descriptive statistics and multiple logistic regressionanalysis were employed. The prevalence of current drinkers was 11.5%; 95% CI: 9.8, 13.5. Themajority (65%) consumed alcoholic beverages in Category 2, which is mainly beer. Current drinkersconsumed alcohol mostly once a month (59.0%), one or two drinks (71.1%), on a typical day. Mostrespondents had six or more drinks less than once a month (27.6%). Sex, age, ethnicity, education,employment, and smoking were found to be significantly associated with current alcohol drinking.Marital status, locality of residence, and household income were not significantly associated. Alcoholdrinking is a problem among certain vulnerable groups and should be tackled appropriately.
Keywords: alcohol drinkers; above 15 years; NHMS; Malaysia
1. Introduction
The harmful use of alcohol, which includes binge drinking and heavy episodic drink-ing (HED), not only causes health and social consequences for the drinker but also forthe family and society at large. The Sustainable Developmental Goals (SDGs) in healthTarget 3.5 (“Strengthen the prevention and treatment of substance abuse, including narcoticdrug abuse and harmful use of alcohol”) particularly emphasize the harmful use of alco-hol [1]. Alcohol consumption is undoubtedly a risk factor for non-communicable diseases(NCDs) [2]. The Global Action Plan for the Prevention and Control of Non-communicableDiseases (2013–2020) reported that the harmful use of alcohol is one of the four behavioralrisk factors (tobacco use, unhealthy diet, physical inactivity, alcohol use) for three majorNCDs (cardiovascular disease, cancer, chronic respiratory disease) [3].
A vast number of other diseases and injuries are also attributed to drinking alcohol,including alcohol dependence, liver cirrhosis, injuries due to violence, suicides, and roadtraffic accidents [1]. The attributable disability-adjusted life years (DALYs) were highest fortobacco smoking (170.9 million DALYs), followed by alcohol (85.0 million), and illicit drugs(27.8 million) [4]. According to a recent meta-analysis, there was evidence that a reduction
Int. J. Environ. Res. Public Health 2022, 19, 8851. https://doi.org/10.3390/ijerph19148851 https://www.mdpi.com/journal/ijerph

Int. J. Environ. Res. Public Health 2022, 19, 8851 2 of 11
of alcohol consumption among those who drank more than two drinks a day significantlyreduced their blood pressure [5].
Several socio-demographic factors have an influence on alcohol consumption since itis very much related to social culture. Males and smokers were more likely to consumealcohol according to findings from a study done among university students in Myanmar [6].This group was also more likely to binge drink [7]. A couple of studies found that age,ethnicity, gender, education levels, income, employment, and locality of residence weresignificantly associated with current drinking [8,9].
With an expected overall growth of 176 percent from 2000 to 2019, Asia has the fastest-growing alcohol market, accounting for nearly 30 percent of worldwide alcohol sales in2014. China and India are leading the rise with rates of 382 percent and 1245 percent,respectively [10]. Malaysia, along with Indonesia which is also a Muslim majority country,undoubtedly have a low global average for alcohol consumption [11]. However, there arecertain ethnicities such as Chinese and Bumiputera Sabah and Sarawakians [12–14] whohave rather higher consumptions of alcohol and risky drinking patterns compared to otherethnicities in Malaysia. A local study among millennials found that binge drinking posed anincreased association with a number of behavioral risk factors and harmful alcohol-relatedoutcomes [7].
In Malaysia, alcohol consumption reduction is targeted on its harmful use and isnot aimed at any particular community. Therefore, this paper aims to showcase andstrengthen current evidence on the factors associated with alcohol drinking in Malaysia,which includes socio-demographic characteristics of current drinkers, types of alcoholicbeverages consumed, and frequencies of drinking.
2. Materials and Methods
Data from the National Health and Morbidity Survey (NHMS) 2019 were used in thisstudy. The NHMS is the largest nationwide health survey conducted in Malaysia by theInstitute for Public Health. This study, which examines a variety of community health-related subjects, is undertaken on a regular basis. In the NHMS, a two-stage stratifiedrandom sampling was used to ensure a nationally representative sample in terms ofgeography, socio-demographics, and economic diversity in Malaysia. The first stage ofsampling was the Enumeration Blocks (EBs), which formed the sampling frame. The secondstage of sampling was the Living Quarters (LQs). The selection of EBs was done within eachstate (primary stratum) and within urban or rural areas (secondary stratum) with assistancefrom the Department of Statistics Malaysia (DOSM). Malaysia consists of 13 states and3 federal territories. For this study, a total of 475 EBs were selected and 5676 LQs wereobtained from those EBs (12 LQs made up 1 EB). A total of 362 and 113 EBs were selectedfrom urban and rural areas, respectively [9]. Data collection was conducted between Julyto October 2019. The respondents who answered the Alcohol Consumption module inNHMS 2019 were all 13 years of age and above. However, for this study, sub-analysis forthose 15 years old and above (n = 11,111) was done to suit international definitions andstandards [1].
2.1. Tools
The study’s instrument was a self-administered standardized Adult Use DisordersIdentification Test (AUDIT) questionnaire. The AUDIT is a 10-item tool developed bythe World Health Organization (WHO) that assesses alcohol consumption, drinking be-havior, and alcohol related problems [15,16]. This questionnaire was made available infour languages to suit the local people: English, Bahasa Malaysia, Tamil, and Mandarin.Two screening questions on ever and current drinking were included before answering theAUDIT. Data on the respondents’ socio-demographic details, such as age, income, maritalstatus, level of education, and locality of residence, were also collected. In the AUDIT,each question has a set of possible responses, with a score ranging from 0–4 (items 1 to8 are scored on a 0–4 scale and items 9 and 10 are scored 0, 2, 4). A cut-off score of 8
Int. J. Environ. Res. Public Health 2022, 19, 8851 3 of 11
or more indicates a hazardous or harmful pattern of drinking [14]. The questionnaire isfurther categorized into three domains: Items 1, 2, and 3 (hazardous alcohol use), Items 4,5, and 6 (dependence symptoms), and Items 7, 8, 9 and 10 (harmful alcohol use). Item 1(frequency of drinking); Item 2 (typical quantity); Item 3 (frequency of heavy drinking);Item 4 (impaired control over drinking); Item 5 (increased salience of drinking); Item 6(morning drinking); Item 7 (guilt after drinking); Item 8 (blackouts); Item 9 (alcohol-relatedinjuries); Item 10 (others concerned about drinking). A written informed consent and anassent for minors (less than 18 years old) was taken prior to the interviews from parentsor guardians. This questionnaire was self-administered by the respondents to encouragetruthfulness and confidentiality.
2.2. Definition of Alcohol Drinkers
Those who had drunk any alcoholic beverage in the previous 12 months were con-sidered current drinkers. Ever drinkers are those who have drunk alcohol at least once intheir lives. Six or more alcoholic standard drinks consumed in one sitting was consideredbinge drinking. HED was defined as six or more standard alcoholic beverages consumedin a single session at least once per week [17]. Lifetime abstainers were defined as thosewho have never consumed alcohol. Abstainers in the past 12 months were defined asthose who did not drink any alcohol in the past 12 months. Types of alcoholic beverageswere grouped into 5 categories according to their alcohol content; Category 1 (alcoholcontent < 2%): shandy; Category 2 (alcohol content < 9%): beer including lager, ale or stout;Category 3 (alcohol content 10–25%): wine, cider, champagne, Peri, toddy, Tuak, Tuak Kelapa,Bahar, Lihing or Ijok; Category 4 (alcohol content > 30%): brandy, rum, whisky, vodka, gin,Samsu, Samsu Cheng, Montoku or Langkau, and others.
2.3. Covariates
A total of nine covariates were included in this study (sex (male/female), age (15 to19 years/20 to 39 years/40 to 59 years/60 years and above), location (rural/urban), ethnicity(Malay/Chinese/Indian/Bumiputera Sabah and Sarawak/Others), marital status (single,divorcee, widow/widower, married), education level (no formal education/primary edu-cation/secondary education/tertiary education), income (bottom 40%/ middle 40%/top20%), employment status (employed/unemployed, retiree, homemaker, caregiver), and cur-rent smoking (yes/no). Current smokers were defined as those who were currently usingany smoked tobacco products (manufactured cigarettes, hand-rolled cigarettes, kretek,cigars, shisha, bidis, or tobacco pipes).
2.4. Statistical Analysis
Descriptive statistics were used to present data on types of alcoholic beverages con-sumed and the frequencies of each item in the AUDIT questionnaire. Multiple logisticregression analysis was employed to determine the factors associated with alcohol con-sumption among Malaysians aged 15 years and above. All possible two-way interactionsbetween the independent variables were assessed in producing the final model. The fitof the model was examined using a classification table. Data were presented with a 95%confidence level. All statistical analyses were carried out using statistical software SPSSversion 26 (IBM Corporation, Armonk, NY, USA) with complex sample function.
3. Results3.1. Socio-Demographic Characteristics of Current Drinkers in Malaysia
The overall response rate of this survey was 87.2% [12]. The mean age of the populationin this study was 40.8 (SD ± 15.63). The prevalence of current drinkers among Malaysiansaged 15 years and above was 11.5%; 95% CI: 9.8, 13.5. Males (16.3%; 95% CI: 13.9, 19.1) hada higher prevalence compared with females (6.4%; 95% CI: 5.0, 8.2). Those in age groups 20to 39 years (13.4%; 95% CI: 10.9, 16.3) and 40 to 59 years (12.2%; 95% CI: 10.1, 14.7) had ahigher prevalence of current drinkers compared with those in other age groups (Table 1).

Int. J. Environ. Res. Public Health 2022, 19, 8851 4 of 11
Table 1. Socio-demographic characteristics of current drinkers in Malaysia aged 15 and above.
Socio-Demographic Characteristics n EstimatedPopulation Prevalence
95% CILCL UCL
Overall 818 2,640,940 11.5 9.8 13.5
Sex
Male 576 1,923,105 16.3 13.9 19.1Female 242 717,835 6.4 5.0 8.2
Age group
15–19 63 221,120 8.3 5.8 11.820–39 359 1,453,241 13.4 10.9 16.340–59 279 773,470 12.2 10.1 14.7
60 years and above 117 193,110 6.2 4.8 8.0Mean age (40.8 SD ± 15.63)
Locality
Rural 271 533,346 10.4 7.9 13.6Urban 547 2,107,594 11.8 9.8 14.2
Education level
No formal education 37 69,818 6.4 4.2 9.8Primary education 166 558,020 12.2 9.2 16.2
Secondary education 395 1,243,281 10.7 8.8 13.1Tertiary education 217 767,026 13.7 10.9 17.2
Occupation
Employed 587 2,052,715 15.2 12.9 17.8Unemployed/retiree/homemaker/caregiver 112 255,202 5.8 4.3 7.8
Marital status
Single/divorcee/widow/widower 306 1,146,244 12.3 9.8 15.4Married 512 1,494,696 10.9 9.2 12.9
Ethnicity
Chinese 312 1,248,468 26.0 21.6 30.9Malay 37 81,572 0.7 0.5 1.1Indian 117 233,429 17.3 13.5 21.9
Bumiputera of Sabah Sarawak 298 794,696 31.1 24.3 38.8Others 54 282,776 11.7 6.9 19.2
Household Income
Bottom 40% 498 1,503,522 10.7 9.0 12.6Middle 40% 184 740,137 13.3 9.8 17.8
Top 20% 105 331,450 17.1 12.6 22.7
Current smoker
Yes 252 931,704 19.2 15.4 23.6No 565 1,706,103 9.5 7.9 11.4
Urban areas saw a prevalence of current drinkers of 11.8% (95% CI: 9.8, 14.2) comparedwith rural areas that had a 10.4% (95% CI: 7.9, 13.6) prevalence.
Current drinking was more prevalent among those employed (15.2%; 95% CI: 12.9,17.8) compared with the unemployed (5.8%; 95% CI: 4.3, 7.8). According to marital status,those who were single, may it be divorced or widowed, had a prevalence of 12.3% (95%CI: 9.8, 15.4) current drinkers compared with those who were married (10.9%; 95% CI: 9.2,12.9). The ethnic subgroup that had the highest prevalence was the Bumiputera of Sabahand Sarawak (31.1%; 95% CI: 24.3, 38.8). Those with a household income in the top 20%(17.1%; 95% CI: 12.6, 22.7) category had a higher prevalence of current drinkers comparedwith the other income categories. Current smokers (19.2%; 95% CI: 15.4, 23.6) had a higher

Int. J. Environ. Res. Public Health 2022, 19, 8851 5 of 11
prevalence of alcohol drinkers compared with non-current smokers (9.5%; 95% CI: 7.9, 11.4)(Table 1).
3.2. Types of Alcoholic Beverages and Frequency
Figure 1 shows the preference of alcoholic beverages among current drinkers inMalaysia. The majority (65%) consumed alcoholic beverages in Category 2, which is mainlybeer. This is followed by Category 3 (17.5%), which comprises drinks like wine, champagne,and local drinks such as tuak and bahaar. Category 4 (brandy, rum, whisky, vodka, gin,Samsu, Samsu Cheng, Montoku, or Langkau), Category 1 (shandy), and others were 7.7%,4.1%, and 5.6% respectively. Current drinkers consumed alcohol mostly once a month(59.0%), followed by two to four times a month (23.1%) (Figure 2). Current drinkers mostlyconsumed one or two drinks (71.1%) on a typical day (Figure 3). Most respondents hadsix or more drinks less than once a month (27.6%), followed by monthly (12.3%), weekly(7.1%), and daily or almost daily (1.8%) (Figure 4).
Figure 1. Preference of alcoholic beverages among current drinkers in Malaysia.
Figure 2. Drinking frequency among current drinkers in Malaysia.

Int. J. Environ. Res. Public Health 2022, 19, 8851 6 of 11
Figure 3. Number of drinks consumed on a typical day among current drinkers in Malaysia.
Figure 4. Frequency of having six or more drinks on one occasion among current drinkers in Malaysia.
3.3. Multiple Logistic Regression Analysis
Multiple logistic regression analysis (Table 2), adjusted for possible confounders,showed that males (aOR: 2.21; 95% CI: 1.65, 2.97) were 2.21 times more likely to consumealcohol compared with their female counterparts. Compared with those aged 60 yearsand above, all ages less than the reference group had significantly higher odds of beingassociated with alcohol drinking and these odds reduced for the subsequent age groups:15–19 years (aOR: 3.23; 95% CI: 1.58, 6.58), 20–39 years (aOR: 2.04; 95% CI: 1.30, 3.20),and 40–59 years (aOR: 1.60; 95% CI: 1.02, 2.52). Considering the educational levels of therespondents, the odds of being associated with alcohol drinking was 2.28 times higheramong tertiary educated respondents compared with those with no formal education.Being employed had the odds of 1.49 times of being associated with alcohol consumptioncompared with those unemployed. With regards to the various ethnicities of the respon-dents, Chinese (aOR: 4.80; 95% CI: 2.51, 9.17), Bumiputera of Sabah and Sarawak (aOR:4.71; 95% CI: 2.46, 9.03), and Indian (aOR: 2.52; 95% CI: 1.26, 5.05) ethnics were significantlyassociated with alcohol drinking compared with the reference (other ethnicities). Current
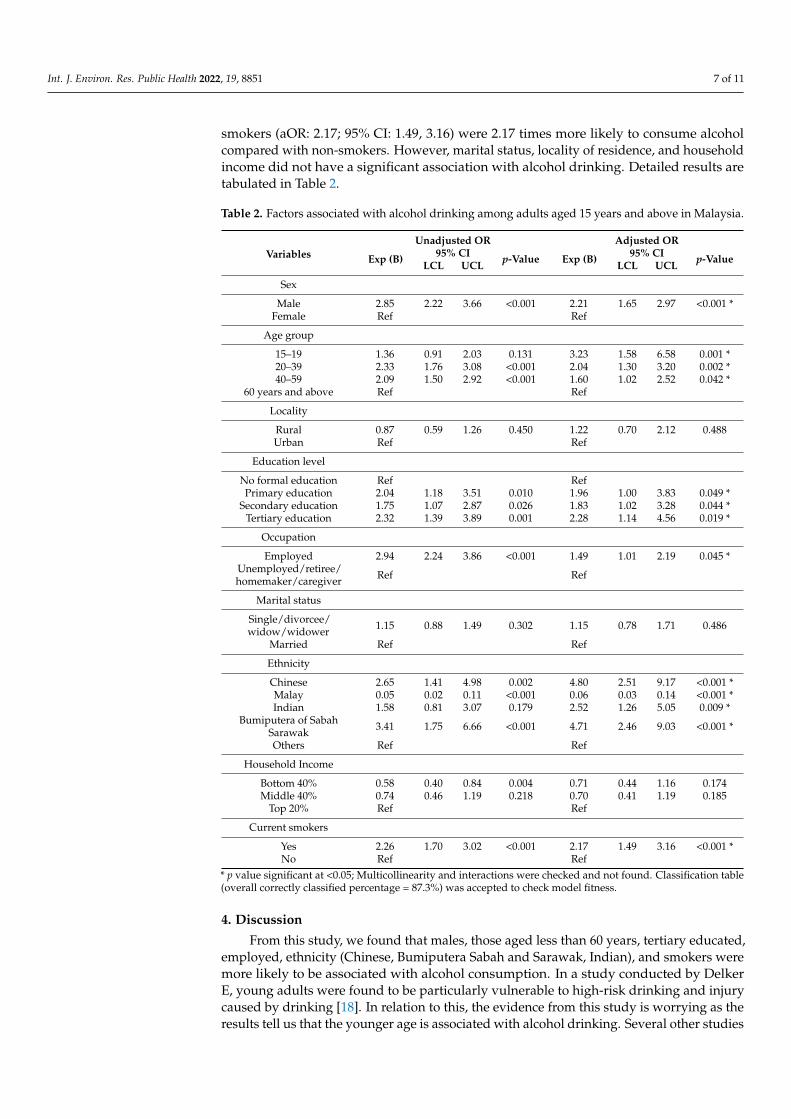
Int. J. Environ. Res. Public Health 2022, 19, 8851 7 of 11
smokers (aOR: 2.17; 95% CI: 1.49, 3.16) were 2.17 times more likely to consume alcoholcompared with non-smokers. However, marital status, locality of residence, and householdincome did not have a significant association with alcohol drinking. Detailed results aretabulated in Table 2.
Table 2. Factors associated with alcohol drinking among adults aged 15 years and above in Malaysia.
VariablesUnadjusted OR Adjusted OR
Exp (B) 95% CI p-Value Exp (B) 95% CI p-ValueLCL UCL LCL UCL
Sex
Male 2.85 2.22 3.66 <0.001 2.21 1.65 2.97 <0.001 *Female Ref Ref
Age group
15–19 1.36 0.91 2.03 0.131 3.23 1.58 6.58 0.001 *20–39 2.33 1.76 3.08 <0.001 2.04 1.30 3.20 0.002 *40–59 2.09 1.50 2.92 <0.001 1.60 1.02 2.52 0.042 *
60 years and above Ref Ref
Locality
Rural 0.87 0.59 1.26 0.450 1.22 0.70 2.12 0.488Urban Ref Ref
Education level
No formal education Ref RefPrimary education 2.04 1.18 3.51 0.010 1.96 1.00 3.83 0.049 *
Secondary education 1.75 1.07 2.87 0.026 1.83 1.02 3.28 0.044 *Tertiary education 2.32 1.39 3.89 0.001 2.28 1.14 4.56 0.019 *
Occupation
Employed 2.94 2.24 3.86 <0.001 1.49 1.01 2.19 0.045 *Unemployed/retiree/homemaker/caregiver Ref Ref
Marital status
Single/divorcee/widow/widower 1.15 0.88 1.49 0.302 1.15 0.78 1.71 0.486
Married Ref Ref
Ethnicity
Chinese 2.65 1.41 4.98 0.002 4.80 2.51 9.17 <0.001 *Malay 0.05 0.02 0.11 <0.001 0.06 0.03 0.14 <0.001 *Indian 1.58 0.81 3.07 0.179 2.52 1.26 5.05 0.009 *
Bumiputera of SabahSarawak 3.41 1.75 6.66 <0.001 4.71 2.46 9.03 <0.001 *
Others Ref Ref
Household Income
Bottom 40% 0.58 0.40 0.84 0.004 0.71 0.44 1.16 0.174Middle 40% 0.74 0.46 1.19 0.218 0.70 0.41 1.19 0.185
Top 20% Ref Ref
Current smokers
Yes 2.26 1.70 3.02 <0.001 2.17 1.49 3.16 <0.001 *No Ref Ref
* p value significant at <0.05; Multicollinearity and interactions were checked and not found. Classification table(overall correctly classified percentage = 87.3%) was accepted to check model fitness.
4. Discussion
From this study, we found that males, those aged less than 60 years, tertiary educated,employed, ethnicity (Chinese, Bumiputera Sabah and Sarawak, Indian), and smokers weremore likely to be associated with alcohol consumption. In a study conducted by DelkerE, young adults were found to be particularly vulnerable to high-risk drinking and injurycaused by drinking [18]. In relation to this, the evidence from this study is worrying as theresults tell us that the younger age is associated with alcohol drinking. Several other studies

Int. J. Environ. Res. Public Health 2022, 19, 8851 8 of 11
also support this finding. For example, a study conducted in Sri Lanka reported similar agegroups to be significant alcohol users and were also related to abuse and dependence [19].Problematic alcohol consumption among male adults in Nepal was significantly associatedwith the 25 to 44 years’ age group [20].
With reference to gender, not only more males consumed alcohol [21–23] but also weremore likely to be risky drinkers compared with females [14,18,24,25]. Similarly, males inthis study were more likely to be current drinkers compared with females. Worryingly,despite the prevalence of current drinkers being on the lower side, almost half of them didbinge drink. Although we did not analyze male binge drinking in this paper, findings fromNHMS 2019 reported that 49.5% male current drinkers aged 18 years and above did bingedrink [12].
In a study conducted in five states in India, having a higher income and living inurban areas were significantly associated with current drinking [8]. A higher level ofhousehold income was also reported to be positively associated with high-risk drinkingamong middle-aged Korean men [21,26]. Our study’s findings indeed show that a lowerincome is a protective factor for alcohol consumption compared with a higher income.
Our study indicated that current smokers were very likely to also be current drinkers.The international literature also support these findings, where smoking and alcohol hada mutual effect on each other’s influence of increased craving [27]. Smokers were alsoat an increased odds of drinking alcohol irrespective of gender [23,25,28]. Additionally,smoking and drinking concurrently also elevated the risk of hypertension [29,30]. Anotherstudy found that the proportion of smokers among drinkers was high [30], which wasalso consistent with our study findings where the prevalence of smokers among currentdrinkers was 19.2%.
The differences in alcohol consumption among communities is closely related to reli-gion, alcohol related policies, and economic growth [31]. Malaysia, compared with otherSouth-East Asian countries, has a low alcohol-per-capita consumption (APC). Moreover,between the years 2010 to 2017, Malaysia had a decrease in APC [11]. However, an articlepublished in the Lancet reported global APC consumption increased from 5.9 L to 6.5 Land it would reach 7.6 L by the year 2030, and current policies are not enough to achieve areduction of the harmful use of alcohol [31]. Religious beliefs, however, do play a part in al-cohol consumption [25]. Since Malaysia is a Muslim majority country, alcohol consumptionon a whole is generally low. In a study conducted by Mutalip et al., in Malaysia, ethnicity(Bumiputera Sabah and Sarawak) had the highest odds and was significantly associatedwith risky drinking [14]. Drinking alcohol is commonly associated with ethnic backgroundsand culture [32] and this is particularly related to the culture of the indigenous people inEast Malaysia (Sabah and Sarawak), especially during festive occasions. This group wasalso found to be more prone to polysubstance use as reported in a study among Malaysianadolescents [33]. Interestingly, a study done in Sabah found that Montoku was mostly drunkby alcohol drinkers there and it was very cheap (RM 0.50 per standard drink), which boilsdown to the issue of taxation of locally distilled alcohol [34]. Thus, the prevention of issuesrelated to alcohol consumption should be targeted more to people of specific ethnicitiesand cultures where different types of beverages are consumed.
Policies related to alcohol are well in place in Malaysia. The maximum legal bloodalcohol concentration (BAC) when driving is set at 0.08% compared with 0.05% and noBAC limit in Thailand and Indonesia, respectively. The minimum age to purchase alcoholicbeverages is set at 21 years old in Malaysia; whereas, Singapore and Thailand have lowerlegal ages of 18 years old and 20 years old, respectively [1]. Alcoholic beverages are actuallyquite easily accessible in Malaysia, as it is sold in neighbourhood convenience stores.A meta-analysis has shown that reducing the physical availability of take-away alcoholwill reduce the APC consumption, thus reducing the relevant harm it could pose [35].
The type of alcoholic beverages preferred by Malaysian adults found in our study wasfrom Category 2, which is mainly beer. Comparatively, current drinkers in Thailand and

Int. J. Environ. Res. Public Health 2022, 19, 8851 9 of 11
India preferred spirits, which are mainly brandy, rum, whiskey, and vodka [8,11]. However,a study among Chinese college students showed beer to be the preferred beverage [24].
Strengths and Limitations
This study has several strengths and limitations. The size of the sample and the sam-ple’s representation of the Malaysian population are its greatest assets. To our knowledge,this is the first study to disseminate updated findings related to alcohol consumptionpatterns in Malaysia of this scale. One of its limitations is the study design used, cross-sectional, where cause and effect could not be determined. This study design, though, wasthe most suitable given the large sample size and existing resources. In addition, alcoholsurveys may not provide reliable per capita consumption data [36]. Secondly, the majorityof the respondents in this study were Malay (Muslim). This could have caused some degreeof dilution of the actual association, because alcohol drinking is strictly prohibited in Islam.Although the reduction of the harmful use of alcohol is one of the SDGs, we unfortunatelycould not analyze the factors associated with HED and binge drinking using this sampledue to the low sample from this group. Therefore, additional research utilizing variousstudy designs and concentrating on groups that are very likely to consume alcohol in adangerous manner is necessary. Other factors, such as parental and peer drinking that werenot explored in this study, should be included in future nationwide surveys. In the GlobalStatus Report on Alcohol and Health 2018, the three strategies that are effective in reducingthe harmful use of alcohol are undoubtedly to increase taxes on alcoholic beverages, bansor restrictions on alcohol advertising in the media, and the restriction on the availability ofretailed alcohol [1,37]. To successfully reduce the harm caused by alcohol consumption,governments should work to adopt this approach.
5. Conclusions
This paper highlights the factors associated with alcohol consumption and the patternof alcohol consumption in Malaysia. Although the prevalence of alcohol consumption isgenerally lower compared with other risk factors reported in NHMS 2019, alcohol drinkingmay be a problem among certain vulnerable groups. More policies directed towards thissubgroup should be formulated to reduce the effects from the harmful use of alcohol.
Author Contributions: Conceptualization, T.G.R.L.; methodology, T.G.R.L., H.A.A.H., W.S.R.H.,M.H.A.M. and N.A.J.; formal analysis, H.A.A.H. and W.S.R.H.; data curation, H.A.A.H.; writing—original draft preparation, T.G.R.L.; writing—review and editing, T.G.R.L., M.R.R., H.M.R., T.A.S.,H.I. and M.F.M.Y. All authors have read and agreed to the published version of the manuscript.
Funding: The National Health and Morbidity Survey (NHMS) 2019 was fully funded by the Ministryof Health Malaysia with the reference number KKM/NIHSEC/P18-2325(12), dated 20 December 2018.
Institutional Review Board Statement: This study was approved by the Medical Research andEthics Committee (MREC) and registered under the National Medical Research Registry (NMRR)with the number NMRR-18-3085-44207.
Informed Consent Statement: Written informed consent and assent for minors (less than 18 yearsold) was taken prior to the interviews from parents or guardians.
Acknowledgments: The authors would like to thank the Director General of Health Malaysia forgranting permission to publish this article.
Conflicts of Interest: The authors declare no conflict of interest.
References1. World Health Organization (WHO); Hammer, J.H.; Parent, M.C.; Spiker, D.A. Global Status Report on Alcohol and Health 2018.
Vol. 65, Global Status Report on Alcohol. 2018, pp. 74–85. Available online: https://www.who.int/publications/i/item/9789241565639 (accessed on 30 March 2022).
2. Eashwar, V.A.; Gopalakrishnan, S.; Umadevi, R.; Geetha, A. Pattern of alcohol consumption and its associated morbidity amongalcohol consumers in an urban area of Tamil Nadu. J. Fam. Med. Prim. Care 2019, 8, 2029. [CrossRef] [PubMed]

Int. J. Environ. Res. Public Health 2022, 19, 8851 10 of 11
3. World Health Organization (WHO). Global Action Plan for the Prevention and Control of Noncommunicable Disease (2013–2020).2013. Available online: https://www.who.int/publications/i/item/9789241506236 (accessed on 30 March 2022).
4. Peacock, A.; Leung, J.; Larney, S.; Colledge, S.; Hickman, M.; Rehm, J.; Giovino, G.A.; West, R.; Hall, W.; Griffiths, P.; et al. Globalstatistics on alcohol, tobacco and illicit drug use: 2017 status report. Addiction 2018, 113, 1905–1926. [CrossRef] [PubMed]
5. Roerecke, M.; Kaczorowski, J.; Tobe, S.W.; Gmel, G.; Hasan, O.S.M.; Rehm, J. The effect of a reduction in alcohol consumption onblood pressure: A systematic review and meta-analysis. Lancet Public Health 2017, 2, e108–e120. [CrossRef]
6. Htet, H.; Saw, Y.M.; Saw, T.N.; Htun, N.M.M.; Mon, K.L.; Cho, S.M.; Thike, T.; Khine, A.T.; Kariya, T.; Yamamoto, E.; et al.Prevalence of alcohol consumption and its risk factors among university students: A cross-sectional study across six universitiesin Myanmar. PLoS ONE 2020, 15, e0229329. [CrossRef]
7. Singh, S.K.; Yap, K.H.; Natarajan, P.; Allotey, P.; Reidpath, D. Alcohol Consumption Patterns and Associated Risk Behaviors inThree Ethnic Groups of Malaysian Millennials. Public Heath Open J. 2020, 5, 26–32. [CrossRef]
8. Kumar, K.; Kumar, S.; Singh, A.K. Prevalence and socio-demographic correlates of alcohol consumption: Survey findings fromfive states in India. Drug Alcohol Depend. 2018, 185, 381–390. [CrossRef]
9. Xi, B.; Veeranki, S.P.; Zhao, M.; Ma, C.; Yan, Y.; Mi, J. Relationship of Alcohol Consumption to All-Cause, Cardiovascular,and Cancer-Related Mortality in US Adults. J. Am. Coll. Cardiol. 2017, 70, 913–922.
10. Canadean. Global Beverage Forecasts March 2016: Comprehensive Topline Analysis of All Commercial Beverages Trends and Forecasts;Canadean: London, UK, 2016.
11. Sornpaisarn, B.; Shield, K.; Manthey, J.; Limmade, Y.; Low, W.Y.; Van Thang, V.; Rehm, J. Alcohol consumption and attributableharm in middle-income South-East Asian countries: Epidemiology and policy options. Int. J. Drug Policy 2020, 83, 102856.[CrossRef]
12. Institute for Public Health (IPH). National Institutes of Health Ministry of Health Malaysia. In National Health and MorbiditySurvey (NHMS) 2019: NCDs-Non-Communicable Diseases: Risk Factors and Other Health Problems; Institute for Public Health (IPH):Kuala Lumpur, Malaysia, 2019; Volume 1, p. 146.
13. Cheah, Y.K.; Rasiah, R. Analysis of the Determinants of Alcohol Consumption among Adult Males in Malaysia. J. Health Manag.2017, 19, 28–38.
14. Mutalip, M.H.B.A.; Kamarudin, R.B.; Manickam, M.; Abd Hamid, H.A.B.; Saari, R.B. Alcohol consumption and risky drinkingpatterns in Malaysia: Findings from NHMS 2011. Alcohol Alcohol. 2014, 49, 593–599.
15. Babor, T.F.; Higgins-biddle, J.C.; Saunders, J.B.; Monteiro, M.G. The Alcohol Use Disorders Identification Test: Guidelines for Use inPrimary Care; WHO: Geneva, Switzerland, 2001.
16. Lawford, B.R.; Barnes, M.; Connor, J.P.; Heslop, K.; Nyst, P.; Young, R.M.D. Alcohol Use Disorders Identification Test (AUDIT):Guidelines for Use in Primary Care. World Health Organization (WHO). 2001. Available online: https://www.who.int/publications/i/item/audit-the-alcohol-use-disorders-identification-test-guidelines-for-use-in-primary-health-care (accessed on14 April 2022).
17. Institute for Public Health (IPH). National Institutes of Health, Ministry of Health Malaysia. In National Health and MorbidtySurvey (NHMS) 2011; Institute for Public Health (IPH): Kuala Lumpur, Malaysia, 2011; Volume 2, p. 192.
18. Delker, E.; Brown, Q.; Hasin, D.S. Alcohol consumption in demographic subpopulations: An epidemiologic overview. Alcohol Res.Curr. Rev. 2016, 38, 7–15.
19. Zavos, H.; Siribaddana, S.; Ball, H.A.; Lynskey, M.T.; Sumathipala, A.; Rijsdijk, F.V.; Hotopf, M. The prevalence and correlates ofalcohol use and alcohol use disorders: A population based study in Colombo, Sri Lanka. BMC Psychiatry 2015, 15, 158. [CrossRef][PubMed]
20. Priyanka, J.; Chhetri, P.; Godar, S.; Timsina, P.; Doranga, S. Factors Associated with Problematic Alcohol Consumption amongAdults in Putalibazar Municipality of Syangja District, Nepal. Adv. Public Health 2022, 2022, 7588153.
21. Choi, J.; Choi, J.Y.; Shin, A.; Lee, S.A.; Lee, K.M.; Oh, J.; Park, J.Y.; Lee, J.K.; Kang, D. Trends and correlates of high-risk alcoholconsumption and types of alcoholic beverages in middle-aged Korean adults: Results from the HEXA-G study. J. Epidemiol. 2019,29, 125–132. [CrossRef] [PubMed]
22. Chaiyasong, S.; Huckle, T.; Mackintosh, A.M.; Meier, P.; Parry, C.D.; Callinan, S.; Viet Cuong, P.; Kazantseva, E.; Gray-Phillip, G.;Parker, K.; et al. Drinking patterns vary by gender, age and country-level income: Cross-country analysis of the InternationalAlcohol Control Study. Drug Alcohol Rev. 2018, 37, S53–S62. [CrossRef] [PubMed]
23. Ganesh Kumar, S.; Premarajan, K.C.; Subitha, L.; Suguna, E.; Vinayagamoorthy Kumar, V. Prevalence and pattern of alcoholconsumption using alcohol use disorders identification test (AUDIT) in rural Tamil Nadu, India. J. Clin. Diagn. Res. 2013, 7,1637–1639.
24. Ji, C.Y.; Hu, P.J.; Song, Y. The epidemiology of alcohol consumption and misuse among Chinese college students. Alcohol Alcohol.2012, 47, 464–472. [CrossRef]
25. Luitel, N.P.; Jordans, M.; Murphy, A.; Roberts, B.; McCambridge, J. Prevalence and patterns of hazardous and harmful alcoholconsumption assessed using the audit among bhutanese refugees in nepal. Alcohol Alcohol. 2013, 48, 349–355. [CrossRef]
26. Murakami, K.; Hashimoto, H. Associations of education and income with heavy drinking and problem drinking among men:Evidence from a population-based study in Japan. BMC Public Health 2019, 19, 420. [CrossRef]
27. Verplaetse, T.L.; McKee, S.A. An overview of alcohol and tobacco/nicotine interactions in the human laboratory. Am. J. DrugAlcohol Abus. 2017, 43, 186–196. [CrossRef]

Int. J. Environ. Res. Public Health 2022, 19, 8851 11 of 11
28. Vellios, N.G.; van Walbeek, C.P. Self-reported alcohol use and binge drinking in South Africa: Evidence from the national incomedynamics study, 2014–2015. S. Afr. Med. J. 2018, 108, 33–39. [CrossRef] [PubMed]
29. Wang, Y.; Yao, Y.; Chen, Y.; Zhou, J.; Wu, Y.; Fu, C.; Wang, N.; Liu, T.; Xu, K. Association between Drinking Patterns and IncidentHypertension in Southwest China. Int. J. Environ. Res. Public Health 2022, 19, 3801. [CrossRef] [PubMed]
30. Wang, M.; Li, W.; Zhou, R.; Wang, S.; Zheng, H.; Jiang, J.; Wang, S.; Yu, C.; Gao, W.; Lv, J.; et al. The paradox association betweensmoking and blood pressure among half million chinese people. Int. J. Environ. Res. Public Health 2020, 17, 2824. [CrossRef]
31. Manthey, J.; Shield, K.D.; Rylett, M.; Hasan, O.S.M.; Probst, C.; Rehm, J. Global alcohol exposure between 1990 and 2017 andforecasts until 2030: A modelling study. Lancet 2019, 393, 2493–2502. [CrossRef]
32. Kabwama, S.N.; Ndyanabangi, S.; Mutungi, G.; Wesonga, R.; Bahendeka, S.K.; Guwatudde, D. Alcohol use among adults inUganda: Findings from the countrywide non-communicable diseases risk factor cross-sectional survey. Glob. Health Action 2016,9, 31302. [CrossRef] [PubMed]
33. Rodzlan Hasani, W.S.; Saminathan, T.A.; Ab Majid, N.L.; Miaw Yn, J.L.; Mat Rifin, H.; Abd Hamid, H.A.; Robert Lourdes, T.G.;Ahmad, A.; Lsmail, H.; Rashid, R.A.; et al. Polysubstance use among adolescents in Malaysia: Findings from the National Healthand Morbidity Survey 2017. PLoS ONE 2021, 16, e0245593. [CrossRef] [PubMed]
34. Shoesmith, W.D.; Oo Tha, N.; Naing, K.S.; Abbas, R.B.H.; Abdullah, A.F. Unrecorded alcohol and alcohol-related harm in ruralSabah, Malaysia: A socio-economically deprived region with expensive beer and cheap local spirits. Alcohol Alcohol. 2016, 51,741–746. [CrossRef]
35. Sherk, A.; Stockwell, T.; Chikritzhs, T.; Andréasson, S.; Angus, C.; Gripenberg, J.; Holder, H.; Holmes, J.; Mäkelä, P.; Mills, M.; et al.Alcohol consumption and the physical availability of take-away alcohol: Systematic reviews and meta-analyses of the days andhours of sale and outlet density. J. Stud. Alcohol Drugs 2018, 79, 58–67. [CrossRef]
36. Kilian, C.; Manthey, J.; Probst, C.; Brunborg, G.S.; Bye, E.K.; Ekholm, O.; Kraus, L.; Moskalewicz, J.; Sieroslawski, J.; Rehm, J. WhyIs Per Capita Consumption Underestimated in Alcohol Surveys ? Results from 39 Surveys in 23 European Countries. AlcoholAlcohol. 2020, 55, 554–563. [CrossRef]
37. World Health Organization. The SAFER Technical Package: Five Areas of Intervention at National and Subnational Levels; World HealthOrganization: Geneva, Switzerland, 2019; pp. 1–24. Available online: https://apps.who.int/iris/handle/10665/330053 (accessedon 13 May 2022).