
The application of bulk acoustic wave (BAW) reso - UCL ...
238
i UCL Chemical Engineering: Doctoral Thesis The application of bulk acoustic wave (BAW) reso- nators for the in-situ inves- tigation of polymer electro- lytes and high-temperature media 2017 Vidal J Bharath Supervisors: Prof. D Brett Dr. G Manos A thesis submitted for the partial fulfilment of the requirements for the degree of Doctor of Philosophy at University College London
-
Upload
khangminh22 -
Category
Documents
-
view
0 -
download
0
Transcript of The application of bulk acoustic wave (BAW) reso - UCL ...
i
UCL Chemical Engineering: Doctoral Thesis
The application of bulk
acoustic wave (BAW) reso-
nators for the in-situ inves-
tigation of polymer electro-
lytes and high-temperature
media
2017
Vidal J Bharath
Supervisors: Prof. D Brett
Dr. G Manos
A thesis submitted for the partial fulfilment of the requirements for the
degree of Doctor of Philosophy at University College London

ii
Declaration
I, Vidal J Bharath, confirm that the work presented in this thesis is my own.
Where information has been derived from other sources, I confirm that this has
been indicated in the thesis.
………………………………………………..
Signature
………………………………………………..
Date

iii
Acknowledgements
Firstly, I’d like to thank Professor Dan Brett. Thank you for persuading me
to do a PhD. The time I’ve spent in the Electrochemical Innovation Lab
(EIL) have been truly outstanding. Thank you for the most memorable of
experiences and providing me with the introduction and opportunity to work
in such an interesting field. Long may our journey continue.
A massive thank you must also go to my other supervisors (officially and
otherwise) Dr. George Manos, Dr. Paul Shearing and Professor Eva
Sorenson; the life skills, support and personal development you’ve each given
me has meant more than you know.
A special thanks must also go to the ’Senior team’ of Jay, Toby and Tom.
You three have been the technical sounding board for which most of this
work has been built. Your willingness to help, your keen eyes for detail and
problem solving assistance have added to the EIL immeasurably and make
it the place it is. How you guys get any time to do your own work is still a
mystery to me.
The EIL is a truly special place to do a PhD, the technical work is regularly
quantified and measured, however the social side of this group is unparal-
leled. And so I must add thanks to my fellow socialites; thanks for the early
morning emergency theory meeting coffees and the less academic late night
drinks. It would not be possible to thank you all here, but I must give a
special mention to Erik, Rhod, James, Leon, Ishanka, Dina, Dami, Shade,
Amal, Chun and all the others who have made working in a cooped up
basement all the more bearable – desirable even. To the ‘commercialisation-
geek squad’; ‘How about that ride in?’ I look forward to our future business
endeavours and the ever present back up movie-script style heists we have
in store. Never change.
Finally, I’d like to thank Amisha and my family. Your love and support is
what keeps me going. Thank You.
iv
Abstract With the realities of the energy and environmental crises drawing ever
closer, the need to fast-track the development of promising future renewable
energy technologies such as fuel cells is of paramount importance. However,
with significant technical barriers to overcome before transition to a fully
renewable energy based low carbon economy, the world must, in the short
term, continue to rely on existing electricity generation methods such as
crude oil refining. It is therefore critical that there remains a focus on ad-
vancing and maximising both future and existing technologies’ power con-
version efficiencies.
Electricity generation technologies represent complex systems; advanced
non-intrusive in-situ investigations can significantly aid with technological
advancements through fundamental understanding of the processes occur-
ring at the interfacial level. Intimate knowledge of the morphological and
structural phenomena occurring at the interface can be gathered using tech-
niques such as bulk acoustic wave (BAW) resonators and provide new in-
sight into factors such as operating conditions to guide future technological
developments of complex systems.
This thesis outlines the establishment of surface developed, BAW resonators
for non-intrusive, in-situ application within bespoke, calibrated experi-
mental set ups to elucidate the interfacial phenomena in the viscoelastic
phase, and specifically within both the fuel cell industry and the refinement
of heavy crude oil as indicated below.
Low-temperature fuel cells (specifically proton exchange membranes
(PEMs)) represent a promising constituent in the low carbon economy for
portable and automotive power. Yet, issues pertaining to durability and cost
hinder the technology’s commercialisation. Recent reaction kinetics devel-
opment in the less well established alkaline anion-exchange membrane
(AAEM) fuel cell however, has shown avenues for significant cost reduc-
tions. However, the AAEM is not without challenges; linked primarily to
hydration states, many reports have shown the technology’s susceptibility
to chemical degradation when operated at temperatures ≥ 65 OC; carbon

v
dioxide poisoning when operating in air; and general system integration is-
sues due to a lack of understanding of the AAEM’s swelling and water load-
ing mechanisms.
A commercially available thin-film AAEM is investigated here using a novel
composite (ionomer-cast) quartz crystal microbalance (QCM) and crystal
admittance spectroscopy (CAS) for interfacial characterisation. The study
focuses on operation in the presence of hydration and how this affects the
ionomer’s water uptake, loading and swelling mechanisms as well as the
susceptibility of the cationic groups to resist cleavage in the presence of
hydroxide ions, leading to E2-(Hofmann) elimination. Operation in condi-
tions that can induce carbonate formation and interaction within the mem-
brane are also investigated.
The world’s ever-increasing energy demand has however not just progressed
the development of future renewables such as fuel cells, but also required
the innovative use of traditional and non-traditional resources such as
‘heavy’ crude oil. However, with significantly more variable compositions of
saturates, aromatics, resins and asphaltenes (SARAs) between wells com-
pared to traditional crude oil supplies, refining and transportation of heavy
crude oil using existing infrastructure has become subject to spurious effects
of fouling.
Fouling from heavy crude oil in pipelines and refinery equipment is unpre-
dictable, causes major flow assurance issues and occurs primarily as a result
of asphaltene destabilisation. Current monitoring and mitigation techniques
require time-intensive, large-volume analysis that is not able to react quickly
enough to changing oil grades.
As such, this study outlines the development of a novel high temperature,
high pressure, rapid, low-volume on-site feedback system for fouling detec-
tion and characterisation using an iron-electrodeposited gallium orthophos-
phate microbalance (iGCM). The iGCM coupled with X-ray computer to-
mography is used here to offer new insight into the phenomena occurring at
the iron–oil interface and thus providing the necessary flow assurance infor-
mation required to implement fouling rejection or conversion techniques.
vi
Publications Primary Publications
- V.J. Bharath, J. Millichamp, T.P. Neville, T.J. Mason, P.R. Shear-
ing, R.J.C. Brown, G. Manos, D.J.L. Brett, “Measurement of water
uptake in thin-film Nafion and anion alkaline exchange membranes
using the quartz crystal microbalance," Journal of Membrane Sci-
ence, vol. 497, pp. 229-238, Jan 1 2016.
- V.J. Bharath, R. Jervis, J. Millichamp, T.P. Neville, T.J. Mason, B.
Tjaden, P.R. Shearing, R.J.C. Brown, G. Manos, D.J.L. Brett, “Al-
kaline anion-exchange membrane degradation as a function of hu-
midity measured using the quartz crystal microbalance," Interna-
tional Journal of Hydrogen Energy, vol. 42, no. 9, pp. 6243-6249,
Mar 2 2017.
- V.J. Bharath, R. Jervis, J.J. Bailey, E. Engebretsen, J. Millichamp,
T.P. Neville, T.J. Mason, P.R. Shearing, R.J.C. Brown, G. Manos,
D.J.L. Brett, “Effect of humidity on the interaction of CO2 with
alkaline anion-exchange membranes probed using the quartz crystal
microbalance," International Journal of Hydrogen Energy, vol. 42,
no. 38, pp. 24301-24307, Aug 18 2017.
Secondary Publications
- L.D. Brown, R. Abdulaziz, R. Jervis, V. Bharath, T.J. Mason, R.C.
Atwood, C. Reinhard, L.D. Connor, D. Inman, D.J.L. Brett, P.R.
Shearing, “A novel molten-salt electrochemical cell for investigating
the reduction of uranium dioxide to uranium metal by lithium using
in situ synchrotron radiation,” Journal of Synchrotron Radiation,
vol.24 (2), pp. 439-444, 2017.
vii
- L.D. Brown, R. Abdulaziz, R. Jervis, V.J. Bharath, R.C. Atwood,
C. Reinhard, L.D. Connor, S.J.R. Simons, D. Inman, D.J.L. Brett,
P.R. Shearing, “Following the electroreduction of uranium dioxide to
uranium in LiCl–KCl eutectic in situ using synchrotron radiation,”
Journal of Nuclear Materials, vol. 464, pp. 256-262, 2016.
Author’s Conference Presentations
- Characterisation of Thin Film Alkaline Anion-exchange Membranes
for Fuel Cells Using a Quartz Crystal Microbalance and Crystal Ad-
mittance Spectroscopy, Nov. 2015, Zing Hydrogen and Fuel Cells
Conference, Cancun Mexico
- Characterisation of Thin Film Nafion and Alkaline Anion-exchange
Membrane Fuel Cells Using a Quartz Crystal Microbalance (QCM),
May 2015, STFC Batteries, Early Career Researcher Conference,
Abingdon, UK
- The Application of a Bulk Acoustic Wave (BAW) resonator as an
in-situ sensor for visco-elastic operation using admittance, Apr. 2014,
University College London, PhD Seminar Series, London, UK

viii
List of Abbreviations
AAEM Alkaline anion-exchange membrane
A-FC Alkaline fuel cell
API American Petroleum Institute
BAW Bulk acoustic wave
BVD Butterworth Van-Dyke
CAS Crystal admittance spectroscopy
CV Cyclic voltammetry
DLD Drive level dependence
EIS Electrochemical impedance spectroscopy
FC Fuel cell
FRA Frequency response analyser
GCM Gallium orthophosphate microbalance
GDL Gas diffusion layer
HOR Hydrogen oxidation reaction
IEC Ion exchange capacity
IPA Isopropanol
LGS Langasite
MEA Membrane electrode assembly
ORR Oxygen reduction reaction
PEM Proton exchange membrane
PG Pressure gauge
ppm Parts per million
PRV Pressure relief valve
QCM Quartz crystal microbalance
QNRF Qatar National Research Fund
RH Relative humidity
SANS Small-angle neutron scattering
SARA Saturates, aromatics, resins, asphaltenes
SAXS Small-angle X-rays scattering
SPE Solid polymer electrolyte
TAW Transverse acoustic wave
TCF Temperature coefficient of frequency
TPR Triple phase boundary
UFO Unidentified floating object

ix
Nomenclature
f Frequency
τ Time
ρ Density
λ Water uptake
δ Depth of decay
η Viscosity
θ Phase angle
μ Shear modulus
m Mass
A Area
Cf Integral of sensitivity coefficient
cf Sensitivity coefficient
T Temperature
Z Impedance
Y Admittance
G Conductance
B Susceptance
C Capacitor
L Inductor
R Resistor
M Molecular weight
Q Charge
i Current
F Faraday’s Constant
t Thickness
ξ22 Quartz permittivity
h Crystal thickness
𝐾𝑂2 Electrochemical coupling con-
stant for quartz
ω Angular excitation frequency
N Overtone number
c66 Quartz elastic constant
Subscripts
r Resonant
s Series
p Parallel
Fe Iron
q Quartz
L Liquid
f Film
w Wet
d Dry
i Ionomer
0 Fundamental
pi Piezoelectric material
x
Contents
Declaration ................................................................................................... ii
Acknowledgements ...................................................................................... iii
Abstract ...................................................................................................... iv
Publications ................................................................................................. vi
List of Abbreviations ................................................................................ viii
Nomenclature .............................................................................................. ix
Contents ....................................................................................................... x
List of Figures ........................................................................................... xiii
1 Introduction ........................................................................................ 1
1.1 The Fuel Cell Application .............................................................. 3
1.2 Heavy Crude Oil Fouling Detection ............................................... 4
2 Literature Review ............................................................................... 6
2.1 Bulk Acoustic Wave Resonators ..................................................... 6
2.2 The Piezoelectric Effect .................................................................. 7
2.3 BAW Resonator Background ......................................................... 9
2.3.1 Mass Monitoring ..................................................................... 10
2.3.2 Energy Trapping and Radial Sensitivity ................................ 12
2.4 Viscoelastic film / Liquid operation ............................................. 13
2.4.1 Background ............................................................................. 13
Kanazawa and Gordon ....................................................................... 15
Bruckenstein and Shay ....................................................................... 15
2.4.2 Viscous Phase Oscillation Fundamentals ............................... 17
2.4.3 Non-ideal Resonator Response ............................................... 18
2.5 Crystal Impedance / Admittance Spectroscopy ........................... 20
2.6 Equivalent Circuit Representation ............................................... 24
2.6.1 Unperturbed Microbalance Equivalent Circuit ...................... 24
2.6.2 Perturbed Crystal Equivalent Circuit .................................... 26
2.6.3 The Effect of Changing Parameters ....................................... 31
2.7 Electrochemical Quartz Crystal Microbalance (eQCM) ............... 36
3 Fuel Cell Application ........................................................................ 37
xi
3.1 Introduction .................................................................................. 37
3.2 Literature Review ......................................................................... 40
3.2.1 What is a Fuel Cell?............................................................... 40
3.2.2 Proton Electrolyte Membrane (PEM) Fuel Cells .................. 40
3.2.3 Alkaline Membrane Fuel Cells ............................................... 42
3.2.4 AAEM Operational Issues ...................................................... 45
3.2.5 The Application of a BAW Resonator ................................... 55
3.3 Methodology ................................................................................. 58
3.3.1 Quartz Crystal Microbalance ................................................. 58
3.3.2 Rig Development .................................................................... 60
3.3.3 Electrolyte Casting ................................................................. 67
3.3.4 Investigation of Specific Operation and Alterations .............. 72
3.4 Results and Discussion .................................................................. 80
3.4.1 Feasibility Studies .................................................................. 80
3.4.2 Investigations .......................................................................... 97
3.5 Conclusions ................................................................................. 131
3.5.1 Future work .......................................................................... 132
4 Fouling detection in high temperature media ................................ 134
4.1 Introduction ................................................................................ 134
4.2 Literature Review ....................................................................... 136
4.2.1 Crude Oil .............................................................................. 136
4.2.2 Transportation and Refining ................................................ 139
4.2.3 Fouling .................................................................................. 140
4.2.4 Microbalance Application ..................................................... 147
4.3 Methodology ............................................................................... 152
4.3.1 Rig Design ............................................................................ 152
4.3.2 Microbalance......................................................................... 156
4.3.3 Iron Electrodeposition .......................................................... 161
4.3.4 Crude Sample ....................................................................... 164
4.4 Results and Discussion ................................................................ 165
4.4.1 Suitability and Calibration Studies ...................................... 165
4.4.2 Iron Electrodeposition .......................................................... 182
4.4.3 iGCM Operation ................................................................... 189

xii
4.4.4 In-situ Application ............................................................... 194
4.5 Conclusion ................................................................................... 199
4.5.1 Future work .......................................................................... 200
5 Overall Conclusions ........................................................................ 202
5.1 Technique .................................................................................... 202
5.2 Application .................................................................................. 202
6 References ....................................................................................... 205
xiii
List of Figures
Figure 1: BAW resonator schematic ........................................................... 6
Figure 2: The converse piezoelectric effect .................................................. 7
Figure 3: Resulting atomic displacement and change in electrical charge with
an applied stress ......................................................................................... 8
Figure 4: Standing Wave Schematic ........................................................... 9
Figure 5: TAW propagation through a resonator and a contacting thin-film,
indicating the fulfilment of the standing wave condition .......................... 11
Figure 6: TAW propagation dampening through a contacting liquid media
.................................................................................................................. 16
Figure 7: The non-slip condition between the BAW resonator top electrode
and the monolayer of the contacting species ............................................. 19
Figure 8: Nyquist plot for a) an ideally oscillating resonator b) a real
oscillating resonator with an introduced static capacitance (Section 2.6)
from a holder for example ......................................................................... 21
Figure 9: Example of typical admittance Cartesian plots – admittance
magnitude is shown in black and the phase plot in blue (these typical plots
were generated using simulation data within the ZView modelling software)
.................................................................................................................. 23
Figure 10: Lumped parameter dashpot schematic .................................... 24
Figure 11: The Butterworth Van Dyke (BVD) equivalent circuit ............ 25
Figure 12: Modified BVD equivalent circuit ............................................. 27
Figure 13: Microbalance admittance a) loci b) magnitude and c) phase
responses to rigid mass loading (the unperturbed system is shown in black
and the perturbed system in red) d) tabulated key metrics...................... 33
Figure 14: Microbalance admittance a) loci, b) magnitude and c) phase
responses for a viscous loading (the unperturbed system is shown in black
and the perturbed system in red) d) tabulated key metrics...................... 35
Figure 15: PEM-FC operation schematic .................................................. 41
Figure 16: A-FC operating schematic ....................................................... 43
Figure 17: AAEM-FC operating schematic ............................................... 44
Figure 18: Nafion structure ....................................................................... 47
Figure 19 : The Cluster Model theory for hydrated Nafion microstructure
adapted from Gierke et al. ........................................................................ 48
Figure 20: Hoffman (E2) elimination reaction mechanism. ....................... 50
Figure 21: Direct nucleophilic degradation, Pathway 1 ............................ 51
xiv
Figure 22: Direct nucleophilic degradation, Pathway 2 ............................ 51
Figure 23: Quartz crystal microbalance double anchor electrode schematic
.................................................................................................................. 59
Figure 24: ‘Base-rig’ set up. ...................................................................... 61
Figure 25: The fuel cell humidification chamber / cell. The QCM is housed
within the holder in the translucent section to the right of the image. .... 63
Figure 26: Schematic of the final iteration of the QCM holder: a) shows the
top section of the holder, b) the bottom section with the QCM and c) the
complete holder. ........................................................................................ 65
Figure 27: The holder shown in its assembled form including the base plate
for mounting into the cell. ........................................................................ 66
Figure 28: Initial ex-situ casting process by micropipette directly onto the
microbalance surface. ................................................................................ 68
Figure 29: In-situ casting chamber – retrofitted into the translucent section
of the cell as shown in Figure 25 .............................................................. 69
Figure 30: Casting success for a a) non-diluted ionomer dispersion which
resulted in a poorly distributed ionomer layer and b) diluted ionomer
dispersion showing a significantly more uniform, well-confined ionomer layer
.................................................................................................................. 71
Figure 31: Degradation investigation rig set up. The red box shows the
additional mass spectrometer added to the system to provide off-gas
analysis. .................................................................................................... 75
Figure 32: In-situ carbonation rig. The red box indicates the additional air
inlet added to provide atmospheric CO2 to the ionomer. .......................... 77
Figure 33: Ex-situ carbonate interaction rig set up .................................. 79
Figure 34: The effect of temperature on a 6 MHz crystal microbalance’s
resonant frequency during heating and cooling ......................................... 81
Figure 35: Graphical representation of the magnitude of noise experienced
for an unperturbed microbalance operating at 55 OC and 80 OC for 5 minutes
at resonant frequency ................................................................................ 83
Figure 36: QCM frequency stability when held at a range of relative
humidities at 80 OC and under a flow of 100 ml min-1 of N2 ..................... 84
Figure 37: Cast frequency profile for a a) 12.9 nm Nafion ionomer and b) 12
nm Tokuyama AS-4 ionomer. Numbers on the Figure relate to 1) electrolyte
application to the microbalance 2) initial rapid dying phase 3) slow drying
phase and 4) subsequent new resonant frequency ..................................... 88
xv
Figure 38: SEM ionomer homogeneity scans for a) an unperturbed QCM
gold electrode b) a 33 nm AS-4 cast composite resonator ........................ 90
Figure 39: Ionomer cast boundaries on the QCM gold electrode .............. 91
Figure 40: Unperturbed and cast 37 nm Nafion composite resonator
admittance response. Key metrics tabulated for reference. ....................... 93
Figure 41: Unperturbed and 68 nm cast AS-4 composite resonator
admittance response. Key metrics tabulated for reference. ....................... 94
Figure 42: Graphical representation of the magnitude of noise experienced
for an unperturbed, Nafion and Tokuyama AAEM cast microbalance
operating at 80, 80 and 55 OC and 30% RH respectively .......................... 96
Figure 43: Nafion ionomer water uptake for 33 nm (black line) and 60 nm
(red line) thick ionomers operating through a range of RHs. The frequency
response for the 33nm composite resonator operating through the humidity
range is shown in the inset ....................................................................... 97
Figure 44: A snapshot of the CAS response for a 33 nm Nafion composite
resonator operating through a range of RHs and hydration states: (a)
admittance locus and (b) magnitude of admittance Bode plot. .............. 100
Figure 45: (a) Series resonant frequency and (b) percentage decrease in the
amplitude of admittance as a function of RH for a 33 nm Nafion composite
resonator (linear sections added as a guide to the eye). ......................... 101
Figure 46: Change in composite resonator’s resistance (R2) in the modified
BVD equivalent circuit as a function of RH (linear sections added as a guide
to the eye). .............................................................................................. 103
Figure 47: AS-4 ionomer water uptake for a 23 nm (black), 39 nm (red) and
100 nm (blue) thick ionomers operating through a range of RHs. The
frequency response for a 39 nm composite resonator operating through the
humidity range is shown in the inset ...................................................... 104
Figure 48: Segment of CAS results for a 39 nm AAEM composite resonator
operating through a range of RHs and hydration states: (a) Admittance
locus and (b) magnitude of admittance plot ........................................... 107
Figure 49: (a) Change in series resonant frequency and (b) percentage
decrease in amplitude of admittance for a 39 nm AAEM composite resonator
versus RH and hydration (linear sections added as a guide to the eye). 108
Figure 50: Change in the AS-4’s composite resonator’s resistance (R2) in the
modified BVD equivalent circuit as a function of RH (linear sections added
as a guide to the eye). ............................................................................. 110
xvi
Figure 51: The measured frequency response for a 100 nm composite
resonator when operating at temperatures between 55 OC and 65 OC. The
inset image shows a zoomed in analysis of the frequency response for the
composite resonator when operating at 65 OC. ....................................... 113
Figure 52: The measured frequency response profile for a 100 nm AS-4
composite resonator operating at 55 OC, 65 OC and again at 55 OC at 66%
RH .......................................................................................................... 114
Figure 53: The measured frequency response profile for a 100 nm AS-4
composite resonator operating at 55 OC, 65 OC and again at 55 OC at 11%
RH .......................................................................................................... 115
Figure 54: CAS response for a 100 nm AS-4 composite resonator operating
at 55 OC before (black line) and after (red line) operation at 65 OC and 11%
RH for 50 mins. Figure b inset shows an enlarged version of the ǀYǀmax peaks
for each response ..................................................................................... 117
Figure 55: The composite resonator’s percentage shift in R2 (representing
the viscoelastic change in the film) when operating before and after exposure
to elevated temperatures as a function of relative humidity. .................. 118
Figure 56: In-line mass spectrometry data for the composite resonator
operating at: a) 55C (inset shows the full relative intensity scale) and b)
65C. (the results presented here are taken at 0% RH) .......................... 120
Figure 57: Unperturbed microbalance operation under a nitrogen and
subsequently air environments at 55 OC and 40% relative humidity ...... 123
Figure 58: Resonant frequency and resistance response for a 33 nm cast
Nafion microbalance operating under a nitrogen and subsequently air
environment at 55 OC and 40% relative humidity. ................................. 124
Figure 59: The % ohmic resistance change for the A201 membranes when
operating in nitrogen (blue section) and subsequently in air containing
atmospheric carbon dioxide at 0, 50 and 100% RH at 55 C (represented as
50 s averaged intervals). ......................................................................... 125
Figure 60: (a) Transient frequency responses for AS-4 composite resonators
operating in nitrogen and subsequently in air at a range of RHs. (b) Change
in the composite resonators’ steady state frequency response when operating
in nitrogen and subsequently in air at a range of RHs. .......................... 127
Figure 61: API gravity classification ....................................................... 137
Figure 62: SARA separation analysis schematic ..................................... 138
Figure 63: In-line pig schematic .............................................................. 141
xvii
Figure 64: Typical 3-electrode electrodeposition experimental set-up ..... 150
Figure 65: Accelerated fouling detection rig Set-up ................................ 153
Figure 66: Pressurised chamber housing the microbalance holder and
elevation stage ........................................................................................ 154
Figure 67: Electrical T-piece connection schematic detailing internal wiring
channels developed from fish bone beads ................................................ 156
Figure 68: The corresponding temperature and coupling coefficients for a
GaPO4 crystal’s angle of cut, reproduced from [241]. .............................. 158
Figure 69: Temperature coefficients of GaPO4 at Y-11.1o cut compared to
AT-cut quartz, reproduced from [248]. ................................................... 159
Figure 70: Microbalance holder schematic. Manufactured in-house using one
piece of unfired pyrophyllite and rapid prototyping equipment .............. 161
Figure 71: Gamry instruments BAW holder modified for use as an eGCM
holder with an electrodeposition bath shown here a) closed and b) open,
indicating its operation. .......................................................................... 162
Figure 72: eGCM electrodeposition bath set up for iron electrodeposition
................................................................................................................ 163
Figure 73: QCM frequency response for operation between 25 OC and 600
OC, showing failure at 435 OC [255]. ........................................................ 166
Figure 74: GCM frequency response for operation up to 900 OC, showing a
reduced temperature coefficient between 400 – 600 OC [255] .................. 167
Figure 75: Measured and calculated GCM temperature profiles for operation
between 50 OC and 600 OC. ..................................................................... 167
Figure 76: GCM temperature stability shown at temperatures between 300
OC and 600 OC. ....................................................................................... 169
Figure 77: The crude-GCM composite resonator shown here before heating
to disperse the heavy crude. .................................................................... 170
Figure 78: The frequency response for a GCM-crude sample heated between
150 – 530 OC in order to determine the composite resonator’s critical
temperature. ........................................................................................... 171
Figure 79: CAS responses for the GCM-crude resonator operating at
temperature between 176 – 245 OC in order to determine the ‘true’ critical
temperature. ........................................................................................... 173
Figure 80: The heating and cooling frequency responses for a GCM-crude
resonator operating between 215 – 530 OC ............................................. 174
Figure 81: The frequency shift for a QCM (black plot) and a GCM (red
plot) for operation under pressure between 1 and 8 bar (gauge). ........... 176
xviii
Figure 82: QCM frequency stability when operating at pressures between 1-
8 bar ....................................................................................................... 177
Figure 83: GCM frequency stability when operating at pressures between 1-
8 bar ....................................................................................................... 178
Figure 84: The admittance response for a QCM operating in pressurised
environments of 1 – 8 bar. ...................................................................... 179
Figure 85: The admittance response for a GCM operating in pressurised
environments of 1 – 8 bar. ...................................................................... 180
Figure 86: eGCM response for iron electrodeposition when the system is held
at -15 mA for 4 s (literature plating values). ....................................... 183
Figure 87: Literature coated iron electrodeposited iGCM SEM and EDX
analysis ................................................................................................... 184
Figure 88: Relevant plating negative potential section of a cyclic
voltammogram employing the electrodeposition setup described in Figure
72, with a GCM working electrode ......................................................... 185
Figure 89: eGCM frequency response for the iron electrodeposition process
when the system is held at -0.9 mA for 80s. ........................................... 186
Figure 90: Calculated value plating procedure iGCM, where the dark grey
central area shows the addition of the iron layer to the platinum double
anchor electrode. ..................................................................................... 187
Figure 91: Calculated coat iron electrodeposited iGCM SEM and EDX
analysis ................................................................................................... 188
Figure 92: iGCM CAS responses for the a) literature and b) calculated
platings, indicating minimal change to the system’s Q-factor as a result of
iron electrodeposition of 10.9 and 17.4 ng respectively ........................... 190
Figure 93: iGCM frequency stability when operating in an environment of
flowing argon (100 ml min-1) at a range of temperatures between 250 – 600
OC ........................................................................................................... 191
Figure 94: iGCM frequency stability when operated in argon at pressures
between 1 – 8 bar. .................................................................................. 192
Figure 95: iGCM frequency response when held under two test conditions
of 250 OC at 5 bar (black line) and 350 OC at 3 bar (red line). .............. 193
Figure 96: The active iGCM response when in contact with ~ 0.01 mg of
heavy vacuum residue. The response is initially taken after composite
resonator stabilisation and the inset image shows the active response
between achieving TC and reporting a stable frequency response. .......... 194
xix
Figure 97: The admittance response for the iGCM in contact with 0.01 mg
of heavy vacuum residue before and after being held at 300 OC and 3.5 bar.
Key metrics are also presented ............................................................... 196
Figure 98: X-ray tomography reconstructions of a) the iron – crude interface
on the GCM and b) a zoomed in image of the same. ............................. 198
List of Tables Table 1: Base case ZView2 fitting data ........................................................... 31
Table 2: All known properties for the Nafion and Tokuyama dispersions ...... 67
Table 3: Frequency data for cast a) Nafion and b) AS-4 ionomers and their
corresponding mass changes and subsequent thickness’ .................................. 86
Table 4: Mass number peaks registered in Figure 56b when the composite
resonator is operating at 65C and suggested corresponding elements and
hydrocarbon fractures. ............................................................................ 121
Table 5: Traditional crude oil composition [158]. ................................... 136
Table 6: Asphaltene heteroatom’s common functional groups ................ 142
Table 7: Piezocryst’s GCM frequency and temperature relationship
nomenclature........................................................................................... 168
Table 8: Temperature vs. θmin ................................................................. 172

1
1 Introduction
The effects of global warming and the price volatility associated with fossil
fuels and traditional electricity generation methods has resulted in a clear
demand for renewable energy technologies. Electricity currently generated
from renewable sources such as solar and wind is intermittent resulting in
an unreliable supply and subsequently unpredictable strains on the grid.
These technologies therefore require advancements in grid storage solutions
coupled with balancing and demand shaping to be truly widespread. Recent
advancements in alkaline anion-exchange membrane (AAEM) fuel cells have
however provided an avenue for a scalable, constant and stable electricity
generation mechanism when supplied with hydrogen. Fuel cells are not yet
without challenges, and require extensive research to elucidate issues per-
taining to early on-set degradation, durability issues and importantly cost
($/kW) parity compared to existing electricity generators.
The renewable energy forecast is very promising and will undoubtedly play
a large role in meeting our future energy demands and improving our envi-
ronmental outlook. However, until achieving the above outlined improve-
ments the world will continue to rely on the more consistent current elec-
tricity generation mechanisms such as fossil fuels to meet its ever increasing
demand. It is therefore imperative that we continue to improve the efficien-
cies of, and advance these existing technologies during the transition to a
renewable energy reliant low carbon economy.
Crude oil has long provided the world with its most plentiful fuel resource,
however dwindling traditional reserves have recently forced refineries to
draw on the more abundant heavy crude oil supply. Advancements in heavy
crude refining has meant it can now produce similar products to traditional
crude during the refining process. Heavy crude oil supplies contain more
variable compositions of ‘harsh ingredients’ such as saturates, aromatics,
resins and asphaltenes (SARAs) between wells. The presence of SARAs and
particularly destabilised asphaltenes in heavy crude oil systems can lead to
unpredictable fouling throughout the production chain causing severe flow
assurance, safety and economic issues. Without a better fundamental un-
derstanding of the factors that affect the fouling properties of a particular
2
oil blend, there will continue to be uncertainty over the transport and re-
finement of heavy crude oil within the industry. This will hinder the effi-
cient, cost-effective production of consumer ready fuels, resulting in contin-
ued price volatilities.
In order to both improve existing and help develop promising future energy
technologies, a better fundamental understanding of what happens at the
interfacial level in complex processes is vital. Advanced non-intrusive in-situ
interfacial investigations can provide real-time structural and morphological
characterisation as processes occur, providing new insight into the effect of
operating conditions and guiding future technological developments.
There are many in-situ analytical methods to study interfaces, one of which
is the application of a bulk acoustic wave resonator (BAW) such as a pie-
zoelectric crystal microbalance.
BAW resonators comprise a thin piezoelectric material (for example quartz)
sandwiched between two metal electrodes. When an alternating electrical
field is introduced across the BAW resonator, it results in a vibrational
motion at the piezoelectric material’s resonant frequency. The resonant fre-
quency varies for each resonator and is dependent on the electrode mass; it
is this unique feature that gives rise to the piezoelectric microbalance’s abil-
ity to measure interfacial mass changes with nanogram resolution.
BAW resonators represent a mature mass measurement method, especially
in their application of mass deposition and depletion in the gas phase. BAW
resonator operation in both viscoelastic media and harsh environments (tem-
peratures and pressures) is less well established and is discussed in further
detail throughout this work.
This thesis outlines the development of BAW resonators for use as in-situ
monitoring devices to characterize complex processes in the viscoelastic
phase. The study is divided into two distinct sections; the first concentrating
on the interfacial properties of a novel alkaline anion-exchange membrane
fuel cell ionomer, whilst the second part focuses on the fouling detection and
characterisation occurring in heavy crude oil in transition pipelines and re-
finery equipment.
3
1.1 The Fuel Cell Application
Fuel cells are seen as one of the big contributors in the development of the
low carbon economy; with a wide range available, they are a diverse power
producer. With no point-of-use emissions or particulates and no moving
parts in the stack, fuel cells can potentially provide a large part of the an-
swer to our growing energy demand. However, fuel cells and particularly
low-temperature proton exchange membrane fuel cells (PEM-FCs) are not
without challenges and have struggled for commercialization, mainly due to
electro-catalyst cost and durability issues.
Alkaline anion-exchange membrane (AAEM) fuel cells are a novel solid pol-
ymer electrolyte (SPE) version of the alkaline fuel cell (A-FC). Operating
in an alkaline medium has the benefit of more facile oxygen reduction kinet-
ics at the cathode, compared to traditional acid-based PEM-FCs, and
AAEM fuel cells are therefore able to utilize more cost-effective non-precious
metal catalysts. The AAEM is expected to negate many of the issues expe-
rienced with the aqueous A-FC, such as carbonate salt precipitation when
operated in the presence of CO2 from the air and also issues pertaining to
transport and the use of a caustic electrolyte.
AAEMs are at a relatively early stage of development and face specific (of-
ten hydration-related) technological challenges compared to PEMs as out-
lined below.
- As with all SPEs, the AAEM’s water management, uptake,
sorption mechanisms, swelling characteristics and stability gov-
ern its operation and performance efficiency. However with ad-
ditional cationic groups (often quaternary ammonium groups,
R4N+) added to the AAEM to improve conductivity, there have
been reported incidents of reduced mechanical strength and
chemical stability of the membrane during hydration. With in-
consistent literature results as discussed in Section 3.2.4.1, un-
derstanding of these mechanisms for system integration is am-
biguous and cannot be relied upon.
4
- Chemical instability and degradation mechanisms that arise as
a result of increased operating temperature and specifically E2
(Hofmann) elimination have been demonstrated for several
AAEMs when operating at temperatures ≥ 65 OC, consequently
reducing kinetic advantage. At elevated temperatures, the OH-
conducting ions have been shown to irreversibly cleave the teth-
ered cationic head groups from the polymer backbone reducing
its ionic conductivity.
- Finally, with immobilised cations (in contrast to the A-FC),
carbonate ion interaction and subsequent precipitation of salts
are unlikely when operating in air; however, varying degrees of
performance effects have been seen within the literature as dis-
cussed in Section 3.2.4.3.
This work employs a composite (AAEM ionomer-cast, surface developed)
quartz crystal microbalance (QCM) along with crystal admittance spectros-
copy (CAS) to explore each of the above phenomena for interfacial charac-
terisation of a commercially available AAEM as a function of its hydration
state and under various operating conditions.
1.2 Heavy Crude Oil Fouling Detection
The world’s ever-increasing energy consumption, coupled with its dwindling
conventional fuel supplies and the associated price volatility, has led a push
towards new technologies such as fuel cells and other future renewables.
However, with technological bariers to overcome before wide-spread
implementation, the world will continue to rely on traditional electricity
generation mechanisms such as crude oil. It is therefore crucial that there is
a continued focus on improving the power conversion efficiencies of tradi-
tional and non-traditional resources such as ‘heavy’ crude oil.
Crude oil has for a long time served the world as its largest energy vector;
however, with depleting supplies, refineries are beginning to draw on the
5
more abundant heavy crude oil reserves. Whilst these heavy crudes can pro-
duce similar products to their lighter counterparts during the refining pro-
cess, they also contain a larger, more variable composition of SARA compo-
nents, which in their raw forms can cause severe fouling of transmission
pipelines and refinery equipment.
Fouling is one of the oil industry’s biggest issues; resulting in either down-
time to clean or replace sections of pipe, as well as leading to increased
pressure drops which may result in burst pipelines and well heads, loss of
product and environmental disaster. Fouling occurs primarily as a result of
asphaltene destabilisation and is currently treated through rejection or con-
version of the precipitating products. However, current monitoring and mit-
igation feedback systems are time intensive, high volume studies which do
not allow the refinery and drilling experts to react quickly enough to chang-
ing oil grades.
This study in collaboration with the Qatar National Research Fund (QNRF)
outlines the development of a rapid, low volume on site feedback system for
fouling characterisation in pseudo- pipelines and refinery equipment using a
high-temperature BAW resonator.
The investigation uses an iron electrodeposited gallium orthophosphate mi-
crobalance (iGCM) in contact with a heavy crude oil sample with the ability
to operate under a range of conditions to provide an end-user device with
the necessary flow assurance information required to implement fouling re-
jection or conversion techniques.
The chapter also outlines the efficiency, development and characterisation
of the electrodeposited-iron GCM (iGCM) through the innovative applica-
tion of the electrochemical GCM (eGCM). It shows the stable operation of
the iGCM under the investigative range of conditions and shows an early
example of the system’s combined functionality, implementing both active
and passive oscillation coupled with X-ray tomography reconstructions to
provide new insight into the phenomena occurring at the iron – oil interface.
6
2 Literature Review
2.1 Bulk Acoustic Wave Resonators
Bulk acoustic wave (BAW) resonators is a name given to a unique range of
devices that work using the piezoelectric effect. BAW devices have been
researched for many decades for applications such as sonar, frequency con-
trol and in particular military communications [1]. In recent years, however,
both the cost and size of these devices have reduced significantly, leading to
a growing interest in the field. BAW resonators have become very popular
as a means for nonintrusive in-situ mass measurement for their nanogram
resolution and small size; these are sometimes referred to as crystal micro-
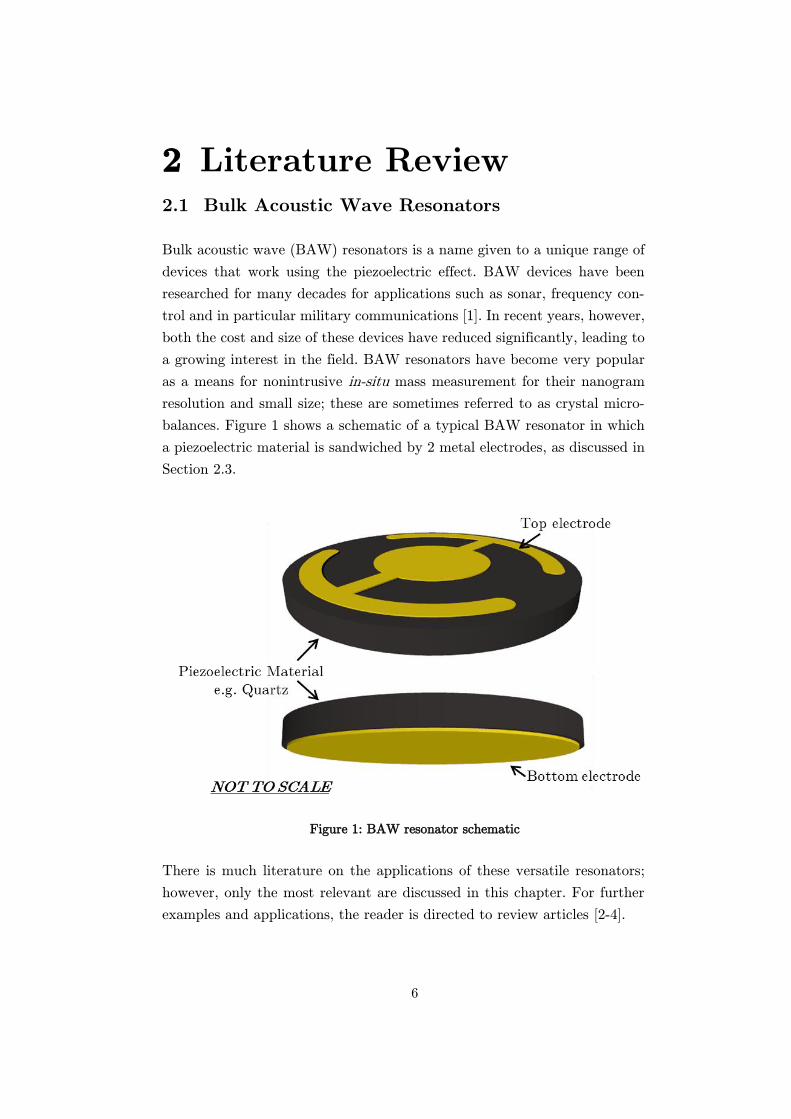
balances. Figure 1 shows a schematic of a typical BAW resonator in which
a piezoelectric material is sandwiched by 2 metal electrodes, as discussed in
Section 2.3.
Figure 1: BAW resonator schematic
There is much literature on the applications of these versatile resonators;
however, only the most relevant are discussed in this chapter. For further
examples and applications, the reader is directed to review articles [2-4].
7
2.2 The Piezoelectric Effect
Piezoelectricity or ‘pressure electricity’ was first coined by the Curie broth-
ers Pierre and Jacques in 1880. They demonstrated that the application of
a mechanical stress to certain crystal materials (Rochelle salt, tourmaline
and quartz for example) resulted in an electrical polarization across the
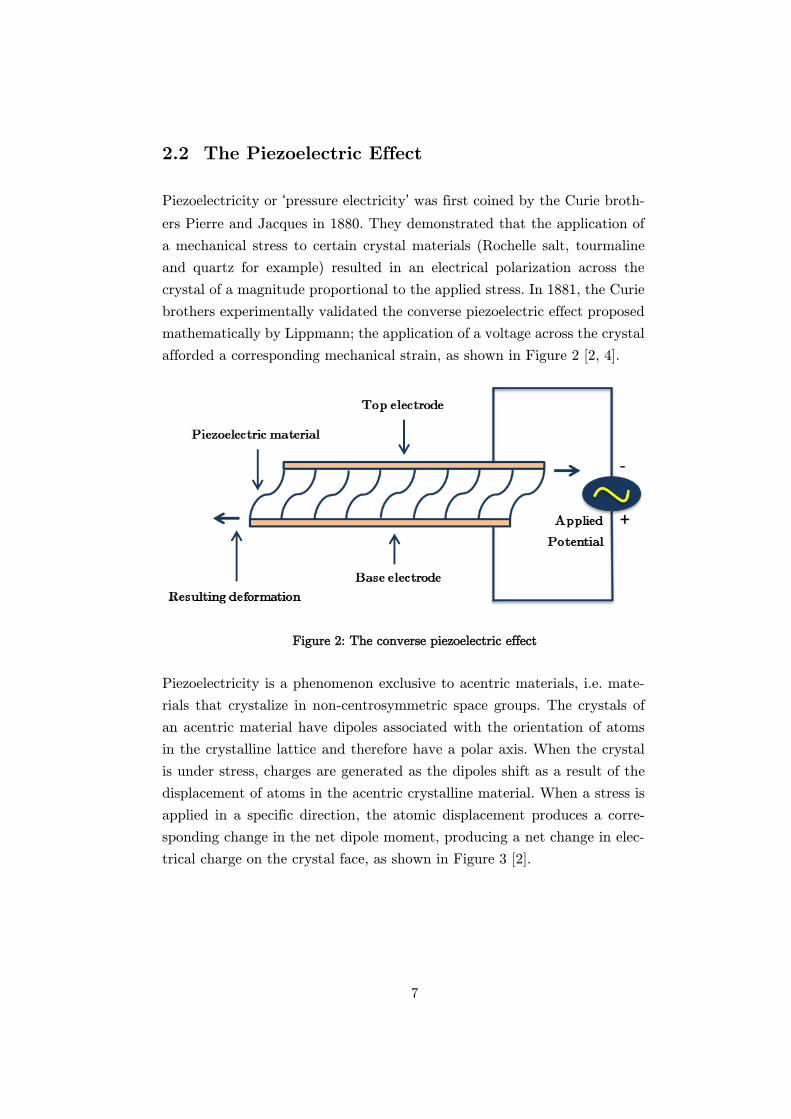
crystal of a magnitude proportional to the applied stress. In 1881, the Curie
brothers experimentally validated the converse piezoelectric effect proposed
mathematically by Lippmann; the application of a voltage across the crystal
afforded a corresponding mechanical strain, as shown in Figure 2 [2, 4].
Figure 2: The converse piezoelectric effect
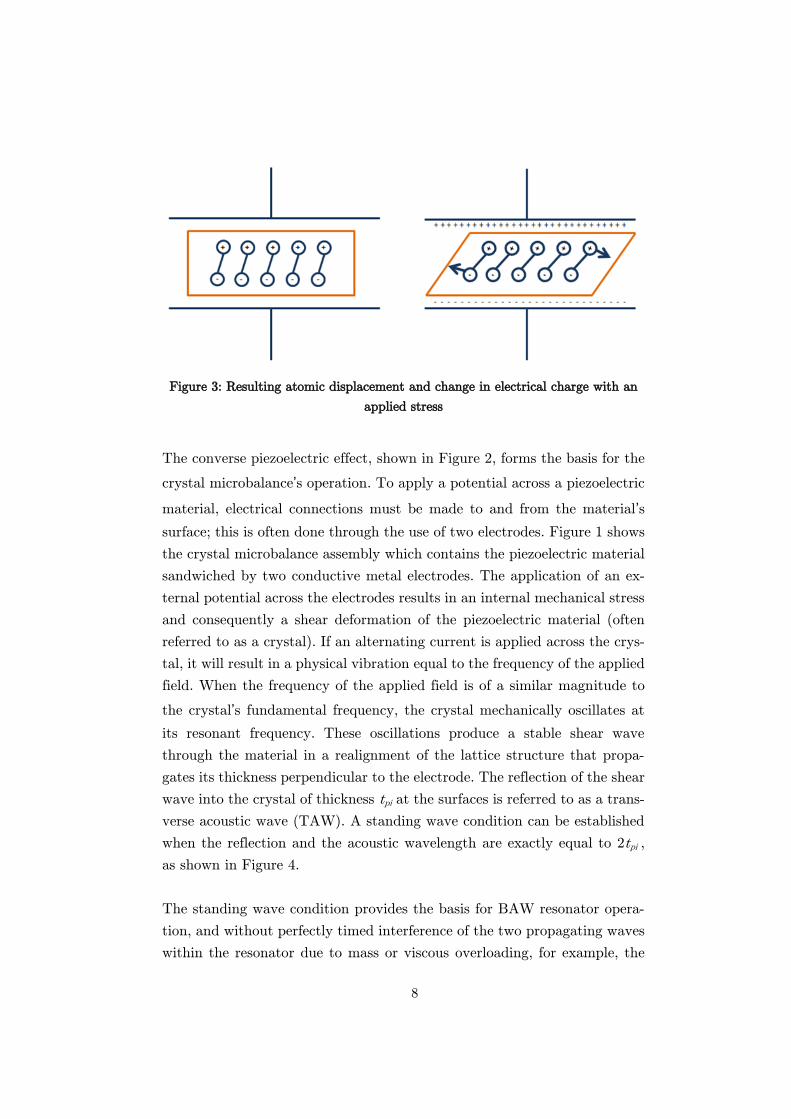
Piezoelectricity is a phenomenon exclusive to acentric materials, i.e. mate-
rials that crystalize in non-centrosymmetric space groups. The crystals of
an acentric material have dipoles associated with the orientation of atoms
in the crystalline lattice and therefore have a polar axis. When the crystal
is under stress, charges are generated as the dipoles shift as a result of the
displacement of atoms in the acentric crystalline material. When a stress is
applied in a specific direction, the atomic displacement produces a corre-
sponding change in the net dipole moment, producing a net change in elec-
trical charge on the crystal face, as shown in Figure 3 [2].
8
Figure 3: Resulting atomic displacement and change in electrical charge with an
applied stress
The converse piezoelectric effect, shown in Figure 2, forms the basis for the
crystal microbalance’s operation. To apply a potential across a piezoelectric
material, electrical connections must be made to and from the material’s
surface; this is often done through the use of two electrodes. Figure 1 shows
the crystal microbalance assembly which contains the piezoelectric material
sandwiched by two conductive metal electrodes. The application of an ex-
ternal potential across the electrodes results in an internal mechanical stress
and consequently a shear deformation of the piezoelectric material (often
referred to as a crystal). If an alternating current is applied across the crys-
tal, it will result in a physical vibration equal to the frequency of the applied
field. When the frequency of the applied field is of a similar magnitude to
the crystal’s fundamental frequency, the crystal mechanically oscillates at
its resonant frequency. These oscillations produce a stable shear wave
through the material in a realignment of the lattice structure that propa-
gates its thickness perpendicular to the electrode. The reflection of the shear
wave into the crystal of thickness tpi at the surfaces is referred to as a trans-
verse acoustic wave (TAW). A standing wave condition can be established
when the reflection and the acoustic wavelength are exactly equal to 2tpi ,
as shown in Figure 4.
The standing wave condition provides the basis for BAW resonator opera-
tion, and without perfectly timed interference of the two propagating waves
within the resonator due to mass or viscous overloading, for example, the
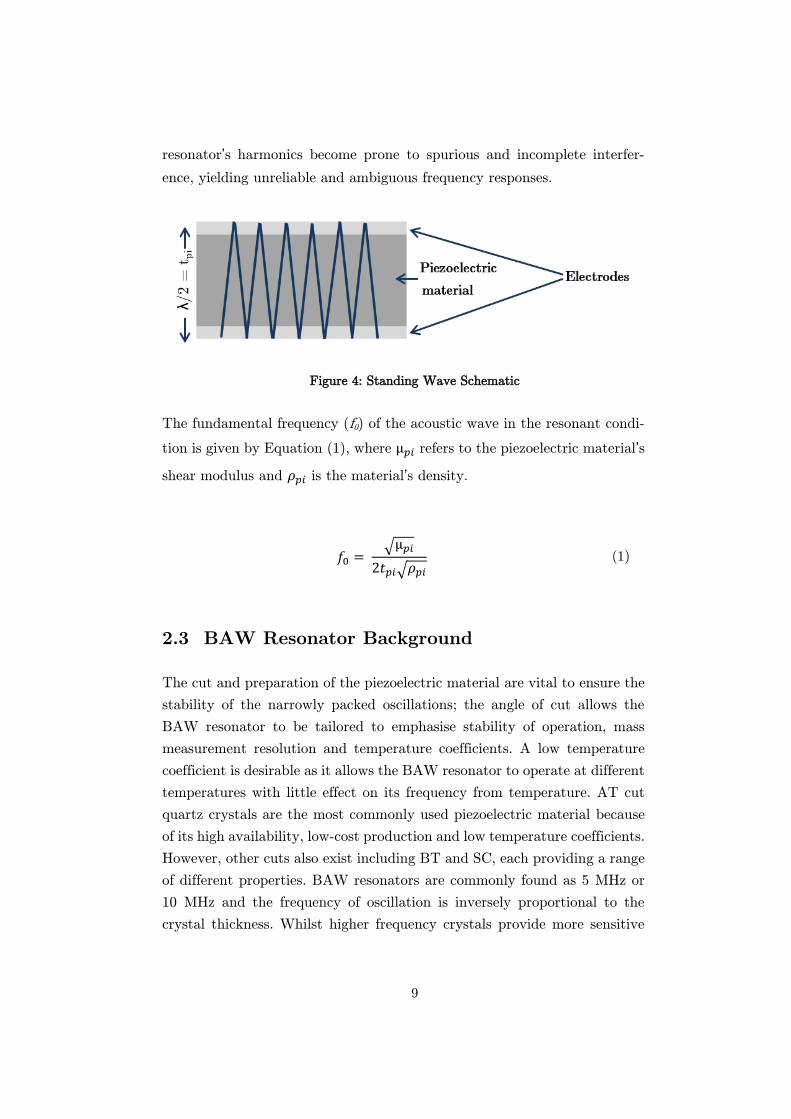
9
resonator’s harmonics become prone to spurious and incomplete interfer-
ence, yielding unreliable and ambiguous frequency responses.
Figure 4: Standing Wave Schematic
The fundamental frequency (f0) of the acoustic wave in the resonant condi-
tion is given by Equation (1), where µ𝑝𝑖 refers to the piezoelectric material’s
shear modulus and 𝜌𝑝𝑖 is the material’s density.
𝑓0 = √µ𝑝𝑖
2𝑡𝑝𝑖√𝜌𝑝𝑖
(1)
2.3 BAW Resonator Background
The cut and preparation of the piezoelectric material are vital to ensure the
stability of the narrowly packed oscillations; the angle of cut allows the
BAW resonator to be tailored to emphasise stability of operation, mass
measurement resolution and temperature coefficients. A low temperature
coefficient is desirable as it allows the BAW resonator to operate at different
temperatures with little effect on its frequency from temperature. AT cut
quartz crystals are the most commonly used piezoelectric material because
of its high availability, low-cost production and low temperature coefficients.
However, other cuts also exist including BT and SC, each providing a range
of different properties. BAW resonators are commonly found as 5 MHz or
10 MHz and the frequency of oscillation is inversely proportional to the
crystal thickness. Whilst higher frequency crystals provide more sensitive
10
data analysis, they are also more difficult to handle as the material is thin-
ner, more brittle and difficult to use, as explained by Equation (1).
BAW resonators can be thought of as an energy storage device by removing
the external input; in the absence of any loss mechanism a BAW resonator
should theoretically oscillate at its natural frequency indefinitely, however,
this is not the case as energy dissipates to the surroundings. A BAW reso-
nator’s ability to store (or lose) energy gives rise to a crystal classification
system known as its quality or Q-factor. The Q-factor is defined as the ratio
of the energy stored per cycle to the energy dissipated per cycle [3] and is
typically greater than 105 in air, [4] but is reduced in contact with liquid /
viscoelastic media [2]. The Q-factors of a resonator operated in different
environments can be represented through phase angle plots developed when
passively operating the resonator, as discussed in Section 2.5.
2.3.1 Mass Monitoring
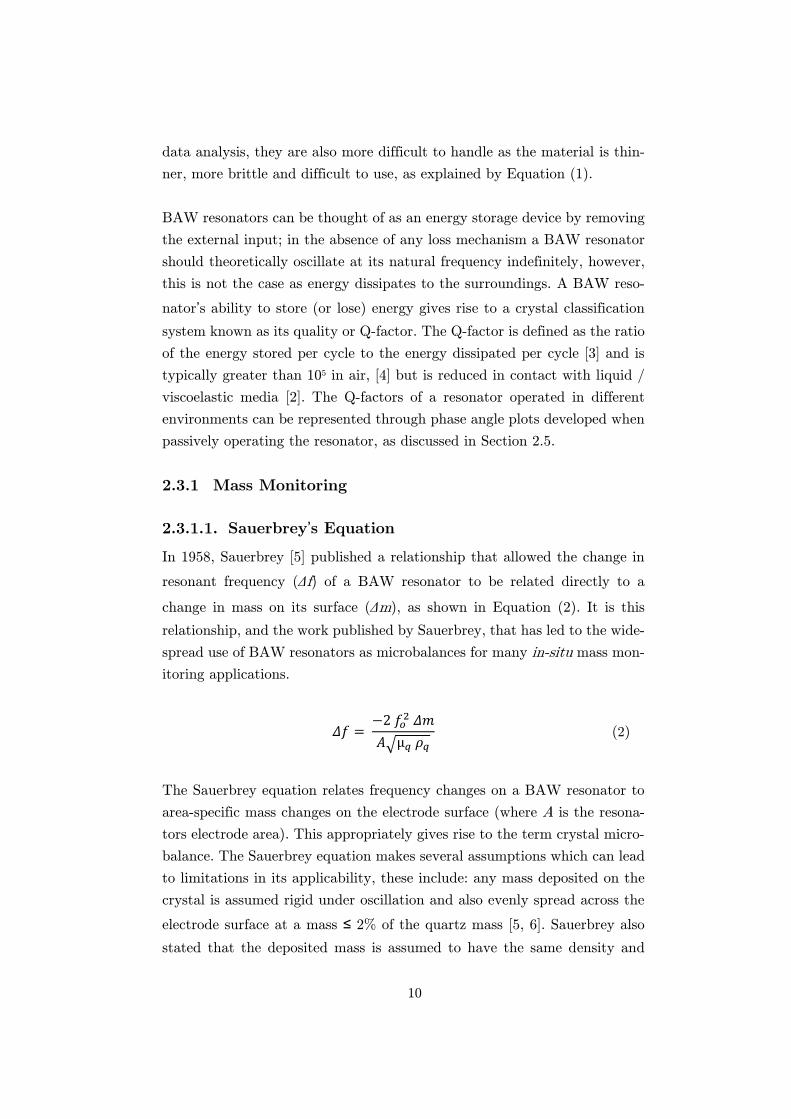
Sauerbrey’s Equation
In 1958, Sauerbrey [5] published a relationship that allowed the change in
resonant frequency (Δf) of a BAW resonator to be related directly to a
change in mass on its surface (Δm), as shown in Equation (2). It is this
relationship, and the work published by Sauerbrey, that has led to the wide-
spread use of BAW resonators as microbalances for many in-situ mass mon-
itoring applications.
𝛥𝑓 = −2 𝑓𝑜
2 𝛥𝑚
𝐴√µ𝑞 𝜌𝑞
(2)
The Sauerbrey equation relates frequency changes on a BAW resonator to
area-specific mass changes on the electrode surface (where A is the resona-
tors electrode area). This appropriately gives rise to the term crystal micro-
balance. The Sauerbrey equation makes several assumptions which can lead
to limitations in its applicability, these include: any mass deposited on the
crystal is assumed rigid under oscillation and also evenly spread across the
electrode surface at a mass ≤ 2% of the quartz mass [5, 6]. Sauerbrey also
stated that the deposited mass is assumed to have the same density and
11
transverse velocity as the quartz. The relationship states that the frequency
shift resulting from a mass deposited at some radial distance from the centre
of the crystal will be the same regardless of the radial distance [2]. Finally,
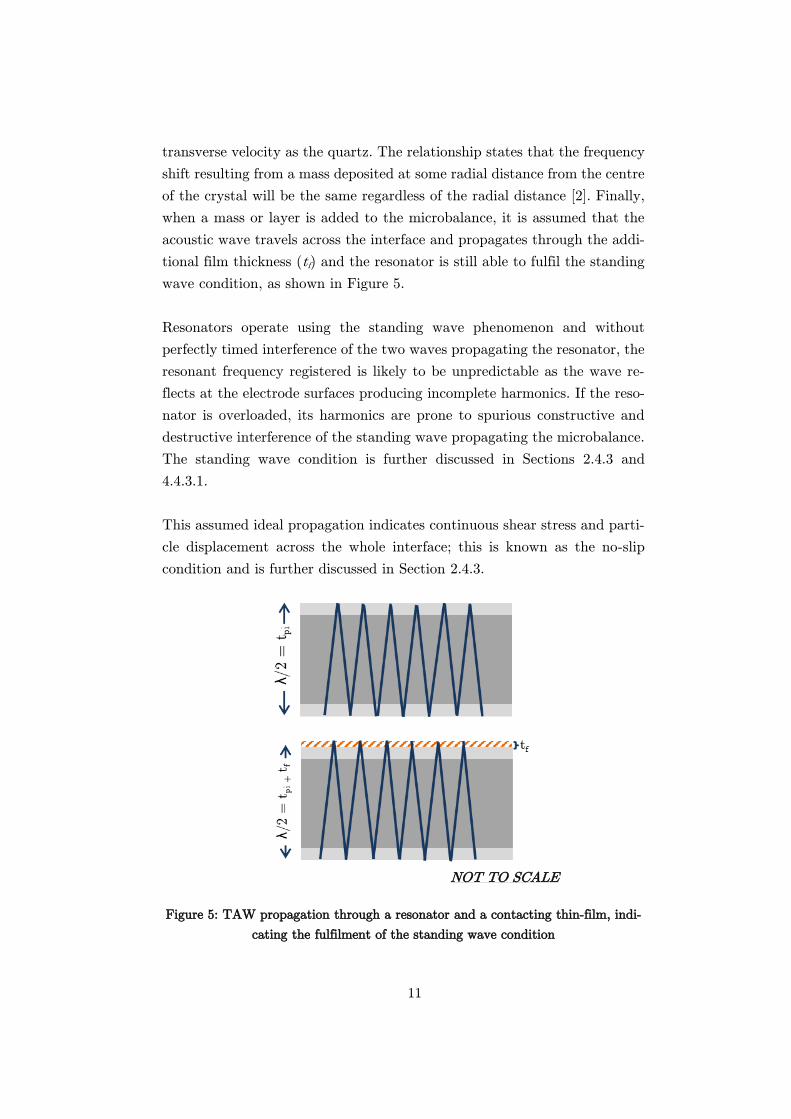
when a mass or layer is added to the microbalance, it is assumed that the
acoustic wave travels across the interface and propagates through the addi-
tional film thickness (tf) and the resonator is still able to fulfil the standing
wave condition, as shown in Figure 5.
Resonators operate using the standing wave phenomenon and without
perfectly timed interference of the two waves propagating the resonator, the
resonant frequency registered is likely to be unpredictable as the wave re-
flects at the electrode surfaces producing incomplete harmonics. If the reso-
nator is overloaded, its harmonics are prone to spurious constructive and
destructive interference of the standing wave propagating the microbalance.
The standing wave condition is further discussed in Sections 2.4.3 and
4.4.3.1.
This assumed ideal propagation indicates continuous shear stress and parti-
cle displacement across the whole interface; this is known as the no-slip
condition and is further discussed in Section 2.4.3.
Figure 5: TAW propagation through a resonator and a contacting thin-film, indi-
cating the fulfilment of the standing wave condition
NOT TO SCALE
12
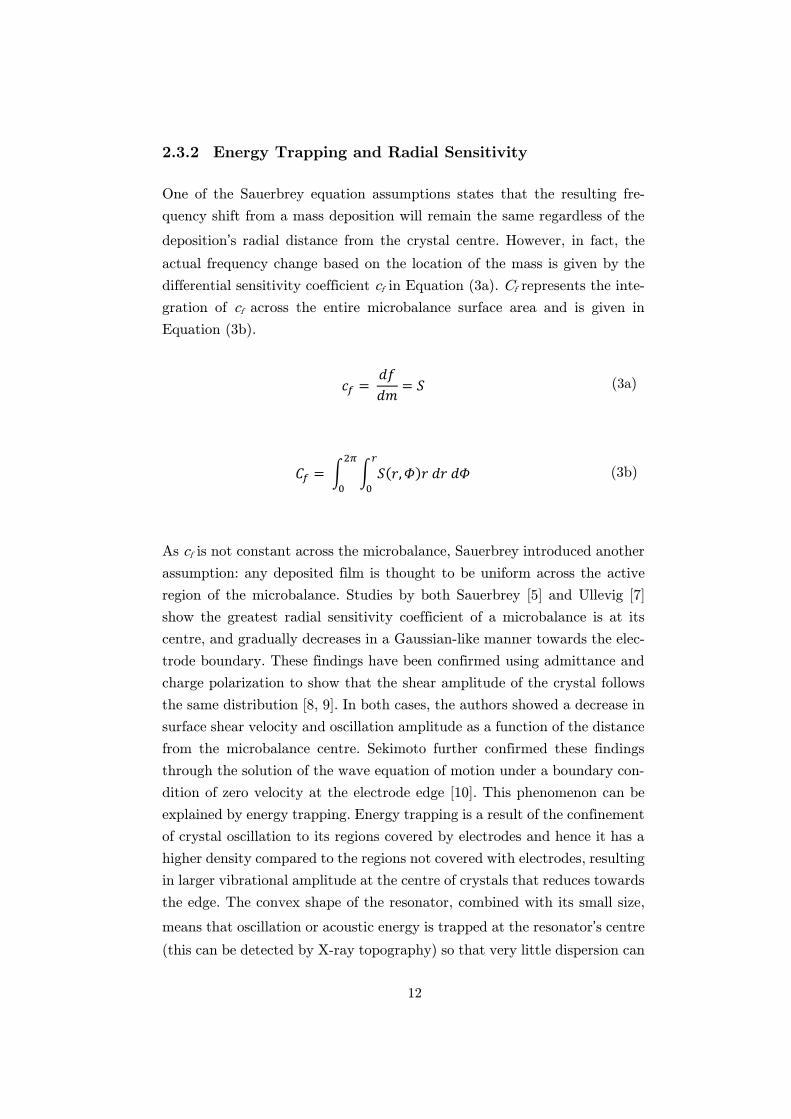
2.3.2 Energy Trapping and Radial Sensitivity
One of the Sauerbrey equation assumptions states that the resulting fre-
quency shift from a mass deposition will remain the same regardless of the
deposition’s radial distance from the crystal centre. However, in fact, the
actual frequency change based on the location of the mass is given by the
differential sensitivity coefficient cf in Equation (3a). Cf represents the inte-
gration of cf across the entire microbalance surface area and is given in
Equation (3b).
𝑐𝑓 = 𝑑𝑓
𝑑𝑚= 𝑆 (3a)
𝐶𝑓 = ∫ ∫ 𝑆(𝑟, 𝛷)𝑟 𝑑𝑟 𝑑𝛷𝑟
0
2𝜋
0
(3b)
As cf is not constant across the microbalance, Sauerbrey introduced another
assumption: any deposited film is thought to be uniform across the active
region of the microbalance. Studies by both Sauerbrey [5] and Ullevig [7]
show the greatest radial sensitivity coefficient of a microbalance is at its
centre, and gradually decreases in a Gaussian-like manner towards the elec-
trode boundary. These findings have been confirmed using admittance and
charge polarization to show that the shear amplitude of the crystal follows
the same distribution [8, 9]. In both cases, the authors showed a decrease in
surface shear velocity and oscillation amplitude as a function of the distance
from the microbalance centre. Sekimoto further confirmed these findings
through the solution of the wave equation of motion under a boundary con-
dition of zero velocity at the electrode edge [10]. This phenomenon can be
explained by energy trapping. Energy trapping is a result of the confinement
of crystal oscillation to its regions covered by electrodes and hence it has a
higher density compared to the regions not covered with electrodes, resulting
in larger vibrational amplitude at the centre of crystals that reduces towards
the edge. The convex shape of the resonator, combined with its small size,
means that oscillation or acoustic energy is trapped at the resonator’s centre
(this can be detected by X-ray topography) so that very little dispersion can
13
occur at the edge. In most resonators this area is approached by the shape
of the electrodes, this is the phenomenon known as energy trapping.
The energy trapping studies discussed above indicate the crystal is most
sensitive at its centre. Thus in any work conducted, it is vital to ensure that
coatings or loadings occur exclusively to a finite yet evenly spread / con-
sistent area at the crystal electrode surface. Specific microbalance holder
designs should ensure that any effects that may be felt from energy trapping
will be limited or mitigated.
BAW resonators have been used extensively in the gas phase for in-situ
mass monitoring and these applications are well documented elsewhere [3,
4]. This project however concentrates on the application of the BAW reso-
nator in contact with viscoelastic media and so forms the main focus of the
following sections.
2.4 Viscoelastic film / Liquid operation
2.4.1 Background
Whilst crystal microbalances have been commonly employed for nanogram
mass detection in the gas phase, early adopters found operation in liquid
media to be a much more difficult feat. It was widely accepted that the
viscous hydrodynamic effects would cause excessive damping of the oscilla-
tion that would lead to inaccurate mass measurements [11].
However, in 1979, Nomura and Hattori [12] investigated the effect that cy-
anide solution had on a silver surface using a quartz crystal microbalance
with a silver coated electrode, suspended in a cyanide solution. They were
unable to record in-situ changes in frequency and instead took dry frequency
readings before and after submersion into the cyanide solution. Whilst there
are of course many potential inaccuracies with this pseudo-in-situ method,
it is the earliest record of crystal microbalance operation in the liquid phase.
The in-situ operation of a piezoelectric microbalance in the liquid phase was
first achieved in 1980 by Konash and Bastiaans [13]. This work used a res-
onator with only one face exposed to the liquid phase and the other exposed
14
to air. The crystal’s behaviour was studied in a flow cell set up to simulate
liquid chromatography. They found that the crystal’s resonant frequency
differed with each liquid tested and attributed these changes to density or
surface adsorption. In 1982, Nomura and Okuhara [14] confirmed this single
electrode exposure operation. Their work continued to show that the crystal
was able to oscillate in a variety of solutions and organic solvents and sub-
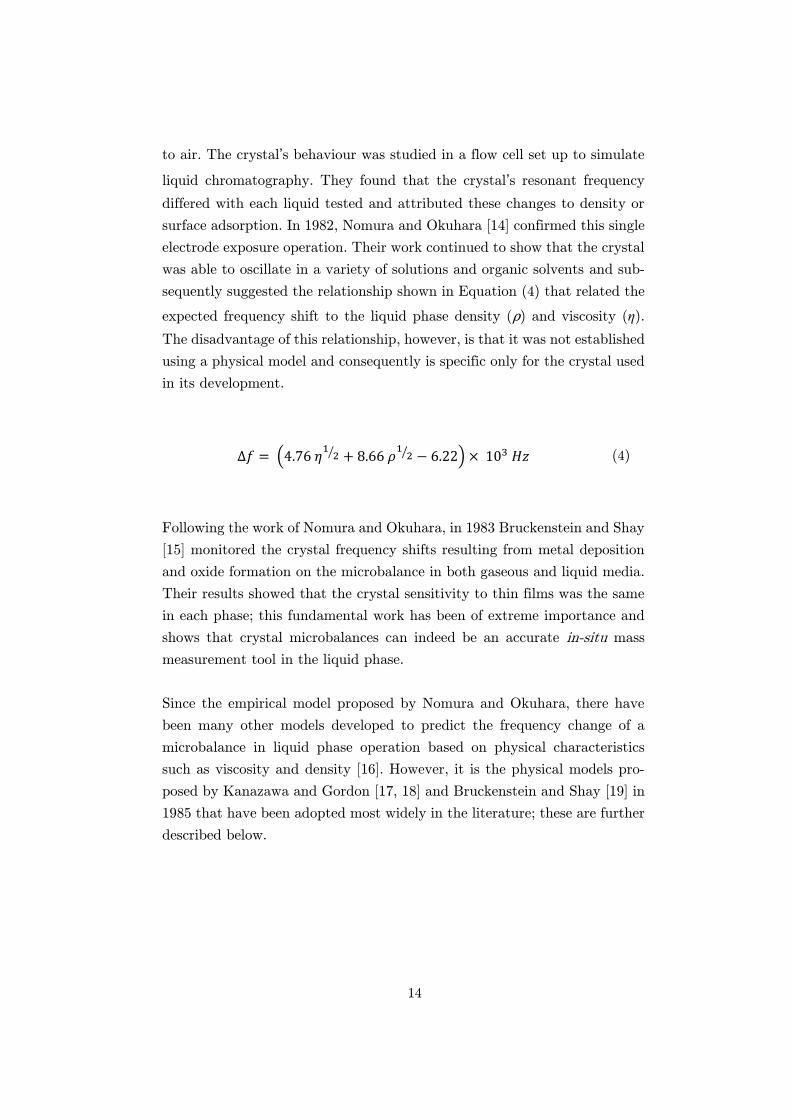
sequently suggested the relationship shown in Equation (4) that related the
expected frequency shift to the liquid phase density (ρ) and viscosity (η).
The disadvantage of this relationship, however, is that it was not established
using a physical model and consequently is specific only for the crystal used
in its development.
∆𝑓 = (4.76 𝜂1
2⁄ + 8.66 𝜌1
2⁄ − 6.22) × 103 𝐻𝑧 (4)
Following the work of Nomura and Okuhara, in 1983 Bruckenstein and Shay
[15] monitored the crystal frequency shifts resulting from metal deposition
and oxide formation on the microbalance in both gaseous and liquid media.
Their results showed that the crystal sensitivity to thin films was the same
in each phase; this fundamental work has been of extreme importance and
shows that crystal microbalances can indeed be an accurate in-situ mass
measurement tool in the liquid phase.
Since the empirical model proposed by Nomura and Okuhara, there have
been many other models developed to predict the frequency change of a
microbalance in liquid phase operation based on physical characteristics
such as viscosity and density [16]. However, it is the physical models pro-
posed by Kanazawa and Gordon [17, 18] and Bruckenstein and Shay [19] in
1985 that have been adopted most widely in the literature; these are further
described below.
15
Kanazawa and Gordon
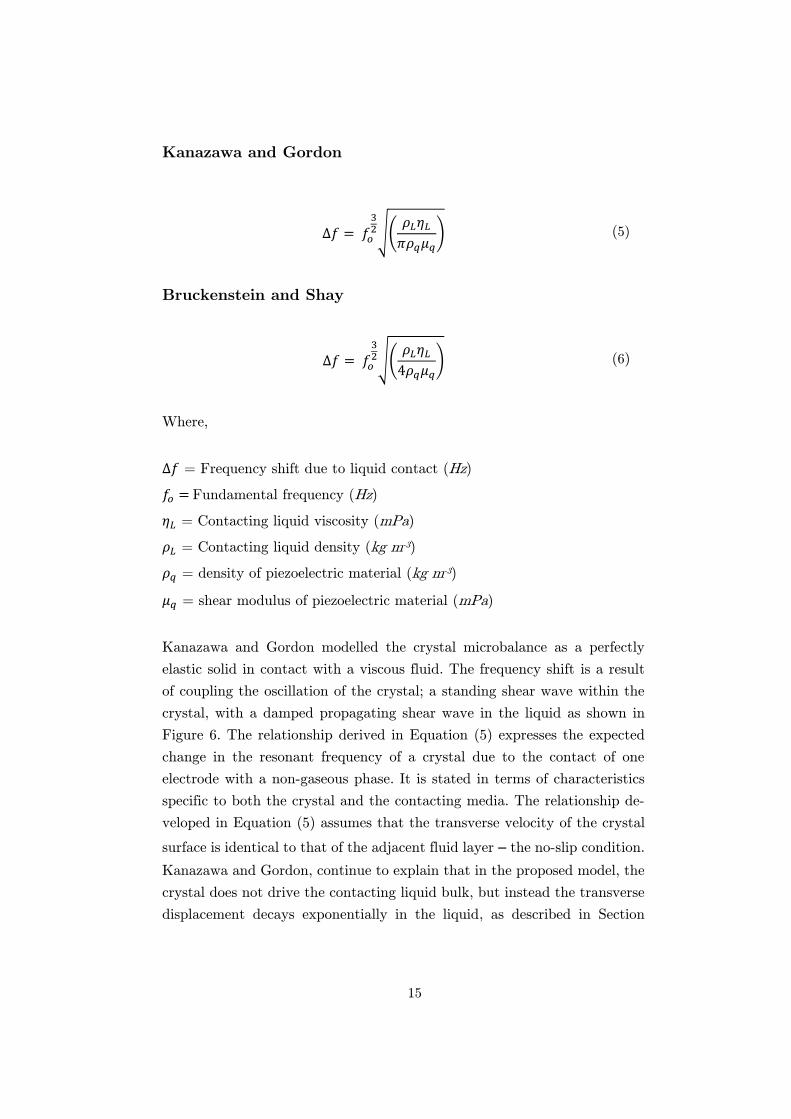
∆𝑓 = 𝑓𝑜
32√(
𝜌𝐿𝜂𝐿
𝜋𝜌𝑞𝜇𝑞) (5)
Bruckenstein and Shay
∆𝑓 = 𝑓𝑜
32√(
𝜌𝐿𝜂𝐿
4𝜌𝑞𝜇𝑞) (6)
Where,
∆𝑓 = Frequency shift due to liquid contact (Hz)
𝑓𝑜 = Fundamental frequency (Hz)
𝜂𝐿 = Contacting liquid viscosity (mPa)
𝜌𝐿 = Contacting liquid density (kg m-3)
𝜌𝑞 = density of piezoelectric material (kg m-3)
𝜇𝑞 = shear modulus of piezoelectric material (mPa)
Kanazawa and Gordon modelled the crystal microbalance as a perfectly
elastic solid in contact with a viscous fluid. The frequency shift is a result
of coupling the oscillation of the crystal; a standing shear wave within the
crystal, with a damped propagating shear wave in the liquid as shown in
Figure 6. The relationship derived in Equation (5) expresses the expected
change in the resonant frequency of a crystal due to the contact of one
electrode with a non-gaseous phase. It is stated in terms of characteristics
specific to both the crystal and the contacting media. The relationship de-
veloped in Equation (5) assumes that the transverse velocity of the crystal
surface is identical to that of the adjacent fluid layer – the no-slip condition.
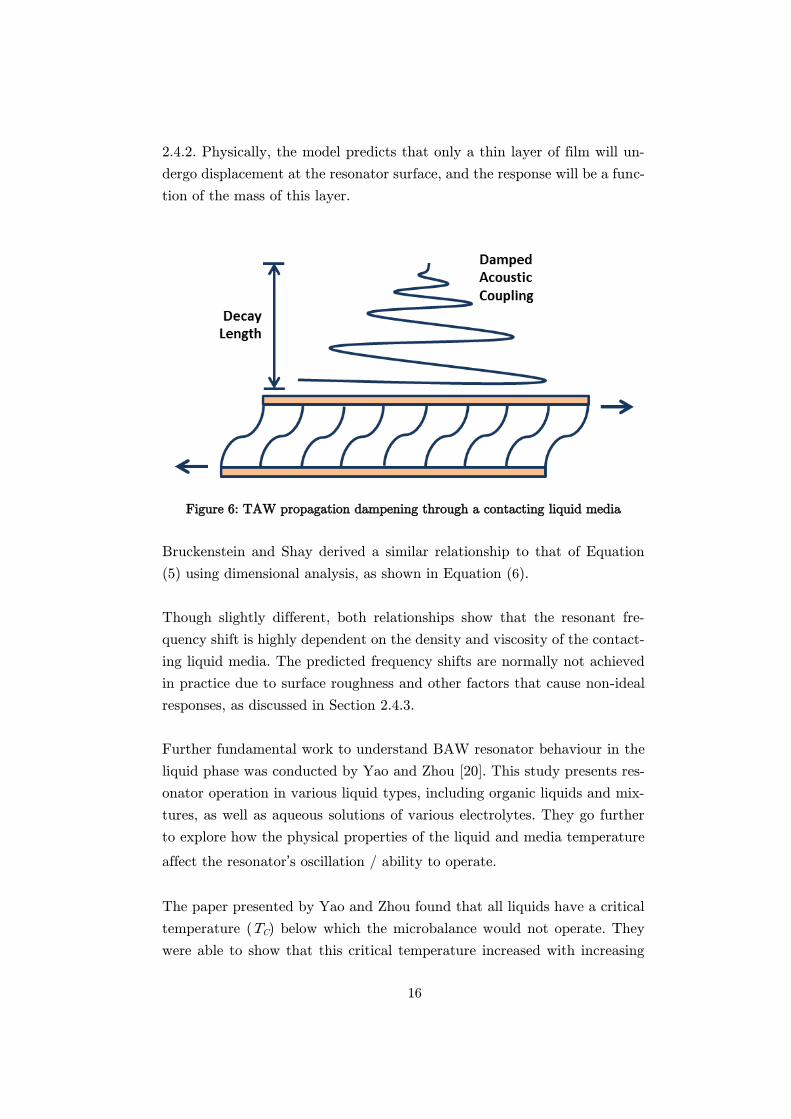
Kanazawa and Gordon, continue to explain that in the proposed model, the
crystal does not drive the contacting liquid bulk, but instead the transverse
displacement decays exponentially in the liquid, as described in Section
16
2.4.2. Physically, the model predicts that only a thin layer of film will un-
dergo displacement at the resonator surface, and the response will be a func-
tion of the mass of this layer.
Figure 6: TAW propagation dampening through a contacting liquid media
Bruckenstein and Shay derived a similar relationship to that of Equation
(5) using dimensional analysis, as shown in Equation (6).
Though slightly different, both relationships show that the resonant fre-
quency shift is highly dependent on the density and viscosity of the contact-
ing liquid media. The predicted frequency shifts are normally not achieved
in practice due to surface roughness and other factors that cause non-ideal
responses, as discussed in Section 2.4.3.
Further fundamental work to understand BAW resonator behaviour in the
liquid phase was conducted by Yao and Zhou [20]. This study presents res-
onator operation in various liquid types, including organic liquids and mix-
tures, as well as aqueous solutions of various electrolytes. They go further
to explore how the physical properties of the liquid and media temperature
affect the resonator’s oscillation / ability to operate.
The paper presented by Yao and Zhou found that all liquids have a critical
temperature (TC) below which the microbalance would not operate. They
were able to show that this critical temperature increased with increasing
17
concentration of electrolyte in an aqueous solution. Similarly, they proved
that in an organic liquid, the critical temperature also increases with longer
carbon chains. The work also shows that grounding their detection cell re-
duced the critical operating temperature, allowing the crystal to operate at
colder temperatures. However, when grounding the cell for operation in long
chain organic solvents (of particular interest in Chapter 4) this decrease in
temperature was hardly experienced, suggesting it works only with liquids
with greater dielectric constants or electrical conductance.
2.4.2 Viscous Phase Oscillation Fundamentals
When a crystal is operating with one electrode in solution and one electrode
open to air, a negative frequency shift is experienced from operation in air
alone. The oscillation dampening experienced is a result of the electrome-
chanical coupling of the shear transverse wave and the mechanical proper-
ties of the contacting medium that are reflected in the resonator’s electrical
response, as discussed above. The damped transverse wave propagates per-
pendicular to the plane of the shear deformation with its amplitude dimin-
ishing exponentially until it reaches zero at its decay depth (δ); described in
Figure 6 and Equation (7).
The oscillation energy from the resonator is converted to thermal energy
within the solution as the TAW diminishes. The rate of energy conversion
from oscillation to thermal is dependent on the coupling of the electrode to
the liquid phase and the ability of the TAW to penetrate the liquid. The
decay depth is given by Equation (7) where ηL, ρL and ω are the contacting
liquid’s viscosity, density and resonator’s angular excitation frequency re-
spectively.
𝛿 = √(2𝜂𝐿
𝜔𝜌𝐿) (7)
18
2.4.3 Non-ideal Resonator Response
Whilst it has been well established that a microbalance’s frequency changes
while operating in the liquid phase, it must be noted that these shifts cannot
be solely attributed to changes in mass on the electrode, as given by the
Sauerbrey equation [5].
Equations (5) and (6) developed by Kanazawa and Gordon [18] and Bruck-
enstein and Shay [19] have shown that a microbalance operating in solution
is sensitive to changes in both the solution’s density and viscosity. Viscous
coupling of the contacting liquid medium to the crystal surface results in
both a decrease in its resonant frequency and resonance dampening. The
effect of an increasing viscoelasticity of the contacting film / media on the
crystal electrode has been described by Martin et al. [21] and also Topart
and Noel [22]. In both cases they showed increases in the media’s viscosity,
resulting in a reduction of the resonant frequency, but showed no sign of
mass deposition.
Factors other than viscoelasticity that contribute to non-ideal Sauerbrey
Equation resonator responses include the following (for a more extensive
review, the reader is referred to [2]):
Surface Roughness
The electrode surface stress and roughness have been found to affect the
resonant frequency as described by Schumacher et al. [23, 24]. The surface
roughness refers specifically to the microscopic roughness seen on the BAW
resonator’s electrodes. The electrode roughness traps liquid within its cavi-
ties and crevices; the unexpected trapped liquid causes an additional mass
on the resonator and hence a reduced resonant frequency, whilst not pur-
posefully loading the microbalance.
Radial Mass Sensitivity
As discussed in Section 2.3.2, though the vibration within a BAW resonator
is concentrated in the electrode-covered regions, the BAW resonator does
suffer from radial mass sensitivity. This can cause skewed frequency re-
sponses; however, the introduction of plano-convex resonators coupled with
uniform mass distribution significantly reduces this issue [7].
19
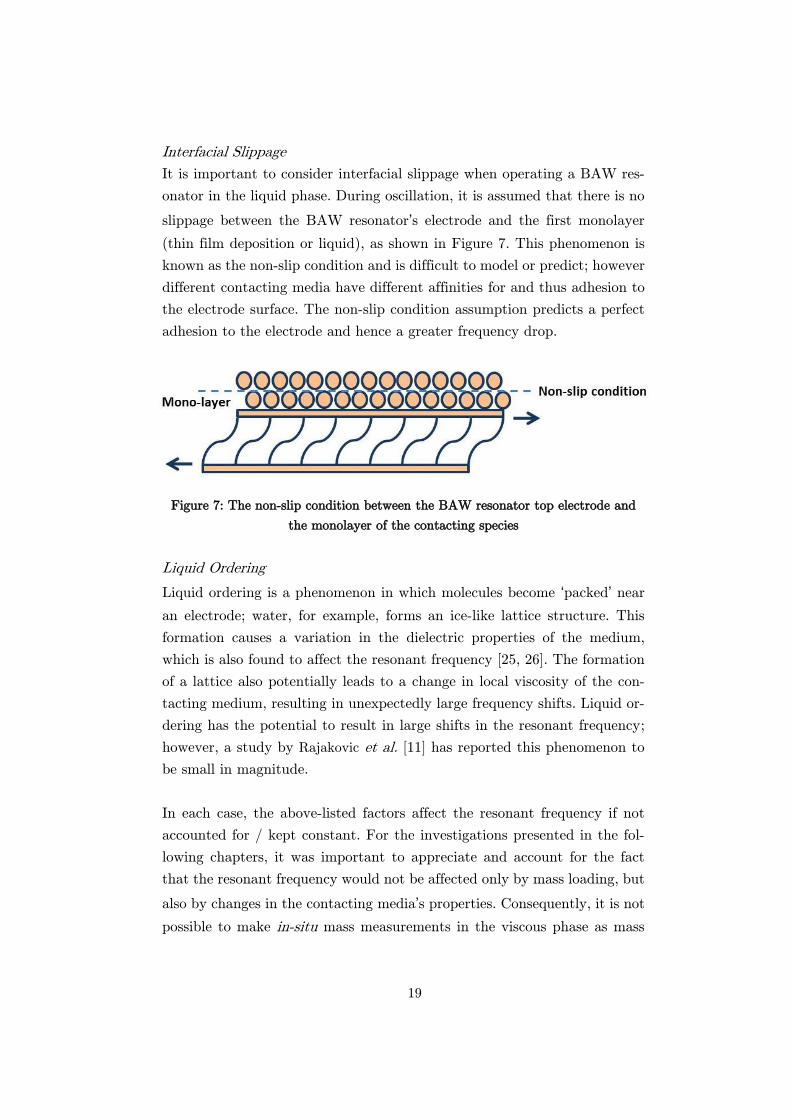
Interfacial Slippage
It is important to consider interfacial slippage when operating a BAW res-
onator in the liquid phase. During oscillation, it is assumed that there is no
slippage between the BAW resonator’s electrode and the first monolayer
(thin film deposition or liquid), as shown in Figure 7. This phenomenon is
known as the non-slip condition and is difficult to model or predict; however
different contacting media have different affinities for and thus adhesion to
the electrode surface. The non-slip condition assumption predicts a perfect
adhesion to the electrode and hence a greater frequency drop.
Figure 7: The non-slip condition between the BAW resonator top electrode and
the monolayer of the contacting species
Liquid Ordering
Liquid ordering is a phenomenon in which molecules become ‘packed’ near
an electrode; water, for example, forms an ice-like lattice structure. This
formation causes a variation in the dielectric properties of the medium,
which is also found to affect the resonant frequency [25, 26]. The formation
of a lattice also potentially leads to a change in local viscosity of the con-
tacting medium, resulting in unexpectedly large frequency shifts. Liquid or-
dering has the potential to result in large shifts in the resonant frequency;
however, a study by Rajakovic et al. [11] has reported this phenomenon to
be small in magnitude.
In each case, the above-listed factors affect the resonant frequency if not
accounted for / kept constant. For the investigations presented in the fol-
lowing chapters, it was important to appreciate and account for the fact
that the resonant frequency would not be affected only by mass loading, but
also by changes in the contacting media’s properties. Consequently, it is not
possible to make in-situ mass measurements in the viscous phase as mass
20
loading rather than changes to the liquid media through active frequency
measurements alone.
However, techniques such as crystal impedance (or admittance) spectros-
copy [2, 27] can measure the electrical characteristics of a BAW resonator
over a range of frequencies near resonance; simplifying frequency contribu-
tions and thus providing a more accurate representation of the phenomena
occurring at the interface.
The interaction between the mechanical displacement and electrical poten-
tial in a BAW resonator causes mechanical interactions between the BAW
resonator and the contacting media to influence its electrical characteristics,
particularly near the resonant frequency, i.e. maximum amplitude [2, 28].
The BAW resonator’s electrical characteristics can be evaluated using crys-
tal impedance or admittance (the reciprocal of impedance) spectroscopy;
defined as the ratio of the measured current output for an applied voltage.
The admittance provides significant information about the system such as
energy stored and power dissipation in both the BAW resonator and per-
turbing media.
2.5 Crystal Impedance / Admittance Spectroscopy
BAW resonators can be operated in one of two ways; (i) active operation in
which the microbalance operates at its resonant frequency allowing active
measurements of frequency changes; (ii) passive operation requires the mi-
crobalance to be connected to an external instrument which applies a sinus-
oidal voltage at a range of frequencies near the crystal’s resonant frequency
- crystal admittance spectroscopy (CAS). The resulting voltages are then
measured and the electrical characteristics of the resonator can be deter-
mined [16]. CAS allows the deviation from rigidity of a surface film on a
microbalance to be determined.
The CAS data can be analysed using equivalent circuits in which the reso-
nator’s electrical responses can be interpreted as mechanical properties of
the surface film perturbation. This technique can provide useful insight into
the physical properties of surface rigid mass and viscoelastic layers, as well
as contacting liquid media, this is further discussed in Section 0.
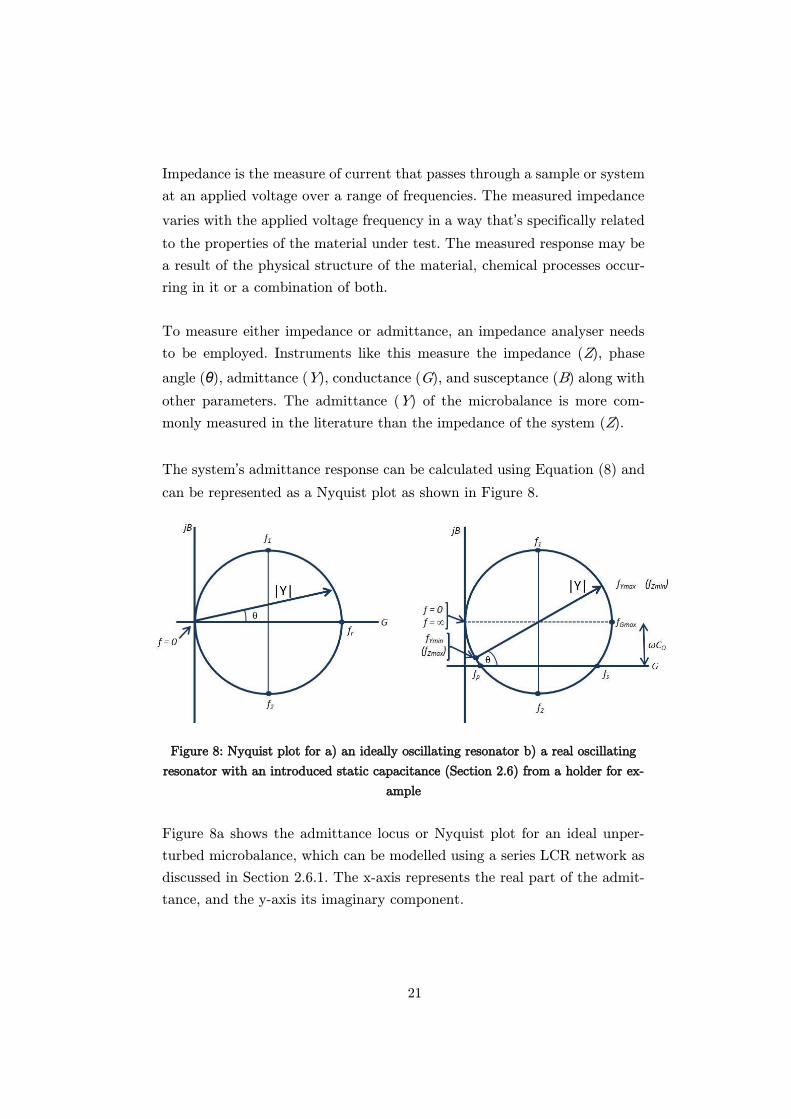
21
Impedance is the measure of current that passes through a sample or system
at an applied voltage over a range of frequencies. The measured impedance
varies with the applied voltage frequency in a way that’s specifically related
to the properties of the material under test. The measured response may be
a result of the physical structure of the material, chemical processes occur-
ring in it or a combination of both.
To measure either impedance or admittance, an impedance analyser needs
to be employed. Instruments like this measure the impedance (Z), phase
angle (θ), admittance (Y), conductance (G), and susceptance (B) along with
other parameters. The admittance (Y) of the microbalance is more com-
monly measured in the literature than the impedance of the system (Z).
The system’s admittance response can be calculated using Equation (8) and
can be represented as a Nyquist plot as shown in Figure 8.
Figure 8: Nyquist plot for a) an ideally oscillating resonator b) a real oscillating
resonator with an introduced static capacitance (Section 2.6) from a holder for ex-
ample
Figure 8a shows the admittance locus or Nyquist plot for an ideal unper-
turbed microbalance, which can be modelled using a series LCR network as
discussed in Section 2.6.1. The x-axis represents the real part of the admit-
tance, and the y-axis its imaginary component.
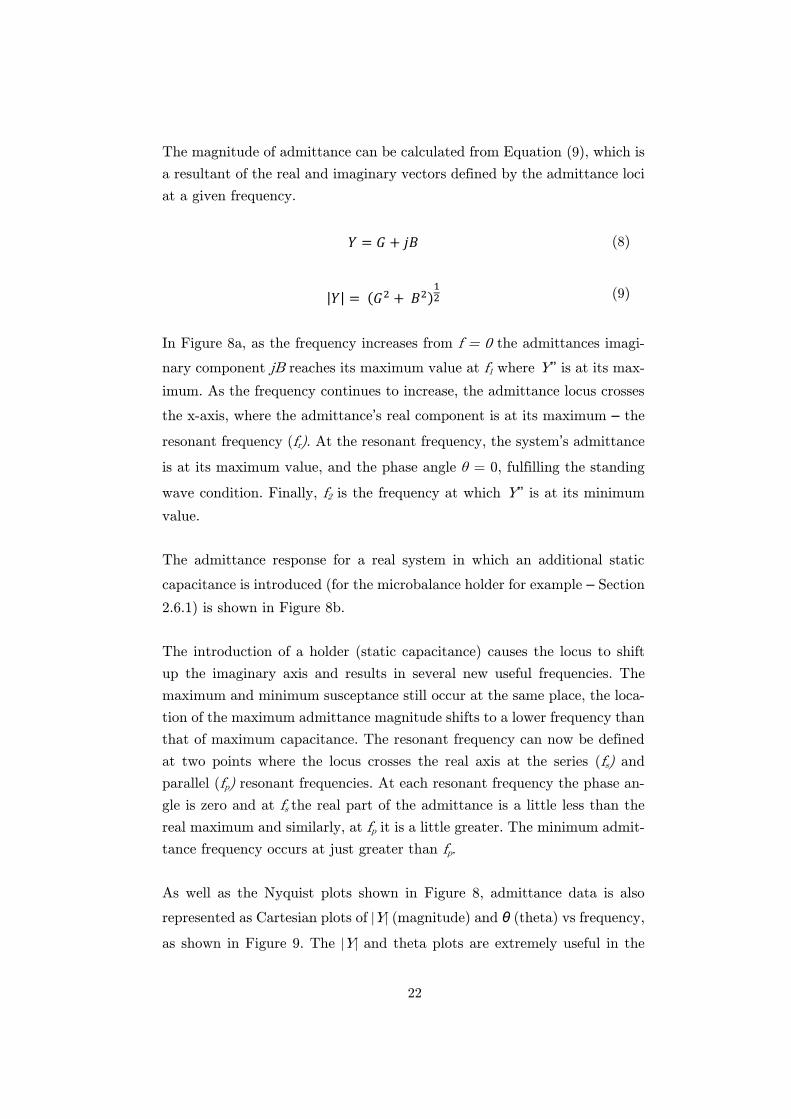
22
The magnitude of admittance can be calculated from Equation (9), which is
a resultant of the real and imaginary vectors defined by the admittance loci
at a given frequency.
𝑌 = 𝐺 + 𝑗𝐵 (8)
|𝑌| = (𝐺2 + 𝐵2)12 (9)
In Figure 8a, as the frequency increases from f = 0 the admittances imagi-
nary component jB reaches its maximum value at f1 where Y’’ is at its max-
imum. As the frequency continues to increase, the admittance locus crosses
the x-axis, where the admittance’s real component is at its maximum – the
resonant frequency (fr). At the resonant frequency, the system’s admittance
is at its maximum value, and the phase angle θ = 0, fulfilling the standing
wave condition. Finally, f2 is the frequency at which Y’’ is at its minimum
value.
The admittance response for a real system in which an additional static
capacitance is introduced (for the microbalance holder for example – Section
2.6.1) is shown in Figure 8b.
The introduction of a holder (static capacitance) causes the locus to shift
up the imaginary axis and results in several new useful frequencies. The
maximum and minimum susceptance still occur at the same place, the loca-
tion of the maximum admittance magnitude shifts to a lower frequency than
that of maximum capacitance. The resonant frequency can now be defined
at two points where the locus crosses the real axis at the series (fs) and
parallel (fp) resonant frequencies. At each resonant frequency the phase an-
gle is zero and at fs the real part of the admittance is a little less than the
real maximum and similarly, at fp it is a little greater. The minimum admit-
tance frequency occurs at just greater than fp.
As well as the Nyquist plots shown in Figure 8, admittance data is also
represented as Cartesian plots of |Y| (magnitude) and θ (theta) vs frequency,
as shown in Figure 9. The |Y| and theta plots are extremely useful in the
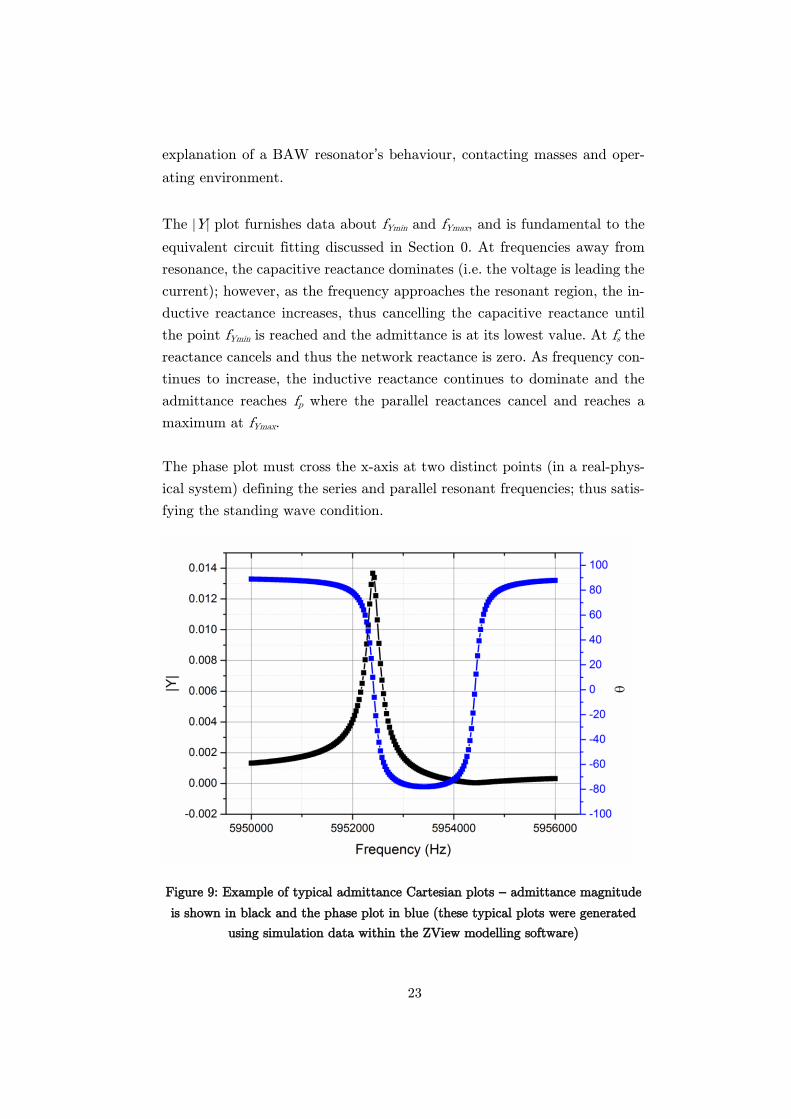
23
explanation of a BAW resonator’s behaviour, contacting masses and oper-
ating environment.
The |Y| plot furnishes data about fYmin and fYmax, and is fundamental to the
equivalent circuit fitting discussed in Section 0. At frequencies away from
resonance, the capacitive reactance dominates (i.e. the voltage is leading the
current); however, as the frequency approaches the resonant region, the in-
ductive reactance increases, thus cancelling the capacitive reactance until
the point fYmin is reached and the admittance is at its lowest value. At fs the
reactance cancels and thus the network reactance is zero. As frequency con-
tinues to increase, the inductive reactance continues to dominate and the
admittance reaches fp where the parallel reactances cancel and reaches a
maximum at fYmax.
The phase plot must cross the x-axis at two distinct points (in a real-phys-
ical system) defining the series and parallel resonant frequencies; thus satis-
fying the standing wave condition.
Figure 9: Example of typical admittance Cartesian plots – admittance magnitude
is shown in black and the phase plot in blue (these typical plots were generated
using simulation data within the ZView modelling software)
24
2.6 Equivalent Circuit Representation
Equivalent circuits are commonly applied to understanding the physical
properties of a system analysed using electrochemical impedance spectros-
copy (EIS) [29, 30]. This approach can also be used to better understand
the phenomena occurring on the BAW resonator interface. With only a few
lumped elements, an equivalent circuit simulates the electrical-mechanical
characteristics of the BAW resonator over a range of frequencies near reso-
nance. The model relates the circuit elements to physical microbalance prop-
erties, as well as any deposited layers or surrounding media. Fitting and
understanding how circuit components relate to electrical measurements
greatly facilitates the system characterisation and allows mass loading and
viscoelastic properties to be better deciphered.
2.6.1 Unperturbed Microbalance Equivalent Circuit
Figure 10: Lumped parameter dashpot schematic
The electrochemical properties of a piezoelectric resonator can be modelled
on a system consisting of lumped parameter elements of mass, compliance
(an object’s ability to yield elastically when a force is applied) and resistance
based on a ‘dashpot’ mechanical model of a mass M attached to a spring of
compliance Cm and a piston with friction r, as shown in Figure 10. Cady [31]
and subsequently Bottom represented this model by a series of lumped pa-
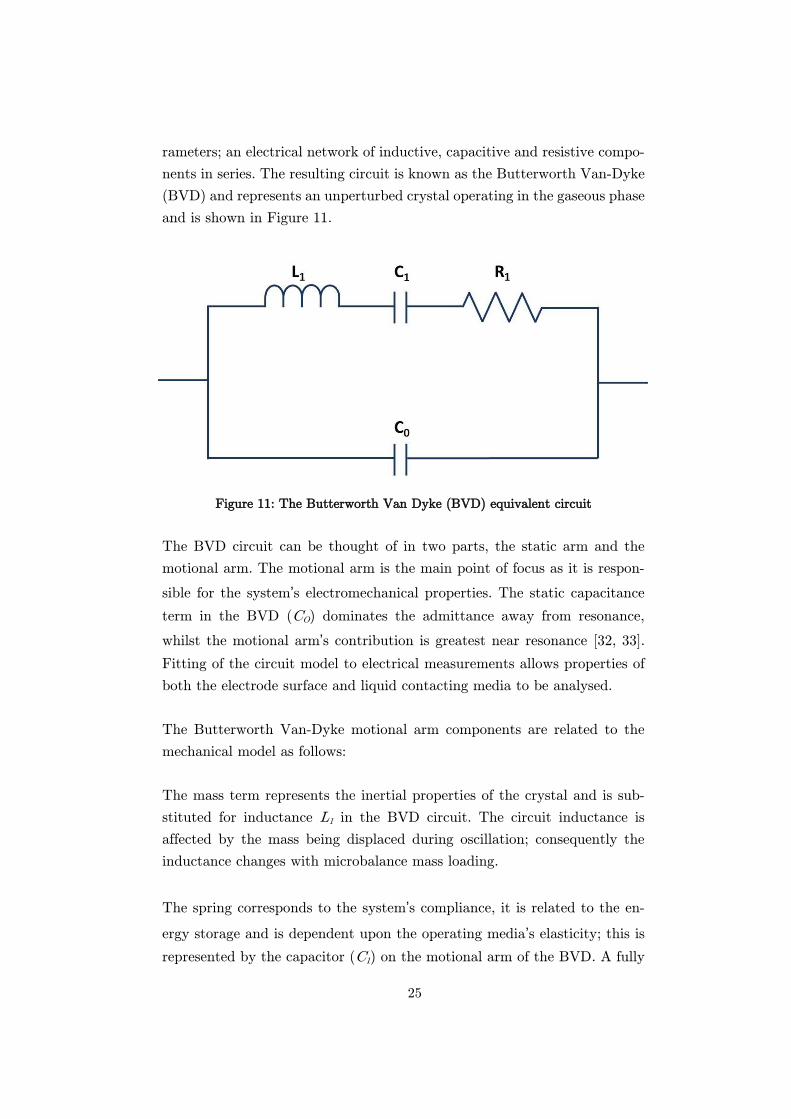
25
rameters; an electrical network of inductive, capacitive and resistive compo-
nents in series. The resulting circuit is known as the Butterworth Van-Dyke
(BVD) and represents an unperturbed crystal operating in the gaseous phase
and is shown in Figure 11.
Figure 11: The Butterworth Van Dyke (BVD) equivalent circuit
The BVD circuit can be thought of in two parts, the static arm and the
motional arm. The motional arm is the main point of focus as it is respon-
sible for the system’s electromechanical properties. The static capacitance
term in the BVD (CO) dominates the admittance away from resonance,
whilst the motional arm’s contribution is greatest near resonance [32, 33].
Fitting of the circuit model to electrical measurements allows properties of
both the electrode surface and liquid contacting media to be analysed.
The Butterworth Van-Dyke motional arm components are related to the
mechanical model as follows:
The mass term represents the inertial properties of the crystal and is sub-
stituted for inductance L1 in the BVD circuit. The circuit inductance is
affected by the mass being displaced during oscillation; consequently the
inductance changes with microbalance mass loading.
The spring corresponds to the system’s compliance, it is related to the en-
ergy storage and is dependent upon the operating media’s elasticity; this is
represented by the capacitor (C1) on the motional arm of the BVD. A fully
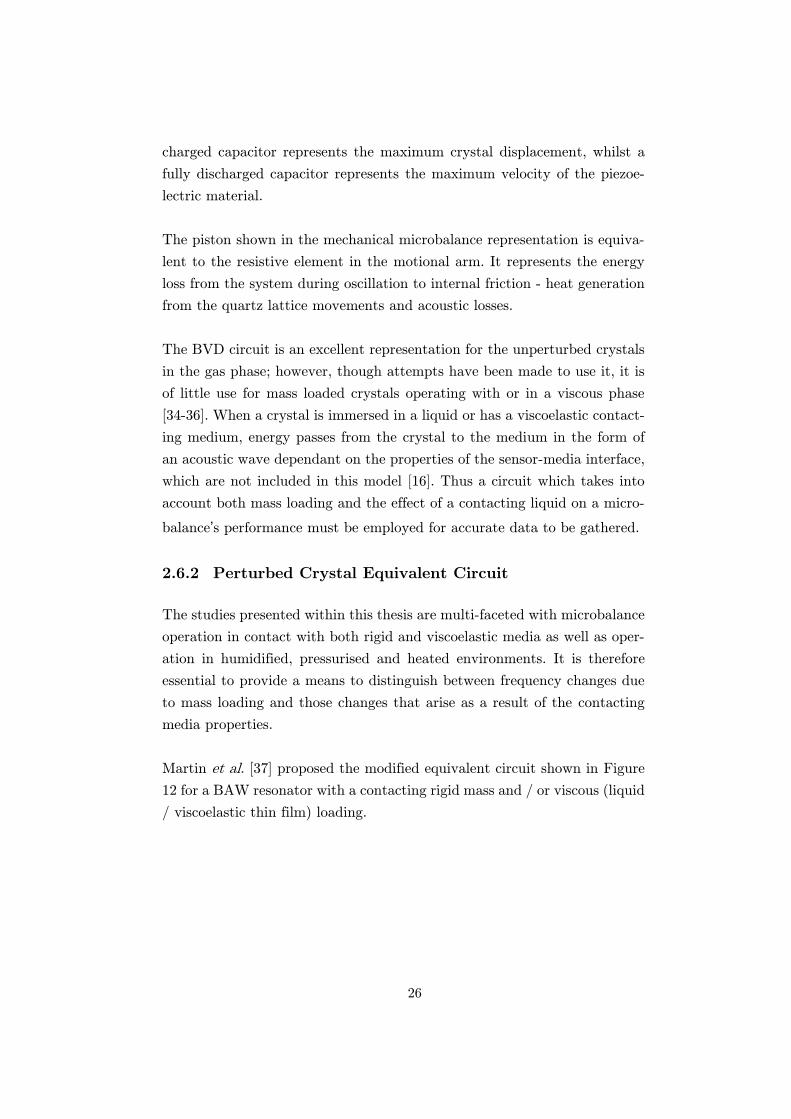
26
charged capacitor represents the maximum crystal displacement, whilst a
fully discharged capacitor represents the maximum velocity of the piezoe-
lectric material.
The piston shown in the mechanical microbalance representation is equiva-
lent to the resistive element in the motional arm. It represents the energy
loss from the system during oscillation to internal friction - heat generation
from the quartz lattice movements and acoustic losses.
The BVD circuit is an excellent representation for the unperturbed crystals
in the gas phase; however, though attempts have been made to use it, it is
of little use for mass loaded crystals operating with or in a viscous phase
[34-36]. When a crystal is immersed in a liquid or has a viscoelastic contact-
ing medium, energy passes from the crystal to the medium in the form of
an acoustic wave dependant on the properties of the sensor-media interface,
which are not included in this model [16]. Thus a circuit which takes into
account both mass loading and the effect of a contacting liquid on a micro-
balance’s performance must be employed for accurate data to be gathered.
2.6.2 Perturbed Crystal Equivalent Circuit
The studies presented within this thesis are multi-faceted with microbalance
operation in contact with both rigid and viscoelastic media as well as oper-
ation in humidified, pressurised and heated environments. It is therefore
essential to provide a means to distinguish between frequency changes due
to mass loading and those changes that arise as a result of the contacting
media properties.
Martin et al. [37] proposed the modified equivalent circuit shown in Figure
12 for a BAW resonator with a contacting rigid mass and / or viscous (liquid
/ viscoelastic thin film) loading.
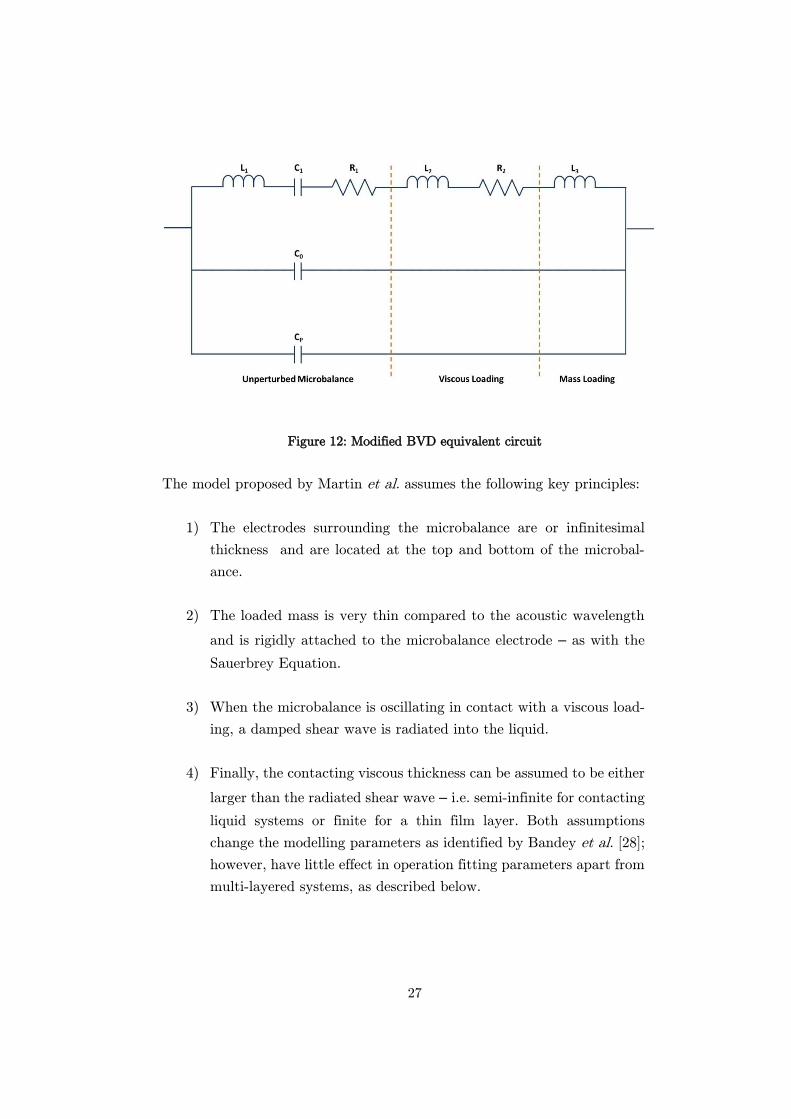
27
Figure 12: Modified BVD equivalent circuit
The model proposed by Martin et al. assumes the following key principles:
1) The electrodes surrounding the microbalance are or infinitesimal
thickness and are located at the top and bottom of the microbal-
ance.
2) The loaded mass is very thin compared to the acoustic wavelength
and is rigidly attached to the microbalance electrode – as with the
Sauerbrey Equation.
3) When the microbalance is oscillating in contact with a viscous load-
ing, a damped shear wave is radiated into the liquid.
4) Finally, the contacting viscous thickness can be assumed to be either
larger than the radiated shear wave – i.e. semi-infinite for contacting
liquid systems or finite for a thin film layer. Both assumptions
change the modelling parameters as identified by Bandey et al. [28];
however, have little effect in operation fitting parameters apart from
multi-layered systems, as described below.
28
Figure 12 introduces four new terms to the original BVD equivalent circuit:
- For a microbalance in contact with a viscoelastic contacting mass,
there is an additional inductance (L2) and a resistance (R2). For a
finite thin-film layer, the acoustic wave generated at the resonator-
film interface propagates into the media and is reflected at the film-
air interface. This phenomenon allows surface admittance to detect
the phase shift and attenuation of the wave propagating the con-
tacting film, i.e. the difference between the initial propagating and
reflecting wave through the media
- For an additional rigid mass loading to the microbalance surface, a
third inductance (L3) is introduced. A rigid mass loading (alterna-
tively called an ideal mass layer) refers to a film which is both thin
and sufficiently rigid that there is negligible acoustic phase shift of
the propagating wave through the layer. In this case, the thin layer
is assumed infinitesimally thin, but still imposes a finite mass that
moves synchronously with the BAW resonator.
- In the case of a multi-layered system, for example, a thin film com-
posite resonator submerged within a semi-infinite liquid, an addi-
tional viscous loading modification must be introduced with further
inductance (LX) and resistance (RX) terms used to represent the ad-
ditional media [2, 28, 38].
Equations (10) a-g derived by Martin et al. describes the corresponding pa-
rameters in the ‘perturbed equivalent circuit’ shown in Figure 12. For fur-
ther explanation of these equations, including their derivations, the reader
is directed to [37].
𝐶𝑂 = ξ22𝐴
ℎ
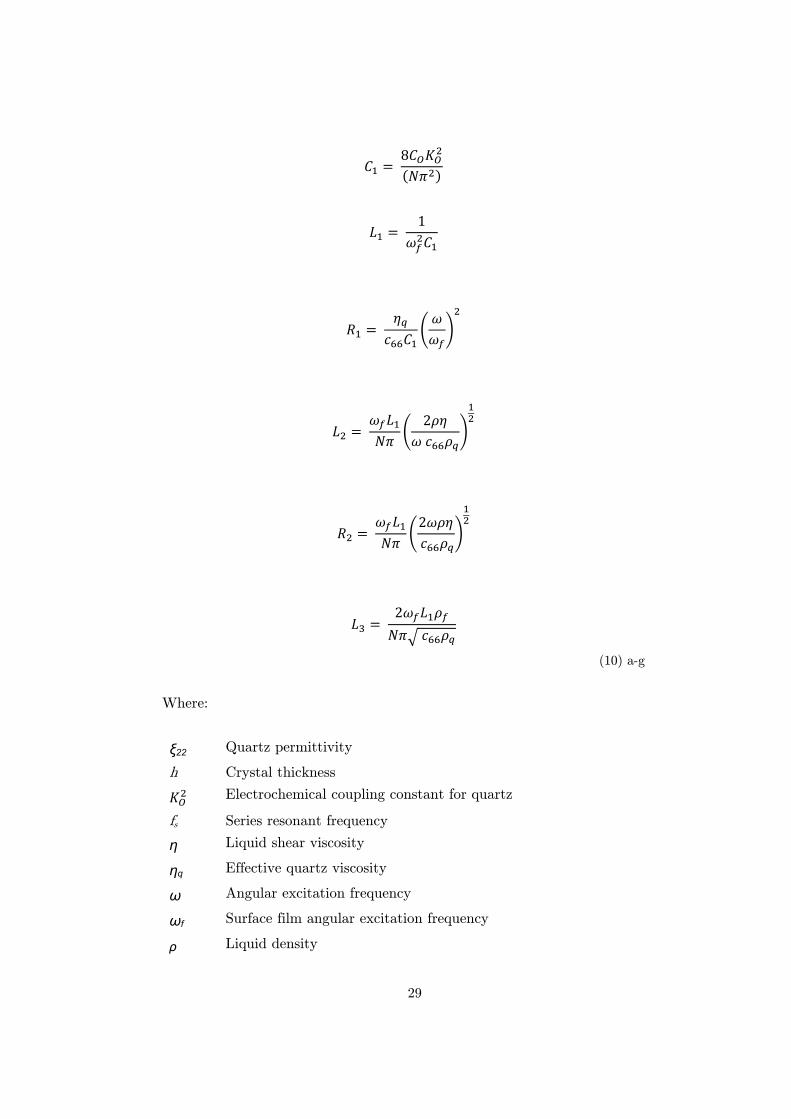
29
𝐶1 = 8𝐶𝑂𝐾𝑂
2
(𝑁𝜋2)
𝐿1 = 1
𝜔𝑓2𝐶1
𝑅1 = 𝜂𝑞
𝑐66𝐶1(
𝜔
𝜔𝑓)
2
𝐿2 = 𝜔𝑓𝐿1
𝑁𝜋(
2𝜌𝜂
𝜔 𝑐66𝜌𝑞)
12
𝑅2 = 𝜔𝑓𝐿1
𝑁𝜋(
2𝜔𝜌𝜂
𝑐66𝜌𝑞)
12
𝐿3 = 2𝜔𝑓𝐿1𝜌𝑓
𝑁𝜋√ 𝑐66𝜌𝑞
(10) a-g
Where:
ξ22 Quartz permittivity
h Crystal thickness
𝐾𝑂2 Electrochemical coupling constant for quartz
fs Series resonant frequency
η Liquid shear viscosity
ηq Effective quartz viscosity
ω Angular excitation frequency
ωf Surface film angular excitation frequency
ρ Liquid density
30
ρf Density of surface film
ρq Quartz density
N Overtone number
c66 Quartz elastic constant
For an unperturbed microbalance, ρf = ρη = 0, thus L2 = R2 = L3 = 0, and
Figure 12 reduces to the original BVD circuit [39]. As discussed by Beck et
al. [35] viscous loading causes an increase in both the motional inductance
L2 and the resistance R2. Martin et al. continues to show mass loading affects
only L3; together these findings allow frequency responses and perceived
loadings to be distinguished from one another.
Martin et al. continued to show that the results that arise from both the
perturbed and unperturbed microbalances are related. It is shown therefore
that characterization of the unperturbed microbalance is important in de-
termining the response of a given mass or liquid perturbation. Similarly, for
systems employing multiple layers / phases, the unperturbed composite res-
onator must first be characterised using equivalent circuits before the expo-
sure to surface modifying media in order to accurately determine the effect
of said media on the system.
Finally, the new term Cp represents the parasitic capacitance; this term was
added by Martin et al. to account for a capacitance arising from the holder,
and depends on the geometry of the holder and the electrode pattern on the
microbalance surface. C0 and Cp are shown in Figure 12 in parallel and may
be thought of as indistinguishable from one another; however, C0 arises as
a result of fields across the quartz and enters into the motional circuit ele-
ments; Cp comes from the field’s external to the microbalance and therefore
doesn’t affect the motional arm.
The following section explores how crystal admittance spectroscopy can be
used to analyse the properties of the electrical characteristics of the micro-
balance. It also shows how fitting of parameters can give rise to equivalent
circuit values. The ability to express mechanical properties of the QCM as
electrical equivalents greatly improves its characterisation. The components
of the equivalent circuit can be calculated using network analysis, and thus
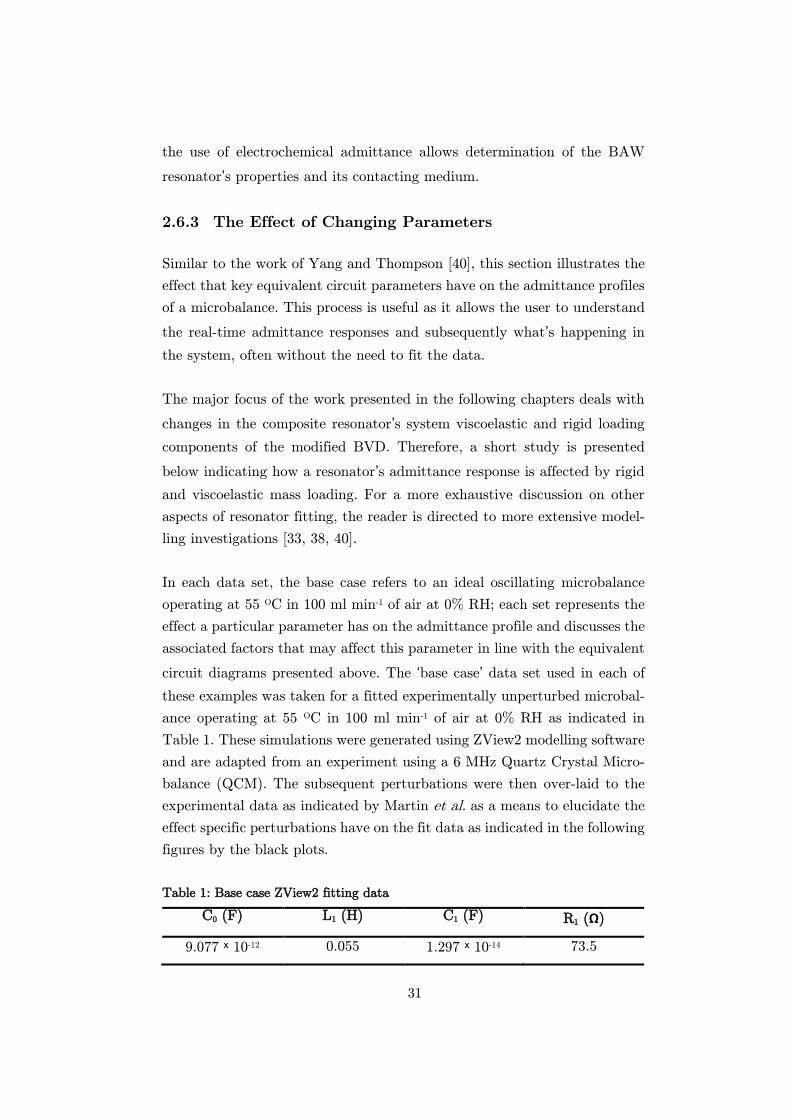
31
the use of electrochemical admittance allows determination of the BAW
resonator’s properties and its contacting medium.
2.6.3 The Effect of Changing Parameters
Similar to the work of Yang and Thompson [40], this section illustrates the
effect that key equivalent circuit parameters have on the admittance profiles
of a microbalance. This process is useful as it allows the user to understand
the real-time admittance responses and subsequently what’s happening in
the system, often without the need to fit the data.
The major focus of the work presented in the following chapters deals with
changes in the composite resonator’s system viscoelastic and rigid loading
components of the modified BVD. Therefore, a short study is presented
below indicating how a resonator’s admittance response is affected by rigid
and viscoelastic mass loading. For a more exhaustive discussion on other
aspects of resonator fitting, the reader is directed to more extensive model-
ling investigations [33, 38, 40].
In each data set, the base case refers to an ideal oscillating microbalance
operating at 55 OC in 100 ml min-1 of air at 0% RH; each set represents the
effect a particular parameter has on the admittance profile and discusses the
associated factors that may affect this parameter in line with the equivalent
circuit diagrams presented above. The ‘base case’ data set used in each of
these examples was taken for a fitted experimentally unperturbed microbal-
ance operating at 55 OC in 100 ml min-1 of air at 0% RH as indicated in
Table 1. These simulations were generated using ZView2 modelling software
and are adapted from an experiment using a 6 MHz Quartz Crystal Micro-
balance (QCM). The subsequent perturbations were then over-laid to the
experimental data as indicated by Martin et al. as a means to elucidate the
effect specific perturbations have on the fit data as indicated in the following
figures by the black plots.
Table 1: Base case ZView2 fitting data
C0 (F) L1 (H) C1 (F) R1 (Ω)
9.077 ˣ 10-12 0.055 1.297 ˣ 10-14 73.5
32
The Effect of Rigid Mass Loading (L3)
Figure 13 a-c shows the admittance response for an 6 MHz BAW resonator
before and after rigid mass loading. Figure 13a depicts the admittance loci
for both systems, Figure 13b shows the magnitude of admittance plots and
finally, Figure 13c shows the phase angle plots for both the unperturbed and
perturbed systems.
The admittance loci responses are shown in Figure 13a for an unperturbed
microbalance in black and for the same microbalance with an additional
rigid mass on its electrode surface (composite resonator) in red. Both plots
follow the same trend and indicate that the admittance locus is unaffected
by the addition of a mass on the crystal surface. No change in the admit-
tance locus radii indicates that both the unperturbed and composite resona-
tor experiences the same resistance to oscillation (R2). The admittance locus
radius is directly proportional to the microbalances resistance, as given in
the BVD and other equivalent circuits – the smaller the radius, the greater
the resistance value.
Figure 13b shows the magnitude of admittance response for both the unper-
turbed and composite resonators. For the loaded resonator, there is a dis-
tinct shift in the plot to a lower frequency range. The magnitude plot is
made up of two peaks – the first high peak indicates the series resonant
frequency, and the lower peak represents the parallel resonant frequency.
The series resonant frequency and its magnitude are vital in diagnosing mass
deposition types. In the case of a rigid mass deposition, the series resonant
frequency shifts to a lower value; however, its amplitude remains unaffected.
The phase angle plot is represented in Figure 13c shows a distinct shift to a
lower frequency range when an additional rigid mass is present on the BAW
resonators electrode. The shift to the ‘left’ indicates that the microbalance
has a new lower resonant frequency, confirming the general trend observed
using the Sauerbrey equation. Importantly, however, neither the value of
θmin nor the phase bandwidth changes with an additional mass on the crystal
surface. The phase bandwidth is defined as the frequency range (Δf) when
the phase angle is negative. A phase angle response such as the one discussed
above is indicative of a purely rigid mass loading.
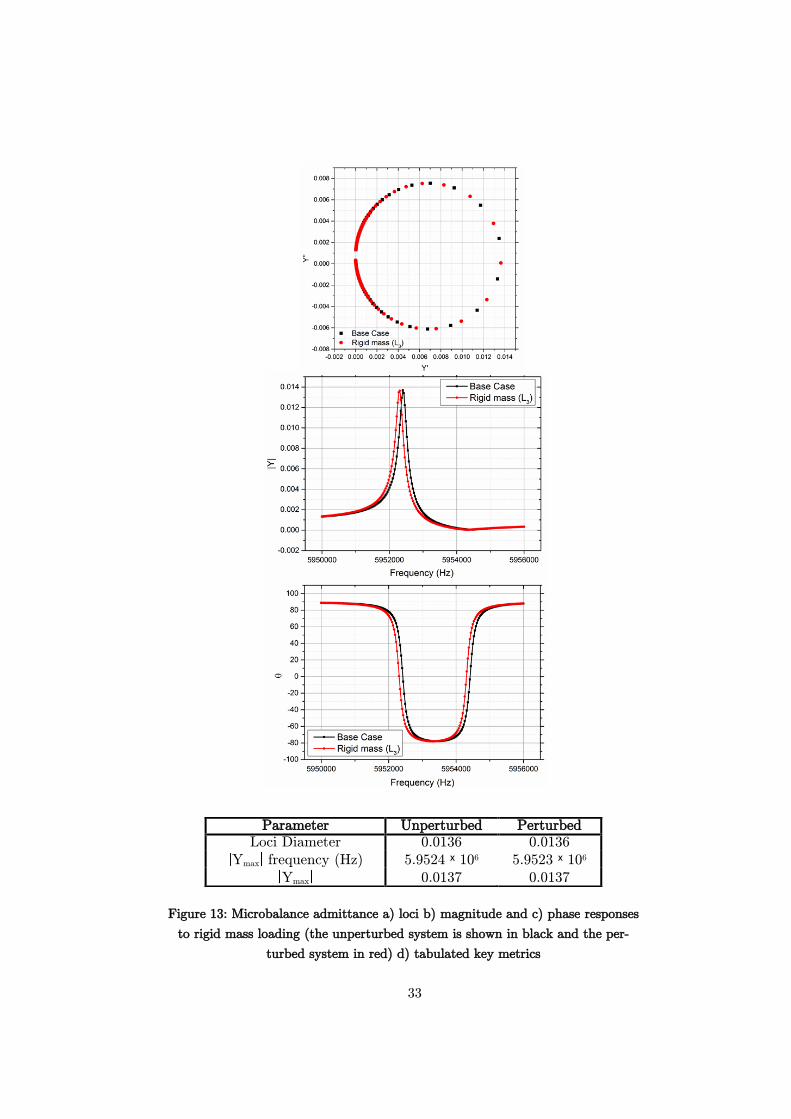
33
Figure 13: Microbalance admittance a) loci b) magnitude and c) phase responses
to rigid mass loading (the unperturbed system is shown in black and the per-
turbed system in red) d) tabulated key metrics
Parameter Unperturbed Perturbed
Loci Diameter 0.0136 0.0136
Ymax frequency (Hz) 5.9524 ˣ 106 5.9523 ˣ 106
Ymax 0.0137 0.0137
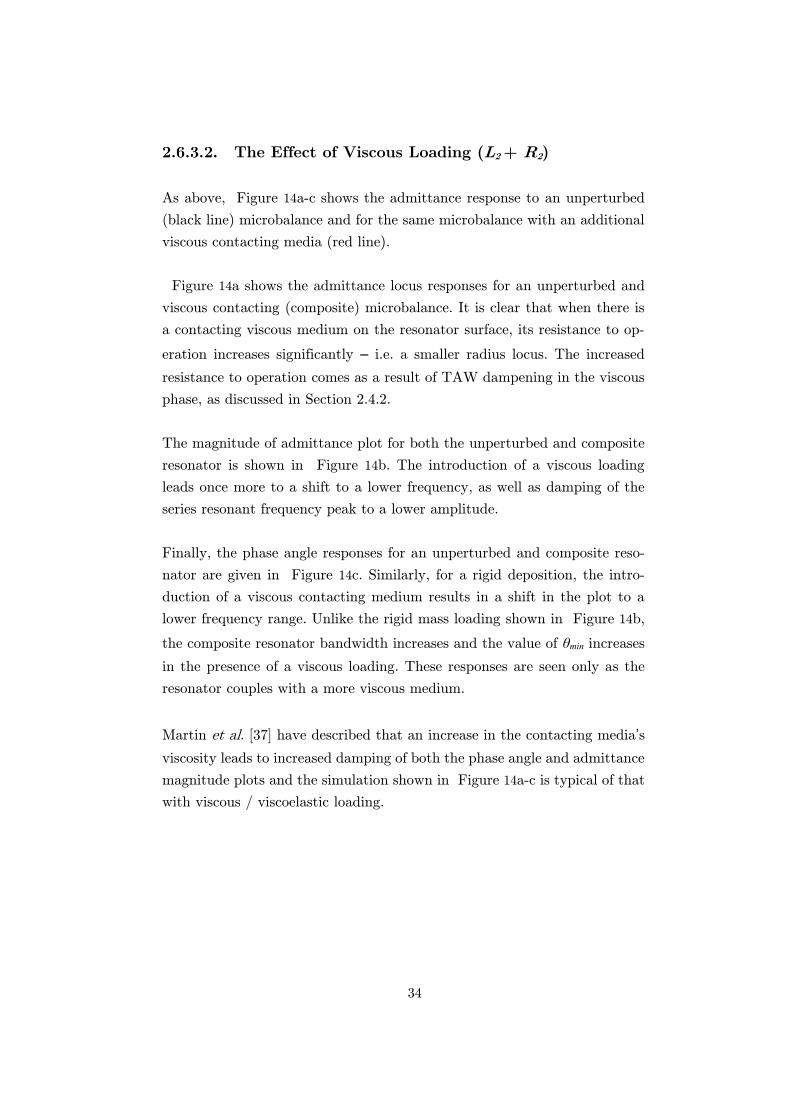
34
The Effect of Viscous Loading (L2 + R2)
As above, Figure 14a-c shows the admittance response to an unperturbed
(black line) microbalance and for the same microbalance with an additional
viscous contacting media (red line).
Figure 14a shows the admittance locus responses for an unperturbed and
viscous contacting (composite) microbalance. It is clear that when there is
a contacting viscous medium on the resonator surface, its resistance to op-
eration increases significantly – i.e. a smaller radius locus. The increased
resistance to operation comes as a result of TAW dampening in the viscous
phase, as discussed in Section 2.4.2.
The magnitude of admittance plot for both the unperturbed and composite
resonator is shown in Figure 14b. The introduction of a viscous loading
leads once more to a shift to a lower frequency, as well as damping of the
series resonant frequency peak to a lower amplitude.
Finally, the phase angle responses for an unperturbed and composite reso-
nator are given in Figure 14c. Similarly, for a rigid deposition, the intro-
duction of a viscous contacting medium results in a shift in the plot to a
lower frequency range. Unlike the rigid mass loading shown in Figure 14b,
the composite resonator bandwidth increases and the value of θmin increases
in the presence of a viscous loading. These responses are seen only as the
resonator couples with a more viscous medium.
Martin et al. [37] have described that an increase in the contacting media’s
viscosity leads to increased damping of both the phase angle and admittance
magnitude plots and the simulation shown in Figure 14a-c is typical of that
with viscous / viscoelastic loading.
35
Figure 14: Microbalance admittance a) loci, b) magnitude and c) phase responses
for a viscous loading (the unperturbed system is shown in black and the perturbed
system in red) d) tabulated key metrics
Parameter Unperturbed Perturbed Loci Diameter 0.0135 0.0080
Ymax frequency (Hz) 5.9524 ˣ 106 5.9517 ˣ 106
Ymax 0.0137 0.0081
36
2.7 Electrochemical Quartz Crystal Microbalance
(eQCM)
Between 1982-86, Nomura et al. [41-43] and Bruckenstein and Shay [19]
conducted work on microbalances to better understand the oscillation be-
haviour when used in an electrolytic solution. They were able to use the
QCM’s ability to oscillate in solution to perform in-situ electrogravimetry
in controlled electrochemical conditions to successfully study the formation
of an electrodeposited layer or film on the QCM’s working electrode.
The use of a BAW resonator (often a QCM) in a conducting medium as the
working electrode in a conventional three-electrode setup for in-situ analysis
is referred to as an electrochemical quartz crystal microbalance (eQCM) [44,
45].
The first application of the eQCM involved electrodeposition of metals onto
electrode surfaces [19]. Bruckenstein and Shay reported an electrodeposition
of 10 layers of silver on the metal working electrode at an accuracy of 3 %
when compared to the predicted Sauerbrey equation. The electrochemical
BAW resonator theory is briefly implemented in this work and is further
discussed in Sections 4.2.4.3 and 4.3.3.
37
3 Fuel Cell Application
This Chapter begins by reproducing and investigating published
literature on the water uptake of the Nafion ionomer commonly
used in Proton Electrolyte Membrane (PEM) fuel cells using hu-
midified nitrogen. Whilst Nafion has been at the forefront of fuel
cell research for decades, there are still conflicting theories about
its hydrated microstructure and water loading mechanisms. Models
for its loading characteristics have been presented for over 40 years
[46-48]; however these are yet to be conclusively validated. The
preliminary work presented here is an analysis of the Nafion iono-
mer’s water loading characteristics using an in-situ composite
BAW resonator and electrochemical crystal admittance spectros-
copy.
The chapter evolves to focus on a novel solid polymer AS-4 alkaline
anion exchange membrane (AAEM) developed by Tokuyama Co.
(Japan). AAEM fuel cells are a solid polymer electrolyte iteration
of the original aqueous alkaline fuel cell. Again, understanding its
water uptake, loading and sorption characteristics are critical to
understanding the technologies operation and performance limita-
tions and so these factors are assessed here. It is also well docu-
mented that AAEMs can suffer from deleterious performance ef-
fects as a result of thermal and subsequent chemical degradation
as well as carbon dioxide poisoning. The effect of these factors on
the AAEM’s performance are poorly understood and so are further
explored in this investigation using surface developed in-situ BAW
resonators.
3.1 Introduction
There is greater demand than ever for a greener energy economy. Fuel cells
are considered a potentially integral technology in achieving this goal. A
fuel cell operates by converting chemical energy directly into electricity,
without the production of any particulates or greenhouse gas emissions at
38
point-of-use. With no moving parts in the stack itself, fuel cells can offer
higher efficiencies than the equivalent combustion engine whilst also
providing improved energy storage and reduced ‘charge’ times when com-
pared to batteries.
However, fuel cells are not without challenges. The major hindrance to the
technology’s commercialisation is its cost per kilowatt compared to existing
electricity generation technologies. A fuel cell is made up of the components
described in Section 3.2.1 and elsewhere [49, 50], where the main working
part, the membrane electrode assembly (MEA) comprises an electrocatalyst,
often containing a precious metal such as platinum, and an ionic polymer
membrane. The membrane and the catalyst provide a significant contribu-
tion to the fuel cell’s overall cost.
Alkaline anion-exchange membrane fuel cells (AAEMs) have the potential
to replace the traditional acidic proton exchange membrane (PEM) fuel cells
for low-temperature applications [51-56]. With more facile oxygen reduction
reaction (ORR) kinetics than traditional PEM fuel cells, the alkaline me-
dium allows implementation of lower cost, non-precious metal electrocata-
lysts at the cathode [57, 58], compared to the more resilient precious metals
(e.g. Pt) required in acidic media [57-64]. In addition, the AAEM is a solid
polymer electrolyte and so can be incorporated into compact designs, as seen
with acid based proton exchange membrane fuel cells [53, 65].
This study is broken down into three investigations, as outlined below:
The first investigation explores the water uptake, sorption mechanics and
swelling characteristics of thin-film Nafion and the commercially available
AS-4 Tokuyama alkaline anion-exchange membrane ionomer from the va-
pour phase using surface developed in-situ BAW resonators. The water up-
take measures the number of water molecules adsorbed by the ionomer per
functional group and is determined in-situ using the BAW resonators fre-
quency responses allowing for comparison with nanogram precision. Crystal
admittance spectroscopy, along with equivalent circuit fitting, is applied to
both thin films for the first time and is used to investigate the ionomer’s
viscoelastic changes during hydration; to elucidate the mechanisms at play
during low, medium and high relative humidities.
39
Many AAEMs are reported to suffer from increased instability within alka-
line media (degradation) via a number of routes, including nucleophilic elim-
ination when operated at temperatures above 60C, somewhat eliminating
the kinetic advantage of operating at higher temperatures. Nonetheless,
modelling studies have indicated that the membrane hydration could show
improved resistance to alkaline instability and subsequent degradation when
operated at elevated temperatures. This second investigation uses the AS-4
composite BAW resonator to examine the thermal stability of the ionomer
as a function of humidity. The results show that hydration improves iono-
mer resistance to degradation, as the ions within the system (namely the
OH- nucleophile and cationic headgroups) become less reactive. In-line mass
spectrometry data confirms that the ionomer degrades during the elevated
temperature excursions used in this study.
Finally, the third investigation explores the issues relating to degradation
and specifically the ionomer’s interaction with CO2 (often referred to as CO2
poisoning). With hydration playing a key role in solid polymer electrolyte
fuel cell operation, this study examines how membrane hydration affects the
AAEM interaction with CO2. The change of membrane conductivity upon
exposure to atmospheric CO2 has been compared with the change in visco-
elastic properties of a cast thin-film ionomer, both as a function of humidity.
The effect of CO2 on the membrane as a function of hydration suggests a
link to its solvation and swelling regimes and thus the access of CO2 to the
ionic channels within the membrane. The thin-film BAW composite resona-
tor study has shown that during the solvation (pore opening) regime, there
is a linear increase in CO2 uptake as water can further permeate the pore
system and the cationic headgroups become increasingly accessible. During
the transition to the pore swelling regime, there is a step increase in CO2
uptake as the network is thought to be fully open; as such, subsequent in-
creases in RH do not indicate any significant increase in CO2 uptake.
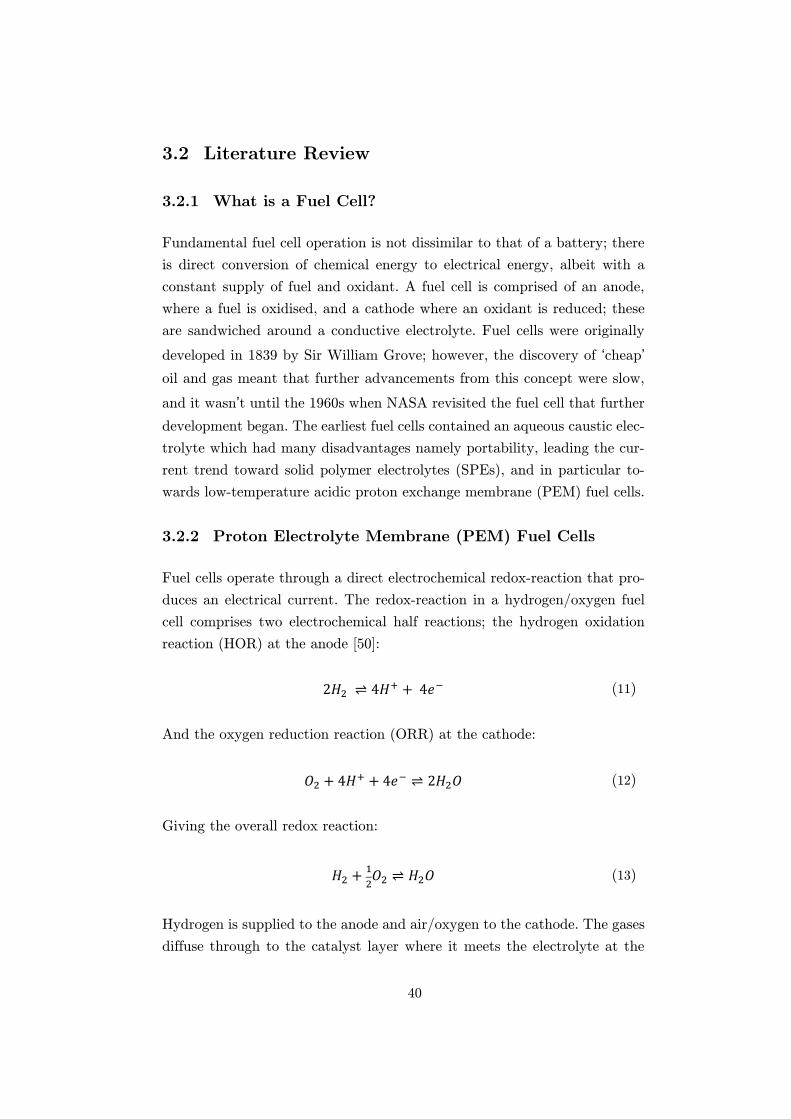
40
3.2 Literature Review
3.2.1 What is a Fuel Cell?
Fundamental fuel cell operation is not dissimilar to that of a battery; there
is direct conversion of chemical energy to electrical energy, albeit with a
constant supply of fuel and oxidant. A fuel cell is comprised of an anode,
where a fuel is oxidised, and a cathode where an oxidant is reduced; these
are sandwiched around a conductive electrolyte. Fuel cells were originally
developed in 1839 by Sir William Grove; however, the discovery of ‘cheap’
oil and gas meant that further advancements from this concept were slow,
and it wasn’t until the 1960s when NASA revisited the fuel cell that further
development began. The earliest fuel cells contained an aqueous caustic elec-
trolyte which had many disadvantages namely portability, leading the cur-
rent trend toward solid polymer electrolytes (SPEs), and in particular to-
wards low-temperature acidic proton exchange membrane (PEM) fuel cells.
3.2.2 Proton Electrolyte Membrane (PEM) Fuel Cells
Fuel cells operate through a direct electrochemical redox-reaction that pro-
duces an electrical current. The redox-reaction in a hydrogen/oxygen fuel
cell comprises two electrochemical half reactions; the hydrogen oxidation
reaction (HOR) at the anode [50]:
2𝐻2 4𝐻+ + 4𝑒− (11)
And the oxygen reduction reaction (ORR) at the cathode:
𝑂2 + 4𝐻+ + 4𝑒− 2𝐻2𝑂 (12)
Giving the overall redox reaction:
𝐻2 +1
2𝑂2 𝐻2𝑂 (13)
Hydrogen is supplied to the anode and air/oxygen to the cathode. The gases
diffuse through to the catalyst layer where it meets the electrolyte at the
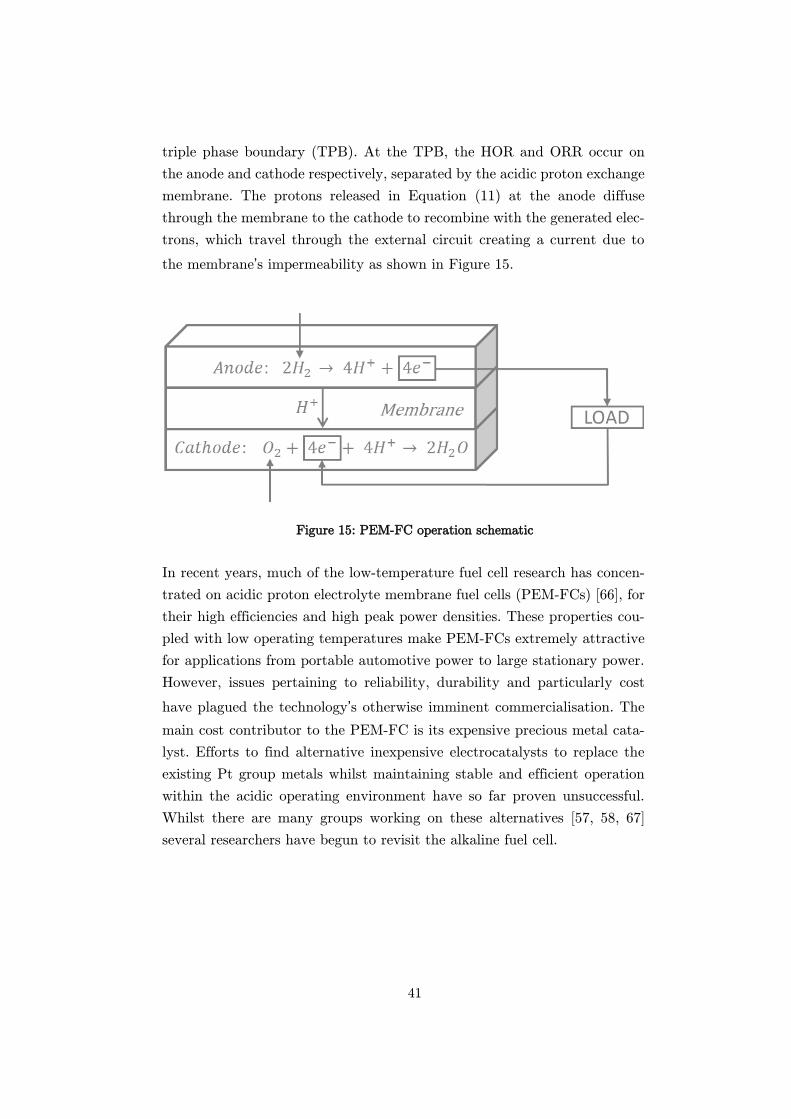
41
triple phase boundary (TPB). At the TPB, the HOR and ORR occur on
the anode and cathode respectively, separated by the acidic proton exchange
membrane. The protons released in Equation (11) at the anode diffuse
through the membrane to the cathode to recombine with the generated elec-
trons, which travel through the external circuit creating a current due to
the membrane’s impermeability as shown in Figure 15.
Figure 15: PEM-FC operation schematic
In recent years, much of the low-temperature fuel cell research has concen-
trated on acidic proton electrolyte membrane fuel cells (PEM-FCs) [66], for
their high efficiencies and high peak power densities. These properties cou-
pled with low operating temperatures make PEM-FCs extremely attractive
for applications from portable automotive power to large stationary power.
However, issues pertaining to reliability, durability and particularly cost
have plagued the technology’s otherwise imminent commercialisation. The
main cost contributor to the PEM-FC is its expensive precious metal cata-
lyst. Efforts to find alternative inexpensive electrocatalysts to replace the
existing Pt group metals whilst maintaining stable and efficient operation
within the acidic operating environment have so far proven unsuccessful.
Whilst there are many groups working on these alternatives [57, 58, 67]
several researchers have begun to revisit the alkaline fuel cell.
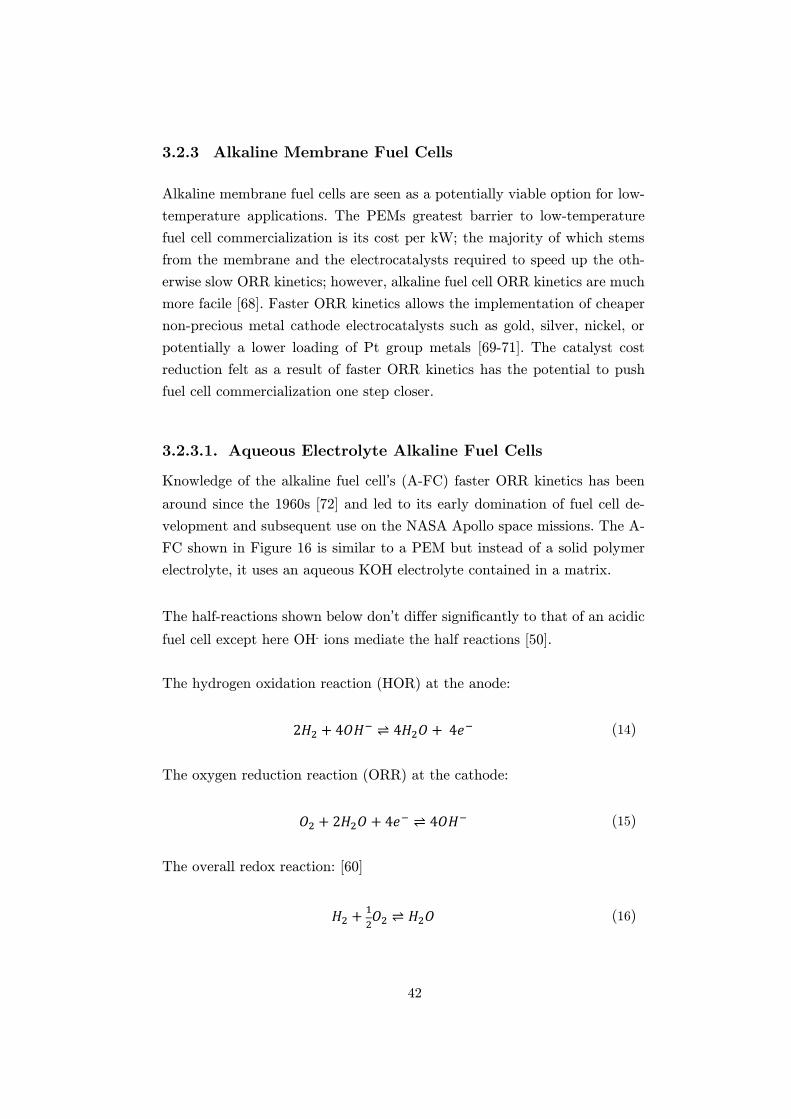
42
3.2.3 Alkaline Membrane Fuel Cells
Alkaline membrane fuel cells are seen as a potentially viable option for low-
temperature applications. The PEMs greatest barrier to low-temperature
fuel cell commercialization is its cost per kW; the majority of which stems
from the membrane and the electrocatalysts required to speed up the oth-
erwise slow ORR kinetics; however, alkaline fuel cell ORR kinetics are much
more facile [68]. Faster ORR kinetics allows the implementation of cheaper
non-precious metal cathode electrocatalysts such as gold, silver, nickel, or
potentially a lower loading of Pt group metals [69-71]. The catalyst cost
reduction felt as a result of faster ORR kinetics has the potential to push
fuel cell commercialization one step closer.
Aqueous Electrolyte Alkaline Fuel Cells
Knowledge of the alkaline fuel cell’s (A-FC) faster ORR kinetics has been
around since the 1960s [72] and led to its early domination of fuel cell de-
velopment and subsequent use on the NASA Apollo space missions. The A-
FC shown in Figure 16 is similar to a PEM but instead of a solid polymer
electrolyte, it uses an aqueous KOH electrolyte contained in a matrix.
The half-reactions shown below don’t differ significantly to that of an acidic
fuel cell except here OH- ions mediate the half reactions [50].
The hydrogen oxidation reaction (HOR) at the anode:
2𝐻2 + 4𝑂𝐻− 4𝐻2𝑂 + 4𝑒− (14)
The oxygen reduction reaction (ORR) at the cathode:
𝑂2 + 2𝐻2𝑂 + 4𝑒− 4𝑂𝐻− (15)
The overall redox reaction: [60]
𝐻2 +1
2𝑂2 𝐻2𝑂 (16)
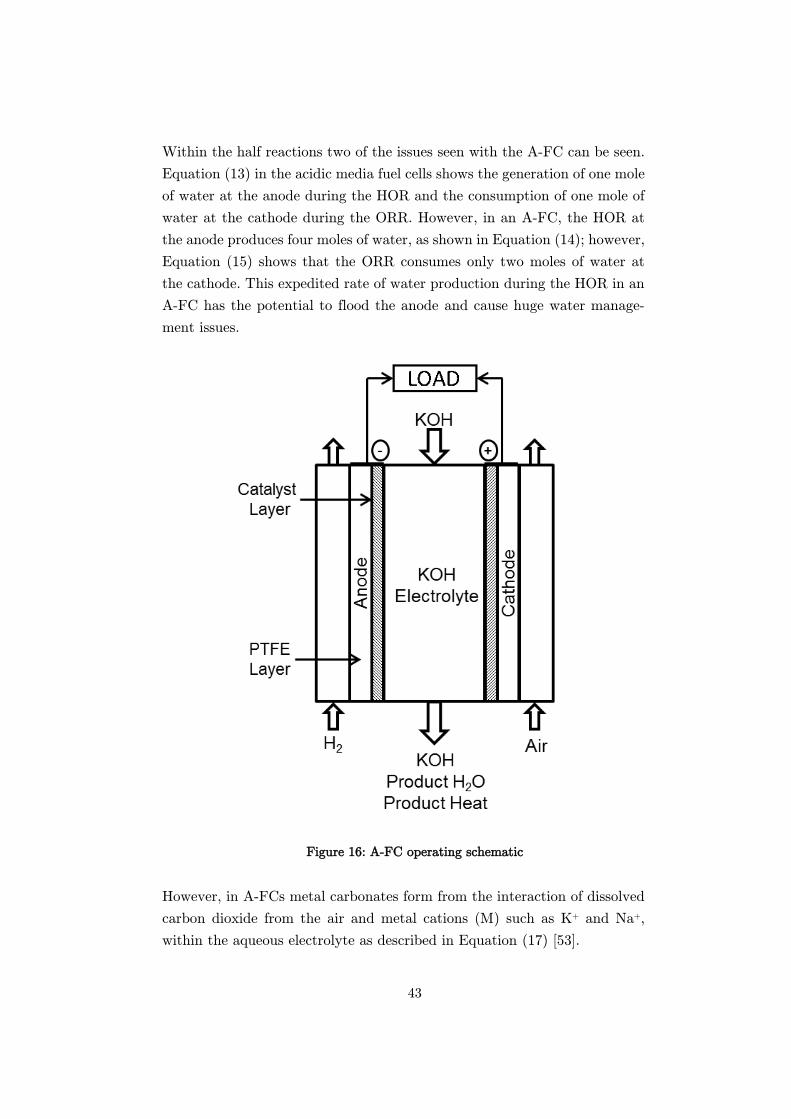
43
Within the half reactions two of the issues seen with the A-FC can be seen.
Equation (13) in the acidic media fuel cells shows the generation of one mole
of water at the anode during the HOR and the consumption of one mole of
water at the cathode during the ORR. However, in an A-FC, the HOR at
the anode produces four moles of water, as shown in Equation (14); however,
Equation (15) shows that the ORR consumes only two moles of water at
the cathode. This expedited rate of water production during the HOR in an
A-FC has the potential to flood the anode and cause huge water manage-
ment issues.
Figure 16: A-FC operating schematic
However, in A-FCs metal carbonates form from the interaction of dissolved
carbon dioxide from the air and metal cations (M) such as K+ and Na+,
within the aqueous electrolyte as described in Equation (17) [53].
44
𝐶𝑂2(𝑔) + 2𝑀𝑂𝐻(𝑎𝑞) ↔ 𝑀2𝐶𝑂3(𝑎𝑞) + 𝐻2𝑂(𝑙) (17)
These metal carbonates precipitate and not only decrease the concentration
of solvated OH- ions but also form layers on the electrode surfaces, blocking
active sites, gas diffusion layers (GDLs) and significantly reducing system
performance [50, 73].
These issues were in some cases resolved by the implementation of gas scrub-
bers and other pre-treatment processes of the reactants, significantly in-
creasing the cost per kW [51, 74]. These factors coupled with portability and
weeping of caustic electrolyte led fuel cell research towards the more popular
PEM technology. However, recent developments in SPE alkaline anion-ex-
change membrane fuel cells (AAEM-FCs) have begun to shift the focus once
more.
Alkaline Anion Exchange Membrane Fuel Cells
The AAEM-FC operates with very similar principles to the PEM fuel cell
i.e. electrochemical conversion of hydrogen to electricity using a solid poly-
mer electrolyte as shown in Figure 17. However, the AAEM-FC maintains
the A-FC’s half equations and hence its ORR kinetics, thus allowing the
benefit of catalyst cost reductions whilst nullifying many of its caustic aque-
ous electrolyte issues [53].
Figure 17: AAEM-FC operating schematic
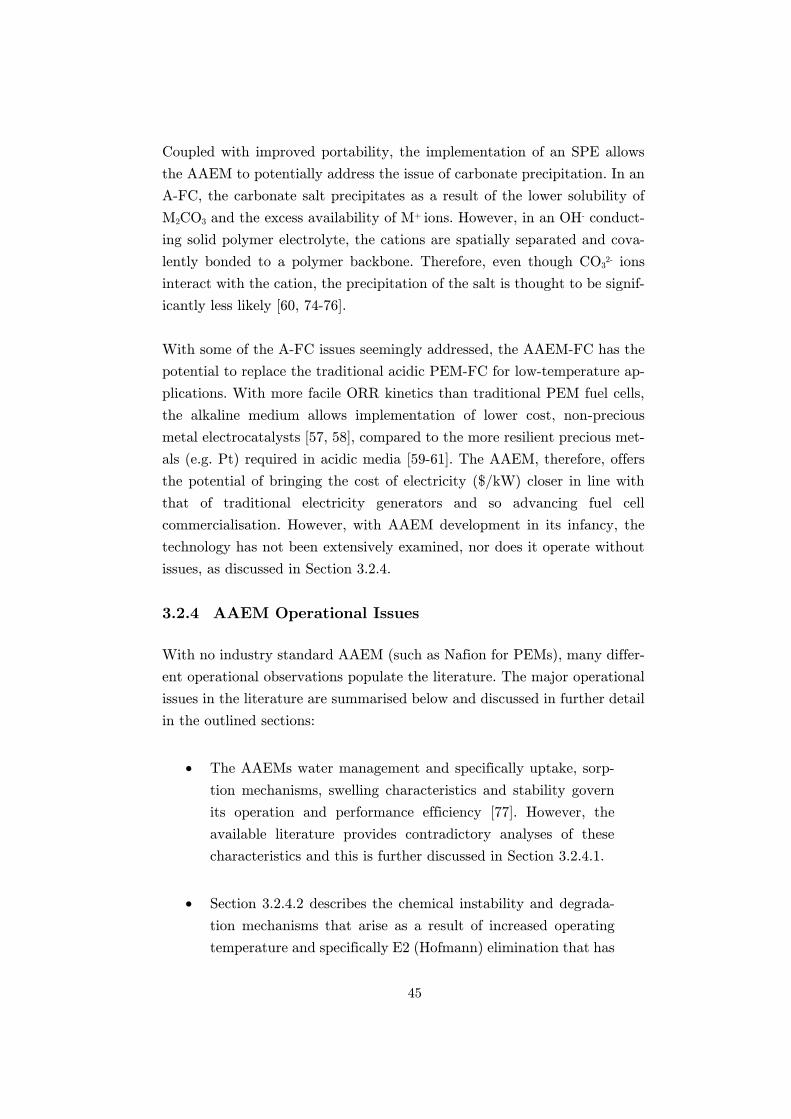
45
Coupled with improved portability, the implementation of an SPE allows
the AAEM to potentially address the issue of carbonate precipitation. In an
A-FC, the carbonate salt precipitates as a result of the lower solubility of
M2CO3 and the excess availability of M+ ions. However, in an OH- conduct-
ing solid polymer electrolyte, the cations are spatially separated and cova-
lently bonded to a polymer backbone. Therefore, even though CO32- ions
interact with the cation, the precipitation of the salt is thought to be signif-
icantly less likely [60, 74-76].
With some of the A-FC issues seemingly addressed, the AAEM-FC has the
potential to replace the traditional acidic PEM-FC for low-temperature ap-
plications. With more facile ORR kinetics than traditional PEM fuel cells,
the alkaline medium allows implementation of lower cost, non-precious
metal electrocatalysts [57, 58], compared to the more resilient precious met-
als (e.g. Pt) required in acidic media [59-61]. The AAEM, therefore, offers
the potential of bringing the cost of electricity ($/kW) closer in line with
that of traditional electricity generators and so advancing fuel cell
commercialisation. However, with AAEM development in its infancy, the
technology has not been extensively examined, nor does it operate without
issues, as discussed in Section 3.2.4.
3.2.4 AAEM Operational Issues
With no industry standard AAEM (such as Nafion for PEMs), many differ-
ent operational observations populate the literature. The major operational
issues in the literature are summarised below and discussed in further detail
in the outlined sections:
• The AAEMs water management and specifically uptake, sorp-
tion mechanisms, swelling characteristics and stability govern
its operation and performance efficiency [77]. However, the
available literature provides contradictory analyses of these
characteristics and this is further discussed in Section 3.2.4.1.
• Section 3.2.4.2 describes the chemical instability and degrada-
tion mechanisms that arise as a result of increased operating
temperature and specifically E2 (Hofmann) elimination that has
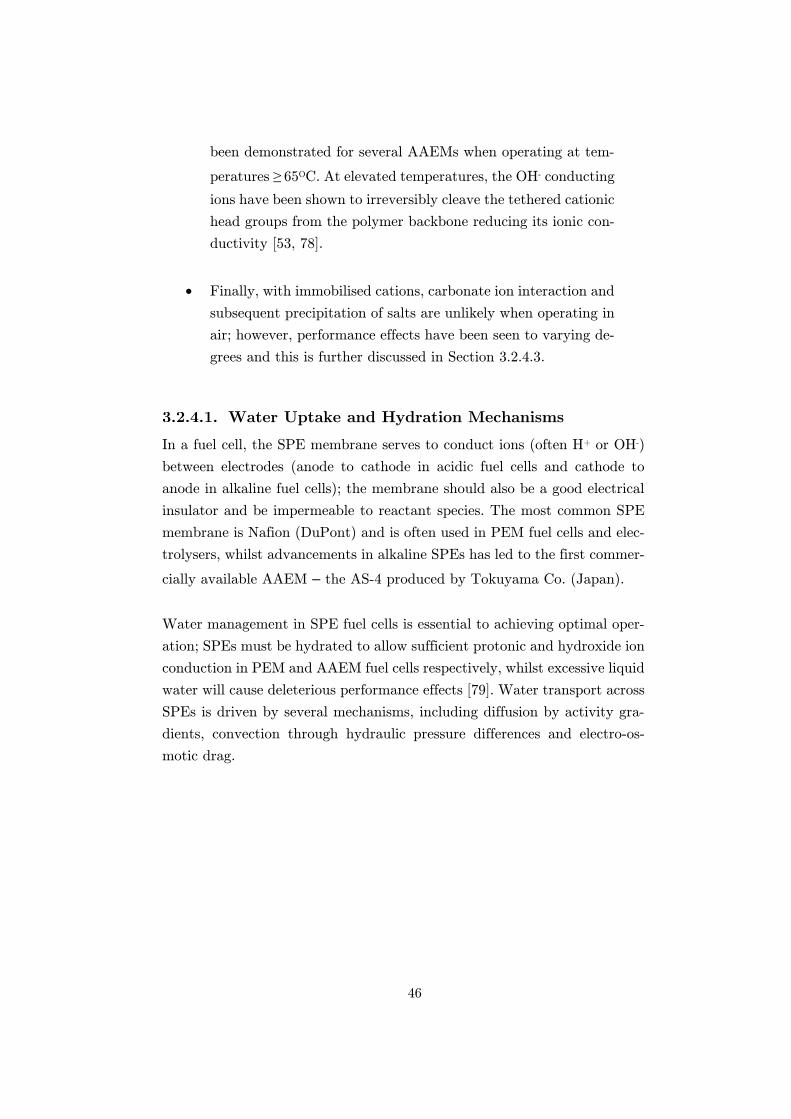
46
been demonstrated for several AAEMs when operating at tem-
peratures ≥ 65OC. At elevated temperatures, the OH- conducting
ions have been shown to irreversibly cleave the tethered cationic
head groups from the polymer backbone reducing its ionic con-
ductivity [53, 78].
• Finally, with immobilised cations, carbonate ion interaction and
subsequent precipitation of salts are unlikely when operating in
air; however, performance effects have been seen to varying de-
grees and this is further discussed in Section 3.2.4.3.
Water Uptake and Hydration Mechanisms
In a fuel cell, the SPE membrane serves to conduct ions (often H+ or OH-)
between electrodes (anode to cathode in acidic fuel cells and cathode to
anode in alkaline fuel cells); the membrane should also be a good electrical
insulator and be impermeable to reactant species. The most common SPE
membrane is Nafion (DuPont) and is often used in PEM fuel cells and elec-
trolysers, whilst advancements in alkaline SPEs has led to the first commer-
cially available AAEM – the AS-4 produced by Tokuyama Co. (Japan).
Water management in SPE fuel cells is essential to achieving optimal oper-
ation; SPEs must be hydrated to allow sufficient protonic and hydroxide ion
conduction in PEM and AAEM fuel cells respectively, whilst excessive liquid
water will cause deleterious performance effects [79]. Water transport across
SPEs is driven by several mechanisms, including diffusion by activity gra-
dients, convection through hydraulic pressure differences and electro-os-
motic drag.
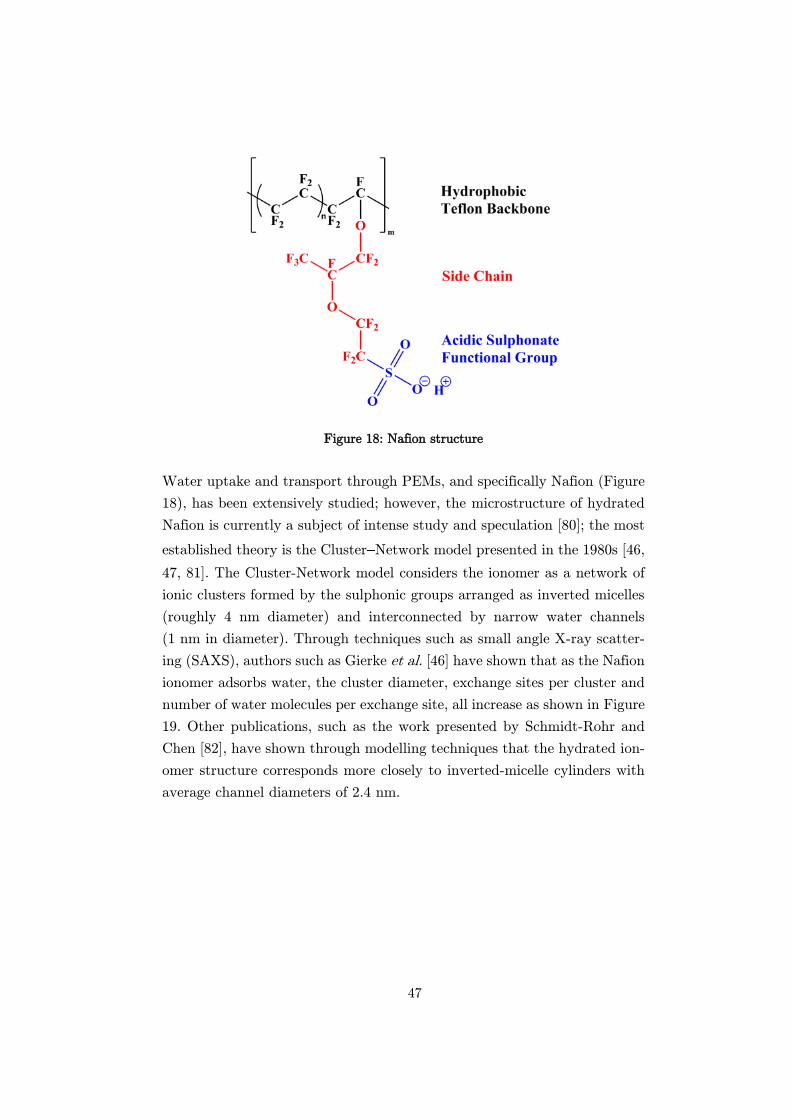
47
Figure 18: Nafion structure
Water uptake and transport through PEMs, and specifically Nafion (Figure
18), has been extensively studied; however, the microstructure of hydrated
Nafion is currently a subject of intense study and speculation [80]; the most
established theory is the Cluster–Network model presented in the 1980s [46,
47, 81]. The Cluster-Network model considers the ionomer as a network of
ionic clusters formed by the sulphonic groups arranged as inverted micelles
(roughly 4 nm diameter) and interconnected by narrow water channels
(1 nm in diameter). Through techniques such as small angle X-ray scatter-
ing (SAXS), authors such as Gierke et al. [46] have shown that as the Nafion
ionomer adsorbs water, the cluster diameter, exchange sites per cluster and
number of water molecules per exchange site, all increase as shown in Figure
19. Other publications, such as the work presented by Schmidt-Rohr and
Chen [82], have shown through modelling techniques that the hydrated ion-
omer structure corresponds more closely to inverted-micelle cylinders with
average channel diameters of 2.4 nm.
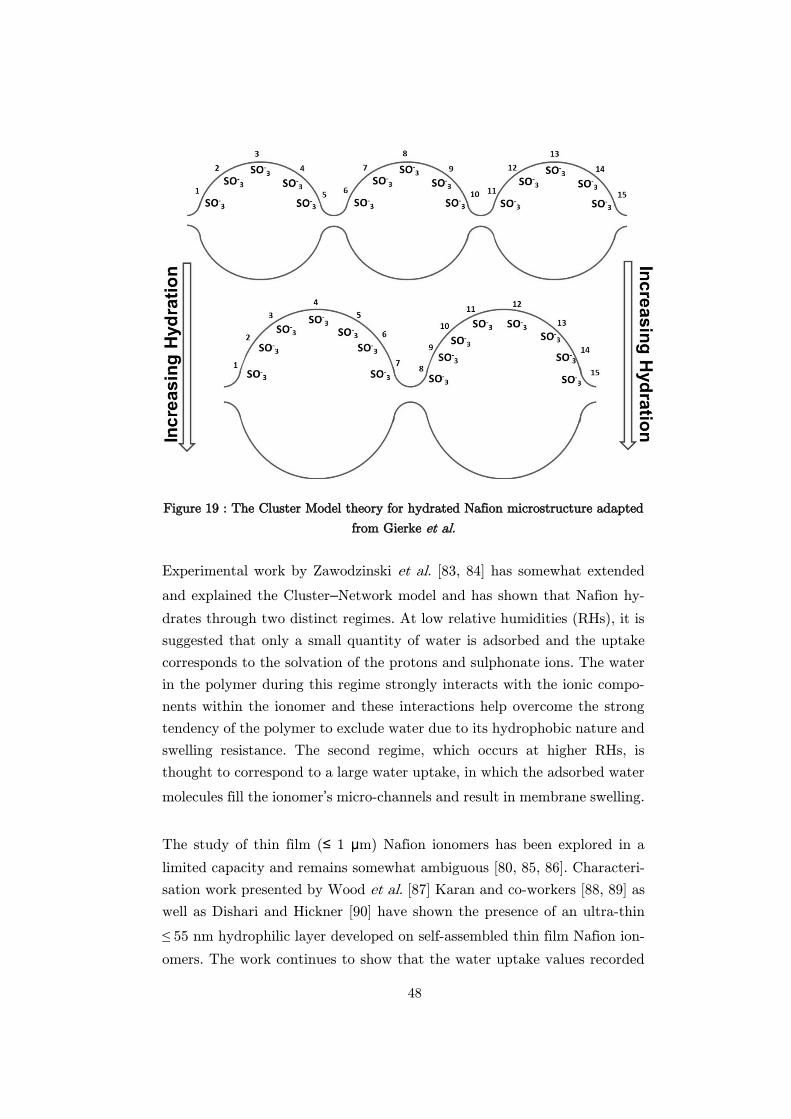
48
Figure 19 : The Cluster Model theory for hydrated Nafion microstructure adapted
from Gierke et al.
Experimental work by Zawodzinski et al. [83, 84] has somewhat extended
and explained the Cluster–Network model and has shown that Nafion hy-
drates through two distinct regimes. At low relative humidities (RHs), it is
suggested that only a small quantity of water is adsorbed and the uptake
corresponds to the solvation of the protons and sulphonate ions. The water
in the polymer during this regime strongly interacts with the ionic compo-
nents within the ionomer and these interactions help overcome the strong
tendency of the polymer to exclude water due to its hydrophobic nature and
swelling resistance. The second regime, which occurs at higher RHs, is
thought to correspond to a large water uptake, in which the adsorbed water
molecules fill the ionomer’s micro-channels and result in membrane swelling.
The study of thin film (≤ 1 μm) Nafion ionomers has been explored in a
limited capacity and remains somewhat ambiguous [80, 85, 86]. Characteri-
sation work presented by Wood et al. [87] Karan and co-workers [88, 89] as
well as Dishari and Hickner [90] have shown the presence of an ultra-thin
≤ 55 nm hydrophilic layer developed on self-assembled thin film Nafion ion-
omers. The work continues to show that the water uptake values recorded
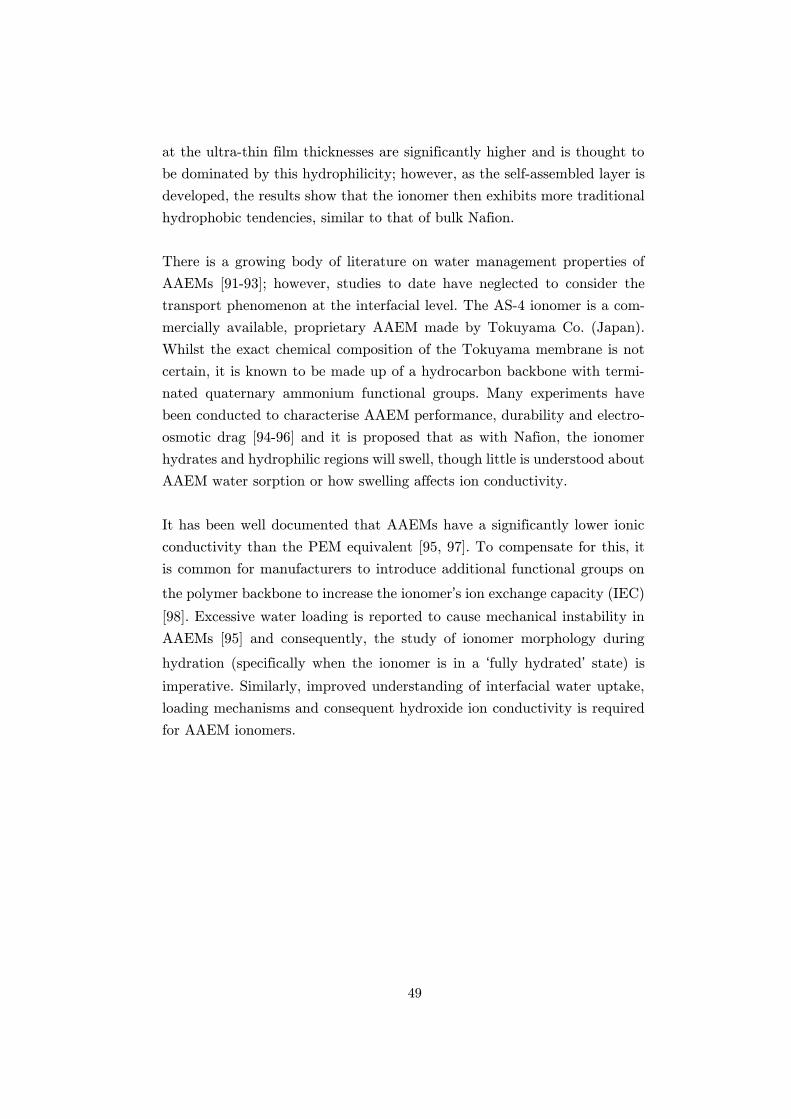
49
at the ultra-thin film thicknesses are significantly higher and is thought to
be dominated by this hydrophilicity; however, as the self-assembled layer is
developed, the results show that the ionomer then exhibits more traditional
hydrophobic tendencies, similar to that of bulk Nafion.
There is a growing body of literature on water management properties of
AAEMs [91-93]; however, studies to date have neglected to consider the
transport phenomenon at the interfacial level. The AS-4 ionomer is a com-
mercially available, proprietary AAEM made by Tokuyama Co. (Japan).
Whilst the exact chemical composition of the Tokuyama membrane is not
certain, it is known to be made up of a hydrocarbon backbone with termi-
nated quaternary ammonium functional groups. Many experiments have
been conducted to characterise AAEM performance, durability and electro-
osmotic drag [94-96] and it is proposed that as with Nafion, the ionomer
hydrates and hydrophilic regions will swell, though little is understood about
AAEM water sorption or how swelling affects ion conductivity.
It has been well documented that AAEMs have a significantly lower ionic
conductivity than the PEM equivalent [95, 97]. To compensate for this, it
is common for manufacturers to introduce additional functional groups on
the polymer backbone to increase the ionomer’s ion exchange capacity (IEC)
[98]. Excessive water loading is reported to cause mechanical instability in
AAEMs [95] and consequently, the study of ionomer morphology during
hydration (specifically when the ionomer is in a ‘fully hydrated’ state) is
imperative. Similarly, improved understanding of interfacial water uptake,
loading mechanisms and consequent hydroxide ion conductivity is required
for AAEM ionomers.
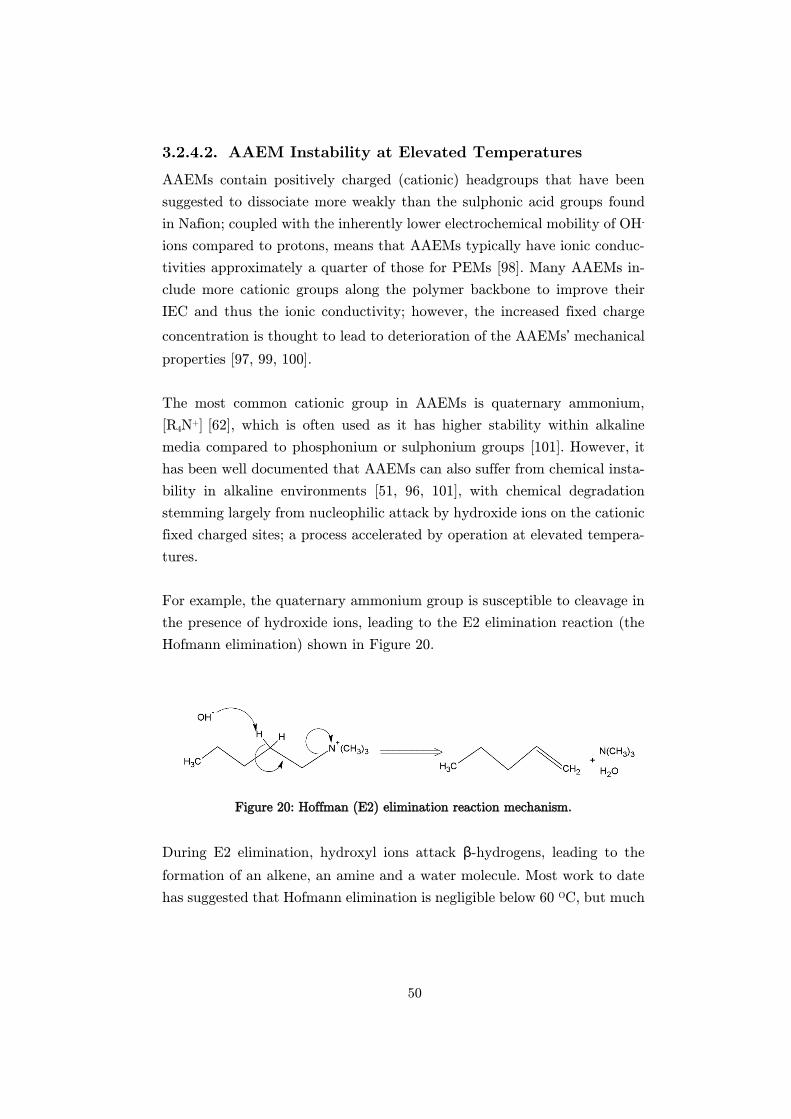
50
AAEM Instability at Elevated Temperatures
AAEMs contain positively charged (cationic) headgroups that have been
suggested to dissociate more weakly than the sulphonic acid groups found
in Nafion; coupled with the inherently lower electrochemical mobility of OH-
ions compared to protons, means that AAEMs typically have ionic conduc-
tivities approximately a quarter of those for PEMs [98]. Many AAEMs in-
clude more cationic groups along the polymer backbone to improve their
IEC and thus the ionic conductivity; however, the increased fixed charge
concentration is thought to lead to deterioration of the AAEMs’ mechanical
properties [97, 99, 100].
The most common cationic group in AAEMs is quaternary ammonium,
[R4N+] [62], which is often used as it has higher stability within alkaline
media compared to phosphonium or sulphonium groups [101]. However, it
has been well documented that AAEMs can also suffer from chemical insta-
bility in alkaline environments [51, 96, 101], with chemical degradation
stemming largely from nucleophilic attack by hydroxide ions on the cationic
fixed charged sites; a process accelerated by operation at elevated tempera-
tures.
For example, the quaternary ammonium group is susceptible to cleavage in
the presence of hydroxide ions, leading to the E2 elimination reaction (the
Hofmann elimination) shown in Figure 20.
Figure 20: Hoffman (E2) elimination reaction mechanism.
During E2 elimination, hydroxyl ions attack β-hydrogens, leading to the
formation of an alkene, an amine and a water molecule. Most work to date
has suggested that Hofmann elimination is negligible below 60 OC, but much
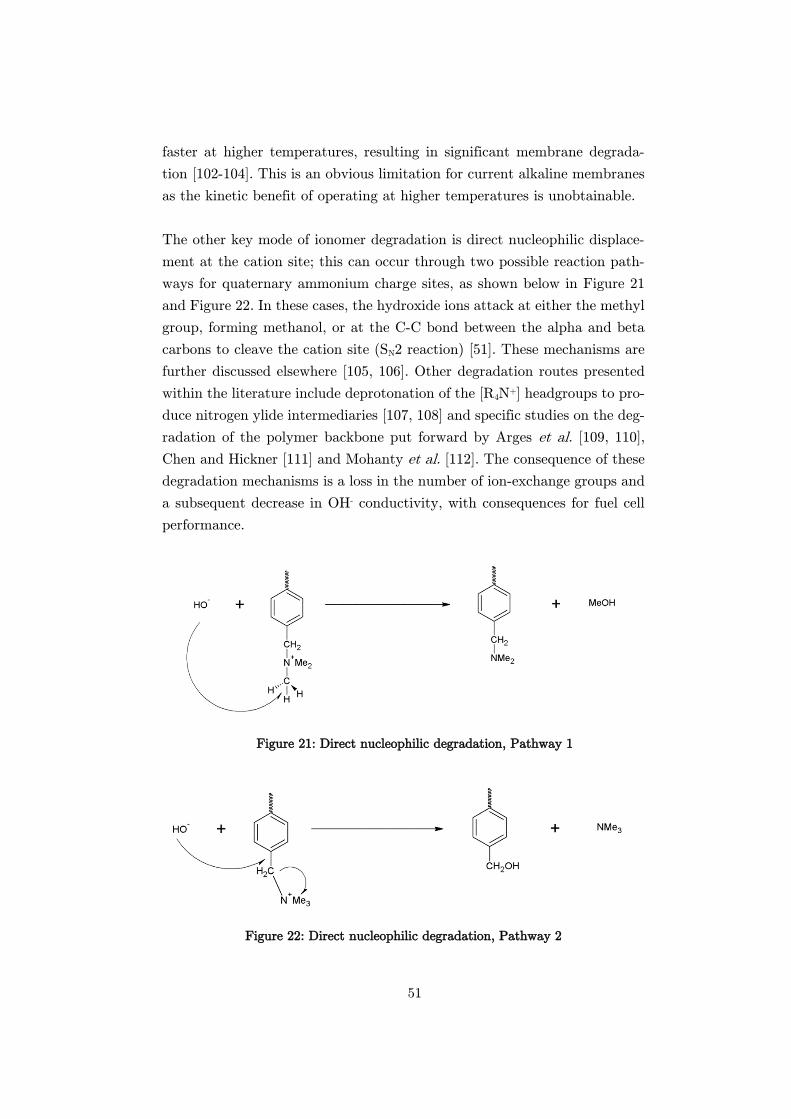
51
faster at higher temperatures, resulting in significant membrane degrada-
tion [102-104]. This is an obvious limitation for current alkaline membranes
as the kinetic benefit of operating at higher temperatures is unobtainable.
The other key mode of ionomer degradation is direct nucleophilic displace-
ment at the cation site; this can occur through two possible reaction path-
ways for quaternary ammonium charge sites, as shown below in Figure 21
and Figure 22. In these cases, the hydroxide ions attack at either the methyl
group, forming methanol, or at the C-C bond between the alpha and beta
carbons to cleave the cation site (SN2 reaction) [51]. These mechanisms are
further discussed elsewhere [105, 106]. Other degradation routes presented
within the literature include deprotonation of the [R4N+] headgroups to pro-
duce nitrogen ylide intermediaries [107, 108] and specific studies on the deg-
radation of the polymer backbone put forward by Arges et al. [109, 110],
Chen and Hickner [111] and Mohanty et al. [112]. The consequence of these
degradation mechanisms is a loss in the number of ion-exchange groups and
a subsequent decrease in OH- conductivity, with consequences for fuel cell
performance.
Figure 21: Direct nucleophilic degradation, Pathway 1
Figure 22: Direct nucleophilic degradation, Pathway 2
52
As with most SPEs, AAEM hydroxyl conduction improves with hydration
as the ionomer channels solvate and subsequently swell [113, 114]. There is
a balance between improved membrane conductivity through hydration and
the deleterious effects on the performance seen in fuel cells caused by the
formation of liquid water blocking reactant channels and gas diffusion layer
pores. Recently published work [105, 108, 115] on formulated head groups
have added a new dynamic to this balance, indicating a correlation between
ion solvation (and hence ionomer hydration) and ionomer degradation by
nucleophilic attack.
A model presented by Chempath et al. [105] implements an untethered cat-
ionic head group, [N(CH3)4]+, and shows that the degradation mechanisms
appear more aggressive in a system with low water content. Work by Ma-
comber et al. [108] reports a similar conclusion, where the thermal degrada-
tion of tetramethyl ammonium hydroxide is retarded by hydration. In both
cases, the investigations explain that a dehydrated membrane exhibits more
aggressive degradation, as both the hydroxyl ions and cations remain un-
solvated and thus more reactive [105, 108].
Carbonate Ion Interaction and Conductivity
Compared to the A-FC, the AAEM-FC is much more portable and does not
suffer from weeping of caustic electrolyte and leaking issues [53]; however,
recent reports suggest it is still susceptible to carbonate formation [60, 74-
76]. In A-FCs, metal carbonates form from the interaction of dissolved car-
bon dioxide from the air and metal cations (M) within the aqueous electro-
lyte, such as K+ and Na+, as described in Equation (17) [53]. These metal
carbonates precipitate and not only decrease the concentration of solvated
OH- ions but also precipitate, forming layers on the electrode surfaces, block-
ing active sites, gas diffusion layers (GDLs) and significantly reducing sys-
tem performance.
Recall,
𝐶𝑂2(𝑔) + 2𝑀𝑂𝐻(𝑎𝑞) ↔ 𝑀2𝐶𝑂3(𝑎𝑞) + 𝐻2𝑂(𝑙) (17)
53
The AAEM has immobilised cationic functional groups tethered to its pol-
ymer backbone and thus the effect of carbonate formation on the system’s
ionic performance has been a topic of much debate. The membrane is still
expected to form immobilised metal carbonates; however, these are thought
to have minimal deleterious performance effects on fuel cell operation as
they cannot dissociate from the ionomer backbone and cause the aforemen-
tioned blocking issues seen in the A-FC [116, 117]. Some studies have shown
that the presence of carbonate ions can, in fact, enhance fuel cell perfor-
mance through improved membrane chemical stability and thus long-term
operation [76, 116]; whilst others have presented opposing results, through
a reduction in both ionic conductivity and its impact on the hydrogen oxi-
dation reaction (HOR) [118-122].
Investigations have proven that the ionomer can operate in the carbonate
(CO32- / HCO3-) form [121]; however, the reported conductivities have been
significantly lower when compared to operation in the OH- form [123].
Varcoe et al. [76] have presented a potential solution, known as the self-
purging mechanism, in which a humidified system can return to OH- oper-
ation having been in the carbonate form. This mechanism requires the sys-
tem to run at high current densities and in CO2 free conditions; allowing
the carbonate ions to be replaced by OH- ions generated at the anode [118].
Even with promising commercialisation prospects, the effect of CO2 interac-
tion, membrane degradation and poor understanding of the system’s hydra-
tion mechanisms have resulted in very few commercially available AAEMs
and thus no industry-leading standard (such as Nafion). Many examples in
the literature are conducted on in-house fabricated membranes; generally at
the lab scale development stages and hence have huge discrepancies in find-
ings, such as conductivity and thermal and chemical stability [53].
As discussed, Tokuyama Co’s AS-4 AAEM provides an ionic conductivity
more comparable to that of Nafion; however little is known of the mem-
brane’s properties or how it functions in different operating conditions. Pub-
lished work by Tokuyama and specifically Yanagi and Fukuta [121], has
shown that the membrane is hindered by operation in air, resulting in re-
duced conductivity in the A201 membrane from 42 mS cm-1 in the OH- form
to 10 mS cm-1 in the carbonate form.
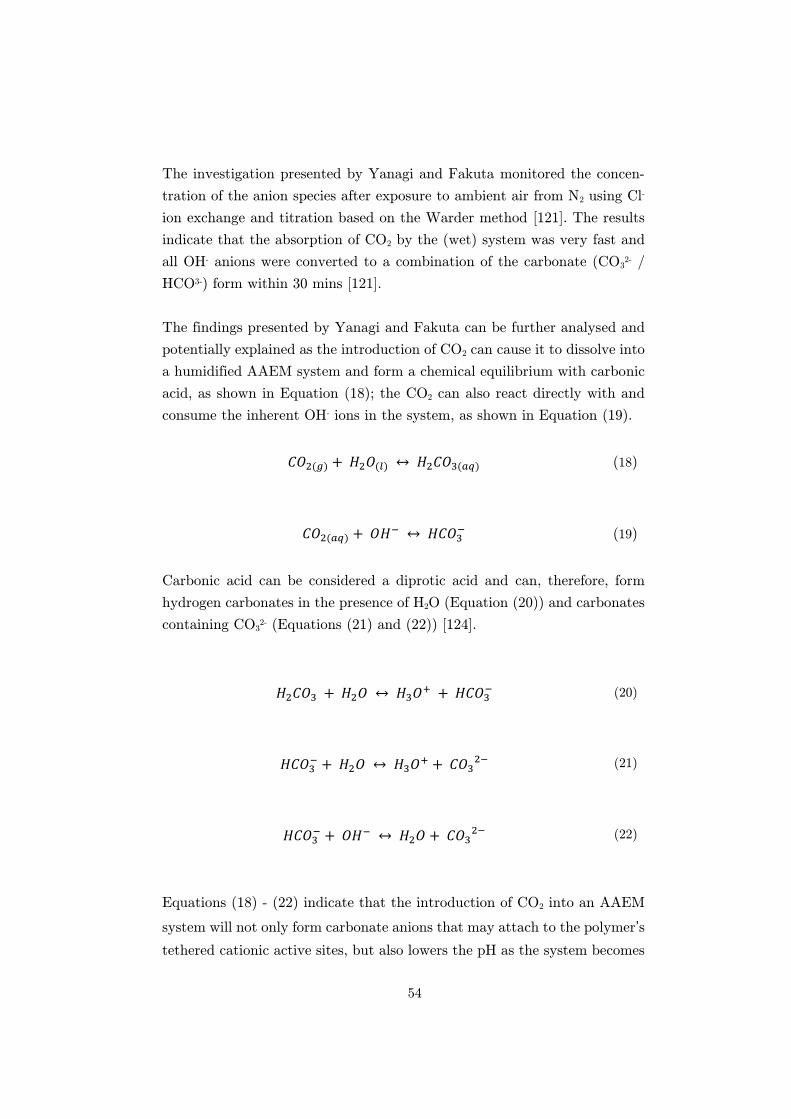
54
The investigation presented by Yanagi and Fakuta monitored the concen-
tration of the anion species after exposure to ambient air from N2 using Cl-
ion exchange and titration based on the Warder method [121]. The results
indicate that the absorption of CO2 by the (wet) system was very fast and
all OH- anions were converted to a combination of the carbonate (CO32- /
HCO3-) form within 30 mins [121].
The findings presented by Yanagi and Fakuta can be further analysed and
potentially explained as the introduction of CO2 can cause it to dissolve into
a humidified AAEM system and form a chemical equilibrium with carbonic
acid, as shown in Equation (18); the CO2 can also react directly with and
consume the inherent OH- ions in the system, as shown in Equation (19).
𝐶𝑂2(𝑔) + 𝐻2𝑂(𝑙) ↔ 𝐻2𝐶𝑂3(𝑎𝑞) (18)
𝐶𝑂2(𝑎𝑞) + 𝑂𝐻− ↔ 𝐻𝐶𝑂3− (19)
Carbonic acid can be considered a diprotic acid and can, therefore, form
hydrogen carbonates in the presence of H2O (Equation (20)) and carbonates
containing CO32- (Equations (21) and (22)) [124].
𝐻2𝐶𝑂3 + 𝐻2𝑂 ↔ 𝐻3𝑂+ + 𝐻𝐶𝑂3− (20)
𝐻𝐶𝑂3− + 𝐻2𝑂 ↔ 𝐻3𝑂+ + 𝐶𝑂3
2− (21)
𝐻𝐶𝑂3− + 𝑂𝐻− ↔ 𝐻2𝑂 + 𝐶𝑂3
2− (22)
Equations (18) - (22) indicate that the introduction of CO2 into an AAEM
system will not only form carbonate anions that may attach to the polymer’s
tethered cationic active sites, but also lowers the pH as the system becomes
55
more acidic, as well as consuming OH- ions reducing membrane conductivity
and hence performance [125].
Water management and ionomer hydration play a key role in effective fuel
cell operation, including ionic conductivity [126] and ionomer degradation
[127]. Equations (18) - (22) show that water may also play a key role in the
mechanisms involved in reducing fuel cell performance through interaction
with CO2. It is therefore crucial that we understand if and how the system’s
operational humidity affects the processes discussed above.
3.2.5 The Application of a BAW Resonator
Section 3.2.4 has outlined some of the major operational concerns of the
AAEM-FC. In order to commercialise the AAEM-FC, the issues of water
sorption and swelling characteristics, thermal and chemical instability and
carbonate ion interaction must be understood and addressed. In each case,
the membrane’s characteristics and morphological changes must be investi-
gated as a function of its operating conditions in order to optimize the
AAEMs operation, performance and cost.
This study will examine each of the aforementioned operational issues on an
interfacial level using the nanogram resolution mass monitoring capability
of composite BAW resonators coupled with crystal admittance spectroscopy.
Electrolyte mass changes during this study are likely to be in the nanogram
region; making a BAW resonator and specifically a quartz crystal microbal-
ance (QCM) an ideal in-situ mass measurement device. As discussed in
Chapter 2, a BAW resonator is able to operate under a range of conditions
and in an array of media. One of the more difficult challenges with an in-
situ sensor of this type is the ability to distinguish between different types
of loading i.e. whether a change in frequency response can be attributed to
additional mass loading or simply changes in the operating environment or
changing membrane characteristics. However, the application of crystal ad-
mittance spectroscopy (CAS) and its equivalent circuits as discussed in Sec-
tions 2.5 and 0 respectively allows specific frequency shifts to be categorized.
56
CAS will provide unique insight into how the ionomers are affected by wa-
ter, degradation and carbonate interaction; providing a clearer picture of
whether responses are related to rigid or viscoelastic properties for instance.
A 2013 publication by Abuin et al. [80] showed the use of a QCM for in-situ
mass monitoring in a PEM-FC to understand how Nafion’s swelling and
water sorption properties were affected by the presence of a substrate. This
work was of particular interest, as it encompassed a similar technique to
that used here; employing the QCM as a means to measure the mass change
on the crystal surface and hence to determine the water uptake by the
Nafion ionomer. However, whilst showing how the water uptake of the
Nafion varies with its thickness, Abuin et al. had issues with electrolyte
casting, conducting this as an ex-situ process. Consequently, the reported
masses and Nafion thicknesses published are inaccurate under dry condi-
tions, thus making it impossible to calculate and compare accurate water
uptake results for the ionomer when operating under humidified conditions.
A similar issue was found with work published by Kongkanand [86], who
showed that the Nafion water uptake was affected by temperature and very
slightly by membrane thickness.
Studies on Nafion have described water uptake trends and some have com-
mented on the so-called Schroeder’s Paradox - a phenomenon used to de-
scribe the difference in solvent uptake by a polymer when exposed to satu-
rated vapour and pure liquid [80, 85, 86]. However, to date, most QCM
studies have limited the analysis to a simple consideration of the frequency
of operation as the key metric of water uptake and overlooked viscoelastic
effects, loading mechanisms and subsequent swelling of the interfacial layer
upon hydration. Using the QCM to investigate viscoelastic changes of the
ionomer during hydration provides potential insight into hydrated micro-
structure and the links between hydration states and ionic conductivity.
A similar technique of in-situ monitoring will be conducted throughout this
work with the in-situ casting of a thin layer of electrolyte on the BAW
resonator surface to give a ‘true’ in-situ indication of what is happening at
the electrolyte – electrode interface. The QCM allows thin film deposition
of ionomers to be cast and allows in-situ non-intrusive operation. The use
57
of thin ionomer films ensures there is no contribution of internal water dif-
fusion within the film and simplifies the analysis.
The following section outlines the three thin-film ionomer investigations en-
compassed within this study:
• The first part of this study investigates the water uptake and loading
mechanisms of both thin-film Nafion and a commercially available
AS-4 AAEM ionomer whilst operating in a range of humidified en-
vironments using the QCM and CAS. Whilst the Nafion ionomer’s
water uptake and loading mechanisms are reasonably well under-
stood, the knowledge of the same within the AAEM is significantly
lower. The Nafion investigation presented during this study is novel
in its own right through the application of CAS, but also serves as
a means by which to validate the experimental set-up and feasibility
for thin film ionomer studies for the unknown AS-4 ionomer.
• With the AAEM hydration mechanisms better understood, the sec-
ond investigation experimentally explores how specific ionomer hy-
dration affects the thermal and chemical degradation mechanisms of
the AS-4 ionomer using a QCM. In-line mass spectrometry is used
alongside the QCM in this study to further elucidate the importance
(and limitations) of cation and hydroxide ion solvation for the sta-
bility of an AAEM ionomer.
• The final investigation within this study examines how reactant hu-
midity (and hence membrane hydration) affects the AAEM interac-
tion with atmospheric levels of CO2. The change of membrane re-
sistance with exposure to air (as a source of CO2) is compared with
the change in viscoelastic properties of a thin-film ionomer, both at
steady state and as a function of humidity.
58
3.3 Methodology
This study has been divided into the investigations outlined in Section 3.2.5;
however, many of the key operating principles remain the same between
investigations and thus employs the same ‘base-rig’ set up. Rig modifications
and changes in the methodology have been made for specific investigations
and these are clearly highlighted where relevant.
This section outlines and justifies the equipment selection, development and
material choices used through this study.
3.3.1 Quartz Crystal Microbalance
The in-situ interfacial electrolyte investigations proposed in Section 3.2.5
required nanogram resolution mass monitoring to detect the smallest
changes within the system in order to provide useful insight into processes
occurring at the interfacial level. The required level of accuracy made the
BAW resonator the ideal mass monitoring device for these applications.
The investigations within this study have application conditions between
50 – 80 OC at a range of relative humidities and involve polymer surface
modification of the BAW resonator for in-situ application. It was, therefore,
necessary to find a BAW resonator able to operate with an attached thin
film layer within the defined conditions.
There are a range of BAW resonators suitable for this operation, each with
varying levels of frequency stability and mass sensitivity as described by
[128]. However, the quartz crystal microbalance (QCM) represents a mature,
reliable, stable, consistent and cost-effective mass monitoring device. The
QCM has proven applications across many polymer studies including previ-
ous work with Nafion [80, 86, 129], where it has shown excellent stability
and accuracy of mass measurement. The QCM was therefore chosen for
these investigations and a further feasibility study is presented in Section
3.4.1 [130, 131].
The QCM is a very popular BAW resonator for the aforementioned reasons
and it is therefore available in a range of resonant frequencies, each with
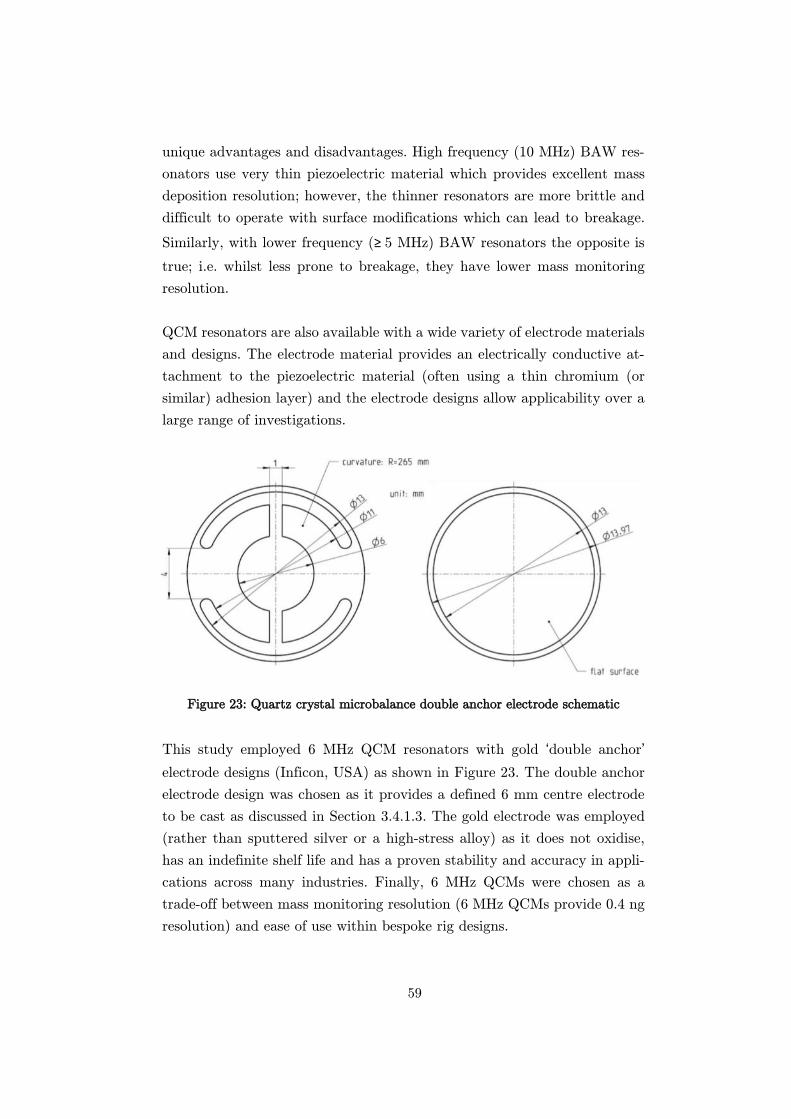
59
unique advantages and disadvantages. High frequency (10 MHz) BAW res-
onators use very thin piezoelectric material which provides excellent mass
deposition resolution; however, the thinner resonators are more brittle and
difficult to operate with surface modifications which can lead to breakage.
Similarly, with lower frequency (≥ 5 MHz) BAW resonators the opposite is
true; i.e. whilst less prone to breakage, they have lower mass monitoring
resolution.
QCM resonators are also available with a wide variety of electrode materials
and designs. The electrode material provides an electrically conductive at-
tachment to the piezoelectric material (often using a thin chromium (or
similar) adhesion layer) and the electrode designs allow applicability over a
large range of investigations.
Figure 23: Quartz crystal microbalance double anchor electrode schematic
This study employed 6 MHz QCM resonators with gold ‘double anchor’
electrode designs (Inficon, USA) as shown in Figure 23. The double anchor
electrode design was chosen as it provides a defined 6 mm centre electrode
to be cast as discussed in Section 3.4.1.3. The gold electrode was employed
(rather than sputtered silver or a high-stress alloy) as it does not oxidise,
has an indefinite shelf life and has a proven stability and accuracy in appli-
cations across many industries. Finally, 6 MHz QCMs were chosen as a
trade-off between mass monitoring resolution (6 MHz QCMs provide 0.4 ng
resolution) and ease of use within bespoke rig designs.
60
3.3.2 Rig Development
The experimental rig is initially set up as shown in Figure 24 (hereunder
referred to as the ‘base-rig’) and is developed to provide both a dry (0 % RH)
and humidified (0.5% - 100% RH) supply of nitrogen to the QCM under
test which is housed in the fuel cell humidification chamber (hereunder
known as the cell). The literature presented in Section 3.2.4.3 suggests that
the AAEM is expected to interact and form carbonate ions in the presence
of CO2 (even at atmospheric concentration levels) [120, 132] and so all in-
vestigations were conducted within the sealed cell in CO2 - free conditions
as discussed in Section 3.3.4.3. The base rig was the initial test station de-
veloped for the water uptake and hydration mechanism investigation; alter-
ations for further investigations are discussed in Section 3.3.4.
Nitrogen (BOC, UK) is supplied compressed at 300 bar in a compressed gas
cylinder; it is piped to a 5 bar 2-stage regulator, valve tap and filter through
(1/4”) nylon piping (FTI, Sussex UK) to a mass flow controller (Bronkhorst,
Suffolk UK). The mass flow controller allows a desired flow of nitrogen into
a dry stream through a desiccant or via the dew point humidifier (Arbin
Instruments, USA). The dew point humidifier was connected to cooling and
deionised water supplies and allowed a precise gas dew point supply tem-
perature to be set. The dew point specific or dry gas is fed to the cell, where
it fills the QCM housing chamber (which is constantly replenished at a rate
of 100 ml min-1). The gas then continues through the chamber and is subse-
quently vented.
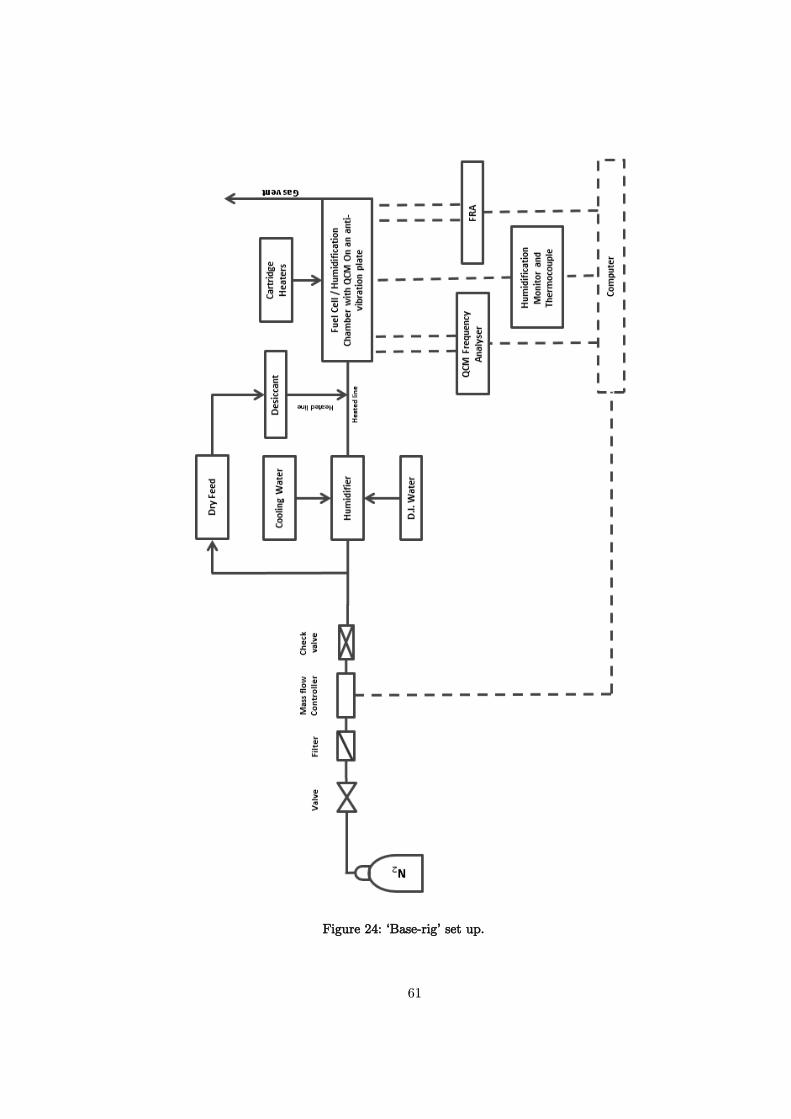
61
Figure 24: ‘Base-rig’ set up.
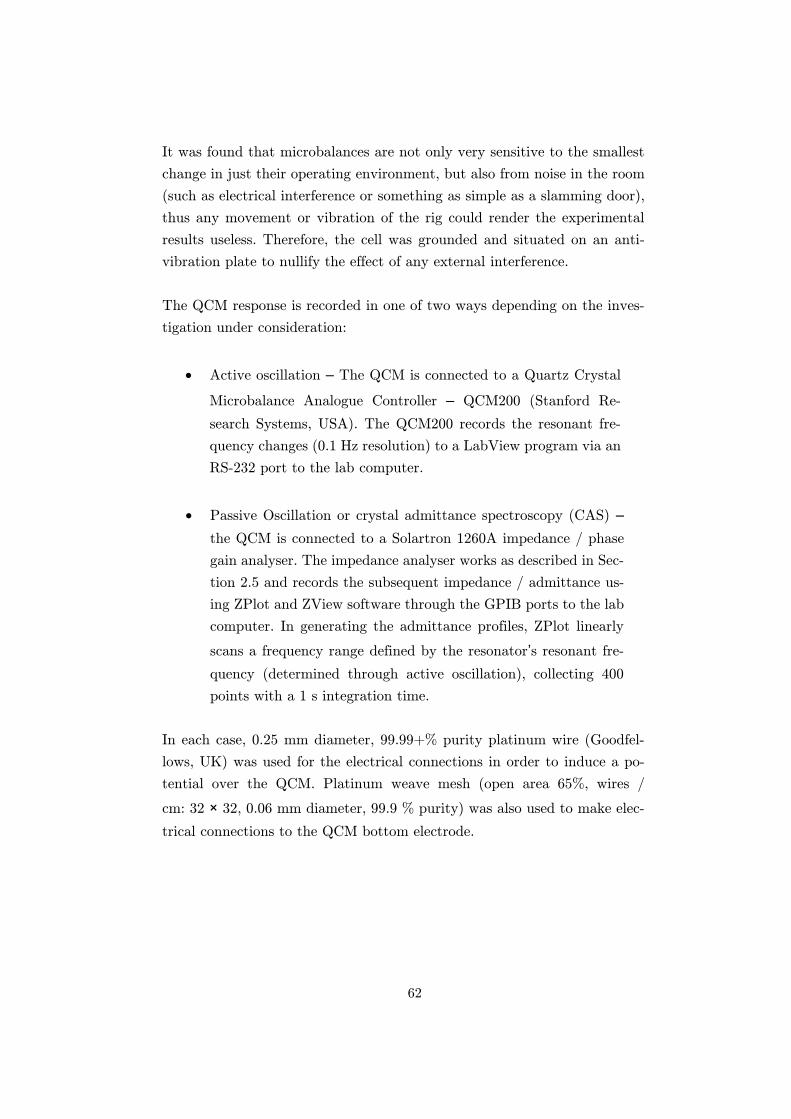
62
It was found that microbalances are not only very sensitive to the smallest
change in just their operating environment, but also from noise in the room
(such as electrical interference or something as simple as a slamming door),
thus any movement or vibration of the rig could render the experimental
results useless. Therefore, the cell was grounded and situated on an anti-
vibration plate to nullify the effect of any external interference.
The QCM response is recorded in one of two ways depending on the inves-
tigation under consideration:
• Active oscillation – The QCM is connected to a Quartz Crystal
Microbalance Analogue Controller – QCM200 (Stanford Re-
search Systems, USA). The QCM200 records the resonant fre-
quency changes (0.1 Hz resolution) to a LabView program via an
RS-232 port to the lab computer.
• Passive Oscillation or crystal admittance spectroscopy (CAS) –
the QCM is connected to a Solartron 1260A impedance / phase
gain analyser. The impedance analyser works as described in Sec-
tion 2.5 and records the subsequent impedance / admittance us-
ing ZPlot and ZView software through the GPIB ports to the lab
computer. In generating the admittance profiles, ZPlot linearly
scans a frequency range defined by the resonator’s resonant fre-
quency (determined through active oscillation), collecting 400
points with a 1 s integration time.
In each case, 0.25 mm diameter, 99.99+% purity platinum wire (Goodfel-
lows, UK) was used for the electrical connections in order to induce a po-
tential over the QCM. Platinum weave mesh (open area 65%, wires /
cm: 32 × 32, 0.06 mm diameter, 99.9 % purity) was also used to make elec-
trical connections to the QCM bottom electrode.
63
The Cell (humidification chamber)
Figure 25 shows the cell in more detail. It was designed in-house and has
been developed to simulate an adaptable pseudo fuel cell capable of a range
of operating environment and comprises a gas inlet and outlet, cartridge
heaters, a thermocouple and humidification probes. The cell design allows
for very versatile operating conditions to be employed, such as temperature,
humidity and gaseous environment.
Figure 25: The fuel cell humidification chamber / cell. The QCM is housed within
the holder in the translucent section to the right of the image.
The temperature within the cell is maintained using two cartridge heaters
and a thermocouple connected to an accurately tuned PID controller (Eu-
rotherm, UK). The cell is made of aluminium to ensure that the heat pro-
vided from the cartridge heaters is efficiently distributed to the microbalance
– this was confirmed using sticky thermocouples placed on the microbalance
surface and temperature profile developed using a thermal imaging camera.
The gas inlet and outlet to the cell are discussed earlier in Section 3.3.2 and
allow nitrogen (and / or air – Section 3.3.4.3) to be supplied to the cell at
a range of relative humidities from the mass flow controllers. Figure 25 also
shows the fittings for the humidity probe (Vaisala, Finland) used to monitor
the system’s relative humidity.
64
Finally, the microbalance holder can be seen in the translucent section of
the cell in Figure 25 and this is further discussed in Section 3.3.2.2. The
translucent section of the cell doubles as the casting bay and contains an
access point for in-situ electrolyte casting via micro-pipette as described in
Section 3.3.3.
Microbalance Holder
Many commercial microbalance holders and experimental prefabricated set-
ups exist on the market. These well-tested pieces of equipment offer stable
frequency analysis and allow mass monitoring for a range of general appli-
cations. However, to understand the in-situ analysis and the fundamental
processes occurring in a novel system such as this, a new rig and non-intru-
sive microbalance holder had to be developed to assimilate the conditions
under which these interfacial phenomena occur. Figure 26 shows the QCM
holder developed for this investigation which is housed in the cell as shown
in Figure 25 and Figure 27. The holder was designed and manufactured in-
house using drawing software (Rhino, UK) and rapid prototyping CNC ma-
chines to execute. The holder was originally cut from PTFE; however, this
design was rapidly changed and the holder was instead manufactured from
one piece of unfired pyrophyllite as shown. The PTFE holder whilst excel-
lent in holding the crystal in place and providing good electrical connections
through a combination of platinum wire and mesh had one massive draw-
back; its excellent insulation properties. As the chamber and feed gas heated
up, the holder maintained a much lower temperature and hence promoted
water condensation from the humidified gas stream. The condensation of
water onto the holder led to a combination of water on the QCM surface as
well as an increased level of moisture near the QCM and hence produced a
local relative humidity higher than the rest of the chamber leading to in-
creased water loading on the crystal surface at seemingly low relative hu-
midities.
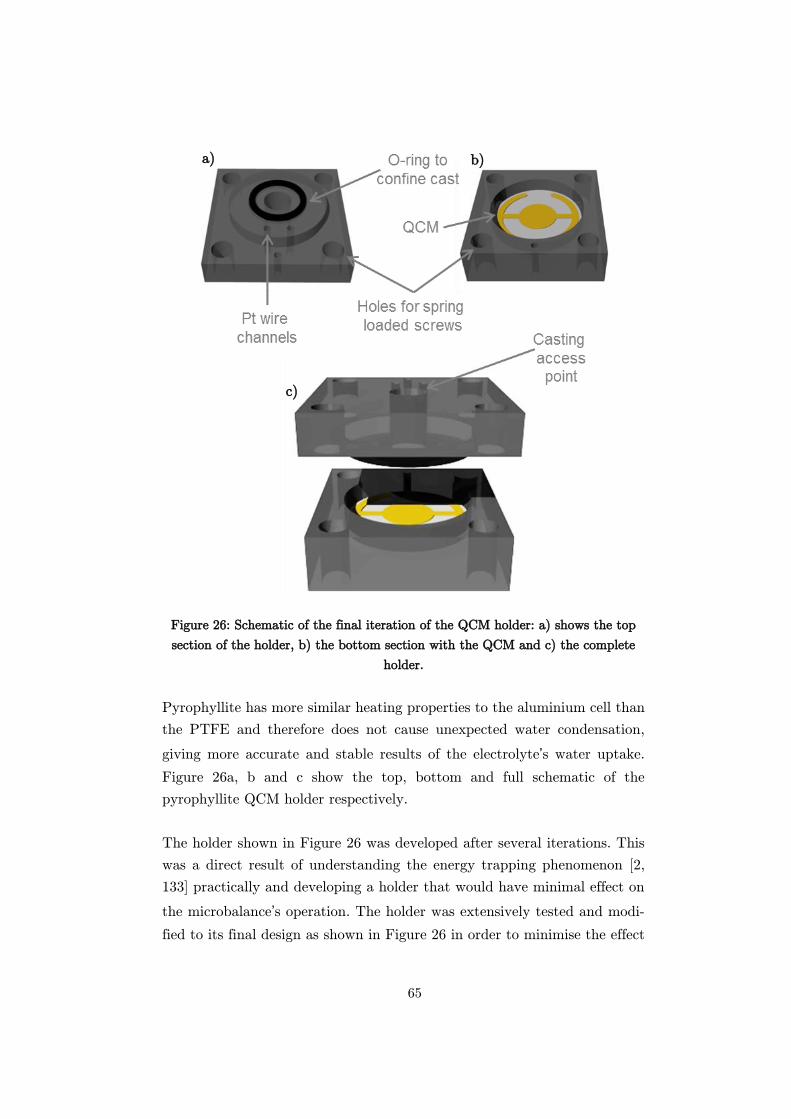
65
Figure 26: Schematic of the final iteration of the QCM holder: a) shows the top
section of the holder, b) the bottom section with the QCM and c) the complete
holder.
Pyrophyllite has more similar heating properties to the aluminium cell than
the PTFE and therefore does not cause unexpected water condensation,
giving more accurate and stable results of the electrolyte’s water uptake.
Figure 26a, b and c show the top, bottom and full schematic of the
pyrophyllite QCM holder respectively.
The holder shown in Figure 26 was developed after several iterations. This
was a direct result of understanding the energy trapping phenomenon [2,
133] practically and developing a holder that would have minimal effect on
the microbalance’s operation. The holder was extensively tested and modi-
fied to its final design as shown in Figure 26 in order to minimise the effect
a) b)
c)
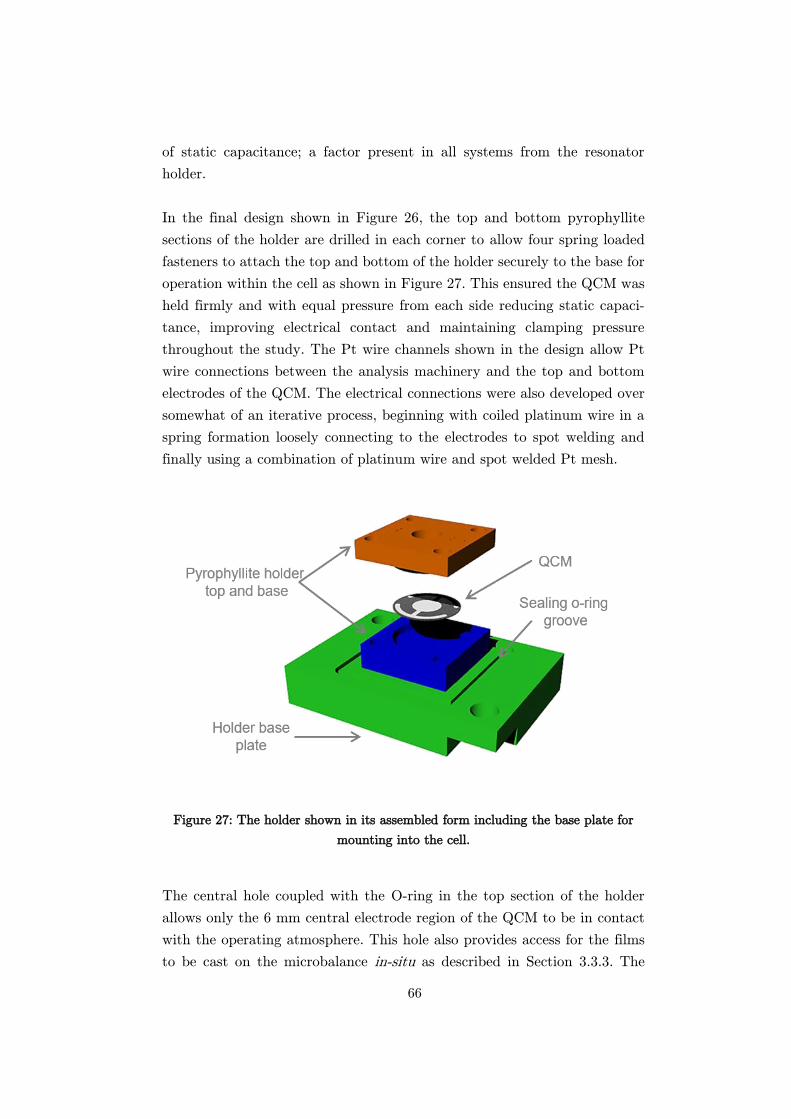
66
of static capacitance; a factor present in all systems from the resonator
holder.
In the final design shown in Figure 26, the top and bottom pyrophyllite
sections of the holder are drilled in each corner to allow four spring loaded
fasteners to attach the top and bottom of the holder securely to the base for
operation within the cell as shown in Figure 27. This ensured the QCM was
held firmly and with equal pressure from each side reducing static capaci-
tance, improving electrical contact and maintaining clamping pressure
throughout the study. The Pt wire channels shown in the design allow Pt
wire connections between the analysis machinery and the top and bottom
electrodes of the QCM. The electrical connections were also developed over
somewhat of an iterative process, beginning with coiled platinum wire in a
spring formation loosely connecting to the electrodes to spot welding and
finally using a combination of platinum wire and spot welded Pt mesh.
Figure 27: The holder shown in its assembled form including the base plate for
mounting into the cell.
The central hole coupled with the O-ring in the top section of the holder
allows only the 6 mm central electrode region of the QCM to be in contact
with the operating atmosphere. This hole also provides access for the films
to be cast on the microbalance in-situ as described in Section 3.3.3. The
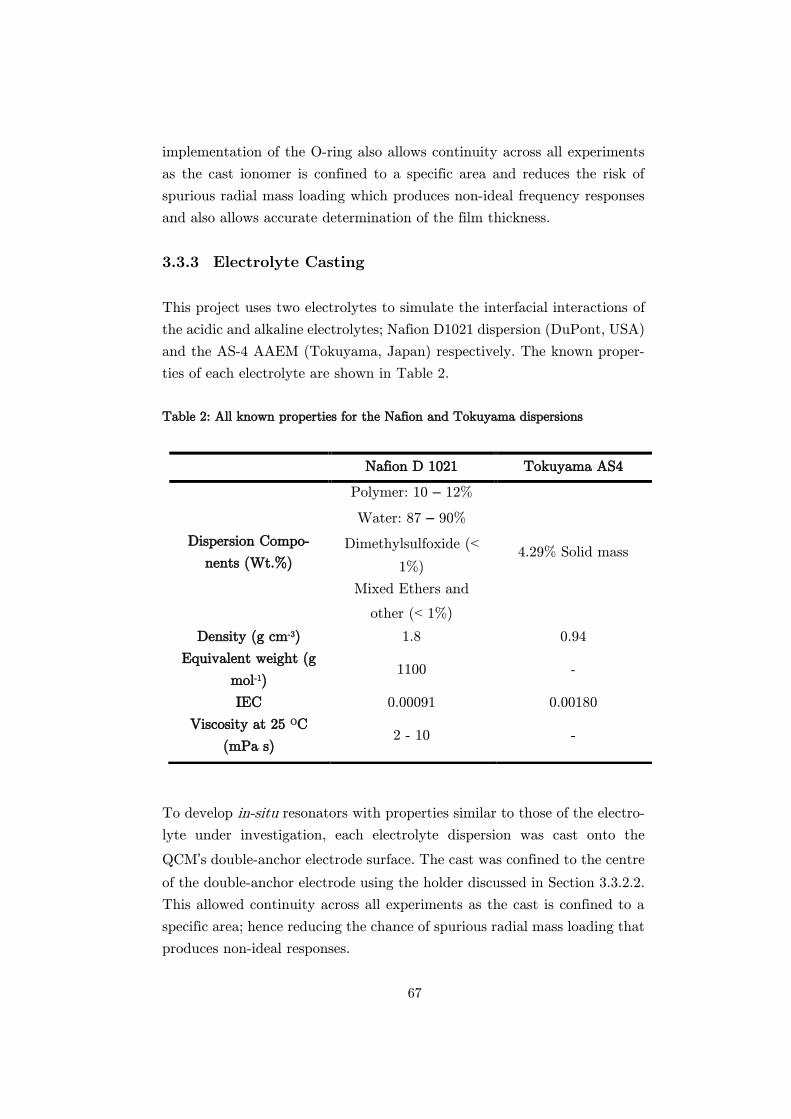
67
implementation of the O-ring also allows continuity across all experiments
as the cast ionomer is confined to a specific area and reduces the risk of
spurious radial mass loading which produces non-ideal frequency responses
and also allows accurate determination of the film thickness.
3.3.3 Electrolyte Casting
This project uses two electrolytes to simulate the interfacial interactions of
the acidic and alkaline electrolytes; Nafion D1021 dispersion (DuPont, USA)
and the AS-4 AAEM (Tokuyama, Japan) respectively. The known proper-
ties of each electrolyte are shown in Table 2.
Table 2: All known properties for the Nafion and Tokuyama dispersions
To develop in-situ resonators with properties similar to those of the electro-
lyte under investigation, each electrolyte dispersion was cast onto the
QCM’s double-anchor electrode surface. The cast was confined to the centre
of the double-anchor electrode using the holder discussed in Section 3.3.2.2.
This allowed continuity across all experiments as the cast is confined to a
specific area; hence reducing the chance of spurious radial mass loading that
produces non-ideal responses.
Nafion D 1021 Tokuyama AS4
Dispersion Compo-
nents (Wt.%)
Polymer: 10 – 12%
Water: 87 – 90%
Dimethylsulfoxide (<
1%)
Mixed Ethers and
other (< 1%)
4.29% Solid mass
Density (g cm-3) 1.8 0.94
Equivalent weight (g
mol-1) 1100 -
IEC 0.00091 0.00180
Viscosity at 25 OC
(mPa s) 2 - 10 -
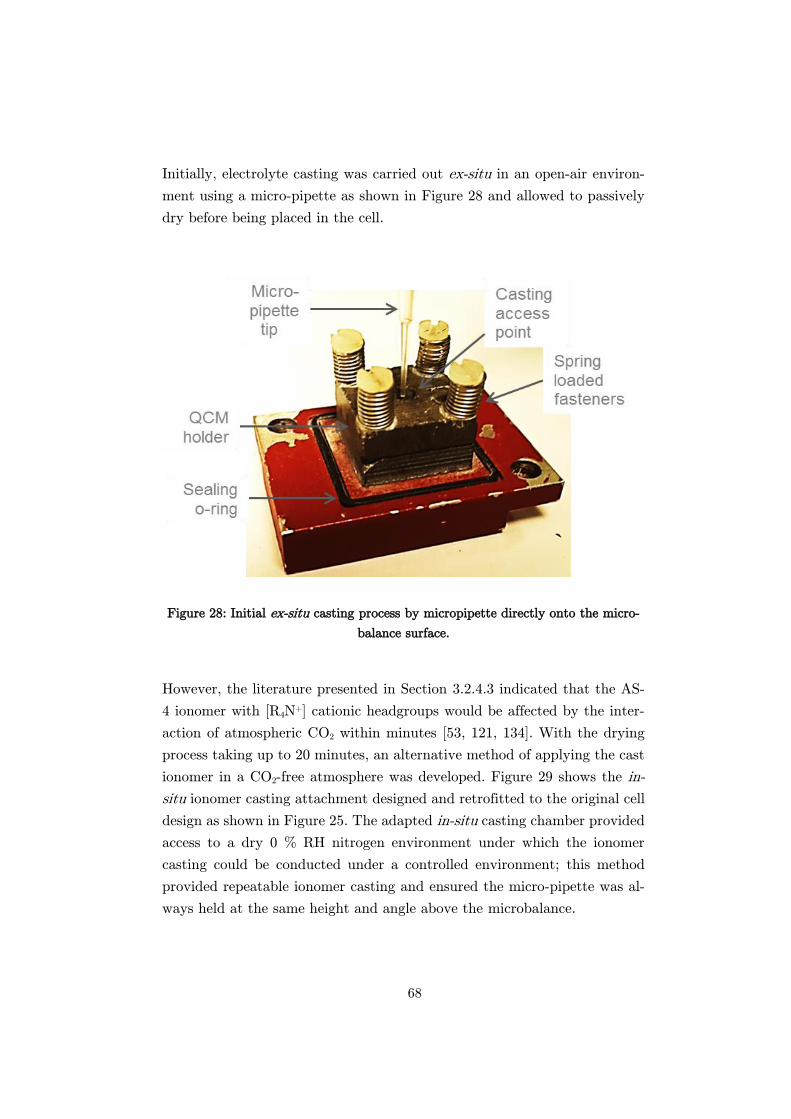
68
Initially, electrolyte casting was carried out ex-situ in an open-air environ-
ment using a micro-pipette as shown in Figure 28 and allowed to passively
dry before being placed in the cell.
Figure 28: Initial ex-situ casting process by micropipette directly onto the micro-
balance surface.
However, the literature presented in Section 3.2.4.3 indicated that the AS-
4 ionomer with [R4N+] cationic headgroups would be affected by the inter-
action of atmospheric CO2 within minutes [53, 121, 134]. With the drying
process taking up to 20 minutes, an alternative method of applying the cast
ionomer in a CO2-free atmosphere was developed. Figure 29 shows the in-
situ ionomer casting attachment designed and retrofitted to the original cell
design as shown in Figure 25. The adapted in-situ casting chamber provided
access to a dry 0 % RH nitrogen environment under which the ionomer
casting could be conducted under a controlled environment; this method
provided repeatable ionomer casting and ensured the micro-pipette was al-
ways held at the same height and angle above the microbalance.
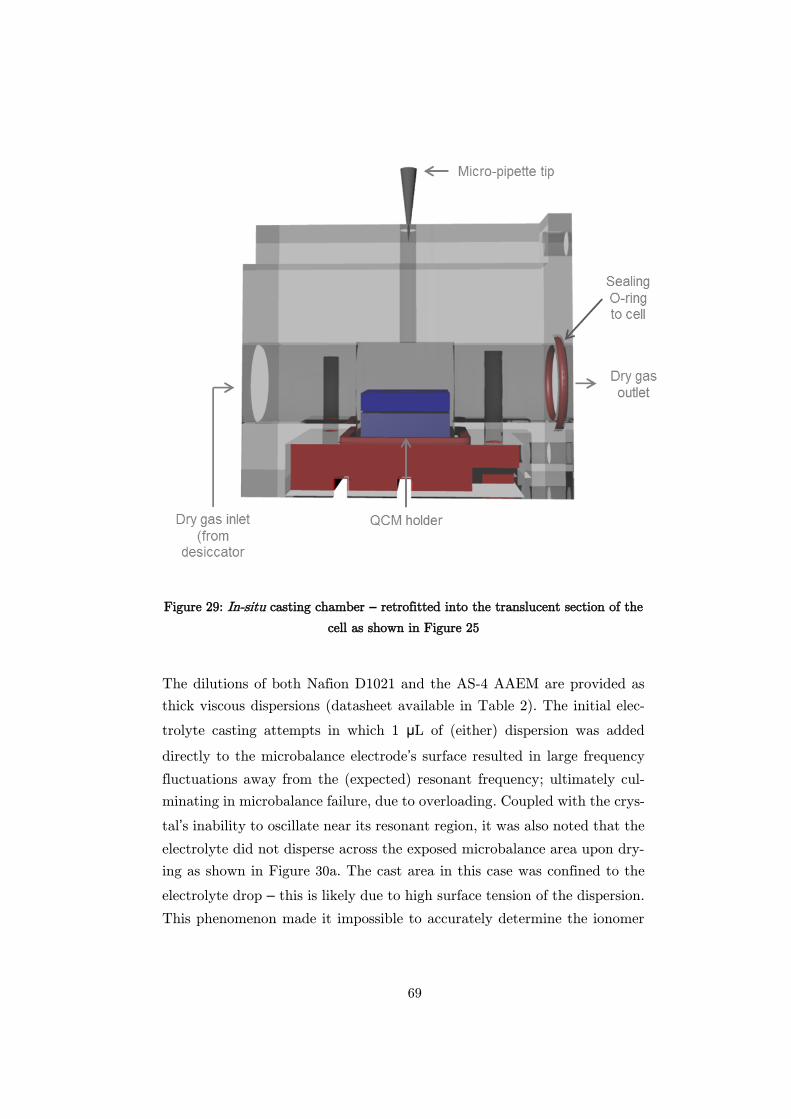
69
Figure 29: In-situ casting chamber – retrofitted into the translucent section of the
cell as shown in Figure 25
The dilutions of both Nafion D1021 and the AS-4 AAEM are provided as
thick viscous dispersions (datasheet available in Table 2). The initial elec-
trolyte casting attempts in which 1 μL of (either) dispersion was added
directly to the microbalance electrode’s surface resulted in large frequency
fluctuations away from the (expected) resonant frequency; ultimately cul-
minating in microbalance failure, due to overloading. Coupled with the crys-
tal’s inability to oscillate near its resonant region, it was also noted that the
electrolyte did not disperse across the exposed microbalance area upon dry-
ing as shown in Figure 30a. The cast area in this case was confined to the
electrolyte drop – this is likely due to high surface tension of the dispersion.
This phenomenon made it impossible to accurately determine the ionomer
70
thickness and resulted in an interaction with the operating environment that
could not solely be attributed to the ionomer’s properties.
The microbalance failure was likely due to operation in a highly viscous
medium below its critical temperature (Section 2.4.2 and 4.4.1.2); the elec-
trolyte dispersion therefore required dilution. Diluting the electrolyte pro-
vided a two-fold benefit - ensuring the microbalance operation under (wet)
electrolyte loading as well as reducing the dispersion surface tension and
thus allowing it to spread evenly across the entire O-ring confined area on
the microbalance’s double-anchor electrode.
The Nafion electrolyte dispersion which is supplied suspended in deionised
water was further dispersed in methanol whilst the Tokuyama dispersion
was further diluted with isopropanol (IPA). The suspension media were cho-
sen to help distribute the ionomer evenly over the crystal surface and pro-
mote quick evaporation whilst not affecting the ionomer structure or stabil-
ity. The dilution methods produced better cast results that provided visual
uniformity covering the centre electrode as shown in Figure 30b and have
also been inspected in Section 3.4.1.3 using SEM to ensure the thin film is
evenly distributed preventing misreported thicknesses and spurious radial
mass loading on the microbalance.
During the casting process, diluted dispersions of each ionomer were cast in-
situ to the microbalance double anchor electrode surface via a micro-pipette
under a stream of 100 ml min-1 0% RH N2. All ionomers were cast at 0 % RH
to eliminate the water content contribution to the ionomer thickness calcu-
lations. The Nafion ionomers were cast and operated at 80 OC, whilst the
AAEM ionomers were cast at 55 OC to limit the effect of nucleophilic dis-
placement and subsequent membrane degradation as discussed in Section
3.2.4.3 [51, 53, 78]. The composite resonators (which refer to the ionomer
coated microbalances) were subsequently held at either 80 or 55 C for
1 hour after the cast was applied to allow the ionomer to anneal.
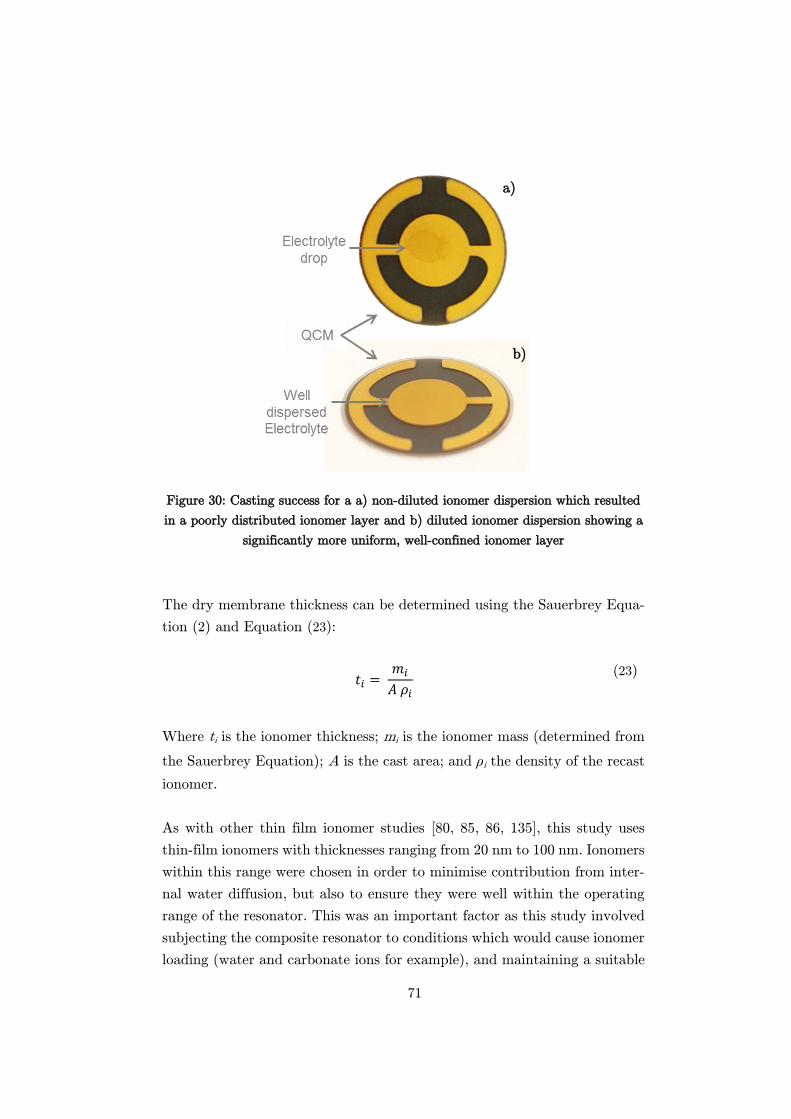
71
Figure 30: Casting success for a a) non-diluted ionomer dispersion which resulted
in a poorly distributed ionomer layer and b) diluted ionomer dispersion showing a
significantly more uniform, well-confined ionomer layer
The dry membrane thickness can be determined using the Sauerbrey Equa-
tion (2) and Equation (23):
𝑡𝑖 = 𝑚𝑖
𝐴 𝜌𝑖
(23)
Where ti is the ionomer thickness; mi is the ionomer mass (determined from
the Sauerbrey Equation); A is the cast area; and ρi the density of the recast
ionomer.
As with other thin film ionomer studies [80, 85, 86, 135], this study uses
thin-film ionomers with thicknesses ranging from 20 nm to 100 nm. Ionomers
within this range were chosen in order to minimise contribution from inter-
nal water diffusion, but also to ensure they were well within the operating
range of the resonator. This was an important factor as this study involved
subjecting the composite resonator to conditions which would cause ionomer
loading (water and carbonate ions for example), and maintaining a suitable
a)
b)
72
Q-factor and ensuring the composite resonator was able to fulfil the standing
wave condition was therefore of critical importance.
CAS was implemented throughout this study to elucidate the phenomenon
occurring on the composite resonators’ interface. However, it was also used
to ensure the composite resonator was always able to fulfil the standing
wave condition and maintain a high Q-factor as discussed in Section 2.2
[136].
3.3.4 Investigation of Specific Operation and Alterations
This section discusses the nuances of the rig operations and alterations for
each investigation within this study. All alterations from the original base
rig setup shown in Figure 24 have been discussed in the relevant sections
below and have been further highlighted using red boxes for ease of differ-
entiation.
Water Uptake and Hydration Mechanisms
The rig shown in Figure 24 was specifically developed to study the water
uptake, loading mechanisms and swelling properties of both thin-film Nafion
and a commercially available AAEM ionomer through a range of humidities
using the QCM and CAS.
An ionomer’s water uptake () is defined as the number of moles of water
adsorbed per mole of functional group present (mol/mol) – it is electrolyte
specific. It provides a useful way to directly compare the water sorption
properties of different membrane types and thicknesses; it is calculated using
Equation (24) or (25) depending on the available ionomer information.
𝜆 = 𝑚𝑤𝑀𝑜
𝑚𝑑𝑀𝑤
(24)
73
Where Mw and Mo are the molecular weight of water and the ionomer’s
exchange sites respectively and md and mw are the dry and wet mass of the
electrolyte at a given humidity.
However, in the case of the AS-4 ionomer the chemical makeup and thus
the number of moles of functional group present per mass of membrane
material is not available. However, another method to determine the water
uptake exists through the membrane’s ion exchange capacity (IEC), as
shown in Equation (25). This method has been verified by calculating
Nafion’s water uptake using both methods [114].
𝜆 = 𝜑
𝐼𝐸𝐶 × 100 × 𝑀𝑤
(25)
Where 𝜑 is defined by:
𝜑 = 𝑚𝑤 − 𝑚𝑑
𝑚𝑑 × 100
(26)
The IEC represents the conducting ion content per gram of polymer (mmol
g-1) [53], mw the molecular weight of water md and mw represent the dry
membrane mass and water mass in the membrane at a given humidity,
respectively [114].
Thin film ionomers of both Nafion and AS-4 were cast with a thickness
ranging from 20 – 100 nm, supported on a QCM electrode. The Nafion and
AS-4 composite resonators were exposed to nitrogen under a range of hu-
midities and the consequent water uptake values and swelling characteristics
determined through a combination of passive and active oscillation methods.
Active oscillation measurements, in which the composite resonator’s fre-
quency response is measured when a specific voltage is applied, were carried
out using a QCM analogue controller (QCM200, Stanford Research Systems,
USA). The admittance response is achieved using a Solartron 1260A
impedance / phase-gain analyser.
74
Degradation
This investigation experimentally explored how specific hydration levels af-
fect the degradation mechanisms of the AS-4 ionomer using QCM composite
resonators. In-line mass spectrometry was also used in this investigation for
off-gas analysis to complement the QCM results and to further elucidate the
importance (and limitations) of cation and hydroxide ion solvation for the
stability of an AAEM ionomer.
During this investigation, the resonator is initially actively oscillated during
the casting process to determine the ionomer thickness, as described; it was
subsequently passively oscillated to determine the effect of operation at ele-
vated temperatures through a range of relative humidities.
After annealing, the composite resonator is passively operated at 55C until
it attains a stable frequency. The operating temperature is then ramped and
held at 65C for 45 mins, it is then cooled back to 55C. This investigation
is repeated through a range of relative humidities with a freshly cast 100 nm
composite resonator for each run. CAS data is recorded before and after the
microbalance temperature ramp and the corresponding response in the
system’s frequency and viscoelasticity is measured.
The apparatus and rig design used throughout this investigation are shown
in Figure 31. The alteration to the original rig is minimal for this investiga-
tion and includes the addition of a mass spectrometer (Hiden, UK) that was
used to analyse the components of the exhaust gas exiting the humidification
chamber, to evaluate the extent of thermal degradation occurring.
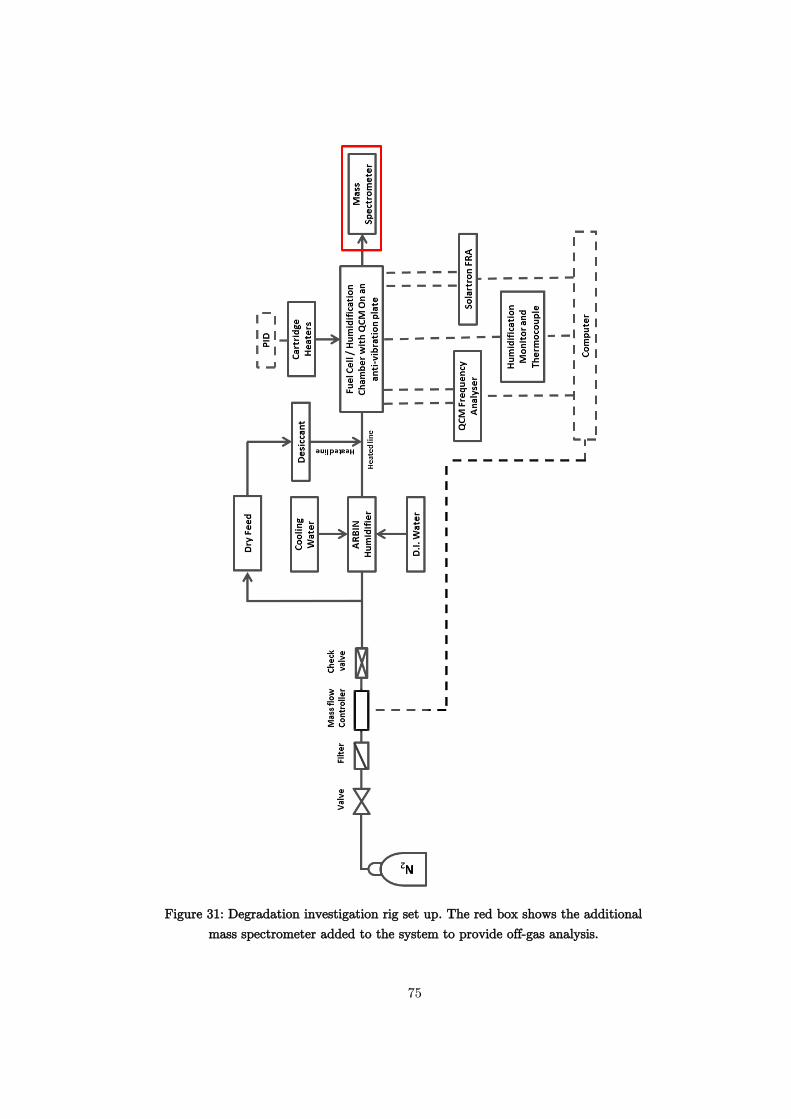
75
Figure 31: Degradation investigation rig set up. The red box shows the additional
mass spectrometer added to the system to provide off-gas analysis.
76
Carbonate Ion Interaction
The carbonate interaction investigation examined how reactant humidity
(and hence membrane hydration) affects how CO2 interacts with the AS-4
ionomer. This investigation also employed an ex-situ analysis of how To-
kuyama’s A-201 sheet membrane’s change in resistance with exposure to air
(as a source of CO2). It is then compared with the change in viscoelastic
properties of a thin-film ionomer, both at steady state and as a function of
humidity. The effect of CO2 on the membrane material as a function of
hydration was also analysed.
The base-rig was altered for the in-situ carbonate interaction analysis by
the introduction of an air input (containing CO2) as shown in Figure 32.
The air cylinder (BOC, UK) was attached to a valve, filter, mass flow con-
troller and check valve and added to the system using a T-piece. After an-
nealing, the 65 ± 4 nm composite resonators continue to operate under a
nitrogen stream at 100 ml min-1 and 55C; the same dew point humidifier
was used to attain the system’s relative humidity and is specific for each
sub-investigation. The frequency was measured actively, and once the com-
posite resonator achieved a stable frequency, the nitrogen was switched to
a stream of air (BOC, UK) at the same flow rate and RH with ~ 400 ppm
CO2 concentration.
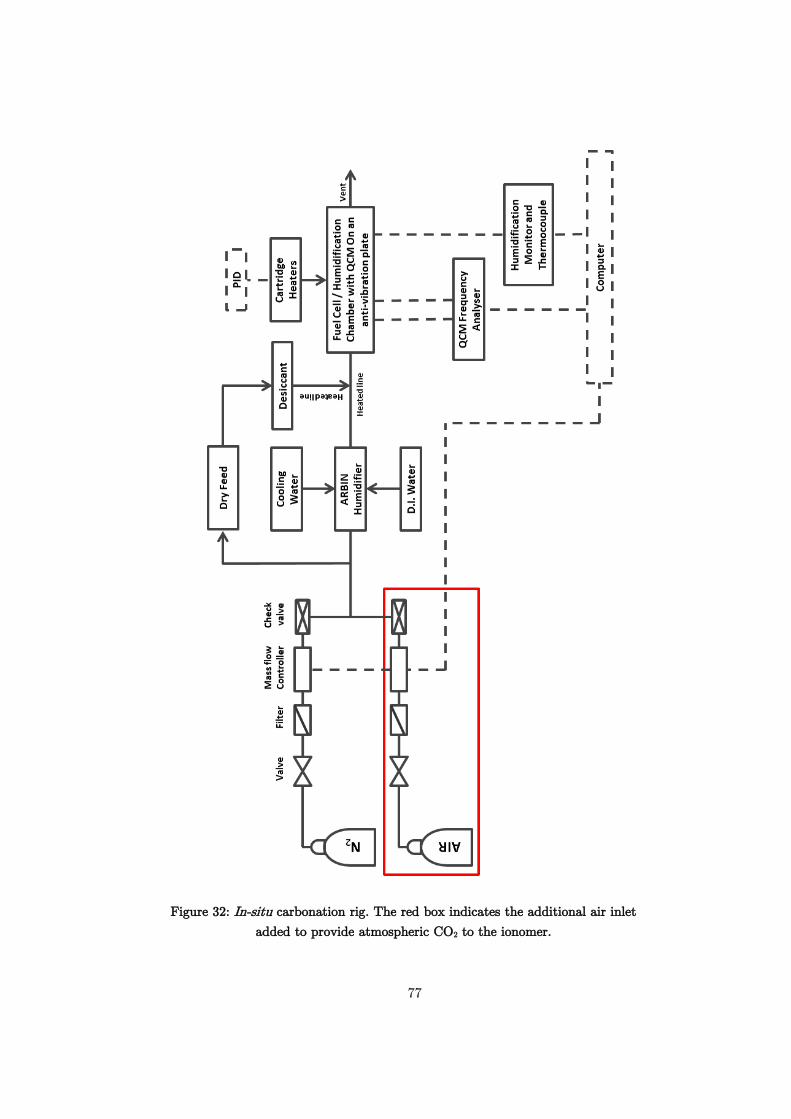
77
Figure 32: In-situ carbonation rig. The red box indicates the additional air inlet
added to provide atmospheric CO2 to the ionomer.
78
A new rig was developed for the ex-situ carbonate ion interaction analysis
and is shown in Figure 33. For this part of the investigation a commercially
available, proprietary alkaline anion-exchange sheet membrane (A201, To-
kuyama, Japan) was operated in an in-house fabricated closed-cathode fuel
cell (5 cm2 active area), with nitrogen running over both sides at a range of
humidities. The A201 membrane was soaked in 1 M KOH for 5 hours to
convert it from the Cl- form to the OH- form; it was then rinsed in deionised
water, pat-dried and inserted into the cell where it was held under stable
conditions at 55 C with 100 ml min-1 of N2 passing over each side. Using
electrochemical impedance spectroscopy (EIS), the high-frequency intercept
with the real axis of the Nyquist plot was used to determine the resistance
of the system. Once the EIS high-frequency intercept was constant, the sup-
ply of nitrogen was switched to air (at the same relative humidity), and the
corresponding high-frequency measurement recorded until stable. This pro-
cess was repeated at a range of RHs delivered the dew point humidifier
(Arbin, USA).
The membrane’s transient high-frequency intercept was measured using an
IviumStat (Alkatek, UK). Impedance spectroscopy was measured
potentiostatically at open circuit voltage, 0 V, with AC amplitude of 10 mV;
the amplitude was the smallest system perturbation which initiated a clear
current response. The high-frequency impedance was measured at 35 kHz
every second; determined by performing impedance sweeps between 100 kHz
and 100 Hz to find the high-frequency intercept before the introduction of
air to the system. The impedance sweep was also performed at the end of
each experiment to confirm a negligible shift in the high-frequency intercept.
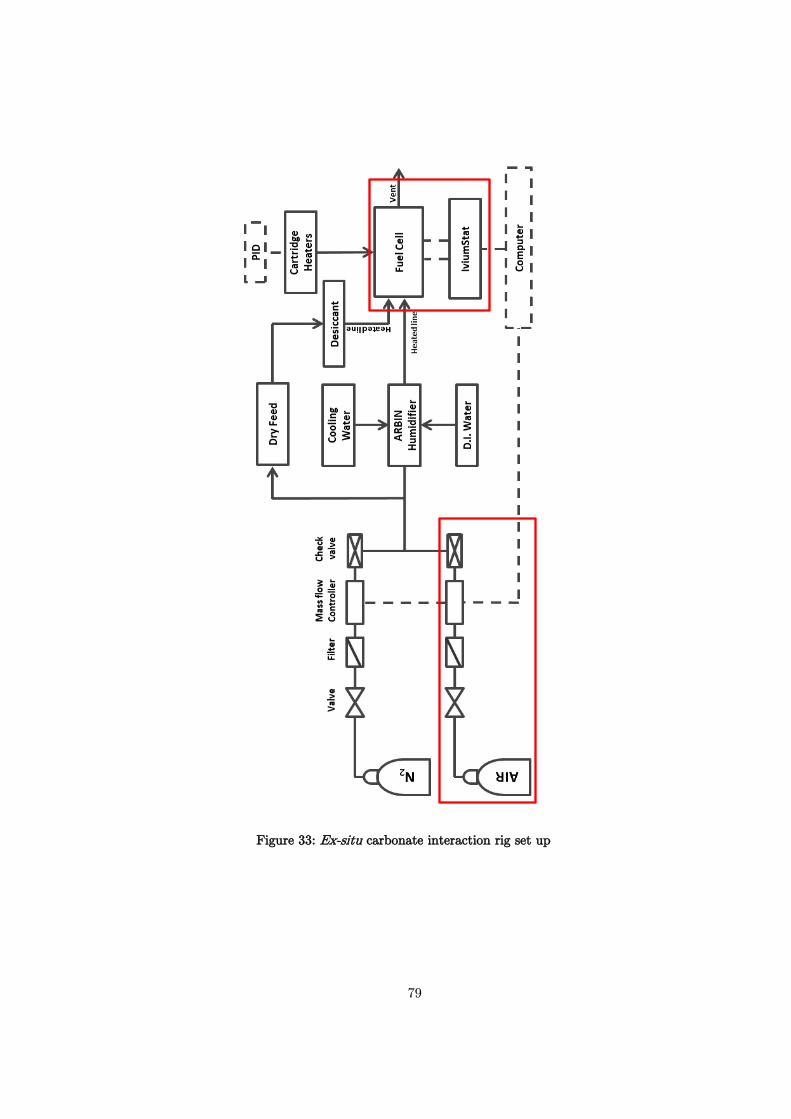
79
Figure 33: Ex-situ carbonate interaction rig set up
80
3.4 Results and Discussion
This Section initially presents a QCM (and by extension, rig and equipment)
feasibility study for application in this study followed by the results from
the investigations proposed in Section 3.2.5.
3.4.1 Feasibility Studies
Before commencing with any investigations, it was first important to assess
the developed rig and determine its suitability for microbalance measure-
ments. A microbalance measures frequency changes within a system that
can relate directly to precise changes on its electrode surface; however to do
this accurately (Section 2.4.3 – non-ideal responses) they must oscillate
without interference from any source other than that being investigated. To
this end, the rig setup and stability, as well as the choice of resonator, was
of paramount importance in this investigation.
Whilst there are several commercially available BAW resonators that could
be applicable to this study, the QCM was chosen for the reasons discussed
in Section 3.3.1. However, to ensure the QCM’s feasibility, it was first tested
under the investigative range of temperatures and humidities employed dur-
ing this study.
Whilst extremely accurate and generally stable in oscillation, the use of a
piezoelectric microbalance raises issues in terms of comparability and re-
peatability. As each microbalance contains slight variations, no two micro-
balance resonant frequencies are ever the same. Though microbalances often
produce very similar responses to conditions and thus provide a visual com-
parison between resonators, the physical numbers often do not match. Thus,
frequency shifts experienced during experimentation are often reported by
the change in a frequency from a specific point. This work will present res-
onant frequency shifts using the following relationship: Δf /ft0 where Δf rep-
resents the change in frequency at any given time from the frequency at
time ‘0’ (ft0); the resultant frequency shift is reported in parts per million
(ppm). Presentation of results in this manner still produces the same shape
distribution as the measured frequency data but on a smaller, more compa-
rable scale and is common for work of this nature [137, 138].
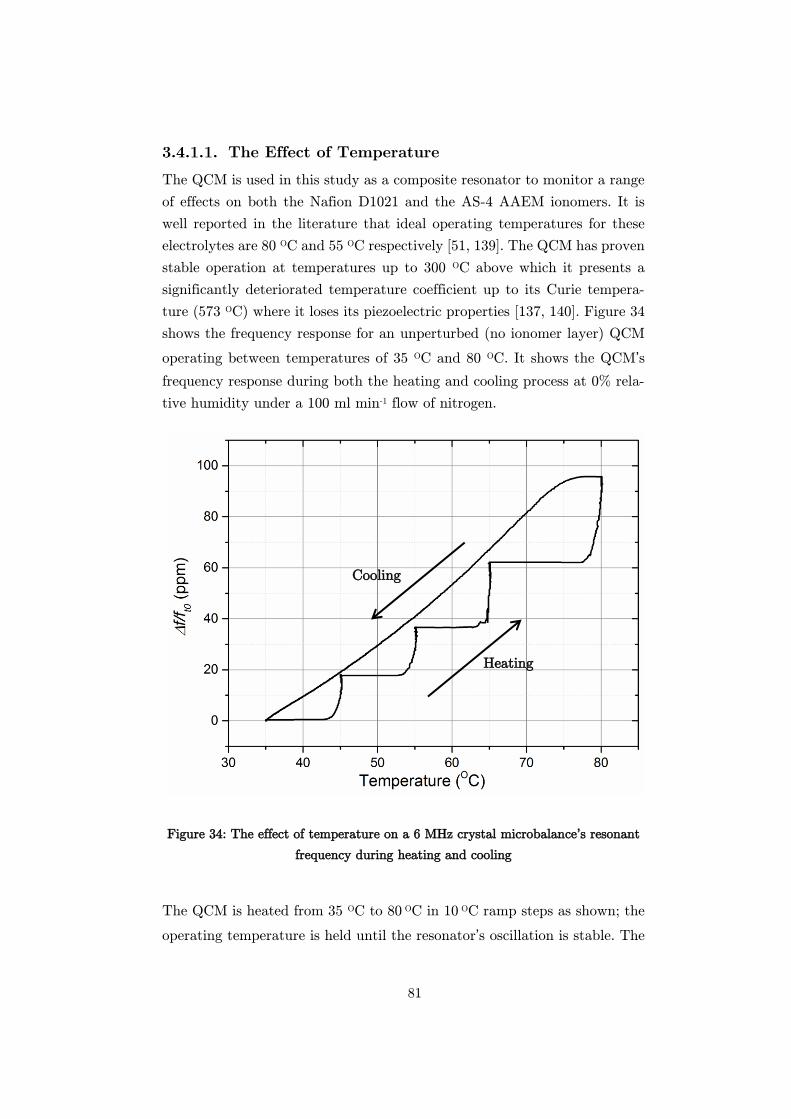
81
The Effect of Temperature
The QCM is used in this study as a composite resonator to monitor a range
of effects on both the Nafion D1021 and the AS-4 AAEM ionomers. It is
well reported in the literature that ideal operating temperatures for these
electrolytes are 80 OC and 55 OC respectively [51, 139]. The QCM has proven
stable operation at temperatures up to 300 OC above which it presents a
significantly deteriorated temperature coefficient up to its Curie tempera-
ture (573 OC) where it loses its piezoelectric properties [137, 140]. Figure 34
shows the frequency response for an unperturbed (no ionomer layer) QCM
operating between temperatures of 35 OC and 80 OC. It shows the QCM’s
frequency response during both the heating and cooling process at 0% rela-
tive humidity under a 100 ml min-1 flow of nitrogen.
Figure 34: The effect of temperature on a 6 MHz crystal microbalance’s resonant
frequency during heating and cooling
The QCM is heated from 35 OC to 80 OC in 10 OC ramp steps as shown; the
operating temperature is held until the resonator’s oscillation is stable. The
Heating
Cooling
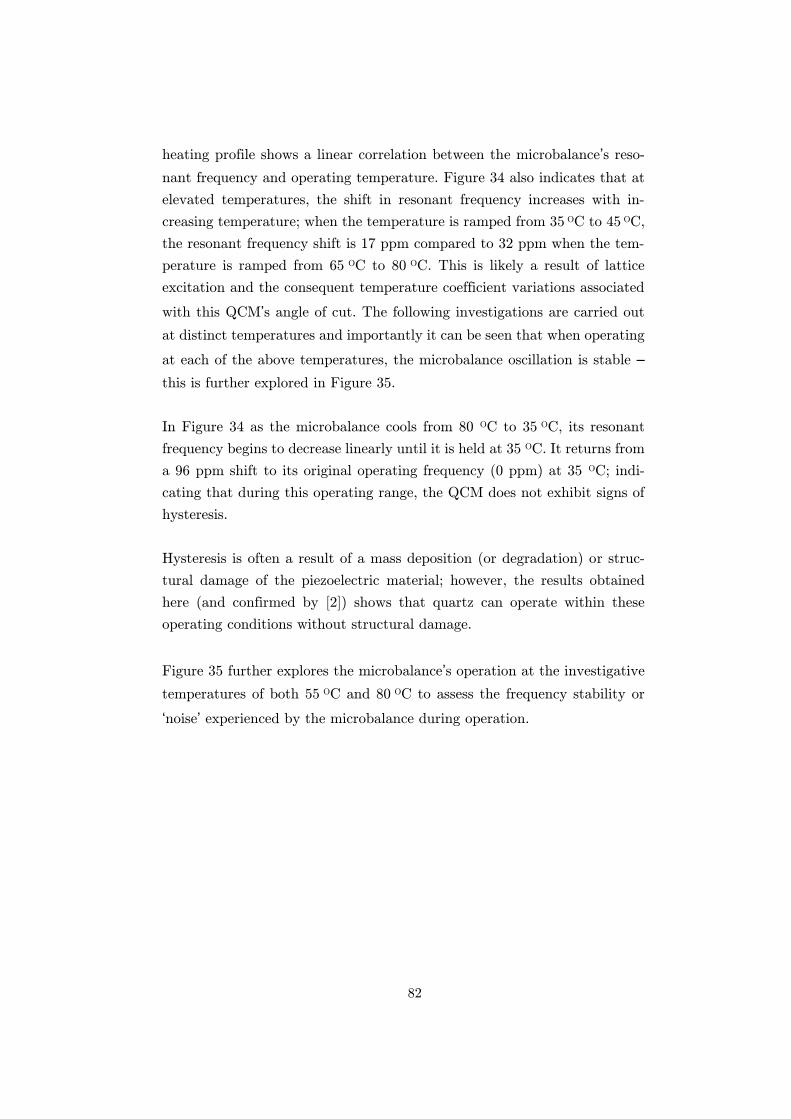
82
heating profile shows a linear correlation between the microbalance’s reso-
nant frequency and operating temperature. Figure 34 also indicates that at
elevated temperatures, the shift in resonant frequency increases with in-
creasing temperature; when the temperature is ramped from 35 OC to 45 OC,
the resonant frequency shift is 17 ppm compared to 32 ppm when the tem-
perature is ramped from 65 OC to 80 OC. This is likely a result of lattice
excitation and the consequent temperature coefficient variations associated
with this QCM’s angle of cut. The following investigations are carried out
at distinct temperatures and importantly it can be seen that when operating
at each of the above temperatures, the microbalance oscillation is stable –
this is further explored in Figure 35.
In Figure 34 as the microbalance cools from 80 OC to 35 OC, its resonant
frequency begins to decrease linearly until it is held at 35 OC. It returns from
a 96 ppm shift to its original operating frequency (0 ppm) at 35 OC; indi-
cating that during this operating range, the QCM does not exhibit signs of
hysteresis.
Hysteresis is often a result of a mass deposition (or degradation) or struc-
tural damage of the piezoelectric material; however, the results obtained
here (and confirmed by [2]) shows that quartz can operate within these
operating conditions without structural damage.
Figure 35 further explores the microbalance’s operation at the investigative
temperatures of both 55 OC and 80 OC to assess the frequency stability or
‘noise’ experienced by the microbalance during operation.
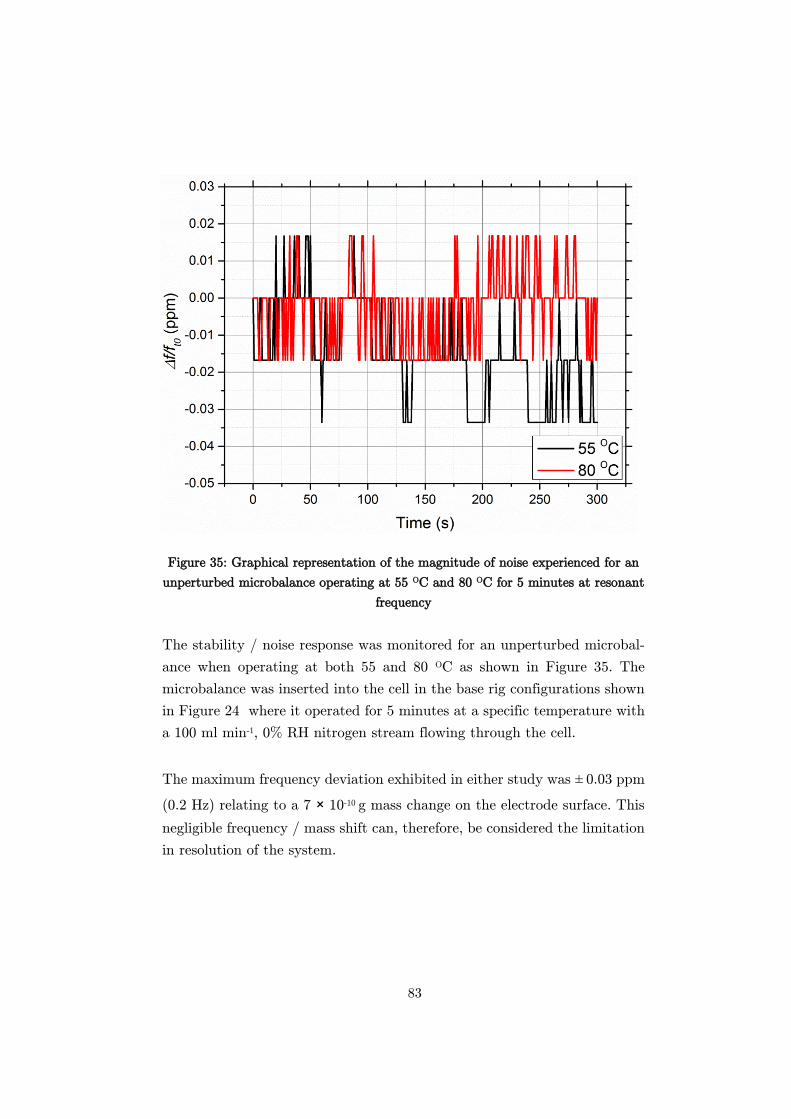
83
Figure 35: Graphical representation of the magnitude of noise experienced for an
unperturbed microbalance operating at 55 OC and 80 OC for 5 minutes at resonant
frequency
The stability / noise response was monitored for an unperturbed microbal-
ance when operating at both 55 and 80 OC as shown in Figure 35. The
microbalance was inserted into the cell in the base rig configurations shown
in Figure 24 where it operated for 5 minutes at a specific temperature with
a 100 ml min-1, 0% RH nitrogen stream flowing through the cell.
The maximum frequency deviation exhibited in either study was ± 0.03 ppm
(0.2 Hz) relating to a 7 × 10⁻¹⁰ g mass change on the electrode surface. This
negligible frequency / mass shift can, therefore, be considered the limitation
in resolution of the system.
84
The Effect of Humidity
Many elements of this study required operation of the composite resonator
under humidified conditions. As with temperature, it was important to un-
derstand how the microbalance itself was affected, if at all by humidity and
whether the experimental responses obtained were as a result of the electro-
lyte behaviour or because of the microbalance operation.
The QCM has a proven application in many in-situ monitoring environ-
ments including use as a humidity sensor [141-143]. However basic published
literature on the effect operational humidity has on the QCM’s resonant
frequency stability is not available, and thus is explored here.
Figure 36: QCM frequency stability when held at a range of relative humidities at 80 OC and under a flow of 100 ml min-1 of N2
Figure 36 shows the frequency response in ppm of a microbalance operating
in a 100 ml min-1 flow of nitrogen at a range of relative humidities
(0 – 100 %) at 80 OC within the base rig setup shown in Figure 24.
85
This investigation was conducted by maintaining the QCM’s operating tem-
perature at 80 OC (to assimilate the harshest available conditions that will
be faced during this study) within the cell whilst varying the dew point
humidifier settings to achieve the investigative range of relative humidities.
As with temperature, the QCM exhibits very stable frequency responses
when operating through the range of relative humidities. When operated at
the RHs shown in Figure 36, the frequency has a maximum deviation of
± 0.04 ppm (0.3 Hz); this small fluctuation can once more be considered as
the limitation in resolution of the system.
After the final investigation at 96% RH, the humidified nitrogen stream was
replaced by a 0% RH flow (100 ml min-1) and the microbalance was left to
re-equilibrate overnight. As the humidification cell’s relative humidity re-
turned to 0%, the microbalance’s resonant frequency too returned to that of
the original value (0 ppm shift). Again, the resonator indicated no sign of
hysteresis; and thus confirms the microbalance’s ability to operate within a
humidified environment.
The above two subsections have shown that the QCM is able to function
with a high degree of stability when operating in the base experimental rig
setup and under the investigative range of temperatures and humidities for
this study. The resonator’s ability to operate efficiently with the ionomer
surface development (creating the composite resonator) is explored in Sec-
tion 3.4.1.3.
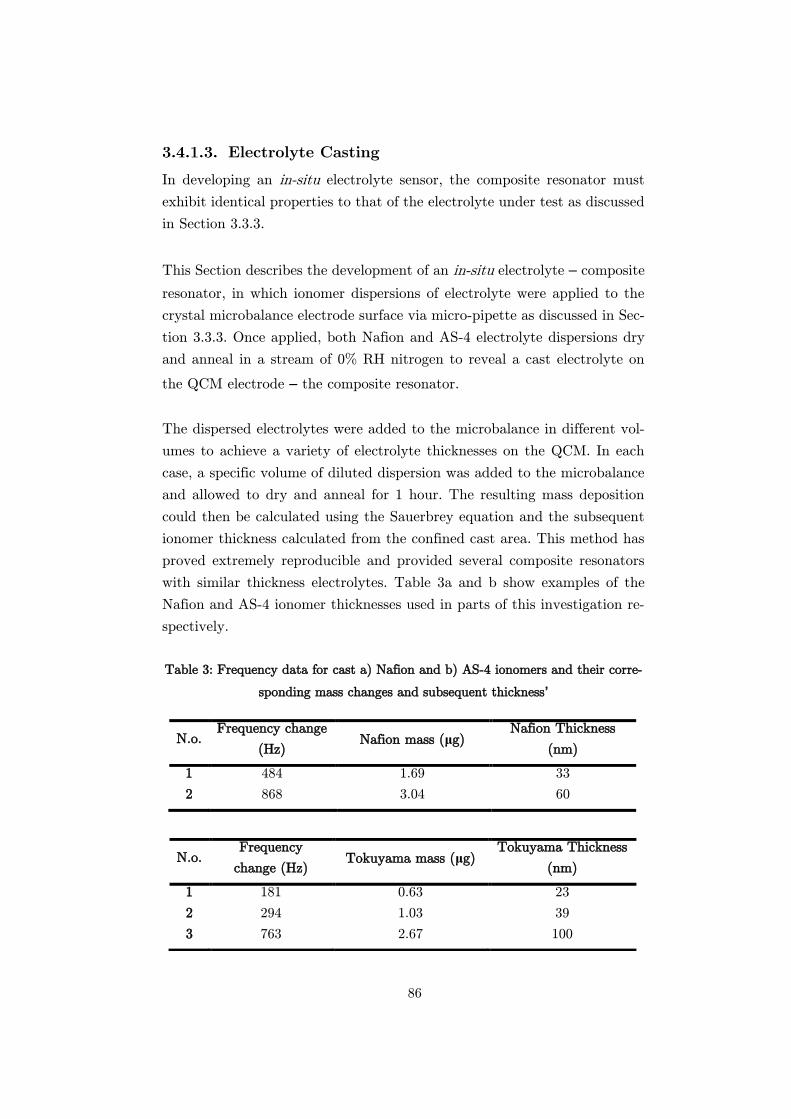
86
Electrolyte Casting
In developing an in-situ electrolyte sensor, the composite resonator must
exhibit identical properties to that of the electrolyte under test as discussed
in Section 3.3.3.
This Section describes the development of an in-situ electrolyte – composite
resonator, in which ionomer dispersions of electrolyte were applied to the
crystal microbalance electrode surface via micro-pipette as discussed in Sec-
tion 3.3.3. Once applied, both Nafion and AS-4 electrolyte dispersions dry
and anneal in a stream of 0% RH nitrogen to reveal a cast electrolyte on
the QCM electrode – the composite resonator.
The dispersed electrolytes were added to the microbalance in different vol-
umes to achieve a variety of electrolyte thicknesses on the QCM. In each
case, a specific volume of diluted dispersion was added to the microbalance
and allowed to dry and anneal for 1 hour. The resulting mass deposition
could then be calculated using the Sauerbrey equation and the subsequent
ionomer thickness calculated from the confined cast area. This method has
proved extremely reproducible and provided several composite resonators
with similar thickness electrolytes. Table 3a and b show examples of the
Nafion and AS-4 ionomer thicknesses used in parts of this investigation re-
spectively.
Table 3: Frequency data for cast a) Nafion and b) AS-4 ionomers and their corre-
sponding mass changes and subsequent thickness’
N.o. Frequency change
(Hz) Nafion mass (μg)
Nafion Thickness
(nm)
1 484 1.69 33
2 868 3.04 60
N.o. Frequency
change (Hz) Tokuyama mass (μg)
Tokuyama Thickness
(nm)
1 181 0.63 23
2 294 1.03 39
3 763 2.67 100
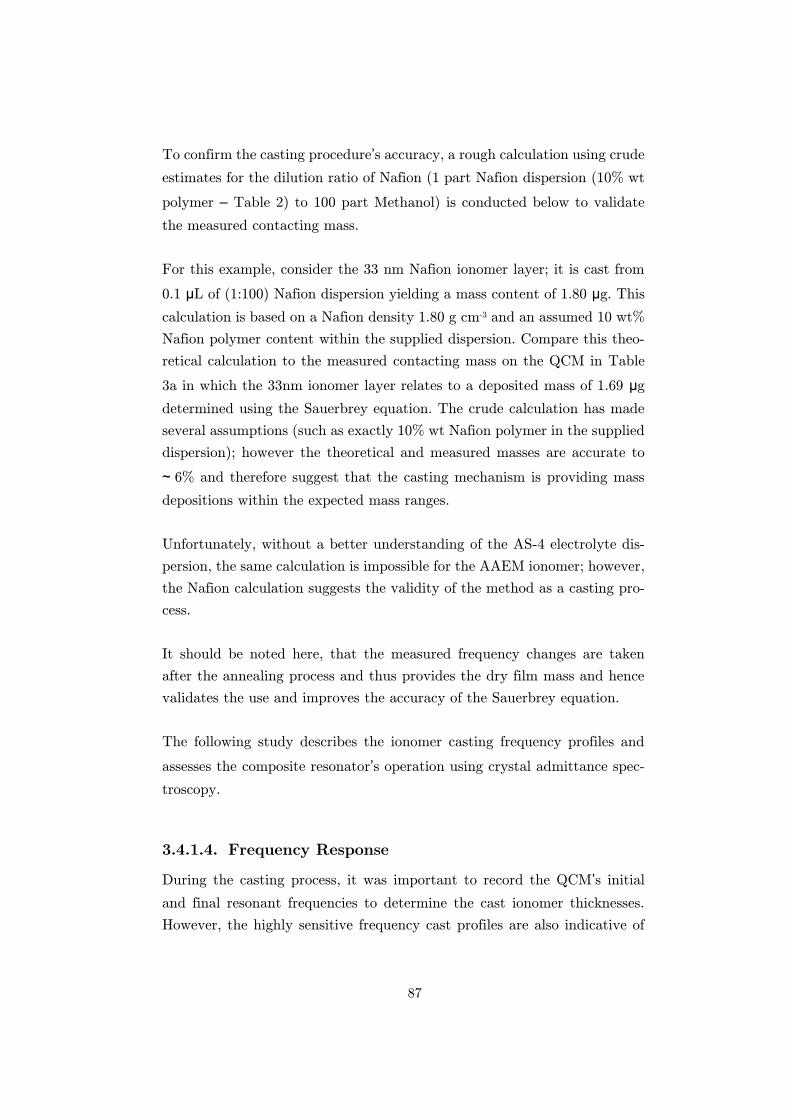
87
To confirm the casting procedure’s accuracy, a rough calculation using crude
estimates for the dilution ratio of Nafion (1 part Nafion dispersion (10% wt
polymer – Table 2) to 100 part Methanol) is conducted below to validate
the measured contacting mass.
For this example, consider the 33 nm Nafion ionomer layer; it is cast from
0.1 μL of (1:100) Nafion dispersion yielding a mass content of 1.80 μg. This
calculation is based on a Nafion density 1.80 g cm-3 and an assumed 10 wt%
Nafion polymer content within the supplied dispersion. Compare this theo-
retical calculation to the measured contacting mass on the QCM in Table
3a in which the 33nm ionomer layer relates to a deposited mass of 1.69 μg
determined using the Sauerbrey equation. The crude calculation has made
several assumptions (such as exactly 10% wt Nafion polymer in the supplied
dispersion); however the theoretical and measured masses are accurate to
~ 6% and therefore suggest that the casting mechanism is providing mass
depositions within the expected mass ranges.
Unfortunately, without a better understanding of the AS-4 electrolyte dis-
persion, the same calculation is impossible for the AAEM ionomer; however,
the Nafion calculation suggests the validity of the method as a casting pro-
cess.
It should be noted here, that the measured frequency changes are taken
after the annealing process and thus provides the dry film mass and hence
validates the use and improves the accuracy of the Sauerbrey equation.
The following study describes the ionomer casting frequency profiles and
assesses the composite resonator’s operation using crystal admittance spec-
troscopy.
Frequency Response
During the casting process, it was important to record the QCM’s initial
and final resonant frequencies to determine the cast ionomer thicknesses.
However, the highly sensitive frequency cast profiles are also indicative of
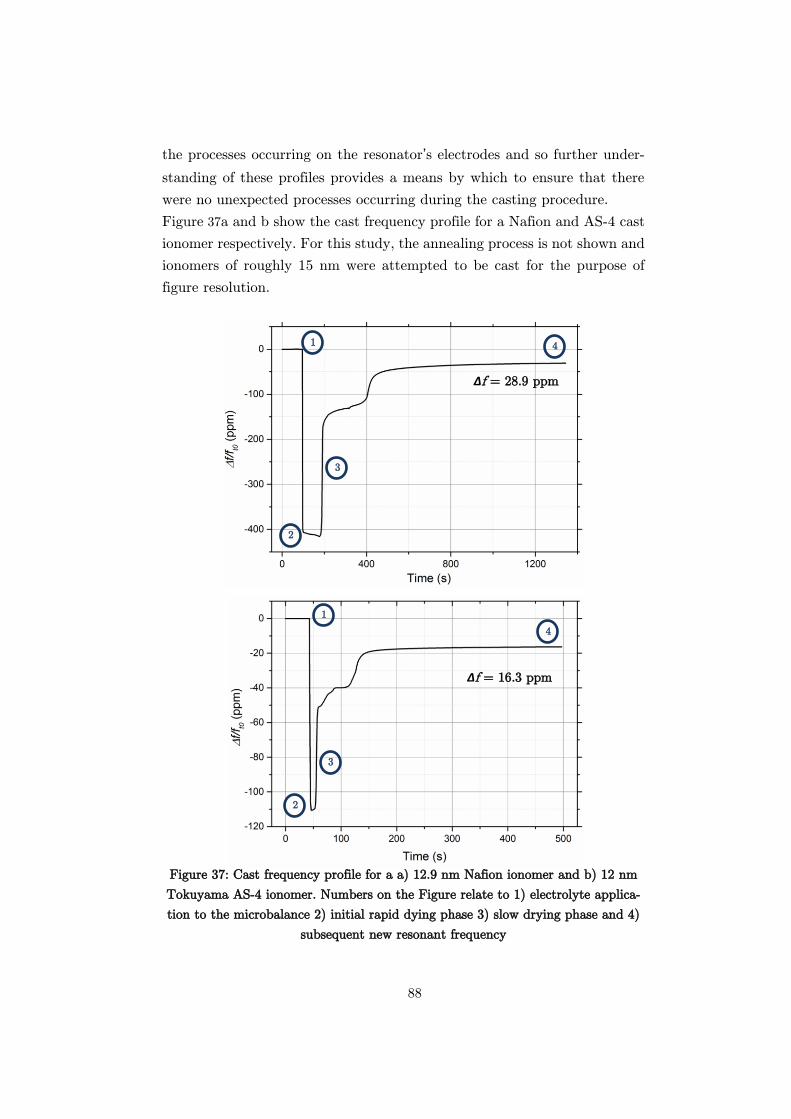
88
the processes occurring on the resonator’s electrodes and so further under-
standing of these profiles provides a means by which to ensure that there
were no unexpected processes occurring during the casting procedure.
Figure 37a and b show the cast frequency profile for a Nafion and AS-4 cast
ionomer respectively. For this study, the annealing process is not shown and
ionomers of roughly 15 nm were attempted to be cast for the purpose of
figure resolution.
Figure 37: Cast frequency profile for a a) 12.9 nm Nafion ionomer and b) 12 nm
Tokuyama AS-4 ionomer. Numbers on the Figure relate to 1) electrolyte applica-
tion to the microbalance 2) initial rapid dying phase 3) slow drying phase and 4)
subsequent new resonant frequency
Δf = 28.9 ppm
Δf = 16.3 ppm
1
2
3
4
1
2
3
4
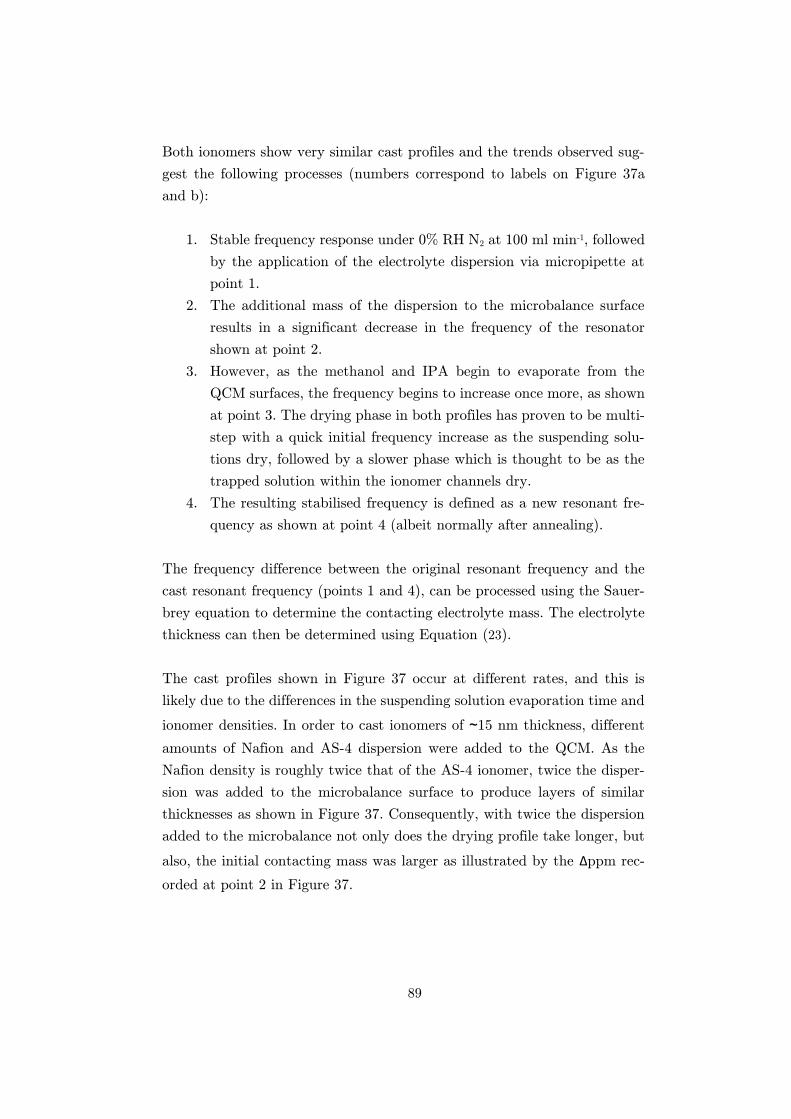
89
Both ionomers show very similar cast profiles and the trends observed sug-
gest the following processes (numbers correspond to labels on Figure 37a
and b):
1. Stable frequency response under 0% RH N2 at 100 ml min-1, followed
by the application of the electrolyte dispersion via micropipette at
point 1.
2. The additional mass of the dispersion to the microbalance surface
results in a significant decrease in the frequency of the resonator
shown at point 2.
3. However, as the methanol and IPA begin to evaporate from the
QCM surfaces, the frequency begins to increase once more, as shown
at point 3. The drying phase in both profiles has proven to be multi-
step with a quick initial frequency increase as the suspending solu-
tions dry, followed by a slower phase which is thought to be as the
trapped solution within the ionomer channels dry.
4. The resulting stabilised frequency is defined as a new resonant fre-
quency as shown at point 4 (albeit normally after annealing).
The frequency difference between the original resonant frequency and the
cast resonant frequency (points 1 and 4), can be processed using the Sauer-
brey equation to determine the contacting electrolyte mass. The electrolyte
thickness can then be determined using Equation (23).
The cast profiles shown in Figure 37 occur at different rates, and this is
likely due to the differences in the suspending solution evaporation time and
ionomer densities. In order to cast ionomers of ~15 nm thickness, different
amounts of Nafion and AS-4 dispersion were added to the QCM. As the
Nafion density is roughly twice that of the AS-4 ionomer, twice the disper-
sion was added to the microbalance surface to produce layers of similar
thicknesses as shown in Figure 37. Consequently, with twice the dispersion
added to the microbalance not only does the drying profile take longer, but
also, the initial contacting mass was larger as illustrated by the Δppm rec-
orded at point 2 in Figure 37.
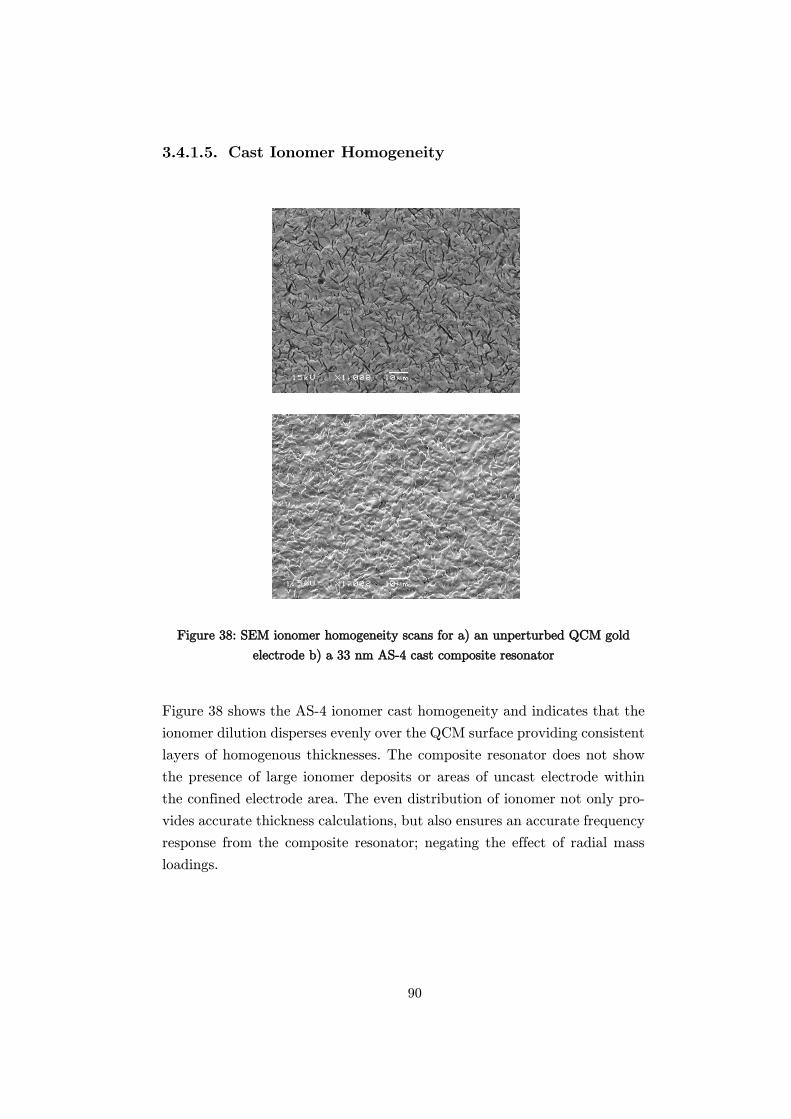
90
Cast Ionomer Homogeneity
Figure 38: SEM ionomer homogeneity scans for a) an unperturbed QCM gold
electrode b) a 33 nm AS-4 cast composite resonator
Figure 38 shows the AS-4 ionomer cast homogeneity and indicates that the
ionomer dilution disperses evenly over the QCM surface providing consistent
layers of homogenous thicknesses. The composite resonator does not show
the presence of large ionomer deposits or areas of uncast electrode within
the confined electrode area. The even distribution of ionomer not only pro-
vides accurate thickness calculations, but also ensures an accurate frequency
response from the composite resonator; negating the effect of radial mass
loadings.
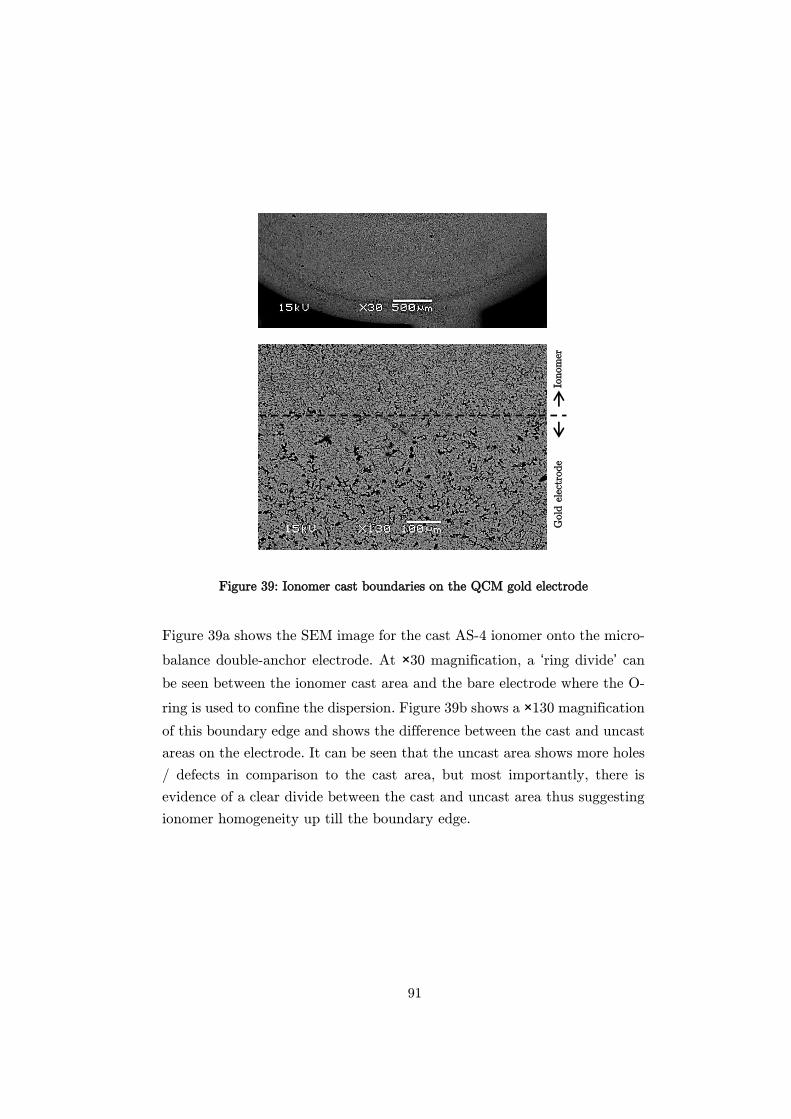
91
Figure 39: Ionomer cast boundaries on the QCM gold electrode
Figure 39a shows the SEM image for the cast AS-4 ionomer onto the micro-
balance double-anchor electrode. At ×30 magnification, a ‘ring divide’ can
be seen between the ionomer cast area and the bare electrode where the O-
ring is used to confine the dispersion. Figure 39b shows a ×130 magnification
of this boundary edge and shows the difference between the cast and uncast
areas on the electrode. It can be seen that the uncast area shows more holes
/ defects in comparison to the cast area, but most importantly, there is
evidence of a clear divide between the cast and uncast area thus suggesting
ionomer homogeneity up till the boundary edge.
Gold
ele
ctro
de
Ionom
er
92
Crystal Admittance Response
Frequency data for the casting processes as shown in Figure 37 are used for
indicating an additional contacting mass on the microbalance surface. How-
ever, it is only through crystal admittance spectroscopy (CAS) that it is
possible to determine not only the type of mass deposited on the crystal
surface, but more importantly whether the composite resonator is able to
fulfil the standing wave condition (Section 2.2). The CAS process is used
throughout this study and is simply demonstrated here.
Figure 40 and Figure 41 a-c show the admittance responses for an unper-
turbed and subsequently loaded 37 nm Nafion and a 68 nm AS-4 cast com-
posite resonator respectively. These ionomer thicknesses relate to very
similar contacting masses (544 Hz and 516 Hz = 1.88 μg and 1.81 μg
respectively) and were chosen to highlight the differences in the composite
resonator’s operation when in contact with almost identical ionomer masses
of different viscoelasticities.
In each figure, the black plot represents the uncast QCM’s admittance
responses and the red plot, the composite resonators admittance response.
Both investigations were carried out at 50 OC under a 100 ml min-1 flow of
0% RH N2.
Figure 40 and Figure 41 show the admittance responses for a 1.88 µg (37 nm)
and 1.81 µg (68 nm) deposition of Nafion and AS-4 ionomer respectively.
Using Section 2.6.3 as a guide, both admittance responses suggest the
addition of a viscoelastic rather than a rigid contacting layer. Upon
comparison of the two responses, however, it can be seen that the AS-4
ionomer (of similar mass to Nafion) produces a significantly more
viscoelastic contacting layer response. As described in Section 2.6.3, the
introduction of a viscoelastic layer CAS response is differentiated from a
rigid response by a decreasing loci radius and value of ǀYǀmax and an
increasing θmin value.
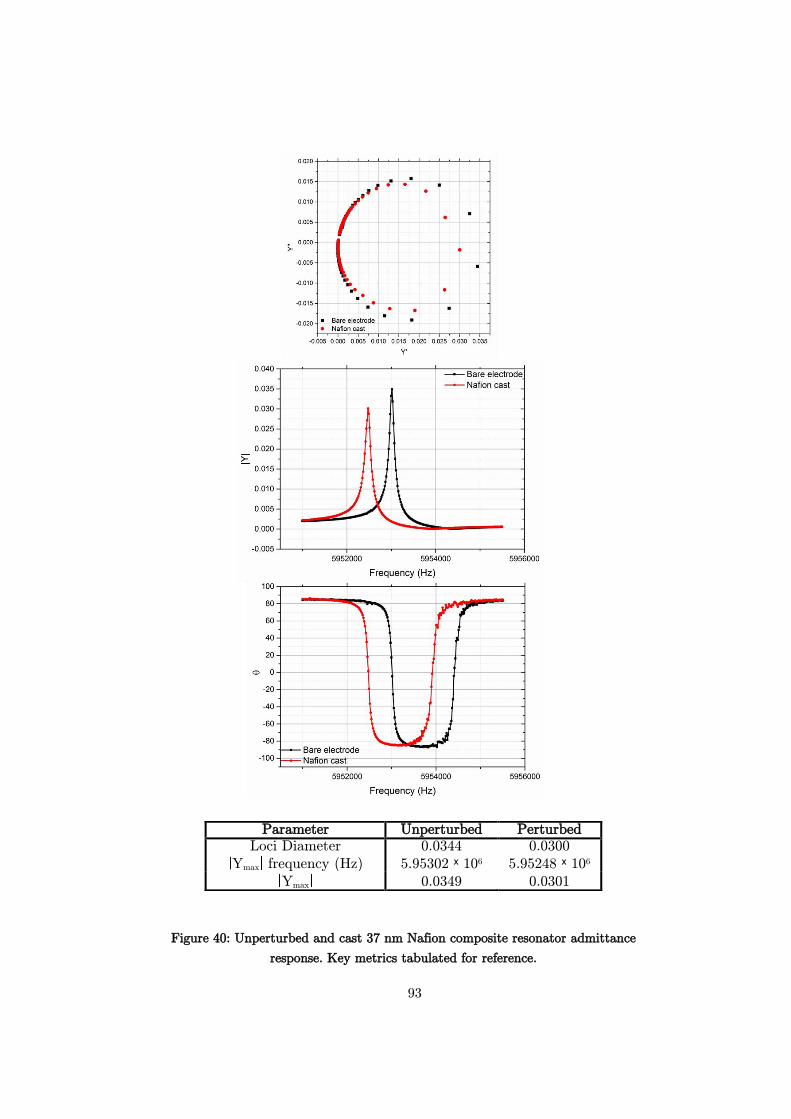
93
Figure 40: Unperturbed and cast 37 nm Nafion composite resonator admittance
response. Key metrics tabulated for reference.
Parameter Unperturbed Perturbed Loci Diameter 0.0344 0.0300
Ymax frequency (Hz) 5.95302 ˣ 106 5.95248 ˣ 106
Ymax 0.0349 0.0301
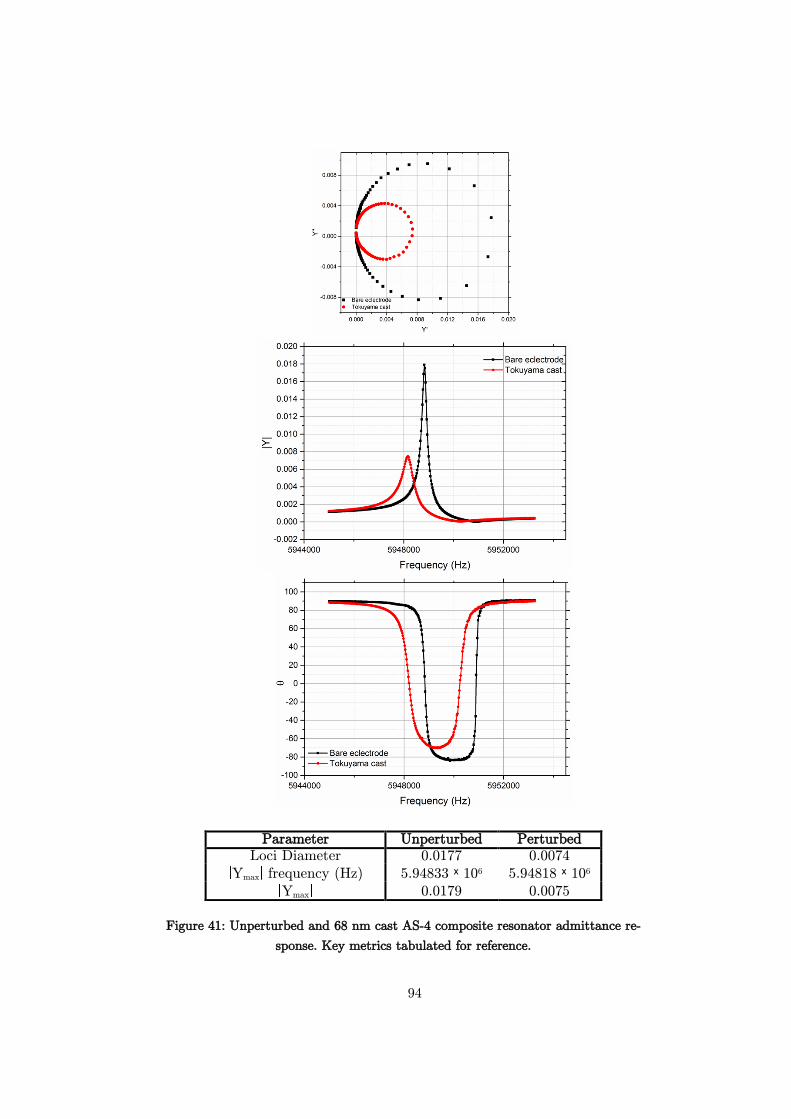
94
Figure 41: Unperturbed and 68 nm cast AS-4 composite resonator admittance re-
sponse. Key metrics tabulated for reference.
Parameter Unperturbed Perturbed
Loci Diameter 0.0177 0.0074
Ymax frequency (Hz) 5.94833 ˣ 106 5.94818 ˣ 106
Ymax 0.0179 0.0075
95
The responses shown in Figure 40 and Figure 41 also provide confirmation
that the composite resonators are able to fulfil the standing wave condition
as each plot is able to register both an fs and an fp indicting the usability of
the resonator as an in-situ mass monitoring device [144]. The Figures also
show that the composite resonators provide a decrease in the Q-factor com-
pared to the unperturbed system; indicated by the widening of the band-
width. The increased bandwidth and subsequent Q-factor reduction relate
directly to increased energy losses in the QCM as a result of being in contact
with a more viscous medium. The Figures show signs of a significantly more
reduced Q-factor for the more viscoelastic AS-4 ionomer; this is likely to
continue to decrease when under application in this study as the ionomer
becomes hydrated for example. Ensuring a high Q-factor provides more ac-
curate and stable results as discussed in Section 2.4; therefore, as with other
thin film investigations, [136] it is important to ensure that thin ionomer
films were deposited, so that during operation, a high Q-factor can still be
attained even in the harshest investigative conditions, thus allowing the
ability to fulfil the standing wave condition and provide accurate mass mon-
itoring throughout [135].
This Section has introduced and defined the effect of electrolyte loading. It
has shown the methods in which to determine the mass and thickness of the
contacting ionomer as well as the method by which to characterise the type
of loading on the composite resonator. The final rig feasibility study involves
the stability of operation of the composite resonators under the investigative
conditions.
Stability of the Cast Resonators
With the addition of thin film layers to the resonator surface, the mass
deposition and consequently the shift in the microbalance’s resonant fre-
quency is small as shown in Section 3.4.1.4. As a result, the effect of the
additional layer on the crystal’s stability is expected to be negligible and is
further analysed in this section.
To determine the cast microbalance stability, the composite resonator is
operated within the cell at 80 OC and 55 OC for the Nafion and AS-4 com-
posite resonators respectively in a 100 ml min-1 flow of nitrogen at 30% RH.
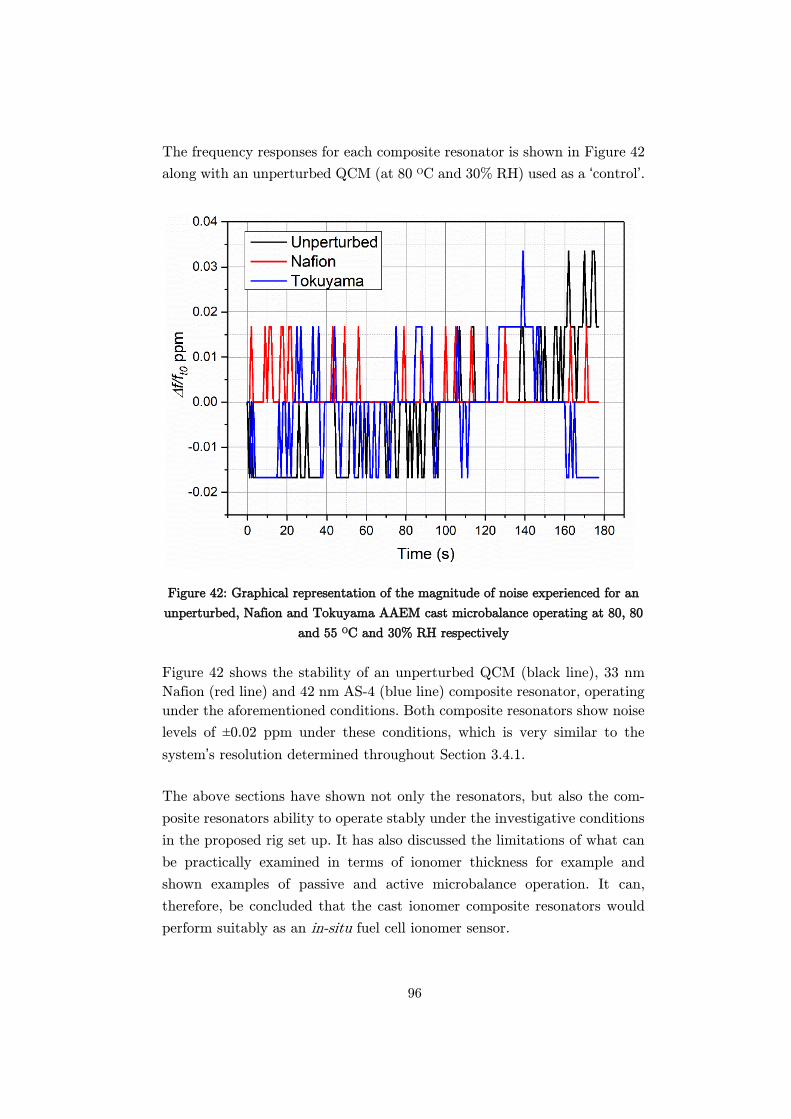
96
The frequency responses for each composite resonator is shown in Figure 42
along with an unperturbed QCM (at 80 OC and 30% RH) used as a ‘control’.
Figure 42: Graphical representation of the magnitude of noise experienced for an
unperturbed, Nafion and Tokuyama AAEM cast microbalance operating at 80, 80
and 55 OC and 30% RH respectively
Figure 42 shows the stability of an unperturbed QCM (black line), 33 nm
Nafion (red line) and 42 nm AS-4 (blue line) composite resonator, operating
under the aforementioned conditions. Both composite resonators show noise
levels of ±0.02 ppm under these conditions, which is very similar to the
system’s resolution determined throughout Section 3.4.1.
The above sections have shown not only the resonators, but also the com-
posite resonators ability to operate stably under the investigative conditions
in the proposed rig set up. It has also discussed the limitations of what can
be practically examined in terms of ionomer thickness for example and
shown examples of passive and active microbalance operation. It can,
therefore, be concluded that the cast ionomer composite resonators would
perform suitably as an in-situ fuel cell ionomer sensor.
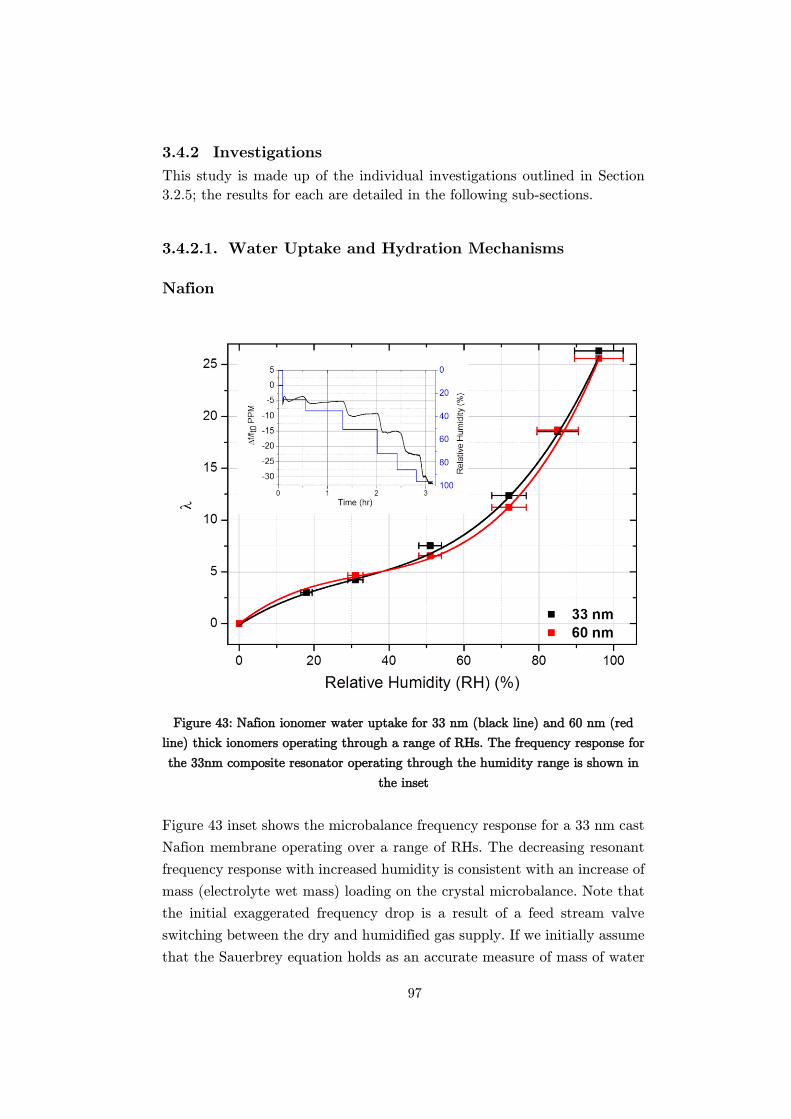
97
3.4.2 Investigations
This study is made up of the individual investigations outlined in Section
3.2.5; the results for each are detailed in the following sub-sections.
Water Uptake and Hydration Mechanisms
Nafion
Figure 43: Nafion ionomer water uptake for 33 nm (black line) and 60 nm (red
line) thick ionomers operating through a range of RHs. The frequency response for
the 33nm composite resonator operating through the humidity range is shown in
the inset
Figure 43 inset shows the microbalance frequency response for a 33 nm cast
Nafion membrane operating over a range of RHs. The decreasing resonant
frequency response with increased humidity is consistent with an increase of
mass (electrolyte wet mass) loading on the crystal microbalance. Note that
the initial exaggerated frequency drop is a result of a feed stream valve
switching between the dry and humidified gas supply. If we initially assume
that the Sauerbrey equation holds as an accurate measure of mass of water
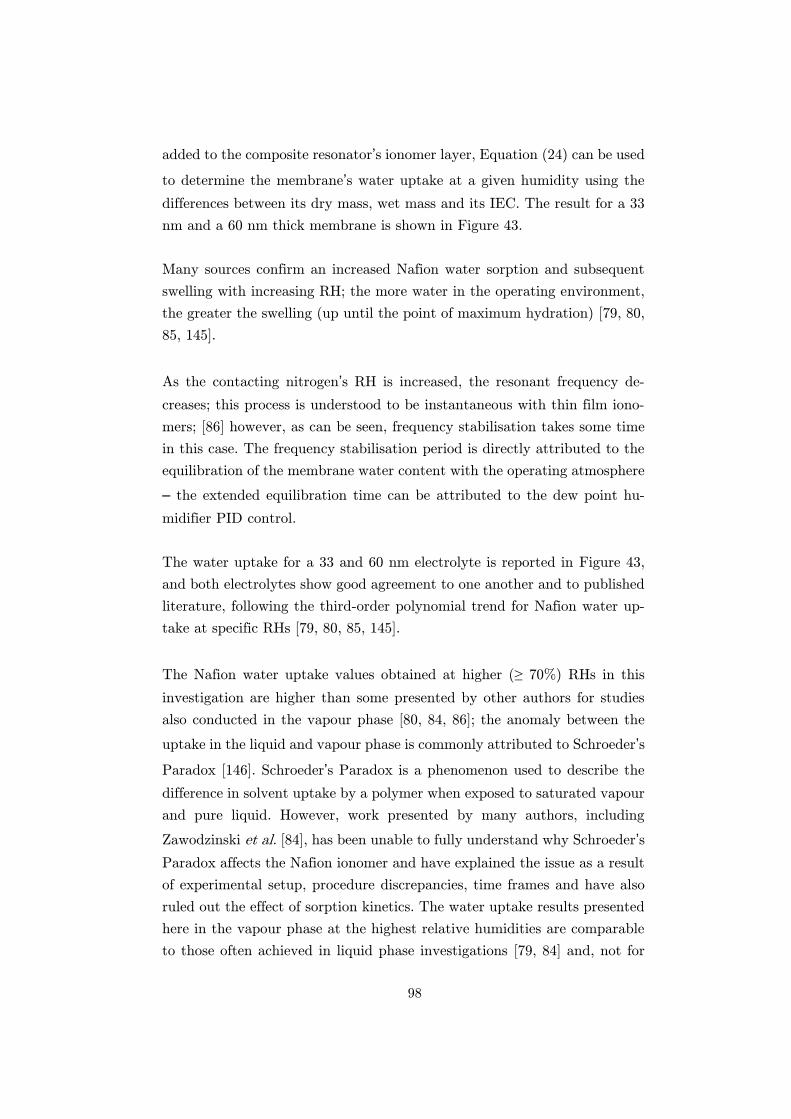
98
added to the composite resonator’s ionomer layer, Equation (24) can be used
to determine the membrane’s water uptake at a given humidity using the
differences between its dry mass, wet mass and its IEC. The result for a 33
nm and a 60 nm thick membrane is shown in Figure 43.
Many sources confirm an increased Nafion water sorption and subsequent
swelling with increasing RH; the more water in the operating environment,
the greater the swelling (up until the point of maximum hydration) [79, 80,
85, 145].
As the contacting nitrogen’s RH is increased, the resonant frequency de-
creases; this process is understood to be instantaneous with thin film iono-
mers; [86] however, as can be seen, frequency stabilisation takes some time
in this case. The frequency stabilisation period is directly attributed to the
equilibration of the membrane water content with the operating atmosphere
– the extended equilibration time can be attributed to the dew point hu-
midifier PID control.
The water uptake for a 33 and 60 nm electrolyte is reported in Figure 43,
and both electrolytes show good agreement to one another and to published
literature, following the third-order polynomial trend for Nafion water up-
take at specific RHs [79, 80, 85, 145].
The Nafion water uptake values obtained at higher (≥ 70%) RHs in this
investigation are higher than some presented by other authors for studies
also conducted in the vapour phase [80, 84, 86]; the anomaly between the
uptake in the liquid and vapour phase is commonly attributed to Schroeder’s
Paradox [146]. Schroeder’s Paradox is a phenomenon used to describe the
difference in solvent uptake by a polymer when exposed to saturated vapour
and pure liquid. However, work presented by many authors, including
Zawodzinski et al. [84], has been unable to fully understand why Schroeder’s
Paradox affects the Nafion ionomer and have explained the issue as a result
of experimental setup, procedure discrepancies, time frames and have also
ruled out the effect of sorption kinetics. The water uptake results presented
here in the vapour phase at the highest relative humidities are comparable
to those often achieved in liquid phase investigations [79, 84] and, not for
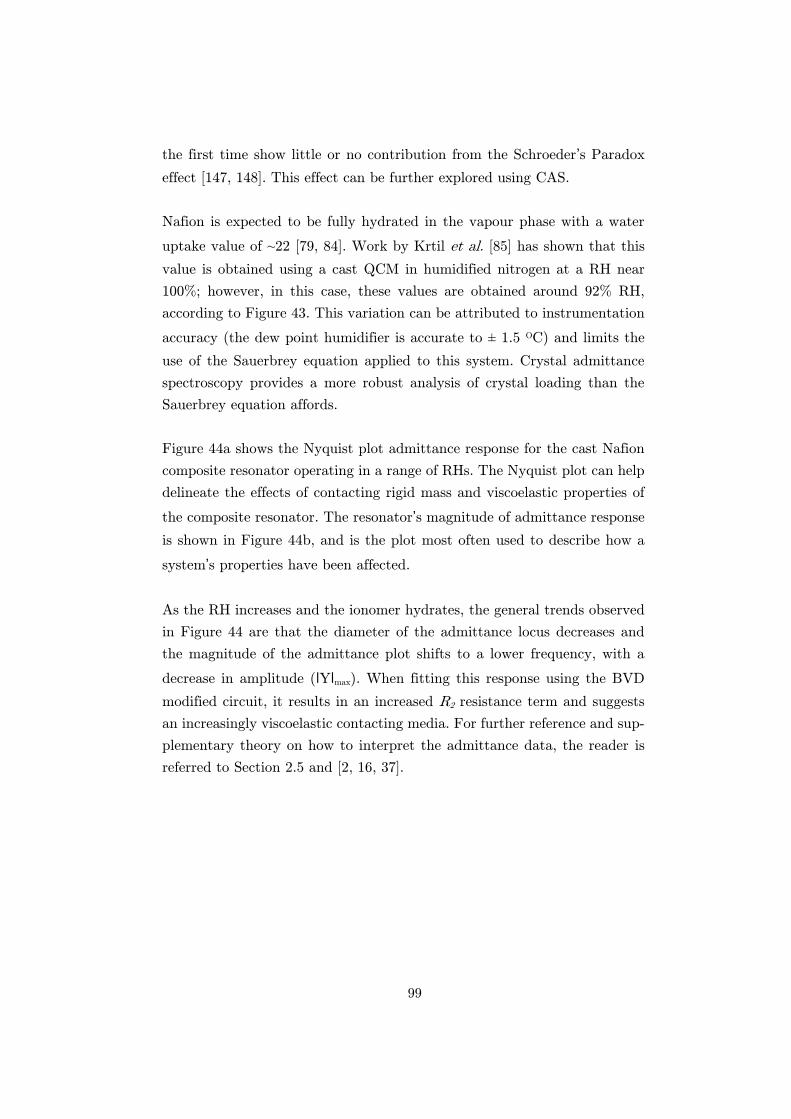
99
the first time show little or no contribution from the Schroeder’s Paradox
effect [147, 148]. This effect can be further explored using CAS.
Nafion is expected to be fully hydrated in the vapour phase with a water
uptake value of ~22 [79, 84]. Work by Krtil et al. [85] has shown that this
value is obtained using a cast QCM in humidified nitrogen at a RH near
100%; however, in this case, these values are obtained around 92% RH,
according to Figure 43. This variation can be attributed to instrumentation
accuracy (the dew point humidifier is accurate to ± 1.5 OC) and limits the
use of the Sauerbrey equation applied to this system. Crystal admittance
spectroscopy provides a more robust analysis of crystal loading than the
Sauerbrey equation affords.
Figure 44a shows the Nyquist plot admittance response for the cast Nafion
composite resonator operating in a range of RHs. The Nyquist plot can help
delineate the effects of contacting rigid mass and viscoelastic properties of
the composite resonator. The resonator’s magnitude of admittance response
is shown in Figure 44b, and is the plot most often used to describe how a
system’s properties have been affected.
As the RH increases and the ionomer hydrates, the general trends observed
in Figure 44 are that the diameter of the admittance locus decreases and
the magnitude of the admittance plot shifts to a lower frequency, with a
decrease in amplitude (ǀYǀmax). When fitting this response using the BVD
modified circuit, it results in an increased R2 resistance term and suggests
an increasingly viscoelastic contacting media. For further reference and sup-
plementary theory on how to interpret the admittance data, the reader is
referred to Section 2.5 and [2, 16, 37].
100
Figure 44: A snapshot of the CAS response for a 33 nm Nafion composite resona-
tor operating through a range of RHs and hydration states: (a) admittance locus
and (b) magnitude of admittance Bode plot.
The ǀYǀmax peak describes the effect that humidity has on the composite
resonator’s viscoelastic properties and occurs at the series resonant fre-
quency (fs). Figure 45a and b further emphasise the effect that hydration
has on the magnitude of admittance by plotting the change in the series
resonant frequency (fs) (frequency at which the ǀYǀmax occurs) and the value
of ǀYǀmax through the range of operating RHs, compared to the value at 0 %
RH respectively.
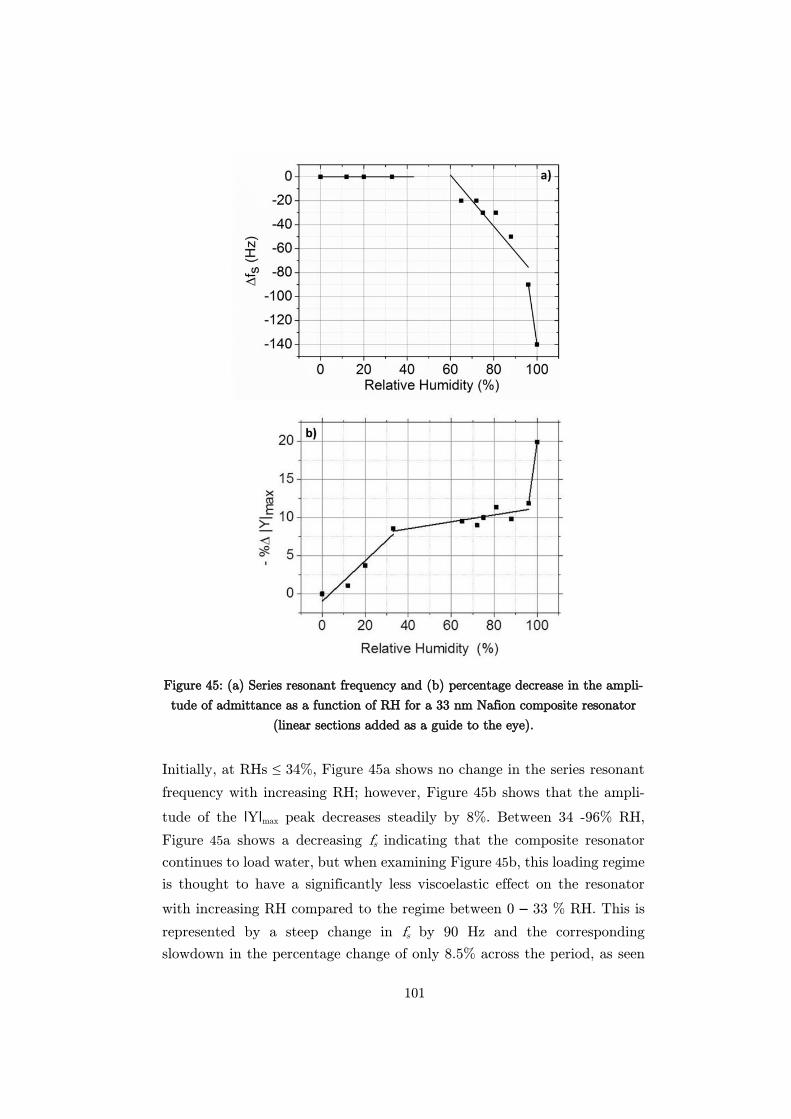
101
Figure 45: (a) Series resonant frequency and (b) percentage decrease in the ampli-
tude of admittance as a function of RH for a 33 nm Nafion composite resonator
(linear sections added as a guide to the eye).
Initially, at RHs ≤ 34%, Figure 45a shows no change in the series resonant
frequency with increasing RH; however, Figure 45b shows that the ampli-
tude of the ǀYǀmax peak decreases steadily by 8%. Between 34 -96% RH,
Figure 45a shows a decreasing fs indicating that the composite resonator
continues to load water, but when examining Figure 45b, this loading regime
is thought to have a significantly less viscoelastic effect on the resonator
with increasing RH compared to the regime between 0 – 33 % RH. This is
represented by a steep change in fs by 90 Hz and the corresponding
slowdown in the percentage change of only 8.5% across the period, as seen
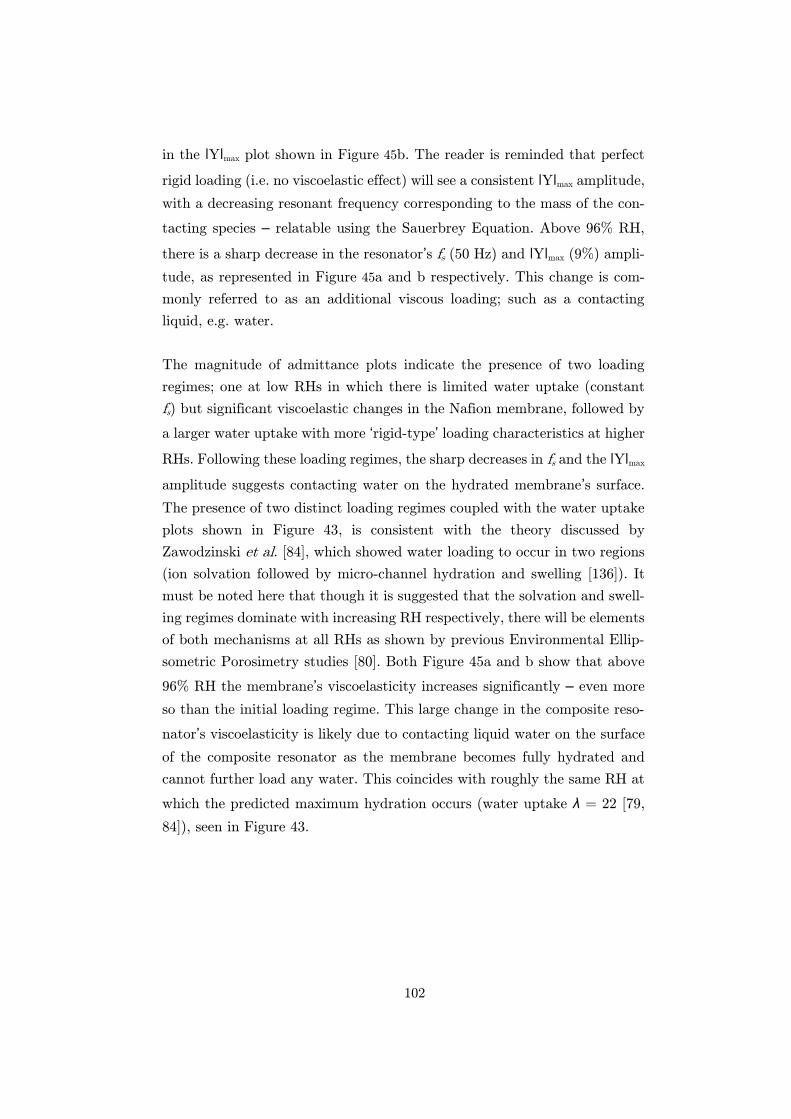
102
in the ǀYǀmax plot shown in Figure 45b. The reader is reminded that perfect
rigid loading (i.e. no viscoelastic effect) will see a consistent ǀYǀmax amplitude,
with a decreasing resonant frequency corresponding to the mass of the con-
tacting species – relatable using the Sauerbrey Equation. Above 96% RH,
there is a sharp decrease in the resonator’s fs (50 Hz) and ǀYǀmax (9%) ampli-
tude, as represented in Figure 45a and b respectively. This change is com-
monly referred to as an additional viscous loading; such as a contacting
liquid, e.g. water.
The magnitude of admittance plots indicate the presence of two loading
regimes; one at low RHs in which there is limited water uptake (constant
fs) but significant viscoelastic changes in the Nafion membrane, followed by
a larger water uptake with more ‘rigid-type’ loading characteristics at higher
RHs. Following these loading regimes, the sharp decreases in fs and the ǀYǀmax
amplitude suggests contacting water on the hydrated membrane’s surface.
The presence of two distinct loading regimes coupled with the water uptake
plots shown in Figure 43, is consistent with the theory discussed by
Zawodzinski et al. [84], which showed water loading to occur in two regions
(ion solvation followed by micro-channel hydration and swelling [136]). It
must be noted here that though it is suggested that the solvation and swell-
ing regimes dominate with increasing RH respectively, there will be elements
of both mechanisms at all RHs as shown by previous Environmental Ellip-
sometric Porosimetry studies [80]. Both Figure 45a and b show that above
96% RH the membrane’s viscoelasticity increases significantly – even more
so than the initial loading regime. This large change in the composite reso-
nator’s viscoelasticity is likely due to contacting liquid water on the surface
of the composite resonator as the membrane becomes fully hydrated and
cannot further load any water. This coincides with roughly the same RH at
which the predicted maximum hydration occurs (water uptake λ = 22 [79,
84]), seen in Figure 43.
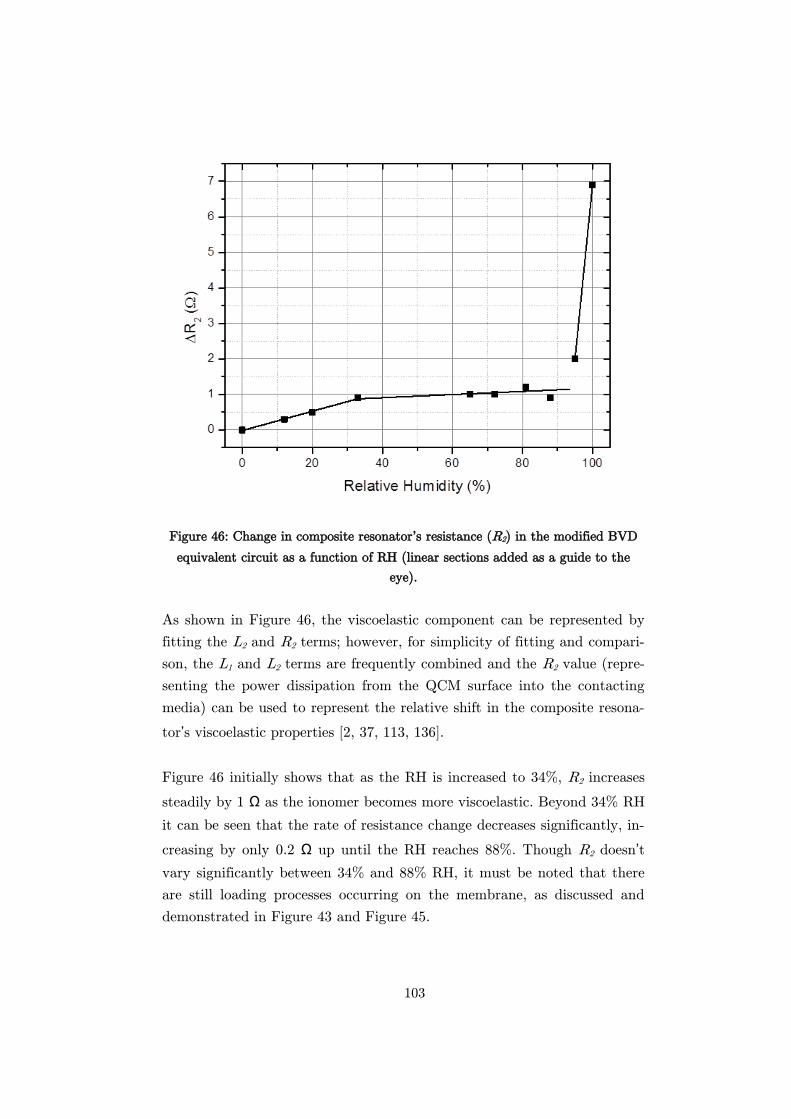
103
Figure 46: Change in composite resonator’s resistance (R2) in the modified BVD
equivalent circuit as a function of RH (linear sections added as a guide to the
eye).
As shown in Figure 46, the viscoelastic component can be represented by
fitting the L2 and R2 terms; however, for simplicity of fitting and compari-
son, the L1 and L2 terms are frequently combined and the R2 value (repre-
senting the power dissipation from the QCM surface into the contacting
media) can be used to represent the relative shift in the composite resona-
tor’s viscoelastic properties [2, 37, 113, 136].
Figure 46 initially shows that as the RH is increased to 34%, R2 increases
steadily by 1 Ω as the ionomer becomes more viscoelastic. Beyond 34% RH
it can be seen that the rate of resistance change decreases significantly, in-
creasing by only 0.2 Ω up until the RH reaches 88%. Though R2 doesn’t
vary significantly between 34% and 88% RH, it must be noted that there
are still loading processes occurring on the membrane, as discussed and
demonstrated in Figure 43 and Figure 45.
104
Finally, above 88% and specifically 96% RH, R2 increases sharply – this
indicates a significant increase in viscoelasticity of the composite resonator.
The sharp change observed in the composite resonators R2 and consequent
viscoelasticity supports the data seen in Figure 45a and b, and is signifi-
cantly sharper than the R2 changes seen previously; this suggests the pres-
ence of a contacting liquid; whether that liquid water is contacting on the
ionomer / nitrogen or gold / ionomer interface still remains unclear.
AS-4 Ionomer
Figure 47: AS-4 ionomer water uptake for a 23 nm (black), 39 nm (red) and 100
nm (blue) thick ionomers operating through a range of RHs. The frequency re-
sponse for a 39 nm composite resonator operating through the humidity range is
shown in the inset
As with the Nafion water uptake calculations, both the dry and wet mass
of the AS-4 ionomer must be known in order to determine its water uptake.
Once again, in order to determine the mass of the wet ionomer, cast AS-4
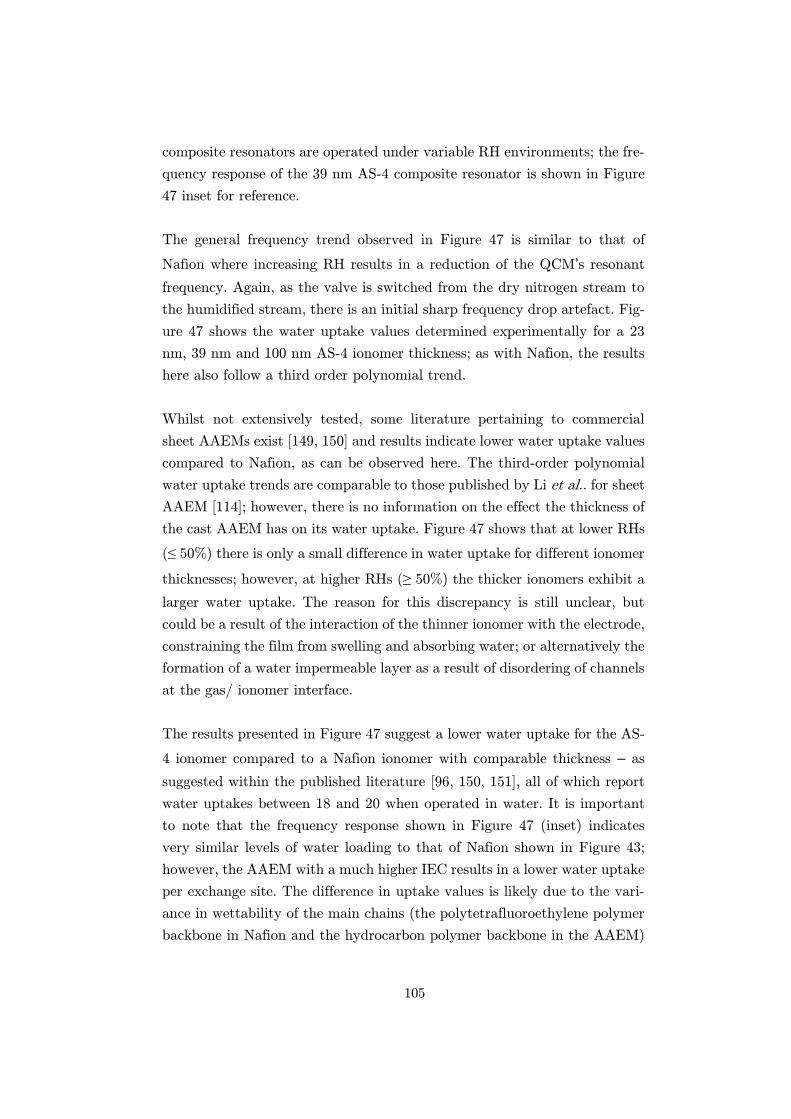
105
composite resonators are operated under variable RH environments; the fre-
quency response of the 39 nm AS-4 composite resonator is shown in Figure
47 inset for reference.
The general frequency trend observed in Figure 47 is similar to that of
Nafion where increasing RH results in a reduction of the QCM’s resonant
frequency. Again, as the valve is switched from the dry nitrogen stream to
the humidified stream, there is an initial sharp frequency drop artefact. Fig-
ure 47 shows the water uptake values determined experimentally for a 23
nm, 39 nm and 100 nm AS-4 ionomer thickness; as with Nafion, the results
here also follow a third order polynomial trend.
Whilst not extensively tested, some literature pertaining to commercial
sheet AAEMs exist [149, 150] and results indicate lower water uptake values
compared to Nafion, as can be observed here. The third-order polynomial
water uptake trends are comparable to those published by Li et al.. for sheet
AAEM [114]; however, there is no information on the effect the thickness of
the cast AAEM has on its water uptake. Figure 47 shows that at lower RHs
(≤ 50%) there is only a small difference in water uptake for different ionomer
thicknesses; however, at higher RHs (≥ 50%) the thicker ionomers exhibit a
larger water uptake. The reason for this discrepancy is still unclear, but
could be a result of the interaction of the thinner ionomer with the electrode,
constraining the film from swelling and absorbing water; or alternatively the
formation of a water impermeable layer as a result of disordering of channels
at the gas/ ionomer interface.
The results presented in Figure 47 suggest a lower water uptake for the AS-
4 ionomer compared to a Nafion ionomer with comparable thickness – as
suggested within the published literature [96, 150, 151], all of which report
water uptakes between 18 and 20 when operated in water. It is important
to note that the frequency response shown in Figure 47 (inset) indicates
very similar levels of water loading to that of Nafion shown in Figure 43;
however, the AAEM with a much higher IEC results in a lower water uptake
per exchange site. The difference in uptake values is likely due to the vari-
ance in wettability of the main chains (the polytetrafluoroethylene polymer
backbone in Nafion and the hydrocarbon polymer backbone in the AAEM)
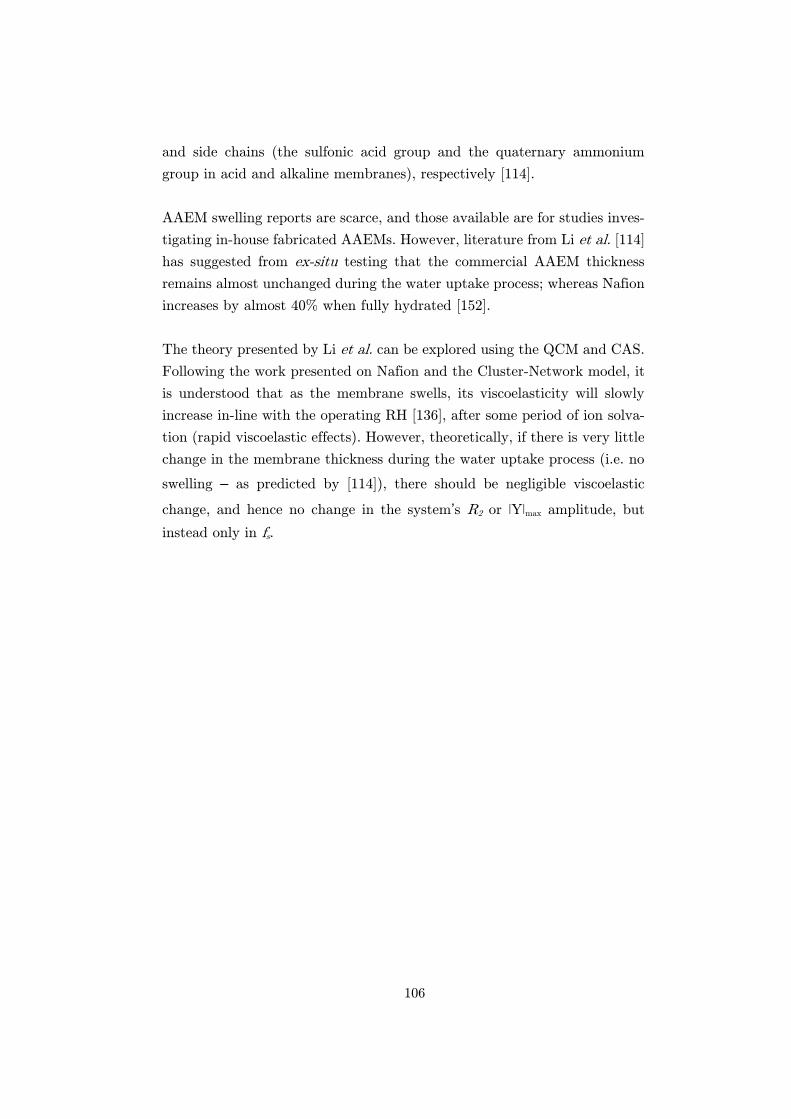
106
and side chains (the sulfonic acid group and the quaternary ammonium
group in acid and alkaline membranes), respectively [114].
AAEM swelling reports are scarce, and those available are for studies inves-
tigating in-house fabricated AAEMs. However, literature from Li et al. [114]
has suggested from ex-situ testing that the commercial AAEM thickness
remains almost unchanged during the water uptake process; whereas Nafion
increases by almost 40% when fully hydrated [152].
The theory presented by Li et al. can be explored using the QCM and CAS.
Following the work presented on Nafion and the Cluster-Network model, it
is understood that as the membrane swells, its viscoelasticity will slowly
increase in-line with the operating RH [136], after some period of ion solva-
tion (rapid viscoelastic effects). However, theoretically, if there is very little
change in the membrane thickness during the water uptake process (i.e. no
swelling – as predicted by [114]), there should be negligible viscoelastic
change, and hence no change in the system’s R2 or ǀYǀmax amplitude, but
instead only in fs.
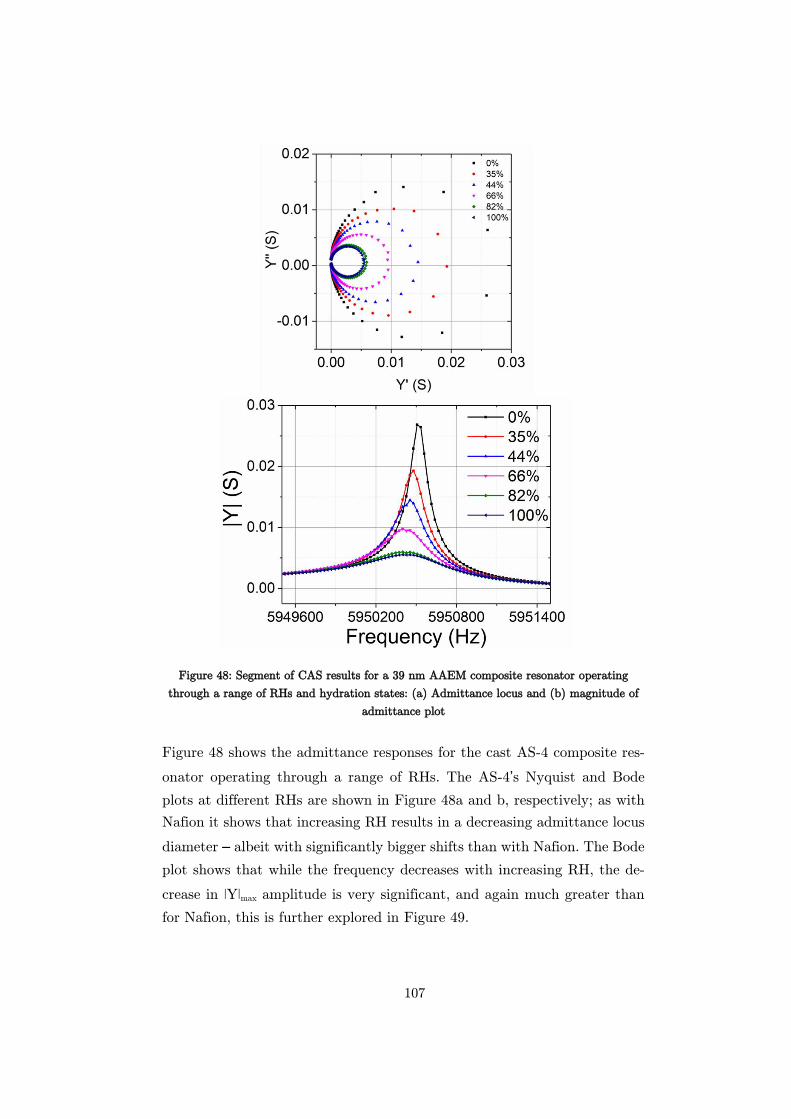
107
Figure 48: Segment of CAS results for a 39 nm AAEM composite resonator operating
through a range of RHs and hydration states: (a) Admittance locus and (b) magnitude of
admittance plot
Figure 48 shows the admittance responses for the cast AS-4 composite res-
onator operating through a range of RHs. The AS-4’s Nyquist and Bode
plots at different RHs are shown in Figure 48a and b, respectively; as with
Nafion it shows that increasing RH results in a decreasing admittance locus
diameter – albeit with significantly bigger shifts than with Nafion. The Bode
plot shows that while the frequency decreases with increasing RH, the de-
crease in ǀYǀmax amplitude is very significant, and again much greater than
for Nafion, this is further explored in Figure 49.
108
Figure 49: (a) Change in series resonant frequency and (b) percentage decrease in ampli-
tude of admittance for a 39 nm AAEM composite resonator versus RH and hydration
(linear sections added as a guide to the eye).
The understanding of how AAEMs respond to humidification is still ambig-
uous with scarce yet conflicting literature available. However, once more,
the changes observed in the magnitude of admittance plot (Figure 48b) gen-
erally indicate viscoelastic loading effects with increased humidification. Fig-
ure 49a and b show the composite resonator’s series resonant frequency (fs)
and the percentage change in the amplitude of the magnitude of the admit-
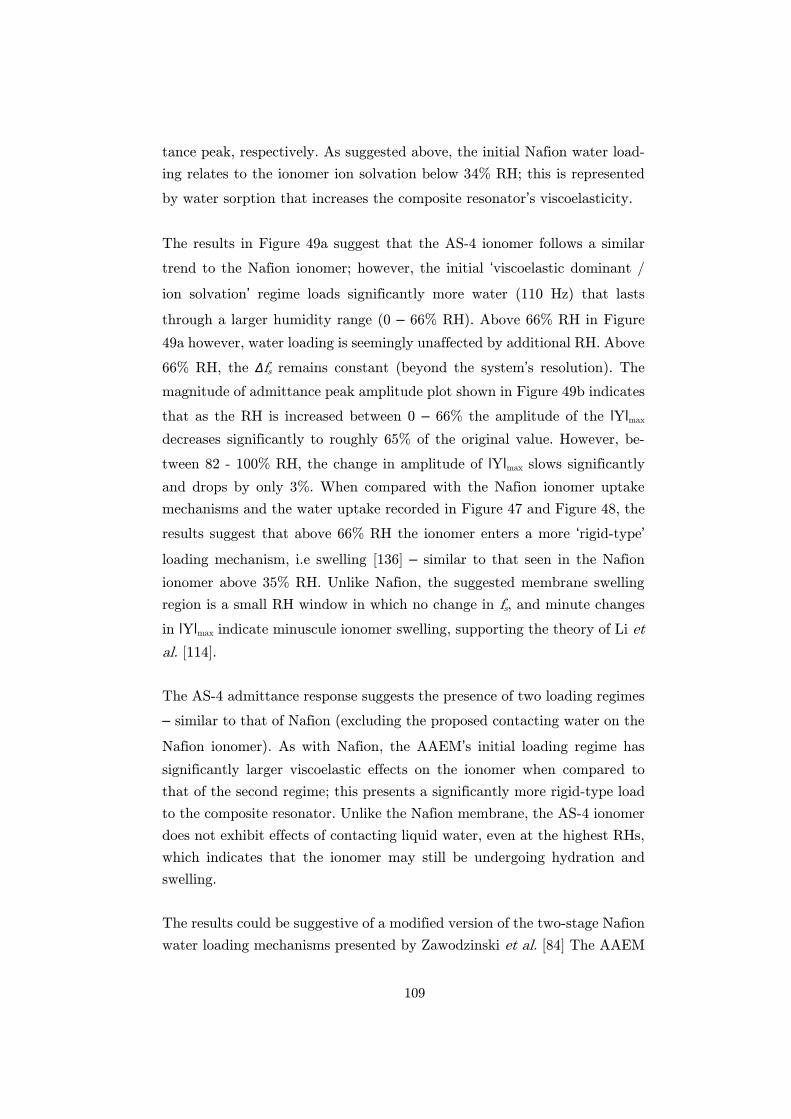
109
tance peak, respectively. As suggested above, the initial Nafion water load-
ing relates to the ionomer ion solvation below 34% RH; this is represented
by water sorption that increases the composite resonator’s viscoelasticity.
The results in Figure 49a suggest that the AS-4 ionomer follows a similar
trend to the Nafion ionomer; however, the initial ‘viscoelastic dominant /
ion solvation’ regime loads significantly more water (110 Hz) that lasts
through a larger humidity range (0 – 66% RH). Above 66% RH in Figure
49a however, water loading is seemingly unaffected by additional RH. Above
66% RH, the Δfs remains constant (beyond the system’s resolution). The
magnitude of admittance peak amplitude plot shown in Figure 49b indicates
that as the RH is increased between 0 – 66% the amplitude of the ǀYǀmax
decreases significantly to roughly 65% of the original value. However, be-
tween 82 - 100% RH, the change in amplitude of ǀYǀmax slows significantly
and drops by only 3%. When compared with the Nafion ionomer uptake
mechanisms and the water uptake recorded in Figure 47 and Figure 48, the
results suggest that above 66% RH the ionomer enters a more ‘rigid-type’
loading mechanism, i.e swelling [136] – similar to that seen in the Nafion
ionomer above 35% RH. Unlike Nafion, the suggested membrane swelling
region is a small RH window in which no change in fs, and minute changes
in ǀYǀmax indicate minuscule ionomer swelling, supporting the theory of Li et
al. [114].
The AS-4 admittance response suggests the presence of two loading regimes
– similar to that of Nafion (excluding the proposed contacting water on the
Nafion ionomer). As with Nafion, the AAEM’s initial loading regime has
significantly larger viscoelastic effects on the ionomer when compared to
that of the second regime; this presents a significantly more rigid-type load
to the composite resonator. Unlike the Nafion membrane, the AS-4 ionomer
does not exhibit effects of contacting liquid water, even at the highest RHs,
which indicates that the ionomer may still be undergoing hydration and
swelling.
The results could be suggestive of a modified version of the two-stage Nafion
water loading mechanisms presented by Zawodzinski et al. [84] The AAEM
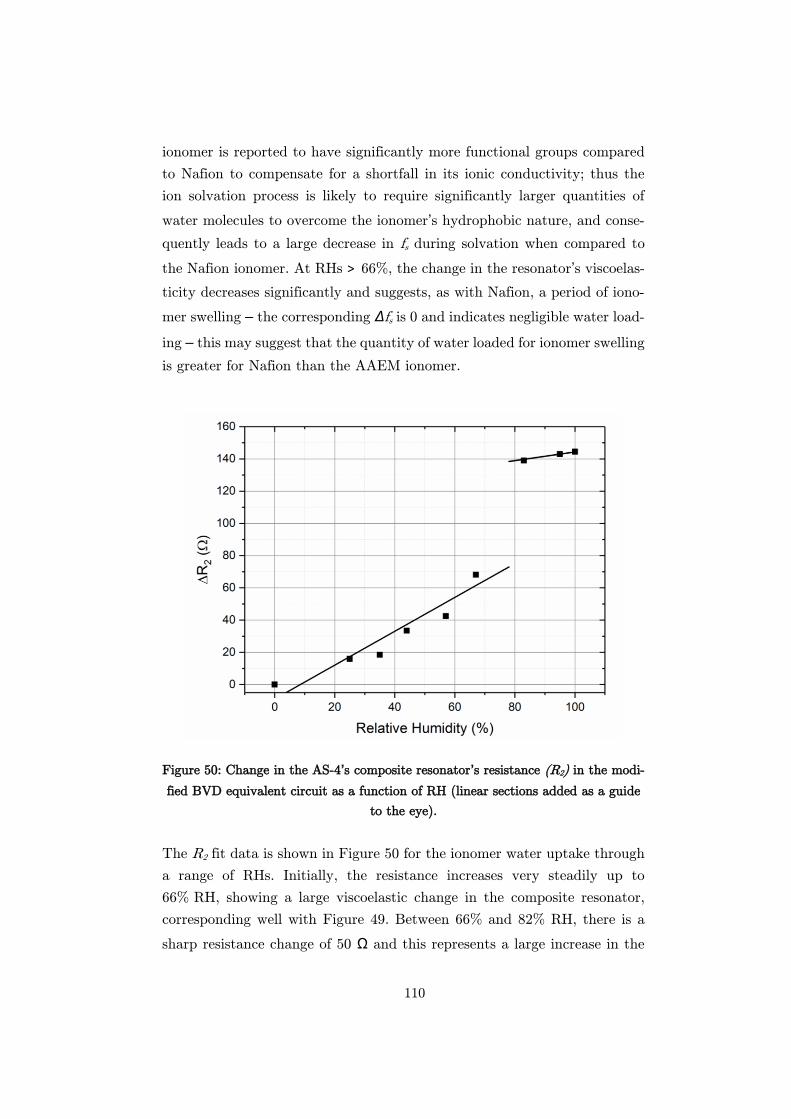
110
ionomer is reported to have significantly more functional groups compared
to Nafion to compensate for a shortfall in its ionic conductivity; thus the
ion solvation process is likely to require significantly larger quantities of
water molecules to overcome the ionomer’s hydrophobic nature, and conse-
quently leads to a large decrease in fs during solvation when compared to
the Nafion ionomer. At RHs ˃ 66%, the change in the resonator’s viscoelas-
ticity decreases significantly and suggests, as with Nafion, a period of iono-
mer swelling – the corresponding Δfs is 0 and indicates negligible water load-
ing – this may suggest that the quantity of water loaded for ionomer swelling
is greater for Nafion than the AAEM ionomer.
Figure 50: Change in the AS-4’s composite resonator’s resistance (R2) in the modi-
fied BVD equivalent circuit as a function of RH (linear sections added as a guide
to the eye).
The R2 fit data is shown in Figure 50 for the ionomer water uptake through
a range of RHs. Initially, the resistance increases very steadily up to
66% RH, showing a large viscoelastic change in the composite resonator,
corresponding well with Figure 49. Between 66% and 82% RH, there is a
sharp resistance change of 50 Ω and this represents a large increase in the
111
resonator’s viscoelasticity. Above 82% RH, the R2 rate of increase slows
considerably through to 100% RH. As with Nafion, the slow-down in the
rate of increase of R2 is suggestive of a period of low viscoelastic change
compared to the solvation region and can be attributed to ionomer swelling.
Water Uptake and Hydration Conclusions
The work presented during this investigation explores the water uptake,
sorption mechanics and swelling characteristics of thin film Nafion and the
commercially available AS-4 AAEM ionomer from the vapour phase using
a QCM.
The QCM frequency response has shown, as reported by other authors, that
the water uptake is lower for the AAEM ionomer compared to that of Nafion
at a given relative humidity. The active oscillation has also shown that
unlike Nafion, the AAEM water uptake is not independent of film thickness.
CAS has been applied to this system for the first time to help better under-
stand the sorption characteristics and swelling of Nafion and AS-4 ionomers.
The experimental results suggest some similarities in loading mechanisms
between the two, albeit to varying magnitudes. Both the Nafion and AS-4
ionomer exhibit a process of high viscoelasticity increases as ions within the
ionomer are solvated. The results presented show that the Nafion solvation
occurs at a significantly lower relative humidity and water uptake value
compared to the AAEM ionomer; beyond the solvation period, the ionomer
channels begin to absorb water and swell. The Nafion ionomer exhibits sig-
nificantly larger water uptake during the swelling regime, suggesting a su-
perior swelling ratio than that of the AS-4.
112
Ionomer Degradation
As discussed in Section 3.2.4.2, AAEM ionomers have shown degradation
through instability within the alkaline media when operated at temperatures
≥ 65 OC in several systems.
The following investigation compares the AS-4 ionomer’s instability (degra-
dation) as a function of its hydration at steady state using the QCM, CAS
and mass spectrometry.
CAS was implemented during this investigation as a means to determine
the effect on the ionomer’s viscoelasticity from the exposure to elevated
temperatures. CAS was employed as frequency response alone would indi-
cate a change in the composite resonator’s operation that would be difficult
to attribute directly to the effect of degradation.
However, to develop the parameters of the investigation such as the degra-
dation onset temperature and investigative timeframe, it was first necessary
to understand the limitations of the experimentation through the active re-
sponse. These parameters are further described in Figure 51, Figure 52 and
Figure 53.
To determine the ionomer’s instability onset temperature the base rig was
altered as shown in Figure 31. An in-situ AS-4 cast 100 nm composite reso-
nator was then operated within the setup initially at 55 OC with a 100 ml
min-1 flow of 50% RH nitrogen through the cell; as the resonator obtained
stable frequency responses the operating temperature was ramped and held
at 1 OC intervals as shown in Figure 51. The resonator provided stable fre-
quency responses during operation at temperatures between 55 OC – 64 OC;
however, when operating at 65 OC, the response is not as expected. At 65
OC the composite resonator initially begins to stabilise at a new resonant
frequency; however, the initial stabilisation period is short-lived and fol-
lowed by a sudden increase in the resonator’s frequency by 1.6 ppm before
re-stabilisation. Figure 51 inset further illustrates the effect occurring on the
microbalance and indicates that the composite resonator is ‘losing mass’ un-
til it stabilises at a new frequency.
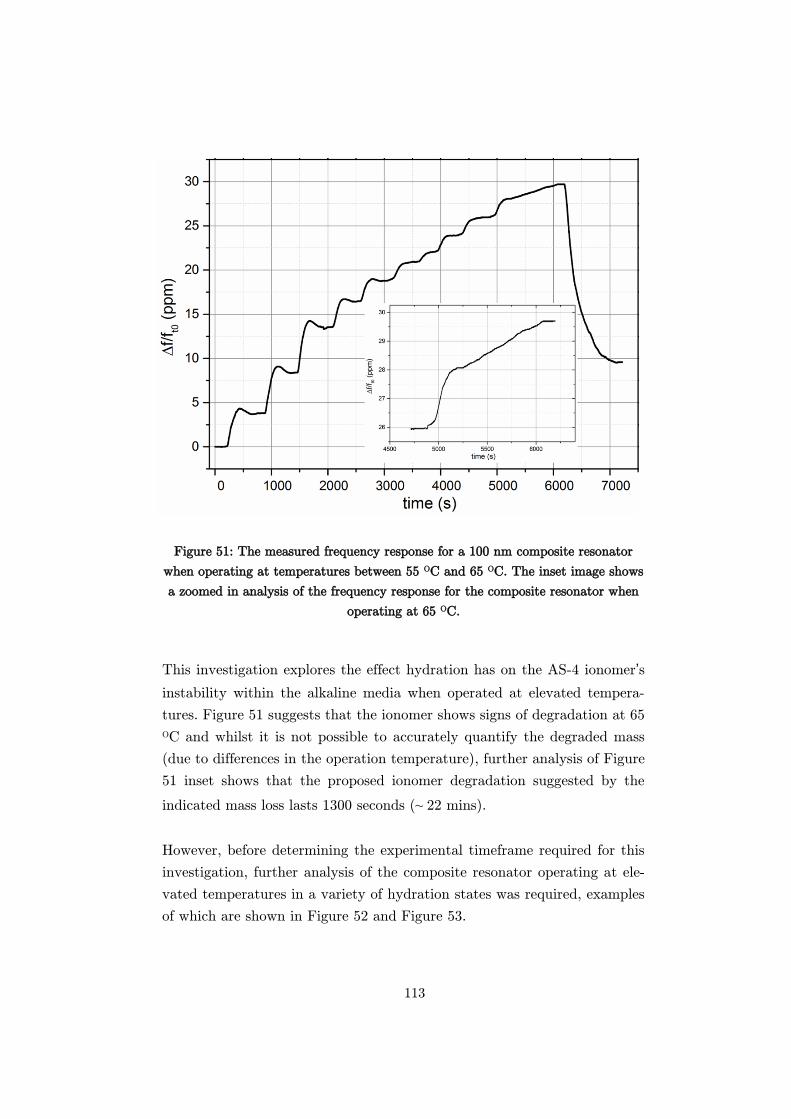
113
Figure 51: The measured frequency response for a 100 nm composite resonator
when operating at temperatures between 55 OC and 65 OC. The inset image shows
a zoomed in analysis of the frequency response for the composite resonator when
operating at 65 OC.
This investigation explores the effect hydration has on the AS-4 ionomer’s
instability within the alkaline media when operated at elevated tempera-
tures. Figure 51 suggests that the ionomer shows signs of degradation at 65
OC and whilst it is not possible to accurately quantify the degraded mass
(due to differences in the operation temperature), further analysis of Figure
51 inset shows that the proposed ionomer degradation suggested by the
indicated mass loss lasts 1300 seconds (~ 22 mins).
However, before determining the experimental timeframe required for this
investigation, further analysis of the composite resonator operating at ele-
vated temperatures in a variety of hydration states was required, examples
of which are shown in Figure 52 and Figure 53.
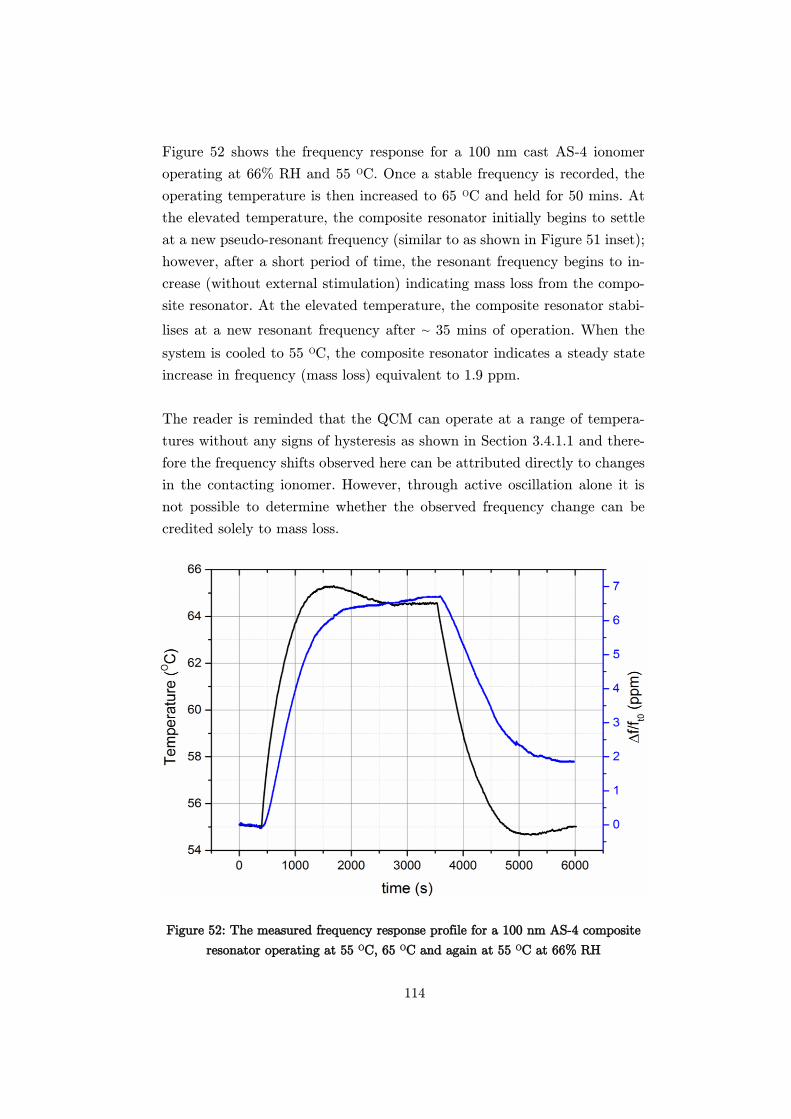
114
Figure 52 shows the frequency response for a 100 nm cast AS-4 ionomer
operating at 66% RH and 55 OC. Once a stable frequency is recorded, the
operating temperature is then increased to 65 OC and held for 50 mins. At
the elevated temperature, the composite resonator initially begins to settle
at a new pseudo-resonant frequency (similar to as shown in Figure 51 inset);
however, after a short period of time, the resonant frequency begins to in-
crease (without external stimulation) indicating mass loss from the compo-
site resonator. At the elevated temperature, the composite resonator stabi-
lises at a new resonant frequency after ~ 35 mins of operation. When the
system is cooled to 55 OC, the composite resonator indicates a steady state
increase in frequency (mass loss) equivalent to 1.9 ppm.
The reader is reminded that the QCM can operate at a range of tempera-
tures without any signs of hysteresis as shown in Section 3.4.1.1 and there-
fore the frequency shifts observed here can be attributed directly to changes
in the contacting ionomer. However, through active oscillation alone it is
not possible to determine whether the observed frequency change can be
credited solely to mass loss.
Figure 52: The measured frequency response profile for a 100 nm AS-4 composite
resonator operating at 55 OC, 65 OC and again at 55 OC at 66% RH
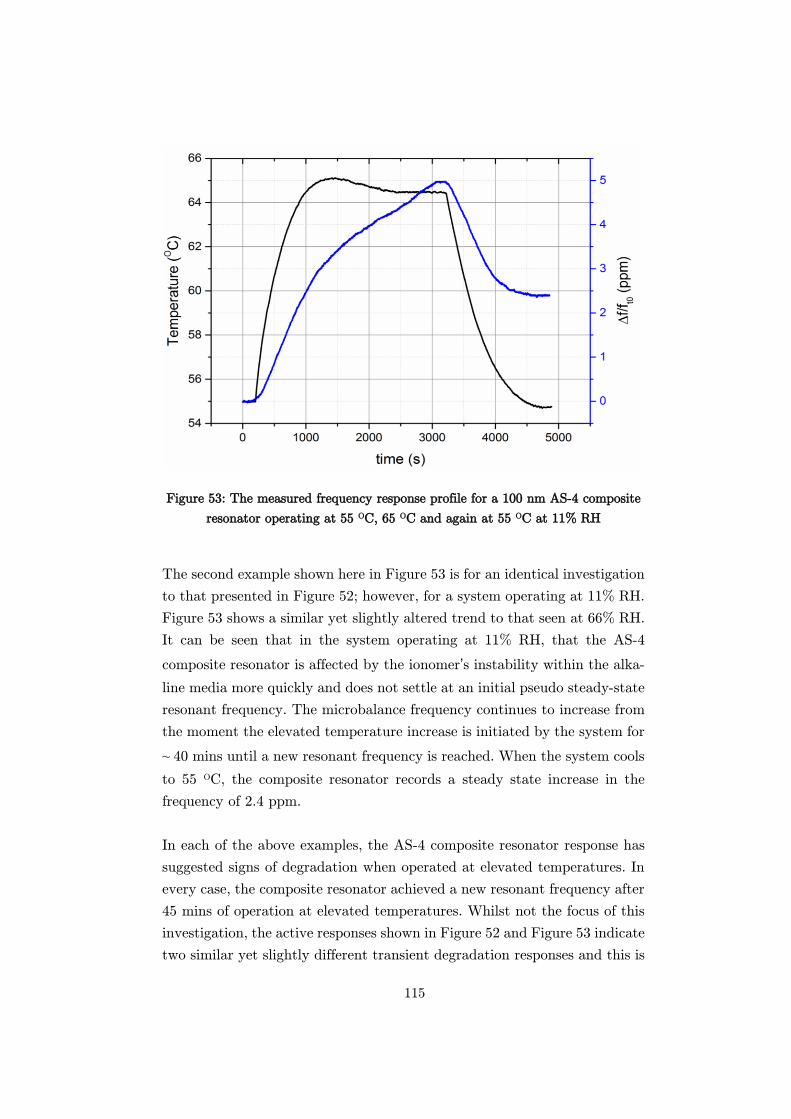
115
Figure 53: The measured frequency response profile for a 100 nm AS-4 composite
resonator operating at 55 OC, 65 OC and again at 55 OC at 11% RH
The second example shown here in Figure 53 is for an identical investigation
to that presented in Figure 52; however, for a system operating at 11% RH.
Figure 53 shows a similar yet slightly altered trend to that seen at 66% RH.
It can be seen that in the system operating at 11% RH, that the AS-4
composite resonator is affected by the ionomer’s instability within the alka-
line media more quickly and does not settle at an initial pseudo steady-state
resonant frequency. The microbalance frequency continues to increase from
the moment the elevated temperature increase is initiated by the system for
~ 40 mins until a new resonant frequency is reached. When the system cools
to 55 OC, the composite resonator records a steady state increase in the
frequency of 2.4 ppm.
In each of the above examples, the AS-4 composite resonator response has
suggested signs of degradation when operated at elevated temperatures. In
every case, the composite resonator achieved a new resonant frequency after
45 mins of operation at elevated temperatures. Whilst not the focus of this
investigation, the active responses shown in Figure 52 and Figure 53 indicate
two similar yet slightly different transient degradation responses and this is
116
further discussed in Section 3.5.1. The measured shift in frequency for these
investigations is very similar and whilst useful at indicating composite res-
onator mass change, it does not provide enough information to understand
the nuances of the degradation process. The implementation of the steady
state investigation using CAS provides a more comprehensive insight into
the processes occurring on the ionomer surface during the degradation pro-
cess.
The admittance data for the composite resonator operating at 55C before
and after the rise in operating temperature (to 65C for 50 mins) were rec-
orded (an example of which is shown in Figure 54) and fitted using the
modified equivalent circuit shown in Figure 12. The example shown here is
for a system operating at 55 OC before and after operation at 65 OC at
11% RH. As can be seen in Figure 54b inset, the composite resonator shows
signs of a damped ǀYǀmax and thus a reduced viscoelasticity after operation
at elevated temperatures. The change in the systems viscoelasticity indicates
that the measured active frequency responses are a result of degradation of
the ionomer’s side chains and not a process of the ionomer ‘burning off’ at
high temperatures, as discussed below.
The system’s viscoelasticity can be represented by the R2 term in the equiv-
alent circuit [2, 113, 136], and is the main component of interest in this
investigation. The relative difference in viscoelasticity can be represented by
the shift in R2. The percentage change in R2 before and after composite
resonator operation at elevated temperatures for a range of relative humid-
ities is shown in Figure 55.
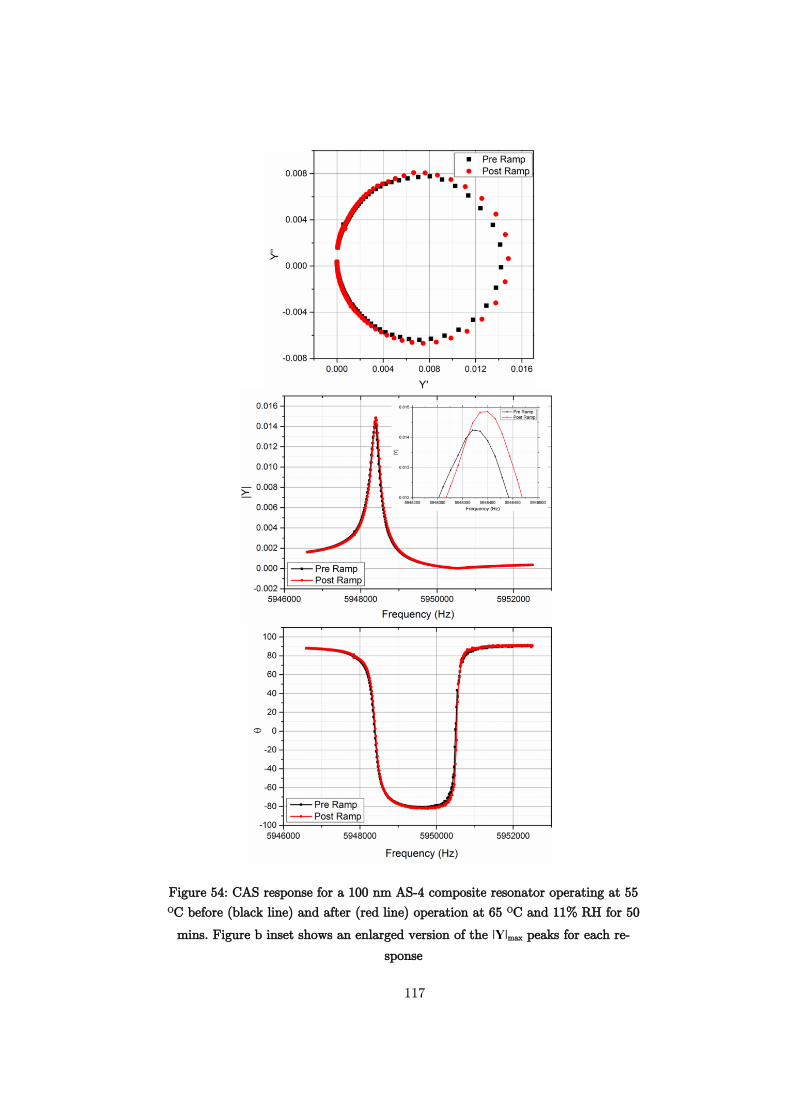
117
Figure 54: CAS response for a 100 nm AS-4 composite resonator operating at 55
OC before (black line) and after (red line) operation at 65 OC and 11% RH for 50
mins. Figure b inset shows an enlarged version of the ǀYǀmax peaks for each re-
sponse
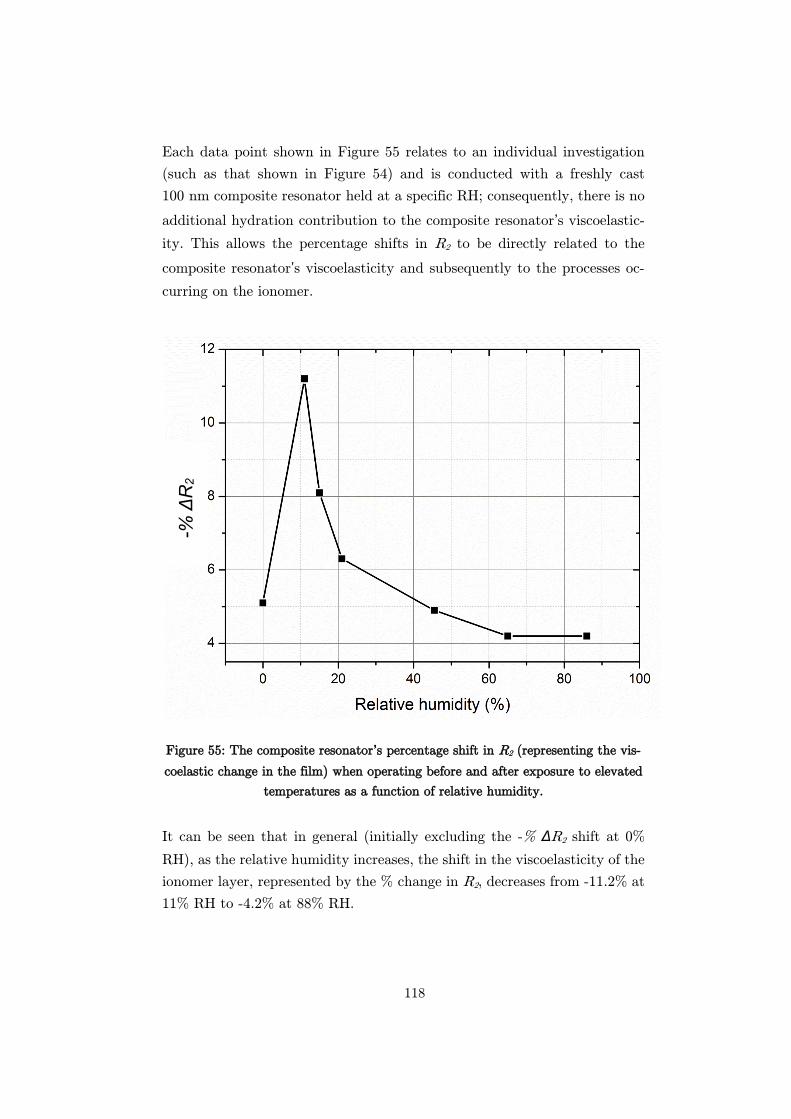
118
Each data point shown in Figure 55 relates to an individual investigation
(such as that shown in Figure 54) and is conducted with a freshly cast
100 nm composite resonator held at a specific RH; consequently, there is no
additional hydration contribution to the composite resonator’s viscoelastic-
ity. This allows the percentage shifts in R2 to be directly related to the
composite resonator’s viscoelasticity and subsequently to the processes oc-
curring on the ionomer.
Figure 55: The composite resonator’s percentage shift in R2 (representing the vis-
coelastic change in the film) when operating before and after exposure to elevated
temperatures as a function of relative humidity.
It can be seen that in general (initially excluding the -% ΔR2 shift at 0%
RH), as the relative humidity increases, the shift in the viscoelasticity of the
ionomer layer, represented by the % change in R2, decreases from -11.2% at
11% RH to -4.2% at 88% RH.
-% Δ
R2
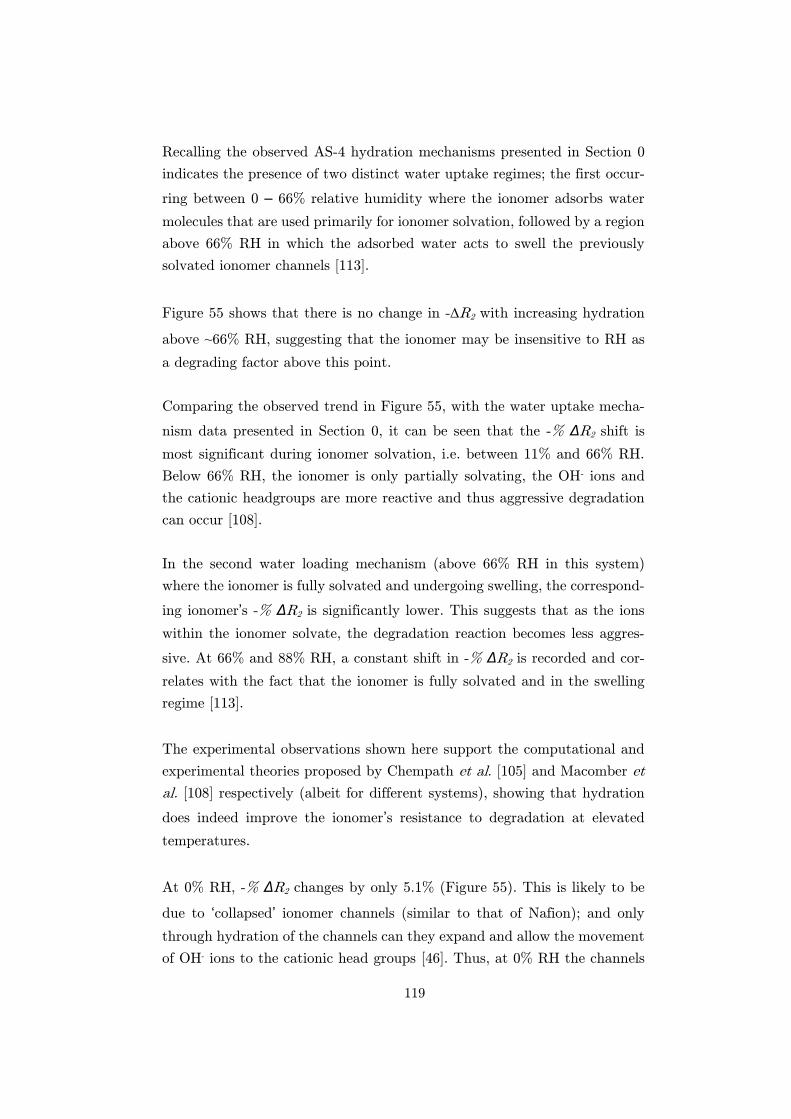
119
Recalling the observed AS-4 hydration mechanisms presented in Section 0
indicates the presence of two distinct water uptake regimes; the first occur-
ring between 0 – 66% relative humidity where the ionomer adsorbs water
molecules that are used primarily for ionomer solvation, followed by a region
above 66% RH in which the adsorbed water acts to swell the previously
solvated ionomer channels [113].
Figure 55 shows that there is no change in -R2 with increasing hydration
above ~66% RH, suggesting that the ionomer may be insensitive to RH as
a degrading factor above this point.
Comparing the observed trend in Figure 55, with the water uptake mecha-
nism data presented in Section 0, it can be seen that the -% ΔR2 shift is
most significant during ionomer solvation, i.e. between 11% and 66% RH.
Below 66% RH, the ionomer is only partially solvating, the OH- ions and
the cationic headgroups are more reactive and thus aggressive degradation
can occur [108].
In the second water loading mechanism (above 66% RH in this system)
where the ionomer is fully solvated and undergoing swelling, the correspond-
ing ionomer’s -% ΔR2 is significantly lower. This suggests that as the ions
within the ionomer solvate, the degradation reaction becomes less aggres-
sive. At 66% and 88% RH, a constant shift in -% ΔR2 is recorded and cor-
relates with the fact that the ionomer is fully solvated and in the swelling
regime [113].
The experimental observations shown here support the computational and
experimental theories proposed by Chempath et al. [105] and Macomber et
al. [108] respectively (albeit for different systems), showing that hydration
does indeed improve the ionomer’s resistance to degradation at elevated
temperatures.
At 0% RH, -% ΔR2 changes by only 5.1% (Figure 55). This is likely to be
due to ‘collapsed’ ionomer channels (similar to that of Nafion); and only
through hydration of the channels can they expand and allow the movement
of OH- ions to the cationic head groups [46]. Thus, at 0% RH the channels
120
impede access of OH- ions, which results in minimal membrane degradation
(and viscoelastic change associated with the shift in R2).
Whilst the QCM is able to provide useful insight into what is happening at
the interfacial level of the ionomer, it does not provide chemical information
on the degradation process. By applying in-line mass spectrometry to the
humidification chamber exhaust, it is possible to distinguish between re-
gimes of membrane degradation and stability.
Figure 56: In-line mass spectrometry data for the composite resonator operating
at: a) 55C (inset shows the full relative intensity scale) and b) 65C. (the results
presented here are taken at 0% RH)
The mass spectrum is shown in Figure 56a and the inset represents the
system when the composite resonator is operating at 55C under a dry flow
of nitrogen. This measurement is performed at 0% RH to simplify the anal-
ysis and remove water and constituent element peaks from the data. As
expected, peaks appear at mass numbers 14, 28 and 29, indicating the pres-
ence of only nitrogen. This confirms that there is no discernible membrane
degradation at 55C, and that the system is completely closed to air (dis-
counting the possibility of the formation of carbonates in the presence of
CO2).
Figure 56b, shows the mass spectrum when operated at 65C at 0% RH
(after 30 mins); the presence of additional mass number peaks are observed
and summarised in Table 4.
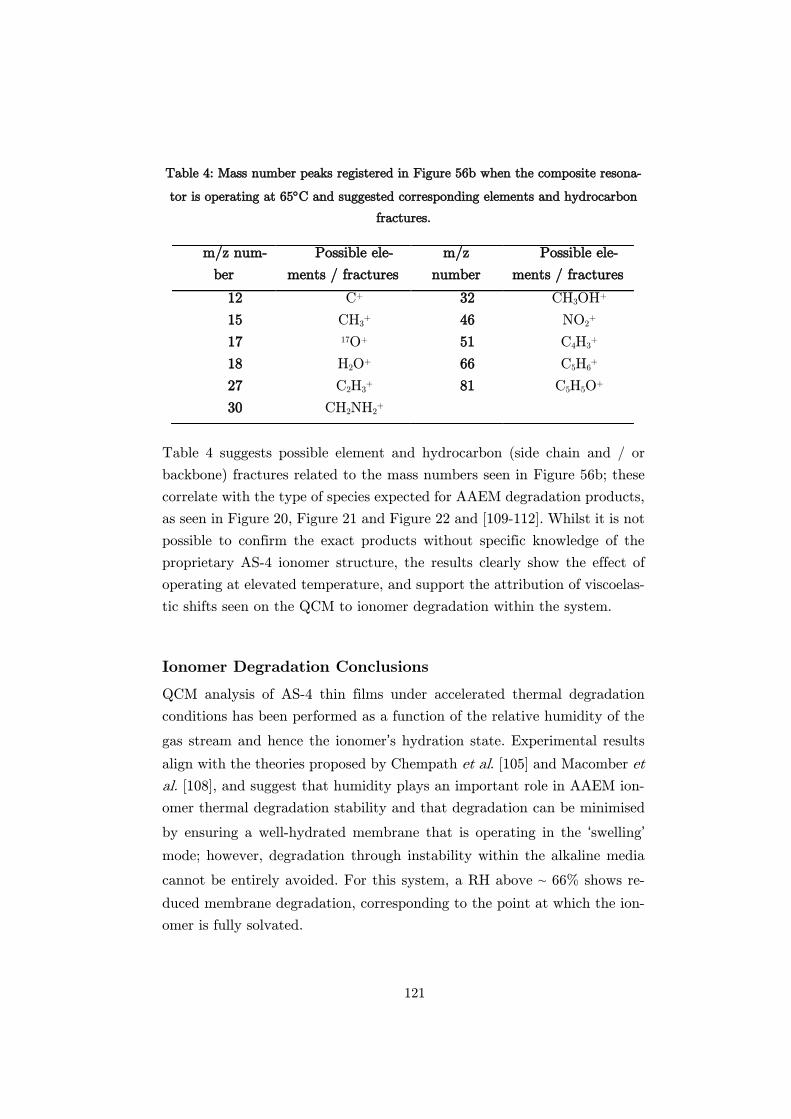
121
Table 4: Mass number peaks registered in Figure 56b when the composite resona-
tor is operating at 65C and suggested corresponding elements and hydrocarbon
fractures.
Table 4 suggests possible element and hydrocarbon (side chain and / or
backbone) fractures related to the mass numbers seen in Figure 56b; these
correlate with the type of species expected for AAEM degradation products,
as seen in Figure 20, Figure 21 and Figure 22 and [109-112]. Whilst it is not
possible to confirm the exact products without specific knowledge of the
proprietary AS-4 ionomer structure, the results clearly show the effect of
operating at elevated temperature, and support the attribution of viscoelas-
tic shifts seen on the QCM to ionomer degradation within the system.
Ionomer Degradation Conclusions
QCM analysis of AS-4 thin films under accelerated thermal degradation
conditions has been performed as a function of the relative humidity of the
gas stream and hence the ionomer’s hydration state. Experimental results
align with the theories proposed by Chempath et al. [105] and Macomber et
al. [108], and suggest that humidity plays an important role in AAEM ion-
omer thermal degradation stability and that degradation can be minimised
by ensuring a well-hydrated membrane that is operating in the ‘swelling’
mode; however, degradation through instability within the alkaline media
cannot be entirely avoided. For this system, a RH above ~ 66% shows re-
duced membrane degradation, corresponding to the point at which the ion-
omer is fully solvated.
m/z num-
ber
Possible ele-
ments / fractures
m/z
number
Possible ele-
ments / fractures
12 C+ 32 CH3OH+
15 CH3+ 46 NO2
+
17 17O+ 51 C4H3+
18 H2O+ 66 C5H6+
27 C2H3+ 81 C5H5O+
30 CH2NH2+
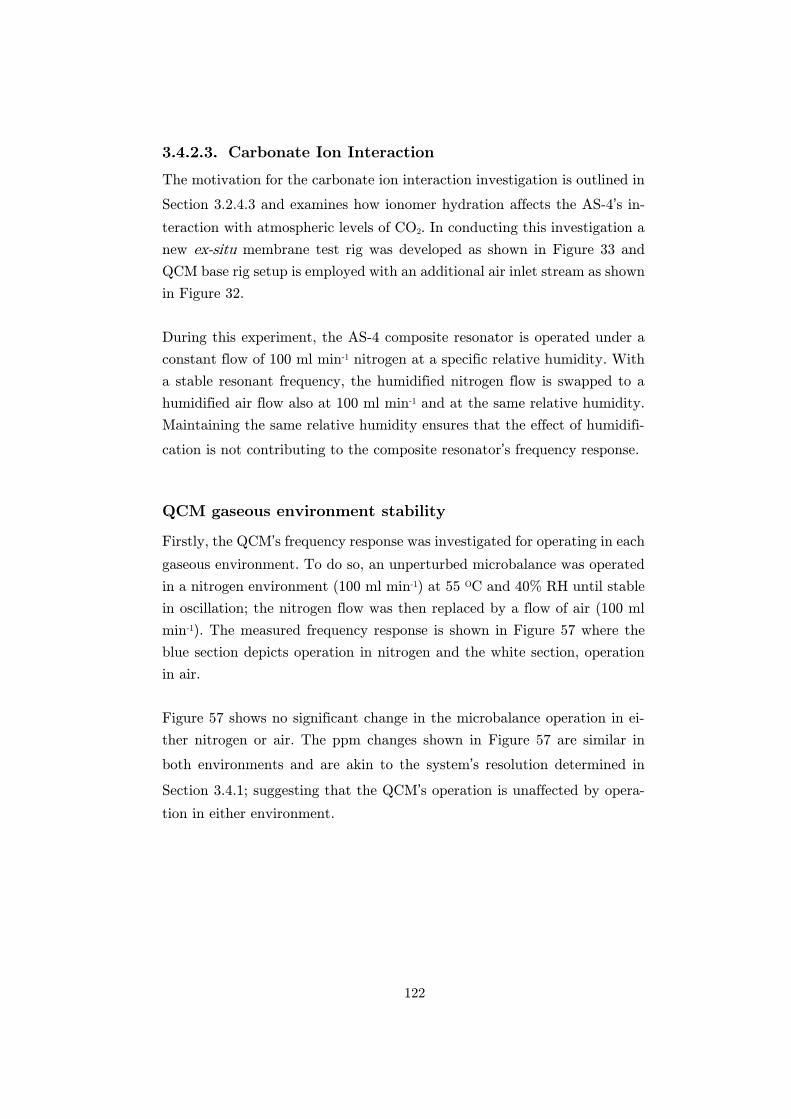
122
Carbonate Ion Interaction
The motivation for the carbonate ion interaction investigation is outlined in
Section 3.2.4.3 and examines how ionomer hydration affects the AS-4’s in-
teraction with atmospheric levels of CO2. In conducting this investigation a
new ex-situ membrane test rig was developed as shown in Figure 33 and
QCM base rig setup is employed with an additional air inlet stream as shown
in Figure 32.
During this experiment, the AS-4 composite resonator is operated under a
constant flow of 100 ml min-1 nitrogen at a specific relative humidity. With
a stable resonant frequency, the humidified nitrogen flow is swapped to a
humidified air flow also at 100 ml min-1 and at the same relative humidity.
Maintaining the same relative humidity ensures that the effect of humidifi-
cation is not contributing to the composite resonator’s frequency response.
QCM gaseous environment stability
Firstly, the QCM’s frequency response was investigated for operating in each
gaseous environment. To do so, an unperturbed microbalance was operated
in a nitrogen environment (100 ml min-1) at 55 OC and 40% RH until stable
in oscillation; the nitrogen flow was then replaced by a flow of air (100 ml
min-1). The measured frequency response is shown in Figure 57 where the
blue section depicts operation in nitrogen and the white section, operation
in air.
Figure 57 shows no significant change in the microbalance operation in ei-
ther nitrogen or air. The ppm changes shown in Figure 57 are similar in
both environments and are akin to the system’s resolution determined in
Section 3.4.1; suggesting that the QCM’s operation is unaffected by opera-
tion in either environment.
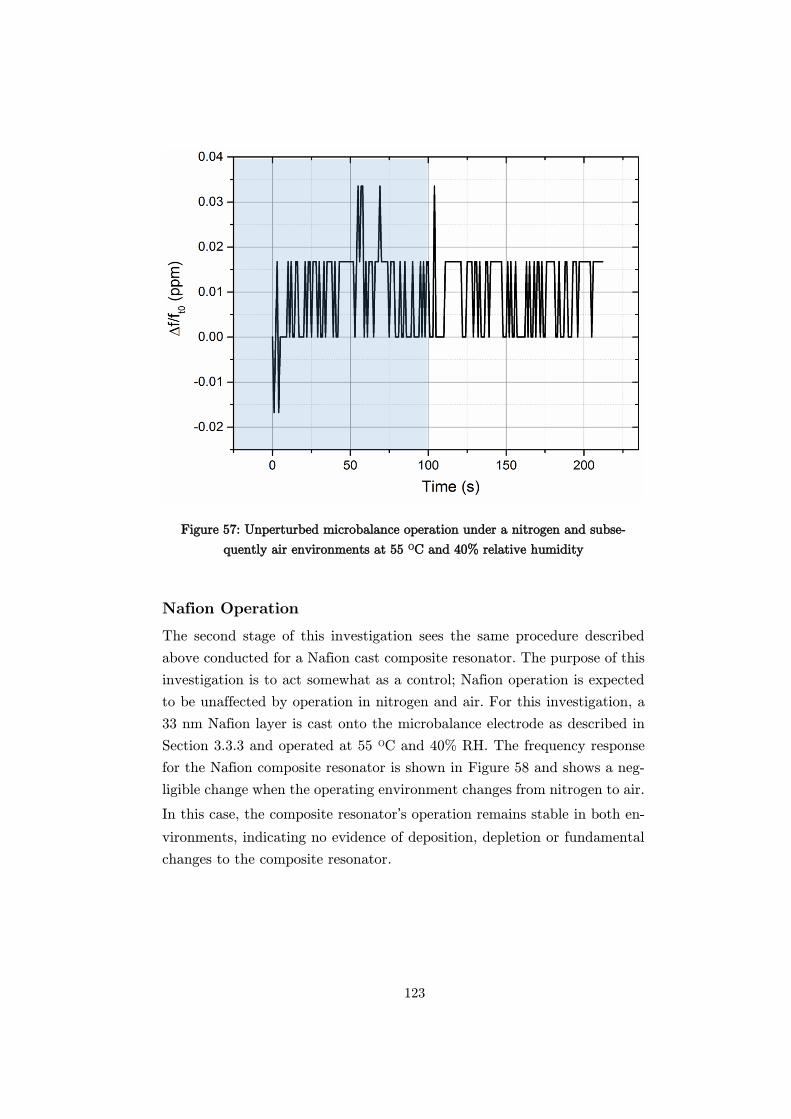
123
Figure 57: Unperturbed microbalance operation under a nitrogen and subse-
quently air environments at 55 OC and 40% relative humidity
Nafion Operation
The second stage of this investigation sees the same procedure described
above conducted for a Nafion cast composite resonator. The purpose of this
investigation is to act somewhat as a control; Nafion operation is expected
to be unaffected by operation in nitrogen and air. For this investigation, a
33 nm Nafion layer is cast onto the microbalance electrode as described in
Section 3.3.3 and operated at 55 OC and 40% RH. The frequency response
for the Nafion composite resonator is shown in Figure 58 and shows a neg-
ligible change when the operating environment changes from nitrogen to air.
In this case, the composite resonator’s operation remains stable in both en-
vironments, indicating no evidence of deposition, depletion or fundamental
changes to the composite resonator.
124
Figure 58: Resonant frequency and resistance response for a 33 nm cast Nafion
microbalance operating under a nitrogen and subsequently air environment at 55
OC and 40% relative humidity.
AS-4 carbonate Ion Interaction
AAEM EIS Resistance Measurements
The first part of this investigation explores how humidity affects the high-
frequency Ohmic resistance of a commercially available alkaline anion-ex-
change sheet membrane (A201, Tokuyama) operating in atmospheric levels
of CO2 (air).
Figure 59 shows the % change in the measured high-frequency resistance for
A201 sheet AAEMs held at different RHs when operating in nitrogen (blue
section) and subsequently in air of the same RH.
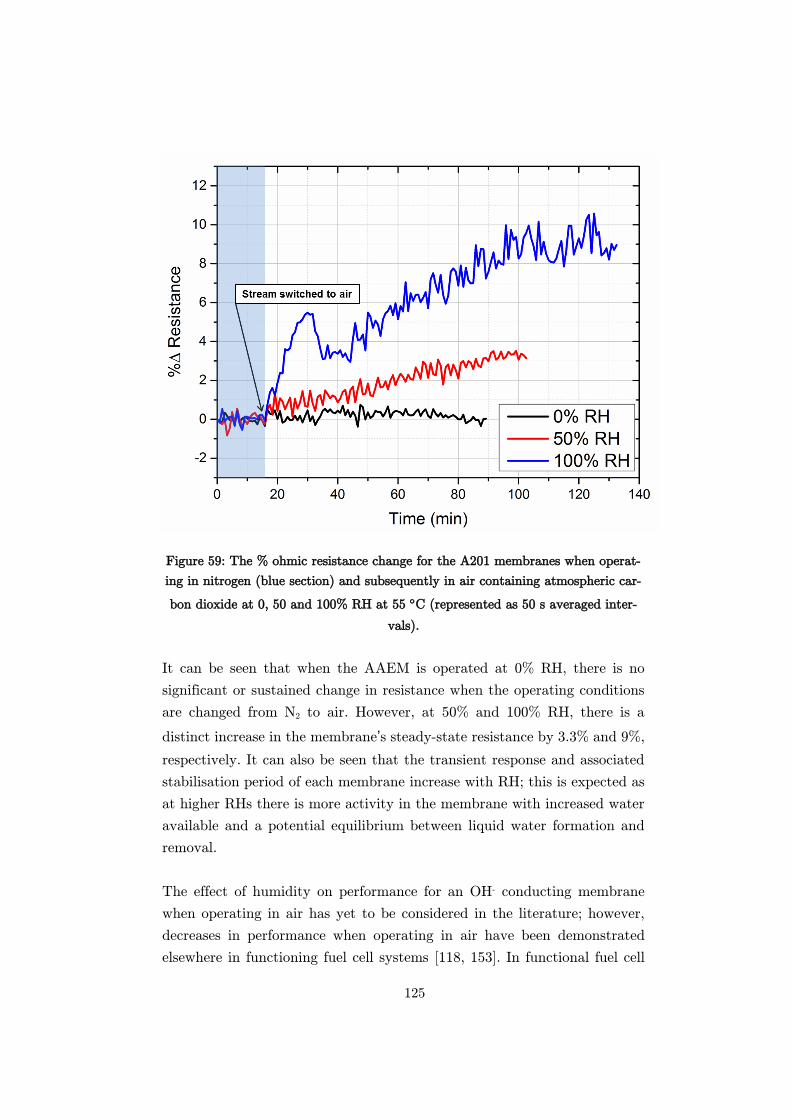
125
Figure 59: The % ohmic resistance change for the A201 membranes when operat-
ing in nitrogen (blue section) and subsequently in air containing atmospheric car-
bon dioxide at 0, 50 and 100% RH at 55 C (represented as 50 s averaged inter-
vals).
It can be seen that when the AAEM is operated at 0% RH, there is no
significant or sustained change in resistance when the operating conditions
are changed from N2 to air. However, at 50% and 100% RH, there is a
distinct increase in the membrane’s steady-state resistance by 3.3% and 9%,
respectively. It can also be seen that the transient response and associated
stabilisation period of each membrane increase with RH; this is expected as
at higher RHs there is more activity in the membrane with increased water
available and a potential equilibrium between liquid water formation and
removal.
The effect of humidity on performance for an OH- conducting membrane
when operating in air has yet to be considered in the literature; however,
decreases in performance when operating in air have been demonstrated
elsewhere in functioning fuel cell systems [118, 153]. In functional fuel cell
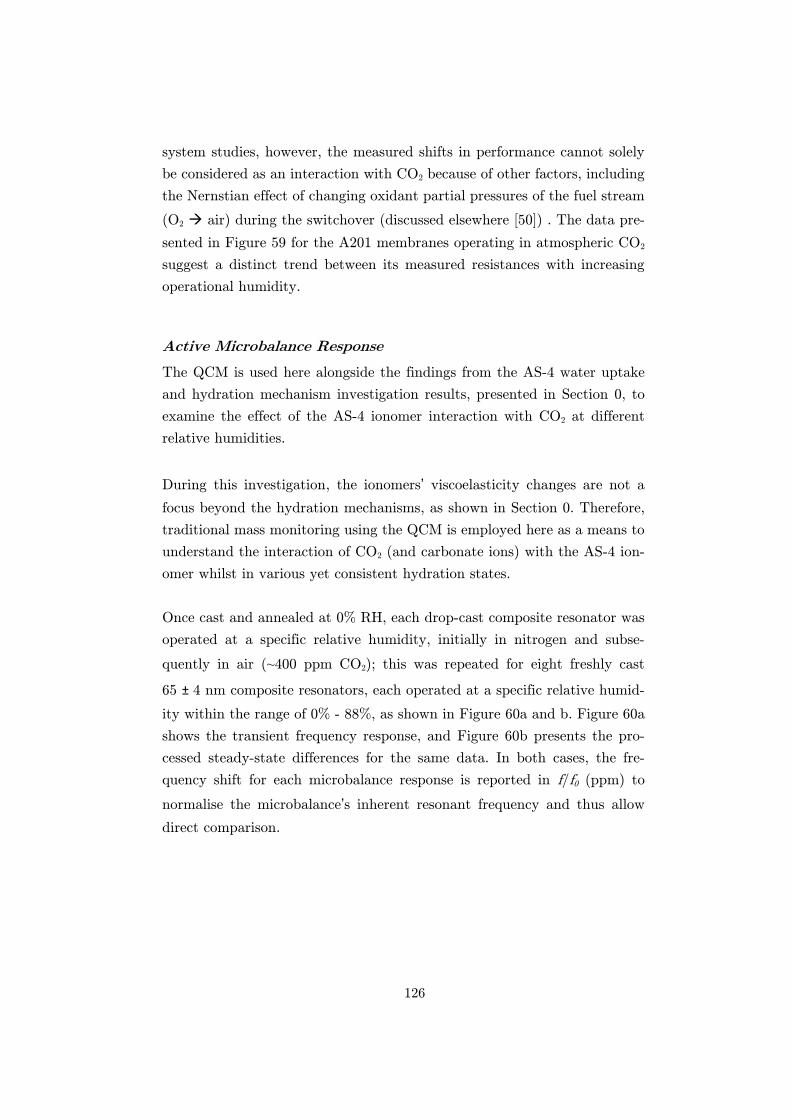
126
system studies, however, the measured shifts in performance cannot solely
be considered as an interaction with CO2 because of other factors, including
the Nernstian effect of changing oxidant partial pressures of the fuel stream
(O2 air) during the switchover (discussed elsewhere [50]) . The data pre-
sented in Figure 59 for the A201 membranes operating in atmospheric CO2
suggest a distinct trend between its measured resistances with increasing
operational humidity.
Active Microbalance Response
The QCM is used here alongside the findings from the AS-4 water uptake
and hydration mechanism investigation results, presented in Section 0, to
examine the effect of the AS-4 ionomer interaction with CO2 at different
relative humidities.
During this investigation, the ionomers’ viscoelasticity changes are not a
focus beyond the hydration mechanisms, as shown in Section 0. Therefore,
traditional mass monitoring using the QCM is employed here as a means to
understand the interaction of CO2 (and carbonate ions) with the AS-4 ion-
omer whilst in various yet consistent hydration states.
Once cast and annealed at 0% RH, each drop-cast composite resonator was
operated at a specific relative humidity, initially in nitrogen and subse-
quently in air (~400 ppm CO2); this was repeated for eight freshly cast
65 ± 4 nm composite resonators, each operated at a specific relative humid-
ity within the range of 0% - 88%, as shown in Figure 60a and b. Figure 60a
shows the transient frequency response, and Figure 60b presents the pro-
cessed steady-state differences for the same data. In both cases, the fre-
quency shift for each microbalance response is reported in f/f0 (ppm) to
normalise the microbalance’s inherent resonant frequency and thus allow
direct comparison.
127
Figure 60: (a) Transient frequency responses for AS-4 composite resonators oper-
ating in nitrogen and subsequently in air at a range of RHs. (b) Change in the
composite resonators’ steady state frequency response when operating in nitrogen
and subsequently in air at a range of RHs.
128
The transient frequency response shown in Figure 60a reveals an immediate
drop in the composite resonator’s frequency upon the introduction of air
into the system. In general, the magnitude of the frequency drop increases
with the system’s relative humidity. After the initial frequency drop, the
composite resonator’s resonant frequency increases and settles at a new sta-
ble steady-state value. The difference between the steady-state operation in
N2 and in air is processed and presented in Figure 60b.
This initial frequency drop shown in Figure 60a is not experienced for the
AS-4 ionomer operating at 0% RH, nor with either the unperturbed or
Nafion composite resonators shown in Figure 57 and Figure 58. This sug-
gests that the initial frequency drop is a result of the (partially) hydrated
ionomer’s interaction and equilibration with the dissolved CO2 in the con-
tacting operating environment. The sheet membrane resistance study pre-
sented in Figure 59 also shows a similar phenomenon occurring at 100% RH
where after the operating environment is changed, the membrane’s re-
sistance initially increases sharply only to fall soon after.
Figure 60b shows that for a composite resonator held at 0% RH (when there
is no water in the system); there is no change in the resonator’s resonant
frequency when switched from operation in nitrogen to air. This agrees with
the membrane resistance result seen in Figure 59 for 0% RH. In the range
between 0% and 62% RH, Figure 60b shows a linear increase with each
composite resonator’s relative steady state frequency shift with increasing
RH when switched to operation in air. At 66% RH, the composite resonator
shows a step change of 1.8 ppm from the investigation conducted at
62 % RH. Between 66% - 88% RH, increased operational RH has shown to
have a significantly smaller effect on each of the composite resonators’ fre-
quency shifts.
The AS-4 hydration investigation presented in Section 0 suggests that the
ionomer initially undergoes a solvation period (≤ 66% RH) in which ion
conducting channels begin to open as cationic headgroups become fully solv-
ated, followed by swelling of these ionomer channels between 66% and
100% RH.
129
It is expected that access of CO2 to the pore network structure will have an
effect on the extent of interaction with the AS-4 ionomer. As the RH in-
creases during this investigation, it is possible that more CO2 is able to
permeate into the humidified channels within the membrane. This would
allow an increased production of carbonic acid within the system (Equation
(18)), which can react with the hydroxyl anions (Equations (18) - (22))
[121]. With increasing RH, the system is expected to become more acidic as
the CO2 uptake increases (and hence carbonate ion formation); more of the
cationic head groups interact with the increased concentration of available
carbonate ions which results in an effective mass increase (decreasing f/f0).
The initial frequency drop seen in the transient response in Figure 60a sug-
gests the presence of equilibrium between the carbonate ion interaction and
the ionomer. The magnitude of the initial interaction increases with increas-
ing RH as potentially more dissolved CO2 is able to permeate into more
hydrated channels and thus increased access to and interaction with the
cationic head groups before equilibration begins. Figure 60b suggests that
the extent of CO2 uptake increases linearly with humidity between
0 - 62% RH; however, between 62% - 66% RH there is a significant step
change which remains approximately constant between 66% and 88% RH.
Figure 60a and b suggests a correlation between the degree of membrane
hydration and the extent of CO2 uptake. During the linear solvation regime,
the results suggest a corresponding linear opening of the membrane pores
allows increasing access of CO2, and hence more interaction between cationic
head groups and carbonate ions. Once the channels are thought to be fully
open (≥ 66% RH as suggested by [113]), all cationic sites can become acces-
sible as the ionomer is fully solvated and changes in RH have little effect on
CO2 uptake.
Carbonate Ion Interaction Conclusion
Interaction of CO2 with AAEMs is a potentially potent cause of performance
degradation. Results here suggest that loss of membrane ion conductivity
on exposure to CO2 is a function of membrane hydration; increasing mem-
brane hydration leads to more substantial resistance increases. Thin-film
ionomer studies using the QCM have allowed for very accurate measurement
of CO2 uptake (carbonate interaction) into the membrane. Exposing the cast

130
membrane to atmospheric levels of CO2 in air and operating at the typical
operating temperature of the membrane in a device (55 C), suggests that
there is a correlation between CO2 uptake and the level of hydration of the
membrane; the pore opening regime resulting in a linear increase in CO2
uptake as water permeates the pore system and cation headgroups become
increasingly accessible to CO2. The transition to the pore swelling phase sees
a step increase in CO2 uptake as the network is fully open and continues to
swell with water but does not lead to a significant increase in CO2 uptake
with increasing RH.
131
3.5 Conclusions
During this study, the development of AS-4 cast composite QCM’s have
been established through a novel in-situ casting procedure. The composite
resonators developed throughout this study range in ionomer layer thick-
nesses of 20 – 100 nm. These thicknesses have been determined using the
Sauerbrey equation and were chosen to ensure fulfilment of the standing
wave condition, even when loaded.
Throughout this study, the composite resonator has been implemented
within bespoke rig designs and repeatedly tested and calibrated for use in
each investigation. In each case the frequency response contribution has
been confirmed only to be a factor of the conditions under investigation.
The study presented within this chapter has encompassed a detailed analysis
of the thin film AS-4 ionomer using the QCM through three individual in-
vestigations. These investigations have been discussed and concluded in the
necessary sections; however, a brief overview is given here alongside sug-
gested future work.
The initial work investigated the water uptake, swelling characteristics and
sorption mechanics of thin film Nafion and AS-4 ionomers from the vapour
phase. The Nafion investigation provided in-situ results that agreed with
proposed theories in the literature by authors such as Zawodzinski et al. and
provided a useful means by which to validate the experimental setup for the
relatively unknown AS-4 ionomer investigations. The first AS-4 investiga-
tion presented within this study has suggested the ionomers hydration mech-
anisms occur in part similar to that of Nafion with two distinct regimes; the
first being a solvation period at RHs ≤ 66% in which adsorbed water is used
to solvate ions within the ionomer followed by a swelling regime at higher
RHs.
The second part of the study explores the AS-4 ionomer instability and
degradation when operated at elevated temperatures as a function of its
hydration state. The theories presented in this section indicate that the
degradation pathways are more dominant when the ionomer is partially hy-
drated and specifically during the solvation period as defined by the initial
132
investigation. When the ionomer is operating during the swelling regime,
the results indicate that the ionomer performs more stably within the alka-
line media and shows fewer signs of degradation. The experimental results
obtained align with the theories proposed by Chempath et al. [105] and
Macomber et al. [108], and implies that humidity plays an important role
in AAEM ionomer stability within the alkaline media and that degradation
can be minimised by ensuring a well-hydrated membrane that is operating
in the ‘swelling’ mode.
The final investigation presented within this chapter uses sheet AAEM EIS
in conjunction with thin film AS-4 composite resonators to assess the car-
bonate ion interaction as a function of ionomer hydration. The findings sug-
gest that during the solvation regime there is a linear increase in CO2 uptake
as channels hydrate and water permeates the pore system and cation head-
groups become increasingly accessible to CO2. The transition to the pore
swelling regime sees a step increase in CO2 uptake as the pore network be-
comes fully open and additional water is used for swelling. Increasing RH
does not however result in increased CO2 uptake.
3.5.1 Future work
A further specific investigation into the transient water uptake at varying
ionomer thicknesses and thus an analysis of the sorption kinetics will provide
an interesting further insight into the AS-4’s hydration mechanisms. Equally
an examination of the ionomer hydration and dehydration cycling will pro-
vide useful insight into how the water uptake and hydration mechanisms
change (or creep) with cycling and consequently how factors such as degra-
dation and carbonate ion interaction are affected by changing ionomer char-
acteristics. This investigation will provide useful insight for operators re-
garding operation at different stages of the membrane lifespan.
A supplementary transient degradation study will help elucidate the kinetics
of the instability process and may provide guidance on how individual deg-
radation pathways dominate the kinetic responses. This future analysis may
provide operators with the information required to halt specific degradation
mechanisms as a means to accessing the kinetic advantage of operating at
elevated temperatures.

133
Finally, to further understand the carbonate ion interaction phenomenon,
an additional transient study is proposed to fully elucidate the effect that
hydration has on the ionomer’s ability to form immobilised salts. The tran-
sient study should focus on the initial frequency response shown in Figure
60a to determine the effect additional RH has on the initial interaction with
the ionomer and the subsequent kinetics of the carbonate ion interaction.
134
4 Fouling detection in high
temperature media
The work presented in this chapter advances the BAW resonator’s
operation further; operating with a heavy crude oil sample, under
variable pressure and temperature and with surface developed iron
layers. This study outlines the development and initial application
of a high-temperature gallium orthophosphate (GaPO4) BAW res-
onator for in-situ fouling detection during transportation and refin-
ing of heavy crude oil.
4.1 Introduction
Future renewable technologies such as fuel cells still have technical hurdles
to overcome before wide-spread application. Therefore, during the transition
to the low carbon economy the world will continue to rely on traditional
electricity generation methods. It is therefore critical that elements of the
future focus remain on increasing the efficiencies and attaining cost reduc-
tion (and stabilisation) of processes such as crude oil refinement to meet the
ever increasing demands in the short term.
With dwindling supplies of traditional crude oil; there has been significant
interest by the industry to draw on alternative resources such as heavy crude
oil. Heavy crude oil is a plentiful resource [154] which can act as a viable
substitute for conventional crude oils [155, 156]. However, variation in heavy
crude composition makes transportation and refinement of these heavily vis-
cous products difficult. The high viscosity and constituents of heavy crude
oil require alteration of conventional transmission transport pipelines and
refinery equipment. These alterations include dilution, heating, partial up-
grading, oil-in-water systems and core annular flow. The effect of each of
these improved transport methods is not currently well understood, and in
many cases may promote fouling and / or corrosion within the transporta-
tion pipelines and refinery equipment.
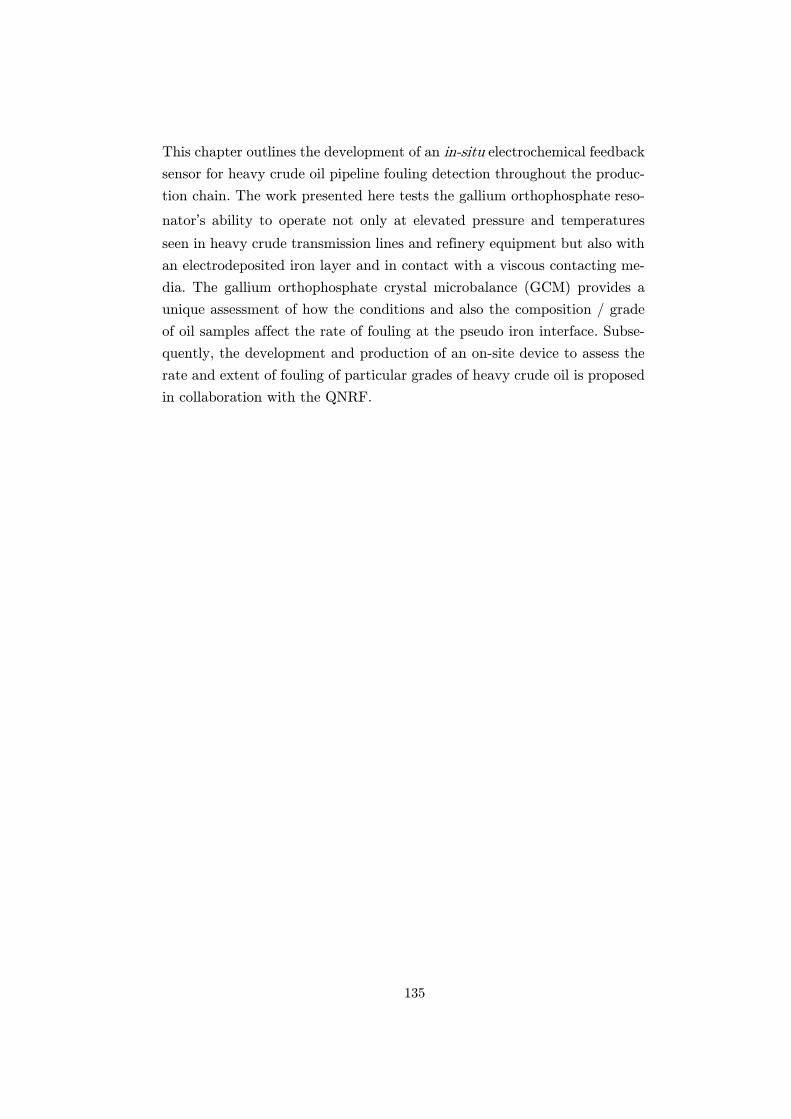
135
This chapter outlines the development of an in-situ electrochemical feedback
sensor for heavy crude oil pipeline fouling detection throughout the produc-
tion chain. The work presented here tests the gallium orthophosphate reso-
nator’s ability to operate not only at elevated pressure and temperatures
seen in heavy crude transmission lines and refinery equipment but also with
an electrodeposited iron layer and in contact with a viscous contacting me-
dia. The gallium orthophosphate crystal microbalance (GCM) provides a
unique assessment of how the conditions and also the composition / grade
of oil samples affect the rate of fouling at the pseudo iron interface. Subse-
quently, the development and production of an on-site device to assess the
rate and extent of fouling of particular grades of heavy crude oil is proposed
in collaboration with the QNRF.
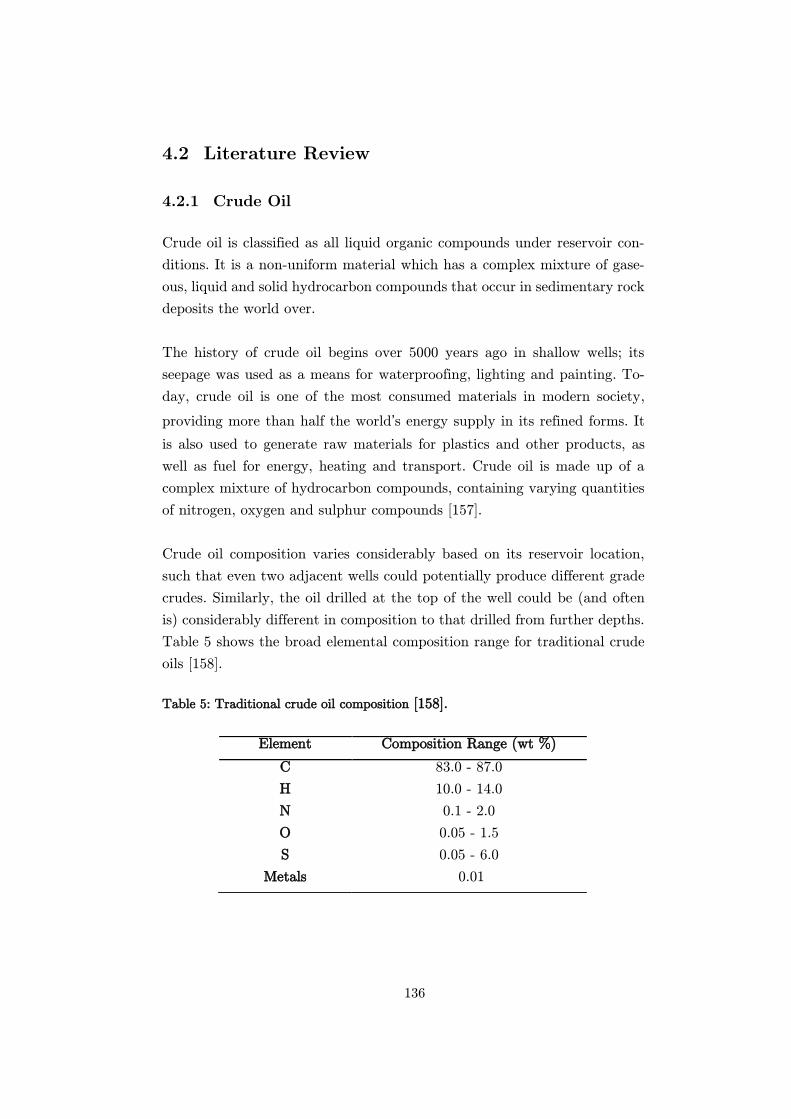
136
4.2 Literature Review
4.2.1 Crude Oil
Crude oil is classified as all liquid organic compounds under reservoir con-
ditions. It is a non-uniform material which has a complex mixture of gase-
ous, liquid and solid hydrocarbon compounds that occur in sedimentary rock
deposits the world over.
The history of crude oil begins over 5000 years ago in shallow wells; its
seepage was used as a means for waterproofing, lighting and painting. To-
day, crude oil is one of the most consumed materials in modern society,
providing more than half the world’s energy supply in its refined forms. It
is also used to generate raw materials for plastics and other products, as
well as fuel for energy, heating and transport. Crude oil is made up of a
complex mixture of hydrocarbon compounds, containing varying quantities
of nitrogen, oxygen and sulphur compounds [157].
Crude oil composition varies considerably based on its reservoir location,
such that even two adjacent wells could potentially produce different grade
crudes. Similarly, the oil drilled at the top of the well could be (and often
is) considerably different in composition to that drilled from further depths.
Table 5 shows the broad elemental composition range for traditional crude
oils [158].
Table 5: Traditional crude oil composition [158].
Element Composition Range (wt %)
C 83.0 - 87.0
H 10.0 - 14.0
N 0.1 - 2.0
O 0.05 - 1.5
S 0.05 - 6.0
Metals 0.01
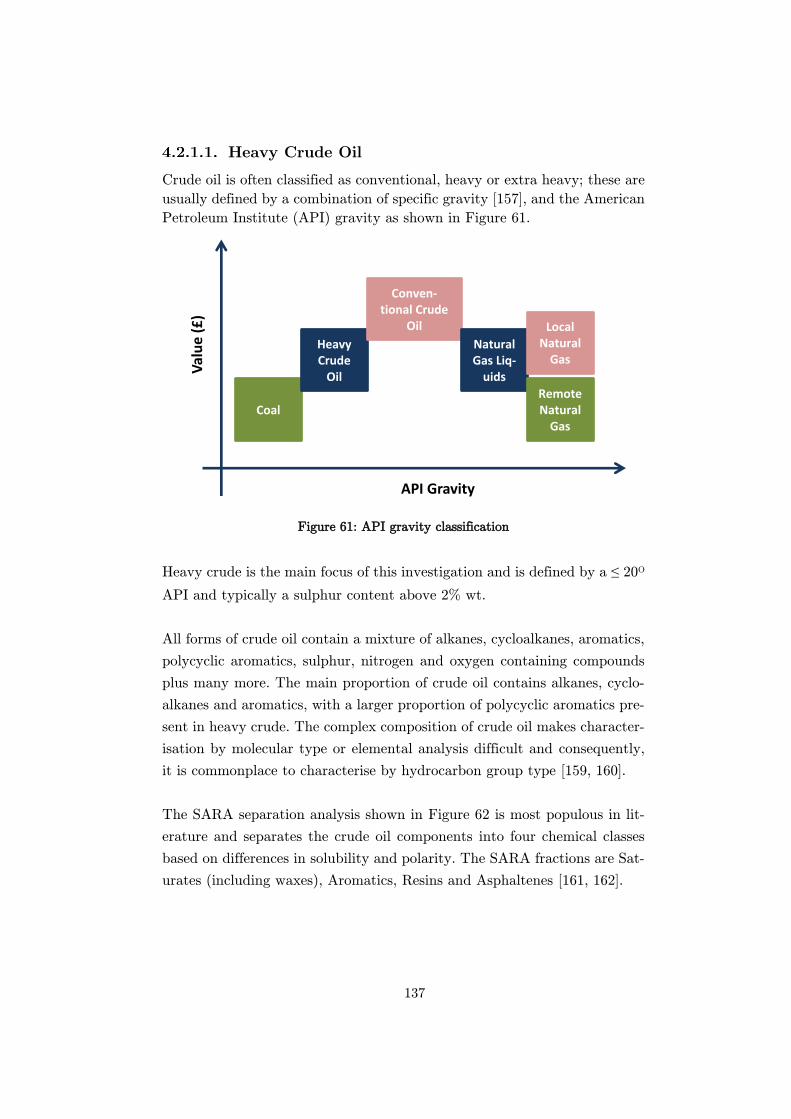
137
Heavy Crude Oil
Crude oil is often classified as conventional, heavy or extra heavy; these are
usually defined by a combination of specific gravity [157], and the American
Petroleum Institute (API) gravity as shown in Figure 61.
Figure 61: API gravity classification
Heavy crude is the main focus of this investigation and is defined by a ≤ 20O
API and typically a sulphur content above 2% wt.
All forms of crude oil contain a mixture of alkanes, cycloalkanes, aromatics,
polycyclic aromatics, sulphur, nitrogen and oxygen containing compounds
plus many more. The main proportion of crude oil contains alkanes, cyclo-
alkanes and aromatics, with a larger proportion of polycyclic aromatics pre-
sent in heavy crude. The complex composition of crude oil makes character-
isation by molecular type or elemental analysis difficult and consequently,
it is commonplace to characterise by hydrocarbon group type [159, 160].
The SARA separation analysis shown in Figure 62 is most populous in lit-
erature and separates the crude oil components into four chemical classes
based on differences in solubility and polarity. The SARA fractions are Sat-
urates (including waxes), Aromatics, Resins and Asphaltenes [161, 162].
Coal
Heavy Crude
Oil
Conven-tional Crude
Oil
Natural Gas Liq-
uids
Remote Natural
Gas
Local Natural
Gas
API Gravity
Val
ue
(£
)
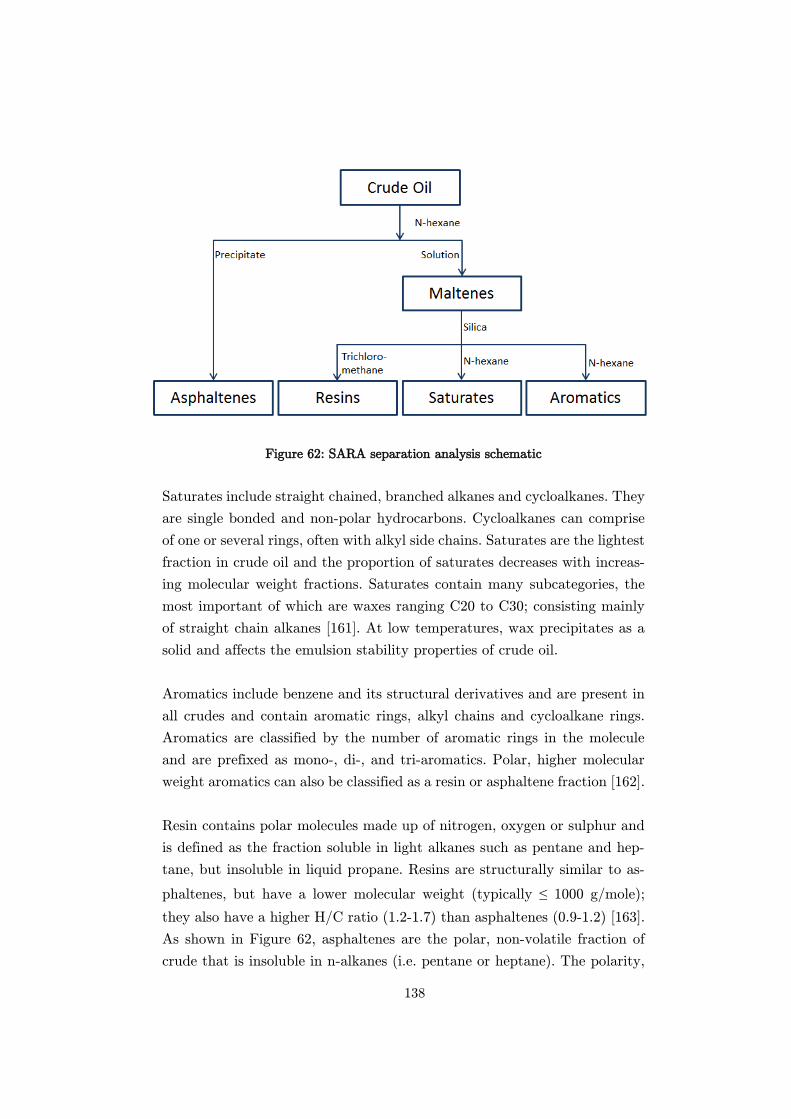
138
Figure 62: SARA separation analysis schematic
Saturates include straight chained, branched alkanes and cycloalkanes. They
are single bonded and non-polar hydrocarbons. Cycloalkanes can comprise
of one or several rings, often with alkyl side chains. Saturates are the lightest
fraction in crude oil and the proportion of saturates decreases with increas-
ing molecular weight fractions. Saturates contain many subcategories, the
most important of which are waxes ranging C20 to C30; consisting mainly
of straight chain alkanes [161]. At low temperatures, wax precipitates as a
solid and affects the emulsion stability properties of crude oil.
Aromatics include benzene and its structural derivatives and are present in
all crudes and contain aromatic rings, alkyl chains and cycloalkane rings.
Aromatics are classified by the number of aromatic rings in the molecule
and are prefixed as mono-, di-, and tri-aromatics. Polar, higher molecular
weight aromatics can also be classified as a resin or asphaltene fraction [162].
Resin contains polar molecules made up of nitrogen, oxygen or sulphur and
is defined as the fraction soluble in light alkanes such as pentane and hep-
tane, but insoluble in liquid propane. Resins are structurally similar to as-
phaltenes, but have a lower molecular weight (typically ≤ 1000 g/mole);
they also have a higher H/C ratio (1.2-1.7) than asphaltenes (0.9-1.2) [163].
As shown in Figure 62, asphaltenes are the polar, non-volatile fraction of
crude that is insoluble in n-alkanes (i.e. pentane or heptane). The polarity,
139
molecular weight and aromaticity of precipitated asphaltenes generally in-
crease with increasing carbon number of n-alkane precipitant.
Asphaltenes are crude oil’s heaviest components; their precipitate appears
black / brown in colour and has an undefined melting point and decomposes
at temperatures in excess of 300-400 OC (at atmospheric pressure). Asphal-
tene precipitation is shown to be affected by changes in temperature [164,
165], pressure [166-168] and oil composition [169].
The motivation for this work stems from the need to develop an in-situ
sensor that can elucidate the fouling properties of specific compositions of
heavy crude oils and the effect of operating conditions at various points
within the production chain. A specific emphasis is placed on asphaltene
precipitation throughout this study given its unpredictable solubility within
the bulk accelerated by changes in operating conditions as explored in Sec-
tion 4.2.3.
4.2.2 Transportation and Refining
To convert crude oil into its useful products, it must first be transported to
a refinery. Methods of transport have varied over the decades from disused
whisky barrels to trucks with the most popular being pipeline transporta-
tion. Before transportation through the pipeline, the crude oil mixture that
comes out of the ground is pre-treated and impurities such as water, sand
and gas are stripped away from the mixture [154, 170]. The oil is transported
to the refinery in transmission pipelines, which can be up to 56” diameter
and are typically made of carbon steel.
With the necessary move to heavy crude oils to meet consumer demands,
pipelines and refinery equipment that previously processed conventional
crude oils are now subject to the more variable composition SARA compo-
nents in the heavy crude mixture. However, without a better understanding
of how these components specifically affect the system’s flow assurance and
the subsequent implementation of the necessary amendments, pipelines and
other refinery equipment are subject to fouling and arterial blockages.
140
4.2.3 Fouling
Fouling in a system is the formation of an undesirable phase that interferes
with normal operation / processing. Foulant often appears as a solid, but
can also exist as a liquid in the gas phase operation or an emulsion in the
liquid phase [171]. The main source of pipeline fouling from heavy crude oil
comes from the saturate and asphaltene fractions, with smaller contributions
from water emulsions and organic solids.
Fouling (or deposition) in pipelines, risers and processing equipment can
have severe effects on flow assurance and oil production efficiency. The
fouling build-up in pipelines and other refinery equipment can cause in-
creased pressure drops, resulting in reduced throughput, higher utility costs
and reduced revenue. In some cases, pipelines and processing facilities can
plug and rupture, halting production altogether and lead to potentially huge
economic and environmental losses.
Waxes
The wax present in crudes consists primarily of paraffin and naphthenic
hydrocarbons; (C18 - C36) and (C30 - C60) respectively. The hydrocarbons
state of matter (gas, liquid or solid) is defined by the temperature and the
pressure of the crude. As the crude flows through a cold pipe (with a wall
temperature below the cloud point of the crude mixture – e.g. on the seabed)
macrocrystalline and microcrystalline crystals of wax may form on the wall.
Wax crystals continue to grow until the whole inner wall is covered, with
increasing wax wall thickness, there is a corresponding increase in pressure
drop across the pipe. To maintain a constant flow rate, the pumping power
must increase and thus the overall power requirement for the crude
transport increases.
The arterial blockage problems caused by waxes can be controlled by heat-
ing the pipe to above its cloud point and insulation. However, with these
systems not commonly installed, frequent and expensive chemical
antifoulants and pigging operations (Figure 63) have become necessary [170,
172].
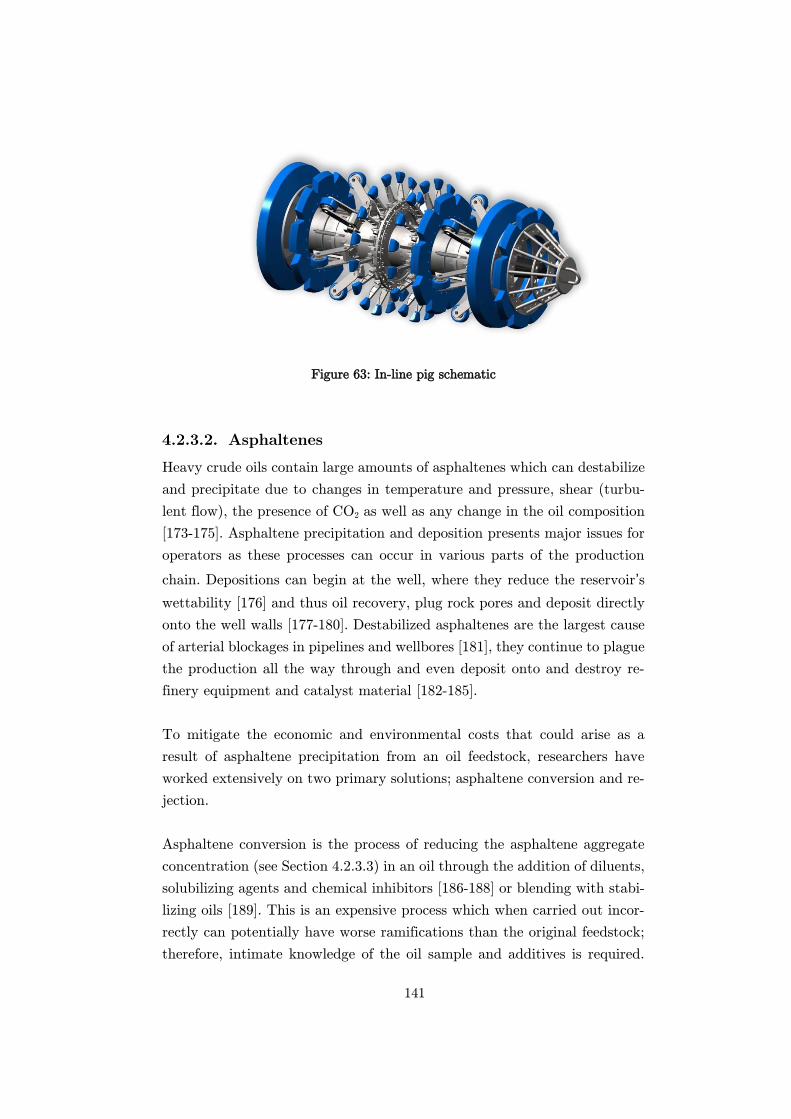
141
Figure 63: In-line pig schematic
Asphaltenes
Heavy crude oils contain large amounts of asphaltenes which can destabilize
and precipitate due to changes in temperature and pressure, shear (turbu-
lent flow), the presence of CO2 as well as any change in the oil composition
[173-175]. Asphaltene precipitation and deposition presents major issues for
operators as these processes can occur in various parts of the production
chain. Depositions can begin at the well, where they reduce the reservoir’s
wettability [176] and thus oil recovery, plug rock pores and deposit directly
onto the well walls [177-180]. Destabilized asphaltenes are the largest cause
of arterial blockages in pipelines and wellbores [181], they continue to plague
the production all the way through and even deposit onto and destroy re-
finery equipment and catalyst material [182-185].
To mitigate the economic and environmental costs that could arise as a
result of asphaltene precipitation from an oil feedstock, researchers have
worked extensively on two primary solutions; asphaltene conversion and re-
jection.
Asphaltene conversion is the process of reducing the asphaltene aggregate
concentration (see Section 4.2.3.3) in an oil through the addition of diluents,
solubilizing agents and chemical inhibitors [186-188] or blending with stabi-
lizing oils [189]. This is an expensive process which when carried out incor-
rectly can potentially have worse ramifications than the original feedstock;
therefore, intimate knowledge of the oil sample and additives is required.
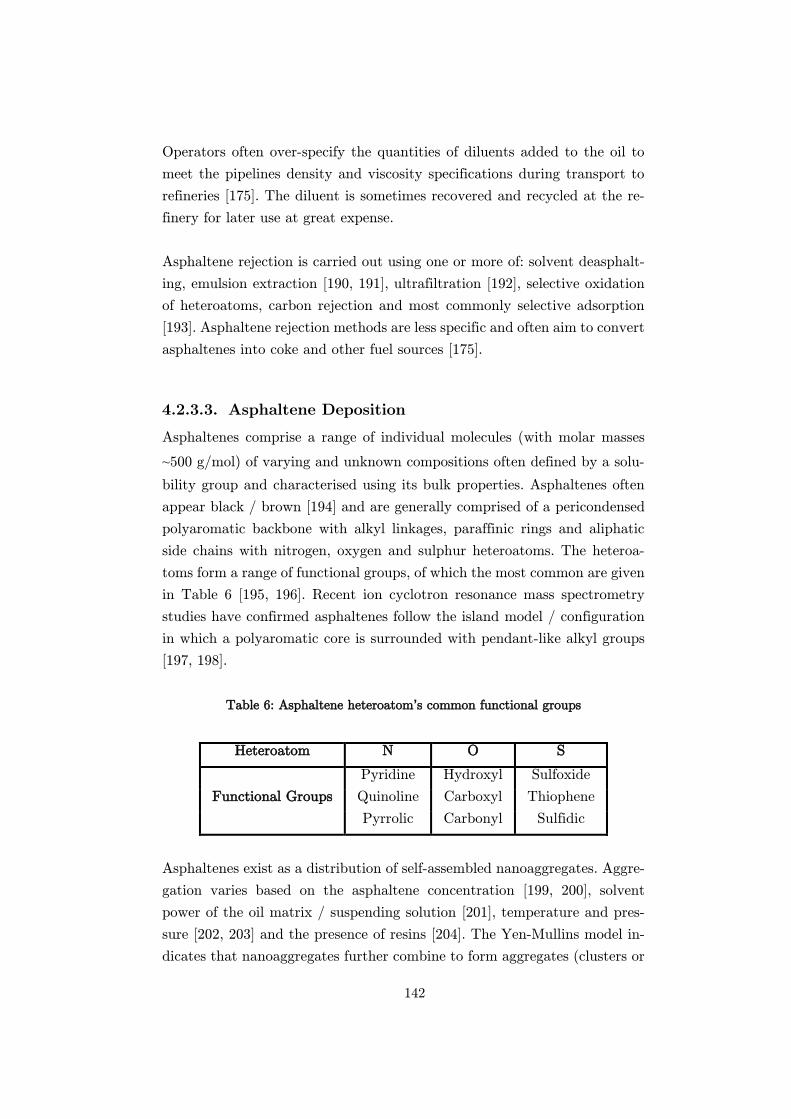
142
Operators often over-specify the quantities of diluents added to the oil to
meet the pipelines density and viscosity specifications during transport to
refineries [175]. The diluent is sometimes recovered and recycled at the re-
finery for later use at great expense.
Asphaltene rejection is carried out using one or more of: solvent deasphalt-
ing, emulsion extraction [190, 191], ultrafiltration [192], selective oxidation
of heteroatoms, carbon rejection and most commonly selective adsorption
[193]. Asphaltene rejection methods are less specific and often aim to convert
asphaltenes into coke and other fuel sources [175].
Asphaltene Deposition
Asphaltenes comprise a range of individual molecules (with molar masses
~500 g/mol) of varying and unknown compositions often defined by a solu-
bility group and characterised using its bulk properties. Asphaltenes often
appear black / brown [194] and are generally comprised of a pericondensed
polyaromatic backbone with alkyl linkages, paraffinic rings and aliphatic
side chains with nitrogen, oxygen and sulphur heteroatoms. The heteroa-
toms form a range of functional groups, of which the most common are given
in Table 6 [195, 196]. Recent ion cyclotron resonance mass spectrometry
studies have confirmed asphaltenes follow the island model / configuration
in which a polyaromatic core is surrounded with pendant-like alkyl groups
[197, 198].
Table 6: Asphaltene heteroatom’s common functional groups
Asphaltenes exist as a distribution of self-assembled nanoaggregates. Aggre-
gation varies based on the asphaltene concentration [199, 200], solvent
power of the oil matrix / suspending solution [201], temperature and pres-
sure [202, 203] and the presence of resins [204]. The Yen-Mullins model in-
dicates that nanoaggregates further combine to form aggregates (clusters or
Heteroatom N O S
Functional Groups
Pyridine Hydroxyl Sulfoxide
Quinoline Carboxyl Thiophene
Pyrrolic Carbonyl Sulfidic
143
floccules) that are suspended within the matrix that can precipitate [200].
A small angle neutron scattering (SANS) study by Simon et al. has shown
these clusters to range in size between 3 – 10 nm [205], whilst other work
by Mullins et al. has shown nanoaggregate clusters to be closer to 5 nm in
size [200, 206]. Gray et al. have described the nanoaggregates formed by the
asphaltene molecules to follow supramolecular assemblies rather than the
typical micelle assemblies; a direct consequence of the variety of functional
groups that the heteroatoms can form [207]. Gray et al. continue to discuss
that the asphaltene intramolecular forces are a combination of hydrogen
bonding, acid-base interactions, coordination complexes, Van de Waals and
π-π stacking. Whilst these forces are individually weak, supramolecular
chemistry suggests that together they combine to provide strong interac-
tions. It is these forces that cause asphaltene molecule agglomeration that
are thought to feature in asphaltene-surface interactions, and hence deposi-
tion.
Whilst asphaltene deposition is an undesirable phenomenon throughout the
processing chain, understanding asphaltene-surface interactions will help to
both partially upgrade the oil product by selective removal of asphaltenes
that may precipitate and cause depositions (rejection) as well as manage
additives and conditions under which depositions may occur (conversion).
Asphaltene deposition is a complex process that is affected by many varia-
bles; this has resulted in large inconsistencies within the literature [175, 208]
and makes understanding the fundamental processes difficult. Some of the
key variables that affect asphaltene deposition are discussed in this section;
however, for an exhaustive review, the reader is directed to [175].
Suspending Solvent
Most asphaltene deposition work in the literature is carried out using model
oil (C5-C7), precipitated asphaltenes (from a range of sources) and employs
various sorbing surfaces including glass, rock, metals, metal oxides, polymers
and many more. The source and concentration of the asphaltenes used in
each investigation affect its aggregation and hence deposition properties;
making a direct comparison between studies difficult. Equally the model oil
/ solvent used in many investigations to suspend the asphaltenes also has a
144
significant effect on the deposition characteristics, for example strong sol-
vents such as nitrobenzene cause ionization allowing ion exchange mecha-
nisms to dominate [209], whilst weak solvents allow increased asphaltene
molecule aggregation and hence more successful deposition [208, 210, 211].
Asphaltene Molecules
The physical properties and characteristics of the asphaltene molecules vary
considerably depending on their source. Many current studies isolate asphal-
tene from a range of sources including crude (conventional and heavy), shale
oil, residua, processed and cracked oil. The size and physical characteristics
of the asphaltene molecules govern how they form nanoaggregates and sub-
sequently aggregates [184], which has a direct impact on how strongly they
are able to interact with the surface as well as its diffusion rates in solution
[199].
SARA Composition
As discussed in Section 4.2.1, crude oil is made up of several fractions in-
cluding saturates, aromatics, asphaltenes and resins; each fraction has dif-
ferent chemical and physical properties and affects asphaltene deposition in
a variety of ways. Aromatics and saturates have been shown not to affect
the asphaltene deposition as they do not adsorb and therefore compete for
active sites, resins have however shown to have varying effects on asphaltene
deposition [212]. Studies within the literature indicate that the smaller sized
resins molecules are able to diffuse through the bulk of the suspending solu-
tion to the sorbent sites more quickly than the asphaltenes; however, the
asphaltene-asphaltene interactions prove more significant and displace the
resins on the sorbent surface [208, 213, 214]. A QCM study by Ekholm et
al. [213], has shown the addition of resins to a model oil increased the thick-
ness of the deposited layer compared to asphaltenes alone, this was thought
to be the result of either intercalation of resins within the asphaltene aggre-
gates or the termination of aromatic asphaltenes reorganisation into com-
pact layers by the resins [215]. Another study by Castillo et al. which showed
indefinite asphaltene growth proved that the addition of resins disrupted
and limited the growth of the deposition [216]. Adams [175] has suggested
145
that the limitation on asphaltene deposition growth as a result of resin in-
teraction supports the supramolecular aggregate model put forward by Gray
et al. [207].
Water
The hydrogen bonding between asphaltene molecules and subsequently their
aggregates has also been shown to be affected in the presence of water [217].
As before, with the molecule aggregation affected, the asphaltene-surface
interactions are also been shown to be affected by the presence of water
[218]. A study by Jeon et al. has postulated that the presence of water does
not only reduce deposition through its effect on asphaltene aggregation but
also because the water molecules actively compete for surface adsorption
sites [219]. The presence of water has also shown to corrode pipelines and
other processing equipment, leaving behind metal oxide surfaces [181, 219].
A study by Nalwaya et al. has shown that the presence of metal compounds
to has a dramatic effect on the solution’s polarity, and resulted in elevated
asphaltene precipitation and deposition [220].
Temperature
Pierre et al. have shown asphaltene aggregates to decrease in size with in-
creasing model oil suspension’s temperature; relating to weaker asphaltene-
surface interactions and hence reduced depositions [203, 221]. However, a
study by Xing et al. has shown that this reduced deposition only occurs
when investigating short reaction times [222]. However, industrial patent
applications that focus on oil feedstocks (rather than asphaltene-model oil
suspensions) have reported increased deposition (on a range of different me-
dia) at higher temperatures (≥ 200 OC) [223-225]. This phenomenon is
thought to occur as model oil solutions with dissolved asphaltenes in sol-
vents are designed to study asphaltene behaviour in controlled environ-
ments; however, these studies do not explore the harsh realities under which
the industry must operate. Industrial applications study asphaltene deposi-
tion in viscous crudes and heavy oil vacuum residue and must apply heat
to reduce the viscosity of the heavy oils.
146
Enhanced deposition may be seen at elevated temperatures in feedstock oil
as the viscosity decreases, increasing diffusion rates of the asphaltenes within
the oil, as well as releasing aggregates from the association and thus expos-
ing more active sites. This phenomenon results in the formation of small
aggregates which are able to move through the oil and interact with the
surface [175].
The variation in the literature indicates that there is no current conclusive
method by which to understand fouling characteristics of an incoming heavy
crude oil feedstock. Whether the user is interested in using selective adsorp-
tion (or other rejection techniques) or a method of conversion such as the
implementation of anti-foulant chemicals, an industry standard technique
to understand the conditions that govern asphaltene deposition under con-
ditions akin to those used in industry does not exist.
Nalco Co. is a world leader in asphaltene conversion and anti-fouling chem-
ical manufacture [226-228]. As part of their investigations, they have devel-
oped a range of large volume experiments to study the asphaltene deposition
of a particular heavy crude oil feedstock. The patent literature and input
from their R&D scientists indicate that their ex-situ analysis takes roughly
30 days before feeding back to the field on how to proceed with handling
and processing of the new feedstock [229].
High volume, time-intensive studies for each new oil well is an impractical
solution to understanding the asphaltene precipitation characteristics of a
given heavy crude feedstock. The following sections discuss the development
of an in-situ BAW resonator process for the elucidation of the asphaltene
deposition characteristics of an incoming feedstock in a low volume, non-
time intensive study. The proposed device will provide the user with a pro-
cess by which to change and understand conditions (temperature and pres-
sure) either to replicate those along the production chain (conversion) or to
promote precipitation for partial upgrading (rejection) for specific feedstock
oil using low volume and non-time intensive studies.
147
4.2.4 Microbalance Application
The application of a BAW microbalance as an in-situ oil fouling sensor is of
much interest to both industry and academia. It should be noted here that
the previously used quartz crystal microbalance in Chapter 3 is not useful
for this application as will be discussed in Section 4.4.1 as the oil tempera-
tures for this application can be higher than the critical twinning tempera-
ture of quartz and thus a high temperature alternative microbalance had to
be identified.
Microbalances are very versatile in their operation, and consequently piezo-
electric materials that can operate stably and consistently at high tempera-
ture are extremely desirable. For this reason, much research has and con-
tinues to be done in developing next generation piezoelectric materials that
can successfully satisfy the high-temperature application need. Some of these
are discussed below [230, 231].
High-Temperature BAW Resonators
Lithium Tetraborate (Li2B4O7)
Li2B4O7 is a pyroelectric material, i.e. it produces an electrical potential when
exposed to changing temperatures. Specific cut angles are useful as piezoe-
lectric devices; however, pyroelectric properties combined with low ionic
conductivity limit the frequency range at high temperatures. However, some
studies have shown at particular cut angles, the resonator can achieve zero
temperature coefficients making Li2B4O7 useful for mass monitoring in vari-
able temperature conditions. Further studies have shown that lithium tetra-
borate undergoes a phase transition around 500 OC, affecting its ferroelectric
properties and limiting its use as a high-temperature sensor [230].
Aluminium Nitride (AlN)
Although AlN is able to operate at temperatures up to 1150 OC, it has poor
oxidation resistance and impurities drastically reduces the resonator’s relia-
bility at high temperature [232].
148
Langasite (La3Ga5SiO14) (LGS)
LGS has proven stable oscillation up to 1400 oC, with reliable results rec-
orded up to 1000 OC. LGS is very similar in structure to quartz; however, it
does not seem to undergo a phase transition at elevated temperatures and
has previously been used in a range of high-temperature resonator investi-
gations [230, 233, 234].
Gallium Orthophosphate (GaPO4)
Gallium orthophosphate has a Curie temperature of 970 OC and has been
successfully implemented as an in-situ mass monitoring device for solid oxide
fuel cell coking studies at ≥ 700 OC [137, 138].
Both the gallium orthophosphate and LGS share similar upper operating
temperatures, 970 OC and 1000 OC, respectively. However, Fritze et al. [233]
demonstrated through crystal impedance spectroscopy that the GaPO4 mi-
crobalance dissipates significantly less energy than the LGS, hence improv-
ing its Q-factor (Section 2.3.2). Consequently, when developing the LGS
crystals, operators must employ doping techniques to reduce energy losses
at high temperatures. The choice of microbalance for this investigation is
further discussed in Section 4.3.2.
Electrode Iron Deposition
To develop a microbalance for use as an in-situ fouling sensor, the GCM
electrode in contact with the heavy crude oil requires a representative sur-
face. This will allow the resonator to detect similar (if not more) levels of
asphaltene deposition, as would be expected within the pipeline or refinery
equipment, allowing the GCM to act as a pseudo fouling analyser / early
warning sensor. Therefore a rigid iron layer was to be deposited onto the
electrode surface; this can be done through a variety of methods including,
but not limited to, electrodeposition or sputtering.
Whilst much of the equipment and pipelines involved in the oil refining
industry are typically made from carbon steel, iron deposition is somewhat
more convenient; yet still provides an accurate in-situ representation of the
fouling processes occurring at the surface. Iron provides a large amount of
149
flexibility; it can be deposited as a hard and brittle metal which can become
soft and malleable by heat treating. Similarly, iron can be deposited as a
soft and ductile metal which can be hardened through the use of carburizing,
cyaniding and nitriding. Kepple et al. have shown the fatigue strength of
surfaces prepared by case hardening electrodeposited iron is equal to the
best commercial rolling element bearing materials [235]. Like typical ‘refin-
ery iron’, electrodeposited iron can be welded or plated by other materials
and due to its high purity shows reasonable corrosion resistance (as would
be expected from carbon steel).
Iron Electrodeposition
Iron plating by electrodeposition represents a mature process with applica-
tions dating as far back as the First World War; including electrotype pro-
duction in Russia and weapon rebuilding in Germany for example [236, 237].
The process of iron electrodeposition can be carried out using a range of
electrode configurations, plating baths (such as ferrous sulphate and ferrous
chloride baths), as well as operating conditions. There is significant yet con-
flicting information available in the literature regarding the electrodeposi-
tion technique and theory, but a typical methodology and setup is described
here.
In a typical 3-electrode setup, the object of interest (to be plated) is con-
nected to a potentiostat and held as the working electrode within an elec-
trolyte such as iron(II) sulphate at a constant pH and temperature along
with a reference and counter electrode, as shown in Figure 64. The counter
electrode allows the bath to be held at a specific potential whilst the refer-
ence electrode provides control over the electrodes potential. If a BAW res-
onator such as the QCM is applied as the working electrode within this
system, the in-situ mass monitoring of the electrodeposition is made possible
as the QCM operates as an electrochemical QCM (eQCM) as discussed in
Section 2.7. The operation of the eQCM allows a secondary measure to de-
termine the efficiency of the electrochemical deposition process as discussed
in Section 4.3.3.
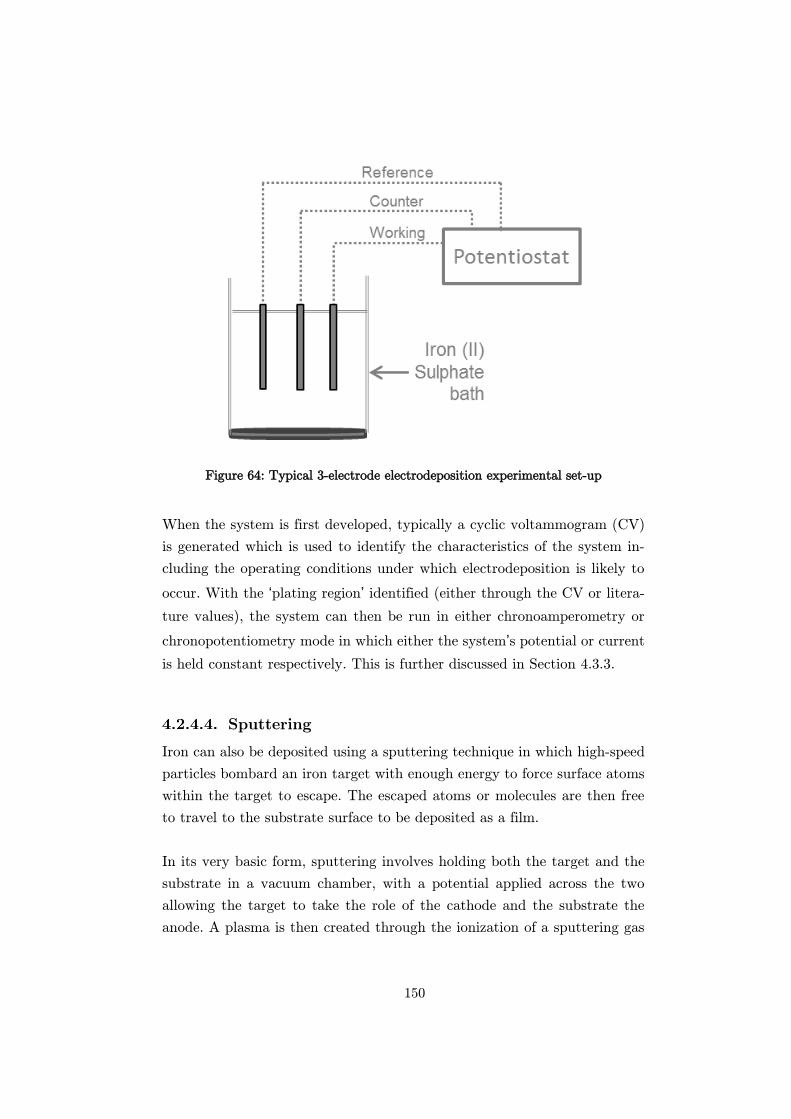
150
Figure 64: Typical 3-electrode electrodeposition experimental set-up
When the system is first developed, typically a cyclic voltammogram (CV)
is generated which is used to identify the characteristics of the system in-
cluding the operating conditions under which electrodeposition is likely to
occur. With the ‘plating region’ identified (either through the CV or litera-
ture values), the system can then be run in either chronoamperometry or
chronopotentiometry mode in which either the system’s potential or current
is held constant respectively. This is further discussed in Section 4.3.3.
Sputtering
Iron can also be deposited using a sputtering technique in which high-speed
particles bombard an iron target with enough energy to force surface atoms
within the target to escape. The escaped atoms or molecules are then free
to travel to the substrate surface to be deposited as a film.
In its very basic form, sputtering involves holding both the target and the
substrate in a vacuum chamber, with a potential applied across the two
allowing the target to take the role of the cathode and the substrate the
anode. A plasma is then created through the ionization of a sputtering gas

151
such as argon, which is used to bombard the target allowing iron atoms to
be released and form a film on the substrate surface.
The technique of sputtering iron is well documented within the literature,
with methods to improve layering as well as ideal operating conditions dis-
cussed by several authors [238-240].
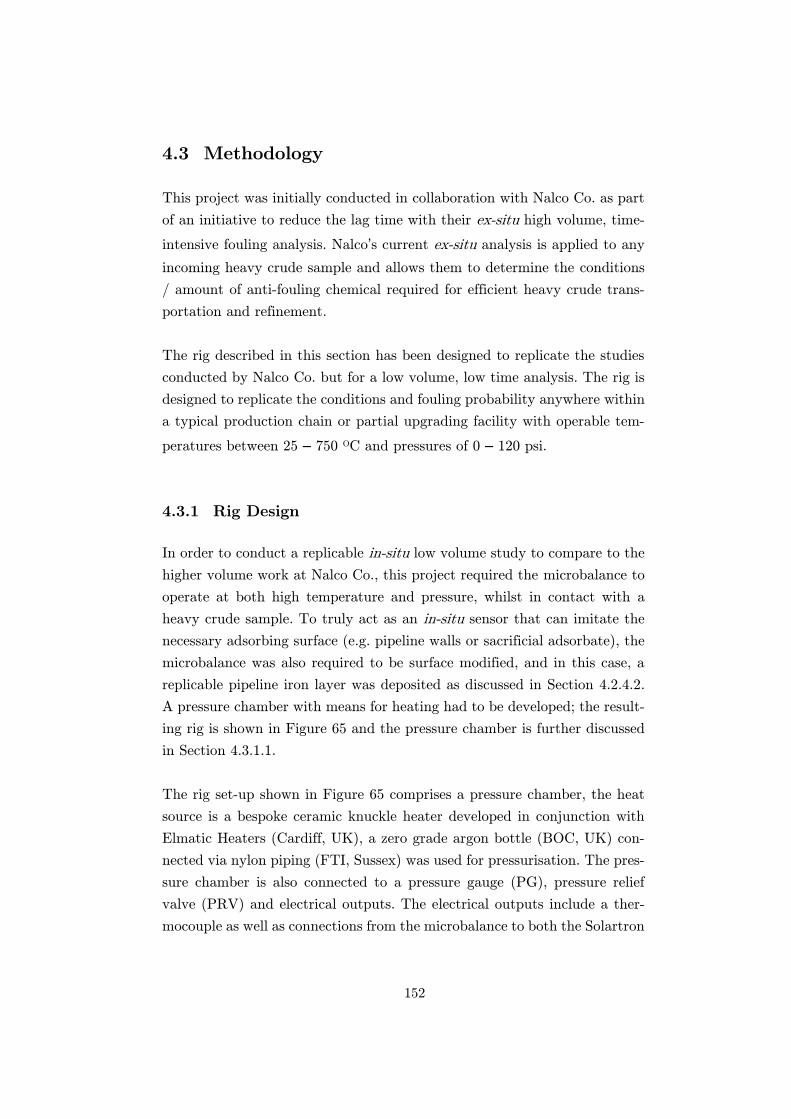
152
4.3 Methodology
This project was initially conducted in collaboration with Nalco Co. as part
of an initiative to reduce the lag time with their ex-situ high volume, time-
intensive fouling analysis. Nalco’s current ex-situ analysis is applied to any
incoming heavy crude sample and allows them to determine the conditions
/ amount of anti-fouling chemical required for efficient heavy crude trans-
portation and refinement.
The rig described in this section has been designed to replicate the studies
conducted by Nalco Co. but for a low volume, low time analysis. The rig is
designed to replicate the conditions and fouling probability anywhere within
a typical production chain or partial upgrading facility with operable tem-
peratures between 25 – 750 OC and pressures of 0 – 120 psi.
4.3.1 Rig Design
In order to conduct a replicable in-situ low volume study to compare to the
higher volume work at Nalco Co., this project required the microbalance to
operate at both high temperature and pressure, whilst in contact with a
heavy crude sample. To truly act as an in-situ sensor that can imitate the
necessary adsorbing surface (e.g. pipeline walls or sacrificial adsorbate), the
microbalance was also required to be surface modified, and in this case, a
replicable pipeline iron layer was deposited as discussed in Section 4.2.4.2.
A pressure chamber with means for heating had to be developed; the result-
ing rig is shown in Figure 65 and the pressure chamber is further discussed
in Section 4.3.1.1.
The rig set-up shown in Figure 65 comprises a pressure chamber, the heat
source is a bespoke ceramic knuckle heater developed in conjunction with
Elmatic Heaters (Cardiff, UK), a zero grade argon bottle (BOC, UK) con-
nected via nylon piping (FTI, Sussex) was used for pressurisation. The pres-
sure chamber is also connected to a pressure gauge (PG), pressure relief
valve (PRV) and electrical outputs. The electrical outputs include a ther-
mocouple as well as connections from the microbalance to both the Solartron
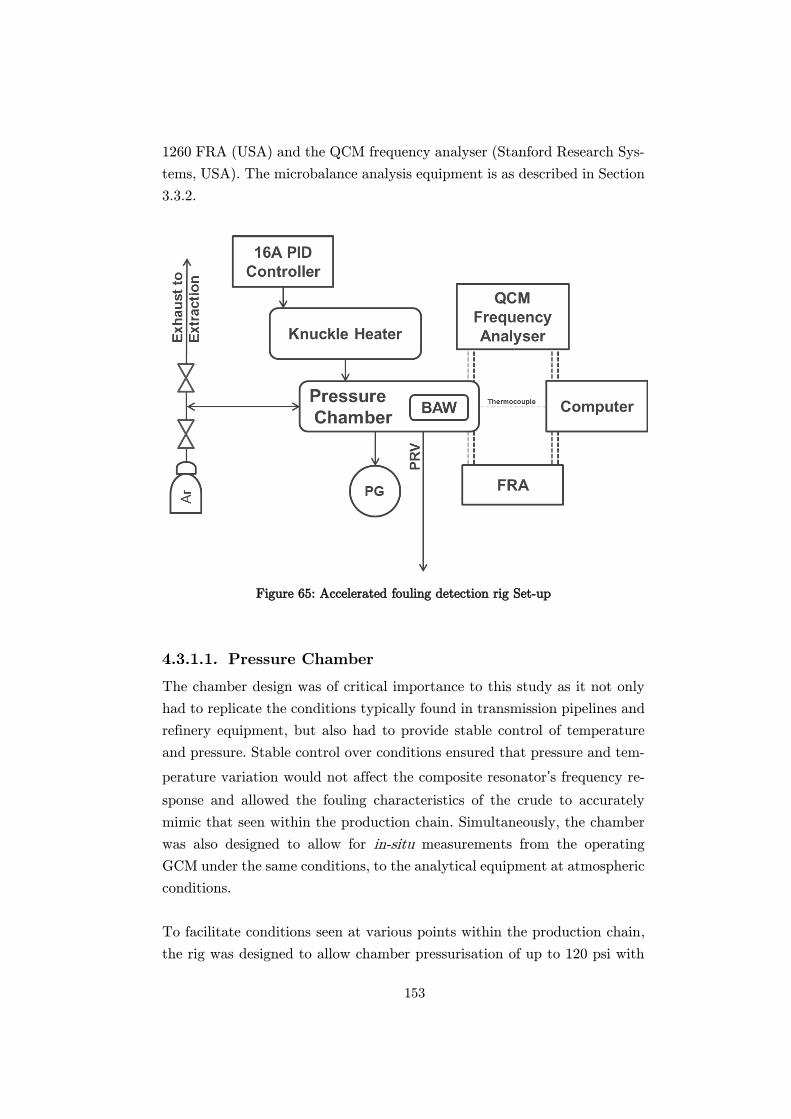
153
1260 FRA (USA) and the QCM frequency analyser (Stanford Research Sys-
tems, USA). The microbalance analysis equipment is as described in Section
3.3.2.
Figure 65: Accelerated fouling detection rig Set-up
Pressure Chamber
The chamber design was of critical importance to this study as it not only
had to replicate the conditions typically found in transmission pipelines and
refinery equipment, but also had to provide stable control of temperature
and pressure. Stable control over conditions ensured that pressure and tem-
perature variation would not affect the composite resonator’s frequency re-
sponse and allowed the fouling characteristics of the crude to accurately
mimic that seen within the production chain. Simultaneously, the chamber
was also designed to allow for in-situ measurements from the operating
GCM under the same conditions, to the analytical equipment at atmospheric
conditions.
To facilitate conditions seen at various points within the production chain,
the rig was designed to allow chamber pressurisation of up to 120 psi with
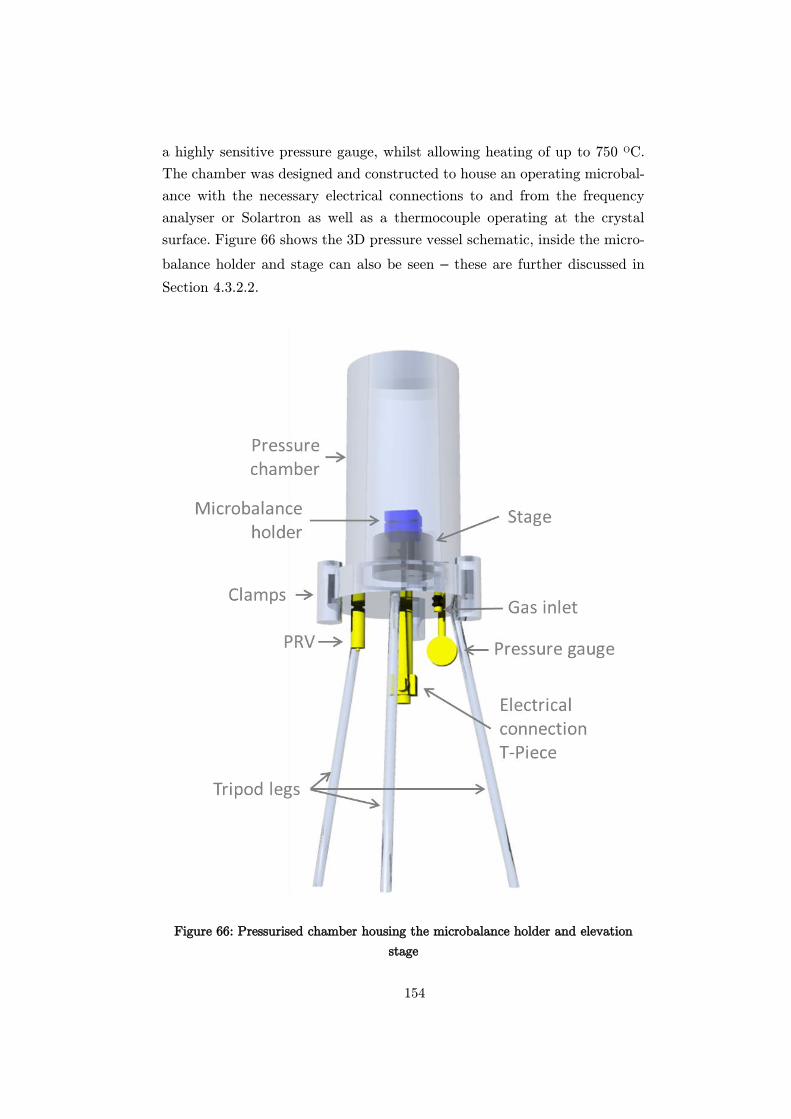
154
a highly sensitive pressure gauge, whilst allowing heating of up to 750 OC.
The chamber was designed and constructed to house an operating microbal-
ance with the necessary electrical connections to and from the frequency
analyser or Solartron as well as a thermocouple operating at the crystal
surface. Figure 66 shows the 3D pressure vessel schematic, inside the micro-
balance holder and stage can also be seen – these are further discussed in
Section 4.3.2.2.
Figure 66: Pressurised chamber housing the microbalance holder and elevation
stage
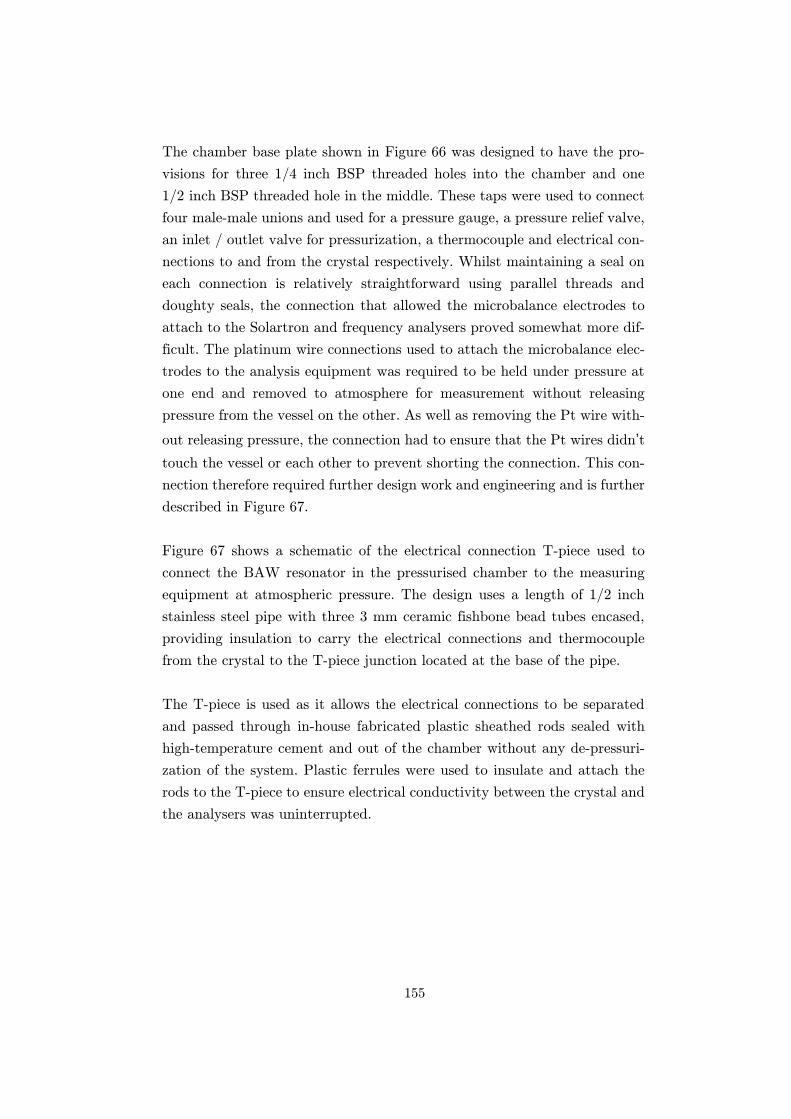
155
The chamber base plate shown in Figure 66 was designed to have the pro-
visions for three 1/4 inch BSP threaded holes into the chamber and one
1/2 inch BSP threaded hole in the middle. These taps were used to connect
four male-male unions and used for a pressure gauge, a pressure relief valve,
an inlet / outlet valve for pressurization, a thermocouple and electrical con-
nections to and from the crystal respectively. Whilst maintaining a seal on
each connection is relatively straightforward using parallel threads and
doughty seals, the connection that allowed the microbalance electrodes to
attach to the Solartron and frequency analysers proved somewhat more dif-
ficult. The platinum wire connections used to attach the microbalance elec-
trodes to the analysis equipment was required to be held under pressure at
one end and removed to atmosphere for measurement without releasing
pressure from the vessel on the other. As well as removing the Pt wire with-
out releasing pressure, the connection had to ensure that the Pt wires didn’t
touch the vessel or each other to prevent shorting the connection. This con-
nection therefore required further design work and engineering and is further
described in Figure 67.
Figure 67 shows a schematic of the electrical connection T-piece used to
connect the BAW resonator in the pressurised chamber to the measuring
equipment at atmospheric pressure. The design uses a length of 1/2 inch
stainless steel pipe with three 3 mm ceramic fishbone bead tubes encased,
providing insulation to carry the electrical connections and thermocouple
from the crystal to the T-piece junction located at the base of the pipe.
The T-piece is used as it allows the electrical connections to be separated
and passed through in-house fabricated plastic sheathed rods sealed with
high-temperature cement and out of the chamber without any de-pressuri-
zation of the system. Plastic ferrules were used to insulate and attach the
rods to the T-piece to ensure electrical conductivity between the crystal and
the analysers was uninterrupted.
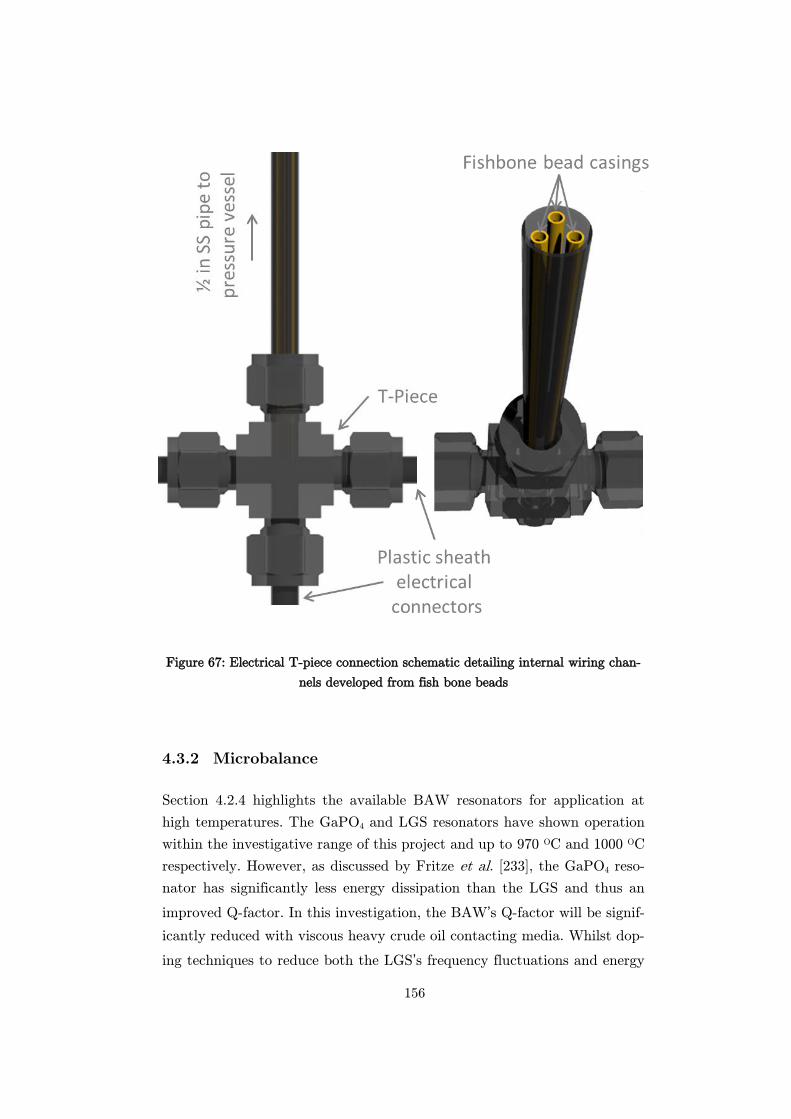
156
Figure 67: Electrical T-piece connection schematic detailing internal wiring chan-
nels developed from fish bone beads
4.3.2 Microbalance
Section 4.2.4 highlights the available BAW resonators for application at
high temperatures. The GaPO4 and LGS resonators have shown operation
within the investigative range of this project and up to 970 OC and 1000 OC
respectively. However, as discussed by Fritze et al. [233], the GaPO4 reso-
nator has significantly less energy dissipation than the LGS and thus an
improved Q-factor. In this investigation, the BAW’s Q-factor will be signif-
icantly reduced with viscous heavy crude oil contacting media. Whilst dop-
ing techniques to reduce both the LGS’s frequency fluctuations and energy
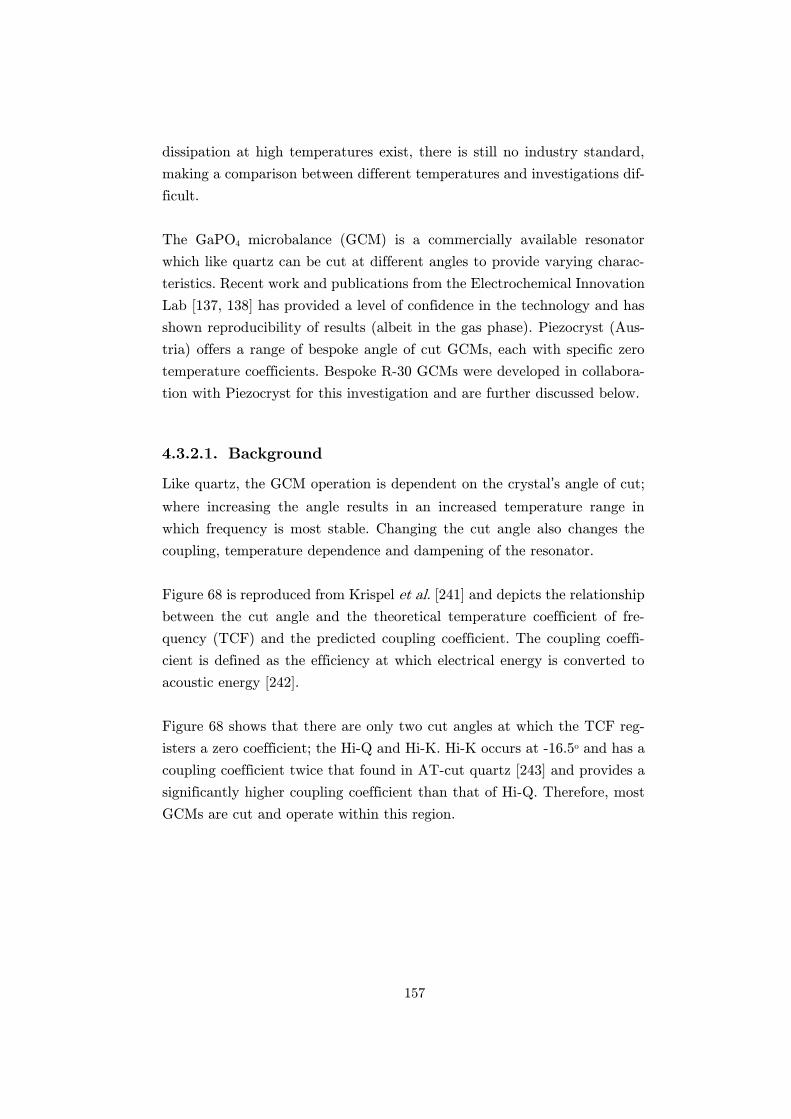
157
dissipation at high temperatures exist, there is still no industry standard,
making a comparison between different temperatures and investigations dif-
ficult.
The GaPO4 microbalance (GCM) is a commercially available resonator
which like quartz can be cut at different angles to provide varying charac-
teristics. Recent work and publications from the Electrochemical Innovation
Lab [137, 138] has provided a level of confidence in the technology and has
shown reproducibility of results (albeit in the gas phase). Piezocryst (Aus-
tria) offers a range of bespoke angle of cut GCMs, each with specific zero
temperature coefficients. Bespoke R-30 GCMs were developed in collabora-
tion with Piezocryst for this investigation and are further discussed below.
Background
Like quartz, the GCM operation is dependent on the crystal’s angle of cut;
where increasing the angle results in an increased temperature range in
which frequency is most stable. Changing the cut angle also changes the
coupling, temperature dependence and dampening of the resonator.
Figure 68 is reproduced from Krispel et al. [241] and depicts the relationship
between the cut angle and the theoretical temperature coefficient of fre-
quency (TCF) and the predicted coupling coefficient. The coupling coeffi-
cient is defined as the efficiency at which electrical energy is converted to
acoustic energy [242].
Figure 68 shows that there are only two cut angles at which the TCF reg-
isters a zero coefficient; the Hi-Q and Hi-K. Hi-K occurs at -16.5o and has a
coupling coefficient twice that found in AT-cut quartz [243] and provides a
significantly higher coupling coefficient than that of Hi-Q. Therefore, most
GCMs are cut and operate within this region.
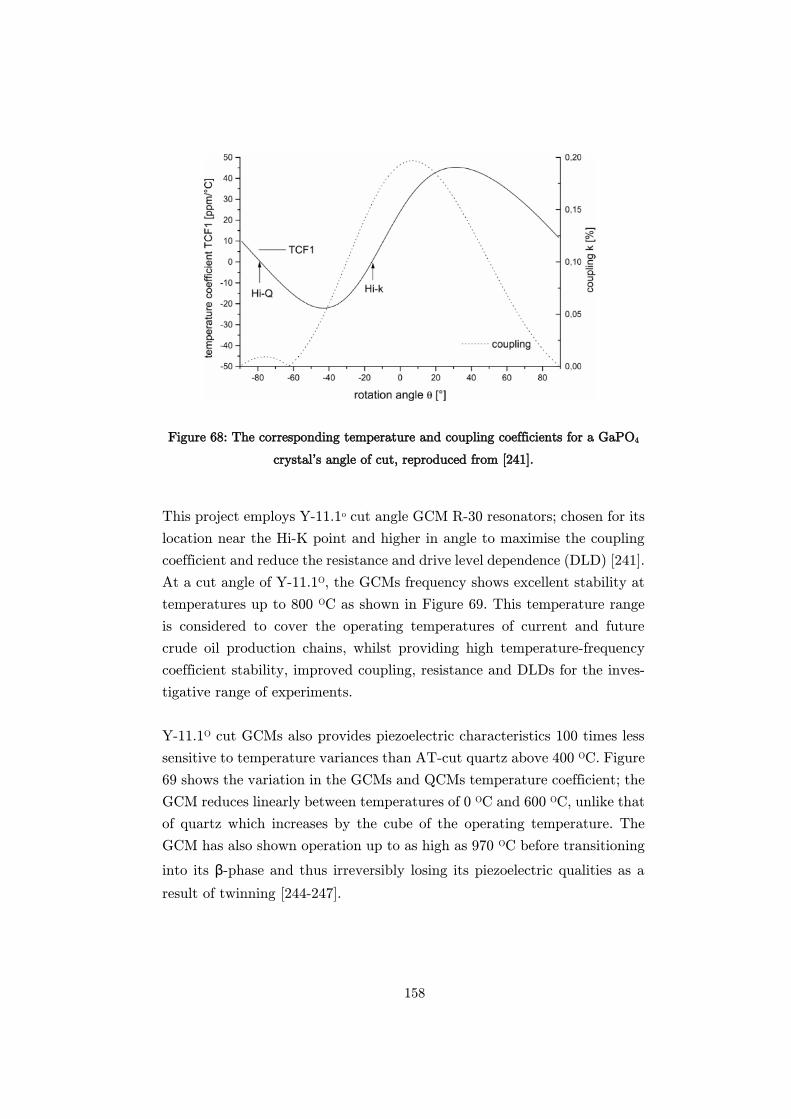
158
Figure 68: The corresponding temperature and coupling coefficients for a GaPO4
crystal’s angle of cut, reproduced from [241].
This project employs Y-11.1o cut angle GCM R-30 resonators; chosen for its
location near the Hi-K point and higher in angle to maximise the coupling
coefficient and reduce the resistance and drive level dependence (DLD) [241].
At a cut angle of Y-11.1O, the GCMs frequency shows excellent stability at
temperatures up to 800 OC as shown in Figure 69. This temperature range
is considered to cover the operating temperatures of current and future
crude oil production chains, whilst providing high temperature-frequency
coefficient stability, improved coupling, resistance and DLDs for the inves-
tigative range of experiments.
Y-11.1O cut GCMs also provides piezoelectric characteristics 100 times less
sensitive to temperature variances than AT-cut quartz above 400 OC. Figure
69 shows the variation in the GCMs and QCMs temperature coefficient; the
GCM reduces linearly between temperatures of 0 OC and 600 OC, unlike that
of quartz which increases by the cube of the operating temperature. The
GCM has also shown operation up to as high as 970 OC before transitioning
into its β-phase and thus irreversibly losing its piezoelectric qualities as a
result of twinning [244-247].
159
Figure 69: Temperature coefficients of GaPO4 at Y-11.1o cut compared to AT-cut
quartz, reproduced from [248].
As with the QCM, the R-30 GCM is developed with an understanding of
energy trapping (Section 2.3.2) and has a convex geometry to produce stable
frequency responses and high Q-factors.
The GCM possesses an electrochemical coupling coefficient k2 four times
that of quartz [249], and combines better damping resistances and low con-
ductivity (10-7 Ω cm-1 at 700 oC) to provide higher operating efficiencies
compared to quartz.
The GCM devices used throughout this investigation are similar to those
employed in Chapter 3 and have a double anchor electrode with a resonant
frequency of 6 MHz and offer 0.4 ng mass monitoring resolution. The elec-
trodes are 200 nm platinum plates attached to the gallium using a 20 nm
titanium adhesive layer. The R-30 microbalances are commercially available
from Piezocryst (Graz, Austria), and are compatible with the industrial
standard holders and analysis equipment.
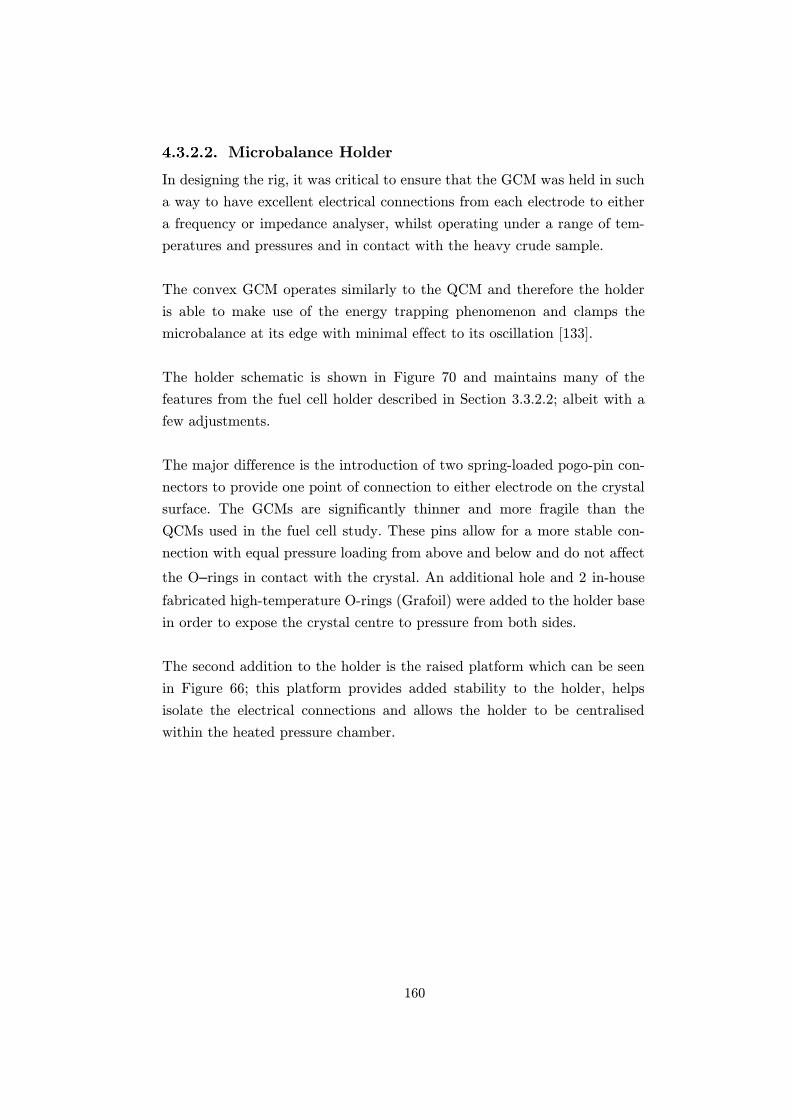
160
Microbalance Holder
In designing the rig, it was critical to ensure that the GCM was held in such
a way to have excellent electrical connections from each electrode to either
a frequency or impedance analyser, whilst operating under a range of tem-
peratures and pressures and in contact with the heavy crude sample.
The convex GCM operates similarly to the QCM and therefore the holder
is able to make use of the energy trapping phenomenon and clamps the
microbalance at its edge with minimal effect to its oscillation [133].
The holder schematic is shown in Figure 70 and maintains many of the
features from the fuel cell holder described in Section 3.3.2.2; albeit with a
few adjustments.
The major difference is the introduction of two spring-loaded pogo-pin con-
nectors to provide one point of connection to either electrode on the crystal
surface. The GCMs are significantly thinner and more fragile than the
QCMs used in the fuel cell study. These pins allow for a more stable con-
nection with equal pressure loading from above and below and do not affect
the O–rings in contact with the crystal. An additional hole and 2 in-house
fabricated high-temperature O-rings (Grafoil) were added to the holder base
in order to expose the crystal centre to pressure from both sides.
The second addition to the holder is the raised platform which can be seen
in Figure 66; this platform provides added stability to the holder, helps
isolate the electrical connections and allows the holder to be centralised
within the heated pressure chamber.
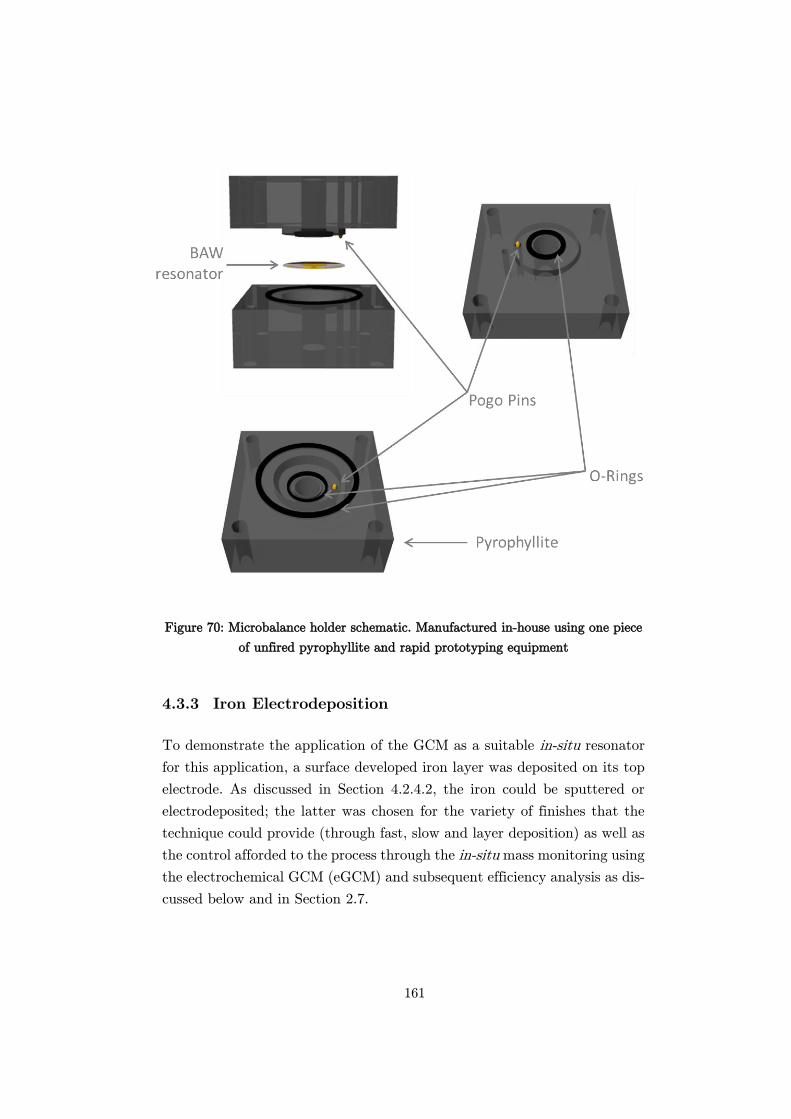
161
Figure 70: Microbalance holder schematic. Manufactured in-house using one piece
of unfired pyrophyllite and rapid prototyping equipment
4.3.3 Iron Electrodeposition
To demonstrate the application of the GCM as a suitable in-situ resonator
for this application, a surface developed iron layer was deposited on its top
electrode. As discussed in Section 4.2.4.2, the iron could be sputtered or
electrodeposited; the latter was chosen for the variety of finishes that the
technique could provide (through fast, slow and layer deposition) as well as
the control afforded to the process through the in-situ mass monitoring using
the electrochemical GCM (eGCM) and subsequent efficiency analysis as dis-
cussed below and in Section 2.7.
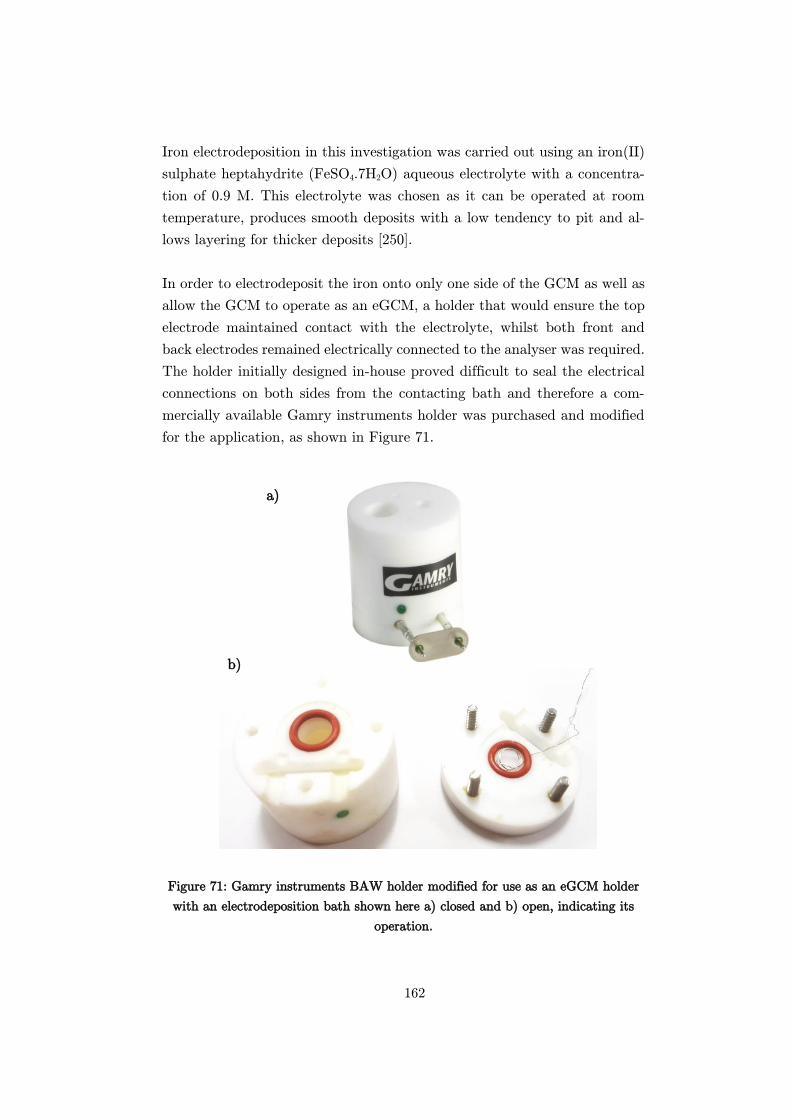
162
Iron electrodeposition in this investigation was carried out using an iron(II)
sulphate heptahydrite (FeSO4.7H2O) aqueous electrolyte with a concentra-
tion of 0.9 M. This electrolyte was chosen as it can be operated at room
temperature, produces smooth deposits with a low tendency to pit and al-
lows layering for thicker deposits [250].
In order to electrodeposit the iron onto only one side of the GCM as well as
allow the GCM to operate as an eGCM, a holder that would ensure the top
electrode maintained contact with the electrolyte, whilst both front and
back electrodes remained electrically connected to the analyser was required.
The holder initially designed in-house proved difficult to seal the electrical
connections on both sides from the contacting bath and therefore a com-
mercially available Gamry instruments holder was purchased and modified
for the application, as shown in Figure 71.
Figure 71: Gamry instruments BAW holder modified for use as an eGCM holder
with an electrodeposition bath shown here a) closed and b) open, indicating its
operation.
a)
b)
163
With the holder modified to allow the GCM to be run as an eGCM during
the electrodeposition process, it was connected to a potentiostat (Gamry,
USA) through a face bias as shown in Figure 72. In this setup, the micro-
balance is operated with one electrode in the iron sulphate bath, and one
electrode exposed to air.
Figure 72: eGCM electrodeposition bath set up for iron electrodeposition
The system has been set up to allow operation similar to that indicated in
the literature for other plating experiments from iron(II) sulphate baths
albeit with the eGCM replacing the working electrode. The initial setup
employed was constructed as described in the literature [250, 251] with a
0.9M iron(II) sulphate bath at pH 5, 25 OC operating at -50 mA cm-2. How-
ever, the system was also arranged to allow cyclic voltammetry sweeps for
further elucidation of the current window in which iron would be electrode-
posited and removed from the microbalance surface. Several GCMs were
subsequently operated within the bath under slightly varying conditions to
understand the variance of the electrodeposited layer quality; this was sub-
sequently assessed using SEM and EDX as shown in Section 4.4.3. Finally,
the electrodeposited iron GCM (iGCM) was passively operated using CAS
to ensure the mass loading was within the GCM’s operable limits and pro-
vided a composite resonator with a suitable Q-factor range.
164
Equations (27) – (30) were used to determine the optimal time in which to
apply a current for plating a specific mass of iron onto the working electrode.
Firstly, the charge (Q) can be calculated from the applied current (i) and
time (τ) as shown in Equation (27):
𝑄 = 𝑖. 𝜏 (27)
The number of moles of iron transferred for a given charge is calculated
using the relationship with the Faraday constant (F) as indicated in Equa-
tion (28).
𝑚𝑜𝑙𝑒𝑠 (𝐹𝑒) =
𝑄𝐹
2
⁄
(28)
The mass deposited onto the working electrode (m) and the subsequent
layer thickness (tFe) can be determined using the density (ρ) and Equations
(29) and (30).
𝑚 (𝐹𝑒) = 𝑚𝑜𝑙 (𝐹𝑒) × 𝑀𝑜𝑙𝑎𝑟 𝑚𝑎𝑠𝑠 (29)
𝑡𝐹𝑒 =
𝑚𝜌
𝐴⁄
(30)
The application of the eGCM allowed an in-situ mass deposition to be cal-
culated to determine the deposition efficiency, and true layer thickness as
discussed in Section 4.4.2.
4.3.4 Crude Sample
The heavy crude sample used during this investigation was kindly provided
by the R&D analysis centre at Nalco Co. and is a bituminous vacuum resi-
due from the North Sea.
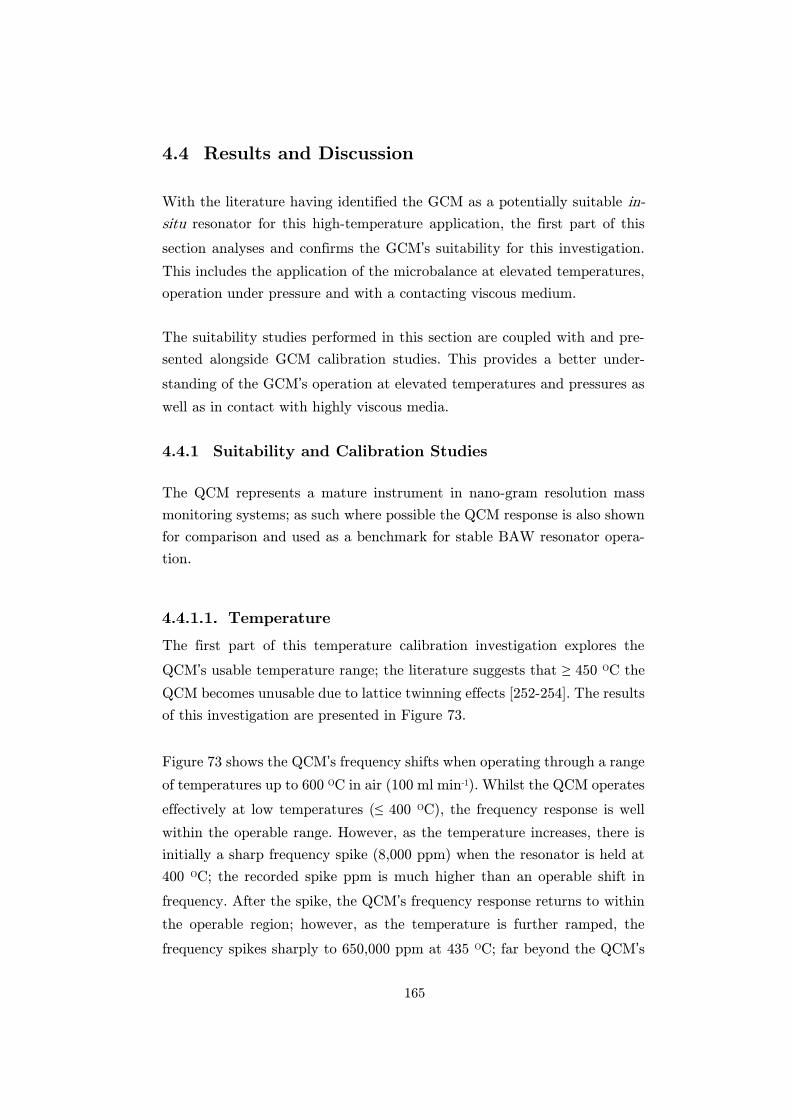
165
4.4 Results and Discussion
With the literature having identified the GCM as a potentially suitable in-
situ resonator for this high-temperature application, the first part of this
section analyses and confirms the GCM’s suitability for this investigation.
This includes the application of the microbalance at elevated temperatures,
operation under pressure and with a contacting viscous medium.
The suitability studies performed in this section are coupled with and pre-
sented alongside GCM calibration studies. This provides a better under-
standing of the GCM’s operation at elevated temperatures and pressures as
well as in contact with highly viscous media.
4.4.1 Suitability and Calibration Studies
The QCM represents a mature instrument in nano-gram resolution mass
monitoring systems; as such where possible the QCM response is also shown
for comparison and used as a benchmark for stable BAW resonator opera-
tion.
Temperature
The first part of this temperature calibration investigation explores the
QCM’s usable temperature range; the literature suggests that ≥ 450 OC the
QCM becomes unusable due to lattice twinning effects [252-254]. The results
of this investigation are presented in Figure 73.
Figure 73 shows the QCM’s frequency shifts when operating through a range
of temperatures up to 600 OC in air (100 ml min-1). Whilst the QCM operates
effectively at low temperatures (≤ 400 OC), the frequency response is well
within the operable range. However, as the temperature increases, there is
initially a sharp frequency spike (8,000 ppm) when the resonator is held at
400 OC; the recorded spike ppm is much higher than an operable shift in
frequency. After the spike, the QCM’s frequency response returns to within
the operable region; however, as the temperature is further ramped, the
frequency spikes sharply to 650,000 ppm at 435 OC; far beyond the QCM’s
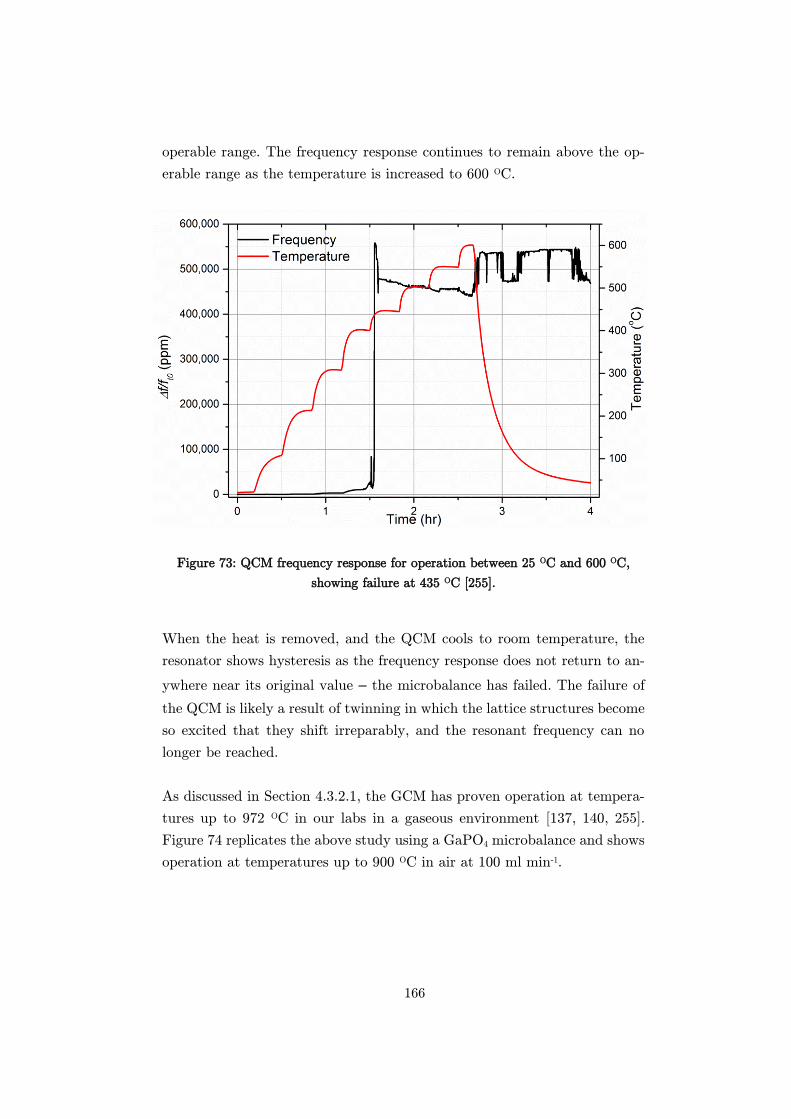
166
operable range. The frequency response continues to remain above the op-
erable range as the temperature is increased to 600 OC.
Figure 73: QCM frequency response for operation between 25 OC and 600 OC,
showing failure at 435 OC [255].
When the heat is removed, and the QCM cools to room temperature, the
resonator shows hysteresis as the frequency response does not return to an-
ywhere near its original value – the microbalance has failed. The failure of
the QCM is likely a result of twinning in which the lattice structures become
so excited that they shift irreparably, and the resonant frequency can no
longer be reached.
As discussed in Section 4.3.2.1, the GCM has proven operation at tempera-
tures up to 972 OC in our labs in a gaseous environment [137, 140, 255].
Figure 74 replicates the above study using a GaPO4 microbalance and shows
operation at temperatures up to 900 OC in air at 100 ml min-1.
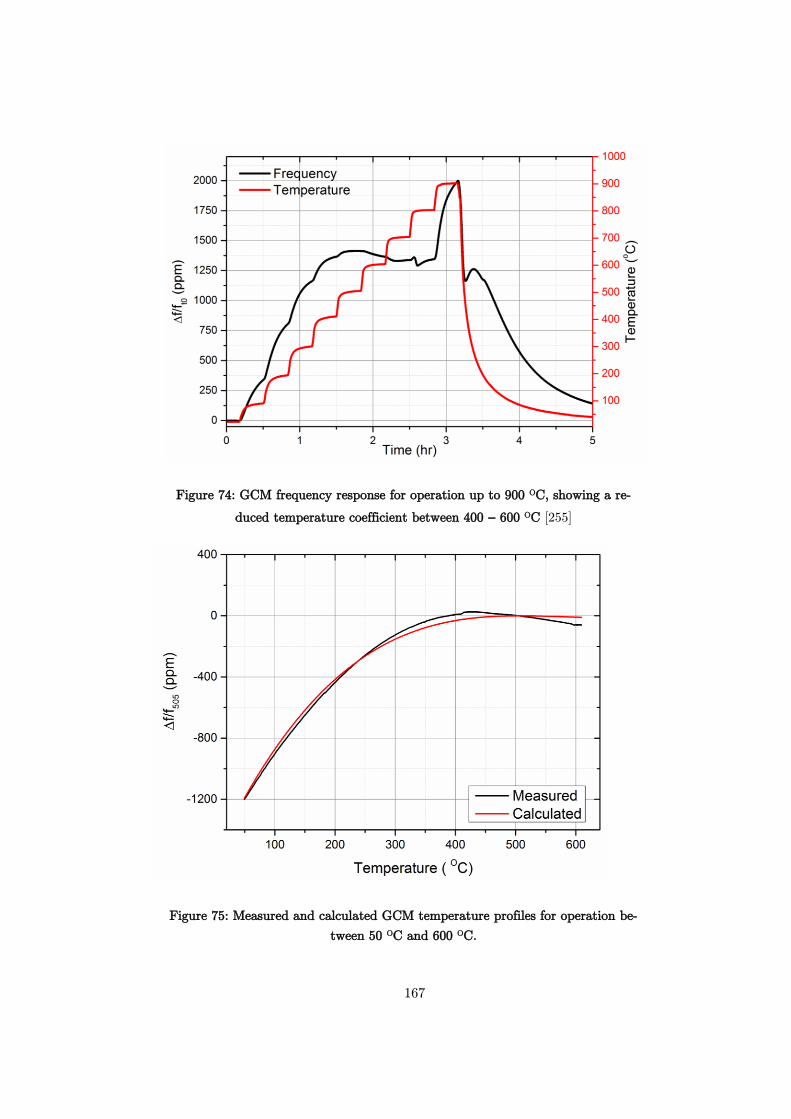
167
Figure 74: GCM frequency response for operation up to 900 OC, showing a re-
duced temperature coefficient between 400 – 600 OC [255]
Figure 75: Measured and calculated GCM temperature profiles for operation be-
tween 50 OC and 600 OC.
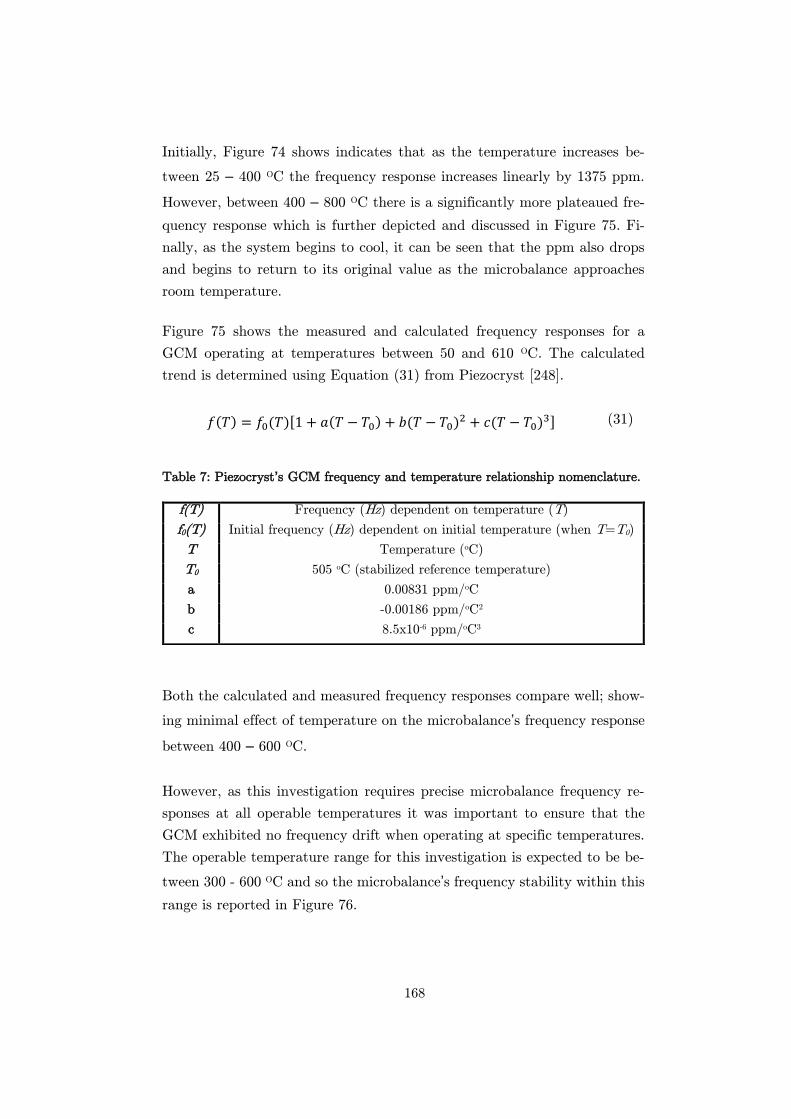
168
Initially, Figure 74 shows indicates that as the temperature increases be-
tween 25 – 400 OC the frequency response increases linearly by 1375 ppm.
However, between 400 – 800 OC there is a significantly more plateaued fre-
quency response which is further depicted and discussed in Figure 75. Fi-
nally, as the system begins to cool, it can be seen that the ppm also drops
and begins to return to its original value as the microbalance approaches
room temperature.
Figure 75 shows the measured and calculated frequency responses for a
GCM operating at temperatures between 50 and 610 OC. The calculated
trend is determined using Equation (31) from Piezocryst [248].
𝑓(𝑇) = 𝑓0(𝑇)[1 + 𝑎(𝑇 − 𝑇0) + 𝑏(𝑇 − 𝑇0)2 + 𝑐(𝑇 − 𝑇0)3] (31)
Table 7: Piezocryst’s GCM frequency and temperature relationship nomenclature.
Both the calculated and measured frequency responses compare well; show-
ing minimal effect of temperature on the microbalance’s frequency response
between 400 – 600 OC.
However, as this investigation requires precise microbalance frequency re-
sponses at all operable temperatures it was important to ensure that the
GCM exhibited no frequency drift when operating at specific temperatures.
The operable temperature range for this investigation is expected to be be-
tween 300 - 600 OC and so the microbalance’s frequency stability within this
range is reported in Figure 76.
f(T) Frequency (Hz) dependent on temperature (T)
f0(T) Initial frequency (Hz) dependent on initial temperature (when T=T0)
T Temperature (oC)
T0 505 oC (stabilized reference temperature)
a 0.00831 ppm/oC
b -0.00186 ppm/oC2
c 8.5x10⁻⁶ ppm/oC3
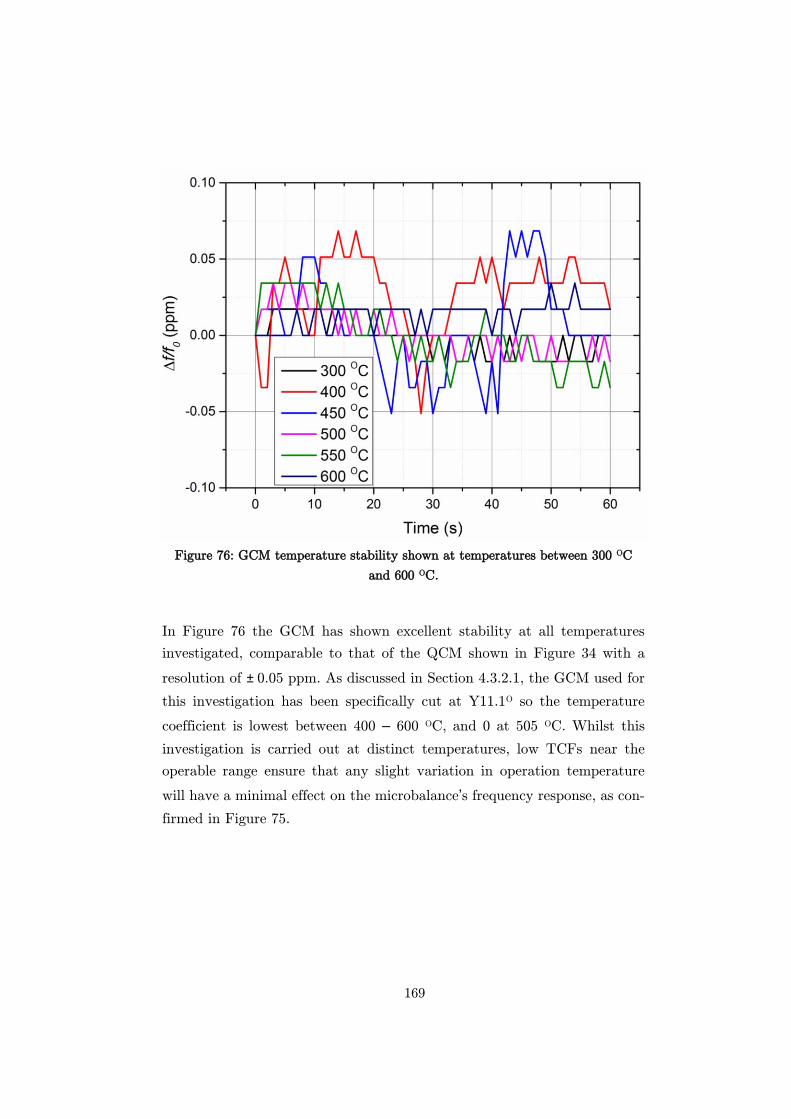
169
Figure 76: GCM temperature stability shown at temperatures between 300 OC
and 600 OC.
In Figure 76 the GCM has shown excellent stability at all temperatures
investigated, comparable to that of the QCM shown in Figure 34 with a
resolution of ± 0.05 ppm. As discussed in Section 4.3.2.1, the GCM used for
this investigation has been specifically cut at Y11.1O so the temperature
coefficient is lowest between 400 – 600 OC, and 0 at 505 OC. Whilst this
investigation is carried out at distinct temperatures, low TCFs near the
operable range ensure that any slight variation in operation temperature
will have a minimal effect on the microbalance’s frequency response, as con-
firmed in Figure 75.
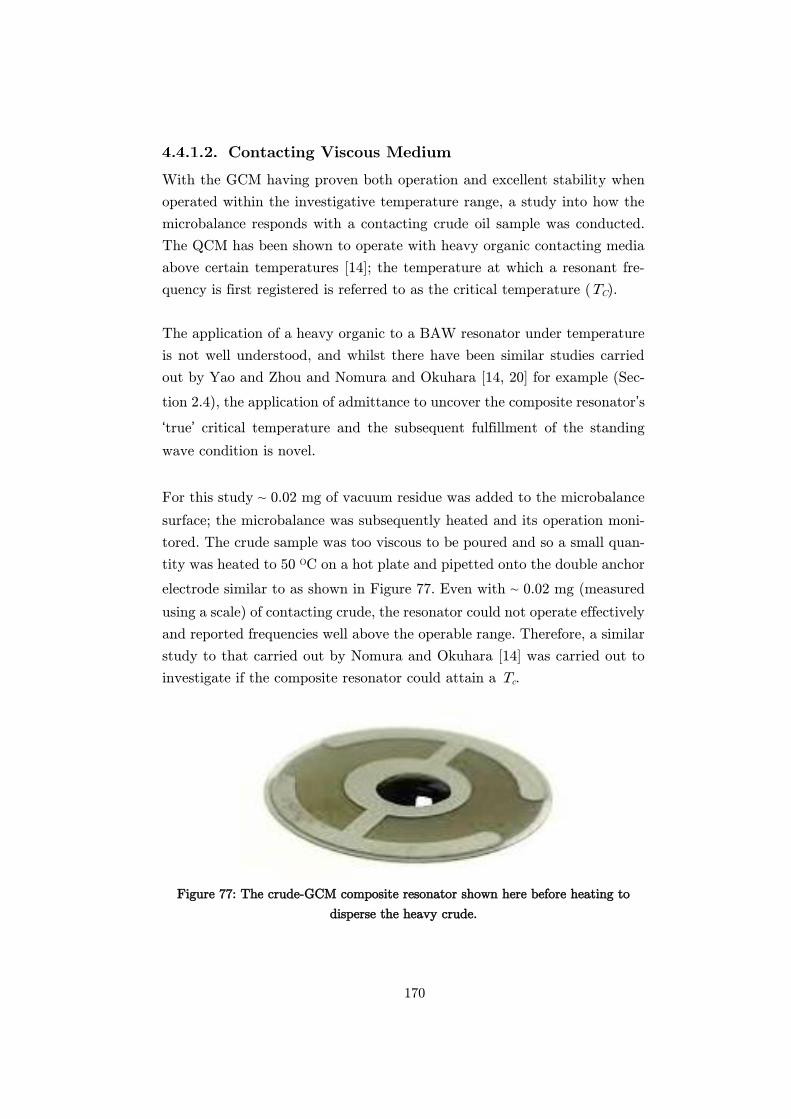
170
Contacting Viscous Medium
With the GCM having proven both operation and excellent stability when
operated within the investigative temperature range, a study into how the
microbalance responds with a contacting crude oil sample was conducted.
The QCM has been shown to operate with heavy organic contacting media
above certain temperatures [14]; the temperature at which a resonant fre-
quency is first registered is referred to as the critical temperature (TC).
The application of a heavy organic to a BAW resonator under temperature
is not well understood, and whilst there have been similar studies carried
out by Yao and Zhou and Nomura and Okuhara [14, 20] for example (Sec-
tion 2.4), the application of admittance to uncover the composite resonator’s
‘true’ critical temperature and the subsequent fulfillment of the standing
wave condition is novel.
For this study ~ 0.02 mg of vacuum residue was added to the microbalance
surface; the microbalance was subsequently heated and its operation moni-
tored. The crude sample was too viscous to be poured and so a small quan-
tity was heated to 50 OC on a hot plate and pipetted onto the double anchor
electrode similar to as shown in Figure 77. Even with ~ 0.02 mg (measured
using a scale) of contacting crude, the resonator could not operate effectively
and reported frequencies well above the operable range. Therefore, a similar
study to that carried out by Nomura and Okuhara [14] was carried out to
investigate if the composite resonator could attain a Tc.
Figure 77: The crude-GCM composite resonator shown here before heating to
disperse the heavy crude.
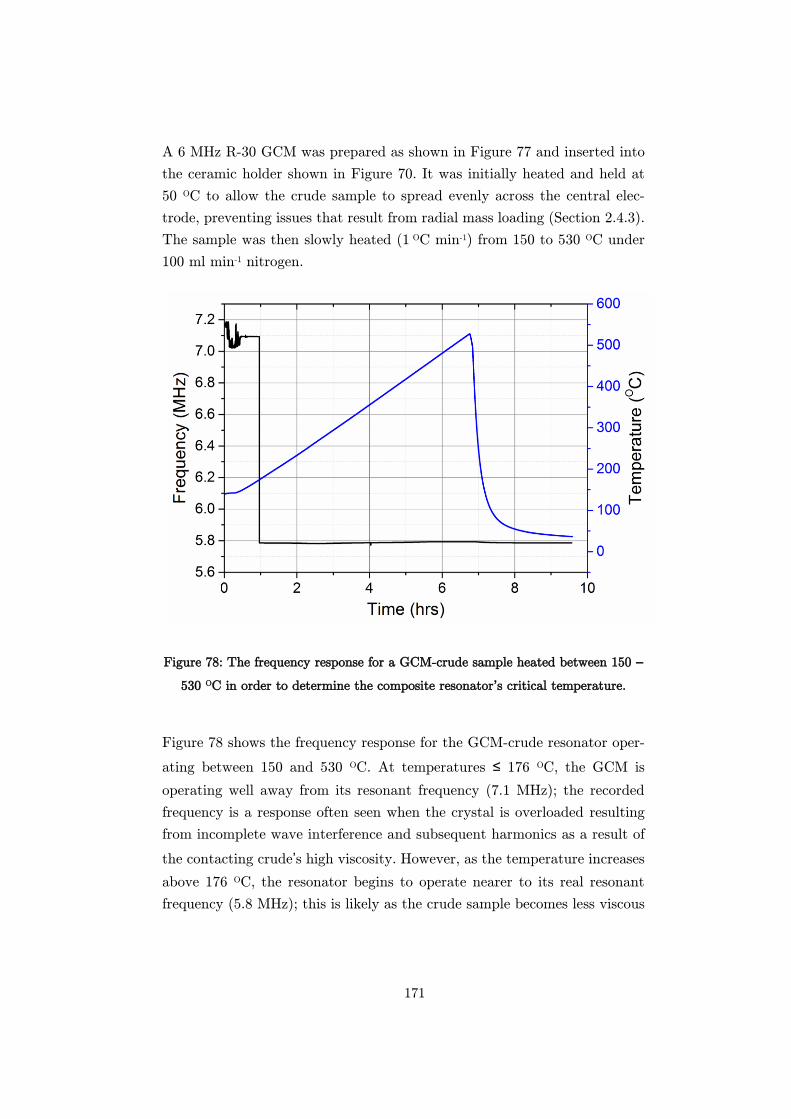
171
A 6 MHz R-30 GCM was prepared as shown in Figure 77 and inserted into
the ceramic holder shown in Figure 70. It was initially heated and held at
50 OC to allow the crude sample to spread evenly across the central elec-
trode, preventing issues that result from radial mass loading (Section 2.4.3).
The sample was then slowly heated (1 OC min-1) from 150 to 530 OC under
100 ml min-1 nitrogen.
Figure 78: The frequency response for a GCM-crude sample heated between 150 –
530 OC in order to determine the composite resonator’s critical temperature.
Figure 78 shows the frequency response for the GCM-crude resonator oper-
ating between 150 and 530 OC. At temperatures ≤ 176 OC, the GCM is
operating well away from its resonant frequency (7.1 MHz); the recorded
frequency is a response often seen when the crystal is overloaded resulting
from incomplete wave interference and subsequent harmonics as a result of
the contacting crude’s high viscosity. However, as the temperature increases
above 176 OC, the resonator begins to operate nearer to its real resonant
frequency (5.8 MHz); this is likely as the crude sample becomes less viscous
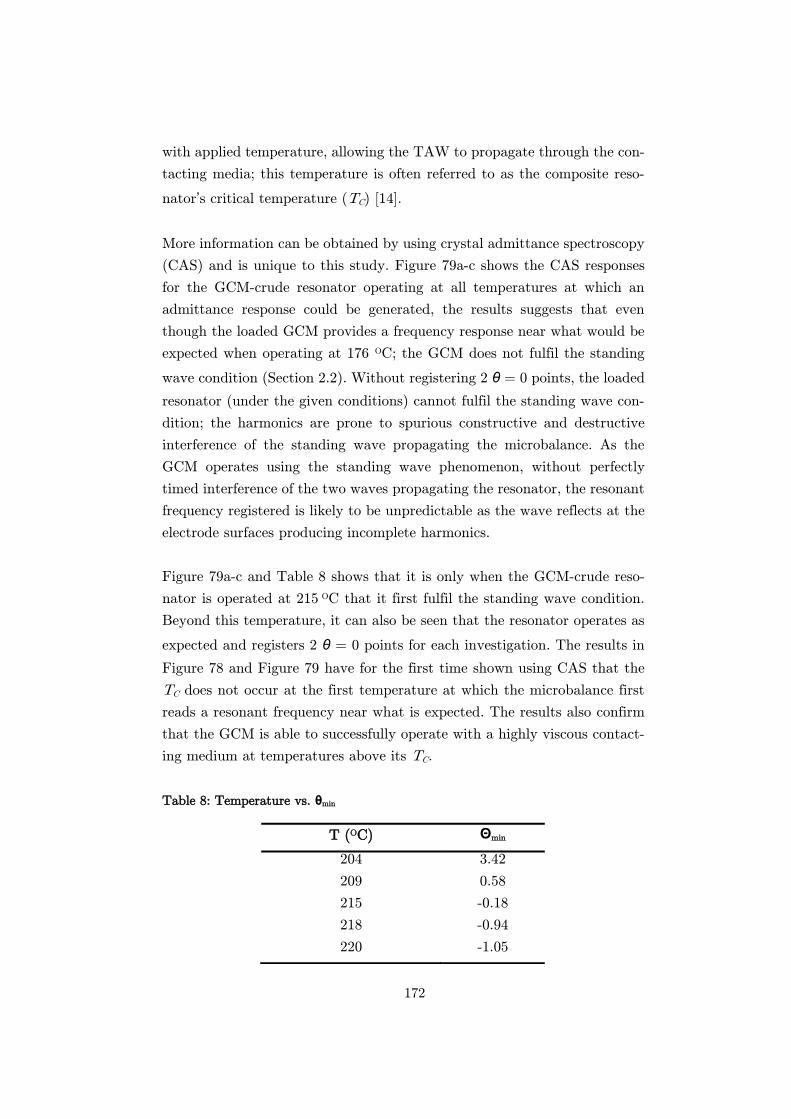
172
with applied temperature, allowing the TAW to propagate through the con-
tacting media; this temperature is often referred to as the composite reso-
nator’s critical temperature (TC) [14].
More information can be obtained by using crystal admittance spectroscopy
(CAS) and is unique to this study. Figure 79a-c shows the CAS responses
for the GCM-crude resonator operating at all temperatures at which an
admittance response could be generated, the results suggests that even
though the loaded GCM provides a frequency response near what would be
expected when operating at 176 OC; the GCM does not fulfil the standing
wave condition (Section 2.2). Without registering 2 θ = 0 points, the loaded
resonator (under the given conditions) cannot fulfil the standing wave con-
dition; the harmonics are prone to spurious constructive and destructive
interference of the standing wave propagating the microbalance. As the
GCM operates using the standing wave phenomenon, without perfectly
timed interference of the two waves propagating the resonator, the resonant
frequency registered is likely to be unpredictable as the wave reflects at the
electrode surfaces producing incomplete harmonics.
Figure 79a-c and Table 8 shows that it is only when the GCM-crude reso-
nator is operated at 215 OC that it first fulfil the standing wave condition.
Beyond this temperature, it can also be seen that the resonator operates as
expected and registers 2 θ = 0 points for each investigation. The results in
Figure 78 and Figure 79 have for the first time shown using CAS that the
TC does not occur at the first temperature at which the microbalance first
reads a resonant frequency near what is expected. The results also confirm
that the GCM is able to successfully operate with a highly viscous contact-
ing medium at temperatures above its TC.
Table 8: Temperature vs. θmin
T (OC) Θmin
204 3.42
209 0.58
215 -0.18
218 -0.94
220 -1.05
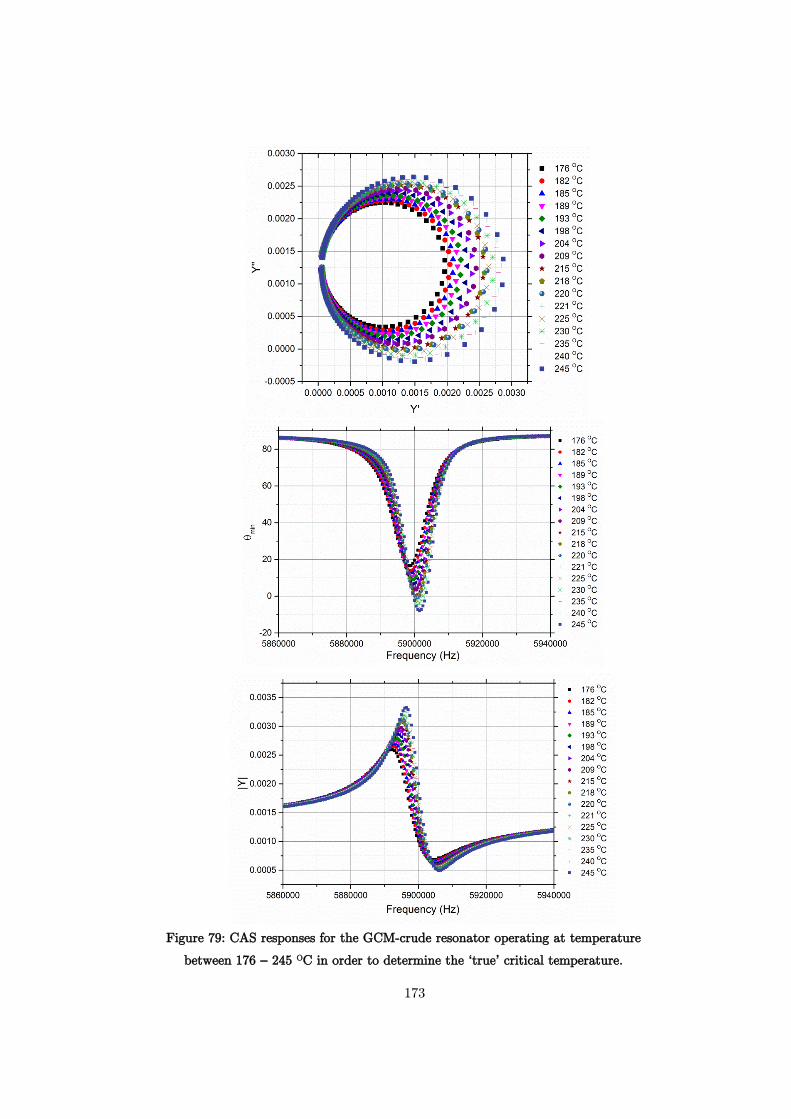
173
Figure 79: CAS responses for the GCM-crude resonator operating at temperature
between 176 – 245 OC in order to determine the ‘true’ critical temperature.
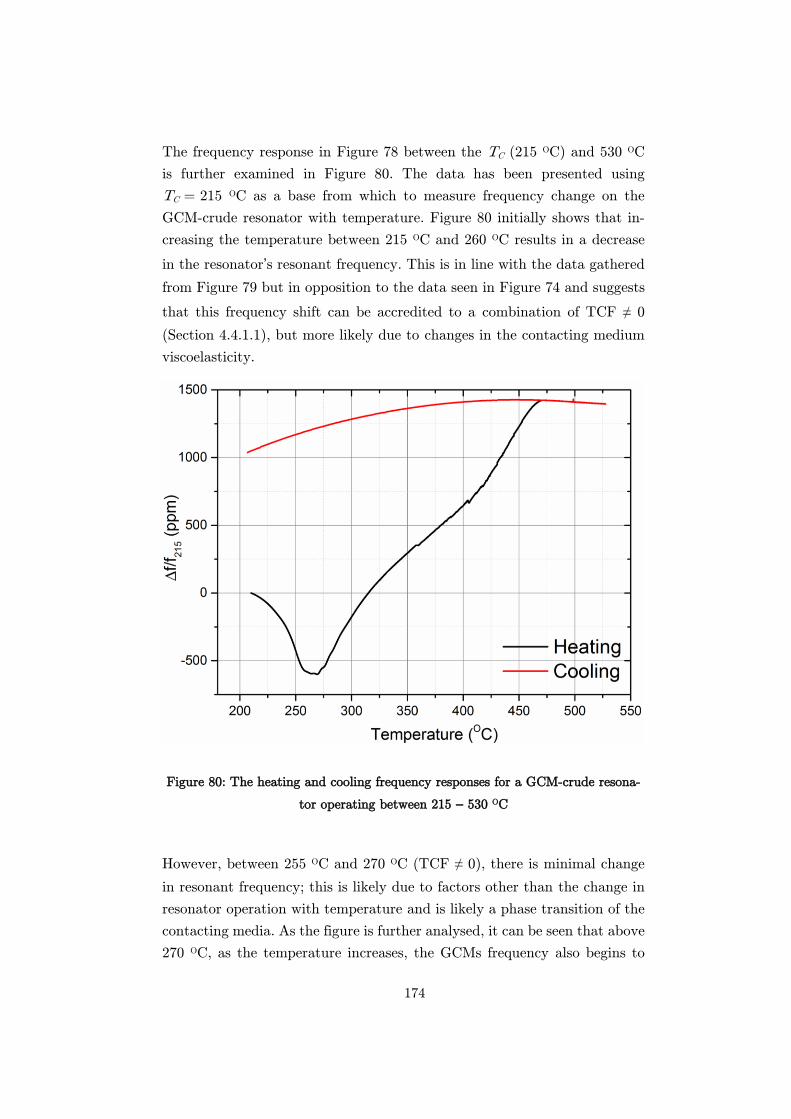
174
The frequency response in Figure 78 between the TC (215 OC) and 530 OC
is further examined in Figure 80. The data has been presented using
TC = 215 OC as a base from which to measure frequency change on the
GCM-crude resonator with temperature. Figure 80 initially shows that in-
creasing the temperature between 215 OC and 260 OC results in a decrease
in the resonator’s resonant frequency. This is in line with the data gathered
from Figure 79 but in opposition to the data seen in Figure 74 and suggests
that this frequency shift can be accredited to a combination of TCF ≠ 0
(Section 4.4.1.1), but more likely due to changes in the contacting medium
viscoelasticity.
Figure 80: The heating and cooling frequency responses for a GCM-crude resona-
tor operating between 215 – 530 OC
However, between 255 OC and 270 OC (TCF ≠ 0), there is minimal change
in resonant frequency; this is likely due to factors other than the change in
resonator operation with temperature and is likely a phase transition of the
contacting media. As the figure is further analysed, it can be seen that above
270 OC, as the temperature increases, the GCMs frequency also begins to

175
increase. With TCF ≠ 0, the increase in frequency is expected with increas-
ing operating temperature; however, the increasing frequency may also be
used to indicate a loss of mass on the microbalance’s surface. As the tem-
perature continues to increase, the increase in frequency suggests a continual
decrease in the contacting mass on the composite resonator’s surface until
470 OC. The resonator then registers the same frequency shift when operat-
ing between 470 OC and 530 OC during the heating and cooling phase. As
the resonator cools, the frequency response is measured as shown in Figure
80, and indicates an increase in frequency of 1037 ppm at 215 OC when
cooling compared to heating. This change in frequency relates to a reduction
in the microbalance’s contacting mass by 0.022 mg. This is very similar to
the mass originally added to the system (albeit measured more accurately
using the GCM than a conventional mass balance), and suggests that the
contacting crude has evaporated from the resonator electrode. This is con-
firmed visually after post-mortem examination of the GCM.
Figure 80 suggests that the evaporation of the crude sample begins at tem-
peratures above 275 OC and has highlighted the need for the application of
pressure to the system. The application of pressure to both heavy crude
refining and transportation is commonplace and is used to allow the appli-
cation of heat whilst maintaining the crude below its cloud point. Therefore,
to provide an accurate representation of the fouling that may occur within
the production chain, the microbalance must itself show stability when op-
erated under pressure.
Pressure Stability
Transmission pipelines and refinery equipment throughout the production
chain can typically operate at pressures up to 100 psi (6.8 bar). It was,
therefore, essential to ensure the microbalance’s operation at similar (and
higher) pressures was stable in order to isolate the response from the final
analysis and attribute observations solely to the interfacial processes.
As discussed in Chapter 2, the QCM has in the past been employed as an
interfacial sensor in systems held under constant pressure. The GCM liter-
ature has yet to report operation under similar conditions and so is further
176
explored here. As before, the QCM’s operation and responses are used in
this investigation as a baseline for successful resonator operation.
Figure 81: The frequency shift for a QCM (black plot) and a GCM (red plot) for
operation under pressure between 1 and 8 bar (gauge).
For this investigation, a 6 MHz QCM (Inficon) and a 6 MHz R-30 GCM
(Piezocryst) were operated in the ceramic holder within the pressure vessel
as shown in Figure 70 and Figure 66 respectively. Both microbalances were
subjected to operation at 30 OC and pressures between 1 and 8 bar (gauge)
in an argon environment; the ppm frequency responses are shown in Figure
81.
Both microbalances show the ability to operate through this pressure range
with small (≤ 8 ppm) but comparable decreases in frequency response with
increasing pressure; following similar second order polynomial responses.
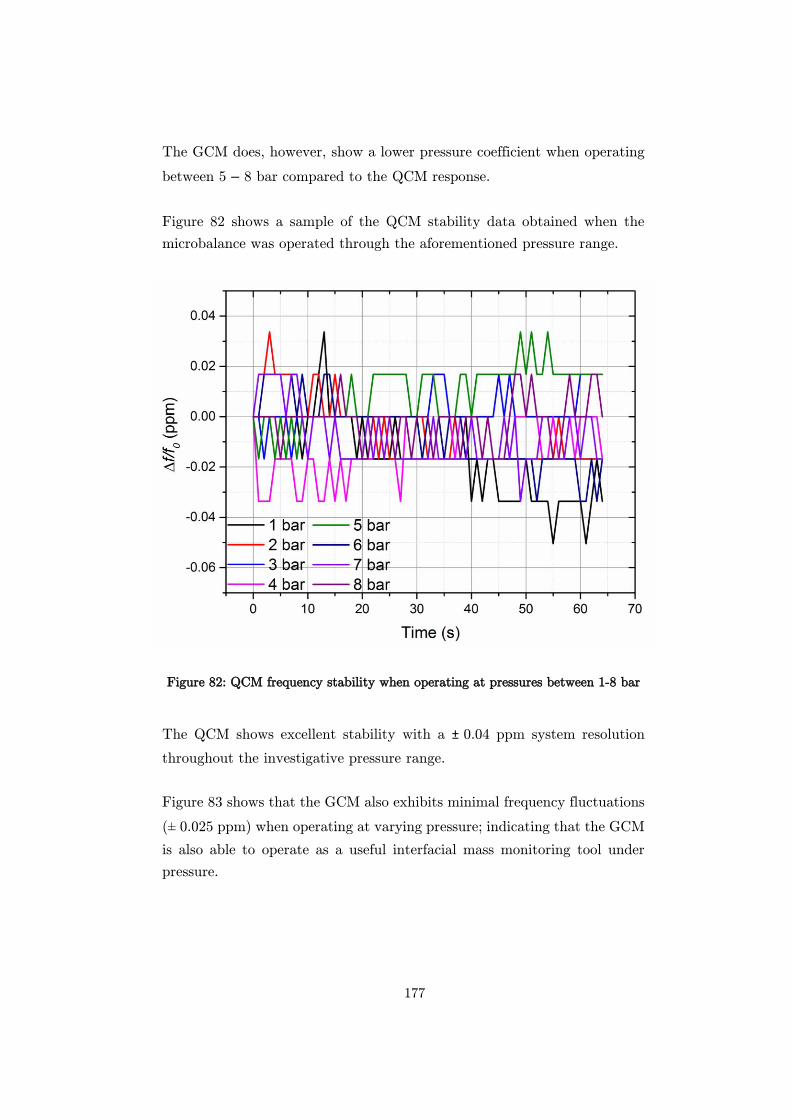
177
The GCM does, however, show a lower pressure coefficient when operating
between 5 – 8 bar compared to the QCM response.
Figure 82 shows a sample of the QCM stability data obtained when the
microbalance was operated through the aforementioned pressure range.
Figure 82: QCM frequency stability when operating at pressures between 1-8 bar
The QCM shows excellent stability with a ± 0.04 ppm system resolution
throughout the investigative pressure range.
Figure 83 shows that the GCM also exhibits minimal frequency fluctuations
(± 0.025 ppm) when operating at varying pressure; indicating that the GCM
is also able to operate as a useful interfacial mass monitoring tool under
pressure.
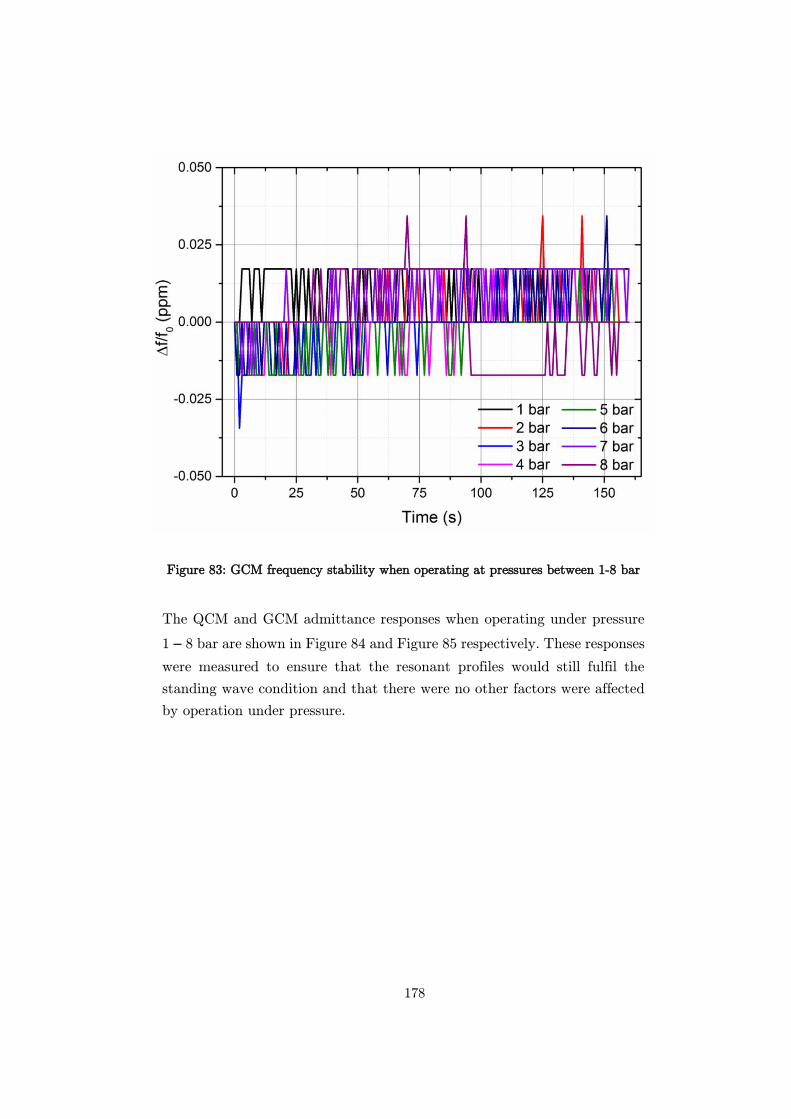
178
Figure 83: GCM frequency stability when operating at pressures between 1-8 bar
The QCM and GCM admittance responses when operating under pressure
1 – 8 bar are shown in Figure 84 and Figure 85 respectively. These responses
were measured to ensure that the resonant profiles would still fulfil the
standing wave condition and that there were no other factors were affected
by operation under pressure.
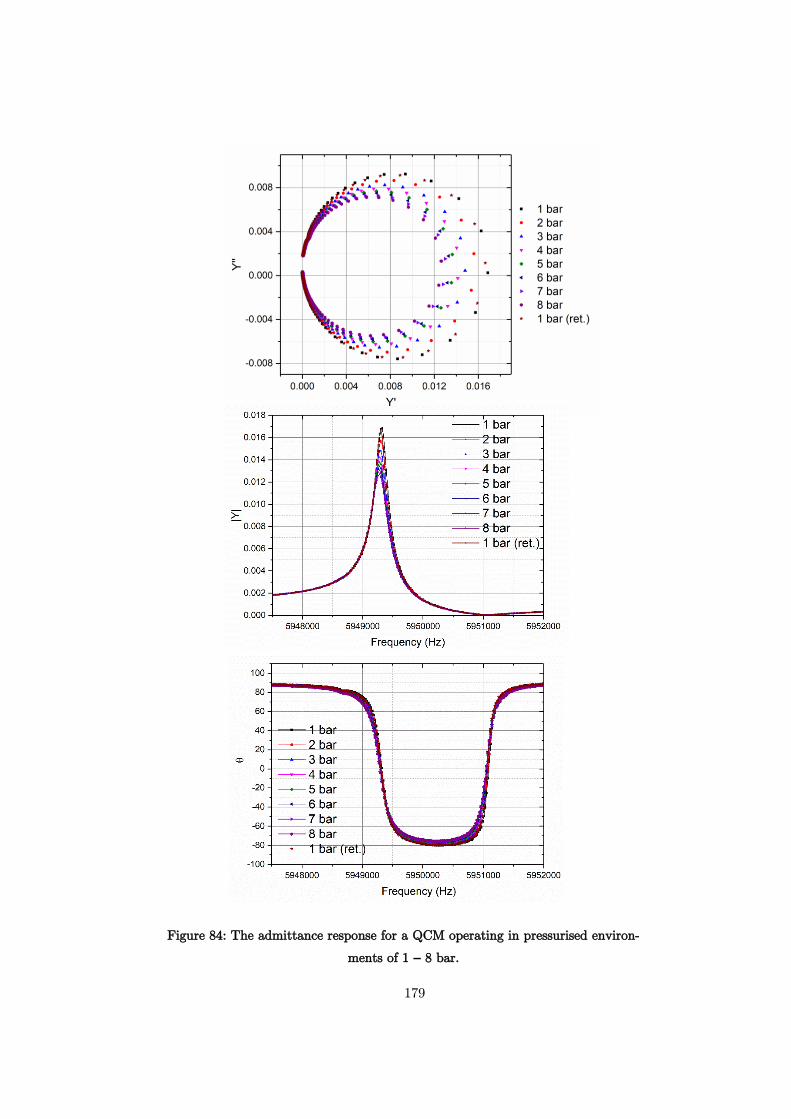
179
Figure 84: The admittance response for a QCM operating in pressurised environ-
ments of 1 – 8 bar.
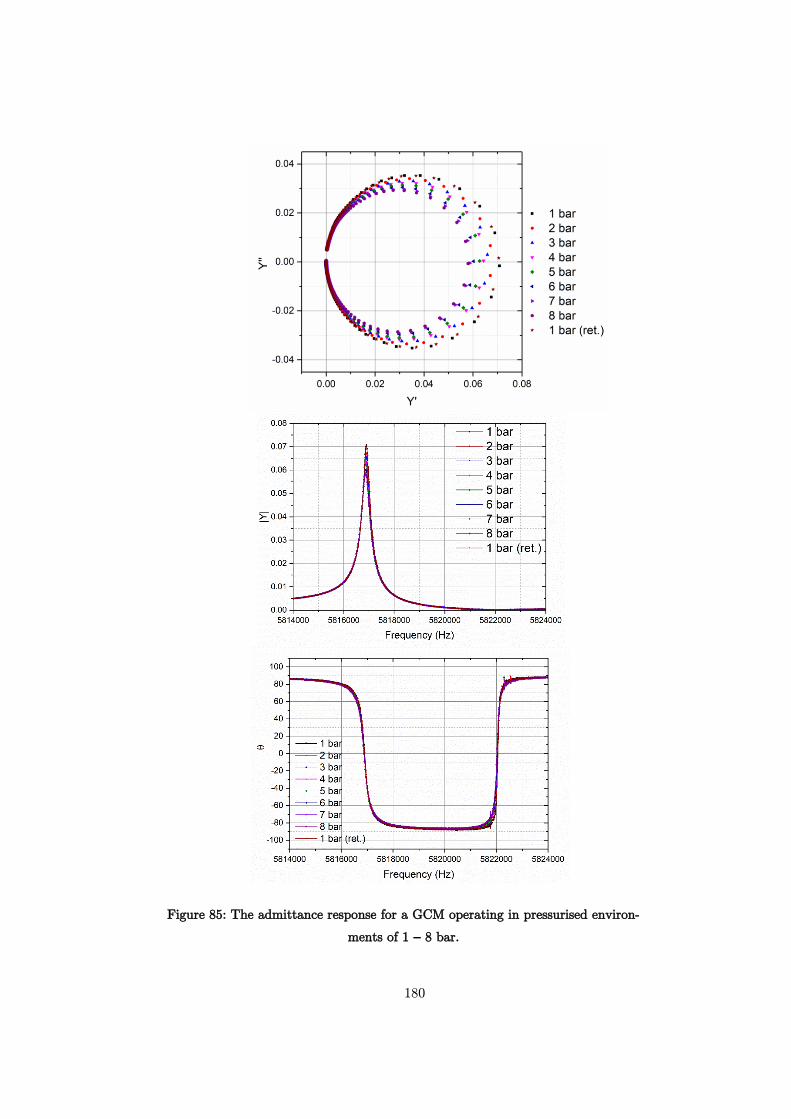
180
Figure 85: The admittance response for a GCM operating in pressurised environ-
ments of 1 – 8 bar.
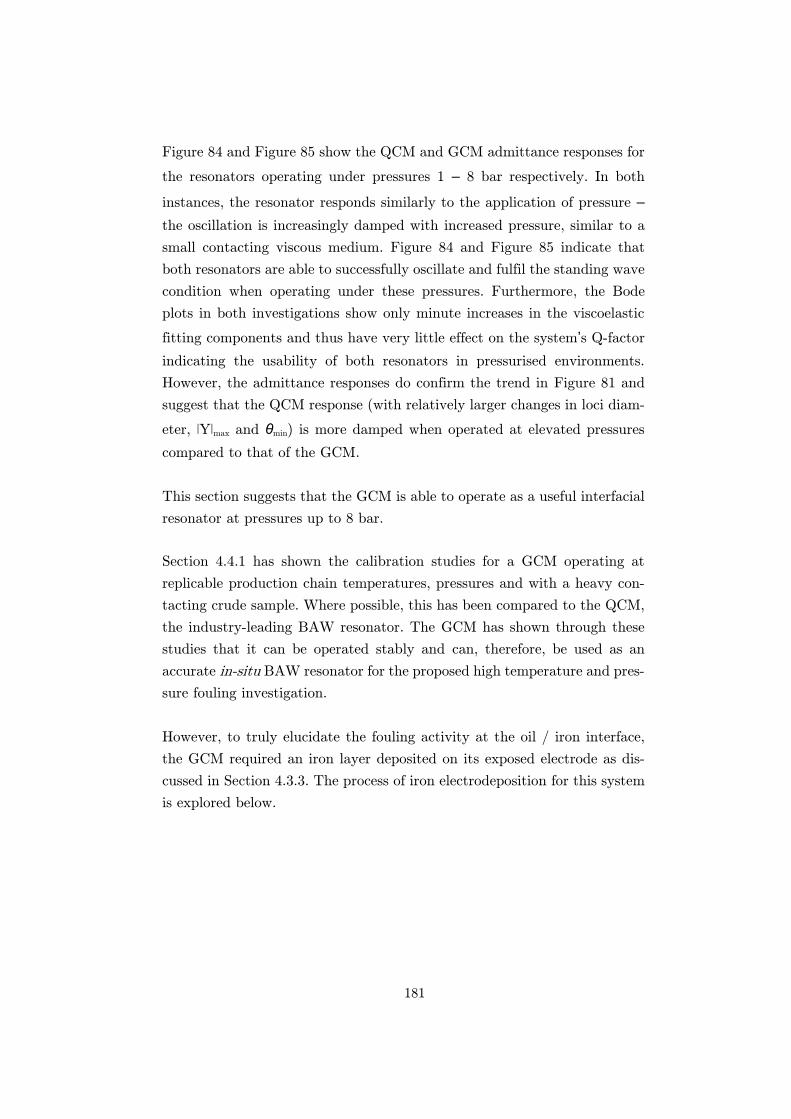
181
Figure 84 and Figure 85 show the QCM and GCM admittance responses for
the resonators operating under pressures 1 – 8 bar respectively. In both
instances, the resonator responds similarly to the application of pressure –
the oscillation is increasingly damped with increased pressure, similar to a
small contacting viscous medium. Figure 84 and Figure 85 indicate that
both resonators are able to successfully oscillate and fulfil the standing wave
condition when operating under these pressures. Furthermore, the Bode
plots in both investigations show only minute increases in the viscoelastic
fitting components and thus have very little effect on the system’s Q-factor
indicating the usability of both resonators in pressurised environments.
However, the admittance responses do confirm the trend in Figure 81 and
suggest that the QCM response (with relatively larger changes in loci diam-
eter, ǀYǀmax and θmin) is more damped when operated at elevated pressures
compared to that of the GCM.
This section suggests that the GCM is able to operate as a useful interfacial
resonator at pressures up to 8 bar.
Section 4.4.1 has shown the calibration studies for a GCM operating at
replicable production chain temperatures, pressures and with a heavy con-
tacting crude sample. Where possible, this has been compared to the QCM,
the industry-leading BAW resonator. The GCM has shown through these
studies that it can be operated stably and can, therefore, be used as an
accurate in-situ BAW resonator for the proposed high temperature and pres-
sure fouling investigation.
However, to truly elucidate the fouling activity at the oil / iron interface,
the GCM required an iron layer deposited on its exposed electrode as dis-
cussed in Section 4.3.3. The process of iron electrodeposition for this system
is explored below.
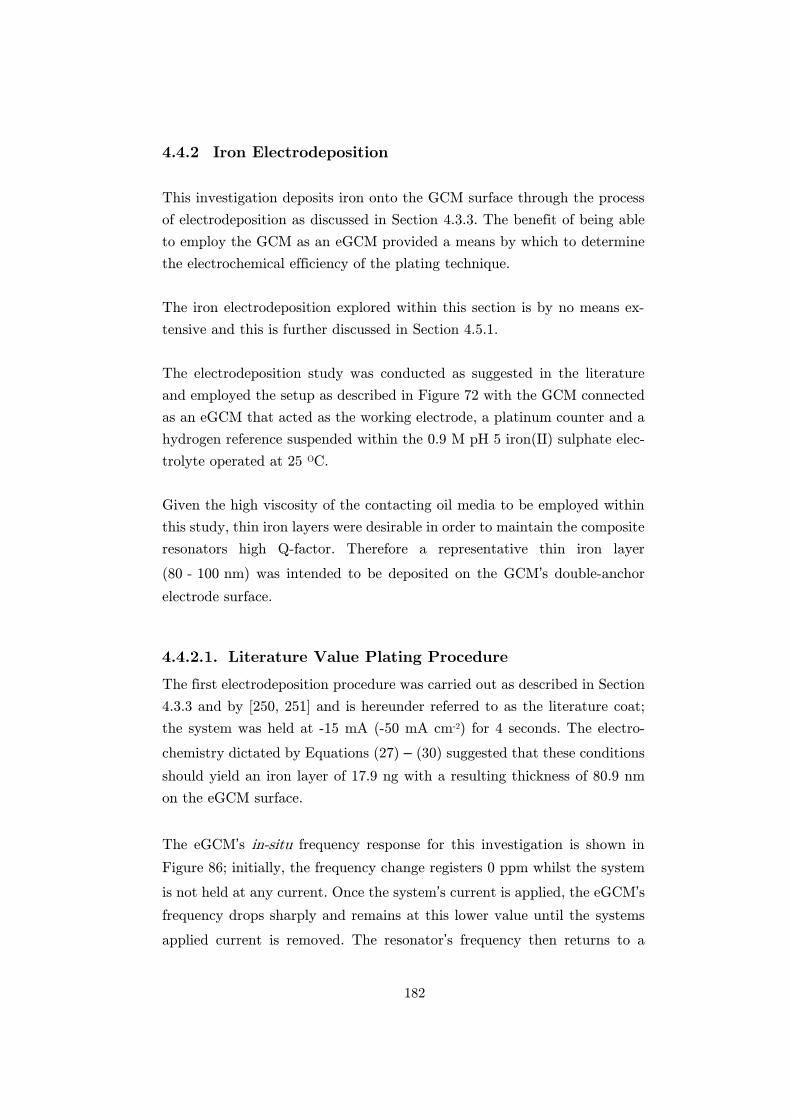
182
4.4.2 Iron Electrodeposition
This investigation deposits iron onto the GCM surface through the process
of electrodeposition as discussed in Section 4.3.3. The benefit of being able
to employ the GCM as an eGCM provided a means by which to determine
the electrochemical efficiency of the plating technique.
The iron electrodeposition explored within this section is by no means ex-
tensive and this is further discussed in Section 4.5.1.
The electrodeposition study was conducted as suggested in the literature
and employed the setup as described in Figure 72 with the GCM connected
as an eGCM that acted as the working electrode, a platinum counter and a
hydrogen reference suspended within the 0.9 M pH 5 iron(II) sulphate elec-
trolyte operated at 25 OC.
Given the high viscosity of the contacting oil media to be employed within
this study, thin iron layers were desirable in order to maintain the composite
resonators high Q-factor. Therefore a representative thin iron layer
(80 - 100 nm) was intended to be deposited on the GCM’s double-anchor
electrode surface.
Literature Value Plating Procedure
The first electrodeposition procedure was carried out as described in Section
4.3.3 and by [250, 251] and is hereunder referred to as the literature coat;
the system was held at -15 mA (-50 mA cm-2) for 4 seconds. The electro-
chemistry dictated by Equations (27) – (30) suggested that these conditions
should yield an iron layer of 17.9 ng with a resulting thickness of 80.9 nm
on the eGCM surface.
The eGCM’s in-situ frequency response for this investigation is shown in
Figure 86; initially, the frequency change registers 0 ppm whilst the system
is not held at any current. Once the system’s current is applied, the eGCM’s
frequency drops sharply and remains at this lower value until the systems
applied current is removed. The resonator’s frequency then returns to a
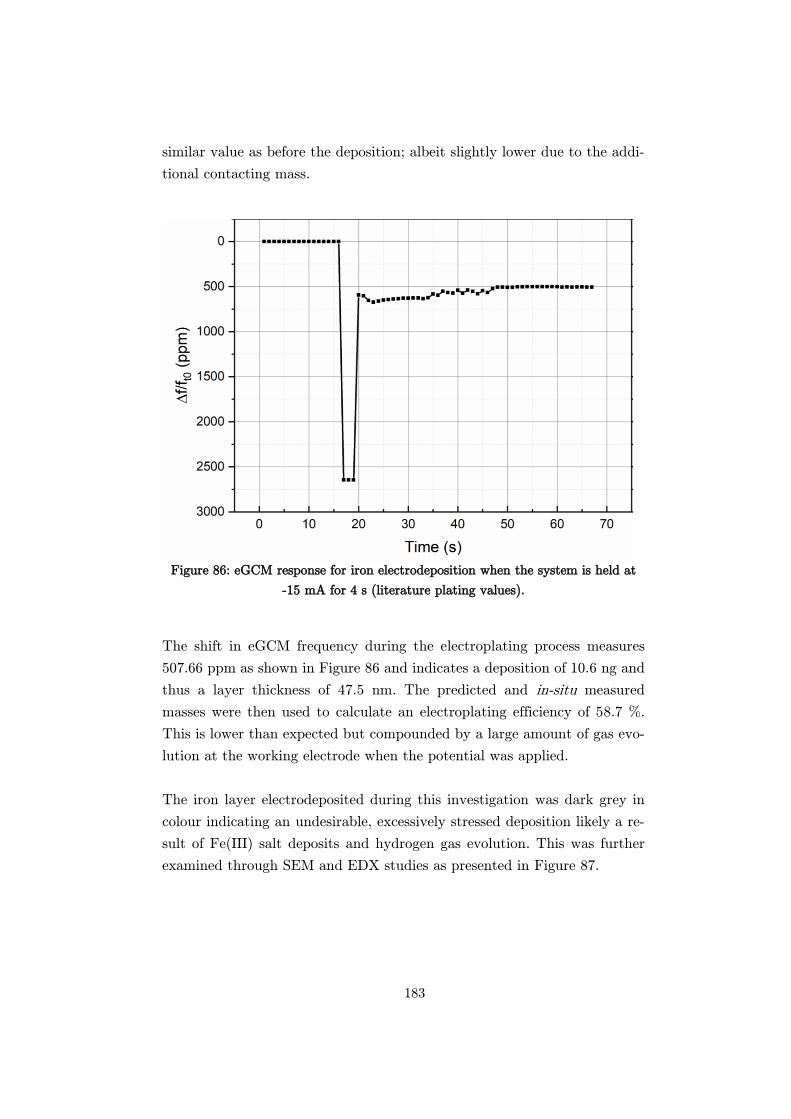
183
similar value as before the deposition; albeit slightly lower due to the addi-
tional contacting mass.
Figure 86: eGCM response for iron electrodeposition when the system is held at
-15 mA for 4 s (literature plating values).
The shift in eGCM frequency during the electroplating process measures
507.66 ppm as shown in Figure 86 and indicates a deposition of 10.6 ng and
thus a layer thickness of 47.5 nm. The predicted and in-situ measured
masses were then used to calculate an electroplating efficiency of 58.7 %.
This is lower than expected but compounded by a large amount of gas evo-
lution at the working electrode when the potential was applied.
The iron layer electrodeposited during this investigation was dark grey in
colour indicating an undesirable, excessively stressed deposition likely a re-
sult of Fe(III) salt deposits and hydrogen gas evolution. This was further
examined through SEM and EDX studies as presented in Figure 87.
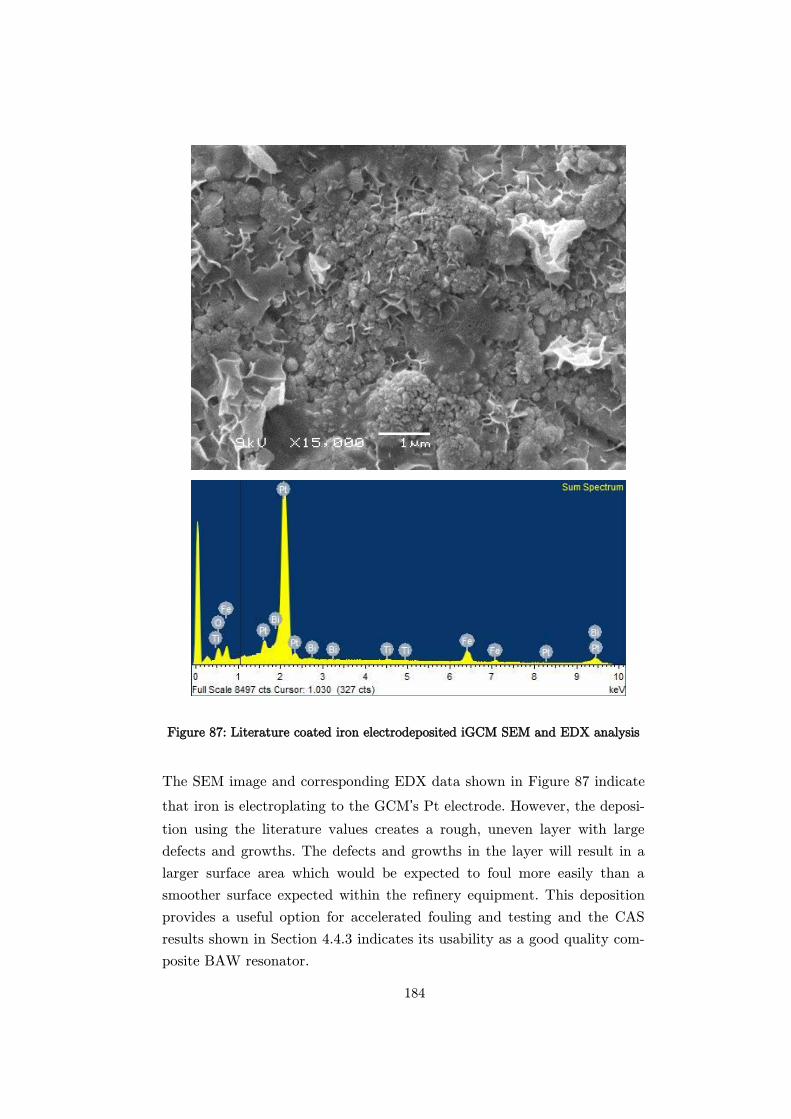
184
Figure 87: Literature coated iron electrodeposited iGCM SEM and EDX analysis
The SEM image and corresponding EDX data shown in Figure 87 indicate
that iron is electroplating to the GCM’s Pt electrode. However, the deposi-
tion using the literature values creates a rough, uneven layer with large
defects and growths. The defects and growths in the layer will result in a
larger surface area which would be expected to foul more easily than a
smoother surface expected within the refinery equipment. This deposition
provides a useful option for accelerated fouling and testing and the CAS
results shown in Section 4.4.3 indicates its usability as a good quality com-
posite BAW resonator.
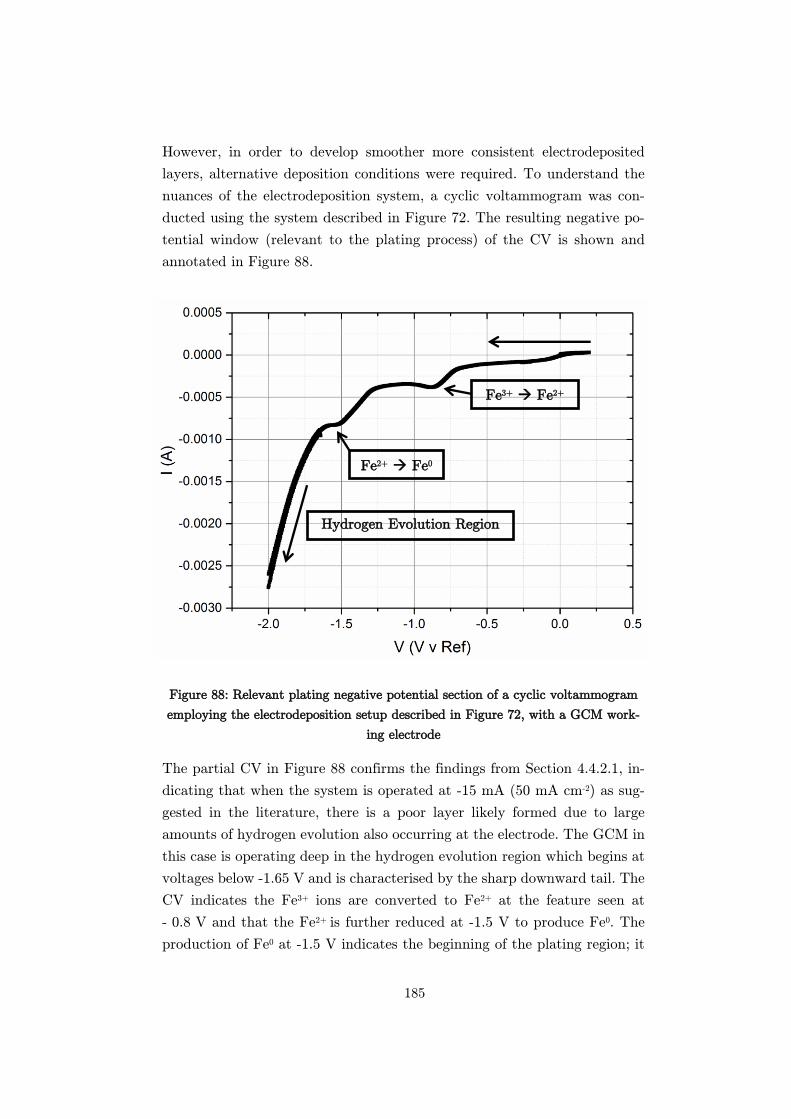
185
However, in order to develop smoother more consistent electrodeposited
layers, alternative deposition conditions were required. To understand the
nuances of the electrodeposition system, a cyclic voltammogram was con-
ducted using the system described in Figure 72. The resulting negative po-
tential window (relevant to the plating process) of the CV is shown and
annotated in Figure 88.
Figure 88: Relevant plating negative potential section of a cyclic voltammogram
employing the electrodeposition setup described in Figure 72, with a GCM work-
ing electrode
The partial CV in Figure 88 confirms the findings from Section 4.4.2.1, in-
dicating that when the system is operated at -15 mA (50 mA cm-2) as sug-
gested in the literature, there is a poor layer likely formed due to large
amounts of hydrogen evolution also occurring at the electrode. The GCM in
this case is operating deep in the hydrogen evolution region which begins at
voltages below -1.65 V and is characterised by the sharp downward tail. The
CV indicates the Fe3+ ions are converted to Fe2+ at the feature seen at
- 0.8 V and that the Fe2+ is further reduced at -1.5 V to produce Fe0. The
production of Fe0 at -1.5 V indicates the beginning of the plating region; it
Hydrogen Evolution Region
Fe2+ Fe0
Fe3+ Fe2+
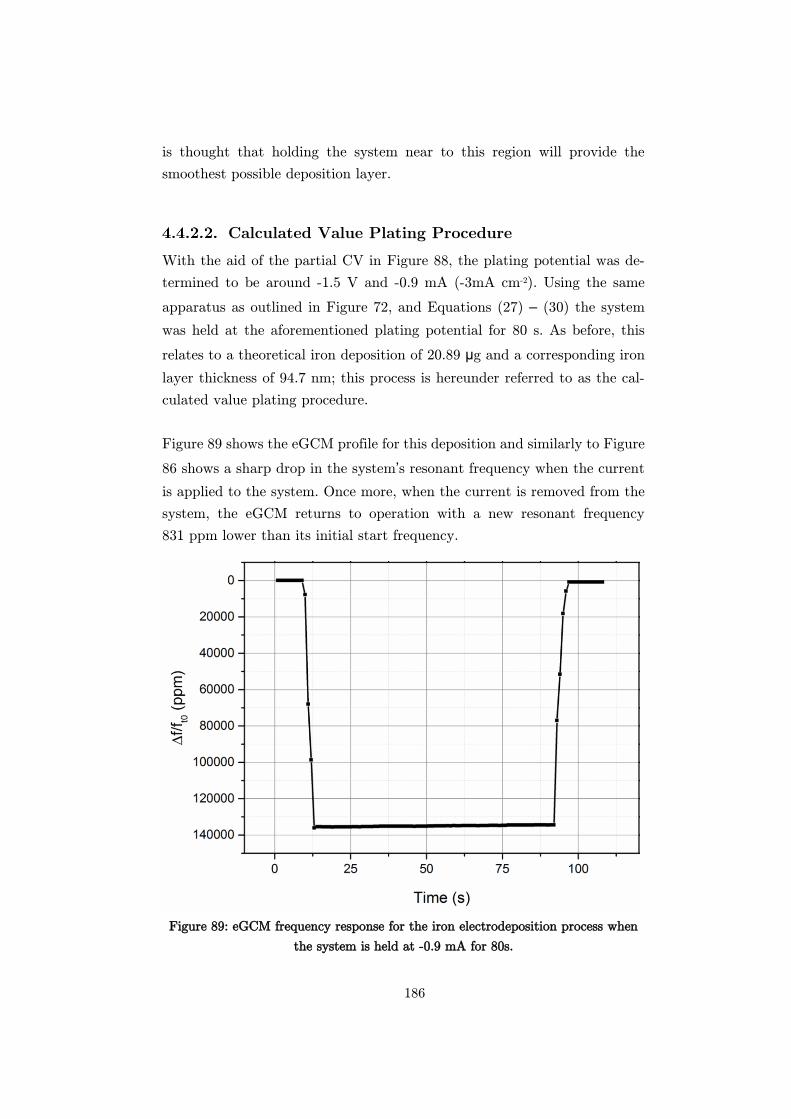
186
is thought that holding the system near to this region will provide the
smoothest possible deposition layer.
Calculated Value Plating Procedure
With the aid of the partial CV in Figure 88, the plating potential was de-
termined to be around -1.5 V and -0.9 mA (-3mA cm-2). Using the same
apparatus as outlined in Figure 72, and Equations (27) – (30) the system
was held at the aforementioned plating potential for 80 s. As before, this
relates to a theoretical iron deposition of 20.89 μg and a corresponding iron
layer thickness of 94.7 nm; this process is hereunder referred to as the cal-
culated value plating procedure.
Figure 89 shows the eGCM profile for this deposition and similarly to Figure
86 shows a sharp drop in the system’s resonant frequency when the current
is applied to the system. Once more, when the current is removed from the
system, the eGCM returns to operation with a new resonant frequency
831 ppm lower than its initial start frequency.
Figure 89: eGCM frequency response for the iron electrodeposition process when
the system is held at -0.9 mA for 80s.
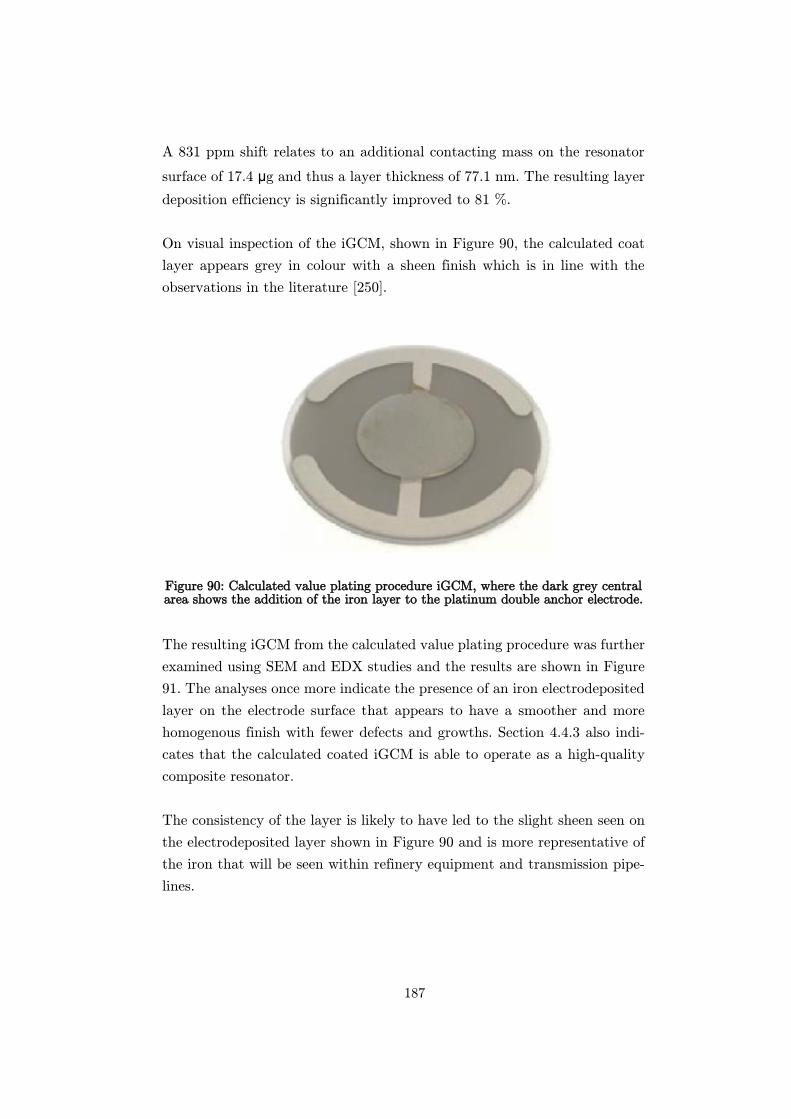
187
A 831 ppm shift relates to an additional contacting mass on the resonator
surface of 17.4 μg and thus a layer thickness of 77.1 nm. The resulting layer
deposition efficiency is significantly improved to 81 %.
On visual inspection of the iGCM, shown in Figure 90, the calculated coat
layer appears grey in colour with a sheen finish which is in line with the
observations in the literature [250].
Figure 90: Calculated value plating procedure iGCM, where the dark grey central area shows the addition of the iron layer to the platinum double anchor electrode.
The resulting iGCM from the calculated value plating procedure was further
examined using SEM and EDX studies and the results are shown in Figure
91. The analyses once more indicate the presence of an iron electrodeposited
layer on the electrode surface that appears to have a smoother and more
homogenous finish with fewer defects and growths. Section 4.4.3 also indi-
cates that the calculated coated iGCM is able to operate as a high-quality
composite resonator.
The consistency of the layer is likely to have led to the slight sheen seen on
the electrodeposited layer shown in Figure 90 and is more representative of
the iron that will be seen within refinery equipment and transmission pipe-
lines.
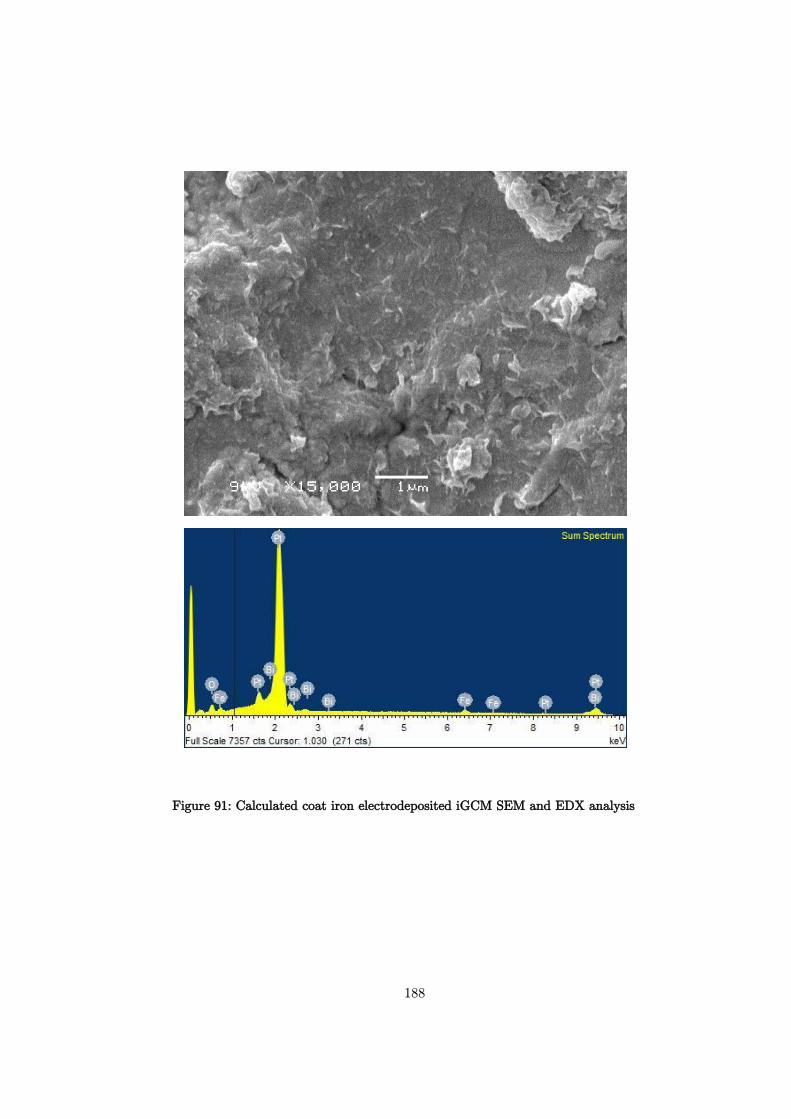
188
Figure 91: Calculated coat iron electrodeposited iGCM SEM and EDX analysis
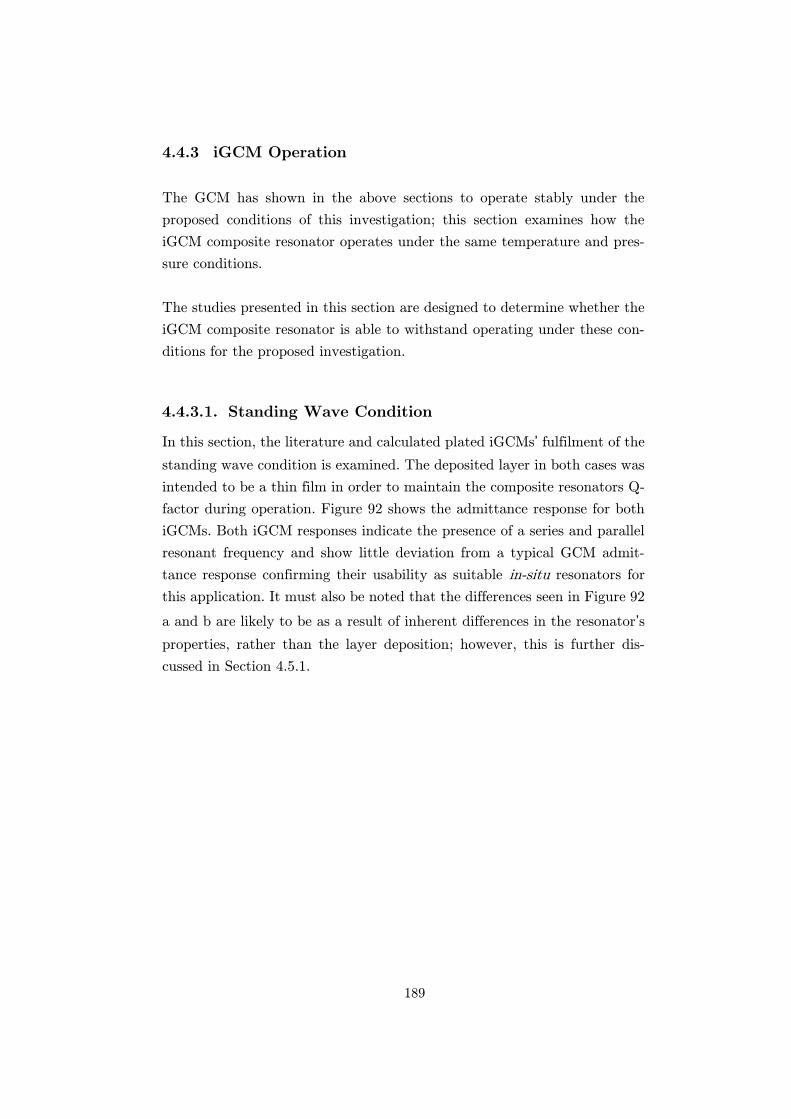
189
4.4.3 iGCM Operation
The GCM has shown in the above sections to operate stably under the
proposed conditions of this investigation; this section examines how the
iGCM composite resonator operates under the same temperature and pres-
sure conditions.
The studies presented in this section are designed to determine whether the
iGCM composite resonator is able to withstand operating under these con-
ditions for the proposed investigation.
Standing Wave Condition
In this section, the literature and calculated plated iGCMs’ fulfilment of the
standing wave condition is examined. The deposited layer in both cases was
intended to be a thin film in order to maintain the composite resonators Q-
factor during operation. Figure 92 shows the admittance response for both
iGCMs. Both iGCM responses indicate the presence of a series and parallel
resonant frequency and show little deviation from a typical GCM admit-
tance response confirming their usability as suitable in-situ resonators for
this application. It must also be noted that the differences seen in Figure 92
a and b are likely to be as a result of inherent differences in the resonator’s
properties, rather than the layer deposition; however, this is further dis-
cussed in Section 4.5.1.
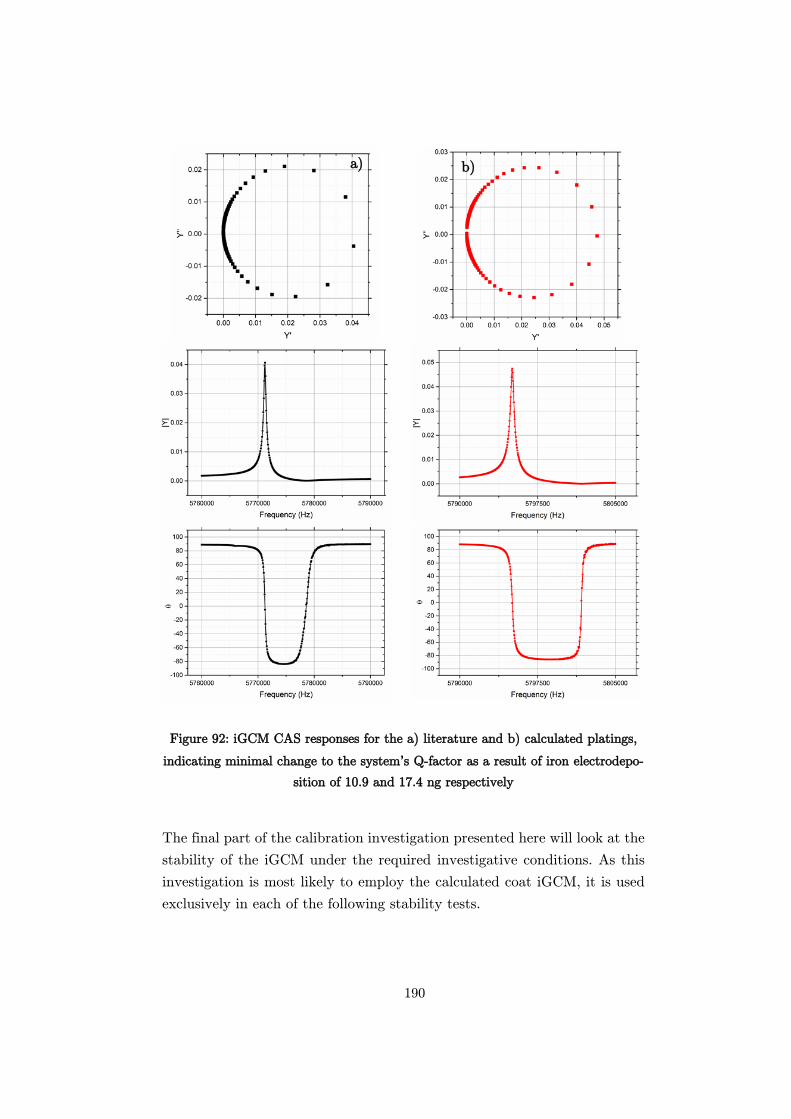
190
Figure 92: iGCM CAS responses for the a) literature and b) calculated platings,
indicating minimal change to the system’s Q-factor as a result of iron electrodepo-
sition of 10.9 and 17.4 ng respectively
The final part of the calibration investigation presented here will look at the
stability of the iGCM under the required investigative conditions. As this
investigation is most likely to employ the calculated coat iGCM, it is used
exclusively in each of the following stability tests.
a) b)
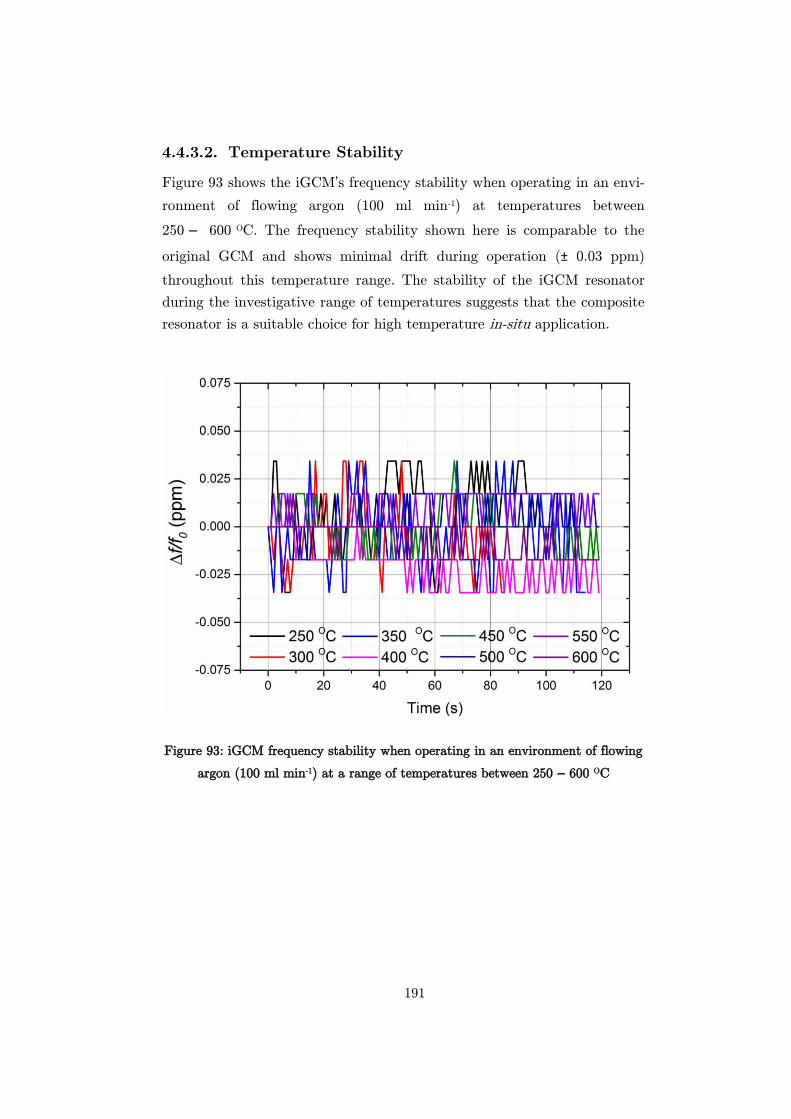
191
Temperature Stability
Figure 93 shows the iGCM’s frequency stability when operating in an envi-
ronment of flowing argon (100 ml min-1) at temperatures between
250 – 600 OC. The frequency stability shown here is comparable to the
original GCM and shows minimal drift during operation (± 0.03 ppm)
throughout this temperature range. The stability of the iGCM resonator
during the investigative range of temperatures suggests that the composite
resonator is a suitable choice for high temperature in-situ application.
Figure 93: iGCM frequency stability when operating in an environment of flowing
argon (100 ml min-1) at a range of temperatures between 250 – 600 OC
192
Pressure Stability
The iGCM’s frequency stability when operated in a pressurised argon envi-
ronment between 1 – 8 bar is shown in Figure 94.
Figure 94: iGCM frequency stability when operated in argon at pressures between
1 – 8 bar.
Once more, the iGCM has shown excellent frequency stability, comparable
to that of the original GCM at all pressures. This indicates that the iGCM
can be used as a reliable in-situ mass monitoring device when held under
the investigative pressure range.
Pressure and Temperature Stability
The final stability subsection investigates the iGCM’s operation under com-
bined temperature and pressure. Two representative studies for this inves-
tigation are presented in Figure 95 and monitor the iGCM’s frequency re-
sponse when held at 250 OC and 5 bar and at 350 OC at 3 bar.
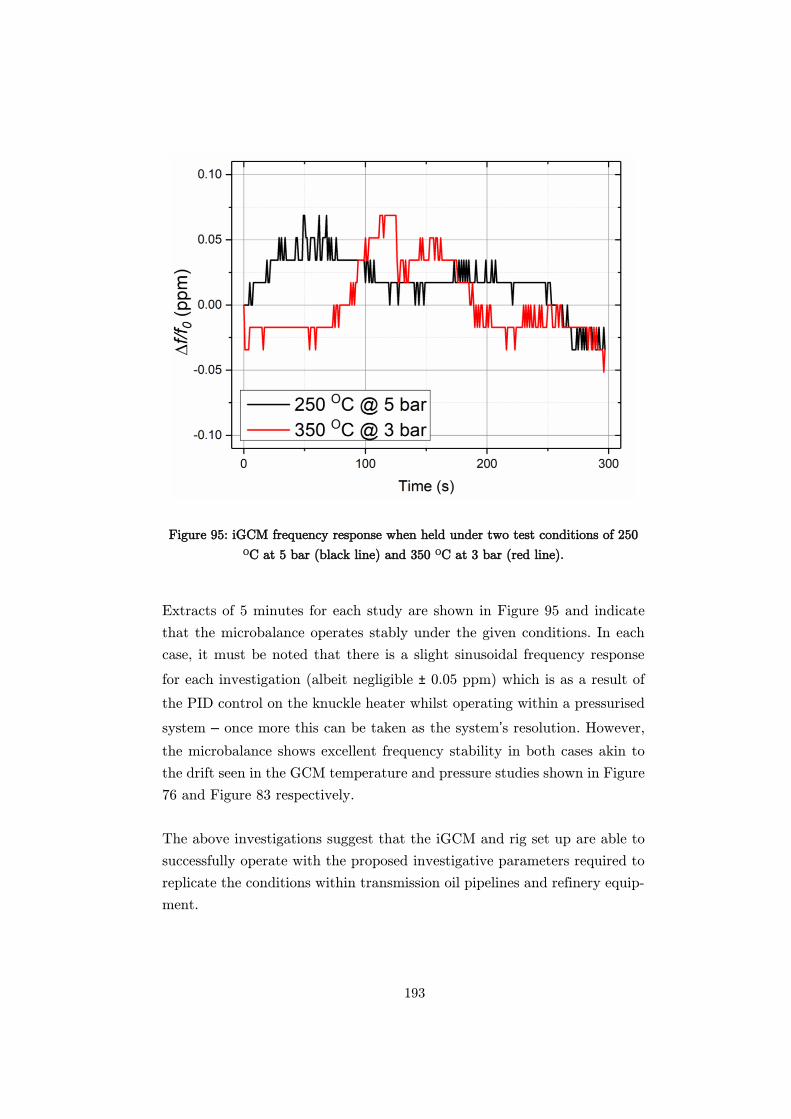
193
Figure 95: iGCM frequency response when held under two test conditions of 250
OC at 5 bar (black line) and 350 OC at 3 bar (red line).
Extracts of 5 minutes for each study are shown in Figure 95 and indicate
that the microbalance operates stably under the given conditions. In each
case, it must be noted that there is a slight sinusoidal frequency response
for each investigation (albeit negligible ± 0.05 ppm) which is as a result of
the PID control on the knuckle heater whilst operating within a pressurised
system – once more this can be taken as the system’s resolution. However,
the microbalance shows excellent frequency stability in both cases akin to
the drift seen in the GCM temperature and pressure studies shown in Figure
76 and Figure 83 respectively.
The above investigations suggest that the iGCM and rig set up are able to
successfully operate with the proposed investigative parameters required to
replicate the conditions within transmission oil pipelines and refinery equip-
ment.
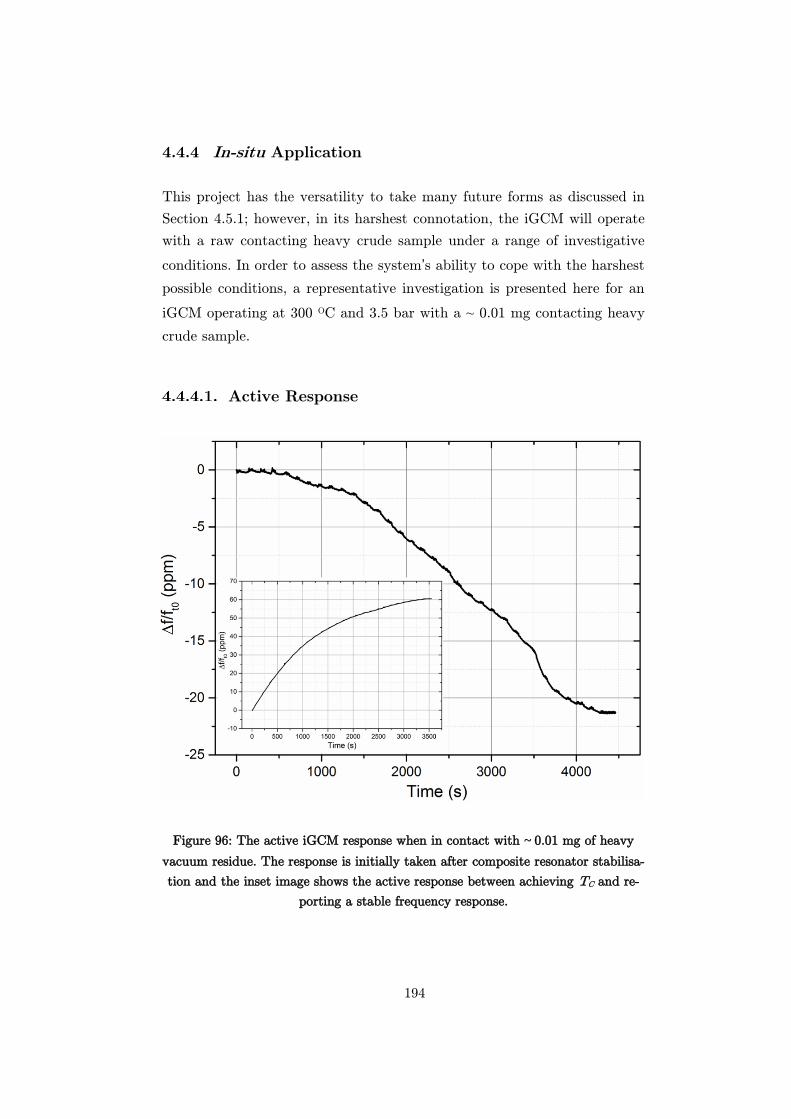
194
4.4.4 In-situ Application
This project has the versatility to take many future forms as discussed in
Section 4.5.1; however, in its harshest connotation, the iGCM will operate
with a raw contacting heavy crude sample under a range of investigative
conditions. In order to assess the system’s ability to cope with the harshest
possible conditions, a representative investigation is presented here for an
iGCM operating at 300 OC and 3.5 bar with a ~ 0.01 mg contacting heavy
crude sample.
Active Response
Figure 96: The active iGCM response when in contact with ~ 0.01 mg of heavy
vacuum residue. The response is initially taken after composite resonator stabilisa-
tion and the inset image shows the active response between achieving TC and re-
porting a stable frequency response.
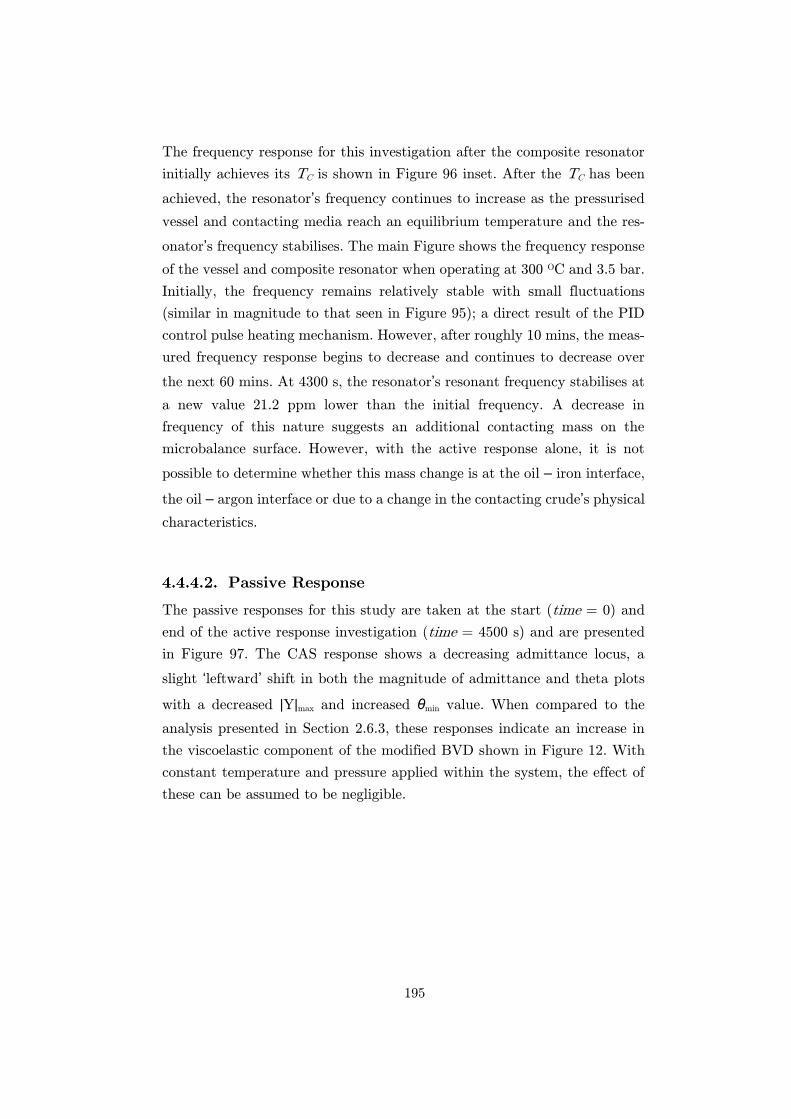
195
The frequency response for this investigation after the composite resonator
initially achieves its TC is shown in Figure 96 inset. After the TC has been
achieved, the resonator’s frequency continues to increase as the pressurised
vessel and contacting media reach an equilibrium temperature and the res-
onator’s frequency stabilises. The main Figure shows the frequency response
of the vessel and composite resonator when operating at 300 OC and 3.5 bar.
Initially, the frequency remains relatively stable with small fluctuations
(similar in magnitude to that seen in Figure 95); a direct result of the PID
control pulse heating mechanism. However, after roughly 10 mins, the meas-
ured frequency response begins to decrease and continues to decrease over
the next 60 mins. At 4300 s, the resonator’s resonant frequency stabilises at
a new value 21.2 ppm lower than the initial frequency. A decrease in
frequency of this nature suggests an additional contacting mass on the
microbalance surface. However, with the active response alone, it is not
possible to determine whether this mass change is at the oil – iron interface,
the oil – argon interface or due to a change in the contacting crude’s physical
characteristics.
Passive Response
The passive responses for this study are taken at the start (time = 0) and
end of the active response investigation (time = 4500 s) and are presented
in Figure 97. The CAS response shows a decreasing admittance locus, a
slight ‘leftward’ shift in both the magnitude of admittance and theta plots
with a decreased ǀYǀmax and increased θmin value. When compared to the
analysis presented in Section 2.6.3, these responses indicate an increase in
the viscoelastic component of the modified BVD shown in Figure 12. With
constant temperature and pressure applied within the system, the effect of
these can be assumed to be negligible.
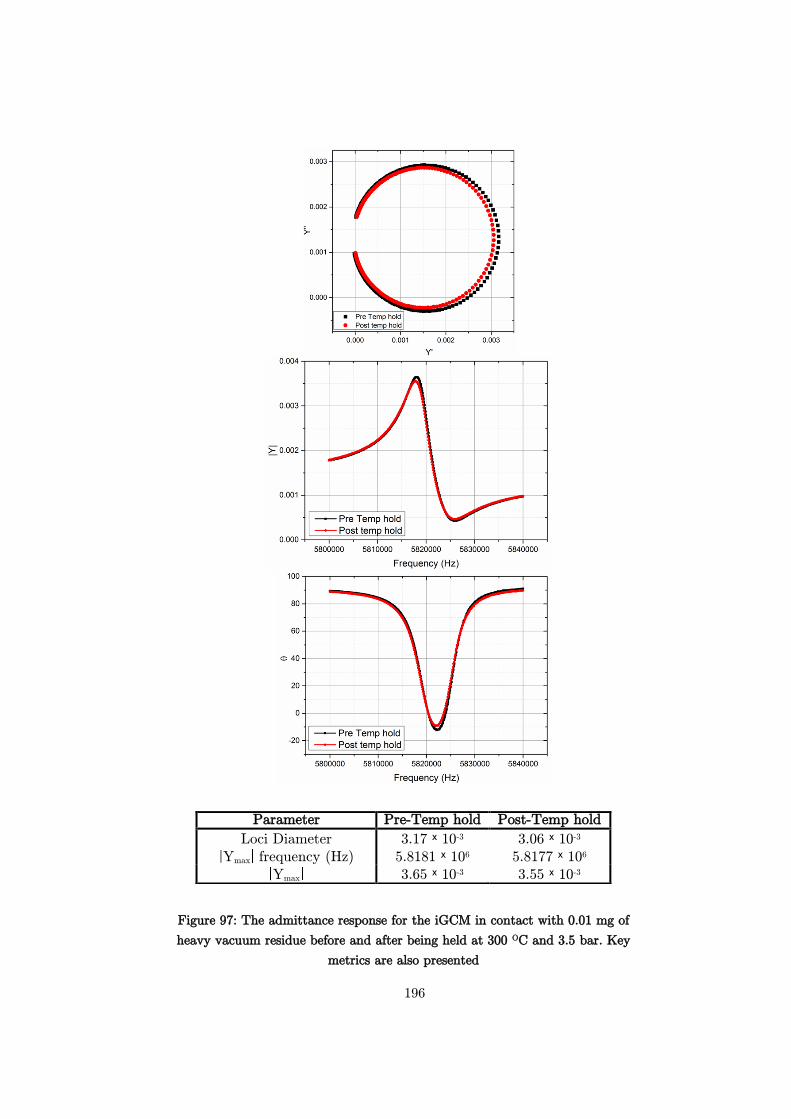
196
Figure 97: The admittance response for the iGCM in contact with 0.01 mg of
heavy vacuum residue before and after being held at 300 OC and 3.5 bar. Key
metrics are also presented
Parameter Pre-Temp hold Post-Temp hold
Loci Diameter 3.17 ˣ 10-3 3.06 ˣ 10-3
Ymax frequency (Hz) 5.8181 ˣ 106 5.8177 ˣ 106
Ymax 3.65 ˣ 10-3 3.55 ˣ 10-3
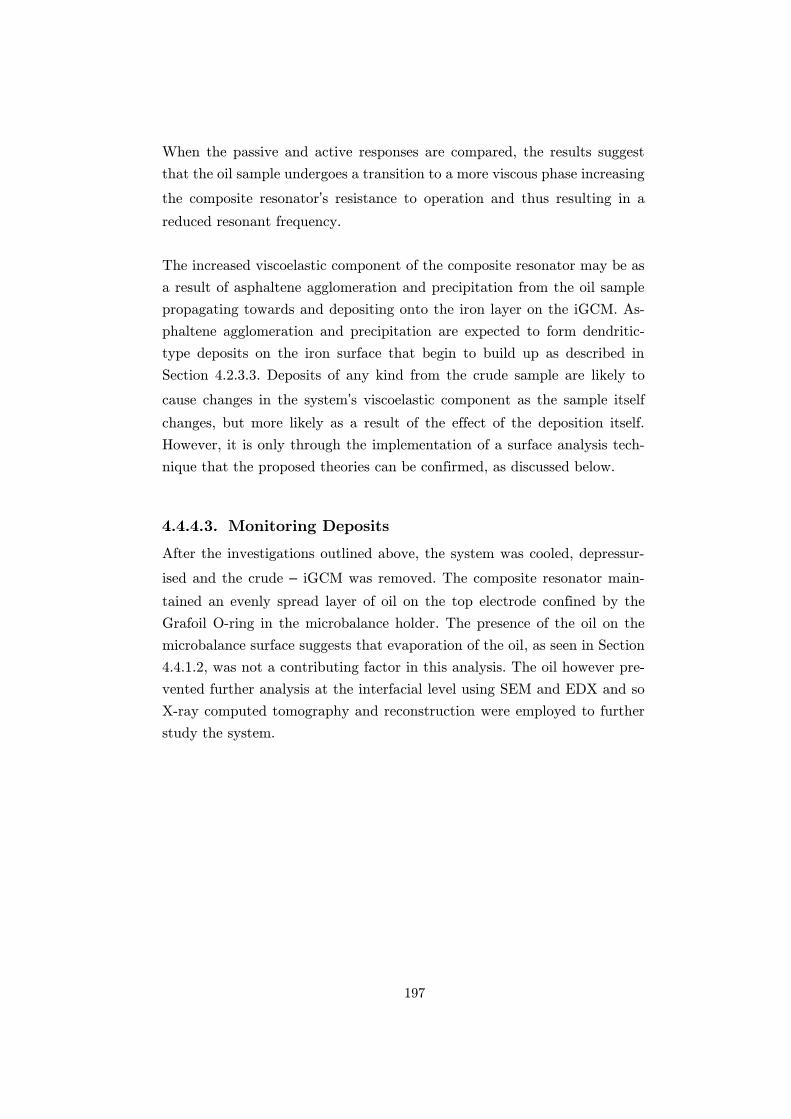
197
When the passive and active responses are compared, the results suggest
that the oil sample undergoes a transition to a more viscous phase increasing
the composite resonator’s resistance to operation and thus resulting in a
reduced resonant frequency.
The increased viscoelastic component of the composite resonator may be as
a result of asphaltene agglomeration and precipitation from the oil sample
propagating towards and depositing onto the iron layer on the iGCM. As-
phaltene agglomeration and precipitation are expected to form dendritic-
type deposits on the iron surface that begin to build up as described in
Section 4.2.3.3. Deposits of any kind from the crude sample are likely to
cause changes in the system’s viscoelastic component as the sample itself
changes, but more likely as a result of the effect of the deposition itself.
However, it is only through the implementation of a surface analysis tech-
nique that the proposed theories can be confirmed, as discussed below.
Monitoring Deposits
After the investigations outlined above, the system was cooled, depressur-
ised and the crude – iGCM was removed. The composite resonator main-
tained an evenly spread layer of oil on the top electrode confined by the
Grafoil O-ring in the microbalance holder. The presence of the oil on the
microbalance surface suggests that evaporation of the oil, as seen in Section
4.4.1.2, was not a contributing factor in this analysis. The oil however pre-
vented further analysis at the interfacial level using SEM and EDX and so
X-ray computed tomography and reconstruction were employed to further
study the system.
198
Figure 98: X-ray tomography reconstructions of a) the iron – crude interface on
the GCM and b) a zoomed in image of the same.
Figure 98 shows the X-ray reconstructions of the iron – crude interface after
the testing described above. Within the crude sample, particles of varying
sizes can be observed both at the interface as well as suspended within the
media. Whilst it is not possible to conclusively determine what these uni-
dentified floating objects (UFOs) are without further elemental analysis,
their presence at the interface may suggest the occurrence of asphaltene
precipitation, migration and deposition towards the iron layer. However,
further analysis to confirm this phenomenon is required as discussed in Sec-
tion 4.5.1
GC
M
Cru
de
Inte
rface
Iron
199
4.5 Conclusion
Whilst very much in its infancy, the work presented in this Chapter outlines
the development of an in-situ low-volume, rapid analysis BAW resonator
study to elucidate the fouling properties of specific heavy crude oil blends.
The literature review presented in Section 4.2 describes the conditions and
factors that are understood to affect the fouling characteristics of heavy
crude oil and specifically asphaltene precipitation along with traditional
methods of combating these issues. The iGCM device proposed here could
provide application for academia and industry alike in the area of both as-
phaltene rejection and conversion to understand both the effect of operating
conditions and the presence of chemical additives.
Within this chapter, the GCM has been identified as a suitable BAW reso-
nator for application at both the required elevated temperatures and pres-
sures necessary for the development of pseudo-refinery and transportation
equipment necessary in the heavy crude oil production chain. The GCM has
been operated as an electrochemical GCM (eGCM) as an in-situ mass mon-
itoring device to determine plating efficiency in the development of the elec-
trodeposited iron layer on the GCM (iGCM). The iGCM has been developed
using literature plating values as well as a system specific calculated coat
method. Both iGCMs’ iron layers were analysed using SEM and EDX and
the calculated coat iGCM was found to produce a more homogeneous finish
with fewer defects. The calculated coat iGCM was further investigated and
has also proven to maintain a high Q-factor and fulfil the standing wave
condition as well as provide stable operation under the proposed investiga-
tive conditions.
The critical temperature of the crude-GCM composite resonator has also
been explored and for the first time, the use of CAS has suggested that the
traditional critical temperature may not occur as originally expected. A dis-
cussion of the propagation of the standing wave through the less viscous
contacting media with the application of temperature is provided as a means
to explain the composite resonators ability to fulfil the standing wave con-
dition.

200
An example analysis of the crude-iGCM is provided in Section 4.4.4 and
whilst not extensive shows the usability of the system in its harshest possible
operating parameters with contacting raw heavy crude oil. The suite of tech-
niques including active and passive microbalance operation alongside X-ray
tomography reconstructions has been shown to provide an excellent analyt-
ical tool in the quest for the elucidation of fouling properties of a specific
setup.
4.5.1 Future work
This work will be further developed in collaboration with the QNRF. There
are several key areas of focus for the successful development of this system
which are outlined as follows:
The electrodeposited iron layer used during this study has proven to be
suitably stable for operation under the investigative conditions. However,
further development and characterisation of the deposited iron layers to
provide a means by which to assimilate the surfaces within different refinery
equipment will prove useful in providing more accurate fouling characteris-
tics. The iron layer development will play a significant role in how the sys-
tem responds to fouling and is expected to be a major part of the develop-
ment of this device for widespread use
The oil sample delivery to the iGCM will also be a key factor in producing
repeatable end-user results. Whilst the microbalance has shown operation
above the critical temperature when in contact with the heavy crude sample,
the current method of pipetting the raw heavy crude sample onto the mi-
crobalance will need further development. Many researchers use model oils
and re-dissolved precipitated asphaltenes during their investigations, as dis-
cussed in Section 4.2.3.3; the implementation of these samples and / or other
pre-treatment techniques to determine the repeatability of results is of crit-
ical importance moving towards the standalone device.
As this system is very much in its infancy, it requires extensive testing and
calibrating along-side known systems and quantities in order to verify its
accuracy and usability. Operating this system with samples known to pro-
duce specific fouling levels and characteristics is an important step in veri-
fying the small volume, rapid sample analysis.
201
The X-ray computed tomography reconstruction for the microbalance sur-
face operating under a crude sample is shown in Figure 98. Whilst it shows
the presence of ‘UFOs’ at the oil microbalance interface, it is difficult to
characterise exactly what is present. Further work to develop a process of
understanding a fouling deposition and / or asphaltene agglomeration and
precipitation is required (possibly at a beam-line with EDX) to confirm ex-
actly what is being measured and subsequently imaged.
The future of this project lays in the development of a standalone product;
an on-site device capable of providing a low volume, rapid and accurate
determination of the fouling properties of a particular heavy crude oil source.
The end user should be able to use the device to regulate how a particular
heavy crude may affect the refinery or transportation equipment and take
the necessary steps to prevent or promote certain outcomes. The develop-
ment of this device can be in many forms, including a vessel that provides
a heated and pressurised flow of sample oil over the resonator’s surface. The
development of such a device may prove difficult and costly to develop, but
will provide the industry with a much-needed feedback sensor.
202
5 Overall Conclusions
5.1 Technique
Throughout this thesis, surface developed BAW resonators have been es-
tablished using a range of methods including in-situ polymer casting onto a
QCM for AAEM characterisation and iron electrodeposition using the
eGCM for heavy crude oil fouling detection. In each case, the techniques
provided thin-film, smooth, reproducible layers with thicknesses ranging be-
tween 20 – 100 nm. Each surface developed BAW resonator has been tested
to ensure fulfilment of the standing wave condition; even when loaded. Crys-
tal admittance spectroscopy and equivalent circuits have been used along-
side active frequency responses throughout these studies and has provided
additional insight into the phenomena occurring at the interfacial layer.
Each study presented within this thesis has an associated bespoke rig design
set up to simulate environments that would typically be found in both an
operating fuel cell (Chapter 3) and within the heavy crude oil production
chain (Chapter 4). Together with the experimental rig setups, the surface
developed BAW resonators have been tested and extensively calibrated to
ensure the frequency response contributions were as a result of the variable
under test only. Where possible, the investigations have been developed
along-side existing technologies and similar literature investigations as a
means for technique verification.
Overall, the results presented within the two studies conducted in this thesis
have shown the versatility of the BAW resonator technology and provided
useful insight into the interfacial phenomena occurring within each energy
system.
5.2 Application
The study specific conclusions and proposed future work is presented within
the corresponding chapters within this thesis, thus only an overview is pre-
sented here.

203
The first study focuses primarily on the commercially available AS-4 iono-
mer as a representative industry standard AAEM. The first investigation
presented within this study has suggested the ionomer’s hydration mecha-
nisms occur in part similar to that of Nafion with a solvation period at RHs
≤ 66% followed by a swelling regime at higher RHs. The second part of the
study explores the AS-4 ionomer instability and degradation when operated
at elevated temperatures as a function of its hydration state. The theories
presented in this section indicate that the degradation pathways are more
dominant when the ionomer is partially hydrated and specifically during the
solvation regime. When the ionomer is operating during the swelling regime,
the results indicate that the ionomer is more stable within the alkaline media
and shows fewer signs of degradation. The final investigation presented
within Chapter 3 assesses the carbonate ion interaction of the AS-4 ionomer
as a function of ionomer hydration. The findings suggest that the ionomer
shows increased interaction with the carbonate ions as it becomes more solv-
ated. This phenomenon is thought to be a direct result of channel hydration
and access of the carbonate ions to the cationic functional headgroups.
In each case, the information gathered using the QCM in combination with
other ex-situ techniques will provide the industry with useful insight into
the ionomer’s operation in order to guide future ionomer integration and
development.
Chapter 4 outlines the initial development of an in-situ feedback sensor for
heavy crude oil fouling detection and characterisation. This Chapter pre-
sents a thorough examination of a high-temperature BAW resonator (GCM)
for operation in harsh conditions (pressure and temperature akin to those
seen within the oil refinery and transportation industries) with an electro-
deposited iron layer and in contact with a viscous contacting media. The
ex-situ X-ray computed tomography investigation presented shows the pres-
ence of ‘UFOs’ both within the contacting oil media and on the iGCM sur-
face, potentially indicating the occurrence of asphaltene precipitation and
deposition onto the iGCM surface. The future of this project in collaboration
with the QNRF is the development and production of an on-site device to
assess the fouling characteristics of particular samples of heavy crude oil.

204
This thesis has shown that the applications of BAW resonators for in-situ
interfacial investigations can provide a powerful tool to offer useful insights
to the processes occurring at the interfacial level to guide future technolog-
ical advancements.
205
6 References
[1] R. L. Filler, "The Acceleration Sensitivity of Quartz Crystal-Oscillators - a Review," (in English), Ieee Transactions on Ultrasonics Ferroelectrics and Frequency Control, vol. 35, no. 3, pp. 297-305, May 1988.
[2] D. A. Buttry and M. D. Ward, "Measurement of Interfacial Processes at Electrode Surfaces with the Electrochemical Quartz Crystal Microbalance," (in English), Chemical Reviews, vol. 92, no. 6, pp. 1355-1379, Sep-Oct 1992.
[3] J. F. Alder and J. J. Mccallum, "Piezoelectric-Crystals for Mass and Chemical Measurements - a Review," (in English), Analyst, vol. 108, no. 1291, pp. 1169-1189, 1983.
[4] A. W. Czanderna. C. Lu, Applications of Piezoelectric Quartz Crystal Microbalances. Elsevier, 1984.
[5] G. Sauerbrey, "Verwendung Von Schwingquarzen Zur Wagung Dunner Schichten Und Zur Mikrowagung," (in English), Zeitschrift Fur Physik, vol. 155, no. 2, pp. 206-222, 1959.
[6] M. Rodahl, F. Hook, A. Krozer, P. Brzezinski, and B. Kasemo, "Quartz-Crystal Microbalance Setup for Frequency and Q-Factor Measurements in Gaseous and Liquid Environments," (in English), Review of Scientific Instruments, vol. 66, no. 7, pp. 3924-3930, Jul 1995.
[7] D. M. Ullevig, J. F. Evans, and M. G. Albrecht, "Effects of Stressed Materials on the Radial Sensitivity Function of a Quartz Crystal Microbalance," (in English), Analytical Chemistry, vol. 54, no. 13, pp. 2341-2343, 1982.
[8] H. Fukuyo, N. Oura, A. Yokoyama, and S. Nonaka, "Thickness-Shear Vibration of Circular Biconvex at-Cut Plates," (in English), Electrical Engineering in Japan, vol. 94, no. 3, pp. 36-42, 1974.
[9] I. Koga, "Radio-Frequency Vibrations of Rectangular at-Cut Quartz Plates," (in English), Journal of Applied Physics, vol. 34, no. 8, pp. 2357-&, 1963.
[10] H. Sekimoto, "Analysis of Trapped Energy Resonators with Circular Electrodes," (in English), Ieee Transactions on Sonics and Ultrasonics, vol. 31, no. 6, pp. 664-669, 1984.
[11] L. V. Rajakovic, B. A. Cavic-Vlasak, V. Ghaemmaghami, K. M. R. Kallury, A. L. Kipling, and M. Thompson, "Mediation of Acoustic Energy Transmission from Acoustic-Wave Sensors to the Liquid-Phase by Interfacial Viscosity," (in English), Analytical Chemistry, vol. 63, no. 6, pp. 615-621, Mar 15 1991.
[12] T. Nomura and O. Hattori, "Determination of Micromolar Concentrations of Cyanide in Solution with a Piezoelectric Detector," (in English), Analytica Chimica Acta, vol. 115, no. Mar, pp. 323-326, 1980.
[13] P. L. Konash and G. J. Bastiaans, "Piezoelectric-Crystals as Detectors in Liquid-Chromatography," (in English), Analytical Chemistry, vol. 52, no. 12, pp. 1929-1931, 1980.
[14] T. Nomura and M. Okuhara, "Frequency-Shifts of Piezoelectric Quartz Crystals Immersed in Organic Liquids," (in English), Analytica Chimica Acta, vol. 142, no. Oct, pp. 281-284, 1982.
[15] S. Bruckenstein and M. Shay, "Insitu Weighing of Atom Layer Thick-Films at Electrodes," (in English), Abstracts of Papers of the American Chemical Society, vol. 186, no. Aug, pp. 45-Anyl, 1983.
[16] M. Thompson, A. L. Kipling, W. C. Duncan-Hewitt, L. V. Rajakovic, and B. A. Cavic-Vlasak, "Thickness-Shear-Mode Acoustic-Wave Sensors in the Liquid-Phase - a Review," (in English), Analyst, vol. 116, no. 9, pp. 881-890, Sep 1991.
[17] K. K. Kanazawa and J. G. Gordon, "The Oscillation Frequency of a Quartz Resonator in Contact with a Liquid," (in English), Analytica Chimica Acta, vol. 175, no. Sep, pp. 99-105, 1985.
206
[18] K. K. Kanazawa and J. G. Gordon, "Frequency of a Quartz Microbalance in Contact with Liquid," (in English), Analytical Chemistry, vol. 57, no. 8, pp. 1770-1771, 1985.
[19] S. Bruckenstein and M. Shay, "Experimental Aspects of Use of the Quartz Crystal Microbalance in Solution," (in English), Electrochimica Acta, vol. 30, no. 10, pp. 1295-1300, 1985.
[20] S. Z. Yao and T. A. Zhou, "Dependence of the Oscillation Frequency of a Piezoelectric Crystal on the Physical Parameters of Liquids," (in English), Analytica Chimica Acta, vol. 212, no. 1-2, pp. 61-72, Sep 15 1988.
[21] S. J. Martin, G. C. Frye, and S. D. Senturia, "Dynamics and Response of Polymer-Coated Surface-Acoustic-Wave Devices - Effect of Viscoelastic Properties and Film Resonance," (in English), Analytical Chemistry, vol. 66, no. 14, pp. 2201-2219, Jul 15 1994.
[22] P. A. Topart and M. A. M. Noel, "High-Frequency Impedance Analysis of Quartz-Crystal Microbalances .2. Electrochemical Deposition and Redox Switching of Conducting Polymers," (in English), Analytical Chemistry, vol. 66, no. 18, pp. 2926-2934, Sep 15 1994.
[23] R. Schumacher, G. Borges, and K. K. Kanazawa, "The Quartz Microbalance - a Sensitive Tool to Probe Surface Reconstructions on Gold Electrodes in Liquid," (in English), Surface Science, vol. 163, no. 1, pp. L621-L626, 1985.
[24] R. Schumacher, "The Quartz Microbalance - a Novel-Approach to the Insitu Investigation of Interfacial Phenomena at the Solid Liquid Junction," (in English), Angewandte Chemie-International Edition in English, vol. 29, no. 4, pp. 329-343, Apr 1990.
[25] W. H. Zhu, W. Z. Wei, Z. H. Mo, L. H. Nie, and S. Z. Yao, "Piezoelectric Detection of Water with a Separated Electrode," (in English), Analytical Chemistry, vol. 65, no. 19, pp. 2568-2571, Oct 1 1993.
[26] H. E. Hager, "Fluid Property Evaluation by Piezoelectric-Crystals Operating in the Thickness Shear Mode," (in English), Chemical Engineering Communications, vol. 43, no. 1-3, pp. 25-38, 1986.
[27] T. A. Zhou, L. H. Nie, and S. Z. Yao, "On Equivalent-Circuits of Piezoelectric Quartz Crystals in a Liquid and Liquid Properties .1. Theoretical Derivation of the Equivalent-Circuit and Effects of Density and Viscosity of Liquids," (in English), Journal of Electroanalytical Chemistry, vol. 293, no. 1-2, pp. 1-18, Oct 25 1990.
[28] H. L. Bandey, S. J. Martin, R. W. Cernosek, and A. R. Hillman, "Modeling the responses of thickness-shear mode resonators under various loading conditions," (in English), Analytical Chemistry, vol. 71, no. 11, pp. 2205-2214, Jun 1 1999.
[29] M. E. Orazem and B. Tribollet, Electrochemical impedance spectroscopy (The Electrochemical Society series). Hoboken, N.J.: Wiley, 2008, pp. xxxi, 523 p.
[30] J. R. Scully, D. C. Silverman, and M. W. Kendig, Electrochemical impedance : analysis and interpretation (Stp, no. 1188). Philadelphia: ASTM, 1993, p. 480 p.
[31] W. G. Cady, Piezoelectricity; an introduction to the theory and applications of electromechanical phenomena in crystals, New rev. ed. New York,: Dover Publications, 1964.
[32] G. P. Martin, B. E. Loveday, and C. Marriott, "The Effect of Bromhexine Hydrochloride on the Viscoelastic Properties of Mucus from the Mini-Pig," (in English), European Respiratory Journal, vol. 3, no. 4, pp. 392-396, Apr 1990.
[33] H. L. Bandey, S. J. Martin, R. W. Cernosek, and A. R. Hillman, "Equivalent-circuit model for the TSM resonator with a viscoelastic film near film resonance," (in English), Chemical Sensors Iv, Proceedings of the Symposium, vol. 99, no. 23, pp. 320-325, 1999.
[34] H. Muramatsu, E. Tamiya, and I. Karube, "Computation of Equivalent-Circuit Parameters of Quartz Crystals in Contact with Liquids and Study of Liquid Properties," (in English), Analytical Chemistry, vol. 60, no. 19, pp. 2142-2146, Oct 1 1988.
207
[35] R. Beck, U. Pittermann, and K. G. Weil, "Impedance Analysis of Quartz Oscillators, Contacted on One Side with a Liquid," (in English), Berichte Der Bunsen-Gesellschaft-Physical Chemistry Chemical Physics, vol. 92, no. 11, pp. 1363-1368, Nov 1988.
[36] A. L. Kipling and M. Thompson, "Network Analysis Method Applied to Liquid-Phase Acoustic-Wave Sensors," (in English), Analytical Chemistry, vol. 62, no. 14, pp. 1514-1519, Jul 15 1990.
[37] S. J. Martin, V. E. Granstaff, and G. C. Frye, "Characterization of a Quartz Crystal Microbalance with Simultaneous Mass and Liquid Loading," (in English), Analytical Chemistry, vol. 63, no. 20, pp. 2272-2281, Oct 15 1991.
[38] S. J. Martin, H. L. Bandey, R. W. Cernosek, A. R. Hillman, and M. J. Brown, "Equivalent-circuit model for the thickness-shear mode resonator with a viscoelastic film near film resonance," (in English), Analytical Chemistry, vol. 72, no. 1, pp. 141-149, Jan 1 2000.
[39] J. F. Rosenbaum, Bulk acoustic wave theory and devices (The Artech House acoustics library). Boston: Artech House, 1988, pp. xiv, 462 p.
[40] M. S. Yang and M. Thompson, "Multiple Chemical Information from the Thickness Shear Mode Acoustic-Wave Sensor in the Liquid-Phase," (in English), Analytical Chemistry, vol. 65, no. 9, pp. 1158-1168, May 1 1993.
[41] T. Nomura and T. Nagamune, "Internal Electrolytic Determination of Silver in Solution with a Piezoelectric Quartz Crystal," (in English), Analytica Chimica Acta, vol. 155, no. Dec, pp. 231-234, 1983.
[42] T. Nomura, M. Watanabe, and T. S. West, "Behavior of Piezoelectric Quartz Crystals in Solutions with Application to the Determination of Iodide," (in English), Analytica Chimica Acta, vol. 175, no. Sep, pp. 107-116, 1985.
[43] T. Nomura and M. Maruyama, "Effect of Metal-Ions on a Piezoelectric Quartz Crystal in Aqueous-Solution and the Adsorptive Determination of Iron(Iii) as Phosphate," (in English), Analytica Chimica Acta, vol. 147, no. Mar, pp. 365-369, 1983.
[44] K. K. Kanazawa and O. R. Melroy, "The Quartz Resonator - Electrochemical Applications," (in English), Ibm Journal of Research and Development, vol. 37, no. 2, pp. 157-171, Mar 1993.
[45] N. Oyama and T. Ohsaka, "Coupling between Electron and Mass-Transfer Kinetics in Electroactive Polymer-Films - an Application of the in-Situ Quartz-Crystal Electrode," (in English), Progress in Polymer Science, vol. 20, no. 5, pp. 761-818, 1995.
[46] T. D. Gierke, G. E. Munn, and F. C. Wilson, "The Morphology in Nafion Perfluorinated Membrane Products, as Determined by Wide-Angle and Small-Angle X-Ray Studies," (in English), Journal of Polymer Science Part B-Polymer Physics, vol. 19, no. 11, pp. 1687-1704, 1981.
[47] E. J. Roche, M. Pineri, R. Duplessix, and A. M. Levelut, "Small-Angle Scattering Studies of Nafion Membranes," (in English), Journal of Polymer Science Part B-Polymer Physics, vol. 19, no. 1, pp. 1-11, 1981.
[48] M. Fujimura, T. Hashimoto, and H. Kawai, "Small-Angle X-Ray-Scattering Study of Perfluorinated Ionomer Membranes .1. Origin of 2 Scattering Maxima," (in English), Macromolecules, vol. 14, no. 5, pp. 1309-1315, 1981.
[49] R. P. O'Hayre, Fuel cell fundamentals, 2nd ed. Hoboken, N.J.: John Wiley & Sons, 2009, pp. xxv, 546 p., 4 p. of plates.
[50] J. Larminie and A. Dicks, Fuel cell systems explained, 2nd ed. Chichester, West Sussex: J. Wiley, 2003, pp. xxii, 406 p.
[51] J. R. Varcoe and R. C. T. Slade, "Prospects for alkaline anion-exchange membranes in low temperature fuel cells," (in English), Fuel Cells, vol. 5, no. 2, pp. 187-200, Apr 2005.
[52] M. A. Hickner, A. M. Herring, and E. B. Coughlin, "Anion Exchange Membranes: Current Status and Moving Forward (vol 51, pg 1727, 2013)," (in English), Journal of Polymer Science Part B-Polymer Physics, vol. 52, no. 4, pp. 347-347, Feb 15 2014.
[53] G. Merle, M. Wessling, and K. Nijmeijer, "Anion exchange membranes for alkaline fuel cells: A review," (in English), Journal of Membrane Science, vol. 377, no. 1-2, pp. 1-35, Jul 15 2011.
208
[54] J. Cheng, G. H. He, and F. X. Zhang, "A mini-review on anion exchange membranes for fuel cell applications: Stability issue and addressing strategies," (in English), International Journal of Hydrogen Energy, vol. 40, no. 23, pp. 7348-7360, Jun 22 2015.
[55] Y. J. Wang, J. L. Qiao, R. Baker, and J. J. Zhang, "Alkaline polymer electrolyte membranes for fuel cell applications," (in English), Chemical Society Reviews, vol. 42, no. 13, pp. 5768-5787, 2013.
[56] G. W. Li, J. Pan, J. J. Han, C. Chen, J. T. Lu, and L. Zhuang, "Ultrathin composite membrane of alkaline polymer electrolyte for fuel cell applications," (in English), Journal of Materials Chemistry A, vol. 1, no. 40, pp. 12497-12502, 2013.
[57] R. Jervis et al., "Hydrogen Oxidation on PdIr/C Catalysts in Alkaline Media," (in English), Journal of the Electrochemical Society, vol. 161, no. 4, pp. F458-F463, 2014.
[58] R. Jervis, N. Mansor, C. Gibbs, C. A. Murray, C. C. Tang, and D. J. L. Brett, "Novel PdIr/C Catalysts for the Hydrogen Oxidation Reaction in Alkaline Media," (in English), Polymer Electrolyte Fuel Cells 13 (Pefc 13), vol. 58, no. 1, pp. 637-650, 2013.
[59] S. Srinivasan, D. J. Manko, H. Koch, M. A. Enayetullah, and A. J. Appleby, "Recent Advances in Solid Polymer Electrolyte Fuel-Cell Technology with Low Platinum Loading Electrodes," (in English), Journal of Power Sources, vol. 29, no. 3-4, pp. 367-387, Feb 1990.
[60] G. F. McLean, T. Niet, S. Prince-Richard, and N. Djilali, "An assessment of alkaline fuel cell technology," (in English), International Journal of Hydrogen Energy, vol. 27, no. 5, pp. 507-526, May 2002.
[61] J. R. Varcoe, R. C. T. Slade, G. L. Wright, and Y. L. Chen, "Steady-state dc and impedance investigations of H-2/O-2 alkaline membrane fuel cells with commercial Pt/C, Ag/C, and Au/C cathodes," (in English), Journal of Physical Chemistry B, vol. 110, no. 42, pp. 21041-21049, Oct 26 2006.
[62] S. Gu et al., "A Soluble and Highly Conductive Ionomer for High-Performance Hydroxide Exchange Membrane Fuel Cells," (in English), Angewandte Chemie-International Edition, vol. 48, no. 35, pp. 6499-6502, 2009.
[63] S. F. Lu, J. Pan, A. B. Huang, L. Zhuang, and J. T. Lu, "Alkaline polymer electrolyte fuel cells completely free from noble metal catalysts," (in English), Proceedings of the National Academy of Sciences of the United States of America, vol. 105, no. 52, pp. 20611-20614, Dec 30 2008.
[64] N. J. Robertson, H. A. Kostalik, T. J. Clark, P. F. Mutolo, H. D. Abruna, and G. W. Coates, "Tunable High Performance Cross-Linked Alkaline Anion Exchange Membranes for Fuel Cell Applications," (in English), Journal of the American Chemical Society, vol. 132, no. 10, pp. 3400-3404, Mar 17 2010.
[65] V. Mehta and J. S. Cooper, "Review and analysis of PEM fuel cell design and manufacturing," (in English), Journal of Power Sources, vol. 114, no. 1, pp. 32-53, Feb 25 2003.
[66] Y. Wang, K. S. Chen, J. Mishler, S. C. Cho, and X. C. Adroher, "A review of polymer electrolyte membrane fuel cells: Technology, applications, and needs on fundamental research," (in English), Applied Energy, vol. 88, no. 4, pp. 981-1007, Apr 2011.
[67] N. Mansor et al., "Development of Graphitic-Carbon Nitride Materials as Catalyst Supports for Polymer Electrolyte Fuel Cells," (in English), Polymer Electrolyte Fuel Cells 13 (Pefc 13), vol. 58, no. 1, pp. 1767-1778, 2013.
[68] W. Vielstich, A. Lamm, and H. A. Gasteiger, Handbook of fuel cells : fundamentals, technology, and applications. Chichester, England ; Hoboken, N.J.: Wiley, 2003, p. 4 v.
[69] S. Srinivasan, D. J. Manko, H. Koch, M. A. Enayetullah, and A. J. Appleby, "Recent Advances in Solid Polymer Electrolyte Fuel-Cell Technology with Low Platinum Loading Electrodes," (in English), Space Electrochemical Research and Technology ( Sert ) 1989, vol. 3056, pp. 95-113, 1989.
209
[70] E. Agel, J. Bouet, and J. F. Fauvarque, "Characterization and use of anionic membranes for alkaline fuel cells," (in English), Journal of Power Sources, vol. 101, no. 2, pp. 267-274, Oct 15 2001.
[71] K. Fukuta, H. Inoue, Y. Chikashige, and H. Yanagi, "Improved Maximum Power Density of Alkaline Membrane Fuel Cells (AMFCs) by the Optimization of MEA Construction," (in English), Batteries and Energy Technology (General) - 217th Ecs Meeting, vol. 28, no. 30, pp. 221-225, 2010.
[72] F. T. Bacon, "The High Pressure Hydrogen-Oxygen Fuel Cell," (in English), Industrial and Engineering Chemistry, vol. 52, no. 4, pp. 301-303, 1960.
[73] R. P. O'Hayre, Fuel cell fundamentals. Hoboken, NJ: John Wiley & Sons, 2006, pp. xxii, 409 p.
[74] M. Cifrain and K. V. Kordesch, "Advances, aging mechanism and lifetime in AFCs with circulating electrolytes," (in English), Journal of Power Sources, vol. 127, no. 1-2, pp. 234-242, Mar 10 2004.
[75] E. Gulzow and M. Schulze, "Long-term operation of AFC electrodes with CO2 containing gases," (in English), Journal of Power Sources, vol. 127, no. 1-2, pp. 243-251, Mar 10 2004.
[76] L. A. Adams, S. D. Poynton, C. Tamain, R. C. T. Slade, and J. R. Varcoe, "A carbon dioxide tolerant aqueous-electrolyte-free anion-exchange membrane alkaline fuel cell," (in English), Chemsuschem, vol. 1, no. 1-2, pp. 79-81, 2008.
[77] M. Unlu, J. Zhou, and P. A. Kohl, "Self Humidifying Hybrid Anion-Cation Membrane Fuel Cell Operated Under Dry Conditions," (in English), Fuel Cells, vol. 10, no. 1, pp. 54-63, Feb 2010.
[78] S. Chempath, J. M. Boncella, L. R. Pratt, N. Henson, and B. S. Pivovar, "Density Functional Theory Study of Degradation of Tetraalkylammonium Hydroxides," (in English), Journal of Physical Chemistry C, vol. 114, no. 27, pp. 11977-11983, Jul 15 2010.
[79] T. J. Mason, J. Millichamp, T. P. Neville, P. R. Shearing, S. Simons, and D. J. L. Brett, "A study of the effect of water management and electrode flooding on the dimensional change of polymer electrolyte fuel cells," (in English), Journal of Power Sources, vol. 242, pp. 70-77, Nov 15 2013.
[80] G. C. Abuin, M. C. Fuertes, and H. R. Corti, "Substrate effect on the swelling and water sorption of Nafion nanomembranes," (in English), Journal of Membrane Science, vol. 428, pp. 507-515, Feb 1 2013.
[81] H. L. Yeager and A. Eisenberg, "Perfluorinated Ionomer Membranes - Introduction," (in English), Acs Symposium Series, vol. 180, pp. 1-6, 1982.
[82] K. Schmidt-Rohr and Q. Chen, "Parallel cylindrical water nanochannels in Nafion fuel-cell membranes," (in English), Nature Materials, vol. 7, no. 1, pp. 75-83, Jan 2008.
[83] T. A. Zawodzinski, T. E. Springer, F. Uribe, and S. Gottesfeld, "Characterization of Polymer Electrolytes for Fuel-Cell Applications," (in English), Solid State Ionics, vol. 60, no. 1-3, pp. 199-211, Mar 1993.
[84] T. A. Zawodzinski et al., "Water-Uptake by and Transport through Nafion(R) 117 Membranes," (in English), Journal of the Electrochemical Society, vol. 140, no. 4, pp. 1041-1047, Apr 1993.
[85] P. Krtil, A. Trojanek, and Z. Samec, "Kinetics of water sorption in Nafionthin films - Quartz crystal microbalance study," (in English), Journal of Physical Chemistry B, vol. 105, no. 33, pp. 7979-7983, Aug 23 2001.
[86] A. Kongkanand, "Interfacial Water Transport Measurements in Nafion Thin Films Using a Quartz-Crystal Microbalance," (in English), Journal of Physical Chemistry C, vol. 115, no. 22, pp. 11318-11325, Jun 9 2011.
[87] D. L. Wood, J. Chlistunoff, J. Majewski, and R. L. Borup, "Nafion Structural Phenomena at Platinum and Carbon Interfaces," (in English), Journal of the American Chemical Society, vol. 131, no. 50, pp. 18096-18104, Dec 23 2009.
[88] M. A. Modestino et al., "Self-Assembly and Transport Limitations in Confined Nafion Films," (in English), Macromolecules, vol. 46, no. 3, pp. 867-873, Feb 12 2013.
210
[89] D. K. Paul, K. Karan, A. Docoslis, J. B. Giorgi, and J. Pearce, "Characteristics of Self-Assembled Ultrathin Nafion Films," (in English), Macromolecules, vol. 46, no. 9, pp. 3461-3475, May 14 2013.
[90] S. K. Dishari and M. A. Hickner, "Antiplasticization and Water Uptake of Nafion Thin Films," (in English), Acs Macro Letters, vol. 1, no. 2, pp. 291-295, Feb 2012.
[91] M. B. Satterfield and J. B. Benziger, "Viscoelastic Properties of Nafion at Elevated Temperature and Humidity," (in English), Journal of Polymer Science Part B-Polymer Physics, vol. 47, no. 1, pp. 11-24, Jan 1 2009.
[92] C. W. Monroe, T. Romero, W. Merida, and M. Eikerling, "A vaporization-exchange model for water sorption and flux in Nafion," (in English), Journal of Membrane Science, vol. 324, no. 1-2, pp. 1-6, Oct 31 2008.
[93] Y. Tabuchi, R. Ito, S. Tsushima, and S. Hirai, "Analysis of in situ water transport in Nafion (R) by confocal micro-Raman spectroscopy," (in English), Journal of Power Sources, vol. 196, no. 2, pp. 652-658, Jan 15 2011.
[94] L. An, T. S. Zhao, Y. S. Li, and Q. X. Wu, "Charge carriers in alkaline direct oxidation fuel cells," (in English), Energy & Environmental Science, vol. 5, no. 6, pp. 7536-7538, Jun 2012.
[95] J. R. Varcoe, M. Beillard, D. M. Halepoto, J. P. Kizewski, S. D. Poynton, and R. C. T. Slade, "Membrane and Electrode Materials for Alkaline Membrane Fuel Cells," (in English), Proton Exchange Membrane Fuel Cells 8, Pts 1 and 2, vol. 16, no. 2, pp. 1819-1834, 2008.
[96] J. R. Varcoe et al., "Anion-exchange membranes in electrochemical energy systems," (in English), Energy & Environmental Science, vol. 7, no. 10, pp. 3135-3191, Oct 2014.
[97] L. An, T. S. Zhao, Q. X. Wu, and L. Zeng, "Comparison of different types of membrane in alkaline direct ethanol fuel cells," (in English), International Journal of Hydrogen Energy, vol. 37, no. 19, pp. 14536-14542, Oct 2012.
[98] K. N. Grew and W. K. S. Chiu, "A Dusty Fluid Model for Predicting Hydroxyl Anion Conductivity in Alkaline Anion Exchange Membranes," Journal of The Electrochemical Society, vol. 157, no. 3, pp. B327-B337, 2010.
[99] Y. S. Li and T. S. Zhao, "Understanding the performance degradation of anion-exchange membrane direct ethanol fuel cells," (in English), International Journal of Hydrogen Energy, vol. 37, no. 5, pp. 4413-4421, Mar 2012.
[100] F. Karas, J. Hnat, M. Paidar, J. Schauer, and K. Bouzek, "Determination of the ion-exchange capacity of anion-selective membranes," (in English), International Journal of Hydrogen Energy, vol. 39, no. 10, pp. 5054-5062, Mar 26 2014.
[101] B. Bauer, H. Strathmann, and F. Effenberger, "Anion-Exchange Membranes with Improved Alkaline Stability," (in English), Desalination, vol. 79, no. 2-3, pp. 125-144, Dec 1990.
[102] S. Chempath, J. M. Boncella, L. R. Pratt, N. Henson, and B. S. Pivovar, "Density Functional Theory Study of Degradation of Tetraalkylammonium Hydroxides," The Journal of Physical Chemistry C, vol. 114, no. 27, pp. 11977-11983, 2010/07/15 2010.
[103] A. A. Zagorodni, D. L. Kotova, and V. F. Selemenev, "Infrared spectroscopy of ion exchange resins: chemical deterioration of the resins," (in English), Reactive & Functional Polymers, vol. 53, no. 2-3, pp. 157-171, 2002.
[104] V. Neagu, I. Bunia, and I. Plesca, "Ionic polymers - VI. Chemical stability of strong base anion exchangers in aggressive media," (in English), Polymer Degradation and Stability, vol. 70, no. 3, pp. 463-468, 2000.
[105] S. Chempath et al., "Mechanism of tetraalkylammonium headgroup degradation in alkaline fuel cell membranes," (in English), Journal of Physical Chemistry C, vol. 112, no. 9, pp. 3179-3182, Mar 6 2008.
[106] E. N. Komkova, D. F. Stamatialis, H. Strathmann, and M. Wessling, "Anion-exchange membranes containing diamines: preparation and
211
stability in alkaline solution," (in English), Journal of Membrane Science, vol. 244, no. 1-2, pp. 25-34, Nov 15 2004.
[107] W. K. Musker, "Nitrogen Ylides from Tetramethylammonium Salts," (in English), Journal of Chemical Education, vol. 45, no. 3, pp. 200-&, 1968.
[108] C. S. Macomber, J. M. Boncella, B. S. Pivovar, and J. A. Rau, "Decomposition pathways of an alkaline fuel cell membrane material component via evolved gas analysis," (in English), Journal of Thermal Analysis and Calorimetry, vol. 93, no. 1, pp. 225-229, Jul 2008.
[109] C. G. Arges and V. Ramani, "Two-dimensional NMR spectroscopy reveals cation-triggered backbone degradation in polysulfone-based anion exchange membranes," (in English), Proceedings of the National Academy of Sciences of the United States of America, vol. 110, no. 7, pp. 2490-2495, Feb 12 2013.
[110] C. G. Arges, L. H. Wang, J. Parrondo, and V. Ramani, "Best Practices for Investigating Anion Exchange Membrane Suitability for Alkaline Electrochemical Devices: Case Study Using Quaternary Ammonium Poly(2,6-dimethyl 1,4-phenylene)oxide Anion Exchange Membranes," (in English), Journal of the Electrochemical Society, vol. 160, no. 11, pp. F1258-F1274, 2013.
[111] D. Y. Chen and M. A. Hickner, "Degradation of Imidazolium- and Quaternary Ammonium-Functionalized Poly(fluorenyl ether ketone sulfone) Anion Exchange Membranes," (in English), Acs Applied Materials & Interfaces, vol. 4, no. 11, pp. 5775-5781, Nov 2012.
[112] A. D. Mohanty, S. E. Tignor, J. A. Krause, Y. K. Choe, and C. Bae, "Systematic Alkaline Stability Study of Polymer Backbones for Anion Exchange Membrane Applications," (in English), Macromolecules, vol. 49, no. 9, pp. 3361-3372, May 10 2016.
[113] V. J. Bharath et al., "Measurement of water uptake in thin-film Nafion and anion alkaline exchange membranes using the quartz crystal microbalance," (in English), Journal of Membrane Science, vol. 497, pp. 229-238, Jan 1 2016.
[114] Y. S. Li, T. S. Zhao, and W. W. Yang, "Measurements of water uptake and transport properties in anion-exchange membranes," (in English), International Journal of Hydrogen Energy, vol. 35, no. 11, pp. 5656-5665, Jun 2010.
[115] S. C. B.R. Einsla, L.R. Pratt, J.M. Boncella, J. Rau, C. Macomber and B.S. Pivovar "Stability of Cations for Anion Exchange Membrane Fuel Cells " ECS Transactions, vol. 11, no. 1, pp. 1173-1180, 2007.
[116] J. A. Vega, C. Chartier, S. Smith, and W. E. Mustain, "Effect of Carbonate on Oxygen Reduction, Hydrogen Oxidation and Anion Exchange Membrane Chemical Stability," (in English), Polymer Electrolyte Fuel Cells 10, Pts 1 and 2, vol. 33, no. 1, pp. 1735-1749, 2010.
[117] J. F. Zhou, M. Unlu, J. A. Vega, and P. A. Kohl, "Anionic polysulfone ionomers and membranes containing fluorenyl groups for anionic fuel cells," (in English), Journal of Power Sources, vol. 190, no. 2, pp. 285-292, May 15 2009.
[118] Fakuta K., Inoue H., Watanabe S., Yanagi H., "In-Situ Observation of CO2 through the Self-purging in Alkaline Membrane Fuel Cell (AMFC) " ECS Transactions, vol. 23-27, no. 19, 2009.
[119] Y. Matsui, M. Saito, A. Tasaka, and M. Inaba, "Influence of Carbon Dioxide on the Performance of Anion-Exchange Membrane Fuel Cells," (in English), Ecs Transactions, vol. 25, no. 13, pp. 105-110, 2010.
[120] J. L. Yan and M. A. Hickner, "Anion Exchange Membranes by Bromination of Benzylmethyl-Containing Poly(sulfone)s," (in English), Macromolecules, vol. 43, no. 5, pp. 2349-2356, Mar 9 2010.
[121] H. Yanagi and K. Fukuta, "Anion Exchange Membrane and Ionomer for Alkaline Membrane Fuel Cells (AMFCs)," (in English), Proton Exchange Membrane Fuel Cells 8, Pts 1 and 2, vol. 16, no. 2, pp. 257-262, 2008.
[122] A. Tewari, V. Sambhy, M. U. Macdonald, and A. Sen, "Quantification of carbon dioxide poisoning in air breathing alkaline fuel cells," (in English), Journal of Power Sources, vol. 153, no. 1, pp. 1-10, Jan 23 2006.
212
[123] T. P. Pandey et al., "Interplay between water uptake, ion interactions, and conductivity in an e-beam grafted poly(ethylene-co-tetrafluoroethylene) anion exchange membrane," (in English), Physical Chemistry Chemical Physics, vol. 17, no. 6, pp. 4367-4378, 2015.
[124] A. H. England, A. M. Duffin, C. P. Schwartz, J. S. Uejio, D. Prendergast, and R. J. Saykally, "On the hydration and hydrolysis of carbon dioxide," (in English), Chemical Physics Letters, vol. 514, no. 4-6, pp. 187-195, Oct 6 2011.
[125] V.J. Bharath et al., "Effect of humidity on the interaction of CO2 with alkaline anion exchange membranes probed using the quartz crystal microbalance," International Journal of Hydrogen Energy, vol. 42, no. 38, pp. 24301-24307, 2017.
[126] Q. J. Duan, S. H. Ge, and C. Y. Wang, "Water uptake, ionic conductivity and swelling properties of anion-exchange membrane," (in English), Journal of Power Sources, vol. 243, pp. 773-778, Dec 1 2013.
[127] V. J. Bharath et al., "Alkaline anion exchange membrane degradation as a function of humidity measured using the quartz crystal microbalance," (in English), International Journal of Hydrogen Energy, vol. 42, no. 9, pp. 6243-6249, Mar 2 2017.
[128] K. M. Lakin, "A review of thin-film resonator technology," (in English), Ieee Microwave Magazine, vol. 4, no. 4, pp. 61-67, Dec 2003.
[129] J. M. Slater and E. J. Watt, "Examination of Ammonia Poly(Pyrrole) Interactions by Piezoelectric and Conductivity Measurements," (in English), Analyst, vol. 116, no. 11, pp. 1125-1130, Nov 1991.
[130] S. R. Systems, "QCM100- Quartz Crystal Microbalance Theory and Calibration," Available: http://www.thinksrs.com/downloads/PDFs/ApplicationNotes/QCMTheoryapp.pdf
[131] C. K. O’Sullivan and G. G. Guilbault, "Commercial quartz crystal
microbalances – theory and applications," Biosensors and Bioelectronics, vol. 14, no. 8–9, pp. 663-670, 1999.
[132] J. P. Kizewski, N. H. Mudri, R. Zeng, S. D. Poynton, R. C. T. Slade, and J. R. Varcoe, "Alkaline Electrolytes and Reference Electrodes for Alkaline Polymer Electrolyte Membrane Fuel Cells," (in English), Polymer Electrolyte Fuel Cells 10, Pts 1 and 2, vol. 33, no. 1, pp. 27-35, 2010.
[133] E. R. Benes, R. Groschl, F. Seifert, and A. Pohl, "Comparison between BAW and SAW sensor principles," (in English), Ieee Transactions on Ultrasonics Ferroelectrics and Frequency Control, vol. 45, no. 5, pp. 1314-1330, Sep 1998.
[134] J. A. Vega and W. E. Mustain, "Effect of CO2, HCO3- and CO3-2 on oxygen reduction in anion exchange membrane fuel cells," (in English), Electrochimica Acta, vol. 55, no. 5, pp. 1638-1644, Feb 1 2010.
[135] L. A. Diaz, G. C. Abuin, and H. R. Corti, "Methanol sorption and permeability in Nafion and acid-doped PBI and ABPBI membranes," (in English), Journal of Membrane Science, vol. 411, pp. 35-44, Sep 1 2012.
[136] J. John et al., "An Electrochemical Quartz Crystal Microbalance Study of a Prospective Alkaline Anion Exchange Membrane Material for Fuel Cells: Anion Exchange Dynamics and Membrane Swelling," (in English), Journal of the American Chemical Society, vol. 136, no. 14, pp. 5309-5322, Apr 9 2014.
[137] J. Millichamp et al., "Application of a GaPO4 Crystal Microbalance for the Detection of Coke Formation in High-Temperature Reactors and Solid Oxide Fuel Cells," (in English), Industrial & Engineering Chemistry Research, vol. 50, no. 13, pp. 8371-8375, Jul 6 2011.
[138] J. Millichamp et al., "A study of carbon deposition on solid oxide fuel cell anodes using electrochemical impedance spectroscopy in combination with a high temperature crystal microbalance," (in English), Journal of Power Sources, vol. 235, pp. 14-19, Aug 1 2013.
[139] J. Larminie and A. Dicks, Fuel cell systems explained, 2nd ed. Chichester, West Sussex: J. Wiley, 2003, pp. xxii, 406 p.
213
[140] J. W. Elam and M. J. Pellin, "GaPO(4) sensors for gravimetric monitoring during atomic layer deposition at high temperatures," (in English), Analytical Chemistry, vol. 77, no. 11, pp. 3531-3535, Jun 1 2005.
[141] F. Pascal-Delannoy, B. Sorli, and A. Boyer, "Quartz Crystal Microbalance (QCM) used as humidity sensor," (in English), Sensors and Actuators a-Physical, vol. 84, no. 3, pp. 285-291, Sep 1 2000.
[142] S. Y. Kwon, Y. I. Choi, J. C. Kim, and H. S. Nham, "A highly stable quartz crystal microbalance sensor and its application to water vapor measurements," (in English), Journal of the Korean Physical Society, vol. 48, no. 1, pp. 161-165, Jan 2006.
[143] K. Jaruwongrungsee, A. Tuantranont, Y. Wanna, A. Wisitsoraat, and T. Lomas, "Quartz Crystal Microbalance Humidity Sensor using Electrospun PANI Micro/nano Dots," (in English), 2007 7th Ieee Conference on Nanotechnology, Vol 1-3, pp. 316-319, 2007.
[144] H. K. John J, Rivera-Meléndez J, Kostalik HA 4th, Rus ED, Wang H,
Coates GW, Abruña HD., "An electrochemical quartz crystal microbalance study of a prospective alkaline anion exchange membrane material for fuel cells: anion exchange dynamics and membrane swelling.," J Am Chem Soc, pp. 5309–5322, 2014.
[145] T. A. Zawodzinski et al., "A Comparative-Study of Water-Uptake by and Transport through Ionomeric Fuel-Cell Membranes," (in English), Journal of the Electrochemical Society, vol. 140, no. 7, pp. 1981-1985, Jul 1993.
[146] C. Vallieres, D. Winkelmann, D. Roizard, E. Favre, P. Scharfer, and M. Kind, "On Schroeder's paradox," (in English), Journal of Membrane Science, vol. 278, no. 1-2, pp. 357-364, Jul 5 2006.
[147] L. M. Onishi, J. M. Prausnitz, and J. Newman, "Water-nafion equilibria. Absence of Schroeder's paradox," (in English), Journal of Physical Chemistry B, vol. 111, no. 34, pp. 10166-10173, Aug 30 2007.
[148] J. R. Varcoe, R. C. T. Slade, E. L. H. Yee, S. D. Poynton, and D. J. Driscoll, "Investigations into the ex situ methanol, ethanol and ethylene glycol permeabilities of alkaline polymer electrolyte membranes," (in English), Journal of Power Sources, vol. 173, no. 1, pp. 194-199, Nov 8 2007.
[149] J. R. Varcoe, "Investigations of the ex situ ionic conductivities at 30 degrees C of metal-cation-free quaternary ammonium alkaline anion-exchange membranes in static atmospheres of different relative humidities," (in English), Physical Chemistry Chemical Physics, vol. 9, no. 12, pp. 1479-1486, 2007.
[150] D. Stoica, L. Ogier, L. Akrour, F. Alloin, and J. F. Fauvarque, "Anionic membrane based on polyepichlorhydrin matrix for alkaline fuel cell: Synthesis, physical and electrochemical properties," (in English), Electrochimica Acta, vol. 53, no. 4, pp. 1596-1603, Dec 31 2007.
[151] G. C. Abuin, P. Nonjola, E. A. Franceschini, F. H. Izraelevitch, M. K. Mathe, and H. R. Corti, "Characterization of an anionic-exchange membranes for direct methanol alkaline fuel cells," (in English), International Journal of Hydrogen Energy, vol. 35, no. 11, pp. 5849-5854, Jun 2010.
[152] J. T. Hinatsu, M. Mizuhata, and H. Takenaka, "Water-Uptake of Perfluorosulfonic Acid Membranes from Liquid Water and Water-Vapor," (in English), Journal of the Electrochemical Society, vol. 141, no. 6, pp. 1493-1498, Jun 1994.
[153] G. W. Li et al., "Carbonation effects on the performance of alkaline polymer electrolyte fuel cells," (in English), International Journal of Hydrogen Energy, vol. 40, no. 20, pp. 6655-6660, Jun 1 2015.
[154] A. Saniere, I. Henaut, and J. F. Argillier, "Pipeline transportation of heavy oils, a strategic, economic and technological challenge," (in English), Oil & Gas Science and Technology-Revue D Ifp Energies Nouvelles, vol. 59, no. 5, pp. 455-466, Sep-Oct 2004.
[155] M. S. Rana, V. Samano, J. Ancheyta, and J. A. I. Diaz, "A review of recent advances on process technologies for upgrading of heavy oils and residua," (in English), Fuel, vol. 86, no. 9, pp. 1216-1231, Jun 2007.
214
[156] S. Chopra, L. Lines, D. Schmitt, and M. Batzle, "Heavy Oils: Reservoir Characterization and Production Monitoring Preface," (in English), Heavy Oils: Reservoir Characterization and Production Monitoring, vol. 13, pp. Xvii-Xix, 2010.
[157] J. G. Speight, The chemistry and technology of petroleum, 4th ed. (Chemical industries, no. 114). Boca Raton: CRC Press/Taylor & Francis, 2007, p. 945 p.
[158] J. A. Moulijn, M. Makkee, and A. v. Diepen, Chemical process technology. New York: John Wiley & Sons, 2001, pp. xii, 453 p.
[159] K. J. Leontaritis, "The asphaltene and wax deposition envelopes," (in English), Fuel Science & Technology International, vol. 14, no. 1-2, pp. 13-39, 1996.
[160] C. Bollet, J. C. Escalier, C. Souteyrand, M. Caude, and R. Rosset, "Rapid Separation of Heavy Petroleum-Products by High-Performance Liquid-Chromatography," (in English), Journal of Chromatography, vol. 206, no. 2, pp. 289-300, 1981.
[161] J. R. Becker, Crude oil waxes, emulsions, and asphaltenes. Tulsa, Okla.: Pennwell Books, 1997, pp. ix, 276 p.
[162] N. Aske, H. Kallevik, and J. Sjoblom, "Determination of saturate, aromatic, resin, and asphaltenic (SARA) components in crude oils by means of infrared and near-infrared spectroscopy," (in English), Energy & Fuels, vol. 15, no. 5, pp. 1304-1312, Sep-Oct 2001.
[163] J. Sjoblom et al., "Our current understanding of water-in-crude oil emulsions. Recent characterization techniques and high pressure performance," (in English), Advances in Colloid and Interface Science, vol. 100, pp. 399-473, Feb 28 2003.
[164] B. J. Fuhr, C. Cathrea, L. Coates, H. Kalra, and A. I. Majeed, "Properties of Asphaltenes from a Waxy Crude," (in English), Fuel, vol. 70, no. 11, pp. 1293-1297, Nov 1991.
[165] L. H. Ali and K. A. Alghannam, "Investigations into Asphaltenes in Heavy Crude Oils .1. Effect of Temperature on Precipitation by Alkane Solvents," (in English), Fuel, vol. 60, no. 11, pp. 1043-1046, 1981.
[166] A. Hirschberg, L. N. J. Dejong, B. A. Schipper, and J. G. Meijer, "Influence of Temperature and Pressure on Asphaltene Flocculation," (in English), Society of Petroleum Engineers Journal, vol. 24, no. 3, pp. 283-293, 1984.
[167] P. Fotland, "Precipitation of asphaltenes at high pressures; Experimental technique and results," (in English), Fuel Science & Technology International, vol. 14, no. 1-2, pp. 313-325, 1996.
[168] H. Laux, I. Rahimian, and D. Browarzik, "Flocculation of asphaltenes at high pressure. I. Experimental determination of the onset of flocculation," (in English), Petroleum Science and Technology, vol. 19, no. 9-10, pp. 1155-1166, 2001.
[169] E. Y. Sheu, "Physics of asphaltene micelles and microemulsions - Theory and experiment," (in English), Journal of Physics-Condensed Matter, vol. 8, no. 25A, pp. A125-A141, Jun 17 1996.
[170] L. Z. Pillon, "Interfacial Properties of Petroleum Products," (in English), Interfacial Properties of Petroleum Products, vol. 120, pp. 1-348, 2007.
[171] T. R. Bott, Fouling of heat exchangers (Chemical engineering monographs, no. 26). Amsterdam ; New York: Elsevier, 1995, pp. xxii, 524 p.
[172] J. N. H. Tiratsoo, Pipeline pigging technology, 2nd ed. Houston: Gulf Pub. Co., 1992, pp. xx, 460 p.
[173] J. S. Buckley and J. X. Wang, "Crude oil and asphaltene characterization for prediction of wetting alteration," (in English), Journal of Petroleum Science and Engineering, vol. 33, no. 1-3, pp. 195-202, Apr 2002.
[174] S. Asomaning, "Petroleum chemistry and the fouling behavior of crude oils.," (in English), Abstracts of Papers of the American Chemical Society, vol. 226, pp. U259-U259, Sep 2003.
[175] J. J. Adams, "Asphaltene Adsorption, a Literature Review," (in English), Energy & Fuels, vol. 28, no. 5, pp. 2831-2856, May 2014.
[176] C. Drummond and J. Israelachvili, "Fundamental studies of crude oil-surface water interactions and its relationship to reservoir wettability," (in
215
English), Journal of Petroleum Science and Engineering, vol. 45, no. 1-2, pp. 61-81, Nov 30 2004.
[177] R. Z. Syunyaev, R. M. Balabin, I. S. Akhatov, and J. O. Safieva, "Adsorption of Petroleum Asphaltenes onto Reservoir Rock Sands Studied by Near-Infrared (NIR) Spectroscopy," (in English), Energy & Fuels, vol. 23, pp. 1230-1236, Mar-Apr 2009.
[178] J. S. Buckley and Y. Liu, "Some mechanisms of crude oil/brine/solid interactions," (in English), Journal of Petroleum Science and Engineering, vol. 20, no. 3-4, pp. 155-160, Jun 1998.
[179] J. L. M. de la Cruz, F. J. Arguelles-Vivas, V. Matias-Perez, C. D. Duran-Valencia, and S. Lopez-Ramirez, "Asphaltene-Induced Precipitation and Deposition During Pressure Depletion on a Porous Medium: An Experimental Investigation and Modeling Approach," (in English), Energy & Fuels, vol. 23, pp. 5611-5625, Nov 2009.
[180] M. Vafaie-Sefti and S. A. Mousavi-Dehghani, "Application of association theory to the prediction of asphaltene deposition: Deposition due to natural depletion and miscible gas injection processes in petroleum reservoirs," (in English), Fluid Phase Equilibria, vol. 247, no. 1-2, pp. 182-189, Sep 15 2006.
[181] A. Cosultchi, P. Rossbach, and I. Hernandez-Calderon, "XPS analysis of petroleum well tubing adherence," (in English), Surface and Interface Analysis, vol. 35, no. 3, pp. 239-245, Mar 2003.
[182] T. Masuda and K. Hashimoto, "Deactivation of zeolite catalysts by coke," (in English), Deactivation and Testing of Hydrocarbon-Processing Catalysts, vol. 634, pp. 62-76, 1996.
[183] C. H. Bartholomew, "Mechanisms of catalyst deactivation," (in English), Applied Catalysis a-General, vol. 212, no. 1-2, pp. 17-60, Apr 30 2001.
[184] C. Marchal, E. Abdessalem, M. Tayakout-Fayolle, and D. Uzio, "Asphaltene Diffusion and Adsorption in Modified NiMo Alumina Catalysts Followed by Ultraviolet (UV) Spectroscopy," (in English), Energy & Fuels, vol. 24, pp. 4290-4300, Aug 2010.
[185] I. Gawel, D. Bociarska, and P. Biskupski, "Effect of asphaltenes on hydroprocessing of heavy oils and residua," (in English), Applied Catalysis a-General, vol. 295, no. 1, pp. 89-94, Oct 13 2005.
[186] M. Barcenas, P. Orea, E. Buenrostro-Gonzalez, L. S. Zamudio-Rivera, and Y. Duda, "Study of medium effect on asphaltene agglomeration inhibitor efficiency," (in English), Energy & Fuels, vol. 22, no. 3, pp. 1917-1922, May-Jun 2008.
[187] C. L. Chang and H. S. Fogler, "Peptization and coagulation of asphaltenes in apolar media using oil-soluble polymers," (in English), Fuel Science & Technology International, vol. 14, no. 1-2, pp. 75-100, 1996.
[188] J. A. Ostlund, M. Nyden, H. S. Fogler, and K. Holmberg, "Functional groups in fractionated asphaltenes and the adsorption of amphiphilic molecules," (in English), Colloids and Surfaces a-Physicochemical and Engineering Aspects, vol. 234, no. 1-3, pp. 95-102, Feb 26 2004.
[189] S. W. Hasan, M. T. Ghannam, and N. Esmail, "Heavy crude oil viscosity reduction and rheology for pipeline transportation," (in English), Fuel, vol. 89, no. 5, pp. 1095-1100, May 2010.
[190] U. G. Romanova, H. W. Yarranton, L. L. Schramm, and W. E. Shelfantook, "Investigation of oil sands froth treatment," (in English), Canadian Journal of Chemical Engineering, vol. 82, no. 4, pp. 710-721, Aug 2004.
[191] Y. X. Zhao and F. Wei, "Simultaneous removal of asphaltenes and water from water-in-bitumen emulsion: I. Fundamental development," (in English), Fuel Processing Technology, vol. 89, no. 10, pp. 933-940, Oct 2008.
[192] A. Duong and K. J. Smith, "A model of ceramic membrane fouling during heavy oil ultrafiltration," (in English), Canadian Journal of Chemical Engineering, vol. 75, no. 6, pp. 1122-1129, Dec 1997.
[193] H. L. Wang, G. Wang, B. J. Shen, C. M. Xu, and J. S. Gao, "Upgrading Residue by Carbon Rejection in a Fluidized-Bed Reactor and Its Multiple Lump Kinetic Model," (in English), Industrial & Engineering Chemistry Research, vol. 50, no. 22, pp. 12501-12511, Nov 16 2011.
216
[194] O. C. Mullins et al., "The colloidal structure of crude oil and the structure of oil reservoirs," (in English), Energy & Fuels, vol. 21, no. 5, pp. 2785-2794, Sep-Oct 2007.
[195] O. C. Mullins, E. Y. Sheu, Fine Particle Society. Meeting, American Chemical Society. Division of Fuel Chemistry., and American Chemical Society. Division of Petroleum Chemistry., Structures and dynamics of asphaltenes / edited by Oliver C. Mullins and Eric Y. Sheu. New York: Plenum Press, 1998, pp. x, 438 p.
[196] J. F. Schabron et al., "Waxphaltene Determinator Method for Automated Precipitation and Redissolution of Wax and Asphaltene Components," (in English), Energy & Fuels, vol. 26, no. 4, pp. 2256-2268, Apr 2012.
[197] O. C. Mullins, Asphaltenes, heavy oils, and petroleomics. New York: Springer, 2007, pp. xxi, 669 p.
[198] H. Sabbah, A. L. Morrow, A. E. Pomerantz, and R. N. Zare, "Evidence for Island Structures as the Dominant Architecture of Asphaltenes," (in English), Energy & Fuels, vol. 25, no. 4, pp. 1597-1604, Apr 2011.
[199] S. Acevedo et al., "Importance of asphaltene aggregation in solution in determining the adsorption of this sample on mineral surfaces," (in English), Colloids and Surfaces a-Physicochemical and Engineering Aspects, vol. 166, no. 1-3, pp. 145-152, Jun 15 2000.
[200] O. C. Mullins et al., "Advances in Asphaltene Science and the Yen-Mullins Model," (in English), Energy & Fuels, vol. 26, no. 7, pp. 3986-4003, Jul 2012.
[201] S. Q. Wang, J. J. Liu, L. Y. Zhang, J. Masliyah, and Z. H. Xu, "Interaction Forces between Asphaltene Surfaces in Organic Solvents," (in English), Langmuir, vol. 26, no. 1, pp. 183-190, Jan 5 2010.
[202] R. Tanaka, E. Sato, J. E. Hunt, R. E. Winans, S. Sato, and T. Takanohashi, "Characterization of asphaltene aggregates using X-ray diffraction and small-angle X-ray scattering," (in English), Energy & Fuels, vol. 18, no. 4, pp. 1118-1125, Jul-Aug 2004.
[203] F. M. Faus, P. Grange, and B. Delmon, "Influence of Asphaltene Deposition on Catalytic Activity of Cobalt Molybdenum on Alumina Catalysts," (in English), Applied Catalysis, vol. 11, no. 2-3, pp. 281-293, 1984.
[204] P. M. Spiecker, K. L. Gawrys, C. B. Trail, and P. K. Kilpatrick, "Effects of petroleum resins on asphaltene aggregation and water-in-oil emulsion formation," (in English), Colloids and Surfaces a-Physicochemical and Engineering Aspects, vol. 220, no. 1-3, pp. 9-27, Jun 30 2003.
[205] S. Simon, J. Jestin, T. Palermo, and L. Barre, "Relation between Solution and Interfacial Properties of Asphaltene Aggregates," (in English), Energy & Fuels, vol. 23, no. 1, pp. 306-313, Jan-Feb 2009.
[206] O. C. Mullins, D. J. Seifert, J. Y. Zuo, and M. Zeybek, "Clusters of Asphaltene Nanoaggregates Observed in Oilfield Reservoirs," (in English), Energy & Fuels, vol. 27, no. 4, pp. 1752-1761, Apr 2013.
[207] M. R. Gray, R. R. Tykwinski, J. M. Stryker, and X. L. Tan, "Supramolecular Assembly Model for Aggregation of Petroleum Asphaltenes," (in English), Energy & Fuels, vol. 25, no. 7, pp. 3125-3134, Jul 2011.
[208] A. Zahabi and M. R. Gray, "Kinetics and Properties of Asphaltene Adsorption on Surfaces," (in English), Energy & Fuels, vol. 26, no. 2, pp. 1009-1018, Feb 2012.
[209] E. Czarnecka and J. E. Gillott, "Formation and Characterization of Clay Complexes with Bitumen from Athabasca Oil Sand," (in English), Clays and Clay Minerals, vol. 28, no. 3, pp. 197-203, 1980.
[210] A. Abudu and L. Goual, "Adsorption of Crude Oil on Surfaces Using Quartz Crystal Microbalance with Dissipation (QCM-D) under Flow Conditions," (in English), Energy & Fuels, vol. 23, pp. 1237-1248, Mar-Apr 2009.
[211] S. E. Moschopedis, J. F. Fryer, and J. G. Speight, "Investigation of Asphaltene Molecular-Weights," (in English), Fuel, vol. 55, no. 3, pp. 227-232, 1976.
217
[212] K. Kumar, E. Dao, and K. K. Mohanty, "AFM study of mineral wettability with reservoir oils," (in English), Journal of Colloid and Interface Science, vol. 289, no. 1, pp. 206-217, Sep 1 2005.
[213] P. Ekholm, E. Blomberg, P. Claesson, I. H. Auflem, J. Sjoblom, and A. Kornfeldt, "A quartz crystal microbalance study of the adsorption of asphaltenes and resins onto a hydrophilic surface," (in English), Journal of Colloid and Interface Science, vol. 247, no. 2, pp. 342-350, Mar 15 2002.
[214] S. Acevedo, M. A. Ranaudo, G. Escobar, L. Gutierrez, and P. Ortega, "Adsorption of Asphaltenes and Resins on Organic and Inorganic Substrates and Their Correlation with Precipitation Problems in Production Well Tubing," (in English), Fuel, vol. 74, no. 4, pp. 595-598, Apr 1995.
[215] O. Leon et al., "Adsorption of native resins on asphaltene particles: A correlation between adsorption and activity," (in English), Langmuir, vol. 18, no. 13, pp. 5106-5112, Jun 25 2002.
[216] J. Castillo, S. Goncalves, A. Fernandez, and V. Mujica, "Applications of photothermal displacement spectroscopy to the study of asphaltenes adsorption," (in English), Optics Communications, vol. 145, no. 1-6, pp. 69-75, Jan 1 1998.
[217] S. I. Adersen, J. M. del Rio, D. Khvostitchenko, S. Shakir, and C. Lira-Galeana, "Interaction and solubilization of water by petroleum asphaltenes in organic solution," (in English), Langmuir, vol. 17, no. 2, pp. 307-313, Jan 23 2001.
[218] J. C. Petersen and H. Plancher, "Model studies and interpretive review of the competitive adsorption and water displacement of petroleum asphalt chemical functionalities on mineral aggregate surfaces," (in English), Petroleum Science and Technology, vol. 16, no. 1-2, pp. 89-131, 1998.
[219] Y. W. Jeon, S. H. Yi, and S. J. Choi, "Adsorption of Asphaltene Functionalities and Asphaltene on Goethite," (in English), Fuel Science & Technology International, vol. 13, no. 2, pp. 195-214, 1995.
[220] V. Nalwaya, V. Tantayakom, P. Piumsomboon, and S. Fogler, "Studies on asphaltenes through analysis of polar fractions (vol 43, pg 7682, 2004)," (in English), Industrial & Engineering Chemistry Research, vol. 43, no. 23, pp. 7682-7682, Nov 10 2004.
[221] H. Alboudwarej, D. Pole, W. Y. Svrcek, and H. W. Yarranton, "Adsorption of asphaltenes on metals," (in English), Industrial & Engineering Chemistry Research, vol. 44, no. 15, pp. 5585-5592, Jul 20 2005.
[222] C. Xing, R. W. Hilts, and J. M. Shaw, "Sorption of Athabasca Vacuum Residue Constituents on Synthetic Mineral and Process Equipment Surfaces from Mixtures with Pentane," (in English), Energy & Fuels, vol. 24, pp. 2500-2513, Apr 2010.
[223] K. C. S. Yao, "Removal of basic nitrogen compounds from extracted oils by use of acidic polar adsorbents and the regeneration of said adsorbents," United States, 1989. Available: http://www.freepatentsonline.com/4846962.html.
[224] D. Y. H. Ngan, "Process for removal of polynuclear aromatics from a hydrocarbon in an endothermic reformer reaction system," United States, 1989. Available: http://www.freepatentsonline.com/4804457.html.
[225] M. Gorbaty, "SELECTIVE ADSORPTION PROCESS FOR RESID UPGRADING," 1999. Available: http://www.freepatentsonline.com/WO1999031199.html.
[226] C. Russell and R. Sharpe, "Characteristics of heavy residue pyrolysis: A systematic approach to the design of fouling mitigation strategies using chemical additives," (in English), Abstracts of Papers of the American Chemical Society, vol. 244, Aug 19 2012.
[227] K. U. Ogbuneke, C. E. Snape, J. M. Andresen, S. Crozier, C. Russell, and R. Sharpe, "Identification of a Polycyclic Aromatic Hydrocarbon Indicator for the Onset of Coke Formation during Visbreaking of a Vacuum Residue," (in English), Energy & Fuels, vol. 23, pp. 2157-2163, Mar-Apr 2009.
[228] C. A. Russell, S. Crozier, and R. Sharpe, "Observations from Heavy Residue Pyrolysis: A Novel Method To Characterize Fouling Potential and
218
Assess Antifoulant Additive Performance," (in English), Energy & Fuels, vol. 24, pp. 5483-5492, Oct 2010.
[229] G. T. S. Savage, Russell, Christopher A. "SURFACE PASSIVATION METHOD FOR FOULING REDUCTION," United States, 2016. Available: http://www.freepatentsonline.com/y2016/0237357.html.
[230] D. Damjanovic, "Materials for high temperature piezoelectric transducers," (in English), Current Opinion in Solid State & Materials Science, vol. 3, no. 5, pp. 469-473, Oct 1998.
[231] T. Stevenson et al., "Piezoelectric materials for high temperature transducers and actuators," (in English), Journal of Materials Science-Materials in Electronics, vol. 26, no. 12, pp. 9256-9267, Dec 2015.
[232] A. D. Katnani and K. I. Papathomas, "Kinetics and Initial-Stages of Oxidation of Aluminum Nitride - Thermogravimetric Analysis and X-Ray Photoelectron-Spectroscopy Study," (in English), Journal of Vacuum Science & Technology a-Vacuum Surfaces and Films, vol. 5, no. 4, pp. 1335-1340, Jul-Aug 1987.
[233] H. Fritze, M. Schulz, H. Seh, and H. L. Tuller, "Sensor application-related defect chemistry and electromechanical properties of langasite," (in English), Solid State Ionics, vol. 177, no. 26-32, pp. 2313-2316, Oct 31 2006.
[234] M. Schulz, J. Sauerwald, D. Richter, and H. Fritze, "Electromechanical properties and defect chemistry of high-temperature piezoelectric materials," (in English), Ionics, vol. 15, no. 2, pp. 157-161, Apr 2009.
[235] R. K. Kepple, E. R. Mantel, Klingenm.Oj, and R. L. Mattson, "Electrodeposited and Hardened Iron for Rolling Contact Fatigue Applications," (in English), Mechanical Engineering, vol. 92, no. 9, pp. 70-&, 1970.
[236] W. A. Macfadyen, "An aspect of electrolytic iron deposition," (in English), Transactions of the Faraday Society, vol. 15, no. 3, pp. 0098-0133, Jun 1920.
[237] V. Kellog, "Russian scientific aid," (in English), Science, vol. 56, pp. 717-717, Jul-Dec 1922.
[238] T. S. Baer and J. N. Anno, "Sputtering of Iron by Fast-Neutrons," (in English), Journal of Applied Physics, vol. 43, no. 5, pp. 2453-&, 1972.
[239] N. Imanishi, H. Ohta, S. Ninomiya, and A. Itoh, "Emission energy distribution of secondary ions produced through the electronic sputtering process under heavy ion bombardment," (in English), Nuclear Instruments & Methods in Physics Research Section B-Beam Interactions with Materials and Atoms, vol. 164, pp. 803-808, Apr 2000.
[240] B. Schweer and H. L. Bay, "On the Velocity Distribution of Excited Fe-Atoms by Sputtering of Iron," (in English), Applied Physics a-Materials Science & Processing, vol. 29, no. 2, pp. 53-55, 1982.
[241] F. Krispel et al., "Properties and applications of singly rotated GaPO<sub>4</sub> resonators," in Frequency Control Symposium and PDA Exhibition Jointly with the 17th European Frequency and Time Forum, 2003. Proceedings of the 2003 IEEE International, 2003, pp. 668-673.
[242] P. W. Krempl, C. Reiter, W. Wallnofer, and J. Neubig, "Temperature sensors based on GaPO<sub>4</sub>," in Ultrasonics Symposium, 2002. Proceedings. 2002 IEEE, 2002, vol. 1, pp. 949-952 vol.1.
[243] J. Nosek and M. Pustka, "About the coupling factor of the gallium orthophosphate (GaPO<sub>4</sub>) and its influence to the resonance-frequency temperature dependence," in Frequency Control Symposium and PDA Exhibition Jointly with the 17th European Frequency and Time Forum, 2003. Proceedings of the 2003 IEEE International, 2003, pp. 674-678.
[244] D. Damjanovic, "Materials for high temperature piezoelectric transducers," Current Opinion in Solid State and Materials Science, vol. 3, no. 5, pp. 469-473, 1998.
[245] K. Jacobs, P. Hofmann, D. Klimm, J. Reichow, and M. Schneider, "Structural Phase Transformations in Crystalline Gallium Orthophosphate," Journal of Solid State Chemistry, vol. 149, no. 1, pp. 180-188, 2000.
219
[246] H. Seh and H. Tuller, "Defects and Transport in Langasite II: Donor-doped (La3Ga4.75Nb0.25SiO14)," Journal of Electroceramics, vol. 15, no. 3, pp. 193-202, 2005.
[247] H. Seh and H. Tuller, "Defects and transport in langasite I: Acceptor-doped (La3Ga5SiO14)," Journal of Electroceramics, vol. 16, no. 2, pp. 115-125, 2006.
[248] P. A. S. GmbH, "High Temperature Microbalance Sensor Crystals," P. A. S. GmbH, Ed., ed. Graz: Piezocryst Advanced Sensorics GmbH, 2006.
[249] J. Detaint, B. Capelle, O. Cambon, and E. Philippot, "Properties of AT cut gallium phosphate resonators," in Frequency Control Symposium and Exhibition, 2000. Proceedings of the 2000 IEEE/EIA International, 2000, pp. 145-157.
[250] M. Schlesinger and M. Paunovic, Modern electroplating, 5th ed. (The electrochemical society series, no. 52). Hoboken, NJ: Wiley, 2010, pp. xv, 729 p.
[251] S. L. Diaz, J. A. Calderon, O. E. Barcia, and O. R. Mattos, "Electrodeposition of iron in sulphate solutions," (in English), Electrochimica Acta, vol. 53, no. 25, pp. 7426-7435, Oct 30 2008.
[252] T. L. Anderson, J. W. Laughner, and R. E. Newnham, "Laser-Induced Twins in Piezoelectric Quartz," (in English), American Ceramic Society Bulletin, vol. 55, no. 4, pp. 418-418, 1976.
[253] T. L. Anderson, R. E. Newnham, L. E. Cross, and J. W. Laughner, "Laser-Induced Twinning in Quartz," (in English), Physica Status Solidi a-Applied Research, vol. 37, no. 1, pp. 235-245, 1976.
[254] O. Cambon et al., "Crystal growth of GaPO4, a very promising material for manufacturing BAW devices," (in English), Annales De Chimie-Science Des Materiaux, vol. 26, no. 1, pp. 79-84, Jan-Feb 2001.
[255] J.S.Millichamp, "Development of a novel high temperature crystal microbalance in-situ sensor for the study of electrode processes in solid oxide fuel cells," PhD, Chemical Engineering, UCL, 2013.