Synthesis and thermoelectric characterisation of bismuth nanoparticles

1 23
Metallurgical and MaterialsTransactions A ISSN 1073-5623 Metall and Mat Trans ADOI 10.1007/s11661-014-2343-9
Synthesis, Characterization, andThermoelectric Properties of ElectrospunBoron-Doped Barium-Stabilized Bismuth-Cobalt Oxide Nanoceramics
Emre Çinar, Serhat Koçyiğit, ArdaAytimur, İbrahim Uslu & AhmetAkdemir
1 23
Your article is protected by copyright
and all rights are held exclusively by The
Minerals, Metals & Materials Society and ASM
International. This e-offprint is for personal
use only and shall not be self-archived in
electronic repositories. If you wish to self-
archive your article, please use the accepted
manuscript version for posting on your own
website. You may further deposit the accepted
manuscript version in any repository,
provided it is only made publicly available 12
months after official publication or later and
provided acknowledgement is given to the
original source of publication and a link is
inserted to the published article on Springer's
website. The link must be accompanied by
the following text: "The final publication is
available at link.springer.com”.

Synthesis, Characterization, and Thermoelectric Properties ofElectrospun Boron-Doped Barium-Stabilized Bismuth-CobaltOxide Nanoceramics
EMRE CINAR, SERHAT KOCYIGIT, ARDA AYTIMUR, _IBRAHIM USLU,and AHMET AKDEMIR
In this study, the boron-doped barium-stabilized bismuth cobalt oxide thermoelectricnanocrystalline ceramic powders were produced by the polymeric precursor technique. Thepowders were characterized by X-ray diffraction, scanning electron microscopy, and thephysical properties measurement system. The X-ray diffraction results showed that these pat-terns have mixture of two phases as face-centered cubic and body-centered cubic. Values of thecrystallite size, the dislocation density, and the microstrain were calculated by the Scherrerequation. According to these values, the crystallite size decreased from 60 to 51 nm with theboron addition in the boron-undoped and boron-doped samples, respectively. The scanningelectron microscope results showed that nanograins are rarely seen in the boron-undopedsamples, but nanograins turn into needle-like and layered structures with boron addition. Thediameters distribution of nanofibers was calculated. The average diameter of the boron-dopedsample is smaller than the boron-undoped sample. The physical properties measurement systemvalues showed that the electrical and thermal conductivity, the Seebeck coefficient, and thefigure of merit increased with the temperature rise for both samples. The boron-doping effectincreased the electrical and thermal conductivity, decreased the Seebeck coefficient, anddecreased the figure of merit.
DOI: 10.1007/s11661-014-2343-9� The Minerals, Metals & Materials Society and ASM International 2014
I. INTRODUCTION
THERMOELECTRIC nanocomposites are promis-ing materials for the conversion of waste heat in toelectricity in a cost-effective and environmentally benignmanner. Along with the large thermopower effect ofNaxCoO2, the layered cobalt oxides were the subject ofintense research. However, the discovery of the substi-tution between sodium and bismuth has increased thethermoelectric properties (ZT factor), and other layeredcobalt oxides such as bismuth-doped cobalt oxides havealso drawn great interest.[1,2] The ZT factor is a measureof the potential of a particular material for an efficientthermoelectric device.[3] The ZT factor has a dimension-less ratio and depends on the electrical conductivity, thethermal conductivity, and the Seebeck coefficient. Ahigh-performance thermoelectric material requires ahigh Seebeck coefficient and electrical conductivity;and low thermal conductivity.[4] The Seebeck coefficientd is named as ‘‘thermopower,’’ too. All materials have aspecific Seebeck coefficient. It depends on the electrical
potential difference (DV) and the temperature difference(DT); the formula is (d = DV/DT).[3]
Nanostructuring polymer composites are effective inenhancing the ZT factor through phonon scattering atthe nanograin boundaries.[5] The electrical conductivitymay be increased through the use of the quantum dotsto enhance the high electron density because the electronmobility was greater in the nanocrystalline structures.[6]
Conversely, the thermal conductivity may be decreasedthrough the phonon-blocking effects through the use ofthe nanostructures. The electrospinning technique is asimple and straightforward process that can be used toproduce nanofibers and nanograins—after calcinationand sintering—for the thermoelectric composite materi-als. According to the literature, it possible to generatethe ceramic nanocrystals with the enhanced ZT factorusing the electrospinning technique.[7,8] Another impor-tant advantage for the electrospun thermoelectricceramic nanofibers is that the synthesis process is highlyefficient and scalable.[9]
This work reports a novel technique for the synthesis ofhigh surface area of the bismuth-cobalt oxide-based nanof-ibers and nanocrystalline ceramic powders, use of thepolymeric precursor, polyvinyl alcohol (PVA) sol-gel basedelectrospinning technique, and the consolidation into bulkceramics by calcining and sintering in air atmosphere.Barium was added to the bismuth-cobalt oxide
structure as the stabilized material. The Ba2+ ion hasa significantly greater ionic radius than the Bi3+ ion forstabilization of the intermediate spin (IS) state of the
EMRE CINAR, M.Sc. Student, and AHMET AKDEMIR,Professor, are with the Department of Mechanical Engineering, SelcukUniversity, Konya, Turkey. SERHAT KOCYIGIT and ARDAAYTIMUR, M.Sc. Students, are with the Department of AdvancedTechnologies, Gazi University, Ankara, Turkey. Contact e-mail:[email protected]. _IBRAHIM USLU, Professor, is with theDepartment of Chemical Education, Gazi University, Ankara, Turkey.
Manuscript submitted February 26, 2014.
METALLURGICAL AND MATERIALS TRANSACTIONS A
Author's personal copy
cobalt ions.[10] The Ba2+ with a large ionic radius favorsthe creation of the large lattice spacing and a higherfreedom of the oxygen ionic movements. To comple-ment barium, bismuth was chosen as a cation dopantbecause it has the ionic radius variability at the differentvalence states (Bi3+ and Bi5+). These combined featuresof barium and bismuth manipulate the perovskitestructure toward the favorable oxygen transport prop-erties. With the addition of barium contents, the oxygenvacancies in the anionic perovskite sublattice are morestable by leading to structures related to the perov-skite.[11]
In this study, boron is used as a dopant becauseaccording to the literature, boron doping significantlyreduces the resistivity from insulating to conducting,and a very high Seebeck coefficient was observed whenboron is added to the system. The boron atomsincorporated in the crystal structure of the thermoelec-tric material and acted as the carrier dopants.[12]
The thermoelectric studies of bismuth-doped cobaltatesare rarely found in the literature. In the current study, thethermoelectric properties of BiCoO3 and the effect ofboron-doping substitution in bismuth site are reported.
II. EXPERIMENTAL SECTION
To obtain barium-stabilized bismuth cobalt oxidenanocrystalline ceramic powders, boric acid, and cobalt(II) acetate were supplied from Merck (WhitehouseStation, NJ). PVA (Mw 85,000 to 124,000), bariumacetate, and bismuth (III) acetate were supplied fromSigma Aldrich (St. Louis, MO). The ultrapure deionizedwater was used in this study as a solvent.
First, an aqueous PVA solution (10 pct) was preparedby dissolving PVA powder in distilled water. It washeated at 353 K (80 �C) with stirring for 3 hours, andthen the temperature was reduced to room temperature.In the experiments, two hybrid polymer solutions wereobtained. For each composition, the proper amounts ofthe bismuth(III) acetate, the barium acetate, thecobalt(II) acetate, and the boric acid were added to20 g of the aqueous PVA (10 pct w/w) solution at 333 K(60 �C). Each hybrid polymer solution was stirredvigorously using a magnetic stirring bar for 1 hour atthe same temperature. This process continued for 3hours at room temperature. As a final product, twoviscous gels (boron doped and undoped) of PVA/Bi-Ba-Co acetate hybrid polymer solutions were obtainedsuccessfully. Table I shows the values of NCM-1 and 2solution components. The solutions were put into thecapillary tube for the production of nanofibers viaelectrospinning. The obtained nanofibers were calcined
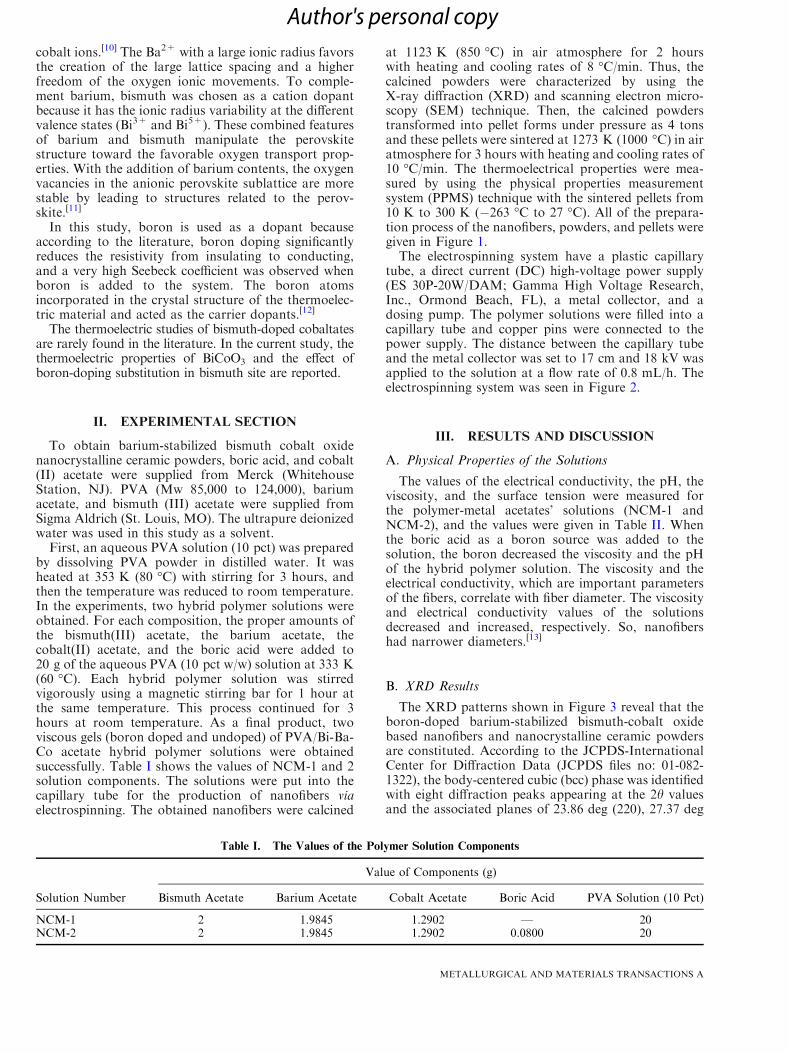
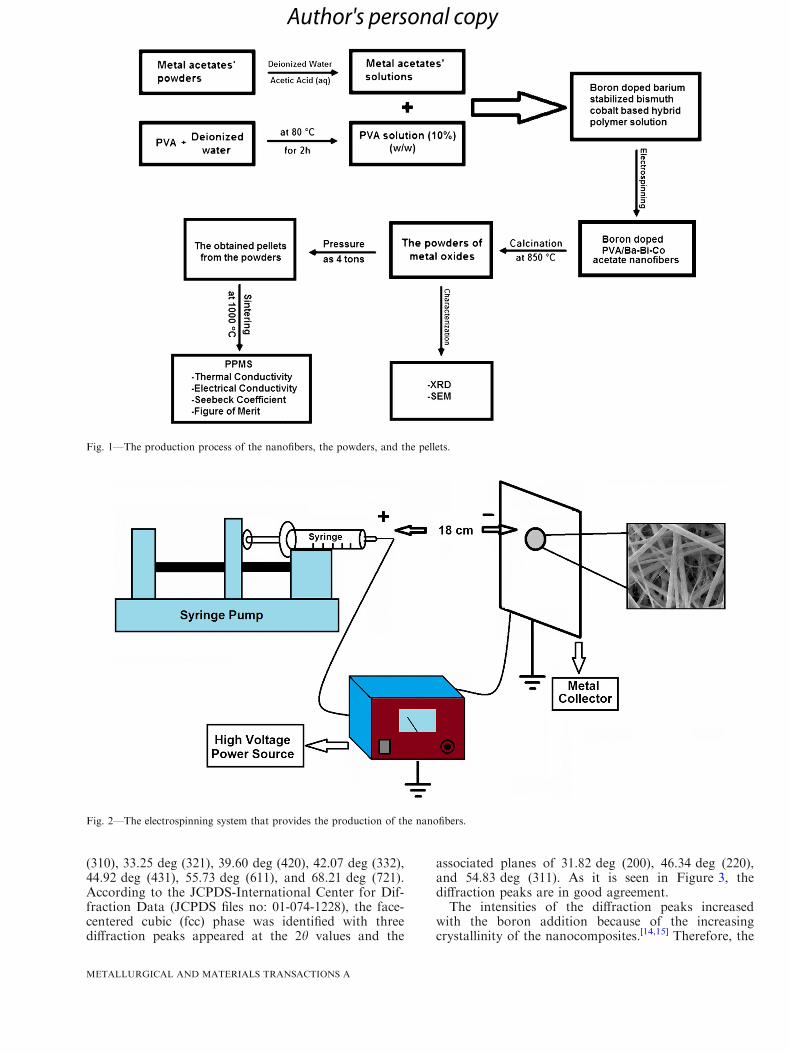
at 1123 K (850 �C) in air atmosphere for 2 hourswith heating and cooling rates of 8 �C/min. Thus, thecalcined powders were characterized by using theX-ray diffraction (XRD) and scanning electron micro-scopy (SEM) technique. Then, the calcined powderstransformed into pellet forms under pressure as 4 tonsand these pellets were sintered at 1273 K (1000 �C) in airatmosphere for 3 hours with heating and cooling rates of10 �C/min. The thermoelectrical properties were mea-sured by using the physical properties measurementsystem (PPMS) technique with the sintered pellets from10 K to 300 K (�263 �C to 27 �C). All of the prepara-tion process of the nanofibers, powders, and pellets weregiven in Figure 1.The electrospinning system have a plastic capillary
tube, a direct current (DC) high-voltage power supply(ES 30P-20W/DAM; Gamma High Voltage Research,Inc., Ormond Beach, FL), a metal collector, and adosing pump. The polymer solutions were filled into acapillary tube and copper pins were connected to thepower supply. The distance between the capillary tubeand the metal collector was set to 17 cm and 18 kV wasapplied to the solution at a flow rate of 0.8 mL/h. Theelectrospinning system was seen in Figure 2.
III. RESULTS AND DISCUSSION
A. Physical Properties of the Solutions
The values of the electrical conductivity, the pH, theviscosity, and the surface tension were measured forthe polymer-metal acetates’ solutions (NCM-1 andNCM-2), and the values were given in Table II. Whenthe boric acid as a boron source was added to thesolution, the boron decreased the viscosity and the pHof the hybrid polymer solution. The viscosity and theelectrical conductivity, which are important parametersof the fibers, correlate with fiber diameter. The viscosityand electrical conductivity values of the solutionsdecreased and increased, respectively. So, nanofibershad narrower diameters.[13]
B. XRD Results
The XRD patterns shown in Figure 3 reveal that theboron-doped barium-stabilized bismuth-cobalt oxidebased nanofibers and nanocrystalline ceramic powdersare constituted. According to the JCPDS-InternationalCenter for Diffraction Data (JCPDS files no: 01-082-1322), the body-centered cubic (bcc) phase was identifiedwith eight diffraction peaks appearing at the 2h valuesand the associated planes of 23.86 deg (220), 27.37 deg
Table I. The Values of the Polymer Solution Components
Solution Number
Value of Components (g)
Bismuth Acetate Barium Acetate Cobalt Acetate Boric Acid PVA Solution (10 Pct)
NCM-1 2 1.9845 1.2902 — 20NCM-2 2 1.9845 1.2902 0.0800 20
METALLURGICAL AND MATERIALS TRANSACTIONS A
Author's personal copy
(310), 33.25 deg (321), 39.60 deg (420), 42.07 deg (332),44.92 deg (431), 55.73 deg (611), and 68.21 deg (721).According to the JCPDS-International Center for Dif-fraction Data (JCPDS files no: 01-074-1228), the face-centered cubic (fcc) phase was identified with threediffraction peaks appeared at the 2h values and the
associated planes of 31.82 deg (200), 46.34 deg (220),and 54.83 deg (311). As it is seen in Figure 3, thediffraction peaks are in good agreement.The intensities of the diffraction peaks increased
with the boron addition because of the increasingcrystallinity of the nanocomposites.[14,15] Therefore, the
Fig. 1—The production process of the nanofibers, the powders, and the pellets.
Fig. 2—The electrospinning system that provides the production of the nanofibers.
METALLURGICAL AND MATERIALS TRANSACTIONS A
Author's personal copy
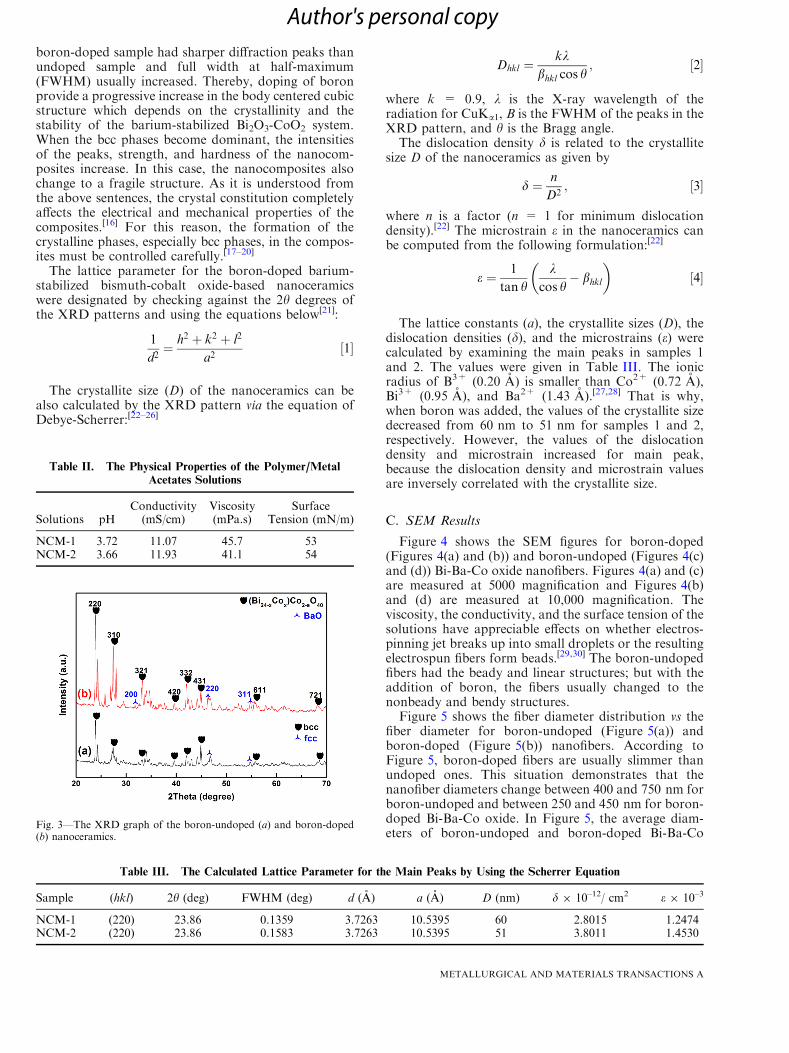
boron-doped sample had sharper diffraction peaks thanundoped sample and full width at half-maximum(FWHM) usually increased. Thereby, doping of boronprovide a progressive increase in the body centered cubicstructure which depends on the crystallinity and thestability of the barium-stabilized Bi2O3-CoO2 system.When the bcc phases become dominant, the intensitiesof the peaks, strength, and hardness of the nanocom-posites increase. In this case, the nanocomposites alsochange to a fragile structure. As it is understood fromthe above sentences, the crystal constitution completelyaffects the electrical and mechanical properties of thecomposites.[16] For this reason, the formation of thecrystalline phases, especially bcc phases, in the compos-ites must be controlled carefully.[17–20]
The lattice parameter for the boron-doped barium-stabilized bismuth-cobalt oxide-based nanoceramicswere designated by checking against the 2h degrees ofthe XRD patterns and using the equations below[21]:
1
d2¼ h2 þ k2 þ l2
a2½1�
The crystallite size (D) of the nanoceramics can bealso calculated by the XRD pattern via the equation ofDebye-Scherrer:[22–26]
Dhkl ¼kk
bhkl cos h; ½2�
where k = 0.9, k is the X-ray wavelength of theradiation for CuKa1, B is the FWHM of the peaks in theXRD pattern, and h is the Bragg angle.The dislocation density d is related to the crystallite
size D of the nanoceramics as given by
d ¼ n
D2; ½3�
where n is a factor (n = 1 for minimum dislocationdensity).[22] The microstrain e in the nanoceramics canbe computed from the following formulation:[22]
e ¼ 1
tan hk
cos h� bhkl
� �½4�
The lattice constants (a), the crystallite sizes (D), thedislocation densities (d), and the microstrains (e) werecalculated by examining the main peaks in samples 1and 2. The values were given in Table III. The ionicradius of B3+ (0.20 A) is smaller than Co2+ (0.72 A),Bi3+ (0.95 A), and Ba2+ (1.43 A).[27,28] That is why,when boron was added, the values of the crystallite sizedecreased from 60 nm to 51 nm for samples 1 and 2,respectively. However, the values of the dislocationdensity and microstrain increased for main peak,because the dislocation density and microstrain valuesare inversely correlated with the crystallite size.
C. SEM Results
Figure 4 shows the SEM figures for boron-doped(Figures 4(a) and (b)) and boron-undoped (Figures 4(c)and (d)) Bi-Ba-Co oxide nanofibers. Figures 4(a) and (c)are measured at 5000 magnification and Figures 4(b)and (d) are measured at 10,000 magnification. Theviscosity, the conductivity, and the surface tension of thesolutions have appreciable effects on whether electros-pinning jet breaks up into small droplets or the resultingelectrospun fibers form beads.[29,30] The boron-undopedfibers had the beady and linear structures; but with theaddition of boron, the fibers usually changed to thenonbeady and bendy structures.Figure 5 shows the fiber diameter distribution vs the
fiber diameter for boron-undoped (Figure 5(a)) andboron-doped (Figure 5(b)) nanofibers. According toFigure 5, boron-doped fibers are usually slimmer thanundoped ones. This situation demonstrates that thenanofiber diameters change between 400 and 750 nm forboron-undoped and between 250 and 450 nm for boron-doped Bi-Ba-Co oxide. In Figure 5, the average diam-eters of boron-undoped and boron-doped Bi-Ba-Co
Table II. The Physical Properties of the Polymer/Metal
Acetates Solutions
Solutions pHConductivity(mS/cm)
Viscosity(mPa.s)
SurfaceTension (mN/m)
NCM-1 3.72 11.07 45.7 53NCM-2 3.66 11.93 41.1 54
Fig. 3—The XRD graph of the boron-undoped (a) and boron-doped(b) nanoceramics.
Table III. The Calculated Lattice Parameter for the Main Peaks by Using the Scherrer Equation
Sample (hkl) 2h (deg) FWHM (deg) d (A) a (A) D (nm) d 9 10–12/ cm2 e 9 10–3
NCM-1 (220) 23.86 0.1359 3.7263 10.5395 60 2.8015 1.2474NCM-2 (220) 23.86 0.1583 3.7263 10.5395 51 3.8011 1.4530
METALLURGICAL AND MATERIALS TRANSACTIONS A
Author's personal copy
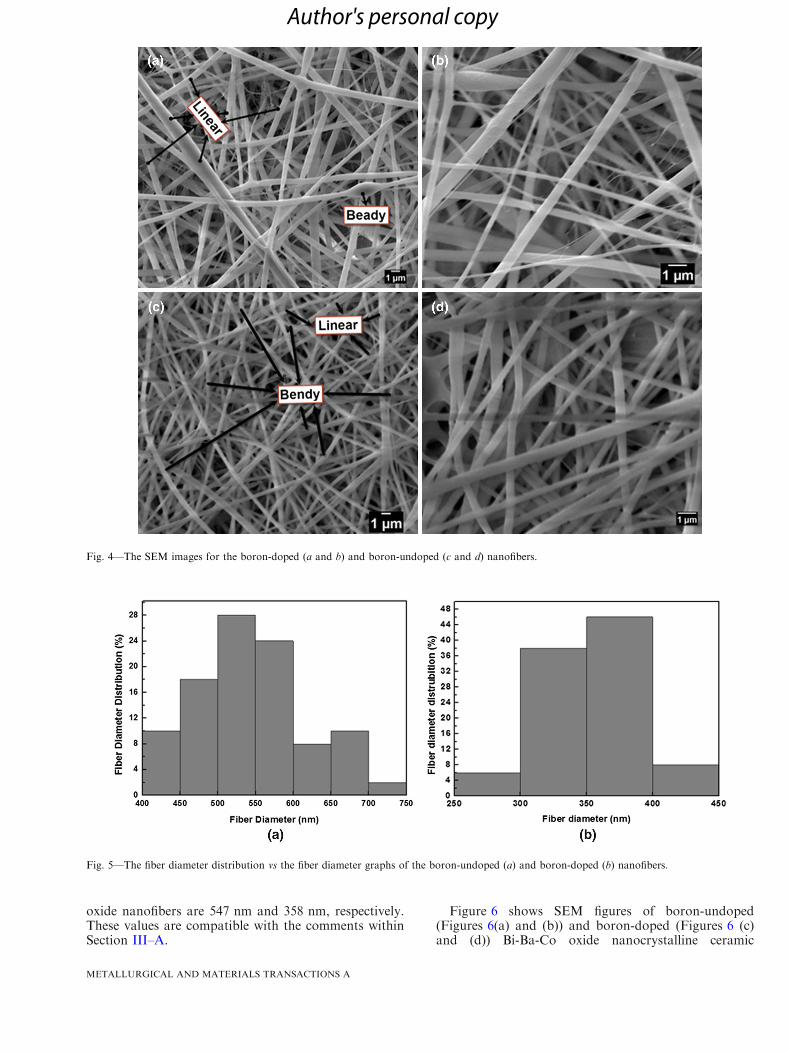
oxide nanofibers are 547 nm and 358 nm, respectively.These values are compatible with the comments withinSection III–A.
Figure 6 shows SEM figures of boron-undoped(Figures 6(a) and (b)) and boron-doped (Figures 6 (c)and (d)) Bi-Ba-Co oxide nanocrystalline ceramic
Fig. 4—The SEM images for the boron-doped (a and b) and boron-undoped (c and d) nanofibers.
Fig. 5—The fiber diameter distribution vs the fiber diameter graphs of the boron-undoped (a) and boron-doped (b) nanofibers.
METALLURGICAL AND MATERIALS TRANSACTIONS A
Author's personal copy

powders, which were formed from nanofibers and werecalcined at 1123 K (850 �C). In Figure 6, nanograins arerarely seen in the boron-undoped samples, but nano-grains turn into the needle-like and layered structureswith the boron addition.
D. Thermoelectric Properties
The thermal conductivity vs the temperature graphswere given in Figure 7 for the boron-undoped (black-colored and square-shaped) and boron-doped (red-colored and spherical-shaped) nanoceramic pellets.According to this graph, the thermal conductivityvalues of both samples increased with the temperaturerise until the temperature reached approximately 448 K(175 �C); they remained stable and decreased after thistemperature. In other words, this graph shows theincreasing and concave downward graph. For hot tocold junction thermoelectric materials, this situationincreases the electrical conductivity values with thetemperature rise.
The effect of boron doping can be explained asfollows: At all temperatures, the values of the thermalconductivity of the boron-doped sample are higher thanthat of the boron-undoped sample. So, the boron-doped
sample shows a negative effect in respect to the thermalconductivity for thermoelectric capacity. It is knownthat the boron has already got increasing of the thermalconductivity with the temperature rise.[31] However, thethermal conductivity of the both samples was lower thanthat of the typical, practical thermoelectric materials. Atroom temperature (298 K [25 �C]), the values are 0.6418and 0.7639 W/K m for boron-undoped and boron-doped sample, respectively. Wang et al. measured thethermal conductivity as 1.75 W/K m for 300 K and Yinet al. measured the thermal conductivity as 1.8 W/K mfor 350 K (77 �C) in their studies. Namely, these valuesfor both samples are usually higher than literaturedata.[32–35]
Figure 8 shows the graphs of the electrical conductivityvs the temperature for boron-undoped (black-coloredand square-shaped) and boron-doped (red-colored andspherical-shaped) nanoceramic pellets. According to thisgraph, the electrical conductivity values of the boron-doped sample are higher than the undoped one at alltemperatures. This case shows that the values increasewith the doping of boron. Already, this incrementamong the electrical conductivity values for both sam-ples is an expected situation.[36] The electrical conduc-tivity values of both samples increased with the increase
Fig. 6—The SEM images of the boron-undoped (a and b) and boron-doped (c and d) nanoceramic powders.
METALLURGICAL AND MATERIALS TRANSACTIONS A
Author's personal copy
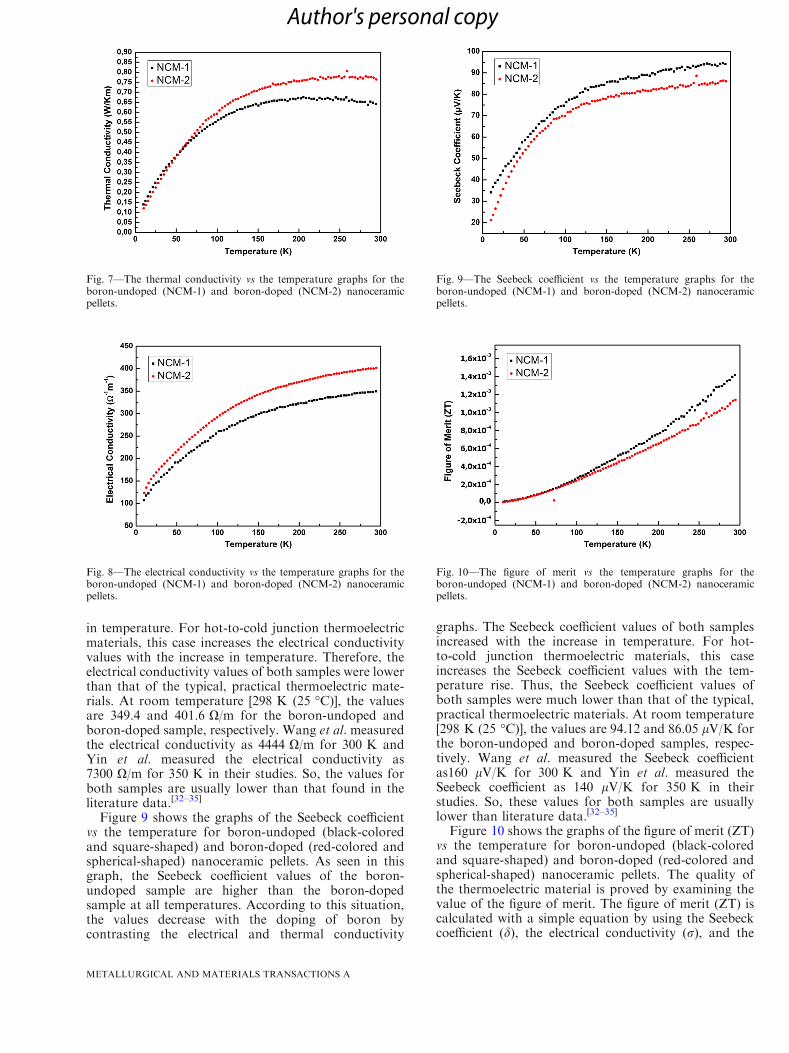
in temperature. For hot-to-cold junction thermoelectricmaterials, this case increases the electrical conductivityvalues with the increase in temperature. Therefore, theelectrical conductivity values of both samples were lowerthan that of the typical, practical thermoelectric mate-rials. At room temperature [298 K (25 �C)], the valuesare 349.4 and 401.6 X/m for the boron-undoped andboron-doped sample, respectively. Wang et al. measuredthe electrical conductivity as 4444 X/m for 300 K andYin et al. measured the electrical conductivity as7300 X/m for 350 K in their studies. So, the values forboth samples are usually lower than that found in theliterature data.[32–35]
Figure 9 shows the graphs of the Seebeck coefficientvs the temperature for boron-undoped (black-coloredand square-shaped) and boron-doped (red-colored andspherical-shaped) nanoceramic pellets. As seen in thisgraph, the Seebeck coefficient values of the boron-undoped sample are higher than the boron-dopedsample at all temperatures. According to this situation,the values decrease with the doping of boron bycontrasting the electrical and thermal conductivity
graphs. The Seebeck coefficient values of both samplesincreased with the increase in temperature. For hot-to-cold junction thermoelectric materials, this caseincreases the Seebeck coefficient values with the tem-perature rise. Thus, the Seebeck coefficient values ofboth samples were much lower than that of the typical,practical thermoelectric materials. At room temperature[298 K (25 �C)], the values are 94.12 and 86.05 lV/K forthe boron-undoped and boron-doped samples, respec-tively. Wang et al. measured the Seebeck coefficientas160 lV/K for 300 K and Yin et al. measured theSeebeck coefficient as 140 lV/K for 350 K in theirstudies. So, these values for both samples are usuallylower than literature data.[32–35]
Figure 10 shows the graphs of the figure of merit (ZT)vs the temperature for boron-undoped (black-coloredand square-shaped) and boron-doped (red-colored andspherical-shaped) nanoceramic pellets. The quality ofthe thermoelectric material is proved by examining thevalue of the figure of merit. The figure of merit (ZT) iscalculated with a simple equation by using the Seebeckcoefficient (d), the electrical conductivity (r), and the
Fig. 7—The thermal conductivity vs the temperature graphs for theboron-undoped (NCM-1) and boron-doped (NCM-2) nanoceramicpellets.
Fig. 8—The electrical conductivity vs the temperature graphs for theboron-undoped (NCM-1) and boron-doped (NCM-2) nanoceramicpellets.
Fig. 9—The Seebeck coefficient vs the temperature graphs for theboron-undoped (NCM-1) and boron-doped (NCM-2) nanoceramicpellets.
Fig. 10—The figure of merit vs the temperature graphs for theboron-undoped (NCM-1) and boron-doped (NCM-2) nanoceramicpellets.
METALLURGICAL AND MATERIALS TRANSACTIONS A
Author's personal copy

thermal conductivity (j). The ZT in the nanoceramicpellet can be calculated by using Eq. [5]:[37]
ZT ¼ d2rj
T; ½5�
where ZT is the figure of merit. According to Eq. [5], theZT is directly proportional to the values of the Seebeckcoefficient (d) and the electrical conductivity (r), and it isinversely proportional to the value of the thermalconductivity. As shown in Figure 10, the ZT values ofboth samples increase with the increase in temperature.But the boron-undoped sample is seen higher than theboron-doped one at all temperatures after from 373 K(100 �C). The ZT graph is a concave and increasinggraph for both samples. This case examines that the ZTvalues can give better results at higher temperatures.
At room temperature [298 K (25 �C)], the ZT valuesof nanoceramics are 1.42 9 10�3 and 1.18 9 10�3 for theboron-undoped and boron-doped sample, respectively.According to Figure 10, the ZT values decreased withboron doping. In other words, boron doping provided anegative effect for the thermoelectric system in thisstudy.
IV. CONCLUSIONS
In this article, nanofibers were synthesized by usingPVA as a polymeric precursor via the electrospinningtechnique and the nanoceramic powders were synthe-sized along with the calcination of nanofibers. Accom-plishing this work has implied the possibility toelectrospin the boron-doped barium-stabilized bis-muth-cobalt oxide nanoceramic thermoelectric oxidecomposite material.
Among various chemical or physical syntheticapproaches for the thermoelectric materials, electros-pinning appears to be the most straightforward andconvenient method for generating nanocomposite crys-talline structures. We believe that the nanocompositematerials that were produced by using the electrospin-ning techniques may have potential applications inthermoelectric nanodevices.
Nanofibers were characterized by using the SEMtechnique and the nanoceramic powders by using theXRD, SEM, and PPMS techniques. The results exhib-ited that both samples provided nanosize particles. TheSEM results for nanofibers demonstrated that theboron-doped fibers are usually slimmer than theboron-undoped ones and the boron-undoped fibershad beady and linear structures. But with the additionof boron, the fibers changed to the nonbeady and bendystructures. The SEM results showed that the nanograinsare rarely seen in the boron-undoped samples, butnanograins turn into the needle-like and layered struc-ture with the addition of boron. The XRD resultsshowed that these patterns have a two-phase mixture asa face-centered and body-centered cubic. The values ofthe crystallite size, the dislocation density, and themicrostrain were calculated by using the Scherrerequation. According to these values, the crystallite size
decreased from 60 to 51 nm with the boron addition insamples 1 and 2, respectively. Hence, the ionic radius ofB3+ (0.20 A) is smaller than Co2+ (0.72 A), Bi+3
(0.95 A) and Ba+2 (1.43 A). The PPMS values showedthat the electrical and thermal conductivity, the Seebeckcoefficient, and the ZT increased with the increase intemperature for both samples. Especially, the ZT valuesthat pointed out the importance of the thermoelectricalproperties increased with the increasing temperature forboth samples. The effect of the boron doping increasedthe electrical and thermal conductivity and decreasedthe Seebeck coefficient and the ZT. Moreover, thethermal conductivity values of both samples are higher,but the electrical conductivity and the Seebeck coeffi-cient values of both samples are lower than the literaturevalues. The ZT values of the nanoceramics are 1.42 910�3 and 1.18 9 10�3 for the boron-undoped andboron-doped samples at room temperature (298 K),respectively. The values give good results for especiallythe boron-undoped sample at this temperature. So, theZT values decreased with boron doping. In other words,boron doping provided a negative effect on the thermo-electric system in this study.
REFERENCES1. R. Funahashi, I. Matsubara, K. Ueno, S. Sodeoka, and H.
Yamada: Chem. Mater., 2000, vol. 12, pp. 2424–27.2. A. Maignan, S. Hebert, M. Hervieu, C. Michel, D. Pelloquin, and
D. Khomskii: J. Phys. Condens. Matter., 2003, vol. 15, pp. 2711–23.
3. V. Zlati and A.C. Hewson: Properties and Applications of Ther-moelectric Materials, Springer, Dordrecht, 2008.
4. M.A. Kamarudin, S.R. Sahamir, R.S. Datta, B.D. Long, M.F.M.Sabri, and S.M. Said: Sci. World J., 2013, vol. 2013, art. id 713640.doi:10.1155/2013/713640.
5. F. Ma, Y. Ou, Y. Yang, Y. Liu, S. Xie, J.F. Li, G. Cao, R.Proksch, and J. Li: J. Phys. Chem. C, 2010, vol. 114, pp. 22038–43.
6. D.K. Taggart, Y. Yang, S.C. Kung, T.M. McIntire, and R.M.Penner: Nano Lett., 2011, vol. 11, pp. 125–31.
7. W.E. Teo and S. Ramakrishna: Nanotechnology, 2006, vol. 17,pp. R89–106.
8. I. Uslu, S.S. Cetin, A. Aytimur, S. Yuceyurt, and M.O. Erdal: J.Inorg. Organomet. Polym., 2012, vol. 22, pp. 766–71.
9. H. Wu, W. Pan, D. Lin, and H. Li: J. Adv. Ceram., 2012, vol. 1,pp. 2–23.
10. M.A. Senaris-Rodriguez and J.B. Goodenough: J. Solid StateChem., 1995, vol. 118, pp. 323–36.
11. J. Sunarso: Ph.D. Dissertation, The University of Queensland,2010.
12. J. Okamoto, G. Shimizu, S. Kubo, Y. Yamada, H. Kitagawa, A.Matsushita, Y. Yamada, and F. Ishikawa: J. Phys. Conf. Ser.,2009, vol. 176, p. 012042.
13. T. Tunc, I. Uslu, S. Durmusoglu, S. Keskin, A. Aytimur, and A.Akdemir: J. Inorg. Organomet. Polym., 2012, vol. 22, pp. 105–11.
14. C.Y. Hsu, J.W. Yeh, S.K. Chen, and T.T. Shun: Metall. Mater.Trans. A, 2004, vol. 35A, pp. 1465–69.
15. D. Chen, D. Yang, Q. Wang, and Z. Jiang: Ind. Eng. Chem. Res.,2006, vol. 45, pp. 4110–16.
16. A. Aytimur, _I. Uslu, E. Cınar, S. Kocyigit, F. Ozcan, and A.Akdemir: Ceram. Int., 2013, vol. 39, pp. 911–16.
17. S. Guo, C. Ng, J. Lu, and C.T. Liu: J. Appl. Phys., 2011, vol. 109,p. 103505.
18. C.J. Tong, Y.L. Chen, S.K. Chen, J.W. Yeh, T.T. Shun, C.H.Tsau, S.J. Lin, and S.Y. Chang: Metall. Mater. Trans. A, 2005,vol. 36A, pp. 881–93.
METALLURGICAL AND MATERIALS TRANSACTIONS A
Author's personal copy

19. C.W. Tsai, M.H. Tsai, J.W. Yeh, and C.C. Yang: J. AlloysCompd., 2010, vol. 490, pp. 160–65.
20. F.J. Wang, Y. Zhang, and G.L. Chen: J. Alloys Compd., 2009,vol. 478, pp. 321–24.
21. C. Suryanarayana and M.G. Norton: X-Ray Diffraction a Prac-tical Approach, Plenum Press, New York, NY, 1998.
22. B. Karunagaran,R.T.R.Kumar, D.Mangalaraj, S.K.Narayandass,and G.M. Rao: Cryst. Res. Technol., 2002, vol. 37, pp. 1285–92.
23. P.H. Klug and L.E. Alexander: X-Ray Diffraction Procedures forPolycrystalline andAmorphousMaterials,Wiley,NewYork,NY,1974.
24. N.S. Prasad and K.B.R. Varma: Mater. Sci. Eng. B Adv., 2002,vol. 90, pp. 246–53.
25. E. Alvarado, L.M. Torres-Martinez, A.F. Fuentes, and P. Quintana:Polyhedron, 2000, vol. 19, pp. 2345–51.
26. Y. Ding, G.T. Zhang, H. Wu, B. Hai, L.B. Wang, and Y.T. Qian:Chem. Mater., 2001, vol. 13, pp. 435–40.
27. H. Katsura, T. Hashimoto, and Y. Suemune: J. Jpn. Appl. Phys.,1991, vol. 30, pp. 274–79.
28. S.Y. Wua and H.N. Dong: Z. Naturforsch., 2004, vol. 59A,pp. 563–67.
29. S. Ramakrishna, K. Fujihara, W.E. Teo, T.C. Lim, and Z. Ma: AnIntroduction to Electrospinning and Nanofibers, World Scientific,Hackensack, NJ, 2005.
30. S.L. Shenoy, W.D. Bates, H.L. Frisch, and G.E. Wnek: Polymer,2005, vol. 46, pp. 3372–84.
31. C. Song, X. Wang, R. Huang, J. Song, and Y. Guo: Mater. Chem.Phys., 2013, vol. 142, pp. 292–96.
32. R. Funahashi, I. Matsubara, and S. Sodeoka: Appl. Phys. Lett.,2000, vol. 76, pp. 2385–87.
33. S. Li, R. Funahashi, I. Matsubara, H. Yamada, K. Ueno, and S.Sodeoka: Ceram. Int., 2001, vol. 27, pp. 321–24.
34. D. Wang, L. Chen, Q. Yao, and J. Li: Solid State Commun., 2004,vol. 129, pp. 615–18.
35. T. Yin, D. Liu, Y. Ou, F. Ma, S. Xie, J.F. Li, and J. Li: J. Phys.Chem. C, 2010, vol. 114, pp. 10061–65.
36. W. Xie, S. Zhu, X. Tang, J. He, Y. Yan, V. Ponnambalam, Q.Zhang, S.J. Poon, and T. Tritt: J. Phys. D Appl. Phys., 2009,vol. 42, p. 235407.
37. K. Zabrocki, P. Ziolkowski, T. Dasgupta, J. De Boor, and E.Muller: J. Electron. Mater., 2013, vol. 42, pp. 2402–08.
METALLURGICAL AND MATERIALS TRANSACTIONS A
Author's personal copy
Copyright © 2022 FDOKUMEN