Thermoelectric Power ve rsus Electrical Conductivity Plot for ...
6
UDC 669. 141. 241.2: 6 21.7 8 5.797: 6 21. 785 .616 .53 7: 3 Thermoelectric Power ve rsus Electrical Conductivity Plot for Quench-ageing of Low-carbon Aluminium-killed Steel* By Hideo ABE** and Takeshi SUZUKI ** Synopsis In the thermoelectric power vers us electrical conductivity graph for iso- thermal ageing if a low-carbon aluminium-killed steel preliminarily quench- ed from 700°C, each precipitation process is represented by a straight line wi th a gradient characteristic to it. Th e gradient of the straight line increases as the temperature of ageing is lowered. B esides, it shows a te/ldency to depend on the structure of preci pitates . An ex planation is give/l on the higher gradients for the age ing at lower temperatures by cOllsidering the coherency strains and def ects in which interstitial carbon atoms have segregated. Approximately the same activation energy for the preci pitation of the meta stable carbide and the same va lues of exponent n in an empiri- ca l equation f(t) = I -e xp [- (t /T)n], wheref(t ) is the jraction precipi- tated in a period of time t, and T and n are constants, can be deri ved from the thermoelectric power and the res istivity data. I. Introduction Most of m etall urgi ca l processes can be represented by individu al straight lin es in the th ermoelectric power versus electrical conductivity graph. The grad i- ents of the straight l in es (we call th em hereinafter " the g radi ents " for abbrev iation) are characteristic to th eir respective reactions invo lved. I ,2) It has been shown 2 ) that, in a low-carbon al uminium-kill ed steel, the grad ient for the dissolution of in cohere nt cementite particles into the ferrite matrix is 260 pV· pD· cm· deg-1, whereas the gradient for th e pr ecipitation of semicoherent cement ite particles at 250°C is 3 10 p V· pD.cm .deg- l . Al though the precipitation of carb ides from supersaturated solid sol ution of ferrite in iron- carbon a ll oys or commercia l l ow-carbon steels has been exhaustively studied,3-25) the difference between the above two va lues of the gradient seems to add new information to our knowl edge of the precipita- tion in low-carbon stee ls. It was supposed 2 ) that the former value would be nearly that c haracteristi c to the carbon atoms oc - cupying th e normal interstitial sites of the iron l att ice and th e higher value of the l atter could be accounted for qualitative ly as due to elimination of l oca l l att ice strains around interstitial carbon atoms thro ugh inter - action with coherency strains and defects i nduced al ong the precipitate -matrix interfaces. The present study has been unde rtak en to inv es tigat e the va lidity of such a view for wh i ch some modification in the statement shall be given and to give furth er informa - tion on the gradie nt for th e qu e nch-ageing proc ess of th e low-carbon al umi nium-ki lled stee l. II. Experimental The material used in th e pr ese nt study was a hot band, 2.96 mm thick , of a low-carbon al uminium- * R eceived on Oc tober 5, 1979. kill ed steel. The ch emica l composition is given in Table 1. T he al umi nium -killed steel was used be- cause the effect of the nitride precipitat ion was thought to be el imi nated by suitable h eat-treatments. The hot band was austenitized for 2 hr at 920°C in an argon-flow furnace, cool ed at a rate of 50°Cj hr down to 650°C and rapid ly cooled ther ea fter. Then the hot band was cold roll ed to a reduction of 75 % in thickness. Seventy eight specimens, 120 mm by 4 mm by 0.74 mm, were cut from th e col d-roll ed sheet. Individual specimens were immersed for 20 min in a salt bath kept at 700° C±5 °C and quenched into iced water. Then, meas ur eme nt s were made on the hardn ess, the elect rical resistivity at liq uid nitrogen te mp er at ure and the th e rmoelectric power at O°C. Eighteen specimens of the highest resistivity were selected and us ed for the subsequent que n ch-ageing exper i ment. After successive ageing for var ious times isoth erm- a ll y at 35°C, 50°C, 75°C, 100°C, 150°C, 200°C, 250°C, or 300°C, measurements we re made at each ti me on the electrical resistivity at li quid nitrogen temperature and at O°C, the absol ut e th ermoe lectric power at O°C, and the ha rdn ess. Th e experime ntal techniques were similar to those described in a pre- vious paper. l ) Immed iately after quench i ng the carbon concen- trat ion in supe r saturated soli d sol ution was estimated to be approximately O.O ll wt .%. Considering from data on a simil ar steel, the ni trogen content in solu- tion was supposed to be 10 wt·ppm level. Thus , slig ht influe nce of the prec ipitation of Fe Is N 2 or Fe 4 N was thou g ht to be unavoidable, but the resul ts ob- tained h ave been a na lyzed and discussed by con- sidering only the behaviour of carbon . III. Results Fig ure 1 shows th e change in hardness duri ng iso- therma l ageing. Agei ng at l ower temperatures below 75 °C gives rise to a mar ked harde n ing, whereas a little or no harde n ing is observed for ageing at higher temperatures above 100° e. Two stages of hardening are evident for the ageing at 35°C, 50°C and 75 °C ; a sligh t hardening of the first stage is fo ll owed by a Table I. Chemical compos ition. (wt .%) C Si Mn p S sol. Al insol. Al so l. N 0 . 046 0.01 0. 35 0.020 0.0 18 0 . 0 30 0.0 10 0 .0060 ** D epa rtment of Meta llurgy an d Mat eria ls Science, Th e University of Tokyo, Bunkyo-ku, Tokyo 113. ( 690 ) Research A rticle
-
Upload
khangminh22 -
Category
Documents
-
view
3 -
download
0
Transcript of Thermoelectric Power ve rsus Electrical Conductivity Plot for ...

UDC 6 6 9 .141.241.2: 6 21.78 5.797: 6 21.785.616.537: 3
Thermoelectric Power ve rsus Electrical Conductivity Plot for
Quench-ageing of Low-carbon Aluminium-killed Steel*
By Hideo ABE** and Takeshi SUZUKI**
Synopsis In the thermoelectric power versus electrical conductivity graph for iso
thermal ageing if a low-carbon aluminium-killed steel preliminarily quench
ed from 700°C, each precipitation process is represented by a straight
line with a gradient characteristic to it. The gradient of the straight line
increases as the temperature of ageing is lowered. Besides, it shows a
te/ldency to depend on the structure of precipitates . An explanation is give/l
on the higher gradients for the ageing at lower temperatures by cOllsidering
the coherency strains and defects in which interstitial carbon atoms have
segregated. Approximately the same activation energy for the precipitation
of the metastable carbide and the same values of exponent n in an empiri
cal equation f(t) = I -exp [- (t /T)n], wheref(t ) is the jraction precipi
tated in a period of time t, and T and n are constants, can be derived from
the thermoelectric power and the resistivity data.
I. Introduction
Most of metallurgical processes can be represented by individual straight lines in the thermoelectric power versus electrical conductivity graph. The gradients of the straight lines (we call them hereinafter " the gradients " for abbreviation) are characteristic to their respective reactions involved. I ,2) It has been shown2) that, in a low-carbon aluminium-killed steel, the gradient for the dissolution of incoherent cementite particles into the ferrite matrix is 260 pV· pD· cm· deg-1, whereas the gradient for the precipitation of semicoherent cementite particles at 250°C is 310 p V · pD.cm .deg- l . Although the precipitation of carbides from supersaturated solid solution of ferrite in ironcarbon a lloys or commercial low-carbon steels has been exhaustively studied,3-25) the difference between the above two values of the gradient seems to add new information to our knowledge of the precipitation in low-carbon steels.
It was supposed 2 ) that the former value would be nearly that characteristic to the carbon atoms occupying the normal interstitial sites of the iron lattice and the higher value of the latter could be accounted for qualitatively as due to elimination of local lattice strains around interstitial carbon atoms through interaction with coherency strains and defects induced along the precipitate-matrix interfaces. The present study has been undertaken to investigate the validity of such a view for which some modification in the statement shall be given and to give further information on the gradien t for the quench-ageing process of the low-carbon aluminium-killed steel.
II. Experimental
The material used in the present study was a hot band, 2.96 mm thick, of a low-carbon aluminium-
* R eceived on October 5, 1979.
killed steel. T he chemical composition is given in Table 1. T he aluminium-killed steel was used because the effect of the nitride precipitation was thought to be eliminated by suitable heat-treatments. The hot band was austenitized for 2 hr at 920°C in an argon-flow furnace, cooled at a rate of 50°Cjhr down to 650°C and rapidly cooled thereafter. Then the hot band was cold rolled to a reduction of 75 % in thickness. Seventy eight specimens, 120 mm by 4 mm by 0.74 mm, were cut from the cold-rolled sheet. Individual specimens were immersed for 20 min in a salt bath kept at 700°C±5°C and quenched into iced water. Then, measurements were made on the hardness, the electrical resistivity at liquid nitrogen temperature and the thermoelectric power at O°C. Eighteen specimens of the highest resistivity were selec ted a nd used for the subsequent quench-ageing experiment.
After successive ageing for various times isothermally at 35°C, 50°C, 75°C, 100°C, 150°C, 200°C, 250°C, or 300°C, measurements were made at each time on the electrical resistivity at liquid nitrogen temperature and at O°C, the absolute thermoelectric power at O°C, and the ha rdness. The experimental techniques were similar to those described in a previous paper. l )
Immediately after quenching the carbon concentration in supersaturated solid solution was estimated to be approximately O.O ll wt .% . Considering from data on a similar steel, the nitrogen content in solution was supposed to be 10 wt·ppm level. Thus, slight influence of the precipitation of FeIsN 2 or Fe4N was thought to be unavoidable, but the results obtained have been analyzed and discussed by considering only the behaviour of carbon.
III. Results
Figure 1 shows the change in hardness d uring isothermal ageing. Ageing at lower temperatures below 75°C gives rise to a marked hardening, whereas a little or no hardening is observed for ageing at h igher temperatures above 100°e. Two stages of hardening are evident for the ageing at 35°C, 50°C and 75°C ; a sligh t hardening of the first stage is followed by a
Table I. Chemical composition. (wt.%)
C Si Mn p S sol. Al insol. Al sol. N
0 .046 0 .0 1 0 . 35 0.020 0.0 18 0 .030 0.010 0 .0060
** D epartment of Meta llurgy and Materials Science, The University of Tokyo, Bunkyo-ku, Tokyo 113.
( 690 ) Research A rticle

ma rked hardening of the second stage. Similar results were reported by T akeyama, M a tsuzaka and Yamada21 ) on a low-carbon rimming steel.
The changes in electrical resistivity and thermoelectric power are shown in Fig. 2. The resistivity decreases while the thermoelectric power increases In a corresponding m anner during ageing a t each
200
~ 180
E ~ 160 VI VI
'" .§ 140
;:; L
VI 120
~ :; 100
r.l .. -
J I ~ ~ ~'CJ I ~ >, ~ P5J ~--,.....~751c
cf.Lc/ j
.. ~ J ~ .:;,. .... I -~~ I ~ 100' C
'-.~-i!'"I'>'~~.=.I>..-...A> __ _ ·-6-L.;:,.~l' - -6. . - &- I I '1;,.--_ ,,£ 1S.
I ~ I 1 250 'Cr- --~~ 15,o ' C -t-"l, _~ 300'C -.:. . ~[]'.Q. .;.-o..r. . . -6~-:t::- __ .. 2~~~ ~r-
. ···I ... · l · · ·· r · · ·, · I ·······I ··ooTl~ 800 100 10 ' 10 ' 106
Isothermal ageing time ( sec)
Fig . I . Hardness of low-carbon a lum inium-killed s teel isothermally aged a t various tempera tures after q uenching from 700°C .
Transactions ISIJ, Vol. 20, 1980 ( 691 )
tempera ture, but it is to be noted tha t the fractional change of thermoelectric power is obviously larger than that of resistivity at intermediate stages of ageing. Two stages of reaction a re evident for the ageing a t 35°C and 50°C.
Figure 3 is the a bsolute thermoelectric power versus electrical conductivity graph a t O°C. The values of the gradient for the ageing at 35°C, 50°C, 75°C, 100°C, 150°C, 200°C, 250°C a nd 300°C are 830, 730, 450, 390, 390, 365, 350 and 300 fl-V' fl-D . cm·deg- 1, respectively, except for their respective longtime portions. The value of 350 fl-V . fl-D. cm· deg-1
for the ageing a t 250°C is higher tha n tha t reported in a previous paper,2) 310 fl-V ' fl-D. cm.deg-1, which was derived from the data after ageing for a long time a t 250°C. It is evident from Fig . 3 that the value reported here should be adopted for the early stages of ageing a t 250°C. According to a preliminary observation by transmission electron microscopy, the precipitates after ageing for sufficient times a t 250°C and 300°C were confirmed to be cementi te . The gradient of about 300 fl-V' fl-D . cm ·deg-1 can be regarded to be that characteristic to the precipitation
3 . 4 ~----r---~-,--~--,----,-,---r--~---,--~-,----r---.
Fig . 2. The electrical resisti vity at liquid nitrogen temperature a nd the absolute thermoelectric power a t O°C for low-carbon a luminium-killed steel iso thermally aged a t various tempera tures after quenching from
700°C .
~11 6 ., CJl <11 -0 > =t
u o d
~ 8. '2.0 i---r---'c\ u ~
U <11
Q; o E Q) 12 .2 f---+------+ ,..-'=~'" .r:.
~ :::J
Si
~ ;>, :l =:" 3.3 H ----;-=- "''r! > ~
.- '" ~ E" ~ ~ 5 3.2 H --+---+-~zci .~ I . ~ ~ CT 3.1 H--+---+-+ u~ ~~ wO
3.0 11.6
:;; _ 11.8 H----i--~ -0 1 D. 0l
'" u "O 12.0 H --+---+-~ >
U =>. "'--.; ~~ ~ O
'" L ~
12.2 l-t--+---+-+
1- 0 12.4 H---j---+--+- -+---+---j--+-=--t--=:.:.r=-==r= ·
o 100 10 2 10 '
Isothermal ag eing t i me (sec)
F ig. 3.
~1 00"!,
10 6
~ ' 2 . 4 ~-~-----__t-------j-------+--· 999000sec
The absolute thermoelectric power versus electrical conductivity plo ts a t O°C for iso thermal ageing at various tempera tures for low-carbon aluminiumkilled steel quenched
from 700°C. 0.0840 0 .0845 0 .0850 0 .08 55 0.0860
Electrical conductivity at O·C ().JQ-l cm -l )
Research Article

( 692 ) Transactions ISIJ, Vol. 20, 1980
of cementite. It should be remarked that the gradient has a
smaller dependence on temperature in a range [rom 100°C up to 250°C. This suggests that the reactions taking place on ageing within this temperature range must be very similar. The carbide phase precipitated on ageing at these temperatures could not be identified by electron diffraction, but was considered to be a metastable carbide, presumably . -carbide with {lOO}a habit.
The data of resistivity a nd thermoelectric power given in Fig. 2 are plotted in a IOglO·loglo [l /{ l - J(t)}] versus loglO t graph as shown in Fig. 4 for fitting to an empirical equation
J(t) = 1- exp [ - (t iT)" ) ,
where J(t) is the fraction precipita ted within a period of time t, a nd nand T are constants. The fraction precipitated J(t) was calculated [rom the relation
J(t) = (Po-Pt)/(po - pp)
or J(t) = (St -So)/(Sp - So) ,
where P a nd S are the electrical resistivity and the thermoelectric power, a nd the subscripts 0, t, and F refer to the start, the p eriod t, and the end of a precipitation process, respectively. The end of the early precipita tion process a t each temperature was defined by the deflection point of the corresponding straight line in the plot of Fig. 3, since the deflection indicates the commencement of the subsequent different reaction . The values of exponent 11 given by the slopes of the straight lines in Fig. 4 are 1.5 for the ageing a t 300°C and 250°C, 1.3 at 200°C, 1.1 at 150°C and 100°C, 1.5 at 75°C, and 1.6 at 50°C, pa rt of which agrees fairly well with more precise analyses using binary iron- carbon alloys by Wert,4) Pitsch and Lucke8 ) and by Doremus. 13)
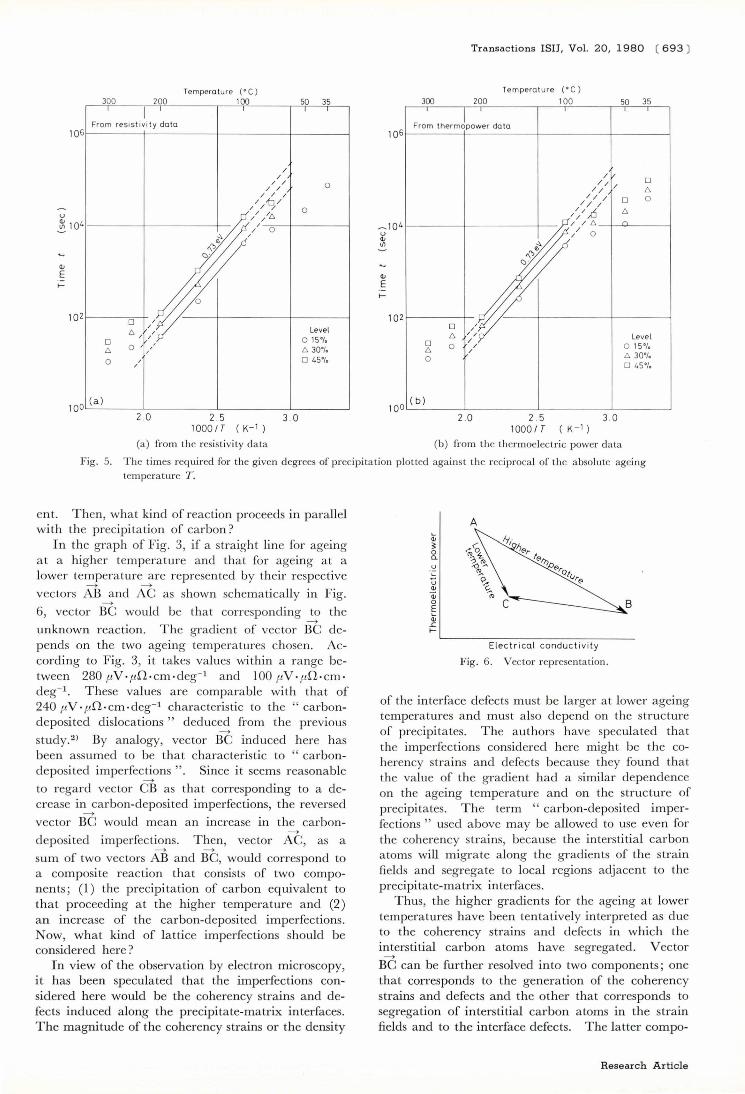
The logarithms of the times required to effec t equal amounts of carbon precipitation at the eight ageing temperatures are plotted against the reciprocal of the a bsolute ageing temperature T (K ) for three intermediate stages of precipitation, Fig. 5. Figure 5 (a)
Time (min)
Research Article
is plotted from the data of electrical reSIstIvIty, and (b) from the data of thermoelectric power, both given in Fig. 2. Normalization for the degrees of precipitation was made by assuming that the final stage on ageing for a long time a t 300°C corresponds to 100% precipItation. From the slopes of the straight lines connecting the data-points for 200°C, 150°C and 100°C, the apparent activation energy is found to be approxima tely the same for the three levels of precipitation a nd is 0.73 ± 0.03 eV. This value is nearly the same with those reported by Wert,3) 0.76 ± 0.07 eV (17.5 ± 1. 7 kcal/mol), by Doremus,l2) 0.74± 0.02 eV (17.1±0.5kcaIJmol ), a nd by Chollet a nd Crussard,16) O. 715 ± 0.02 eV (16.5±0. 5 kcaIJmol ). Detailed analysis of the kinetics has not been made, because, a t present, we have no satisfactory method of analysis for the precipitation process in low-carbon steels. It is evident that the data-points plotted at the right a nd left extremes in Fig. 5 for a given degree of precipitation can not be connected by a straigh t line.
IV. Discussion
The thermoelectric power versus electrical conductivity graph given in Fig. 3 shows that the gradient increases with decreasing the ageing temperature. Besides, it has been shown that the gradient for the precipita tion of the metas ta ble carbide has a smaller dependence on temperature. These results show that the gradient not only depends on the ageing temperature but has a tendency to depend on the structure of precipitates.
As stated in a previous paper,2) the gradient characteristic to the interstitial carbon a toms can be regarded to be nearly 260 ,uV. ,ua. cm . deg- l . Even the lowest gradient given in Fig. 3 is o bviously higher than this value. The higher gradients for the ageing at lower temperatures suggest that the precipitation of carbides a t lower temperatures will not m erely be a simple reaction of draining of excess interstitial carbon atoms [rom the iron matrix but involve an unknown reaction that contributes to an increase of the gradi-
Fig. 4.
LOgIO.JogI O[I / {l -f(t)}] versus IOglOt graph. Open circles are plotted [rom the resistivity data, and open squares from the thermoelectric power data.
Temperature (' C) 300 200 100 50 35
Fr om resistivity data 106r-------+---------~--------_+------~
u
~ 1041---------+----------1--
<li E >-
10 2 0 /
/ 6
/ / /
0 6 0
/ /
0 / /
100 (a l 2.0 2.5 3.0
1000 I T (K -1 )
(a) from the resistivity data
o
o
Level 0 15'1, 6 30'1. 0 45'1.
Transactions ISH, Vol. 20, 1980 ( 693 )
Temperature ( . C)
300 200 100 50 35
From thermopower data 106 r-------+---------~--------_+------~
o 6
o 6 o
_104 r--------+----------~--) u <li til
<li E >-
102 r--------/-
100 (b)
o 6 o
o / /
6 // /
o /
2.0 2 .5 3.0 1000 I T (K -1 )
(b) from the thermoelec tri c power data
Level 0 15'1. 6 30'1. 0 45'1.
Fig. 5. The times required for the given degrees of p recipitation plotted agai nst the reciprocal of the absolute ageing temperature T.
ent. Then, what kind ofreaction proceeds in parallel with the precipitation of carbon ?
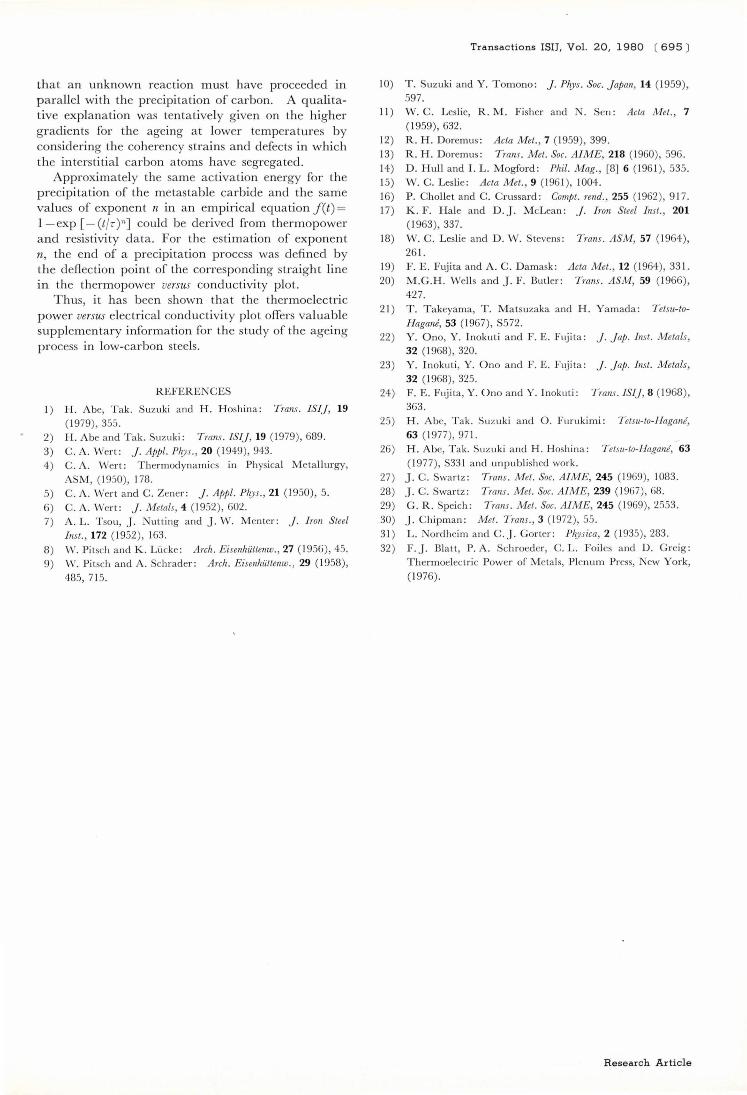
In the graph of Fig. 3, if a straight line for ageing at a higher temperature and that for ageing at a lower temperature are represented by their respective
--+ --+ vectors AB a nd AC as shown schematically in Fig.
6, vector BC would be that corresponding to the
unknown reaction. The gradient of vector Be depends on the two ageing temperatures chosen. According to Fig. 3, it takes values within a range between 280 .u V . .un. cm· deg- 1 and 100 .u V . .un. cm · deg- 1. These values are comparable with that of 240 .u V . .un. cm· deg- 1 characteristic to the " carbondeposited dislocations" deduced from the previous
study.2l By analogy, vector Be induced here has been assumed to be that characteristic to "carbondeposited imperfections". Since it seems reasonable
to regard vector CB as that corresponding to a decrease in carbon-deposited imperfections, the reversed
--+ vec tor BC would mean a n increase in the carbon-
--+ deposited imperfections. Then, vector AC, as a
urn of two vectors AB and Be, would correspond to a composite reaction that consists of two components; (1) the precipitation of carbon equivalent to tha t proceeding at the higher temperature and (2) a n increase of the carbon-deposited imperfections. Now, what kind of lattice imperfections should be considered here?
In view of the observation by electron microscopy, it has been speculated that the imperfections considered here would be the coherency strains and defects induced along the precipita te-ma trix interfaces. The magnitude of the coherency strains or the density
:;; ~ 0 Q.
u
U <li 0; 0 E :;; .I: >-
A
C
Electr ical conducti vity
Fig. 6. Vector representa tion.
of the interface defects must be larger a t lower ageing temperatures and must a lso depend on the structure of precipitates. The authors have speculated that the imperfections considered h ere migh t be the coherency strains a nd defects because they found that the value of the gradien t had a similar dependence on the ageing temperature and on the structure of preCipItates. The term "carbon-deposited imperfections " used above may be allowed to use even for the coherency strains, because the in terstitial carbon atoms will migrate along the gradients of the strain fields and segregate to local regions adjacent to the precipita te-matrix interfaces .
Thus, the higher gradients for the ageing at lower tempera tures have been tentatively interpreted as due to the coherency strains and defects in which the interstitial carbon atoms have segregated. Vector
--+ BC can be further resolved into two components; one that corresponds to the genera tion of the coherency strains and defects and the other that corresponds to segregation of interstitial carbon atoms in the strain fields and to the interface defects. The latter compo-
Research Article

( 694 ) Transactions ISIJ, Vol. 20, 1980
nent involves the elimination of the local lattice strains, or the tetragonal strains, around the interstitial carbon atoms through interaction with the coherency strains and defects. Although the atomistic model for such an interaction is unknown, the explanation of the high gradients proposed in the previous paper2) is deemed to be qualitatively justified from the above speculation using vector analysis.
It should be noted in this connection that the first tempering stage of the tetragonal martensite in a eutectoid carbon steel has been found 26) to show a gradient of about 950 pV.pD.cm .deg- l . Though it is still larger than the highest value of 830 pV·pD . cm .deg- 1 observed in the present study for the ageing at 35°C, similar interpretation must be given also to the tempering process of martensite. It should a lso be noted that the strain energy of the " self-stressed cementite" defined by Swartz27 ,28) increases as the temperature of ageing is lowered and is I 100 cal/mol at 300°C. The difference between the value of 300 pV . pD ·cm ·deg- 1 for the ageing at 300°C and that of 260 pV . pD ·cm ·deg-1 for the dissolution of incoherent cementite particles into the iron matrix may be caused by the lattice strains corresponding to 1 100 cal/mol.
During the ageing at 35°C, 50°C and 75°C, two stages of hardening were observed as shown in Fig. 1. An explanation is that the interstitial carbon atoms must have segregated to dislocations during the first stage and clustered into fine precipitates along them during the second stage. On the basis of the above interpretation on the higher gradients for the ageing at lower temperatures, the marked hardening of the second stage observed by ageing at 35°C, 50°C and 75°C may be argued to be caused by the coherency strains and defects in which the carbon atoms h ave segregated.
In Fig. 3, the slope changes at around 160 000 sec for the ageing at 35°C, 52 900 sec at 50°C, 32 400 sec at 75°C, 40000 sec at lOO°C, 25320 sec at 150°C, 900 sec at 200°C, and 132 sec at 250°C. By prolonged ageing over 132 sec at 250°C, the data-point gradually deviates from the original straight line and approaches to the neighbouring straight line for the ageing at 300°C. This indicates that the reaction taking place on prolonged ageing at 250°C is the replacement of the metastable carbide by cementite, being accompanied by disappearance of the coh erency strains and defects. The abrupt decrease of the slope at around 900 sec, 25 320 sec and 40 000 sec respectively for the ageing at 200°C, 150°C and lOO°C may also be explained by the commencement of the same phenomenon, whereas that of around 32 400 sec, 52 900 sec and 160 000 sec respectively for the ageing at 75°C, 50°C and 35°C may be explained by the commencement of the metastable carbide precipitation.
From the value of electrical resistivity at the deflection point of the line shown in Fig. 3, the amount of carbon precipitated during the early-stage reaction at each temperature was estimated as given in Table 2. The electrical resistivity contribution of carbon
Research Article
Table 2. The amount of carbon having precipitated at the end of the first-stage reaction at each tem-perature.
The deflection point of the stra ight line Decrease Amount Ageing given in Fig. 3
In of carbon temper- resistivity precipi-atu re Resistivity (OC) Time at liq . -N2 Po-Pp tated
(sec) temp. (,uU·cm) (wt. % )
PF (~IU . cm )
35 160000 3.290 0.057 0.0019
50 52900 3.275 0.072 0.0024
75 32400 3.201 0.146 0.0049
100 40000 3. 133 0.214 0.0073
150 25320 3. 123 0.224 0.0076
200 900 3. 122 0.225 0.0076
250 132 3 . 156 0.191 0.0065
300 120 3.050 0.297 0.010
in solution was assumed to be 29.5pD.cm/wt.%.29) It is intcresting to note that the amounts of carbon precipitated were nearly the same for the ageing at lOO°C, 150°C and 200°C, where the precipitated phase was the metastable carbide and a common activation energy could be deduced from Fig. 5 (a) or (b). The amount of carbon in supersaturated solid solution after quenching from 700°C was 0.011 wt. %. Therefore, the amounts of carbon retained in solution at the end of the early-stage reaction at lOO°C, 150°C, 200°C and 250°C would be 0.0037wt. % , 0.0034wt. % , 0.0034wt. % and 0.0045wt. % , respectively. On the other hand, the values of solubility for c-carbide in ferrite calculated from the equation30)
wt.%C = 1.1 5 exp [-6 lO8/RTJ
are 0.0003wt. %, 0.0008wt. % , 0.0017wt. % and 0.0032wt. % , respectively at lOO°C, 150D C, 200°C and 250°C. Part of the apparent inconsistency between the respective values may be attributed to the multicomponent equilibria in the commercial steel used in the present study and to the disregard of the a mounts of carbon segregated to grain boundaries a nd dislocations, but another part may be due to the coherency strains and defects, the effects of which have been neglected in the above estimation of the amounts of carbon retained in solution.
In the present paper, a nalyses of the data on the basis of the Nordheim- Gorter rule31 ) have not been made because the magnon-drag or the phonon-drag component is thought to be larger than the electrondiffusion component. 32)
V. Summary
The absolute thermoelectric power versus electrical conductivity plots for isothermal ageing of a lowcarbon aluminium-killed steel showed that each precipitation process was represented by a straight line with a gradient characteristic to it . The gradient increased as the temperature of ageing was lowered a nd had a tendency to depend on the structure of precipitates. From these results it was speculated
that an unknown reaction m ust h ave proceeded in parallel with the precipitation of carbon. A qualitative explanation was tentatively given on the higher gradients for the ageing at lower temperatures by considering the coherency strains a nd defects in which the interstitia l carbon atoms have segregated.
Approximately the same activation energy for the precipitation of the metastable carbide and the same values of exponent n in an empirical equation J(t ) = l -exp [ - (tfr)n] could be derived from thermopower and resistivity data. For the es timation of exponent n, the end of a precipitation process was defined by the deflection point of the correspond ing straight line in the thermopower versus conductivity plot.
Thus, it has been shown that the thermoelectric power versus electrical conductivity plot offers valuable supplementary information for the study of the ageing process in low-carbon steels.
R EFERENCES
I ) H . Abe, Tak. Suzuki a nd H . Hoshina: Trans. ISIJ, 19 ( 1979), 355 .
2) H . Abe and Tak. Suzuki: Trans. ISIJ, 19 (1979), 689 . 3) C. A. Wert: J. Appl. Phys ., 20 ( 1949), 943. 4) C . A. Wert: Thermod ynamics in Physical M etall urgy,
ASM, ( J 950), J 78. 5) C. A. Wert and C. Zener: J. Appl. Phys., 21 ( 1950),5.
6) C. A. Wert : J. M etals, 4 ( 1952 ), 602. 7) A. L. T sou, ] . N utting and ] . W. Menter: ) . Iron Steel
Inst ., 172 ( 1952), 163. 8) W. Pitsch a nd K . Lucke : Arch. Eisenlllltlenw., 27 (1956),45. 9) W. Pi tsch a nd A. Schrader : Arch. Eisenh,iUenw. , 29 (1958),
485,7 15.
Transactions ISIJ, Vol. 2 0 , 1980 ( 695 )
10) T. Suzuki a nd Y. Tomono : J. Phys. Soc. J apan, 14 ( 1959), 597.
II ) W . C. Leslie, R. M. Fisher and N. Sen: Acta Mel., 7
( 1959), 632. 12 ) R . H. Doremus : Acta Met., 7 ( 1959), 399. 13) R . H. Doremus: Trans . M et. Soc. AIME, 218 ( 1960), 596 . 14) D. Hull a nd I. L. M ogford : Phil. Mag., [8] 6 ( 196 1), 535 . 15) W . C. Leslie: Acta Met., 9 (196 1), 1004. 16) P . Chollet a nd C . C russard : Compt . rend., 255 (1962), 9 17. 17) K. F. H ale and D .]. M cLean: J. Iron Steel b lSt., 201
( 1963),337. 18) W. C. Leslie and D. W. Stevens: Trans . ASM, 57 (1964),
26 1. 19) F. E. Fujita and A . C. Damask: Acta M et., 12 (1964), 33 1. 20) M .G.H. Well s and ]. F. Butler: Trans. ASM, 59 (1966),
427. 2 1) T. Takeyama, T. M atsuzaka and H . Yamada: Tetsu-to
Hagane, 53 (1967), S572. 22) Y. Ono, Y. I nokuti a nd F. E. Flu ita: J . l ap. Inst. Metals,
32 (1968), 320. 23) Y. Inokuti, Y. Ono a nd F. E. Fujita: J . Jap . 1IlSt. Metals,
32 (1968), 325. 24) F. E. Fujita, Y. Ono and Y. Inokut i: Trans. lSI), 8 (1968),
363. 25) H. Abe, Tak . Suzuki and O. Furukimi: Tetsu-to-Hagan!,
63 ( 1977), 97 1. 26) H. Abe, T ak. Suzuki a nd H. H oshina: Tetsu-to-Hagan!, 63
( 1977), S33 1 and unp ublished work . 27) ]. C. Swartz: Trans. Met. Soc. Al ME, 245 ( 1969), 1083.
28) ] . C. Swartz: Trans. Mel. Soc. Al ME, 239 ( 1967), 68. 29) G. R. Speich: Trans. M el. Soc. Al ME, 245 ( 1969),2553. 30) ] . C hipman: M et. Trans. , 3 (1972), 55.
31) L. Nordheim a nd C. ]. Gor ter: Plrysica, 2 ( 1935),283.
32) F.]. Blatt, P. A. Schroeder, C. L. Foiles and D . Greig: Thermoelectric Power of Metals, Plenum Press, New York,
(1976).
Research Article