Potential of Thermoelectric Generators based on Ionic Liquids ...
60
North Sea Conference & Journal LTD 2 Charlestown Walk, Cove Bay, AB12 3EZ, Aberdeen, Scotland, United Kingdom http://www.nscj.co.uk/JECM/ | [email protected] | +44(0)1224 875635 Volume 3, Issue 2 July 2016 Featured article: Potential of Thermoelectric Generators based on Ionic Liquids Stefanie Uhl 1* , Edith Laux, Tony Journot, Loïc Piervittori, Laure Jeandupeux and Herbert Keppner 1 Haute Ecole Arc Ingénierie (HESSO), Eplatures-Grise 17, 2300 La Chaux-de-Fonds, Switzerland
-
Upload
khangminh22 -
Category
Documents
-
view
1 -
download
0
Transcript of Potential of Thermoelectric Generators based on Ionic Liquids ...

North Sea Conference & Journal LTD
2 Charlestown Walk, Cove Bay, AB12 3EZ, Aberdeen, Scotland, United Kingdom http://www.nscj.co.uk/JECM/ | [email protected] | +44(0)1224 875635
Volume 3, Issue 2 July 2016
Featured article:
Potential of Thermoelectric Generators based on Ionic Liquids Stefanie Uhl1*, Edith Laux, Tony Journot, Loïc Piervittori, Laure Jeandupeux and Herbert Keppner 1 Haute Ecole Arc Ingénierie (HESSO), Eplatures-Grise 17, 2300 La Chaux-de-Fonds, Switzerland

i ©2016
ISSN 2056-9386
Volume 3 (2016) issue 2
TABLE OF CONTENTS pages
Article 1: Potential of Thermoelectric Generators based on Ionic Liquids Stefanie Uhl1*, Edith Laux, Tony Journot, Loïc Piervittori, Laure Jeandupeux and Herbert Keppner 1 Haute Ecole Arc Ingénierie (HESSO), Eplatures-Grise 17, 2300 La Chaux-de-Fonds, Switzerland
42-50
Article 2: High efficiency perovskite/crystalline silicon thin-film tandem solar cell from a highly textured MgO [111] buffered glass substrate: a proposal Ashok Chaudhari1* 1Solar-Tectic LLC, 416 Long Hill RD E, Briarcliff Manor, NY 10510, United States
51-58
Article 3: Crude Glycerol as Substrate for Oleaginous Yeasts Heike Kahr1*, Manuel Pointner1, Klaus Krennhuber1, Alexander Jäger1 1School of Engineering and Environmental Sciences, University of Applied Sciences Upper Austria, 4600 Wels, Austria
59-63
Article 4: District heating as the infrastructure for competition among fuels and technologies Poul Erik Grohnheit 1, Bent Ole Gram Mortensen 2 1DTU Management Engineering, Technical University of Denmark, Building 426, Produktionstorvet, DK-2800 Lyngby, Denmark 2University of Southern Denmark Department of Law, Campusvej 55, DK-5230 Odense M, Denmark
64-69
Article 5: Funnel Flight Controller for a Simulation Model and Attitude Control System Norman Hopfe1* and Guido Kurth2 1R&D Engineer, Bayern-Chemie GmbH, P.O. Box 1131, 84544 Aschau am Inn, Germany 2Technical Director, Bayern-Chemie GmbH, P.O. Box 1131, 84544 Aschau am Inn, Germany
70-82

ii ©2016
ISSN 2056-9386
Volume 3 (2016) issue 2
Article 6: A Review of Materials Science Research Pathways and Opportunities for Building Integrated Photovoltaics Bjørn Petter Jelle1,2*, Serina Ng2, Tao Gao1, Sohrab Alex Mofid1 and Tore Kolås3 1Norwegian University of Science and Technology (NTNU), Department of Civil and Transport Engineering, NO-7491 Trondheim, Norway. 2SINTEF Building and Infrastructure, Department of Materials and Structures, NO-7465 Trondheim, Norway. 3SINTEF Materials and Chemistry, Department of Materials and Nanotechnology, NO-7465 Trondheim, Norway.
83-92
Article 7: Multisided Approach for Photovoltaics Regulated Outputs: Computer-based Simulations Janvier Kamanzi1*, Mohamed Kahn1 1 Centre for Distributed Power and Electronic Systems, Cape Peninsula University of Technology, Cape Town 7535, South Africa
93-99

42 ©2014
ISSN 2056-9386
Volume 3 (2016) issue 2, article 1
Potential of thermoelectric generators based on ionic
liquids
基于离子液体的热电发生器之潜力
Stefanie Uhl1*, Edith Laux, Tony Journot, Loïc Piervittori, Laure Jeandupeux and
Herbert Keppner
1 Haute Ecole Arc Ingénierie (HESSO), Eplatures-Grise 17, 2300 La Chaux-de-Fonds, Switzerland
Accepted for publication on 14 May 2016
Abstract - In advanced thermoelectric materials the key
aspect lies in the reduction of the thermal conductivity
while maximizing electric carrier transport. Skutterudites,
clathrates, Half-Heusler compounds, complex
chalcogenides and thin-film properties are only examples
of tracks which are taken to optimize material properties
for thermoelectric applications.
New in the row of the advanced materials is Ionic
Liquids (ILs) which have been investigated regarding their
thermoelectric properties only by a few research groups in
the last years. ILs are organic salts that exist as liquids
below a threshold temperature, various at room
temperature, and constitute a new generation of solvents
composed of 100% of cations and anions.
The possibility to fine-tune practically all the ILs
physiochemical properties by modifying its chemical
structures makes IL truly designer solvents and might
allow the optimization of the thermoelectric properties.
Out of 15 tested off-the-shelf ILs a large range of Seebeck
coefficients and Power outputs could be observed.
The potential of ILs does not only lie in the promising
thermoelectric properties; liquids could also open new
fabrication methods regarding flexible TEG modules using
the Solid-on-Liquids Technology.
This paper investigates in a first part fundamental
material studies of the promising protonic Ionic Liquid,
Ethylammonium nitrate (EAN). In a second part, the
integration of Ionic Liquids in a thermoelectric generator
module is demonstrated.
Keywords - Ionic Liquids, Thermoelectricity, Flexible TE
modules, Low Power Generation
I. INTRODUCTION
Reduction of thermal conductivity of a TEG is obvious due
to the fact that a high thermal conductivity will not allow the
creation of a significant temperature difference at reduced
heat-flows. By that the generator voltage is poor and a high
number of junctions must be serially connected. Looking at
applications, the trend goes to energy autonomous devices.
Originally the military was demanding for solutions, but also
space missions. Recently, modern microelectronics had a
tremendous success in further reduction of power consumption
of all kinds of integrated circuits, displays, CMOS devices etc.
which allows to drive them with a low power TEG as long as
the created voltage is sufficiently high [1]. Thermoelectric
Generators have, (together with photovoltaic generators) no
moving mechanical parts and no maintenance is needed within
their lifetime.
Conventional (Bi,Sb)2(Te,Se)3-based thermoelectric
materials and devices report very good performances at room
temperature [2]. However if these materials are assembled and
series-connected as a large number of bulk elements, certain
difficulties and limitations arise in making highly miniaturized
and flexible modules. Flexibility is one aspect that let increase
the field of application of a TEG, since it can be applied around
an object that needs to be electrically powered. Trends are
observed in using wearable generators that can make use of the
bodies’ heat for powering biomedical devices, but also for
consumer electronics such as bracelets for watches and
acquisition systems for sports activities.
For such applications high flexibility is particularly needed
[3-6] allowing a better thermal contact to the heat source
surface as compared to rigid systems that must be
mechanically clamped. Therefore TEG’s technology passes

Uhl et al. (2016) Potential of Thermoelectric Generators based on Ionic Liquids
44 Journal of Energy Challenges and Mechanic ©2016
more and more to thin-film technology allowing serial
connection of the junctions at low space for obtaining the
needed system voltage. The use of (Bi,Sb)2(Te,Se)3- thin films
allows increasing the integration of P/N couples on a given
surface, however the maintainable temperature difference over
the module is limited, again, due to the high thermal
conductivity which leads, again, to low output voltages [7].
Due to low thermal conductivities of Ionic Liquids (e.g.
[BMIM][BF4] λ=0.184W/mK [8]) the temperature gradient
between hot and cold electrode is maintained and high Seebeck
coefficients ([BMIM][BF4] S=850μV/K [18]) could be shown.
In contrast, the electrical conductivity ([EAN][NO3]
σ=2.82S/m [9]) is generally low as compared with solid-state
materials.
TEGs using ILs combined with elastic silicone-based
substrates combine two effects: first high flexibility can be
achieved; second, low thermal conductivity of the IL prevents
a thermal short-circuit (see Fig. 1) and generates therefore
enhanced voltages. In order to guarantee bubble-free
packaging for the IL and series connection, solid on liquid
technology will be applied [10].
Moreover, the reliability of TEG modules might be
improved by ensuring a stable interface between the
thermoelectric material and the electrode. The performance of
solid-state-based TEG modules tends to degrade with thermal
cycling as the constituent materials and the interfaces are
exposed to large temperature gradients. This increases the
internal resistance caused by poor contacts and micro cracks
between a thermoelectric material and the electrode [12].
II. EXPERIMENTAL
2.1. MEASUREMENT SETUP
The current-voltage characteristics of the ILs of the
generator have been performed in a specially designed test cell
sketched in Fig. 2 [13]. The test setup consists of two thermally
highly conductive sapphire plates that are coated with an inert
electrode material (1µm Rhodium) that is in contact with the
IL. Externally a 4-point configuration allows the current-
voltage-power measurements and obtaining the data of the
Seebeck coefficient. To avoid IL losses, the cell is sealed using
a silicone gasket (d=4mm). The aluminium bodies are
connected with a heater (thermal resistor, Vitelec, France) and
cooler system (Thermostat Frigiterm, J.P. Selecta S.A,
Barcelona, Spain); the thermocouples (Type K, Jumo-
Regulations, Metz, France) are placed close to the sapphire
plates between the IL and the heater, respectively cooler
(Fig.2).
Fig. 2 Experimental setup for the characterization of the
TEGs based on ILs
In order to extract a current from the TEG, redox couple
I2/LiI was added to the IL. The thermally generated potential
difference at the electrodes was shunted using high precision
resistors and the output current could be determined. For
measurements of the open circuit voltage (VOC) and the
voltage under load, a high impedance voltmeter was used
(Data Acquisition System 34970A and 34901A, Agilent, Santa
Clara, CA, USA). The system is fully automatized allowing
measuring the potential difference and the heating/cooling
dynamics, as well as the stabilization of the measured data.
The I-V characteristic was obtained by switching a resistance
cascade in parallel to the test cell using the 4-probe-method.
The resistances between 5Ω and 100MΩ have a tolerance of
0.1%. Every 10 seconds a measurement is taken and the
maximum errors from the measurement system are less than 1
μV and ±1.5 K. The error in the temperature measurement due
to thermal resistances at the contacts is not taken into account
at this stage. The total concentration of impurities in the
studied ILs was less than 2 % (Ionic Liquids Technologies,
Heilbronn, Germany), and a concentration inaccuracy of the
added redox couple of ±10 % is assumed.
The relative Seebeck-coefficient was determined from the
slope of the measured voltage-temperature curve as:
SE = (Umax - Umin) / (ΔTmax - ΔTmin) (1)
Whereby ΔUmin is the potential difference [V] between the hot
and cold electrode at the temperature difference ΔTmin [K] and
ΔUmax, the potential at ΔTmax.
One of the principle advantages for using IL in TEGs is seen
in the unique possibility for significantly reducing the thermal
conductivity of the active substance. In previous work [13] it
was mentioned that the heat flow in TEG based on ILs is
convective, hence the effective heat-conductivity must be
Fig. 1: Equivalent thermal circuit of a generator with a
thermal load [11]. A TEG with a low thermal resistance
will short-circuit the temperature difference.

Uhl et al. (2016) Potential of Thermoelectric Generators based on Ionic Liquids
45 Journal of Energy Challenges and Mechanic ©2016
measured of better understanding the devices. These
measurements have been carried out using a test cell as shown
in Fig. 2 which was put into a vacuum system at 5 Pa pressure.
In this case parasitic heat loss from the heater electrode
(copper in this case) could be avoided.
2.2. RESULTS AND DISCUSSION
EAN was found to be the so far most promising IL as soon
as 0.4 Mol/l redox couple I2/LiI is added [14]. Furthermore,
the output-power of the TEG could be increased by heating the
cold electrode to about 30 °C. This effect was attributed to
thermal activation of bulk-conductivity effects, but also as
thermal activation for enhanced electron exchange between the
electrode and the Helmholtz layer. In Fig. 3 it can be seen that
the current that can be extracted from a TEG, has a maximum
at higher temperatures as the maximum power point. It is
surprising that just not a high difference between the hot and
the cold electrode exhibits the best working condition for an
IL-based TEG; the cold electrode must be rather activated.
Fig. 3: Mismatch between the maximum power point and
the highest extractable current. The cold electrode must be
“activated” [14].
In Fig. 3 the reduction of the temperature difference
between the fixed T(hot) =58°C and the increasing variable
T(cold) gives rise to continuous voltage reduction that has its
impact on the power of the device. Allowing T(hot) to increase
let match the current maximum with the power maximum. The
effect of heating the cold electrode was further researched
comparing the same sample under 50-30 conditions [T(hot) =
50°C; T(cold) = 30°C] with 130-60 conditions. For 3.5 times
increasing of the heat flow Fig. 4 shows that the electrical
power increases 77 times.
In a next step T(hot)-T(cold) was kept constant at 5 K and
the hot temperature was varied starting form 20°C up to 94°C.
The experiment was assumed getting more insight into the
ideal working conditions of IL-based TEGs. Fig. 5 shows the
voltage-current and Fig. 6 the voltage-power characteristics.
Fig. 4. Comparison of the V-I-P characteristics of EAN+0.4
Mol/L I2/LiI under 50-30 (left) and 130-60 (right). The
power is increased 77 times.
Fig. 5 V-I characteristics of EAN+0.4Mol/L redox for
temperature differences of 5 K.
Fig. 5 confirms the trend that current extraction needs heat;
note the heat-flow P through the generator is defined by
equation (2):
0.02
0.04
0.06
0.08
0.1
0.12
0.14
0
0.1
0.2
0.3
0.4
0.5
0.6
0.7
0.8
0 10 20 30 40 50 60
I (M
PP
) [m
A]
P (M
PP
) [µW
]
T(cold) [°C]
EAN+ 0.4 mol/L Redox current at MPP / Power at MPP
DT =58 °C- T(cold)

Uhl et al. (2016) Potential of Thermoelectric Generators based on Ionic Liquids
46 Journal of Energy Challenges and Mechanic ©2016
𝑃 = 𝐴 ∙ 𝜆
𝑑∙ Δ𝑇 (2)
whereby, A is the surface where the IL is in contact with the
electrode. Looking at Fig. 6 it can be observed in this
systematics that the maximum power point is at low T(hot)-
values rather at increased voltages, whereas at increased
T(hot)-values it is shifted to lower voltages.
Fig. 6: Voltage-Power characteristics of the TEG from Fig.
5. Note the Maximum Power point is shifted to lower
voltages as soon as T(hot) is increased.
Fig. 7: Link between the internal resistance calculated from
Ri=V(MPP)/I(MPP) and the maximum power output and
T(hot).
Looking at Fig. 5 and 6, it is obvious that the power follows
the current as soon as T(hot) is increasing. However, the open
circuit voltage is decreasing. Looking at solid-state devices,
the voltage depends rather exclusively from the temperature
difference. Fig. 8 evaluates the Seebeck coefficient for the
series of the measurements from figures 5, 6 and 7.
Fig. 8: Despite the constant temperature difference (5 K),
the Seebeck coefficient (VOC / T(hot)-T(cold)) decreases
with increasing T(hot). Repeated measurements of the point
30-25 were not reproduced, probably due to different
electrode coverage.
The effect observed in Fig 8 is surprising and a model
explaining this observation is needed. There are two
mechanisms that could explain the phenomenon:
1. Due to enhanced T(hot) and T(cold) the thermally
selective carrier attachment at the electrodes is
reduced due to modified Helmholtz-layer / electrode
interaction.
2. Due to the fact that the cells of the generator have
rather a large diameter (A = 176.7 mm2) at low
thickness (d = 4 mm), the heat transport is highly
convective. Enhanced convective flow at globally
higher temperatures (T(hot) and T(cold)) increases
the apparent total heat conductivity, leading to a
reduced temperature difference in the vicinity of the
liquid-electrode interface, and by that to a reduced
VOC and Seebeck coefficient.
In order to find an explanation, the apparent heat conductivity
(consisting of laminar and turbulent contribution) was
measured. The cell of Fig.2 was equipped with a high heat-
capacity copper electrode and put into a vacuum system to
avoid unwanted parasitic heat losses. For this experiment, the
Copper-body was heated up; after switching off the heater the
stored thermal energy was released via the sample into the
cooled Al body. For verification, the experiment was carried
out only using the Copper/Sapphire/Sapphire/Aluminum stack
0.45
0.5
0.55
0.6
0.65
0 20 40 60 80 100
See
bec
k co
effi
cien
t [m
V/K
]
temperature of hot electrode [°C]
Seebeck coefficients DV/DT for
T(hot)-T(cold)= 5 K EAN+0.4 Mol/L RedoxT(hot): variable

Uhl et al. (2016) Potential of Thermoelectric Generators based on Ionic Liquids
47 Journal of Energy Challenges and Mechanic ©2016
and the sample arrangement without IL in the reservoir. The
results of the measurements are summarized in Fig. 9.
Fig. 9: Heat transport experiments using three different
configurations. The middle curve represents the sample that
is loaded with EAN+redox.
As assumed the left graph show the strongest decay (linear);
the transport is dominated by the 3 interfaces (Cu/sappire,
sapphire/sapphire, sapphire/Al) the total conductivity is 20
times smaller as Sapphire 42 W/(mK). The upper curve
represents the unloaded sample holder with an apparent heat
conductivity of =0.355 W/(mK). The IL loaded sample
indicates two slightly different regimes (modified slopes); the
one between 80°C and 50°C is more pronounced (= 0.713
W/(mK)), as compared to the one between 50°C to 30 °K (=
0.555 W/(mK)). The measurement of the heat conductivity
could support model 2, but does not exclude model 1.
III. APPLICATION
3.1. DESIGN AND FABRICATION OF SERIAL CONNECTED
THERMOPILES
The proposed TEG (Fig.10) comprises a flexible Silicone
substrate (e.g. Polydimethylsiloxane (PDMS), thickness range
0.25-3.2mm) and a plasma bonded thin polymer film (e.g.
Mylar®, thickness range 0.36-0.75μm) on both sides, which
contain the electrode pattern for the serial connection of the IL
cells. PDMS is suitable due to its chemical inertness, flexibility
and low heat-conductivity (λ=0.15 W/(mK)), avoiding
parasitic heat-flow through the generator. Looking at Fig. 9
typical heat-flows through an EAN TEG are less than λ=0.5
W/(mK)). Furthermore, plasma assisted bonding together with
Solid on liquid deposition [10] allow a perfect bubble-free
hermetic sealing. A first prototype of 34 serial-connected cells
is represented in Fig. 10.
Fig. 10: TEG module (1.5x1.5cm) with 34-serial
connected IL-cells based on a Silicone substrate.
In the following, a schematic representation of the
fabrication steps is shown in figure 11. The polymer foil is
structured by Laser (Laser Nanoseconde, Type Nd:YAG
Fresco-Ultra, Fab. Coherent, spot size 20μm) and partially
masked with blue tape (I), see Fig. 12. The holes have a
diameter of 0.3mm and the masked area corresponds to the
electrode pattern (Ø1.2mm, track width 0.8mm, track length
13 mm) which is coated with Rhodium in a later step. (II) In a
plasma enhanced chemical vapor deposition process (PECVD),
a SiOx layer is deposited with a gradually changing
composition, starting with an inorganic SiO2 layer (ratio 2
O2/HMDSO) and ending with an organic composition (ratio
15 O2/HMDSO). This adhesion layer is necessary to reach a
strong bond between the polymer foils and the silicone
substrate by plasma bonding. The area for the metal electrodes
are spared because of the adhesion properties. The electrode
pattern is coated in a physical vapor deposition (PVD) process
and the thickness of the rhodium layer is 500nm (V), see Fig.
13. The mask is subsequently lifted off and the patterned
polymer foils are plasma bonded (N2 10 Pa, 50W/40sec, curing
2h/60°C) to the Polydimethylsiloxane (PDMS) substrate on
both sides (VII). Before filling the cavities, the surfaces are
activated with an argon plasma for a good wettability (Ar 10
Pa, 20W/60sec). The masked device is placed in a vacuum
chamber together with a reservoir of IL which is tilted to pour
the liquid over the cavity inlets (Fig. 14). By setting the sample
again under ambient pressure, the cavities are filled with the
ionic liquid, see Fig. 15 and 16. The same procedure is
repeated for the opposite side with the second Ionic Liquid
(Fig. 17).
1
1.5
2
2.5
3
3.5
4
4.5
5
0
20
40
60
80
100
0 2x10³
4x10³
6x10³
8x10³
10x103
D T
[K]
Tem
perature [°C]
time [s]
coppersapphiresiliconesapphireAluminium
coppersapphire
silicone + ILsapphireAluminium
coppersapphiresapphireAluminium
thermal transport measurementsfrom heater (Cu) to cooler (Al) sapphires + empty silicone containersapphires + container filled with ILsappires
l = 2.78 W / K m
l = 0.713 W / K m
l = 0.555 W / K m
l = 0.355 W / K m

Uhl et al. (2016) Potential of Thermoelectric Generators based on Ionic Liquids
48 Journal of Energy Challenges and Mechanic ©2016
Fig. 11: (I), (II) and (III) Polymer foil and mask is structured
by Laser to coat the SiOx adhesion layer; (IV), (V) and (VI)
Subsequently the electrode pattern for the serial connection
of the cells are coated by PVD; (VII) on both sides of a laser
structured PDMS substrate, a patterned polymer foil is
plasma bonded; (VIII) the cavities are filled under vacuum
and the liquid is encapsulated.
Fig. 12: Mylar Foil
structured by laser and
masked with bluetape
Fig. 13: Rhodium
electrodes, deposited by
sputtering; layer thickness
500nm
Fig. 14: Vacuum filling technique for cavities: Liquid is
applied in the reservoir (right side) and the substrate is tilted
after applying the vacuum. The liquid flows through a
narrow channel over the inlets of the cavities (left side) and
after a complete coverage, the sample is set again under
ambient pressure. While cycling the pressure, residual air
bubbles in the cavities are degased and the cavities are
completely filled with IL.
Fig. 15: left: unfilled cavity (hole diameter 0.3mm); right:
IL-filled cavity
Fig. 16: TEG module filled
from one side with ionic liquid
(e.g. p-equivalent type of IL)
Fig. 17: TEG module is
turned and filled with the
second IL (e.g. n-equivalent
type)
3.2. CHARACTERISATION OF THERMOPILE
The characterization of the prototype was made in the setup
described above, to determine the total Seebeck coefficient and
of 34 serial-connected IL cells. As shown in previous work
[18], IL with positive and negative Seebeck coefficients could
be found. EAN+ 0.2 Mol/l I2/LiI has a positive coefficient and
17 cells have been filled with and the residual 17cells with
Methyl-3-propyl iodide (PMIM I) with 0.2Mol/l I2 (negative
coefficient).
In a former material study, the two ILs have been characterized
with the following Seebeck Coefficents:
EAN + I2/LiI 0.2 Mol/l SE= 629μV/K
PMIM I + I2 0.2 Mol/l SE= -56μV//K
(I)
(II)
(III)
(IV)
(V)
(VI)
(VII)
(VIII)
Polymer foil Mask I SiOx Mask II Metallisation PDMS IL n-type IL p-type Parylene

Uhl et al. (2016) Potential of Thermoelectric Generators based on Ionic Liquids
49 Journal of Energy Challenges and Mechanic ©2016
Theoretically, the TEG module should therefore have a total
Seebeck Coefficient of:
SE_total=17 x 629μV/K – 17 x (-56μV/K)
= 11.6mV/K
The determined Seebeck Coefficient was 9.24mV/K.
The difference might be explained by a locally lacking thermal
contact when heating/cooling the 34 cells.
Fig.18: Prototype with 34 serial-connected cells (ΔT=37K);
Ethylammonium nitrate with 0.2Mol/l I2/LiI and 1-Methyl-
3-propyl iodide (PMIM I) with 0.2Mol/l I2
Looking at the power output of the device, one can observe
a pounced mismatch between the properties of the liquids with
positive and negative Seebeck coefficients (Fig. 19); the liquid
PMIM I has a high cell resistance and limits therefore the
current extraction [18]. Further material research has to be
done to find or design an Ionic Liquids with a negative
Seebeck Coefficient and the ability of a high carrier extraction.
Fig. 18 and Fig. 19 illustrate the mismatch in detail.
Fig. 19: V-I-P characteristics of the negative SE-partner in
the thermoelectric module. These properties limit the
overall performance of the EAN part.
IV. CONCLUSION
Ionic liquids are interesting candidates as thermoelectric
materials because their thermal conductivity is 5 to ten times
smaller as compared to solid-state materials. This is a typical
property of liquids in general. A high thermal conductivity
means that for a given heat-flow only a small temperature
difference can be generated across the material ending in
strongly reduced generator voltages. Ionic liquids present a
large new variety of substances, creating space for
optimization and new developments. It is concluded in this
paper that the current is the principal remaining bottleneck for
further conversion efficiency increase. One way out is given
by further optimizing redox couples that allow in a cyclic
process carrier exchange with the electrodes at low energy. A
further way out is just heating of the entire device; heating
overcomes the activation energy for increasing the bulk
conductivity and for carrier exchange between the liquid and
the electrodes. It was found that an increase of the heat-flow
of 3.5 times lead to an increase of the electrical power of 77
times.
An issue is the encapsulation of the ILs. The advantage of
choosing liquids in combination with polymers appears to be
ideal looking at manufacturing of highly flexible generators;
however long-term sealing and bubble-free packaging is not
straightforward. In this paper the first result on a successfully
serial connected IL-based TEG is presented, whereby all
process steps could be solved. ILs exhibit positive and
negative Seebeck coefficients; this is principally favorable for
obtaining higher voltages, however at present the values of the
internal resistance negative SE ILs are by far too high and more
effort must be done in order to “match” them with positive SE
ILs.

Uhl et al. (2016) Potential of Thermoelectric Generators based on Ionic Liquids
50 Journal of Energy Challenges and Mechanic ©2016
ACKNOWLEDGEMENTS
The authors acknowledge the financial support of the
‘Polish-Swiss-Research Programme’ for the project
‘‘ENERLIQ” (Grant number: PSPB-051/2010) in
collaboration with Gdansk University of Technology in
Poland, and by the Swiss Federal Office of Energy and the
Swiss Space Center.
REFERENCES
[1] M. Belleville, E. Cantatore, H. Fanet, P. Fiorini, P.
Nicole, M. Pelgrom, C. Piquet, R. Han, C. van Hoof,
Ruud Vullers, M. Tartagni. “Energy Autonomous
Systems: Future Trends in Devices, Technology, and
Systems, CATRENE, 2009
[2] www.micropelt.com, www.nextreme.com,
www.eureca.de, www.marlow.com
[3] S. Kim, J. We, B. Cho. “A wearable thermoelectric
generator fabricated on a glass fabric”,
Energy&Environmental Science, 7, pp.1959-1965, 2014.
[4] G. Sevilla, S. Inayat, J. Rojas, A. Hussain, M. Hussain.
“Flexible and Semi-Transparent Thermoelectric Energy
Harvester from Low Cost Bulk Silicon (100)”,
Communications: Energy Harvesters, Small 2013, 9, no.
23, pp. 3916-3921, 2013
[5] S. Jo, M. Kim, M. Kim, H. Kim, Y. Kim. „Human Body
Heat Energy Harvesting Using Flexible Thermoelectric
Generator For Autonomous Microsystems”, 16th
International Conference on Miniaturized Systems for
Chemistry and Life Sciences, Oct. 28 – Nov. 1 Okinawa,
Japan, pp. 839-841, 2012
[6] V. Leonov. “Energy Harvesting for Self-Powered
Wearable Devices”, Wearable Monitoring Systems, pp.
27-49, 2011
[7] W. Glatz, E. Schwyter, L. Durrer, C. Hierold. “Bi2Te3-
Based Flexible Micro Thermoelectric Generator With
Optimized Design“, Journal of Microelectromechanical
Systems, vol. 18, no. 3, pp. 763-772, 2009
[8] M. Valkenburg, R. Vaughn, M. Williams, J. Wilkes.
“Thermochemistry of ionic liquid heat-transfer fluids”,
Thermochimica Acta 425, pp. 181-188, 2005
[9] S. Uhl, E. Laux, T. Journot, L. Jeandupeux, J. Charmet,
H. Keppner. “Development of Flexible Micro-Thermo-
electrochemical Generators based on Ionic Liquids”,
Journal of Electronic Materials, pp. 3758-3764, 2014
[10] A. Homsy, E. Laux, L. Jeandupeux, J. Charmet, R.
Bitterli, C. Botta, Y. Rebetez, O. Banakh, H. Keppner.
“Solid on liquid deposition, a review of technological
solutions”, Microelectronic Engineering 141, pp. 267-
279, 2014
[11] V. Leonov. “Chapter 2 Energy Harvesting for Self-
Powered Wearable Devices”, Wearable Monitoring
Systems, DOI 10.1007/978-1-4419-7384-9_2, p. 29,
2011
[12] W. Park, M. Barako, A. Marconnet, M. Asheghi, K.
Goodson. “Effect of Thermal Cycling on Commercial
Thermoelectric Modules”, IEEE, Thermal and
Thermomechanical Phenomena in Electronic Systems,
pp. 107-112, 2012
[13] H. Keppner, S. Uhl, E. Laux, L. Jeandupeux, J. Tschanz,
T. Journot. “Ionic Liquid-based Thermoelectric
Generator: Links between Liquid Data and Generator
Characteristics”, Materials Today: Proceedings 2, pp.
680-689, 2015
[14] E. Laux, S. Uhl, T. Journot, J. Brossard, L. Jeandupeux,
H. Keppner. “Aspects of protonic ionic liquid as
electrolyte in thermoelectric generators”, Journal of
Electronic Materials: Conference Proceedings ICT &
ECT, pp 1-7, 2016
51 ©2016
ISSN 2056-9386
Volume 3 (2016) issue 2, article 2
High efficiency perovskite/crystalline silicon thin-film
tandem solar cell from a highly textured MgO [111]
buffered glass substrate: a proposal
来自于高度织构氧化镁[111]缓冲玻璃基板的高效率
钙钛矿/结晶硅薄膜串列式太阳能电池:一个建议
Ashok Chaudhari1*
1Solar-Tectic LLC, 416 Long Hill RD E, Briarcliff Manor, NY 10510, United States
Accepted for publication on 27 July 2016
Abstract - In this paper, a proposal for high-efficiency
perovskite/crystalline silicon thin-film tandem solar cells is
presented. The proposal is based on the successful fabrication of
a highly textured MgO [111] thin-film on a glass substrate which
is a promising indicator for the successful growth of highly
textured (c-axis aligned) silicon films on which textured
perovskite films can then be deposited for high-efficiency tandem
solar cells.
Keywords – perovskite solar cells, thin-film crystalline silicon
solar cells, MgO substrates.
I. INTRODUCTION
In today’s solar cell market high power conversion
efficiency (PCE) is the most important factor in any
photovoltaic technology.i It was only recently that cost was
considered to be the primary factor, and of course it still
remains paramount, but PCE may now even be something
manufacturers will pay extra for because efficiency lowers the
balance of system costs (BOS) and therefore the overall price
per Watt installed (currently at $3.00 USD per Watt without
subsidies with the goal of $1.00).ii Ideally, both factors – PCE
and low cost -- can be achieved, and here a proposal to
accomplish this by fabricating a perovskite/crystalline silicon
thin-film tandem solar cell is presented for the first time. To
date, to the best of our knowledge, there have been no
proposals or reports on a perovskite/silicon thin-film tandem
solar cell device whether amorphous thin-film silicon or
crystalline thin-film silicon.
II. BACKGROUND
Recently papers were published by Solar-Tectic LLC iii
reporting the growth of a highly textured MgO [111] film on
soda-lime glass, iv crystalline Al2O3 on this same MgO
substrate,v and silicon film growth also on this MgO/soda-lime
glass substrate. vi Additionally, a paper was published
reporting crystalline silicon film growth on glass without an
MgO buffer layer, where the glass was a flexible glass made
by a leading glass manufacturer.vii While these papers prove
that inexpensive deposition of crystalline silicon thin-films on
ordinary glass is possible, their efficiency when converted to
solar cells will be necessarily limited by the single absorber
layer. This is true even if a single crystal thin-film of silicon
without defects could be grown on glass, a long standing
objective in the materials research community, which remains
to be accomplished.viiiix
Also recently, much attention within the solar cell
community has been focused on a relatively new material
called perovskites, specifically metal halide organic-inorganic
hybrid perovskites. It has been suggested that a tandem solar
cell consisting of a silicon sub-cell layer (of wafer thickness)
combined with a perovskite layer would provide a solution to
solving both the efficiency and cost problems which are
keeping solar energy from truly competing with fossil fuels,
without subsidies.x Here we propose an alternative which is
potentially less expensive, non-toxic, and equally efficient to a
perovskite/silicon wafer tandem solar cell structure of the kind
proposed thus far: a tandem solar cell consisting of a thin-film
of crystalline silicon on soda-lime glass and perovskite film

Chaudhari (2016) High efficiency perovskite/crystalline silicon thin-film tandem solar cell from a highly textured MgO …
52 Journal of Energy Challenges and Mechanics ©2016
grown on this film for a planar heterojunction high efficiency
solar cell. Following the recipe (recently patented) of the late
Dr. Praveen Chaudhari, a textured silicon film is grown on an
MgO [111] buffered soda-lime glass substrate from a silicon-
tin eutectic melt and a tandem solar cell is formed by the
addition of a layer of another material with better light
conversion efficiency, i.e. with a higher bandgap. In the new
process disclosed here for the first time by Solar-Tectic LLC
(patent pending) the Sn from the Si-Sn eutectic alloy melt
which has segregated on the surface of the crystalline silicon
film after deposition is then used as the metal in the perovskite
structure thus replacing the toxic lead, and facilitating a planar
heterojunction device formation for high efficiency, low cost.
In the following pages, data will be provided regarding the
first and second steps in this architecture, namely the MgO
[111] on glass substrate and the crystalline silicon film grown
on it; and in the second half of the paper a proposal regarding
the third and final step – the deposition of the perovskite film
on the crystalline silicon film, will be described, though many
details remain and this is only an introduction to a new process
invented which will be developed.
III. STEP 1: TEXTURED MGO [111] FILM ON SODA-
LIME GLASS
For the perovskite/crystalline silicon tandem solar cell a
textured buffer layer that serves as a diffusion barrier for the
soda-lime glass, preventing glass impurities from entering the
silicon, as well as a template to induce texture in the silicon
film, is preferable as it is known than textured materials have
distinct electronic advantages, and this includes
perovskites.xixii Although the MgO [111] film on glass is
highly transparent (see figure 2), transparency is not a
requirement for the device architecture since light must enter
first through the top perovskite layer which has the higher
bandgap. It is the combination of the higher bandgap
perovskite with the lower bandgap silicon that allows for
higher voltage and PCE.
The textured MgO [111] film on glass serves the purpose
of the required buffer layer for the tandem device. As
already stated a previous paper reported the successful
deposition of the MgO [111] film on soda-lime glass, and
here we present some additional data regarding this
accomplishment which has not been made public until now.
Figure 1 shows a second XRD that was performed on the
same sample as reported on in the previous paper, but
includes the associated parallel [222] peak thereby indicating
and/or confirming that a good crystalline formation (better
than if there had only been one [111] peak) was obtained. To
further investigate the quality of the crystalline MgO [111]
film, TEM was performed (see figure 3) clearly evidencing
alignment or high texture. A rocking curve was also
performed on a highly textured (almost perfectly aligned)
sample of 3µm MgO [111] film deposited on a quartz
substrate at 800°C using the same invented processxiii. This
particular sample was chosen because of the near perfect
alignment and thinner film, and it showed a large FWHM
(see figures 4 and 5).
Fig.1, XRD of 7µm MgO [111] on soda-lime glass with associated [222] peak at ~78 dgrees.
0
2000
4000
6000
8000
10000
12000
20 30 40 50 60 70 80
CP
S
Degrees
Sample 14 - MgO- Soda-lime Glass

Chaudhari (2016) High efficiency perovskite/crystalline silicon thin-film tandem solar cell from a highly textured MgO …
53 Journal of Energy Challenges and Mechanics ©2016
Figure 2: Transparency of MgO on glass. The layer here is
7µm thick and shows high transparency, or ~99%.
Figure 3: Selected area diffraction from TEM of 7µm
MgO [111] film on soda-lime glass showing a c-axis aligned
or highly oriented [111] film was grown directly on glass.
Fig.4: XRD of 3µm of MgO [111] on quartz. No peaks
besides the MgO [111] and MgO [222] parallel peak (at ~78
degrees) are visible indicating near perfect out-of-plane or c-
axis alignment.
Fig.5, Rocking Curve of 3µm MgO [111] on quartz at 800°C
7.4 degrees.

Chaudhari (2016) High efficiency perovskite/crystalline silicon thin-film tandem solar cell from a highly textured MgO …
54 Journal of Energy Challenges and Mechanics ©2016
It was hypothesized that higher temperature may improve
the crystalline quality compared to the sample reported on in
the previous paper since generally crystallinity of materials
improves with higher temperature. It was therefore
considered to be a “best case” scenario. The FWHM of the
rocking curve indicates the range of tilt angles through which
the MgO 111 planes are oriented, which was determined to
be 7.4 degrees, a wide range. For comparison, single crystals
usually give a FWHM of 0.1 deg. using the same
configuration. Additional investigation and a rocking curve
of the 7µm MgO [111] film on soda-lime glass samples
reported on the previous paper is planned in the near future.
IV. STEP 2: CRYSTALLINE SILICON DEPOSITION ON
THE MGO/SODA-LIME GLASS SUBSTRATE.
For deposition of thin-films on a textured substrate from a
eutectic alloy melt, the energetics of the interface with the
substrate and/or the vacuum or gas must be considered, and it
is not only the chemical interaction of the metal or Si with the
substrate that is important but also its crystallographic
orientation. This is because the surface or interface energy
depends upon orientation of the grains.xiv Here the MgO has a
strong texture which is [111] oriented, and should therefore
be advantageous to silicon [111] film growth. However,
another concern is the difference in lattice match between the
nucleating film and the substrate which can lead to strain
induced energy that is minimized by either inducing defects
or not growing uniformly in thickness across the substrate
surface. There is a lattice mismatch between MgO and
silicon that may be adverse to achieving high quality films.
MgO has a lattice constant of 4.212Å and silicon 5.431 Å.
These factors determine if silicon is likely to deposit on the
substrate (heterogeneous nucleation) or nucleate and form
small crystals in the liquid (homogenous nucleation).xv
When considering the texture of the MgO on glass, it is
important to determine whether it is uniaxial or biaxial. In
other words, whether it has in-plane or out-of-plane texture.
In order to determine this, EBSD was performed on the
samples, presented here for the first time. It was clear (see
figure 6) that the sample was highly textured [111] out-of-
plane. It was also evident that there was little or no in-plane
texture, which is not surprising since the films were deposited
on an amorphous substrate without ion beam assistance. It
should be noted that it is well known that MgO films with
both in-plane and out-of-plane texture can be grown using ion
beam assisted deposition (IBAD). But this process is more
expensive than the process we report on here. Moreover, it is
not clear that biaxial orientation and epitaxy would be
necessary in the process since epitaxial growth with both in-
plane and out-of-plane texture is not always necessary and
preferentially oriented polycrystalline films are often
sufficient.xvi Also, if one looks at this process as a kind of
Vapor-liquid-solid thin-film process (VLS-TF) where the
film is essentially a nanowire-like, and therefore -- because
nanowires are single crystal -- single crystal-like thin-film,
which depends more on the out-of-plane crystallographic
orientation of the film for growth (necessarily the case with
nanowire growth), one can see how in-plane texture may not
be so important.xvii Also, with nanowire growth the [111]
direction is crucial. (For details on this VLS-TF process by P.
Chaudhari please see McMahon et al, “Textured [111]
crystalline silicon thin film growth on flexible glass by e-
beam evaporation”). Indeed, it may be for this reason that the
film growth reported on in a recent paper where silicon was
deposited on the MgO/glass substrate was not oriented as
thought. It was polycrystalline but there was no texture.
Initial XRD scans seemed to indicate the film was textured,
as there was only one silicon peak in the XRD, but TEM later
showed the film to be polycrystalline (see figure 7) without
oriented silicon. We reason that the lack of orientation could
be due to the amount of Al that was used. Too much Al
would prohibit nanowire-like film growth and would not lead
to oriented film growth, failing to replicate the high texture in
the MgO substrate clearly evidenced in the XRD. On the
other hand, the process disclosed by P. Chaudhari is probably
closer to a modified liquid-phase epitaxy method. And
therefore it may be necessary to grow biaxially textured
substrates in order to obtain the quality of crystallinity that is
the aim of his invention, and indeed is a part of the
prescription. However, the plan view TEM of the same
sample, presented here for the first time (see figure 8),
showed a completely continuous film with crystals of various
sized completely covering the MgO substrate and no
pinholes. The film was etched to remove the Al from the Si
film.
Figure 6: Inverse pole figure from EBSD confirming a
highly oriented [111] MgO crystalline film has been
grown.

Chaudhari (2016) High efficiency perovskite/crystalline silicon thin-film tandem solar cell from a highly textured MgO …
55 Journal of Energy Challenges and Mechanics ©2016
Figure 7: TEM SAED diffraction pattern showing a
polycrystalline Si film with perhaps some in-plane
orientation but otherwise no texture, despite the strong
intensity of the [111]. (Cornell University, CCMR,
2016).xviii
Figure 8: Plan view TEM of same sample as in figure 7,
showing a completely continuous Al etched polycrystalline
Si film covering the MgO/glass substrate. No pin holes are
evident. (Cornell University, CCMR, 2016).xix
V. STEP 3: PEROVSKITE FILM GROWTH ON THE SI
FILM.
As already stated, solar cell efficiency is now of primary
importance and in fact also lowers overall costs since the
BOS costs are reduced with increased PCE. Many now
believe that the best way to achieve a highly efficient and
cost effective solar cell is by fabricating a tandem (or multi-
junction) solar cell, consisting of two layers, where one layer
has a bandgap higher than the other, and the layers work in
tandem towards higher efficiency light conversion. The
question is which materials should be used for this structure.
Silicon has a near ideal bandgap for a sub-cell (1.1eV),xx and
the more difficult question is which material should be used
for the top layer (with higher bandgap). Interestingly, there is
only one example found in the literature of a tandem solar
cell consisting of crystalline thin-film silicon layer, and it is
with germanium (on the bottom). A proposal and simulation
for this was reported with maximum efficiencies of 28%
predicted.xxi However, very recently, perovskites have
gained much attention due to the rapid increase in efficiency
from just 3.8% in 2009 to over ~20% at present. It has been
suggested that combining perovskites with silicon for a
tandem cell is a viable way to gaining market entry in a
silicon wafer dominated industry; and initial tandem device
models predict that 36% to 37% efficiencies are achievable
for perovskite/silicon tandems.xxii However, these are not
thin-film devices since the Si is wafer thickness or fabricated
by the same process as Si wafers, namely at very high
temperatures.
For a thin-film crystalline Si tandem solar cell, a perovskite
top absorber layer is an attractive material because
perovskites are easy and cheap to make.xxiii But there are
several significant problems that prevent perovskites entry
into the market place at this pointxxiv. One such problem is the
use of Pb (lead) as the main metal, which is toxic. Here we
present a solution to this problem by replacing lead with Sn
(tin) in a tandem structure. This has actually been
demonstrated before in a perovskite solar cell,xxv but not with
a thin-film crystalline Si under layer. A crystalline Si under-
layer can be deposited at low temperature using eutectics and
requires much less materialxxvi. It is therefore is less
expensive than c-Si wafers. So far the only tandem solar cell
reported which used crystalline thin-film Si as an under-layer
was with a P3HT (polymer).xxvii Here for the first time we
propose a process that uses Sn as the metal catalyst for low
temperature crystalline silicon thin-film growth that not only
makes use of the highly efficient perovskite material
combined with silicon, but in using a thin-film of silicon
rather than a wafer, additional cost savings are achieved since
less silicon material is needed. Moreover, by using a Sn-Si
eutectic alloy (rather than the more common Al-Si used in
Aluminum Induced Crystallization) to deposit the silicon at
low temperature on the MgO [111] buffered glass, the Sn can
be used as the metal (the “B” in ABX3) in the perovskite
material, thus avoiding the otherwise necessary step of
etching the Sn from the surface of the silicon layer. The
process is simple, and can take place at low temperature – a
crucial advantage often cited in connection with perovskite
technology too -- using known deposition methods and non-
toxic materials and processes throughout. Depositing the
silicon film by e-beam evaporation avoids the costly and dirty
manufacturing process associated with silicon wafers, both
polycrystalline and monocrystalline. Since silicon has a
global market share of about 90%, there is obviously a huge
market potential for silicon thin-films with comparable
quality to c-Si but with additional efficiency (beyond the
25.6% Si wafer current record) due to the tandem perovskite
layer.xxviiixxix And this holds true for any material with a
higher bandgap such as CZTS which is another contender for
a top layer due to its high bandgap as well as closely
matching lattice parameter with that of silicon.

Chaudhari (2016) High efficiency perovskite/crystalline silicon thin-film tandem solar cell from a highly textured MgO …
56 Journal of Energy Challenges and Mechanics ©2016
As for details of the perovskite material, the family of
perovskite materials adopt the chemical formula ABX3, where
A and B are cations of dissimilar sizes, and X are anions. B
is the metal cation and would in this case be Sn instead of
Pb.xxx Either a hybrid perovskite (organic-inorganic) or a
non-organic perovskite material can be used, though it is
known that the non-organic perovskites have bandgaps that
are too large for high PCE.xxxi Therefore, a likely material
would look like MASnI3. And the deposition process for
combining the MA and I3 with the Sn would be that known in
the art and involve common processes, and while this
requires much more development and detailed investigation,
there is reason to be optimistic because perovskites are
versatile and there is room for various configurations.
The versatility of perovskites makes them highly attractive
as they can form multidimensional structures pertaining to
the same chemical formula through use of different
combinations of various components. There is therefore
flexibility as to the exact perovskite compound.xxxii They are
known to easily form solar cells layers. “One of the real
beauties of perovskite is it almost doesn’t care how you make
it. Put a few drops of perovskite precursor, in liquid form, on
a piece of aluminum foil on your desk; leave it to evaporate
for a day; then plug in a metal probe and you have an
operating PV cell — cruddy output, but output nonetheless”
as one industry expert put it, perhaps somewhat
unscientifically!xxxiii
Despite the seeming ease of fabricating perovskite films
described above, there are potential hurdles. The B metal
cation sites in hybrid perovskites are occupied by the group
IVA metals in a divalent oxidation state (Pb2+, Sn2+, Ge2+).
Lead (Pb) has proven the superior constituent compared to tin
(Sn), both in terms of performance and stability, and
consequentially has been the most widely employed of the
group IVA metals.xxxiv In the new process presented here,
one concern is this issue of Sn stability. Another issue is how
exactly the remaining components of the perovskite structure
would be combined with the Sn layer on Si. Finally, if there
are any impurities in the Sn from the Si (per Si-Sn eutectic
melt), how will this affect the perovskite material?
As far as the solar cell structure is concerned, planar
heterojunction perovskite/silicon solar cells have already
been achieved. And they can be made with an electron
transport layer between the silicon and the perovskite, or
without. For example, a perovskite/silicon multi-junction
solar cell may also be constructed via monolithic integration
where a thin film perovskite sub-cell is deposited directly
onto the c-Si sub-cell without a recombination layer.xxxv In
the case of the process we propose here the Sn on the surface
of the silicon (the Sn segregates to the surface of the Si film
in the process) film can be oxidized to form a SnO2 electron
transport layer onto which the perovskite film is then
deposited. SnO2 has already been proven to be a viable
substitute for the common TiO2.xxxvi This SnO2 film is also
likely to have texture if the underlying silicon film does.
While texture would be advantageous, it is not necessary
for an efficient perovskite layer. Textured crystalline silicon
and perovskite layers in a tandem cell would however be
likely to have improved efficiencies as it is known that in
order to achieve highly efficient perovskite layers good
quality crystallinity is key. That is, crystallization of the
perovskites, including the orientation, grain size, and
morphology, determines the device performance of
perovskite solar cellsxxxvii. There has been one report of
textured perovskite growth.xxxviii However, at the present
time, there are no reports of any perovskite/crystalline or
amorphous silicon thin-film results (or patent applications).
And this includes both a-Si and crystalline Si from aluminum
induced crystallization. Work has however been done on
perovskite/thin –film CIGS tandem structuresxxxix. Yet a
crystalline silicon thin-film would have many advantages
over CIGS, not least because CIGS uses selenide (H2Se)
which is highly toxic. Also the manufacturing process is
much more complicated than the crystalline silicon thin-film
deposition process reported on here which is a
straightforward e-beam or CVD (or HW-CVD) deposition
method already used widely in the display industry, for
example.
III. CONCLUSION
In conclusion, additional characterizations of the MgO
[111] film growth on soda-lime glass have been provided,
confirming the high texture growth, but also clarifying the
texture is limited to out-of-plane or uniaxial as per EBSD
results and analysis. Also, further investigation and analysis
of the rocking curve (FWHM) should be undertaken and its
significance reported. Secondly, further characterizations of
the crystalline silicon film grown on this MgO [111] film
have been reported and have clarified that in fact the Si film
is likely not textured as originally thought, though it is
polycrystalline and TEM showed that it is completely
continuous even after etching of the Al. Such a film, if
deposited using Sn instead of Al at the catalyst, could serve
as the bottom layer in a tandem cell where perovskite film
could be deposited. Moreover, the Sn segregated on the Si
film could be used to form the MASnI3 material thus saving
the step of etching the Sn and also perhaps improving the
perovskite material. Such a perovskite/crystalline silicon
thin-film solar cell could be an even better solution than the
current perovskite/c-Si design recommended by a number of
groups, since lower temperature processing could be
sufficient all around, not just for the perovskite film. Details
of this proposal will be reported on as R&D commences in
the near future.

Chaudhari (2016) High efficiency perovskite/crystalline silicon thin-film tandem solar cell from a highly textured MgO …
57 Journal of Energy Challenges and Mechanics ©2016
REFERENCES
i C. Bailie and M. McGehee, “High efficiency tandem
perovskite solar cells” MRS Bulletin, vol. 40, August 2015. ii R. Martin, “Wind and Solar Will Be the Cheapest Way to
Generate Power by 2040” MIT Technology Review, June 13,
2016. iii Solar-Tectic LLC is a start-up based primarily on the
technologies invented by the late Dr. Praveen Chaudhari,
winner of the 1995 US National Medal of Technology. iv A. Chaudhari, R.D. Vispute, H. Efstathiadis, “Extremely
highly textured MgO [111] crystalline films on soda-lime
glass by e-beam”, Materials Letters 121 (2014) 47-49. v A. Chaudhari, R.D. Vispute, T. Murray, H. Efstathiadis,
“Crystalline Al2O3 on buffered soda-lime glass by e-beam”,
Materials Letters 136 (2014) 407-410. vi S. McMahon, A. Chaudhari, H. Efstathiadis, “Highly
textured silicon [111] crystalline thin-film on buffered soda-
lime glass by e-beam evaporation”, Materials Letters 140
(2015) 123-126. vii S. McMahon, A. Chaudhari, Z. Zhao, H. Efstathiadis,
“Textured [111] crystalline silicon thin film growth on
flexible glass by e-beam evaporation”, Materials Letters 158
(2015) 269-273. viii K. Chen, R. Kapadia, A. Harker, S. Desai, J.S. Kang, S.
Chuang, M. Tosun, C.M. Sutter-Fella, M. Tsang, Y. Zeng, D.
Kiriya, J. Hazra, S.R. Madhvapathy, M. Hettick, Y.Z. Chen,
J. Mastandrea, M. Amani, S. Cabrini, Y.L. Chueh, J.W. Ager,
“Direct growth of single-crystalline III-V semiconductors on
amorphous substrates”, Nature Communications
DOI:10.1038, 2016. ix S. Kühnapfel, S. Gall, B. Rech, D. Amkreutz, “Towards
monocrystalline silicon thin films grown on glass by liquid
phase crystallization”, Solar Energy Materials & Solar Cells
140 (2015) 86-91. x V. Sivaram, S. Stranks, H.J. Snaith, “Outshining silicon: An
upstart material – perovskite – could finally make solar cells
that are cheaper and more efficient than the prevailing silicon
technology” Scientific American, July 2015. xi M. Yang, Y. Zhou, Y. Zeng, C.S. Jiang, N. Padture,
“Square-centimeter solution processed planar Ch3NH3Pbl3
perovskite solar cells with efficiency exceeding 15%”, Adv.
Mater. 2015. xii C. Teplin, D.S. Ginley, H.M. Branz, “A new approach to
thin film crystal silicon on glass:Biaxially-textured silicon on
foreign template layers”, Journal of Non-Crystalline Solids
352 (2006) 984–988. xiii For details of the process see R.D. Vispute et al “Methods
of producing large grain or single crystal films” (US
2014/0245947, patent pending). xiv P. Chaudhari, “Methods of Growing Heteroepitaxial
Single Crystal or Large Grained Semiconductor Films and
Devices Thereon”, US Patent 9,054, 249. 2015. xv P. Chaudhari, “Methods of Growing Heteroepitaxial Single
Crystal or Large Grained Semiconductor Films and Devices
Thereon”, US Patent 9,054, 249. 2015. xvi J. Beeckman, J.P. George, K. Neyts, D.V. Thourhout,
“Ferroelectric thin films on silicon and glass for optical
applications”, IC1208, September, 2014.
xvii P. Chaudhari, H. Shim, B.A. Wacaser, M.C. Reuter, C.
Murray, K.B. Reuter, J. Jordan-Sweet, F.M. Ross, S. Guha,
“Heteroepitaxial silicon film growth at 600°C from an Al-Si
eutectic melt”, Thin Solid Films 518 (2010) 5368-5371. xviii This image was made at Cornell University’s Center
for Materials Research (CCMR), by Don Werder, in
2016. xix This image was made at Cornell University’s Center
for Materials Research (CCMR), by Don Werder, in
2016. xx C. Battaglia, A. Cuevas, S. De Wolf, “High-efficiency
crystalline silicon solar cells: status and perspectives” Energy
Environ. Sci. 2016, 9, 1552. xxi G. Sun, F. Chang, R.A. Soref, “High efficiency thin-film
crystalline Si/Ge tandem solar cell”, Optics Express, Vol. 18,
No.4, 15 February 2010. xxii C. Ballie and M. McGehee, “High efficiency tandem
perovskite solar cells” MRS Bulletin, vol. 40, August 2015. xxiii V. Sivaram, S. Stranks, H.J. Snaith,“Outshining silicon:
An upstart material – perovskite – could finally make solar
cells that are cheaper and more efficient than the prevailing
silicon technology” Scientific American, July 2015. xxiv K. Chen, R. Kapadia, A. Harker, S. Desai, J.S. Kang, S.
Chuang, M. Tosun, C.M. Sutter-Fella, M. Tsang, Y. Zeng, D.
Kiriya, J. Hazra, S.R. Madhvapathy, M. Hettick, Y.Z. Chen,
J. Mastandrea, M. Amani, S. Cabrini, Y.L. Chueh, J.W. Ager,
“Direct growth of single-crystalline III-V semiconductors on
amorphous substrates”, Nature Communications
DOI:10.1038, 2016. xxv N. Noel, S. Stranks, A. Abate, C. Wehrenfennig, S.
Guarnera, A-A. Haghighirad, A. Sadhanala, G.E. Eperon,
S.K. Pathak, M.B. Johnston, A. Petrozza, L.M. Hertz, H.J.
Snaith, “Lead-free organic-inorganic tin hailde perovskites
for photovoltaic applications”, Energy Environ. Sci. 2014, 7,
3061. xxvi C. Teplin, D. Ginley, H.M. Branz, “A new approach to
thin film crystal silicon on glass:Biaxially-textured silicon on
foreign template layers”, Journal of Non-Crystalline Solids
352 (2006) 984–988. xxvii A. Zellmeier, S. Kuhnapfel, B. Rech, N.H. Nickel, J.
Rappich, “Enhanced stability of
P3HT/poly-crystalline Si thin film hybrid solar cells”, Phys.
Status Solidi A, 1–5 (2016). xxviii C. Battaglia, A. Cuevas, S. De Wolf “High-efficiency
crystalline silicon solar cells: status and perspectives” Energy
Environ. Sci. 2016, 9, 1552. xxix V. Sivaram, S. Stranks, H.J. Snaith, “Outshining silicon:
An upstart material – perovskite – could finally make solar
cells that are cheaper and more efficient than the prevailing
silicon technology” Scientific American, July 2015. xxx Q. Chen, N. De Marco, Y.M. Yang, T-B Song, C-C. Chen,
H. Zhao, Z. Hong, H. Zhou, Y. Yang, “Under the spotlight:
The organic—inorganic hybrid halide perovskite for
optoelectronic applications “Nano Today (2015) 10, 355—
396. xxxi Q. Chen, N. De Marco, Y.M. Yang, T-B Song, C-C.
Chen, H. Zhao, Z. Hong, H. Zhou, Y. Yang “Under the

Chaudhari (2016) High efficiency perovskite/crystalline silicon thin-film tandem solar cell from a highly textured MgO …
58 Journal of Energy Challenges and Mechanics ©2016
spotlight: The organic—inorganic hybrid halide perovskite
for optoelectronic applications “Nano Today (2015) 10,
355—396. xxxii Q. Chen, N. De Marco, Y.M. Yang, T-B Song, C-C.
Chen, H. Zhao, Z. Hong, H. Zhou, Y. Yang “Under the
spotlight: The organic—inorganic hybrid halide perovskite
for optoelectronic applications “Nano Today (2015) 10,
355—396. xxxiiiD. Snieckus “Could this be solar's next big
breakthrough?” RECHARGE magazine, June 03 2016. xxxiv Ibid. xxxv J. Mailoa, C. Bailie, E.C. Johlin, E.T. Hoke, A.J. Akey,
W.H. Nguyen, M.D. McGehee, T. Buonassisi, “A 2 terminal
perovskite/silicon multijunction solar cell enabled by a
silicon tunnel junction”, Applied Physics Letters 106, 121105
(2015). xxxvi W. Ke, G. Fang, Q. Liu, L. Xiong, P. Qin, H. Tao, J.
Wang, H. Lei, B. Li, J. Wan, G. Yang, Y. Yan, “Low-
Temperature Solution-Processed Tin Oxide as an Alternative
Electron Transporting Layer for Efficient Perovskite Solar
Cells”, J. Am. Chem. Soc. 2015, 137, 6730−6733. xxxvii Z.K. Wang, X. Gong, M. Li, Y. Hu, J-M. Wang, H. Ma,
L-S. Liao, “Induced crystallization of perovskites by a
perylene underlayer for high performance solar cells”, ACS
Nano 2016, 10, 5479−5489. xxxviii M. Yang, , Y. Zhou, Y. Zeng, C.S. Jiang, N. Padture
“Square-centimeter solution processed planar Ch3NH3Pbl3
perovskite solar cells with efficiency exceeding 15%”, Adv.
Mater. 2015. xxxix L. Kranz, A. Abate, T. Feurer, F. Fu, E. Avancini, J.
Lockinger, P. Reinhard, S.M. Zakeerruddin, M. Gratzel, S.
Buecheler, A.N. Tiwari, “High-Efficiency Polycrystalline
Thin Film Tandem Solar Cells” J. Phys. Chem. Lett. 2015, 6,
2676−2681

59 ©2016
ISSN 2056-9386
Volume 3 (2016) issue 2, article 3
Crude glycerol as substrate for oleaginous yeasts
作为含油酵母基板的粗甘油
Heike Kahr1*, Manuel Pointner1, Klaus Krennhuber1, Alexander Jäger1
1School of Engineering and Environmental Sciences, University of Applied Sciences Upper Austria, 4600 Wels, Austria
Accepted for publication on 13th March 2016
Abstract - Diverse oleaginous yeasts can grow and accumulate
lipid on a broad range of competitive substrates. In this study
crude glycerol from conventional biodiesel production was used
as the substrate for lipid production via oleaginous yeasts.
Various cultivation conditions were tested – different C/N ratios,
temperatures and addition of salts.
Candida lipolytica, Yarrowia lipolytica, Trichosporon
fermentans produced up to maximum of 22 % (w/w) lipid
relating to the biomass at specific cultivation conditions. Scale up
experiments revealed the further challenges of the lipid
production via oleaginous yeasts - adhesion of the yeast,
production of citric acid, low biomass and lipid yield. The lipid
yield was 17 % (w/w) relating to the biomass despite addition of
detergent.
Keywords – oleaginous yeast, crude glycerol, lipid production.
I. INTRODUCTION
Conventional biodiesel is produced from diverse sources -
from edible plant oils (mainly from rapeseed in Austria) and
non-edible plant oils and waste oil. In the future biofuel
production should be done with non-food crops,
agro-industrial wastes and renewable resources. These
substrates will not compete with food and feed production and
will avoid a food versus fuel discussion.
The next generation biodiesel production is developed with
lipid accumulating microorganisms such as microalgae,
bacteria and fungi, especially yeast. The oleaginous yeasts
mainly belong to the genera Yarrowia, Candida, Rhodotorula,
Rhodosporodium and Cryptococcus [1] [2] [3].
The oleaginous yeasts convert low cost substrates to lipids,
grow quickly to high density, produce lipid year around and
can accumulate up to 70% oil by dry matter. The dominant
lipids are palmitic acid, palmitoleic acid, stearic acid, oleic
acid and linoleic acid - similarly to those detected in plant oils
and therefore suitable for biodiesel.
The lipid production via yeasts requires specific cultivation
conditions – often carbon excess and nitrogen limitation. But
the lipid production via yeast is also influenced by other
factors like the yeast species, stage of growth, carbon source
and level, aeration rate, temperature, presence of inhibitors,
nitrogen source, phosphorus level, thiamine, biotin, pH value
and acclimatization to a carbon source [4].
Glycerol is a co-product from the oleochemical industry
especially from biodiesel production. The global annual
biodiesel production will increase up to over 41 billion litres in
the year 2022 [5]. About 1 kg crude glycerol remains from 10
kg of biodiesel from rapeseed oil [6]. Refining this crude
glycerol to high purities is too costly and energy-intensive [7].
Several publications exist about the lipid production from
crude glycerol via oleaginous yeasts. For instance
Rhodotorula glutinis converted crude glycerol to 10.05 g/L
biomass, 60.6 % (w/w) lipid and 6.1 g L-1 lipid yield [8]. The
yeast Yarrowia lipolytica produced in continuous culture with
crude glycerol 3.5 g L-1 cellular lipid and 43 % (w/w) lipid [9].
First scale ups, pilot and demonstration plants were built
and run during the last century but theses factories were closed
because of the inefficient production. The first up to date scale
up (200 litres medium containing glycerol) was reported in the
year 2014 – here the cultivation of the yeast Metschnikowia
pulcherrima yields 2.06 g L-1 biomass and 34 % lipid (w/w)
[10].
We tested the oleaginous potential of diverse oleaginous
yeasts using crude glycerol from conventional biodiesel
production as substrate. Yarrowia lipolytica produced 22 %
lipid (w/w) relating to the biomass at specific cultivation
conditions. Finally we illustrated the problems with the scale
up - adhesion of the yeast, production of citric acid and low
biomass and lipid yield.
In future the industrial lipid production via yeast will be
feasible with cheap feedstock (like crude glycerol), higher
productivity and final higher oil concentrations.

Kahr et al. (2016) Crude Glycerol as Substrate for Oleaginous Yeasts
60 Journal of Energy Challenges and Mechanic ©2016
II. MATERIALS AND METHODS
2.1. YEASTS, MEDIA, PRECULTIVATION AND CULTIVATION
The cell growth and lipid accumulation of the yeast species
Candida lipolytica, Yarrowia lipolytica and Trichosporon
fermentans (kindly provided from the strain collection of the
company Agrana (http://www.agrana.at/)) were investigated
in this study.
The yeast was precultured in incubator shaker in crude
glycerol medium (60 g L-1 glycerol, 2 g L-1 yeast extract, 2 g
L-1 peptone, autoclaved at 121°C for 20 minutes) for 24 hours
at 180 rpm at 30°C. Furthermore yeast cells were adapted in
the crude glycerol medium over a lot of generations.
Screening was done in crude glycerol medium (60 g L-1
crude glycerol) with different C/N ratios and sometime with or
without salts (2.7 g L-1 potassium dihydrogen phosphate,
1.192 g L-1 disodium hydrogen phosphate dihydrate, 0.1 g L-1
ethylenediaminetetraacetic acid) at 25°C or 30°C with 180
rpm for 7, 10 or 17 days.
2.2. HPLC AND GC-FID ANALYSIS, MAIN IONS AND TRACE
ELEMENT ANALYSIS, DETERMINATION OF THE YEAST BIOMASS
Glycerol concentration was quantified by HPLC, using an
Agilent Technologies 1200 Series equipped with a Varian
Metacarb 87 H column (300x7.8 mm) at 65°C, H2SO4 (c = 5
mmol L-1) eluent and an isocratic flow rate of 0.8 mL min-1
was used. The data acquisition was performed per refractive
index detection and UV detection at 210 nm. For calibration
the method of external standard was applied. Data analysis
was performed per Agilent Chemstation 04.03 b.
Samples for the determination of main ions by IC were
prepared by dilution with the proper mobile phase followed by
centrifugation with a rotational speed of 13,000 min-1. The
main ionic components of the raw glycerin were determined
by a Dionex ICS 1000 ion chromatographic system, equipped
with an AS40 auto sampler. Signals were obtained by a
conductivity detector. For anions the chromatographic setup
was an IonPac AS14A (4x250 mm) separation column,
guarded by an IonPac AG14A (4x50 mm) and the suppressor
ASRS Ultra II, 4mm from Thermo Fisher.
For cations the chromatographic setup was an IonPac
CS12A (4x250 mm) separation column, guarded by an IonPac
CG12A (4x50mm) and the suppressor CSRS Ultra II 4 mm
from Thermo Fisher. Chromatographic conditions were set up
according the columns reference method. As calibration the
external standard method was applied. Standard solutions
were purchased from Merck Certipur.
Samples for determination of trace elementals by ICP OES
were prepared by centrifugation at a rotational speed of 13,000
min-1. The clear supernatant was diluted to a proper factor with
nitric acid (TRACE METAL Fisher Scientific, 67-70 %) c =
0.1 mmol L-1 in a 50 mL plastic screw tube.
Trace metal concentration was determined by ICP OES
from Horiba Jobin Yvonne, ULTIMA2, equipped with an AS
80 auto sampler using the software ICP Analyst 5.2. The argon
plasma torch (Air Liquide, >99,999 %) was generated with a
power of 1,000 Watt and a flow rate of 12 L min-1. Samples
were injected by a concentric Meinhard nebulizer in the
concentric cyclone chamber. As calibration, the method of
external standard was applied. Multi standard solution was
purchased from Roth Rotistar.
Cells were harvested by centrifugation at 5000 min-1 for 15
minutes. The supernatant was used for HPLC analysis. The
pellet was washed twice with pure water and utilized for
biomass determination (dried at 105°C until its mass is
constant).
For the analytical quantification of the fatty acid content and
distribution, 5 mL yeast suspension was centrifuged at a
rotational speed of 4000 min-1 for 15 minutes. The yeast pellet
was washed twice with 5 mL of deionized water and dried at
105°C for 24 hours. The pellet was resuspended and
methylated with 5 ml of methanol/acetyl chloride with a
volumetric dilution of 50:2 for 24 hours at 60°C. The reaction
was stopped by adding 2.5 mL of a sodium carbonate solution
with a concentration of 60 g L-1. Extraction was done by
adding 2 mL of hexane and shaking for 2 minutes. The upper
phase, containing the methyl esters, was transferred in a 1.5
mL crimp vial for GC analysis. The hexane extract was
injected in a Thermo Trace GC equipped with an autosampler
AS 2000 and detection was done with FID.
The chromatographic conditions were chosen according the
chromatographic columns, an Agilent J&W capillary column
DB23 60 m, 0.25 mm ID and 0.25 µm film thickness was used
for analytical separation. The data analysis was performed
with the software Chrom Card Data System Ver. 2.8 from
Thermo Finnigan. For calibration the external standard
method has been used.
III. RESULTS AND DISCUSSION
3.1. GLYCEROL COMPOSITION AND SCREENING OF YEAST AT
DIFFERENT C/N RATIOS AND TEMPERATURES
The crude glycerol was kindly provided by the company
BDI (Grambach, Graz, Austria). The content of this crude
glycerol was analysed and shown in table 1. The crude
glycerol contains considerable ammonium and nitrate values.
The yeast strains, Candida lipolytica and Yarrowia
lipolytica, Trichosporon fermentans were chosen to evaluate
the lipid accumulation potential for future microbial oil
production.
We already determined the growth condition and lipid
accumulation of the different yeast strains in pure glycerol
medium [11].

Kahr et al. (2016) Crude Glycerol as Substrate for Oleaginous Yeasts
61 Journal of Energy Challenges and Mechanic ©2016
TABLE 1, CONTENT OF THE CRUDE GLYCEROL
Glycerol 680 g L-1
Sodium 10.05 g L-1
Ammonium 2.05 g L-1
Potassium 22.05 g L-1
Magnesium 0.03 g L-1
Calcium 0.015 g L-1
Chloride 12.05 g L-1
Nitrate 8.45 g L-1
Phosphate 0.6 g L-1
Sulfate 18.95 g L-1
Aluminium 24 mg L-1
Cooper 9 mg L-1
Iron 11 mg L-1
The lipid production via yeasts works mostly in a medium
with an excess of the carbon source and limited nitrogen - the
ratio of carbon and nitrogen sources (C/N ratio) influences the
oleaginous potential of the culture. The determination of the
optimal C/N ratio for both cell number and lipid accumulation
is essential [12] [13], therefore cultivation of different yeast
species was done in glycerol medium with variable C/N ratios
(ranging from 27 up to 59) for 7, 10 or 17 days at different
temperatures. The experiments were done in 50 ml medium in
250 ml Erlenmayer flasks. 50 ml crude glycerol based medium
was inoculated with 10 % preculture (v/v; adapted yeasts).
At the start of the cultivation extra nitrogen source was
added (yeast extract and peptone) to the glycerol medium.
Low C/N ratio resulted in low lipid content (lower than 10 %
(w/w, relating to the biomass, data not shown). Lipid
accumulation increased after changing the nitrogen level and
therefore the C/N ratio. Table 2 and 3 show the culture
conditions, cell biomass and lipid content of the yeast strains
with high lipid accumulation potential at 25°C temperature.
Other conditions resulted in lipid content lower than 10 %
(w/w, relating to the biomass) and therefore these data were
not shown.
The achieved cell biomass ranged 0.42 g 100 g-1 up to 0.85 g
100 g-1 (shown in table 2) - values typically for oleaginous
yeast growth in crude glycerol medium, for example the
biomass of the yeast Yarrowia lipolytica achieved 6.5 g L-1 up
to 8.1 g L-1 in crude glycerol medium [14].
TABLE 2, CELL BIOMASS OF THE YEASTS AT DIFFERENT CONDITIONS AT
25°C TEMPERATURE
Yarrowia lipolytica
25°C; C/N ratio 59, 10 days 0.42 g 100 g-1
25°C, C/N ratio 59, 17 days plus
salt
0.79 g 100 g-1
Candida lipolytica
25°C, C/N ratio 59, 17 days plus
salt
0.85 g 100 g-1
Trichosporon fermentans
25°C; C/N ratio 49, 10 days 0.69 g 100 g-1
TABLE 3, LIPID CONTENT OF THE YEASTS AT DIFFERENT CONDITIONS
AT 25°C TEMPERATURE
Yarrowia lipolytica
25°C; C/N ratio 59, 10 days 18 %
25°C, C/N ratio 59, 17 days plus
salt
20 %
Candida lipolytica
25°C, C/N ratio 59, 17 days plus
salt
20 %
Trichosporon fermentans
25°C; C/N ratio 49, 10 days 17.9 %
The three different yeast strains, Candida and Yarrowia
lipolytica, Trichosporon fermentans, accumulated lipid
contents from 17.9 % up to 20 % at different culture conditions
(summarized in table 3) – a phenomenon which seems to be
yeast strain specific [4]. The yeasts mainly produced lipid like
oleic acid, palmitic acid, stearic acid and linoleic acid – fitting
for biodiesel.
The incubation temperature can influence the lipid
accumulation too, therefore the same medium was used for
further experiments at increased temperature of 30°C.
TABLE 4, CELL BIOMASS OF THE YEASTS AT DIFFERENT CONDITIONS AT
30°C TEMPERATURE
Yarrowia lipolytica
30°C, C/N ratio 59, 17 days plus
salt
0.51 g 100 g-1
Trichosporon fermentans
30°C, C/N ratio 59, 17 days 1.23 g 100 g-1
TABLE 5, LIPID CONTENT OF THE YEASTS AT DIFFERENT CONDITIONS
AT 30°C TEMPERATURE
Yarrowia lipolytica
30°C, C/N ratio 59, 17 days plus
salt
17 %
Trichosporon fermentans
30°C, C/N ratio 59, 17 days 16 %
The lipid production potential of oleaginous yeast is
obviously lower at higher temperature, the lipid content of the
yeast Yarrowia lipolytica is lower than 10 % (w/w, relating to
the biomass, data not shown) and the duration of lipid
production of Yarrowia lipolytica and Trichosporon
fermentans took more time. In comparison, the lipid
accumulation of the oleaginous yeast Candida 107 reached a
maximum at 25°C ranging the temperature from 19°C up to
33°C [15]. Maybe the lipid accumulation catabolism could be
decelerated or be changed at higher temperature.
The crude glycerol already contained nitrogen sources (see
table 1) – therefore the medium for lipid accumulation was
prepared plus salt but without an additional nitrogen sources.
Reduction or avoidance of external nitrogen sources will

Kahr et al. (2016) Crude Glycerol as Substrate for Oleaginous Yeasts
62 Journal of Energy Challenges and Mechanic ©2016
reduce the cost of the lipid production process and contributed
to the marketability of this process.
The lipid accumulation potential of the three selected yeast
was tested within this medium at two temperatures for 7, 10
and 17 days. Trichosporon fermentans and Candida lipolytica
produced relative low biomass concentrations (see table 6) but
good lipid contents (see table 7). Other conditions did not
result in high lipid content (lower than 10 % (w/w) relating to
the biomass) and therefore these data were not shown.
TABLE 6, CELL BIOMASS OF THE YEASTS IN CRUDE GLYCEROL MEDIUM
AT 25°C TEMPERATURE
Trichosporon fermentans
25°C, crude glycerol, 7 days plus salt 0.49 g 100 g-1
25°C, crude glycerol, 10 days plus salt 0.47 g 100 g-1
Candida lipolytica
25°C; crude glycerol, 10 days plus salt 0.42 g 100 g-1
25°C; crude glycerol, 17 days plus salt 0.45 g 100 g-1
TABLE 7, LIPID CONTENT OF THE YEASTS IN CRUDE GLYCEROL MEDIUM
AT 25°C TEMPERATURE
Trichosporon fermentans
25°C; crude glycerol, 10 days 18.7 %
25°C, crude glycerol, 17 days plus
salt
18 %
Candida lipolytica
25°C, crude glycerol, 17 days plus
salt
17 %
The yeasts were tested also at 30°C in this medium.
Yarrowia lipolytica achieved biomass concentration of 0.45 g
100 g-1 and a lipid content of 22 % (w/w) relating to the
biomass. Obviously the factor C/N ratio influences the lipid
production to a greater extent than the temperature.
Furthermore the nitrogen sources within the crude glycerol
supported the lipid production via yeast and no external
nitrogen sources will be needed.
In comparison to the results in other publications all
achieved lipid data are quite lower [8] [9] – but the lipid
production via yeast depends on several issues: selection of the
yeast strain, on composition of the used substrate (included
inhibiting or promoting substances) and kind of lipid
extraction and transesterification.
Scale up experiments in 2 liters fermenter were done with
yeasts in crude glycerol medium and the medium with variable
C/N ratio to improve the lipid production via yeasts due to the
improved controlled aeration and pH value. Various problems
occurred – the production of citric acid, adhesion of the yeast,
low biomass yield and lipid content. Diverse detergents were
used to decrease the adhesion of the yeast. Different
cultivation modes were tested and the pH value was regulated
constant or no pH regulation was applied. Anyhow - the lipid
content increased only up to a maximum of 17 % (w/w)
relating to the biomass (see table 8). The biomass
concentration reached a maximum of 0.33 g 100 g-1.
TABLE 8, LIPID CONTENT OF YARROWIA LIPOLYTICA IN CRUDE
GLYCEROL IN FERMENTER
Day 3 5.5 %
Day 6 7.3 %
Day 7 7.4 %
Day 10 9 %
Day 13 17 %
Crude glycerol is suitable as substrate for lipid production
via yeast. An important requirement of commercialization is
the price of the substrate used. Therefore the use of glycerol
could contribute to the commercialization of lipid production
with yeasts. Furthermore several challenges: higher biomass
values and lipid content due to optimization of the process step
by step, suitable fermenters and optimal mode of
transesterification must be solved before industrial scale up.
IV. CONCLUSION
This paper has shown that specific oleaginous yeasts
convert crude glycerol to lipids suitable for biodiesel
production. Variation of the culture conditions in small lab
scale mode concerning the C/N ratio, temperature and duration
revealed the optimum at 30°C in a crude glycerol medium
without external nitrogen sources. The produced lipid fitted
for further biodiesel production.
The scale up experiments failed due to adhesion of the
yeast, production of citric acid and low yeast numbers and
lipid content.
Further improvements concerning each step within the lipid
production process must be done before starting further scale
ups.
REFERENCES
[1] Q. Li, W. Du and D. Liu., “Perspectives of microbial oils
for biodiesel”, Applied Microbiology and Biotechnology,
80, pp. 749-756, 2008.
[2] A. Amaretti, S. Raimondi, M. Sala, L. Roncaglia, M. De
Luca, A. Leonard and M. Rossi. “Single cell oils of the
cold-adapted oleaginous yeast Rhodotorula glacialis
DBVPG 4785”, Microbial Cell Factories, 9:73, 2010.
[3] J. Ageistos, J. Vallejo, P. Veiga-Cespo and T. Villa.
“Oily yeasts as oleaginous cell factories”, Applied
Microbiology and Biotechnology, 90, pp. 1219-1227,
2011.
[4] I.R. Sitepu. L.A. Garay, R. Sestric, D. Levin, D. E.
Block, J. B. German and K. L. Boundy-Mills.
“Oleaginous yeasts for biodiesel: Current and future
trends in biology and Production”, Biotechnology
Advances 32: pp. 1336-1360, 2014.
[5] OECD-FAQ Agricultural Outlook,
http://www.fao.org/fileadmin/templates/est/COMM_M
ARKETS_MONITORING/Oilcrops/Documents/OECD

Kahr et al. (2016) Crude Glycerol as Substrate for Oleaginous Yeasts
63 Journal of Energy Challenges and Mechanic ©2016
_Reports/OECD_2013_22_biofuels_proj.pdf, 2013,
downloaded at 20. March 2015.
[6] P.A.E.P. Meesters, G.N.M. Huijberts and G. Eggink.
“High cell density cultivation of the lipid accumulating
yeast Cryptococcus curvatus using glycerol as carbon
source”, Applied Microbiology and Biotechnology, 45,
pp. 575-579, 1996.
[7] J.C. Thompson and B.B. He. “Characterization of crude
glycerol from biodiesel production from different
feedstocks”, Applied Engineering in Agriculture, 22:pp.
261-265, 2010.
[8] C. Saenge, B. Cheirsilp, T.T. Suksaroge and T.
Bourtoom. “Potential use of oleaginous red yeast
Rhodotorula glutinis for the bioconversion of crude
glycerol from biodiesel plant to lipids and carotenoids”,
Process Biochem 46: pp. 210-218, 2011.
[9] S. Papanikolaou and G. Aggelis. 2002, “Lipid production
by Yarrowia lipolytica growing on industrial glycerol in
a single continuous culture”, Bioresource Technology
82: pp. 43-49, 2002.
[10] F. Santamauro, F.M Whiffin, R.J. Scott and C.J. Chuck.
“Low-cost lipid production by an oleaginous yeast
cultured in non-sterile conditions using model waste
resources”, Biotechnology for Biofuels 7:pp. 34, 2014.
[11] R. Haselgrübler , A. Jäger, H. Kahr, K. Krennhuber and
D. Steindl. „Lipid Production with different oleaginous
yeasts with glycerol as carbon source and varying
growing conditions”, Poster, 21st European Biomass
Conference and Exhibition, Copenhagen, Denmark
2013.
[12] L.M. Granger, P. Perlot, G. Goma and A. Pareileux.
“Efficiency of fatty acid synthesis by oleaginous yeast:
prediction of yield and fatty acid cell content from
consumed C/N ration by a simple method”,
Biotechnology and Bioengineering 42, pp. 1151-1156,
1993.
[13] C. Ratledge and J.P. Wynn. “The Biochemistry and
Molecular Biology of lipid accumulation in oleaginous
microorganisms”, In Advances in Applied Microbiology,
edited by Laskin AI, Bennett JW, Gadd GM, San Diego:
Elsevier Academic Press Inc, pp. 1-51, 2002.
[14] R.W. Nicol, K. Marchand and W.D. Lubnitz.
“Bioconversion of crude glycerol by fungi”, Applied
Microbiology and Biotechnology 93: pp. 1865-1875,
2012.
[15] M.J. Hall and C. Ratlegde. “Lipid accumulation in an
oleaginous yeast (Candida 107) growing on glucose
under various conditions in a one- and two-stage
continuous culture”, Applied and Environmental
Microbiology 33: pp. 577-594, 1977.

64 ©2016
ISSN 2056-9386
Volume 3 (2016) issue 2, article 4
District heating as the infrastructure for competition
among fuels and technologies
区域供热作为燃料与技术竞争之基础设施
Poul Erik Grohnheit 1, Bent Ole Gram Mortensen 2
1 DTU Management Engineering, Technical University of Denmark, Building 426, Produktionstorvet, DK-2800 Lyngby,
Denmark, [email protected] 2 University of Southern Denmark Department of Law, Campusvej 55, DK-5230 Odense M, Denmark, [email protected]
Accepted for publication on 31st August 2016
Abstract - District heating networks offer the possibility of
competition between a wide range of fuels for combustion as well
as technologies for comfort heat and cooling in buildings. For
decades, cogeneration of electricity and heat for industrial
processes or district heating has been a key technology for
increased energy efficiency. Additional technologies suitable for
small-scale networks are heat pumps, solar panels and local
biomass in the form of straw or biogas. For large-scale urban
networks, incineration of urban waste and geothermal heat are
key technologies. With heat storages, district heating
infrastructure can contribute significantly to balancing the
intermittency of wind power.
This paper is an update of the authors' article published in
Energy Policy in 2003 focusing on the European directives
focusing on competition in the electricity and gas network
industries and promotion of renewables and cogeneration but
limited support for the development and expansion of the district
heating infrastructure. It was partly based on a contribution to
the Shared Analysis Project for the European Commission
Directorate-General for Energy, concerning the penetration of
combined heat and power (CHP), energy saving, and
renewables as instruments to meet the targets of the Kyoto
Protocol within the liberalised European energy market.
The update will focus on recent research on district heating in
North Europe, which covers not only the physical infrastructure
but also the very important immaterial infrastructure, such as
the legal and institutional framework. This includes the
experience with market places for electricity trade on an hourly
basis over the last two decades. Improved modelling tools and
modelling experience will add to the development and
performance of district heating systems.
Finally, we summarise the tasks for a European policy
concerning the future regulation of district heating net-works for
CHP, emphasising the need for rules for a fair competition
between natural gas and district heating networks and the need
for integration between energy systems.
Keywords Infrastructure; District heating; Competition,
Energy market, Legal Framework.
Acknowledgement: The article is based on research for the 4DH -
Strategic Research Centre for 4th Generation District Heating
Technologies and Systems.www.4dh.dk.
I. INTRODUCTION
The primary intention of the EU electricity and gas
directives is to make the electricity and natural gas markets
part of the internal market. The overall objective has been to
increase the availability of electricity and gas at more
competitive prices for the benefit of the final consumers. The
same objective was the motivation for the nationalisation of
the electricity and other energy industries in several Western
European countries – notably France, UK and Italy – a few
decades earlier.
All these measures share the same strengths and
weaknesses: The may increase the efficiency of energy supply
by a single energy carrier – electricity or gas – by economies
of scale, rational organisation and standardisation, or by
introducing competition into an industry that is dominated by
monopolies. On the other hand, they may be obstacles to a
synergetic use of the various energy carriers at the local or
regional level. The best illustration is the very different
penetration of CHP for district heating in North West Europe.
This paper was originally based on a contribution to the
Shared Analysis Project for the European Commission DG
Energy, concerning the penetration of CHP, energy saving,
and renewables as instruments to meet the targets of the Kyoto
Protocol within the liberalised European energy market [1,2].
It focused on obstacles and lost opportunities for the
development of district heating systems as a necessary
infrastructure for further penetration of these technologies,
emphasising the legal issues systems [3,4]. In recent years the
concept of 4th Generation District Heating (4GDH) includes
the relations to District Cooling and the concepts of smart

Grohnheit and Mortensen (2016) District heating as the infrastructure for competition among fuels and technologies
65 Journal of Energy Challenges and Mechanics ©2016
energy and smart thermal grids [5]. This includes surplus
electricity to be used in district heating [6]. Further, promotion
of district cooling may increase efficiency [7].
During the last decade several EU and national research
projects have focused on the integration of low carbon and
renewable technologies for electricity and heat into the
European energy market.
We are using Denmark as the main example, because the
penetration of district heating has gone much further than in
the large countries in north-west Europe, in spite of no
significant difference in climate and the urban physical
structure. District heating systems is the backbone of the
physical infrastructure that will allow 50 % or more of the
Danish electricity demand to be supplied by wind power.
The immaterial infrastructure is just as important as the
physical infrastructure for the integration of wind. Especially
the physical commodity exchange (energy exchange) – Nord
Pool Spot – operating the world's largest electrical power
exchange with a day-ahead market and an intraday market has
become an important part of the Nord European power market.
The main part of Nord Pool Spot is owned by the TSO’s in
Norway, Sweden, Finland and Denmark.
II. INFRASTRUCTURE FOR SPACE HEATING AND
COMPETITION AMONG FUELS AND TECHNOLOGIES
The infrastructures for electricity and natural gas are mature
in most European countries. The natural gas infrastructure is
dependent of a single fuel, which must be imported to the
European Union in increasing amounts, although biomass
offers an alternative within their resource limitations. The
district heating infrastructure can exist in all scales, but
requires a higher heat density than gas networks – and
water-based heating systems in buildings.
2.1. THE URBAN HEAT MARKET
Fig. 1 describes the urban heat market as a hierarchy of
building levels and heating technologies. Half a century ago
solid fuelled stoves in single rooms were dominant even in
urban areas. The customers were independent of collective
systems and could be free to choose their supplier of coal,
coke, fuel wood or paraffin. Today, these systems are found
only in outdated flats. Electric heating is an additional choice
that requires limited investment, but it may be too expensive
for the – often poor – residents. In many cities the introduction
of natural gas has improved the standard of living at moderate
costs
In some countries – in particular the United Kingdom –
natural gas is frequently used for water-based radiator systems
supplied from an individual boiler in each flat. This system is
dominant for single-family houses in areas with natural gas
supply in most countries in northwest Europe. The
introduction of competition in the gas sector based on the
natural gas market directive has given the customer free choice
among several gas suppliers. Also new technologies may
become available for gas customers in the near future, which
may increase fuel efficiency and competition, in particular
micro-scale CHP in the form of gas engines or fuel cells.
However most of these new technologies are gas-only
technologies with limited flexibility concerning base and peak
load.
Stove
Electric heat
Gas boiler
Oil boiler
Small heat pump
DH boiler
Large heat pump
Small-scale CHP
Industrial waste heat
Waste incineration
Large-scale CHP
Geothermal heat
Micro CHP
Room
Flat
Building
Urban area
Town/City
RegionN
atu
ral g
as g
rid
No/limited fuel competition
Competitive gas/heat supply Water-based heat supply
Fig.1. The urban heat market.
The principal advantage of larger water-based heat
distribution system is that they enable more competition
among fuels and technologies both in the short and long term,
and possible also cheaper heat supply. On the other hand, these
systems require investment in infrastructure over decades and
regulation, which may reduce the short-term choice of the
individual consumers. District heating itself is a system in
competition with other systems [8].
District heating for single-family houses is best established
as a part of the development of sites for detached or terraced
houses together with electricity, water and sewage. At this
level competition from a natural gas grid or individual boilers
may be detrimental for energy efficiency and recovery of
investment. Larger groups of single-family houses with
water-based heat distribution systems or blocks of flats or
offices will have a local infrastructure that may be supplied by
connection to an urban-wide district heating system in
competition with large gas-fired boilers or small-scale CHP.
Larger district heating systems, covering a whole town or an
urban region, offer more opportunities for competition
between fuels and technologies for heat supply, in particular
urban waste incineration, industrial waste heat, or
transmission of geothermal heat.
Grohnheit and Mortensen (2016) District heating as the infrastructure for competition among fuels and technologies
66 Journal of Energy Challenges and Mechanics ©2016
2.2. OVERLAPPING INTERNATIONAL ELECTRICITY AND GAS
MARKETS
The electricity and gas markets are becoming more
overlapping. New gas transmission lines may not only have
impact on the gas trade. It may also lead to further integration
of the European market for wholesale electricity. With the
increasing capacity of gas-fired electricity generating units,
gas will be used for electricity generation, where the price of
electricity is highest. The organised markets for spot and
future electricity already exist. Nord Pool Spot now operates
in Norway, Denmark, Sweden, Finland, Estonia, Latvia,
Lithuania, Germany and the UK. The spot and futures markets
of Nord Pool have become a model for power exchanges in the
Netherlands, Germany, Poland and Spain.
2.3. THE ‘SINGLE ENERGY CARRIER’ DIRECTIVES AND DISTRICT
HEATING
The common rules of the two energy market directives
(electricity and natural gas) are similar, but the two network
industries are treated separately. The disadvantages of the
separate treatment of the electricity and gas grids regarding the
creation of the internal market are small, because there is only
a limited potential for competition between these two types of
grids. However, none of them are considering the district
heating systems, although the district heating networks offer
the possibility of competition between natural gas and a range
of other fuels on the market for space heating.
The law and regulations regarding anti-competitive
agreements and abuse of dominant position may apply not
only to the electricity and gas markets but also to the heat
market. However, part of the heat market is supplied by a third
network industry, district heating, which provides a market for
several competing types of fuels and technologies, including
natural gas, various types of biomass combustion including
incineration of urban waste, and combined heat and power
(CHP). The heat market might be left in a regulatory ‘vacuum’
only regulated by national provisions and the general EC
Treaty provisions, while CHP producers can be regulated by
both the electricity and gas market directives and parallel
national legislation. This may involve a risk of conflicts
between the different set of rules.
Several of those technologies that may be victims of this
regulatory conflict are supported by EU policy as means to
meet environmental challenges or technologies to meet the
target of sustainable development, including international
obligations to reduce the emissions of greenhouse gasses.
III. CONSUMERS’ CHOICE, INFRASTRUCTURE AND
COMPETITION
The regulatory frameworks for district heating, electricity
and natural gas are normally very different. However, some
common characteristics exist, in particular with regard to
large-scale district heating networks. Competition involving
CHP exists in different ways. As supplier to district heating
grids certain possibilities in competition with existing
suppliers seem open. Vertical disintegration (unbundling)
exists also within the district heating market. There are
examples of markets for district heating, which seem relatively
mature and already use market mechanisms in buying heat.
3.1. HOUSEHOLD CONSUMERS
Both European and national competition authorities tend to
have a bias towards cash-and-carry items with low transaction
costs, and high discount rates in the choice of production
technology. These features are compatible with goods and
services that are internationally traded. With some innovative
types of regulation, the development in the late 20th Century
demonstrates that competition can be introduced in industries
that were considered as natural monopolies, in particular
telecommunication, public transport, electricity and natural
gas.
Other markets have features that are very different from
these, e.g. the real estate market. In particular the market for
resident-owned housing is characterised by long-term
investments, very high transaction costs, and low personal
discount rates. For most individuals and families the housing
market is far more important than the energy market.
3.2. LOCAL GOVERNMENT AND CUSTOMER CHOICE
A key issue in the development of district heating systems
has been the role of local government and local interests in the
electricity supply industry and other utilities. In some
countries local government is directly or indirectly owner of
utilities or has an important influence on physical planning and
urban/regional development. It is worth mentioning that in
those countries, where the electricity supply industry was
nationalised into a single dominant vertically integrated
organisation, there has been very little development of district
heating systems.
Some of the traditional instruments that were used by local
government for the development of these systems do not
comply very well with the liberalised markets. Customer
choice of supplier is a basic element of the liberalisation of
energy markets. However, the individual choice by consumers
may be counterproductive to the target of creating a
competitive market for space heating with competition
between fuels and technologies. Thus, limiting the consumers’
choice on the local level – e.g. by regulation in the form of
zoning that requires the use of particular heating systems, in
particular district heating – will add to competition on the
energy market as a whole.
The opposite of individual choices is collective decision by
public planning. Such decisions may provide better solutions
for the individual customers. The collective decisions may
enable competition among fuels and technologies that are not
available for the individual customer. In countries with
tradition for individual home ownership financed by long-term
mortgage loans, there is also a tradition for very strict physical
planning and regulation. While new district heating grids in
existing neighbourhoods may be too expensive, this may not
be the case for new developments. Here, district heating
becomes an alternative to investments in a new gas grid with
individual boilers.
Grohnheit and Mortensen (2016) District heating as the infrastructure for competition among fuels and technologies
67 Journal of Energy Challenges and Mechanics ©2016
3.3. COMPETITIVE ELEMENTS IN NETWORKS FOR HEAT SUPPLY
The principle that is used for introducing competition in the
electricity and gas supply industries is that generation and
supply are subject to competition, while the grid activities –
transmission and distribution – remain natural monopolies
subject to regulation. A similar concept may be developed for
district heating, either on a national level or harmonised for the
Member States of the European Union.
Large-scale district heating networks have some
characteristics that are similar to the electricity market.
Although there is no example of an urban district heating grid
with full-feature third party access and competition between
many suppliers, there are examples of unbundling between
competing heat producers using a variety of primary fuels and
technologies, a monopoly transmission company, and several
local distribution companies. The latter may be subject to
various elements of competition, in particular competition
between local heat production and purchase from the
transmission grid.
There is now more than twenty years of experience with
competition and market organisations in the electricity sector.
There are only some few examples of attempts to introduce
third party access and competition into district heating grids,
and there are many examples of elements of competition
between district heating and natural gas grids:
Competition in the planning of grid distributed energy in
new developments, where a license for grid development
should be granted either to district heating or natural gas,
but not both.
Competition among heat generators (industrial waste
heat, incineration of urban waste, CHP from large-scale
and small-scale generators, heat-only boilers with
combustion of different fuels).
Competition among owners of boilers for peak load either
through long-term contracts or a short-term market. In an
interconnected district heating system, heat supply from
boilers is important to overcome temporary capacity
limitations in the grid.
Outsourcing of operation and maintenance of grids or
administration of supply, metering and billing of
customers.
Takeover of a district heating system by a utility company
that is operating on a national or international scale
The development and implementation of competitive
elements for grid distributed energy network takes time
and requires the development and implementation of new
software and information systems.
The history of liberalisation of the electricity and gas sector
already has numerous examples of delays and chaotic
implementation due such practical issues, which are vastly
underestimated in the more ideological discussion on
liberalisation and competition in network energy industries.
IV. THE EUROPEAN MARKET FOR DISTRICT HEATING
In the Communication from the Commission to the Council
and the European Parliament of October 1997 “A Community
strategy to promote combined heat and power (CHP) and to
dismantle barriers to its development” (COM(97) 514 final), it
was stated that: “CHP is one of the very few technologies
which can offer a significant short or medium term
contribution to the energy efficiency issue in the European
Union and can make a positive contribution to the
environmental policies of the EU.” In 1994 less than 10 % of
the electricity generation in the EU was combined production
with significant variations among Member States: From more
than 30 % in the Netherlands, Denmark and Finland to less
than 5 % in the UK, France, Greece and Ireland. The
maximum technical potential of CHP has been assessed by
different studies to 40 % of the total electricity generation in
the mid-1990s. In a recent study the potential for district
heating in Europe has been indicated to 46 percent of all
excess heat in EU27 (corresponding to 31 percent of total
building heat demands) is located within identified strategic
regions [9].
This potential includes CHP for both industrial steam
raising and district heating and cooling. Increased energy
efficiency in industrial processes and space heating will
reduce the technical potential for heat supply from CHP,
which is dependent of the heat densities of the local heat
markets. However, past experience has shown that the
penetration of CHP has been widely different in the countries
in north-west Europe, in spite of no significant difference in
climate and urban physical structure. The main explanation is
the relative power of various institutions [2]
4.1 THE MARKET POTENTIAL FOR CHP, WASTE INCINERATION
AND GEOTHERMAL ENERGY
CHP for space heating is available only via infrastructure in
the form of a heat distribution system in an appropriate scale.
Large extraction-condensing power stations with an electric
capacity of several hundred MW will need an interconnected
district heating grid for the sale of its potential for cogenerated
heat. Small-scale CHP units are designed for a local
water-based heat distribution system for a building, or a local
group of buildings, a village or a small town.
The largest district heating systems in the European Union
are in Berlin Copenhagen, Helsinki, Hamburg, Stockholm and
Paris. None of these systems have been developed over a short
period according to a single initial plan. They were developed
over decades for different reasons by adding new elements to
the existing infrastructure, often taking advantage of
temporary and unusual situations, e.g. the high oil prices in the
period 1973-1985. The most constant elements have been
local or national actors with a consistent interest in finding
ways and means for expanding the district heating markets and
networks.
Increased energy efficiency in space heating by better
insulation will reduce the technical potential for heat supply
from CHP, which is dependent of the heat densities of the local
heat markets. On the other hand, a given heat market will

Grohnheit and Mortensen (2016) District heating as the infrastructure for competition among fuels and technologies
68 Journal of Energy Challenges and Mechanics ©2016
become a basis for a much larger generation of electricity,
because of a very significant increase in the power-to-heat
ratio. The power-to-heat ratios for new combined-cycle gas
turbine (CCGT) or gas engines are about 1.0 compared to 0.4
for traditional gas turbines a decade ago. Thus, the same heat
market will become the basis for a much larger electricity
generation.
Waste incineration. In Denmark waste incineration is an
integrated part of district heating systems, delivering base load.
Incineration of municipal solid waste in Denmark started in
1903 in a densely populated municipality with little access to
space for landfill. The energy was used for a district heating
system established at the same time and for generation for the
local grid. It was built opposite to the new municipal hospital
with supply of central heat for the hospital and electricity for
the local grid.
District heating grew significantly during the 1960s –
mainly driven by excess heavy fuel oil from the
new-established Danish refineries. This gave a market for the
heat from waste incineration plants, which was established in
many medium-sized towns. The mismatch between the
seasonal variation in the heat demand and the all year-round
supply from waste incineration plants was gradually solved by
expanding district heating grids and interconnection of smaller
separate grids. With the high penetration of waste incineration
in Denmark, the volume of incinerated waste will decrease,
because waste treatment policies aim at increasing recycling
on the expense of waste incineration [10].
Geothermal energy. District heating systems is an important
market for geothermal energy in a larger scale. However, the
Danish experience is limited. Geothermal sources are
available in Denmark, but other sources for supply of district
heating systems are more competitive.
District cooling. Even in a Nordic context, many buildings
have a need for comfort cooling in the interest of the users. In
most places, building cooling is done by means of electrically
driven compressors installed in the building. The term “district
cooling” refers to the arrangement where the cooling of a
building is handled by centralised units which distribute
cooling to multiple buyers through a heating or cooling
medium via a grid. District cooling is a collective solution as
an alternative to an individual cooling solution.
To simplify a little, district cooling covers two basic
concepts. First, a primary solution is where cold water is
produced in a facility and distributed through a network to a
number of buyers. The central station can use different sources
such as low temperatures in groundwater, lake water and
seawater (so-called “free cooling”), and secondly energy for
cooling can be obtained by utilising the energy in district
heating water feeding district heating water to the end-user
absorption unit which utilises district heating water to produce
cooling water. The ability to convert district heating to cooling
has made the technology particularly interesting to the district
heating sector and thus for countries with a large district
heating sector, such as the Nordic countries Finland, Sweden
and Denmark.
In Finland there has been cooling in Helsinki since 1998,
and now it is also used in Turku, Lahti, and Vierumäki.
Denmark has not come so far; the supply of district cooling
from a major public construction project only began in 2009
(in Copenhagen). The most advanced of the three Nordic
countries is Sweden, where the first plant was built in 1992.
Denmark has had a special District Cooling Act (Act No. 465
of 17 June 2008 on municipal district cooling) which
specifically provides a basis for municipal participation in
district cooling operations [7].
4.2 MODEL ANALYSES
The technology choice for electricity generation has been an
important topic for traditional optimisation models, e.g.
EFOM, MARKAL and TIMES, developed within the EU
framework programmes and the IEA Implementing
Agreement, ETSAP, www.iea.etsap.org. In a competitive
market this optimisation is of limited interest. However, the
same modelling tools can be useful for the analysis of different
agents or market participants. A model developed for analyses
of the electricity and CHP markets in the Baltic Sea Region
has been used for numerous studies in many countries,
including China, www. balmorel.com [11]. Very detailed data
and geographical information systems (GIS) are essential tools
for modelling district heating on a local level [12].
In global optimisation models, e.g. TIAM or EFDA-TIMES,
which are divided into 15-17 regions, e.g. Europe or China, the
district heating infrastructure can be modelled using very
aggregated parameters for costs and efficiencies [13].
V. A EUROPEAN POLICY ON HEAT DISTRIBUTION
NETWORKS
Numerous policy initiatives over the last decades have
focused on CHP rather than district heating as a means for
energy efficiency and CO2 reduction. The emphasis from
international organisations and lobbying organisations are
mostly on small-scale CHP application for industries and
smaller heat distribution networks, e.g. large hospitals.
However, recent initiatives from the IEA are focusing on the
“the network’s ability to use many heat sources including ones
with renewable fuel sources” and express the concern that
“market forces may drive solutions that may be shorter term
than is optimum for society and discriminate against high
capital technologies such as district heating.”
A community policy will be needed for support of the
infrastructure necessary for further penetration of CHP, which
should include framework conditions for local heat
distribution networks that are compatible with the different
national traditions of regulation of real property. Most of the
elements for such a policy are found in existing EU legislation.
However, existing legislation may contain a wide range of
inconsistencies and conflicts that may be obstacles for both
CHP, energy efficiency and renewables.
A community policy would also be needed to support and
regulate the development of procedures for international
tendering for operation of district heating networks. So far, a
marked directive regarding districting heating has not been on

Grohnheit and Mortensen (2016) District heating as the infrastructure for competition among fuels and technologies
69 Journal of Energy Challenges and Mechanics ©2016
the political agenda. As long as district heating in Europe
mainly consists of local markets it can be questioned whether
such a directive falls within the competence of the EU
according to the principle of subsidiarity in the Treaty.
However this principle shall not prevent the EU in developing
Trans-European energy infrastructure including in the area of
district heading.
A key task for the Commission to promote the development
of CHP would be to support the legal framework and
procedures for the development of district heating grids and
the interconnection between them.
The role of district heating systems for balancing wind
power is becoming increasingly important. In addition to heat
storages, there is a range of technologies that offer flexibility
for the electric system: Electric boilers with low investment
cost are useful for surplus electricity in short periods. Heat
pumps and CHP require much higher utilisation times, but
they operate complementary to balance wind, while producing
heat. It is essential that markets and regulation offer the proper
incentives for investment in both [14].
Some of the issues that were discussed in the article from
2003 [1] may be addressed in Heat Roadmap Europe [9].
REFERENCES
European Union legal documents
Directive 2009/72/EC of the European Parliament and of
the Council of 13 July 2009 concerning common rules for the
internal market in electricity and repealing Directive
2003/54/EC. (the electricity market directive).
Directive 2009/73/EC of the European Parliament and of
the Council of 13 July 2009 concerning common rules for the
internal market in natural gas and repealing Directive
2003/55/EC (the natural gas market directive).
Directive 2010/75/EU of the European Parliament and of
the Council of 24 November 2010 on industrial emissions
(integrated pollution prevention and control) Treaty on the
Functioning of the European Union (TFEU).
[1] Grohnheit, P.E.; Mortensen, B.O.G. (2003) Competition
in the markets for space heating. District heating as the
infrastructure for competition among fuels and
technologies. Energy Policy Vol. 31, pp. 817-826
[2] Grohnheit, P.E (1999), Energy policy responses to the
climate change challenge: The consistency of European
CHP, renewables and energy efficiency policies (Office
for Official Publications of the European Communities,
Luxembourg) (Energy in Europe, Special issue,
December 1999 with appended CD-ROM)
[3] Mortensen, B.O. G. (1998), Elforsyning – afvejning af
hensyn til en sektor på vej mod det indre marked [Power
Supply – Considerations to be taken in a Sector heading
for the Internal Market] DJØF Publishing, Copenhagen.
[4] Mortensen, B. O. G. (2004), Elforsyningsloven med
kommentarer [A commentary to the Danish Electricity
Supply Act], DJØF Publishing, Copenhagen.
[5] Lund, H.; Werner, S; Wiltshire, R.; Svendsen, S.;
Thorsen, J.E.; Hvelplund F.; Mathiesen, B. V. (2014),
4th Generation District Heating (4GDH): Integrating
smart thermal grids into future sustainable energy
systems, Energy, Vol. 68, pp. 1-11.
[6] Averfalk, H.; Ingvarsson, P.; Persson, U.; Werner, S.
(2014), On the Use of Surplus Electricity in District
Heating Systems, proceeding from the 14th International
Symposium on District Heating and Cooling
(http://www.svenskfjarrvarme.se/In-English/District-He
ating-in-Sweden/The-14th-International-Symposium-on-
District-Heating-and-Cooling-/Proceedings/)
[7] Mortensen, B.O.G. (2014), Legal Framework as a Core
Element of District Cooling Success – The Case of
Denmark. Journal of Power and Energy Engineering,
Vol. 2, No 9, pp. 41-48, ISSN 2327-588X
(www.scirp.org/journal/jpee).
[8] Mortensen, B.O.G. (2012), Fjernvarme – en
monopolsektor i konkurrence [District heating – a
monopolistic sector competition] in Festskrift til Jens
Fejø, DJØF Publishing, pp. 299-310
[9] Persson, U., Möller, B.; Werner, S. (2014): Heat
Roadmap Europe: Identifying strategic heat synergy
regions, Energy Policy, vol. 74, pp. 663-681.
[10] Münster, M.; Lund, H. (2009), Use of waste for heat,
electricity and transport – Challenges when performing
energy system analysis. Energy Policy, Vol. 34, pp.
636–644.
[11] Balmorel Project (2001), Balmorel: A Model for
Analyses of the Electricity and CHP Markets in the
Baltic Sea Region. www.balmorel.com.
[12] Petrović, S.; Karlsson, K.B. (2014). Danish heat atlas as
a support tool for energy system models. Energy
Conversion and Management, Vol. 87, pp. 1063–1076.
10.1016/j.enconman.2014.04.084
[13] Grohnheit, P. E.; Korsholm, S.B.; Lüthje, M (2011),
Long-term modelling of Carbon Capture and Storage,
Nuclear Fusion, and large-scale District Heating, Risø
International Conference 10-12 May 2011. Risø-R-1776,
56-66 (2011)
[14] Grohnheit, P.E.; Møller Andersen, F.; Larsen, H. V.
(2011) Area price and demand response in a market with
25% wind power. Energy Policy, Vol. 39, pp.
8051-8061.

ISSN 2056-9386
Volume 3 (2016) issue 2, article 5
1 ©2016
Funnel Flight Controller for a Simulation Model and
Attitude Control System
漏斗飞行控制器用于仿真模型和姿态控制系统
Dr. Norman Hopfe1* and Dr. Guido Kurth2
1R&D Engineer, Bayern-Chemie GmbH, P.O. Box 1131, 84544 Aschau am Inn, Germany 2Technical Director, Bayern-Chemie GmbH, P.O. Box 1131, 84544 Aschau am Inn, Germany
Accepted for publication on 27th July 2016
Abstract - In the recent years modeling has become an
important tool for predicting the behavior and the design of
dynamical systems resulting in a reduced need for numerous and
often expensive testing. Especially if the system under
investigation cannot be tested completely under accessible test
conditions on ground, the development of reliable simulation
tools is mandatory for its design.
Within this paper, the development of an advanced simulation
tool is presented which is able to predict the behavior of a so
called Attitude Control System (ACS) which is used to adjust the
attitude of a missile to agility requirements commanded by the
onboard guidance, navigation and control device. Here the focus
is laid on the internal dynamics of such an ACS.
In general, an ACS can be regarded as a small scale rocket
engine with the capability of providing thrust at certain points of
the operational activity. This is usually realized by a set of
circumferentially mounted “mini” motors which can be
triggered individually while the missile performs a rotational
movement along its longitudinal axis or by a continuous burning
(solid propellant) motor which feeds a throttleable Cartesian
nozzle configuration.
The advantage of such a system lies in the fact that it provides
a continuous operation capability. The thrust direction can be
controlled by a simultaneous modification of the four nozzle
throats, usually realized by a hot gas valve system consisting of so
called pintles which can be shifted (either two coupled or four
individually) backwards and forth to increase or reduce the
respective nozzle throat area.
For the current investigation an ACS is simulated which
consists of a gas generator that produces a hot gas which is led
into a pair of throttleable nozzles. The nozzles are aligned along a
straight line and throttled by a coupled pintle system. The pintles
connected via a metallic rod are shifted backwards and forth to
change the respective nozzle throats such that with closing one
throat the other will be opened. The rod is connected via a lever
with an actuator.
Such a configuration allows very fast thrust modifications by
side thrust change and due to this a very fast position change of
the missile depending of the location of the ACS with respect to
the missile’s center of gravity.
This paper comprises the simulation model and application
for such an ACS containing brief descriptions of the flight
control algorithms and a mathematical simulation model. It
investigates the performance prediction for the ACS.
For all models a funnel controller method is used as an
automatic control tool. It is shown how the funnel controller is
used in a simulation and for a real test facility trial aiming at a
fast thrust variation.
The theoretical funnel control and experimental results of a
laboratory rotatory mechanical system from [SIAM2013] are
combined and extended to speed funnel control with nonlinear
disturbances and elastic deformation without active damping
where only thrust measurement is available. The extended
innovative funnel control concept is applied to this highly
reactive ACS and guarantees extremely fast thrust tracking with
a required transient accuracy in the low millisecond range to
achieve maximum performance. The knowledge of all system
parameters, the nonlinear mass flow link and the actuator
interaction is not required.
Keywords - Funnel control, Attitude Control System, nonlinear
systems, transient behavior, solid propellant, gel propellant,
simulation model, propellant burnback, Matlab
I. INTRODUCTION
This paper investigates the accuracy of a performance and
design model in simulating the thrust generation, thrust
direction, combustion pressure behavior, pintle movement,
actuator behavior, propellant choice and propellant grain
geometry (for solid propellant) etc. of an actively controlled
ACS complemented by a methodology to properly model the

Hopfe et al. (2016) Funnel Flight Controller for a Simulation Model and Attitude Control System
2 Journal of Energy Challenges and Mechanics ©2016
system by a precise mathematical description. The basic
physical equations of the dynamic can be found in
[ROMA2009], [TAM2004], [WILE2001].
The simulation of the performance of an actively controlled
ACS is a combination of all the characteristics of the system
(e.g. mass properties, performance requirements, propellant
burning and combustion gas supply, geometrical
configurations), environmental conditions and actuator
behavior. The tracking of a changing thrust profile (thrust
direction and thrust level) requires a permanent adjustment of
the commanded pintle position of the ACS (i.e. actuator
command in voltage) in order to compensate the differences
between the real measured and the nominal thrust due to
manufacturing, measurement, atmospheric modeling errors
and due to material failures during operation of the system
(e.g. insulation fracture and/or rupture or particle deposition in
the nozzle throat area).
A detailed simulation model enables engineers to
investigate the dynamics and performance during each design
phase. In the current model, the significant parameters (e.g.
combustion pressure, nozzle exit pressure, thrust etc.) and
component behaviors (e.g. actuator behavior model) are
determined by different methods – experimentally (e.g. nozzle
erosion), CFD analysis (e.g. nozzle design and performance)
as well as semi-empirical (e.g. actuator behavior model) and
analytical methods (e.g. propellant burning, pressure and
thrust generation). The first group obtains data from test
facility trials and flight tests. The CFD methods solve a set of
fundamental equations for fluid domains – divided into
discrete cells – to simulate flow fields and forces (e.g. internal
forces and pressure along the boundary layer). At last, the semi
empirical and analytical methods calculate the behavior via
analytical formulas and an existent empirical database. The
last method is the quickest way to determine or approximate
the performance of a new component of the dynamical system
or the missile/system performance and is thus important
during development.
In order to ensure the correct functioning of the system in all
phases, a robust and reliable control algorithm has been
developed. Its effectiveness has been proven in numerous
ground trials. A brief overview of the controller is given in the
section of the performance funnel description in this paper.
The interested reader is referred to [UVIL2010] for a detailed
description.
II. ATTITUDE CONTROL SYSTEM: FUNCTION AND
REALIZATION
ACS’s use (impulse) force to control the attitude (pitch, yaw
and roll) of a vehicle flying inside or outside the atmosphere.
Vehicles using an ACS system are upper stages of space
launchers, missiles or missile defense interceptors designed to
intercept (ballistic) missiles and their effectors.
Missiles with an ACS system (see Figure 1) are
Lockheed-Martin´s PAC 3 ground based air defense missile
incorporating an array of many small solid impulse thrusters
and MBDA´s CAMM ship-based air defense missile with a
continuously operating solid gas generator to turn the missile
after vertical launch and point it towards the correct direction.
Well-known examples of missile defense systems are the
Terminal High-Altitude Area Defense System (THAAD),
which uses liquid propulsion to maneuver an
endo-atmospheric vehicle and the longer range SM-3 missile,
which uses solid propellant propulsion to maneuver an
exo-atmospheric kill vehicle.
Figure 1: missile scheme with ACS
In space applications, ACS blocks, often designated as
“Vernier Motors”, can be used to control the attitude of the
launch vehicle without the need to integrate a movable nozzle
into the solid propellant rocket motor or to move the liquid
propellant rocket motor. Well-known applications are the
Vernier motors of the Sojuz launcher.
Currently, liquid and solid propellant ACS are used in
operational vehicles. The liquid ACS of the Ground Based
Interceptor (GBI) uses individual ACS thrusters from space
propulsion technology. These thrusters operate intermittently
and use hydrazine or a derivative as propellant. The solid ACS
of the SM3 has a central combustion chamber with supposedly
three solid propellant grains that produce a mission-adapted
level of gas flow for the ACS along the mission.
For vehicles that fly within the atmosphere, ACS’s are in
use to increase the agility of a missile in conditions where the
aerodynamic forces do not generate sufficiently high pitch and
yaw moments or in order to secure a direct hit. This can be the
case immediately after the launch of a missile, when the low
velocity does not generate the aerodynamic control force
needed for a quick turn or in the final approach to a
maneuvering target at high altitude, when the low atmospheric
pressure does not support quick control of pitch and yaw. The
thrust vector of an ACS creates a lateral force at a distance of
the Centre of Gravity (CoG) of the missile. The thrust vector
of an ACS creates a lateral force at a distance of the CoG of the
missile.
The introduced ACS concept assumes a central and
continuously operating gas generator to supply the nozzles
with produced gases which create the necessary thrust
directions. A hot gas pipe transports the produced gas from the
gas generator to the ACS.

Hopfe et al. (2016) Funnel Flight Controller for a Simulation Model and Attitude Control System
3 Journal of Energy Challenges and Mechanics ©2016
The design uses four coupled, controlled nozzles with
plenum, pintles and actuators, i.e. the two pintles of one nozzle
plane are connected. The system has a quasi-Cartesian
configuration with pintles to regulate the nozzle throat and
control the thrust direction, i.e. the system has two planes with
two nozzles. The actuators are outside of the hot gas. The
design assumes coupled nozzles to steer the gas flow through
the nozzle pair to reduce complexity and number of actuators.
A scheme of the system can be seen in Figure 2.
The actual design assumes that the gas generator supplies
the nozzle plenum over a hot gas pipe with thermal insulation
and efficiency loss. A complete closure of a nozzle is a harder
challenge then a “nearly closed” condition. Therefore, the
design concept assumes a “nearly closed” nozzle.
Figure 2: ACS configuration with four nozzles and actuators
Figure 2 shows the basic building blocks of an ACS with the
exception of the electric energy and gas supply. In most
designs a gas generator supplies the gas that is distributed by
the nozzle, pintle blocks according to the thrust demand. The
ACS thrusters are located outside the CoG near the periphery.
For missile applications, the total time of operation of ACS is
typically some seconds depending on the mission profile.
Continuously operating ACS’s, as shown in Figure 2,
consist of three main building blocks - namely the combustion
gas supply (CGS), the nozzle, pintle, actuator blocks that
distribute the gas to the ACS’s nozzles and the control unit that
controls the pintle and actuator and, if possible, the CGS
system, to convert the signals from the guidance, navigation
and control (GNC) into thrust vectors of correct magnitude
and direction. In many applications the nozzles and the pintles
are one assembly that is very tightly connected with the
actuators. The mechanical interface between CGS and nozzles
can be described comparatively easily as a flow of hot
combustion gas with determined mass flow at a given set of
state parameters. This allows to take pintle nozzles with
actuators and CGS as separate mechanical entities. More
complicated are the interfaces of the control unit with both
pintle nozzle actuator and CGS if the CGS can produce a
variable mass flow (e.g. gelled propellant gas generator or
TDR with solid propellant) which has to be controlled by the
control unit in connection with the nozzle, pintle and actuator.
Due to their compact design, pintle nozzles are the preferred
solution. Independent on the design of the nozzle and valve,
the materials of both have to withstand the extreme heat loads
generated by the hot gas at high pressure. The pintle nozzles
can be designed to have always a constant total nozzle throat
area ∑ 𝐴𝑡ℎ𝑟𝑜𝑎𝑡,𝑖(∙) = nearly const.𝑖 This allows to connect
the control of oppositely oriented nozzles directly in that way
that the sum of both 𝐴𝑡ℎ𝑟𝑜𝑎𝑡(∙) is nearly constant, independent
from the displacement of the pintle. By this, one actuator can
drive the pintles for these two oppositely oriented nozzles.
III. FUNCTIONAL BEHAVIOR OF THE CURRENT ACS
The current ACS is meant to be applied within an
interceptor against incoming ballistic missiles. Hence, it
should be able to guarantee, that the interceptor is capable of
hitting the target within a certain “miss distance” depending on
the intercept velocity and misalignment of the interceptor with
respect to the target.
In addition, the ACS should also be capable of stabilizing
the missile attitude such, that a seeker is able to track the
ballistic missile’s trajectory in order to enable the GNC to
guide the missile properly to its predicted intercept point
(PIP).
For this purpose, the current ACS uses four thrusters that
have to provide the required thrust very accurately within a
required thrust level and time frame. Depending on the missile
and mission design, the ACS has to perform over a wide range
of altitudes. In case the ACS is located outside the CoG, the
missile maneuvering capability can be increased and the time
constant for “instant” turns can be reduced.
The benefits of the current system are then
compact system,
attitude control in low and high altitudes
hit to kill precision and
a continuous operation of the system.
The concept is in its essence a thrust system with four
nozzles in a quasi-Cartesian configuration.
The thrust direction is an integral element effectively
controlled by an actuator system. Hot gas pintles are integrated
to provide the control authority as part of the ACS. The
actuators are directly coupled with the hot gas pintles which
control the thrust direction of the ACS. In all cases, the
actuators and their control are an integral element of the
system.
If a constant mass flow gas generator, for example a solid
fuel gas generator, is used, the use of four individually
controlled ACS nozzles allows for significant savings of
propellant mass. This is because only those ACS nozzles that
need to provide thrust have to be opened while all other
nozzles can be kept closed - thus preventing the loss of waste
gas.
If a variable mass flow gas generator - like a gelled
propellant gas generator or a RJ gas generator - is used the gas
generator mass flow can be controlled through a valve
additionally to the four controlled ACS nozzles.
pintle
actuators
nozzle plenum
gas supply
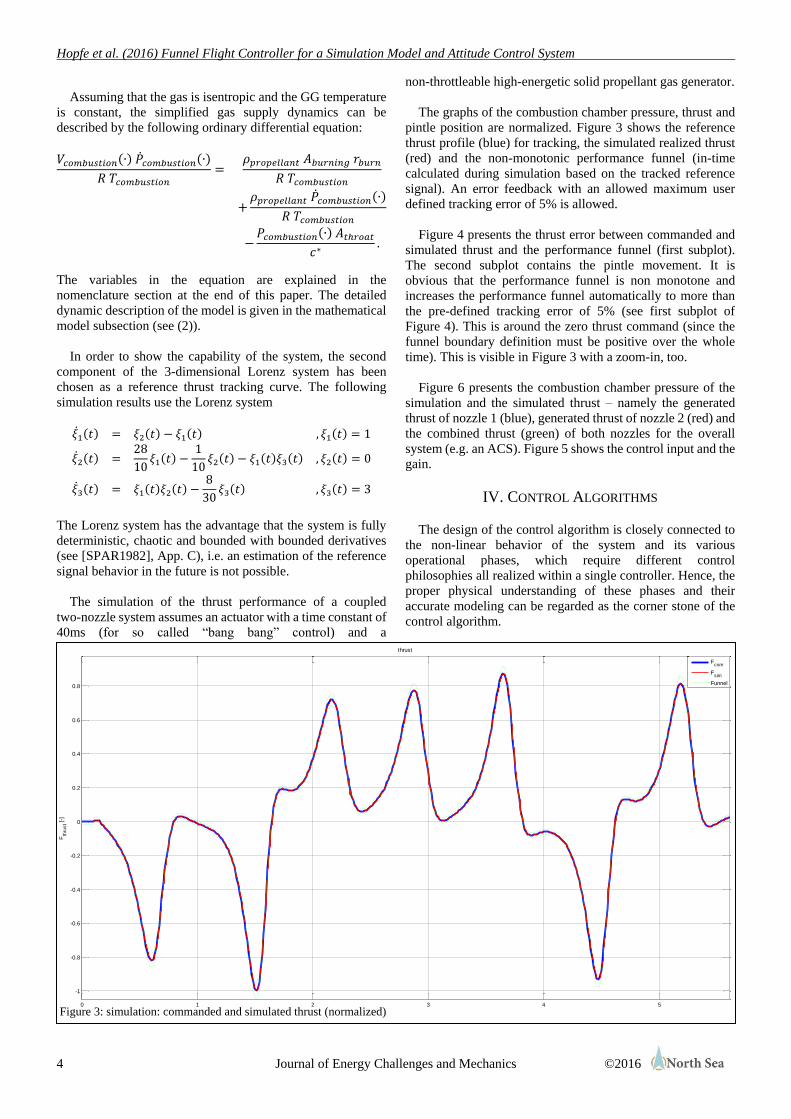
Hopfe et al. (2016) Funnel Flight Controller for a Simulation Model and Attitude Control System
4 Journal of Energy Challenges and Mechanics ©2016
Assuming that the gas is isentropic and the GG temperature
is constant, the simplified gas supply dynamics can be
described by the following ordinary differential equation:
𝑉𝑐𝑜𝑚𝑏𝑢𝑠𝑡𝑖𝑜𝑛(∙) ��𝑐𝑜𝑚𝑏𝑢𝑠𝑡𝑖𝑜𝑛(∙)
𝑅 𝑇𝑐𝑜𝑚𝑏𝑢𝑠𝑡𝑖𝑜𝑛
=𝜌𝑝𝑟𝑜𝑝𝑒𝑙𝑙𝑎𝑛𝑡 𝐴𝑏𝑢𝑟𝑛𝑖𝑛𝑔 𝑟𝑏𝑢𝑟𝑛
𝑅 𝑇𝑐𝑜𝑚𝑏𝑢𝑠𝑡𝑖𝑜𝑛
+𝜌𝑝𝑟𝑜𝑝𝑒𝑙𝑙𝑎𝑛𝑡 ��𝑐𝑜𝑚𝑏𝑢𝑠𝑡𝑖𝑜𝑛(∙)
𝑅 𝑇𝑐𝑜𝑚𝑏𝑢𝑠𝑡𝑖𝑜𝑛
−𝑃𝑐𝑜𝑚𝑏𝑢𝑠𝑡𝑖𝑜𝑛(∙) 𝐴𝑡ℎ𝑟𝑜𝑎𝑡
𝑐∗.
The variables in the equation are explained in the
nomenclature section at the end of this paper. The detailed
dynamic description of the model is given in the mathematical
model subsection (see (2)).
In order to show the capability of the system, the second
component of the 3-dimensional Lorenz system has been
chosen as a reference thrust tracking curve. The following
simulation results use the Lorenz system
��1(𝑡) = 𝜉2(𝑡) − 𝜉1(𝑡) , 𝜉1(𝑡) = 1
��2(𝑡) =28
10𝜉1(𝑡) −
1
10𝜉2(𝑡) − 𝜉1(𝑡)𝜉3(𝑡) , 𝜉2(𝑡) = 0
��3(𝑡) = 𝜉1(𝑡)𝜉2(𝑡) −8
30𝜉3(𝑡) , 𝜉3(𝑡) = 3
The Lorenz system has the advantage that the system is fully
deterministic, chaotic and bounded with bounded derivatives
(see [SPAR1982], App. C), i.e. an estimation of the reference
signal behavior in the future is not possible.
The simulation of the thrust performance of a coupled
two-nozzle system assumes an actuator with a time constant of
40ms (for so called “bang bang” control) and a
non-throttleable high-energetic solid propellant gas generator.
The graphs of the combustion chamber pressure, thrust and
pintle position are normalized. Figure 3 shows the reference
thrust profile (blue) for tracking, the simulated realized thrust
(red) and the non-monotonic performance funnel (in-time
calculated during simulation based on the tracked reference
signal). An error feedback with an allowed maximum user
defined tracking error of 5% is allowed.
Figure 4 presents the thrust error between commanded and
simulated thrust and the performance funnel (first subplot).
The second subplot contains the pintle movement. It is
obvious that the performance funnel is non monotone and
increases the performance funnel automatically to more than
the pre-defined tracking error of 5% (see first subplot of
Figure 4). This is around the zero thrust command (since the
funnel boundary definition must be positive over the whole
time). This is visible in Figure 3 with a zoom-in, too.
Figure 6 presents the combustion chamber pressure of the
simulation and the simulated thrust – namely the generated
thrust of nozzle 1 (blue), generated thrust of nozzle 2 (red) and
the combined thrust (green) of both nozzles for the overall
system (e.g. an ACS). Figure 5 shows the control input and the
gain.
IV. CONTROL ALGORITHMS
The design of the control algorithm is closely connected to
the non-linear behavior of the system and its various
operational phases, which require different control
philosophies all realized within a single controller. Hence, the
proper physical understanding of these phases and their
accurate modeling can be regarded as the corner stone of the
control algorithm.
0 1 2 3 4 5
-1
-0.8
-0.6
-0.4
-0.2
0
0.2
0.4
0.6
0.8
Fth
rust [
-]
thrust
F
com
Fsim
Funnel
Figure 3: simulation: commanded and simulated thrust (normalized)

Hopfe et al. (2016) Funnel Flight Controller for a Simulation Model and Attitude Control System
5 Journal of Energy Challenges and Mechanics ©2016
0 1 2 3 4 5-10
-8
-6
-4
-2
0
2
4
6
8
10
err
or
[%]
thrust error and pintle position
ethrust
funnel
0 1 2 3 4 5
-1
-0.8
-0.6
-0.4
-0.2
0
0.2
0.4
0.6
0.8
1
time [s]
pin
tle p
ositio
n [
-]
nozzle 1
nozzle 2
0 1 2 3 4 5-10
-8
-6
-4
-2
0
2
4
6
8
10
err
or
[%]
thrust error and pintle position
ethrust
funnel
0 1 2 3 4 5
-1
-0.8
-0.6
-0.4
-0.2
0
0.2
0.4
0.6
0.8
1
time [s]
pin
tle p
ositio
n [
-]
nozzle 1
nozzle 2
Figure 4: simulation: thrust error and pintle position (normalized)
0 1 2 3 4 5
0.1
0.2
0.3
0.4
0.5
0.6
0.7
0.8
0.9
1
Pcham
ber [
-]
combustion chamber pressure and thrust
0 1 2 3 4 5-1
-0.8
-0.6
-0.4
-0.2
0
0.2
0.4
0.6
0.8
1
time [s]
Fth
rust [
-]
Fnozzle 1
Fnozzle 2
Fthr,1-2
0 1 2 3 4 5
0.1
0.2
0.3
0.4
0.5
0.6
0.7
0.8
0.9
1
Pcham
ber [
-]
combustion chamber pressure and thrust
0 1 2 3 4 5-1
-0.8
-0.6
-0.4
-0.2
0
0.2
0.4
0.6
0.8
1
time [s]
Fth
rust [
-]
Fnozzle 1
Fnozzle 2
Fthr,1-2
Figure 6: simulation: combustion pressure and thrust (normalized)
0 1 2 3 4 5
0.1
0.2
0.3
0.4
0.5
0.6
0.7
0.8
0.9
1
Pcham
ber [
-]
combustion chamber pressure and thrust
0 1 2 3 4 5-1
-0.8
-0.6
-0.4
-0.2
0
0.2
0.4
0.6
0.8
1
time [s]
Fth
rust [
-]
Fnozzle 1
Fnozzle 2
Fthr,1-2
0 1 2 3 4 5-0.2
-0.15
-0.1
-0.05
0
0.05
0.1
0.15
0.2
0.25
u [
-]
control input and gain
0 1 2 3 4 5
0.01
0.02
0.03
0.04
0.05
0.06
0.07
0.08
0.09
0.1
0.11
time [s]
gain
k [
-]
0 1 2 3 4 5-0.2
-0.15
-0.1
-0.05
0
0.05
0.1
0.15
0.2
0.25
u [
-]
control input and gain
0 1 2 3 4 5
0.01
0.02
0.03
0.04
0.05
0.06
0.07
0.08
0.09
0.1
0.11
time [s]
gain
k [
-]
Figure 5: simulation: control input u and gain k

Hopfe et al. (2016) Funnel Flight Controller for a Simulation Model and Attitude Control System
6 Journal of Energy Challenges and Mechanics ©2016
The main objective of the controller is to modify the
controllable parameters (i.e. the actuator position) such that a
certain command thrust is achieved without endangering the
system’s physical stability.
The controller has to monitor and react to changes in the
system even if the demand thrust remains unchanged. Typical
examples are changes in material geometry and elastic
deformations with implications on the thrust performance.
This means that the control algorithms have to monitor
constantly all the relevant system parameters and adapt the
actuator position continuously.
The aim is to track a reference signal (e.g. the pre-defined
thrust profile) in the context of input and output systems in the
presence of input control. The investigated method is a
pre-specified parameterized performance funnel. The tracking
error is required to evolve within the funnel: transient and
asymptotic behavior of the tracking error is influenced through
the choice of parameter values which define the funnel. The
proposed structure is an error feedback wherein the gain
function evolves so as to preclude contact with the funnel
boundary.
A feasibility condition (formulated in terms of the funnel
data and the reference signal) can be formulated under which
the tracking objective is achieved, whilst maintaining
boundedness of all signals. The performance funnel evaluates
system reliability and technical performance such that it
allows a better orientation, more accurate matching and a
better control of the parameter influence on the results.
[ESAIM2002] assumes arbitrary small time steps inside the
proof of the main theorem. In real applications, the time step is
limited to a minimum given by the sensor measurement
system, actuator response time and the overall
software/hardware delay.
Thus, a direct application of the funnel controller from
[UVIL2010] is not possible. The well-known performance
funnel concept was extended for use in applications with
discrete time steps given by the used hardware.
V. MATHEMATICAL MODEL
Simulation models predict general system behavior as
represented by speed, performance or reaction times by
solving the respective equations of the system’s dynamics.
The aim is to improve the operational effectiveness of a
system through modeling and simulation. Figure 7 shows the
model structure of the current ASC design which covers
system dynamics, sensors to track the realized system thrust, a
guidance law to generate the a-priori actuator commands, a
propulsion model and a controller to achieve the desired thrust
response to the guidance commands (actuator, pintle, thrust
control).
As seen in Figure 7, the model is divided into different
components – the propulsion gas supply, actuators, sensors,
disturbances, thrust control, actuator controller and
transformations. The closed-loop nature of the simulation
shows the connectivity between the different model
components. The propulsion supply system includes a
propellant burning model, different flow models, description
of the nozzle, pintle and actuator behavior as a function of time
constants, combustion pressure, used propellant gas and
ambient conditions. The system contains a large number of
sub-components of which Figure 7 gives only a limited
overview. The reference thrust follows a pre-specified profile,
e.g. the chaotic 3-dimensional Lorenz system.
Figure 7: Model structure
The kinematic and dynamic equations model the system
under the influence of the actuator behavior, disturbances and
the thrust forces produced by the propulsion supply system.
Actuator commands and combustion pressure interaction and
any other effects caused by actuators or signal processing are
included.
In view of precision, speed and ability to respond of the
ACS, the characteristics of the ACS and propulsion system are
analyzed and computational tools are developed. Numerical
simulations with a dynamic model are carried out to
investigate the behavior.
In order to predict the thrust response of a controlled ACS, a
mathematical model with several subclasses describes the
dynamic of all components. The code can be easily integrated
in applications or used as standalone program, e.g. when
performing adapted performance simulations within a
pre-existing database of actuator and nozzle data.
The dynamic equations of the model describe the
performance and reaction time of the system (see (2)). The
variables in (2) are explained in the nomenclature section at
the end of this paper. Note that ρcombustion(∙) and rburn(∙)
depend on Pcombustion(∙) . For simplicity, since the correct
mathematical space definition and initial values formulation
are complex, the functional definition space of the right hand
side of (2) is sloppy at this point.
Note that the equations of (2) are a non-linear state space
representation of the thrust simulation model. The full
non-linear equations are used, integrated and solved for
pressure, mass flow, density and volume. In view of (2), some
caution is required in formulating the existence of a unique
global solution, i.e. defined on ℝ≥0 . A straightforward
formulation proves the existence and uniqueness of a global
solution which is a major step for a prediction model. Standard
theory of ordinary differential equations (see [WALT1998],
Th. III.10.VI) yields existence and uniqueness of a maximal
solution of the initial value problem (2).
Sensors
System
dynamic
equations
Actuator
command
System/Reference
thrust
Guidance
and
Control
Propulsion
Disturbances
Hysteresis
Material failures

Hopfe et al. (2016) Funnel Flight Controller for a Simulation Model and Attitude Control System
7 Journal of Energy Challenges and Mechanics ©2016
Traditional control techniques use a linearized state space
form of (2) which may not be carried out in appropriate detail
and may leave useful information/effects unconsidered.
The controller of the ACS thrust simulation model converts
guidance commands into respective pintle position commands
– more precisely, into actuator position commands to control
the fuel mass flow direction from the gas supply system to the
nozzles – in order to realize the required thrust level and
direction needed for the intended missile maneuver. The
resultant dynamics are measured by rate gyros, accelerometers
and pressure sensors to design a non-adaptive feedback
control system that tracks the a-priori defined thrust curve (e.g.
the output of the chaotic Lorenz system).
As control system, the performance funnel is used
[RTO2012]. The performance funnel ensures that the
pre-specified transient behavior of the thrust generation and
direction with respect to the reference profile is simpler than
an adaptive controller insofar as the gain is not dynamically
generated and does not invoke any internal model (see
[RTO2012]).
VI. PERFORMANCE FUNNEL
Within this chapter the extension of the introduced funnel
controller is discussed (see [IFAC2013], [RTO2012])
focusing on the practical, technical implementation of this
control algorithm on an ACS in an uncontrolled environment.
A significant number of control algorithms that apply to
dynamic inversion, backstepping techniques on simplified
state variable models of the dynamics or PID controllers on
linearized models in the frequency domain are presented in the
literature (see [IEEE2004], [IEEE2007]). Here it is shown that
if the practical non-linear time domain implementation is done
correctly, even the simple non-monotone gain funnel
controller can ensure the stability of the thrust direction and
the thrust control (i.e. motor thrust, thrust direction and
tracking error).
In the abstract sense, the complete model (2) can be
described by functional differential equations in the presence
of multi-input, multi-output systems which can be considered
as a system of two interconnected nonlinear subsystems
��(𝑡) = 𝑓1(𝑥(𝑡), 𝑑1(𝑡)) + 𝑔(𝑢(𝑡)) , 𝑥(0) = 𝑥0
𝑦(𝑡) = 𝑓2(𝑥(𝑡), 𝑑2(𝑡))} (3)
where 𝑓1: ℝ𝑛×ℝ𝑝 → ℝ𝑛 , 𝑓2: ℝ𝑛×ℝ�� → ℝ𝑚 are locally
Lipschitz, 𝑑1(∙) ∈ 𝔏∞(ℝ≥0 → ℝ𝑝) , 𝑑2(∙) ∈ 𝔏∞(ℝ≥0 → ℝ��)
are disturbances and 𝑔: ℝ𝑞 → ℝ𝑛 is the continuous input
function. In view of (3), some care is required in formulating
the existence of a unique global solution, i.e. defined on ℝ≥0
which was discussed before. Momentarily regarding the
second subsystem in (3), as an example for the presented
application, y(∙) = 𝐹𝑡ℎ𝑟(∙) is a possible representation.
The performance method is formulated in terms of the
performance funnel (see Figure 8)
𝐹(𝜑) ≔ {(𝑡, 𝜂) ∈ ℝ≥0×ℝ𝑚|𝜑(𝑡)‖𝜂‖ < 1},
determined by a function 𝜑(∙) which satisfies a Lipschitz
condition. It has to be noted that the funnel boundary is given
by 𝜑(∙)−1 which contains a potential singularity. Typical
funnel prototypes are illustrated in Figure 8.
Figure 8: Prototypes of non-/symmetric performance funnels
The control objective is as follows. Determine a feedback
structure which ensures that, for a given reference signal
𝑦𝑟𝑒𝑓(∙) ∈ 𝑊1,∞(ℝ≥0 → ℝ𝑚), the output tracking error 𝑒(∙) ≔
𝑦(∙) − 𝑦𝑟𝑒𝑓(∙) evolves within the funnel, i.e.
{(𝑡, 𝑒(𝑡))}𝑡∈ℝ≥0
⊂ 𝐹(𝜑): transient and asymptotic behavior of
the tracking error is influenced through choice of the function
𝜑(∙). The proposed structure is an error feedback wherein the
gain function evolves so as to preclude contact with the funnel
boundary:
𝑒(𝑡) 𝜑1−1(∙)
−𝜑2−1(∙)
𝑒(0)
𝑒(𝑡)
𝑒(0) 𝜑−1(∙)
��𝑐𝑜𝑚𝑏𝑢𝑠𝑡𝑖𝑜𝑛(∙) = ��𝑡ℎ𝑟𝑜𝑎𝑡(∙) +𝑑(𝜌𝑐𝑜𝑚𝑏𝑢𝑠𝑡𝑖𝑜𝑛(∙)𝑉𝑐𝑜𝑚𝑏𝑢𝑠𝑡𝑖𝑜𝑛(∙))
𝑑𝑡𝑑𝑉𝑐𝑜𝑚𝑏𝑢𝑠𝑡𝑖𝑜𝑛(∙)
𝑑𝑡= 𝐴𝑏𝑢𝑟𝑛𝑖𝑛𝑔(∙)��𝑏𝑢𝑟𝑛(∙)
𝑑𝜌𝑐𝑜𝑚𝑏𝑢𝑠𝑡𝑖𝑜𝑛(∙)
𝑑𝑡=
𝑑𝑃𝑐𝑜𝑚𝑏𝑢𝑠𝑡𝑖𝑜𝑛(∙)
𝑑𝑡−
2𝑃𝑐𝑜𝑚𝑏𝑢𝑠𝑡𝑖𝑜𝑛(∙)
𝑐∗(∙)𝑑𝑐∗(∙)
𝑑𝑡
൭𝑐∗(∙)ξ𝛾ቀ2
𝛾+1ቁ
𝛾+12(𝛾−1)൱
2
𝑑𝑃𝑐𝑜𝑚𝑏𝑢𝑠𝑡𝑖𝑜𝑛(∙)
𝑑𝑡=
൭𝑐∗(∙)ξ𝛾ቀ2
𝛾+1ቁ
𝛾+12(𝛾−1)൱
2
𝑉𝑐𝑜𝑚𝑏𝑢𝑠𝑡𝑖𝑜𝑛(∙)ቀ𝜌𝑝𝑟𝑜𝑝𝑒𝑙𝑙𝑎𝑛𝑡(∙) − 𝜌𝑐𝑜𝑚𝑏𝑢𝑠𝑡𝑖𝑜𝑛(∙)ቁ 𝐴𝑏𝑢𝑟𝑛𝑖𝑛𝑔(∙)��𝑏𝑢𝑟𝑛(∙)
⬚ ⬚ −൭𝑐∗(∙)ξ𝛾ቀ
2
𝛾+1ቁ
𝛾+12(𝛾−1)൱
2
𝑉𝑐𝑜𝑚𝑏𝑢𝑠𝑡𝑖𝑜𝑛(∙)
𝑃𝑐𝑜𝑚𝑏𝑢𝑠𝑡𝑖𝑜𝑛(∙)𝐴𝑡ℎ𝑟𝑜𝑎𝑡(∙)
𝑐∗(∙)+
2𝑃𝑐𝑜𝑚𝑏𝑢𝑠𝑡𝑖𝑜𝑛(∙)
𝑐∗(∙)
𝑑𝑐∗(∙)
𝑑𝑡
(2)

Hopfe et al. (2016) Funnel Flight Controller for a Simulation Model and Attitude Control System
8 Journal of Energy Challenges and Mechanics ©2016
given: performance funnel 𝜑(∙)−1 - roughly speaking -
φ, �� ∈ 𝔏∞
design: gain 𝑘(𝑡) = 𝑘 ቀ𝑡; 𝜑(𝑡), 𝑦(𝑡), 𝑦𝑟𝑒𝑓(𝑡)ቁ
such that: for all reference signals - roughly speaking -
𝑦𝑟𝑒𝑓 , ��𝑟𝑒𝑓 ∈ 𝔏∞
the simple feedback 𝑢(𝑡) = −𝑘(𝑡)[𝑦(𝑡) − 𝑦𝑟𝑒𝑓(𝑡)]
guarantees
non-monotone gain which is simpler then the
adaptive gain (not dynamically generated, no
internal model)
asymptotic and transient behavior:
𝑦(𝑡) − 𝑦𝑟𝑒𝑓(𝑡) ≤ 𝜑(𝑡)−1
that the performance funnel is not restricted to a
specialized system
robustness against input, output and reference
noise
positivity: 𝑦(𝑡) ≥ 0 if user/designer
requirement
The performance funnel was first introduced in
[ESAIM2002] and [UVIL2010] with the goal of achieving
better performances than PID controllers in control situations.
This is achieved with a basically simpler representation, as
unlike a PID controller the funnel does not require a
differential equation or internal module. An approach to the
simulation model of the performance estimation for the
purpose of formal verification and analysis is illustrated.
The performance funnel ensures pre-specified transient
behavior of the tracking error, has a non-monotone gain, is
simpler than an adaptive controller (insofar as the gain is not
dynamically generated), and does not invoke any internal
model. The method combines the benefits of two different
approaches: the simplicity of adaptive feedback control and an
intrinsic high-gain property if necessary. It can be applied
directly to the problem without differential equations or an
internal model. Two performance evaluation methods are
implemented – Euclidean and component wise analysis. The
first method uses the Euclidean norm of the output signal (see
Figure 8). The second part fits each output signal separately.
An allowed corridor for the input is used to fit the reference
signals. The simple implementation of the algorithm only uses
the input and reference signals.
Figure 9: Schematically flow of the funnel based thrust direction
control
A wide variety of funnels are possible (see Figure 8).
Monotonicity of the funnel boundary is not required.
Non-monotone funnels may be advantageous in situations for
which it is known a priori when perturbations or set-point
changes may occur – in this sense; non-monotone funnels have
the connotation of re-initialization of the control structure.
The simplified workflow of the funnel based performance
approach for an input output system is shown schematically in
Figure 9.
VII. TEST FACILITY DEMONSTRATOR AND TRIALS
Based on requirements like performance, operational time,
installation space, total mass etc., a first principal operational
ACS design was developed to fulfill the requirements (see
Figure 1 and Figure 2). The preliminary concept uses in-house
tools, CFD calculations and experimental results for a
principle concept of a gas supply system with an actuator
concept to move the pintle and meet the performance
requirements.
This basic design with all components was implemented
and integrated into a simulation environment in
Matlab/Simulink including propellant burning model,
empirical actuator behavior curves, nozzle and pintle shapes to
realize a simulation and performance prediction model to
simulate the overall performance of the system, to identify and
optimize key driver components, to do sensitivity studies (e.g.
influence of actuator time constant or influence of sensor
measurement and data transfer rates etc.) and to validate and
verify test facility trials and results.
Figure 10: ACS - test facility hardware design
Based on this lightweight design, a test facility hardware
concept design (see Figure 10) was generated to fulfill the
function of an ACS, but it is more modular and less integrated
than a possible flight design to allow the change or
modification of parts and has more massive structures in order
to allow refurbishment of parts or assemblies or re-use.
𝑦 𝑢
𝑒
𝑦𝑟𝑒𝑓
𝑦
+ −
𝑢 = −𝑘(𝑡; 𝜑, 𝑒)𝑒
𝑢 = 𝑠𝑎𝑡𝑢ෝ(𝑢)
model noise
switch input constraints
yes no

Hopfe et al. (2016) Funnel Flight Controller for a Simulation Model and Attitude Control System
9 Journal of Energy Challenges and Mechanics ©2016
The demonstrator concept is represented by two nozzles for
the ACS, i.e. one nozzle plane, with plenum, pintles and an
actuator. The full functionality of the ACS can be
demonstrated with only 50 per cent of the nozzle numbers and
actuators.
The nozzles have a quasi-Cartesian configuration with
pintles to control the thrust direction. The actuators are not
exposed to the hot gas. Typical test facility actuators are used,
i.e. the time constant of the demonstrator is slower than
expected for an operational system.
The aims of the test facility trials are to determine the
dynamic behavior of the system, validate the accuracy of the
design and simulation model, determine actuator forces and
confirm the design and technology handling.
For simplicity, coupled pintles are used instead of
individual controlled nozzles. This implies a higher propellant
mass flow during the trial but reduces the complexity of the
system. A complete closure of a nozzle is a harder challenge
then a “nearly closed”. Therefore, “nearly closed” nozzles are
assumed.
The simulation model and funnel controller implementation
is verified by analytical test cases and real test facility trials
with an ACS test facility demonstrator based on a flight
design. In order to investigate the performance and control
algorithm of the controlled ACS, a single trial will be chosen.
0 1 2 3 4 5 6
-0.8
-0.6
-0.4
-0.2
0
0.2
0.4
0.6
0.8
1
time [s]
Fth
rust r
ef
[-]
thtust reference profile
Figure 11: trial: PN reference thrust profile (normalized)
0 1 2 3 4 5 6
0.1
0.2
0.3
0.4
0.5
0.6
0.7
0.8
0.9
1
Pcham
ber [
-]
combustion chamber pressure
Pchamber, meas
Pchamber, sim
Figure 12: trial: pressure (normalized)

Hopfe et al. (2016) Funnel Flight Controller for a Simulation Model and Attitude Control System
10 Journal of Energy Challenges and Mechanics ©2016
For a standardized classical missile, proportional navigation
is a first standard approach for a guidance law and
performance studies (e.g. like range, flight time, footprint
etc.). The presented trial uses a common thrust reference
profile as expected during real flights (see Figure 11). Since
the ignition process is not represented inside the simulation
model, the reference thrust has the zero command at the
beginning to guarantee that the ignition process of the engine
is finished.
As a gas supply system, a gelled propellant with a
combustion temperature of approximately 2000 K is used
since the propellant handling is simpler and cheaper compared
to a solid propellant gas generator. For safety reasons, if a
failure happens during the trial, the gelled propellant
combustion and gas production can be stopped immediately.
The graphs of the combustion chamber pressure, thrust and
pintle position are normalized. Figure 12 shows the simulated
combustion chamber pressure (blue) based on the simulation
model and the measured trial pressure (magenta). The ignition
process is not represented inside the model which explains the
differences between measurement and simulation over the first
0.4s. Afterwards, the fitting between measurement and
simulation is good and the pressure movements are visible in
both graphs. Some loss of insulation explains the pressure
drop at the end of the trial.
Figure 14 shows the commanded, pre-defined reference
thrust (blue) as in Figure 11 which shall be tracked by the
ACS. The measured thrust of the active controlled system via
pintle position and thrust control is in magenta taking into
account that the used controller is an inline pre-defined
Figure 14: trial: thrust (normalized) 0 1 2 3 4 5 6
-0.8
-0.6
-0.4
-0.2
0
0.2
0.4
0.6
0.8
1
Fth
rust [
-]
thrust tracking
Fcom
Fmeas
Figure 14: trial: error between measured thrust and reference thrust
0 1 2 3 4 5 6-10
-8
-6
-4
-2
0
2
4
6
8
10
err
or
[%]
thrust error and pintle position
ethrust
funnel
0 1 2 3 4 5 6
-1
-0.8
-0.6
-0.4
-0.2
0
0.2
0.4
0.6
0.8
1
time [s]
pin
tle p
ositio
n [
-]
nozzle 1
nozzle 2
0 1 2 3 4 5 6-10
-8
-6
-4
-2
0
2
4
6
8
10
err
or
[%]
thrust error and pintle position
ethrust
funnel
0 1 2 3 4 5 6
-1
-0.8
-0.6
-0.4
-0.2
0
0.2
0.4
0.6
0.8
1
time [s]
pin
tle p
ositio
n [
-]
nozzle 1
nozzle 2

Hopfe et al. (2016) Funnel Flight Controller for a Simulation Model and Attitude Control System
11 Journal of Energy Challenges and Mechanics ©2016
performance funnel. As seen in Figure 8, the test facility
demonstrator has an oscillation capability and no integrated
damper which would have an influence to the thrust
measurement. Therefore, the main focus is not on the
measured thrust curve in absolute values but on the qualitative
behavior and the control handling and reaction. It can be seen
that the introduced funnel controller can guarantee the system
control, material dispersions (e.g. insulation loss, erosion etc.),
oscillation events and actuator delays.
Figure 14 presents the thrust error between commanded and
measured thrust and the performance funnel (first subplot).
Through the oscillation capability and no integrated damper,
the user allowed pre-defined error range is 8 %. Most of the
time, the tracking error is less than 4 %. As explained in
subsection III, the performance funnel is non monotone and
the algorithm increases the performance funnel automatically
to more than the pre-defined tracking error (see first subplot of
Figure 14).
The second subplot contains the pintle movement. Note that
a mechanical actuator has a reaction time for a new
commanded position.
Figure 15 shows the control input and the gain. A zoom-in
shows that the control input u(∙) is smaller than 0.05 in
absolute values. This means that the tracking is fast and
immediately such that no large control inputs are necessary.
Moreover, the gain is not constant and the intrinsic high gain
property is obviously, i.e. the gain is large if necessary and
otherwise small.
VIII. CONCLUSION
The combination of increasingly complex and expensive
hardware and constrained military budgets results in the fact
that it is not economically feasible to test a system for the
entire possible range of operations or with different designs. A
precise model of the performance, certified by trials that can
be used to predict system performance accurately for all
operating points or updated subcomponents is essential.
Especially the controller design and the modeling accuracy
and reliability are very important constituents of the missile or
rocket engineering design.
This paper presented the main components of a simulation
control system applied to an ACS. A main issue was to prove
that such a complex system can be controlled using a
pre-defined performance funnel. A linearized simulation
model, transfer functions or frequency-domain descriptions
are not necessary.
The tracking error is required to evolve within the funnel:
transient and asymptotic behavior of the tracking error is
influenced through choice of parameter values which define
the funnel. The proposed structure is an error feedback
wherein the gain function evolves so as to preclude contact
with the funnel boundary. A feasibility condition (formulated
in terms of the funnel data and the reference signal) can be
formulated under which the tracking objective is achieved,
whilst maintaining boundedness of all signals. The
performance funnel evaluates system reliability and technical
performance so as to allow a better orientation, more accurate
matching and a better control of the parameter influence on the
results.
The presented performance funnel controller guarantees a
transient behavior for the missile. Since the performance
method is described by generic functions, a large range of
models can be analyzed. The implemented funnel algorithm
allows the optimization of both – the geometrical shape of the
pintle nozzle system and actuator parameters with respect to
given requirements.
As explained in the algorithmic description, the maximum
allowed error of the tracked parameter (e.g. thrust) is user
defined. The maximum allowed error has to be high enough as
that a physically meaningful solution can be obtained.
Figure 15: trial: gain k and control input u
1 2 3 4 5 6
-0.8
-0.6
-0.4
-0.2
0
0.2
0.4
u [
-]
control input and gain
1 2 3 4 5 6
-0.05
0
0.05
0.1
0.15
0.2
time [s]
gain
k [
-]
1 2 3 4 5 6
-0.8
-0.6
-0.4
-0.2
0
0.2
0.4
u [
-]
control input and gain
1 2 3 4 5 6
-0.05
0
0.05
0.1
0.15
0.2
time [s]
gain
k [
-]

Hopfe et al. (2016) Funnel Flight Controller for a Simulation Model and Attitude Control System
12 Journal of Energy Challenges and Mechanics ©2016
NOMENCLATURE
ACS Attitude Control System
CoG Centre of Gravity
GG Gas Generator
PID Proportional Integral Differential
(Controller)
PN Proportional Navigation
RJ Ram Jet
TDR Throttleable Ducted Rocket
𝐴𝑏𝑢𝑟𝑛𝑖𝑛𝑔(∙) burning area of the propellant
𝐴𝑡ℎ𝑟𝑜𝑎𝑡(∙) pintle position dependent nozzle throat
area
𝑐∗(∙) characteristic velocity of the gas
𝐹𝑡ℎ𝑟(∙) thrust
𝛾 heat specific value
��𝑐𝑜𝑚𝑏𝑢𝑠𝑡𝑖𝑜𝑛(∙) mass flow rate due to propellant
combustion
��𝑡ℎ𝑟𝑜𝑎𝑡(∙) mass flow rate exiting the nozzle
��𝑏𝑢𝑟𝑛(∙) burn rate of the propellant
𝑃𝑐𝑜𝑚𝑏𝑢𝑠𝑡𝑖𝑜𝑛(∙) combustion chamber pressure
𝑅 universal gas constant
𝜌𝑝𝑟𝑜𝑝𝑒𝑙𝑙𝑎𝑛𝑡 density of the propellant
𝜌𝑐𝑜𝑚𝑏𝑢𝑠𝑡𝑖𝑜𝑛 gas density in the combustion chamber
𝑇𝑐𝑜𝑚𝑏𝑢𝑠𝑡𝑖𝑜𝑛(∙) combustion chamber temperature
𝑉𝑐𝑜𝑚𝑏𝑢𝑠𝑡𝑖𝑜𝑛(∙) combustion chamber volume
ℝ, ℝ≥0 space of (non-negative) real numbers
𝔏∞(ℝ≥0 → ℝ𝑚) measurable and essentially bounded
functions
W1(ℝ≥0 → ℝ𝑚) bounded locally absolutely continuous
functions with essentially bounded first
derivative
REFERENCES
[ESAIM2002] A. Ilchmann, E.P. Ryan and C.J. Sangwin,
Tracking with prescribed transient behavior,
ESAIM: Control, Optimisation and Calculus
of Variations, Volume 7, 2007, p. 471–493
[IEEE2004] P. Castillo, A. Dzul and R. Lozano,
Real-time stabilization and tracking of a
four-rotor mini rotorcraft, IEEE
Transactions on Control Systems
Technology, Volume 14, Issue 4, 2004, p.
510–516
[IEEE2007] S. Bouabdallah and R. Siegwart, Full control
of a quadrator, IEEE/RSJ International
Conference on Intelligent Robots and
Systems, 2007, p. 153-158
[IFAC2013] N. Hopfe and P. Caldas-Pinto and G. Kurth,
Funnel Control for systems with relative
degree two, IFAC Automatic Control in
Aerospace, Volume 19, Issue 1, 2013, p.
125–130
[ROMA2009] E. Cavallini, Modelling and Numerical
Simulation of Solid Rocket Motors Internal
Ballistics, Ph.D., Sapienza Universita di
Roma, 2009
[RTO2012] C. Bauer and N. Hopfe and P. Caldas-Pinto
and F. Davenne and G. Kurth, Advanced
Flight performance Evaluation Methods of
Supersonic Air-Breathing Propulsion
System by a Highly Integrated Model Based
Approach, RTO AVT-208 Symposium,
RTO-MP-AVT-208, San Diego, 2012
[SIAM2013] C. Hackl and N. Hopfe and A. Ilchmann and
M. Mueller and S. Trenn, Funnel Flight
Controller for a TDR 6-DoF Simulation
Model, SIAM J. of Control and Optimization,
Volume 51, Issue 2, 2013, p. 965–995
[SPAR1982] C. Sparrow, The Lorenz Equations:
Bifurcations, Chaos, and Strange
Attractors, Number 41 in Applied
Mathematical Sciences, Springer-Verlag,
1982
[TAM2004] D.S. Stewart, K.C. Tang, S. Yoo, M.Q.
Brewster and I.R. Kuznetsov, Multiscale
modeling of solid rocket motors: Time
integration methods from computational
aerodynamics applied to stable quasi-steady
motor burning, TAM report no. 1054,
Theoretical and Applied Mechanics,
University of Illinois at Urbana-Champaign,
2004
[UVIL2010] N. Hopfe, Feedback control: systems with
higher unknown relative degree, input
constraints and positivity,
Universitäts-Verlag Ilmenau, 2010
[WALT1998] W. Walter, Ordinary Differential Equations,
Springer, New York, 1998
[WILE2001] G. P. Sutton and O. Biblarz, Rocket
Propulsion Elements, 7nd edition. John
Wiley & Sons, 2001
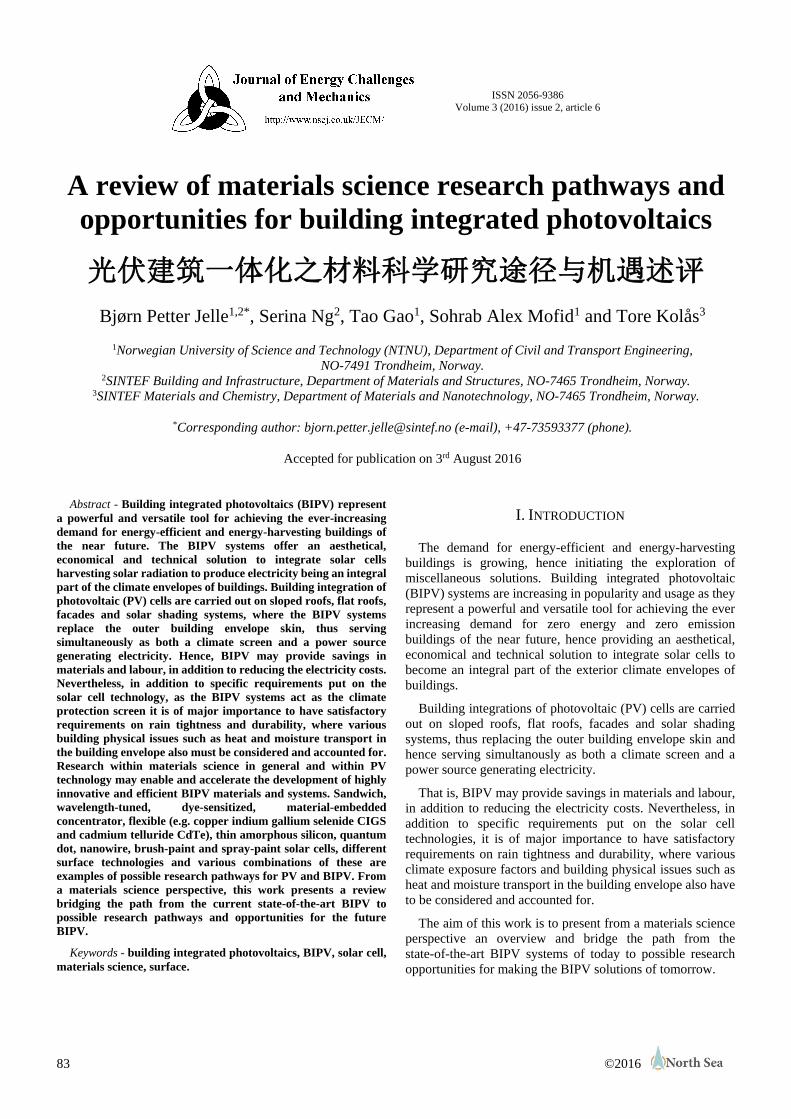
ISSN 2056-9386
Volume 3 (2016) issue 2, article 6
83 ©2016
A review of materials science research pathways and
opportunities for building integrated photovoltaics
光伏建筑一体化之材料科学研究途径与机遇述评
Bjørn Petter Jelle1,2*, Serina Ng2, Tao Gao1, Sohrab Alex Mofid1 and Tore Kolås3
1Norwegian University of Science and Technology (NTNU), Department of Civil and Transport Engineering,
NO-7491 Trondheim, Norway. 2SINTEF Building and Infrastructure, Department of Materials and Structures, NO-7465 Trondheim, Norway.
3SINTEF Materials and Chemistry, Department of Materials and Nanotechnology, NO-7465 Trondheim, Norway.
*Corresponding author: [email protected] (e-mail), +47-73593377 (phone).
Accepted for publication on 3rd August 2016
Abstract - Building integrated photovoltaics (BIPV) represent
a powerful and versatile tool for achieving the ever-increasing
demand for energy-efficient and energy-harvesting buildings of
the near future. The BIPV systems offer an aesthetical,
economical and technical solution to integrate solar cells
harvesting solar radiation to produce electricity being an integral
part of the climate envelopes of buildings. Building integration of
photovoltaic (PV) cells are carried out on sloped roofs, flat roofs,
facades and solar shading systems, where the BIPV systems
replace the outer building envelope skin, thus serving
simultaneously as both a climate screen and a power source
generating electricity. Hence, BIPV may provide savings in
materials and labour, in addition to reducing the electricity costs.
Nevertheless, in addition to specific requirements put on the
solar cell technology, as the BIPV systems act as the climate
protection screen it is of major importance to have satisfactory
requirements on rain tightness and durability, where various
building physical issues such as heat and moisture transport in
the building envelope also must be considered and accounted for.
Research within materials science in general and within PV
technology may enable and accelerate the development of highly
innovative and efficient BIPV materials and systems. Sandwich,
wavelength-tuned, dye-sensitized, material-embedded
concentrator, flexible (e.g. copper indium gallium selenide CIGS
and cadmium telluride CdTe), thin amorphous silicon, quantum
dot, nanowire, brush-paint and spray-paint solar cells, different
surface technologies and various combinations of these are
examples of possible research pathways for PV and BIPV. From
a materials science perspective, this work presents a review
bridging the path from the current state-of-the-art BIPV to
possible research pathways and opportunities for the future
BIPV.
Keywords - building integrated photovoltaics, BIPV, solar cell,
materials science, surface.
I. INTRODUCTION
The demand for energy-efficient and energy-harvesting
buildings is growing, hence initiating the exploration of
miscellaneous solutions. Building integrated photovoltaic
(BIPV) systems are increasing in popularity and usage as they
represent a powerful and versatile tool for achieving the ever
increasing demand for zero energy and zero emission
buildings of the near future, hence providing an aesthetical,
economical and technical solution to integrate solar cells to
become an integral part of the exterior climate envelopes of
buildings.
Building integrations of photovoltaic (PV) cells are carried
out on sloped roofs, flat roofs, facades and solar shading
systems, thus replacing the outer building envelope skin and
hence serving simultanously as both a climate screen and a
power source generating electricity.
That is, BIPV may provide savings in materials and labour,
in addition to reducing the electricity costs. Nevertheless, in
addition to specific requirements put on the solar cell
technologies, it is of major importance to have satisfactory
requirements on rain tightness and durability, where various
climate exposure factors and building physical issues such as
heat and moisture transport in the building envelope also have
to be considered and accounted for.
The aim of this work is to present from a materials science
perspective an overview and bridge the path from the
state-of-the-art BIPV systems of today to possible research
opportunities for making the BIPV solutions of tomorrow.

Jelle et al. (2016) A Review of Materials Science Research Pathways and Opportunities for Building Integrated Photovoltaics
84 Journal of Energy Challenges and Mechanics ©2016
II. STATE-OF-THE-ART BIPV SYSTEMS
The BIPV product range is very wide, and the BIPV
products or systems may be categorized in different ways, e.g.
as foil, tile, module and solar cell glazing products. On the
other hand, building attached (applied/added) photovoltaics
(BAPV) are regarded as add-ons to the buildings, thus not
replacing the traditional building parts as BIPV systems are
doing. Examples of BIPV tiles on building roofs are shown in
Fig.1 [1,2]. Furthermore, two different BIPV products are
depicted in Fig.2 [3,4]. For an overview and detailed
information of state-of-the-art BIPV products it is referred to
earlier studies [5,6].
Fig.1. Examples of BIPV tiles on building roofs, Solar Thermal
Magazine (left) [1] and Applied Solar (right) [2].
Fig.2. BIPV tile products, SRS Energy (left) [3] and Solar Century
(right) [4].
III. MATERIALS SCIENCE RESEARCH PATHWAYS
3.1. IMPACT ON BIPV FROM PV DEVELOPMENT
The development of PV materials and their technologies
may have an even stronger impact on the BIPV development
in the years to come. This will especially be valid if one from
the PV based research is able to tailor-make solar cell
materials and solutions for building integration [7,8]. In Fig.3
there is given a timeline for reported best research-cell
efficiencies, depicting all verified records for different PV
conversion technologies [9].
Fig.3. Timeline for reported best research-cell efficiencies (enlarge
digitally to see details) [9].
The miscellaneous PV conversion technologies given in the
overview in Fig.3 include crystalline Si, thin film,
single-junction GaAs, multijunction and emerging
technologies, and are collected from solar companies,
universities and national laboratories [9].
Ongoing experimental studies range from those with more
focus on pure materials science, e.g. quantum dots [10], to the
more device focused ones, e.g. ceramic tiles [11].
3.2. HIGH-PERFORMANCE SOLAR CELLS
Research laboratories have for many years produced
high-performance solar cells with efficiencies up to 25-40 %.
One approach is to use materials with higher purity and to
eliminate the impurities along in the process. The back surface
can be passivated with silicon oxide and amorphous silicon to
minimize recombination losses at the surfaces and contacts.
Furthermore, textured surfaces and buried contacts with
minimal shading reduce optical losses. The total production is
very expensive.
High-performance solar cells may also be made as solar cell
concentrators or concentrated photovoltaic (CPV) cells. The
highest solar cell efficiency for a CPV cell is currently 46.0 %
in 2016 (see Fig.3).
3.3. ABSORBING NON-VISIBLE SOLAR RADIATION
A system for harvesting solar radiation has been developed,
using small organic molecules that are tuned to absorb specific
non-visible wavelengths (i.e. ultraviolet and near infrared) of
solar radiation and letting the visible solar radiation pass
straight through (Fig.4), thus resulting in a solar cell able to
produce electricity while still allowing people to see through a
clear glass with no colour distortions [12]. Thereby, solar
energy may be harvested by windows which apparently look
like normal and clear windows.
Fig.4. Solar harvesting tuned to absorb specific non-visible
wavelengths of solar radiation and letting visible solar radiation pass
straight through [12].
3.4. SANDWICH SOLAR CELLS
Sandwich or stack solar cells use several different material
layers and cells with different spectral absorbances to harvest
as much as possible of the solar radiation in a wide wavelength
range. As an example, Fig.5 [13] shows a triple solar cell that
has a top cell layer which absorbs the blue light and allows the
other wavelength parts of the solar radiation to pass through.
The green and yellow light ranges are then absorbed by the
middle cell layer, and the red light is absorbed by the bottom
cell layer. Hence, a much larger portion of the solar radiation
may be utilized.

Jelle et al. (2016) A Review of Materials Science Research Pathways and Opportunities for Building Integrated Photovoltaics
85 Journal of Energy Challenges and Mechanics ©2016
Fig.5. A triple solar cell with its configuration (top) and spectral
responses (bottom) [13].
3.5. POLYMER SOLAR CELLS
Ultra-low cost and low-medium efficiency organic based
modules are based on dye sensitized solar cells (DSSC),
extremely thin absorbers, organic polymer cells and others.
Organic semiconductors are less expensive than inorganic
ones. The highest reported efficiency for an organic solar cell
(with the exception of DSSC) was 6.5 % in 2007 and has now
reached 11.5 % in 2016 (see Fig.3). However, polymer solar
cells are more sensitive to degradation, where ultraviolet solar
radiaion and oxygen from the atmosphere may oxidize the
organic layer.
3.6. DYE SENSITIZED SOLAR CELLS
Dye sensitized solar cells (DSSC) have solar radiation
absorbing dyes usually deposited onto a titanium dioxide
(TiO2) substrate material like in the Grätzel solar cell. The
schematic structure and band diagram for DSSC are depicted
in Fig.6 [14,15].
The DSSC technology is often compared with and stated to
imitate the photosynthesis, and is by Grätzel called ”the
artificial leaf”. The cells absorb across the visible spectrum
and therefore lead to an increased efficiency ranging from 7 %
under direct solar irradiation (AM1.5) and up to 11 % in
diffuse daylight. The TiO2 material is a renewable and
non-toxic white mineral, thus giving smaller environmental
impacts, where an easy manufacturing process contributes to
lower costs. The reduced production costs and the decreased
environmental impacts result in shorter energy and
economical payback time, and therefore makes the DSSC
technology very promising. The market share for this
technology is still very small, but it is expected to rise and may
achieve a great influence in the future.
Fig.6. DSSC schematic structure (top [14]) and band diagram (top
[14] and bottom [15]).
3.7. ANTENNA-SENSITIZER SOLAR CELLS
So-called solar cell ”antennas” may harvest several
wavelengths, i.e. a much broader spectrum of the solar
radiation. This technology concept may also be compared to
the more ”traditional” sandwich solar cells. ”The use of
antenna-sensitizer molecular devices may constitute a viable
strategy to overcome problems of light harvesting efficiency
in the spectral sensitization of wide-bandgap semiconductors.”
[16]. A principle drawing of an antenna-sensitizer solar cell
example is depicted in Fig.7 [16].
Fig.7. Illustrative representation of the adsorption mode of the
trinuclear complex on the TiO2 surface (left) and block diagram
showing the function of the trinuclear complex as an
antenna-sensitizer molecular device (right) [16].
3.8. CIGS AND CdTe SOLAR CELLS
Flexible and lightweight CIGS (copper indium gallium
selenide) and cadmium telluride (CdTe) solar devices are
shown in Fig.8 (principle configuration drawings) and Fig.9
(photos of actual devices), and have yielded an active area
efficiency of 14.7 % and 9.4 %, respectively [17]. These
flexible and lightweight devices increase the integration

Jelle et al. (2016) A Review of Materials Science Research Pathways and Opportunities for Building Integrated Photovoltaics
86 Journal of Energy Challenges and Mechanics ©2016
flexibility and allow building integration in structures which
can not take the additional load of heavy and rigid glass
laminated solar modules. ”The flexible solar modules can be
laminated to building elements such as flat roof membranes,
tiles or metallic covers without adding weight and thus, the
installation costs can be reduced significantly.” [17].
Fig.8. Schematic configuration build-up of CIGS (left) and CdTe
(right) thin film solar cells [17].
Fig.9. Photos of flexible CIGS (left) and CdTe (right) solar cells on
polyimide substrates [17].
The flexibility of CIGS solar cells is also noted by others,
e.g. quoting ”Thanks to flexible lamination, CIGS solar cells
now have the ability to both realize their potential as the most
efficient thin film technology and to dominate the
building-integrated photovoltaics (BIPV) market in the
future” [18]. A bending test carried out on a CIGS solar cell on
flexible borosilicate ultra-thin glass substrate (100 m) is
shown in Fig.10 [19].
Fig.10. Bending test of a CIGS solar cell on flexible borosilicate
ultra-thin glass substrate (100 m) [19].
3.9. QUANTUM DOT SOLAR CELLS
Experimental investigations carried out by Semonin et al.
[10] have reported photocurrent quantum efficiencies
exceeding 100 % in a quantum dot solar cell, being enabled by
multiple exciton generation (MEG). The MEG process may
occur in semiconductor nanocrystals or quantum dots where
absorption of a photon with at least twice the bandgap energy
creates two or more electron-hole pairs. In Fig.11 there are
shown scanning electron microscope images of TiO2 nanorods
and cadmium sulfide (CdS) quantum dots [20]. For further
details, including charge transfer processes between CdS and
TiO2 in a quantum dot nanowire based solar cell, it is referred
to the review by Badawy [20]. Hence, miscellaneous new and
exciting discoveries within solar cell research may with time
find its way into the PV and BIPV systems for the buildings of
tomorrow.
Fig.11. Field-emission scanning electron microscope (FESEM)
images of (a) TiO2 nanorod array (top view), (b) cross-sectional SEM
image of TiO2 nanorod array grown on FTO (fluorinated tin oxide),
(c) top and (d) cross-sectional view of CdS quantum dots coated on a
TiO2 nanorod array [20].
3.10. SOLAR CELL CONCENTRATORS
It is possible to envision to be able to make an exterior
surface capable of harvesting as much solar energy as if the
whole exterior surface was covered with a PV material, while
in fact the actual PV material surface is considerably smaller
and located somewhat beneath the exterior surface, hence
reducing the PV material costs. This may be viewed as a
special built-in concentrator system integrated within the PV
surface. Hence, the idea may then be to fabricate a ”solar
concentrator” at a microscopic material level embedded in the
solar cell surface and beneath [5].
A luminescent solar concentrator (LSC) example is
depicted in the illustrations given in Fig.12 [21], where first
dye-doped polymethylmethacrylate (PMMA) plates were
prepared by an in-situ polymerization method and thereafter
crystalline silicon solar cells were mounted to the as-prepared
dye-doped PMMA plates.
Fig.12. Illustration of a luminescent solar concentrator with (a)
side-mounted and (b) bottom-mounted solar cells [21].
Naturally, for solar cell concentrators to be applied as BIPV,
it is crucial to make the concentrator dimensions as small as
possible, e.g. with respect to the total thickness.
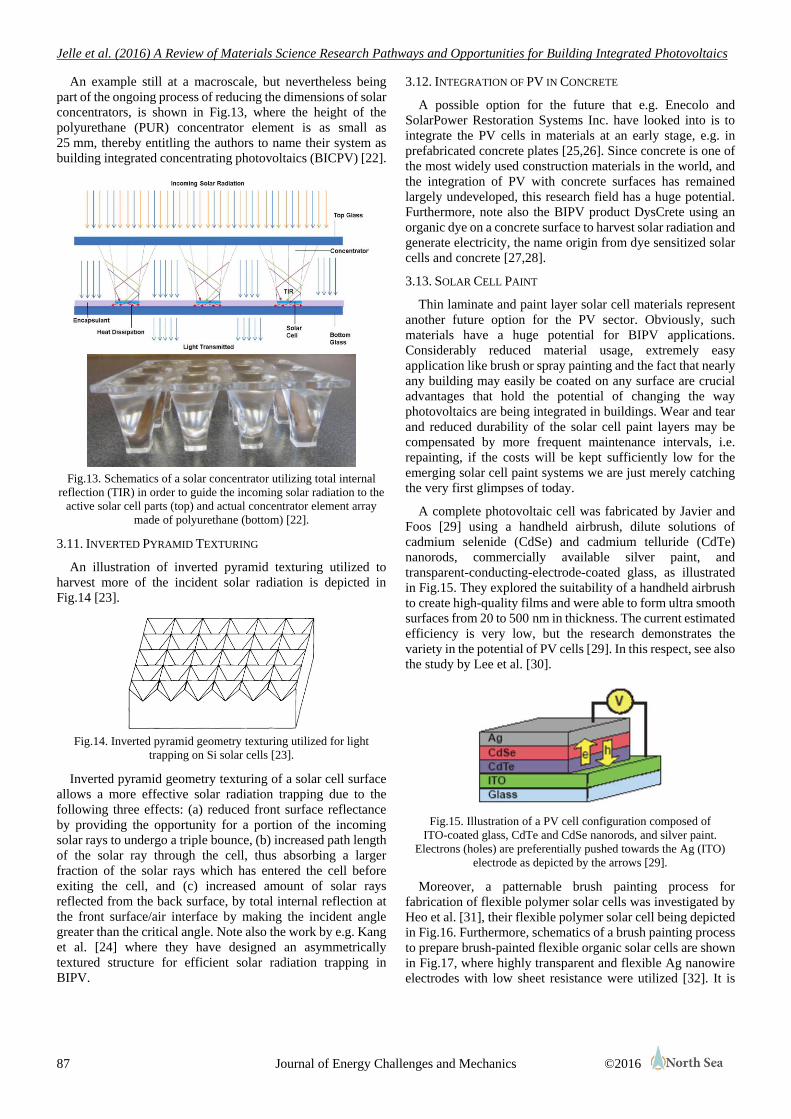
Jelle et al. (2016) A Review of Materials Science Research Pathways and Opportunities for Building Integrated Photovoltaics
87 Journal of Energy Challenges and Mechanics ©2016
An example still at a macroscale, but nevertheless being
part of the ongoing process of reducing the dimensions of solar
concentrators, is shown in Fig.13, where the height of the
polyurethane (PUR) concentrator element is as small as
25 mm, thereby entitling the authors to name their system as
building integrated concentrating photovoltaics (BICPV) [22].
Fig.13. Schematics of a solar concentrator utilizing total internal
reflection (TIR) in order to guide the incoming solar radiation to the
active solar cell parts (top) and actual concentrator element array
made of polyurethane (bottom) [22].
3.11. INVERTED PYRAMID TEXTURING
An illustration of inverted pyramid texturing utilized to
harvest more of the incident solar radiation is depicted in
Fig.14 [23].
Fig.14. Inverted pyramid geometry texturing utilized for light
trapping on Si solar cells [23].
Inverted pyramid geometry texturing of a solar cell surface
allows a more effective solar radiation trapping due to the
following three effects: (a) reduced front surface reflectance
by providing the opportunity for a portion of the incoming
solar rays to undergo a triple bounce, (b) increased path length
of the solar ray through the cell, thus absorbing a larger
fraction of the solar rays which has entered the cell before
exiting the cell, and (c) increased amount of solar rays
reflected from the back surface, by total internal reflection at
the front surface/air interface by making the incident angle
greater than the critical angle. Note also the work by e.g. Kang
et al. [24] where they have designed an asymmetrically
textured structure for efficient solar radiation trapping in
BIPV.
3.12. INTEGRATION OF PV IN CONCRETE
A possible option for the future that e.g. Enecolo and
SolarPower Restoration Systems Inc. have looked into is to
integrate the PV cells in materials at an early stage, e.g. in
prefabricated concrete plates [25,26]. Since concrete is one of
the most widely used construction materials in the world, and
the integration of PV with concrete surfaces has remained
largely undeveloped, this research field has a huge potential.
Furthermore, note also the BIPV product DysCrete using an
organic dye on a concrete surface to harvest solar radiation and
generate electricity, the name origin from dye sensitized solar
cells and concrete [27,28].
3.13. SOLAR CELL PAINT
Thin laminate and paint layer solar cell materials represent
another future option for the PV sector. Obviously, such
materials have a huge potential for BIPV applications.
Considerably reduced material usage, extremely easy
application like brush or spray painting and the fact that nearly
any building may easily be coated on any surface are crucial
advantages that hold the potential of changing the way
photovoltaics are being integrated in buildings. Wear and tear
and reduced durability of the solar cell paint layers may be
compensated by more frequent maintenance intervals, i.e.
repainting, if the costs will be kept sufficiently low for the
emerging solar cell paint systems we are just merely catching
the very first glimpses of today.
A complete photovoltaic cell was fabricated by Javier and
Foos [29] using a handheld airbrush, dilute solutions of
cadmium selenide (CdSe) and cadmium telluride (CdTe)
nanorods, commercially available silver paint, and
transparent-conducting-electrode-coated glass, as illustrated
in Fig.15. They explored the suitability of a handheld airbrush
to create high-quality films and were able to form ultra smooth
surfaces from 20 to 500 nm in thickness. The current estimated
efficiency is very low, but the research demonstrates the
variety in the potential of PV cells [29]. In this respect, see also
the study by Lee et al. [30].
Fig.15. Illustration of a PV cell configuration composed of
ITO-coated glass, CdTe and CdSe nanorods, and silver paint.
Electrons (holes) are preferentially pushed towards the Ag (ITO)
electrode as depicted by the arrows [29].
Moreover, a patternable brush painting process for
fabrication of flexible polymer solar cells was investigated by
Heo et al. [31], their flexible polymer solar cell being depicted
in Fig.16. Furthermore, schematics of a brush painting process
to prepare brush-painted flexible organic solar cells are shown
in Fig.17, where highly transparent and flexible Ag nanowire
electrodes with low sheet resistance were utilized [32]. It is
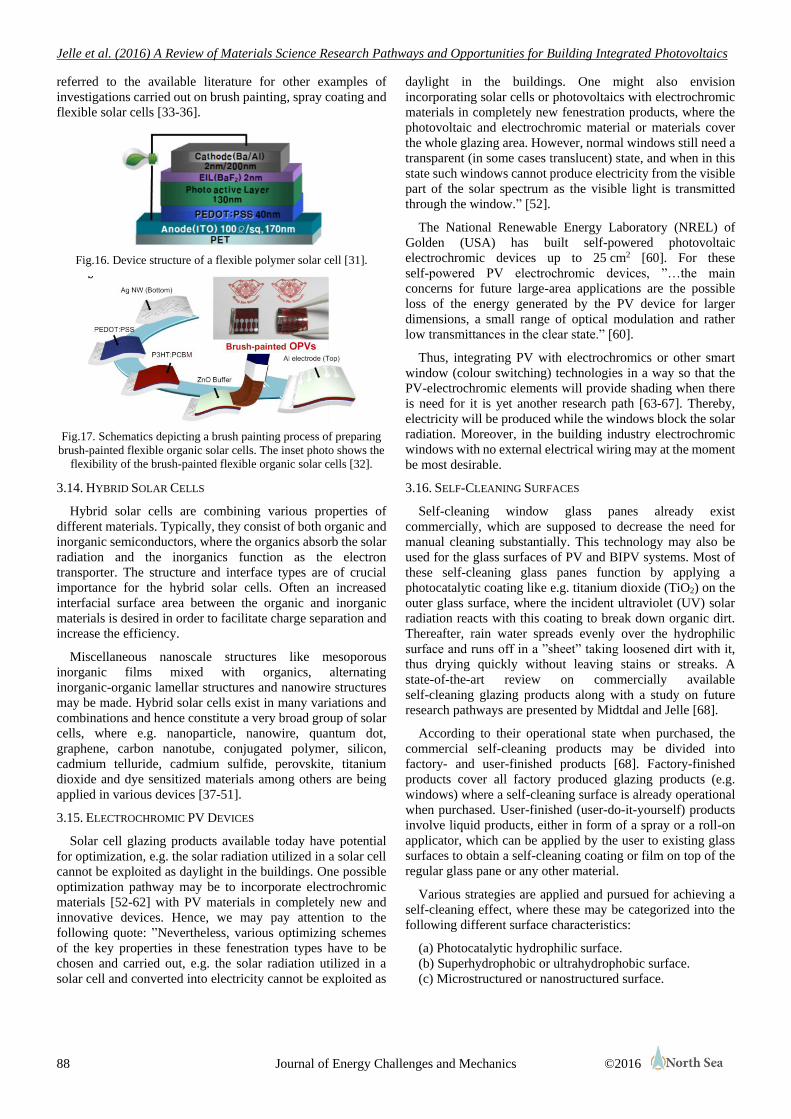
Jelle et al. (2016) A Review of Materials Science Research Pathways and Opportunities for Building Integrated Photovoltaics
88 Journal of Energy Challenges and Mechanics ©2016
referred to the available literature for other examples of
investigations carried out on brush painting, spray coating and
flexible solar cells [33-36].
Fig.16. Device structure of a flexible polymer solar cell [31].
Fig.17. Schematics depicting a brush painting process of preparing
brush-painted flexible organic solar cells. The inset photo shows the
flexibility of the brush-painted flexible organic solar cells [32].
3.14. HYBRID SOLAR CELLS
Hybrid solar cells are combining various properties of
different materials. Typically, they consist of both organic and
inorganic semiconductors, where the organics absorb the solar
radiation and the inorganics function as the electron
transporter. The structure and interface types are of crucial
importance for the hybrid solar cells. Often an increased
interfacial surface area between the organic and inorganic
materials is desired in order to facilitate charge separation and
increase the efficiency.
Miscellaneous nanoscale structures like mesoporous
inorganic films mixed with organics, alternating
inorganic-organic lamellar structures and nanowire structures
may be made. Hybrid solar cells exist in many variations and
combinations and hence constitute a very broad group of solar
cells, where e.g. nanoparticle, nanowire, quantum dot,
graphene, carbon nanotube, conjugated polymer, silicon,
cadmium telluride, cadmium sulfide, perovskite, titanium
dioxide and dye sensitized materials among others are being
applied in various devices [37-51].
3.15. ELECTROCHROMIC PV DEVICES
Solar cell glazing products available today have potential
for optimization, e.g. the solar radiation utilized in a solar cell
cannot be exploited as daylight in the buildings. One possible
optimization pathway may be to incorporate electrochromic
materials [52-62] with PV materials in completely new and
innovative devices. Hence, we may pay attention to the
following quote: ”Nevertheless, various optimizing schemes
of the key properties in these fenestration types have to be
chosen and carried out, e.g. the solar radiation utilized in a
solar cell and converted into electricity cannot be exploited as
daylight in the buildings. One might also envision
incorporating solar cells or photovoltaics with electrochromic
materials in completely new fenestration products, where the
photovoltaic and electrochromic material or materials cover
the whole glazing area. However, normal windows still need a
transparent (in some cases translucent) state, and when in this
state such windows cannot produce electricity from the visible
part of the solar spectrum as the visible light is transmitted
through the window.” [52].
The National Renewable Energy Laboratory (NREL) of
Golden (USA) has built self-powered photovoltaic
electrochromic devices up to 25 cm2 [60]. For these
self-powered PV electrochromic devices, ”…the main
concerns for future large-area applications are the possible
loss of the energy generated by the PV device for larger
dimensions, a small range of optical modulation and rather
low transmittances in the clear state.” [60].
Thus, integrating PV with electrochromics or other smart
window (colour switching) technologies in a way so that the
PV-electrochromic elements will provide shading when there
is need for it is yet another research path [63-67]. Thereby,
electricity will be produced while the windows block the solar
radiation. Moreover, in the building industry electrochromic
windows with no external electrical wiring may at the moment
be most desirable.
3.16. SELF-CLEANING SURFACES
Self-cleaning window glass panes already exist
commercially, which are supposed to decrease the need for
manual cleaning substantially. This technology may also be
used for the glass surfaces of PV and BIPV systems. Most of
these self-cleaning glass panes function by applying a
photocatalytic coating like e.g. titanium dioxide (TiO2) on the
outer glass surface, where the incident ultraviolet (UV) solar
radiation reacts with this coating to break down organic dirt.
Thereafter, rain water spreads evenly over the hydrophilic
surface and runs off in a ”sheet” taking loosened dirt with it,
thus drying quickly without leaving stains or streaks. A
state-of-the-art review on commercially available
self-cleaning glazing products along with a study on future
research pathways are presented by Midtdal and Jelle [68].
According to their operational state when purchased, the
commercial self-cleaning products may be divided into
factory- and user-finished products [68]. Factory-finished
products cover all factory produced glazing products (e.g.
windows) where a self-cleaning surface is already operational
when purchased. User-finished (user-do-it-yourself) products
involve liquid products, either in form of a spray or a roll-on
applicator, which can be applied by the user to existing glass
surfaces to obtain a self-cleaning coating or film on top of the
regular glass pane or any other material.
Various strategies are applied and pursued for achieving a
self-cleaning effect, where these may be categorized into the
following different surface characteristics:
(a) Photocatalytic hydrophilic surface.
(b) Superhydrophobic or ultrahydrophobic surface.
(c) Microstructured or nanostructured surface.

Jelle et al. (2016) A Review of Materials Science Research Pathways and Opportunities for Building Integrated Photovoltaics
89 Journal of Energy Challenges and Mechanics ©2016
Commercial factory-finished self-cleaning products are
most often based on photocatalytic hydrophilic coatings or
surfaces, whereas user-finished self-cleaning products are
normally based on the creation of hydrophobic coatings on the
desired surfaces.
In the following we will learn that there exists an important
correlation between superhydrophobicity and a structured
coarseness of a surface, whereupon the term icephobicity will
also be discussed. As a general rule of thumb, the coarseness
dimensions of the structured self-cleaning surface should be
smaller than the dirt particles to be removed by the
self-cleaning effect.
3.17. SUPERHYDROPHOBIC AND ICEPHOBIC SURFACES
Superhydrophobicity, icephobicity and similar aspects on
how to avoid snow and ice formation on the solar cell surfaces
will be among the important issues to address. In Fig.18
[69,70] this challenge is shown, as depending on the climate
conditions, snow and ice may stick to smooth glass surfaces
for large inclination angles and even for vertical surfaces.
Fig.18. Snow/ice slab firmly sticking to the glass surface of an
insulated window pane even at an inclination angle of 90° during a
laboratory experiment (left). Snow covering a solar cell panel at an
inclination angle of 70° (right) [69,70].
Hydrophobicity is an often used measure of the repellent
nature of a surface, and then especially to repel water. A
completely hydrophobic surface has a water contact angle of
180°, whereas a completely hydrophilic surface has a water
contact angle of 0°. A surface is considered as hydrophilic for
water contact angles below 90°, hydrophobic above 90°,
superhydrophilic below 5° (within 0.5 s or less) and
superhydrophobic above 150° [71-74].
The hydrophobicity of a surface will be dependent upon (i)
the micro- and nanoscale coarseness of the surface, and (ii) the
surface energy of the surface, where the former one may be
considered as a mechanical property and the latter one as a
chemical property, respectively. In general, a micro- or
nanoscale coarse surface and a low surface energy will give a
hydrophobic surface. A low surface energy can be achieved by
use of reactive molecules mainly classified into four
categories, i.e. fluorinated molecules, alkyl molecules,
non-fluorinated polymers and silicon/silane compounds
[73,75].
A surface’s coarseness on a micro- and nanoscale has a
direct influence on its repellent and hydrophobic properties.
The wetting states of a liquid drop placed on a surface are
illustrated in Fig.19 depicting a smooth surface (where contact
angle measure is shown), the Wenzel state, the Cassie-Baxter
state and a combined state [76], where the Cassie-Baxter state
represents the superhydrophobic state where liquid drops are
repelled as spheres from the surface (large contact angle). In
the Wenzel state the liquid (water) drops are impaled by the
nanorods (or similar structure) on the surface, while in the
Cassie-Baxter state the liquid drops are resting on top of the
nanorods with trapped air pockets beneath between the
nanorods.
Fig.19. Wetting states of a liquid drop to a surface: (a) drop on a
smooth surface (contact angle measure is illustrated), (b) Wenzel
state, (c) Cassie-Baxter state, and (d) combined state [76].
In Fig.20 there is given an overview of the timeline of major
advances in the area of liquid repellency, including advances
in theory, polymer and surface chemistry, development of
superhydrophobic surfaces (SHS), slippery liquid-infused
porous surfaces (SLIPS), polydimethylsiloxane (PDMS) and
polytetrafluoroethylene (PTFE) [77].
Fig.20. Timeline of major advances in the area of liquid repellency
(enlarge digitally to see details) [77].
Examples of natural water-repellent leaf surfaces and
artificially fabricated superhydrophobic surfaces are given in
Fig.21 [78,79].
Fig.21. Micromorphologies for water-repellent leaf surfaces of (a)
Nelumbo nucifera and (b) Lupinuspolyphyllos (scale bars = 50 m),
and (c) Gladioluswatsonioides and (d) Sinarundinaria nitida (scale
bars = 20 m) (left four photos) [78]. Images of four artificially
fabricated hollow hybrid superhydrophobic surfaces (scale bars =
50 m) (right four photos) [79].
Several of the same principles may be applied for anti-icing
investigations as for self-cleaning aspects, in particular
superhydrophobicity and structured surface coarseness effects,

Jelle et al. (2016) A Review of Materials Science Research Pathways and Opportunities for Building Integrated Photovoltaics
90 Journal of Energy Challenges and Mechanics ©2016
hence the term icephobicity has been introduced and is now in
common usage. Anti-icing coating design cases with various
roughness scales, including microscale roughness, nanoscale
roughness and hierarchical roughness (combination of both
micro- and nanoscale) are illustrated in Fig.22 [80].
Fig.22. Anti-icing coating design cases with roughnesses Rn
nanoscale, Rm microscale, and Rh hierarchical [80].
In Fig.23 there are shown micrographs of various surface
structures for icephobicity, depicting nanocones, nanopits,
micropillars and micropillars with embedded nanotextures
[81]. Furthermore, Fig.23 also shows the effects of a
nano-fluorocarbon coating on icing processes, where the water
droplets on the coated surface have a much smaller contact
area to the superhydrophobic surface, i.e. water spheres due to
the large contact angle caused by the superhydrophobicity,
resulting in a much longer starting time for icing and also a
much longer total time needed to complete the whole icing
process for the superhydrophobic surface than for the
non-coated plain surface [82].
Fig.23. (Top) Micrographs showing relevant length scales and
structures utilized in single-tier and multi-tier structures for
icephobicity: (a) etched Si nanocones, (b) etched SiO2 nanopits, (c)
etched SiO2 micropillars, and (d) etched Si micropillars/nanotextures
with the nanotexture depicted in the inset image [81]. (Bottom) Icing
process of a water droplet on a plain copper surface (top) and a
nano-fluorocarbon coated surface (bottom) [82].
The task of preventing snow and ice formation involves
other crucial aspects than merely removal of dirt and water
from these surfaces. Freezing of water below 0°C represents a
huge obstacle or challenge in this respect, which in some cases
is further complicated by in general possible moisture
condensation from surrounding air and subsequent freezing on
the surfaces. Although many promising results have been
achieved, e.g. for prolonged freezing delays on
superhydrophobic surfaces, there is still much research to be
carried out before practical and efficient snow and ice
avoiding/repelling surfaces for a full range of outdoor weather
exposure conditions have been accomplished.
An interesting research pathway may be to investigate if it is
possible to make some sort of force field solution. That is, to
envision a force field which could repel all snow crystals
already before they are impacting onto the solar cell surfaces,
in addition to prevent any ice formation on the exterior
surfaces (e.g. rain which freezes, and condensation and
freezing processes from moisture in the ambient air). Hence,
one has to ask what kind of force field this could be, which in
addition is (ideally) not using extra energy. An electric or
magnetic force field, or a combination of these, either static or
dynamic, may be investigated. Or could something entirely
different be envisioned? In order to be able to repel the snow
crystals one may explore if the dipolarity in water molecules
may be taken advantage of and utilized, even in solid state as
snow and ice and not as liquid water, or the various transition
states (gas, liquid and solid state) at the solar cell surfaces.
Natural, biological superhydrophobic surfaces like e.g.
plant leaves and insect wings when damaged may regenerate
their surfaces by biological growth processes and are therefore
able to maintain their superhydrophobicity over their whole
lifetime. Thus, one may ask if it could be possible to make
artificial superhydrophobic surfaces which would
continuously regenerate their surface patterns and thereby
retain their superhydrophobic properties, i.e. self-healing,
self-repairing or self-regenerating superhydrophobic surfaces.
3.18. FINAL REMARKS
As new building materials and components are being
developed, including BIPV materials, it is of major
importance to investigate the durability of these materials, e.g.
by carrying out accelerated climate ageing in the laboratory
[83]. Furthermore, conducting a robustness assessment of
these materials and components may also be found to be
beneficial [84]. Finally, it seems appropriate to end this with
the following vision from Richard Lunt at Michigan State
University: ”Ultimately, we want to make solar harvesting
surfaces that you don’t even know are there.” [12].
IV. CONCLUSIONS
Various research pathways and opportunities for building
integrated photovoltaics (BIPV) from a materials science
viewpoint are explored. Continued research and development
within both PV and BIPV materials and technologies will
improve the BIPV solutions in the coming years, e.g. with
respect to solar cell efficiency, environmental aspects,
robustness, long-term durability versus climate exposure,
production costs and miscellaneous building integration
aspects. Easily applicable and flexible solutions like e.g. paint
applications of PV cells and bendable solar cells are among the
future visions for BIPV.

Jelle et al. (2016) A Review of Materials Science Research Pathways and Opportunities for Building Integrated Photovoltaics
91 Journal of Energy Challenges and Mechanics ©2016
ACKNOWLEDGEMENTS
This work has been supported by the Research Council of
Norway and several partners through the research projects
”Building Integrated Photovoltaics for Norway” (BIPV
Norway) and ”The Research Centre on Zero Emission
Buildings” (ZEB).
REFERENCES
[1] Solar Thermal Magazine, October 23, 2010,
<http://www.solarthermalmagazine.com/2010/10/23/the
-curved-solar-power-rooftop-tile-homeowners-now-hav
e-better-looking-options/>, 2010 (accessed November 8,
2011).
[2] Applied Solar,
<http://www.appliedsolar.com/roofingsystems/roofingti
les.php>, 2010 (accessed December 9, 2010).
[3] SRS Energy,
<http://www.srsenergy.com/maint/files/SPT16%20Tech
nical%20Specifications%20090310.pdf>, 2010
(accessed October 5, 2010).
[4] Solar Century,
<http://www.solarcentury.co.uk/installers-and-roofers/p
roducts/solar-tiles/c21e-solar-roof-tiles/>, 2011
(accessed December 14, 2011).
[5] B.P. Jelle, C. Breivik and H.D. Røkenes, Solar Energy
Materials and Solar Cells, 100, 69-96, 2012.
[6] B.P. Jelle and C. Breivik, Energy Procedia, 20, 68-77, 2012.
[7] B.P. Jelle and C. Breivik, Energy Procedia, 20, 78-87, 2012.
[8] B.P. Jelle, Energies, 9, 1-30, Article no. 21, 2016.
[9] NREL, Best research-cell efficiencies, Rev. 04-20-2016,
<http://www.nrel.gov/ncpv/images/efficiency_chart.jpg
>, 2016 (accessed April 20, 2016).
[10] O.E. Semonin, J.M. Luther, S. Choi, H.-Y. Chen, J. Gao,
A.J. Nozik and M.C. Beard, Science, 334, 1530-1533,
2011.
[11] Y.-C. Huang, C.-C. Chan, S.-J. Wang and S.-K. Lee,
Energy Procedia, 61, 1874-1878, 2014.
[12] A. Mourant, ”BIPV: Better form, improved function”,
Renewable Energy Focus, September/October 2014.
[13] The German Energy Society (DGS), ”Planning and
installing photovoltaic systems - A guide for installers,
Architects and Engineers”, Earthscan, 2008.
[14] M.L. Parisi, S. Maranghi and R. Basosi, Renewable and
Sustainable Energy Reviews, 39, 124-138, 2014.
[15] V. Sugathan, E. John and K. Sudhakar, Renewable and
Sustainable Energy Reviews, 52, 54-64, 2015.
[16] R. Amadelli, R. Argazzi, C.A. Bignozzi and F. Scandola,
Journal of the American Chemical Society, 112,
7099-7103, 1990.
[17] S. Buecheler, A. Chirilă, J. Perrenoud, L. Kranz, C.
Gretener, P. Blösch, F. Pianezzi, S. Seyrling and A.N.
Tiwari, ”Flexible and lightweight solar modules for new
concepts in building integrated photovoltaics”, in:
Proceedings of the CISBAT, Lausanne, Switzerland,
September 14-16, 2011.
[18] B. Stuart, ”CIGS cells to ”dominate” future BIPV
market”, PV Magazine,
<http://www.pv-magazine.com/news/details/beitrag/cigs
-cells-to-dominate-future-bipv-market_100001483/>,
November 1, 2010 (accessed February 9, 2012).
[19] A. Gerthoffer, F. Roux, F. Emieux, P. Faucherand, H.
Fournier, L. Grenet and S. Perraud, Thin Solid Films,
592: Part A, 99-104, 2015.
[20] W.A. Badawy, Journal of Advanced Research, 6,
123-132, 2015.
[21] Y. Zhang, S. Sun, R. Kang, J. Zhang, N. Zhang, W. Yan,
W. Xie, J. Ding, J. Bao and C. Gao, Energy Conversion
and Management, 95, 187-192, 2015.
[22] H. Baig, N. Sellami and T.K. Mallick, Solar Energy
Materials and Solar Cells, 134, 29-44, 2015.
[23] A.W. Smith and A. Rohatgi, Solar Energy Materials and
Solar Cells, 29, 37-49, 1993.
[24] J. Kang, C. Cho and J.-Y. Lee, Organic Electronics, 26,
61-65, 2015.
[25] D. Prasad and M. Snow, ”Designing with solar power - A
source book for building integrated photovoltaics
(BiPV)”, The Images Publishing Group Pty Ltd and
Earthscan, London, 2005.
[26] SolarPower Restoration Systems Inc., ”Solar seal PV
concrete system”,
<http://www.solarpower-restoration.com/solar-seal-pv-c
oncrete-system.html>, (not dated) 2011 (accessed
December 9, 2011).
[27] DysCrete, ”DysCrete: Power from concrete”,
<http://becquerelinstitute.org/dyscrete-power-from-conc
rete/>, 2015 (accessed July 30, 2015).
[28] DysCrete, ”DysCrete - Experimental energy production
systems”,
<http://www.baukunsterfinden.org/en/research/projects/
dyscrete-energy-production-systems/>, 2015 (accessed
July 30, 2015).
[29] A. Javier and E.E. Foos, IEEE Transactions on
Nanotechnology, 8, 569-573, 2009.
[30] J.-H. Lee, H.-S. Shin, Y.-J. Noh, S.-I. Na and H.-K. Kim,
Solar Energy Materials and Solar Cells, 114, 15-23,
2013.
[31] S.-W. Heo, J.-Y. Lee, H.-J. Song, J.-R. Ku and D.-K.
Moon, Solar Energy Materials and Solar Cells, 95,
3041-3046, 2011.
[32] S.-B. Kang, Y.-J. Noh, S.-I. Na and H.-K. Kim, Solar
Energy Materials and Solar Cells, 122, 152-157, 2014.
[33] D.-Y. Cho, K. Eun, S.-H. Choa and H.-K. Kim, Carbon,
66, 530-538, 2014.
[34] Y.-J. Kang, D.-G. Kim, J.-K. Kim, W.-Y. Jin and J.-W.
Kang, Organic Electronics, 15, 2173-2177, 2014.
[35] S.-S. Kim, S.-I. Na, S.-J. Kang and D.-Y. Kim, Solar
Energy Materials and Solar Cells, 94, 171-175, 2010.
[36] J.-W. Lim, D.-Y. Cho, Jihoon-Kim, S.-I. Na and H.-K.
Kim, Solar Energy Materials and Solar Cells, 107,
348-354, 2012.
[37] Q. Liu, T. Ohki, D. Liu, H. Sugawara, R. Ishikawa, K.
Ueno and H. Shirai, Nano Energy, 11, 260-266, 2015.
[38] N. Chehata, A. Ltaief, E. Beyou, B. Ilahi, B. Salem, T.
Baron, P. Gentile, H. Maaref and A. Bouazizi, Journal of
Luminescence, 168, 315-324, 2015.

Jelle et al. (2016) A Review of Materials Science Research Pathways and Opportunities for Building Integrated Photovoltaics
92 Journal of Energy Challenges and Mechanics ©2016
[39] Z. Ge, L. Xu, R. Zhang, Z. Xue, H. Wang, J. Xu, Y. Yu,
W. Su, Z. Ma and K. Chen, Applied Surface Science,
334, 15-18, 2015.
[40] F. Cao, H. Wang, Z. Xia, X. Dai, S. Cong, C. Dong, B.
Sun, Y. Lou, Y. Sun, J. Zhao and G. Zou, Materials
Chemistry and Physics, 149-150, 124-128, 2015.
[41] I. Mihalache, A. Radoi, M. Mihaila, C. Munteanu, A.
Marin, M. Danila, M. Kusko and C. Kusko,
Electrochimica Acta, 153, 306-315, 2015.
[42] P. Yu, S. Qu, C. Jia, K. Liu and F. Tan, Materials Letters,
157, 235-238, 2015.
[43] T. Kim, Y. Gao, H. Hu, B. Yan, Z. Ning, L.K.
Jagadamma, K. Zhao, A.R. Kirmani, J. Eid, M.M.
Adachi, E.H. Sargent, P.M. Beaujuge and A. Amassian,
Nano Energy, 17, 196-205, 2015.
[44] X. Ren, X. Li and W.C.H. Choy, Nano Energy, 17,
187-195, 2015.
[45] X.-P. Cui, K.-J. Jiang, J.-H. Huang, Q.-Q. Zhang, M.-J.
Su, L.-M. Yang, Y.-L. Song and X.-Q. Zhou, Synthetic
Metals, 209, 247-250, 2015.
[46] W. Yan, Y. Li, Y. Li, S. Ye, Z. Liu, S. Wang, Z. Bian and
C. Huang, Nano Energy, 16, 428-437, 2015.
[47] K. Wang, C. Liu, P. Du, L. Chen, J. Zhu, A. Karim and X.
Gong, Organic Electronics, 21, 19-26, 2015.
[48] T. Segal-Peretz, O. Sorias, M. Moshonov, I. Deckman,
M. Orenstein and G.L. Frey, Organic Electronics, 23,
144-150, 2015.
[49] W. Jaimes, G. Alvarado-Tenorio, C. Martinez-Alonso, A.
Quevedo-López, H. Hu and M.E. Nicho, Materials
Science in Semiconductor Processing, 37, 259-265,
2015.
[50] U. Mehmood, I.A. Hussein, K. Harrabi, M.B. Mekki, S.
Ahmed and N. Tabet, Solar Energy Materials and Solar
Cells, 140, 174-179, 2015.
[51] U. Dasgupta, A. Bera and A.J. Pal, Solar Energy
Materials and Solar Cells, 143, 319-325, 2015.
[52] B.P. Jelle, A. Hynd, A. Gustavsen, D. Arasteh, H. Goudey
and R. Hart, Solar Energy Materials and Solar Cells, 96,
1-28, 2012.
[53] B.P. Jelle and G. Hagen, Journal of The Electrochemical
Society, 140, 3560-3564, 1993.
[54] C.G. Granqvist, ”Handbook of inorganic electrochromic
materials”, Elsevier, Amsterdam, 1995.
[55] P.M.S. Monk, R.J. Mortimer and D.R. Rosseinsky,
”Electrochromism: Fundamentals and applications”,
VCH, 1995.
[56] B.P. Jelle, G. Hagen and Ø. Birketveit, Journal of Applied
Electrochemistry, 28, 483-489, 1998.
[57] B.P. Jelle and G. Hagen, Journal of Applied
Electrochemistry, 28, 1061-1065, 1998.
[58] B.P. Jelle and G. Hagen, Solar Energy Materials and Solar
Cells, 58, 277-286, 1999.
[59] B.P. Jelle, A. Gustavsen, T.-N. Nilsen and T. Jacobsen,
Solar Energy Materials and Solar Cells, 91, 342-354,
2007.
[60] R. Baetens, B.P. Jelle and A. Gustavsen, Solar Energy
Materials and Solar Cells, 94, 87-105, 2010.
[61] B.P. Jelle, Solar Energy Materials and Solar Cells, 116,
291-323, 2013.
[62] R.J. Mortimer, D.R. Rosseinsky and P.M.S. Monk (Eds.),
”Electrochromic materials and devices”, Wiley-VCH,
2015.
[63] J.N. Bullock, C. Bechinger, D.K. Benson and H.M.
Branz, Journal of Non-Crystalline Solids, 198-200,
1163-1167, 1996.
[64] W. Gao, S.H. Lee, J. Bullock, Y. Xu, D.K. Benson, S.
Morrison and H.M. Branz, Solar Energy Materials and
Solar Cells, 59, 243-254, 1999.
[65] S.K. Deb, S.-H. Lee, C. Edwin Tracy, J. Roland Pitts,
B.A. Gregg and H.M. Branz, Electrochimica Acta, 46,
2125-2130, 2001.
[66] C.M. Lampert, Solar Energy Materials and Solar Cells,
76, 489-499, 2003.
[67] K.-S. Ahn, S.J. Yoo, M.-S. Kang, J.-W. Lee and Y.-E.
Sung, Journal of Power Sources, 168, 533-536, 2007.
[68] K. Midtdal and B.P. Jelle, Solar Energy Materials and
Solar Cells, 109, 126-141, 2013.
[69] B.P. Jelle, Energy and Buildings, 67, 334-351, 2013.
[70] B.P. Jelle, T. Gao, S.A. Mofid, T. Kolås, P.M. Stenstad and
S. Ng, Procedia Engineering, 145, 699-706, 2016.
[71] N.J. Shirtcliffe, G. McHale, S. Atherton and M.I. Newton,
Advances in Colloid and Interface Science, 161,
124-138, 2010.
[72] V. Hejazi, K. Sobolev and M. Nosonovsky, Scientific
Reports, 3:2194, 1-6, 2013.
[73] L. Yao and J. He, Progress in Material Science, 61,
94-143, 2014.
[74] P. Zhang and F.Y. Lv, Energy, 82, 1068-1087, 2015.
[75] C.-H. Xue, S.-T. Jia, J. Zhang and J.-Z. Ma, Science and
Technology of Advanced Materials, 11, 1-15, Article
no. 033002, 2010.
[76] C. Antonini, M. Innocenti, T. Horn, M. Marengo and A.
Amirfazli, Cold Regions Science and Technology, 67,
58-67, 2011.
[77] M.J. Kreder, J. Alvarenga, P. Kim and J. Aizenberg,
Nature Reviews Materials, 1, 1-15, Article no. 15003,
2016.
[78] S.-H. Hsu, K. Woan and W. Sigmund, Materials Science
and Engineering R, 72, 189-201, 2011.
[79] S. Dash, M.T. Alt and S.V. Garimella, Langmuir, 28,
9606-9615, 2012.
[80] J. Xiao and S. Chaudhuri, Langmuir, 28, 4434-4446,
2012.
[81] T.M. Schutzius, S. Jung, T. Maitra, P. Eberle, C.
Antonini, C. Stamatopoulos and D. Poulikakos,
Langmuir, 31, 4807-4821, 2015.
[82] H. Wang, G. He and Q. Tian, Applied Surface Science,
258, 7219-7224, 2012.
[83] B.P. Jelle, Journal of Materials Science, 47, 6475-6496,
2012.
[84] B.P. Jelle, E. Sveipe, E. Wegger, A. Gustavsen, S.
Grynning, J.V. Thue, B. Time and K.R. Lisø, Journal of
Building Physics, 37, 213-245, 2014.

ISSN 2056-9386
Volume 3 (2016) issue 2, article 7
93 ©2016
Multisided approach for photovoltaics regulated
outputs: computer-based simulations
多片面光伏稳压输出:基于计算机的模拟
Janvier Kamanzi1*, Mohamed Kahn2
1,2Centre for Distributed Power and Electronic Systems, Cape Peninsula University of Technology, Cape Town 7535, SA
Accepted for publication on 2 September 2015
Abstract – The world is experiencing unprecedented moments
of energy crisis along with its associated aftermath. However,
solutions sought in renewable energy sources have not been
optimally exploited, and this the case of solar-based sources that
use Photovoltaics (PVs) as an energy conversion platform.
Through computer-based simulations, this article shows, in
accurate figures, the extent of the effects of using the classic
single fixed-tilt solar panels; and investigated multisided PV
systems in order to provide an evenly distributed power as to
address the issue of Gaussian-shaped outputs characteristic of
fixed-tilt panels. Various multisided systems were therefore
studied; and a double-sided PV system, with a 600 junction angle,
was found to be the best in terms of output power level and
smoothness. The study also suggested the adoption of
cylindrical-shaped systems for direct and continuous output
though with a bit lower level than the output of a double-sided
system.
Keywords – Distributed systems, Multisided systems,
Photovoltaics, PV topologies, Renewable energy.
I. INTRODUCTION
The whole world is living an unprecedented time of energy
crisis and its associated aftermath on the society and
environment [1] and solutions have been sought in alternative
primary energy sources. The fossil fuels dominating the pool
of primary energy supply are faced with depletion due to
exponential increase in energy demand in one hand and critics
big role in the alarming global warming and climate change on
the other hand.
The global demand in energy is deemed to double within the
next two decades [2] involving an imminent increase use of
green and renewable energy [3]. In this regard, Global Market
Outlook [4] indicated that solar-based power would increase
from 138.8 GW 2013 figures to 1700 GW within two and half
decades (2030), whereas a further remarkable increase up to
4670 GW would be expected by 2050. In parallel, the author
[4] highlighted there would be an increase in the implantation
of wind supplied power generators with a bit low impact
observable as compared to solar powered generators.
With the sun providing about 2 MWh/m2 to the earth [5],
which is by far higher than any other source of energy [6] and
being by excellence IEA compliant, solar energy has proven
its worth in terms alternative power generation platform for all
the time.
In the context of South Africa, the Department of Energy
(DoE) along with public electricity utility (ESKOM) plus
private companies have made significant progress toward a
full and optimized use of available energy sources and
integration of the latter in the national grid. Policies involving
Independent power producers (IPP) were adopted with regard
to integrating distributed energy sources in electric power
systems [7], [8]. To make this a success, smart techniques for
grid automation and management of power distributed
systems were given a priority research wise [9].
However, with focus on solar energy, low efficiency and
inconsistent power outputs of PV cells remain an intricate
concern to address. This has been a major and longtime
handicap to the adoption of the PV based grid as part of the
countries’ national grids. A lot of studies and initiatives from
various perspectives have been conducted with encouraging
results; of which some have been spotlighted.
Low efficiency improvement has been targeted by much
research in an attempt to make PV technology more viable and
an increase of 5% could be gained by using Magnesium-doped
quantum dot sensitized solar cells [10]. Thin film is another

Kamanzi and Kahn (2016) Multisided Approach for Photovoltaics Regulated Outputs: Computer-based Simulations
94 Journal of Energy Challenges and Mechanic ©2016
technology which was brought forth to increase the PV
efficiency yielding an increase of about 4% [11].
While the efficient is inherent to the scarcity of material
used to manufacture PV cells, another factor lowering the cells
output is external. Solar cells performance reliance to weather
conditions results in a non-uniform power distribution
throughout the day and the year and no much can be done
versus natural conditions.
Nevertheless, the way PV arrays have been used do not take
advantage of the available light for a maximum electrical
energy conversion. PV arrays as traditionally laid on the roof
of buildings at a certain angle can receive the maximum sun
irradiation at noon over a whole day (Figure 1). Moreover, the
sun shuttling between the two tropics yearly exposes the
shortcoming of fixed tilt angle PV approach. Figure 2 shows
combined effect of sun’s daily and yearly apparent movements
on the output power dynamics. The PV output power was
simulated with respect to the irradiance set at 1 kW/m2 for
convenience purposes; the sun moving from one tropic to
another i.e. between -23.450 and 23.450. The sun’s movement
double effect is also shown on a 3D plot in Figure 3. The PV
output power shown in Figure 2 reflects a moderated case with
a minimum of 92 % of the expected output for an observer
located in the equatorial region. With the tropic being the
limits of observation, the best in terms of irradiance will occur
when one tropic is experiencing the solstice whereas the
opposite tropic is at the worse since having the longest night
producing an output drop down to 72% of the nominal output.
The paper aims to address the issue of the Gaussian-shaped
PV output as represented in Figure 1. By ideally considering
that the sun rises at 6 am, the irradiance is null, the PV output
grows up and becomes maximum at noon and falls back to
zero at 6 pm, ideal sunset. Thus, between sunrise and sunset,
the power follows a sine waveform between zero and pi
radians. Mathematically, it can be expressed as per equation 1.
0 ,sinMII (1)
where I is the irradiance, IM , the maximum irradiance and 𝜃, an angle describing the sun’s apparent movement over a day.
Figure 3 shows in 3-D the double effect of the sun’s motion
and the study’s expected outcome. During the day, the power
is expected to be uniform while less may be done to
circumvent the effect of the sun’s shuttle between the two
tropics on the PV output; the worst case still being observed at
poles.
Fig.1, Power distribution for a single classic panel
Fig.2, Simulation of moderated effects of double sun’s apparent
movement on the power
Fig.3, Simulation of the study expected outcome
II. MULTISIDED APPROACH
A multisided PV system approach is one of the possible
solutions to improving PV output based on a possibility such a

Kamanzi and Kahn (2016) Multisided Approach for Photovoltaics Regulated Outputs: Computer-based Simulations
95 Journal of Energy Challenges and Mechanic ©2016
system can exhibit in terms of optimum exposure to the sun at
any moment of the day time (Figure 4). The study therefore
explores various type of PV arrays arrangements and was
referred to a work which was conducted on PV topologies
[12]. The systems’ performance was assessed trough
simulations conducted in Matlab, a scientific and engineering
computing environment.
Assumptions were made for convenience and simplicity
purposes with the aim to ease the understanding of the study
and the interpretation of the results. The irradiance, the power
per unity area produced by the sun, was assumed to be
1kW/m2 and the sides of the PV system to be identical, have
equal area and have a total area of 1m2. Hence, simulated
results on various graphs reflect dynamics in power and
irradiance simultaneously following the sun’s apparent
movement. In the context of this study, a day or day time refers
to the time interval to the night between the sunrise and sunset,
a portion opposed to the night. The study started from a
double-sided PV system, a direct upgrade of a classic
single-sided.
Fig.4, Picture of a tilted multisided PV system
2.1. DOUBLE-SIDED PV SYSTEM
A double-sided PV system was conceived in a way the
structure allows significant and balanced exposure to the sun
from sunrise to sunset. Therefore, the sides of the system were
designed as to have the external angle facing the sun at noon.
Systems with a 1200, 900, 600, 450 and 300 junction angles
respectively were studied and exhibited power performance
according to Figures 5 through 9, including wide and obtuse
angles to make ensure the study is comprehensive.
Fig.5, Power dynamics for a double-sided with 900 junction angle
Fig.6, Power dynamics for a double-sided with 600 junction angle
Fig.7, Power dynamics for a double-sided system with 1200
junction angle
Fig .8, Power dynamics for a double-sided with 450 junction angle

Kamanzi and Kahn (2016) Multisided Approach for Photovoltaics Regulated Outputs: Computer-based Simulations
96 Journal of Energy Challenges and Mechanic ©2016
Fig.9, Power dynamics for a double-sided with 300 junction angle
For the double-sided PV systems, simulation results showed
that systems with 600 junction angle (Figure 6) produce better
power dynamics in terms of steadiness and uniformity of the
output power over the whole day though with a bit lower
average output 0.4715 kW against 0.5259 kW and 0.5644 kW
for systems with 900 (Figure 5) and 1200 (Figure 7) junction
angles respectively and a bit higher than 0.4420 kW and
0.4049 kW for systems with 450 (Figure 8) and 300 (Figure 9)
respectively. The PV systems with 900 and 1200 angles
manifest a remarkable power bump around noon whereas the
remaining two exhibit a depression around the same period,
which is not good for the load and therefore require extra
regulation attention. Also the output power ripple for the 600
angled system is the lowest, 0.067 kW than the rest having
ripples ranging between 0.1261 kW and 0.616 kW. Systems
with further more sides were investigated in the perspective of
improved power dynamics and low ripple rates.
2.2. THREE-SIDED PV SYSTEM
A three-sided PV system should be the first to consider
matching three main parts a day can be divided into, the
morning, the noon and the evening.
This PV system was thought of with one PV side exposed to
the rising sun with a period of 6:00 to 10:00, another between
10:00 and 14:00 whereas the last has to effectively deal with
energy harvesting between 14:00 and 18:00, the sunset time.
PV sides have the same area and are joined at right angles.
Three sided systems with different angles were explored
and their output power simulated in the process of seeking a
system with a much better performance. Therefore, systems
with wider angle than 90, thus a 1200 angled system became
part of the stud and power dynamics plotted in Figures 10 and
11 respectively.
Fig.10, Power dynamics for a three-sided system with right angle
junction
Fig.11, Power dynamics for a three-sided system with 1200 junction
angle
Simulation results obtained from the strategically chosen
three-sided systems showed that systems with 900 junction
angle exhibit more promising output power plot though with
a bit lower average power, 0.4152 kW (Figure 10) than 120
angled systems, 0.5091 (Figure 11), and far away improved
dynamics than systems separated with much wider angles. In
this respect, systems with 900 have a significantly low ripple
rate 29% as compared to 57% of the 1200 angled systems. In
this perspective, it is important to notice that the wider the
angle, the more the system tends to behave like a classic
single-sided PV panel and has an exacerbated amount of
power around noon.
2.3. SYSTEMS WITH A LARGER NUMBER OF SIDES
Systems with a higher number of sided were investigated
namely a four, five, six seven sided and output powers were
plotted in Figures 12 through 16 respectively. These systems
were assumed to have junction angle equivalent to the angle
between the sides of a base of a corresponding half polygon,
i.e. 1350 for a four-sided, 1440 for a five-sided, 1500 for a

Kamanzi and Kahn (2016) Multisided Approach for Photovoltaics Regulated Outputs: Computer-based Simulations
97 Journal of Energy Challenges and Mechanic ©2016
six-sided, 154.50 for a seven-sided and 157.50 for an
eight-sided.
Fig.12, Power dynamics for a four-sided system with 450 junction
angle
Fig.13, Power dynamics for a five-sided system
Fig.14, Power dynamics for a six-sided system
Fig. 15, Power dynamics for a seven-sided system
Fig. 16, Power dynamics for an eight-sided system
The general observation was that the six-sided had a much
more even power distribution, 18% ripple ratio with an
average power of 0.455 kW, followed by the four and
eight-sided systems with 23% and 27% ripple ratios with an
average power of 0.42 kW and 0.46 kW. The five and seven
sided systems’ power dynamics exhibit a huge bump around
noon, due to the presence of a middle panel permanently
exposed to the sun the whole day which is at its peak at noon.
III. SUMMARY OF RESULTS
The results for the studied multisided PV systems are
summarized in Table 1 and presented in graphs for a broad
view and easy comparison. Parameters hereby concerned are
the maximum power, average power, the ripple and ripple
ratio as per Figures 17 through 20. The average power and the
ripple ratio are especially predetermining parameters when it
comes to the output amplitude and smoothness and hold
therefore the key factor for best system selection.
TABLE 1, RESULTS SUMMARY
System-angle Max (kW) Average Ripple- Ripple

Kamanzi and Kahn (2016) Multisided Approach for Photovoltaics Regulated Outputs: Computer-based Simulations
98 Journal of Energy Challenges and Mechanic ©2016
(0) (kW) (kW) (%)
Double (60) 0.500 0.472 0.067 50.0
Double (90) 0.707 0.526 0.354 13.4
Double (120) 0.866 0.564 0.433 71.0
Double (30) 0.500 0.405 0.250 50.0
Double (45) 0.496 0.442 0.126 25.4
Three (90) 0.744 0.636 0.411 29.3
Three(120) 0.667 0.629 0.089 56.7
Four (135) 0.458 0428 0.104 22.8
Five (144) 0.647 0.507 0.339 52.4
Six (150) 0.483 0.455 0.089 18.3
Seven (154.5) 0.642 0.505 0.329 51.2
Eight (157.5) 0.519 0.470 0.142 27.4
Fig.17, Maximum power comparison
Fig.18, Average power comparison
Fig.19, Ripple comparison
Fig.20, Ripple ratio comparison
IV. RESULTS DISCUSSION, ANALYSIS AND
INTERPRETATION
Results for various PV systems investigated produce
similarities regarding some parameters including the
maximum and average output power. Double-sided and
three-sided systems with junction angles greater than 900 have
a maximum output greater than 0.7 kW and an average slightly
greater than 0.5 kW whereas those with junction angle smaller
than 900 supply a maximum of 0.5 kW and an average power
ranging between 0.40 kW and 0.47 kW. In terms of ripple
values, obtuse angles provide smaller ripple ratios and
therefore a smoother output, and a 600 angled PV system was
found to have the best power dynamics and lowest ripple and a
reasonable average output power of about 0.5 kW.
For the rest, the four, the six and eight sided systems proved
to have peak output powers ranging between 0.46 kW and 0.52
kW and an average lying between 0.43 kW and 0.46 kW. The
mentioned systems offer an advantage of good power
distribution, with the 600 angle systems having the lowest
ripple ratio, 18.3%. Though the five and the seven sided can
supply peak output powers greater than 0.64 kW and an
average power a bit greater than 0.5 kW, their ripple ratio is a
setback when it comes to the output smoothness. This is a
general observation with regard to PV systems with an odd
number of sides, same as with half cylinder shaped systems.
However, much regulated power outputs may be obtained
using closed systems such as hollowed polygonal prism and
cylindrical shaped systems (Figure 21). The power dynamics
of such PV topologies were studied and the average output
found to be 0.32 kW out of 1kW PV system nominal power,
findings derived from a work explained in [12] [13]. In this
respect a cylindrical shaped system may provide a perfectly
regulated output power of about 0.32 kW for a total PV area of
1 m2 and an irradiance of 1 kW/m2.
0.7071
0.5
0.866
0.5
0.4957
0.4714
0.6667
0.4583
0.6472
0.483
0.642
0.5186
M A XP O W E R [ KW ]
0.5259
0.4715
0.5644
0.4049
0.442
0.4152
0.5091
0.4283
0.5065
0.455
0.5054
0.4695
A V E R A G E [ K W ]
0.354
0.067
0.616
0.250
0.126
0.138
0.378
0.104
0.339
0.089
0.329
0.142
R I P P L E [ K W ]
50.007
13.400
71.132
50.000
25.439
29.296 56.697
22.780 52.441
18.344
51.246
27.362
R I P P L E R A T I O ( % )

Kamanzi and Kahn (2016) Multisided Approach for Photovoltaics Regulated Outputs: Computer-based Simulations
99 Journal of Energy Challenges and Mechanic ©2016
Fig.21, Cylindrical-shaped PV system
V. CONCLUSION
As a conclusion, from the pool of PV systems hereby
studied, a double-sided system with a 600 junction angle
shows much promise in terms of efficient utilization of sides,
good output power average and smoothness. Come closed PV
systems; hollowed cylindrical-shaped systems prove to be the
best in applications where regulated power is imperative.
REFERENCES
[1] J. P. Holdren and C. Berkeley, “Population and the
Energy Problem,” vol. 12, no. 3, 1991.
[2] G. W. Crabtree and N. S. Lewis, “Solar energy
conversion,” Physics Today, March, pp. 37–42, 2007.
[3] J. Wright and E. E. Africa, “Electrical energy storage
to make wind and solar PV resources disptatchable,”
Energize, Vol.3, June, pp. 54–59, 2015.
[4] F. Photovoltaics, “GLOBAL MARKET,” 2014.
[5] P. R. E. Systems, “The sun shines , but not always …,”
Energize, Vol.3, June, pp. 51–53, 2015.
[6] V. Mittal, “The study of solar absorption
air-conditioning systems,” vol. 16, no. 4, pp. 59–66,
2005.
[7] A. Apostolov, “Integration of distributed energy
resources in electric power systems,” Energize, Vol.3,
June, 2015.
[8] C. Carter-brown, E. Ipp, R. Marais, K. Leask, D. Vrey,
and R. Melesi, “Transmission network integration of
renewable energy in South Africa,” Energize, Vol.3,
June, 2015.
[9] P. Diamandis and Q. C. Systems, “Smart-grid
technologies for automation and control in a grid
connected wind energy facility in South Africa,”
Energize, Vol.3, June, pp. 35–38, 2015.
[10] P. K. Santra and P. V Kamat, “Mn-Doped Quantum
Dot Sensitized Solar Cells: A Strategy to Boost
Efficiency over 5%,” pp. 23–26, 2012.
[11] S. Africa, “Thin film PV modules offer over 4 % more
energy than silicon PV in South Africa,” Energize,
vol.3, June, 2015.
[12] J. Kamanzi and M. Kahn, “Development of a
Renewable Energy-Based Cooling System for a
Mobile Ground Station,” Aerospace and Electronics
Systems IEEE Magazine, Vol.30, no 2, February, pp.
6–13, 2015.
[13] J. Kamanzi and M. Kahn, "Low energy cooling
technology for a cubesat mobile ground station,''
Industrial and Commercial Use of Energy 10th annual
Conference, Cape Town, South Africa, August 19-21,
2013.

Cove Bay, Aberdeen, Scotland, United Kingdom
Editor:
Dr. Henry Tan
University of Aberdeen, Scotland, United Kingdom
Scope:
Since James Watt, a Scottish inventor, improved efficiency of the steam
engine, human civilization relies more and more on a steady supply of energy.
Today we are at a transitional age. On the one hand, we see technology
advances in the exploration and development of oil and gas, a depleting
resource; we see growth in handling aging and decommissioning. On the
other hand, we see ideas and plans for new energy infrastructure. This
journal is about energy challenges and the underlying mechanics, involving
multiple disciplines in science, technology, management and policy-making.
Mechanics, fundamentally, is about force and the related behaviours, where
force is about relationships, including those physical, human and social. For
mechanics, the journal covers interactive boundaries with many other
disciplines. For energy, topics include both fossil fuels and many different
forms of renewable energy; also, issues related to energy economy, energy
policy, efficiency, safety, environment and ecology will also be covered.