Investigation of Novel Thermoelectric Refrigeration Systems
200
Investigation of Novel Thermoelectric Refrigeration Systems By Xiaoli Ma, BEng, MSc Thesis submitted to the University of Nottingham For the degree of Doctor of Philosophy July 2004 cl: \RSITY I-Vt
-
Upload
khangminh22 -
Category
Documents
-
view
1 -
download
0
Transcript of Investigation of Novel Thermoelectric Refrigeration Systems

Investigation of Novel Thermoelectric Refrigeration Systems
By
Xiaoli Ma, BEng, MSc
Thesis submitted to the University of Nottingham
For the degree of Doctor of Philosophy
July 2004
cl: \RSITY I-Vt

THESIS CONTAINS
CD/DVD

Contents
Contents Pages
Abstract i
Acknowledgements iv
Nomenclature v
List of Figures x
List of Tables xvii
Chapter 1. Introduction 1
1.1 Background 1
1.2 Description of the research 2
1.3 Work involved with the research 8
Chapter 2. Review of Applications and Research of Thermoelectric Cooling
Technology, Heat Pipes and Photovoltaic Solar Cells 10
2.1 Applications of Thermoelectric Cooling Technology and Research on Thermoelectric Cooling Systems 10
2.1.1 Thermoelectric cooling technologies and Their Applications 10
2.1.2 Research on Improving Coefficient of Performance of Thermoelectric
Cooling Systems 26
2.2 Heat Pipes and Heat Pipe Thermal Performance Analysis 33
2.3 Photovoltaic Solar Cells and Their Applications 38
2.4 Conclusion 41
Chapter 3. Thermoelectric Module and Heat Sink 43
3.1 Thermoelectric Module Performance 43
3.1.1 Thermoelectric Module Performance and Optimum Selection (Design)
Model 43
3.1.2 Validation of the Optimum Selection Model 48
3.1.3 Discussion of the Modelling Results 52
3.4 Finned Heat Sink Performance 61
3.4.1 Analytical Model of the Performance of Finned Heat Sink 61

Contents
3.4.2 Modelling Results and Discussions 65
3.5 Conclusion 70
Chapter 4. Heat Pipe and Heat Pipe Thermal Performance Analysis 71
4.1 Conventional Heat Pipe and a New Type Heat Pipe 71
4.2 Analytical Model Set-up---Limits of Heat Transport Capacity 72
4.3 Validation of Analytical Modelling 80
4.4 Modelling of the Heat Transfer of the New Type Heat Pipe and Discussion 87
4.5 Conclusion 92
Chapter 5. Investigation of Thermoelectric Heat Pump System 94
5.1 Design of the Thermoelectric Heat Pump Prototype System 94
5.2 Analytical Model Set-up 97
5.3 Modelling of the Performance of the Heat Pump Prototype System and Discussion
101
5.3.1 Modelling of Cooling Mode 101
5.3.2 Modelling of Heating Mode 104
5.4 Experimental Testing 108
5.4.1 Testing of Cooling Mode 111
5.4.2 Testing of Heating Mode 115
5.4.3 Testing of Improving Coefficient of Performance in Cooling Mode by Using
Evaporation of Water 119
5.5 Comparison of the Modelling and Testing Results 123
5.6 Estimation of the Required Scale for Building Application 130
5.7 Environmental and Potential Economical Effects 132
5.8 Conclusion 134
Chapter 6. Experimental Investigation of Thermoelectric Refrigerator
Using Phase Change Material 137
6.1 Aim of the Experimental Investigation 137
6.2 Scheme of the Experimental Investigation 137
6.3 Experimental Investigation of the Thermoelectric Refrigeration System
Employing a Phase Change Material 138

Contents
6.3.1 Description of the Experimental System 138
6.3.2 Testing Methodology 142 6.3.3 Results and Discussion 142
6.4 Experimental Investigation of the Thermoelectric Refrigeration System
Employing Phase Change Material Integrated with Thermal Diode 149
6.4.1 Description of the Improved System 149
6.4.2 Results and Discussions 151
6.5 Conclusion 155
Chapter 7. Conclusions and Further Work 157
7.1 Summary of the Work 157
7.2 Conclusions 158
7.3 Further Work 162
References 165
Appendix A 170
Appendix B 171
Appendix C 172

Abstract
Abstract
Concern over global warming and depletion of the ozone layer has stimulated research to
develop cooling methods that do not employ environmentally damaging working fluids
such as CFCs and HCFCs. Two methods that have been considered are absorption and
thermoelectric `Peltier' cooling systems. Absorption systems, using H20/LiBr have the
advantage of being able to use low-grade waste heat. However, the large volume, high
capital cost and low performance of these systems have inhibited their widespread
application.
Thermoelectric systems were developed in the 1950s and use of this technology for air-
conditioning applications was investigated as early as the 1960s. However, the continued development of thermoelectric systems was slow owing to technical difficulties and the
superior performance of vapour-compression systems in terms of coefficient of
performance (COP). It is known however that most working fluids employed in vapour-
compression systems are damaging to the environment, and as vapour-compression
systems contain moving parts, they have the further disadvantage of being noisy and
requiring regular maintenance. In recent years therefore, there has been stimulated interest in using thermoelectric "Peltier" cooling systems for domestic refrigerators and
air conditioning.
Investigation of novel thermoelectric refrigeration systems was carried out in this
research. The systems use thermoelectric "peltier" coolers (thermoelectric modules) to
produce cooling or heating. Thermoelectric modules are solid state heat pump, which have the advantage of being environmentally friendly, being quiet, have no moving parts
and can operate using direct current supplied from photovoltaic solar cells (PVs).
This work mainly investigated a passive technology based on integration of a thermal
diode and thermoelectric modules for building integrated heat pump. The heat pump
uses thermoelectric modules to produce cooling or heating, and the thermal diode to
transfer heat in or out of the building, and prevent reverse heat flow in the event of
power failure. The heat pump was designed to have the following features:
" Very compact and suitable for incorporation within the building structure;
i

Abstract
" Does not require a plant room and simple to construct;
" Easily switched between cooling and heating modes;
" Can prevent reverse heat flow in the event of power failure;
" Low manufacturing cost;
" Environmentally friendly;
" Can be driven by solar photovoltaic panels.
This work also investigated the potential application of phase change materials (PCMs)
in the thermoelectric refrigeration system. The system employs phase change material to
improve the performance of a thermoelectric refrigerator as well as the cooling storage
capability. The refrigerator employing phase change material was designed to have
following features:
" Be able to overcome the peak loads and losses during door openings and power-off
periods.
" Prevent reverse heat flow via thermoelectric modules in the event of the power being
turned off by integrating the thermosyphon with the phase change material.
" Low manufacturing cost.
" Environmentally friendly.
Can be driven by solar photovoltaic panels
The research initially involved the investigation of the performance of the components
of the thermoelectric refrigeration systems, including thermoelectric modules, heat pipes
and heat sinks. The analytical models were developed to evaluate the heat transfer and
optimise the design of these components. Correlations between heat transfer and. fluid
flow inside the heat pipes were explored by computer modelling.
The research work further involved the design, modelling, construction and tests of a
thermoelectric heat pump prototype. A computer model was developed to evaluate the
performance of the heat pump system for two different modes, i. e., cooling and heating,
under various operating and ambient temperatures. Laboratory tests were carried out to
validate the modelling predictions and experimentally examine the thermal performance
11

Abstract
of the heat pump. Comparison was made between the modelling and testing results, and
the reasons for error formation were analysed and correction was given. Further
experimental investigation showed that reducing the temperature of the condenser of the
thermal diode could provide a significant improvement of the efficiency of the
coefficient of performance (COP) of the system in cooling mode. This can be achieved
by using the evaporation of water on the heat sink attached to the condenser.
The research work also involved the design, construction and tests of a thermoelectric
refrigerator employing phase change material. The work intended to investigate the
potential application of phase change materials (PCMs) in the thermoelectric
refrigeration system. The system was first fabricated and tested using a conventional heat sink system as the cold heat sink. In order to improve the performance and the
storage capability, the system was reconstructed and tested using an encapsulated PCM
as a cold heat sink. Results of tests of the latter system showed an improved performance compared with the former system. However, to improve the storage capability, in
particular during off-power periods, it was found necessary to integrate the PCM with a
thermosyphons, which would allow heat flow in one direction only. Results of tests
carried out on the system employing phase change material integrated with thermosyphons showed considerable improvement in the storage capability of the
thermoelectric refrigeration system compared with the previous ones.
On the basis of the above investigation the further work for improving the performance
of the thermoelectric refrigeration system was suggested, which is illustrated in Chapter
7, and its key technical issues are discussed.
iii
Acknowledgement
Acknowledgement
I would like to express my gratitude and appreciation to my supervisor, Professor
S. B. Riffat, for his unlimited support and assistance throughout the progress of my
research work, and also for his technical instructions and advice during the whole period
of the research.
I gratefully acknowledge the financial support by the University of Nottingham through
the award of the PhD studentship.
I am indebted to my husband, Xudong, for his sincere moral support. He constructively
supported me throughout my studies. He kept helping me in both my research and the house works.
I am also grateful to my colleagues and working partners, especially Dr Siddig Omer, Dr
Guoquan Qiu, Dr Naresh Srivastava and Dr Yuehong Su, for their continued support. I
would like to thank the technicians of the school for their tolerance and co-operation.
iv

Nomenclature
Nomenclature
Symbol Term Unit
Ab Area of the base plate m2
Ar Cross section area of the fin m2
Af Total surface area of a fin m2
Ai Liquid area in the cross section of single hole m2
A. Total area of all the exposed regions of base plate m2
At Total area exposed to coolant m2
A, Cross section area of vapour m2
Awali Total surface area of the box m2
C, C1, C2 Coefficient of vapour phase resistance calculation
COPT, CO P2 Coefficient of performance
CP Specific heat of air KJ/kg°C
d; Equivalent diameter of the cross section m
d� Diameter of cross section area of vapour m
f� Frictional resistance coefficient of the vapour flow in the heat pi pe, 0.014
G Geometry factor (cross section area/length of thermoelectric element),
cm
Gf Minimum filled liquid mass kg
g gravitational acceleration ßs2
h Convective heat transfer coefficient W/m2°C
hf Liquid fill level (variable) m
hfg Latent heat of vaporization J/kg
Convective heat transfer coefficient of internal surface of the box W/m2°C
Convective heat transfer coefficient of outside surface of the box W/m2°C
I Current A
I°pt Optimum current A
J Correction factor in relation to the heat resistance of the vapour fl ow 1
K Coefficient for liquid phase resistance calculation
k Thermal conductivity of thermoelectric material watt/cm Kelvin
ke Thermal conductivity of the wicked space W/m°C
V

Nomenclature
keff Effective thermal conductivity of the wicks W/m°C
kf Thermal conductivity of fin W/m°C
k1 Thermal conductivity of the liquid W/m°C
kp Thermal conductivity of the heat pipe wall W/m°C
ks Shape factor of the heat pipe channel geometry L Length of the fin in
L Corrected length of the fin in
I, 5 Length of finned heat sink in
la Length of adiabatic section of the heat pipe m 1c Length of condensation section of the heat pipe in le Length of evaporation section of the heat pipe m Leff Effective length of the heat pipe in lp Length of liquid column in the heat pipe in M� Mach number of vapour flow N/m2
N Number of thermocouples in 3.1; Number of fins in 3.4
P Perimeter of the cross section of the fin in Pe Power consumption W
P� Vapour pressure Pa
p Resistivity of thermoelectric material ohm cm Qa Sensible energy of the air inside the refrigerator cabinet W
Qaiju n Cooling energy stored in the aluminium block W
QC Heat flow at cold side (cooling capacity) W Qc, e Cooling energy produced by thermoelectric refrigerator W Qcooling Cooling capacity W
Qcd Heat conduction from the hot side to cold side W
QE Power consumption W
Qf Heat transfer from the fin W
Qfs Heat transfer from finned heat sink W
Qh Heat flow at hot side (heating capacity) W Qheating Heating capacity W Qinput Electrical energy input to the thermoelectric modules W
Qj Joule heat generation rate W Qload Heat load provided by lamps W
vi

Nomenclature
QiOSs Heat loss produced by the fan on the wall of the box W
QiPCm Latent heat of the PCM W
Q, b Peltier heat pumping rate W
QsPCm Sensible energy of the PCM W
QW Sensible energy of the water W
Qwail Heat transfer from the environment to the interior of the box W
qb, m Boiling limit for heat transport W
qc Heat input W
qe, m Entrainment limit for heat transport W
qs, m Sonic limit for heat transport W
qv, m Viscous limit for heat transport W
R, Thermal resistance of the inside heat sink K/W
Re Heat exchanger thermal resistance K/W
Re� Reynolds number Rf Thermal resistance of the fin °C/W
Rfs Thermal resistance of finned heat sink °C/W
Rh Thermal resistance of the outside heat sink K/W
Rhp Thermal resistance of the thermal diode K/W
Rp, c Condenser wall heat resistance m2°C/W Rp, e Evaporator wall thermal resistance m2°C/W R,, Thermal resistance of the vapour flow in the heat pipe m2°C/W R�, Vapour constant (J/kg. K) (n-pentane: 115; HFE-7100: 31.5)
RW, Thermal resistance of condenser saturated wicks m2°C/W Rwait Thermal resistance of wall of the box m2°C/W Rw, e Heat resistance of evaporator saturated wicks m2°C/W
rce Capillary radius m
r; Equivalent radius of the cross section m
rix Radius of the condensation section of the heat pipe (inner surface) M.
r1e Radius of the evaporation section of the heat pipe (inner surface) M.
rhi Hydraulic radius of liquid cross section m
rh� Hydraulic radius of vapour cross section m
rh, W Hydraulic radius of wicks with liquid m
rn Critical radius of bubble generation m
vu

Nomenclature
r° Radius of the evaporation section of the heat pipe (outer surface) m
rox Radius of the condensation section of the heat pipe (outer surface) m
r� Equivalent radius of the vapour area in the cross section m
rV, C Radius of the vapour column in the condensation section of the heat pipe m
Sa Cross section area of the airflow of the fan on the wall m2 T. Ambient temperature (Kelvin in section 5.2) °C
TT Cold side temperature K
Tceu Temperature of the PV cell °C
Th Hot side temperature K
Tin Temperature inside the box (room) (Kelvin in section 5.2) °C
Tm 1/2(Th+Tc) K
Tr Temperature of fin base °C
TS Temperature of the surrounding fluid over the fin °C
T, Absolute temperature of vapour K
U, Coefficient of heat transfer of the box W/m2°C
V Voltage V
Va Velocity of the wind of the fan on the wall m/s W Width of the finned heat sink m Z Figure of Merit (a2/(pk)) K71
AT Th-Tc K
APag Axial hydrostatic pressure drop Pa
APcl Net capillary pressure difference Pa
APc, m Maximum capillary force Pa
Apl Viscous pressure drop occurring in the liquid phase Pa
Aprg Radial hydrostatic pressure drop Pa
Op� Viscous pressure drop occurring in the vapour phase Pa
a Seebeck coefficient of thermoelectric material Volts/K
G Surface tension N/m
e Cofficient of performance for cooling
cops Optimum cofficient of performance for cooling
11 Coefficient of performance for heating
, If Fin efficiency
viii
Nomenclature
ifs Finned heat sink efficiency
gopt Optimum cofficient of performance for heating
S Thickness of the fin m
8b Thickness of base plate m2
Al Liquid viscosity N. s/m2
µ� Vapour viscosity N. s/m2
p Density of air kg/m3
PI Liquid density kg/m3
pv Vapour density kg/m3
Specific heat ratio
Angle of inclination of the pipe relative to horizontal surface deg
yr Angle of inclination of adiabatic section relative to horizontal surface deg
0 Wetting angle of liquid-vapour surface deg
x Latent heat of working fluid of the heat pipe J/kg
ix

List of Figures
List of Figures
Page
Chapter 1
1-1 Schematic diagram of the thermal diode (a) Illustration of the thermal diode
in the experimental system (b) Internal structure of the evaporator and
condenser 3
1-2 Schematic description of a Peltier module, showing details of element integration 4
1-3 Operation mode of the heat pump (a) Cooling mode (b) Heating mode 5
1-4 Schematic diagram of a thermoelectric refrigeration system employing PCM
integrated with thermal diode 7
Chanter 2
2-1 Schematic of thermoelectric module operation (a) cooling mode (b) heating mode 11
2-2 Schematic diagrams of two types of thermoelectric modules (a) Type A configuration with ceramic insulating plates and large inter-
thermoelement separation; (b) Type B configuration without ceramic insulating plate and with very
small inter-thermoelement separation 14
2-3 Conventional arrangement for thermoelectric cooler. Ql is the heat to be
pumped, P is the electrical power supplied. Q2 is the heat 16
2-4 Schematic diagrams showing an integrated thermoelectric microcooler with infrared components integrated onto cooled central region (a) plane view and (b) cross-sectional view 19
2-5 Schematic diagram of the powerless thermoelectric refrigerator/warmer 21
2-6 Schematic diagram of a thermoelectric refrigerator with controlling system 22
2-7 Solar cell-driven, thermoelectric cooling prototype head gear 22
2-8 Schematic diagram of a cryoconcentration cell 24
2-9 Schematic diagram of thermoelectric intercooler 24
2-10 COP as a function of temperature difference across the module at hot side
x

List of Figures
temperature Th=300K 25
2-11 Common heat exchanger designs: (a) natural air convection; (b) forced air
convection (heat sink not shown for clarity); (c) water-cooled forced 27
2-12 (a) Air cooled, thermosyphon reboiler-condener assembly (b) Cross-section
of the hollow condensing tube with enhanced heat transfer surface 29
2-13 Typical thermoelectric module designs (a) single-stage module; (b) multistage
module 32
2-14 Normal gravity assisted wickless heat pipe (two-phase closed thermosyphon) 35
2-15 Normal capillary-driven heat pipe 36
2-16 Cross section of micro/miniature heat pipe 36
2-17 Separate-type gravity heat pipe heat exchanger 37
2-18 Gravity heat pipe with cross-over flow separator 38
Chapter 3
3-1 Flow chart of the optimum selection (design) model of thermoelectric modules 47
3-2 Comparison of optimum thermoelectric parameters for varied cooling
capacities (Th=45°C, Tc=17°C) 50
3-3. Comparison of operating voltage for varied cooling capacities (Th=45°C, Tc=17°C) 50
3-4 Comparison of optimum thermoelectric parameters for varied hot side temperatures (Q, =40OW, Tc=17°C) 51
3-5. Comparison of operating voltage for varied hot side temperatures (Q, =40OW, TT=17°C) 51
3-6 Relations between cooling capacity and optimum thermoelectric parameters
for cooling mode (Th=45°C, Tc=17°C, G=0.282) 55
3-7 Relations between cooling capacity and operating voltage for cooling mode (Th=45°C, Tc=17°C, G=0.282) 56
3-8 Relation between hot side temperature and optimum thermoelectric parameters for cooling mode (Q, =60OW, Tc=17°C, G=0.282) 56
3-9 Relation between hot side temperature and operating voltage for cooling
mode (Qc=60OW, T,, =17°C, G=0.282) 57
3-10 Relation between geometry factor and optimum thermoelectric parameters for
xi

List of Figures
cooling mode (Q, =600W, Th=45°C, Tc=17°C) 57
3-11 Relation between geometry factor and operating voltage for cooling mode (Qc=600W, Th=45°C, Tc=17°C) 58
3-12 Relation between heating capacity and optimum thermoelectric parameters for
heating mode (Th=23°C, TT=3°C, G=0.282) 58
2-13 Relation between heating capacity and operating voltage for heating mode
(Th=23°C, TT=3°C, G=0.282) 59
3-14 Relation between cold side temperature and optimum thermoelectric parameters for heating mode (Qh=600W, Th=23°C, G=0.282) 59
3-15 Relation between cold side temperature and operating voltage for heating mode (Qh=600W, Th=23°C, G=0.282) 60
3-16 Relation between geometry factor and optimum thermoelectric parameters for
heating mode (Qh=600W, Th=23°C, T,, =3°C) 60
3-17 Relation between geometry factor and operating voltage for heating
mode (Qh=600W, Th=23°C, TT=3°C) 61
3-18 Schematic diagram of finned heat sink 65
3-19 Relation between heat transfer as well as efficiency and length of fins
(N=45, h=19.8W/m2. °C) 67
3-20 Relation between thermal resistance and length of fins
(N=45, h=19.8W/m2. °C) 67
3-21 Relation between heat transfer as well as efficiency and number of fins
(I 5cm, h=19.8W/m2. °C) 68
3-22 Relation between thermal resistance and number of fins
(L. f=Scm, h=19.8W/m2. °C) 68
3-23 Relation between heat transfer as well as efficiency and convective coefficient (Lf=5cm, N=45) 69
3-24 Relation between thermal resistance and convective coefficient (L4=5cm, N=45) 69
Chanter 4
4-1 Flow chart of limits of heat transport capacity model 79 4-2 Cross-sectional dimensions of the micro heat pipe 80
4-3 Limits of heat transport capacity of a trapezoidal micro heat pipe with water
X11

List of Figures
at a horizontal orientation 81
4-4 Evaluation of the pressure component as a function of the operating temperature
for the trapezoidal heat pipe with water at a horizontal orientation 82
4-5 Measured thermal conductance of a trapezoidal micro heat pipe as a function
of the evaporator temperature (copper, 0.032 g charge) 83
4-6 Measured thermal conductance of a trapezoidal micro heat pipe as a function
of the evaporator temperature (silver, 0.032 g charge) 84
4-7 Comparison of the maximum heat transport capacity of a trapezoidal micro heat
pipe as a function of the operating temperature (copper, 0.0032 g charge) 86
4-8 Comparison of the maximum heat transport capacity of a trapezoidal micro heat
pipe as a function of the operation temperature (silver, 0.032 g charge) 86
4-9 Relation between heat transport capacity and working temperature for pipe with
with wick 89
4-10 Relation between heat transport capacity and working temperature for the pipe
without wick 90
4-11 Relation between maximum heat transport capacity and liquid fill level for
the pipe with wick 90
4-12 Relation between heat transport capacity and liquid fill level for pipe
without wick 91
4-13 Relation between heat transport capacity and cross section diameter for
pipe with wick 91
4-14 Relation between heat transport capacity and cross section diameter for pipe
the pipe without wick 92
Chapter 5
5-1 Schematic diagram of the thermoelectric heat pump(a) cooling mode (b) heating mode 94
5-2 Flow chart of the system simulation model
5-2 Variation of operating current and COP with cooling capacity in modelling 102
5-4 Variation of hot side and cold side temperatures of thermoelectric modules
with cooling capacity in modelling 103
ziii

5-5 Variation of operating current and COP with ambient temperature in
cooling mode in modelling
List of Figures
103
5-6 Variation of hot side and cold side temperatures of thermoelectric modules
with environmental temperature in cooling mode in modelling 5-7 Variation of operating current and COP with heating capacity in modelling
5-8 Variation of hot side and cold side temperatures of thermoelectric modules
with heating capacity in modelling
5-9 Variation of operating current and COP with ambient temperature in heating
mode in modelling 5-10 Variation of hot side and cold side temperatures of thermoelectric modules
with ambient temperature in heating mode in modelling 5-11 Photograph of the new type thermal diode
5-12 Photographs of the heat pump (a) mounted heat pump (b) thermoelectric
modules in the heat pump 5-13 Photograph of the test control system 5-14 Photographs of the test system (a) layout of the test system (b) system in
operating 5-15 T-type thermocouples
5-16 Datataker DT 500
5-17 Variation of the temperatures and DC current with time in the test 5-18Variation of the operating current and the COP with cooling capacity in
cooling mode in the test
5-19Variation of the operating current and the COP with ambient temperature in cooling mode in the test
5-20 Variation of temperatures and DC current with time in test A
5-21 Variation of temperatures and DC current with time
5-22 Variation of the operating current and the COP with heating capacity in heat
mode in test
5-23 Variation of the operating current and COP with ambient temperature in
heating mode in test
5-24 Comparison of COP at various cooling capacity for the tests with and without
water spraying
5-25 Comparison of COP at various ambient temperatures for the tests with and
104
106
106
107
107
109
109
110
110
110
110
112
114
114
117
117
118
119
121
xiv

List of Figures
without water spraying
5-26 Comparison of the hot/cold side temperatures of thermoelectric modules for
the tests with and without water spraying
5-27 Comparison of temperature difference between the hot and cold sides for tests
with and without water spraying 5-28 Comparison of the temperature difference between the evaporator and
condenser of the thermal diode for tests with and without water spraying 5-29 Comparison of operating current and COP at various cooling capacities in
modelling with those in test in cooling mode
5-30 Comparison of operating current and COP at various ambient temperatures in
modelling with those in test in cooling mode 5-31 Comparison of operating current and COP at various heating capacities in
modelling with those in test in heating mode 5-32 Comparison of operating current and COP at various ambient temperatures
in modelling with those in test in heating mode 5-33 Correction factors of hot side temperature
5-34 Correction factors of cold side temperature
5-35 Comparison of operating current and COP at various cooling capacities in
modified modelling with those in test in cooling mode 5-36 Comparison of operating current and COP at various ambient temperatures in
modified modelling with those in test in cooling mode 5-37 Comparison of operating current and COP at various heating capacities in
modelling with those in test in heating mode 5-38 Comparison of operating current and COP at various ambient temperatures
in modified modelling with those in test in heating mode
Chapter
6-1 Schematic description of an experimental refrigeration system from different
views (a) vertical section (b) horizontal section
6-2 The tested thermoelectric refrigerator prototype
6-3 Encapsulated PCM as a cold heat sink
6-4 Variation of the temperatures with time on the condition of fan off for the
121
122
122
123
125
126
126
127
127
128
128
129
129
130
140
141
141
xv

List of Figures
bonded fins heat sink system 144
6-5 Variation of the temperatures with time on the condition of fan on for the
bonded fins heat sink system 144
6-6 Variation of the temperatures with time on the condition of improved
convection inside the cabinet for the bonded fins heat sink system 145
6-7 Variation of thermoelectric module hot and cold side temperatures with, and
without, a heat removal fan for the bonded-fins heat sink system 145
6-8 Variation of the temperatures with time for the PCM system 147
6-9 Variation of cold side and PCM temperatures during the cooling process for
the tests with and without PCM 147
6-10 Variation of cold side and PCM temperatures for the tests with, and without,
PCM, after the power was turned off 148
6-11 Comparison between performance of thermoelectric refrigeration system, with
and without, PCM 148
6-12 Schematic description of a thermoelectric refrigeration system employing PCM integrated with thermal diode 150
6-13 Thermoelectric refrigeration system employing PCM integrated with thermal diodes 151
6-14 Temperature variation of the thermoelectric refrigeration system employing
PCM integrated with thermal diode 153
6-15 Variation of temperature of the PCM with and without thermal diode during
cooling phase 154
6-16 Variation of the temperature of the PCM with and without thermal Diode
after the power was turned off 154
6-17 Comparison of the COP of thermoelectric refrigeration system with and
without PCM and thermal diode 155
Chanter 7
7-1 Schematic diagram of the improved configuration of new type thermal diode 163
xvi

List of Tables
List of Tables
Chanter 4
4-1. Micro heat pipe dimensions
Chapter 5
5-1. Relation between the cooling capacity and COP of the experimental rig
at ambient temperature of 24°C
5-2. Design conditions and parameters of an office
5-3. Required number and total area of thermoelectric modules and the
performance of the system for an office
Page
81
131
131
132
xvii

Introduction
Chapter 1. Introduction
1.1 Background
Concern over global warming and depletion of the ozone layer has stimulated research to
develop cooling methods that do not employ environmentally damaging working fluids
such as CFCs and HCFCs. Two methods that have been considered are absorption and
thermoelectric `Peltier' cooling systems. Absorption systems, using H2O/LiBr have the
advantage of being able to use low-grade waste heat. However, the large volume, high
capital cost and low performance of these systems have inhibited their widespread
application.
Thermoelectric systems were developed in the 1950s and use of this technology for air-
conditioning and refrigerator applications was investigated as early as the 1950s-1960s.
However, the continued development of thermoelectric systems was slow owing to
technical difficulties and the superior performance of vapour-compression systems in
terms of coefficient of performance (COP). It is now known however that most working fluids employed in vapour-compression systems are damaging to the environment and as
vapour-compression systems contain moving parts, they have the further disadvantages
of being noisy and requiring regular maintenance. In recent years therefore, there has
been renewed interest in using thermoelectric modules for domestic refrigerators and air
conditioning. Thermoelectric refrigeration systems are much more compact and lighter
than absorption systems. Some thermoelectric modules, such as Melcor's Polar TEC7m
series thermoelectric modules, have been developed specifically for these low-cost, high
volume, commercial applications. Many reports on the use of thermoelectric refrigerator,
and some reports on use of thermoelectric air-conditioning for small-scale or specific
applications can be found (Bojic M, 1997; Morrow R. C, 2000]. However, few reports
exist on the use of a thermoelectric air conditioner for cooling/heating a room space,
such as living rooms, restaurants, offices, or similar (Kim C. M, 2001).
The main aim of this research is to investigate a passive technology based on integration
of a thermal diode and thermoelectric modules for a building-integrated heat pump. The
system is very compact and suitable for incorporation within the building structure. This
I

Introduction
research also investigated an improved thermoelectric refrigerator employing a phase
change material to improve the overall performance of the system.
As a building heat pump, the system can be constructed as a flat unit suitable for
mounting on the wall of a building. It also has the advantage that it can be easily
switched between cooling and heating modes and adjusted to meet individual air
conditioning requirements. Thermoelectric air-conditioning has the potential to achieve a
higher COP as it requires a smaller temperature difference between the room and the
ambient. These advantages make thermoelectric systems very attractive for building air-
conditioning.
Although many improved thermoelectric refrigerators have been reported, the present
thermoelectric refrigerators still have the problem of low coefficient of performance.
One of the methods to solve the problem is to improve the overall performance of the
system, by properly storing and releasing the available energy and utilizing it efficiently.
Phase change materials (PCM) have long been identified as prime candidates for thermal
energy storage systems, due to the high energy densities (MJ/m3). A further advantage of
PCM is that heat transfer normally takes place at a constant temperature (the transition
temperature). This is appropriate for thermoelectric cooling, and refrigeration units,
especially those used for food and medicine storage which require precise temperature
control.
1.2 Description of the Research
Thermoelectric Heat Pump
The thermoelectric heat pump system utilised novel and integrated design concept for
optimising system performance, size, reliability and costs. It was based on the
integration of thermoelectric modules, a new type of thermal diode in one unit. The heat
pump can be driven by mains power (DC) or PV solar cells (DC). The components and
the operation of the heat pump are described, and the novelty is summarised as follow:
(a) Thermal Diodes
Thermal diode is a unidirectional heat pipe, which can transfer the heat in one direction.
This consists of a closed container charged with a working fluid. When heat is applied to
2

the lower end of the heat pipe (evaporation section), the liquid boils and vaporises. As
the vapour reaches the upper end of the tube, which is cooler (condenser section), it
condenses and returns by gravity to lower end of the tube. Thermal diodes can be made
in various shapes (e. g., tubes, panels) and sizes. A new type of thermal diode was
designed. constructed and used in this system, as shown in Figure 1-1. This thermal diode
can rotate along its axis to change the operation mode from heating to cooling or the
reverse. The external forms of the evaporator and condenser of the thermal diode are flat
panels, which makes it easy to mount thermoelectric modules and heat sink units. The
internal structures of the evaporator and condenser are holes that can undertake the high
vapour pressure without changing the external forms. The holes connect each other to
keep the working liquid in the sane level.
Condenser
13
Adiaba
117- Rotati on
arg:
1\ apt razor
(a) (b)
Vapour up
Figure 1-1. Schematic diagram of the new type thermal diode (a) Illustration of the thermal diode (b) Internal structure of the evaporator and condenser
(b) Thermoelectric. tlodules
A thermoelectric module is a simple solid-state device that converts electrical energy
into thermal energy or the reverse. It consists of a number of couples of' p- and n-type
3

Introduction
semiconductor strips sandwiched between two ceramic plates, connected electrically in
series and thermally in parallel, see Figurel-2. When supplied with a suitable electric
current they can provide either cooling or heating depending on the direction of the
current. Heat generation or absorption rates are proportional to the magnitude of the
current and also the temperature of the hot and cold side. The amount of heat removed
by the hot side corresponds to the cooling effect and the electrical power input.
Negative(-)
Ceramic Plates (Electrical Insulator)
Heat Rejected(Hot Side) Conductor)
Figure 1-2. Schematic description of a thermoelectric (Peltier) module, showing details of element integration[Rowe AM, 1995]
(c) Operation of the Heat Pump
The operation of the heat pump system was shown in Figure 1-3.
Cooling Mode [Figure 1-3(a)]: In summer, Heat from the building will be extracted by
the thermoelectric modules. The heat causes the working fluid inside the thermal diode
to boil and vaporise. As the vapour flows to the condenser section (situated outside the
building) it condenses and releases heat to ambient with the help of the heat sink units.
Heating Mode [Figure 1-3(b)]: In winter, the thermal diode will be rotated along its axis
to reverse the functions of the evaporator and condenser sections. Ambient heat
extracted by the evaporator section of the thermal diode, causing the working fluid to
vaporise. As the vapour flows to the condenser section of the thermal diode, it condenses
P-Type Semiconductor
N-Type Semiconductor
4
4 Heat Absorbed(Cold Side) Positive(+)

and releases heat to the thermoelectric modules. These upgrade the heat to a more useful
temperature which can then used for space heating in the building.
The heat sinks in this system are used to help to dissipate the heat. The system can be
driven by PV panels.
ýýý ý"º
ý. ý
(a)
Avg
Hex air -I r
;I1
Heat sinks
1
Y
I
Rcarine
I; vaporatur
tenser
Thermal diode
(b)
Figure 1-3. Operation modes of the heat pump (a) Cooling mode (b) Heating mode
Evaporator
5
Thermoelectric
modules

Introduction
(d) Novelty
" Integration of thermoelectric modules and thermal diode technology to produce a
compact unit;
9 Use of a new type of thermal diode;
9 Method to allow operation of the thermal diodes in heating or cooling mode;
Thermoelectric Refrigerator
The thermoelectric refrigerator was based on the integration of thermoelectric modules,
heat pipes and phase change material into one unit. The heat pipes used in this system
include thermal diode and "wicked" heat pipe. Unlike thermal diode, the "wicked" heat
pipes return the liquid refrigerant to the evaporator via the wick. The phase change
material (PCM) and the operation of the refrigeration system are described, and the
novelty is summarised as follow:
(a) Phase Change Material
This normally consists of a mixture of salts or organic compounds that undergo a phase
change from liquid to solid when cooled, or the reverse. In doing so, they absorb large
quantities of energy while remaining at an almost constant temperature. The use of a PCM in the system allows the cooling load to be stored for periods of peak loads or
power off as the PCM melt while absorbing heat, thus allowing continuous operation of
the system.
(b) Operation of the refrigerator Three different configurations of the refrigeration system were investigated and
compared. It was found the configuration shown in Figure 1-4 has higher performance, its operation is described as follow:
When DC current is applied to thermoelectric refrigeration system, the thermoelectric
modules absorb heat from the metallic block inside the refrigeration cabinet, and
dissipate heat to ambient with the help of the outside embedded finned heat pipe heat
sink. On the cold side of the system, the working fluid in the evaporator of the thermal
diodes absorbs heat from the PCM, producing cooling. The vapour produced in the
evaporator travels to the condenser end where it condenses, whilst dissipating heat to the
6

cold side of the thermoelectric modules. When the power is turned off, the condenser of
the thermal diodes gets hot, as a result of heat transfer from the hot side to the cold side
of the thermoelectric modules. This stops the condensation to occur, and thus causes the
operation of the thermal diode to cease, and therefore prevents heat transfer to the PCM.
A Metallic block
TECs
Thermal diode
PCM
º-0 Metallic block
". Fan
(a)
A-A
Embedded fin heat pipe heat
sink
-A
Mask
Insulation
Heat pipe
(b)
Figure 1-4. Schematic diagram of a thermoelectric refrigeration system employing PCM integrated with thermal diodes (a) Vertical section (b)Horizontal section
7

Introduction
(c) Novelty
" The encapsulation of a PCM within heat pipe is a novel idea to enhance the heat
input/output mechanisms.
" The integration of thermoelectric modules, a PCM, heat pipes and perhaps PV in a
refrigeration unit is a novel idea to conserve energy supply.
The research on thermoelectric heat pump and thermoelectric refrigerator is timely in
view of the UK government's commitment to reduce CO2 emissions by 20% by the year 2010. The novel thermoelectric refrigeration systems could present an excellent
opportunity to expand the market for heat pumps and refrigerators and is expected to
give rise to significant economic and environmental benefits.
1.3 Work Involved with the Research
The research includes the following 4 technical sections:
Section 1: Review of applications and research of thermoelectric cooling technology, heat pipes and photovoltaic solar cells;
Section 2: Investigation of the performance of components that consist of the main part
of thermoelectric refrigeration systems, including thermoelectric module, heat pipe and
finned heat sink;
Section 3: Investigation of the performance of thermoelectric heat pump system;
Section 4: Investigation of the performance of thermoelectric refrigerator system;
The work of section 1 is indicated in Chapter 2, which involved a review of applications
and research of relevant technologies, including the applications and research of
thermoelectric cooling systems, heat pipes and heat pipe thermal performance analysis
as well as the photovoltaic solar cells technology and their applications. Technical
progress in these areas was examined, and the innovative aspects of this research were
identified compared to the current technical status.
8

Introduction
The work of section 2 is detailed in Chapters 3 and 4. Thermoelectric module
performance was analysed and optimum selection (design) of thermoelectric modules for
thermoelectric refrigeration systems was explored by computer modelling. The
analytical model was validated by comparing the modelling results with the results from
the design software of Melcor company. An analytical model of finned heat sink was
developed and the modelling results provided a basis for designing the finned heat sink.
An analytical model of the heat transfer of heat pipes was developed. The model was
used for simulating the new type of novel cranked thermal diode in two cases, including
the "wicked" thermal diode and "wickless" thermal diode. Results obtained were
discussed. Experimental results were used to validate the analytical model.
The work of section 3 is detailed in Chapter 5. A building-integrated thermoelectric heat
pump was designed and constructed. Computer modelling was used to evaluate the
performance of the heat pump for various operating and weather conditions under two
different modes, i. e., cooling mode and heating mode. Laboratory testing of the
prototype was then carried out. The results obtained are used to assess real performance
of the system. These were also compared to theoretical predictions to validate/modify
the analytical model. Method for improving the COP of the thermoelectric pump system
was explored in this research. Environmental and potential economical effects of the
heat pump were illustrated.
The work of section 4 is detailed in Chapter 6. An experimental investigation of
thermoelectric refrigerator employing phase change material was carried out. Three
different configurations were fabricated and tested. The comparison of the three
configurations showed an effect of employing a phase change material integrated with
thermal diode in thermoelectric refrigeration system.
A number of conclusions derived from the research were arisen in Chapter 7. The merits
of the proposed systems were highlighted, and the problems encountered with the
research were illustrated. Opportunities for further study on this topic were also
discussed.
9

Review of Applications and Research of Thermoelectric Cooling Technologies, Heat
Pipes and Photovoltaic Solar Cells
Chapter 2. Review of Applications and Research of Thermoelectric
Cooling Technologies, Heat Pipes and Photovoltaic Solar Cells
2.1 Applications of Thermoelectric Cooling Technology and Research on
Thermoelectric Cooling Systems
2.1.1 Thermoelectric Cooling Technologies and Their Applications
This section gives the basic knowledge of the thermoelectric modules and an overview
of these applications for the purpose of apprehending the progress in the thermoelectric
cooling technologies.
Thermoelectric Modules
Thermoelectric modules can convert electrical energy into a temperature gradient-This
phenomena was discovered by Peltier in 1834. The application of this cooling or heating
effect remained minimal until the development of semiconductor materials. With the
advent of semiconductor materials came the capability for a wide variety of practical
thermoelectric refrigeration applications [Guy E. C, 1988].
A thermoelectric module consists of a number of couples p- and n-type semiconductor
strips sandwiched between two ceramic plates, connected electrically in series and
thermally in parallel. Figure 2-1 shows a diagram of a single pair consisting of n- and p-
type semiconductor material. When DC current passes from the n- to the p-type
semiconductor material, the junction of semiconductor become cold, and the other end
become hot. The heat is transferred from the cold end to hot end and cooling the
environment, see Figure 2-1(a). This phenomenon is called the Peltier effect. Reversing
the direction of the current, the junction of semiconductor become hot, and the other end
become cold, heat is dissipated to the environment, as shown in Figure 2-1(b).
Thermoelectric heat pumping at the cold end due to the Peltier effect is reduced by other
unwanted heat sources, i. e., Joule heat and conducted heat. Current flow generates
resistive or Joule heat in the thermoelectric material. 50 percent of the Joule heat goes to
the cold end and 50 percent goes to the hot end. Due to the temperature difference
10

Pipes and Photovoltaic Solar Cells
between the cold and hot end of semiconductor material, heat is conducted from the hot
end to the cold end of the module through the thermoelectric material, called Seebeck
effect.
Heat absorbed from
environment (cooling) T, (cold end)
Conductors
T11 (hot end)
+
(a)
Conductors
1', (cold end)
+
(b)
Figure 2-1. Schematic of thermoelectric module operation (a) cooling mode (b) heating mode.
Heat dissipated to heat sink
Heat dissipated to environment (heating) T1 (hot end)

Review of Applications and Research of Thermoelectric Cooling Technologies, Heat
Pipes and Photovoltaic Solar Cells
As the current is increased, the temperature difference increases due to the increased
Peltier cooling effect, and thus the Joule heat and conducted heat increase. Thermal
equilibrium is established when the sum of one half the Joule heat and the conducted
heat equals the Peltier heat, and the thermoelectric module no longer operates.
The electrical power consumption of a thermoelectric module is used to generate the
Joule heat and overcome the Seebeck effect. The coefficient of performance used is
defined as the net heat absorbed at the cold end divided by the applied electric power.
The cooling capability of a semiconductor material is dependent on the material's figure
of merit. Figure of merit depends only on material properties, Seebeck coefficient,
electric resistivity and thermal conductivity. Maximising the figure of merit is the major
objective to increase the module efficiency.
The thermoelectric modules can also convert thermal energy from a temperature gradient into electric energy-this phenomenon was discovered in 1821 and is called "Seebeck
effect. " As mentioned above, when a temperature differential is established between the
hot and cold ends of the semiconductor material, a voltage is generated, i. e, Seebeck
voltage. Actually, the Seebeck effect is an inverse effect of Peltier effect. Based on this
Seebeck effect, the thermoelectric modules can also act as power generators. As shown in Figure 2-1, if heat supplied at the one junction causes an electric current to flow in the
circuit and electrical power is delivered. In practice a large number of such
thermocouples are connected electrically in series to form a "module".
More than one pair of semiconductors are usually assembled together to form a
thermoelectric module. Within the module each semiconductors is called a
thermoelement, and a pair of thermoelements is called a thermocouple.
A typical thermoelectric module is composed of two ceramic substrates that serve as a foundation and electrical insulation for P-type and N-type Bismuth Telluride
thermoelements that are connected electrically in series and thermally in parallel between the ceramics. Conventional thermoelectric modules have various specifications
12

Review of Applications and Research of Thermoelectric Cooling Technologies, Heat
Pipes and Photovoltaic Solar Cells
for various applications; the dimensions vary from 3mm square by 4mm thick to 60mm
square by 5mm thick, the maximum heat-pumping rate from 1W to 125 W. The
maximum temperature difference between the hot and cold side can reach 70°C. The
modules contain from 3 to 127 thermocouples. There are multistage (cascade) series
thermoelectric modules designed to meet requirements for large temperature differentials
(up to 130°C). The lowest practically achievable temperature is about -100°C.
Because the cold side of the module contracts while the hot side expands modules with a footprint larger than 50 mm square usually suffer from thermally induced stresses, at the
electrical connection points inside the module causing a short circuit, so they are not
common. Long, thin modules want to bow for the same reason and are also rare. Larger
areas than an individual module can maintain are cooled or have the temperature
controlled usually by using multiple modules.
Two types of commercially available thermoelectric modules are shown in Figure 2-2.
Type A was originally designed for cooling applications and possesses significant inter-
thermoelement separation. In this type of module, n- and p-type semiconductor thermoelements are connected electrically in series by highly conducting metal strips
and sandwiched between thermally conducting but electrically insulating plates. Type B
has been developed recently for power generation and is densely constructed with very
small inter-thermoelement separation to increase the power-per-area. However, the
conducting metal strips in the latter device are not insulated and the module cannot be
attached directly to electrical conductor, such as aluminium heat sink. [Rowe D. M et al,
1998]
Thermoelectric modules can not be used independently. They should be connected with
heat exchangers to dissipate heat, which consist of thermoelectric cooling systems. The
basic theory and operation of thermoelectric cooling systems have been developed for
many years. Thermoelectric cooling systems are usually small heat pumps, which follow
the laws of thermodynamics in the same manner as mechanical heat pumps, vapour
compressors associated with conventional refrigerators, or other apparatus used to
transfer energy.
13

Pipes and Photovoltaic Solar Cells
Copper conducting strip
(a)
Aluminium conducting strip
[I'I\ P
IN
(iI[i Ihr
Electrical insulating layer
Figure 2-2. Schematic diagrams of two types of thermoelectric modules. (a) Type A Con figuration with ceramic insulating plates and large iuter- thermoelement separation; (b) Type B Configuration without ceramic insulating plate and with very small inter-thennoelem eilt separation.
The thermoelectric modules offer several distinct advantages over other technologies:
" Thermoelectric modules have no moving parts and, therefore, need substantially
less maintenance.
" Life testing has shown the capability of thermoelectric modules to exceed
100,000 hrs of steady state operation.
0 Thermoelectric modules contain no chlorofluorocarbons or other materials that
may require periodic replenishment.
" The direction of heat pumping in a thermoelectric system is fully reversible.
Changing the polarity of the DC power supply causes heat to be pumped in the
opposite direction--a cooler can then become a heater.
0 Precise temperature control to within -0-IT can be maintained using
thermoelectric modules and the appropriate support circuitry.
14
Ceramic plate Thermoelements

Review of Applications and Research of Thermoelectric Cooling Technologies, Heat Pipes and Photovoltaic Solar Cells
9 Thermoelectric modules can function in environments that are too severe, too
sensitive, or too small for conventional refrigeration. Thermoelectric modules are not position-dependent.
Due to all the above advantages, thermoelectric modules have found special applications in wide areas, such as military, aerospace, instrument and industrial or commercial
products in the past decade. According to the working modes, these applications can be
classified into three categories, which are coolers (or heaters), power generators or
thermal energy sensors. The applications of thermoelectric modules as coolers (or
heaters) are detailed below.
Applications of Thermoelectric Cooling Technologies
Commercially available thermoelectric modules are very reliable when used as coolers
and operated at temperatures below room temperature. However, the results of a recent
reliability study indicated that these modules might be less reliable when operated above
room temperature as generators. [Rowe D. M, 1998]
Usually, thermoelectric coolers are used in cases where the system design criteria includes such factors as high reliability, small size, low weight, intrinsic safety for
hazardous electrical environments, and precise temperature control. When
thermoelectric coolers are used in niche applications (under 25 W), their low coefficient
of performance is not an apparent disadvantage.
A thermoelectric cooling system has an electric circuit including a direct current power
source providing direct current through the electric circuit, a thermoelectric module has
at least one heat sink and at least one heat source capable of being cooled to a
predetermined temperature range, and a control assembly. The use of a thermoelectric
module in a cooling system has conventionally followed the basic arrangement shown in
Figure 2-3.
15

.ýI .ý yr ku rýýrf rýýýuuýruo iurka "L Liu Lu vI I u%. I 111L 1, V\rlll I- Ill IIIIlIlk l` ICI. 11ca I
P! r-', sind Photovoltaic Solar Celk
n. Cold side heat sink
Thermoelectric device
Hot side heat sink
P
Figure 2-3. Conventional arrangement for thermoelectric cooler. Q, is the heat to be pumped, Pis the electrical power supplied. Q2 is the heat dissipated to the ambient.
Thermoelectric cooling, systems are analogous to conventional refrigeration systems. For
example, a conventional cooling system includes an evaporator, a compressor, and a
condenser. In the evaporator or cold section, pressurised refrigerant is allowed to
expand, boil, and evaporate. During the change of state from a liquid to a gas, energy in
the form of heat is absorbed. In the next step. the compressor recompresses the gas into a
liquid. Further, the condenser expels the heat absorbed at the evaporator and the extra heat added by the compressor to the ambient environment.
A thermoelectric cooling system has similar subassemblies. However, thermoelectric
cooling is specifically the abstraction of heat from electronic components by the Peltier
effect. Potential uses range from the cooling of electronic components to domestic
refrigerators and air conditioner for cooling/heating a room space.
(a) Cooling Electronic Devices
Electronic devices often have specified cooling requirements. In this area, the
thermoelectric coolers have important roles because the conventional bulk cooling
systems are not fit for these niche applications. The following are examples of these
applications.
16

Review of Applications and Research of Thermoelectric Cooling Technologies, Heat
Pipes and Photovoltaic Solar Cells
One of the applications is cooling the heat-producing device to keep the device in
normal operation. By using a thermoelectric cooler arranged as a super cooler, the heat is
conducted and the temperatures of the devices are kept close to the ambient
temperatures.
Another application is to reduce the thermal noise of the electric components and the
leakage current of the electronic devices, which can improve the accuracy of the
electronic instruments [Redus R. H et al, 2001; Bale G et al, 1999; Scruggs M. K et al,
2001]. One of the examples is a cooled CdZnTe detector for X-ray astronomy. Cooling
between -30°C and -40°C reduces the leakage current of detector and allows the use of a
pulsed reset preamplifier and long pulse shaping times, significantly improving the
energy resolution. Although the heat is conducted from the very low temperature (-
40°C) to the chilled water of 10°C, it is only necessary to use 3W of electrical power for
this small capacity application.
In the aforementioned applications, an electronic device to be cooled is usually directly
physically mounted on the cold side of one or more thermoelectric modules allowing
maximum thermal transfer between the electronic device and the cold side. The hot side
of the thermoelectric module is coupled to a heat sink and a fan or water is used to cool
the hot heat sink. Nature convection is also used in some cases. A variable source of
direct current connected to the thermoelectric coolers to allow them to lower the
temperature of the electronic devices.
Applications of thermoelectric modules for cooling electric devices require very small
and low current thermoelectric modules. The low-cost, general-purpose thermoelectric
modules for cooling instrumentation, laboratory apparatus and consumer appliances etc
are commercially available, such as FRIGICHIP CP Series thermoelectric modules
provided by Melcor company.
Thermoelectric coolers are also widely employed in microelectronics to stabilise the
temperature of laser diodes, to cool infrared detectors and charge-coupled devices
(CCD), and to reduce unwanted noise of integrated circuits. For this application, the
17

Review of Applications and Research of Thermoelectric Cooling Technologies, Heat
Pipes and Photovoltaic Solar Cells
conventional thermoelectric coolers are bulk and are incompatible with microelectronic
fabrication processes. Therefore, the thin film thermoelectric coolers have been designed
by using micromachining technology and can be integrated in microelectronic circuits.
Figure 2-4 (a) and (b) are schematics of a proposed thin film thermoelectric cooler with
infrared component integrated into cooled central region. This thin film thermoelectric
cooler can be fabricated as follows: a very thin amorphous SiC film is `laid down' on a
silicon substrate using conventional thin film deposition and a `membrane formed by
removing the silicon substrate over the desired regions using micromachining. N- and p-
type thermoelements are then deposited on the membrane to form thermocouples.
Thermocouples are configured so that the central region which is to be cooled is
surrounded by the cold junctions of the Peltier thermocouples, while the hot junctions
are located on the outer peripheral area which rests on the silicon substrate rim. Heat is
pumped laterally from the central region to the silicon substrate rim and then dissipated
vertically through it to an external heat sink. Theoretical analysis indicates that the
coefficient of performance and heat pumping capacity, when operating at a temperature
difference of 20°C, are 0.6 and 1mW, respectively. The maximum temperature
difference of 30°C can be obtained for a thermoelement length l of 0.15mm. [ Gao M et
al., 1999]
(b) Refrigerator and Air Conditioner
In addition to cooling the electronic devices, thermoelectric modules are widely used in
other niche applications where the cooling demands are not too great (such as portable
cooler boxes) or cases in which the energy cost is not the main consideration (such as
military applications). However, their applications in cooling large thermal capacity
components or spaces have been limited due to the relatively low COP and high energy
cost. The COP of a present thermoelectric refrigerator is typically < 0.5 when operating
at temperature difference AT- 20°C.
18

iýý, ýýý V v, ý rýýiklýýl, illlvu. ý Uuu ill, . ý\, ýu l. u vl lýýl, l ýýýl ll. ýl, l, U ll. L. VVllll` IC1111 I111U`IC1, licat
Pipes and Photo oltaic Solar Cells
\lctalifatiun
P-tmpc I'cIticr thermociL IIk nt
! \-type I'LItiCF t !i to , eIcmLnt
IioIR ill, Pads
Insulating layer/silicon substrate
Membrane
Ilot lniiCtion
('old junction
('old area
(a)
Infrared array
r vr, a, avý r ý- 1
Ii cJ
(b)
Insulating layer (Membrane)
Silicon substrate
Figure 2-4. Schematic diagrams showing an integrated thermoelectric mierocooler with infrared components integrated onto cooled central region (a) plane view and (b) cross-sectional view [Min G et al, 1999]
In recent years, the available air conditioners and refrigerators have become a way of life
for millions of people around the world. As the standard of living increases in less
developed countries, many more people will demand the convenience and comfort that
they offer. At the same time, energy costs and environmental regulations regarding the
manufacture and release of CFCs are also increasing. These facts are encouraging
manufacturers and their customers to seek alternatives to conventional refrigeration
19

Review of Applications and Research of Thermoelectric Cooling Technologies, Heat
Pipes and Photovoltaic Solar Cells
technology. One of the alternative refrigeration systems being used for an increasing
number of these solutions is thermoelectric technology [Welling Jr T. E, 1997]. As a
unique cooling device in which the electron gas serves as the working fluid, the
thermoelectric module is noiseless, inherently reliable and environmentally friendly.
Actually, examples of using thermoelectric modules for refrigerators can be found as
early as 1950's - 1960's. [Brown W. K, 1965; Boehmer A. P, 1963; Lindenblad N. E,
1954] However, the continued development on this area was slow owing to technical
difficulties and the superior performance of vapour-compresion systems in term of COP.
In recent years, due to the aforementioned reasons, the interests in the use of
thermoelectric modules for domestic refrigerator have been revived in spite of the
drawback of the low COP. Some thermoelectric modules, such as Melcor's Polar TECTh
series thermoelectric modules, was developed specifically for these low cost, high
volume, commercial applications. Many improved thermoelectric refrigerators have
been reported frequently. U. S Patent No. 6,003,319 entitled Thermoelectric Refrigerator
with Evaporating/Condensing Heat Exchanger (shown in Figure 2-5) shows an improved
heat exchanger with an evaporating surface and a condensing surface. Using this heat
exchanger can increase the COP of the current thermoelectric refrigeration system. U. S.
Patent No. 5,987,891 entitled Thermoelectric Refrigerator/Warmer Using no External
Power shows that a refrigerator/warmer convert a natural energy such as the solar energy
into electric power based on difference between the internal and external temperatures to
make an external power needless as shown in Figure 2-6. U. S Patent No. 5,927,078
entitled Thermoelectric Refrigerator shows a unit, the interior of which can be always
maintained at a high humidity by controlling the quantity of electric power to the
thermoelectric module and to the interior fan, as shown in Figure 2-7. This refrigerator
therefore can maintain the freshness of perishables, vegetables and the like for a longer
time compared to a conventional refrigerator.
20

Pipes and Photov oltaic Solar Cell;
j
Fin
Cold side heat in
Thcrnioelectnc mo
(a)
Partition Enhanced heat transfer surface
Ib1
Figure 2-5. (a) Air cooled, thermosyphon reboiler-condenser asseinbl (h) Cross-section of the hollow condensing tube with enhanced heat transfer surface /Gilley et al, 1999/
Due to the low efficiency of present thermoelectric refrigeration systeºns, use of solar
PV cells as the power of the thermoelectric refrigeration systems become attractive. The
solar energy is clean and inexhaustible. Because the supply of the solar energy is free,
efficiency of thermoelectric refrigeration system is not an overriding consideration. As
solar radiation is intermittent, a means of energy storage for periods of low insolation
and nighttime is essential. To achieve this, the thermoelectric refrigeration systems need
to be integrated with heat storage and recovery systems. The investigation on integration
of the heat storage and recovery systems with thermoelectric refrigeration systems is
imperative.
21

Review of Applications and Research of Thermoelectric Cooling Technologies, Heat
Pipes and Photovoltaic Solar Cells
0
G C
Q,
Figure 2-6. Schematic diagram of the powerless thermoelectric refrigerator/warmer. (Explanation for the Figure: 1-Lid; 2-Main body; 3-Thermoelectromotive device; 4- Out part of thermoelectric device; 5- Inner part of thermoelectromotive device; 6-Tthermoelectric module; 7-Bottom plate; 8-Radiating plate; 9-Bolts 10-Protecting
net)
CONTROL UNIT
POFAN WER POWER SUPPLY SUPPLY
7--17--K 1 IXI )'l`' 6 2
3 44
Figure 2-7. Schematic diagram of a thermoelectric refrigerator with controlling system (Explanation for the Figure: 1-Heat insulating
casing; 2-Heat insulating door; 3-First thermal conductor; 4- Secondthermal conductor; 5-Thermoelectric module; 6-Circulation jacket; 7-Interior fan)
22
00 10 ® 090

Review of Applications and Research of Thermoelectric Cooling Technologies, Heat
Pipes and Photovoltaic Solar Cells
Compared to thermoelectric refrigerators, fewer thermoelectric air conditioners are
reported. Reports on using thermoelectric modules for air-conditioning on different
occasions can be found as early as 1960's. However, after more than 30 years, only a
company supplied thermoelectric air-conditioning systems commercially [Rowe
D. M, 1995]. A few reports can be found in using thermoelectric air-conditioning for
small scale or particular case [Bojic M, 1997; Morrow R. C, 2000]. Only one recent report
can be found describing a thermoelectric air conditioner for cooling/heating a room
space, such as living rooms, restaurants, offices, or the like [Kim C. M, 2001].
Compared to conventional gas compressed air conditioner systems, thermoelectric air
conditioner systems have the following features: They can be built into a very flat unit
that can be conveniently handed on walls for building air-conditioning. They can be
easily switched between cooling and heating and proportionally adjusted to meet
requirements for air-conditioning individually. They are environment friendly, quiet, long life span and need less maintenance. Since thermoelectric modules are low DC
currents driven devices, they can accept a power supply directly from PV panel or
through DCJDC conversion. These advantages make thermoelectric devices very
attractive for building air-conditioning.
(c) Specific Applications and Prospects of the Development of Thermoelectric Cooling
Technology
Some thermoelectric equipment for specific applications in military, aerospace, instrument, biology, medicine and industrial or commercial products have been reported. The following is some examples.
A solar cell-driven, thermoelectric cooling prototype headgear (as shown in Figure 2-8. )
can be used to cool the forehead, which achieve required temperature difference between
ambient and cooling temperature (4-5°C) for thermal comfort [Hara T, 1998].
A prototype of thermoelectric "cryoconcentration cell" (shown in Figure 2-9) is
developed for obtaining concentrated orange juice, which use Peltier effect as an
23

Pips: und Photovoltaic Solar Cells
alternative to the traditional methods of cryoconcentration using the conventional
refrigeration cycles based on gases stich as NH3 ISanz-Bobi M. A, 19961.
Amorphous solar cell (Flexible sheet type)
c
Cooling fin
lldgear
iseball cap)
Figure 2-8. Solar cell-driven, thermoelectric cooling
Copper heat exchanger
Thermoelectric modules
Orange juice
Copper pipe Cooling coil
Surface C, -- Surface C,
Recipient
Copper
plates
Figure 2-9. Schematic diagram of a cryocouceutratiou cell
24
Axial Thermoelectric fan nodule

Pipes and Phuto oltaic Solar Cells
An active thermoelectric intercooler is developed for heating or cooling a fluid passing
through the intercooler, as shown in Figure 2-10. The intercooler may he used to cool
gases from the compression stage of an engine turbocharger in order to increase engine
horsepower. The intercooler could also be used to cool the oil in an engine or
transmission. Alternately, the intercooler could be used to heat or cool the air provided
to the passenger compartment of a vehicle [lacullo R. S, 19961.
\ýý / 54
Figure 2-10. Schematic diagram of thermoelectric intercooler. (Explanation for the Figure: 12-Chamber; 14-Inlet pipe; 16-Fluid in; 18-Body of'the chamber; 20-Outlet pipe; 22-Fluid out; 24-Tubes; 26-Bottom of chamber; 28-Top of chamber; 30-Side plate; 32- Front plate; 34-Back plate; 36-Interior; 50-Thermoelectric modules; S2-Control system; 54- Conductive heat sink. * This Figure is from United States Patent, 5547019) /lacullo R. S, 1996/
25

Review of Applications and Research of Thermoelectric Cooling Technologies, Heat
Pipes and Photovoltaic Solar Cells
The thermoelectric coolers have been used practically widespread fields. Thermoelectric
production costs have decreased steadily and significant consumer markets of
thermoelectric coolers have opened. Around 50 types of thermoelectric cooling products
or assemblies are commercially available at present. There are an increasing number
and variety of thermoelectric products. With each new year, the imaginations of design
engineers widen with the immense possibilities of thermoelectric heating and cooling.
It is predicted [www. zts. com] that every domestic icebox could depend on
thermoelectric modules. Thermoelectric domestic heat pumps and air conditioners will
become competitive in the world market. This is because energy costs and demands can
only increase and environmental concerns can only increase. Also the environmental
treaties have banned chlorofluorocarbons. Reduced manufacturing costs of
thermoelectric modules have been opening up new markets.
2.1.2 Research on Improving Coefficient of Performance of Thermoelectric Cooling
Systems
The thermoelectric cooling technology has existed for about 40 years and found
extensive applications. The main drawback of the thermoelectric cooling systems is low
coefficient of performance (COP), particularly in larger capacity applications. The
emphasis of recent research has therefore been the improvement of the COP of
thermoelectric cooling systems by means of developing new materials for thermoelectric
modules, optimisation of the module design and fabrication, improvement of heat
exchange efficiency as well as use of multistage module.
The new thermoelectric materials with large figure of merit could make a breakthrough
on improving module efficiency and the new theory of optimising the module
construction could make a great improvement on module performance. These are yet to
be realised in practice. Advances of research on heat exchange capacity and use of
multistage module are described in the following sections.
26

Review of Applications and Research of Thermoelectric Cooling Technologies, Heat
Pipes and Photovoltaic Solar Cells
(a) Improvement of heat exchange capacity
The COP (optimum COP) of a specific thermoelectric module is a function of module's
hot and cold side temperatures respectively. Increasing the cold side temperature and
decreasing the hot side temperature will improve the COP.
Figure 2-11 shows the calculated COP of a commercially available module as a function
of temperature difference between the hot and cold side, at a hot side temperature of
300K, which is a typical condition for domestic refrigeration. It is shown that the COP of
a thermoelectric module decreases with an increase in the temperature difference
between the module's hot and cold side.
3
2.5
2
1.5 O 0
1
0.5
0
Figure 2-11. COP as a function of temperature difference across the module at hot side temperature Th=300K [Gao M, 2000]
27
05 10 15 20 25 30 35 40 45 50
Temperature difference, Th-T, (K)

Review of Applications and Research of Thermoelectric Cooling Technologies, Heat
Pipes and Photovoltaic Solar Cells
For a typical domestic refrigerator, a temperature difference between the ambient and the
cabinet of about 25-30K at Th=300K is usually required to achieve satisfactory cooling
performance. This indicates that the maximum COP of a thermoelectric refrigerator
comprised of commercially available modules is around 0.9-1.2, as shown in Figure 2-
11. However, the practical COP of a thermoelectric refrigerator is much lower than this
because the temperature difference between the hot and cold side of the thermoelectric
modules is larger than the temperature difference between the ambient and the cabinet.
In other words, the hot side temperature is higher than the ambient and the cold side
temperature is lower than the cabinet temperature.
For a practical thermoelectric refrigeration system, the hot side heat exchanger rejects
the heat produced on the hot side of the thermoelectric modules to the ambient and so
reduces the hot side temperature. The cold side heat exchanger dissipate the heat from
the cold region to the cold side of thermoelectric module and so increases the
temperature of the cold side. Because the thermoelectric modules are very high heat
intensity equipment, the high capacity thermoelectric heat exchangers are necessity.
The heat transfer capacity of the heat exchange system strongly influences the COP of
the thermoelectric cooling system. If the heat transfer capacity of the heat exchange
system is high, the temperature difference between hot and cold side of the
thermoelectric cooling system may be reduced significantly, and the COP will be
increased. If the heat transfer capacity of the heat exchange system is low, the
temperature difference between hot and cold side will be greater, and the COP will be
lower.
Heat is rejected from the hot side across a heat exchanger to the ambient. This is defined
by:
R (2-1) Qh =
Th -T°
28

Pipes and Photovoltaic Solar Cells
As shown in equation (2-1), the hot side temperature may be calculated as a function of
the heat exchanger thermal resistance R,, under specific heat flow at hot side Qi, and
ambient temperature T. The R, determines heat dissipating from the hot side of the
thermoelectric modules by heat exchanger.
In principle, heat exchangers in thermoelectric cooling systems should be designed to
minimise their thermal resistance under restrictions such as the size of the system and
heat transfer method and system design method, because as the thermal resistance of the
heat exchangers increases, the efficiency of thermoelectric cooling systems decreases.
Typical heat exchanger designs include natural convection, and forced convection heat
exchangers for heat rejection to air, and forced convection heat exchangers for heat
rejection to water flow, as shown in Figure. 2-12.
The typical heat exchanger thermal resistance for a 45 by 45mm square thermoelectric
module is [Webb R L. 1998]:
a
ýý° (`)
(b)
Figure 2-12. Common heat exchanger designs: (a) natural air convection; (b) forced air convection (heat sink not shown, for clarity); (c) water-cooled. forced
convection l Webb R L. 19981
I) Natural convection: 0.853-13.075 m-'K/kW, depending on the fin density and the
ratio of the heat exchanger base plate area to the thermoelectric module area. Higher
29
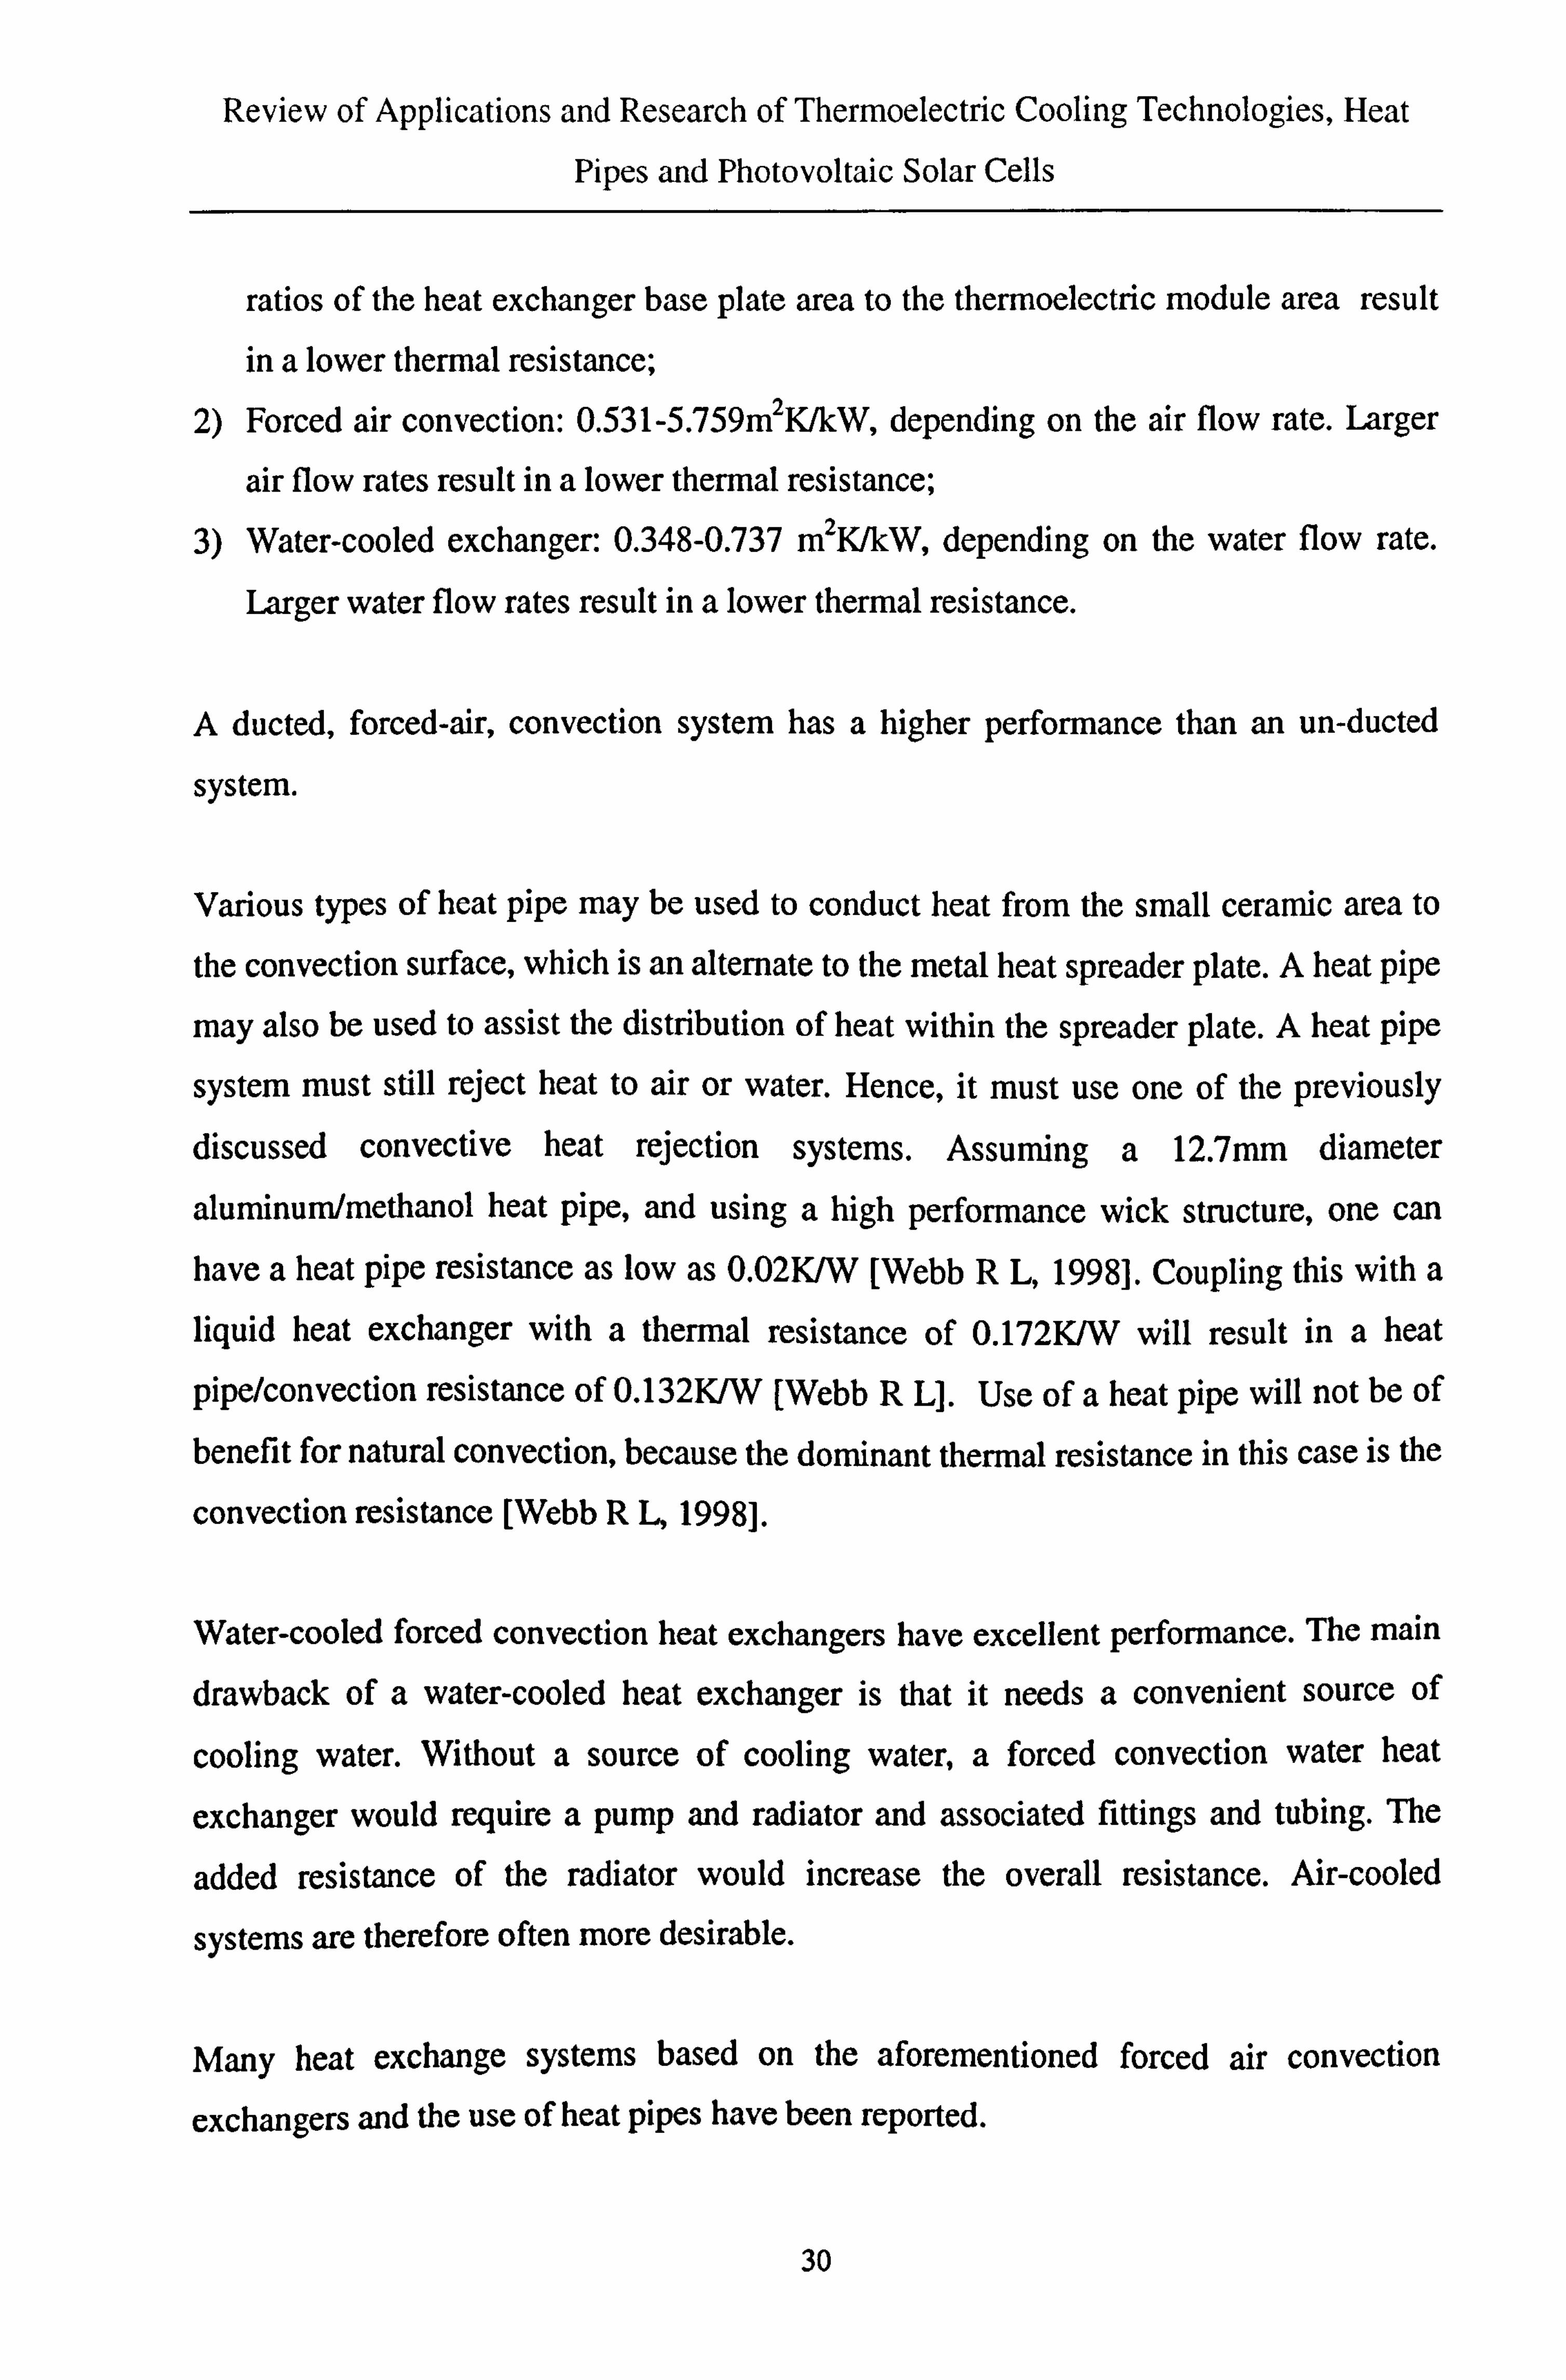
Review of Applications and Research of Thermoelectric Cooling Technologies, Heat
Pipes and Photovoltaic Solar Cells
ratios of the heat exchanger base plate area to the thermoelectric module area result
in a lower thermal resistance; 2) Forced air convection: 0.531-5.759m2K/kW, depending on the air flow rate. Larger
air flow rates result in a lower thermal resistance;
3) Water-cooled exchanger: 0.348-0.737 m2K/kW, depending on the water flow rate.
Larger water flow rates result in a lower thermal resistance.
A ducted, forced-air, convection system has a higher performance than an un-ducted
system.
Various types of heat pipe may be used to conduct heat from the small ceramic area to
the convection surface, which is an alternate to the metal heat spreader plate. A heat pipe
may also be used to assist the distribution of heat within the spreader plate. A heat pipe
system must still reject heat to air or water. Hence, it must use one of the previously discussed convective heat rejection systems. Assuming a 12.7mm diameter
aluminum/methanol heat pipe, and using a high performance wick structure, one can have a heat pipe resistance as low as 0.02K/W [Webb R L, 1998]. Coupling this with a liquid heat exchanger with a thermal resistance of 0.172K/W will result in a heat
pipe/convection resistance of 0.132K/W [Webb R L]. Use of a heat pipe will not be of benefit for natural convection, because the dominant thermal resistance in this case is the
convection resistance [Webb R L, 1998].
Water-cooled forced convection heat exchangers have excellent performance. The main
drawback of a water-cooled heat exchanger is that it needs a convenient source of
cooling water. Without a source of cooling water, a forced convection water heat
exchanger would require a pump and radiator and associated fittings and tubing. The
added resistance of the radiator would increase the overall resistance. Air-cooled
systems are therefore often more desirable.
Many heat exchange systems based on the aforementioned forced air convection
exchangers and the use of heat pipes have been reported.
30

Review of Applications and Research of Thermoelectric Cooling Technologies, Heat
Pipes and Photovoltaic Solar Cells
Sofrata H (1996) reported that using a double fan in an appropriate position could
significantly increase the efficiency of the forced air exchanger compared to using the
single fan in a refrigerator. A long chimney for a natural-convection heat exchanger may
also improve the performance of the refrigerator without the need to use fans that, of
course, require the electrical power input.
A novel, air-cooled thermosyphon reboiler-condenser system has been reported [Webb-
R. L, 1998], as shown in Figure 2-5, and has been used as a heat exchanger of a
thermoelectric refrigerator [Gilley, 1999]. This system is capable of providing very low
heat sink resistance values with air-cooling and a thermal resistance as low as 0.0194-
0.0505K/W was obtained for cooling a 45mm square module. The system promises
significantly higher COP for thermoelectric coolers than is possible using existing heat
exchange technology. The high performance is obtained using of enhanced heat transfer
surfaces.
As shown in Figure. 2-5 (a), the heat exchanger includes a boiling chamber, and a
condensing chamber. The boiling surface inside the boiling chamber has a porous metal
coating to enhance its heat transfer. The working fluid, which has been heated in boiling
chamber to its vapour phase, can flow upwardly through the hollow tube into the
condensing tube in condensing chamber. As shown in Figure. 2-5 (b), each condensing tube includes partitions, which provide the required structural strength for respective
tubes and also increase the total surface area contained within each condensing tube. Enhanced heat transfer surfaces are preferably formed on the interior surface of each
condensing tube. The working fluid that has been condensed into its liquid phase in the
condensing chamber will flow through the hollow tube downward into the boiling
chamber.
In general, thermoelectric module is very high heat intensity equipment, which need
high efficiency heat exchangers to lower the hot side temperature and increase the cold
side temperature in order to improve the COP. However, the optimum design and
selection of the heat exchangers should be a compromise of efficiency, convenience, size
and cost etc.
31

Pipes and Photovoltaic Solar Cells
Use of a greater number of modules would also improve the COP of the system. Use of'
more modules would reduce the heat load on each module, and so lower the heat flux
densities of both the hot and cold side of each module. The hot side temperature could
therefore be reduced more by the heat exchange system. The main disadvantage of this is
however, that the use of many modules would increase both cost and space
requirements.
(b) Use of Multistage ºlodule
The COP of thermoelectric refrigeration system decreases rapidly with increasing
temperature difference but its performance can be improved by the use of multistage
thermoelectric modules. To give the concept of the multistage module, the typical
designs of a single-stage module and a multistage module are shown in Figure. 2-13 for
comparison.
-ti'ý-ýG7A'e'-, U, ýS nýnei'.
Figure 2-13. Typical thermoelectric module designs (a) single-stage module; (b) multistage module [Guyer F_ C, 19881
Lindler Keith W (1998) investigated the improvement in performance that could be
obtained using a multistage module. The results showed a comparison of COP as a
function of hot side temperature (with a fixed cold side temperature of 20°C) for a
single, commercially available CP 1.0-17-08L module, and two CP 1.0-17-08L cascaded
modules. For a hot side temperature around 50°C (temperature differences of 30°C), the
improvement in COP was too small to justify the added cost of a cascaded
thermoelectric module. For a hot side temperature of 60°C, the single module operated at
a COP of 0.670 compared to a COP of 0.7 19 for the cascaded module. This represents a
7.37% improvement in COP. For hot side temperature above 90"C, the improvement in
32

Review of Applications and Research of Thermoelectric Cooling Technologies, Heat
Pipes and Photovoltaic Solar Cells
COP is significant. At a hot side temperature of 100°C, the single module COP is 0.151
compared to 0.232 for the cascaded module. [Lindler Keith W, 1998] This represents a
54% improvement in COP. This showed the multistage modules suits for the system that
has large temperature difference with high hot side temperature to improve the COP.
For large temperature differences (over 40°C), the improvement in COP of the cascaded
system results in a much smaller heat rejection requirement, and thus, a smaller fin can
be used to reject heat to ambient. [Linder Keith W, 1998]
Optimum temperature staging has been investigated to minimise entropy generation in a
multi-stage cryogenic refrigeration cycle [Jeong S et al]. It was found that the best
intermediate temperature distribution was to have the same high to low temperature ratio
at each stage of the system. As an example, the result could be applied to the design of a
cryogenic cascade thermoelectric cooling system to find the optimum size distribution of
each stage. Research on improvement of COP including several aspects as aforementioned. However, a thermoelectric module performance analysis for optimum selection (design)
of the modules for a specific application has not mentioned. Optimum selection (design)
of the thermoelectric module in the system design should play an important role for
improving the system's performance.
2.2 Heat Pipes and Heat Pipe Thermal Performance Analysis
Heat pipes are simple heat transfer devices, having high, effective thermal conductivity
and capable of transporting large amount of heat over considerable distances. Because of
the simplicity of design and ease of manufacture and maintenance, these devices have
found applications in a wide variety of areas, including energy conversion systems,
cooling of nuclear rectors and electronic equipment, space apparatus and the solar
energy system. [Abhat A., 1982; Riffat S. B. et al, 2000; Riffat S. B., 2000]
Heat pipes make use of the evaporation of a suitable working fluid, transport of the
latent heat of vaporization, condensation of the vapour and back flow of the condensate
to the area where evaporation takes place [Dunn and Reay, 1982]. The means of
transporting the condensate from the condensation zone to the evaporation zone is the
33

Review of Applications and Research of Thermoelectric Cooling Technologies, Heat
Pipes and Photovoltaic Solar Cells
major distinction between the different designs of heat pipes. Different forces can be
utilized, e. g., capillary (surface tension) forces, gravitation, acceleration (centrifugal)
forces, thermally induced pressure differences or some combination of these.
Heat pipes can be designed and constructed with various cross-sectional areas and
geometries as small as 0.6mm x 0.6mm and 25 mm in length, or 2mm in diameter and
lm in length, and as large as 100m in length [Takaoka M. et al, 1985]. All heat pipes have an evaporator and condenser section where the working fluid evaporates and
condenses respectively. Many heat pipes also have a transport or adiabatic section,
which separates the evaporator and condenser sections by an appropriate distance
intended to satisfy the heat pipe limitations and the design constraints of the application. A given heat pipe may have multiple evaporators, condensers and adiabatic sections. A
working fluid usually circulates due to the influence of capillary forces in a wick. However, gravitational, centrifugal, electrostatic, and osmotic forces can also be used to
return the liquid from the condenser to the evaporator.
Various types of heat pipes can be made to suit for different applications. The typical
heat pipe configurations include gravity-assisted wickless heat pipe (two-phase closed
thermosyphon), capillary-driven heat pipe, annular heat pipe, flat-plate heat pipe,
rotating heat pipe, leading edge heat pipe, gas-loaded heat pipe, capillary pumped loop
heat pipe and mono groove heat pipe. Heat pipe containers are generally circular
cylinders for simplicity of design and manufacturing. However, other shapes such as
rectangular (flat plate heat pipes), parallelepiped, micro/miniature, conical (rotating heat
pipes), and nose-cap (leading edge heat pipes) geometries have also- been investigated
for special applications. Figure 2-14 and Figure 2-15 [Faghri A., 1995] shows normal
gravity-assisted wickless heat pipe and normal capillary-driven heat pipe. Figure 2-16
shows a micro/miniature heat pipe.
The normal gravity assisted wickless heat pipe is without a capillary structure. It is used for operation in the earth's gravitational field. There is a certain amount of liquid in the
device, forming a pool. In operation the liquid is evaporated from the pool (pool boiling)
and a substantial part of the liquid is in permanent circulation: vapor flow from the
34

Review of Applications and Research of Thermoelectric Cooling Technologies, Heat
Pipes and Photovoltaic Solar Cells
heated areas to the condensation zone, reflux of condensate to heated area. In the
extreme case, the pool volume can disappear completely, so that evaporation takes place
only from the heated wall surfaces, which are wetted by refluxing condensate. These
devices are also called wickless heat pipes, gravity supported or, simply, gravity heat
pipes. For various reasons they can also be provided, at least partly, with a capillary
structure, e. g. to improve evaporation or liquid distribution or to support the pumping
capacity. [Groll Metal, 1992]
Heat -a -~ Conde
output. sec nser
tion , -
V fl apor ow
1J uld flow Gravity Adis tb q (PýUing film) section
Container
i
Input Evaporator section
Figure 2-14. Normal gravity assisted wickless heat pipe (two-phase closed thermosyphon)
35

Review of Applications and Research of Thermoelectric Cooling Technologies, Heat
Pipes and Photovoltaic Solar Cells
Evaporator section
Adiabatic section Evaporator
X\ )k \_ end cap
Condenser section a
Wick -Wall
Heat source
Direction Codde rý äi gravity en cap
Heat sink
Figure 2-15. Normal capillary-driven heat pipe
Figure 2-16. Cross section of micro/miniature heat pipe
Following the needs of industrial and scientific applications, various types of gravity
heat pipes with different structure have been developed. Except for classical gravity-
assisted wickless heat pipe, there are separate-type gravity heat pipe and gravity heat
pipes with flow separator, as shown in Figure 2-17 and Figure 2-18 [Groll M et al,
1992]. The separate-type gravity heat pipe consist of separated evaporator and condenser
tubes with one or more connecting common vapour and liquid flow lines, respectively.
Since this arrangement completely decouples the evaporator and the condenser parts,
two major advantages are obtained: 1) long distances between evaporator and condenser
are manageable; 2) counter-current flow limitation is eliminated, since vapor and
36

Pipes and Photovoltaic Solar Cells
condensate flow co-currently. These positive features are. however, accompanied by
higher complexity of the system and correspondingly higher manufacturing costs. The
main goal in employing flow separators is to shift the counter-current flow limitation
towards higher performance. Compared to separate-type heat pipes, flow separators offer
a very compact design. On the other hand, the disadvantages of separate-type heat pipes,
i. e. higher complexity and cost, are also valid here.
Figure 2-17. Separate-type gravity heat pipe heat exchanger
37

Pipe" and Ph(-)tosoltaic solar Cells
condensate film
phase cross-over section
vapor flow
f- 1
liquid flow
evaporator
Figure 2-18. Gravity heat pipe with cross-over flow separator
For any heat pipe. the maximum heat transport capacity is governed by five limits,
namek. the sonic limit, the entrainment limit, the boiling limit. the viscous limit and the
capillary limits. These limits could he calculated by using the techniques presented in
Dunn and RcaN ( 1982) and Babin et al (1990). and the critical limit would be the
minimum value calculated. For a gravity heat pipe, filled liquid mass also influences its
heat transfer to a certain extent, representing an additional limit which could be
calculated by the ni thod presented by Zhuang J. et a]( 1989).
2.3 Photovoltaic Solar Cells and Their Applications
Increased global warming and deterioration of the ozone layer has stimulated interest in
the use of renewable energy, in particular solar energy due to its abundance for energy
provision (cooling. heating and electricity). Systems using solar energy produce no
pollution, require little maintenance and provide a means of achieving a sustainable
environment.
38
from to from
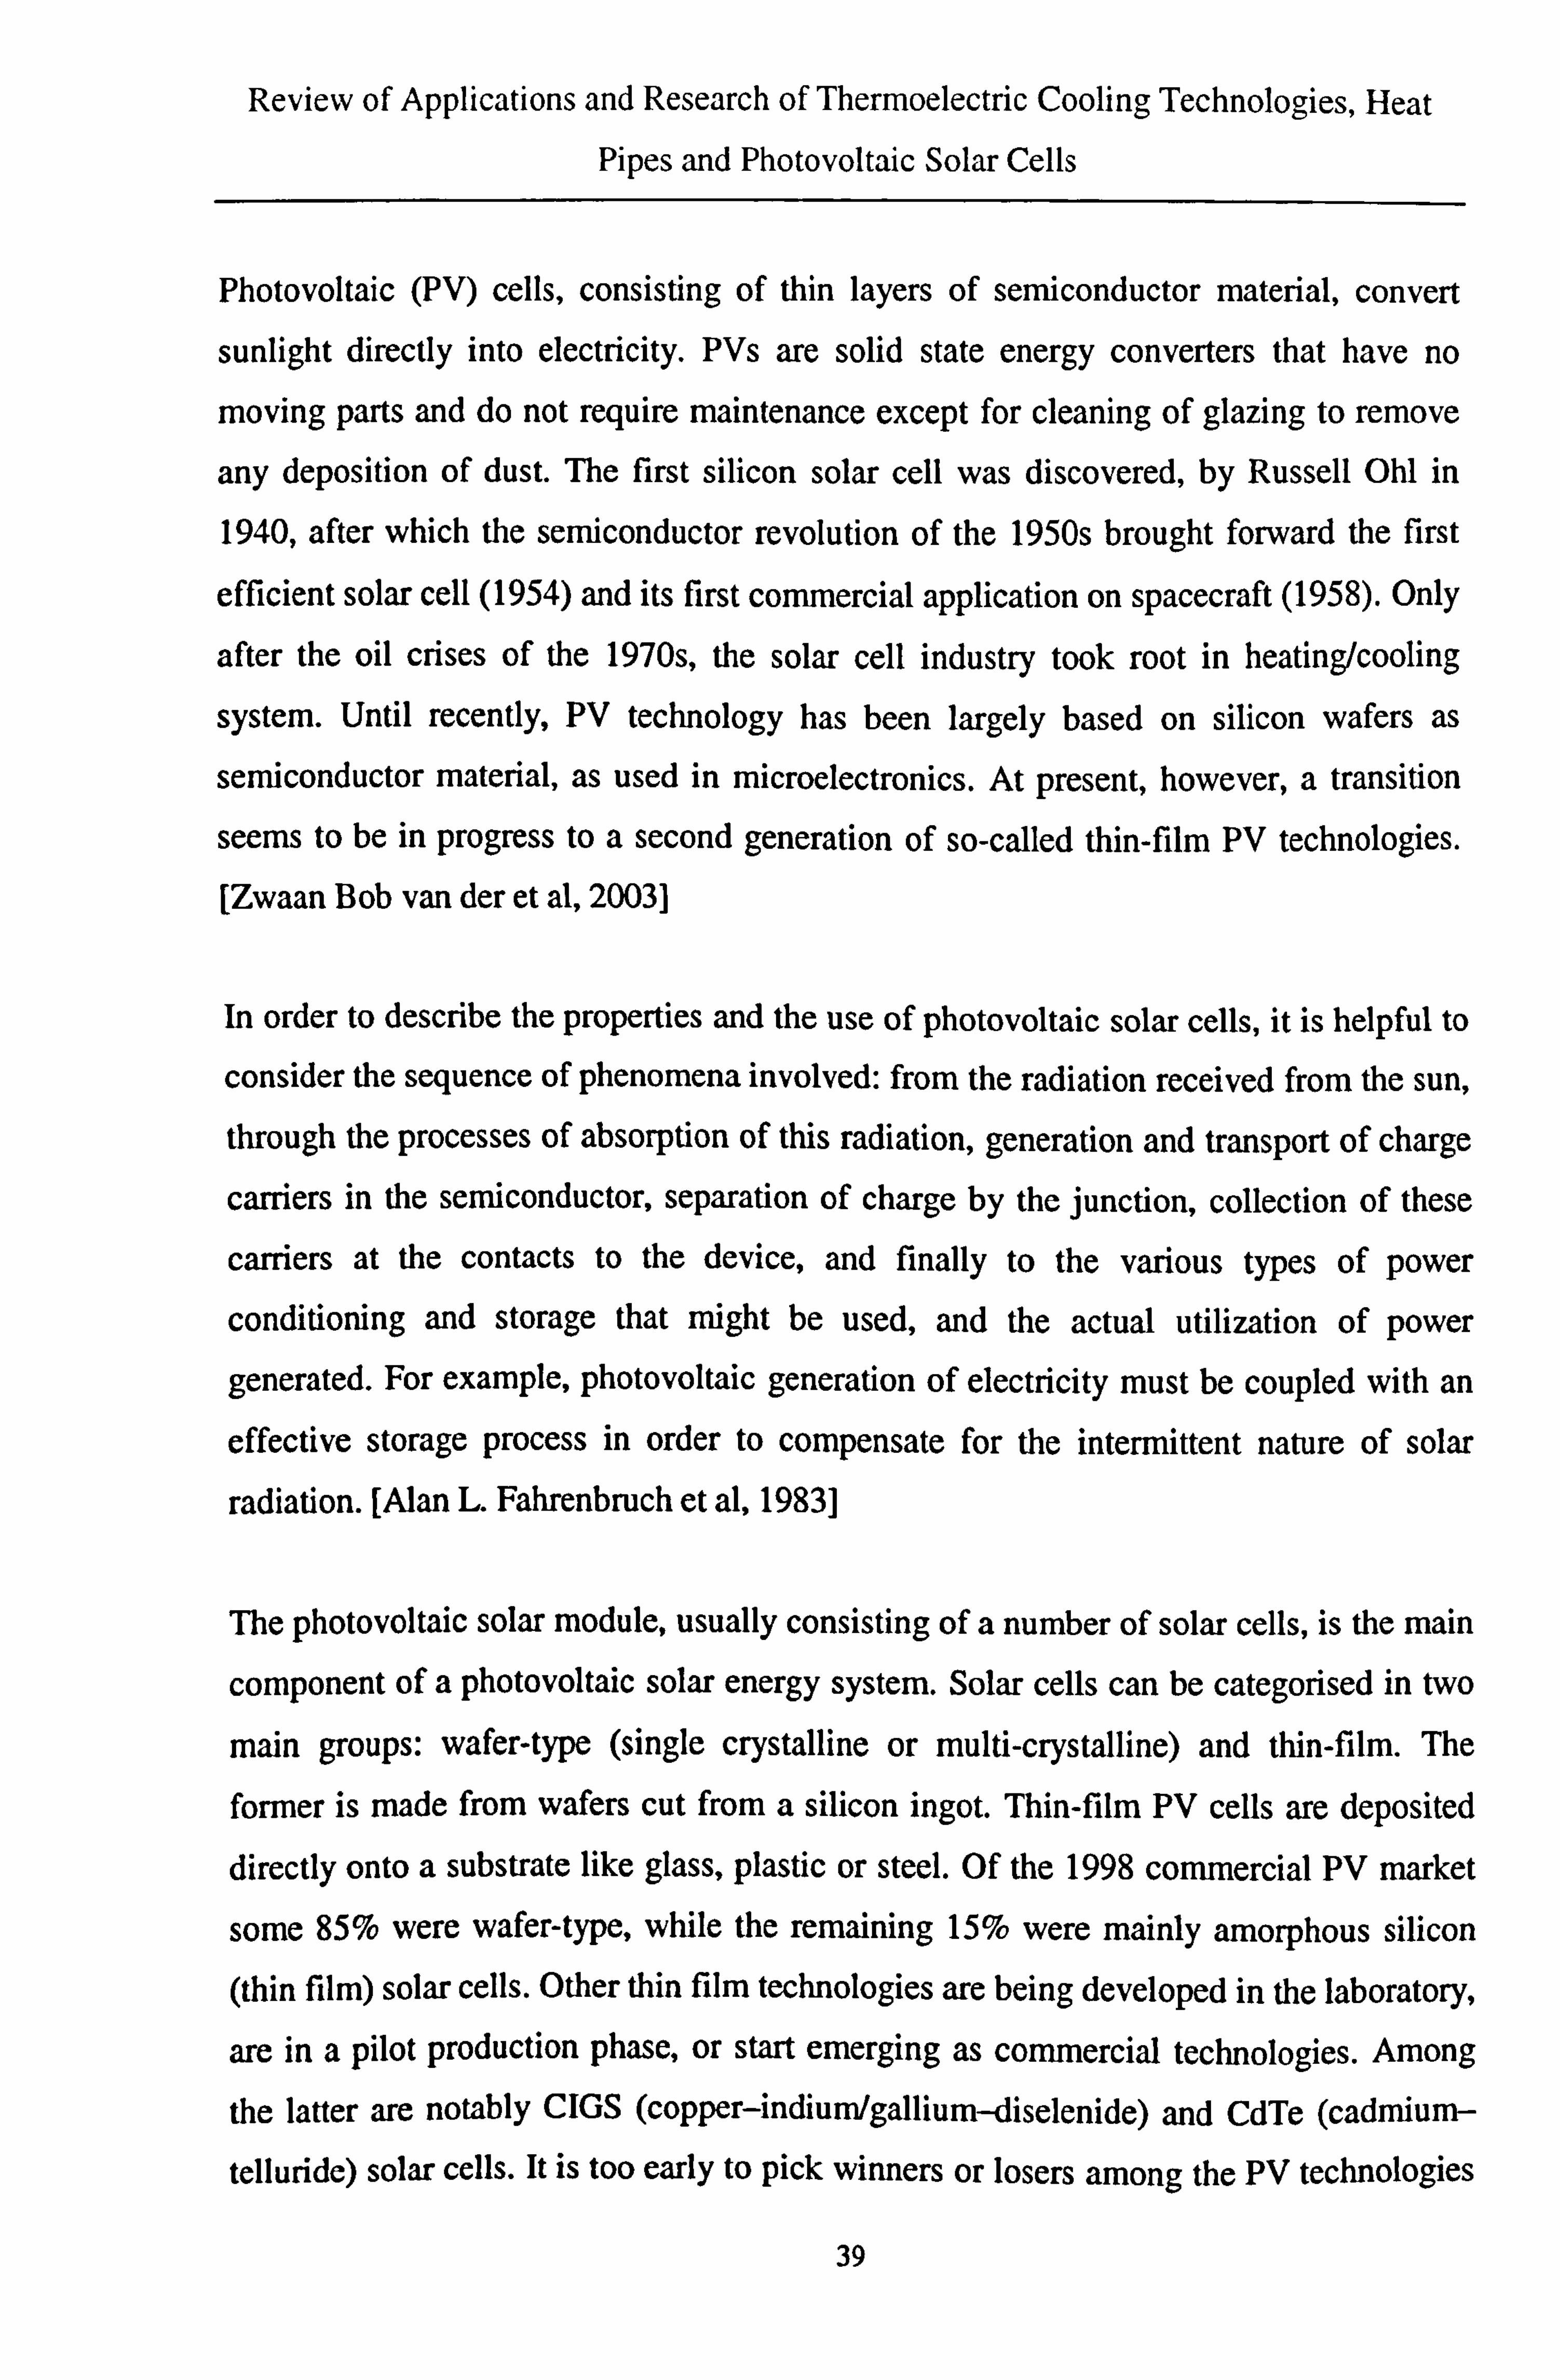
Review of Applications and Research of Thermoelectric Cooling Technologies, Heat
Pipes and Photovoltaic Solar Cells
Photovoltaic (PV) cells, consisting of thin layers of semiconductor material, convert
sunlight directly into electricity. PVs are solid state energy converters that have no
moving parts and do not require maintenance except for cleaning of glazing to remove
any deposition of dust. The first silicon solar cell was discovered, by Russell Ohl in
1940, after which the semiconductor revolution of the 1950s brought forward the first
efficient solar cell (1954) and its first commercial application on spacecraft (1958). Only
after the oil crises of the 1970s, the solar cell industry took root in heating/cooling
system. Until recently, PV technology has been largely based on silicon wafers as
semiconductor material, as used in microelectronics. At present, however, a transition
seems to be in progress to a second generation of so-called thin-film PV technologies.
[Zwaan Bob van der et al, 2003]
In order to describe the properties and the use of photovoltaic solar cells, it is helpful to
consider the sequence of phenomena involved: from the radiation received from the sun, through the processes of absorption of this radiation, generation and transport of charge
carriers in the semiconductor, separation of charge by the junction, collection of these
carriers at the contacts to the device, and finally to the various types of power
conditioning and storage that might be used, and the actual utilization of power
generated. For example, photovoltaic generation of electricity must be coupled with an
effective storage process in order to compensate for the intermittent nature of solar
radiation. [Alan L. Fahrenbruch et al, 1983]
The photovoltaic solar module, usually consisting of a number of solar cells, is the main
component of a photovoltaic solar energy system. Solar cells can be categorised in two
main groups: wafer-type (single crystalline or multi-crystalline) and thin-film. The
former is made from wafers cut from a silicon ingot. Thin-film PV cells are deposited
directly onto a substrate like glass, plastic or steel. Of the 1998 commercial PV market
some 85% were wafer-type, while the remaining 15% were mainly amorphous silicon (thin film) solar cells. Other thin film technologies are being developed in the laboratory,
are in a pilot production phase, or start emerging as commercial technologies. Among
the latter are notably CIGS (copper-indium/gallium-diselenide) and CdTe (cadmium-
telluride) solar cells. It is too early to pick winners or losers among the PV technologies
39

Review of Applications and Research of Thermoelectric Cooling Technologies, Heat
Pipes and Photovoltaic Solar Cells
available commercially or under development. Still, there seems reasonable consensus
that thin-film technologies offer the best long-term prospects for low production costs,
even when considerable cost reductions are to be expected for crystalline wafer
technologies resulting from technological improvements and economies of scale. On the
other hand, wafer-type silicon PV cells achieve today higher efficiencies (typically 12-
15% for flat panels on the market) than those reached by thin-film technologies (around
6-11 %). An empirical fact that might continue to hold for the longer-term future, even
while efficiency improvements will probably be achieved for various technologies to
some 20% in the medium term (up to 2020) and perhaps to some 30% in the long run
(after 2020. Thus, it seems likely that also in the future compromises (tradeoffs) need to
be made between cost and efficiency. [Zwaan Bob van der et al, 2003]
Mainly due to its high costs, PV electricity does not play a major role in global energy
supply and carbon emission abatement at present. Nevertheless, from many perspectives the development potential of PV is high, PV should be a potential major electricity
supply, since beyond 2020 its contribution to electricity production could become very
significant, given its expected cost reductions and the general desire for reduced
environmental damage and enhanced energy supply security.
A variety of photovoltaic cells suitable for stand alone and large scale pilot power
generation units are now commercially available. PVs have been used for refrigeration,
in pharmaceutical, medical and agricultural industries as well as vaccine refrigeration
units in hospitals in remote areas. In applied PVs, 20 to 80 solar cells are connected in
series (solar module) to achieve a voltage of 10-40 volts. Modules are available in sizes
ranging from few watts to about 90 watts. In most of these applications, electrical
batteries and control units are used which in addition to their cost, require frequent
replacement due to their limited life time, and also reduce the overall energy conversion
efficiency. In addition, these refrigeration systems use vapour-compression units which
have moving parts such as compressors and motors which need frequent maintenance
and replacement. They also employ refrigerants which could damage the earth's ozone
layer and increase global warming.
40

Review of Applications and Research of Thermoelectric Cooling Technologies, Heat
Pipes and Photovoltaic Solar Cells
As an alternative to these conventional refrigeration systems, thermoelectric
refrigeration systems may be used directly in conjunction with PVs to produce cooling.
The thermoelectric refrigeration systems can operate using direct current supplied from
PVs. As solar radiation is intermittent, a means of energy storage for periods of low
insolation and nighttime is essential. To achieve this, PVs and thermoelectric modules
need to be integrated with heat storage, such as PCMs, and recovery systems. Use of
PCMs to store the excess cooling allowing it to be reused in periods of low insolation
and night time, so that the system can operate day and night, without the need for large
electricity batteries.
2.4 Conclusion
A literature review was carried out to collect relevant information on applications,
development and research of thermoelectric cooling technologies, heat pipes technology
and heat pipe thermal performance analysis, and applications and development of
photovoltaic solar cells. These subjects are all related to this research, as each of those is
part of the areas the project involved, and therefore, better understanding of the technical
progress in these areas is necessary.
In section 2.1, the basic knowledge of the thermoelectric technologies and an overview
of these applications were given. The advances on the research on thermoelectric cooling
system were outlined. It was shown that the thermoelectric cooling technologies have
opened large markets and have vast potentialities for development. The interests in the
use of thermoelectric modules for domestic refrigerator and air conditioning have been
revived in spite of the drawback of the low COP. The present technologies of
thermoelectric refrigerator and air conditioning were reviewed. Ideas for further
development of thermoelectric refrigerator and air conditioning were given. It was
pointed that the emphasis of recent research has been the improvement of COP of
thermoelectric cooling systems. Several aspects that influence the COP of the
thermoelectric cooling systems are analysed and improved technologies were outlined.
41

Review of Applications and Research of Thermoelectric Cooling Technologies, Heat
Pipes and Photovoltaic Solar Cells
In section 2.2, the concepts of heat pipes were illustrated and the development of this
technology was reviewed. The varieties of heat pipes used for different applications were
summarised. Emphases were focused on the types of thermal diode. It would be
desirable to develop a new structure for thermoelectric heat pump application. Methods
used for calculating limits of heat transport capacity of normal heat pipes were listed.
In section 2.3, the concepts of PV solar cells were described, and the development of this
technology as well as its applications was reviewed. It is seen that the PVs have vast
potential to be power source in globe use. Use of PVs as the power supplies in
thermoelectric refrigeration systems to achieve the stand-alone units can overcome the
shortage of the low efficiency of thermoelectric systems.
42

Thermoelectric Module and Heat Sink
Chapter 3. Thermoelectric Module and Heat Sink
3.1 Thermoelectric Module Performance
A thermoelectric module is a simple solid-state device that converts electrical energy
into thermal energy or the reverse. A typical thermoelectric module is composed of two
ceramic substrates that serve as a foundation and electrical insulation for p-type and n-
type bismuth telluride thermoelements (semiconductors) that are connected electrically
in series and thermally in parallel between the ceramics, as shown in Figure 1-2. Passage
of a current through junctions of the dissimilar materials in the thermoelements
transports heat from a low-temperature to a high-temperature reservoir. These devices
can therefore be used either as coolers or heaters.
3.1.1 Thermoelectric Module Performance and Optimum Selection (Design) Model
This section provides a basic understanding of the performance of a thermoelectric
module. The theory of the optimum selection (design) model for thermoelectric modules
is related.
Cold-side Heat Transfer
Thermoelectric heat pumping (Peltier effect) at the cold side of a thermoelectric module
is given by:
(3-1) Qsb=2NaITc
The term a is the average Seebeck coefficient of the thermoelectric material, N is the
number of thermocouples, T, is the cold side temperature of the module, and I is the DC
current. It is seen from this relation that heat is pumped when current flows through the
module. However, the heat pumped may include other unwanted heat sources. These
heat sources are described in the following sections.
Joule Heat. Current flow generates resistive or Joule heating (Qj) in the thermoelectric
material. 50 percent of the Joule heat goes to the cold side and 50 percent goes to the hot
side. The Joule heating is given by:
QJ=2NI2p/G (3-2)
43

Thermoelectric Module and Heat Sink
Where, p is the resistivity of the thermoelectric material, and G is the geometry factor of the module (cross section area/length of thermoelectric element).
Conducted Heat. During operation, heat is conducted from the hot side to the cold side
of the module through the thermoelectric material. The rate of heat conduction is given
by:
Where, k is the thermal conductivity of thermoelectric material, and Th is the hot side temperature.
Equation (3-3) shows that Qi increases with the temperature difference across the
module. Combining Eq (3-1), (3-2), and (3-3) into the energy balance on the cold side of the module gives the following:
Qý=2N(Qsb-0.5QJ-Qw)= 2N[aITc-I2p/(2G)- kLTG] (3-4)
Equation (3-4) is the standard equation of thermal module performance. This equation
shows that a thermoelectric module no longer operates (Q,, =O) when the sum of one half
the Joule heat (0.5Qj) and the conducted heat (Qj) equals the Peltier heat (Qsb).
The electrical energy consumption of the module is given by:
QE=N=2N(I2p/G+aIOT)
Equation (3-5) shows that the electrical power consumption of a thermoelectric module is used to generate the Joule heat and overcome the Seebeck effect, which generates
power due to the temperature difference between the two sides of the module.
Qcd=2Nk(Th-TC)G= 2NkATG (3-3)
(3-5)
The COP of the thermoelectric module for cooling is given by:
C=QJQE alT, -kATG-I2p/(2G) (3-6)
I2p/G+a10T
44

Thermoelectric Module and Heat Sink
It is seen from Eq(3-6) that the COP is a function of the material property coefficients
and geometry factor of thermoelectric element, the temperatures of the hot side and cold
side, and the current input. For specific modules and working temperatures, there exists
an optimum current for maximum COP.
Solving the equation j
=0, the optimum current for the maximum COP can be given
by:
I0pt=[kiTG(1+(1+ZTm)1/2)]/( aT1, ) (3-7)
Replacing I in Eq (3-6) by Iopt, the maximum (optimum) COP can be given by:
Eopi=(TnJAT)[((1+ZTm)112-1)/((1+ZTm)112+1)]-1/2 (3-8)
where
Tm=1/2(Th+Tc) (3-9)
Z--2 /(Pk) (3-10)
It is seen that the maximum COP under the optimum current is a function of Th, TT and
the figure of merit of thermoelectric material Z.
Hot-side heat transfer
An energy balance on the hot side of the thermoelectric module gives:
Qh=2N((xITh+I2p/(2G)- ktTG)
Qh can also be assessed by the second thermodynamics law, i. e.,
Qh=QC+QE
(3-11)
(3-12)
45

Thermoelectric Module and Heat Sink
From the equation (3-4) and (3-5), we obtain the following equation:
Qh=2N[aITc-I2p/(2G)- kOTG]+ 2N(I2p/G+aIAT)
=2N[aITh+I2p/(2G)- kLTG] (3-13)
It can be seen that equation (3-11) is the same as equation (3-13).
The COP of the thermoelectric module for heating is given by:
fl=Qh/QE=(Qc+QE)/QE= I+ Qc/QE
1+ czIT` -kATG-IZp/(2G) (3-14) IzpI G+ aIOT
Solving the equation j
=0, the expression of the optimum current for the maximum
COP for heating equals that for cooling, see equation (3-7).
Replacing I in Eq (3-14) by I pt, the maximum (optimum) COP for heating can be given by:
, nmx=1+ (Tn/AT)[((1+ZTg, )1/'-1)/((1+ZTm)112+1)]-1/2 (3-15)
It can be seen by the above analysis that the key point to achieve optimum (maximum)
COP is to input optimum current, i. e., the operating current of the thermoelectric
modules should equal to the optimum current expressed in Eq (3-7). As shown in Eq(3-
4) and Eq(3-11), for a specific working temperature Th and Tc, a specific operating
current is required to obtain the required coolingtheating capacity QJQh. By using an
appropriate number of thermocouples or appropriate geometry factor, which constitutes
different types of modules, the operating current can equal to the optimum current.
Computer model was established to determine the optimum number of thermocouples or
geometry factor of the modules required to make the operating current equal to the
optimum current and to achieve maximum COP for a specific cooling/heating
46

Thermoelectric Module and Heat Sink
requirement (known QCIQh, Th and Ta). The flow chart of the model is shown in Figure 3-1 and computer program in C++ language is shown in attached disk (Program A).
Start
I Input parameters
Module geometry factor G and thermoelectric material property coefficients
Working temperature
Th, Tc
Calculate average temperature Ta� temperature difference AT and figure of merit Z
Calculate optimum current I)[)t
Cooling
Input cooling capacity Q,
For cooling or heating ?
Calculate optimum number of thermocouples N by replacing current I in Eq(3-4) with optimum current loft
Heating
Input heating capacity Qh
Calculate optimum number of thermocouples N by replacing current I in Eq (3-11) with optimum current Iopt
Calculate operating voltage V Calculate operating voltage V COP (=optimum COP) COP (=optimum COP)
F-- I Change Qc/Qh, Th, Tc and G alternatively repeat the above procedure and
obtain further simulation
Figure 3-1. Flow chart of the optimum selection (design) model of thermoelectric modules
47

Thermoelectric Module and Heat Sink
For this model, it is assumed all the thermocouples (thermoelectric modules) connect in
series.
The thermoelectric material property coefficients applied in this model are taken from
Melcor company (www. melcor. com). The parameters are shown in Appendix A:
Different module geometry factors constitute different types of modules. The module
types and their geometry factors (Melcor) are shown in Appendix B, and these data were
used in the modelling carried out in section 3.1.3.
3.1.2 Validation of the Optimum Selection Model
To validate the suitability and accuracy of the model used for optimum selection (design) of thermoelectric modules, comparison was carried out between the selection
results using this model and the selection results using Melcor's commercially available thermoelectric cooler selection software. The Melcor's thermoelectric cooler selection
software provides two options of selection, i. e, better efficiency and lower cost. Using
better efficiency option we can obtain the suggested optimum thermoelectric modules (including the number and the type of the modules) and the optimum current (also
operating current) for maximum COP, which suited to the specific cooling/heating
requirements.
The results of the comparisons are shown in Figure 3-2 to Figure 3-5.
Figure 3-2 and Figure 3-3 show a comparison of the optimum thermoelectric parameters
including optimum number of thermocouples, operating (optimum) current, optimum
COP and operating voltage for various cooling capacities under fixed hot and cold side
temperatures. Figure 3-4 and Figure 3-5 show a comparison of the optimum
thermoelectric parameters for various hot side temperatures under fixed cooling capacity
and cold side temperature. The geometry factor G used in the modelling is 0.282, which
is consistent with the geometry factor of CP2-127-06 modules suggested by Melcor's
thermoelectric cooler selection software. It can be seen in Figure 3-2 to Figure 3-5 that
the optimum current and optimum COP obtained from the model are consistent with
those from Melcor's selection software. The number of thermocouples and operating
48

Thermoelectric Module and Heat Sink
voltages obtained from the model are very close to that from Melcor's thermoelectric
cooler selection software. The reason for the existence of the small difference is the Melcor's selection software suggests the required number of the modules and the model
gives the exact required number of the thermocouples. As we know, each module
contains a number of thermocouples, for example, the CP2-127-06 contains 127
thermocouples. The number of the thermocouples from Melcor shown in Figure 3-2 and
Figure 3-4 are the total thermocouples of the suggested modules, which can be just close
to the number of thermocouples by exact calculation.
In overall, the results obtained from Melcor's selection software provide verification of
the optimum selection model and indicate that the model can be used to analyses the
relations between the optimum thermoelectric parameters and cooling/heating
requirements, and provides the optimum thermoelectric parameters for a specific
cooling/heating requirement.
Compared to Melcor's software, the model has extensive use range. Melcor's software
can only be used to select Melcor's thermoelectric cooling modules, and this model can be used to select any thermoelectric cooling modules. Melcor's software can only
provide information in a small range and is not convenient for analysis, and the model is
convenient to be used to analyse the relations between the optimum thermoelectric
parameters for a specific cooling/heating requirement.
49

Thermoelectric Module and Heat Sink
5000 5
4500 1 4.5
-A- Number of thermocouples f rom kblcor 4 4000- O Number of thermocouples from model model
d -i- current from Melcor CL 3500- - COP from Melcor 3.5 : o --s- current from model £ 3000 - -. - COP f rom model 3 I
25001 2.5 v ö t
2000 , 2 v E z 1500 1.5
1000 - 1
500 0.5
0 0 0 100 200 300 400 500 600 700 800 900 1000 1100
Cooling capacity Q, W
Figure 3-2. Comparison of optimum thermoelectric parameters (I, N and COP) for
varied cooling capacities (Th=45°C, TT=17°C)
250
o vortage f rom kblcor
-, ý- voltage from model 200
ti 50 F
T 100 CL 0
50
0 0 100 200 300 400 500 600 700 800 900 1000 1100
Cooling capacity Q, W
Figure 3-3. Comparison of operating voltage for varied cooling capacities (Th=45°C, TT=170C)
50
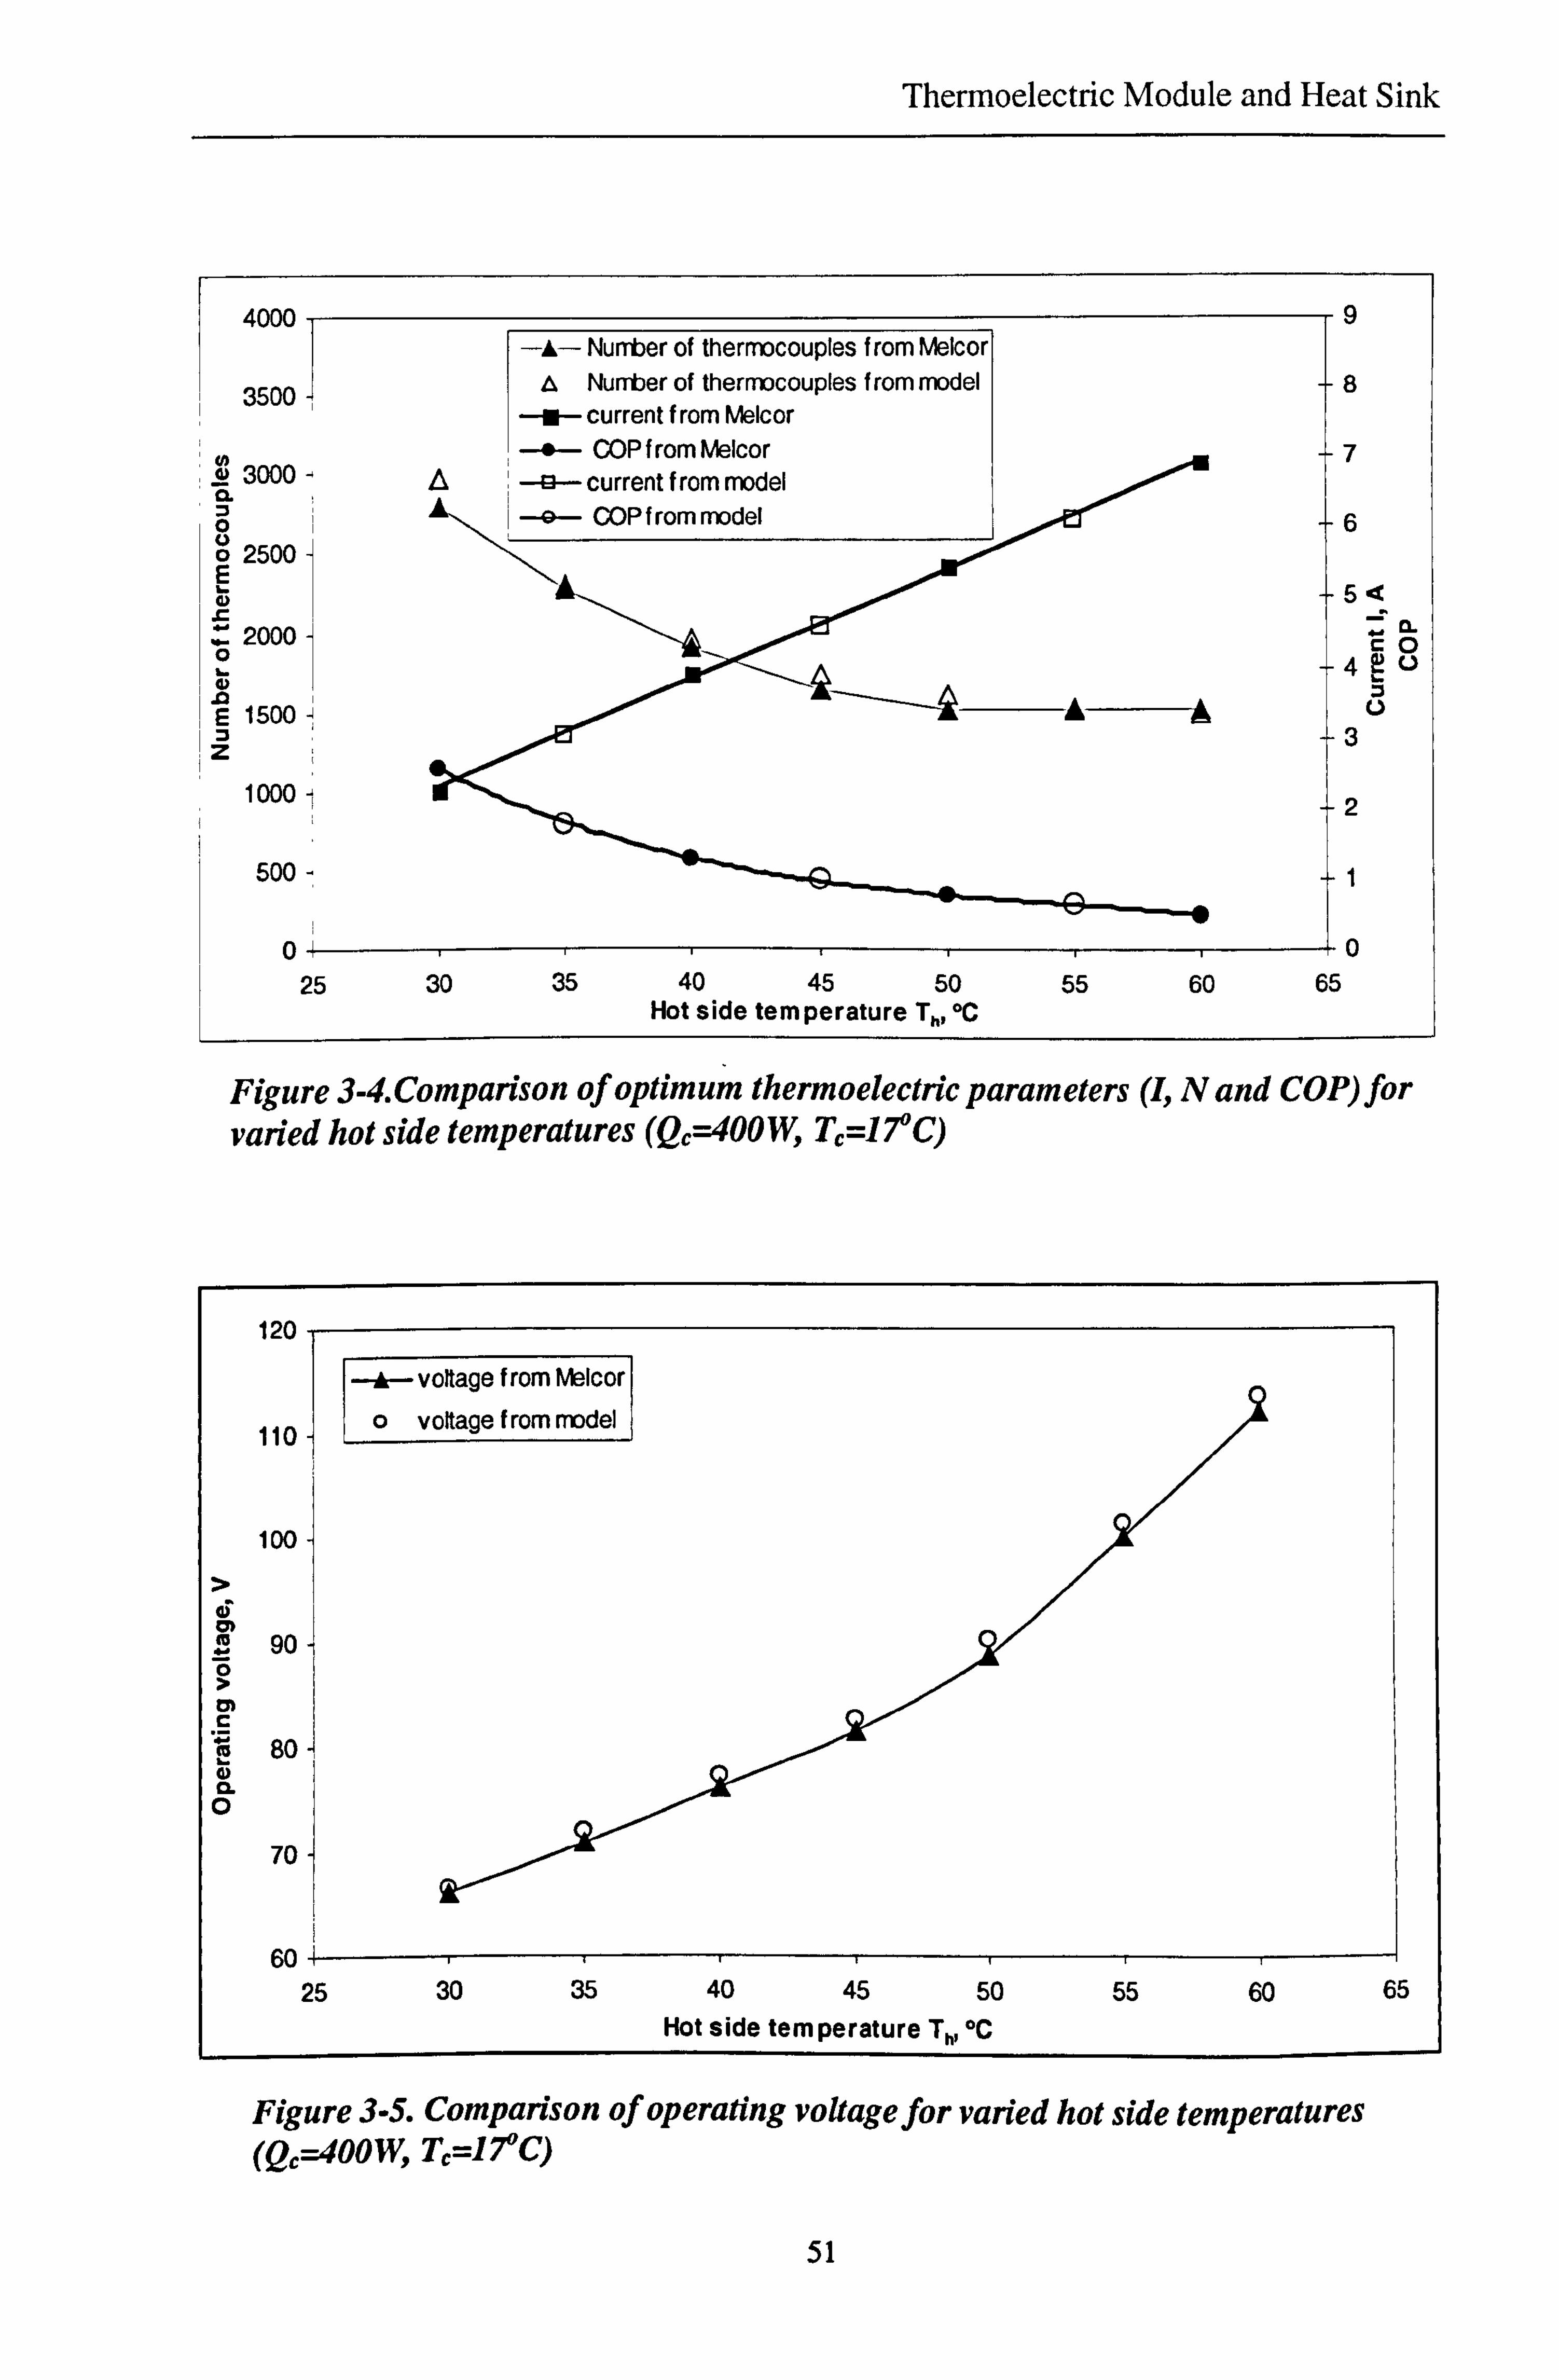
Thermoelectric Module and Heat Sink
4000
3500
R 3000 c. m 0
E 2500
d
0 2000
I- d
.0 1500 z
1000 1
500-
o 25 30 35 40 45 50
Hot side temperature T,,, °C
9
8
7
6
54 IL
4v
3
2
0 55 60 65
Figure 3-4. Comparison of optimum thermoelectric parameters (I, Nand COP) for varied hot side temperatures (Q, =40OW, TT=17°C)
120-
A, - voltage from Melcor
110 o voltage from model
100
d : °. 90 ö
o) c
80 CL 0
70
60 25 30 35 40 45 50 55 60 65
Hot side temperature T,,, °C
Figure 3-5. Comparison of operating voltage for varied hot side temperatures (Q, =40OW, TT=17°C)
51
-A- Number of thermocouples from Melcor Number of thermocouples from model
-i- current from Melcor MP f rnm ! Aclrnr

Thermoelectric Module and Heat Sink
3.1.3 Discussion of the Modelling Results
In practice, a thermoelectric heat pump works under various conditions and therefore the
cooling/heating capacity and working temperatures are variable. The cooling/heating
capacity and the working temperatures (hot and cold side temperature of thermoelectric
modules) used in the modelling should be the severest case, i. e., possible largest
cooling/heating capacity, possible highest hot side temperature and possible lowest cold
side temperature.
Cooling mode
The relation between cooling capacity (Q, ) and optimum thermoelectric parameters (N,
I, V and COP) for specific working temperature (Th, Tj and geometry factor (G), are
shown in Figure 3-6 and Figure 3-7. The simulation results show:
" The required number of thermocouples for optimum current and COP increases with the cooling capacity. This indicates that to obtain the optimum current and maximum COP, an increased cooling capacity requires an increased number of thermocouples (increased number of thermoelectric modules). An increased number of
thermocouples require an increased operating voltage. The optimum current and optimum COP are determined by thermoelectric material
property coefficients, geometry factor and working temperatures (Th, TT) [see Eq(3-
7) and (3-8)], they have no relationship with the cooling capacity. This indicates that
for the specific working temperatures, the optimum current and COP of specific
modules have definite values.
The relation between hot side temperature (Tb) and optimum thermoelectric parameters
(N, I, V and COP) for specific cooling capacity (Qj, cold side temperature (Ta) and
geometry factor (G), are shown in Figure 3-8 and Figure 3-9. The simulation results
show:
" The required number of the thermocouples for optimum current and maximum COP
decreases with the increase of hot side temperature. In other words, a higher hot side
temperature requires less thermal modules to achieve optimum current and optimum COP.
52

Thermoelectric Module and Heat Sink
" When the hot side temperature increases, the optimum current and operating voltage increases and the optimum COP decreases.
" It is seen that a lower hot side temperature has a higher optimum COP. To achieve
optimum COP, more modules are required at a lower hot side temperature than at a
higher hot side temperature.
The relation between geometry factor and optimum thermoelectric parameters (N, I, V
and COP) for the specific cooling capacity (Qj and working temperatures (Th, Ta), are
shown in Figure 3-10 and Figure 3-11.
The simulation results show:
" To achieve optimum COP, the required number of thermocouples varies with the
geometry factor. The larger the geometry factor, the fewer thermocouples are
required.
" The optimum current increases and operating voltage decreases with the increase of
the geometry factor, but the optimum COP remains the same under various geometry factors. This is because the optimum COP is determined by the working temperature
Th, TT and the figure of merit of the material and has no relationship with the
geometry factor.
" The geometry factor determines the type of thermal module. Choosing different type
of modules indicates using different number of modules. Selection of the modules
should consider the total area of the modules and the dimensions of the available heat sink.
Heating mode
The relation between heating capacity (Qh) and optimum thermoelectric parameters (N,
I, V, COP) for specific working temperature (Th, Tj and geometry factor (G), are shown in Figure 3-12 and Figure 3-13. The simulation results show:
" The required number of thermocouples for optimum current and COP increases with
the heating capacity. This indicates that to obtain the optimum current and COP, an increased heating capacity requires an increased number of thermocouples (increased
53

Thermoelectric Module and Heat Sink
number of thermoelectric modules). An increased number of thermocouples requires
an increased operating voltage.
" The optimum current and optimum COP are determined by thermoelectric material
property coefficients and working temperature (Th, Tj and have no relationship with
the heating capacity. This indicates that for the specific working temperatures, the
optimum current and COP have definite values.
The relation between cold side temperature (Ta) and optimum thermoelectric parameters
(N, I, COP) for specific heating capacity (Qh), hot side temperature (Tb) and geometry factor (G), are shown in Figure 3-14 and Figure 3-15. The simulation results show:
" The required number of thermocouples for optimum current and COP increases with
the increase of cold side temperature. In other words, a higher cold side temperature
requires a greater number of modules to achieve optimum current and optimum COP. The operating voltage increases with the required number of thermocouples.
" When the cold side temperature increases, the optimum current decreases and the
optimum COP increases.
" It is seen that a higher cold side temperature results in a higher optimum COP. To
achieve an optimum COP, more modules are required at higher cold side temperature
than at lower cold side temperature.
The relation between geometry factor (G) and optimum thermoelectric parameters (N, I,
COP) for the specific heating capacity (Q,, ) and working temperatures (Th, Ta), are
shown in Figure 3-16 and Figure 3-17. The simulation results show:
" The required number of thermocouples varies with the geometry factor to achieve an
optimum COP. The larger the geometry factor, the fewer thermocouples (fewer
modules) are required.
" The optimum current increases and operating current decreases with the increase of
the geometry factor, but the optimum COP remains the same under various geometry factors. This is because the optimum COP is determined by the working temperature
Th, T, and the figure of merit of the material and has no relationship with the
geometry factor.
54

Thermoelectric Module and Heat Sink
" The geometry factor determines the type of thermal module. Also, selection of the
modules should consider the total area of the modules and the dimensions of the
available heat sink.
6000 20 11 -. - Number of thermocouples
1A
55
Figure 3-6. Relations between cooling capacity and optimum thermoelectric
parameters (I, N and COP) for cooling mode (Th=45°C, TT=170C, G=0.282)

Thermoelectric Module and Heat Sink
5000
4500
4000
350 :a
0 ö 3000-
r 2500 -
2000
Z 1500-
1000 -
500 -
0+ 25
9n
--s- Number of thermocouples 18
- Current I, A
-A - COP 16
14
12 cO
10
-1 U 8
6
4
2
0
30 35 40 45 50 55 60 65 Hot side temperature Th, °C
Figure 3- 8. Relation between hot side temperature and optimum thermoelectric
parameters for cooling mode (Qc=60OW, Tc=17°C, G=0.282)
56
r figure s-1. tceiacwns aecween cuuung capacity ana operating vouage jur
cooling mode (Th=45°C, TT=17°C, G=0.282)

Thermoelectric Module and Heat Sink
50000
45000 III
40000-
235000- CL Z ü 30000 - O
25000 -
, 20000- 0) 1 15000 - Z
10000 -
5000 -
0] 0
20
18
16
14
12 a
loo t
8v
6
4
2 i
0 1.2 1.3
Figure 3-10. Relation between geometryfactor and optimum thermoelectric
parameters for cooling mode (Qc=60OW, Th=45°C, Tc=17°C)
57
Figure 3- 9. Relation between hot side temperature and operating voltage for
cooling mode (QC=600W , TT=17°C, G=0.282)
0.1 02 0.3 0.4 0.5 0.6 0.7 0.8 0.9 1 1.1 Geometry factor

Thermoelectric Module and Heat Sink
800
700 I
600-
500-
C) CM 400 - 0
c 300- La
p 200
100
rririi,,, r r--r 0 0 0.1 0.2 0.3 0.4 0.5 0.6 0.7 0.8 0.9 1 1.1 1.2 1.3
Geometry factor G
Figure 3-11. Relation between geometryfactor and operating voltage for
cooling mode (QC=600W, Th=45°C, Tc=17°C)
4000
3500
30 d
o 2500 0
t 2000
0
0 1500 E 3 z 1000
500
gn
o+ 0
º- Number of there ouples 18 i--Current I, A
COP 16
14
12 4
10 V
80
6 4
2
0 100 200 300 400 500 600 700 800 900 1000 1100 1200 1300
Heating capacity Q,, W
Figure 3-12. Relation between heating capacity and optimum thermoelectric
parameters (I, N and COP) for heating mode (Th=23°C, Tc=3°C, G=0.282)
58

Thermoelectric Module and Heat Sink
Figure 3-13. Relation between heating capacity and operating voltage jor
heating mode (Th=23°C, TT-3°C, G=0.282)
0 d M 0 0
Iw 0 I- dý
"5
--0- Number of thermocouples
3001 - ý- Current I, A
-f- COP
250
200
100
50
3 ýý Cold side temperature T5 °C 9
20
18
16
14
12 a
10 ýv
8
6
4
2
0 11
Figure 3.14. Relation between cold side temperature and optimum thermoelectric
parameters for heating mode (Qh=60OW, Th=23°C, G=0.282)
59

Thermoelectric Module and Heat Sink
74 1
72-'
70-
ai , °10 68 0
rn 66-,
cc ä, CL O 64
62
5 -3 -1 13579 11 Cold side temperature T, °C
Figure 3-15. Relation between cold side temperature and operating voltage for
heating mode (Qh=600W, Th=23°C, G=0.282)
60
rigure a-10. jwuucv. u vet weeri geurnecryjacror ana optimum thermoelectric
parameters for heating mode (Qh=600W, Th=23°C, TT=3°C)

Thermoelectric Module and Heat Sink
700
600
500
rn 400
0
300
v CL O 200
100
Figure 3-17. Relation between geometryfactor and operating voltage for heating
mode (Qh=600W, Th=23°C, T, °C)
3.4 Finned Heat Sink Performance
Due to the high intensity heat flux, the thermoelectric modules can not work
independently. They have to use heat sink to dissipate heat. Heat pipe can only conduct
heat from one place to other place or distribute heat to heat sink, they can not dissipate
heat efficiently. In most of the thermoelectric systems, heat sinks are essential
components to keep the systems work efficiently. An analytical model of the
performance of finned heat sink was set up, which shows the relation between the
performance of the heat sink and its geometry parameters as well as convective
coefficient. The model provides a basis for designing finned heat sink.
3.4.1 Analytical Model of the Performance of Finned Heat Sink
The analytical model was set up based on the following assumption:
" The heat sinks work under steady state conditions.
61
0"11,
0 0.2 0.4 0.6 0.8 1 1.2 1.4 Geometry factor G
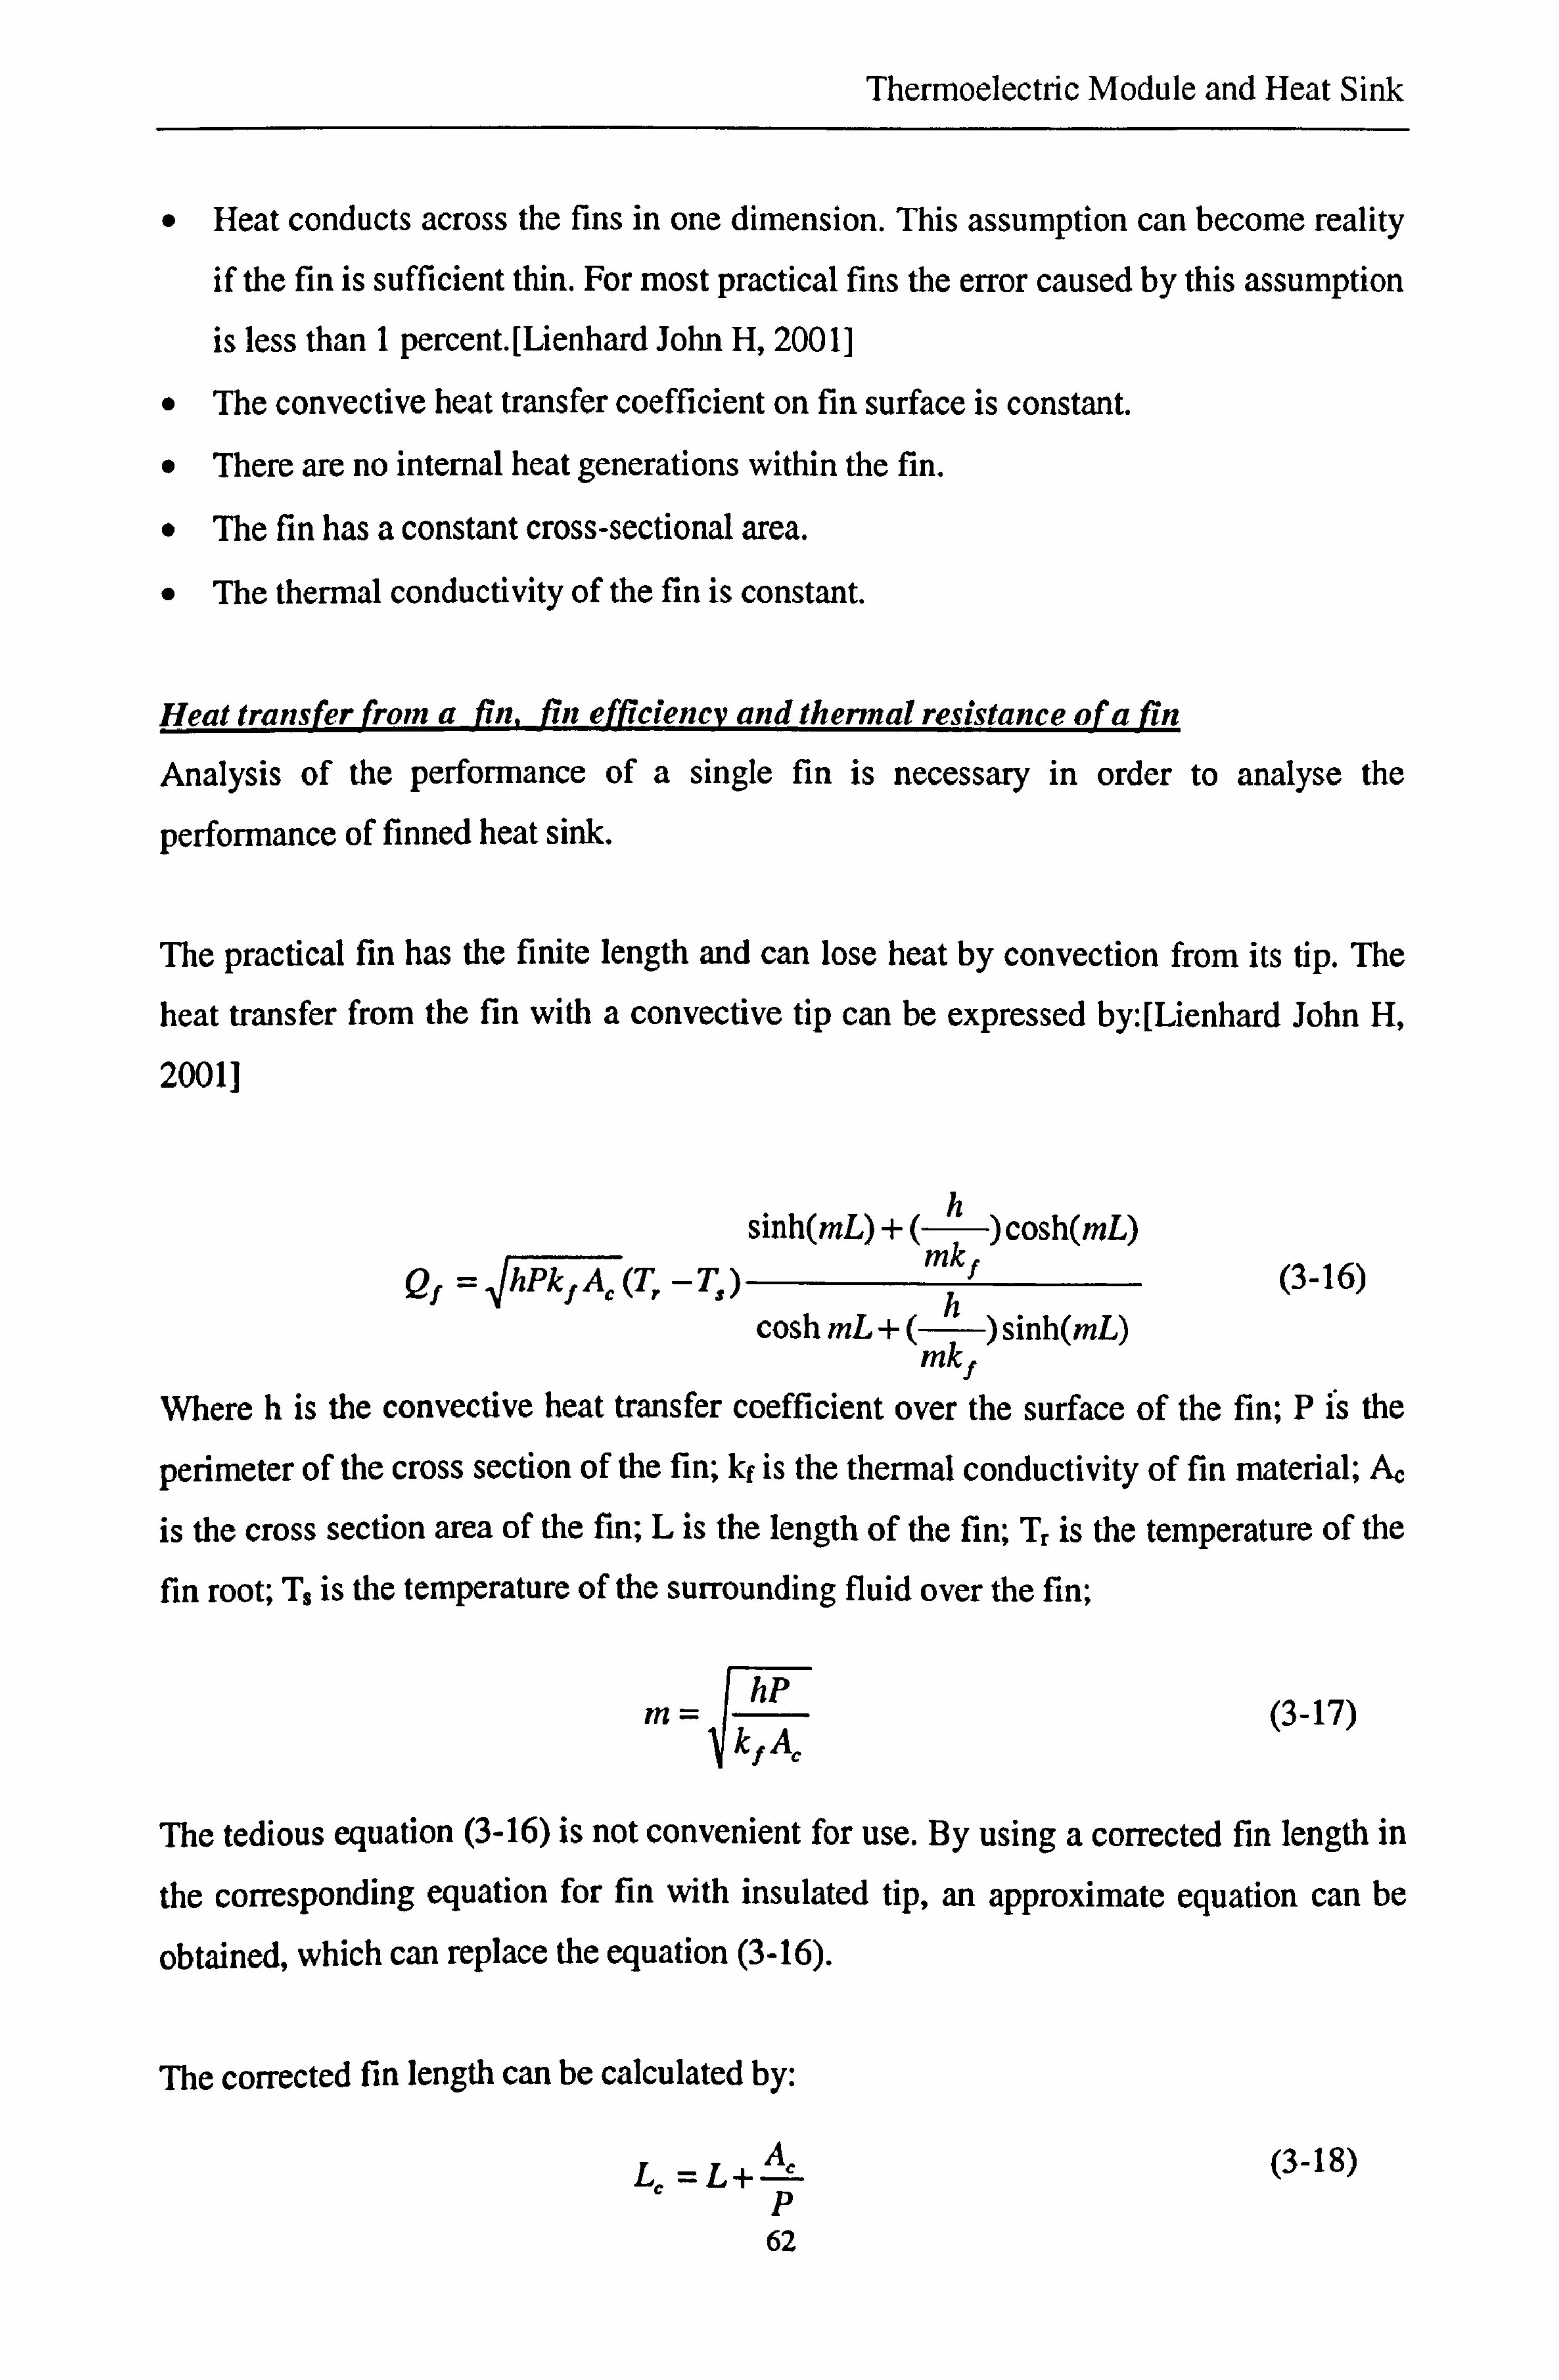
Thermoelectric Module and Heat Sink
" Heat conducts across the fins in one dimension. This assumption can become reality if the fin is sufficient thin. For most practical fins the error caused by this assumption is less than 1 percent. [Lienhard John H, 2001]
" The convective heat transfer coefficient on fin surface is constant.
" There are no internal heat generations within the fin.
" The fin has a constant cross-sectional area.
" The thermal conductivity of the fin is constant.
Heat transfer from a fin, fin efficiency and thermal resistance of a fIn
Analysis of the performance of a single fin is necessary in order to analyse the
performance of finned heat sink.
The practical fin has the finite length and can lose heat by convection from its tip. The
heat transfer from the fin with a convective tip can be expressed by: [Lienhard John H,
2001]
sinh(mL) +() cosh(mL) Qf = hPkfA,
- (T, -Ts) f (3-16)
cosh mL +(h) sinh(mL) mkf
Where h is the convective heat transfer coefficient over the surface of the fin; P is the
perimeter of the cross section of the fin; kf is the thermal conductivity of fin material; A,
is the cross section area of the fin; L is the length of the fin; Tr is the temperature of the
fin root; T$ is the temperature of the surrounding fluid over the fin;
hP k1 Aý
(3-17)
The tedious equation (3-16) is not convenient for use. By using a corrected fin length in
the corresponding equation for fin with insulated tip, an approximate equation can be
obtained, which can replace the equation (3-16).
The corrected fin length can be calculated by:
L, =L+p (3-18)
62

Thermoelectric Module and Heat Sink
The approximate equation for calculating heat transfer from the fin with convective tip is:
Qf= Pk fA., (T, -T, ) tanh(mLL) (3-19)
The fin efficiency is defined as the ratio of actual heat transferred from the fin to heat
that would be transferred if the entire fin were T=Ti. Fin efficiency provides some useful
information as to how well a fin is contrived. [Lienhard John H, 2001]
The fin efficiency can be expressed by: [Lienhard John H, 2001]
Qf -
hPkfA, (T, -Ts)tanh(mL, ) _
tanh(mL, ) 'f
hPLL(T, -Ts) hPL, (T, -Ts) mL, (3-20)
The error caused by using the above approximate equations is less than 8 percent when
h(5)v2<1
2kf 2
Where 5 is the thickness of the fin.
Changing the form of equation (3-20), the following equation can be obtained:
(3-21)
Qf =i7fhPLc(T, -T, )=i7fhAf(T, -Ts) (3-22)
Where Af--PL, is a total surface area of a fin
Change the form of equation (3-22), the thermal resistance of a fin Rf can be expressed
as follow:
Rt =T'-T'= 1
Qf ri1Ath (3-23)
Heat transfer from finned heat sink, finned heat sink efficiency and finned heat sink
thermal resistance The practical finned heat sink has a number of fins extruded from the base plate, as
shown in Figure 3-18. The total area exposed to coolant can be calculated:
63
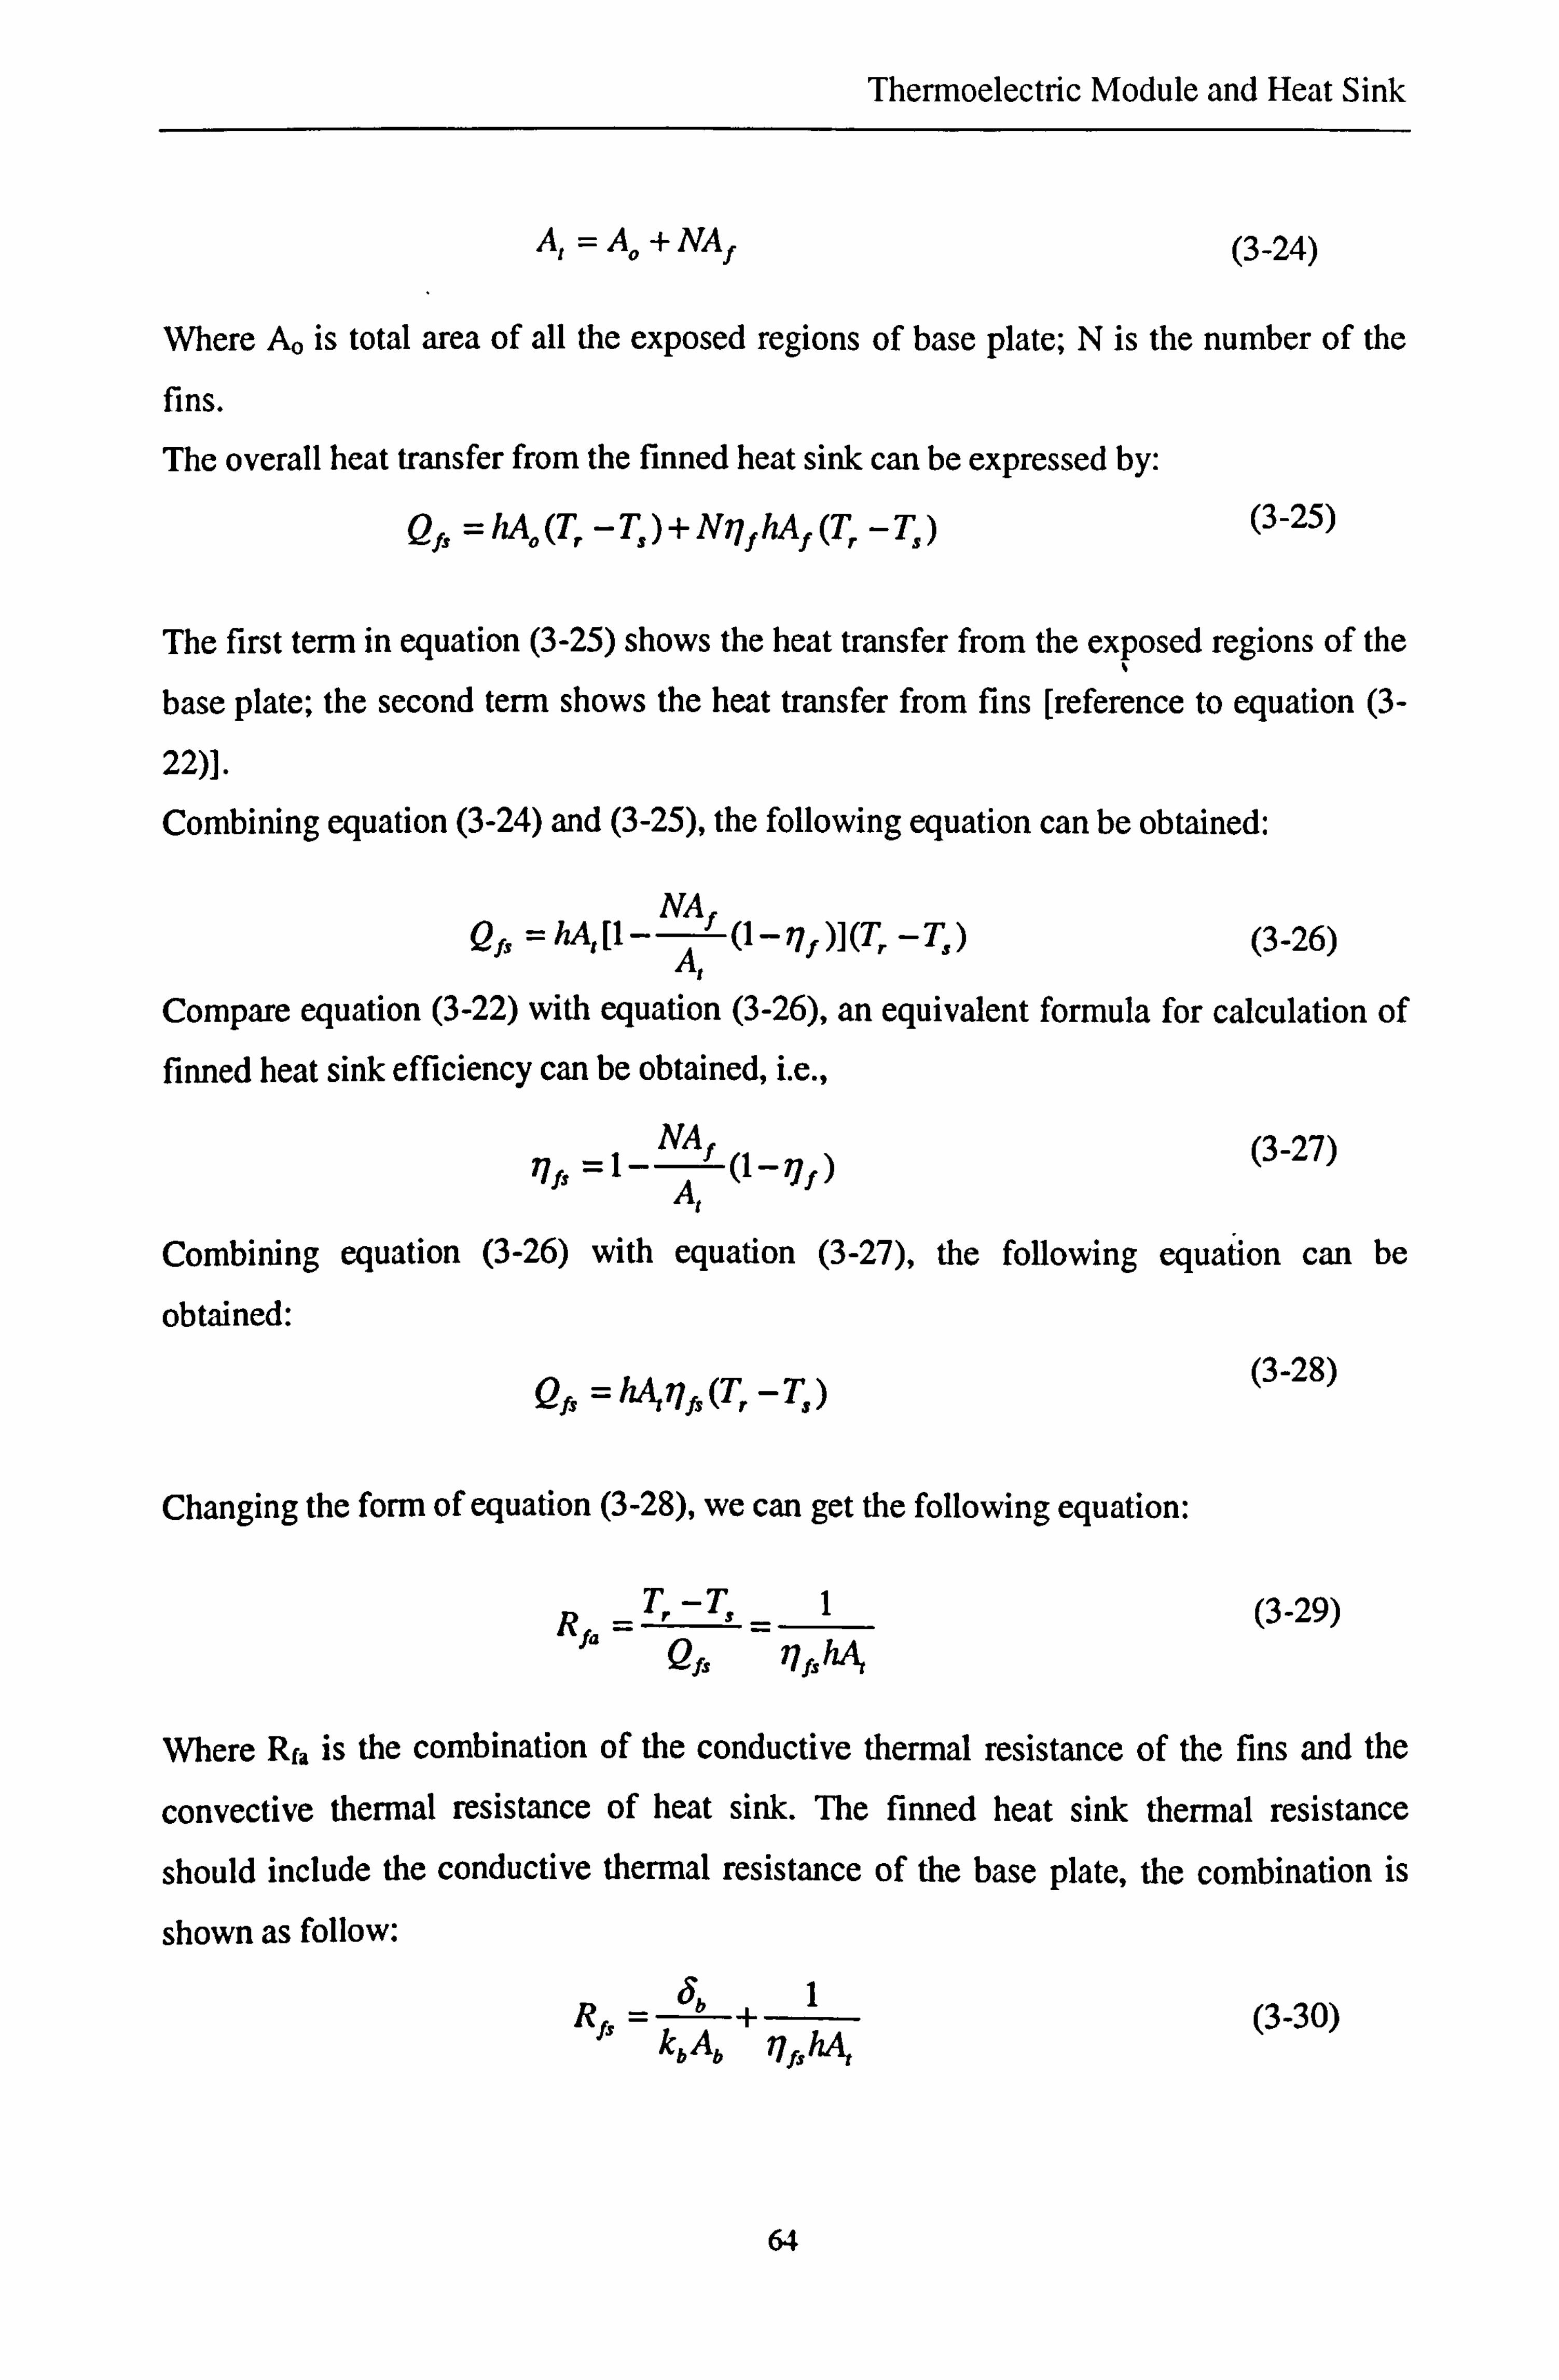
Thermoelectric Module and Heat Sink
A, = Ao + NA f (3-24)
Where Ao is total area of all the exposed regions of base plate; N is the number of the
fins.
The overall heat transfer from the finned heat sink can be expressed by:
Q1, =hA0(T, -Ts)+N _fhAf(T,. -Ts)
(3-25)
The first term in equation (3-25) shows the heat transfer from the exposed regions of the
base plate; the second term shows the heat transfer from fins [reference to equation (3-
22)].
Combining equation (3-24) and (3-25), the following equation can be obtained:
NAf Qfs =hA1[1- A
(1-rlf)](T. -Ts) (3-26)
Compare equation (3-22) with equation (3-26), an equivalent formula for calculation of finned heat sink efficiency can be obtained, i. e.,
7lfs =1-NAf (1-? If) (3-27)
Combining equation (3-26) with equation (3-27), the following equation can be
obtained:
Qfc _ ? If, (T, _Ts) (3-28)
Changing the form of equation (3-28), we can get the following equation:
RIa - T, -TT _1
(3-29) Qf, 1 y71h4 j, ý
Where Rra is the combination of the conductive thermal resistance of the fins and the
convective thermal resistance of heat sink. The finned heat sink thermal resistance
should include the conductive thermal resistance of the base plate, the combination is
shown as follow:
Rh = Sb
+1 (3-30) kb Ab h1I5M
64

Where R. is thermal resistance of finned heat sink; 61, is the thickness of' base plate; At, is
area of base plate.
Fin
13asc (plate
Figure 3-18. Schematic diagram of finned heat sink
Computer program in C++ language for the analytical model is shown in attached disk
(Profirain H ).
3.4.2 Modelling Results and Discussions
Computer modelling was carried out to explore the relations between finned heat sink
performance (heat transfer. efficiency and thermal resistance) and length of fins, number
of tins and convectiVe coefficient. This provides a basis for optimum design of tinned
heat sink.
The following parameters were assumed in the modelling:
thickness of the fins ----------------------------------------
O. Snlnl
width of the heat sink W (see Figure 3-9)-------------- 0.35m
length of the heat sink L, (see Figure 3-9)--------------- 0.15m
thickness of base plate-------------------------------------5mm
thermal conductivity of the finned heat sink (Al)------ 236W/(m. "C) [Lienhard John H,
20011
65
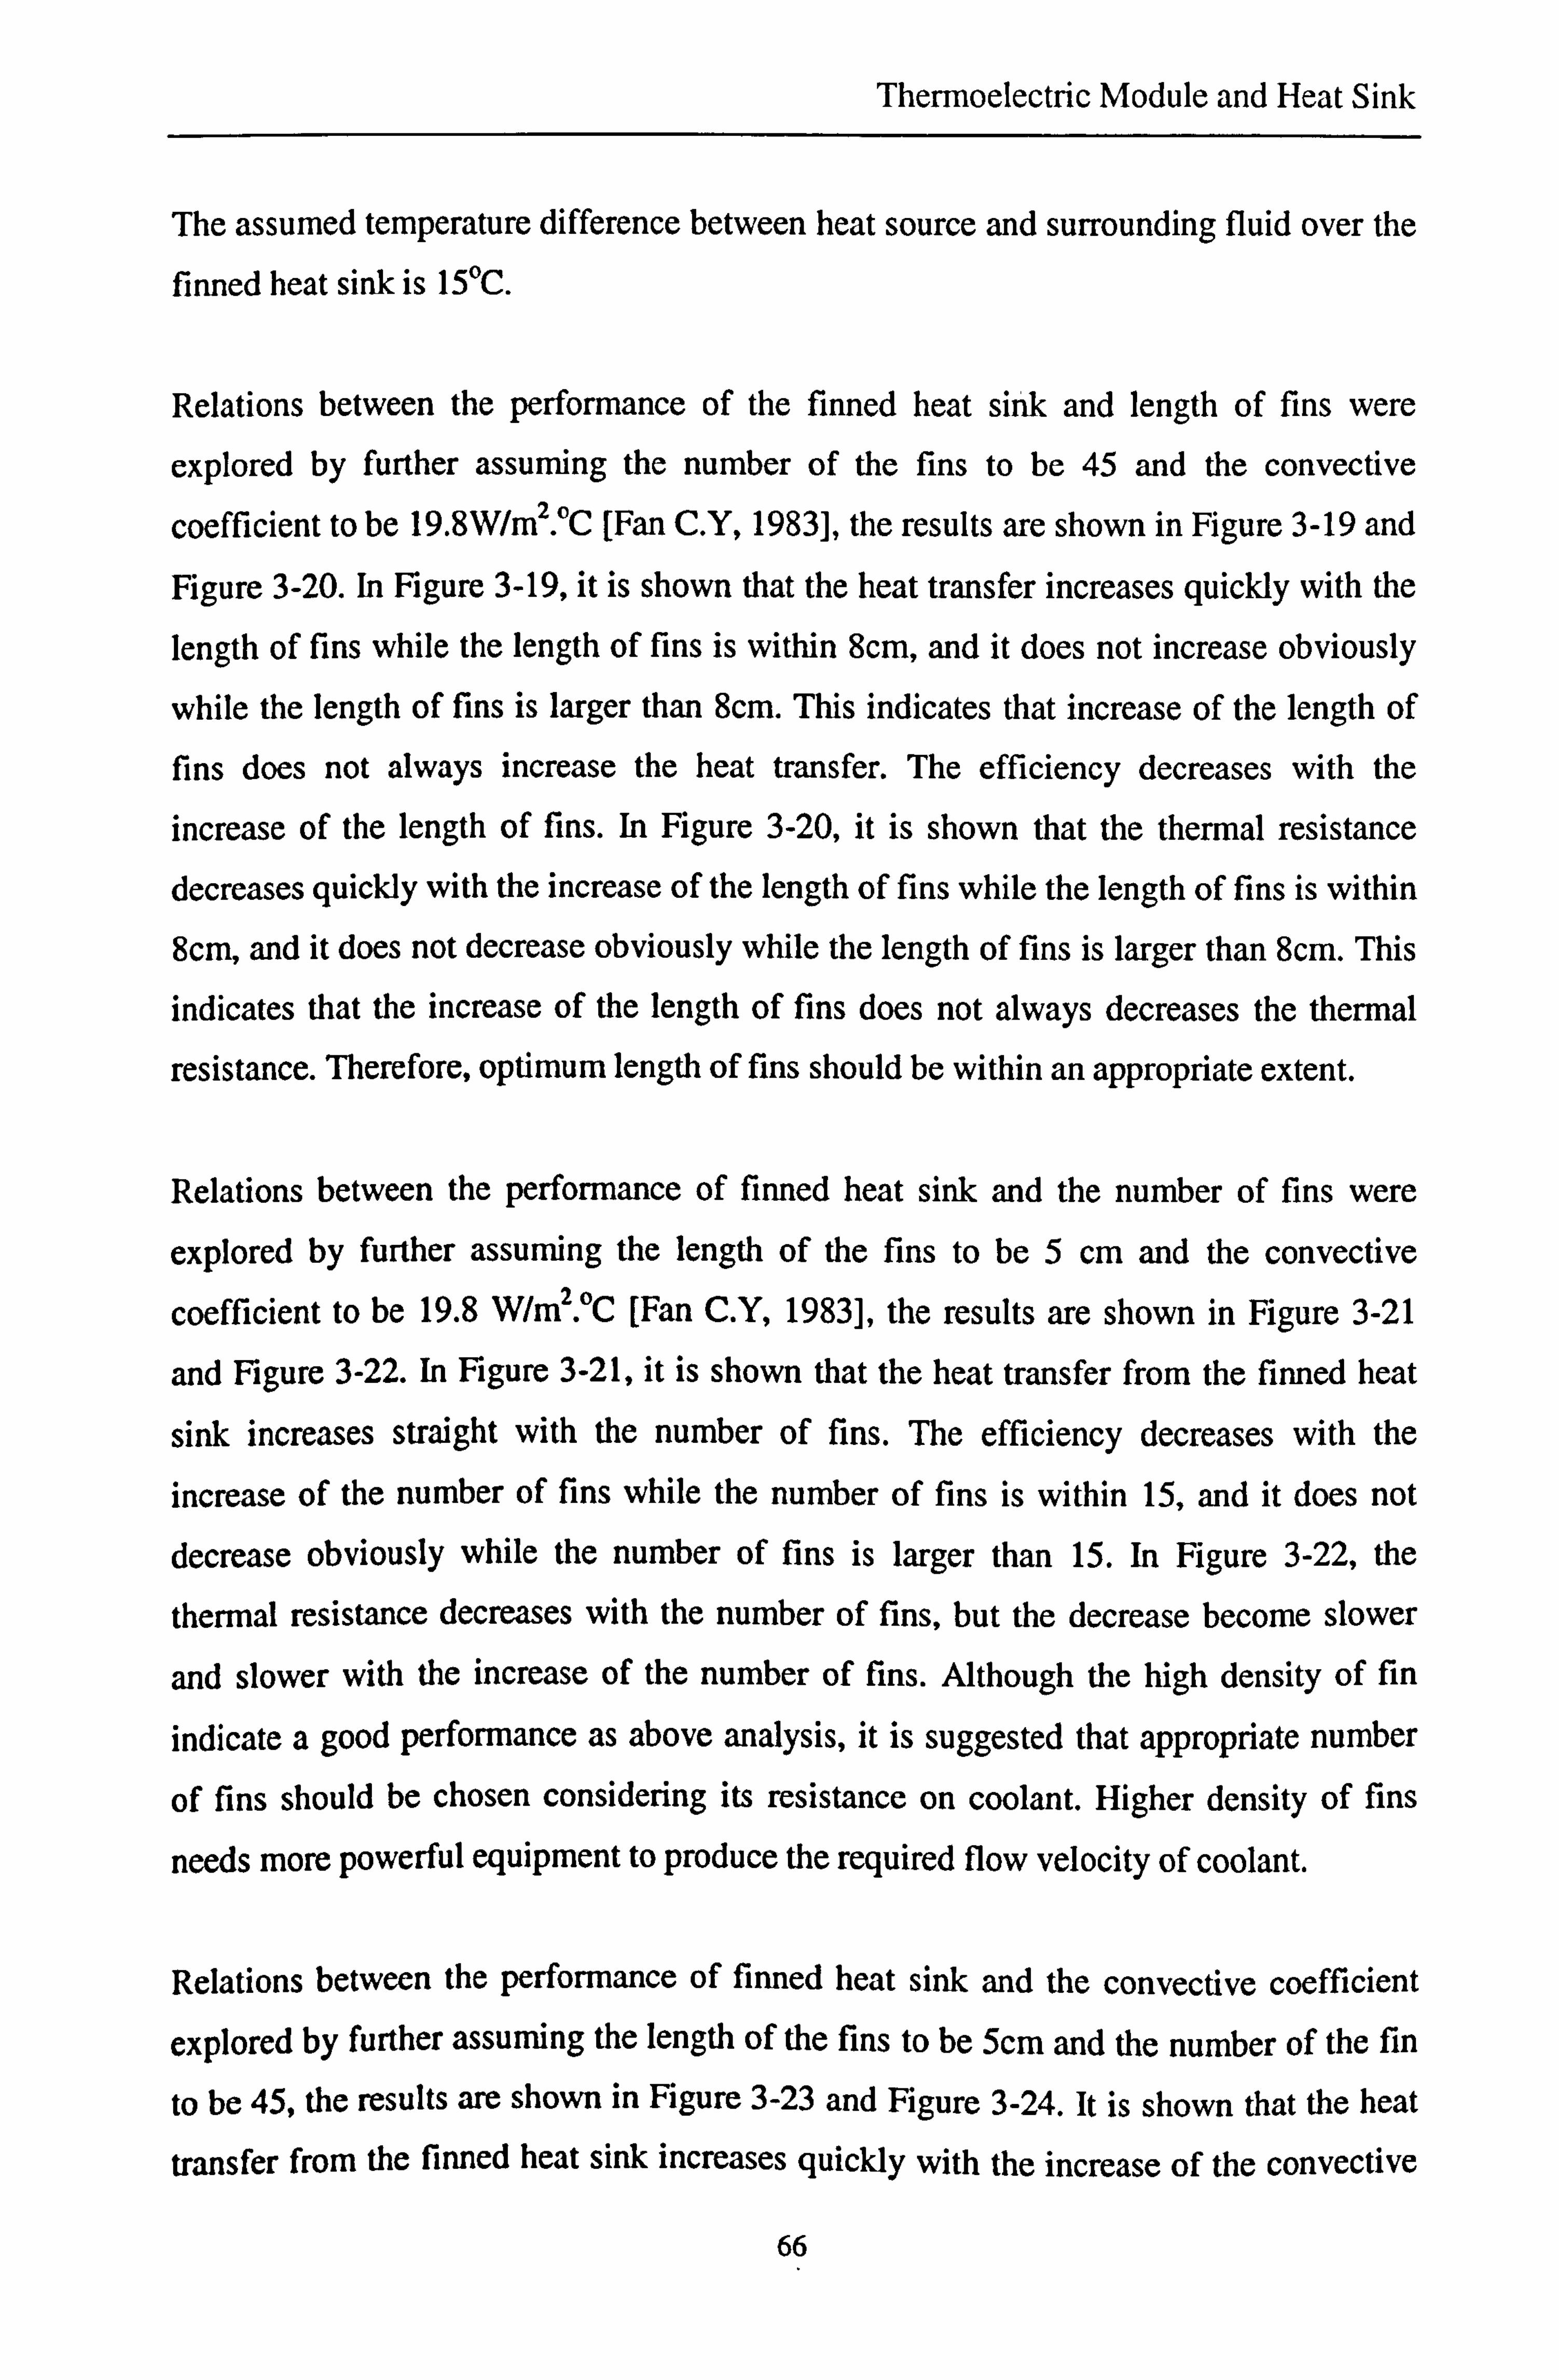
Thermoelectric Module and Heat Sink
The assumed temperature difference between heat source and surrounding fluid over the
finned heat sink is 15°C.
Relations between the performance of the finned heat sink and length of fins were
explored by further assuming the number of the fins to be 45 and the convective
coefficient to be 19.8W/m2. °C [Fan C. Y, 1983], the results are shown in Figure 3-19 and
Figure 3-20. In Figure 3-19, it is shown that the heat transfer increases quickly with the
length of fins while the length of fins is within 8cm, and it does not increase obviously
while the length of fins is larger than 8cm. This indicates that increase of the length of
fins does not always increase the heat transfer. The efficiency decreases with the
increase of the length of fins. In Figure 3-20, it is shown that the thermal resistance
decreases quickly with the increase of the length of fins while the length of fins is within
8cm, and it does not decrease obviously while the length of fins is larger than 8cm. This
indicates that the increase of the length of fins does not always decreases the thermal
resistance. Therefore, optimum length of fins should be within an appropriate extent.
Relations between the performance of finned heat sink and the number of fins were
explored by further assuming the length of the fins to be 5 cm and the convective
coefficient to be 19.8 W/m? °C [Fan C. Y, 1983], the results are shown in Figure 3-21
and Figure 3-22. In Figure 3-21, it is shown that the heat transfer from the finned heat
sink increases straight with the number of fins. The efficiency decreases with the
increase of the number of fins while the number of fins is within 15, and it does not decrease obviously while the number of fins is larger than 15. In Figure 3-22, the
thermal resistance decreases with the number of fins, but the decrease become slower
and slower with the increase of the number of fins. Although the high density of fin
indicate a good performance as above analysis, it is suggested that appropriate number
of fins should be chosen considering its resistance on coolant. Higher density of fins
needs more powerful equipment to produce the required flow velocity of coolant.
Relations between the performance of finned heat sink and the convective coefficient
explored by further assuming the length of the fins to be 5cm and the number of the fin
to be 45, the results are shown in Figure 3-23 and Figure 3-24. It is shown that the heat
transfer from the finned heat sink increases quickly with the increase of the convective
66

Thermoelectric Module and Heat Sink
coefficient and efficiency decreases with the increase of the convective coefficient. The
thermal resistance decreases with the increase of the convective coefficient.
550 T
500-'
450-
400-
350-
300-
250- 0
200 -
150 -
100 -
50 - 0 2468
110%
100%
90%
80%
70% a. u w
60% .2 W
50%
40%
30%
-i ir. - 20% 10 12 14 16 18 20 22 24 26
Length of fins, cm
Figure 3-19. Relation between heat transfer as well as efficiency and length of fins (N=45, h=19.8W/m2. °C)
0.15
0.14
0.13-
0.12-
0.11 -
6 0.1-
0.09-
0.08-
0.07-
0.05-
0.04-
0.03-
0.02- 02468 10 12 14 16 18 20 22 24
Length of fins, cm
Figure 3-20. Relation between thermal resistance and length of fins (N=45, h=19.8W/m? °C)
26
67

Thermoelectric Module and Heat Sink
455 105%
-. - heat transfer 405
. ý_ efficiency 100%
355-
305 - 95%
255- --90% C
205-
= 155- 85%
105- 80%
55-
5 75% 05 10 15 20 25 30 35 40 45 50 55 60
Number of fins
Figure 3-21. Relation between heat transfer as well as efficiency and number of fins (Li-Scm, h=19.8Whn2 °C)
12
1-
9 0.8 0
0 0.6 l0 N 0
0.4
0.2
0- 005 10 15 20 25 30 35 40 45 50 55 60
Number of fins
Figure 3-22. Relation between thermal resistance and number of fins (LT-Scm, h=19.8Wy/m2. °C)
68
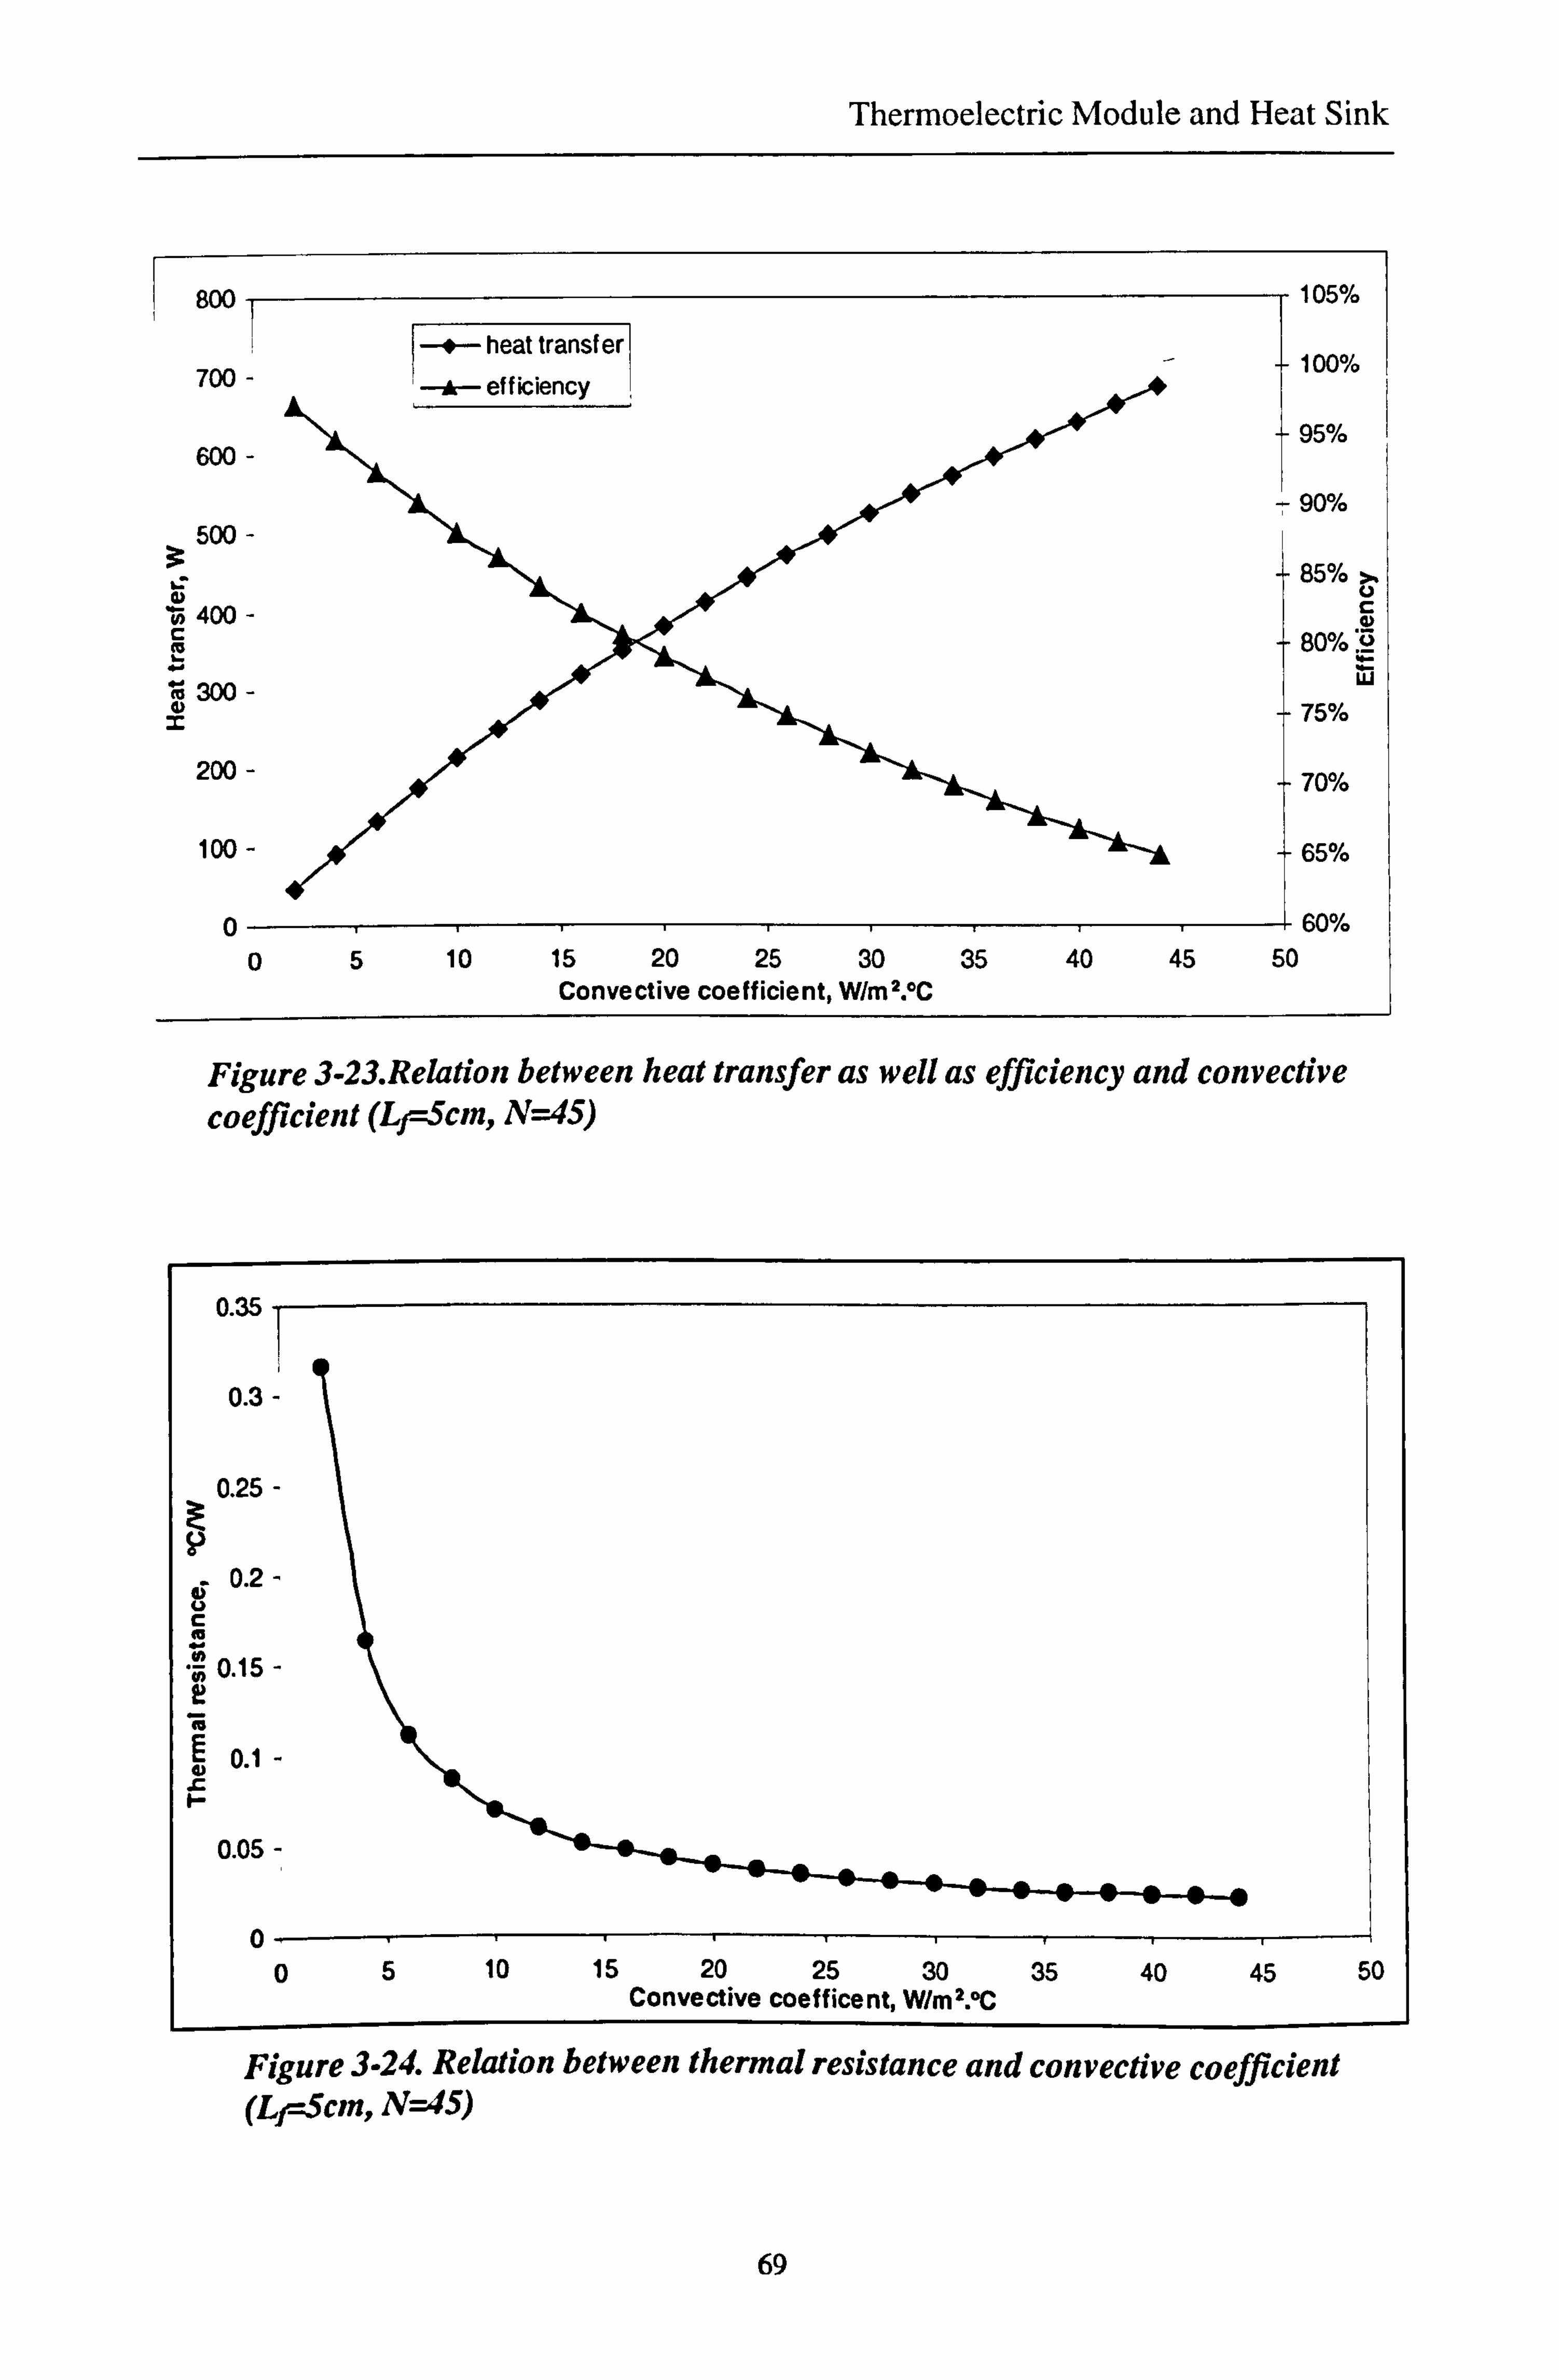
Thermoelectric Module and Heat Sink
800 s heat transfer
105%
100%
Figure 3-23. Relation between heat transfer as well as efficiency and convective coefficient (Lr--Scm, N=45)
69
Clgure J-h'#. nruu[u'S ue"w :i siitiiiiui rt i wince an« cunveciive coejjicle/LL
(L1-Scm, N=45)

Thermoelectric Module and Heat Sink
3.5 Conclusion
A computer model was developed to explore the relations between the cooling/heating
requirements and optimum thermoelectric parameters. It was found that optimum current
should be input to obtain maximum COP. This can be done by using appropriate number
of thermoelectric modules or appropriate geometry factor of the modules to make the
operating current equal to the optimum current. For a specific cooling/heating
requirement, the required optimum number of thermoelectric modules for optimum
current and maximum COP varies with geometry factor (the type of the modules). The
value of maximum COP is determined by the working temperatures and the figure of
merit of the material and has no relationship with the cooling/heating capacity and the
geometry factor.
A computer model was developed to explore the relations between the performance of
the finned heat sink and its geometry parameters as well as convective coefficient. Modelling results showed that the heat transfer from the finned heat sink increases and
thermal resistance decreases with the increase of the length of fins in some extent,
number of fins and convective coefficient. However, the efficiency decreases with the
increase of these factors. The modelling provides a basis for optimum design of a finned
heat sink.
70
Heat Pipes and Heat Pipe Thermal Performance Analysis
Chapter 4. Heat Pipes and Heat Pipe Thermal Performance Analysis
4.1 Conventional Heat Pipes and a New Type Heat Pipe
Conventional heat pipes have simple column containers with straight single channels. If
the cross section diameters or equivalent diameters are larger than 2mm, the channel
geometry are usually circular or rectangular. The inner surface of these heat pipes may
be fitted with wicks, which are used to produce capillary force to aid the operation of the
heat pipes; but some are wickless, which are operated by gravitational force, called
thermal diode. The above heat pipes are called normal heat pipes. If the cross section
diameters is within O. lmm-2mm, the channel geometry is usually a concave trapezoid
with tapered triangular channels in each of four corners [Babin et al, 1989], as shown in
Figure 2-16. This kind of heat pipes is called micro/miniature heat pipe. Micro/miniature
heat pipes are wickless heat pipes. Capillary action produced by the sharp corners of the
channel plays a major role for the operation of this kind of heat pipe. For any heat pipe,
the geometrical shape of the cross section is a critical factor affecting its performance.
To meet different applications, various heat pipes can be derived based on the concept of
the aforementioned conventional heat pipes. For this PhD work, a new type heat pipe
(thermal diode) was required, as shown in Figure 1-1. The evaporator and condenser of
the thermal diode are flat panels with circular holes inside the panels. This structure can
withstand a higher pressure and therefore keeps the surface of the panels flat, which is
essential for this work. The holes connect each other at the end to keep the working fluid
inside the thermal diode at the same level. The adiabatic section is a circular tube. The
angle between the flat panel and the adiabatic section is 120°, which incurs less
resistance to fluid flow than an angle of 90°. The flat panels and the adiabatic section are
connected with headers.
During operation of this new type heat pipe, liquid evaporates on the internal surface of
the evaporator, the vapour enters the condenser via the adiabatic section and condenses
on the internal surface of the condenser. For a thermal diode with a single tube, the
condensate then returns to the evaporator via the adiabatic section by gravity and
distributes on the internal surface of the evaporator. Heat applied to the evaporator
section by an external source then vaporizes the working fluid on the internal surface of
71
Heat Pipes and Heat Pipe Thermal Performance Analysis
evaporator. The heat pipe can therefore continuously transport the latent heat of
vaporization from the evaporator to the condenser section. For this new type thermal
diode heat pipe, the condensate from the adiabatic section cannot flow along all the holes
of the evaporator, it can only flow along one or two holes. Therefore, it can not distribute
the condensate to the internal surface of other holes to form liquid film. This causes that
the thermal diode cannot work efficiently.
To solve this problem, two methods are suggested. One is to use more liquid in the
thermal diode. The liquid fill level should be 100% evaporator length, which of course
can always keep internal surfaces of all the holes of the evaporator wet. Another method
is to use capillary wick in the internal surface of evaporator. The capillary wick will
drive the liquid from the bottom of the evaporator to the whole internal surface of
evaporator and distribute the liquid evenly on the surface. Unlike the conventional
normal heat pipe, the action of the wick in this case is not to return the condensate from
the condenser to evaporator; it is to distribute liquid from the bottom of the evaporator to
its whole internal surface.
Investigation of the conventional heat pipe can provide a basis for investigation of any
types of heat pipes. Based on the investigation of the conventional heat pipes, the new
type thermal diode was investigated for the above two cases, i. e., using more liquid and
using wick in the evaporator.
4.2 Analytical Model Set-up-Limits of Heat Transport Capacity
Limits of maximum heat transport capacity
For any heat pipe, the maximum heat transport capacity is governed by six limits [Dunn
and Reay, 1982]; namely, the sonic limit, the entrainment limit, viscous limit, boiling
limit, capillary limits and liquid fill limits.
1) Sonic limit: When the vapour velocity approaches sonic speed, the mass flow of the
fluid achieves its critical limit, this is also called "choke". Further increase of
pressure drop does not produce further increase of the mass flow rate and heat
transport capacity. This maximum heat transport capacity is called the sonic limit.
72

Heat Pipes and Heat Pipe Thermal Performance Analysis
2) Entrainment limit: Owing to the reverse flow between liquid and vapour, a shear
force exists at the interface of the liquid-vapour phase. If the velocity of the vapour
increases to a high value, some small liquid blocks in the interface will be split and
carried forward by vapour flow from the evaporation section to condensation section.
This will result in ineffective heat transfer. We call the heat transfer under the critical
flow state the entrainment limit.
3) Viscous limit: The flow of both vapour and liquid will cause pressure reduction due
to the viscous effect. This will limit mass flow rate and heat transportation. The limit
is called viscous limit.
4) Boiling limit: When radial heat flow rate increases to a certain value, the liquid near
the inner wall will be superheated and bubbling will occur. This will produce an
unacceptable high temperature in local parts of the evaporation section. This critical
heat transport volume is called the boiling limit.
5) Capillary limit: With increasing of heat flow rate, the liquid evaporation rate will
also increase. However, if the capillary forces produced in the heat pipe are not able
to draw enough liquid back to the evaporation section, the wall of lower part of the
evaporation section will dry out. This critical heat transfer is called the capillary
limit.
6) Liquid fill limit: For gravity assisted two-phase thermosyphon (thermal diode) heat
pipes, the filled liquid volume is also a critical condition for heat pipe operation. For
a certain radial heat flow rate, if only a small volume of liquid is used within the heat
pipe, the liquid film on the wall of lower part of evaporation section would be broken
due to excessive evaporation. Furthermore, the liquid deposited at the bottom of the
heat pipe also evaporates gradually until dried out. In order to prevent this, a
minimum filled liquid volume is required corresponding to a given heat input. In
other word, a given filled volume allows a limited radial heat flow rate, which is
called dry-out limit.
73

Heat Pipes and Heat Pipe Thermal Performance Analysis
Mathematics model The formulae for limits of heat transport capacity for conventional heat pipes with or
without wick were developed. On the basis of these formulae the calculation of
maximum heat transport capacity of the new type heat pipe was also presented.
Consider each hole in the new type thermal diode as a single thermal diode. All the
single thermal diodes have the same adiabatic section. The cross section area of the
adiabatic section is equal to the total cross sectional area of all the single thermal diodes.
The new type thermal diode can then be taken as numerous single thermal diodes
parallel in width. Firstly, we will consider a single thermal diode as a simulation object
and determine its optimum sizes and working conditions. This concept will then be
developed to simulate the whole thermal diode.
Due to all the single holes connecting each other, a natural circulation flow is created in
the evaporator of the new type thermal diode, gravity does not play a role in promoting
fluid flow in the evaporator. This will be considered in the calculation of the capillary
limit.
Using the techniques presented in Dunn and Reay (1982) and Babin B. R. et al (1990),
the above five limits may be expressed as:
Sonic Limit
qs. m = k, AvP,, h1 ()1? Tv ß(2(Y+1))1/2 (4-1)
Where, ks is the shape factor of the heat pipe channel geometry (circle---1; regular
hexagon---0.964; square ---0.883; micro/miniature---no report, a value similar to square
pipe, such as 0.85, could be applied)
Entrainment Limit
9ý, m = k, A, htg ((TPr /(2r, ))"2
Boiling Limit
(4-2)
74
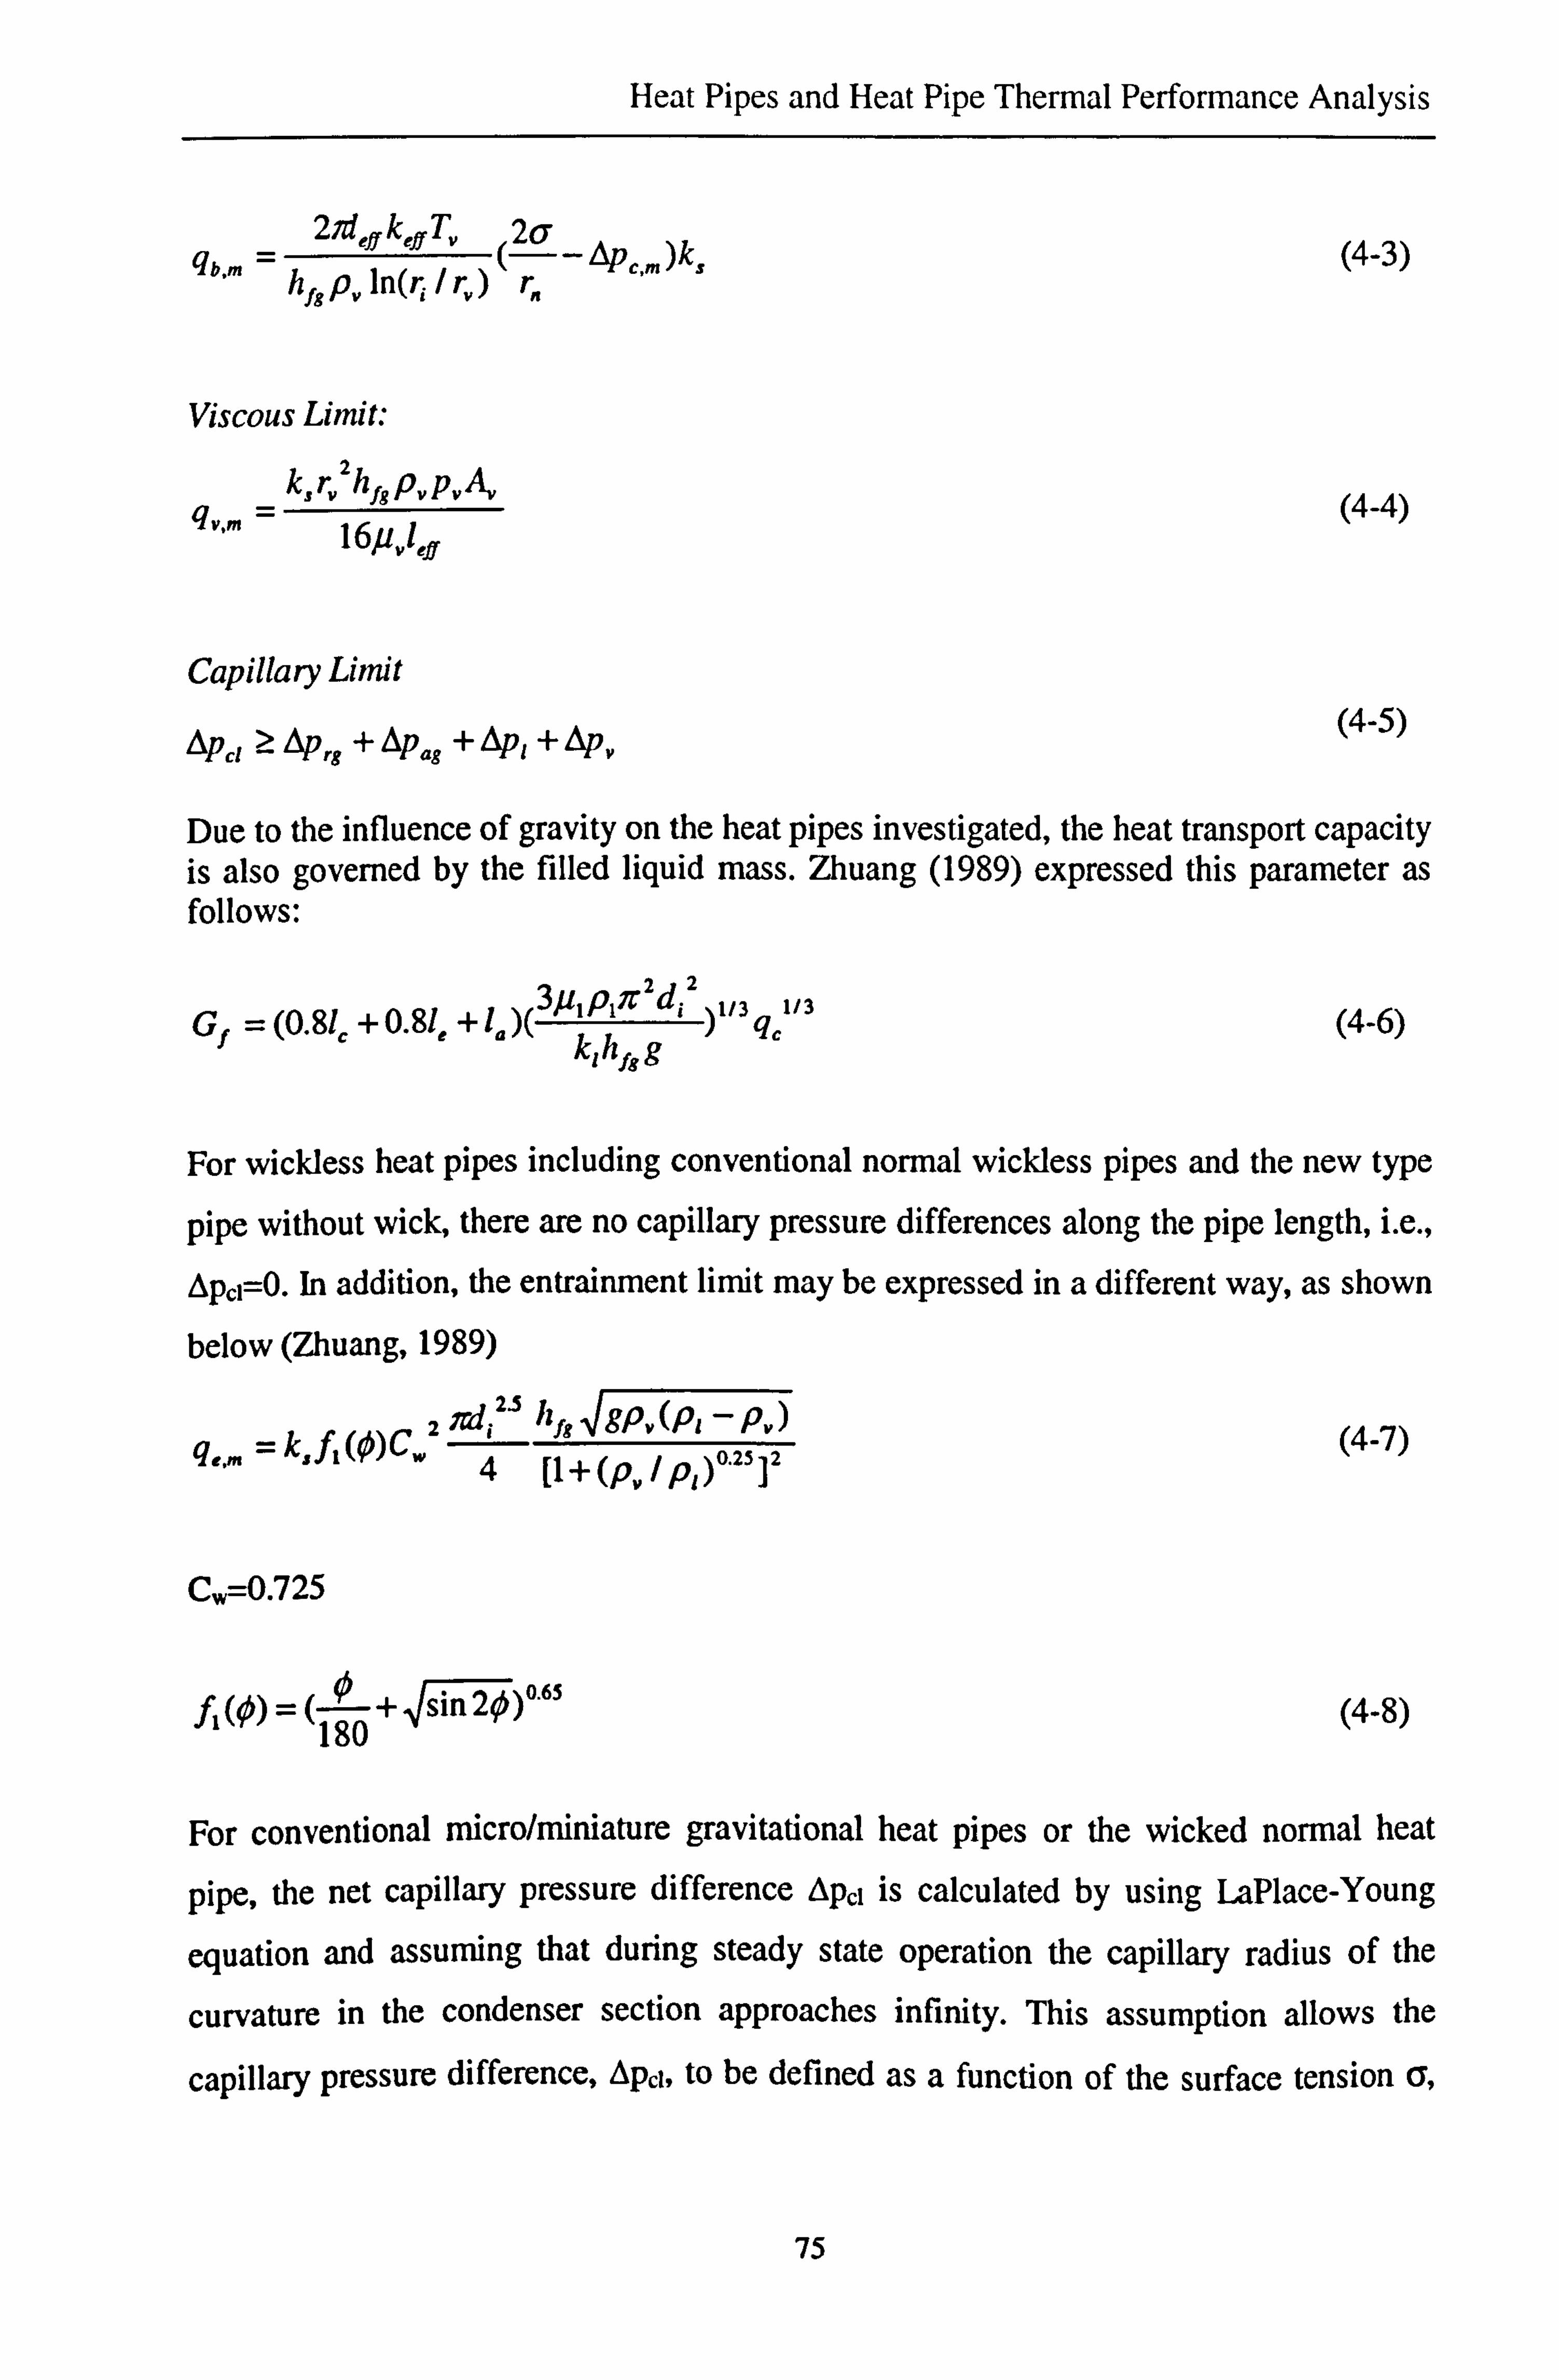
Heat Pipes and Heat Pipe Thermal Performance Analysis
2 effkefTy
26
9n. m -h f8 py In( r. /r
(r - ý,,,,, )ks (4-3) , y) r
Viscous Limit:
ksrv2hrspvpvAv
16Pv)ef
Capillary Limit (4-5)
AP', APB +Opag + Apt +APv
Due to the influence of gravity on the heat pipes investigated, the heat transport capacity is also governed by the filled liquid mass. Zhuang (1989) expressed this parameter as follows:
Gf =(0.81,, p, ir 2i 2)1/3q,
1/3 (4-6) k, hh18 g
For wickless heat pipes including conventional normal wickless pipes and the new type
pipe without wick, there are no capillary pressure differences along the pipe length, i. e.,
Ap,, =0. In addition, the entrainment limit may be expressed in a different way, as shown
below (Zhuang, 1989)
z Ord; zs jtfg SPA(Pý -Pý) q�. = k, f, (0)CW
4 [1 + (Pv / Pi )°. 25 ]2 (4-7)
Cw=0.725
(180 + sin 2O)o. 65 (4-8) fi (0) =
For conventional micro/miniature gravitational heat pipes or the wicked normal heat
pipe, the net capillary pressure difference Opel is calculated by using LaPlace-Young
equation and assuming that during steady state operation the capillary radius of the
curvature in the condenser section approaches infinity. This assumption allows the
capillary pressure difference, Apt, to be defined as a function of the surface tension 6,
75
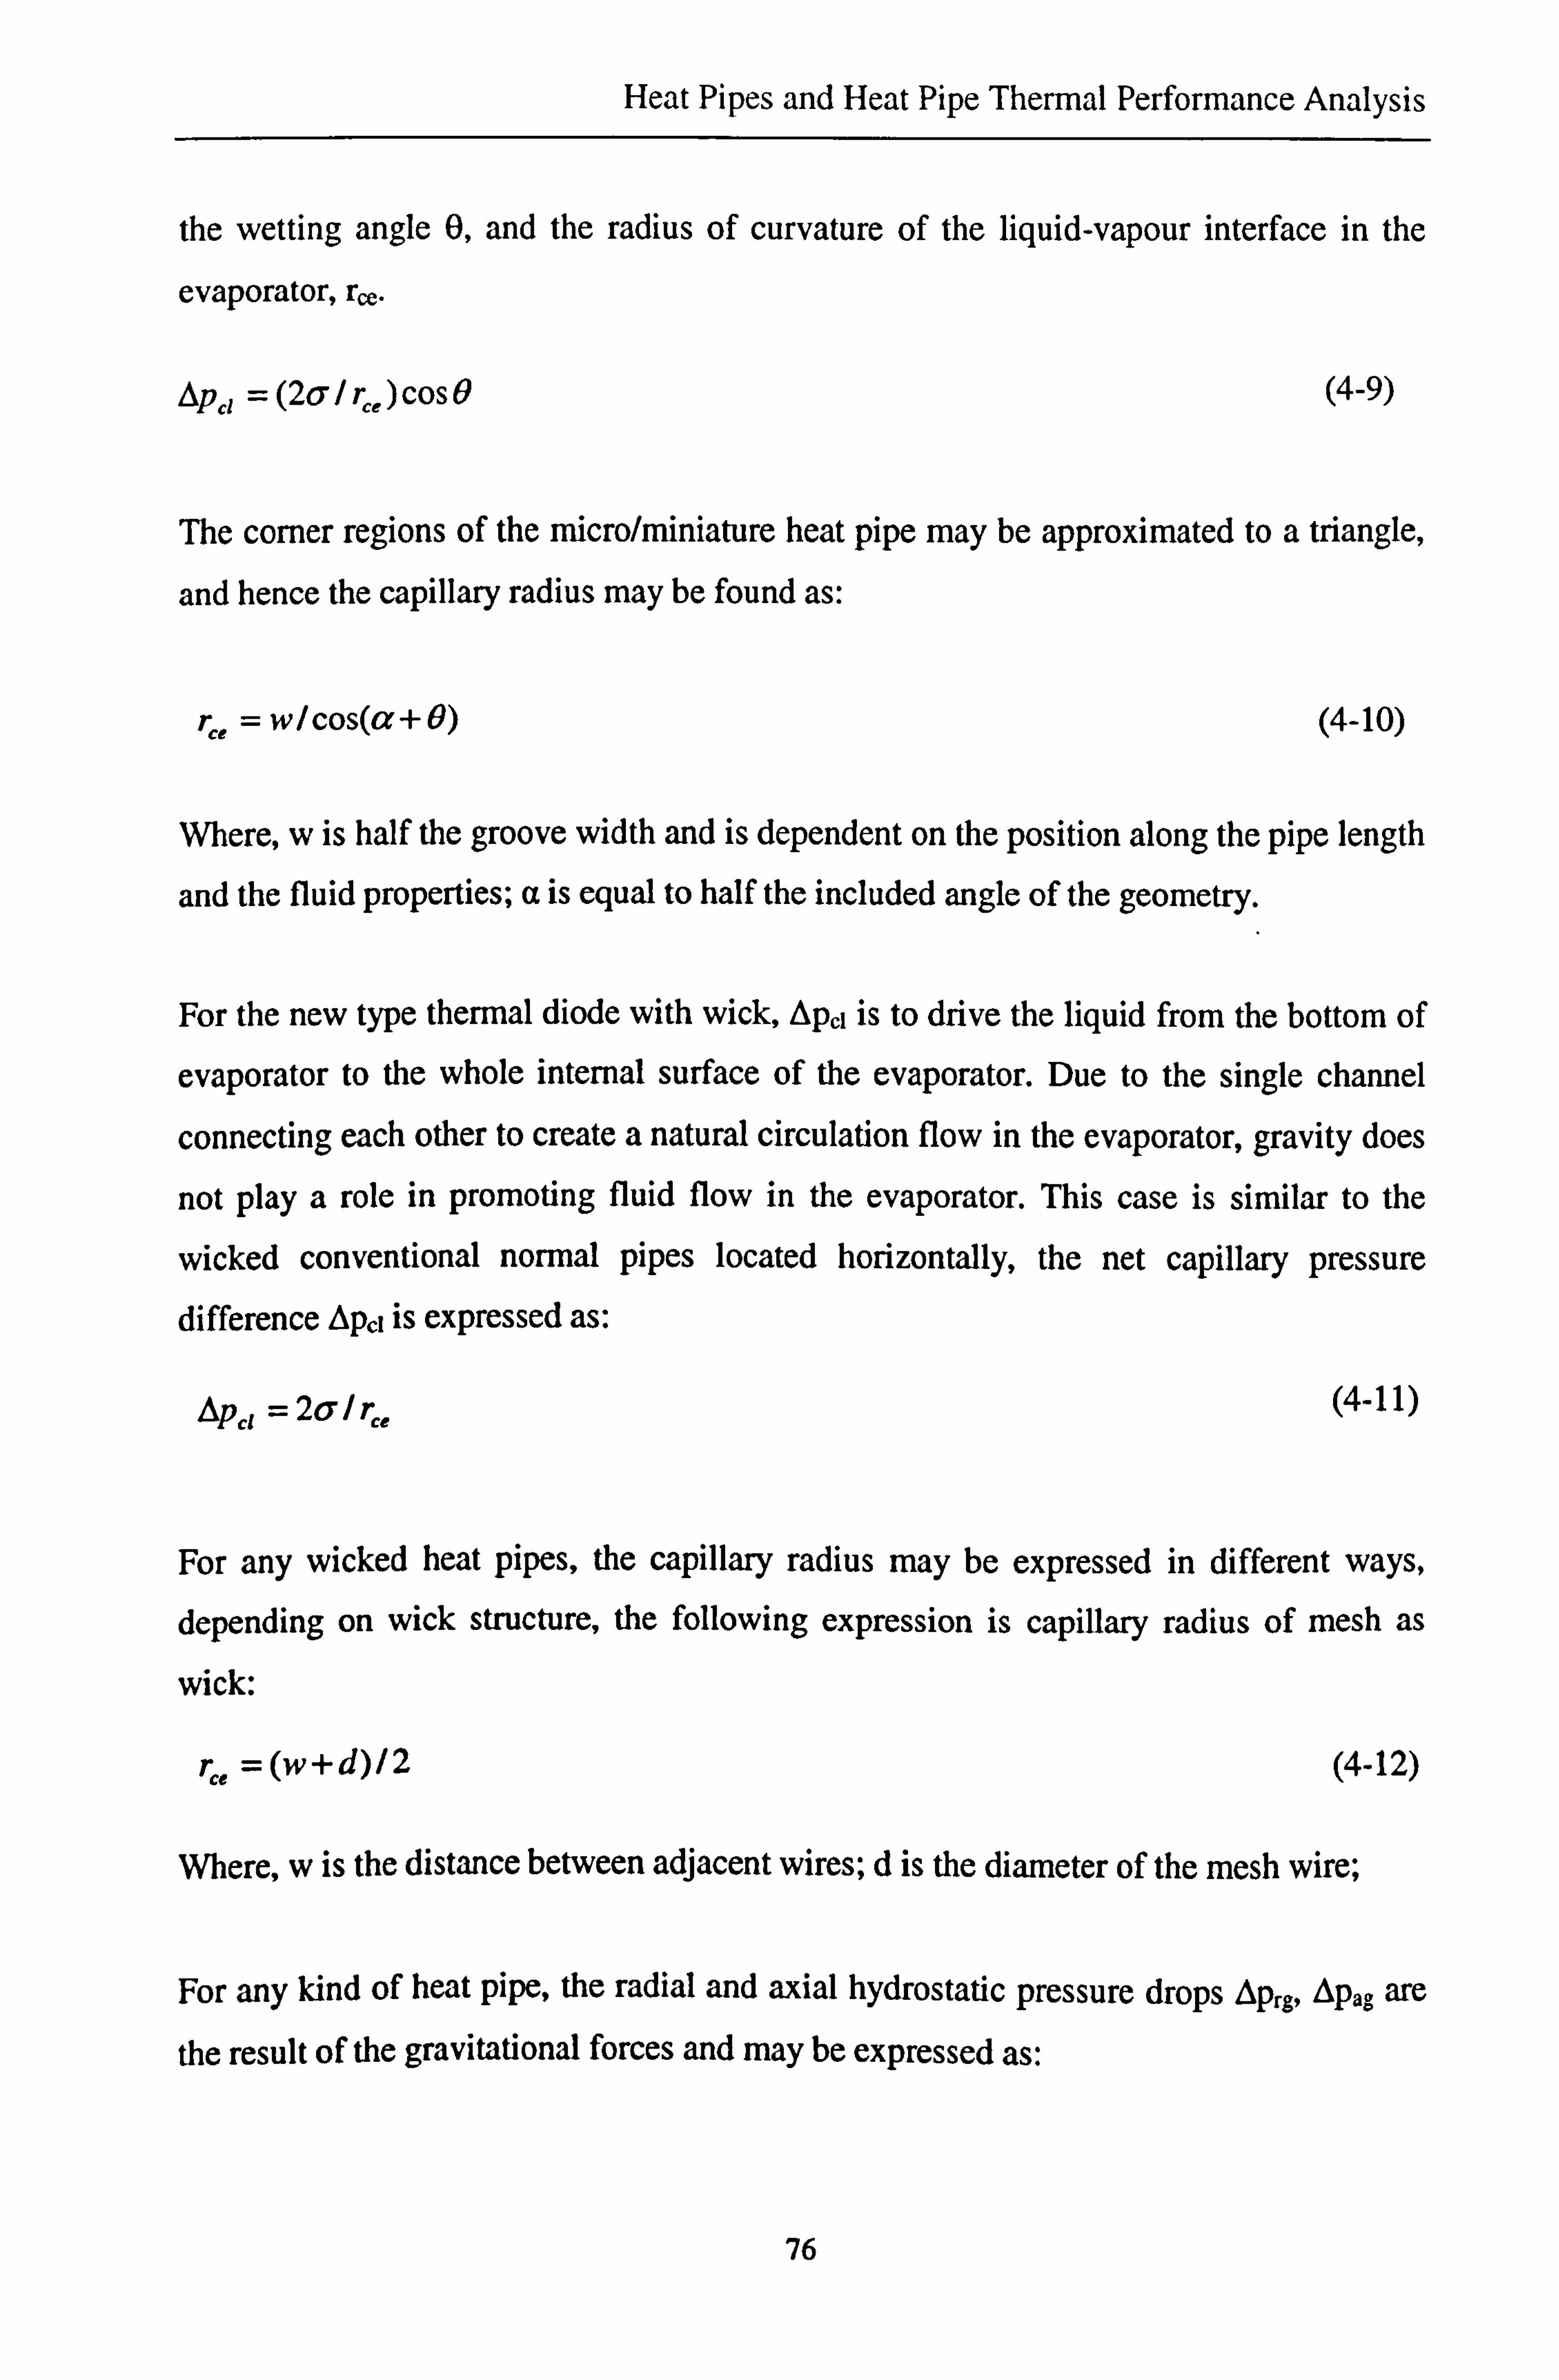
Heat Pipes and Heat Pipe Thermal Performance Analysis
the wetting angle 0, and the radius of curvature of the liquid-vapour interface in the
evaporator, rce.
A&I =(26/rce)cos9 (4-9)
The corner regions of the micro/miniature heat pipe may be approximated to a triangle,
and hence the capillary radius may be found as:
r« = w/cos(a+6) (4-10)
Where, w is half the groove width and is dependent on the position along the pipe length
and the fluid properties; a is equal to half the included angle of the geometry.
For the new type thermal diode with wick, Opi is to drive the liquid from the bottom of
evaporator to the whole internal surface of the evaporator. Due to the single channel
connecting each other to create a natural circulation flow in the evaporator, gravity does
not play a role in promoting fluid flow in the evaporator. This case is similar to the
wicked conventional normal pipes located horizontally, the net capillary pressure difference Epci is expressed as:
E&1 =26/r« (4-11)
For any wicked heat pipes, the capillary radius may be expressed in different ways,
depending on wick structure, the following expression is capillary radius of mesh as
wick:
rýý = (w+d)/2 (4-12)
Where, w is the distance between adjacent wires; d is the diameter of the mesh wire;
For any kind of heat pipe, the radial and axial hydrostatic pressure drops Oprg, Lpag are
the result of the gravitational forces and may be expressed as:
76

Heat Pipes and Heat Pipe Thermal Performance Analysis
Eprg =-pigdi, Cos0 (4-13)
Apa8 =-plglpsin0 (4-14)
Where lp is the length of liquid column in the heat pipe; For conventional heat pipes, lp is calculated as:
lp = le +lc +la -hf (4-15)
For the new type thermal diode, as a natural circulation flow is created in the evaporator,
gravity forces does not play a role on hydrostatic pressure drops, lp should not include
the length of liquid column in evaporator, the lp therefore should be calculated as:
lp= lc + la sin yr (4-16)
Where yi is the angle between the adiabatic section and the horizontal surface; The liquid pressure drop, ipi, may be found by evaluating the shear forces at the liquid-
solid and liquid-vapour interfaces. These forces inhibit the return of the liquid through
the wall areas and may be computed by integrating the pressure gradient over the length
of the heat pipe. For constant heat addition and heat rejection, this yields:
Apt _ _( P! )leffgc (4-17)
K41hfgP1
For the pipe with wick
K=rh, 2/8 (4-18) For the pipe without wick
K =l (4-19)
Leff = 0.5le + la + 0.51c (4-20)
Due to the compressibility of the vapour phase and the mass addition and removal in the
evaporation and the condensation section, determination of the vapour pressure drop,
Ap,,, in the heat pipes is complicated. Because of the large difference in the density
between the liquid and vapour phases, the velocity of the vapour phase must be
significantly higher than the velocity of the liquid phase. Hence, the pressure gradient
77

Heat Pipes and Heat Pipe Thermal Performance Analysis
due to variation in the dynamic pressure, which is due to velocity and density changes,
must also be considered when evaluating the vapour pressure drop. The following is the
expression for the vapour pressure drop:
_ C(fý Rev ), u, ýpv - )l (2(r.,
)2AvPýhts eý. qý (4-21)
In addition, this pressure gradient also partly results from the frictional drag in the heat
pipes.
The friction factor, f, and the constant, C, can be determined once the local axial
Reynolds number and Mach number are defined. These expressions are given below.
Re,, = 2(rn, )q,
(4-22) Av, uvh fg
os (4-23) My = qc
ýPvhig (RvcT. Y)
Kraus and Bar-Cohen (1983) gave the expressions for f� and C, for different sets of
conditions, as follows:
Rev S 2300, My <_ 0.2 (4-24)
(fv Re,, ) =16, C=i. oo
Rev < 2300, My >- 0.2 (4-25)
(f,, Rey, )=16
C= Cl = (1+(Y2-1)Mv2)o. s
Re,, >2300, M,,: 50.2, (4-26)
(f fRe, )=0.038
C=C 2Yhvgc 0.75
2 Avhfgpv
78
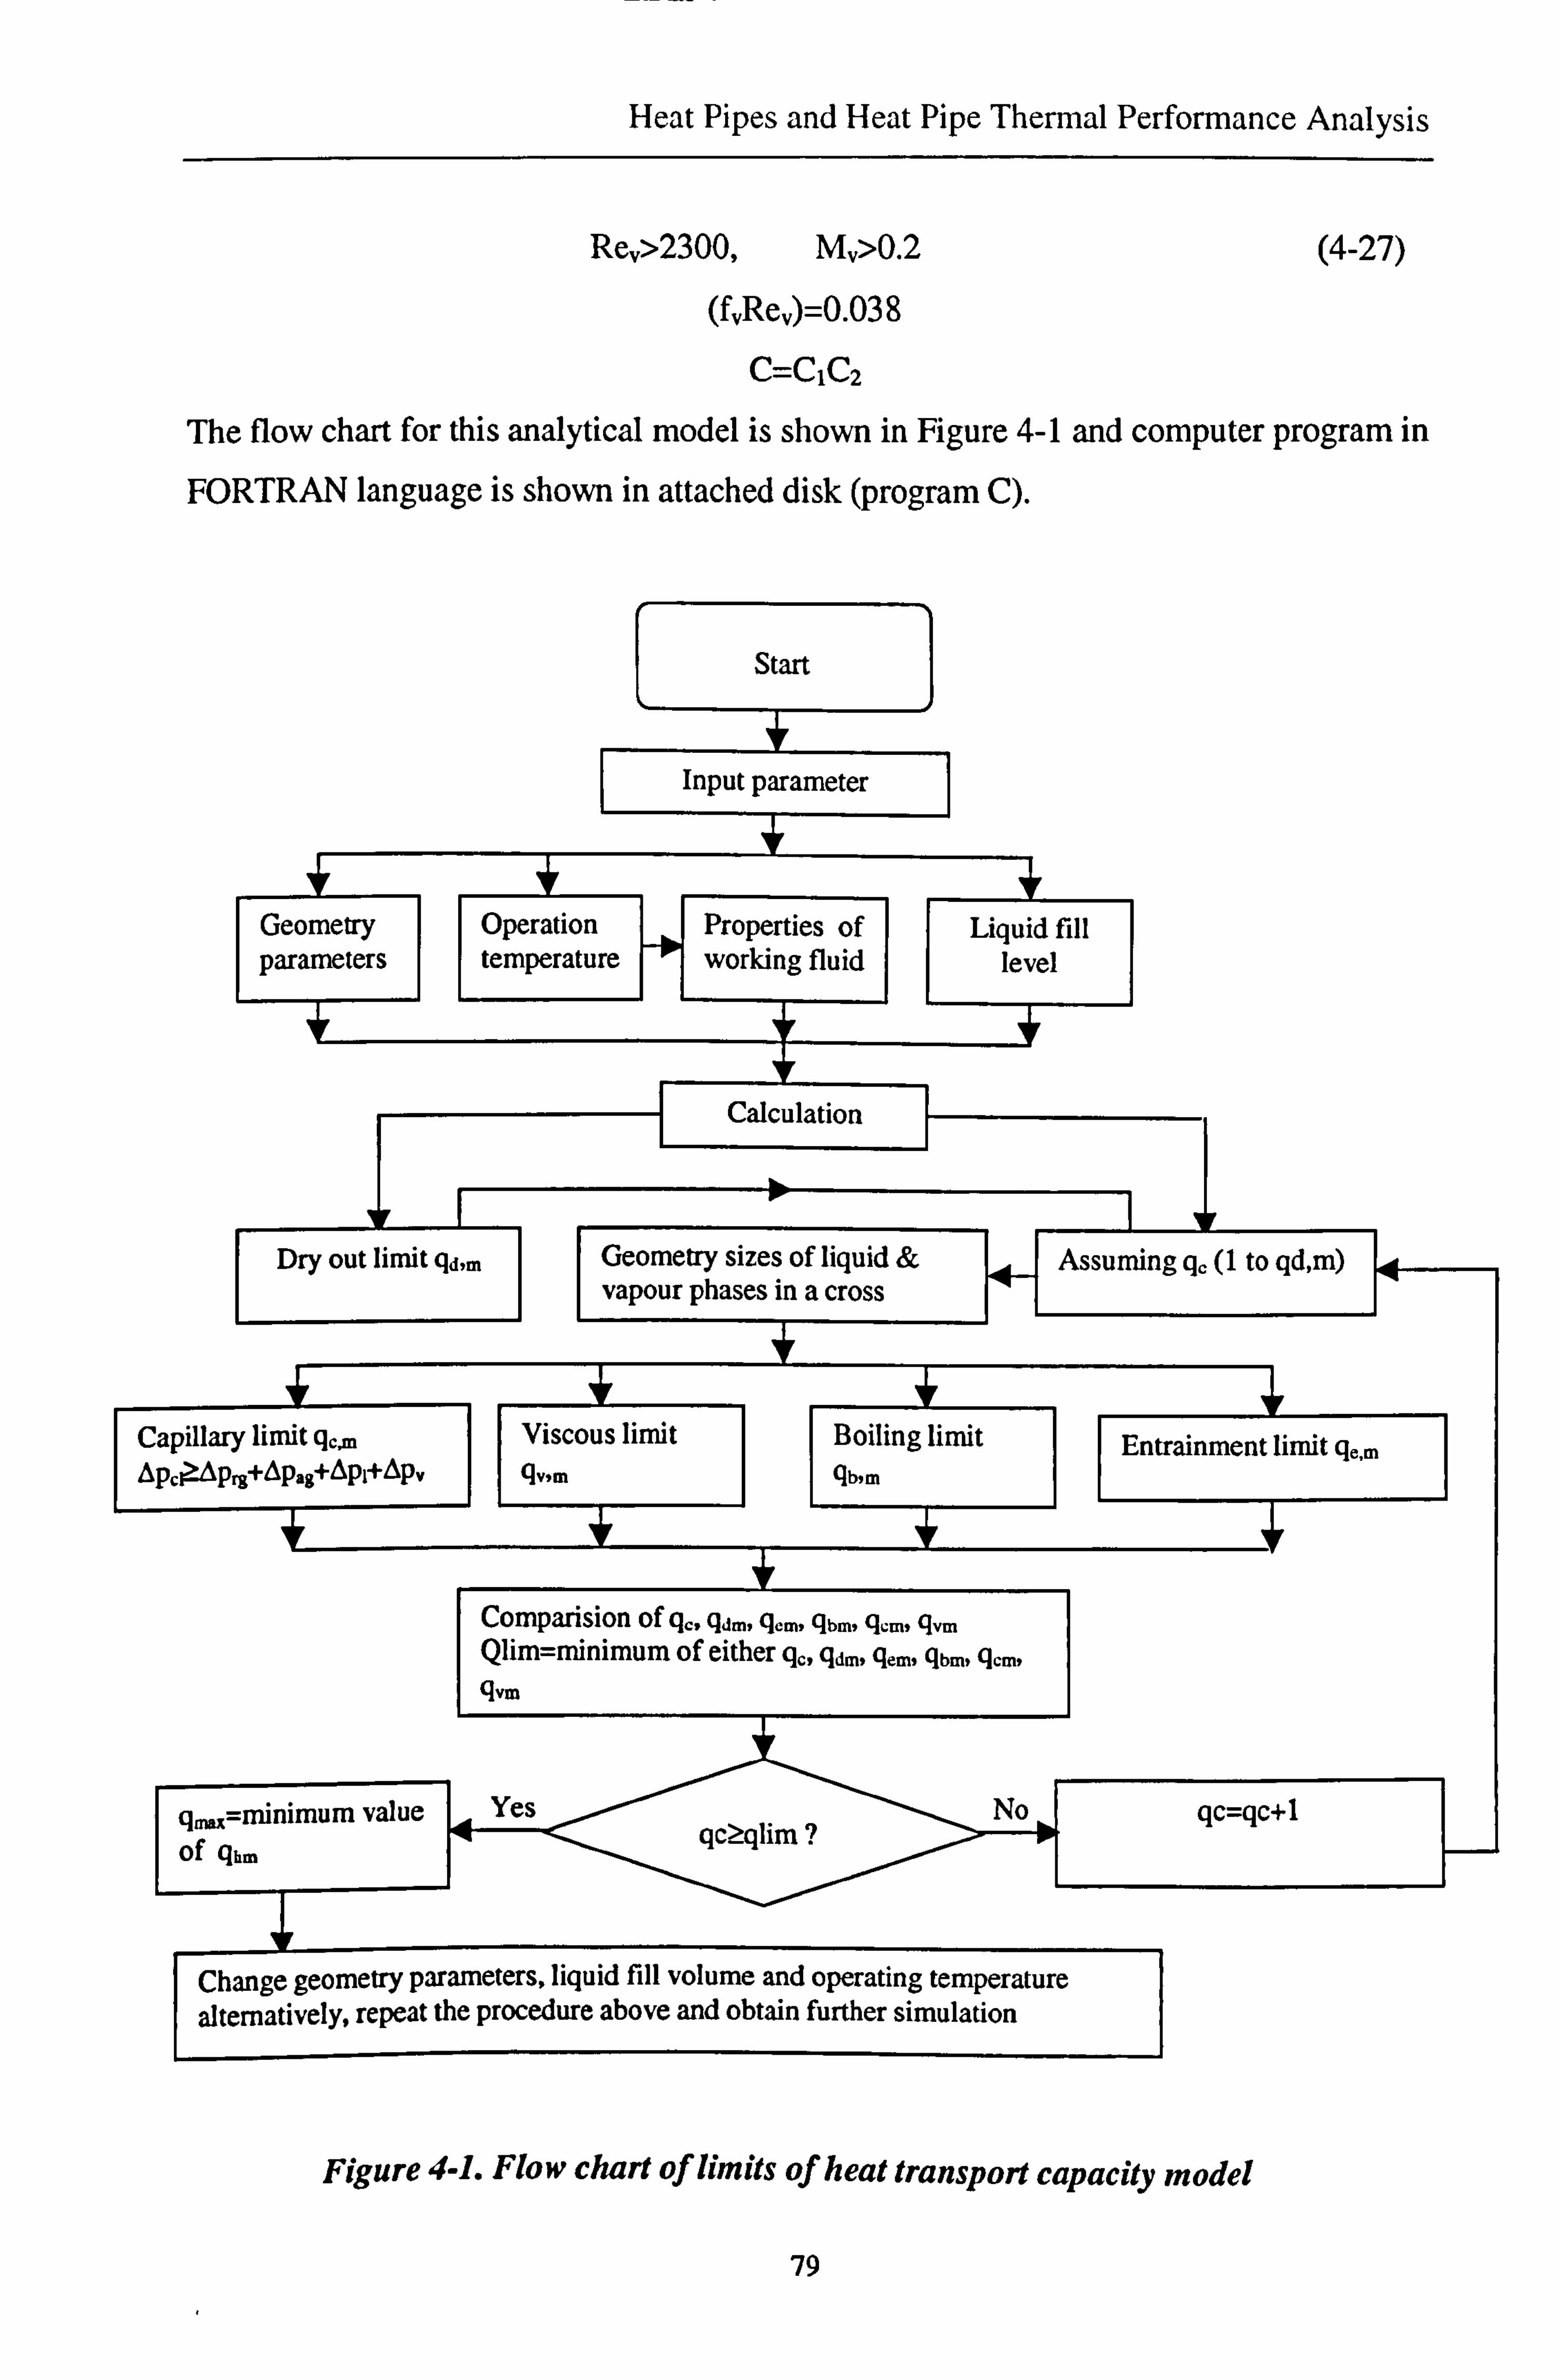
Heat Pipes and Heat Pipe Thermal Performance Analysis
Re,, >2300, M,, >0.2 (4-27)
(f, Re,, )=0.03 8
C=C1C2
The flow chart for this analytical model is shown in Figure 4-1 and computer program in
FORTRAN language is shown in attached disk (program Q.
Start
I Input parameter
Geometry Operation H Properties of parameters temperature working fluid
Calculation
Dry out limit qd, m Geometry sizes of liquid & vapour phases in a cross
Capillary limit q,, m Apcl>-Aps+Apa8+Api+Op,,
qmm=minimum value of qhm
Liquid fill level
Assuming q. (1 to qd, m)
Viscous limit II Boiling limit ýlv, m qb+m
Comparision of qe, q,, m, qem, qbm, qcm, qm Qlim=minimum of either qe, qdm, qem, qbm, qem, qvm
Yes qc>_glim ?
No
Entrainment limit qe, m
qc=qc+1
Change geometry parameters, liquid fill volume and operating temperature alternatively, repeat the procedure above and obtain further simulation
Figure 4-1. Flow chart of limits of heat transport capacity model
79

Heat Pipes and Heat Pipe Thermal Performance Analysis
4.3 Validation of the Analytical Model
It is difficult to test the maximum heat transport capacities of heat pipes in common
laboratories, and the reports relevant to the test data of the maximum heat transport
capacities of heat pipes are rare. Only a report can be found to be available to validate
the suitability and accuracy of the model [Babin B. R, 1990]. Comparison was carried out
between the modelling results and the published experimental data for a conventional
micro heat pipe.
Two test pipes were constructed [Babin B. R, 1990], one made of silver and the other
copper. They were both charged with 0.032g of distilled, deionized water and were
evacuated. In addition, two uncharged test pipes, one each of copper and silver, were
tested to determine the amount of heat conducted through the wall to establish a baseline
for evaluating the improvement in performance due to the vaporization and condensation
of the working fluid.
Figure 4-2 illustrates the geometry of the heat pipes investigated. The shape factors and the sizes of the heat pipe are indicated in Tables 4-1. The limits of heat transport
capacity, including capillary, sonic, entrainment, viscous limits and boiling limit, were
calculated using the model, and the results were illustrated in Figure 4-3. The simulation
results of capillary pressure, liquid pressure and vapour pressure are shown in Figure 4-
4.
//110,
Y", 4 Figure 4-2. Cross-sectional dimensions of the micro heat pipe
80

Heat Pipes and Heat Pipe Thermal Performance Analysis
Table 4-1. Micro heat nine dimensions Length, m 0.05
Length of condenser, m 0.0127 Length of evaporator. m 0.0127 Half of the width of the liquid-vapour interface, m
0.000133
Half of the angle of the sharp corner, rad 0.5854 Thermal conductivity of liquid K,, w/m. °C 0.6 Thermal conductivity of vapour K,
, w/m. °C 0.975
90 --
80
70
60
50 H C P
40
d = 30
20
10
30
Figure 4-3. Limits of heat transport capacity of a trapezoidal micro heat pipe with water at a horizontal orientation
81
35 40 45 50 55 60 65 70 Operating Temperature, °C

Heat Pipes and Heat Pipe Thermal Performance Analysis
1000
900
800
700
600 -,
s capillary 500 y --f- liquid
400 ±=v apou r
300
200
100
30 40 50 60 70 80 90 100 Ope rating Te m pe rature, °C
Figure 4-4. Evaluation of the pressure component as a function of the operating temperature for the trapezoidal heat pipe with water at a horizontal orientation
Figure 4-5 illustrates the results obtained for a copper heat pipe of the dimensions
described above, operating in a horizontal orientation and charged with 0.0032g of
water. The heat pipe was evaluated at a total of six operating temperatures, 30.8°C, 39.5
°C, 43.8 °C, 51.6 °C, 58.9 °C and 67.6°C, one operating temperature for each set of test
points. As shown, the thermal conductance of the pipe decreased rapidly with respect to
the evaporator temperature and asymptotically approached a constant value somewhat
above the value obtained for an uncharged pipe. With the exception of the slightly
decreasing difference between the ultimate conductance value of the test pipe and the
conductance of the uncharged pipe, this behaviour is precisely what would be expected
for a heat pipe in which the evaporator is slowly drying out. Increases in the input power
initially caused the liquid meniscus to recede into the liquid channels located in the
corners of the heat pipe. This resulted in a decrease in the radius of curvature of the
liquid-vapour meniscus, a corresponding decrease in the cross-sectional area of the
liquid, and hence, a slight increases in the evaporator temperature. The receding of the
meniscus continued with increasing power, until dry-out of the evaporator occurs.
82

Heat Pipes and Heat Pipe Thermal Performance Analysis
The slightly decreasing difference between the ultimate conductance value of the test
pipe and the conductance of the uncharged pipe resulted from an increase in the effective
size of the evaporator. Prior to dry-out, all the vaporisation occurs in the evaporator
region. Once dry out begins, the temperature of the heat pipe wall in the adiabatic
section increases and a small part of the adiabatic section began to act as an evaporator.
As the power continued to increase, the dry-out in the evaporator spread and the portion
of the adiabatic section that behaved as an evaporator expanded. In the extreme case
where complete dry-out of the evaporator section occurs, a large portion of the adiabatic
section may behave as an evaporator and may even begin to dry out at the end farthest
from the condenser.
Figure 4-6 illustrated the results for the various test points obtained for a silver heat pipe
of the same dimensions, charged with 0.0032 g of water. The test conditions were
similar; however the operating temperature at which the silver heat pipe was evaluated
were 31.8°C, 32.3°C, 42.0°C, 52.5°C, and 62.8°C. As shown, the trends and tendencies
were all similar to those of the copper pipe tested.
0.150 04
W 0.125
C) z
0.100 U
0 Z 0.075 O
Jm 0.050
W
= 0.025
0.000 L- 30 40 50 60 70 80 90 100 110 120
EVAPORATOR TEMPERATURE (°C)
Figure 4-5. Measured thermal conductance of a trapezoidal micro heat pipe as a function of the evaporator temperature (copper, 0.032 g charge)[Babin BY, 1990]
---" UNCH'ARGt`D HEAT PIPE
-0-- TEST POINT 1 I --1-- TEST POINT 2
----0- TEST POINT 3
--o-- TEST POINT 4 i
---ý-- TEST POINT 5
--ý TEST POINT 6
l1
1`Q
83
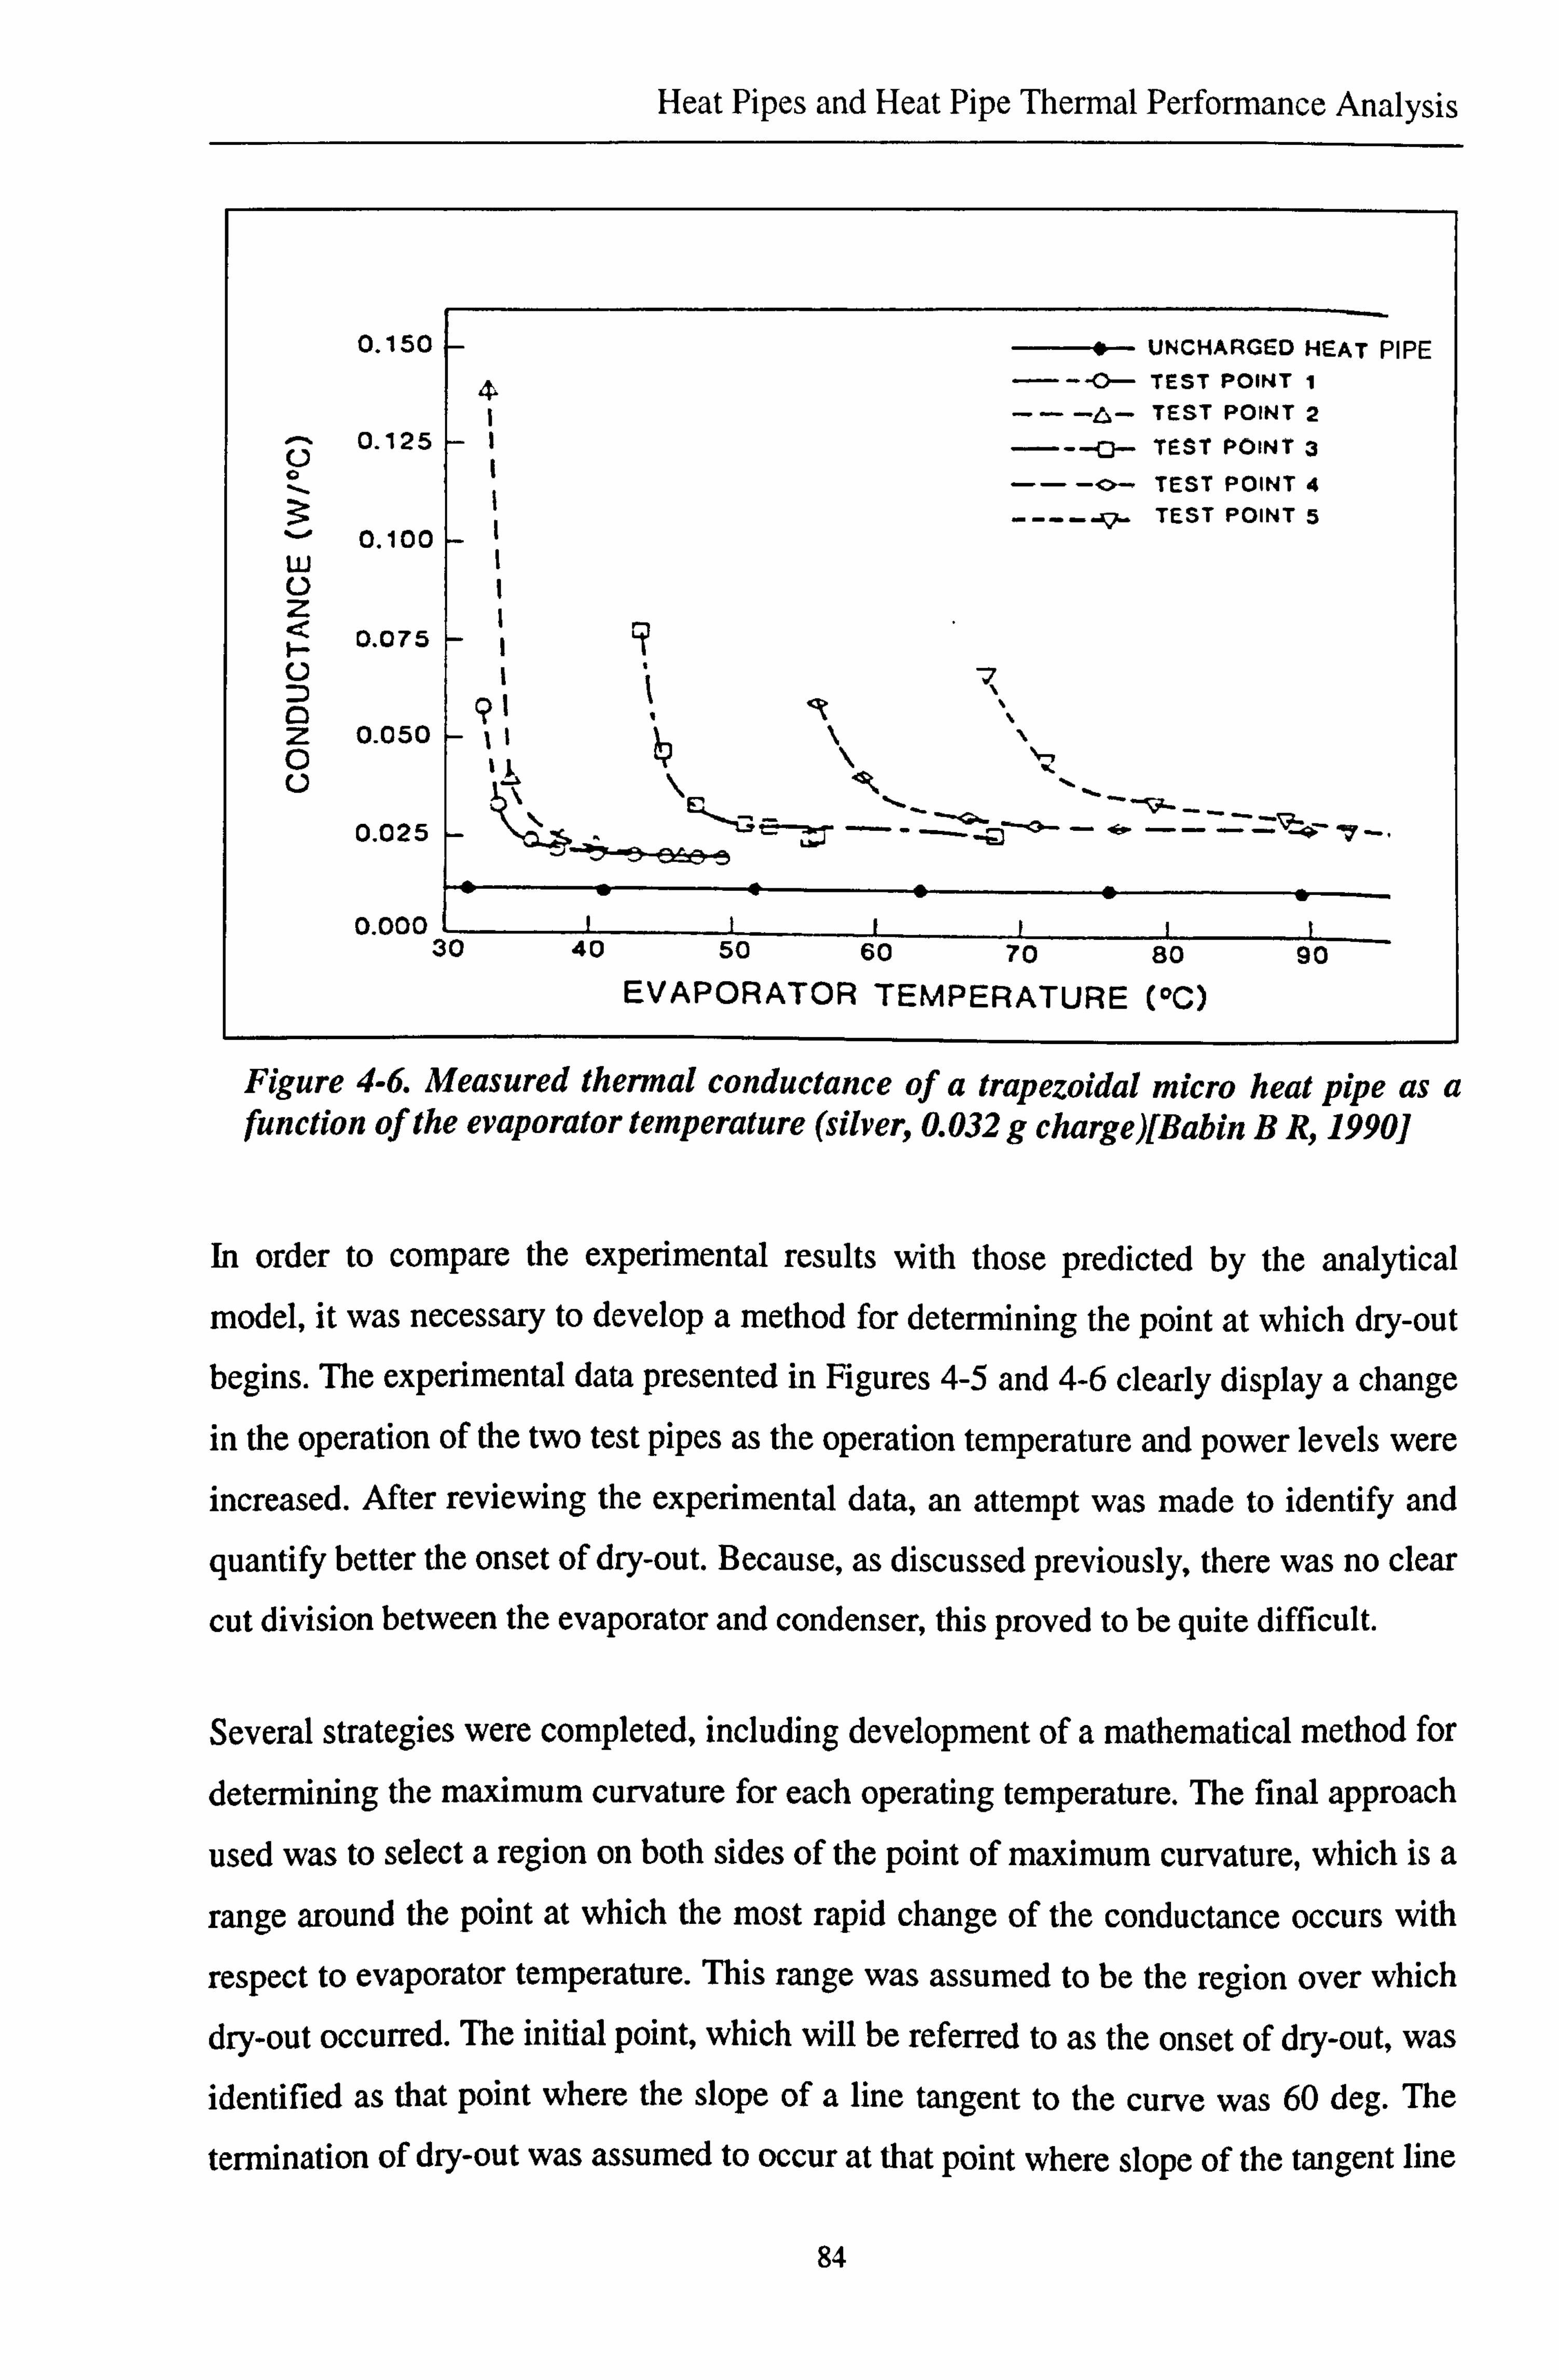
Heat Pipes and Heat Pipe Thermal Performance Analysis
0.150 " UNCHARGED HEAT PIPE
---0- TEST POINT 1
1 ---6- TEST POINT 2 0.125
----fl- TEST POINT 3
-- -o- TEST POINT 4 TEST POINT 5
`-' 0.100 W U Z 1 < 0.075 1
q
U
O !
% % Z 0.050 I L\ O V
0.025
0.000 30 40 50 60 70 80 90
EVAPORATOR TEMPERATURE (°C)
Figure 4-6. Measured thermal conductance of a trapezoidal micro heat pipe as a function of the evaporator temperature (silver, 0.032 g charge)[Babin B R, 1990]
In order to compare the experimental results with those predicted by the analytical
model, it was necessary to develop a method for determining the point at which dry-out
begins. The experimental data presented in Figures 4-5 and 4-6 clearly display a change
in the operation of the two test pipes as the operation temperature and power levels were
increased. After reviewing the experimental data, an attempt was made to identify and
quantify better the onset of dry-out. Because, as discussed previously, there was no clear
cut division between the evaporator and condenser, this proved to be quite difficult.
Several strategies were completed, including development of a mathematical method for
determining the maximum curvature for each operating temperature. The final approach
used was to select a region on both sides of the point of maximum curvature, which is a
range around the point at which the most rapid change of the conductance occurs with
respect to evaporator temperature. This range was assumed to be the region over which dry-out occurred. The initial point, which will be referred to as the onset of dry-out, was identified as that point where the slope of a line tangent to the curve was 60 deg. The
termination of dry-out was assumed to occur at that point where slope of the tangent line
84

Heat Pipes and Heat Pipe Thermal Performance Analysis
was 30 deg. Although this would appear to be a large range, in reality it is probably
reasonably close to the actual behaviour, since dry-out is a gradual process and unlike
the sonic or boiling limit, develops quite slowly.
Figures 4-7 and 4-8 illustrate the results of this process and compare the measured input
power to the heat pipe evaporator, with the maximum heat transfer capacity predicted by
the model for the copper and silver test pipes, respectively. As shown, at low operating
temperatures, this model over-predicts the experimentally determined maximum heat
transport capacity by approximately 15 percent for both the copper and silver test pipes. Between operating temperatures of 40 and 60, the model predicts dry-out with a
reasonable degree of accuracy, and above 60 the model slightly under-predicts dry-out.
In overall, the steady-state experimental results provide experimental verification of the
trapezoidal micro heat pipe concept and indicate that the analytical model can be used to
predict accurately the level of performance. Since variations in the way the dry-out
phenomenon is defined can significantly increase or decrease the experimentally determined values, the discrepancy between the measured and predicted values may in
part be due to the technique used to define dry-out. As a result, the perceived accuracy of
the models is strongly dependent upon the way dry-out is defined. To resolve this
problem, it is necessary to understand the dry-out phenomenon better and define more
clearly when it begins and how it proceeds.
85

Heat Pipes and Heat Pipe Thermal Performance Analysis
0.6 0 onset of dry out
0.5 f termination of dry out modelling results
0.4 O
° 0.3,
C O
2 0 O . O O
N
0.1 1A
'O 0
30 35 40 45 50 55 60 65 70 75 80
Operating Temperature, °C
Figure 4-7. Comparison of the maximum heat transport capacity of a trapezoidal micro heat pipe as a function of the operating temperature (copper, 0.0032 g charge)
0.45-
0.4- 0 onset of dry out
f termination of dry out 0.35 steady state capillary model
3 0.31
AO
CL 0.25 n I 0.2
12 0.15
O
M1 0.1
0 0.05 0
0 30 35 40 45 50 55 60 65 70 75 80
Operating temperature, °C
Figure 4-8. Comparison of the maximum heat transport capacity of a trapezoidal micro heat pipe as a function of the operation temperature (silver, 0.032 g charge)
86

Heat Pipes and Heat Pipe Thermal Performance Analysis
4.4 Modelling of the Heat Transfer of the New Type Heat Pipe and Discussion
For the purpose of optimum designing the new type thermal diode, the modelling of the
heat transfer of the new type thermal diode was carried out. Consider this new type
thermal diode will work in two modes, i. e, cooling mode (in summer) and heating mode
winter (in winter), a larger working temperature range is required. The working fluids n-
pentane (working temperature range is -20°C--120°C) and HFE-7100 (working
temperature range is -20°C-70°C) are suitable for this application and are used as
working fluids in the modelling.
As mentioned in section 4.1, due to the particular structure of the new type thermal
diode, it could be constructed for two cases: one uses wick to distribute liquid in the
evaporator; another fills more liquid to keep the internal surface of the evaporator wet. The thermal performance of the two cases were investigated and compared. These
related to the relations of the maximum heat transport capacity with liquid fill level,
working temperature and thermal diode geometry dimension.
The analytical model was used to determine maximum heat transport capacity. The
invariable parameters in the modelling are assumed, i. e., for both thermal diodes with
and without wick, the lengths of the evaporator and condenser are 0.32m respectively, the lengths of the adiabatic section is 0.15m. For the thermal diode with wick, three layers of woven wire mesh (mesh count: 200) wick was assumed. These assumptions
were in consistent with the testing condition of the thermal diode operation in the
thermoelectric heat pump.
Relation between maximum heat transport capacity and working temperature
Figure 4-9 and Figure 4-10 show the relations between maximum heat transport capacity
and working temperature for the thermal diodes with and without wick. These results
were obtained by further assuming the cross section diameter to be O. Olm and the liquid
fill level to be 0.08m.
The simulation results indicates that for the same values of the working temperature, the
maximum heat transport capacities of the thermal diodes without wick (dominated by
entrainment limts) are much greater than those with wick (dominated by capillary
87

Heat Pipes and Heat Pipe Thermal Performance Analysis
limits), and increase obviously with the working temperature. For the maximum heat
transport capacities, n-pentane is superior to HFE-7100.
Relation between maximum heat transport capacity and liquid fill level
Figure 4-11 and Figure 4-12 show the relations between maximum heat transport
capacity and liquid fill level for the thermal diodes with and without wick. The results
were obtained by further assuming the cross section diameter to be O. Olm and working
temperature to be 45°C.
The simulation results indicates that the maximum heat transport capacities of the
thermal diode with wick (dominated by capillary limits) increase with liquid fill level.
When the liquid fill level is greater than 0.22m, the increase is significant. However, to
use the wick in the new type thermal diode is intending not to use higher liquid fill level,
the role of the wick is to distribute liquid from bottom of evaporator to the whole
internal surface of the evaporator. Normally a liquid fill level of 1/3-1/4 of the
evaporator length is suggested in a heat pipe [Dunn and Reay, 1982], in which cases, the
maximum heat transport capacities of thermal diode with wick are only 18-19W for n-
pentane pipe, 11-12W for HFE-7 100 pipe.
The maximum heat transport capacities of the thermal diodes without wick remain
constant and are much more than that with wick, if the liquid fill level is greater than
0.04m, for this condition the maximum heat transport capacities are dominated by
entrainment limit. If the liquid fill level is less than 0.04m, the maximum heat transport
capacities are dominated by dry out limit, which increases with the liquid fill level. The
investigation suggests that the liquid fill level does not influence the maximum heat
transport capacities if it is over 0.04m.
Relation between maximum heat transport Capacity and cross section diameter
Figure 4-13 and Figure 4-14 show the relations between the maximum heat transport
capacity and cross section diameter for the thermal diodes with and without wick. The
results were obtained by further assuming the working temperature to be 45°C and liquid
fill level to be 0.1 m.
88
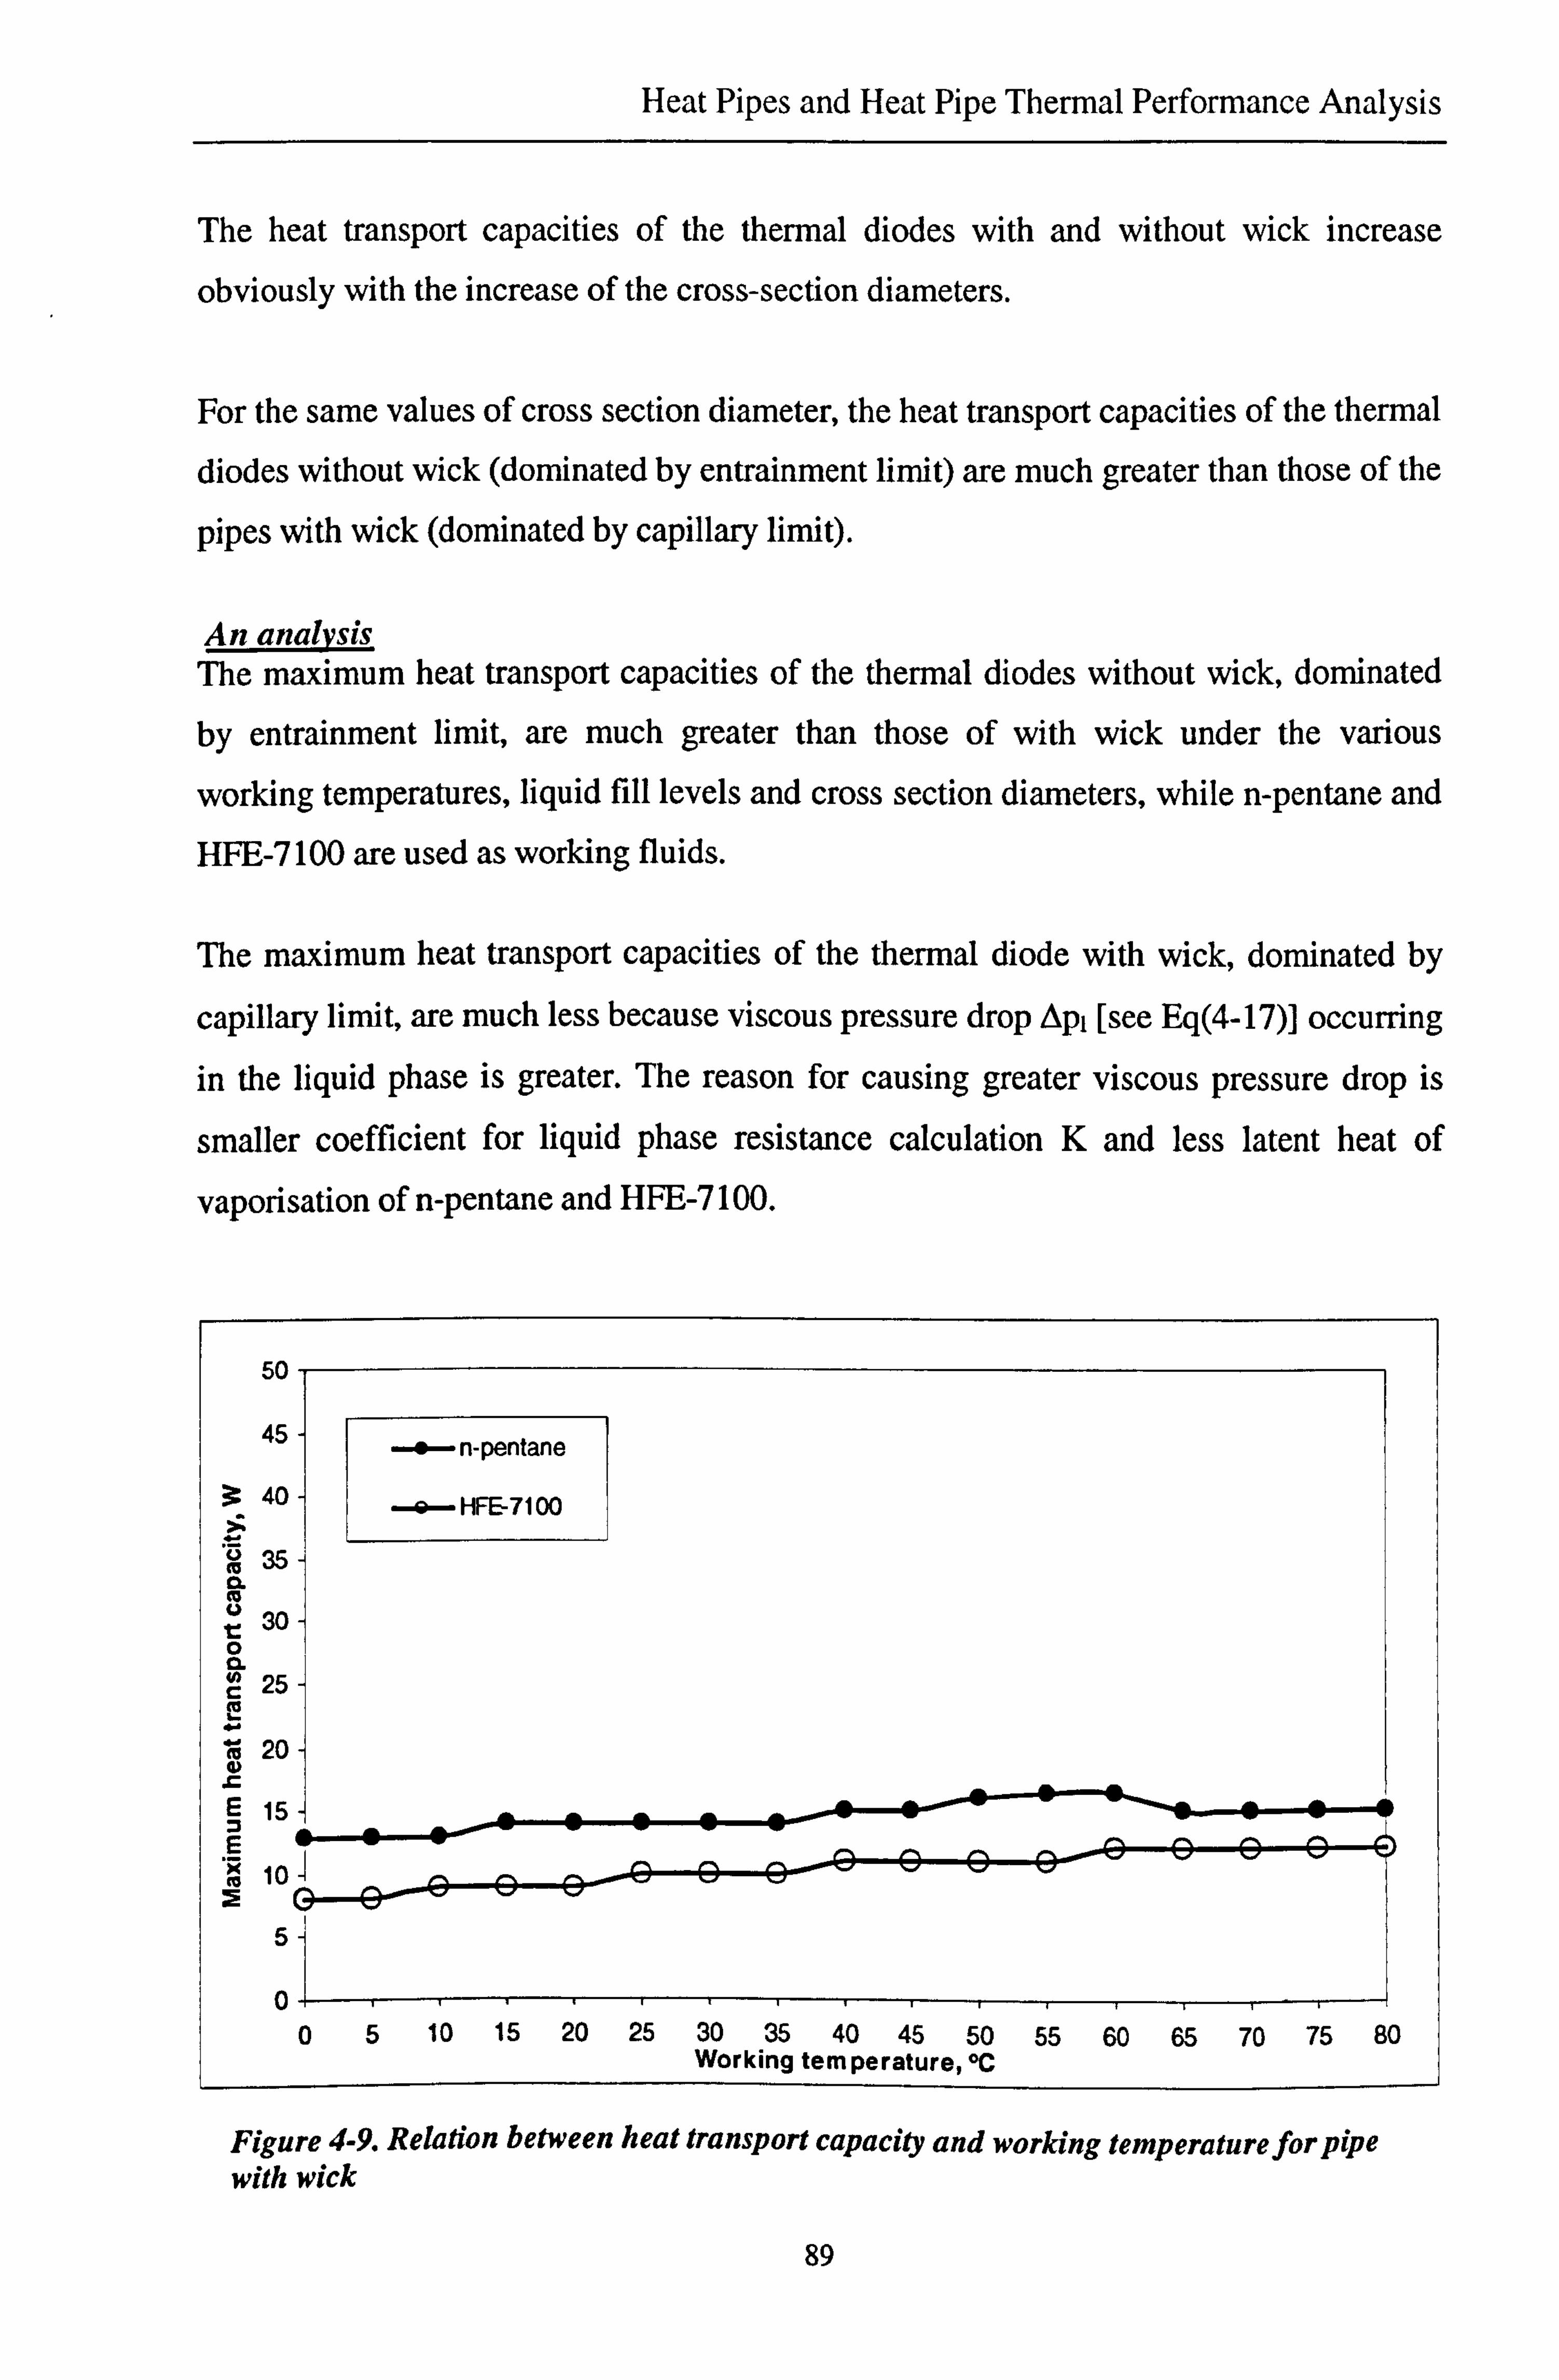
Heat Pipes and Heat Pipe Thermal Performance Analysis
The heat transport capacities of the thermal diodes with and without wick increase
obviously with the increase of the cross-section diameters.
For the same values of cross section diameter, the heat transport capacities of the thermal
diodes without wick (dominated by entrainment limit) are much greater than those of the
pipes with wick (dominated by capillary limit).
An analysis The maximum heat transport capacities of the thermal diodes without wick, dominated
by entrainment limit, are much greater than those of with wick under the various
working temperatures, liquid fill levels and cross section diameters, while n-pentane and HFE-7 100 are used as working fluids.
The maximum heat transport capacities of the thermal diode with wick, dominated by
capillary limit, are much less because viscous pressure drop Opl [see Eq(4-17)] occurring
in the liquid phase is greater. The reason for causing greater viscous pressure drop is
smaller coefficient for liquid phase resistance calculation K and less latent heat of
vaporisation of n-pentane and HFE-7100.
89
Figure 4-9. Relation between heat transport capacity and working temperature for pipe with wick

Heat Pipes and Heat Pipe Thermal Performance Analysis
1,0
100
90-
80-
a CL 70-
r ä 60- N
500
40 L
E 30
20 -
10,
0+ 0
Figure 4-10. Relation between heat transport capacity and working temperature for the pipe without wick
90
5 10 15 20 25 30 35 40 45 50 55 60 65 70 75 80 Working temperature, °C
Figure 4-11. Relation between maximum heat transport capacity and liquid fill level for the pipe with wick
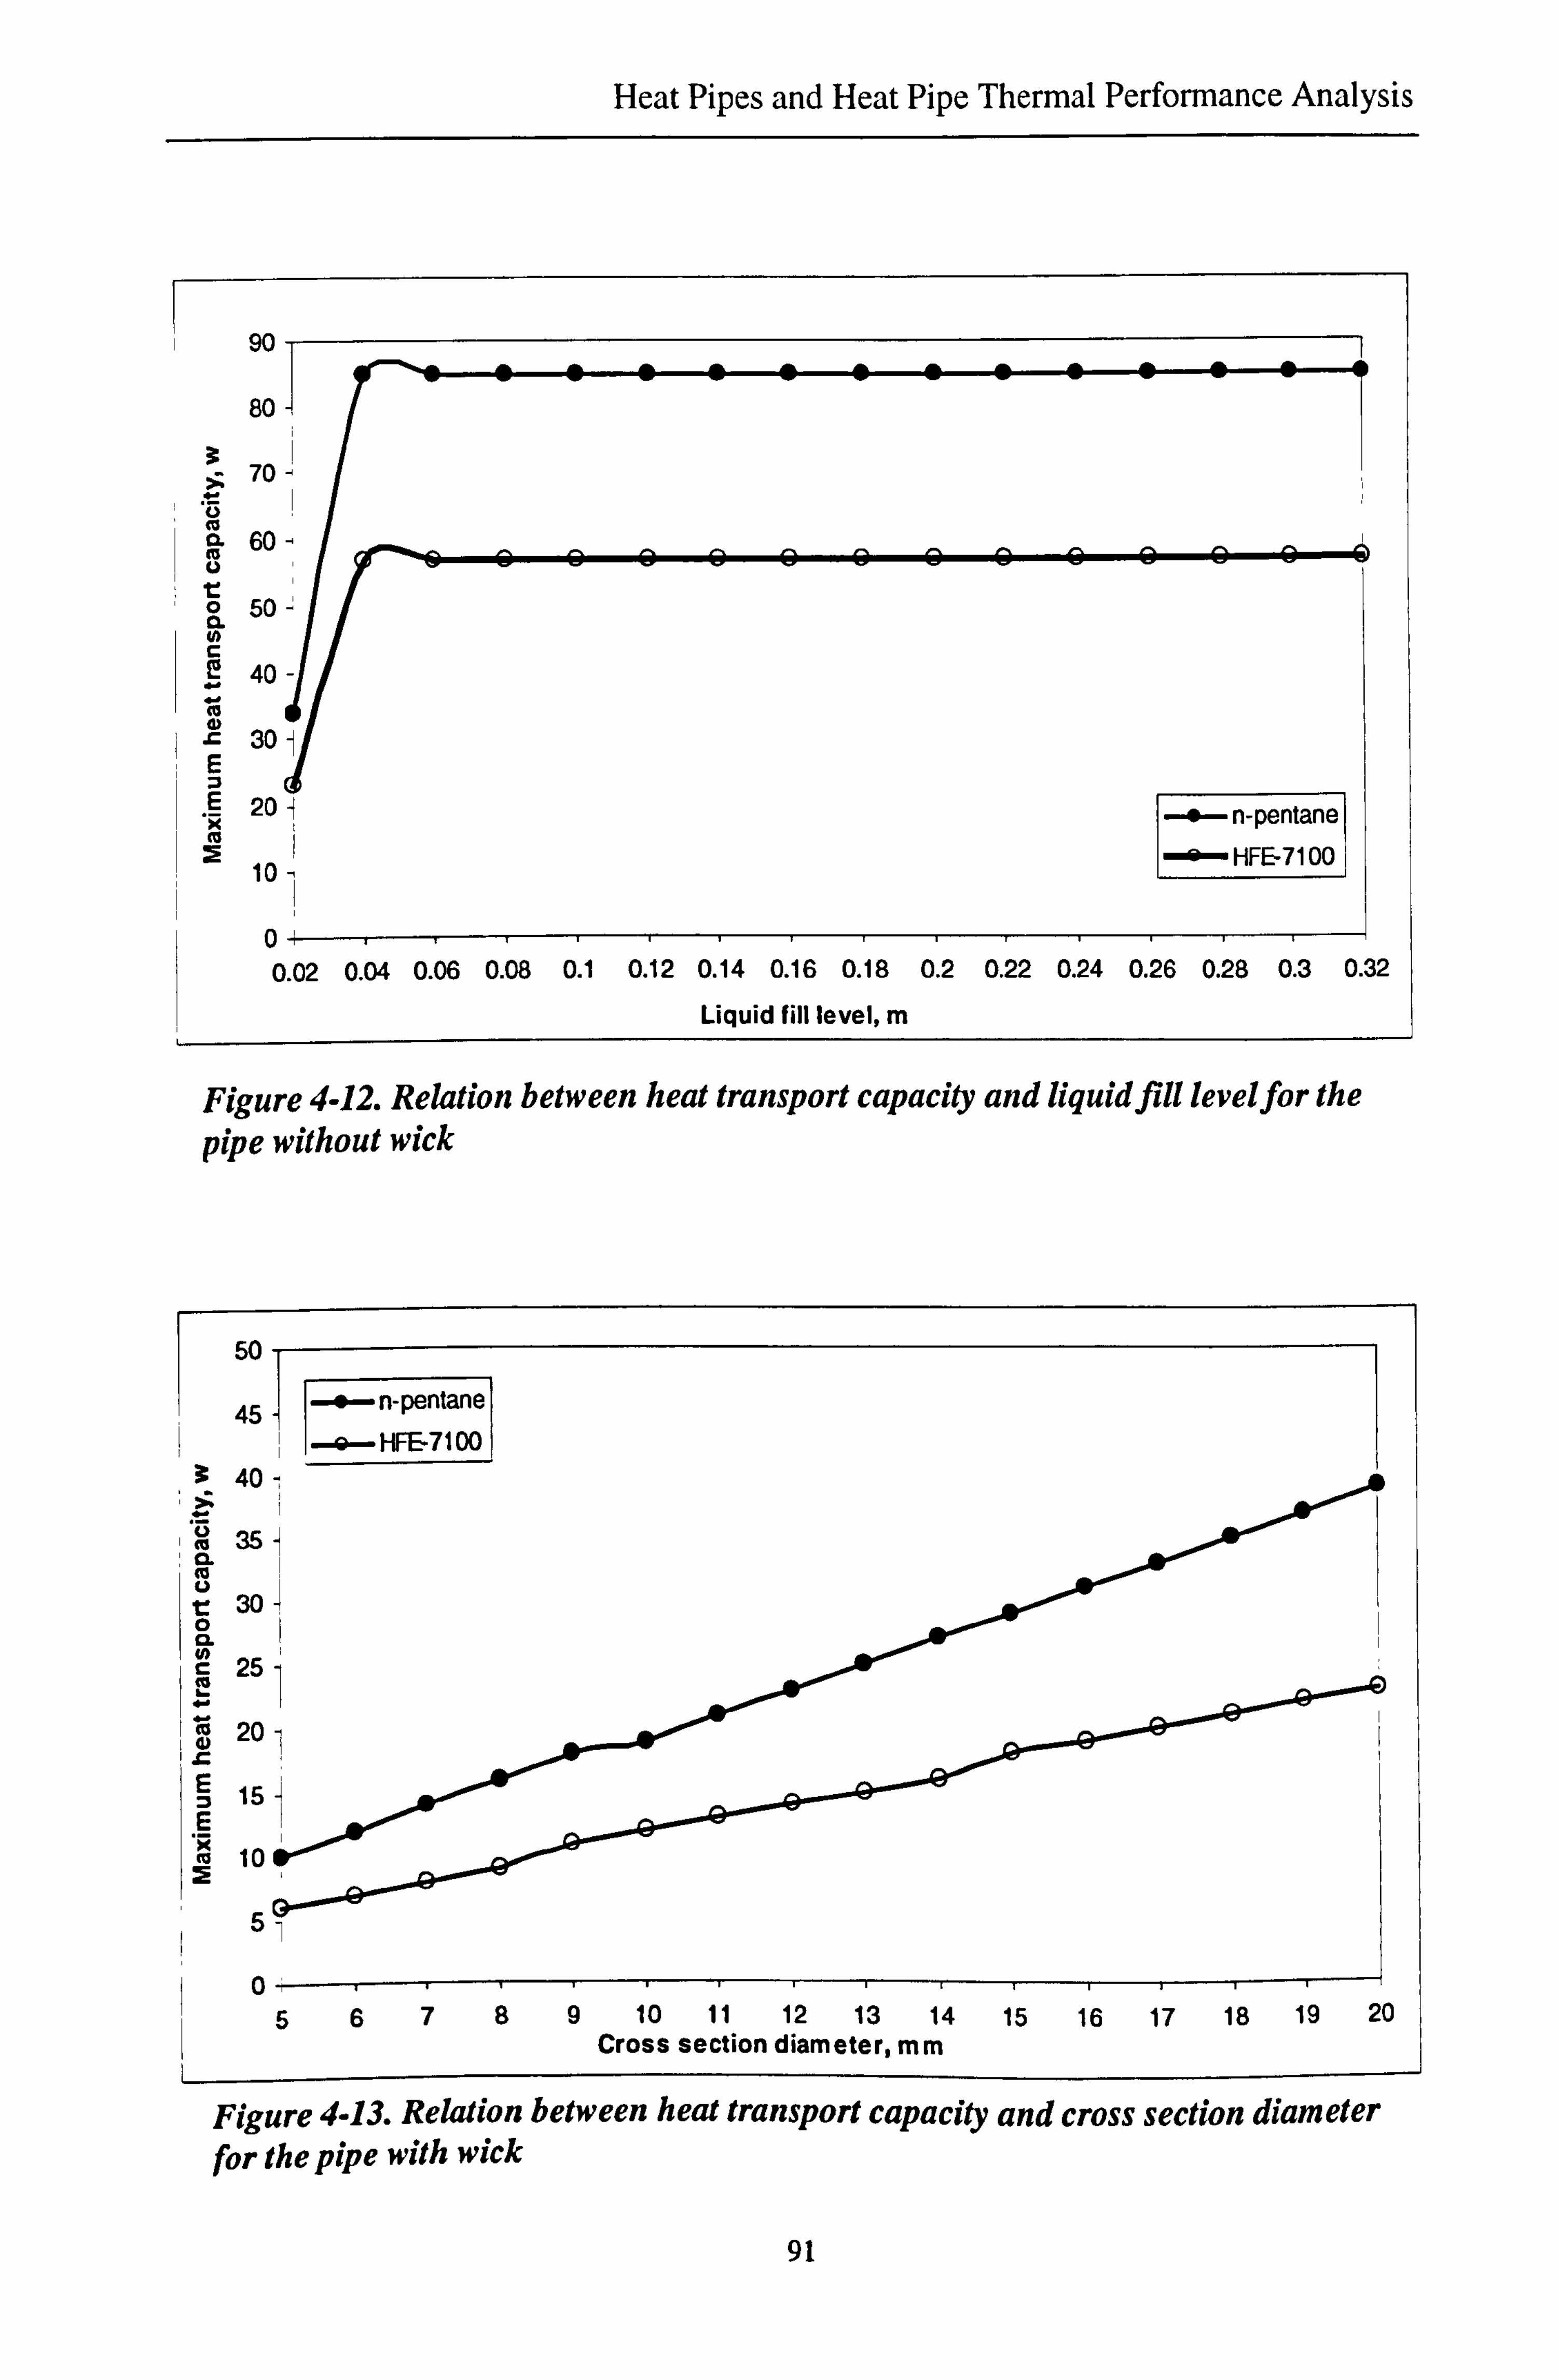
Heat Pipes and Heat Pipe Thermal Performance Analysis
90
80
70
60- 9Q
50-
125 40-
m r 30ý E
20 - 4- n-pentane
10 HFE-7100 1
0 0.02 0.04 0.06 0.08 0.1 0.12 0.14 0.16 0.18 0.2 0.22 0.24 0.26 0.28 0.3 0.32
Liquid fill level, m
Figure 4-12. Relation between heat transport capacity and liquid fill level for the pipe without wick
50
45
40-,
35 CL V
30
CL c 25
20 j
E 15
100
5
0- 5
Figure 4-13. Relation between heat transport capacity and cross section diameter for the pipe with wick
91
6789 10 11 12 13 14 15 16 17 18 19 20 Cross section diameter, mm

Heat Pipes and Heat Pipe Thermal Performance Analysis
500
450
400 IT Ü
0.350 Co
0 300 H. 250
200 E E 150 0 2 100
50
Figure 4-14. Relation between heat transport capacity and cross section diameter for the pipe without wick
4.5 Conclusion
The conventional heat pipes including normal heat pipes, micro/miniature heat pipes and
a new type thermal diode, with/without wick, were illustrated in this chapter. The
investigation of the conventional heat pipes provided the basis for investigation of a new
type heat pipe.
An analytical model was developed to evaluate the thermal performance of all above
heat pipes. The maximum heat transport capacity is taken as the index evaluating heat
transfer capability of a heat pipe, which is governed by six limits, i. e., the sonic limit, the
entrainment limit, the boiling limit, the viscous limit, the capillary limit and the filled
liquid mass limit. The physical phenomena and mathematical theory involved with the
process were indicated, and a computer program was developed based on the above
analysis.
92
0
56789 10 11 12 13 14 15 16 17 18 19 20 Cross section diameter, mm

Heat Pipes and Heat Pipe Thermal Performance Analysis
The modelling was carried out to analyse the thermal performance of the new type
thermal diode that is intending to be used as the components of the novel thermoelectric
heat pump. It was found that:
" The maximum heat transport capacities of the new type thermal diode without wick, dominated by entrainment limit, are much greater than that of with wick under the
various working temperatures, liquid fill levels and cross section diameters, while n-
pentane and HFE-7 100 are used as working fluids.
" The maximum heat transport capacities of the new type thermal diode with wick,
dominated by capillary limit, are much less because viscous pressure drop Opi [see
Eq(4-17)] occurring in the liquid phase is greater. The reason that cause greater
viscous pressure drop is smaller coefficient for liquid phase resistance calculation K
and less latent heat of vaporisation of n-pentane and HFE-7100.
" The maximum heat transport capacities of the new type thermal diode without wick,
dominated by entrainment limit, are greater and they increase with the increase of
working temperature and cross section diameter, and remain constant for various liquid fill levels greater than 0.04m.
" For the maximum heat transport capacities of both thermal diodes with and without
wick, n-pentane is superior to HFE-7100.
93

Chapter 5. Thermoelectric Heat Pump System
5.1 Design of the Thermoelectric Heat Pump Prototype System
A small-scale thermoelectric heat pump prototype system was designed to work in two
modes. i. e., cooling mode and heating mode. It comprised of a new type thermal diode,
eight thermoelectric modules and three heat sink units and two cooling fans, as shown in
Figure 5-1. The system is mounted on one of the walls of a large box
(1 22tnx I. 22mx I. 22m), which was insulted on the inside by a 70mm thick polystyrene
plate, held in place by wood plate of thickness 20tnm. This box simulated a room for the
experiment.
III Cranked thermal diode
i 11 - Condenser
Thermoelectric modu1c. ý Outside heat sink
Inside heat sink Bearing Mask
Evaporator fan 1
Lamps -,: E_]I I -- Insulation
Fan guide Fant
(al
Fwanoratnr
ihi
Figure 5-1. Schematic diagram of the thermoelectric heat pump (a) cooling mode (b) heating mode
94

Thermoelectric Heat Pump System
Calculations have been carried out using the analytical model described in Chapter 4 to
estimate the performance of the new type thermal diode that were used in this heat pump
system. Since the new type thermal diode without wick has much higher heat transport
capacity than that with wick, it was decided to use the new type thermal diode without
wick for this application. The thermal diode was designed taking into account its suitable
size to fit the total area of the thermoelectric modules, maximum heat transfer capacity
and economy in manufacturing. The structure of the thermal diode is shown in Figure. 1-
1. The evaporator and condenser of the thermal diode are flat panels, which sizes are
320mmx150mmx15mm respectively. Each panel contains 11 circular holes of 010mm
inside. The holes connect each other at the end to keep the working fluid inside the
thermal diode at the same level. The adiabatic section is a circular tube with the length of
120mm. The angle between the flat panel and the adiabatic section is 120°, which incurs
less resistance to fluid than an angle of 90°. A bearing is used to switch the thermal
diode from cooling to heating mode, or the reverse. The flat panels and the adiabatic
section are connected with headers. The adiabatic section and the headers are tubes with
internal diameter of 50mm. The working fluid in this thermal diode is n-pentane, which
has a work range of -20°C--120°C. The liquid fill level of the thermal diode is 0.3m. The
maximum heat transport capacities of the thermal diode are 940W at a working
temperature of 45°C (cooling mode), and 630W at a working temperature of 5°C
(heating mode).
The optimum selection model described in Chapter 3 was used to select the
thermoelectric modules used in this system. The eight thermoelectric modules (type
CP2-127-06, Melcor) were selected to obtain optimum COP under designed severest
working conditions in cooling mode, i. e., possible largest cooling capacity, possible
highest hot side temperature and possible lowest cold side temperature. Due to the low
COP of the thermoelectric system when working in cooling mode, the improvement of
performance of the system on cooling mode was a main concern in this design.
The eight thermoelectric modules, connected electrically in series, were mounted side by
side on the surface of one flat panel (located inside the box) of the thermal diode. The
thermoelectric modules were sandwiched between the panel and a heat sink (called
inside heat sink). Two heat sink units (called outside heat sink) were mounted on both
95

Thermoelectric Heat Pump System
sides of another panel (located outside the box) of the thermal diode, as shown in Figure
5-1. The thermal contacts between all contacting surfaces were improved by applying a
thin film of thermal grease. The panel with the mounted thermoelectric modules
performed as an evaporator in the cooling mode, and a condenser in the heating mode,
while the other panel located at outside the box performed as a condenser in the cooling
mode, and an evaporator in the heating mode.
The heat sinks were designed being capable to dissipate the heat absorbed on the cold
side and heat produced on the hot side. The inside heat sink was designed to have the
thermal resistance of 0.133655 °CW 1 (when the air velocity is I m/s; convective
coefficient isl3.97W/m2°C). The outside heat sink was designed to have the thermal
resistance of 0.123681 °CW1 (when the air velocity is 2m/s; convective coefficient is
19.8W/m2°C). Calculations have been carried out using the analytical method of the
performance of finned heat sink described in Chapter 3 to determine dimensions and the
number of fins of the heat sinks used in this heat pump system. The fins of the heat sinks
were positioned vertically. Two cooling fans were used to provide air flow toward inside
heat sink and outside heat sink respectively in the tests. The fan 1 is only used in the
prototype system for laboratory test. For the real system mounted on the building, the
fan 1 is not needed because the nature wind would provide the required airflow.
The heat pump system will work in two modes. In cooling mode, shown in Figure 5-1
(a), heat from the building is extracted by the thermoelectric modules. The heat causes
the working fluid inside the thermal diode to boil and vaporise. As the vapour flows to
the condenser section (situated outside the building) it condenses and releases heat to the
ambient. 'Heat sinks and fans are used to help dissipating heat. The thermal diode is able
to prevent reverse heat flow in the event of power failure. Four lamps (25W, 40W, 60W,
100W) were used in the prototype system to simulate heat sources in the testing.
In heating mode, the thermal diode will be rotated along the axis of the bearing to
reverse the functions of the evaporator and condenser sections and also the direction of
the DC power will be changed, as shown in Figure. 5-1(b). A small fan (not shown in the
figure) was mounted on the wall of the box to produce heat losses. Heat provided by the
system to heat the interior of the box comes from two sources: one is electrical power;
96

Thermoelectric Heat Pump System
and the other is the ambient air. Ambient heat extracted by the evaporator section of the
thermal diode causes the working fluid to vaporise. As the vapour flows to the condenser
section of the thermal diode, it condenses and releases heat to the thermoelectric
modules. These upgrade the heat to a more useful temperature that can then be used for
space heating in the box (room).
5.2 Analytical Model Set-up
An analytical model has been developed to simulate the performance of the novel
thermoelectric heat pump system under various operating and weather conditions.
A number of heat processes exist in various areas of the thermoelectric heat pump. The
processes would proceed until balance states are achieved and would be inter-linked by
developing the analytical model.
Formulas
The following formulas show relations for the various parameters in the system, and are
useful for setting up the analytical model.
Heat balance equation across the inside heat sink: Tc=T; n-QcRc (for cooling mode) (5-1c)
Th=QhRc+Tin (for heating mode) (5-1h)
Average temperature of the hot and cold side of the thermoelectric modules: Tm=(T6+Tc)/2 (5-2)
Temperature difference between the hot and cold side of the thermoelectric modules: OT=Tb-Tc (5-3)
Heat balance equation across the thermal diode and outside heat sink*: Qh (Th-T. )/(Rh+Rhp) (for cooling mode) (5-4c)
Qc=(Ta-Tc)/(Rh+Rhp) (for heating mode) (5-4h)
Power consumption: Pe: Qn-Qc (5-5)
Calculation of COP by its definition:
97

Thermoelectric Heat Pump System
COP=COP1=Q, /Pe (for cooling mode) (5-6c)
COP=COP1=1+Qc/Pe (for heating mode) (5-6h)
Operating current:
I= (2NaTT - (2NaT, )2 -4Np(Q,, +2NkATG)/G)/(2Np/G) (5-7)
Calculation of COP by formulae of thermoelectric module performance analysis:
COP= COP2=[ a ITc-kATG-I2p/(2G)]/ (I2p/G+ a IOT) (for cooling mode) (5-8c)
COP= COP2=1+[ a ITc-kiTG-I2p/(2G)]/ (I2p/G+ a IAT) (for heating mode) (5-8h)
The material property coefficients a, p and k are shown in Appendix A.
* Calculation of thermal resistances of the thermal diode
Eq(5-4c) and Eq(5-4h) require values of the thermal resistance of the thermal diode,
which can be calculated by a subroutine. The calculation of this thermal resistance is
detailed below.
The heat extracted by the evaporator on the hot side will be transported to the outside
heat sink (in cooling mode) or cold side of the thermoelectric modules (in heating mode)
through evaporation and condensation of the working fluid in the heat pipes. There are
several heat resistances in this process, namely, the evaporator wall resistance, the
equivalent resistance of the working fluid in the evaporator, the vapour flow resistance,
the equivalent resistance of the working fluid in the condenser, and condenser wall
resistance. These resistances may be expressed as follows [Dunn P. D. and Reay
D. A., 1982]:
Evaporator wall resistance: r0
2 In( rQ / rýý ) R,. e =- 21ck
p (5-9)
Evaporator saturated wick (liquid film for heat pipe without wick) resistance: 2 ln(re /r
Rw. e - ro21eke ,) (5-10)
98

Thermoelectric Heat Pump System
Vapour flow resistance:
R mo 2 fyTy(1, /6+la +l /6) v, P = (5-11)
pvAj
Condenser saturated wick (liquid film for heat pipe without wick) resistance:
R_ ro i 1n(r,, / r,,,,, ) 2lcke
Condenser wall resistance:
ro21n(ro /i) Rp ̀- 21ckP Total resistance:
(5-12)
(5-13)
Rhp = Rp e+
Rw e+R, ,p+
RK, + Rp c
(5-14)
Structure of the Model
For an existing system, the known parameters for a simulation are cooling capacity Q,
(cooling mode) or heating capacity Qh (heating mode), and the inside room Ti. and
ambient temperature T.. These parameters are insufficient to calculate operating current
and COP by using the above formulas directly. An analytical model with a loop block is
required to solve this problem. The flow chart of the model is shown in Figure 5-2. The
program in C++ language is shown in attached disk (program D).
99

Thermoelectric Heat Pump System
Start
Input system parameters G, N
Heating
Rý Input system parameters R.. k. and working condition Qh, T. and T.
Assume TO-Tee.
Calculate Th, Tm, AT
Calculate R, p by calling subroutine
Calculate Q. and P
Calculate COP1
Calculate material property parameters a, p and k
Calculate I, V7
Calculate COP2
Cooling mode or heating mode?
Cooling
Input system parameters Rsink, Rc and working condition Qý, T. and T.
Assume Th=T, +15
Calculate Tc, Tm, AT
Calculate R,, p by calling subroutine
Calculate Qt, and P
Calculate COP1
Calculate material property parameters a, p and k
Calculate I, V7
Calculate COP2
N COPi-COP=>=0015?
"N COPI-COPZ-0015?
Y
Ih= Its-0.005 II 11ý= Ib+0.005 II Th=Ttº-0.005 n_-' h+0.005
a=o. oi
N
Change the parameters of working condition alternatively repeat the above procedure and obtain further simulation
N
Figure 5-2. Flow chart of the system simulation model
100

Thermoelectric Heat Pump System
5.3 Modelling of the Performance of the Heat Pump Prototype System and
Discussion
The analytical model was used to simulate the performance of the heat pump prototype
system. The simulation results were obtained for various operating and weather
conditions, for both cooling mode and heating mode. The required operating currents
under these conditions were also shown. For the fixed system, the operating voltage is a
function of operating current I, hot and cold side temperature Th, T. This relation can be
seen in Eq(3-5).
5.3.1 Modelling of Cooling Mode
The simulation was carried out for various cooling capacities by assuming the
temperature inside room to be 21°C when the heat balance is achieved and the ambient
temperature to be 24°C. The results are shown in Figure 5-3. It can be seen that the COP
decreases and the operating current increases with the increase of the cooling capacity. Due to more heat to be conducted, which requires larger temperature difference across
the inside heat sink, the cold side temperature will therefore decrease when the inside
room temperature is fixed. Furthermore, the increasing cooling capacity and power
consumption leads to more heat to be conducted by the thermal diode and the outside heat sink, which requires larger temperature difference across the two components, the
hot side temperature will therefore increase when the ambient temperature is fixed.
Figure 5-4 shows the variation of the hot and cold side temperatures of the
thermoelectric modules with cooling capacity, which was obtained by the modelling. The increasing temperature difference between hot and cold side will decrease the COP
of the thermoelectric modules, and therefore further increase the required operating
current, this relation can be seen in Eq(5-7) and Eq(5-8c).
The simulation was also carried out for various ambient temperatures by assuming the
temperature inside room to be 21°C when the heat balance is achieved and no heat
sources inside the room. The results are shown in Figure 5-5. It is seen that the operating
current increases and the COP decreases with the increase of the ambient temperature.
This is because increasing ambient temperature requires increasing hot side temperature
to keep the required temperature difference across the thermal diode and outside heat
sink. Furthermore, due to the increase of the ambient temperature, the heat transfer from
101

Thermoelectric Heat Pump System
the environment to the interior of the room increases, therefore, more heat needs to be
conducted out to keep the temperature inside the room to be 21°C and more power
consumption is required. This requires increasing temperature difference across the
inside heat sink, which therefore leads to the cold side temperature to decrease. The
variation of the hot and cold side temperatures of the thermoelectric modules with
ambient temperature is shown in Figure 5-6. The increasing temperature difference
between hot and cold side of thermoelectric modules decreases the COP and further
increases the power consumption.
66 F
. -operating current in modelling
S. -s- COP in modelling
Q 4-
3 rn
O 2-
0- 20 25 30 35 40 45 50 55 60 65 70
Cooling capacity, W
5
4
a 30 ci
2
0 75
Figure 5-3. Variation of operating current and COP with cooling capacity in modelling [V=-1.412+17.61-4.4(V)]
102

Thermoelectric Heat Pump System
70
0 hot side tenperature
60- --9 c
50-
) 0
40-
30- CL E
20-
10-
0 20 25 30 35 40 45 50 55 60 65 70 75
Cooling capacity, W
Figure 5-4 Variation of hot side and cold side temperatures of thermoelectric modules with cooling capacity in modelling
2.1
ýft oper ating current in modellin 1.8 : COP in modelling
1.5-
1.2-
.S 0. s a
0.6-
0.3
5
4
3
M O
2
1
0I ---' .0 23 24 25 26 27 28 29 30 31
Ambient temperature, °C
Figure 5-5 Variation of operating current and COP with ambient temperature in cooling mode in modelling[V=0.1412+12.71-0.11(v)]
103

Thermoelectric Heat Pump System
0
LD
V
CL E N d v N
0 V
0 C W Y 0
2
39 he 37 -1
--G- cc 35-
33-
31 -
29 -
27 -
25-
23 -
21 -
19-
17-
15 23 24 25 26 27 28 29 30
Ambient temperature, OC 31
Figure 5-6. Variation of hot side and cold side temperatures of thermoelectric modules with ambient temperature in cooling mode in modelling
5.3.2 Modelling of Heating Mode
The simulation was carried out for various heating capacity by assuming temperature
inside room to be 18°C when the heat balance is achieved and the ambient temperature
to be 5°C. The results are shown in Figure 5-7. It is seen that the operating current
increases and the COP decreases with the increase of the heating capacity. Due to more
heat to be conducted to the inside room, which requires larger temperature difference
across the inside heat sink, the hot side temperature will increase when the inside room
temperature is fixed. Due to more heat is conducted from the ambient to the cold side of
the modules, which requires larger temperature difference across the thermal diode and
the outside heat sink, the cold side temperature will decrease when the ambient
temperature is fixed. Furthermore, larger heating capacity requires more power
consumption in the system, this is further increasing operating current and temperature
difference between the hot and cold side. Figure 5-8 shows the variation of the hot and
cold side temperatures of the thermoelectric modules with heating capacity obtained by
modelling. The increasing temperature difference between hot and cold side of
104

Thermoelectric Heat Pump System
thermoelectric modules decreases the COP, and therefore further increase the required
operating current, this relation can be seen in Eq(5-7) and Eq(5-8h).
The simulation was also carried out for various ambient temperatures by assuming the
temperature inside room to be 18°C when the heat balance is achieved. The results are
shown in Figure 5-9. It is seen that the operating current decreases and the COP
increases with the increase of the ambient temperature. Due to the increase of the
ambient temperature, the heat loss from the inside the room to ambient decreases,
therefore, less heat requires to be conducted by the system to keep the temperature inside
the room to be 18°C. This requires less temperature difference across the inside heat
sink, which leads to the hot side temperature to decrease. Furthermore, the more
important reason for the cold side temperature to increase is the increasing ambient
temperature itself. The increase of the ambient temperature increases the working
temperature of the thermal diode. This causes the cold side temperature increase.
Decrease of the heat transfer by the thermoelectric modules requires less electric power
to be consumed in the system, this is why the operating current is decreased. Figure 5-10
shows the variation of the hot and cold side temperatures of the thermoelectric modules
with ambient temperature in heating mode, obtained by modelling. The decrease of the
temperature difference between hot and cold side of thermoelectric modules increases
the COP.
105

Thermoelectric Heat Pump System
5
4.5 - '--*-COP in simulation
4-
3.5-
v rn
3- 3- a I- d a CL 0
2.5-
2-
1.5 90 105 120 135 150 165 180 195 210 225 240 255 270 285 300
Heating capacity, W
2.4
2.2
2
1.8 a 0 L)
1.6
1.4
1.2
1
Figure 5-7 Variation of operating current and COP with heating capacity in
modelling [V=-2.512+24 9I-19(1)j
30
-+- hot side temperature 25 - -c-cold side temperature ý
20-
15- m
C, d E 10- 4) F-
5-
Di
.5 80 100 120 140 160 180 200 220 240 260 280 300 320
Heating capacity, W
Figure 5-8 Variation of hot side and cold side temperatures of thermoelectric modules with heating capacity in modelling
106

Thermoelectric Heat Pump System
4
-+-operating current in modelling
-a- COP in modelling 3.5 -
Q 3-
C
2.5- rn
CD 02
1.5 -
3
2.5
2
CL 1.5 v
1
0.5
11I11IIIIIII0
0123456789 10 11
Ambient temperature, °C
Figure 5-9. Variation of operating current and COP with ambient temperature in heating mode in modelling[V=0.212+]OI+1.1(T)]
25
20-,
Hj 15-
Id a E
10- iN
1-0 'm 0 V
5ý c
Ica
iö 0- I-+- hot side temperature
--cold side temperature
0123456789 10 11 Ambient temperature, °C
Figure 5-10. Variation of hot side and cold side temperatures of thermoelectric modules with ambient temperature in heating mode in modelling
107

Thermoelectric Heat Pump System
5.4 Experimental Testing
The heat pump prototype was fabricated and tested at laboratory of School of the Built
Environment, University of Nottingham. Photograph of the new type thermal diode is
shown in Figure 5-11. Photographs of the heat pump are shown in Figure. 5-12(a) and Figure. 5-12(b). In Figure 5-12(b), the heat sink is taken off and the mounted
thermoelectric modules are shown. As mentioned in section 5.1, the thermoelectric heat
pump prototype was mounted on a larger box that simulates a room. The larger box was located in an environment chamber in the laboratory. A control system for the test
process was located at outdoors of the environment chamber. The photograph of the test
control system is shown in Figure 5-13. /The test control system included an
environmental chamber temperature controller, a computer and an adjustable DC power
supply. By adjusting the environmental temperature controller, the environment chamber
provided various ambient temperatures for the large box. The computer that connected to
a data taker was used to monitor the heat transfer process and collect data. The
adjustable DC power supply was used to provide various DC currents for different tests
and adjustable DC current to fit the required power in a test. The tests were carried out by cooling (in cooling mode) and heating (in heating mode) the interior of the large box
at various operating conditions and ambient temperatures. The photographs of the test
system are shown in Figure 5-14 (a) and Figure 5-14 (b). Figure 5-14 (a) shows the layout of the test system. The two small fans were used to produce air flow toward the inside and outside heat sink respectively (the big blue fan is just used to heat up the interior of the box quickly when a test is finished and not belongs to this system). Figure
5-14 (b) shows the system in operating. A duct covering the outside heat sink and fan
made the wind produced by the fan to be used effectively. The temperatures were
measured at various positions, including cold and hot side of the thermoelectric modules (TECs), evaporator and condenser of the heat pipe, the interior of the box and the
environment. T-type thermocouples (Figure 5-15) were used to measure the
temperatures. The measured data was acquired by the Datataker DT 500 (Figure 5-16)
and transferred to the computer.
108

Thermoelectric Heat Pump System
Figure 5-11. Photograph of the new type thermal diode
I
I" Thermoelectric modules
44
(a) (b)
Figure 5-12. Photographs of the heat pump (a) mounted heat pump (b) thermoelectric modules mounted in the heat pump
109

1 nermoeiectric treat rump system
1-11%nolliii ntal Irina controller
CI)mnutcr
IKpv ýýt
IT.
ö, "r
i
A
Figure 5-13. Photograph of the test control system
pug'.
010-00
(a)
Lamps
(b)
Figure 5-14. Photographs of the test system (a) layout of the test
system (half wall was taken off to show all the equipment) (b)
system in operating
110
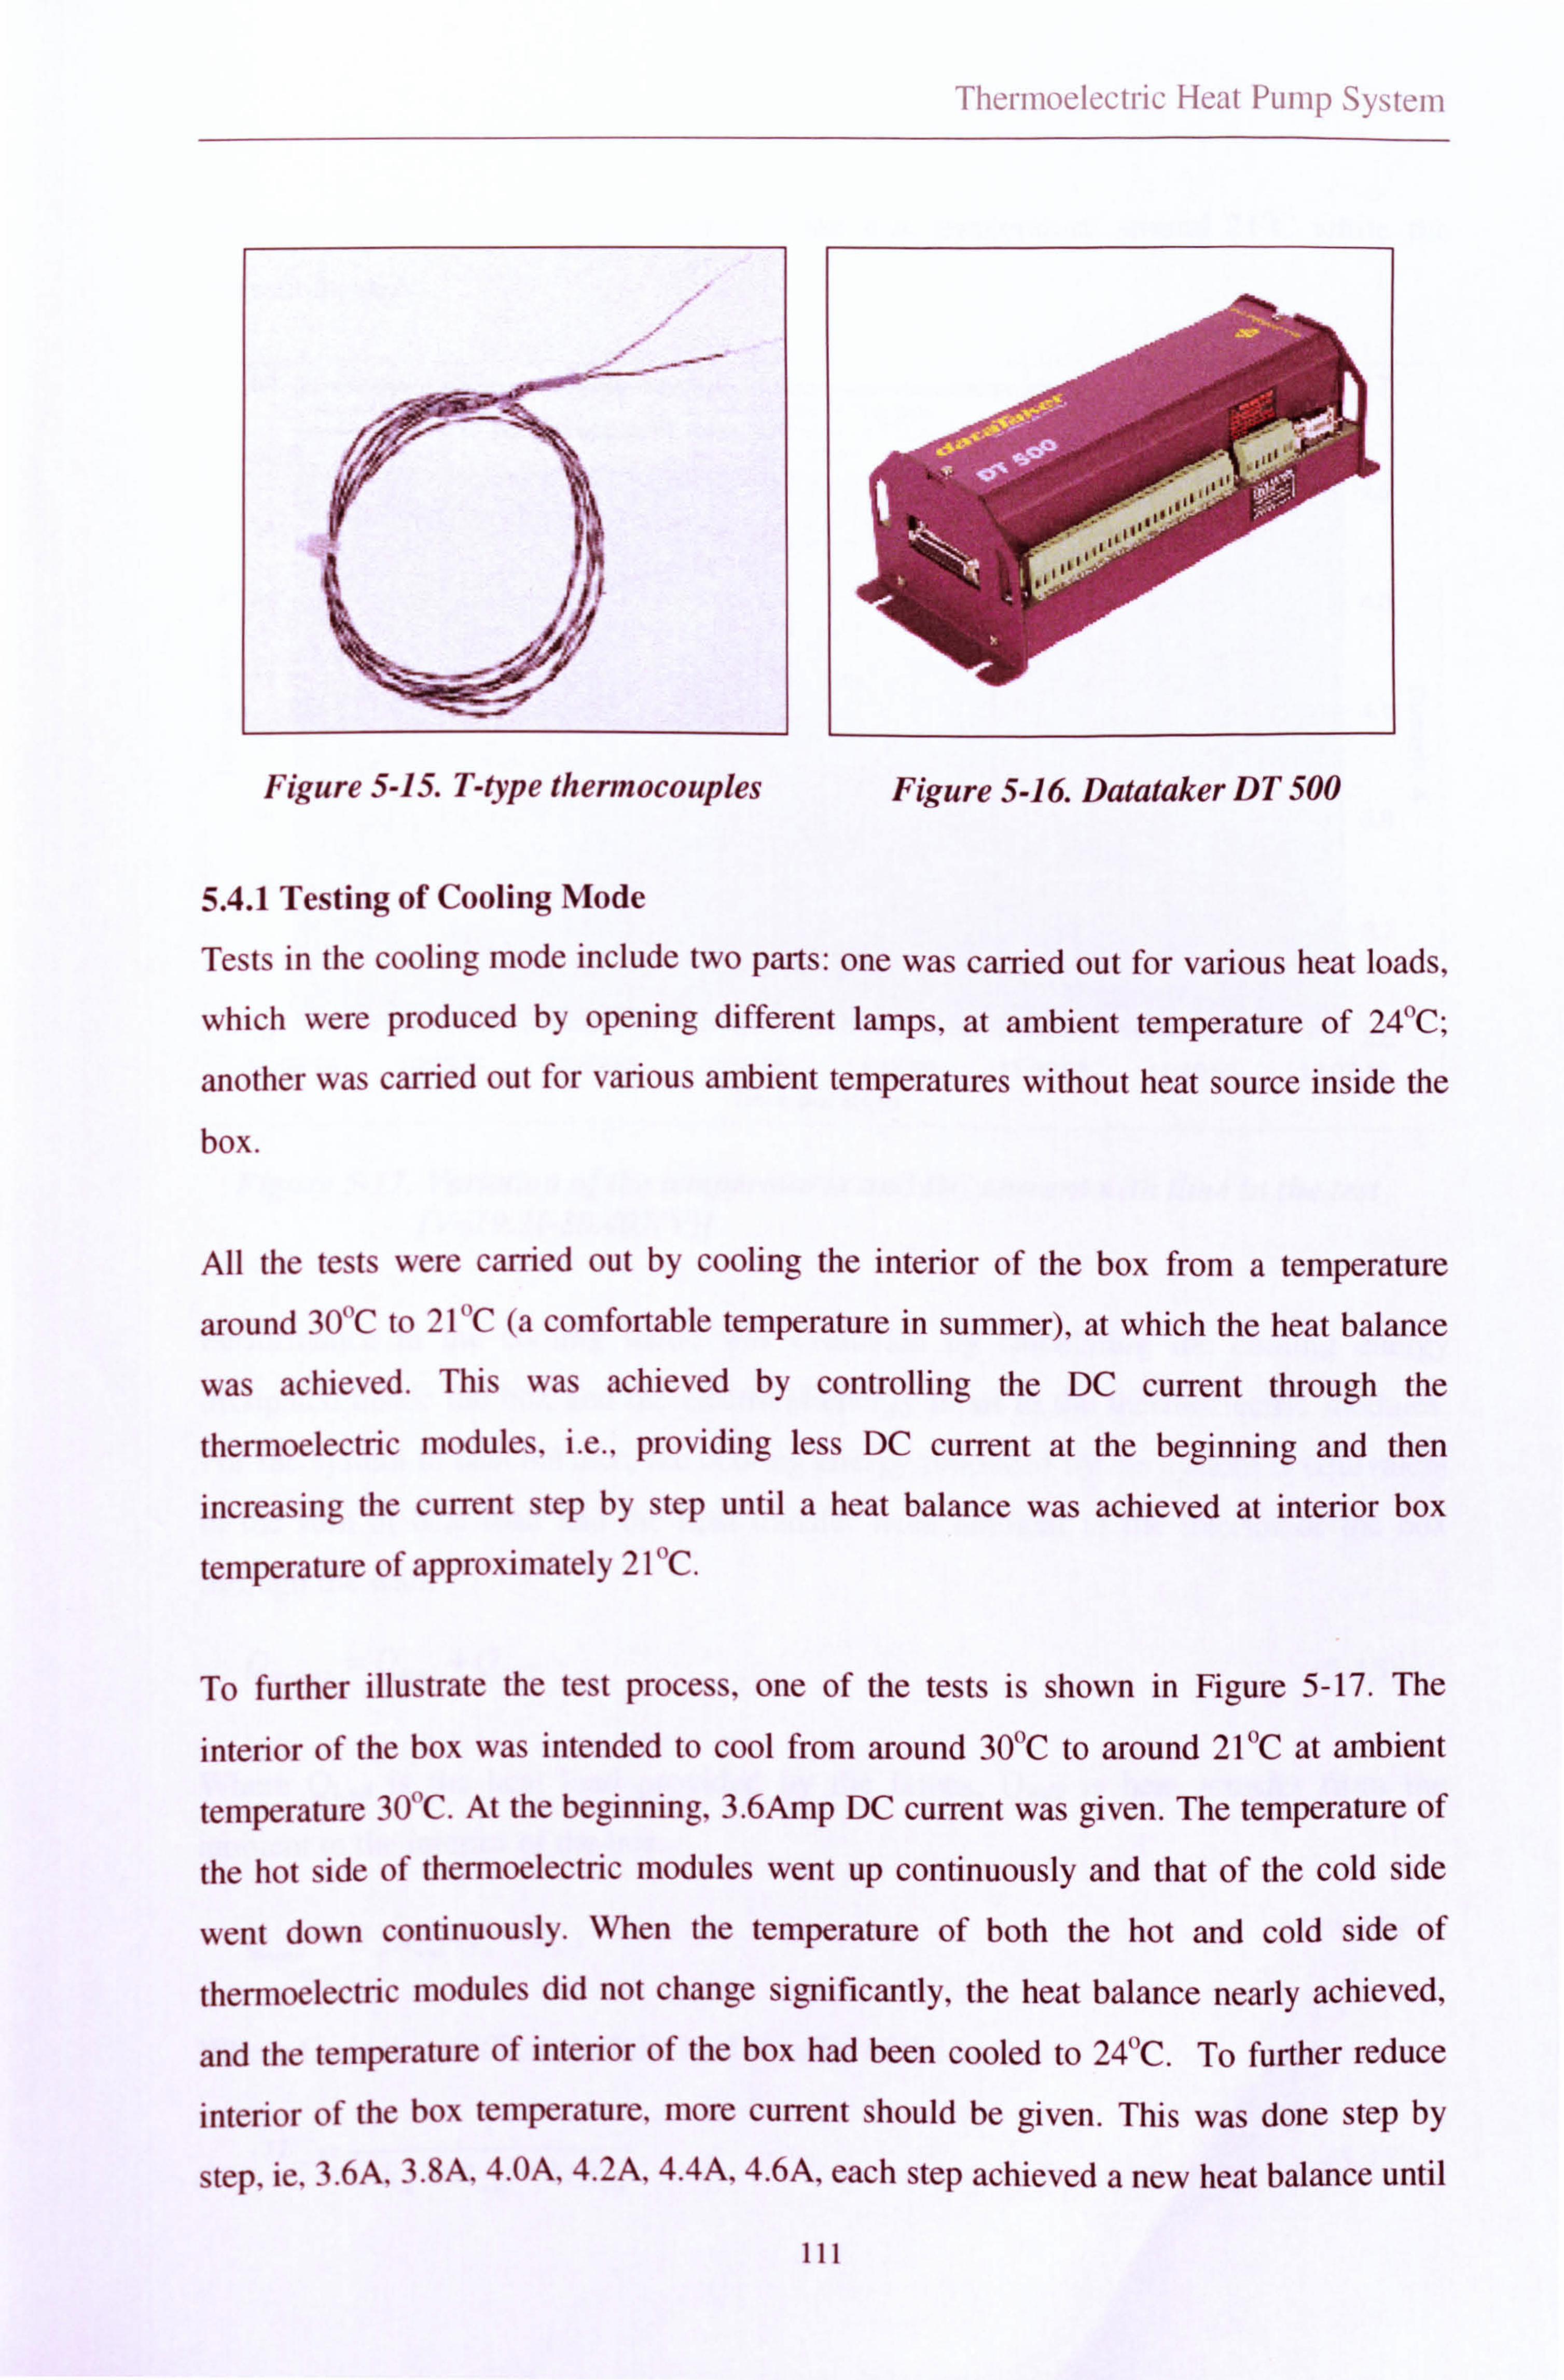
Thermoelectric Heat Pump System
5.4.1 Testing of Cooling Mode
Tests in the cooling mode include two parts: one was carried out for various heat loads,
which were produced by opening different lamps, at ambient temperature of 24°C;
another was carried out for various ambient temperatures without heat source inside the
box.
All the tests were carried out by cooling the interior of the box from a temperature
around 30°C to 21T (a comfortable temperature in summer), at which the heat balance
was achieved. This was achieved by controlling the DC current through the
thermoelectric modules, i. e., providing less DC current at the beginning and then
increasing the current step by step until a heat balance was achieved at interior box
temperature of approximately 21°C.
To further illustrate the test process, one of the tests is shown in Figure 5-17. The
interior of the box was intended to cool from around 30°C to around 21"C at ambient
temperature 30°C. At the beginning, 3.6Amp DC current was given. The temperature of
the hot side of thermoelectric modules went up continuously and that of the cold side
went down continuously. When the temperature of both the hot and cold side of
thermoelectric modules did not change significantly, the heat balance nearly achieved,
and the temperature of interior of the box had been cooled to 24°C. To further reduce
interior of the box temperature, more current should be given. This was done step by
step, ie, 3.6A, 3.8A, 4. OA, 4.2A, 4.4A, 4.6A, each step achieved a new heat balance until
Figure 5-16. Datataker DT 500 Figure 5-15. T-type thermocouples

the heat balance achieved at interior of the box temperature around 21°C while the
current is 4.6A.
64 ýý- Condensor Interior of the box Hot side of TECs(evaporator) -Cold side of TECs
59 - Ambient DC current
54
49
d ýI
44
CL E 39
34
29 ,ý- ý_
24
4.7
4.5
4.3
4.1
D 3.9
3.7
19 3.5
10: 06: 14 10: 23: 31 10: 40: 48 10: 58: 05 11: 15: 22 11: 32: 38 11: 49: 55 12: 07: 12 Time duration
Figure 5-17. Variation of the temperatures and DC current with time in the test [V=19.21-20.407(V)]
Performance in the cooling mode was evaluated by calculating the cooling energy
dissipated inside the box and the electrical energy input to the thermoelectric modules.
For the system in heat balance, the cooling energy produced by the system is equivalent
to the sum of heat load and the heat transfer from ambient to the interior of the box
through the wall:
Qcooiinq = Qload +Q.
all (5-15)
Where Qload is the heat load provided by the lamps, Qwaii is heat transfer from the
ambient to the interior of the box.
QWau = U»A»ýn (Ta -T,.,, ) (5-16)
Where U,, is the coefficient of the heat transfer of the box
I U. -1/h, + R�ý� +1 /hour (5-17)
112

Thermoelectric Heat Pump System
Await is the total area of the box.
The COP of the heat pump system in cooling mode was calculated using the following
equation:
COP = Qcooling / Qinput (s-is)
Where Qmput is the electrical energy input to the thermoelectric modules under
conditions of heat balance.
The results of the tests in cooling mode are shown in Figure 5-18 and Figure 5-19.
Figure 5-18 shows the variation of the operating current and the COP with the cooling
capacity. It can be seen that the operating current increases and the COP decreases with
the increase of the heat load, which shows the same tendency as the modelling results in
section 5.3.1, and the reason for this tendency has been analysed theoretically in section
5.3.1.
Figure 5-19 shows the variation of the operating current and the COP with the ambient
temperature. It can be seen that the operating current increases and the COP decreases
with the increase of the ambient temperature, which shows the same tendency as the
modelling results in section 5.3.1, and the reason for this has been analysed theoretically
in section 5.3.1. The comparison of the modelling and test results is illustrated in section
5.5.
113

Thermoelectric Hcat Pump System
7 0.9
--* operating current in test
* COP in test 0.8 6
0.7 5
Q 0.6 c
4. a
0.5 0
C3 0.4
CL 02
0.3
0.2
0. --- ----- 0.1
20 28 36 44 52 60 68 76 Cooling capacity, W
Figure 5-18. Variation of the operating current and the COP with cooling capacity in cooling mode in the test [V=I2.5I-1.97(V)]
5 0.8
A operating current in test
" COP in test 0.7
4 0.6
"II a30.5
. 0.4 O
rn U 2 0.3
CL 0
" 0.2
0.1
0
23 24 25 26 27 28 29 30 31 Ambient temperature, °C
Figure 5-19. Variation of the operating current and the COP with ambient temperature in cooling mode in the test [V=]41-5.72(V)]
114

Thermoelectric Heat Pump System
5.4.2 Testing of Heating Mode
Tests in the heating mode also included two parts: one was carried out for various heat
losses, which were produced by adjusting the wind speed of the small fan on the wall, at
ambient temperature of 5°C. Another was carried out for various ambient temperatures
while the wind speed of the fan on the wall was kept constant and therefore the heat loss
was kept constant.
All the tests were carried out by heating the interior of the box from the ambient
temperature to approximately 18°C (a comfortable temperature in winter). This was done
by controlling the DC current through the thermoelectric modules in step-wise increments until heat balance was achieved at an interior temperature of approximately 18°C.
In the heating mode, the heat produced by the system comes from two sources, i. e.,
electrical power and the ambient. Heat from the ambient is conducted by thermal diode
to the cold side of the thermoelectric modules, and then conducted by the thermoelectric
modules from the cold side to hot side to heat the interior of the box. To investigate the
effect of the thermal diode in conducting heat from the ambient air, the additional tests
named test A and test B were carried out firstly and are illustrated as follow:
Test A: Heating the interior of the box from 10°C to 18°C at an ambient temperature of 10°C using the heat pump system.
Test B: As for Test A but the heat pipe was not charged, therefore, it was not working.
The test results are presented in Figure 5-20 and Figure 5-21. Fig 5-20 shows the results
of test A and it can be seen that the temperature of the evaporator is lower than the
ambient temperature. This indicates that heat from the ambient air was been conducting
to the thermal diode continuously and then conducted to the cold side of thermoelectric
module by the thermal diode. DC current of 2.8A was input to achieve the desirable heat
balance. Figure 5-21 presents the results of test B and it can be seen that the temperature
of the evaporator is the same as the ambient temperature. This is because the "thermal
diode" could not conduct heat from the evaporator to condenser and therefore did not
absorb heat from the ambient. As the thermal diode absorbed heat from the ambient in
115

Thermoelectric Heat Pump System
test A, the cold side temperature was higher than that in test B, and also less power was
required to achieve the desirable heat balance. DC current of 2.8A was input in this test,
as shown in Figure 5-20. The cold side temperature in test B was much lower and more
power was required to achieve the desirable heat balance. As shown in Figure 5-21, at
the beginning the DC current of 2.8A was input and that could not achieve the desirable
heat balance. The desirable heat balance was achieved while the DC current increased to
3.6A.
Performance in the heating mode was evaluated by calculating the heating energy dissipated inside the box and the electrical energy input to the thermoelectric modules.
For heat balance, the heating energy produced by the system is equivalent to the sum of
heat loss through the fan on the wall and the heat transfer through the wall.
Qheating = Qloss + Q-11 (5-19)
Where Q1. is the heat loss produced by the fan on the wall; Q, Naii is heat transfer from
the interior of the box to the ambient [see eq(5-19)].
Qk. = CppVaS. (Tn -TQ)X1000 (5- 20)
The COP of the heating system was calculated using the following equation:
(5-21) COP =Q heating /Q
input
Where Qinput is the electrical energy input to the thermoelectric modules when heat
balance is achieved at interior of box temperature of approximately 18°C.
116

28
24
20
16 d CL E
12
8
2
c
1.5 t
v U
0.5
-- _- L- 1 ----1 0
11: 52: 48 12: 04: 48 12: 16: 47 12: 28: 47 12: 40: 47 12: 52: 47 13: 04: 46 Time duration
Figure 5-20. Variation of temperatures and DC current with time in test A (V=26.5V)
30 4
25
3 20
o
15 Äc
2 LD N
~ 10
Evaporator Interior of the box 5 Ambient -Cold side of TECs (condenser)
Hot side of TECs DC current
0 13: 48: 00 14: : 15: 10: 05
-5 0
Time duration
Figure 5-21. Variation of temperatures and DC current with time [V=16.61-18.2(V)J
13
'-`rte 2.5
117

Thermoelectric Heat Pump System
Figure 5-22 shows the variation of the operating current and the COP with the heating
capacity. It is seen that the operating current increases and the COP decreases with the
increase of the heating capacity, which shows the same tendency as the modelling results
in section 5.3.2, and the reason for this has been analysed theoretically in section 5.3.2.
Figure 5-23 shows the variation of the operating current and the COP with the ambient
temperature. It is seen that the operating current decreases and the COP increases with
the increase of the ambient temperature, which shows the same tendency as the
modelling results in section 5.3.2, and the reason for this tendency has been analysed
theoretically in section 5.3.2. The comparison of the modelling and the test results is
illustrated in section 5.5
6
5
Q4 c LD
-- operating current in test
0- COP in test
03 rn c
CL 2 0
1
1.8
1.7
1.6
1.5 M 0 U
1.4
1.3
1.2
0- 90 130 170 210 250 290
Heating capacity, W
Figure 5-22. Variation of the operating current and the COP with heating capacity in heat mode in test [V=I1. ]I+0.45(V)]
1.1 330
118

3.6 r
3.3
a3 C dl
2.7 rn C li G) 0 2.4
2.4 operating current in test ý
" COP in test " 2.2
2-1
1.8
2
1.8
a - 1.6 0
U
1.4
1.2
1
0.8 11
Figure 5-23. Variation of the operating current and COP with ambient temperature in heating mode in test [V=10.51+2.2(V)J
5.4.3 Testing of Improving Coefficient of Performance in Cooling Mode by Using
Evaporation of Water
As aforementioned, the COP of the thermoelectric system can be improved by reducing
the hot side temperature of the thermoelectric modules. In the cooling mode of this
system, this can be done by removing heat more efficiently from the condenser of the
thermal diode to the ambient. As we know, water has large latent heat of evaporation.
To investigate the effect of cooling due to evaporation of water on system performance,
more tests in cooling mode were carried out for the condition of spray water evenly on
the outside heat sink. The test results were compared with those in section 5.4.1 (without
spray water) and are shown in Figure 5-24 and Figure 5-25.
Figure 5-24 shows a comparison of COP at various cooling capacities for the tests with
and without water spraying. Figure 5-25 shows a comparison of COP at various ambient
temperatures for the tests with and without water spraying. It is seen that providing
cooling of the outside heat sink by spraying water (30ml/min) onto it for subsequent
evaporation, results in a 78%-233% improvement of the COP. As water has a high
119
13579 Ambient temperature, °C

Thermoelectric Heat Pump System
latent heat of evaporation, this method provided an effective means of cooling. The
effect of the water evaporative cooling on system performance is more significant when
more heat is produced on the hot side of the thermoelectric modules.
The effect of water evaporation on the performance of the thermoelectric modules and
the thermal diode in this system was investigated by comparing tests (heat load-60W,
ambient temperature-24°C) for conditions with and without water spray (30m1/5min).
The results are presented in Figure 5-26, Figure 5-27 and Figure 5-28, and the variation
of the DC current is also shown in these figures.
Figure 5-26 shows a comparison of the hot and cold side temperature of the
thermoelectric modules with and without water spraying. When water was sprayed, the
hot side temperature was much lower, and the cold side temperature dropped more
quickly.
As less power was required when water was sprayed, the achieved temperature
difference between the hot and cold side was much lower, as shown in Figure 5-27. The
temperature difference, of course, increased with DC power step by step.
Figure 5-28 shows the comparison of the temperature difference between the evaporator
and the condenser sections of the thermal diode with and without water spray. With
water spray, the temperature difference between the evaporator and condensor of
thermal diode was much less and increased more slowly than without water spray. This
indicates that the performance of the thermal diode increases when the condenser is
cooled.
120

Thermoelectric Heat Pump System
1.2
f no w ater spraying
1"" sprayingwater
"
0.8
U 0.6
0.4
0.2
0 30 35 40 45 50 55 60 65 70
Cooling capacity, W
Figure 5-24. Comparison of COP at various cooling capacity for the tests with and without water spraying
1.2
1 A no water spraying
" spraying water 30mV5min
0.8
M O 0 0.6
0.4
0.2
0 23 25 27 29 31 33 35
Ambient temperature, °C
Figure 5-25. Comparison of COP at various ambient temperatures for the tests with and without water spraying
121

Fhermoelectric Heat Pump System
65 __ ___F__ I--- 5.6 -hot side (no water spraying) -cold side (no water spraying)
hot side (spraying water) 5.1 cold side (spraying water)
55 DC current (no water spraying) DC current (spraying water) 4.6
o 4.1 45 0
n
3.6 C
35 3.1
2.6 25
2.1
15 1.6 0 20 40 60 80 100 120 140 160
Time, min
Figure 5-26. Comparison of the hot/cold side temperatures of thermoelectric modules for the tests with and without water spraying
50 temperature difference between hot and cold side
5.6
(no water spraying) tenperature difference between hot and cold side 51 ýs, praying water)
40 -w current (no water spraying)
DC current (spraying water) 4.6
30 ------ --- ýý4.1
(7
3.6 2 ` ego
20 3.1
OL E
2.6
1c
2.1
C 1.6
0 20 40 60 80 100 120 140 160 Time, min
Figure 5-27. Comparison of temperature difference between the hot and cold sides for tests with and without water spraying
122

Thermoelectric Heat Pump System
16 5 6 temperature difference between evaporator - .
and condensor (no water spraying) temperature difference between evaporator l 5.1 and condenser (spraying water) F
14 - DC current (no water spraying) o
v 0 - DC current (spraying water)
4.6
12 4.1
L 3.6
10 3.1
E
1 4) 2.6 8 --
= 2.1
6 1.6
0 20 40 60 80 100 120 140 160 Time, min
Figure 5-28. Comparison of the temperature difference between the evaporator and condenser of the thermal diode for tests with and without water spraying
5.5 Comparison of the Modelling and Testing Results
Comparison was carried out between the modelling results (shown in section 5.3) and
experimental results (shown in section 5.4.1 and section 5.4.2) for the thermoelectric
heat pump prototype, for both of cooling and heating mode. The results of these
comparisons are summarised in Figures 5-29,5-30,5-31 and 5-32, respectively. It is
seen the modelling results and experimental data showed a very similar trend for COP
and operating currents. However, there exists the obvious difference between the
modelling and testing results. The theoretical COP are always higher than the
corresponding testing COP and the theoretical operating current are always lower than
the corresponding operating current in test. The reasons for this were investigated, and it
was found that a number of factors contributed to the discrepancies, which are
summarised as follow:
(1) Due to the difficulty of calculating the thermal resistance of the new type thermal
diode that has a complex structure, the calculation was simplified by using Eq(5-
9)-Eq(5-14) that are suitable for the normal heat pipes, i. e., the new type thermal
diode was treated as 11 normal thermal diodes each having the diameter of 10mm.
123

Thermoelectric Heat Pump System
The practical thermal resistance is therefore larger than the calculated thermal
resistance. (2) The thermal resistances of the heat sinks used in simulations are designed
(theoretical) thermal resistances. The practical thermal resistances are larger than the
designed thermal resistances and the contact resistance caused by mounting also
exists.
(3) The parameters of the thermoelectric modules used in the simulations are theoretical
parameters. The thermoelectric modules used for the test would subject to the usual
manufacturing tolerances.
(4) The limit of the model's accuracy causes the errors in the modelling.
The errors related to (1) and (2) are the main factors that caused the difference between
the simulation and test results. As the thermal resistances of the thermal diode and heat
sinks in the modelling are smaller than that in practice, the hot side temperatures of the
thermoelectric modules in the modelling are smaller than that in practice, and the cold
side temperatures in the modelling are higher than those in practice. This indicates the
temperature differences between the hot and cold side in the modelling are smaller than
those in the test. This cause the COP obtained in the modelling to be greater than found
in the testing and the operating currents in modelling to be less than those in the test. The
errors related to (3) and (4), cause uncertain errors. It contributed minor discrepancies
between the modelling results and testing results.
The main error factors related to (1) and (2) contributed to the discrepancies of the hot
and cold side temperatures between the modelling and the testing directly. Therefore,
they can be corrected by comparing the hot and cold side temperatures in modelling with
those in tests, and give the correction factors. The correction factors were determined by
dividing the experimental hot and cold side temperatures by the modelling hot and cold
side temperatures respectively. Figure 5-33 and Figure 5-34 shows the correction factors
of hot and cold side temperatures respectively.
The more accurate hot and cold side temperatures can be obtained by using the
correction factors in the modelling. The more accurate COP and operating currents can
then be calculated by using the modified hot and cold side temperatures in equations (5-
124

Thermoelectric Heat Pump System
7), (5-8c) and (5-8h). The computer program of modelling can complete this correction
process by adding the correction function to it. Figure 5-35 to Figure 5-38 shows the
comparisons of the modified modelling results and the testing results. It is shown that the
modified results are much more close to the testing results, the difference between the
COP in modelling and the COP in testing is within 0.2.
This correlation would be applied to any circumstance for this type of thermoelectric
heat pump, and expected to improve the accuracy of the modelling predictions to a
substantial extent.
7.
0 operating current in modellin1 f operating current in test
6 COP in modelling -*-- COP in test
5 Q CE
4
7 U
OO13 aý a
2
1
6
15
4
CL 3O
U
-2
I1
I
00 20 30 40 50 60 70 80
Cooling capacity, W
Figure 5-29. Comparison of operating current and COP at various cooling capacities in modelling with those in test in cooling mode
125

Thermoelectric Heat Pump System
5
0 operating current in modelling f oý perating current in test
COP in modelling X COP in test
4
4
c3 d t 7 U O) C
1O 2 C CL 0
23 24 25 26 27 28 29 30 Ambient temperature, °C
Figure 5-30. Comparison of operating current and COP at various ambient temperatures in modelling with those in test in cooling mode
5
4
3
a O U
2
1
31
5 3.5
operating current in modelling -t-- operating current in test
4.5 COP in modelling - COP in test 3
4A
2.5 3.5
a U0 U
c3
N CL 0
2.5
2
1.5 - 90 130
-2
1.5
1
290 330
Figure 5-31. Comparison of operating current and COP at various heating capacities in modelling with those in test in heating mode
126
170 210 250 Heating capacity, W

Thermoelectric Heat Pump System
4- 0 operating current in modelling -, ý operating current in test
COP in modelling 3.5 sc COP in test
Q3
d 1- 2.5
c
d
O2
1.5
3
2.5
2
a 1.5 0
-1
-- " 0.5
113579 11 Ambient temperature, °C
Figure 5-32. Comparison of operating current and COP at various ambient temperatures in modelling with those in test in heating mode
Figure 5-33. Correction factors of hot side temperature
127

1.12
1.08
ß d a E 1.04
y 1
0 U
O
X0.96 Ü t0
C 0
0.92ts
O U
0.88 -5
7
y= -7E-06x + 0.9711
05 10 15 Cold side temperature in modelling, °C
Figure 5-34. Correction factors of cold side temperature
20 25
operating current in modelling
6" operating current in test
COP in modelling
5f COP in test
a
aCi 4 tý U
Of 3
cc d a 0 2_
1"
020 30 40 50 60 70
Cooling capacity, W
Figure 5-35. Comparison of operating current and COP at various cooling capacities in modified modelling with those in test in cooling mode
" S.
6
I
.5
.4
3Ö O U
2
0 80
128

Thermoelectric Heat Pump System
5 operating current in modelling
COP in modelling
4 ý- operating current in test
--0- COP in test
a
a,
O1
G1 CL
0
- - 5
A
l__ 3
U 2
00 23 24 25 26 27 28 29 30 31
Ambient temperature, OC
Figure 5-36. Comparison of operating current and COP at various ambient temperatures in modified modelling with those in test in cooling mode
5 3.5
operating current in modelling A operating current in test
4.5 COP in modelling 0 COP in test 3
4
C 2.5 L 3.5 UO
Of V
32
CL O 2.5
1.5
2"
1.5 90 130 170 210 250 290 330
Heating capacity, W
Figure 5-37. Comparison of operating current and COP at various heating capacities in modelling with those in test in heating mode
129

Thermoelectric Heat Pump System
4
3.5 ----
3- c
U O1
2.5
d CL 0
2
A
0
operating current in modelling operating current in test COP in modelling
" COP in test
2.5
"
2.1
1.7
A
Q. O
1.30
0.9
1.5 0.5
-1 13579 11 Ambient temperature, OC
Figure 5-38. Comparison of operating current and COP at various ambient temperatures in modified modelling with those in test in heating mode
5.6 Estimation of the required scale for building application
An estimation of the required scale of the thermoelectric heat pump for practical
application in building was carried out. The estimation is based on the performance of
aforementioned heat pump prototype.
Determination of the COP of the thermoelectric heat pump
The modelling and testing results showed that the COP of the thermoelectric heat pump
system varies with the cooling/heating capacity and the ambient temperature in both
cooling and heating modes. Due to relative low COP of the cooling mode, this design of
the heat pump was mainly based on the considerations of the performance in cooling
mode. For a fixed ambient temperature, the COP in cooling mode decreases with the
increase of the cooling capacity.
Table 5-1 shows the cooling capacity and the corresponding COP of the experimental rig
at ambient temperature 24"C (the temperature of the inside box is 21°C). The system
130

Thermoelectric Heat Pump System
using evaporation of the water on the outside heat sink in cooling mode was also
considered in this estimation. It is shown in Table 5-1 that the system working under
higher COP indicates that it undertakes less cooling capacity. Therefore, for a specific
cooling capacity if higher COP is desirable, more thermoelectric modules will be
required. This will increase the volume of the thermoelectric heat pump and cost.
Therefore, the design of a practical thermoelectric heat pump should judge the required
number of the thermoelectric modules and the COP. Usually the thermoelectric cooling
system with the COP of around 0.5 is acceptable. Therefore, we can determine the
cooling capacity of the rig to be 48W with the COP of 0.46 when the evaporation of
water is not used, and the cooling capacity of the rig to be 68W with the COP of 0.6
when the evaporation of water is used.
Table 5-1. Relation between the cooling capacity and COP of the experimental rig
at ambient temperature of 24°C
Cooling capacity, W 25 33 40 48 55 68 80
COP No spray water 0.69 0.57 0.51 0.46 0.41 0.34 0.26
Spray water 1.03 0.87 0.6
Type of the modules: CP-2-127-06 (Melcor)
Required scale of the thermoelectric heat Pump for an office The estimation of the required scale of the thermoelectric heat pump was carried out for
an office in a building in Scotland (Zhao, 2002). The design conditions and parameters
of the office are shown in Table 5-2.
Table 5-2. Design conditions and parameters of an office Area,
m2
Cooling/heating
capacity, W/m2
Environmental
temperature, °C
15 Summer Winter Summer Winter
60 40 24 -4 Temperature inside the room: 21°C
131

Thermoelectric Heat Pump System
The total cooling capacity of the office is 15m2x60W/m2=900W. The required
thermoelectric modules should be the total cooling capacity /determined cooling
capacity of the rig x number of the thermoelectric modules of the rig.
The total heating capacity of the office is 15m2x40W/m2=600W. The COP in heating
mode can be obtained by modelling based on the above-determined scale of the heat
pump.
The results of the estimated scale for the office are shown in Table 5-3, which gave the
required number of the thermoelectric modules and the performance of the heat pump
system. Of course, the thermal diode and the heat sink system should be designed to fit
this scale.
Table 5-3. Required number and total area of thermoelectric modules and the
performance of the system for an office
Number COP Power required, W Total
of m2 area
Cooling Heating Cooling Heating , modules mode mode mode Mode
No spray water 150 0.54 0.46 1.13 1957 531 in cooling mode
Spray water in 106 0.38 0.6 1.12 1500 536
cooling mode
5.7 Environmental and Potential Economical Effects
Conventional vapour-compression air conditioners have the advantages of high COP and
low purchase price. However, most working fluids employed in conventional vapour-
compression air conditioners are damaging to the environment and as vapour-
compression systems contain moving parts, they have the further disadvantages of being
noisy and requiring regular maintenance. Concern over global warming and depletion of
ozone layer has simulated research to develop cooling methods which do not employ
environmentally damaging working fluids such as CFCs and HCFCs. One of the
methods is to employ thermoelectric cooling systems. Thermoelectric cooling systems
use Peltier effect to produce cooling, they don't contain moving parts (except for cooling
132

Thermoelectric Heat Pump System
fan) and have long life span. They are environmental friendly, as they are solid state heat
pump and don't use environmentally damaging working fluids.
Compared to the conventional vapour-compression air conditioner, the thermoelectric
cooling systems have the disadvantages of low COP and high cost. The COPS of the
vapour-compression air conditioners are around 2.2-3, while the COP of the
thermoelectric heat pump system in this research is 0.5 in cooling mode. Current
commercially available thermoelectric air conditioners have the COP of 0.38-0.45 in
cooling mode. A 2600W vapour-compression air conditioner costs just £318, while a
320W thermoelectric air conditioner costs £880 [Riffat S. B, 2004]. It is seen that on the
basis of performance and cost, the thermoelectric cooling systems are not competitive to
the conventional vapour-compression systems.
However, it is predicted that thermoelectric domestic heat pumps and air conditioners
will become competitive in the world market. This is because energy costs and demands
can only increase and environmental concerns can only increase. Also the environmental
treaties have banned chlorofluorocarbons. [www. zts. com]
Furthermore, the new thermoelectric materials with large figure of merit ZT could make
a breakthrough on applications of the thermoelectric modules in various fields.
Currently, bismuth telluride (Bi2Te3), which is the best low temperature thermoelectric
material and is widely employed in thermoelectric generators and coolers. Bi2Te3
possess a maximum value of ZT-1. If the ZT could be raised to 2 or 3, the
thermoelectric cooling system would be competitive with vapour compression cooling
systems. Recent advances have indicated the possibility of overcoming classical
limitations and increasing the figure of merit of the thermoelectric materials
significantly. The investigations include the following aspects: tailoring the
microstructure of a material to increase phonon scattering in order to decrease thermal
conductivity; reducing the dimensionality of the material so that quantum size-effects
alter the ratio between the electrical and thermal conductivity; use of quasicrystals as
potential thermoelectric materials; use of inhomogeneous materials (with functional
gradients) and development of thin-film thermoelectric materials which has achieved a figure of merit of approximate 2.4 [Venkatasubramanian R, 2001].
133

Thermoelectric Heat Pump System
In addition, investigations have demonstrated the effect of size of the thermoelements on
the COP and heat pumping capacity of the thermoelectric module. A relatively long
thermoelement is required to obtain a large COP, while a relatively short thermoelement
is desirable for achieving maximum heat pumping capacity. The optimum module
design will be a compromise between the requirements of COP and heat pumping
capacity. The investigations also showed that reducing the contact resistances, is an
essential requirement to achieve a further improvement in both COP and heat pumping
capacity of a thermoelectric module [Gao M, 2000].
Moreover, thermoelectric cooling systems can directly employs solar PV cells as power
source, by which the low COP would not be a main drawback. Although PVs are
expensive at present, it is anticipated the development of the technology particularly
regarding preparation methods, and market growth will bring about a fall in prices. The
development of the manufacturing technology of the semiconductor material will also
reduce the prices of the thermoelectric modules. Combining PVs with thermoelectric
refrigeration system will produce an attractive system that are stand alone, no moving
part and noise, environment friendly.
In a word, the thermoelectric cooling system would become competitive in both
economical and environmental aspects in the future.
5.8 Conclusion
"A thermoelectric heat pump prototype were designed and constructed to work in two
modes, i. e., cooling mode and heating mode. The heat pump incorporated a number
of innovative ideas in structure design to produce a compact unit. Analytical models
were used to optimise the design (selection) of all the components with the aim of
improving the COP of the system.
"A theoretical model was developed to estimate the thermal performance of the heat
pump system for various operating and weather conditions. The heat processes in
different areas of the heat pump were investigated, and these were then
corresponding linked together by a set of heat balance equations.
134

Thermoelectric Heat Pump System
" The thermal performance of the heat pump system was investigated using the
computer model developed. Given the structure of the heat pump, the COP and the
required DC current varies with cooling capacities (in cooling mode), heating
capacities (in heating mode) and ambient temperature. In cooling mode, the COP
decrease and the DC current increase with the increase of cooling capacity and
environmental temperature. In heating mode, the COP decrease and the DC current
increase with the increasing heating capacity, the COP increase and the DC current
decrease with the increasing ambient temperature.
" Laboratory tests were carried out to provide experimental results on the performance
of the heat pump prototype. The tests were carried out in the environmental chamber
in School of the Built Environment, University of Nottingham. Test results were
obtained for different cooling (heating) capacities and ambient temperatures.
Experimental COP in cooling mode decreases with the increase of the cooling
capacity and ambient temperature. Experimental COP in heating mode decreases
with the increase of heating capacity and increases with the increase of ambient
temperature. Further tests in cooling mode were carried out to investigate the effect
of cooling due to evaporation of water on system performance. It was found that
providing cooling of the outside heat sink by spraying water (30mUmin) onto it for
subsequent evaporation, resulted in a 78%-233% improvement of COP.
" Modelling and experimental results were compared for the heat pump prototype. It
was found that the modelling results and experimental data showed a very similar
trend for COP and operating currents, however, distinct differences exists between
the values of the modelling and test results, the experimental COP are lower and
required currents are larger than the values predicted by modelling. One reason for
this is the calculation of the thermal resistance of thermal diode in modelling was
simplified due to the existing difficulty of calculating the thermal resistance of the
new type thermal diode with a complex structure. Another reason for this is the
difference between the designed heat sinks and the practical heat sinks. These cause
the larger difference between the hot side and cold side temperatures shown in
modelling and those in tests. The reasons for the difference between modelling and
experimental results also include the limit of the model's accuracy as well as the
135

Thermoelectric Heat Pump System
manufacturing tolerances of the thermoelectric modules. These treatments were not
taken into account in modelling development and processing.
" Correction factors were determined by dividing the hot and cold side temperatures
obtained in tests by the hot and cold side temperatures obtained in modelling
respectively. By correcting the hot side and cold side temperatures more accurate
modelling results were obtained. This correlation would be applied to any
circumstance for this type of thermoelectric heat pump, and expected to improve the
accuracy of the modelling predictions to a substantial extent.
" The required scale for an office in a building in Scotland was estimated. The
estimation was carried out for the system both using evaporation of water and not
using evaporation in cooling mode. An acceptable COP of around 0.5 in cooling
mode is determined. The estimated scale for the office is 150 pieces of CP2-127-06
thermoelectric modules with the area of 0.54m2 while not using the evaporation of
water in cooling mode, and 106 pieces of CP2-127-06 thermoelectric modules with
the area of 0.38m2.
" The environmental and potential effects were analysed and investigated. Although on
the basis of performance and cost, the thermoelectric cooling systems are not
competitive to the conventional vapour-compression systems presently, the
thermoelectric heat pumps have the potential large market due to the environmental
concerns. Furthermore, the investigations on the thermoelectric material for high ZT
could improve the COP greatly. The development of the manufacturing technology
of semiconductor material could reduce the prices Of thermoelectric modules and
PVs. Therefore, combining PVs with thermoelectric refrigeration system will
produce an attractive system that are stand alone, no moving part and noise,
environment friendly. The thermoelectric cooling system would become competitive in both economical and environmental aspects.
136

Experimental Investigation of thermoelectric Refrigerator Using Phase change Material
Chapter 6. Experimental Investigation of Thermoelectric Refrigerator Using Phase Change Material
6.1 Aim of the Experimental Investigation
As aforementioned, combining PVs with thermoelectric refrigeration system will
produce an attractive system that are stand alone, no moving part and noise, environment
friendly. As solar radiation is intermittent, a means of energy storage for periods of low
insolation and night time is essential. To achieve this, the system needs to be integrated
with heat storage and recovery systems. The work described in this chapter was to
investigate the use of phase change materials in a refrigerator to store the excess cooling,
allowing it to be reused in periods of low insolation and nighttime. The system can then
operate day and night, without the need for large electricity batteries.
6.2 Scheme of the Experimental Investigation
The work involved the design, fabrication and testing of a small thermoelectric
refrigeration prototype. The experimental investigation was carried out in two steps. The
first step is to investigate the potential of phase change materials (PCMs) for use with
thermoelectric modules in refrigeration system, in order to evaluate the effect of the
PCM on the performance of the thermoelectric refrigeration, the system was constructed
and tested for two different configurations. One configuration employed a conventional
heat sink system (bonded fin heat sink) on the cold side of the thermoelectric modules.
Another configuration was constructed using an encapsulated phase change material in
place of the conventional heat sink unit. The performance of the two configurations were
tested and compared. Results of tests of the latter system showed an improved
performance as well as the cooling storage capability, which would be particularly useful
for handling the peak loads, and overcoming losses during door openings and power-off
periods. However to improve the storage capability, in particular during off-power
periods, it was found necessary to integrate the PCM with a thermal diode, which would
allow heat flow in one direction only. The second step is therefore to investigate the
potential application of PCMs integrated with thermal diodes in the thermoelectric
refrigerator. The thermoelectric refrigerator was reconstructed employing phase change
material integrated with thermal diodes (thermosyphons) on the cold side of the
thermoelectric modules and tested.
137

Experimental Investigation of thermoelectric Refrigerator Using Phase change Material
All the configurations used heat pipes embedded fins as the heat sink on the hot side.
The thermoelectric modules used in this system are obtained from Thermo Electric
Devices (an UK supplier of Melcor cooling modules). These modules could maintain a
temperature difference as high as 64°C between the hot and the cold side when operated
at full capacity (i. e., at 14.4 V and 8.5 A DC) under no load conditions [Kin-ichi
Uemura, 1995]. In most of the tests carried out on the thermoelectric refrigeration
system under consideration, the maximum temperature difference between the cold and
the hot junctions was 43°C, i. e., about 67% of the maximum design. The temperature
difference could be increased by increasing the input energy, or by cascading the
thermoelectric modules. All the tests were carried out with each module operated at 7.5
V and 3.5 A DC, which achieve the required temperature difference.
The experimental investigation in the two steps is described in section 6.3 and section 6.4 respectively.
6.3 Experimental Investigation of the Thermoelectric Refrigeration System
Employing a Phase Change Material
63.1 Description of the experimental system
Details of the thermoelectric refrigeration system tested in this study are shown in Fig. 6-
1. The system comprises a refrigeration cabinet (420mmx420mmx380mm), six
thermoelectric modules (type PT-12-40), and three (heat pipe, embedded fin) heat sink
units on the hot side of the thermoelectric modules. The refrigeration system was first
tested with a bonded fin heat sink unit mounted on the cold side of the thermoelectric
modules as a cold heat sink. In the second test, an encapsulated PCM replaced the
bonded fin heat sink unit. The encapsulated PCM used in this test is known as "ClimSel
C7" and was obtained from Climator AB, Sweden (www. climator. com). The product
consists of a mixture of sodium sulphate, ammonium chloride and potassium chloride
with additives to prevent super-cooling. The salt mixture has a transition temperature
point of 7°C and specific gravity of 1.42-kg/l. The encapsulated PCM has a latent heat
fusion of 36 Wh/kg and a storage capacity of 50 Wh/kg in the temperature range 2.5-
20°C.
138

Experimental Investigation of thermoelectric Refrigerator Using Phase change Material
The six thermoelectric modules were mounted side by side and were electrically
connected in series. A metallic space block made of aluminum was placed between the
cold plates of the thermoelectric modules and the cold side heat sink. The thermal
contacts between the thermoelectric modules and heat sink units were improved by
applying a thin film of thermal grease.
The heat sink on the hot side of the thermoelectric modules was made of a heat pipe,
embedded-fin system of a thermal resistance 0.012°C W. Three of these units were
mounted on the hot side. Each of these units is capable of dissipating a maximum of 200
W, when mounted vertically. However, when mounted horizontally, it can handle only 150 W. Therefore a small fan was used to provide forced air convection on the hot side heat sink. Tests were carried out with this fan on, and off, in order to investigate its
significant on the performance of the cooling system.
The refrigeration cabinet was insulated on the inside by a 25mm thick polystyrene plate,
and held in place by an extruded PTFE sheet of thickness 3mm.
Power input to the thermoelectric modules was provided by a 400W DC power supply
system.
When DC current is applied to thermoelectric refrigeration systems described in Figure
6-1, the thermoelectric modules absorb heat from the metallic block inside the
refrigeration cabinet, and dissipate heat to the outside heat sink, thus create cold and hot
side.
On the hot side, the working fluid in the evaporator end of the heat pipe, embedded-fin heat sink, evaporates and travels to the condenser end, where it condenses whilst
dissipating heat. The heat is carried away by air convection. The working fluid returns to
the evaporator by the capillary head of the heat pipe wick of the embedded-fin heat sink.
On the cold side of the system, the bonded fin heat sink or PCM cools down whilst dissipating heat to the cold side of the thermoelectric modules. In the PCM system, the
PCM dissipates energy, first as sensible heat, and when the phase change temperature is
reached as latent heat. This maintains the refrigeration cabinet at the required
139

Experimental Investigation of thermoelectric Refrigerator Using Phase change Material
temperature, i. e., the transition temperature of the PCM, with any further cooling stored
as latent energy. Photographs of the tested thermoelectric refrigeration prototype system
are shown in Figures 6-2, and 6-3.
metallic block
Embedded fin heat pipe heat sink
(a)
Three embedded fin heat pipe heat sink units
(b)
Figure 6-1. Schematic description of an experimental refrigeration system from different views (a) vertical section (b) horizontal section
140

Experimental Investigation of thermoelectric Refrigerator Using Phase change Material
w
i
Figure 6-2. The tested thermoelectric refrigerator prototype
_/ý / l 1
ýý i
I Figure 6-3. Encapsulated PCM as a cold heat sink.
141

Experimental Investigation of thermoelectric Refrigerator Using Phase change Material
6.3.2 Test Methodology
Since the aim of the study was to examine the potential of PCMs for use with
thermoelectric modules, the system was tested with, and without PCM, in order to
evaluate the effect of the PCM on the performance of the thermoelectric refrigeration
system. The intention was also to use as few moving parts as possible, e. g., heat removal fans. For this reason, tests were also carried out with the heat removal fan on, and off, to
investigate its effect on the performance of the thermoelectric refrigeration system. 1500
ml of water was used to simulate the cooling load.
The temperatures were measured at various positions, including the cold and hot side of
the thermoelectric modules, condenser section of the heat pipe-embedded fins heat sink
system, the interior of the refrigeration cabinet, the PCM and the environmental air. The
electrical energy input to the thermoelectric modules was also measured.
The performance of the refrigeration system was evaluated by calculating the cooling
energy dissipated inside the refrigeration cabinet and the electrical energy input to the
thermoelectric modules. The cooling energy produced by the system was estimated
using the following equation: Qe,
t = Q.
U. + Qspcm + Qpcm + Q. + Q.
(6-1)
where Qaii�m is the cooling energy stored in the aluminum block, Qspcm is the sensible
energy of the PCM, Q,, is the latent energy of the PCM, Qa is the sensible energy of the air inside the refrigeration cabinet, and Q, y is the sensible energy of the water.
The coefficient of performance of the refrigeration system was calculated using the following equation:
COP = Q,, / Qi, rw,
(6-2)
Where Q,,, p�c is the electrical energy input to the thermoelectric modules.
633 Results and Discussion
The results of the tests using a conventional (fins bonded) heat sink system are presented in Figure 6-4, Figure 6-5, Figure 6-6 and Figure 6-7. Figure 6-4 shows the testing with
142

Experimental Investigation of thermoelectric Refrigerator Using Phase change Material
the heat removal fan off. It is seen that the cold side temperature dropped by 12 degrees
and then increased, the system can not work normally and the temperature inside the
cabinet increase slightly rather than decrease. Figure 6-5 shows the test with the heat
removal fan on. It is seen that with the heat removal fan on, the system can work
efficiently. After 90 minutes, the maximum temperature difference between the hot and
cold side was reached. The temperature inside the cabinet did not drop too much due to
the short period of the testing. If another small fan was used to increase the convection
inside the cabinet, the temperature inside the cabinet can drop quickly and a test shown
in Figure 6-6 illustrates this. To further illustrate the significant of the fan on the
performance of this system, the hot side and the cold side temperatures are compared
with the heat removal fan (on the hot side) on, and off, and this is shown in Figure 6-7.
As shown in Figure 6-7, with fan off, the cold side temperature dropped by a few
degrees and then increased, following the same pattern as the hot side temperature.
Although the temperature difference between the hot and the cold side was almost equal,
both when the fan was switched on, and off, the temperature of the hot side continued to
increase, as did that of the cold side, until the condition of the maximum temperature
difference for the given electrical input was reached. This is because the heat on the hot
side can not be removed effectively and therefore the hot side temperature rose
continuously, the cold side temperature also continued to increase due to the maximum
temperature difference for the given electrical input was reached.
The above tests and analysis showed that it is necessary for the system to use heat
removal fan on the heat pipe-embedded fins heat sink units. All the following tests
shown in this chapter used the fan on the heat pipe-embedded fins heat sink units. Using
of the small fan inside cabinet can speed up the cooling process but is not necessary, and
did not apply to any the following tests.
143

Experimental Investigation of thermoelectric Refrigerator Using Phase change Material
70
60
50
U 0
40 ti
CL 30 E
20
10
0 -_.. ----ý
0 10 20 30 40 50 Time, min
Figure 6-4. Variation of the temperatures with time on the condition of fan off for the bonded fins heat sink system
45
/ 35 25
E 15
condenser
5 hot side (evaporator) cold side inside cabinet ambient
_5 0 t5 30 45 60 75 90
Time, min
Figure 6-5. Variation of the temperatures with time on the condition of fan on for the bonded fins heat sink system
144

Experimental Investigation of thermoelectric Refrigerator Using Phase change Material
45
35
c) 25
ti
is
CL 15
S
5 ý- L- 0 10 20 30 40 50 60 70
Time, min
Figure 6-6. Variation of the temperatures with time on the condition of improved
convection inside the cabinet for the bonded fins heat sink system.
70
50
U
ai 7,
CL E d I-
10
II
10
0 10 20 Time, min
30 40 50
Figure 6-7. Variation of thermoelectric module hot and cold side temperatures with, and without, a heat removal fan for the bonded-fins heat sink system.
145

Experimental Investigation of thermoelectric Refrigerator Using Phase change Material
Figure 6-8 shows a test using the encapsulated PCM replaced the bonded heat sink unit.
Figure 6-9 and Figure 6-10 compare the temperature variation of the thermoelectric
refrigeration system with and without PCM, during the cooling process and when the
electrical power was switched off, respectively. A comparison of the coefficient of
performance of the thermoelectric refrigeration systems with and without PCM is
presented in Figure 6-11.
When a conventional heat sink is used on the cold side, the temperature of the cold side
drops rapidly until the maximum possible temperature difference across thermoelectric
modules is reached. When the PCM is used, most of the cooling energy is absorbed by
the PCM, and therefore the cold side temperature drops more slowly than when the PCM
is not used; this is shown in Figure 6-9. With PCM, the temperature drops slowly at the
beginning until the transient temperature is reached. During the phase change process,
the temperature of the refrigeration system is almost constant until the phase change
process is complete, as shown in Figure 6-9. This helps to keep the temperature
difference across the thermoelectric modules to a minimum, thus improving its
performance.
Use of a PCM provides a storage capacity, which helps to overcome peak loads and
cooling losses during periods of door opening. If the electrical power is turned off for
any reason, the refrigeration system employing PCM would have a storage capacity
capable of meeting the cooling load for a longer period. For example, as shown in Figure
6-10, after the electrical power was turned off, it took twice as long for the temperature in the cabinet with PCM to rise to the same value as in the cabinet with no PCM.
In general, use of a PCM improves the performance of the thermoelectric refrigeration
system, as shown in Figure 6-11. As can be seen, because the cold junction temperature
remains constant during the phase change process, the rate of cooling is also constant, as is the COP of the refrigeration system. This is a major advantage of using a PCM
compared with a conventional heat sink.
146

hyhcriinentaI Invc; tigation of thermocIccuric Rctri«cratwr V iii Phase change Material
45 -
ýý
35
U 25
LD io
CL 15
H
5
200
25
20
15
10
E ý5
0 40 80 Time, min 120 160 200
Figure 6-9. Variation of cold side and PCM temperatures during the cooling process for the tests with and without PCM.
0
5 0 40 80
Time, min 120 160 200
'figure 6-9. Variation of cold side and PCM temperatures during the cooling rocess for the tests with and without PCM.
147
-5 0 40 80 120 160
Time, min
Figure 6-8. Variation of the temperatures with time for the PCM system

25
20
L) 15 G
ti
10 a E H
5
01 0 50 100 150 200 250 300
Time, min
Figure 6-10. Variation of cabinet and PCM temperatures for the tests with, and without, PCM, after the power was switched off.
refrigeration system, with and without, PCM.
148
35

Experimental Investigation of thermoelectric Refrigerator Using Phase change Material
6.4 Experimental Investigation of the Thermoelectric Refrigeration System
Employing Phase Change Material Integrated with Thermal Diode
6.4.1 Description of the Improved System
In the above arrangement of the refrigeration system illustrated in section 6.3, both the
cold heat sink unit and the PCM are in direct contact with the cold side of the
thermoelectric modules. This arrangement is appropriate during the cooling process as
the thermal resistance is kept to a minimum. However, when power is turned off, the
heat would leak back into the refrigeration cabinet. The PCM helps to provide a storage
capacity in this situation. This storage capability could be improved by using a thermal
diode that allows heat flow in one direction only. Using "wickless" heat pipe between
the PCM and the cold side of the thermoelectric modules could provide this. The aim of
this study is to investigate a novel refrigeration system employing a phase change
material integrated with thermal diode to improve the performance of current
thermoelectric modules. The refrigeration system was reconstructed, as shown in Fig. 6-
12. The only difference between the system in Figure 6-1 and that in Figure 6-12 is that,
in the latter, the encapsulated PCM is not directly attached to cold side of the
thermoelectric modules. The thermal diodes were inserted between the PCM and the
cold side of the thermoelectric modules. The lower part of the thermal diodes, which is
in contact with the PCM, forms the evaporator end, while the upper parts, which is in
contact with the cold side of the thermoelectric modules forms the condenser.
Photograph of the system employing phase change material integrated with thermal
diode is shown in Figure 6-13. When DC current is applied to this thermoelectric
refrigeration system, the working fluid in the evaporator of the thermal diodes absorbs
heat from the PCM, producing cooling. The vapour produced in the evaporator travels to
the condenser end where it condenses, whilst dissipating heat to the cold side of the
thermoelectric modules. The cooling effect dissipated to the PCM cause it to solidify and
release its latent heat. The PCM would melt while absorbing heat from the load. The use
of a thermal diode in the system would enhance the heat transfer from the thermoelectric
modules to the PCM. In an event of the power being turned off, the thermoelectric
modules would cease operation and the heat would flow back by direct conduction from
the hot side to the cold side of the thermoelectric modules, due to the temperature
gradient. However, the operation of the thermal diode between the thermoelectric
149

Experimental Investigation of thermoelectric Refrigerator Using Phase change Material
modules and the PCM would cease because the cooling would not be sufficient to cause
the vapour from the evaporator to condense, and thus would prevent heat leakage to the
PCM via the thermoelectric modules. Due to the thermal diode can only transfer heat
from the metal block to PCM, the evaluation of the performance of this system is the
same as that of the system employing PCM directly attached to the cold side of
thermoelectric modules, see Eq (6-1) and Eq (6-2).
Embedded fin Heat pipe heat sink
Metallic block
Thermoelectric
modules
Thermal diode (thermosyphon)
PCM
Cooling Fan
Mask
Figure 6-12. Schematic description of a thermoelectric refrigeration system employing PCM integrated with thermal diodes.
150

Experimental Investigation of thermoelectric Refrigerator Using Phase change Material
6.4.2 Results and Discussions
Figure 6-14 presents the temperature variation of the thermoelectric refrigeration system
with the PCM integrated with thermal diodes. As can be seen, during the cooling phase,
temperatures of the PCM and the cold side of the thermoelectric modules, dropped
rapidly during the first few minutes, and when the phase change temperature of the PCM
was reached, the temperature dropped more slowly and steadily. When the power was
switched off, the temperature of the hot side dropped rapidly. Similarly the temperature
of the cold side increased rapidly to approach the hot side temperature near the ambient
temperature. On the other hand, the PCM temperature and the refrigeration cabinet
temperature increased steadily and slowly to approach the ambient in 4h period after the
power was switched off.
Without the thermal diodes (thermosyphons), the temperature of the PCM and the
temperature of the refrigeration cabinet would have increased more rapidly. Inclusion of
the PCM and the thermal diodes caused both the cooling and the heating processes to
take place slowly due to the effect of the large energy storage capacity of the PCM.
151
Figure 6-13. Thermoelectric refrigeration system employing PCM integrated
with thermal diodes

Experimental Investigation of thermoelectric Refrigerator Using Phase change Material
Introduction of thermal diodes provided a thermal resistance to the heat transfer, which
was an advantage when the power was switched off, as will be explained.
Figure 6-15 compares the PCM temperature variation of the thermoelectric refrigeration
system with PCM directly attached to the cold side of thermoelectric modules and with
PCM integrated with thermal diodes, during the cooling phase. As can be seen, the
temperature of the PCM dropped more slowly, when thermal diodes were introduced.
Similarly, when the power was switched off, the thermal diodes caused the temperature
of the PCM to rise more slowly, compared to a situation when the PCM is directly
attached to the cold side of the thermoelectric modules. This can be seen in Figure 6-16,
which compares the temperature variation of the PCM with and without thermal diode,
after the power was switched off. The temperature of the PCM increased from 2°C to
13.5°C in 5 h, when the PCM was integrated with thermal diodes, while the same
temperature rise took place in 2h and 20 min, when the PCM was directly attached to
the cold side of the thermoelectric modules. In section 6.3, it was known that,
replacement of the conventional heat sink system (bonded-fins heat sink) with a PCM,
allowed twice as much time for a temperature in the refrigeration cabinet to rise to the
same value compared to a refrigeration cabinet without PCM, after the power was
switched off. It is worthy mentioning that, apart from the insulation that was used around
the condenser section of the thermal diodes, the refrigeration cabinet insulation in all the
tests was generally the same. Therefore, it could be concluded that, the temperature of a
thermoelectric refrigeration system which incorporates PCM and thermal diodes, would
take more than four times as long time to rise to the same value when conventional heat
sink system is used, after the power was turned off. This is a major improvement on the
performance of the thermoelectric refrigeration system.
The introduction of the thermal diodes, however did not contribute positively to the
improvement of the COP of the thermoelectric refrigeration system, in place a slight
reduction in COP was observed. Figure 6-17 compares COPs of the thermoelectric
refrigeration system in three cases, i. e., without PCM, with PCM directly attached to
thermoelectric modules and with PCM integrated with thermal diodes. It can be seen
that, the COP drops steadily at lower temperatures, when conventional heat sink is used. However, the COP was improved significantly when PCM was introduced. It can be
152

EE: yperimental Insc, ti Tatwr ý, i' thermoelectric Kcfriý-, ci ttor L ýtn_ I'ha c cham_c Material
observed that, the COP is almost constant during the phase change process as shown in
Figure 6-17. This is because the cold side temperature is almost constant, resulting in a
steady cooling rate. In general, use of PCM improves the performance of the
thermoelectric refrigeration system, and provides a cooling storage capability, which is
further improved by integration of the PCM with thermal diodes.
50
40
30
U
ß2 20 6
ä E
10
0
-10 0
Power off period
120 240 360 480 600 720 Time, minute
Figure 6-14. Temperature variation of the thermoelectric refrigeration system employing PCM integrated with thermal diode
153

25 -
20
U ° 15
v E 10 a, F-
5
0 0 60 120 180 240 300
Time, minute
Figure 6-15. Variation of temperature of the PCM with and without thermal diode during cooling phase
25
20
15
d
CL 10 E d F-
5
Figure 6-16. Variation of the temperature of the PCM with and without thermal Diode after the power was switched off
154
60 120 190 240 3(X) 360
Time, minute

0.30
- COP with thermal diode 0.25 COP without thermal diode
COP without PCM
0.20
Ö 0.15 U
0.10
0.05
0.00 0 25
Figure 6-17. Comparison of the COP of thermoelectric refrigeration system with and without PCM and thermal diode.
6.5 Conclusion
A thermoelectric refrigerator using phase change material has been designed and tested.
The system was first tested with a conventional heat sink unit (bonded fins, heat sink) on
the cold side of the thermoelectric modules, and a fan-assisted (heat pipe-embedded fins)
heat sink unit on the hot side. The system was also tested with an encapsulated PCM in
place of the conventional heat sink on the cold side of the thermoelectric modules.
Replacement of the conventional heat sink system with an encapsulated PCM, gave an
improvement in the performance of the thermoelectric refrigeration system as well as the
cooling storage capability, which would be particularly useful for handling the peak
loads, and overcoming losses during door openings and power-off periods. However,
this would only be effective if the reverse heat flow via the thermoelectric modules
could be prevented by using thermal diodes between the thermoelectric modules and the
PCM. Therefore, the further tests have been carried out to investigate the role of the
thermal diode (thermosyphon) and its effect on the performance of the thermoelectric
refrigeration system.
155
5 10 15 20 Temperature of the refrigeration cabinet °C

Experimental Investigation of thermoelectric Refrigerator Using Phase change Material
An improved thermoelectric refrigeration system employing encapsulated PCM
integrated with thermal diode was fabricated and tested. The performance of the new
system was compared with a similar system using PCM but not integrating thermal
diodes.
Results of the tests showed that, it is feasible to use thermal diodes between the PCM
and the cold side of thermoelectric modules in order to prevent heat leakage to the PCM
in the event of the power being switched off. Results of the tests also showed that,
during the cooling phase, the system employing thermal diodes between the PCM and
the thermoelectric modules has a similar cooling effect as that employing PCM attached directly to the cold side of the thermoelectric modules.
Overall the system can be operated using renewable energies, in particular photovoltaic
solar energy which produces DC electricity, and is well suited for food and medicine
storage.
156

Conclusions and Further Work
Chapter 7. Conclusions and Further Work
7.1 Summary of the Work
This research investigated novel thermoelectric refrigeration systems, which include a
building integrated thermoelectric heat pump and a thermoelectric refrigerator using
phase change material. These systems can be driven by mains power (DC) or solar PV
cells.
The research started from a review in relative to the several technical areas, including
thermoelectric cooling technologies and their applications, research on improving
coefficient of performance of thermoelectric cooling systems, heat pipe technology and
heat pipe performance analysis, and photovoltaic solar cells and their applications. Technical progress in these areas was examined, and the innovative aspects of this
research were identified compared to the current technical status.
The research investigated the thermoelectric module performance and finned heat sink
performance. An optimum selection/design model of the thermoelectric modules was
developed. The relation between optimum thermoelectric parameters and
cooling/heating capacity, hot side/cold side temperature as well as geometry factor was
investigated. An analytical model of the performance of the finned heat sink was
developed. The relations between finned heat sink performance (heat transfer, efficiency
and thermal resistance) and length of fins, number of fins and convective coefficient was
investigated. These two models provided a basis for optimum selection/design of
thermoelectric modules and finned heat sink.
The research also investigated the thermal performance of conventional heat pipe,
including normal heat pipes, micro/miniature heat pipes, with/without wicks. Based on
the investigation of the conventional heat pipes, a new type thermal diode was
investigated for the two cases, i. e., using more liquid and using wick in the evaporator to
keep the internal wall of the evaporator wet. An analytical model was developed to
evaluate the heat transport capacity for the heat pipes. The new type thermal diode using
more liquid to wet the internal wall of the evaporator was proposed. Variation of heat
157

Conclusions and Further Work
transport capacity for the new type thermal diode with operation temperature, liquid fill
level and channel geometry were investigated.
The research further involved the design, modelling, construction and testing of a novel
thermoelectric heat pump, which can work in cooling and heating modes. A computer
model was developed to analyse the heat transfer occurring in the heat pump. Modelling
of the performance and required operating current of the heat pump was carried out
under different operating and ambient temperatures, for both cooling and heating mode.
The relation between the coefficient of performance and the operating condition as well
as weather condition was explored. Laboratory tests were carried out to validate
modelling predictions and examine the thermal performance of the heat pump.
Comparison was made between the modelling and testing results, and the reasons for
error formation were discussed. A correlation factor was determined to modify the
predicted hot and cold side temperatures and this was used in the computer program to
obtain more accurate modelling results.
The research work also involved the design, construction and testing of a thermoelectric
refrigerator. The work intended to investigate the potential application of phase change
materials (PCMs) in the thermoelectric refrigeration system. The system was first
fabricated and tested using a conventional heat sink system at the cold side of the
thermoelectric modules. In order to improve the performance and the storage capability,
the system was reconstructed and tested using an encapsulated PCM as a cold sink.
Results of testing of the latter system showed an improved performance compared with
the former system. However to improve the storage capability, in particular during off-
power periods, it was found necessary to integrate the PCM with the thermosyphons,
which would allow heat flow in one direction only. Results of testing carried out on the
system using PCM integrated with the thermal diodes showed considerable improvement
in the storage capability of the thermoelectric refrigeration system compared with the
previous ones.
7.2 Conclusions
Conditions for thermoelectric cooling/heating system to achieve maximum COP
158

Conclusions and Further Work
For an application with fixed working temperatures Th and TT, the thermoelectric
modules have an optimum current to achieve the maximum COP. To achieve maximum
COP the optimum current should be input, i. e., the operating current of the
thermoelectric modules should equal to the optimum current. For a specific working
temperature Th and TT, a specific operating current is required to obtain the required
cooling/heating capacity QiQh. By using an appropriate number of thermoelectric
modules or appropriate geometry factor, this operating current can equal the optimum
current under this working temperature (hot/cold side temperatures of the thermoelectric
modules) and therefore the maximum COP can be obtained.
The required number of thermoelectric modules for optimum current and COP increases
with the cooling/heating capacity. The optimum current and optimum COP are determined by thermoelectric material property coefficients, geometry factor and
working temperatures Th and TT, they have no relationship with the cooling capacity. The
required number of the thermoelectric modules for optimum current and COP decreases
with the increase of the hot side temperature and increases with the increase of the cold
side temperature. To achieve optimum COP, the required number of thermocouples
varies with the geometry factor, which determines the type of the thermoelectric
modules. The larger the geometry factor, the fewer thermoelectric modules are required.
Heat transfer capacity and efficiency of the finned heat sink Due to the high intensity heat flux, the thermoelectric modules can not work independently. They have to use heat sink to dissipate heat.
The heat transfer capacity and efficiency of finned heat sink varies with its geometry
parameters as well as convective coefficient. The heat transfer capacity increases quickly
with the length of fins while the length of fins is within a certain value, 8cm for selected
finned heat sink for this investigation on thermoelectric heat pump, and it does not
increase obviously while the length of fins is larger than around 8cm. The efficiency
decreases with the increase of the length of fins. The heat transfer capacity increases
straight with the number of fins. The efficiency decreases with the increase of the
number of fins while the number of fins is within a certain value, 15 for selected finned
heat sink for this investigation on thermoelectric heat pump, and it does not decrease
159

Conclusions and Further Work
obviously while the number of fins is larger than 15. Although the high density of fin
indicate a good performance as above analysis, it is suggested that appropriate number
of fins should be chosen considering its resistance on coolant. The heat transfer capacity
increases quickly with the increase of the convective coefficient and efficiency decreases
with the increase of the convective coefficient.
Heat transport capacity of the new type thermal diode
The maximum heat transport capacity is the index evaluating heat transfer capacity of a
heat pipe, which is governed by six limits, i. e., the sonic limit, the entrainment limit, the
boiling limit, the viscous limit, the capillary limit as well as the filled liquid mass limit.
The new type thermal diode was investigated for two cases: one uses more liquid in
evaporator to keep the internal surface of evaporator wet and another uses capillary wick
to distribute the liquid from the bottom to the whole internal surface of the evaporator. The maximum heat transport capacity of the thermal diode for both cases increase with
the working temperatures. The maximum heat transport capacity of the thermal diode for
both cases increase with increasing cross section diameters. The maximum heat
transport capacity of the thermal diode without wick remains constant when the liquid
fill level varies. The maximum heat transport capacities of the thermal diode without
wick, dominated by entrainment limit, are much greater than that of with wick under the
various working temperatures, liquid fill levels and cross section diameters.
For the maximum heat transport capacities, n-pentane is superior to HFE-7100 in this
investigation.
Thermoelectric heat pump
A thermoelectric heat pump prototype were designed and constructed to work in two
modes, i. e., cooling mode and heating mode. The thermal performance of the heat pump
system was investigated using the computer modelling and experimentally. It was found
by both modelling and testing results that the COP and required DC current varies with
cooling capacities (in cooling mode), heating capacities (in heating mode) and ambient
temperature. In cooling mode, the COP decrease and the DC current increase with the
increase of the cooling capacity and the ambient temperature. In heating mode, the COP
160

Conclusions and Further Work
decrease and the DC current increase with the increase of the heating capacity, the COP
increase and the DC current decrease with the increase of the ambient temperature. The
COP of the heat pump is influenced greatly by the efficiency of the heat removal on the
hot side of the thermoelectric modules. Using evaporation of water on the hot side heat
sink can improve the COP in cooling mode significantly.
The testing results were compared with the theoretical predictions, and it was found that
the distinct differences existed between the theoretical and testing values. The
experimental COPS are lower and required currents are larger than modelling
predictions. The main reason for this is the calculation of the thermal resistance of
thermal diode in modelling was simplified due to the existing difficulty of calculating
the thermal resistance of the new type thermal diode with a complex structure. Another
reason for this is the difference between the designed heat sinks and the practical heat
sinks. These cause the larger difference between the working temperatures in modelling
and those in tests. The reasons for the difference between modelling and experimental
results also include the limit of the model's accuracy as well as the manufacturing
tolerances of the thermoelectric modules. These treatments were not taken into account in modelling development and processing. To enable the model to predict the heat pump
performance at a reasonable accuracy, a correlation factor for working temperatures in
modelling was determined and applied to the computer model and modified modelling
results were obtained. The modified modelling results are much more close to the testing
results, the differences between the COPS in modelling and in testing is within 0.2.
The required scale for an office of 15m2 in a building in Scotland was estimated based
on the theoretical and experimental evaluations. The estimation was carried out for the
system both using evaporation of water and not using evaporation of water in cooling
mode. An COP of around 0.5 in cooling mode was determined. The estimated scale for
the office is 150 pieces of CP2-127-06 thermoelectric modules with the area of 0.54m2
while not using the evaporation of water in cooling mode, and 106 pieces of CP2-127-06
thermoelectric modules with the area of 0.38m2 while using the evaporation of water.
Thermoelectric refrigerator using phase change material
161

Conclusions and Further Work
A thermoelectric refrigerator system was designed, constructed and tested. To
investigate the effect of the phase change material and thermal diode on the performance
of the thermoelectric refrigeration system, the system was constructed and tested in three
different configurations. The first configuration use a conventional heat sink unit
(bonded fins heat sink) on the cold side of the thermoelectric modules. The second
configuration use encapsulated PCM in place of the conventional heat sink on the cold
side of the thermoelectric modules. The third configuration employing encapsulated
PCM integrated with thermal diodes (thermosyphons) on the cold side. For the three
configuration, a fan-assisted (heat pipe-embedded fins) heat sink unit was used on the
hot side.
Results of the tests showed that, replacement of the conventional heat sink system with
an encapsulated PCM, gave an improvement in the performance of the thermoelectric
refrigeration system as well as the cooling storage capability, which would be
particularly useful for handling the peak loads, and overcoming losses during door
openings and power-off periods. However, this would only be effective if the reverse heat flow via the thermoelectric modules could be prevented by using thermal diode
between the thermoelectric modules and the PCM, i. e., using the third configuration.
Results of the tests also showed that, it is feasible to use thermal diodes between the PCM and the cold side of thermoelectric modules in order to prevent heat leakage to the
PCM in the event of the power being turned off. Results of the tests also showed that, during the cooling phase, the system employing thermal diodes between the PCM and
the thermoelectric modules has a similar cooling effect as that employing PCM attached directly to the cold side of the thermoelectric modules.
7.3 Further work
Although substantial work has been carried out during this research, there are still quite a
few opportunities to develop this thermoelectric heat pump and this thermoelectric
refrigerator in order to improve the system's performance further. These may be
indicated as follows:
Thermoelectric heat num
162

Conclusions and Further Work
It was noticed that reducing the hot side temperature of the thermoelectric modules
would increase the COP significantly in cooling mode. Therefore, the configuration of
the cranked thermal diode should be improved in order to remove the heat from the hot
side more efficiently. Figure 8-1 shows a suggested improved configuration of the
cranked thermal diode. The condenser (in cooling mode) constitutes of tubes connected
with headers and the tubes are banded with fins, this configuration could increase the
heat dissipating area and is easy to manufacture. The evaporator (in cooling mode) are
still flat panel with the holes inside the panel and could be relevant small due to the less
heat flow cold side (in cooling mode), the area could just match the total area of
thermoelectric modules. This configuration is also suitable for working in heating mode.
The thermal resistance of the cranked thermal diode could be investigated by using CFD,
by which the accurate thermal resistance could be predicted. The system analysis could
be more accurate and therefore the practical system could obtained the designed
optimum (maximum) COP. This would improve the performance greatly.
Evaporation of water is a very effective method to reduce the temperature of the heat
sink. A circulation system for use of evaporation of water in the thermoelectric
refrigeration system could be developed and used in the system to improve the COP.
Fin
Header
Condenser (cooling mode)
Figure 7-1. Schematic diagram of the improved configuration of new type thermal diode
163

Conclusions and Further Work
Thermoelectric refricerator Due to the larger temperature difference between the hot and cold side of thermoelectric
modules in the thermoelectric refrigerator, the COP of the system is much lower. The
hot side heat sink system could be improved to reduce the hot side temperature and
therefore improve the COP. This improvement could be achieved by developing a heat
pipe heat sink system that could be mounted on the hot side vertically.
Combination of PV and the refriMeration system Further investigations of the combining the PV into the thermoelectric refrigeration
system could be carried out. The further investigations should include the optimum design of the PV system for a specific thermoelectric refrigeration system application,
performance modelling and experimental testing.
164

References
References
A Abhat A (1982) Performance investigation of a long, slender heat pipe for thermal
energy storage application, J. Energy 6, pp. 6-16.
B
Babin B. R., Peterson G. P., and Wu D. (1989) Analysis and testing of a micro heat pipe
during steady state operation, American Society of Mechanical Engineers, New York,
Paper 89-HT-17.
Babin B. R., Peterson G. P., and Wu D. (1990) Steady-state modelling and testing of a
micro heat pipe, Journal of Heat Transfer 112, pp. 595-601.
Bale G et al (1999) Cooled CdZnTe detectors for X-ray astronomy, Nuclear Instruments
and Methods in Physics Research Section A: Accelerators, Spectrometers, Detectors and Associated Equipment 436 (1999) pp. 150-154.
Boehmer A. P et al (1963) Thermoelectric refrigerator, United States Patent, 3177670.
Bojic M et at (1997) Thermoelectric cooling of a train carriage by using a coldness-
recovery device, Energy 22 (5) pp. 493-500.
Brown W. K et al (1965) Refrigerator-package arrangement, United States Patent,
3280573.
D
Duffle JA and Beckman WA (1991), Solar Engineering of Thermal Processes, John
Wiley & Sons NewYork. London. Sydney. Toronto, TJ810. D8
Dunn P. D. and Reay D. A. (1982) Heat pipes, 3rd ed., Pergamon Press, New York.
165

References
F
Fahrenbruch A. L and Bube R. H (1983) Fundamentals of solar cells-photovoltaic solar
energy conversion, Academic Press, Inc, New York.
Faghri, A. (1995) Heat Pipe Science and Technology, Taylor &Francis, Washington,
DC, pp. 11-110.
Fan C. Y, Air Conditioning System, Building Industry Press, China, 1983.
G Gao M et al (1999) Cooling performance of integrated thermoelectric microcooler. Solid-state electronics 43 pp. 923-929
Gao M, et al (2000) Improved model for calculating the coefficient of performance of a Peltier module, Energy Conversion and Management, Vol 41, pp. 163-171.
Gilley, et al (1999) Thermoelectric refrigerator with evaporating/condensing heat
exchanger. United States Patent, No. 6003319.
Groll M, Rösler S (1992) Operation principles and performance of heat pipes and closed
two-phase thermosyphons, J. Non-Equilib. Thermodyn. Vol. 17 pp. 91-151
Guyer E. C (1988) Handbook of Applied Thermal Design, McGraw Hill, New York.
H
Hara T, et al (1998) Cooling performance of solar cell driven thermoelectric cooling prototype headgear, Applied Thermal Engineering, Vol. 18, pp. 1159-1169
I lacullo R. S (1996) Thermoelectric intercooler cooling turbocharged air. United States
Patent, 5547019.
J
Jeong S et al (1994) Optimum temperature staging of cryogenic refrigeration system,
Cryogenics, Vol. 34, No. 11, pp. 923-933.
166

References
Jones A. D and Underwood C. P (2001) A thermal model for photovoltaic systems, Solar
Energy, Vol. 70, Issue 4, pp. 349-359
K
Kin-ichi Uemura (1995) Commercial Peltier modules, in: D. M. Rowe (Ed. ),
Thermoelectric Handbook, CRC Press Inc., Boca Bato, FL, pp. 621-631
Kim C. M et al (2001) Air conditioner for individual cooling/heating, United States
Patent Application, 20010005990, kind code, Al.
Kraus A. D. and Bar-Cohen A. (1983) Thermal Analysis and Control of Eletronic
Equipment, McGraw-Hill, New York.
L
Lienhard John H (2001) A Heat Transfer Textbook, Phlogiston Press, Cambridge,
Massachusetts, USA.
Lindenblad N. E et al (1954) Thermoelectric refrigerator. United States Patent, 2837899
Lindler K. W (1998) Use of multi-stage cascades to improve performance of
thermoelectric heat pumps, Energy Conversion and Management. Vol. 39, pp. 1009-
1014.
M
Morrow R. C (2000) Biomass production system (BPS) plant growth unit, Advance in
Space Research: the Official Journal of the Committee on Space Research (COSPAR),
Crabb, TM, 26 (2) pp. 289-298.
R
Redus R. H et al (2001) Improved thermoelectrically cooled X/y-ray detectors and
electrobics, Nuclear Instruments and Methods in Physics Research Section A:
Accelerators, Spectrometers, Detectors and Associated Equipment, Vol. 458, pp. 214-219
167

References
Riffat S. B. (2000) European Commission, Energy, Environmental and Sustainable
Development Programme, NNE5-1999-20114, Hybrid solar collector/CHP system.
Riffat S. B., Doherty P. S. and Abdel Aziz E. I. (2000) Performance testing of different
types of liquid flat plate collectors, International Journal of energy Research, 24,
pp. 1203-1215.
Riffat S. B, Qiu G (2004) Comparative investigation of thermoelectric air-conditioners
versus vapour. compression and absorption air-conditioners, Applied Thermal
Engineering (to be published in 2004)
Rowe D. M (1995) Handbook of Thermoelectrics, CRC Press Inc.
Rowe D. M et al. (1998) Evaluation of thermoelectric modules for power generation,
Journal of Power Sources 73 pp. 193-198
S
Sanz-Bobi M. A, et al (1996) Thermoelectricity applied to the cryoconcentration of
orange juice, 15`h International Conference on Thermoelectrics, pp. 259-263
Scruggs M. K et al (2001) Thermal-electrically cooled photodetector, United States
Patent Application, 20010032922, kind code, Al.
Sofrata H (1996) Heat rejection alternatives for thermoelectric refrigerators, Energy
Conversion and Management. Vol. 37 pp. 269-280
T
Takaoka M., Motai T., Sakaya M., Mochizuki M., Mashiko K., and Ito M. (1985) Development of long heat pipes and heat pipe products, Fujikura Technical Review, No. 14, Fujikura Ltd., Tokyo, Japan.
V Venkatasubramanian R, et al (2001) Thin-film thermoelectric devices with high room-
temperature figures of merit, Nature, Vol. 413, pp. 597-602.
168

References
Viorel Badescu (2003) Dynamic model of a complex system including PV cells, electric battery, electrical motor and water pump, Energy, Vol. 28, Issue 12, pp. 1165-1181.
w Webb-RL, et al (1998) Advanced heat exchange technology for thermoelectric cooling, Journal of Electric Packing, Vol. 120 No. 1, pp. 98-105.
Welling Jr T. E, et al(1997) The effect of thermoelectric cooler mounting orientation on
cooling efficiency. Aes-vol. 37, Proceedings of the ASME Advanced Energy Systems
Division ASME pp. 303-307
Z
Zhao X (2002) Design of an Energy Efficient Timber System at a Sawmill in Scotland,
Heat Pump Association 7th Annual Student Award.
Zhuang J. et al. (1989) Heat Pipe and Heat Pipe Heat Exchanger, First ed., The Press of Jiaotong University, Shanghai, China, pp. 127-147.
Zwaan Bob van der and Rabl An, Prospects for PV: a learning curve analysis, Solar
Energy, Vol. 74, Issue 1, pp. 19-31
169

Appendix A
Appendix A
Thermoelectric material property coefficients
Material Property Coefficients
a=(cxo+(x1Tm+cc2Tm )x10"9 (volts/Kelvin)
oca=22224.0
a1=930.6
(D(2: ---0.9905
p=(po+p1Tm+p2Tm )x10-8 (ohm cm)
po=5112.0
pi=163.4
p2=0.6279
k=(ko+k1Tm+kTm )x10-6 (watt/(cm Kelvin))
ko=62605.0
kt=-277.7
k2=0.4131
Z=a2/(pK) (Kelvin-1)
170

Appendix B
Appendix B
Module types and their geometry factors (G)
Module type G
FC 0.45 -xx- 05 0.016
FC 0.6 -xx- 06 0.024
FC 0.6 -xx- 05 0.030
FC 0.65 -xx- 04 0.040
CP 0.8 -xx- 0.6 0.042
CP 0.8 -xx- 05 0.052
CP1.0 -xx- 08 0.050 CP 1.0 -xx- 06 0.061 CP1.0 -xx- 05 0.079 CP1.4 -xx- 10 0.077
CP1.4 -xx- 06 0.118
CP1.4 -xx- 045 0.171
CP2 -xx- 10 0.184
CP2 -xx- 06 0.282
CP2.8 -xx- 06 0.473
CP5 -xx- 10 0.778
CP5 -xx- 06 1.196
171

Appendix C
Appendix C
Publication list during this research
1. A Novel Thermoelectric Refrigeration System Employing Heat Pipes and a Phase Change Material, an Experimental Investigation, S. B. Riffat, S. A. Omer and Xiaoli Ma, Renewable Energy (23), 2001,313--323
Abstract
This paper presents results of tests carried out to investigate the potential application of
heat pipes and phase change materials for thermoelectric refrigeration. The work
involved the design and construction of a thermoelectric refrigeration prototype. The
performance of the thermoelectric refrigeration system was investigated for two different
configurations. The first configuration employed a conventional heat sink system
(bonded fin heat sink) on the cold side of the thermoelectric cells. The other
configuration used an encapsulated phase change material in place of the conventional
heat sink unit. Both configurations used heat pipe embedded fins as the heat sink on the
hot side. Replacement of the conventional heat sink system with an encapsulated phase
change material was found to improve the performance of the thermoelectric
refrigeration system. In addition, it provided a storage capability that would be
particularly useful for handling peak loads and overcoming losses during door openings
and power-off periods. Results showed that the heat sink units employing heat pipe
embedded fins were well suited to this application. Results also showed the importance
of using a heat pipe system between the cold junction of the thermoelectric cells and the
cold heat sink in order to prevent reverse heat flow in the event of power failure.
172

Appendix C
2. Experimental Investigation of a Thermoelectric Refrigeration System Employing a Phase Change Material Integrated with Thermal Diode (Thermosyphons), S. B. Riffat, S. A. Omer and Xiaoli Ma, Applied Thermal Engineering (21) 2001,1265-1271
Abstract
This paper presents results of tests carried out to investigate the potential application of
phase change materials (PCMs) integrated with thermosyphons in a thermoelectric
refrigeration system. The work involved design, fabrication and test of a 150 W
thermoelectric refrigeration system. The system was first fabricated and tested using a
conventional heat sink system (bonded fin heat sink system) at the cold heat sink. In
order to improve the performance and the storage capability, the system was
reconstructed and tested using an encapsulated PCM as a cold sink. Results of tests of
the latter system showed an improved performance compared with the former system.
However to improve the storage capability, in particular during off-power periods, it was
found necessary to integrate the PCM with a thermal diode, which would allow heat
flow in one direction only. Results of tests carried out on the new system showed
considerable improvement in the storage capability of the thermoelectric refrigeration
system compared with the previous ones. Overall the system suits operation with
renewable energies, e. g., solar energy.
173
Appendix C
3. Thermoelectrics: A Review of Present and Potential Applications, S. B. Riffat and Xiaoli Ma, Applied Thermal Engineering, (23) 2003,913-935
Abstract
Thermoelectric devices are solid state devices. They are reliable energy converters and
have no noise or vibration as there are no mechanical moving parts. They have small
size and are light in weight. As refrigerators, they are friendly to the environment as
CFC gas or any other refrigerant gas is not used. Due to these advantages, the
thermoelectric devices have found a large range of applications. In this paper, basic
knowledge of the thermoelectric devices and an overview of these applications are
given. The prospects of the applications of the thermoelectric devices are also discussed.
174

Appendix C
4. Improving the Coefficient of Performance of Thermoelectric Cooling System: A review, S. B. Riffat and Xiaoli Ma, International Journal of Energy Research. 2004; 28: 753-768.
Abstract
This paper reviews research carried out to improve the coefficient of performance of
thermoelectric cooling systems during the past decade. This includes development of
new materials for thermoelectric modules, optimisation of module design and
fabrication, system analysis and heat exchange efficiency. Several conclusions are
drawn.
175

Appendix C
5. Experimentation of a Novel Thermoelectric Heat Pump System, S. B. Riffat and Xiaoli Ma, International Journal of Ambient Energy, (accepted to be published)
Abstract
This paper presents results of tests carried out to investigate a passive technology based
on integration of a thermal diode and thermoelectric modules for a novel heat pump. The
system is very compact and suitable for incorporation within the building structure. The
heat pump uses thermoelectric modules to produce cooling or heating, and a new type of
thermal diode to transfer heat in or out of the building, and prevents reverse heat flow in
the event of power failure. Following design and construction of a thermoelectric heat
pump prototype, its performance was investigated for two different modes, i. e., cooling
and heating, under various operating conditions and environmental temperatures. Results
showed that reducing the temperature of the condenser of the thermal diode could
provide a significant improvement of the efficiency of the thermal diode and the
coefficient of performance (COP) of the system in cooling mode. This can be achieved
using the evaporation of water on the heat sink attached to the condenser. The
experimental results showed that the new type of thermal diode worked effectively in
both cooling and heating modes.
176

Appendix C
6. Optimum Selection (Design) of Thermoelectric Modules for Large Capacity Heat Pump Applications, S. B. Riffat and Xiaoli Ma, International Journal of Energy Research, (proof approved in publish list)
Abstract
Thermoelectric modules should be selected or designed to meet the specific
cooling/heating requirements of a particular application and in most cases, the cooling
/heating capacity and the working temperatures (hot and cold side temperature of
thermoelectric devices) are known. Computer modelling can be used to assist the
selection process by determining the relationships between the cooling/heating
requirements and optimum thermoelectric parameters thermoelectric modules suited to
large capacity thermoelectric heat pump applications.
NpTTINGy, ý
ITY lxatý
177

Appendix C
7. Performance Simulation and Experimental Testing of a Novel Thermoelectric Heat Pump System, S. B. Riffat and Xiaoli Ma, (completed)
Abstract
A computer model has been developed to simulate the performance of a novel
thermoelectric heat pump system. The modelling was carried out to simulate the
performance of a small prototype system. Results were obtained for various operating
and weather conditions, and these were compared with experimental results carried out
for the fabricated prototype system. Reasons for differences between the modelling
results and test results were analysed, and the computer model was modified. More
accurate modelling results were then obtained. The work provides a basis for analysis
and design of the thermoelectric heat pump system.
178