Progress of hybrid nanocomposite materials for thermoelectric ...
Upload
khangminh22Category
view
2download
0
sustainability
Article
Photovoltaic and Thermoelectric Generator Combined HybridEnergy System with an Enhanced Maximum Power PointTracking Technique for Higher Energy Conversion Efficiency
Kanagaraj N.
Citation: N., K. Photovoltaic and
Thermoelectric Generator Combined
Hybrid Energy System with an
Enhanced Maximum Power Point
Tracking Technique for Higher Energy
Conversion Efficiency. Sustainability
2021, 13, 3144. https://doi.org/
10.3390/su13063144
Academic Editor: Domenico Mazzeo
Received: 9 January 2021
Accepted: 8 March 2021
Published: 12 March 2021
Publisher’s Note: MDPI stays neutral
with regard to jurisdictional claims in
published maps and institutional affil-
iations.
Copyright: © 2021 by the author.
Licensee MDPI, Basel, Switzerland.
This article is an open access article
distributed under the terms and
conditions of the Creative Commons
Attribution (CC BY) license (https://
creativecommons.org/licenses/by/
4.0/).
Electrical Engineering Department, College of Engineering, Prince Sattam Bin Abdulaziz University,Wadi Aldawasir 11991, Saudi Arabia; [email protected]
Abstract: In this paper, the design and performance investigation of the hybrid photovoltaic–thermoelectric generator (PV–TEG) system with an enhanced fractional order fuzzy logic controller(FOFLC)-based maximum power point tracking (MPPT) technique is presented. A control strategy ofthe variable incremental conduction (INC) method is employed using FOFLC for the MPPT controltechnique to efficiently harvest the maximum power from the PV module. The fractional factor αused in the MPPT control algorithm is a supporting fuzzy logic controller (FLC) for the accuratetracking of the maximum power point (MPP) and to maintain the constant output after reaching theMPP. In the proposed system configuration, the TEG is mounted with the PV panel for generatingthe extra electrical power using the waste heat energy produced on the PV panel due to the incidentsolar irradiation. The PV and TEG are connected electrically in series to increase output voltage leveland thereby improve the power output. The hybrid energy module has better energy conversionefficiency when compared to the standalone PV array. The performance of the proposed MPPTtechnique is studied for the PV–TEG hybrid energy module under various thermal and electricaloperating conditions using a MATLAB software-based simulation. The results of the FOFLC-basedMPPT technique are compared with the conventional perturb and observe (P&O) and FLC-basedP&O methods. The proposed MPPT technique confirms its effectiveness in extracting the maximumpower in terms of speed and accuracy. Moreover, the PV and TEG combined system provides higherenergy efficiency than the individual PV module.
Keywords: hybrid PV–TEG energy system; energy efficiency; waste heat recovery; MPPT; fuzzylogic controller
1. Introduction
The electric power generation around the world is changing towards the environ-mentally friendly because the use of conventional source-based power generation causesmore environmental issues, such as the emission of greenhouse gases, global warming,and air pollution. Therefore, the use of renewable energy sources becomes essential tominimize the damages to the environmental and to protect human health. Among thevarious renewable energy sources, solar energy-based electricity generation has attractedmore attention recently due to its merits, such as being freely available everywhere, aclean-green energy, inexhaustible and lower maintenance because it has no mechanicalrotational parts. However, the photovoltaic (PV) cells utilize only a partial amount of theincident irradiation of the solar for electricity, and a large amount of solar energy is con-verted into heat, which is considered as waste [1]. The waste heat due to solar irradiationwill increase the PV cell temperature above the ambient level, which causes the powerconversion efficiency of the PV cells to reduce at a considerable level [2]. Therefore, thecooling mechanism is sometimes necessary for the PV system [3]. As an alternative to thecooling mechanism, the thermoelectric generator (TEG) with heat sinks arrangements canbe mounted at the backside of the PV panel, which helps to convert the freely available
Sustainability 2021, 13, 3144. https://doi.org/10.3390/su13063144 https://www.mdpi.com/journal/sustainability

Sustainability 2021, 13, 3144 2 of 21
thermal energy into useful electricity. The PV combined TEG hybrid module provides apromising solution for solar thermal energy waste, and it supports the improvement of theoverall system power conversion efficiency [1,4].
The practical TEG is usually fabricated with several thermoelectric elements (TEs) (i.e.,thermocouples), which are operates based on the Seebeck effect [5,6]. The thermocouplesare usually connected in series in a TEG to produce an adequate level of voltage output.Generally, the TEs are mounted between two dielectric ceramic plates for better thermalconductance; one of these plate surfaces is maintained with a low temperature called coldside and another plate with a high temperature named hot side. The TEG can also beused to convert the waste heat energy available freely in various industrial processes andautomobile engines, etc. [7–9]. The uses of TEGs were not progressive in the past due to thelow-efficiency factor. However, the TEGs are selected to generate electricity from low-gratefreely available waste heat where the input to these devices is costless and, therefore, theefficiency is not a major issue [10]. The energy conversion efficiency of TEGs is usuallyaround 5–10% [11]; the efficiency level can be improved by enhancing the electrical and/orthermal performance of the TEs.
Recent research studies have confirmed that the TEG can be used for improving thepower conversion efficiency of the PV array by making use of the waste heat producedaround the PV array due to the incident solar irradiation. For example, the study resultsin [12] confirmed that the PV and TEG combined hybrid energy system with differentstructures provides higher power output, better efficiency and reduced waste heat. Theassessment conducted in [3] based on the commercial data proved that the PV–TEG modulewill improve the system performance compared to the individual PV array. The experi-mental study on the PV–TEG system in [13] for water pumping applications confirmedthat the pump flow rate and motor power output were improved. An unconcentratedhybrid system using PV–TEG was suggested by [14] for agriculture indoor farming. It isdemonstrated that the TEG can change the PV module efficiency in the combined PV–TEGsystem. The hybrid system module proposed by [15] for energy enhancement proved thatthe PV and TEG combined system output power was maximized under different operatingconditions. In addition, the MPPT control technique also has a major role in improving thepower conversion efficiency of hybrid renewable energy systems. MPPT control techniquesare generally employed in renewable energy source-based electric power generation to ex-tract the possible maximum power from the source and thereby improve energy efficiency;the quick and accurate achievement of the MPP will help to minimize the power loses inthe system. Different types of MPP tracking methods have been recommended for vari-ous applications in the literature, for example, the incremental conductance method [16],the hill climbing (HC) technique [17], P&O method [18,19], artificial neural network [20],fuzzy logic control technique [21], fractional open-circuit voltage technique [22], linearextrapolation-based MPPT algorithm [23] and variation-tolerant MPPT technique [24].
In this paper, the fractional order fuzzy logic controller (FOFLC)-based variableincremental conduction MPPT control technique is proposed for extracting the maximumpower from the PV module of the hybrid energy module. The proposed MPPT techniqueis developed to overcome the limitations of conventional techniques, such as slow trackingand fluctuating output around MPP. In this control technique, the FLC uses a variabletracking step size for quickly achieving the MPP based on the PV operating point inthe power versus current (P–I) curve; the larger tracking step size is applied when thePV operating point is not close to the MPP. Suppose the operating point of the PV isapproaching the MPP, then a smaller step size will be used to avoid oscillation in theoutput. In the system configuration, the TEG arranged on the rear side of the PV panelwill utilize the waste heat energy for producing extra electricity. To generate sufficientvoltage and output power, the PV and TEG are connected electrically in series, and therebythe overall energy conversion efficiency of the system is improved. The performance ofthe proposed system is investigated under steady-state and transient thermal conditions.

Sustainability 2021, 13, 3144 3 of 21
The results of the proposed MPPT technique are compared with the classical P&O andFLC-based P&O MPPT techniques.
2. Modeling and Analysis of the PV and TEG2.1. The PV Cell Modeling
The equivalent circuit of the PV model is represented with a current source, diodeand resistor combination, as shown in Figure 1. The current flowing out of a PV cell can beexpressed as
Ipv = Iph − ID (1)
where ID is the diode current in A, and Iph is the photocurrent in A. The PV module isusually produced with series and parallel connected solar cells. The above Equation (1) isrewritten as
Ipv = NpIph −NpIsat
[exp
(q
kTnVpv
Ns
)− 1]
(2)
where Isat represents the reverse saturation current in A; Vpv denotes output voltage in V; q de-notes the charge of an electron in C; k denotes the Boltzmann constant (1.3806 × 10⁻²³ JK−1);T denotes the cell temperature in K; Np and Ns denote the number of the parallel and series-connected PV cells, respectively; and n denotes the diode ideality factor. The Isat is sensitiveto the T, which is expressed as
Isat = Irev
[T
Tref
]3exp
(qekn
[1
Tref− 1
T
])(3)
Iph = [Is + ks(T− Tref)]G
1000(4)
where Tref denotes the standard temperature (300 K) in K, Is denotes the short-circuitcurrent in A at standard temperature, Irev denotes reverse saturation current in A atstandard temperature, e denotes energy in energy gap, ks denotes temperature coefficientin %/K of Is and G denotes the irradiation in w/m2.
Figure 1. The photovoltaic (PV) cell equivalent circuit.
The PV module efficiency was determined using the ratio of the power output to thearea of PV panel absorbing solar irradiation [25]; it is expressed as
ηPV =Ppv
(G×AP)(5)
where Ppv denotes the PV module output power in w and AP denotes the area of cross-section of the PV panel in m2.
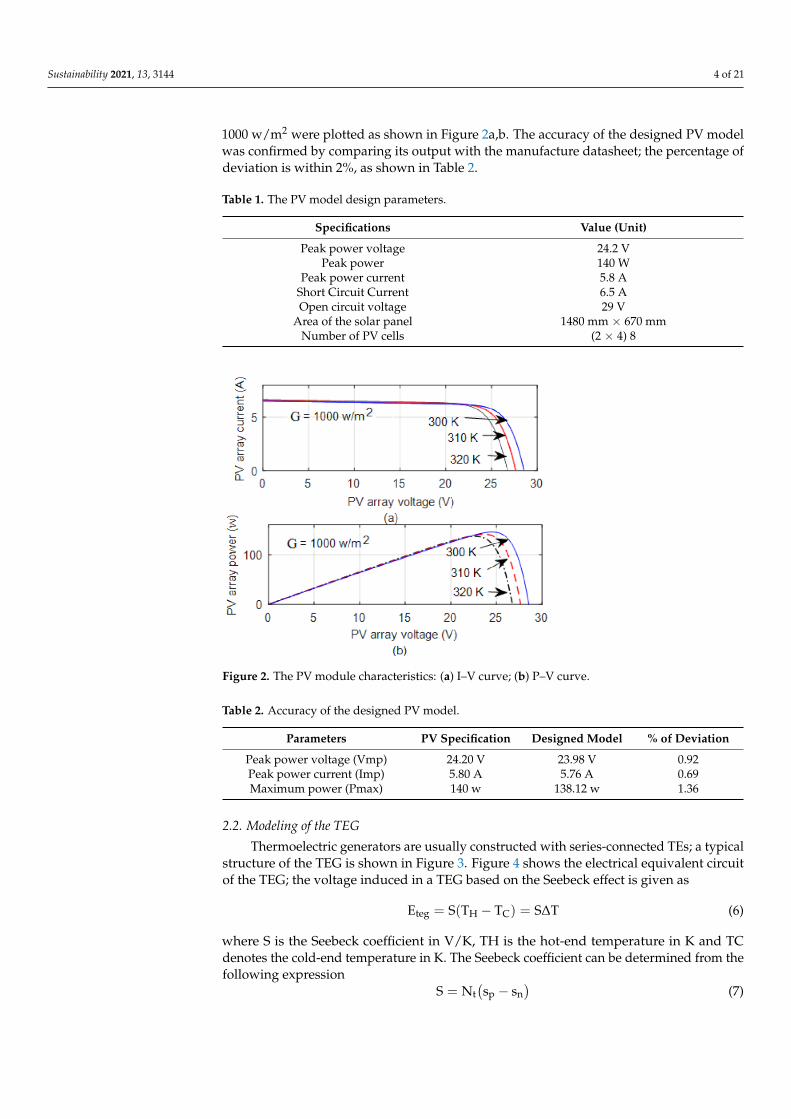
The PV model was developed using MATLAB software based on the aforementionedtheoretical background; the design parameters of the PV model are shown in Table 1. Thedesigned model validation was conducted by verifying the PV cell output characteristics,namely, power versus voltage (P–V) and voltage versus current (I–V). The characteristicsof the designed PV model for the different temperatures with assumed solar irradiation of
Sustainability 2021, 13, 3144 4 of 21
1000 w/m2 were plotted as shown in Figure 2a,b. The accuracy of the designed PV modelwas confirmed by comparing its output with the manufacture datasheet; the percentage ofdeviation is within 2%, as shown in Table 2.
Table 1. The PV model design parameters.
Specifications Value (Unit)
Peak power voltage 24.2 VPeak power 140 W
Peak power current 5.8 AShort Circuit Current 6.5 AOpen circuit voltage 29 V
Area of the solar panel 1480 mm × 670 mmNumber of PV cells (2 × 4) 8
Figure 2. The PV module characteristics: (a) I–V curve; (b) P–V curve.
Table 2. Accuracy of the designed PV model.
Parameters PV Specification Designed Model % of Deviation
Peak power voltage (Vmp) 24.20 V 23.98 V 0.92Peak power current (Imp) 5.80 A 5.76 A 0.69Maximum power (Pmax) 140 w 138.12 w 1.36
2.2. Modeling of the TEG
Thermoelectric generators are usually constructed with series-connected TEs; a typicalstructure of the TEG is shown in Figure 3. Figure 4 shows the electrical equivalent circuitof the TEG; the voltage induced in a TEG based on the Seebeck effect is given as
Eteg = S(TH − TC) = S∆T (6)
where S is the Seebeck coefficient in V/K, TH is the hot-end temperature in K and TCdenotes the cold-end temperature in K. The Seebeck coefficient can be determined from thefollowing expression
S = Nt(sp − sn
)(7)

Sustainability 2021, 13, 3144 5 of 21
where Nt denotes the number of thermocouples; sp and sn denote the Seebeck coefficientsfor p-type and n-type TE, respectively. The voltage, current and power output of the TEGcan be given as
Vteg =
((sp − sn
)× (TH − TC)× RL
(RL − Rint)
)×Nt (8)
I =
(sp − sn
)× (TH − TC)
(RL + Rint)(9)
Pteg = RL ×(sp − sn
)2 × (TH − TC)2
(RL − Rint)2 ×Nt (10)
where RL denotes the load resistance in Ω, and Rint is the TEG internal resistance in Ω. Theinternal resistance of the TEG can be calculated from the following expression
Rint =
(L
σAt+
2LC
σCAC
)(11)
where σ is the electrical conductive of thermocouple in S/m, σC is the electrical conductiveof the copper strip, At is the area of cross-section of TE in m2, AC is the area of cross-sectionof the copper strip in m2, L is the thermocouple length in m and LC is the length of copperstrip in m.
Figure 3. The structure of a typical thermoelectric generator (TEG).
Figure 4. The TEG equivalent circuit.
In this energy conversion process, the TEG collects heat flux at the hot end and releasesthe heat flux at the cold end. During the energy conversion, the Seebeck effect plus twomore effects also take place in the TEG, the Peltier effect causing heat due to the currentflow and the Thomson effect causing heat because of the temperature difference betweentwo ends of the TEG and current flow. However, the Thomson effect is ignored because ofits low impact on the output; the TEG energy equation is expressed as [1]
Qteg = qH − qC (12)

Sustainability 2021, 13, 3144 6 of 21
where qH and qC are the energy at hot and cold ends of the TEG, respectively, which areexpressed as
qH = SITH −1
2σI2 − kt(TH − TC) (13)
qC = SITC +1
2σI2 + kt(TH − TC) (14)
where kt is the thermal conductance of the TEG (w/K); the terms SITH and SITC representthe heat flux at hot and cold ends of the TEG, respectively. The model of the TEG wasdeveloped using the thermal and electrical properties of the thermocouple; the familiarbismuth telluride Bi2Te3-type thermocouple was chosen in the present study. The areasand lengths of p-type TE and n-type TE were assumed to be equal. The temperature-dependent parameters of the Bi2Te3 thermocouple were considered from the datasheetand Qing et al. [26]. The design parameters of the Bi2Te3 thermocouple for the referencetemperature of 300 K are shown in Table 3. The performance of the TEG is usuallydetermined using the figure-of-merit, which is expressed as
ZT =S2σ
KtT (15)
Similarly, the efficiency of TEG was determined by the ratio of the power generatedfor the input thermal energy,
ηteg =Pteg
qH. (16)
Table 3. Design parameters of the TEG module.
Specifications Value
Length (L) 1.6 mmArea (A) 1.4 mm2
Electrical conductivity p-type (σp) 2.18 × 10⁵ S/mElectrical conductivity n-type (σn) 0.825 × 10⁵ S/mThermal conductivity p-type (kp) 1.44 w/mKThermal conductivity n-type (kn) 1.34 w/mK
Seebeck coefficient p-type (sp) 383 µV/KSeebeck coefficient n-type (sn) −634 µV/K
Total Number of thermocouples (Nt) 110
Thermal properties of the p-type and n-type TEs were studied for the temperaturerange of 300 to 450 K, as shown in Figure 5. These characteristic graphs are closely matchedwith the results presented in [27] for the Bi2Te3 thermocouple. Similarly, the electricalproperties of the TEG model were also tested against the temperature difference (∆T) withan assumed total number of thermocouples (Nt) of 110. The voltage and power output ofthe TEG against the varying temperature difference of 0 to 50 K is shown in Figure 6a. Fromthe result, one can understand that the open-circuit voltage (Eteg) of the TEG varies linearlywith ∆T and satisfies Equation (6). Additionally, the output voltage (Vteg) is exactly half ofthe Eteg voltage for the chosen load resistance; RL is equal to the internal resistance (Rint)of the TEG. According to the theory of maximum power transfer theorem, the load willreceive the maximum power when the RL is equal to Rint and the load voltage (Vteg) is halfof the source voltage (Eteg). The proposed TEG model confirmed its electrical performanceby satisfying the maximum power transfer theorem. The power output of the TEG isdirectly dependent on ∆T between the sides (cold and hot) and the connected load at theoutput side. The maximum power output of the TEG was achieved by maintaining anequal load resistance value to its internal resistance of the TEG. The power output (Pteg)generated versus that shown in Figure 6a confirms that the TEG output power variesbased on the temperature difference between the cold and hot ends. The voltage versus

Sustainability 2021, 13, 3144 7 of 21
current (V-I) characteristic of the designed model is demonstrated for the different ∆Tvalues of the TEG in Figure 6b. From the results, it was observed that the voltage output(Vteg) of the TEG is dependent on the temperature difference across the two junctions andconfirms Equation (9). For the given Seebeck coefficient, the high ∆T increased the TEGoutput voltage.
Figure 5. Thermoelectric properties of p-type and n-type thermoelectric elements (TEs): (a) Seebeckcoefficient; (b) thermal conductivity; (c) electric conductivity.

Sustainability 2021, 13, 3144 8 of 21
Figure 6. Electrical characteristics of the TEG: (a) voltage and power output; (b) voltage versus current.
3. The Hybrid PV–TEG Energy Module3.1. Integration of PV with TEG
The hybrid PV–TEG energy module is proposed to convert the maximum irradiationcoming from the sun into electricity. Generally, the PV cells utilize only a partial amountof incident solar irradiation for generating useful electricity, and the larger amount ofirradiation is converted into waste heat energy. Further, the waste heat energy producedon the PV panel increases the cell temperature, which leads to a decrease in the energyefficiency of the PV system. In the proposed system, the TEG with heat sinks is arranged inorder to make use of the waste heat energy for extra power generation and to reduce thePV cell temperature. A typical structure of the PV and TEG combined hybrid module isdepicted in Figure 7. One of the surfaces of the TEG is mounted on the backside; PV arrayrepresents the hot side; the heat sinks are arranged on another surface of the TEG calledthe cold side. The purpose of the heat sink arrangement is to maintain a reasonable level oftemperature difference between the cold and hot sides of the TEG. Additionally, the heatsinks arrangement also helps to reduce the ambient temperature of the PV cells, by whichbetter energy conversion efficiency could be achieved. The overall PV–TEG hybrid systempower conversion efficiency is expressed as follows:
ηPV−TEG =(Ppv + PTEG
)/(G×AP) (17)

Sustainability 2021, 13, 3144 9 of 21
Figure 7. Schematic of a typical hybrid PV–TEG structure.
In the hybrid structure, the PV arrays and TEG can be arranged either in parallel orseries; the parallel connection needs additional power electronic switches, which lead tomore power losses. Alternately, the serial connected PV and TEG have a minimum numberof power electronic switches and minimum power losses.
The performance study of the PV and TEG integrated energy module was conductedunder standard test conditions. In the proposed system configuration, the total efficiency isonly the electrical efficiency since we are not harvesting heat energy for utilization. Theenergy conversion efficiency of the PV system mainly depends on the ratio of electricpower generated to the amount of solar input energy per unit area. The electrical energyconversion efficiency of TEG is based on the input thermal energy at the hot end to theamount of thermal energy emitted at the cold end. In this hybrid structure, the TEG inputis the ceramic absorber plate temperature, and the electrical energy generated by the TEGis the output.
3.2. Performance Analysis of PV–TEG
The feasibility of the hybrid energy module for improving the electrical energy genera-tion from solar energy was confirmed by comparing the performance of the standalone PVwith that of the hybrid PV–TEG system. The performance comparison was conducted forthe assumed solar irradiation of 1000 w/m2, PV temperature of 310 K and temperature dif-ference of 20 K across the TEG. The comparison result is shown in Figure 8; it was observedthat the PV and TEG combined system produced better power output than the standalonePV module. Since the hybrid energy system converted a larger amount of solar irradia-tion into electricity, better power output was achieved. Similarly, the energy conversionefficiency of the PV and hybrid PV–TEG was also studied based on Equations (5) and (17),which was compared with the theoretical efficiency of the PV array for the assumed irradia-tion of 1000 w/m2, as shown in Figure 9. Since the power contribution by the TEG was alsoat a considerable level, the efficiency of the hybrid PV–TEG module was at a reasonablyhigher level when compared to the standalone PV module. Additionally, the theoreticaland study module efficiency comparison for the PV system did not show a significantdifference, which reflects the effectiveness of the designed system. The comparison resultevidently proved that the hybrid PV–TEG system has a higher efficiency, of about 4.5%,than the standalone PV system.

Sustainability 2021, 13, 3144 10 of 21
Figure 8. The output power comparison.
Figure 9. The efficiency comparison.
4. The Proposed FOFLC-Based MPPT Control Technique
MPP tracking techniques are employed for the renewable energy system to harvestthe possible maximum power from the source and thereby increase the energy conversionefficiency. In the current study, the MPP tracking technique was employed for the PV arrayof the hybrid PV–TEG combined energy module; the reason for this choice is explainedin the next section. The variable tracking step size was achieved in the proposed MPPTtechnique by expanding or contracting the universe of discourse (i.e., domain range) of theinput fuzzy variable; the universe of discourse of the fuzzy input was changed dynamicallyusing the fractional factor α. The change in the universe of discourse facilitated theachievement of the variable tracking step size and thereby the quick harvesting of themaximum power from the PV array. For example, if the operating point of the PV isnot closer to the peak point in the P–I curve, then the FLC will use a larger step size toquickly attain the peak point. If the operating point of the PV is approaching the peakpoint, then the FLC will use a smaller step size to produce steady-state output withoutany oscillations. The value for the factor α was assigned between 0 and 1 based on thechange in current (∆I = Ipv − Ipv(t − 1)) of the PV array. The idea of using the fractionalfactor originated from the fractional order differentiator, the recent control strategy usedin various control applications, such as adaptive control, signal processing, active control,

Sustainability 2021, 13, 3144 11 of 21
linear and nonlinear feedback control. Based on the definition of Riemann–Liouville andGrunwald–Letnikov, the general fractional order differentiator is given as [16]
Dαt tn =
fl(n + 1)fl(n + 1− α)
tn−α (18)
where γ denotes function, and α denotes the order of the derivative in the range of 0 < α ≤ 1.When α is 0 < α < 1, then the control scheme will be a fractional order control. Otherwise,if α = 1, the control scheme becomes a conventional integer order control. Therefore, thefractional factor α can be applied in the conventional MPP tracking scheme to enhancethe controller performance. The concept of the fractional order control scheme has beensuccessfully used for different applications in recent years [28–31].
The drawback of the conventional INC tracking technique is that the output fluctuatesaround the MPP, which leads to power losses and a reduction in power conversion efficiency.Hence, the fractional factor combined FLC-based INC method is proposed in this paper toovercome the drawbacks of the conventional INC. In the conventional INC method, theMPP is achieved by meeting any one of the following conditions
dPpv
dIpv= 0 (19)
dIpv
dVpv≈
Ipv − Ipv(t− 1)Vpv −Vpv(t− 1)
= −∆Ipv
∆Vpv(20)
where Ipv and Ppv are the present value of the current and power from the PV array; Ppv(t-1)and Ipv(t−1) are the previous instant value of the current and power from the PV array;dPpv and dIpv are the variations in the power and current at a unit time, respectively.Using the fractional order differentiator of (18), the conventional INC expression (19) canbe modified as
dαPpv
dIαpv= lim
∆I→0
Ppv − αPpv(t− 1)[Ipv − Ipv(t− 1)
]α (21)
dαPpv
dIαpv≈
Ppv − αPpv(t− 1)[Ipv − Ipv(t− 1)
]α (22)
The fractional factor α will change the power and current variation of (22); thisexpression represents the reasonable approximation in fractional order calculus. If α = 1,then (18) will be a general first derivative; suppose 0 < α < 1, then it can be considered asthe fractional order differentiator. Therefore, the fractional order incremental changes ofthe power and current of the PV module are approximated as [16]
dαPpv ≈ Ppv − αPpv(t− 1) (23)
dIαpv ≈[Ipv − Ipv(t− 1)
]α (24)
In the fuzzy logic system, the inputs are converted into suitable linguistic values todevelop the control rules. The two inputs of the classical FLC are defined as
e(t) =Ppv − Ppv(t− 1)Ipv − Ipv(t− 1)
(25)
∆P(t) = Ppv − Ppv(t− 1) (26)
Therefore, for the FOFLC (25) could be modified by including the fractional orderfactor α
e(t) =Ppv − αPpv(t− 1)[Ipv − Ipv(t− 1)
]α (27)

Sustainability 2021, 13, 3144 12 of 21
The error (27) and change in power (26) are the two inputs of the FOFLC. The term α
is assigned with a value between 0 and 1 using the change in current (∆I) of the PV array.Suppose ∆I is zero, then α is set to 1, which confirms that the MPP is achieved. Otherwise,if ∆I is not equal to zero, then α will be 0 < α < 1, which indicates that the MPP is notachieved. According to Equation (27), the fuzzy input variable e(t) will be modified basedon α. Therefore, the smaller α will increase the step size to reduce the time required toreach the MPP. When the operating point approaches the peak level in the P–I curve, thenα will be large (i.e., nearly about 1), then the controller keeps a smaller tracking step size toavoid oscillation. The proposed MPP tracking algorithm is demonstrated through the flowchart, as shown in Figure 10.
Figure 10. Flow chart of the fractional order fuzzy logic controller (FOFLC)-based MPPT control algorithm.
5. Implementation of the Proposed System5.1. The Hybrid PV–TEG System
The schematic of the proposed PV–TEG hybrid system is shown in Figure 11. The PVarray and TEG power ratings were chosen based on the power requirement of the load.Generally, in the hybrid energy system, the MPPT control technique is applied for anyone of the energy modules which contributes more power to the load [13]. In the currentstudy, the PV array was chosen for implementing the MPPT control by considering itsmaximum power contribution from the total output power. A continuous current modeDC-DC converter circuit was used to boost the PV array output. The DC-DC converterdesign was conducted based on the procedure in [32]. The duty cycle for the convertercircuit is the significant factor to extract the possible maximum power under differentoperating conditions. Referring to Figure 11, when the MOSFET switch is ON, the diodeD1 is reverse biased, and the energy will be stored in the inductor L using the PV array

Sustainability 2021, 13, 3144 13 of 21
output during the Toff period. If the MOSFET switch is OFF, the energy available in theinductor will make the current flow to the load via diode D1 for a period Ton. The changesin the duty cycle will modify the output current and voltage. The duty ratio (D) is given by
D =Ton
Ton + Toff(28)
Figure 11. The overall system implementation of the FOFLC-based hybrid PV–TEG module.
A lead-acid battery is also included with charge control switches in the proposedsystem; the battery specifications are shown in Table 4.
Table 4. Battery specifications.
Parameters Value
Nominal voltage 15 VFully charged voltage 17.5 V
Rated capacity 20 AhInternal resistance 0.09 Ω
5.2. Implementation of the FOFLC-Based MPPT Algorithm
In the proposed MPPT control algorithm, the FLC uses two inputs, namely, error e(t)and change in power ∆P(t), defined in (27) and (26), respectively, to generate the outputu(t) using the pre-defined fuzzy control rules. The magnitude of the error input was usedto identify the present operating point of the PV array in the P–I curve, for example, thepositive e(t) confirms that the PV operating point is at the left side of the P–I curve. Supposee(t) is negative, then the operating point is on the right side of the MPP on the P–I curve.If the MPP is achieved, then e(t) is zero. Therefore, the controller uses e(t) to generate thenecessary control action to move the operating point towards the MPP; the justificationfrom the error signal is summarized as follows:
e(t)
− ve; right− side the MPP= 0; at the MPP+ ve; left− side the MPP.
(29)
Similarly, the input of change in the power ∆P(t) sign points out the movement of theoperating point of the PV module in the P–I curve. If e(t) and ∆P(t) inputs are positive,this confirms that the present position of the PV operating point is on the left side, andit is moving towards the MPP in the P–I curve. Hence, there is no need to change theparameters of the PV array to attain MPPT. Alternately, if e(t) and ∆P(t) inputs are negative,this confirms that the present position of the PV operating point is on the right side of thepeak level in the P–I curve, and it is moving away from the MPP. So, the PV current hasto be decreased. Thus, the controller will take appropriate control action using the e(t)

Sustainability 2021, 13, 3144 14 of 21
and ∆P(t) input signals to quickly achieve the MPP; the summary of the control action isillustrated in Table 5.
Table 5. Summary of the control strategy.
Error e(t) Change in Power ∆P(t) Control Action
Positive Positive No changePositive Negative Increase PV current
Negative Positive No changeNegative Negative Decrease PV current
For the FOFLC design, the triangular-type fuzzy membership functions (MFs) wereselected for the inputs and output variables. The fuzzy MFs are represented with linguisticterms; the input MFs are PH: Positive High; PL: Positive Low; ZE: Zero; NL: NegativeLow; NH: Negative High. Similarly, the output MFs are VL: Very Low; LW: Low; ME:Medium; HG: High; VH: Very High. The shapes of the fuzzy MFs used in the present studyare depicted in Figure 12. The control rules for the FOFLC-based MPPT algorithm weredeveloped using the control strategy explained previously, for example, if the error e(t)is negative (i.e., NL or NH), then the output u(t) is small in magnitude to attain the MPPby decreasing the PV array current. Additionally, if the error e(t) is positive (i.e., PH orPL), then the output u(t) is at the maximum to attain the MPP by increasing the PV arraycurrent. Likewise, 25 fuzzy control rules were designed for the present study, which aredepicted in Table 6. The FLC input and output relationship is represented with a surfaceview in Figure 13.
Figure 12. The input and output fuzzy sets: (a) input e(t); (b) input ∆P(t); (c) output u(t).
Table 6. The fuzzy control rules.
u(t)e(t)
NH NL ZE PL PH
∆P(t)
NH VL VL LW ME LW
NL VL LW LW HG ME
ZE LW LW HG ME HG
PL ME ME HG VH VH
PH HG HG VH VH VH

Sustainability 2021, 13, 3144 15 of 21
Figure 13. The fuzzy control rules surface view.
6. Analysis of Results and Discussion
The performance investigation of the proposed FOFLC-based MPPT control techniquefor the hybrid PV–TEG module was conducted using a simulation study. The study resultswere compared with the classical P&O and FLC-based P&O MPPT algorithms to confirmthe advantages of the proposed MPP tracker.
6.1. Hybrid PV–TEG System without Battery Storage
The maximum power extracting ability of the MPPT techniques were investigatedunder different operating conditions for the proposed hybrid PV–TEG energy module. Thepower output from the system using FOFLC, P&O and FLC-based P&O MPPT algorithmsfor step-change in solar irradiation is depicted in Figure 14. The temperature of the PVarray was kept at 310 K, and a temperature difference of 20 K was maintained between thehot and cold sides of the TEG during this investigation. From Figure 14a, the FOFLC-basedMPPT technique exhibited improved performance in tracking the MPP of the PV arraywhen compared to the P&O and FLC-based P&O techniques. It was also observed thatthe proposed MPPT technique accurately tracked the MPP within a short time using thevariable tracking step size, which resulted in the system output power quickly reachingthe maximum level. On other hand, in the conventional P&O method of MPPT, thesystem output had more oscillation and took a long time to attain the final maximumpower level, particularly at the low irradiation level. However, the FLC-based P&OMPPT technique showed a moderate performance in extracting the maximum power withminimum oscillation and a lower time when compared to the conventional P&O method.Therefore, the variable tracking step size used in the proposed FOFLC-based MPPT controltechnique helps to quickly attain the maximum power output and maintain the stableoutput after reaching the maximum power level. However, the conventional P&O MPPTtechnique results are not sufficient for step-change in solar irradiation. The voltage andcurrent flow during this study are shown in Figure 14b. From Figure 14b, it is noticedthat the voltage and current parameters of the system using the conventional P&O-basedMPPT scheme also had oscillation when compared to the other two techniques. Thus,the FOFLC-based MPP tracking method can extract the maximum power within a shorttime and maintains stable output around the MPP. The fast and accurate tracking of theMPP will reduce power losses and thereby improve the energy conversion efficiency ofthe system.

Sustainability 2021, 13, 3144 16 of 21
Figure 14. The hybrid system output for step-change in solar irradiation using different MPPTtechniques: (a) output power; (b) output voltage and current.
The performance of the different MPPT techniques for the step-change in input tem-perature was also verified with a constant irradiation level of 1000 w/m2; the study resultsof the FOFLC, conventional P&O and FLC-based MPP tracking schemes are depicted inFigure 15. The current and voltage outputs of three different MPPT methods for step-change in temperature are shown in Figure 15a; the result clearly demonstrates that theFOFLC-based MPPT technique promptly identified the temperature changes and modifiedthe output accordingly when compared to the other MPPT techniques. The PV–TEG hybridenergy module output power corresponding to this study is illustrated in Figure 15b. FromFigure 15b, it is noticed that the FOFLC-based MPP tracker outperformed in extracting themaximum power for step-change in temperature when compared to other techniques.

Sustainability 2021, 13, 3144 17 of 21
Figure 15. System response for the step-change in temperature using different MPPT techniques:(a) output voltage and current (b) output power.
Additionally, the power harvesting from the PV–TEG hybrid energy module using theMPPT control methods was investigated for the continuous variation in solar irradiationlevel; the investigation results are shown in Figure 16. The results of this study confirmedthat the proposed tracking algorithm can efficiently manage continuous changes in the solarirradiation using the fractional factor and brings the system output to the maximum levelsmoothly without any oscillation. Thus, the performance of the FOFLC-based maximumpower extracting algorithm is comparatively better in identifying the variations in theenvironmental factors and applying the necessary control action to quickly bring the systemoutput to a stable level.

Sustainability 2021, 13, 3144 18 of 21
Figure 16. System power output for the continuous variation in solar irradiation.
6.2. Hybrid PV–TEG System with Added Battery Storage
The usefulness of the proposed PV–TEG hybrid module with FOFLC-based MPPTalgorithm was demonstrated for the battery energy storage application. A lead-acid batterywas added to the system for this study; the system performance was observed with threestages, namely, charging, fully charged and charging and discharging concurrently. Thebattery state of charge (SoC) during these three stages is depicted in Figure 17a; the relatedvoltage and current flow to the battery and load are shown in Figure 17b. In order toobserve the SoC clearly, the initial charge level of the battery was chosen as 99.98%. FromFigure 17b, it is noticed that during the battery charging period, the battery current (IB)magnitude was negative since the battery takes the energy from the source. The batteryvoltage (VB) level increased gradually during the charging time; once the voltage VBreached the maximum level (i.e., SoC is 100%), the IB current became zero. In the secondstage, the SoC was at 100%, and the current IB was zero in this period. To verify the PV–TEGhybrid system power output during the battery discharging conditions, a resistive loadwas connected across the battery, and the battery was allowed to charge as well as deliverpower to the load concurrently. Since the battery receives power continuously from thesource, the SoC and VB levels decreased to a relatively small value and the current IB flowwas also quite low. The load current (IL) and voltage (VL) during this period are shownin Figure 17b. The main purpose of this study is to confirm the level of the power outputfrom the source during these three operation stages. Figure 17c shows the output powerfrom the PV–TEG hybrid system; it was noticed that in all three stages, the system outputpower was almost constant and equal to the maximum power output level. The proposedFOFLC-based MPP tracker correctly adjusts the duty cycle of the DC-DC converter circuitto maintain the maximum power output from the system even for load variations.
Sustainability 2021, 13, x FOR PEER REVIEW 18 of 21
to observe the SoC clearly, the initial charge level of the battery was chosen as 99.98%. From Figure 17b, it is noticed that during the battery charging period, the battery current (IB) magnitude was negative since the battery takes the energy from the source. The bat-tery voltage (VB) level increased gradually during the charging time; once the voltage VB
reached the maximum level (i.e., SoC is 100%), the IB current became zero. In the second stage, the SoC was at 100%, and the current IB was zero in this period. To verify the PV–TEG hybrid system power output during the battery discharging conditions, a resistive load was connected across the battery, and the battery was allowed to charge as well as deliver power to the load concurrently. Since the battery receives power continuously from the source, the SoC and VB levels decreased to a relatively small value and the current IB flow was also quite low. The load current (IL) and voltage (VL) during this period are shown in Figure 17b. The main purpose of this study is to confirm the level of the power output from the source during these three operation stages. Figure 17c shows the output power from the PV–TEG hybrid system; it was noticed that in all three stages, the system output power was almost constant and equal to the maximum power output level. The proposed FOFLC-based MPP tracker correctly adjusts the duty cycle of the DC-DC con-verter circuit to maintain the maximum power output from the system even for load var-iations.
(a)
Figure 17. Cont.

Sustainability 2021, 13, 3144 19 of 21
Figure 17. System performance for the battery energy storage: (a) state of charge; (b) battery andload parameters; (c) system output power.
7. Conclusions
A novel FOFLC-based MPP tracking technique for the hybrid PV–TEG renewableenergy system was proposed. The variable INC method of MPPT control was employedusing the FOFLC for fast and accurate tracking and minimizing the power losses. Themodel of the PV and TEG was developed using the theoretical background; the series-connected PV and TEG energy module was used for investigating the proposed MPPTcontrol scheme. The results of the investigation confirmed that the hybrid energy systemwith the proposed FOFLC-based MPP tracking technique can harvest the maximum poweroutput under varying environmental conditions. Moreover, the MPP tracking ability ofthe proposed MPPT control technique was compared with the conventional P&O andFLC-based P&O tracking techniques; the comparison results proved that the proposedcontrol technique has better performance in terms of speed and accuracy. The fast-trackingand stable output capability of the proposed MPPT technique can reduce the power lossesof the hybrid PV–TEG module, particularly when the system undergoes frequent changesin the solar irradiation. The effectiveness of the proposed hybrid energy system was also

Sustainability 2021, 13, 3144 20 of 21
studied for the battery energy storage application; the results proved that the proposedsystem was always able to supply a constant and enough power output even for the loadvariations. Moreover, the study results of the hybrid PV and TEG integrated energy systemshowed better output power and improved electrical efficiency of about 4.5% higher thanthat of the standalone PV system.
Funding: This research received no external funding.
Institutional Review Board Statement: Not applicable.
Informed Consent Statement: Not applicable.
Conflicts of Interest: The author declare no conflict of interest.
References1. Babu, C.; Ponnambalam, P. The theoretical performance evaluation of hybrid PV-TEG system. Energy Convers. Manag. 2018, 173,
450–460. [CrossRef]2. Attivissimo, F.; Di Nisio, A.; Lanzolla, A.M.L.; Paul, M. Feasibility of a photovoltaic thermoelectric generator: Performance
analysis and simulation results. IEEE Trans. Instrum. Meas. 2015, 64, 1158–1169. [CrossRef]3. Hasanuzzaman, M.; Malek, A.B.M.A.; Islam, M.M.; Pandey, A.K.; Rahim, N.A. Global advancement of cooling technologies for
PV systems: A review. Sol. Energy 2016, 137, 25–45. [CrossRef]4. Ahmet, S.; Kehinde, I.; Bekir, Y.; Abdullah, S. A review on the performance of photovoltaic/thermoelectric hybrid generators. Int.
J. Energy Res. 2020, 44, 3365–3394.5. Meng, J.H.; Zhang, X.X.; Wang, X.D. Characteristics analysis and parametric study of a thermoelectric generator by considering
variable material properties and heat losses. Int. J. Heat Mass Transf. 2015, 80, 227–235. [CrossRef]6. Laird, I.; Lu, D. High step-up DC/DC topology and MPPT algorithm for use with a thermoelectric generator. IEEE Trans. Power
Electron. 2013, 28, 3147–3157. [CrossRef]7. Hsiao, Y.Y.; Chang, W.C.; Chen, S.L. A Mathematic Model of Thermoelectric Module with Applications on Waste Heat Recovery
from Automobile Engine. Energy 2010, 35, 1447–1454. [CrossRef]8. McEnaney, K.; Kraemer, D.; Ren, Z.; Chen, G. Modeling of Concentrating Solar Thermoelectric Generators. J. Appl. Phys. 2011,
110, 074502. [CrossRef]9. Kumar, S.; Heister, S.D.; Xu, X.; Salvador, J.R.; Meisenr, G.P. Thermoelectric generators for automotive waste heat recovery
systems. Part I: Numerical modeling and baseline model analysis. J. Electron. Mater. 2013, 42, 665–674. [CrossRef]10. Wang, P.; Wang, B.L.; Li, J.E. Temperature and performance modeling of thermoelectric generators. Int. J. Heat Mass Transf. 2019,
143, 1145–1153. [CrossRef]11. Kanagaraj, N.; Rezk, H.; Gomaa Behiri, M.R. A variable fractional order fuzzy logic control based MPPT technique for improving
energy conversion efficiency of thermoelectric power generator. Energies 2020, 13, 4531. [CrossRef]12. Lin, J.; Liao, T.; Lin, B. Performance analysis and load matching of a photovoltaic-thermoelectric hybrid system. Energy Convers.
Manag. 2015, 105, 891–899. [CrossRef]13. Ibrahim, N.M.; Rezk, H.; Dahifallah, M.A.; Sergeant, P. Hybrid photovoltaic-thermoelectric generator powered synchronous
reluctance motor for pumping applications. IEEE Access 2019, 7, 146979–146988. [CrossRef]14. Mohd Shatar, N.; Abdul Rahman, M.A.; Muhtazaruddin, M.N.; Shaikh Salim, S.A.Z.; Singh, B.; Muhammad-Sukki, F.; Bani, N.A.;
Saudi, A.S.M.; Ardila-Rey, J.A. Performance evaluation of unconcentrated photovoltaic-thermoelectric generator hybrid systemunder tropical climate. Sustainability 2019, 11, 6192. [CrossRef]
15. Verma, V.; Kane, A.; Singh, B. Complementary performance enhancement of PV energy system through thermoelectric generation.Renew. Sustain. Energy Rev. 2016, 58, 1017–1026. [CrossRef]
16. Lin, C.H.; Huang, C.H.; Du, Y.C.; Chen, J.L. Maximum photovoltaic power tracking for the PV array using the fractional-orderincremental conductance method. Appl. Energy 2011, 88, 4840–4847. [CrossRef]
17. Nzoundja, F.C.B.; Patrice, W.; Martin, K.; Abderrezak, B.; Hyacinthe, T. Real-time experimental assessment of hill climbingalgorithm enhanced by estimating a duty cycle for PV system. Int. J. Renew. Energy Res. 2019, 9, 1180–1189.
18. Fuqiang, C.; Yu, G.; Xiaohong, G.; Xian, Y.; Liangwei, F.; Lin, S.; Xing, H.; Kun, Z.Z.; Chao, W.; Weitao, Z. Fabrication ofnanostructured skutterudite-based thermoelectric module and design of a maximum power point tracking system for thethermoelectric pile. IEEE Sens. J. 2019, 19, 5885–5894.
19. Subudhi, B.; Pradhan, R. A comparative study on maximum power point tracking techniques for photovoltaic power systems.IEEE Trans. Sustain. Energy 2013, 4, 89–98. [CrossRef]
20. Serhat, D.; Nuran, Y.; Ismail, A. A novel MPPT algorithm based on optimized artificial neural network by using FPSOGSA forstandalone photovoltaic energy systems. Neural Comput. Appl. 2018, 29, 257–278.
21. Junaid, K.M.; Lini, M. Fuzzy logic controller-based MPPT for hybrid photo-voltaic/wind/fuel cell power system. Neural Comput.Appl. 2019, 31, 6331–6344.

Sustainability 2021, 13, 3144 21 of 21
22. Montecucco, A.; Knox, A.R. Maximum power point tracking converter based on the open-circuit voltage method for thermoelectricgenerators. IEEE Trans. Power Electron. 2015, 30, 828–839. [CrossRef]
23. Bijukumar, A.; Raam, A.G.K.; Ganesan, S.I.; Nagamani, C. A linear extrapolation-based MPPT algorithm for thermoelectricgenerators under dynamically varying temperature conditions. IEEE Trans. Energy Convers. 2018, 33, 1641–1649. [CrossRef]
24. Kim, J.; Kim, C. A DC–DC boost converter with variation-tolerant MPPT technique and efficient ZCS circuit for thermoelectricenergy harvesting applications. IEEE Trans. Power Electron. 2012, 28, 3827–3833. [CrossRef]
25. Rezania, A.; Sera, D.; Rosendahl, L.A. Coupled thermal model of photovoltaic-thermoelectric hybrid panel for sample cities inEurope. Renew. Energy 2016, 99, 127–135. [CrossRef]
26. Qing, S.; Rezania, A.; Rosendahl, L.A.; Gou, X. An analytical model for performance optimization of thermoelectric generatorwith temperature dependent materials. IEEE Access 2018, 6, 60852–60861. [CrossRef]
27. Chen, M.; Rosendahl, L.A.; Condra, T. A three-dimensional numerical model of thermoelectric generators in fluid power systems.Int. J. Heat Mass Transf. 2011, 54, 345–355. [CrossRef]
28. Kanagaraj, N. Design and performance evaluation of fuzzy variable fractional-order [PI]λDµ controller for a class of first-orderdelay-time systems. Stud. Inform. Control 2019, 28, 443–452. [CrossRef]
29. Tang, S.; Sun, Y.; Chen, Y.; Zhao, Y.; Yang, Y.; Szeto, W. An enhanced MPPT method combining fractional-order and fuzzy logiccontrol. IEEE J. Photovolt. 2017, 7, 640–650. [CrossRef]
30. Yu, K.N.; Liao, C.K.; Yau, H.T. A new fractional-order based intelligent maximum power point tracking control algorithm forphotovoltaic power systems. Int. J. Photoenergy 2015, 2015, 493452. [CrossRef]
31. Ullah, N.; Nisar, F.; Alahmadi, A.A. Closed Loop Control of Photo Voltaic Emulator Using Fractional Calculus. IEEE Access 2020,8, 28880–28887. [CrossRef]
32. Rashid, M.H. Power Electronics Circuits, Devices and Applications, 2nd ed.; Prentice-Hall of India Private Ltd.: New Delhi, India, 2003.
Copyright © 2022 FDOKUMEN