Development of Thermoelectric and Permanent Magnet ...
169
UNIVERSITY OF CALIFORNIA, SAN DIEGO Development of Thermoelectric and Permanent Magnet Nanoparticles for Clean Energy Applications A dissertation submitted in partial satisfaction of the requirements for the degree Doctor of Philosophy in Materials Science and Engineering by Phi-Khanh Nguyen Committee in Charge: Professor Ami Berkowitz, Co-Chair Professor Sungho Jin, Co-Chair Professor Prabhakar Bandaru Professor Renkun Chen Professor Eric Fullerton 2015
-
Upload
khangminh22 -
Category
Documents
-
view
2 -
download
0
Transcript of Development of Thermoelectric and Permanent Magnet ...
UNIVERSITY OF CALIFORNIA, SAN DIEGO
Development of Thermoelectric and Permanent Magnet Nanoparticles
for Clean Energy Applications
A dissertation submitted in partial satisfaction of the requirements for the degree
Doctor of Philosophy
in
Materials Science and Engineering
by
Phi-Khanh Nguyen
Committee in Charge:
Professor Ami Berkowitz, Co-Chair
Professor Sungho Jin, Co-Chair
Professor Prabhakar Bandaru
Professor Renkun Chen
Professor Eric Fullerton
2015

©
Phi-Khanh Nguyen, 2015
All rights reserved.
iii
SIGNATURE PAGE
The dissertation of Phi-Khanh Nguyen is approved, and it is
acceptable in quality and form for publication on microfilm and
electronically:
Co-Chair
Co-Chair
University of California, San Diego
2015
iv
DEDICATION
Dedicated to my mother and father

v
EPIGRAPH
“Materials science is just common sense.”
- Ami E. Berkowitz
vi
TABLE OF CONTENTS
SIGNATURE PAGE ......................................................................................................... iii
DEDICATION ................................................................................................................... iv
EPIGRAPH ......................................................................................................................... v
TABLE OF CONTENTS ................................................................................................... vi
LIST OF ABBREVIATIONS ............................................................................................ ix
LIST OF FIGURES ............................................................................................................ x
LIST OF TABLES ........................................................................................................... xix
PREFACE ......................................................................................................................... xx
ACKNOWLEDGEMENTS ............................................................................................ xxii
VITA ............................................................................................................................... xxv
ABSTRACT OF THE DISSERTATION ...................................................................... xxvi
CHAPTER 1: INTRODUCTION .....................................................................................1
1.1 Clean Energy ......................................................................................................2
1.2 Sustainability and the Rare-Earth Crisis ............................................................7
1.4 References ........................................................................................................10
CHAPTER 2: THERMOELECTRICS .........................................................................11
2.1 Background ......................................................................................................12
2.1.1 Principles.......................................................................................... 12
2.1.2 ZT Figure of Merit ........................................................................... 14
2.1.3 Bulk Nanostructured Thermoelectrics ............................................. 18
2.2 Experimental Procedures .................................................................................20
2.2.1 Sample Preparation .......................................................................... 20
2.2.2 Thermoelectric Measurements & Characterization ......................... 20
vii
2.3 Results and Discussion ....................................................................................23
2.3.1 Enhanced ZT in Bismuth Tellurides ................................................ 23
2.3.2 Spark-Eroded Skutterudite (CoSb3) ................................................. 30
2.4 Conclusions ......................................................................................................36
2.5 Acknowledgements ..........................................................................................37
2.6 References ........................................................................................................38
CHAPTER 3: PERMANENT MAGNETS ....................................................................42
3.1 Background ......................................................................................................43
3.1.1 Principles.......................................................................................... 43
3.1.2 The Maximum Energy Product – (BH)MAX ..................................... 46
3.1.3 Exchange-Spring Magnets ............................................................... 50
3.1.4 Low-Temperature Phase MnBi ........................................................ 52
3.2 Experimental Procedures .................................................................................56
3.2.1 Preparation of High MS Bulk Ingots ................................................ 56
3.2.2 Powder Sample Preparation ............................................................. 57
3.2.3 Rapid Process Sintering (RPS) ........................................................ 59
3.2.4 Magnetic Measurements & Characterization ................................... 61
3.2.5 Magnetic Alignment ........................................................................ 64
3.3 Results and Discussion ....................................................................................67
3.3.1 Bulk MnBi Ingots ............................................................................ 67
3.3.1.1 Bulk MnBi by Chill-Casting ................................................. 68
3.3.1.2 Increased Magnetization by Vacuum Annealing .................. 74
3.3.2 MnBi Particles ................................................................................. 83
3.3.2.1 High Energy Density Particles & Characterization .............. 83
3.3.2.2 Effects of Ball-Milling of Spark-Eroded Powder ................. 91
3.3.2.3 Surface Dead Layer............................................................... 95
3.3.3 Magnetic Alignment ........................................................................ 98
3.3.3.1 Partially-Aligned Compacts by Annealing in a Field ........... 98
3.3.3.2 Crystallization Study ........................................................... 103
3.3.4 Composites (Fe, Co, FeCo) ............................................................ 104
3.3.4.1 Milled Mixtures .................................................................. 104
viii
3.3.4.2 Coated MnBi Particles (Co) ................................................ 111
3.4 Conclusions ....................................................................................................117
3.5 Acknowledgements ........................................................................................119
3.6 References ......................................................................................................120
APPENDIX A: SPARK EROSION ..............................................................................122
A.1 Background ...................................................................................................122
A.2 Setup and Preparation ...................................................................................125
A.3 Operation Optimization.................................................................................130
A.4 Processing and Handling ...............................................................................132
A.5 Effect of Parameters ......................................................................................133
A.6 References .....................................................................................................137
APPENDIX B: MAGNETIZATION EXTRAPOLATION .......................................138
APPENDIX C: TWO-PHASE CURVES .....................................................................139
ix
LIST OF ABBREVIATIONS
BST, bismuth antimony telluride (from Bi-Sb-Te)
EDX, energy-dispersive x-ray spectroscopy
HC, coercive force
Hdm, demagnetizing field
HTP, high-temperature phase (MnBi)
LTP-MnBi, low-temperature phase manganese bismuth
M3T, magnetization in 3 Tesla
Mr, remnant magnetization
MS, saturation magnetization
PM, permanent magnet
PPMS, physical property measurement system
REFPM, rare-earth-free permanent magnet
RPS, rapid process sintering
SEM, scanning electron microscopy
SPS, spark plasma sintering
TB, superparamagnetic blocking temperature
TEM, transmission electron microscopy
VSM, vibrating sample magnetometry
QHTP, quenched high-temperature phase (MnBi)
XRD, x-ray diffraction
XRF, x-ray fluorescent spectroscopy
x
LIST OF FIGURES
Figure 1.1 Historic trend of U.S. energy production by energy source. Trends show a
continuous rise in renewable energy and decline of coal energy ................................ 2
Figure 1.2 Historic trend of U.S. renewable electricity nameplate capacity by source.
Trends show a major increase in wind energy, minor increase in solar energy, and
relatively no change in other renewable energy sources............................................. 3
Figure 1.3 Estimated U.S. Energy Use in 2013 by source and sector as provided by
Lawrence Livermore National Laboratory. The total estimated usage of 97.4 Quads
shows 60.5% wasted energy and 36% energy produced by petroleum. 27.7% of energy
consumed in the U.S. is used for transportation ......................................................... 5
Figure 1.4 Energy diagram for vehicle system with embedded thermoelectrics. A
thermoelectric system converts some of the waste heat produced by the engine into
electricity that can be used for several components within the vehicle ...................... 6
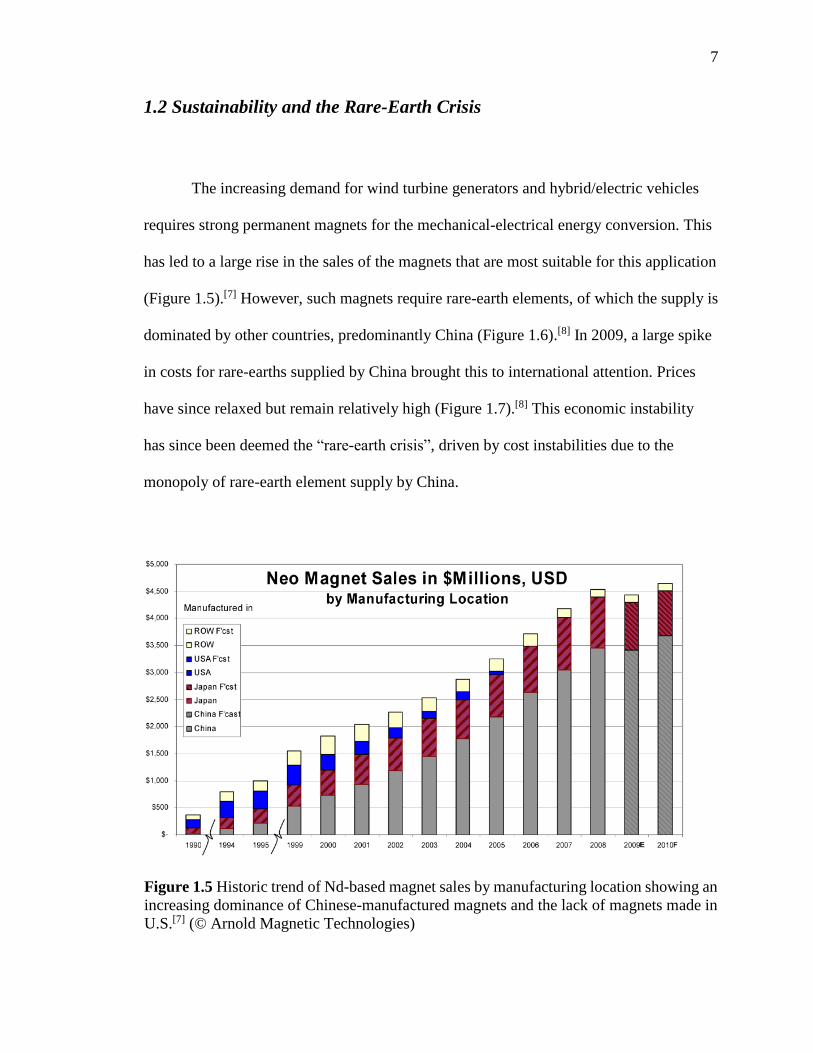
Figure 1.5 Historic trend of Nd-based magnet sales by manufacturing location showing an
increasing dominance of Chinese-manufactured magnets and the lack of magnets
made in U.S. (© Arnold Magnetic Technologies) ...................................................... 7
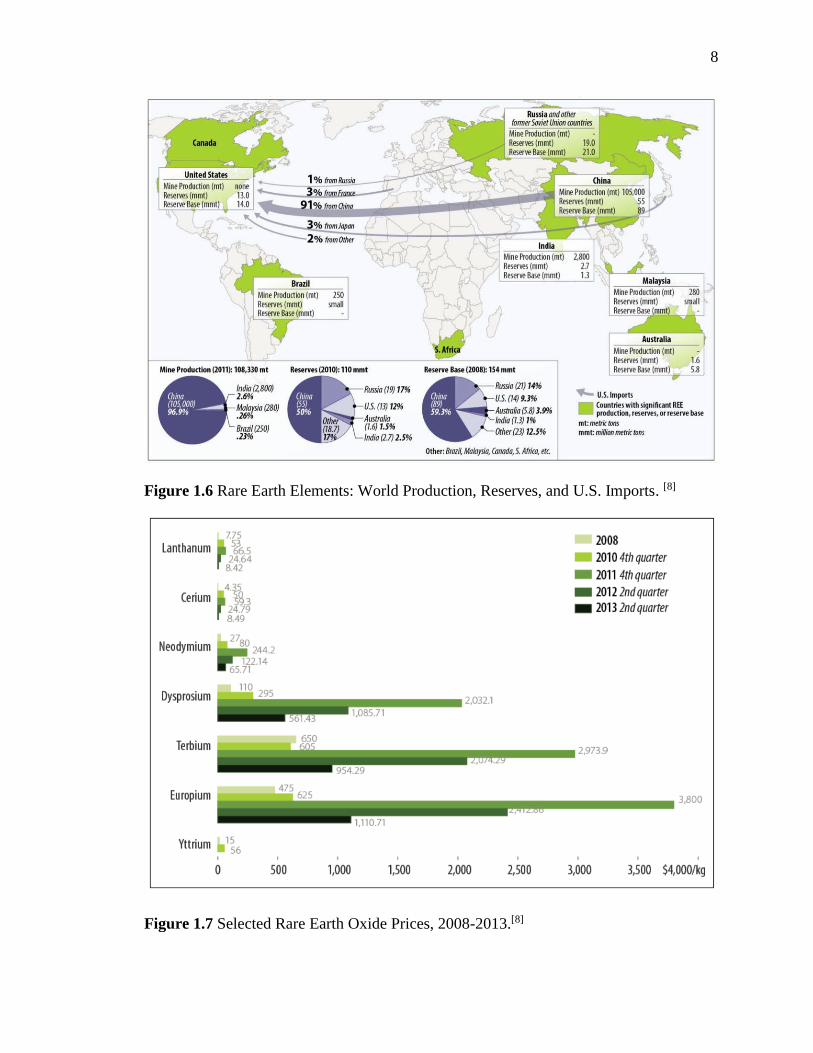
Figure 1.6 Rare Earth Elements: World Production, Reserves, and U.S. Imports ............ 8
Figure 1.7 Selected Rare Earth Oxide Prices, 2008-2013 .................................................. 8
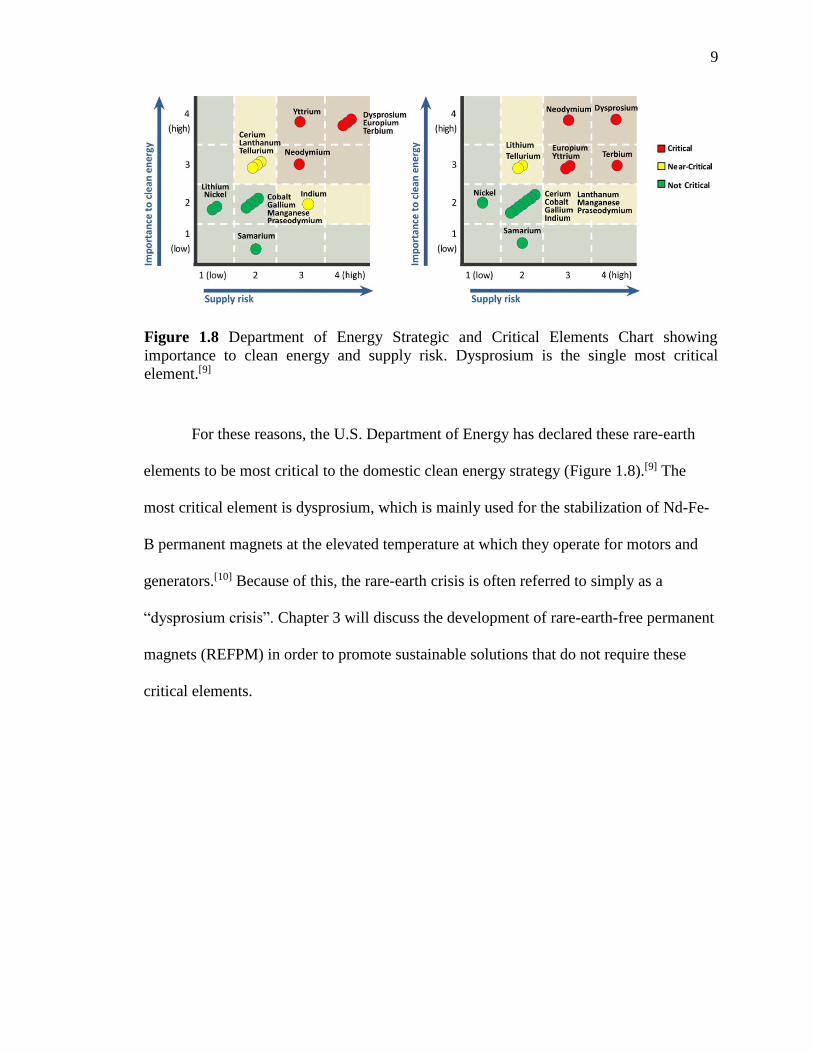
Figure 1.8 Department of Energy Strategic and Critical Elements Chart showing
importance to clean energy and supply risk. Dysprosium is the single most critical
element ........................................................................................................................ 9
Figure 2.1 Schematic illustrations of a thermoelectric device module for (a) power
generation (Seebeck effect) and (b) active refrigeration (Peltier effect). (© Tokyo
Institute of Technology) ............................................................................................ 12
Figure 2.2 Figure of merit, ZT, versus temperature for several conventional p- and n-type
thermoelectric systems .............................................................................................. 14
Figure 2.3 The Seebeck coefficient, electrical conductivity, and electronic and lattice
thermal conductivities, versus carrier concentration showing an optimal electrical
power factor when the carrier concentration is 1 × 1019 cm-3. (© CRC Press) ......... 15
Figure 2.4 By creating nanostructures of a size smaller than the phonon mean free length
but larger than that of the electron, phonon-boundary scattering can be increased while
preserving electron mobility ..................................................................................... 16
xi
Figure 2.5 Thermoelectric measurement orientations as controlled by sample slicing
directions, and the dimensions for the ingot samples and spark-eroded/SPS-sintered
samples ...................................................................................................................... 21
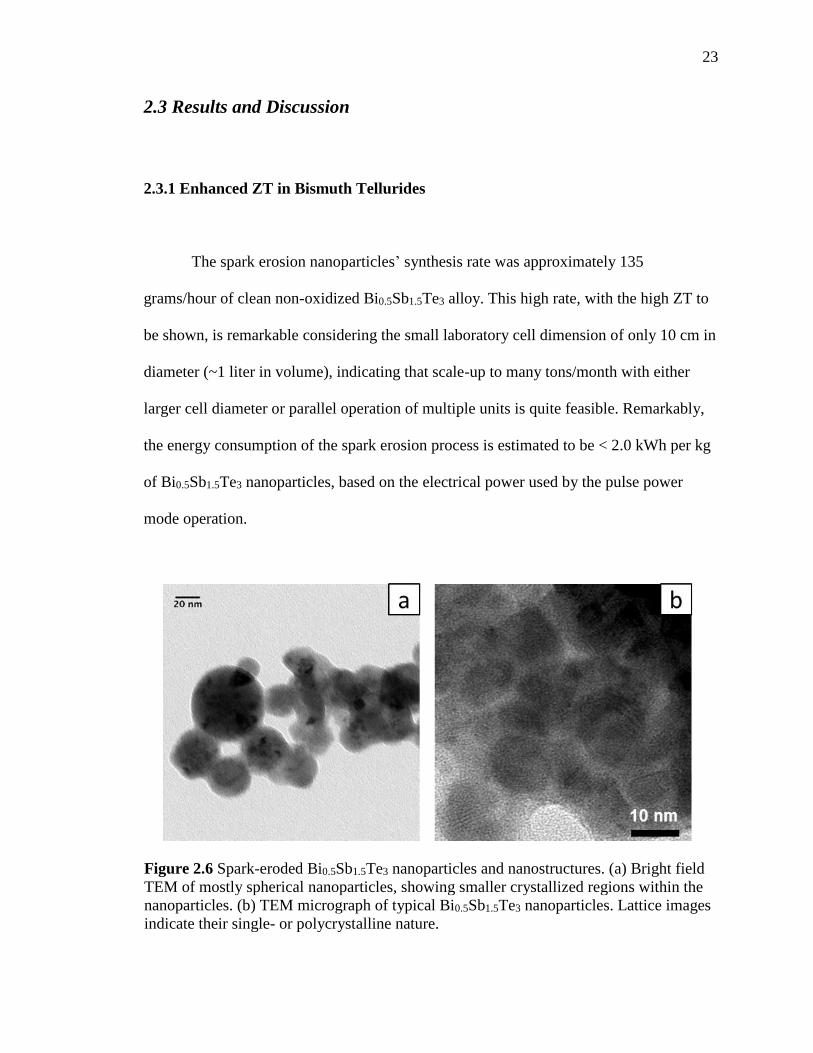
Figure 2.6 Spark-eroded Bi0.5Sb1.5Te3 nanoparticles and nanostructures. (a) Bright field
TEM of mostly spherical nanoparticles, showing smaller crystallized regions within
the nanoparticles. (b) TEM micrograph of typical Bi0.5Sb1.5Te3 nanoparticles. Lattice
images indicate their single- or polycrystalline nature. ............................................ 23
Figure 2.7 SEM images of spark-eroded Bi0.5Sb1.5Te3 particles showing the yield, which
consists of a major fraction of nanoparticles and a minor fraction of micron-sized
particles, albeit with fine structure ............................................................................ 24
Figure 2.8 Particle size distribution of spark-eroded Bi0.5Sb1.5Te3 based on TEM ......... 25
Figure 2.9 TEM micrographs of sections of the SPS sintered compacts made from spark-
eroded Bi0.5Sb1.5Te3 nanoparticles ............................................................................ 26
Figure 2.10 X-ray diffraction patterns with Co radiation of the bulk starting ingot, the <
53 µm spark-eroded powder, and the SPS compact made from that powder, compared
to the standard Bi0.5Sb1.5Te3 XRD pattern shown at the top ..................................... 27
Figure 2.11 Thermoelectric properties of the starting bulk alloy, and the spark-eroded and
SPS-sintered samples, as indicated by their respective markers. (a) electrical
conductivity, (b) Seebeck coefficient, (c) power factor, (d) total thermal conductivity,
(e) lattice thermal conductivity, (f) ZT value ............................................................ 28
Figure 2.12 Comparison of κL versus temperature for various investigations in which
nanostructured Bi0.5Sb1.5Te3 was reported. The similar values indicate that the
mechanism for κL reduction is probably the same .................................................... 29
Figure 2.13 SEM images of spark-eroded Ba0.3Ni0.05Co3.95Sb12 particles showing (a) the
spark-eroded yield and (b) nanoparticle fraction of the yield ................................... 31
Figure 2.14 TEM images of spark-eroded Ba0.3Ni0.05Co3.95Sb12 particles showing 10-40
nm diameter polycrystalline particles. ...................................................................... 31
Figure 2.15 Particle size distribution of spark-eroded Ba0.3Ni0.05Co3.95Sb12 particles
obtained from TEM images showing an average particle size of 25 nm .................. 32
Figure 2.16 XRD pattern of spark-eroded Ba0.3Ni0.05Co3.95Sb12 particles and of the starting
bulk materials obtained by arc-melting ..................................................................... 33
Figure 2.17 Thermoelectric properties of the spark-eroded and SPS-sintered samples under
various SPS conditions. (a) Seebeck coefficient, (b) total thermal conductivity, (c)
electrical conductivity, (d) ZT value ......................................................................... 35

xii
Figure 3.1 The magnetization process of a multi-domain, polycrystalline sample showing
that magnetization first occurs by domain wall motion, then by rotation of the
magnetized domains until saturation magnetization. Upon demagnetization, domain
walls are typically nucleated ..................................................................................... 44
Figure 3.2 The magnetization process of randomly-oriented single-domain particles with
uniaxial crystal anisotropy ........................................................................................ 45
Figure 3.3 M-H and corresponding B-H loops for a typical permanent magnet with a
graphical representation of the maximum energy product, (BH)MAX. (© IEEE) ...... 47
Figure 3.4 Magnetization and induction curves for a Nd-Dy-Fe-B magnet at various
temperatures. The “knee” moves towards the higher fields (more negative) when
coercivity is increased. (© WILEY) .......................................................................... 48
Figure 3.5 Development of permanent magnets in the 20th century, and a visual
comparison of permanent magnets with similar energy densities at room temperature
(each magnet has 100mT field 5mm from the top surface) (© WILEY) .................. 49
Figure 3.6 Maximum energy product and intrinsic coercivity versus temperature for
various permanent magnets showing a general decrease with increasing temperature
(© IEEE) ................................................................................................................... 50
Figure 3.7 Model of an exchange-spring magnet showing the hard/soft interfaces and the
“spring” that forms with the soft magnetization ....................................................... 51
Figure 3.8 Possible configurations for bulk exchange-spring magnets showing a
disordered magnet in which both phases are smaller than the Bloch wall thickness,
soft inclusions within a hard matrix, and alternating soft/hard layers. The striped phase
is the oriented hard phase. (© The American Physical Society) .............................. 52
Figure 3.9 The Mn-Bi phase diagram. (© General Electric Company) ........................... 53
Figure 3.10 The setup for vacuum-annealing showing (a) ingots placed randomly atop a
stainless steel mesh inside a 3 inch diameter high-vacuum chamber, and (b) ingots
mounted on a stainless steel fixture creating separation ........................................... 56
Figure 3.11 Milling setup showing (a) a plastic bottle inserted into a custom aluminum
container for SPEX milling and (b) a welded stainless steel container on a commercial
roller .......................................................................................................................... 57
Figure 3.12 High-frequency ultrasonic probe located inside of a nitrogen glove box (an
argon glove box appeared to cause shorting of the piezoelectric circuit due to arcing).
................................................................................................................................... 58
xiii
Figure 3.13 Schematic of Rapid Process Sintering (RPS) showing a powder sample within
the insulating Macor™ die, pressed with stainless steel pistons through which an AC
current is applied ....................................................................................................... 60
Figure 3.14 Bulk MnBi that has been compacted by RPS from spark-eroded MnBi powder
compared to a U.S. dime. The nominal diameter of the compact is 3/8 inches ........ 61
Figure 3.15 Flow chart for preparing samples for VSM measurements. The samples are
encapsulated in silver foil in order to prevent the particles from oxidizing ............. 62
Figure 3.16 (a) Brass punch and rod used for preparing VSM sample cups. (b) Silver
cup/cap inside of a glass vial .................................................................................... 63
Figure 3.17 Powder x-ray diffraction (XRD) samples. To best prevent oxidation during
measurement, powder samples are sealed in argon using packaging tape. The tape
adds a background peak and causes an overall peak shift due to refraction ............. 64
Figure 3.18 A cold-pressed pellet made from spark-eroded powder compared to pressing
pistons and a U.S. dime. The pellet was made using a custom screw-press tool that
applies an approximated 600 MPa to the powder sample while inside an inert glove
box. The cross section of this fixture is also displayed ............................................. 65
Figure 3.19 The process for orienting spark-eroded MnBi green compacts by directional
crystallization of the amorphous component in a magnetic field ............................. 65
Figure 3.20 Measurement and annealing profile showing magnetization, applied field, and
temperature versus time. A large increase in moment during annealing can be seen.
................................................................................................................................... 66
Figure 3.21 MnBi spark erosion runs plotted by the magnetization of the charge versus
that of the resulting spark-eroded powder for several chill-cast and arc-melted ingots
................................................................................................................................... 67
Figure 3.22 M-H loop of the bulk polycrystalline sample showing MS of 73.5 emu/g at
300 K. The inset shows the low field (100 Oe) region showing HC ≈ 50 Oe ........... 68
Figure 3.23 Cross-sectional optical microscopy images of a chill-cast ingot (a) before and
(b) after annealing showing black precipitates over a dark and light phase. The fraction
of dark phase (LTP-MnBi) increases after annealing ............................................... 69
Figure 3.24 Elemental mapping of the annealed chill-cast ingot by EDX, which aids in
identifying the Mn, Bi, and MnBi phases. For the individual element maps, white
denotes the existence of the element ......................................................................... 70
Figure 3.25 X-ray diffraction pattern of the bulk chill-cast ingot in bulk and powder form
(from mortar and pestle grinding). Large grains in the bulk sample do not provide a
xiv
random enough crystal orientation distribution, and thus MnBi peaks cannot be
detected ..................................................................................................................... 71
Figure 3.26 Optical microscopy image of the LTP-MnBi chill-cast ingot after application
of “Bitter Juice”. The resulting Bitter pattern shows a randomly-oriented, multi-
domain, polycrystalline sample................................................................................. 72
Figure 3.27 M-H loop at 300 K for particles formed by attrition milling of the chill-cast
ingot and the SEM image of this sample .................................................................. 73
Figure 3.28 The complete polished cross-section of the chill-cast ingot. The ingot was
determined to be homogeneous despite an expected temperature gradient from
directional quenching ................................................................................................ 74
Figure 3.29 Photograph of the arc-melted ingot a) before and b) after vacuum-annealing.
After vacuum-annealing, a large mass of Bi is found at the bottom of the annealing
chamber ..................................................................................................................... 75
Figure 3.30 Magnetic properties versus size, annealing time, and sampling position.
Saturation Magnetization of Mn1.1Bi bulk ingots of varying thicknesses, annealing
duration, and measurement location ......................................................................... 76
Figure 3.31 Cross-section of ingot showing Bi preference on one edge. The inset shows
MnBi islands in a matrix of Bi (Bi-rich region of MnBi formed due to blockage of Bi
extraction) ................................................................................................................. 77
Figure 3.32 Diagram of the vacuum-annealing chamber with ingots (a) placed atop a
stainless steel mesh (b) suspended by a fixture made of stainless steel mesh. When
suspended, bismuth can freely flow away from the ingot ........................................ 77
Figure 3.33 The full cross-section of a vacuum-annealed ingot showing little Bi content
but high porosity. ...................................................................................................... 78
Figure 3.34 Depth profile using of the vacuum-annealed ingot obtained by using a digital
optical microscope in which the software detects areas that are in focus. ................ 78
Figure 3.35 Cross-sectional optical microscopy of an arc-melted MnBi ingot, (a) before
and, (b) after vacuum-annealing at 400X magnification. After vacuum-annealing, the
dark phase has increased at the expense of the light phase ....................................... 79
Figure 3.36 Magnetization curves of arc-melted MnBi ingots as-cast (pre-annealed),
annealed in argon, and annealed in high vacuum ..................................................... 80
Figure 3.37 Volume fractions of phases in (a) as-cast, (b) “ideal”, (c) argon-annealed, and
(d) vacuum-annealed ingots ...................................................................................... 82

xv
Figure 3.38 Saturation magnetization of vacuum-annealed ingots for various compositions
before (red) and after (blue) vacuum-annealing. All compositions increase to about 70
emu/g after vacuum-annealing .................................................................................. 83
Figure 3.39 Powder x-ray diffraction patterns for as-sparked and annealed powders.
Annealing greatly enhances the MnBi peaks. ........................................................... 84
Figure 3.40 SEM images of (a) as-sparked powder at low magnification, (b) as-sparked
powder at high magnification, (c) cross-section of a sphere in the as-sparked powder,
(d) cluster of the annealed powder, (e) edge of a platelet produced by milling, and (f)
milled powder at high magnification ........................................................................ 85
Figure 3.41 M-H loops of (a) as-sparked, (b) annealed, and (c) annealed + milled spark-
eroded MnBi powders at room temperature. The annealed and milled powder
demonstrates a (BH)MAX of 3.0 MGOe ..................................................................... 86
Figure 3.42 Transmission electron micrographs of as-sparked particles at (a) lower
magnification and (b) higher magnification, showing lattice fringes ending abruptly,
changing orientation, etc., indicating poor crystallization ........................................ 87
Figure 3.43 Zero-field-cooled and Field-cooled curves for (a) as-sparked and (b) annealed
powders confirming a presence of a very small fraction of superparamagnetic particles
................................................................................................................................... 88
Figure 3.44 Coercive force versus temperature for annealed and milled powders
demonstrating a positive temperature coefficient of coercivity ................................ 90
Figure 3.45 M-H loops for spark-eroded MnBi before and after 19 hours of ball-milling.
Ball milling increases both MS and HC of as-sparked powder .................................. 91
Figure 3.46 XRD Patterns for spark-eroded MnBi before and after ball-milling. Ball-
milling increases the intensity of MnBi peaks .......................................................... 92
Figure 3.47 M-H loops for spark-eroded MnBi annealed, annealed then milled, and milled
then annealed. Ball-milling inherently reduces MS whether performed before or after
annealing. Annealing reduces HC of a milled sample to 1 T, while milling increases
HC of an annealed sample to 2 T ............................................................................... 93
Figure 3.48 SEM images for spark-eroded MnBi (a) annealed then milled, and (b) milled
then annealed. When annealing is the final step, there is evidence of necking ........ 93
Figure 3.49 XRD Patterns for annealed spark-eroded MnBi before and after ball-milling.
Milling broadens peaks and reduces the intensity of MnBi peaks ............................ 94
Figure 3.50 XRD Patterns for annealed spark-eroded MnBi powder that has and has not
been milled. The milled sample has reduced MnBi peaks that could not be restored by
annealing ................................................................................................................... 94
xvi
Figure 3.51 Demagnetization curves for the spark-eroded powders made from vacuum-
annealed ingots, and after annealing, demonstrating generally lower than expected MS
from a starting ingot with MS of 72 emu/g ............................................................... 96
Figure 3.52 Effect on the magnetization of a MnBi particle (diameter) for various "dead"
layer thicknesses (multiples of hexagonal c-lattice parameter) ................................ 97
Figure 3.53 M-H loops of a spark-eroded, cold-pressed MnBi sample before and after
annealing in a 3 T field. The applied field direction for measuring is the same the
annealing field ........................................................................................................... 98
Figure 3.54 XRD pattern of the partially-aligned MnBi compact made from spark-eroded
powder. Key peaks are numbered and labeled as augmented or diminished based on
whether the peak intensity has increased or decreased relative to other peaks when
compared to a randomly-oriented MnBi sample....................................................... 99
Figure 3.55 The MnBi crystal structure showing several atomic planes. The relative
position of the x-ray source is suggested based on the corresponding relative peak
intensity from the XRD pattern ............................................................................... 100
Figure 3.56 M-H loop of spark-eroded, milled, and cold-pressed sample before and after
annealing in 3 T field and at higher temperature. The applied field direction for
measuring is the same as that for annealing ............................................................ 101
Figure 3.57 Parallel vs. perpendicular measurements on a magnetically aligned compact
made from spark-eroded powder that has been milled. The parallel/perpendicular
marker indicates the measurement direction relative to the alignment direction ... 102
Figure 3.58 (a) Magnetization of as-sparked sample in 50 Oe measured as a function of
temperature from 300K to 700 K with a heating rate of 10 K/min. The derivative (b),
and second derivative (c) are shown to accentuate changes in magnetization ....... 103
Figure 3.59 Experimental mixture of annealed, spark-eroded MnBi with 10 wt. % spark-
eroded Fe after ultrasonication in hexane, compared to theoretical mixture .......... 104
Figure 3.60 Ball-milled mixtures of annealed, spark-eroded MnBi powder with Fe, Co,
and FeCo. Fe and FeCo appear to increase MS, while Co decreases MS ................ 105
Figure 3.61 Annealed, spark-eroded MnBi powder mixed with 27 wt % Co nanoparticles
by ball-milling, and compacted by RPS before and after compaction, showing loss of
hysteresis after RPS ................................................................................................ 106
Figure 3.62 Annealed, spark-eroded MnBi powder mixed with 25 wt. % spark-eroded Fe
particles by ball-milling and compacted by RPS before and after compaction, showing
some loss of hysteresis after RPS ........................................................................... 106
xvii
Figure 3.63 Annealed, spark-eroded MnBi powder mixed with 26 wt. % spark-eroded
FeCo particles by ball-milling and compacted by RPS before and after compaction,
showing no loss of hysteresis after RPS ................................................................. 107
Figure 3.64 Annealed, spark-eroded MnBi powder mixed with 25 wt. % spark-eroded Fe
particles by ball-milling and compacted by RPS at different heating rates. The slower
rate appears to have a greater loss of hysteresis...................................................... 107
Figure 3.65 EDX elemental mapping of the MnBi-FeCo ball-milled mixture showing
relative homogeneity at the micron scale ................................................................ 108
Figure 3.66 EDX elemental mapping of the MnBi-FeCo lightly-milled mixture showing a
large particle of FeCo .............................................................................................. 109
Figure 3.67 Ball-milled mixture of spark-eroded MnBi and Fe before and after annealing
in a magnetic field, showing two phases with partial alignment ............................ 110
Figure 3.68 Aligned mixture of spark-eroded MnBi and Fe compared to the RPS compact
of the same mixture, demonstrating the effects of alignment ................................. 110
Figure 3.69 EDX elemental mapping of a MnBi bulk ingot coated with Co by stirring in a
0.25 M CoCl2 ethanol solution for several hours .................................................... 111
Figure 3.70 Annealed spark-eroded MnBi powder before and after ball-milling in a CoCl2
ethanol solution, showing a total loss in hysteresis ................................................ 112
Figure 3.71 Annealed spark-eroded MnBi powder ball-milled with CoCl2 ethanol
solutions of various molarities in glass vials. Larger molarities decrease both Mr and
HC ............................................................................................................................ 113
Figure 3.72 Demagnetization curves for annealed spark-eroded MnBi powder
ultrasonicated in CoCl2 solutions of various molarities. Higher molarities have greater
loss of hysteresis ..................................................................................................... 114
Figure 3.73 Trend of coercivity and magnetization in 3 T for powders ultrasonicated in
CoCl2 solution of various molarities. Both properties are decreased with increasing
molarity ................................................................................................................... 114
Figure 3.74 Mr/M3T for powders ultrasonicated in CoCl2 solution of various molarities.
The decreasing trend is suggests that more soft phase is added at higher molarities
................................................................................................................................. 115
Figure 3.75 M-H loops for spark-eroded MnBi powders stirred in ethanol while CoCl2
solutions of various molarities is slowly introduced by dripping ........................... 116
Figure 3.76 EDX analysis on the MnBi particles mixed with the CoCl2 solution suggests
that the Co replaces Mn .......................................................................................... 116
xviii
Figure A.1 Photograph of the shaker-pot version of spark erosion during a run ........... 122
Figure A.2 Spark-eroded MnBi particle yield after 1 hour in a 4 inch ID glass pot. Rates
of as high as 360 grams per hour have been achieved ............................................ 124
Figure A.3 Spark erosion shaker-pot schematic ............................................................ 125
Figure A.4 Schematic for mounting of spark erosion electrodes showing threaded brass
rods, alternative aluminum clamp, and charge placement ...................................... 126
Figure A.5 Photographs of typical spark erosion charges measured with a ruler .......... 127
Figure A.6 Spark erosion cell (a) filled with charge, and (b) without charge and with
shortened walls to show the exposed electrodes. Brass connectors must be electrically
insulated in order to prevent their spark erosion ..................................................... 128
Figure A.7 Spark erosion shaker-pot setup, model view ............................................... 129
Figure A.8 Spark erosion current waveforms: (a) near ideal and (b) non-ideal distribution
of peak amplitudes. Multiple waveforms can be seen by the “persist” function of the
oscilloscope ............................................................................................................. 130
Figure A.9 Glass cap (a) and clamp (b) for safe boil-off of a cryogenic liquid. The cap,
with a Teflon valve, is a standard glass flange ....................................................... 132
Figure A.10 The effect of the capacitance on the maximum peak current and spark time
duration when aluminum is spark-eroded in various dielectric liquids. Both increase
with capacitance regardless of dielectric medium .................................................. 134
Figure A.11 The spark erosion runs for MnBi as functions of applied voltage and set
capacitance with the circle size representing the peak current or spark time duration
................................................................................................................................. 135
Figure B.1 M3T vs MS for randomly-oriented MnBi samples that were measured from -7
to +7 T showing a linear relationship ..................................................................... 138
Figure C.1 M-H loops of the constituent phases used for reference when modeling the
calculated M-H- loop of a non-interacting two-phase mixture ............................... 139
Figure C.2 Experimental mixture of spark-eroded MnBi with 10 wt. % spark-eroded Fe
by ultrasonication in hexane compared to theoretical mixture (a) before and (b) after
annealing ................................................................................................................. 140
Figure C.3 Ultrasonicated mixture of spark-eroded MnBi with 10 wt. % spark-eroded Fe
measured at elevated temperatures showing two-phase behavior .......................... 141
xix
LIST OF TABLES
Table 2.1 Atomic percent for skutterudite (CoSb3) starting materials and spark-eroded
powder ....................................................................................................................... 34
Table 3.1 Relative fractions of phases in arc-melted MnBi ingots. ................................. 81
Table A.1 Maximum peak currents in amps for various alloys spark-eroded in various
dielectrics liquids when spark-eroded at 200 V and 120 μF ................................... 136
xx
PREFACE
I remember working at Devine’s Pharmacy in Edison, New Jersey as a part-time
store clerk throughout high school. When discussing with one of the pharmacists about
my future direction, I was so confident that nanotechnology was going to change the
world, and I wanted to be a part of this change. I don’t really remember how at that age I
was introduced to “nanotech”, but I think it was from watching Saturday morning
cartoons. It was for this reason that I later decided to pursue a bachelors in materials
science and engineering at Rutgers.
As it turns out, changing the world actually takes quite a lot of time, energy, and
discipline. Hungry to make an impact somehow, I devoted a lot of my efforts into
Engineers Without Borders (EWB), a student organization that seeks to empower third
world countries by implementing sustainable energy solutions. For years, we helped a lot
of people through EWB.
During my third year at Rutgers, life brought me to a major fork in the road where
key decisions regarding my career were to be made. I was studying abroad in
Manchester, United Kingdom when I had to choose between a materials science summer
research internship at UC Berkeley or spending the summer in a Mayan village in
Guatemala to help design a system for bringing potable water to the storm-ravaged
community. It was not with a heavy heart that I picked to go to Berkeley; I had before me
two great choices. While at Berkeley, I did some good work with Jan Seidel and so
formed a good relationship with my advisor at the time, Professor Ramamoorthy Ramesh.
xxi
When I decided to attend UC San Diego for graduate school, I was offered a
position by Professor Sungho Jin to do work on nanostructured thermoelectrics in a joint
collaboration with him and Professor Ami Berkowitz. I consulted with Prof. Ramesh who
informed me that he had been a post-doc of Ami’s and that I should definitely take this
opportunity. In doing so, I worked as part of a collaboration with Samsung, while also
undertaking a part-time project to produce hollow aluminum particles for a small
company. As it turns out, the aluminum project lead to the suggestion of optimizing
parameters in order to achieve a high fraction of nanoparticles at an extraordinarily high
production rate. This discovery was applied to the thermoelectric project, and many of
the successes are reported Chapter 2 of this dissertation.
Having developed the spark erosion technique into a versatile mass-nanoparticle
producing machine, our team was able to secure a DOE ARPA-E grant for producing
magnetic nanoparticles for permanent magnets. I decided to transition into this project
despite my relative lack of interest in magnetism primarily due to the clean energy
implications, and to my loyalty to Ami. This work is reported in Chapter 3 of this
dissertation.
If there is any practical point to this preface other than being a self-promoting
memoir, it’s that it serves as my stark justification for the heavy emphasis on the clean
energy applications of this work. This has always been my reason for all that I’ve done in
my young career – a foolish ambition to make a difference, to change lives, and to do
meaningful work that may one day change the world.
xxii
ACKNOWLEDGEMENTS
The work presented in this dissertation would not have been possible if not for the
administrators, collaborators, teachers, and supporters from whom I’ve learned from and
grown with.
First and foremost, I would like to thank my advisor, Professor Ami Berkowitz,
for his immeasurable contributions to my education and career. Ami is my mentor,
advisor, and collaborator, and I consider him to be the greatest teacher that I’ve ever had.
He has refined all of my experimental practices, influencing my ability to achieve success
in research. The most important things that Ami has taught me were done by example –
confidence, passion, determination, and an unwillingness to settle for mediocrity. I carry
with me these lessons for the rest of life.
I would also like to express my deepest appreciation for Professor Sungho Jin for
giving me my early opportunities at UCSD. He believed in me enough to connect me
with a project, an advisor, and a source of funding. I will not forget that without his
influence, none of this would have been set in motion.
This appreciation is extended to the other great professors who have taught me at
UCSD, especially those who serve on my thesis committee: Professor Renkun Chen,
Professor Eric Fullerton, and Professor Prab Bandaru. Each of these professors have at
least on one occasion welcomed me into their office for consultation and/or advice.
Professor Ken Vecchio, Wayne Neilson, Dr. Chulmin (Edward) Choi, and Dr. Li-
Han Chen have all taught me miscellaneous methods in research and experimentation.
Ray Descoteaux of CMRR has taught me so much that I often refer to him as “Professor

xxiii
Ray”. The useful discussions that I’ve had with Dr. Fred Spada are priceless and have
expanded the limits of my knowledge and wisdom. I appreciate infinitely from these
gentlemen their willingness to help me learn.
Furthermore, I wish to acknowledge those who have taught me how to operate the
equipment used for my graduate research: Ryan Anderson for SEM/EDX, Maribel
Montero for XRF, Phuong Dau, Honghan Fei, and Sanwen (Vince) Chen for PXRD,
Andrea Potocny for DLS, Tae Kyoung Kim for UV-VIS spectroscopy, and Professor
Dave Smith and the microscopy team at ASU for high resolution electron microscopy.
I would also like to extend this appreciation to the helpful administrators who
have aided me throughout my time at CMRR: Betty Manoulian, Kevin Wong, Lauren
Coleman, Julie Matsuda, Kelly Huang, Gabby Tshamjyan, Jonathan Chae, and especially
Iris Villanueva.
I am very grateful to have worked with the brightest: Jeonghoon (David) Kim, my
first collaborator who helped me to adapt to graduate work at UCSD, Chu (Charlie)
Yinghao, Jaeyun Moon, Chin Hung (Isaac) Liu, and especially Young Jin Kim, who
constantly challenges me to improve the quality of my work.
For other collaborators of the work presented in this dissertation, the following is
acknowledged: Chapter 2, in part, is a reprint of the material as it appears in
Nanotechnology, Volume 23, 2012, Phi-Khanh Nguyen, Kyu Hyoung Lee, Jaeyun Moon,
Sang Il Kim, Kyunghan Ahn, Li-Han Chen, Sang Mok Lee, Renkun Chen, Sungho Jin, and
Ami E. Berkowitz. Chapter 3, in part, is a reprint of the material as it appears in Journal of
Applied Physics, Volume 115, 2014, and IEEE Transactions on Magnetics, Volume 49,
xxiv
2013, Phi-Khanh Nguyen, Sungho Jin, and Ami E. Berkowitz. The dissertation author was
the primary investigator and author of these papers.
As the only student in my group, I give special thanks to the students and post-
docs of CMRR who have made my time here special: Sohini Manna, Nasim Eibagi,
Liane Matthes, Jimmy Kan, Jonathan Sapan, Sergio Montoya, Richard Choi, Vojta Uhlir,
Matthias Gottwald, Cihan Kuru, Pablo Salas-Mendez, Tang (Tony) Zhengqiang, Young
Woo Seo, Alex Phan, Chuanwei (John Wayne) Zhang, Youyi Fu, and, of course,
Benjamin Suen.
Lastly, I am forever thankful for the love and support of my truly amazing family:
my mother who has worked tirelessly after fleeing a war-torn nation for the sake of my
future, my father who has instilled in me a passion for science while allowing me the
freedom to pursue my own interests, my brothers, Khanh and Tam, who have always
made me feel smart and special, and finally, my life partner and fiancée, Victoria, with
whom I’ve walked this journey through the long nights, early mornings, erratic hours,
successes, and failures – she is forever the co-author to the greatest things I’ll ever do.
xxv
VITA
2015 Doctor of Philosophy, University of California, San Diego
2012 Master of Science, University of California, San Diego
2010 Bachelor of Science, Rutgers University, New Brunswick/Piscataway
2009 Summer Intern, University of California, Berkeley
2009 Study Abroad, University of Manchester, United Kingdom
2008 Summer Intern, University of California, Riverside
LIST OF PUBLICATIONS
P.-K. Nguyen, S. Jin, A. E. Berkowitz. “MnBi Particles with High Energy Density made
by Spark Erosion”. Journal of Applied Physics, 115, 17A756. (2014)
P.-K. Nguyen, S Jin, A. E. Berkowitz. “Unexpected Domain Behavior in LTP-MnBi”.
IEEE Transactions on Magnetics, 49 3387-3390. (2013)
P.-K. Nguyen, K. H. Lee, J. Moon, S. I. Kim, K. A. Ahn, L. H. Chen, S. M Lee, R. K.
Chen, S. Jin, A. E. Berkowitz. "Spark erosion: a high production rate method for
producing Bi0.5Sb1.5Te3 nanoparticles with enhanced thermoelectric performance".
Nanotechnology 23 415604-415711. (2012)
J. Seidel, W. Luo, S. J. Suresha, P.-K. Nguyen, A. S. Lee, S. Y. Kim, C. H Yang, S. J.
Pennycook, S. T. Pantelides, J. F. Scott, R. Ramesh. "Prominent electrochromism
through vacancy-order melting in a complex oxide". Nature Communications, 3:799 doi:
10.1038/ncomms1799. (2012)
xxvi
ABSTRACT OF THE DISSERTATION
Development of Thermoelectric and Permanent Magnet Nanoparticles
for Clean Energy Applications
by
Phi-Khanh Nguyen
Doctor of Philosophy in Materials Science and Engineering
University of California, San Diego, 2015
Professor Ami E. Berkowitz, Co-Chair
Professor Sungho Jin, Co-Chair
The global trend towards energy efficiency and environmental sustainability has
generated a strong demand for clean energy technologies. Among the many energy
solutions, the work in this dissertation contributes to two strategic goals: the reduction of
fuel consumption in the transportation sector, and the increase of domestic wind power
capacity. The key barriers to achieving these goals are materials challenges. Automobiles
can be made more efficient by thermoelectric conversion of waste heat from the engine
into electricity that can be used to power electrical components in the vehicle. Vehicles
xxvii
can forego petroleum fuel altogether by using electric or hybrid motors. Unfortunately,
the conversion efficiency of current thermoelectric technology is too low to be considered
economically feasible, and the permanent magnets used in electric vehicle motors and
wind turbine generators require critical rare-earth elements that are economically unstable
(often referred to as the “rare-earth crisis”). In order to combat these challenges, a “spark
erosion” technique was utilized for producing nanoparticles that improve thermoelectric
efficiency and contribute to the development of electromotors that do not require rare-
earths.
In Chapter 2 of this dissertation, I describe the utilization of spark erosion for
producing high-quality thermoelectric nanoparticles at a remarkably high rate and with
enhanced thermoelectric properties. The technique was employed to synthesize p-type
Bi0.5Sb1.5Te3 (BST) and n-type skutterudite nanoparticles, using a relatively small
laboratory apparatus, with low energy consumption. The compacted BST nanocomposite
samples made from these nanoparticles exhibit a well-defined, 20 – 50 nm size nanograin
microstructure, and show an enhanced Figure of merit, ZT, of 1.36 at 360 K due to a
reduction in lattice thermal conductivity. The skutterudite nanocomposites also show
reduced thermal conductivity but still require enhancement in the thermoelectric power
factor. Such a technique is essential for providing inexpensive, oxidation-free
nanoparticles required for fabricating high performance thermoelectric devices for power
generation from waste heat, and for refrigeration.
We have investigated the spark erosion of MnBi, a promising rare-earth-free
permanent magnet, and have determined that spark erosion provides the best approach for
producing MnBi particles. The low-temperature phase of MnBi (LTP-MnBi) is an
xxviii
attractive rare-earth free permanent magnet material due it its high uniaxial
magnetocrystalline anisotropy, which produces an unusually high coercivity at the
elevated temperatures required for motor and generators. However, due to the peritectic
Mn-Bi phase diagram and the slow interdiffusion of Mn and Bi below the 350°C phase
change temperature, bulk samples of LTP-MnBi with high saturation magnetization (MS)
have been difficult to achieve.
In Chapter 3, we describe the successful formation of high-purity bulk LTP-MnBi
ingots and spark erosion of this material to produce single-domain particles of MnBi at an
unprecedented rate. The bulk ingots have MS > 90 wt % of LTP-MnBi, and are formed by
chill-casting and by vacuum-annealing of arc-melted ingots. The as-prepared powder
then consists of amorphous, crystalline, and superparamagnetic particles, mostly as
porous aggregates. The major fraction of the powder consists of 20-30 nm particles. A
short anneal crystallizes the amorphous particles producing a high moment, albeit with
HC of only a few kOe. If lightly milled, the agglomerates are broken up and yield an HC
of 1 T and a maximum energy product of 3.0 MGOe.
The particles can be further engineered through milling, annealing, and/or
solution processing in order to produce unique properties that hold promise to achieving
the first bulk permanent magnet that utilizes the exchange-spring principle. In addition,
we have found that due to the amorphous component of the spark-eroded powder, a cold
compact can be magnetically oriented by crystallizing in a magnetic field. This
crystallographic alignment is necessary for further improvement of the magnet energy
density.
1
CHAPTER 1: INTRODUCTION
2
1.1 Clean Energy
Renewable energy technologies have become increasingly popular, more recently
due to the 2000’s oil crisis that saw rise in gas prices throughout the United States. The
acceptance of climate change has also bolstered these technologies, promoting the term
“clean” energy, indicating that the source of energy does not contribute to CO2 emissions,
the primary contributor to the greenhouse effect. The benefits to renewable energy are
environmental-friendliness, sustainability, and domestic energy security.
While popularized by cultural and political forces, renewable/clean energy has
long been considered a long-term plan for gradually moving away from fossil fuels.
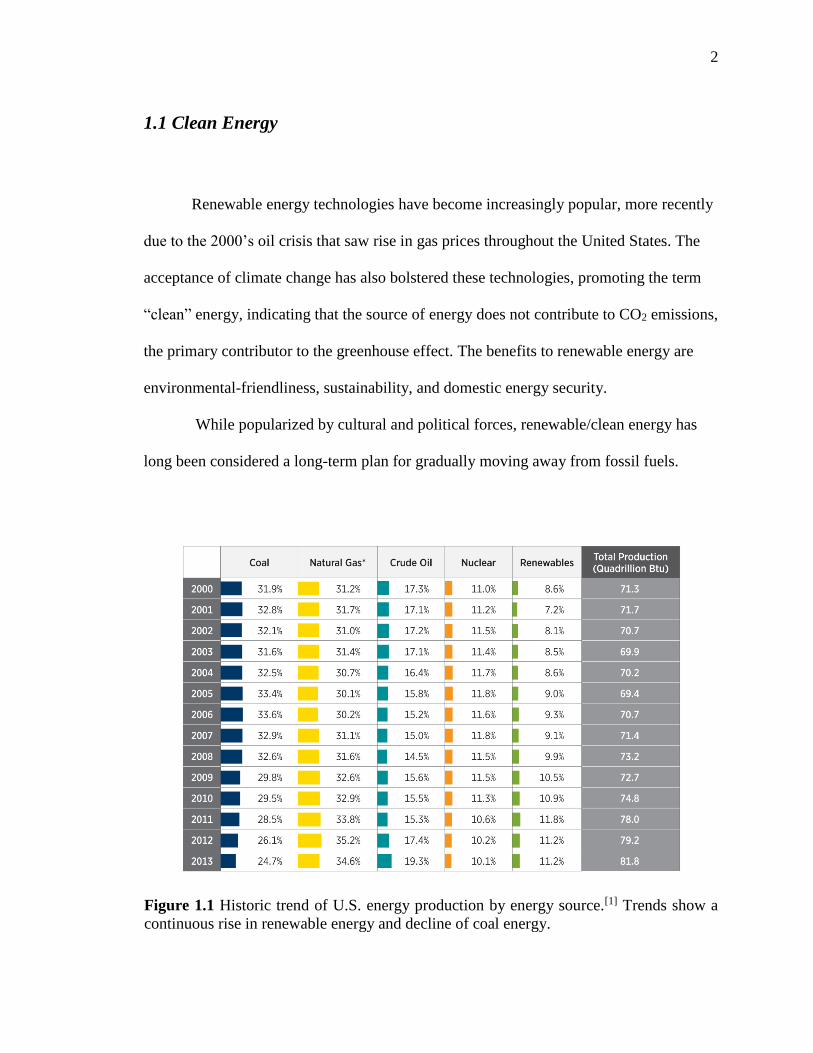
Figure 1.1 Historic trend of U.S. energy production by energy source.[1] Trends show a
continuous rise in renewable energy and decline of coal energy.
3
Historic trends for the production of energy in the United States are shown in
Figure 1.1 for various energy sources.[1] It can be seen here that in the last decade,
renewables are the only energy sources that continuously grow. Coal continuously drops
due to economic competition from natural gas, which gives off fewer emissions.[2] Due to
similar economic forces, the price of crude oil has dropped but has since been rebounding
(at the time of writing this dissertation, the price of gas is half of what is was when I
started my Ph.D. research in 2010). Nuclear energy has fallen overall due to the closure
of 48 nuclear plants in Japan after the Fukushima Daiichi nuclear disaster of 2011.[3]
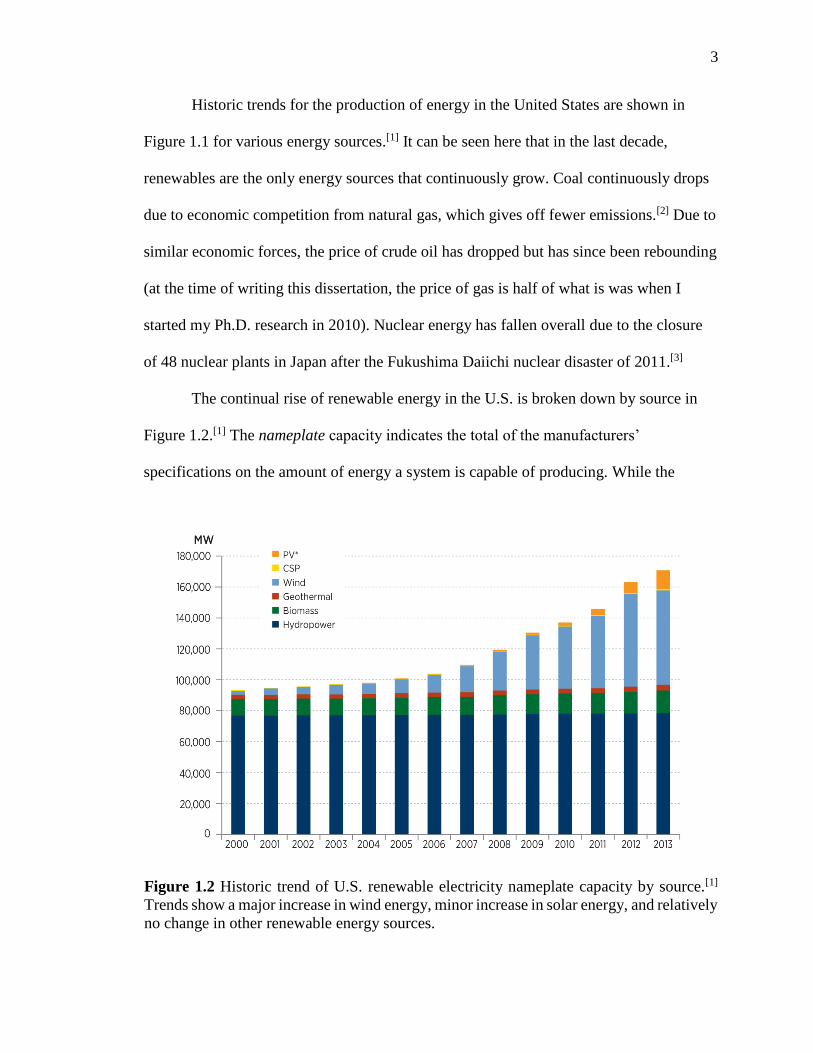
The continual rise of renewable energy in the U.S. is broken down by source in
Figure 1.2.[1] The nameplate capacity indicates the total of the manufacturers’
specifications on the amount of energy a system is capable of producing. While the
Figure 1.2 Historic trend of U.S. renewable electricity nameplate capacity by source.[1]
Trends show a major increase in wind energy, minor increase in solar energy, and relatively
no change in other renewable energy sources.
4
capacity of most renewable sources remains unchanged, wind energy has grown
significantly due to technology maturity, feasibility, geographical favorability, and tax
incentives.[4] For similar reasons, solar energy is also on the rise. The increase in wind
energy capacity requires the use of electric generators. The next section will discuss the
scarcity of materials used in motors/generators and how the work in this dissertation
addresses this sustainability issue in order to assure an energy-secure future that allows
for increased wind generation capability.
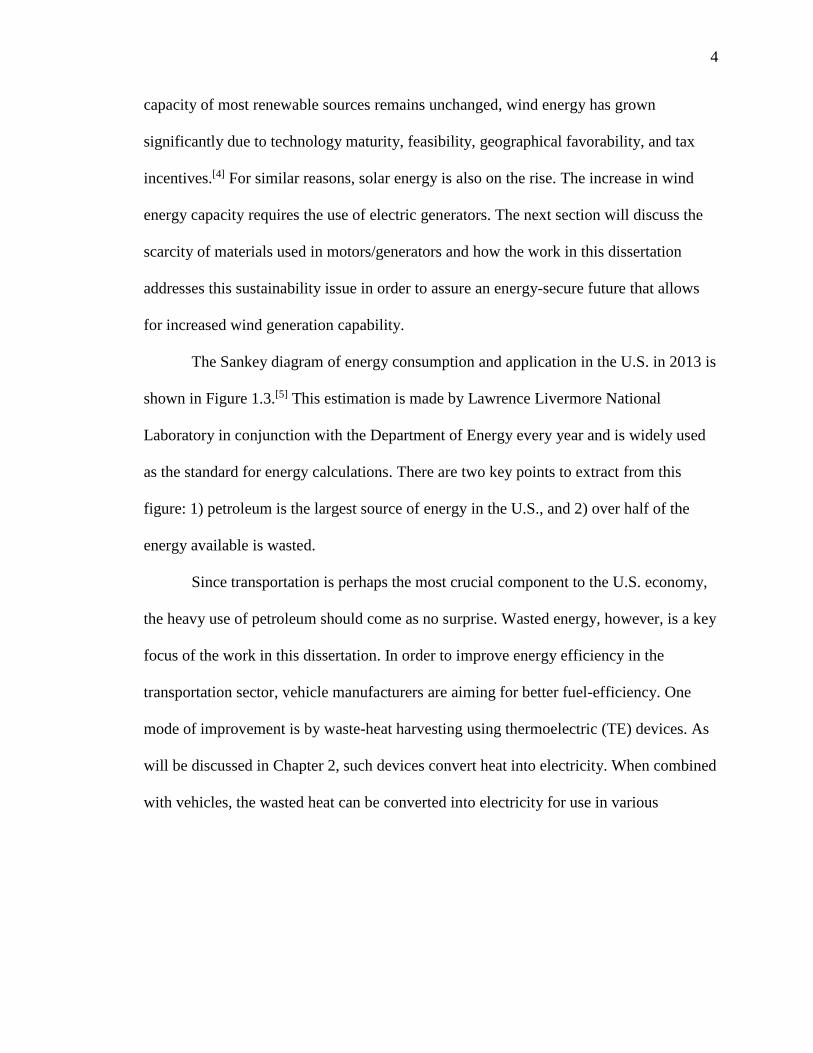
The Sankey diagram of energy consumption and application in the U.S. in 2013 is
shown in Figure 1.3.[5] This estimation is made by Lawrence Livermore National
Laboratory in conjunction with the Department of Energy every year and is widely used
as the standard for energy calculations. There are two key points to extract from this
figure: 1) petroleum is the largest source of energy in the U.S., and 2) over half of the
energy available is wasted.
Since transportation is perhaps the most crucial component to the U.S. economy,
the heavy use of petroleum should come as no surprise. Wasted energy, however, is a key
focus of the work in this dissertation. In order to improve energy efficiency in the
transportation sector, vehicle manufacturers are aiming for better fuel-efficiency. One
mode of improvement is by waste-heat harvesting using thermoelectric (TE) devices. As
will be discussed in Chapter 2, such devices convert heat into electricity. When combined
with vehicles, the wasted heat can be converted into electricity for use in various
5
Fig
ure
1.3
Est
imat
ed U
.S. E
ner
gy U
se in 2
013 b
y s
ourc
e an
d s
ecto
r as
pro
vid
ed b
y L
awre
nce
Liv
erm
ore
Nat
ional
Lab
ora
tory
.[5]
The
tota
l es
tim
ated
usa
ge
of
97.4
Quad
s sh
ow
s 60.5
% w
aste
d e
ner
gy a
nd
36%
ener
gy p
rodu
ced b
y p
etro
leum
. 27.7
% o
f en
erg
y
consu
med
in t
he
U.S
. is
use
d f
or
tran
spo
rtat
ion.
6
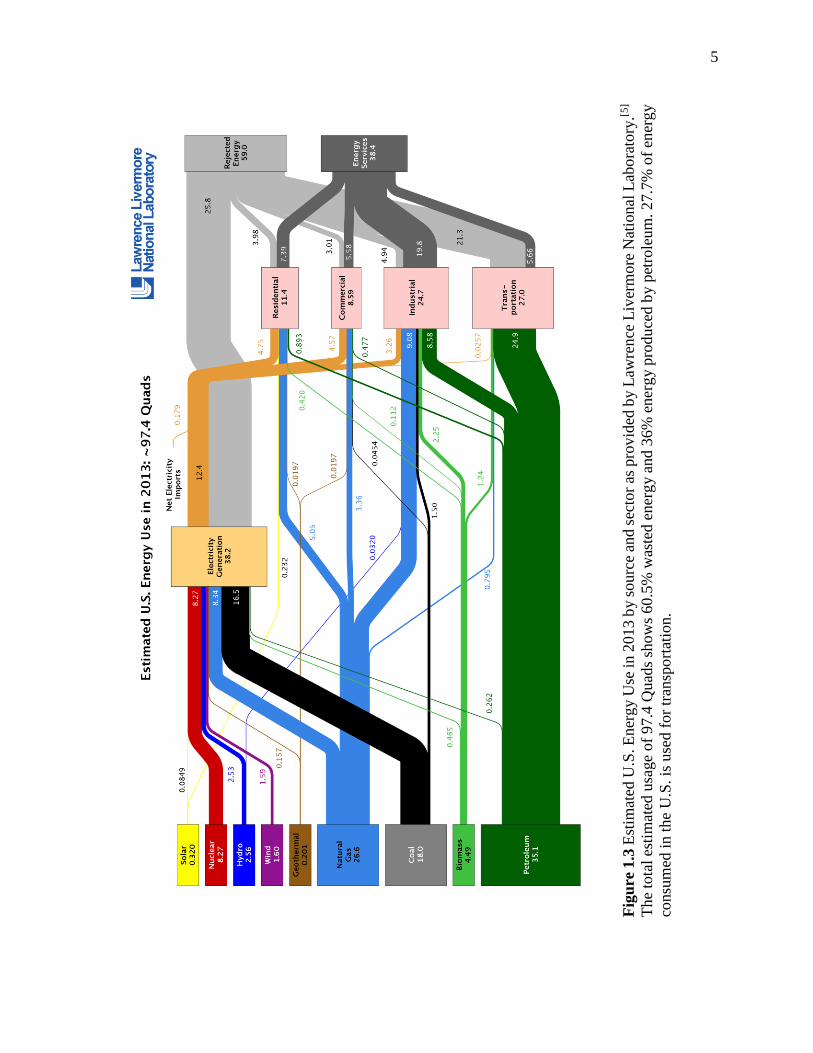
electrical components. The diagram in Figure 1.4 shows a model for waste-heat
harvesting of a vehicle system by using the efficiencies of existing motors and
thermoelectric heat conversion devices.[6] In order for TE devices to be economically
competitive, their conversion efficiencies need to be enhanced. This is the focus of the
work in Chapter 2 of this dissertation. Another way to reduce fuel consumption is by
using hybrid- or all-electric vehicles. Like in wind turbine generators, such vehicles
require the permanent magnet components that will be discussed in Chapter 3.
Figure 1.4 Energy diagram for vehicle system with embedded thermoelectrics. A
thermoelectric system converts some of the waste heat produced by the engine into
electricity that can be used for several components within the vehicle.[6]
7
1.2 Sustainability and the Rare-Earth Crisis
The increasing demand for wind turbine generators and hybrid/electric vehicles
requires strong permanent magnets for the mechanical-electrical energy conversion. This
has led to a large rise in the sales of the magnets that are most suitable for this application
(Figure 1.5).[7] However, such magnets require rare-earth elements, of which the supply is
dominated by other countries, predominantly China (Figure 1.6).[8] In 2009, a large spike
in costs for rare-earths supplied by China brought this to international attention. Prices
have since relaxed but remain relatively high (Figure 1.7).[8] This economic instability
has since been deemed the “rare-earth crisis”, driven by cost instabilities due to the
monopoly of rare-earth element supply by China.
Figure 1.5 Historic trend of Nd-based magnet sales by manufacturing location showing an
increasing dominance of Chinese-manufactured magnets and the lack of magnets made in
U.S.[7] (© Arnold Magnetic Technologies)
8
Figure 1.6 Rare Earth Elements: World Production, Reserves, and U.S. Imports. [8]
Figure 1.7 Selected Rare Earth Oxide Prices, 2008-2013.[8]
9
For these reasons, the U.S. Department of Energy has declared these rare-earth
elements to be most critical to the domestic clean energy strategy (Figure 1.8).[9] The
most critical element is dysprosium, which is mainly used for the stabilization of Nd-Fe-
B permanent magnets at the elevated temperature at which they operate for motors and
generators.[10] Because of this, the rare-earth crisis is often referred to simply as a
“dysprosium crisis”. Chapter 3 will discuss the development of rare-earth-free permanent
magnets (REFPM) in order to promote sustainable solutions that do not require these
critical elements.
Figure 1.8 Department of Energy Strategic and Critical Elements Chart showing
importance to clean energy and supply risk. Dysprosium is the single most critical
element.[9]
10
1.4 References
[1] U.S. Department of Energy, “2013 Renewable Energy Data Book”. NREL,
DOE/GO-102014-4491 (2014).
[2] Center for Climate and Energy Solutions Website. Retrieved February 2015 from
“http://www.c2es.org/energy/source/coal”.
[3] M. Schneider and A. Froggatt, “The World Nuclear Industry Status Report 2014”,
Mycle Schneider Consulting (2014).
[4] U.S. Department of Energy, “2013 Wind Technologies Martket Report”. DOE/GO-
102014-4459 (2014).
[5] Lawrence Livermore National Laboratory, “https://flowcharts.llnl.gov”, U.S.
Department of Energy, LLNL-MI-410527 (2014)
[6] National Renewable Energy Laboratory, “Feasibility of Thermoelectrics for Waste
Heat Recovery in Conventional Vehicles”, NREL/TP-540-44247 (2009).
[7] S. Constantinides, “The Magnetic Material Challenge”, ARPA-E Workshop
Presentation, Rare Earth and Critical Materials, Arlington, VA (2010).
[8] M. Humphries, “Rare Earth Elements:The Global Supply Chain”, Congressional
Research Service, R41347(2013).
[9] U.S. Department of Energy, “U.S. Department of Energy Critical Materials
Strategy December 2011”, DOE/PI-0009 (2012).
[10] O. Gutfleisch, M. A. Willard, E. Bruck, C. H. Chen, S. G. Sankar, and J. P. Liu,
“Magnetic materials and devices for the 21st century: stronger, lighter, and more
energy efficient”, Adv. Mater. 23, 821-842 (2011).
11
CHAPTER 2: THERMOELECTRICS
12
2.1 Background
2.1.1 Principles
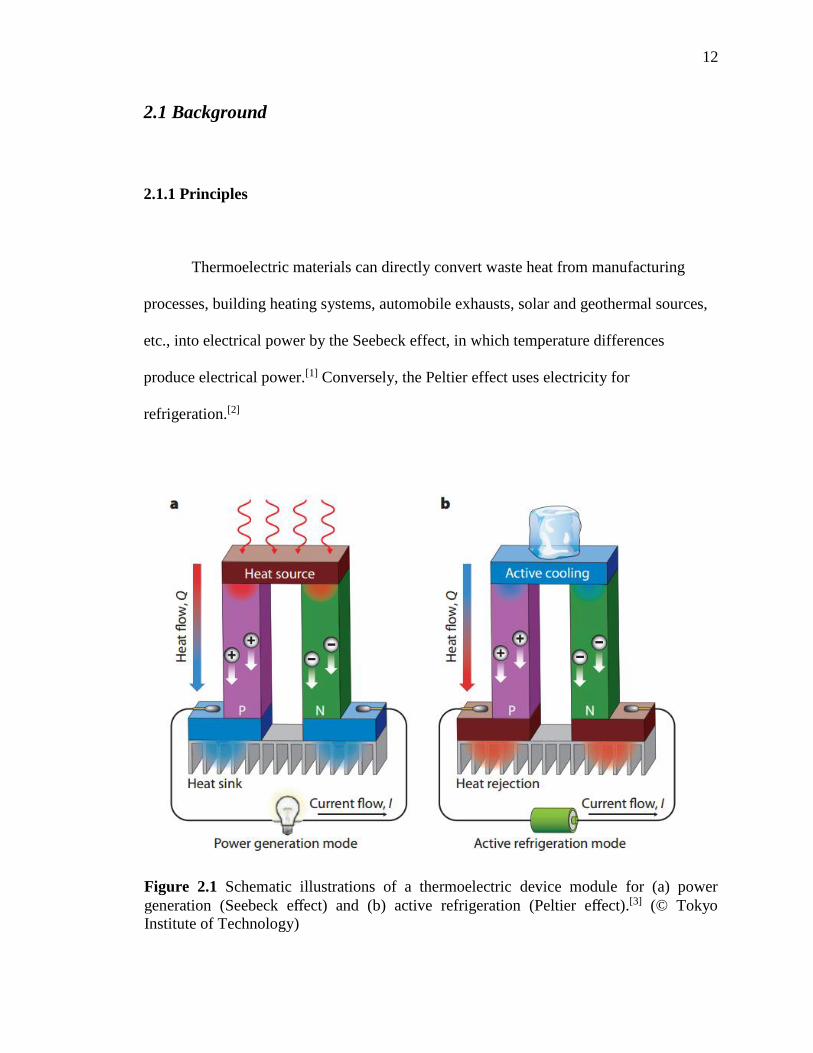
Thermoelectric materials can directly convert waste heat from manufacturing
processes, building heating systems, automobile exhausts, solar and geothermal sources,
etc., into electrical power by the Seebeck effect, in which temperature differences
produce electrical power.[1] Conversely, the Peltier effect uses electricity for
refrigeration.[2]
Figure 2.1 Schematic illustrations of a thermoelectric device module for (a) power
generation (Seebeck effect) and (b) active refrigeration (Peltier effect).[3] (© Tokyo
Institute of Technology)
13
The Seebeck effect relies on the underlying principle of charge carrier diffusion.
In most metals, for example, electrons are constantly in motion throughout the conductive
material. Without a bias, this motion is random, and so the net potential gradient is zero.
When there is a temperature gradient, high-energy electrons diffuse towards the cold end
faster than lower energy electrons diffuse to the hot end. This imbalance forms the
potential difference that is utilized for thermoelectric conversion. The relative voltage
change per temperature difference defines the Seebeck coefficient, S (sometimes denoted
α), which is negative for most metals. Hence, in doped semiconductors where electrons
are the majority charge carriers (n-type), the Seebeck coefficient is also negative.
Likewise, when holes are the majority charge carriers (p-type), S is positive.
A semiconductor thermoelectric device module is depicted in Figure 2.1 showing
the use of the Seebeck and Peltier effects for thermoelectric power generation and
refrigeration, respectively. For both modes, both p- and n-type semiconductors are
required for the continuous flow of charge carriers. For power generation (Figure 2.1a), a
a heat source repels the charge carriers (attracts electrons in a p-type semiconductor and
repels electrons in an n-type). Since the magnitude is dependent on the temperature
difference, a heat sink maximizes the temperature gradient by reducing the temperature
of the cold side. For refrigeration (Figure 2.1b), the current flow forces the charge
carriers to create a temperature gradient, and heat from the hot end is dissipated in order
to actively cool on the cold end.
At present, thermoelectric phenomena has only limited usage for these
applications. The principal reason is the very low conversion efficiency of thermoelectric
devices as compared to the corresponding mechanical systems.
14
2.1.2 ZT Figure of Merit
The ideal thermoelectric material should have a high Seebeck coefficient but also
a high electrical conductivity (low resistivity) in order to reduce joule heating. This,
along with a low thermal conductivity, would aid to maximize the temperature gradient.
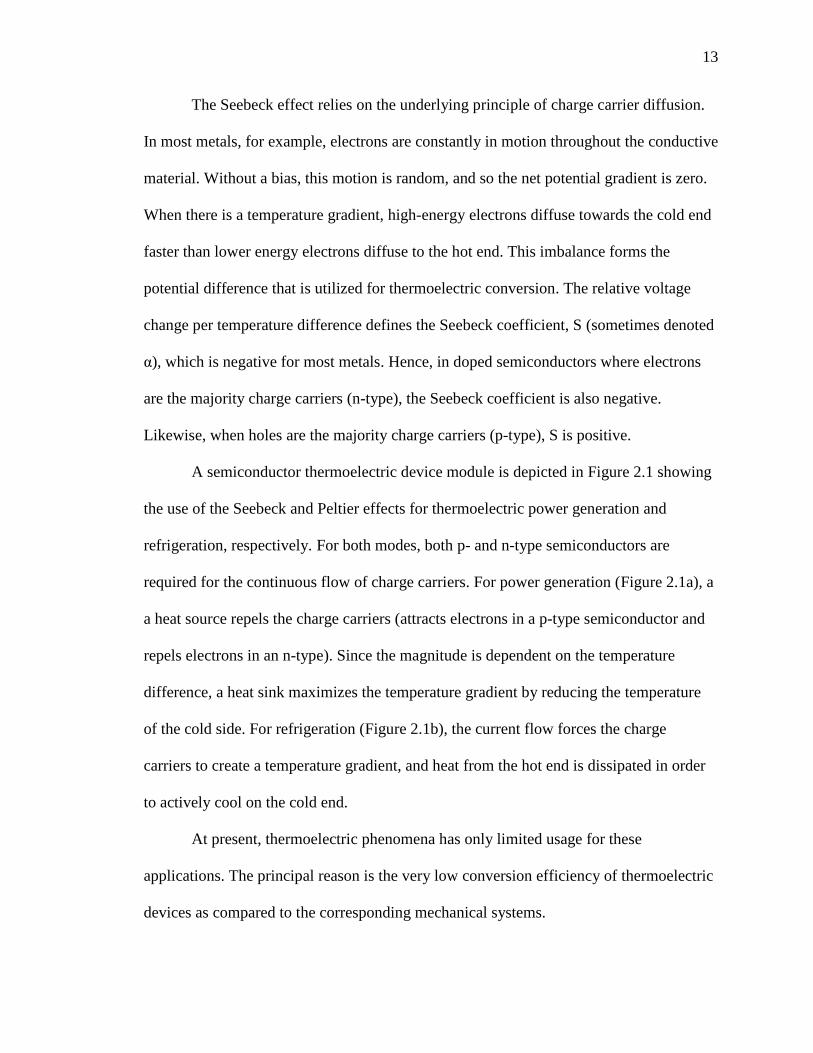
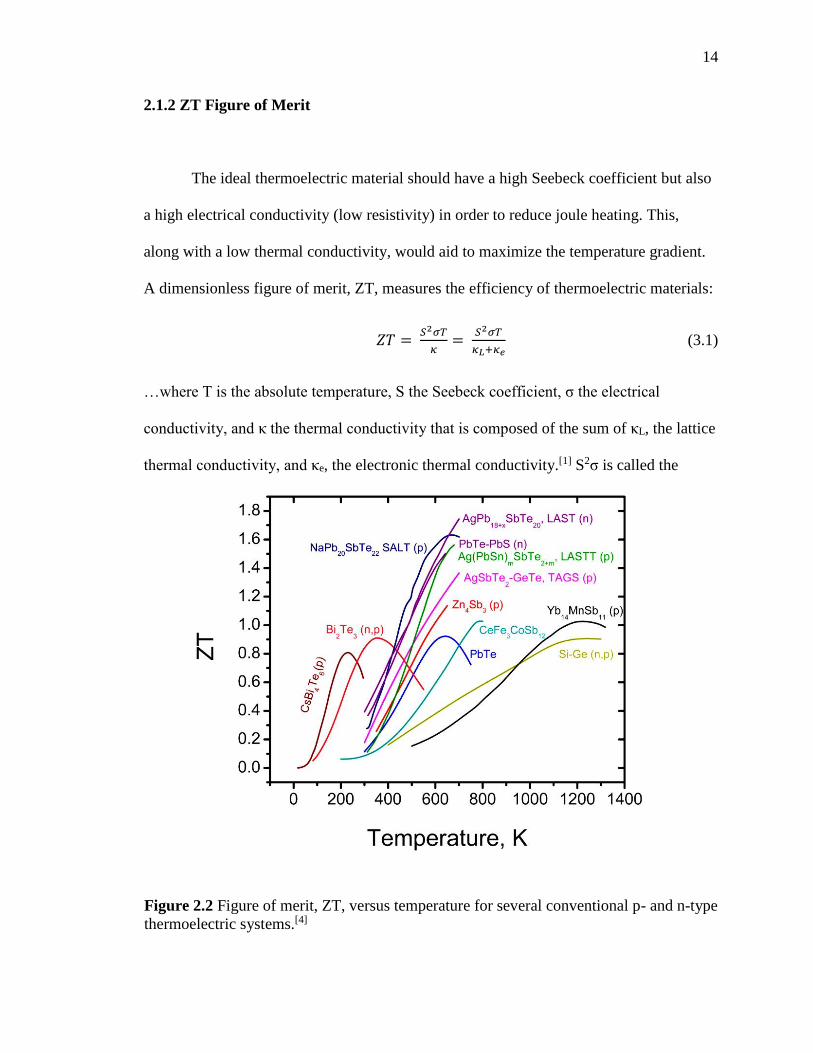
A dimensionless figure of merit, ZT, measures the efficiency of thermoelectric materials:
𝑍𝑇 = 𝑆2𝜎𝑇
𝜅=
𝑆2𝜎𝑇
𝜅𝐿+𝜅𝑒 (3.1)
…where T is the absolute temperature, S the Seebeck coefficient, σ the electrical
conductivity, and κ the thermal conductivity that is composed of the sum of κL, the lattice
thermal conductivity, and κe, the electronic thermal conductivity.[1] S2σ is called the
Figure 2.2 Figure of merit, ZT, versus temperature for several conventional p- and n-type
thermoelectric systems.[4]
15
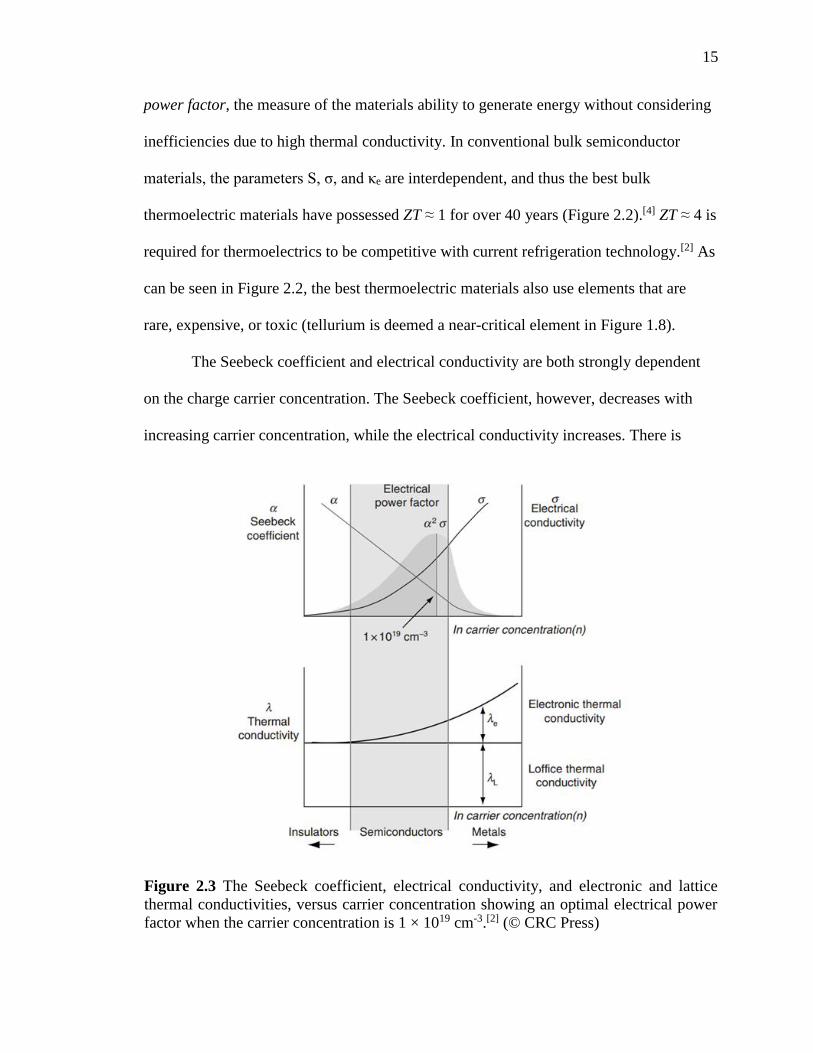
power factor, the measure of the materials ability to generate energy without considering
inefficiencies due to high thermal conductivity. In conventional bulk semiconductor
materials, the parameters S, σ, and κe are interdependent, and thus the best bulk
thermoelectric materials have possessed ZT ≈ 1 for over 40 years (Figure 2.2).[4] ZT ≈ 4 is
required for thermoelectrics to be competitive with current refrigeration technology.[2] As
can be seen in Figure 2.2, the best thermoelectric materials also use elements that are
rare, expensive, or toxic (tellurium is deemed a near-critical element in Figure 1.8).
The Seebeck coefficient and electrical conductivity are both strongly dependent
on the charge carrier concentration. The Seebeck coefficient, however, decreases with
increasing carrier concentration, while the electrical conductivity increases. There is
Figure 2.3 The Seebeck coefficient, electrical conductivity, and electronic and lattice
thermal conductivities, versus carrier concentration showing an optimal electrical power
factor when the carrier concentration is 1 × 1019 cm-3.[2] (© CRC Press)
16
therefore an optimal carrier concentration for a maximum power factor in conventional
thermoelectric materials. This relationship and the optimal carrier concentration of 1 ×
1019 cm-3 is shown in Figure 2.2. It is for this reason that semiconductors make the best
thermoelectric materials – the optimal charge carrier concentration is achieved in
semiconductors.
Since κe is also dependent on the carrier concentration, the only independent
parameter is κL. Thermal conductivity through the lattice is carried by phonons, which are
quantized vibrational modes of the crystal lattice and thus have a group velocity and
mean free length. Reduction of κL depends on the scattering of phonons mainly by
interaction with lattice defects, impurities, grain boundaries, or other phonons. For this
reason, the best thermoelectric alloys in Figure 2.2 contain large atoms.
In order to further reduce ZT, Dresselhaus et al theorized that quantum
confinement could lead to thermoelectrically favorable effects: enhancement of the
density of states near the Fermi energy leading to an enhancement of the Seebeck
coefficient, increased carrier mobilities at a given carrier concentration, different
temperature dependences of the transport properties and intrinsic carrier excitations in
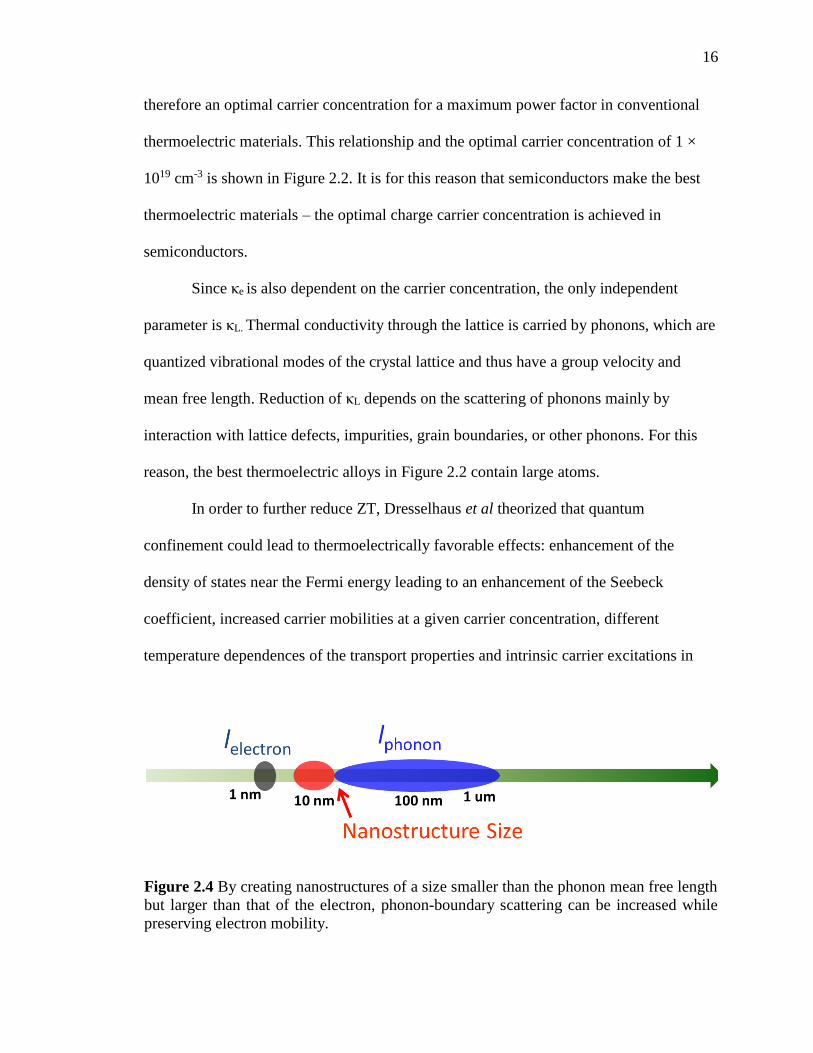
Figure 2.4 By creating nanostructures of a size smaller than the phonon mean free length
but larger than that of the electron, phonon-boundary scattering can be increased while
preserving electron mobility.
17
low dimensional systems relative to 3D systems, and increased boundary scattering of
phonons at the barrier-well interfaces, while effectively preserving carrier mobilities by
exploiting the different length scales for phonon and electron scattering.[5] Since this
report, the field of thermoelectrics has progressed enormously as evidenced by numerous
reports showing enhanced ZT in nanostructured materials[6,7] such as superlattices of
Bi2Te3/Sb2Te3[8] and PbSeTe/PbTe[9], nanowires[10,11], and in bulk materials with complex
structures[12], such as lead antimony silver telluride (LAST)[13] and skutterudites[14]. It is
now recognized that the enhanced ZT values in these nano- or complex-structured
materials are mainly due to reduced lattice thermal conductivity produced by stronger
phonon-boundary scattering in nanostructures.[6,7,5] This approach has been shown to be
quite generic provided that the characteristic nanostructure sizes are smaller than phonon
mean free path in corresponding bulk materials, which is usually dictated by Umklapp
scattering and alloy scattering.
Over the last few years, in search for a more scalable route for making
thermoelectric nanostructures, a new bulk-nanostructuring approach has been developed
and has achieved very notable success.[5,7] This new approach is based on the production
of bulk thermoelectric composites from powders containing nanoparticles and/or high
density of grain boundaries. The key idea of the nanocomposites is to utilize the high
density of grain boundaries to scatter phonons without significantly adversely affecting
the charge transport (Figure 2.4). The fabrication of various nanocomposite materials and
their thermoelectric properties have been reported.[15-32]
18
2.1.3 Bulk Nanostructured Thermoelectrics
Among the reported bulk nanostructure thermoelectrics, the production methods
of the starting thermoelectric powders containing nanoscale features can be generally
categorized into two approaches: top-down[15,17,19,21-24,31,32] and bottom-up[25-30]. For
example, Poudel et al. reported the fabrication of nanocomposite p-type Bi0.5Sb1.5Te3 by
ball-milling the bulk alloys for several hours to nanometer dimensions in inert
environments and hot-pressing these nano-powders to produce the sintered compacts.[19]
They have achieved a high ZT of 1.4 at 100°C. The same groups also reported similar
ball-milling-hot pressing approach for a variety of thermoelectric materials, including n-
type Bi2Te2.7Se0.3[33], n- and p-type SiGe[17,32], n-type Si[24], among others. Another
recently developed approach is melt-spinning ribbons of the appropriate alloy, hand-
grinding them, and compacting them by spark plasma sintering (SPS).[21,22] A similarly
high ZT of ~1.5 at 360 K was observed in these (Bi,Sb)2Te3 nanocomposites. The
comprehensive characterization[21,34] of the samples prepared from the ball-milling and
melt-spinning techniques demonstrated that the low κL and the enhanced ZT were due to
the nanocrystalline domains present. An important economic advantage of hot-pressing
nano-powders is the possibility of preparing net shapes without machining. Besides these
‘top down’ approaches, there have been a growing number of reports showing ‘bottom-
up’ routes for producing Bi-Sb-Te nanostructures by solution processes[25-30]. The latter
approach, although having a great potential for scalability, has yet to demonstrate a ZT
higher than 0.5,{27,28] presumably due to the hindered charge transport or perhaps particle
surface oxidation presented in solution processing.
19
Despite the very important successes of the various nano-bulk composite
approaches, both the top-down and bottom-up methods have disadvantages. Though the
bottom-up approach yields intriguing ZT, the yield of nano-powders for fabricating
compacted samples is still relatively low, and in some cases, the powder fabrication
process itself could be very energy-consuming, which implies high cost. Meanwhile, the
potentially low-cost and scalable ‘bottom-up’ approaches address this issue, but have yet
to demonstrate a ZT comparable to bulk materials. Therefore, a new technique capable of
delivering both advantages would be extremely attractive. Such a technique would
produce clean thermoelectric nanostructures at a significantly improved production rate,
which would also lead to nanostructured bulk composites that demonstrate the high ZT
achieved by the ‘top down’ approaches.
In this chapter, the spark erosion method has been optimized for the production of
nanoparticles of thermoelectric materials. The resultant nanostructured compacts using
spark-eroded Bi0.5Sb1.5Te3 show a high ZT of 1.36 at 360 K, close to the ZT values on
similar alloys prepared by other top-down techniques described above.[19,21] However,
spark erosion offers very significant advantages over these other methods, particularly
with respect to processing efficiency, rate of nano-powder production, and scale-up
potential. Furthermore, since spark erosion requires no crucible, there is no contamination
issue, and oxygen-free processing conditions are readily achieved. Compacts of
Ba0.3Ni0.05Co3.95Sb12 have also been developed in the same manner and show promising
results.
20
2.2 Experimental Procedures
2.2.1 Sample Preparation
High-purity (> 99.999%) Bi, Sb, and Te granules were weighed according to the
composition of Bi0.5Sb1.5Te3 and loaded into a quartz tube 20 mm in diameter. The tube
was vacuum-sealed under 10-4 torr, and the contents were melted and homogeneously
mixed in a rocking furnace for 10 h at 1073 K, then quenched to room temperature. For
the zone-melting, the quenched ingot was directionally grown at a rate of 1 K•min-1.
These ingots were used as spark erosion targets.
For sintered compacts of spark-eroded nanoparticles, disk-shaped bulk samples
(10 mm in diameter and 13 mm in thickness) were fabricated from this powder by SPS
under 90 MPa and at 450°C for 1 min in a vacuum. The sample densities for those
compounds were about 97% of theoretical densities.
Ingots of Ba0.3Ni0.05Co3.95Sb12 were prepared by arc-melting and also used as
spark erosion targets. The sintered compacts were fabricated by SPS under 50 or 40 MPa,
at 650°C or 600°C, and for 5 or 10 min.
2.2.2 Thermoelectric Measurements & Characterization
Disks (10 mm in diameter and 1 mm in thickness) for thermal diffusivity
measurement and bars (2 mm × 2 mm by × mm) for carrier transport properties and
21
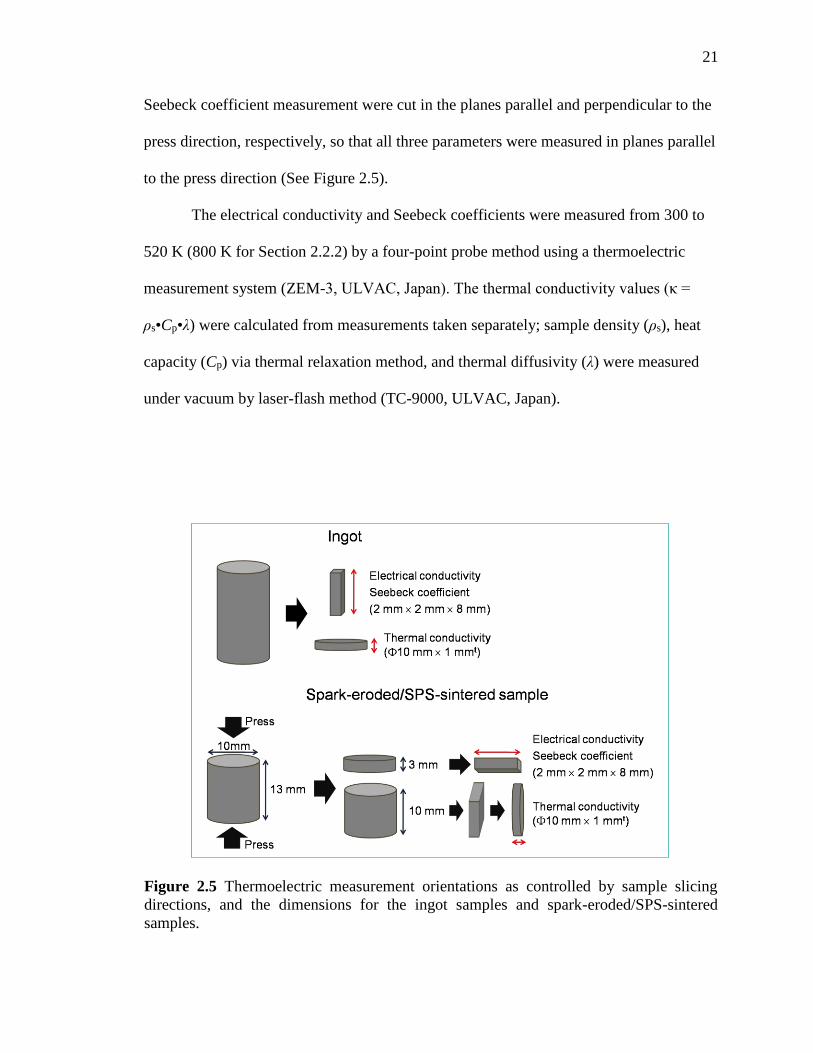
Seebeck coefficient measurement were cut in the planes parallel and perpendicular to the
press direction, respectively, so that all three parameters were measured in planes parallel
to the press direction (See Figure 2.5).
The electrical conductivity and Seebeck coefficients were measured from 300 to
520 K (800 K for Section 2.2.2) by a four-point probe method using a thermoelectric
measurement system (ZEM-3, ULVAC, Japan). The thermal conductivity values (κ =
ρs•Cp•λ) were calculated from measurements taken separately; sample density (ρs), heat
capacity (Cp) via thermal relaxation method, and thermal diffusivity (λ) were measured
under vacuum by laser-flash method (TC-9000, ULVAC, Japan).
Figure 2.5 Thermoelectric measurement orientations as controlled by sample slicing
directions, and the dimensions for the ingot samples and spark-eroded/SPS-sintered
samples.
22
For powder x-ray diffraction, samples were prepared on a glass slide in air and
bound by a mixture of Devcon® Duco Cement and acetone. X-ray diffraction patterns
were measured in a Rigaku Geiger-flex unit with Co radiation in the Bragg-Brentano
mode.
Elemental analysis was performed by direct current plasma emission spectroscopy
(ASTM E 1097-07). Oxygen analysis was performed by inert gas fusion (ASTM E 1019-
08)
23
2.3 Results and Discussion
2.3.1 Enhanced ZT in Bismuth Tellurides
The spark erosion nanoparticles’ synthesis rate was approximately 135
grams/hour of clean non-oxidized Bi0.5Sb1.5Te3 alloy. This high rate, with the high ZT to
be shown, is remarkable considering the small laboratory cell dimension of only 10 cm in
diameter (~1 liter in volume), indicating that scale-up to many tons/month with either
larger cell diameter or parallel operation of multiple units is quite feasible. Remarkably,
the energy consumption of the spark erosion process is estimated to be < 2.0 kWh per kg
of Bi0.5Sb1.5Te3 nanoparticles, based on the electrical power used by the pulse power
mode operation.
Figure 2.6 Spark-eroded Bi0.5Sb1.5Te3 nanoparticles and nanostructures. (a) Bright field
TEM of mostly spherical nanoparticles, showing smaller crystallized regions within the
nanoparticles. (b) TEM micrograph of typical Bi0.5Sb1.5Te3 nanoparticles. Lattice images
indicate their single- or polycrystalline nature.
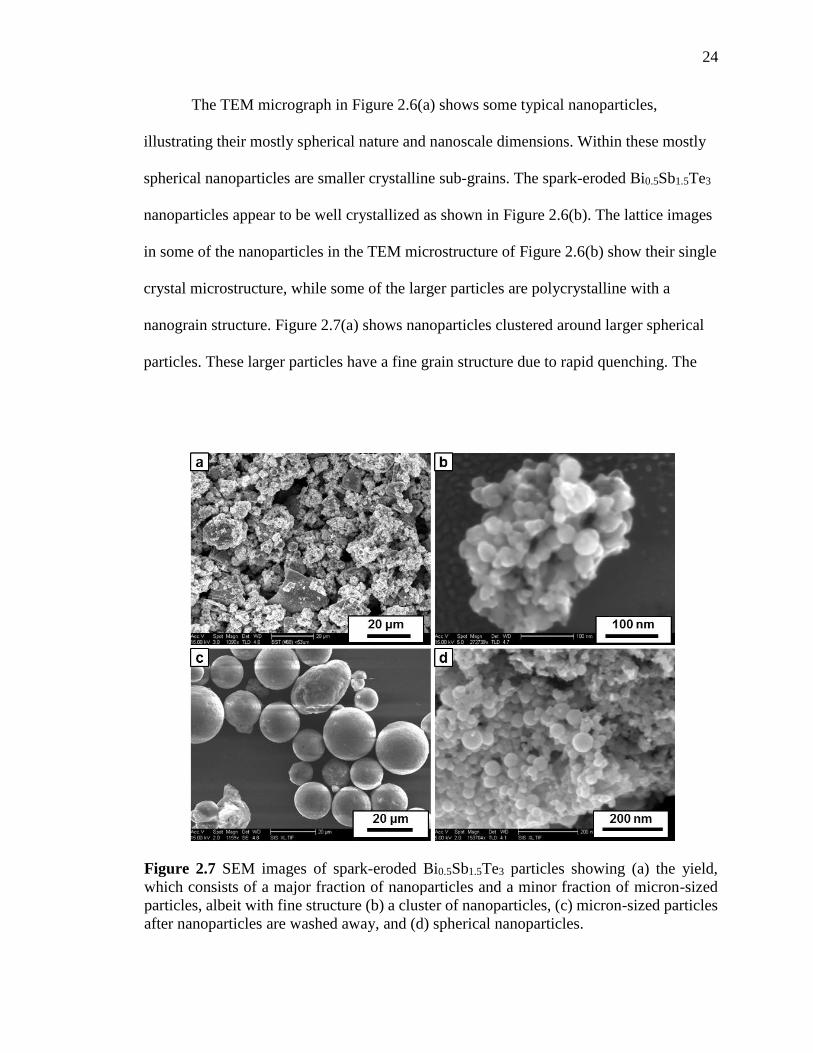
24
The TEM micrograph in Figure 2.6(a) shows some typical nanoparticles,
illustrating their mostly spherical nature and nanoscale dimensions. Within these mostly
spherical nanoparticles are smaller crystalline sub-grains. The spark-eroded Bi0.5Sb1.5Te3
nanoparticles appear to be well crystallized as shown in Figure 2.6(b). The lattice images
in some of the nanoparticles in the TEM microstructure of Figure 2.6(b) show their single
crystal microstructure, while some of the larger particles are polycrystalline with a
nanograin structure. Figure 2.7(a) shows nanoparticles clustered around larger spherical
particles. These larger particles have a fine grain structure due to rapid quenching. The
Figure 2.7 SEM images of spark-eroded Bi0.5Sb1.5Te3 particles showing (a) the yield,
which consists of a major fraction of nanoparticles and a minor fraction of micron-sized
particles, albeit with fine structure (b) a cluster of nanoparticles, (c) micron-sized particles
after nanoparticles are washed away, and (d) spherical nanoparticles.
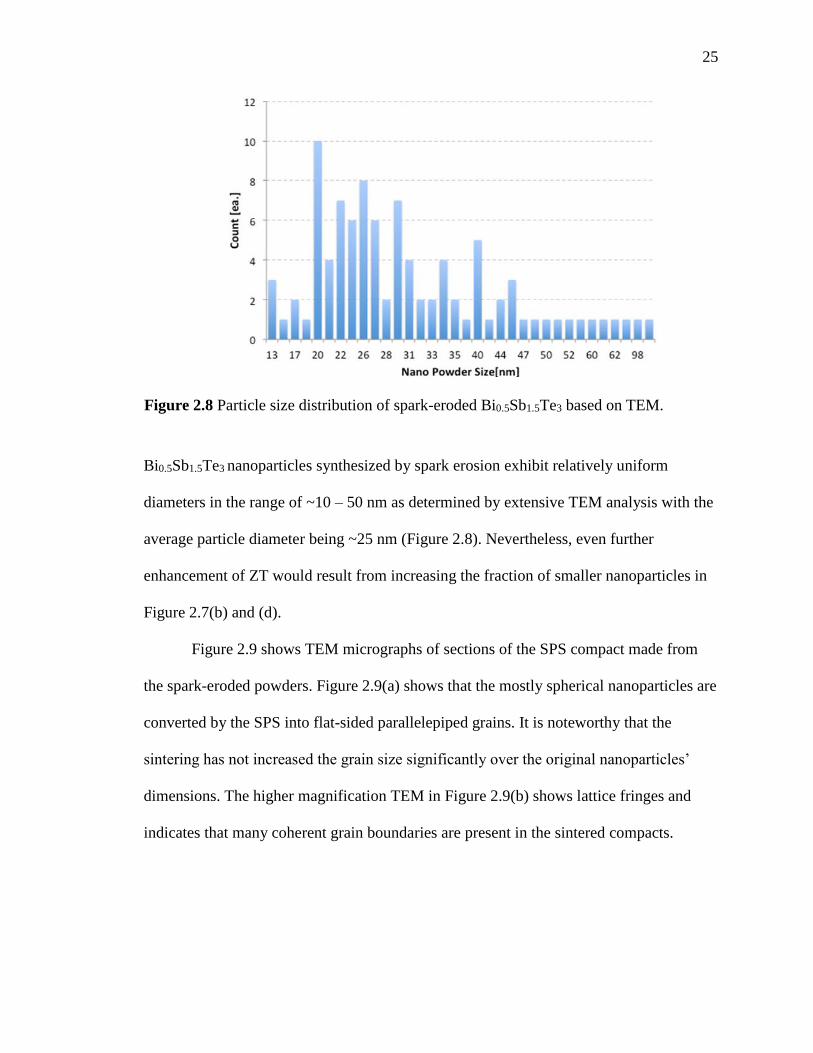
25
Bi0.5Sb1.5Te3 nanoparticles synthesized by spark erosion exhibit relatively uniform
diameters in the range of ~10 – 50 nm as determined by extensive TEM analysis with the
average particle diameter being ~25 nm (Figure 2.8). Nevertheless, even further
enhancement of ZT would result from increasing the fraction of smaller nanoparticles in
Figure 2.7(b) and (d).
Figure 2.9 shows TEM micrographs of sections of the SPS compact made from
the spark-eroded powders. Figure 2.9(a) shows that the mostly spherical nanoparticles are
converted by the SPS into flat-sided parallelepiped grains. It is noteworthy that the
sintering has not increased the grain size significantly over the original nanoparticles’
dimensions. The higher magnification TEM in Figure 2.9(b) shows lattice fringes and
indicates that many coherent grain boundaries are present in the sintered compacts.
Figure 2.8 Particle size distribution of spark-eroded Bi0.5Sb1.5Te3 based on TEM.
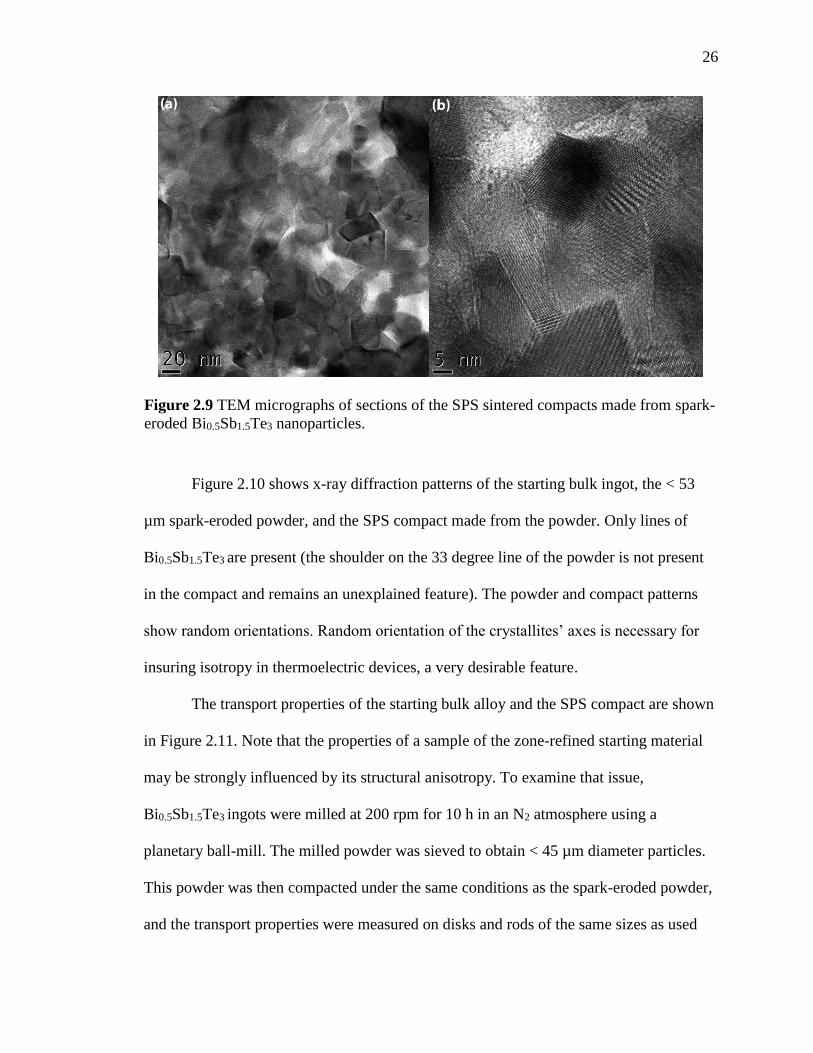
26
Figure 2.10 shows x-ray diffraction patterns of the starting bulk ingot, the < 53
µm spark-eroded powder, and the SPS compact made from the powder. Only lines of
Bi0.5Sb1.5Te3 are present (the shoulder on the 33 degree line of the powder is not present
in the compact and remains an unexplained feature). The powder and compact patterns
show random orientations. Random orientation of the crystallites’ axes is necessary for
insuring isotropy in thermoelectric devices, a very desirable feature.
The transport properties of the starting bulk alloy and the SPS compact are shown
in Figure 2.11. Note that the properties of a sample of the zone-refined starting material
may be strongly influenced by its structural anisotropy. To examine that issue,
Bi0.5Sb1.5Te3 ingots were milled at 200 rpm for 10 h in an N2 atmosphere using a
planetary ball-mill. The milled powder was sieved to obtain < 45 µm diameter particles.
This powder was then compacted under the same conditions as the spark-eroded powder,
and the transport properties were measured on disks and rods of the same sizes as used
Figure 2.9 TEM micrographs of sections of the SPS sintered compacts made from spark-
eroded Bi0.5Sb1.5Te3 nanoparticles.
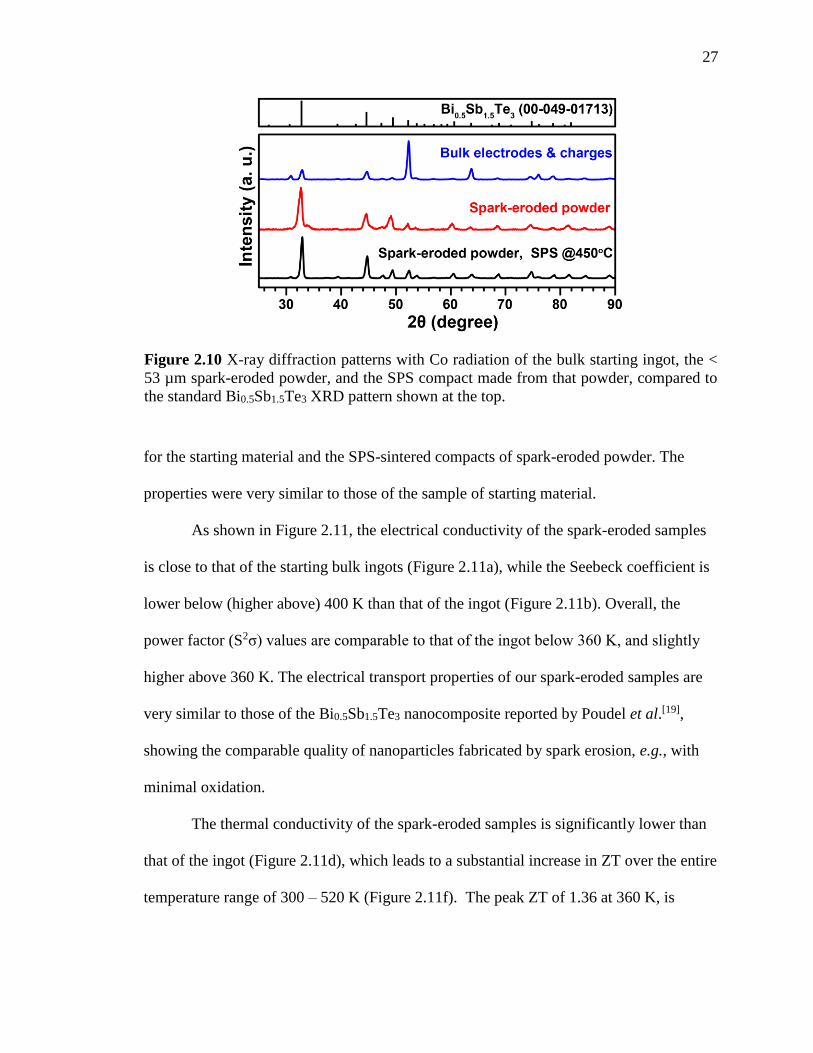
27
for the starting material and the SPS-sintered compacts of spark-eroded powder. The
properties were very similar to those of the sample of starting material.
As shown in Figure 2.11, the electrical conductivity of the spark-eroded samples
is close to that of the starting bulk ingots (Figure 2.11a), while the Seebeck coefficient is
lower below (higher above) 400 K than that of the ingot (Figure 2.11b). Overall, the
power factor (S2σ) values are comparable to that of the ingot below 360 K, and slightly
higher above 360 K. The electrical transport properties of our spark-eroded samples are
very similar to those of the Bi0.5Sb1.5Te3 nanocomposite reported by Poudel et al.[19],
showing the comparable quality of nanoparticles fabricated by spark erosion, e.g., with
minimal oxidation.
The thermal conductivity of the spark-eroded samples is significantly lower than
that of the ingot (Figure 2.11d), which leads to a substantial increase in ZT over the entire
temperature range of 300 – 520 K (Figure 2.11f). The peak ZT of 1.36 at 360 K, is
Figure 2.10 X-ray diffraction patterns with Co radiation of the bulk starting ingot, the <
53 µm spark-eroded powder, and the SPS compact made from that powder, compared to
the standard Bi0.5Sb1.5Te3 XRD pattern shown at the top.
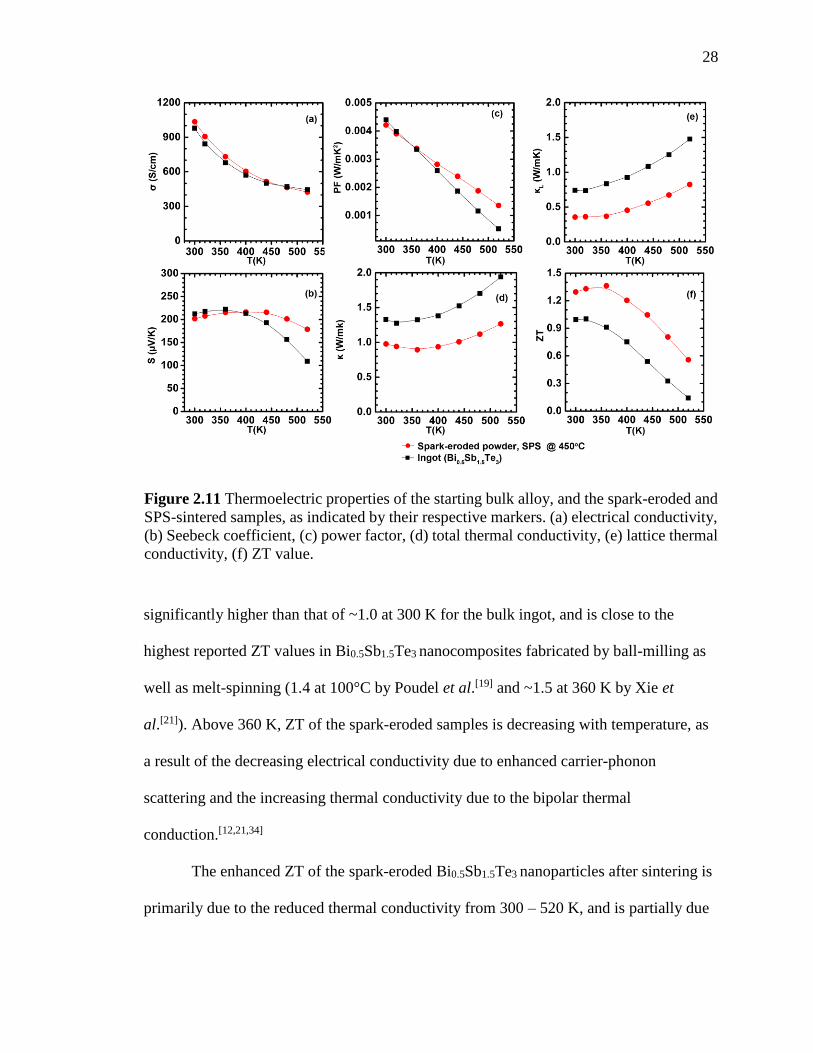
28
significantly higher than that of ~1.0 at 300 K for the bulk ingot, and is close to the
highest reported ZT values in Bi0.5Sb1.5Te3 nanocomposites fabricated by ball-milling as
well as melt-spinning (1.4 at 100°C by Poudel et al.[19] and ~1.5 at 360 K by Xie et
al.[21]). Above 360 K, ZT of the spark-eroded samples is decreasing with temperature, as
a result of the decreasing electrical conductivity due to enhanced carrier-phonon
scattering and the increasing thermal conductivity due to the bipolar thermal
conduction.[12,21,34]
The enhanced ZT of the spark-eroded Bi0.5Sb1.5Te3 nanoparticles after sintering is
primarily due to the reduced thermal conductivity from 300 – 520 K, and is partially due
Figure 2.11 Thermoelectric properties of the starting bulk alloy, and the spark-eroded and
SPS-sintered samples, as indicated by their respective markers. (a) electrical conductivity,
(b) Seebeck coefficient, (c) power factor, (d) total thermal conductivity, (e) lattice thermal
conductivity, (f) ZT value.
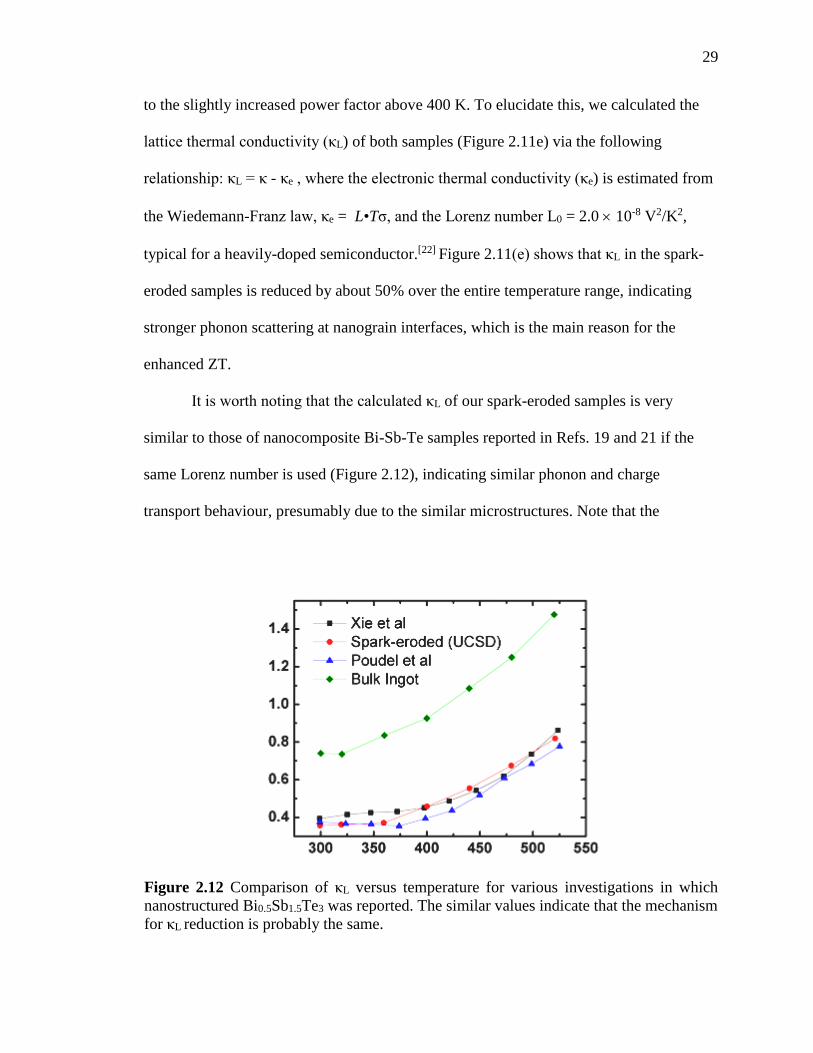
29
to the slightly increased power factor above 400 K. To elucidate this, we calculated the
lattice thermal conductivity (κL) of both samples (Figure 2.11e) via the following
relationship: κL = κ - κe , where the electronic thermal conductivity (κe) is estimated from
the Wiedemann-Franz law, κe = L•Tσ, and the Lorenz number L0 = 2.0 10-8 V2/K2,
typical for a heavily-doped semiconductor.[22] Figure 2.11(e) shows that κL in the spark-
eroded samples is reduced by about 50% over the entire temperature range, indicating
stronger phonon scattering at nanograin interfaces, which is the main reason for the
enhanced ZT.
It is worth noting that the calculated κL of our spark-eroded samples is very
similar to those of nanocomposite Bi-Sb-Te samples reported in Refs. 19 and 21 if the
same Lorenz number is used (Figure 2.12), indicating similar phonon and charge
transport behaviour, presumably due to the similar microstructures. Note that the
Figure 2.12 Comparison of κL versus temperature for various investigations in which
nanostructured Bi0.5Sb1.5Te3 was reported. The similar values indicate that the mechanism
for κL reduction is probably the same.
30
calculated κL shown in Figure 2.11(e) also includes the contribution from the bipolar
thermal conduction[12,21,34], and may not represent the true lattice thermal conductivity[34].
Poudel et al.[19] modelled κL based on the Boltzmann equation and showed that it is
actually decreasing with temperature, and is reduced by a factor of two in
nanocomposites when compared to bulk. In our spark-eroded and bulk samples, the fact
that the peaks of the Seebeck coefficient and the minima of the total thermal conductivity
occur at similar temperatures (360 – 400 K) suggests that bipolar thermal and electrical
conduction becomes important above 360 K[19,21], and the higher Seebeck coefficient in
the spark-eroded samples indicates that the bipolar conduction is suppressed, which also
contributes to the reduced κ and the enhanced ZT.[21,34]
2.3.2 Spark-Eroded Skutterudite (CoSb3)
The CoSb3 system has been an attractive material for thermoelectric devices
because of its large carrier mobility.[3] However, relatively high thermal conductivity has
made it inferior to bismuth telluride-based thermoelectrics. The system is thus primarily
attractive at medium to high temperatures.[3] Additionally, that high performing
thermoelectrics can be made both n- and p-type with the same material system is
attractive for fabricating thermoelectric devices (Figure 2.1).
Dyck et al has found that embedding divalent Ba into the “cage” of the
skutterudite structure creates an additional phonon-scattering site without adversely
affecting electrical conductivity.[36] In addition, the group found that the presence of a
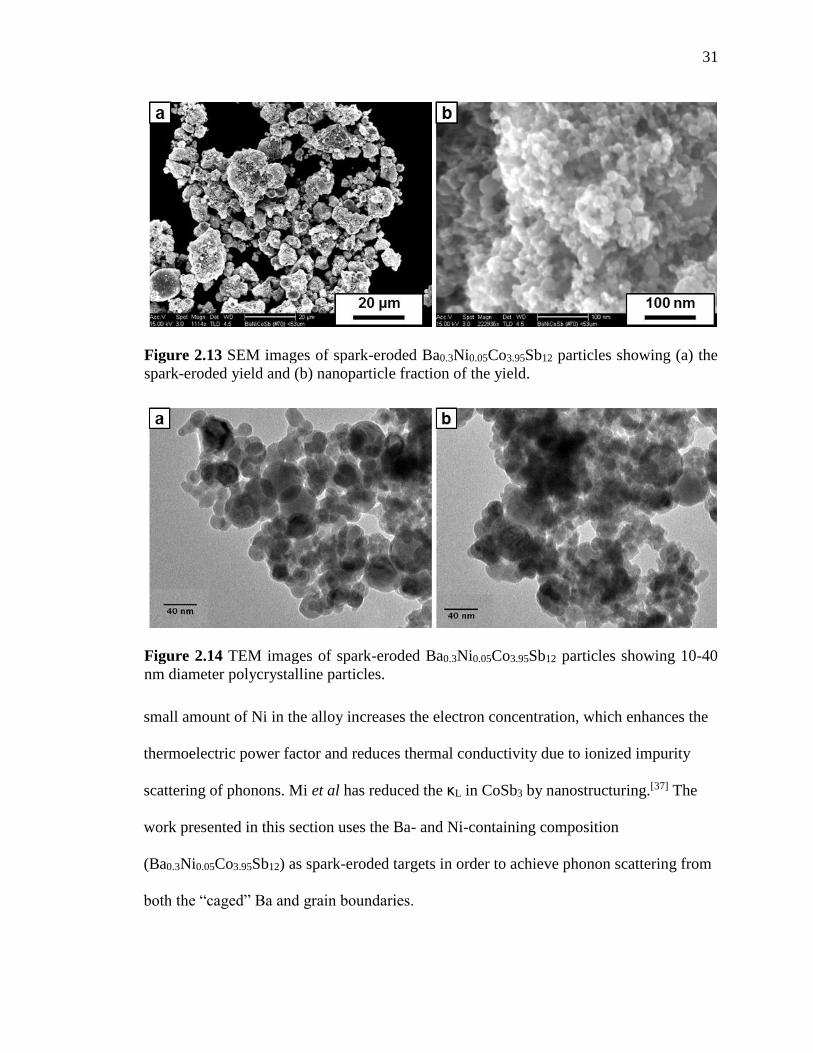
31
small amount of Ni in the alloy increases the electron concentration, which enhances the
thermoelectric power factor and reduces thermal conductivity due to ionized impurity
scattering of phonons. Mi et al has reduced the κL in CoSb3 by nanostructuring.[37] The
work presented in this section uses the Ba- and Ni-containing composition
(Ba0.3Ni0.05Co3.95Sb12) as spark-eroded targets in order to achieve phonon scattering from
both the “caged” Ba and grain boundaries.
Figure 2.13 SEM images of spark-eroded Ba0.3Ni0.05Co3.95Sb12 particles showing (a) the
spark-eroded yield and (b) nanoparticle fraction of the yield.
Figure 2.14 TEM images of spark-eroded Ba0.3Ni0.05Co3.95Sb12 particles showing 10-40
nm diameter polycrystalline particles.
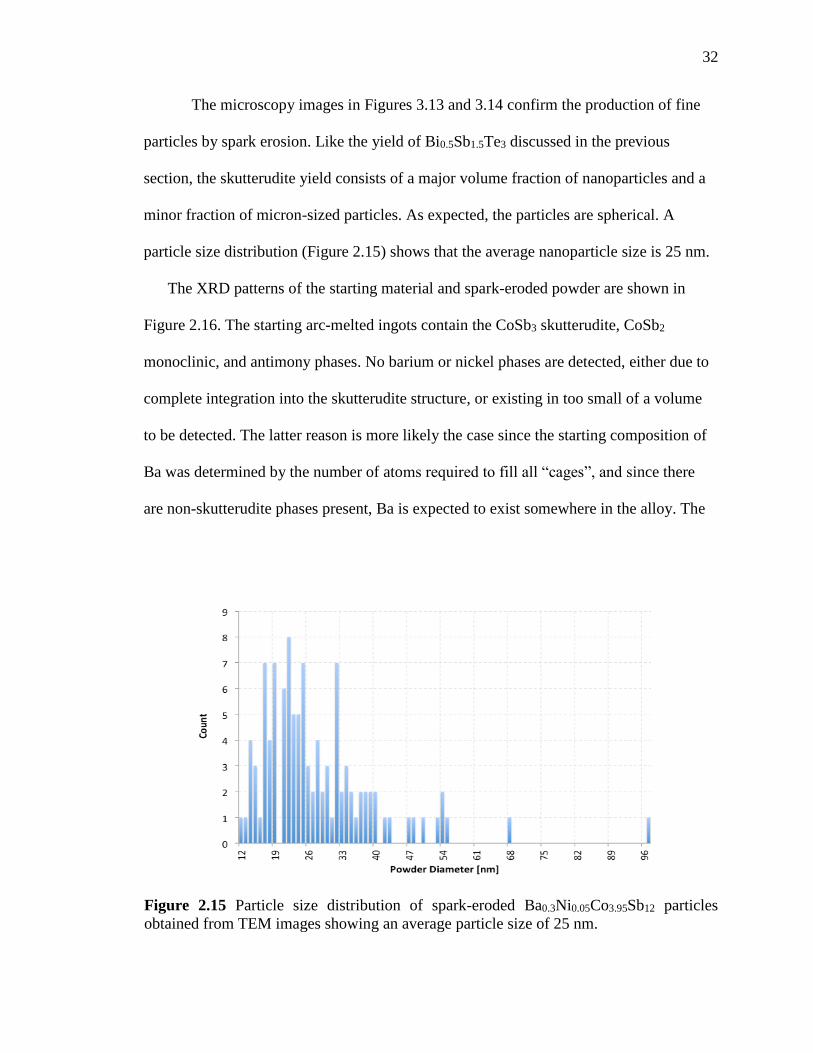
32
The microscopy images in Figures 3.13 and 3.14 confirm the production of fine
particles by spark erosion. Like the yield of Bi0.5Sb1.5Te3 discussed in the previous
section, the skutterudite yield consists of a major volume fraction of nanoparticles and a
minor fraction of micron-sized particles. As expected, the particles are spherical. A
particle size distribution (Figure 2.15) shows that the average nanoparticle size is 25 nm.
The XRD patterns of the starting material and spark-eroded powder are shown in
Figure 2.16. The starting arc-melted ingots contain the CoSb3 skutterudite, CoSb2
monoclinic, and antimony phases. No barium or nickel phases are detected, either due to
complete integration into the skutterudite structure, or existing in too small of a volume
to be detected. The latter reason is more likely the case since the starting composition of
Ba was determined by the number of atoms required to fill all “cages”, and since there
are non-skutterudite phases present, Ba is expected to exist somewhere in the alloy. The
Figure 2.15 Particle size distribution of spark-eroded Ba0.3Ni0.05Co3.95Sb12 particles
obtained from TEM images showing an average particle size of 25 nm.
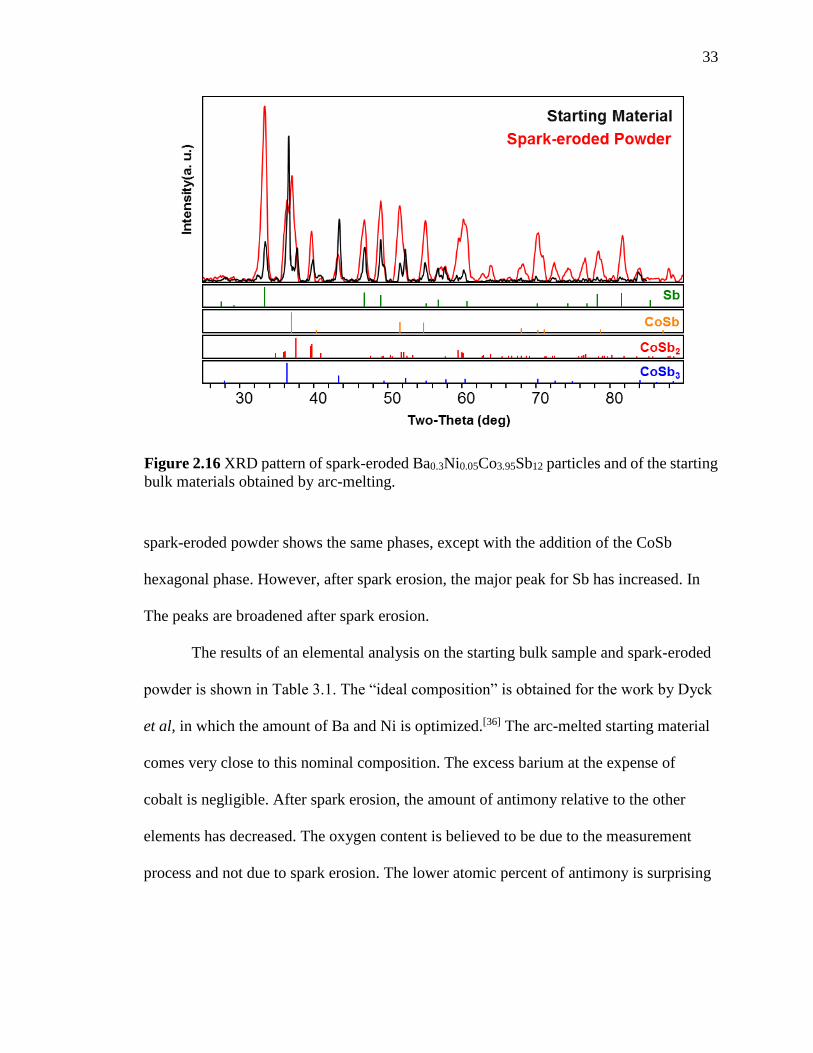
33
spark-eroded powder shows the same phases, except with the addition of the CoSb
hexagonal phase. However, after spark erosion, the major peak for Sb has increased. In
The peaks are broadened after spark erosion.
The results of an elemental analysis on the starting bulk sample and spark-eroded
powder is shown in Table 3.1. The “ideal composition” is obtained for the work by Dyck
et al, in which the amount of Ba and Ni is optimized.[36] The arc-melted starting material
comes very close to this nominal composition. The excess barium at the expense of
cobalt is negligible. After spark erosion, the amount of antimony relative to the other
elements has decreased. The oxygen content is believed to be due to the measurement
process and not due to spark erosion. The lower atomic percent of antimony is surprising
Figure 2.16 XRD pattern of spark-eroded Ba0.3Ni0.05Co3.95Sb12 particles and of the starting
bulk materials obtained by arc-melting.
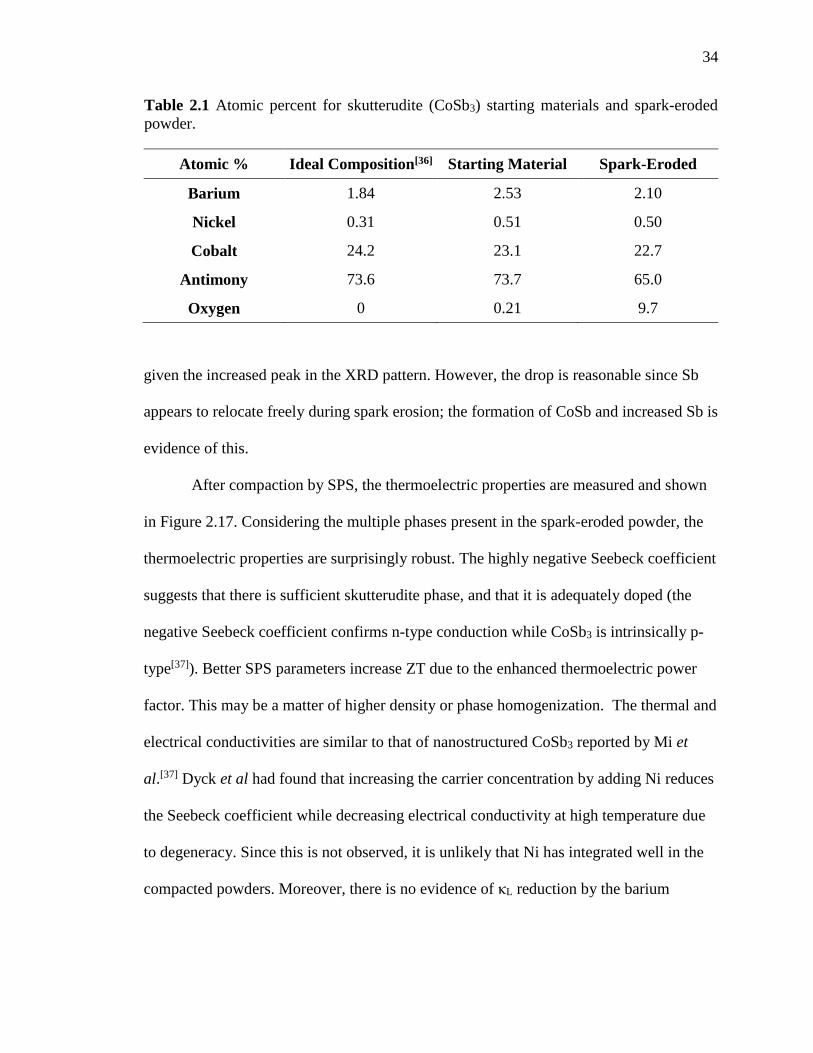
34
given the increased peak in the XRD pattern. However, the drop is reasonable since Sb
appears to relocate freely during spark erosion; the formation of CoSb and increased Sb is
evidence of this.
After compaction by SPS, the thermoelectric properties are measured and shown
in Figure 2.17. Considering the multiple phases present in the spark-eroded powder, the
thermoelectric properties are surprisingly robust. The highly negative Seebeck coefficient
suggests that there is sufficient skutterudite phase, and that it is adequately doped (the
negative Seebeck coefficient confirms n-type conduction while CoSb3 is intrinsically p-
type[37]). Better SPS parameters increase ZT due to the enhanced thermoelectric power
factor. This may be a matter of higher density or phase homogenization. The thermal and
electrical conductivities are similar to that of nanostructured CoSb3 reported by Mi et
al.[37] Dyck et al had found that increasing the carrier concentration by adding Ni reduces
the Seebeck coefficient while decreasing electrical conductivity at high temperature due
to degeneracy. Since this is not observed, it is unlikely that Ni has integrated well in the
compacted powders. Moreover, there is no evidence of κL reduction by the barium
Table 2.1 Atomic percent for skutterudite (CoSb3) starting materials and spark-eroded
powder.
Atomic % Ideal Composition[36] Starting Material Spark-Eroded
Barium 1.84 2.53 2.10
Nickel 0.31 0.51 0.50
Cobalt 24.2 23.1 22.7
Antimony 73.6 73.7 65.0
Oxygen 0 0.21 9.7
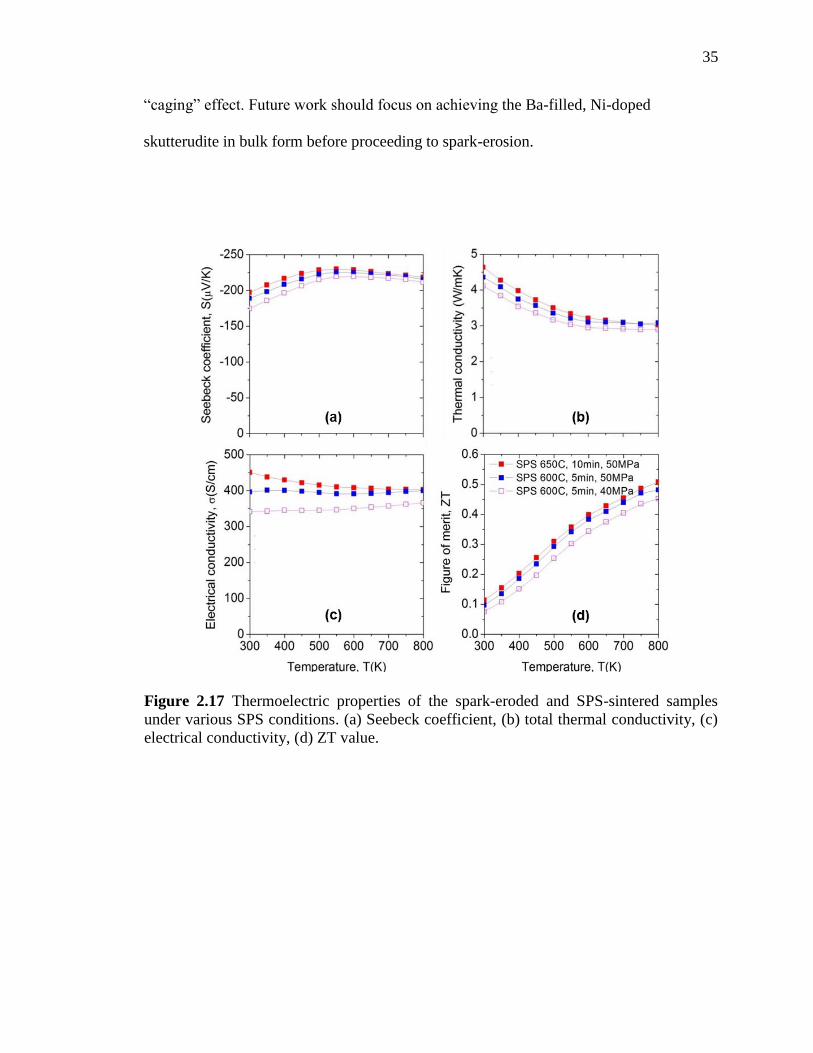
35
“caging” effect. Future work should focus on achieving the Ba-filled, Ni-doped
skutterudite in bulk form before proceeding to spark-erosion.
Figure 2.17 Thermoelectric properties of the spark-eroded and SPS-sintered samples
under various SPS conditions. (a) Seebeck coefficient, (b) total thermal conductivity, (c)
electrical conductivity, (d) ZT value.
36
2.4 Conclusions
We have developed a uniquely efficient, cost-effective method for producing
thermoelectric nanoparticles at a high production rate. These nanoparticles were SPS-
sintered into nano-grained thermoelectric alloy with a ZT of the Bi0.5Sb1.5Te3 compact
comparable to the best reported values. The improved ZT is a result of the reduced lattice
thermal conductivity, as well as the suppressed high temperature bipolar contributions to
electronic thermal transport. Spark-eroded Ba0.3Ni0.05Co3.95Sb12 powder compacted by
SPS also show reduced thermal conductivity, but more doping is required to raise the
thermoelectric power factor. Spark erosion not only produces these clean, oxidation-free,
high-ZT thermoelectric nanoparticles directly at low energy consumption, but the rate of
production is very high, indicating that scale-up to many tons/month is quite feasible.
With the inherent nanoparticle synthesis and nanograined structure using spark-eroded
thermoelectric alloys, the prospects for further improvements in performance and
production rate appear to be promising.
37
2.5 Acknowledgements
The authors acknowledge a partial support of this research by Iwama fund (S.J.)
and Center for Magnetic Recording Research at UC San Diego, and research start-up
fund from UC San Diego (R.C.). Very useful discussions with Dr. David Smith at
Arizona State University and Dr. Fred Spada at UC San Diego are appreciated.
This chapter, in part, is a reprint of the material as it appears in Nanotechnology,
Volume 23, 2012, Phi-Khanh Nguyen, Kyu Hyoung Lee, Jaeyun Moon, Sang Il Kim,
Kyunghan Ahn, Li-Han Chen, Sang Mok Lee, Renkun Chen, Sungho Jin, and Ami E.
Berkowitz. The dissertation author was the primary investigator and author of this paper.
38
2.6 References
[1] L. E. Bell, “Cooling, heating, generating power, and recovering waste heat with
thermoelectric systems”, Science, 321, 1457-1461 (2008).
[2] D. M. Rowe,”CRC Handbook of Thermoelectrics”, CRC Press, Boca Raton, FL
(1995).
[3] J.-F. Li, W.-S. Liu, L.-D. Zhao, and M. Zhou, “High-performance nanostructured
thermoelectric materials”, NPG Asia Mater. 2(4) 152–158 (2010).
[4] The Mercouri G. Kanatzidis Researcvh group Website. Retrieved February 2015
from “http://chemgroups.northwestern.edu/kanatzidis/greatthermo.html”.
[5] M. S. Dresselhaus, G. Chen, M. Y. Tang, R. G. Yang,H. Lee, D. Z. Wang, Z. F.
Ren, J. P. Fleurial, P. Gogna, “New directions for low-dimensional thermoelectric
materials.”, Adv. Mater., 19 (8), 1043-1053, (2007).
[6] C. J. Vineis, A. Shakouri, A. Majumdar, and M. G. Kanatzidis, “Nanostructured
Thermoelectrics: Big Efficiency Gains from Small Features”, Adv. Mater., 22,
3970-3980, (2010).
[7] Y. C. Lan, A. J. Minnich, G. Chen, and Z. F. Ren, “Enhancement of Thermoelectric
Figure-of-Merit by a Bulk Nanostructuring Approach”, Adv. Funct. Mater., 20,
357-376 (2010).
[8] R. Venkatasubramanian, E. Siivola, T. Colpitts, and B. O'Quinn, “Thin-film
thermoelectric devices with high room-temperature figures of merit”, Nature, 413,
597-602, (2001).
[9] T. C. Harman, P. J. Taylor, M. P. Walsh, and B. E. LaForge, “Quantum dot
superlattice thermoelectric materials and devices”, Science, 297, 2229-2232,
(2002).
[10] A. I. Boukai, Y. Bunimovich, J. Tahir-Kheli, J. K. Yu, W. A. Goddard, and J. R.
Heath, “Silicon nanowires as efficient thermoelectric materials”, Nature, 451,168-
171 (2008).
[11] A. I. Hochbaum, R. K. Chen, R. D. Delgado, W. J. Liang, E. C. Garnett, M.
Najarian, A. Majumdar, and P. D. Yang, “Enhanced thermoelectric performance of
rough silicon nanowires”, Nature, 451, 163-167 (2008).
[12] G. J. Snyder and E. S. Toberer, “Complex thermoelectric materials”, Nat. Mater.,
105-114 (2008).
39
[13] K. F. Hsu, S. Loo, F. Guo, W. Chen, J. S. Dyck, C. Uher, T. Hogan, E. K.
Polychroniadis, and M. G. Kanatzidis, “Cubic AgPbmSbTe2+m: Bulk thermoelectric
materials with high figure of merit”, Science, 303, 818-821 (2004).
[14] D. T. Morelli, T. M. Tritt, and G. S. Nolas, “Skutterudites: A phonon-glass-electron
crystal approach to advanced thermoelectric energy conversion applications”,
Annu. Rev. Mater. Sci., 29, 89-116 (1999).
[15] D. G. Ebling, A. Jacquot, H. Bottner, L. Kirste, J. Schmidt, and M. J. Aguirre,
“Influence of Group IV-Te Alloying on Nanocomposite Structure and
Thermoelectric Properties of Bi2Te3 Compounds”, Electron. Mater., 38, 1450-1455
(2009).
[16] J. Q. He, J. R. Sootsman, S. N. Girard, J. C. Zheng, J. G. Wen, Y. M. Zhu, M. G.
Kanatzidis, and V. P. Dravid, “On the Origin of Increased Phonon Scattering in
Nanostructured PbTe Based Thermoelectric Materials” J. Am. Chem. Soc., 132,
8669-8675 (2010).
[17] G. Joshi, H. Lee, Y. C. Lan, X. W. Wang, G. H. Zhu, D. Z. Wang, R. W. Gould,
D. C. Cuff, M. Y. Tang, M. S. Dresselhaus, G. Chen, and Z. F. Ren, “Enhanced
Thermoelectric Figure-of-Merit in Nanostructured p-type Silicon Germanium Bulk
Alloys”, Nano Lett., 8, 4670-4674 (2008).
[18] W. Kim, J. Zide, A. Gossard, D. Klenov, S. Stemmer, A. Shakouri, and A.
Majumdar, “Thermal conductivity reduction and thermoelectric figure of merit
increase by embedding nanoparticles in crystalline semiconductors”, Phys. Rev.
Lett., 96, 045901 (2006).
[19] B. Poudel, Q. Hao, Y. Ma, Y. C. Lan, A. Minnich, B. Yu, X. A. Yan, D. Z. Wang,
A. Muto, D. Vashaee, X. Y. Chen, J. M. Liu, M. S. Dresselhaus, G. Chen, and Z.
F. Ren, “High-thermoelectric performance of nanostructured bismuth antimony
telluride bulk alloys”, Science, 320, 634-638 (2008).
[20] T. M. Tritt, N. Gothard, X. Ji, and J. He, “Thermoelectric and transport properties
of n-type Bi2Te3 nanocomposites”, J. Appl. Phys., 103, 054314 (2008).
[21] W. J. Xie, J. He, H. J. Kang, X. F. Tang, S. Zhu, M. Laver, S. Y. Wang, J. R. D.
Copley, C. M. Brown, Q. J. Zhang, and T. M. Tritt, “Identifying the Specific
Nanostructures Responsible for the High Thermoelectric Performance of
(Bi,Sb)2Te3 Nanocomposites”, Nano Lett., 10, 3283-3289 (2010).
[22] W. J. Xie, Y. G. Yan, X. F. Tang, Q. J. Zhang, and T. M. Tritt, “High thermoelectric
performance BiSbTe alloy with unique low-dimensional structure”, J. Appl. Phys.,
105, 113713 (2009).
40
[23] G. H. Zhu, H. Lee, Y. C. Lan, X. W. Wang, G. Joshi, D. Z. Wang, J. Yang, D.
Vashaee, H. Guilbert, A. Pillitteri, M. S. Dresselhaus, G. Chen, and Z. F. Ren,
“Increased Phonon Scattering by Nanograins and Point Defects in Nanostructured
Silicon with a Low Concentration of Germanium”, Phys. Rev. Lett., 102, 196803
(2009).
[24] S. K. Bux, R. G. Blair, P. K. Gogna, H. Lee, G. Chen, M. S. Dresselhaus, R. B.
Kaner, and J. P. Fleurial, “Nanostructured Bulk Silicon as an Effective
Thermoelectric Material”, Adv. Funct. Mater., 19, 2445-2452 (2009).
[25] M. R. Dirmyer, J. Martin, G. S. Nolas, A. Sen, and J. V. Badding, “Thermal and
Electrical Conductivity of Size-Tuned Bismuth Telluride Nanoparticles”, Small, 5,
933-937 (2009)
[26] M. Scheele, N. Oeschler, K. Meier, A. Kornowski, C. Klinke, and H. Weller,
“Synthesis and Thermoelectric Characterization of Bi2Te3 Nanoparticles” Adv.
Funct. Mater., 19, 3476-3483 (2009).
[27] M. Scheele, N. Oeschler, I. Veremchuk, K. G. Reinsberg, A. M. Kreuziger, A.
Kornowski, J. Broekaert, C. Klinke, and H. Weller, “ZT Enhancement in Solution-
Grown Sb(2-x)BixTe3 Nanoplatelets”, ACS Nano, 4, 4283-4291 (2010).
[28] Y. C. Zhang, H. Wang, S. Kraemer, Y. F. Shi, F. Zhang, M. Snedaker, K. L. Ding,
M. Moskovits, G. J. Snyder, and G. D. Stuck, “Surfactant-Free Synthesis of Bi2Te3-
Te Micro-Nano Heterostructure with Enhanced Thermoelectric Figure of Merit”,
ACS Nano, 5, 3158-3165 (2011).
[29] K. C. See, J. P. Feser, C. E. Chen, A. Majumdar, J. Urban, and R. A. Segalman,
“Water-Processable Polymer-Nanocrystal Hybrids for Thermoelectrics”, Nano
Lett., 10, 4664-4667 (2010).
[30] R. Y. Wang, J. P. Feser, X. Gu, K. M. Yu, R. A. Segalman, A. Majumdar, D. J.
Milliron, and J. Urban “Universal and Solution-Processable Precursor to Bismuth
Chalcogenide Thermoelectrics”, J. Chem. Mater., 22, 1943-1945 (2010).
[31] Y. Ma, Q. Hao, B. Poudel, Y. C. Lan, B. Yu, D. Z. Wang, Z. F. Ren, and G. Chen,
“Enhanced thermoelectric figure of merit in nanostructured n-type silicon
germanium bulk alloy”, Nano Lett., 8, 2580-2584 (2008).
[32] X. W. Wang, H. Lee, Y. C. Lan, G. H. Zhu, G. Joshi, D. Z. Wang, J. Yang, A. J.
Muto, M. Y. Tang, J. Klatsky, S. Song, M. S. Dresselhaus, Z. F. Ren, and G. Chen,
“Enhanced thermoelectric figure of merit in nanostructured n-type silicon
germanium bulk alloy”, Appl. Phys. Lett., 93, 193121 (2008).
[33] G. Chen, X. A. Yan, B. Poudel, Y. Ma, W. S. Liu, G. Joshi, H. Wang, Y. C. Lan,
D. Z. Wang, and Z. F. Ren, “Experimental Studies on Anisotropic Thermoelectric
41
Properties and Structures of n-Type Bi2Te2.7Se0.3”, Nano Lett., 10, 3373-3378
(2010).
[34] J. S. Dyck, W. Chen, and C. Uher, “Thermoelectric properties of the n-type filled
skutterudite Ba0.3Co4Sb12 doped with Ni”, J. Appl. Phys., Vol. 91, No. 6, 15 (2002).
[35] J. L. Mi, T. J. Zhu, X. B. Zhao, and J. Ma, “Nanostructuring and thermoelectric
properties of bulk skutterudite compound CoSb3”, J. Appl. Phys., 101, 054314
(2007).
42
CHAPTER 3: PERMANENT MAGNETS
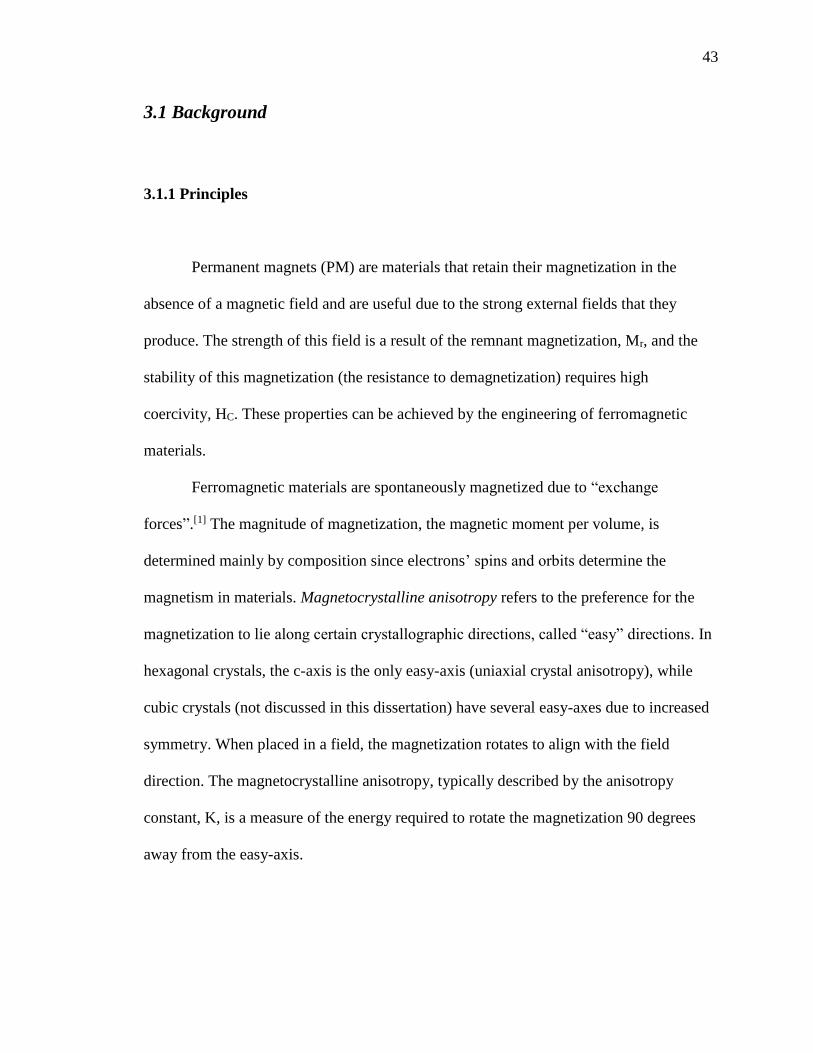
43
3.1 Background
3.1.1 Principles
Permanent magnets (PM) are materials that retain their magnetization in the
absence of a magnetic field and are useful due to the strong external fields that they
produce. The strength of this field is a result of the remnant magnetization, Mr, and the
stability of this magnetization (the resistance to demagnetization) requires high
coercivity, HC. These properties can be achieved by the engineering of ferromagnetic
materials.
Ferromagnetic materials are spontaneously magnetized due to “exchange
forces”.[1] The magnitude of magnetization, the magnetic moment per volume, is
determined mainly by composition since electrons’ spins and orbits determine the
magnetism in materials. Magnetocrystalline anisotropy refers to the preference for the
magnetization to lie along certain crystallographic directions, called “easy” directions. In
hexagonal crystals, the c-axis is the only easy-axis (uniaxial crystal anisotropy), while
cubic crystals (not discussed in this dissertation) have several easy-axes due to increased
symmetry. When placed in a field, the magnetization rotates to align with the field
direction. The magnetocrystalline anisotropy, typically described by the anisotropy
constant, K, is a measure of the energy required to rotate the magnetization 90 degrees
away from the easy-axis.
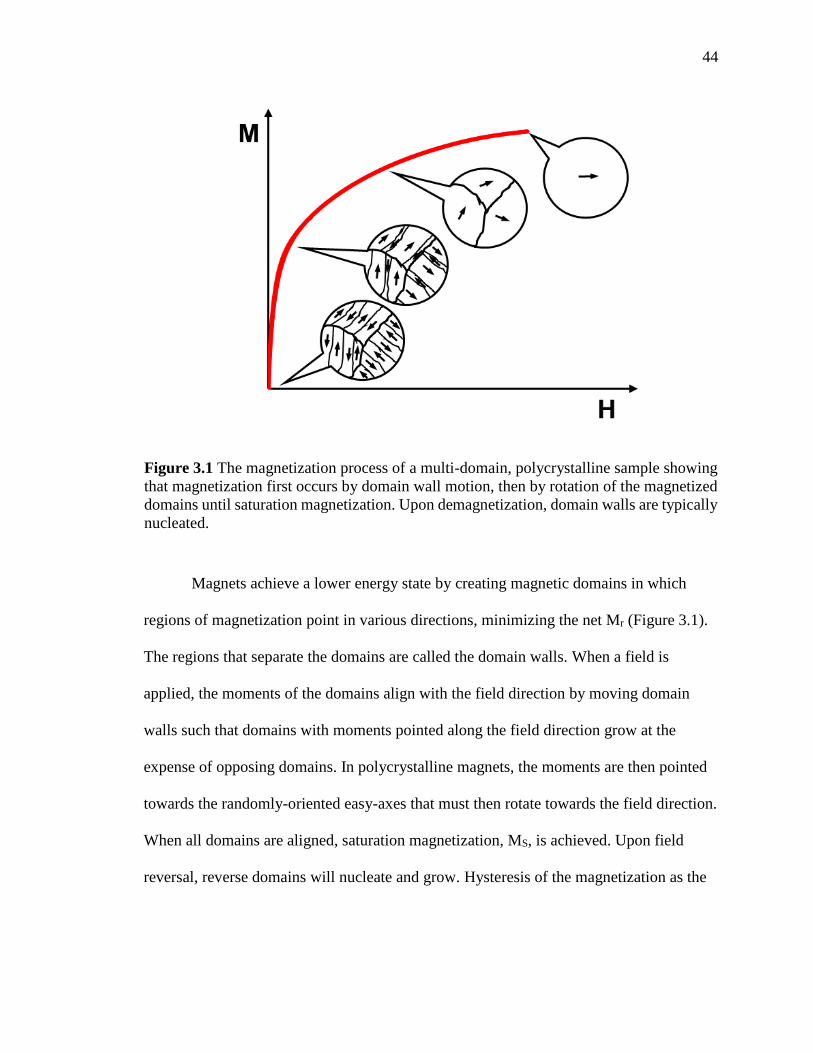
44
Magnets achieve a lower energy state by creating magnetic domains in which
regions of magnetization point in various directions, minimizing the net Mr (Figure 3.1).
The regions that separate the domains are called the domain walls. When a field is
applied, the moments of the domains align with the field direction by moving domain
walls such that domains with moments pointed along the field direction grow at the
expense of opposing domains. In polycrystalline magnets, the moments are then pointed
towards the randomly-oriented easy-axes that must then rotate towards the field direction.
When all domains are aligned, saturation magnetization, MS, is achieved. Upon field
reversal, reverse domains will nucleate and grow. Hysteresis of the magnetization as the
Figure 3.1 The magnetization process of a multi-domain, polycrystalline sample showing
that magnetization first occurs by domain wall motion, then by rotation of the magnetized
domains until saturation magnetization. Upon demagnetization, domain walls are typically
nucleated.

45
applied field is cycled generally depends on the magnitude of the magnetic anisotropy
energy and the presence of "pinning" sites for the domain walls.
When particle dimensions are small enough, single-domain particles are
produced. The hysteresis of these particles depends on their magnetic anisotropy energy
and their shape. A group of non-interacting single-domain particles can be aligned along
their easy axes and compacted so that domain rotation is the only mechanism for
magnetization reversal in the bulk compact. The magnetization cycle is shown in Figure
3.2. Here, the moments point in random directions in the demagnetized state. When a
field is applied, moments first flip along the easy-axis towards the field direction and then
rotate to align with this direction. When the field is then reduced to zero, the moments
Figure 3.2 The magnetization process of randomly-oriented single-domain particles with
uniaxial crystal anisotropy.
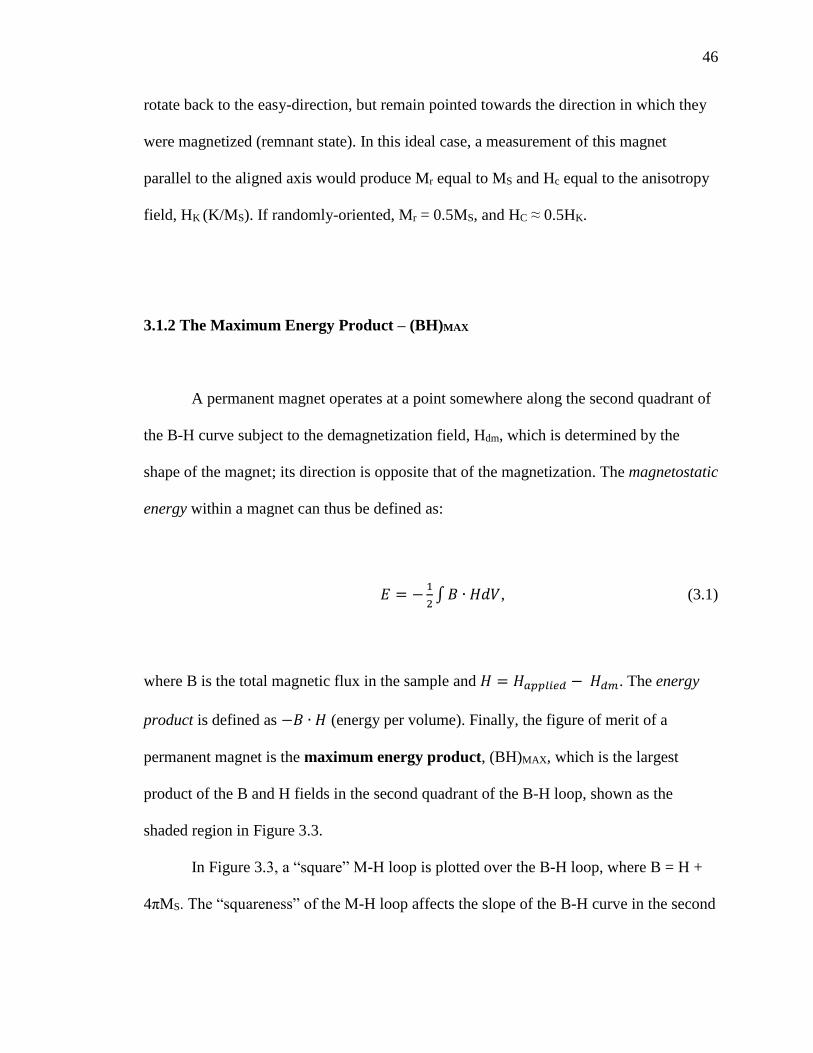
46
rotate back to the easy-direction, but remain pointed towards the direction in which they
were magnetized (remnant state). In this ideal case, a measurement of this magnet
parallel to the aligned axis would produce Mr equal to MS and Hc equal to the anisotropy
field, HK (K/MS). If randomly-oriented, Mr = 0.5MS, and HC ≈ 0.5HK.
3.1.2 The Maximum Energy Product – (BH)MAX
A permanent magnet operates at a point somewhere along the second quadrant of
the B-H curve subject to the demagnetization field, Hdm, which is determined by the
shape of the magnet; its direction is opposite that of the magnetization. The magnetostatic
energy within a magnet can thus be defined as:
𝐸 = −1
2∫ 𝐵 ∙ 𝐻𝑑𝑉, (3.1)
where B is the total magnetic flux in the sample and 𝐻 = 𝐻𝑎𝑝𝑝𝑙𝑖𝑒𝑑 − 𝐻𝑑𝑚. The energy
product is defined as −𝐵 ∙ 𝐻 (energy per volume). Finally, the figure of merit of a
permanent magnet is the maximum energy product, (BH)MAX, which is the largest
product of the B and H fields in the second quadrant of the B-H loop, shown as the
shaded region in Figure 3.3.
In Figure 3.3, a “square” M-H loop is plotted over the B-H loop, where B = H +
4πMS. The “squareness” of the M-H loop affects the slope of the B-H curve in the second
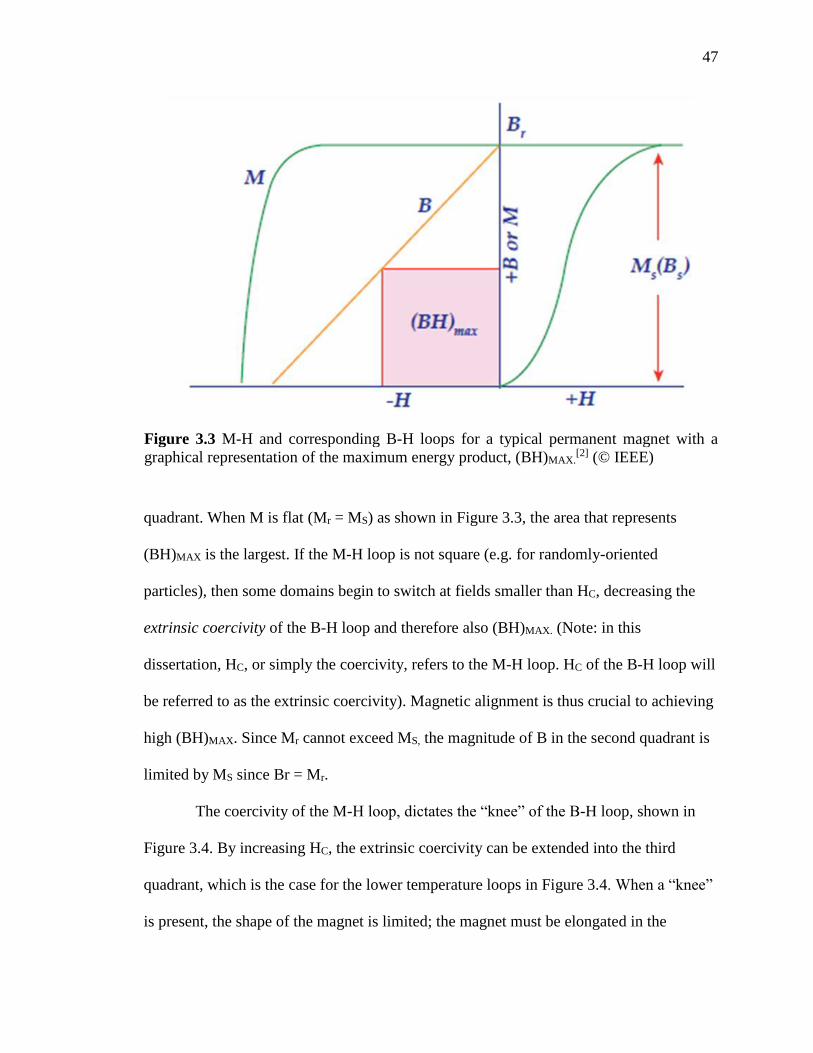
47
quadrant. When M is flat (Mr = MS) as shown in Figure 3.3, the area that represents
(BH)MAX is the largest. If the M-H loop is not square (e.g. for randomly-oriented
particles), then some domains begin to switch at fields smaller than HC, decreasing the
extrinsic coercivity of the B-H loop and therefore also (BH)MAX. (Note: in this
dissertation, HC, or simply the coercivity, refers to the M-H loop. HC of the B-H loop will
be referred to as the extrinsic coercivity). Magnetic alignment is thus crucial to achieving
high (BH)MAX. Since Mr cannot exceed MS, the magnitude of B in the second quadrant is
limited by MS since Br = Mr.
The coercivity of the M-H loop, dictates the “knee” of the B-H loop, shown in
Figure 3.4. By increasing HC, the extrinsic coercivity can be extended into the third
quadrant, which is the case for the lower temperature loops in Figure 3.4. When a “knee”
is present, the shape of the magnet is limited; the magnet must be elongated in the
Figure 3.3 M-H and corresponding B-H loops for a typical permanent magnet with a
graphical representation of the maximum energy product, (BH)MAX.[2] (© IEEE)
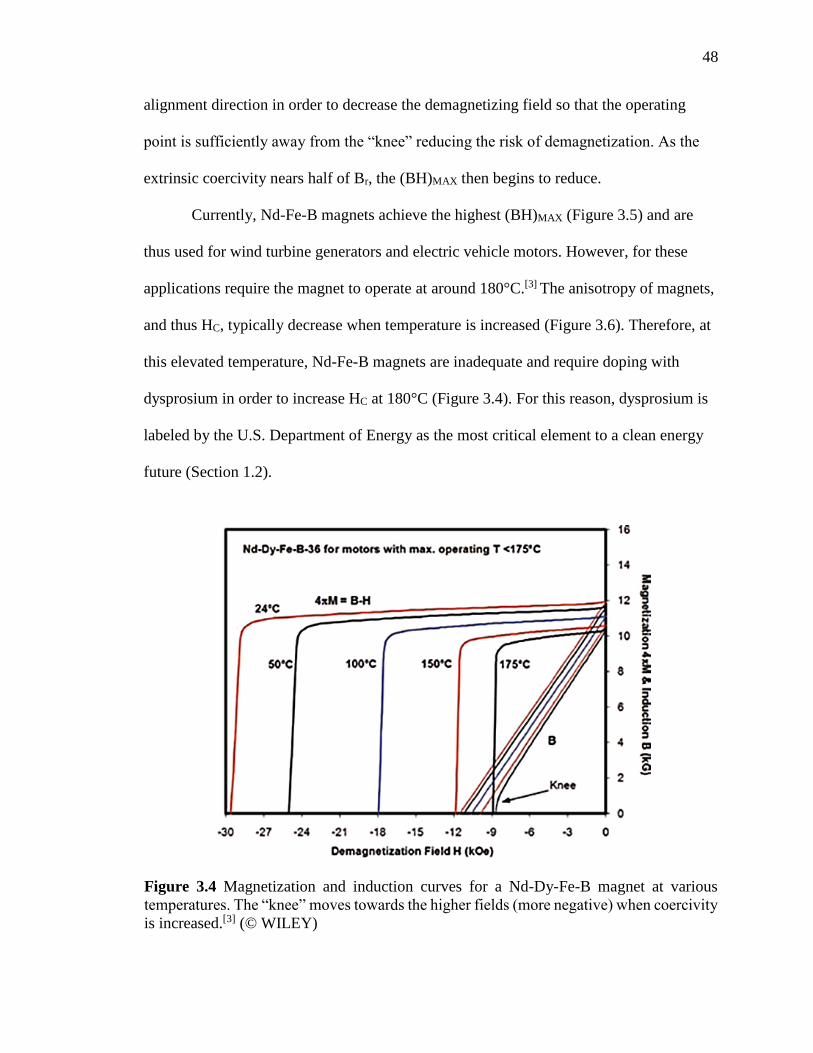
48
alignment direction in order to decrease the demagnetizing field so that the operating
point is sufficiently away from the “knee” reducing the risk of demagnetization. As the
extrinsic coercivity nears half of Br, the (BH)MAX then begins to reduce.
Currently, Nd-Fe-B magnets achieve the highest (BH)MAX (Figure 3.5) and are
thus used for wind turbine generators and electric vehicle motors. However, for these
applications require the magnet to operate at around 180°C.[3] The anisotropy of magnets,
and thus HC, typically decrease when temperature is increased (Figure 3.6). Therefore, at
this elevated temperature, Nd-Fe-B magnets are inadequate and require doping with
dysprosium in order to increase HC at 180°C (Figure 3.4). For this reason, dysprosium is
labeled by the U.S. Department of Energy as the most critical element to a clean energy
future (Section 1.2).
Figure 3.4 Magnetization and induction curves for a Nd-Dy-Fe-B magnet at various
temperatures. The “knee” moves towards the higher fields (more negative) when coercivity
is increased.[3] (© WILEY)
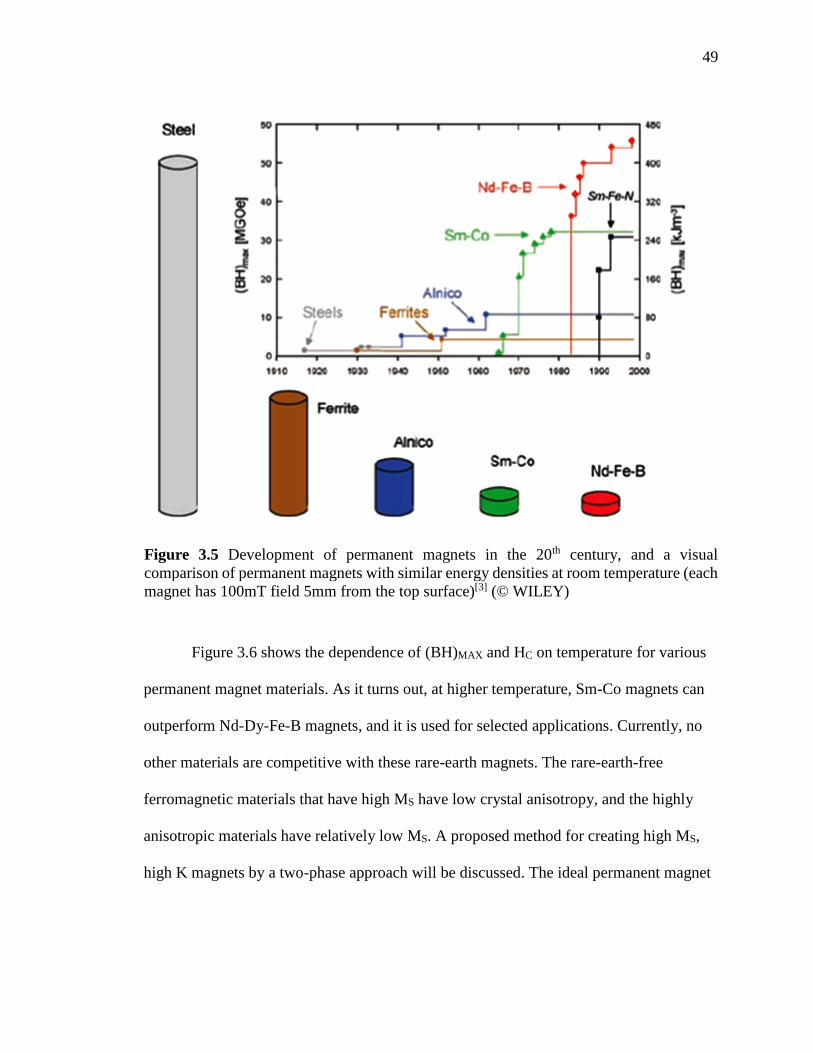
49
Figure 3.6 shows the dependence of (BH)MAX and HC on temperature for various
permanent magnet materials. As it turns out, at higher temperature, Sm-Co magnets can
outperform Nd-Dy-Fe-B magnets, and it is used for selected applications. Currently, no
other materials are competitive with these rare-earth magnets. The rare-earth-free
ferromagnetic materials that have high MS have low crystal anisotropy, and the highly
anisotropic materials have relatively low MS. A proposed method for creating high MS,
high K magnets by a two-phase approach will be discussed. The ideal permanent magnet
Figure 3.5 Development of permanent magnets in the 20th century, and a visual
comparison of permanent magnets with similar energy densities at room temperature (each
magnet has 100mT field 5mm from the top surface)[3] (© WILEY)
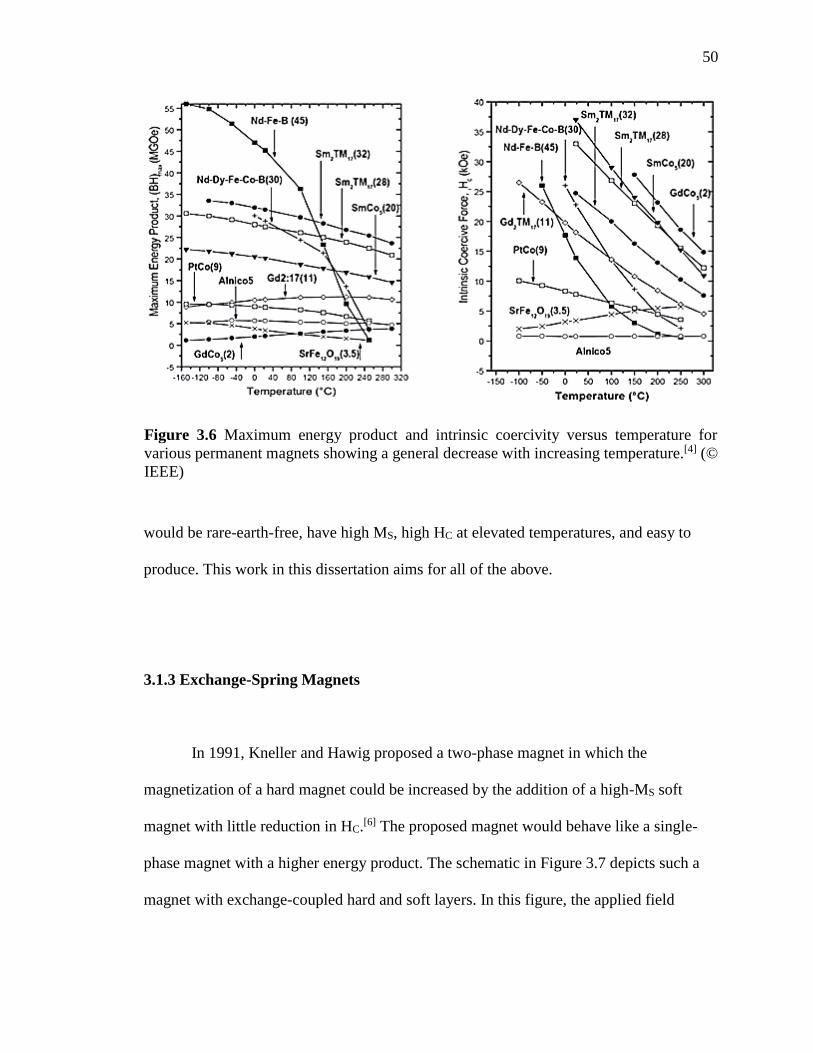
50
would be rare-earth-free, have high MS, high HC at elevated temperatures, and easy to
produce. This work in this dissertation aims for all of the above.
3.1.3 Exchange-Spring Magnets
In 1991, Kneller and Hawig proposed a two-phase magnet in which the
magnetization of a hard magnet could be increased by the addition of a high-MS soft
magnet with little reduction in HC.[6] The proposed magnet would behave like a single-
phase magnet with a higher energy product. The schematic in Figure 3.7 depicts such a
magnet with exchange-coupled hard and soft layers. In this figure, the applied field
Figure 3.6 Maximum energy product and intrinsic coercivity versus temperature for
various permanent magnets showing a general decrease with increasing temperature.[4] (©
IEEE)
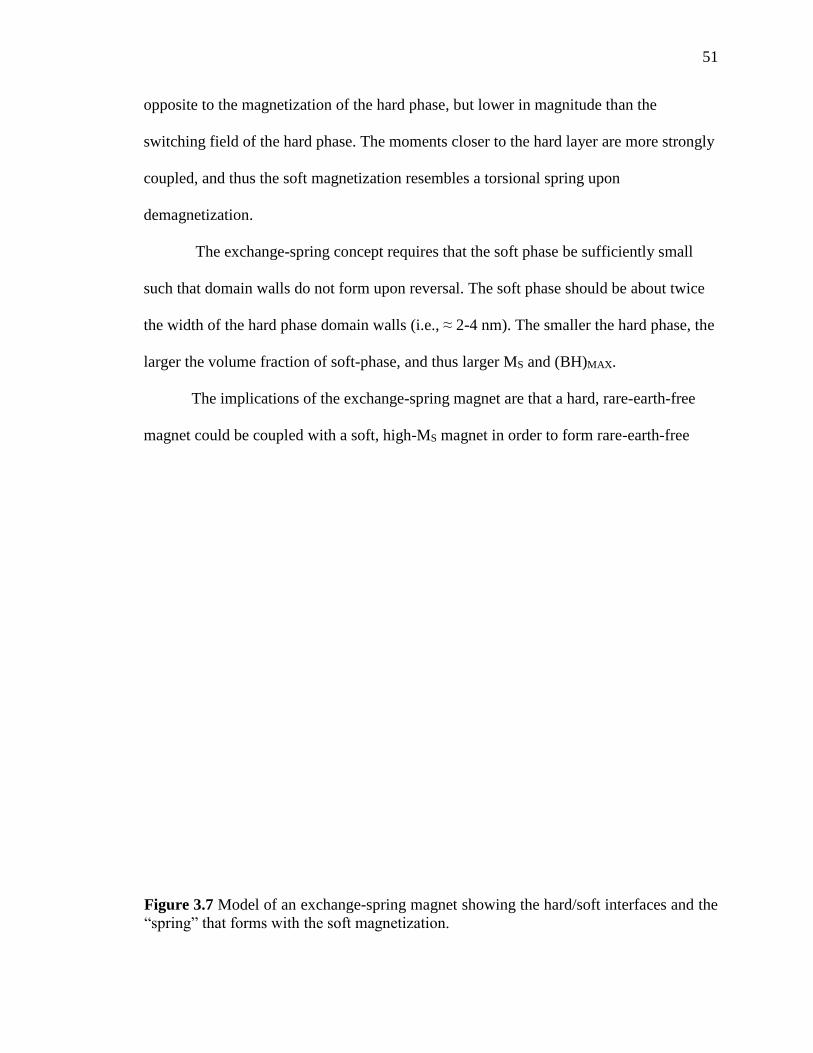
51
opposite to the magnetization of the hard phase, but lower in magnitude than the
switching field of the hard phase. The moments closer to the hard layer are more strongly
coupled, and thus the soft magnetization resembles a torsional spring upon
demagnetization.
The exchange-spring concept requires that the soft phase be sufficiently small
such that domain walls do not form upon reversal. The soft phase should be about twice
the width of the hard phase domain walls (i.e., ≈ 2-4 nm). The smaller the hard phase, the
larger the volume fraction of soft-phase, and thus larger MS and (BH)MAX.
The implications of the exchange-spring magnet are that a hard, rare-earth-free
magnet could be coupled with a soft, high-MS magnet in order to form rare-earth-free
Figure 3.7 Model of an exchange-spring magnet showing the hard/soft interfaces and the
“spring” that forms with the soft magnetization.
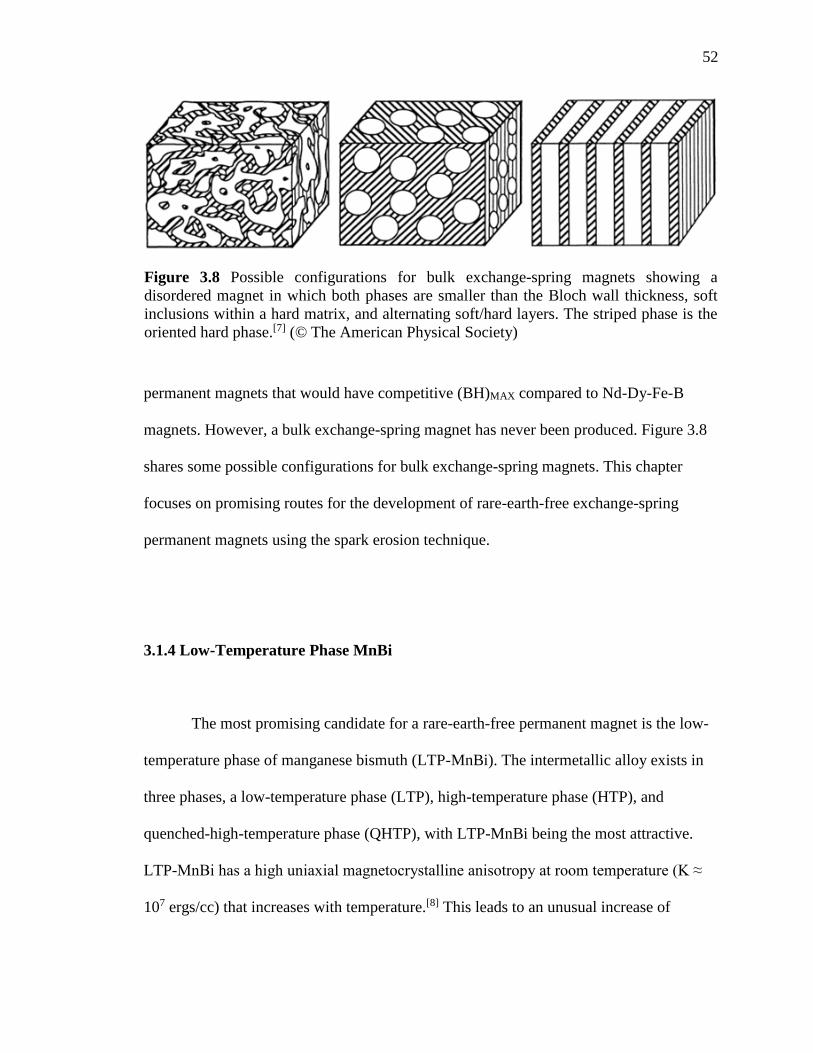
52
permanent magnets that would have competitive (BH)MAX compared to Nd-Dy-Fe-B
magnets. However, a bulk exchange-spring magnet has never been produced. Figure 3.8
shares some possible configurations for bulk exchange-spring magnets. This chapter
focuses on promising routes for the development of rare-earth-free exchange-spring
permanent magnets using the spark erosion technique.
3.1.4 Low-Temperature Phase MnBi
The most promising candidate for a rare-earth-free permanent magnet is the low-
temperature phase of manganese bismuth (LTP-MnBi). The intermetallic alloy exists in
three phases, a low-temperature phase (LTP), high-temperature phase (HTP), and
quenched-high-temperature phase (QHTP), with LTP-MnBi being the most attractive.
LTP-MnBi has a high uniaxial magnetocrystalline anisotropy at room temperature (K ≈
107 ergs/cc) that increases with temperature.[8] This leads to an unusual increase of
Figure 3.8 Possible configurations for bulk exchange-spring magnets showing a
disordered magnet in which both phases are smaller than the Bloch wall thickness, soft
inclusions within a hard matrix, and alternating soft/hard layers. The striped phase is the
oriented hard phase.[7] (© The American Physical Society)
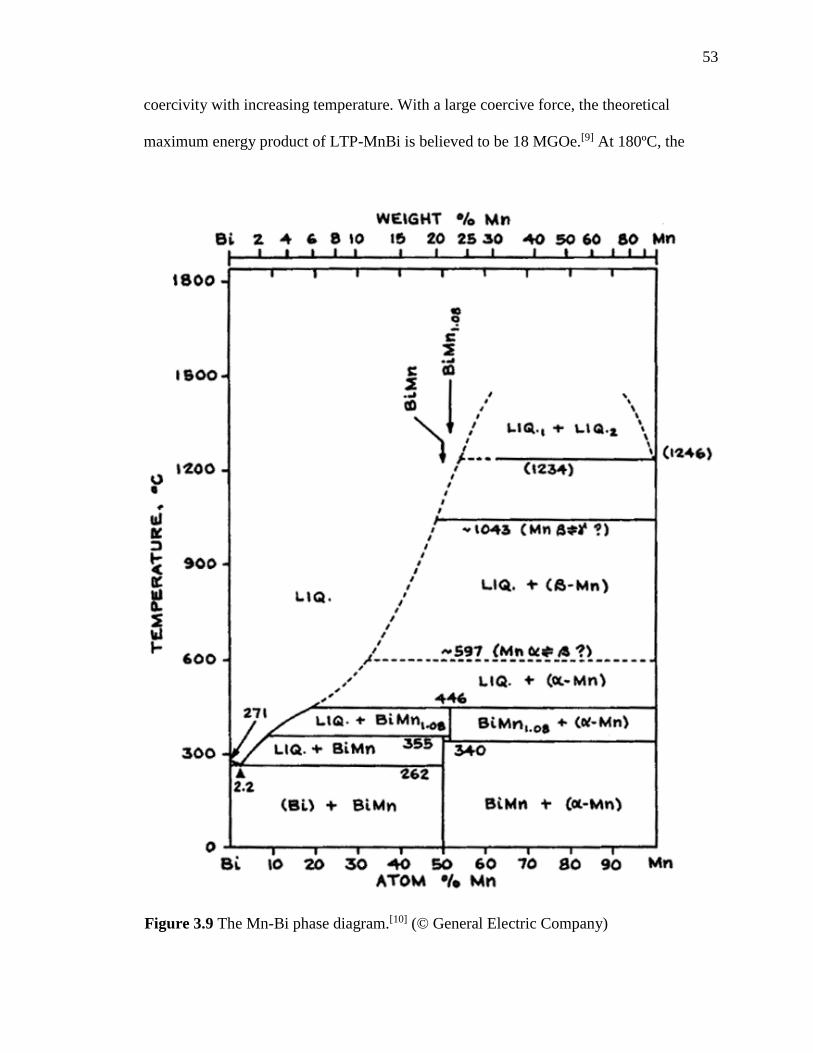
53
coercivity with increasing temperature. With a large coercive force, the theoretical
maximum energy product of LTP-MnBi is believed to be 18 MGOe.[9] At 180ºC, the
Figure 3.9 The Mn-Bi phase diagram.[10] (© General Electric Company)
54
coercivity of LTP-MnBi surpasses that of conventional permanent magnet materials such
as Nd-Fe-B and Sm-Co.
However, a single-phase LTP-MnBi bulk sample is difficult to obtain as a
consequence of its peritectic phase diagram[9, 10] (Figure 3.9). Above the peritectic
temperature, Mn segregates from the Mn-Bi melt. The transition from the closely-related
HTP, existing as Mn1.08Bi, to LTP-MnBi yields an excess of Mn. Obtaining LTP-MnBi
by diffusion is tedious since the annealing must be carried out below 340°C; the diffusion
of Mn and Bi through the MnBi phase has been shown to be extremely slow.[11]
Among the known methods of producing pure LTP-MnBi , Chen et al grew
single-crystal MnBi by pulling a seed crystal from the melt.[8] Later, Yoshida et al
obtained bulk MnBi by quenching in liquid nitrogen, arc-melting, and then zone-
melting.[12] More recently, Guo et al used melt-spinning to form amorphous MnBi flakes
that crystallized upon annealing.[13] In order to form particles, the melt spun ribbon were
ball-milled.[14] Others have studied LTP-MnBi powders produced by mechanically
grinding the bulk ingot; the saturation magnetization, MS, of these samples were not
high.[15, 16]
In this chapter, we discuss several superior methods for producing LTP-MnBi
bulk alloys and particles. First, we describe how polycrystalline LTP-MnBi of > 90 wt %
was made by chill-casting and subsequent annealing at 300°C for 96 hours. This sample
has a room temperature moment of 73.5 emu/g in 70 kOe, as compared to the saturation
magnetization (MS) of 80 emu/g.[17] We also report a novel method for preparing high-MS
bulk MnBi by extraction of the non-magnetic Bi phase from an arc-melted MnBi ingot.
When these bulk LTP-MnBi ingots are spark-eroded, the as-prepared powder consists of
55
amorphous, crystalline, and superparamagnetic particles, mostly as porous aggregates.
When subsequently annealed and lightly milled, the randomly-oriented powder has MS of
69 emu/g and HC of 1 T at room temperature. The (BH)MAX for this randomly-oriented
powder is 3.0 MGOe at room temperature. The large fraction of amorphous particles,
when crystallized in a magnetic field, can be oriented along the field direction. By this
method, a hysteresis with Mr/MS of 0.8 is achieved. Finally, when the spark-eroded
powders are mixed with soft phases by various methods in order to determine potential
routes to an exchange-spring magnet, it was found that FeCo is the best candidate for
coupling.
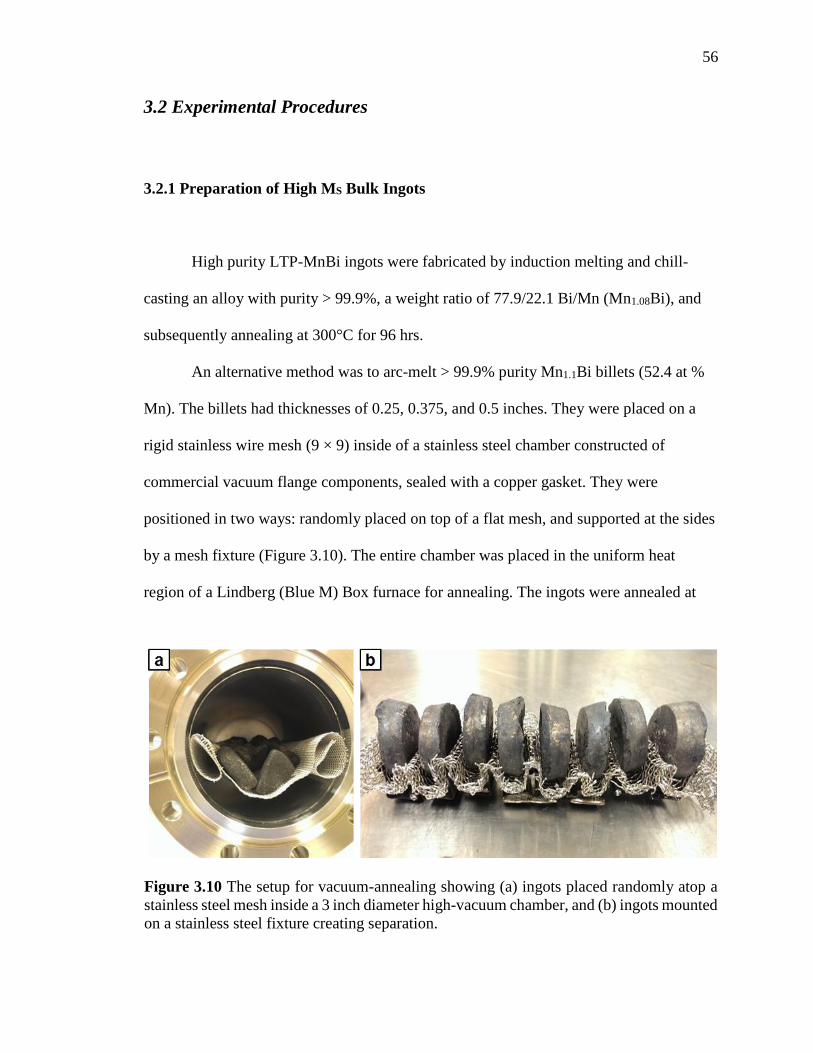
56
3.2 Experimental Procedures
3.2.1 Preparation of High MS Bulk Ingots
High purity LTP-MnBi ingots were fabricated by induction melting and chill-
casting an alloy with purity > 99.9%, a weight ratio of 77.9/22.1 Bi/Mn (Mn1.08Bi), and
subsequently annealing at 300°C for 96 hrs.
An alternative method was to arc-melt > 99.9% purity Mn1.1Bi billets (52.4 at %
Mn). The billets had thicknesses of 0.25, 0.375, and 0.5 inches. They were placed on a
rigid stainless wire mesh (9 × 9) inside of a stainless steel chamber constructed of
commercial vacuum flange components, sealed with a copper gasket. They were
positioned in two ways: randomly placed on top of a flat mesh, and supported at the sides
by a mesh fixture (Figure 3.10). The entire chamber was placed in the uniform heat
region of a Lindberg (Blue M) Box furnace for annealing. The ingots were annealed at
Figure 3.10 The setup for vacuum-annealing showing (a) ingots placed randomly atop a
stainless steel mesh inside a 3 inch diameter high-vacuum chamber, and (b) ingots mounted
on a stainless steel fixture creating separation.
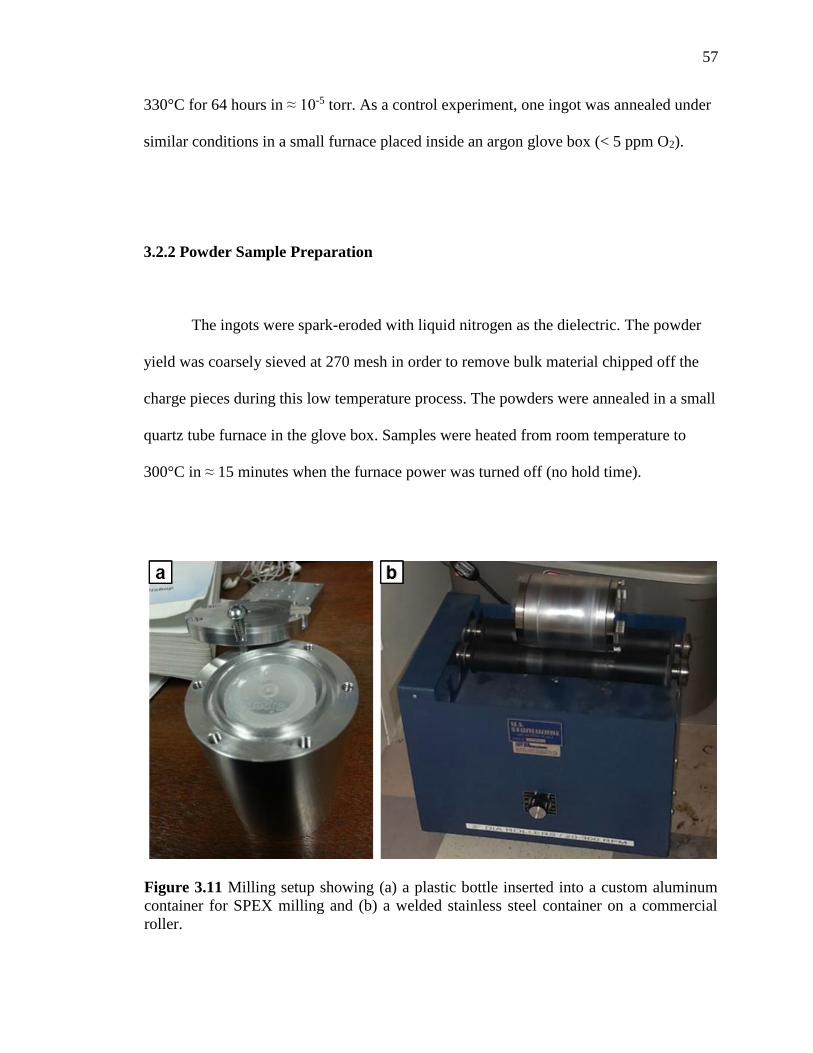
57
330°C for 64 hours in ≈ 10-5 torr. As a control experiment, one ingot was annealed under
similar conditions in a small furnace placed inside an argon glove box (< 5 ppm O2).
3.2.2 Powder Sample Preparation
The ingots were spark-eroded with liquid nitrogen as the dielectric. The powder
yield was coarsely sieved at 270 mesh in order to remove bulk material chipped off the
charge pieces during this low temperature process. The powders were annealed in a small
quartz tube furnace in the glove box. Samples were heated from room temperature to
300°C in ≈ 15 minutes when the furnace power was turned off (no hold time).
Figure 3.11 Milling setup showing (a) a plastic bottle inserted into a custom aluminum
container for SPEX milling and (b) a welded stainless steel container on a commercial
roller.
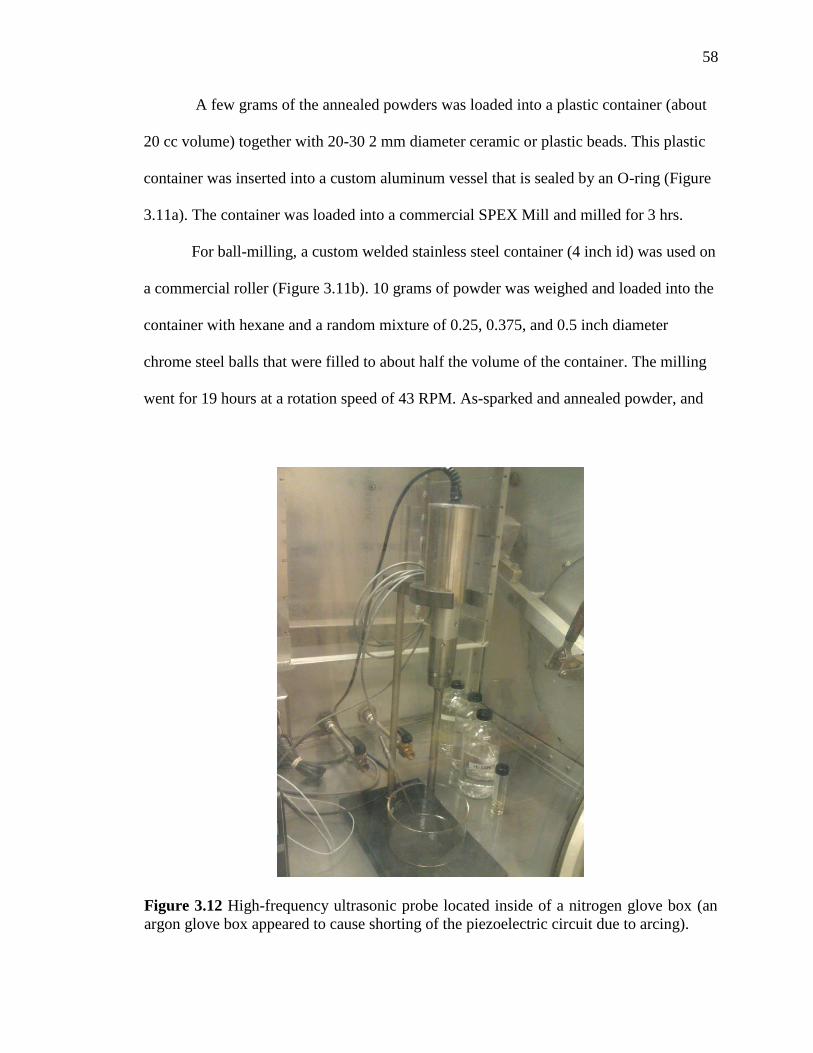
58
A few grams of the annealed powders was loaded into a plastic container (about
20 cc volume) together with 20-30 2 mm diameter ceramic or plastic beads. This plastic
container was inserted into a custom aluminum vessel that is sealed by an O-ring (Figure
3.11a). The container was loaded into a commercial SPEX Mill and milled for 3 hrs.
For ball-milling, a custom welded stainless steel container (4 inch id) was used on
a commercial roller (Figure 3.11b). 10 grams of powder was weighed and loaded into the
container with hexane and a random mixture of 0.25, 0.375, and 0.5 inch diameter
chrome steel balls that were filled to about half the volume of the container. The milling
went for 19 hours at a rotation speed of 43 RPM. As-sparked and annealed powder, and
Figure 3.12 High-frequency ultrasonic probe located inside of a nitrogen glove box (an
argon glove box appeared to cause shorting of the piezoelectric circuit due to arcing).
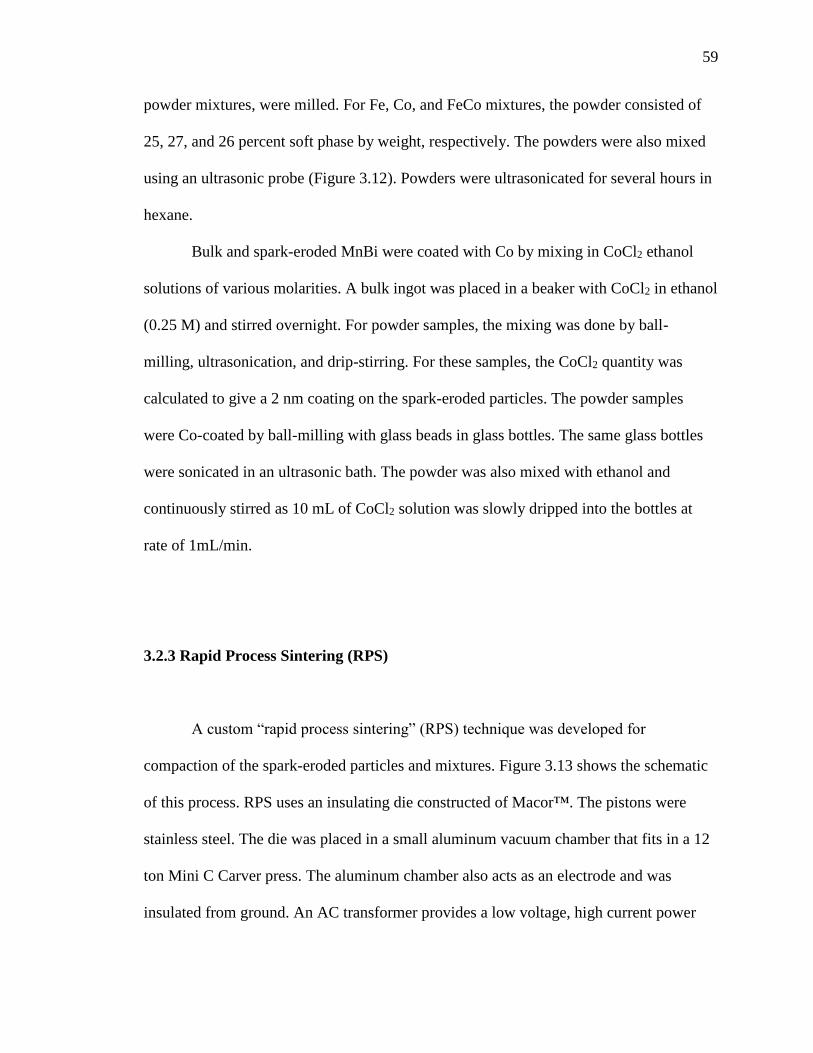
59
powder mixtures, were milled. For Fe, Co, and FeCo mixtures, the powder consisted of
25, 27, and 26 percent soft phase by weight, respectively. The powders were also mixed
using an ultrasonic probe (Figure 3.12). Powders were ultrasonicated for several hours in
hexane.
Bulk and spark-eroded MnBi were coated with Co by mixing in CoCl2 ethanol
solutions of various molarities. A bulk ingot was placed in a beaker with CoCl2 in ethanol
(0.25 M) and stirred overnight. For powder samples, the mixing was done by ball-
milling, ultrasonication, and drip-stirring. For these samples, the CoCl2 quantity was
calculated to give a 2 nm coating on the spark-eroded particles. The powder samples
were Co-coated by ball-milling with glass beads in glass bottles. The same glass bottles
were sonicated in an ultrasonic bath. The powder was also mixed with ethanol and
continuously stirred as 10 mL of CoCl2 solution was slowly dripped into the bottles at
rate of 1mL/min.
3.2.3 Rapid Process Sintering (RPS)
A custom “rapid process sintering” (RPS) technique was developed for
compaction of the spark-eroded particles and mixtures. Figure 3.13 shows the schematic
of this process. RPS uses an insulating die constructed of Macor™. The pistons were
stainless steel. The die was placed in a small aluminum vacuum chamber that fits in a 12
ton Mini C Carver press. The aluminum chamber also acts as an electrode and was
insulated from ground. An AC transformer provides a low voltage, high current power
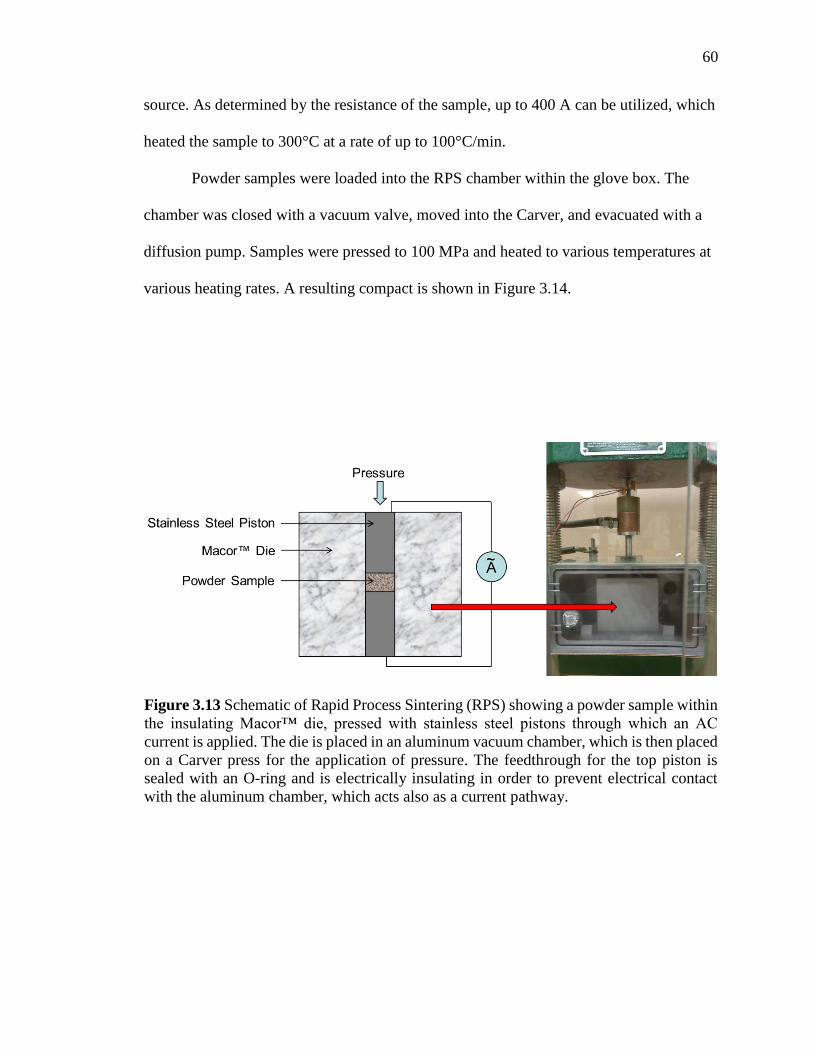
60
source. As determined by the resistance of the sample, up to 400 A can be utilized, which
heated the sample to 300°C at a rate of up to 100°C/min.
Powder samples were loaded into the RPS chamber within the glove box. The
chamber was closed with a vacuum valve, moved into the Carver, and evacuated with a
diffusion pump. Samples were pressed to 100 MPa and heated to various temperatures at
various heating rates. A resulting compact is shown in Figure 3.14.
Figure 3.13 Schematic of Rapid Process Sintering (RPS) showing a powder sample within
the insulating Macor™ die, pressed with stainless steel pistons through which an AC
current is applied. The die is placed in an aluminum vacuum chamber, which is then placed
on a Carver press for the application of pressure. The feedthrough for the top piston is
sealed with an O-ring and is electrically insulating in order to prevent electrical contact
with the aluminum chamber, which acts also as a current pathway.
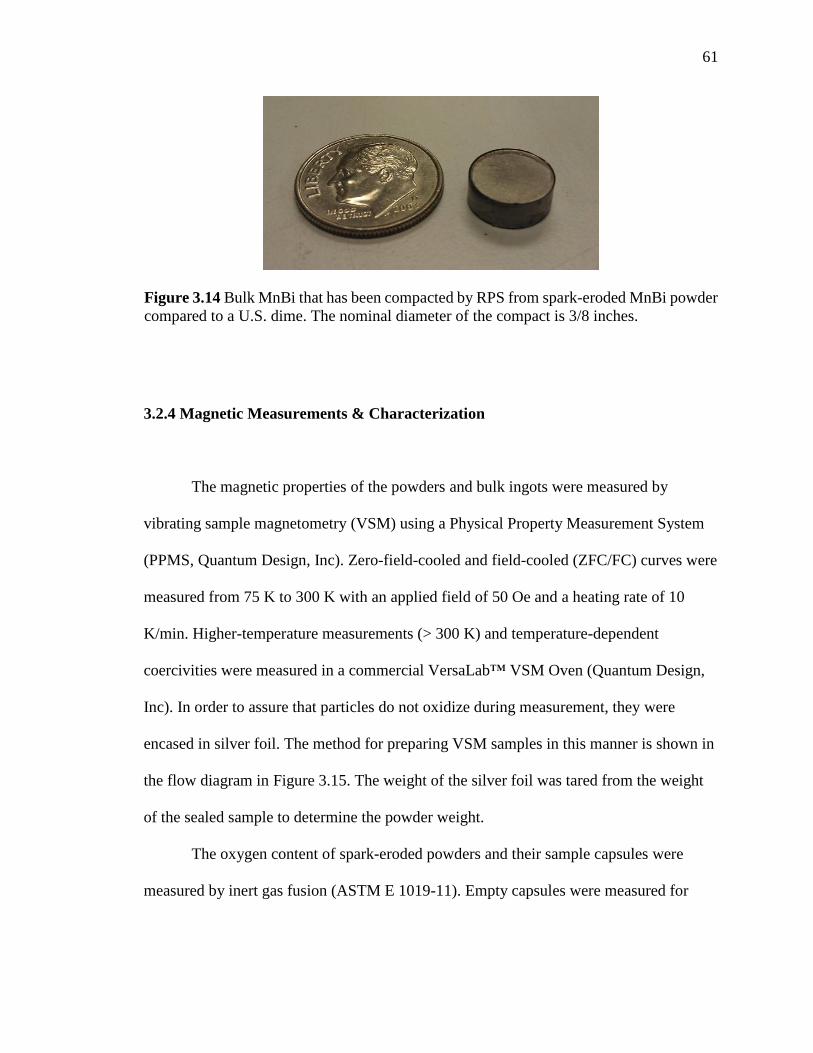
61
3.2.4 Magnetic Measurements & Characterization
The magnetic properties of the powders and bulk ingots were measured by
vibrating sample magnetometry (VSM) using a Physical Property Measurement System
(PPMS, Quantum Design, Inc). Zero-field-cooled and field-cooled (ZFC/FC) curves were
measured from 75 K to 300 K with an applied field of 50 Oe and a heating rate of 10
K/min. Higher-temperature measurements (> 300 K) and temperature-dependent
coercivities were measured in a commercial VersaLab™ VSM Oven (Quantum Design,
Inc). In order to assure that particles do not oxidize during measurement, they were
encased in silver foil. The method for preparing VSM samples in this manner is shown in
the flow diagram in Figure 3.15. The weight of the silver foil was tared from the weight
of the sealed sample to determine the powder weight.
The oxygen content of spark-eroded powders and their sample capsules were
measured by inert gas fusion (ASTM E 1019-11). Empty capsules were measured for
Figure 3.14 Bulk MnBi that has been compacted by RPS from spark-eroded MnBi powder
compared to a U.S. dime. The nominal diameter of the compact is 3/8 inches.
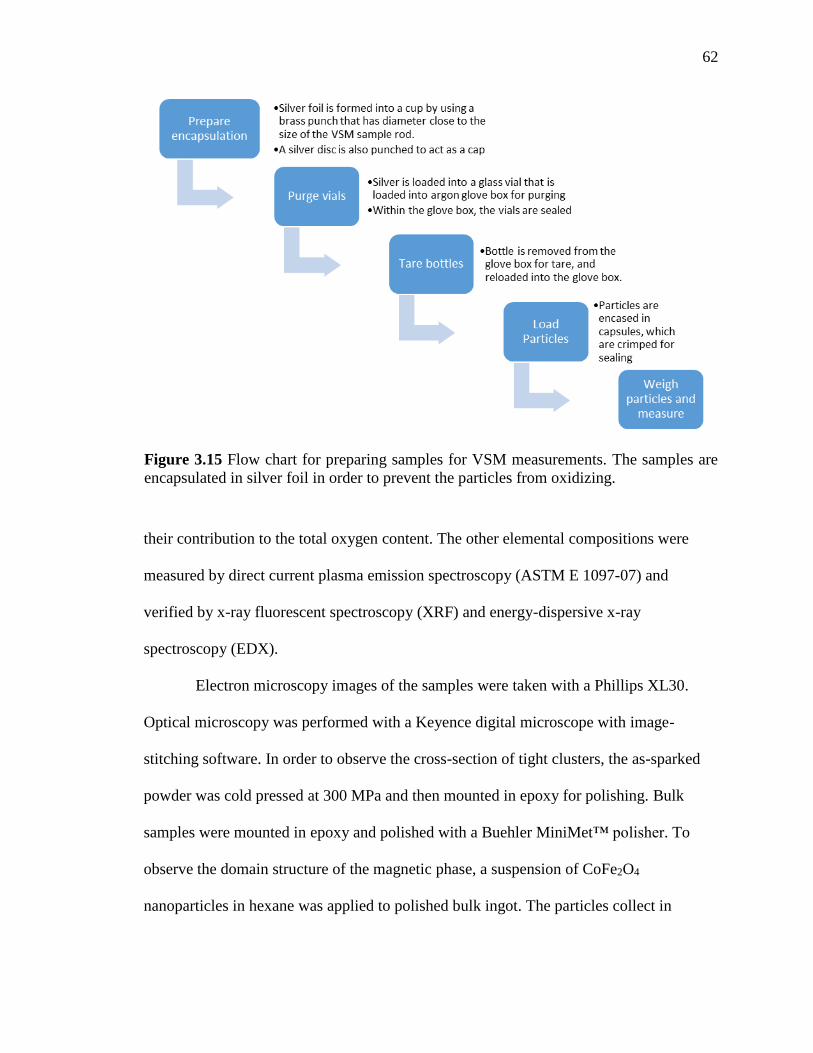
62
their contribution to the total oxygen content. The other elemental compositions were
measured by direct current plasma emission spectroscopy (ASTM E 1097-07) and
verified by x-ray fluorescent spectroscopy (XRF) and energy-dispersive x-ray
spectroscopy (EDX).
Electron microscopy images of the samples were taken with a Phillips XL30.
Optical microscopy was performed with a Keyence digital microscope with image-
stitching software. In order to observe the cross-section of tight clusters, the as-sparked
powder was cold pressed at 300 MPa and then mounted in epoxy for polishing. Bulk
samples were mounted in epoxy and polished with a Buehler MiniMet™ polisher. To
observe the domain structure of the magnetic phase, a suspension of CoFe2O4
nanoparticles in hexane was applied to polished bulk ingot. The particles collect in
Figure 3.15 Flow chart for preparing samples for VSM measurements. The samples are
encapsulated in silver foil in order to prevent the particles from oxidizing.
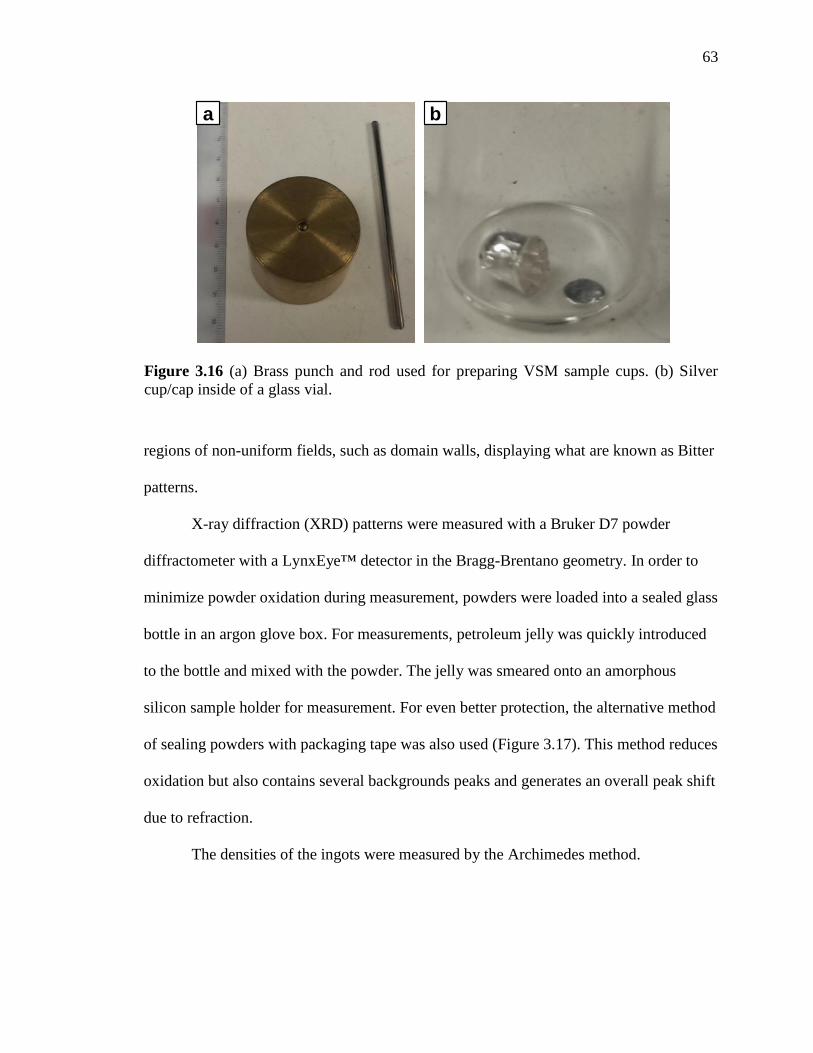
63
regions of non-uniform fields, such as domain walls, displaying what are known as Bitter
patterns.
X-ray diffraction (XRD) patterns were measured with a Bruker D7 powder
diffractometer with a LynxEye™ detector in the Bragg-Brentano geometry. In order to
minimize powder oxidation during measurement, powders were loaded into a sealed glass
bottle in an argon glove box. For measurements, petroleum jelly was quickly introduced
to the bottle and mixed with the powder. The jelly was smeared onto an amorphous
silicon sample holder for measurement. For even better protection, the alternative method
of sealing powders with packaging tape was also used (Figure 3.17). This method reduces
oxidation but also contains several backgrounds peaks and generates an overall peak shift
due to refraction.
The densities of the ingots were measured by the Archimedes method.
Figure 3.16 (a) Brass punch and rod used for preparing VSM sample cups. (b) Silver
cup/cap inside of a glass vial.
a b
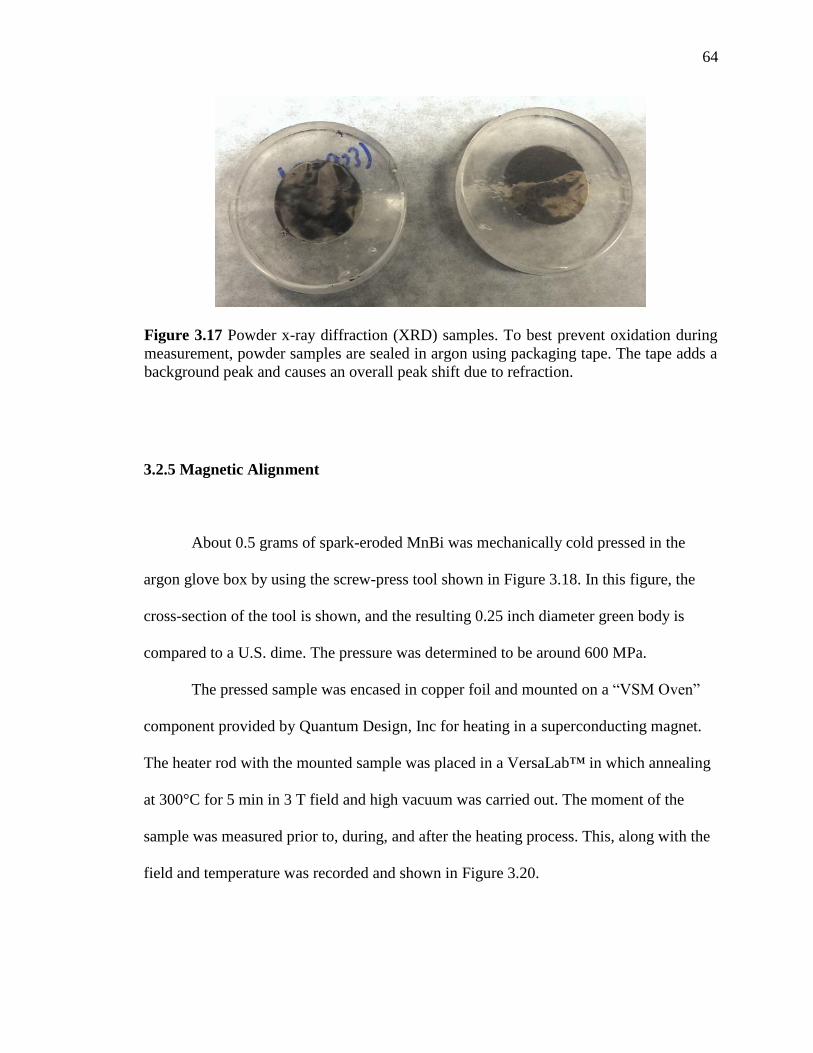
64
3.2.5 Magnetic Alignment
About 0.5 grams of spark-eroded MnBi was mechanically cold pressed in the
argon glove box by using the screw-press tool shown in Figure 3.18. In this figure, the
cross-section of the tool is shown, and the resulting 0.25 inch diameter green body is
compared to a U.S. dime. The pressure was determined to be around 600 MPa.
The pressed sample was encased in copper foil and mounted on a “VSM Oven”
component provided by Quantum Design, Inc for heating in a superconducting magnet.
The heater rod with the mounted sample was placed in a VersaLab™ in which annealing
at 300°C for 5 min in 3 T field and high vacuum was carried out. The moment of the
sample was measured prior to, during, and after the heating process. This, along with the
field and temperature was recorded and shown in Figure 3.20.
Figure 3.17 Powder x-ray diffraction (XRD) samples. To best prevent oxidation during
measurement, powder samples are sealed in argon using packaging tape. The tape adds a
background peak and causes an overall peak shift due to refraction.
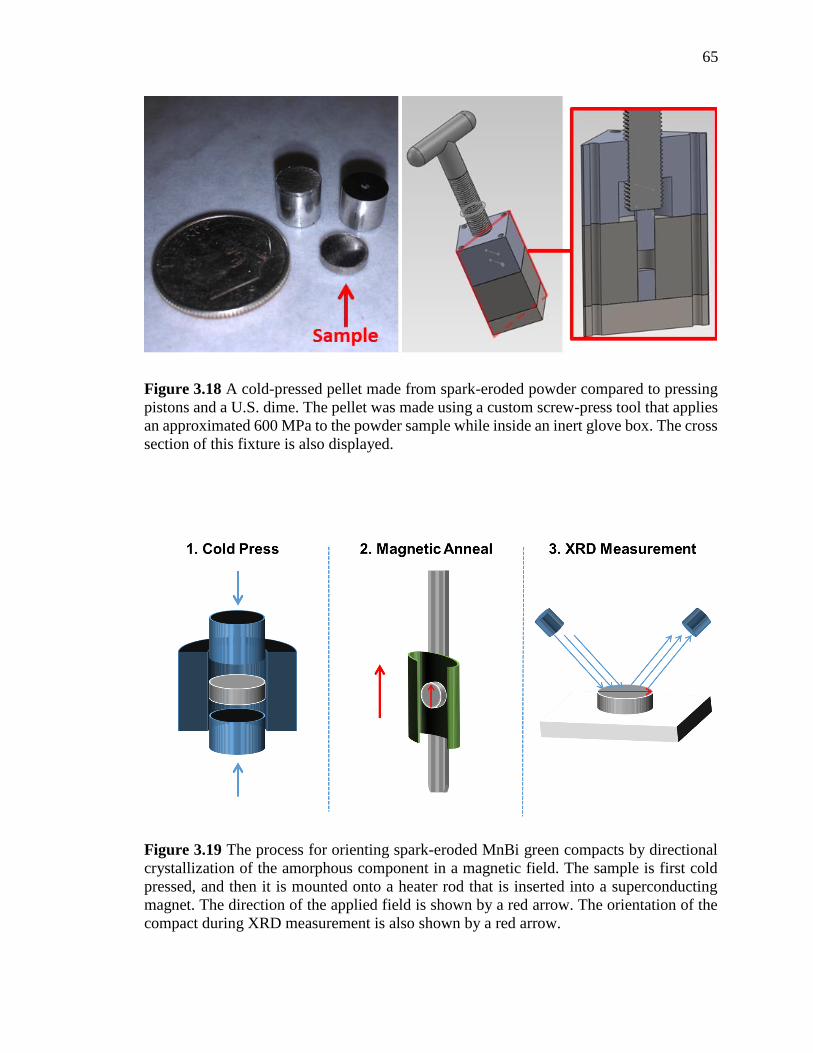
65
Figure 3.18 A cold-pressed pellet made from spark-eroded powder compared to pressing
pistons and a U.S. dime. The pellet was made using a custom screw-press tool that applies
an approximated 600 MPa to the powder sample while inside an inert glove box. The cross
section of this fixture is also displayed.
Figure 3.19 The process for orienting spark-eroded MnBi green compacts by directional
crystallization of the amorphous component in a magnetic field. The sample is first cold
pressed, and then it is mounted onto a heater rod that is inserted into a superconducting
magnet. The direction of the applied field is shown by a red arrow. The orientation of the
compact during XRD measurement is also shown by a red arrow.
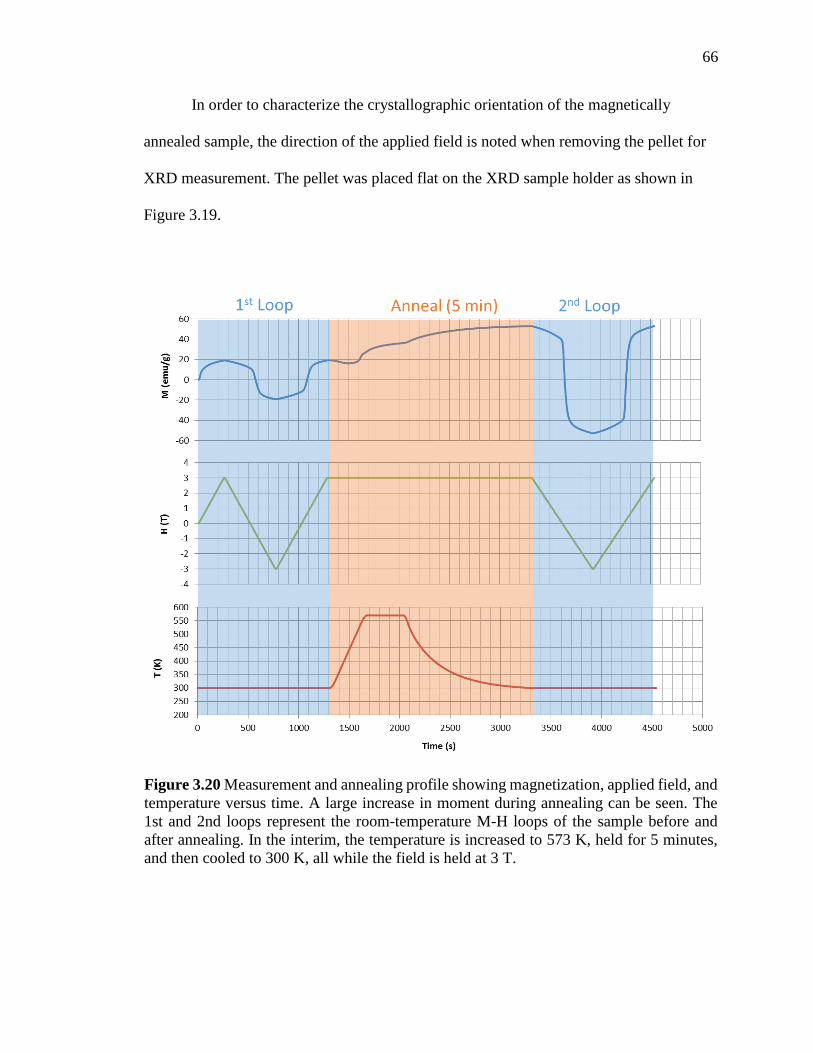
66
In order to characterize the crystallographic orientation of the magnetically
annealed sample, the direction of the applied field is noted when removing the pellet for
XRD measurement. The pellet was placed flat on the XRD sample holder as shown in
Figure 3.19.
Figure 3.20 Measurement and annealing profile showing magnetization, applied field, and
temperature versus time. A large increase in moment during annealing can be seen. The
1st and 2nd loops represent the room-temperature M-H loops of the sample before and
after annealing. In the interim, the temperature is increased to 573 K, held for 5 minutes,
and then cooled to 300 K, all while the field is held at 3 T.
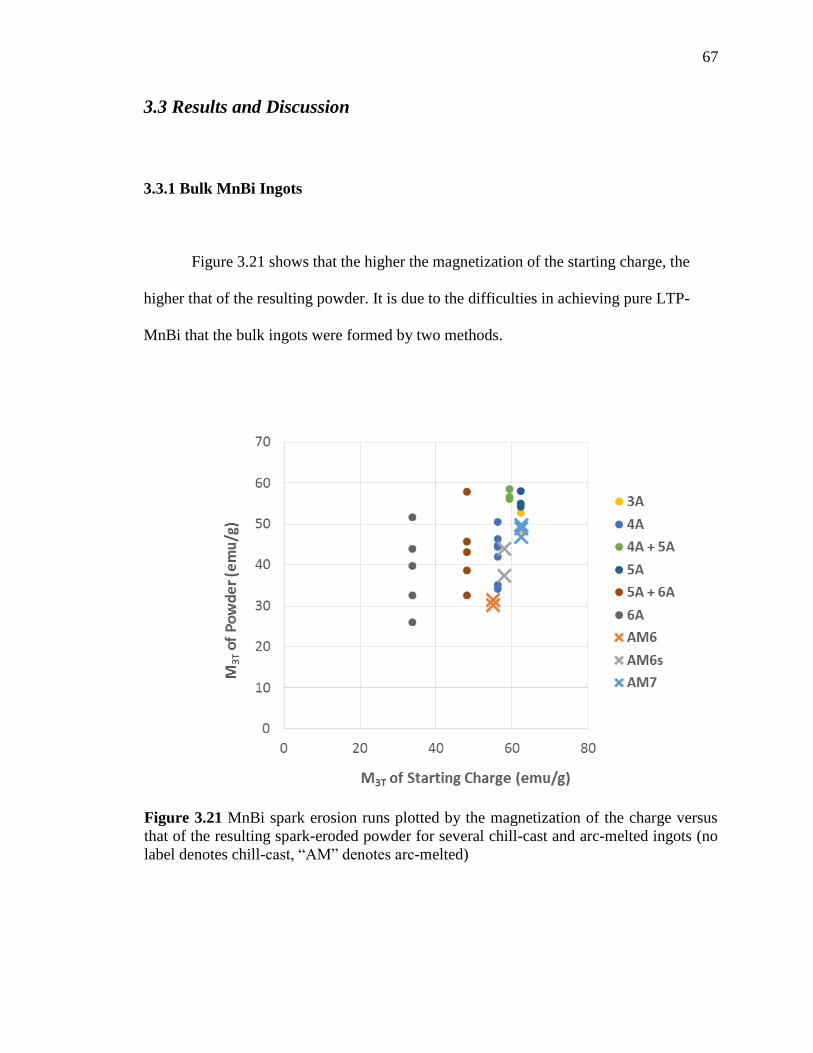
67
3.3 Results and Discussion
3.3.1 Bulk MnBi Ingots
Figure 3.21 shows that the higher the magnetization of the starting charge, the
higher that of the resulting powder. It is due to the difficulties in achieving pure LTP-
MnBi that the bulk ingots were formed by two methods.
Figure 3.21 MnBi spark erosion runs plotted by the magnetization of the charge versus
that of the resulting spark-eroded powder for several chill-cast and arc-melted ingots (no
label denotes chill-cast, “AM” denotes arc-melted)
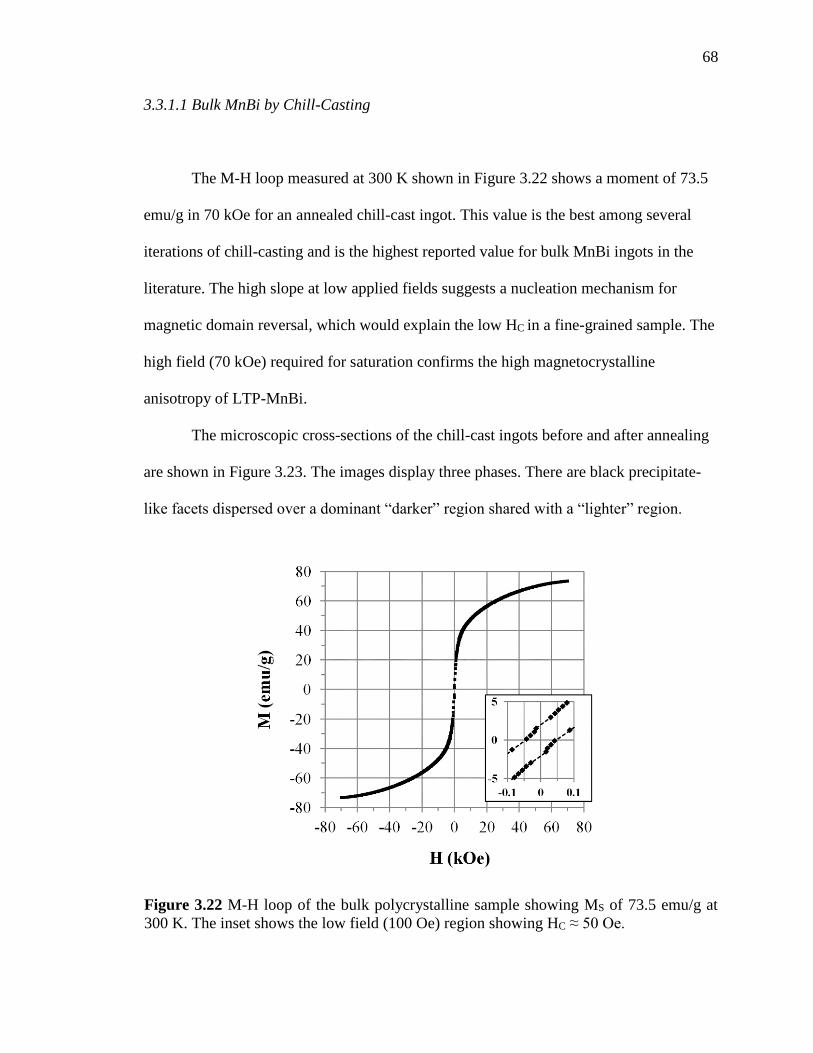
68
3.3.1.1 Bulk MnBi by Chill-Casting
The M-H loop measured at 300 K shown in Figure 3.22 shows a moment of 73.5
emu/g in 70 kOe for an annealed chill-cast ingot. This value is the best among several
iterations of chill-casting and is the highest reported value for bulk MnBi ingots in the
literature. The high slope at low applied fields suggests a nucleation mechanism for
magnetic domain reversal, which would explain the low HC in a fine-grained sample. The
high field (70 kOe) required for saturation confirms the high magnetocrystalline
anisotropy of LTP-MnBi.
The microscopic cross-sections of the chill-cast ingots before and after annealing
are shown in Figure 3.23. The images display three phases. There are black precipitate-
like facets dispersed over a dominant “darker” region shared with a “lighter” region.
Figure 3.22 M-H loop of the bulk polycrystalline sample showing MS of 73.5 emu/g at
300 K. The inset shows the low field (100 Oe) region showing HC ≈ 50 Oe.
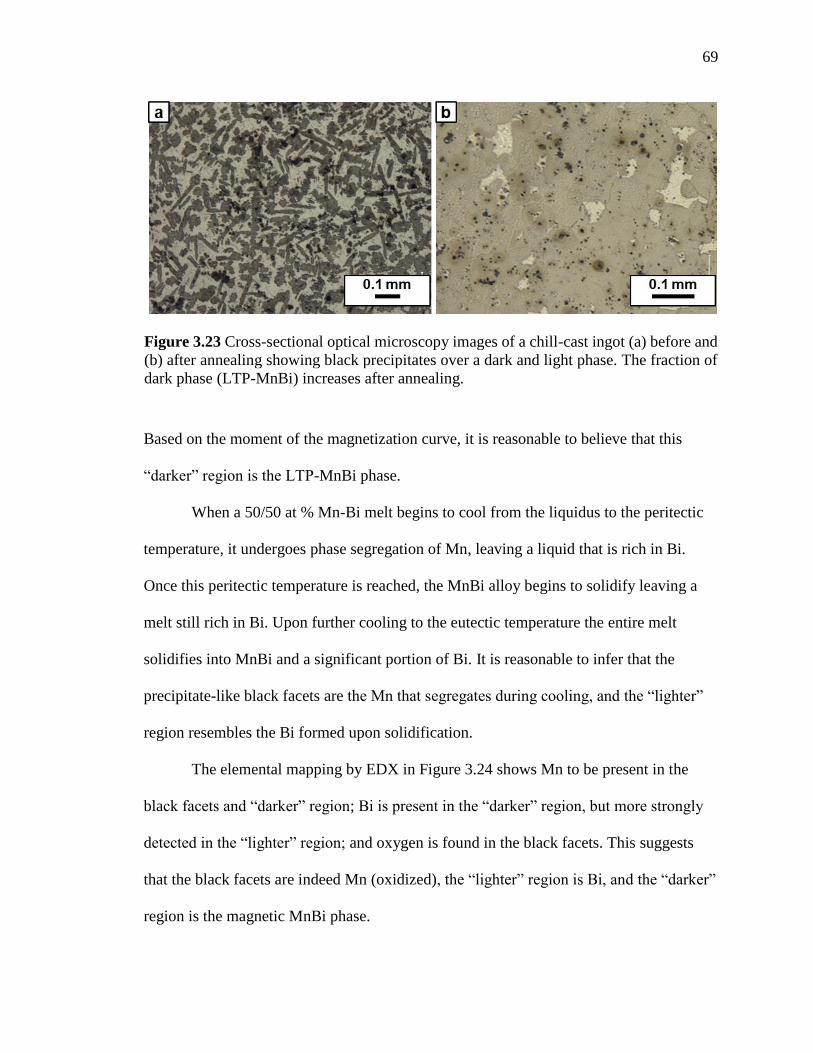
69
Based on the moment of the magnetization curve, it is reasonable to believe that this
“darker” region is the LTP-MnBi phase.
When a 50/50 at % Mn-Bi melt begins to cool from the liquidus to the peritectic
temperature, it undergoes phase segregation of Mn, leaving a liquid that is rich in Bi.
Once this peritectic temperature is reached, the MnBi alloy begins to solidify leaving a
melt still rich in Bi. Upon further cooling to the eutectic temperature the entire melt
solidifies into MnBi and a significant portion of Bi. It is reasonable to infer that the
precipitate-like black facets are the Mn that segregates during cooling, and the “lighter”
region resembles the Bi formed upon solidification.
The elemental mapping by EDX in Figure 3.24 shows Mn to be present in the
black facets and “darker” region; Bi is present in the “darker” region, but more strongly
detected in the “lighter” region; and oxygen is found in the black facets. This suggests
that the black facets are indeed Mn (oxidized), the “lighter” region is Bi, and the “darker”
region is the magnetic MnBi phase.
Figure 3.23 Cross-sectional optical microscopy images of a chill-cast ingot (a) before and
(b) after annealing showing black precipitates over a dark and light phase. The fraction of
dark phase (LTP-MnBi) increases after annealing.
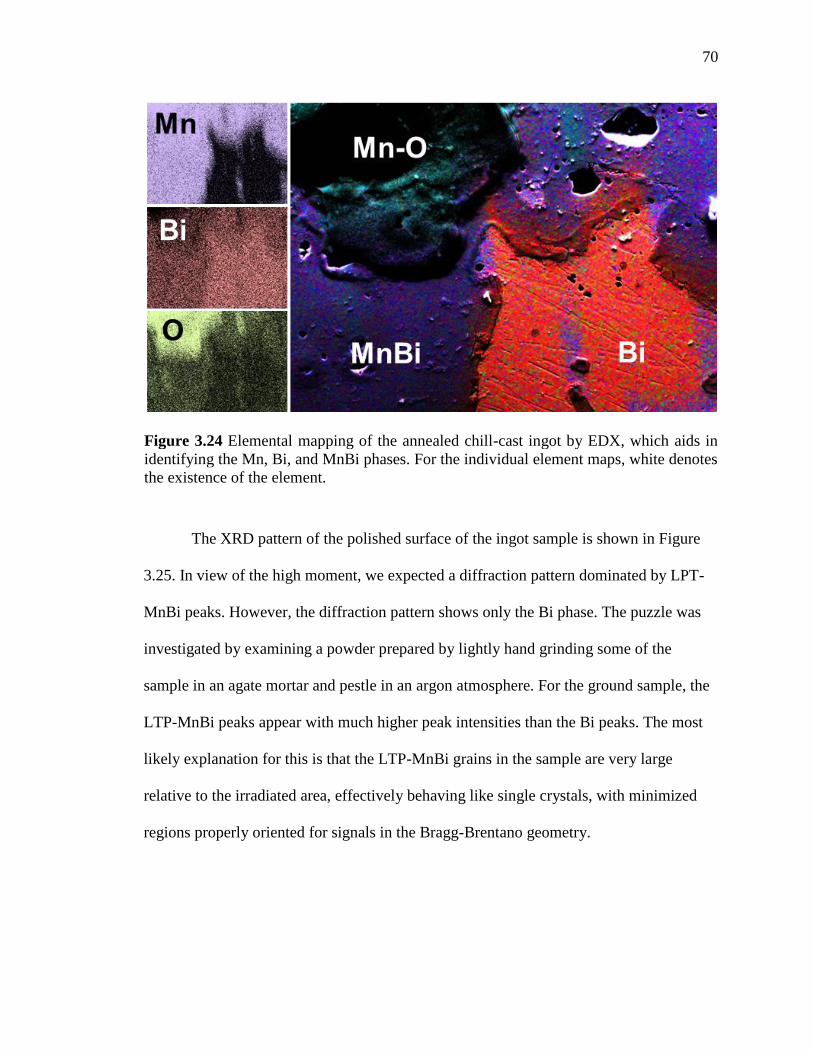
70
The XRD pattern of the polished surface of the ingot sample is shown in Figure
3.25. In view of the high moment, we expected a diffraction pattern dominated by LPT-
MnBi peaks. However, the diffraction pattern shows only the Bi phase. The puzzle was
investigated by examining a powder prepared by lightly hand grinding some of the
sample in an agate mortar and pestle in an argon atmosphere. For the ground sample, the
LTP-MnBi peaks appear with much higher peak intensities than the Bi peaks. The most
likely explanation for this is that the LTP-MnBi grains in the sample are very large
relative to the irradiated area, effectively behaving like single crystals, with minimized
regions properly oriented for signals in the Bragg-Brentano geometry.
Figure 3.24 Elemental mapping of the annealed chill-cast ingot by EDX, which aids in
identifying the Mn, Bi, and MnBi phases. For the individual element maps, white denotes
the existence of the element.
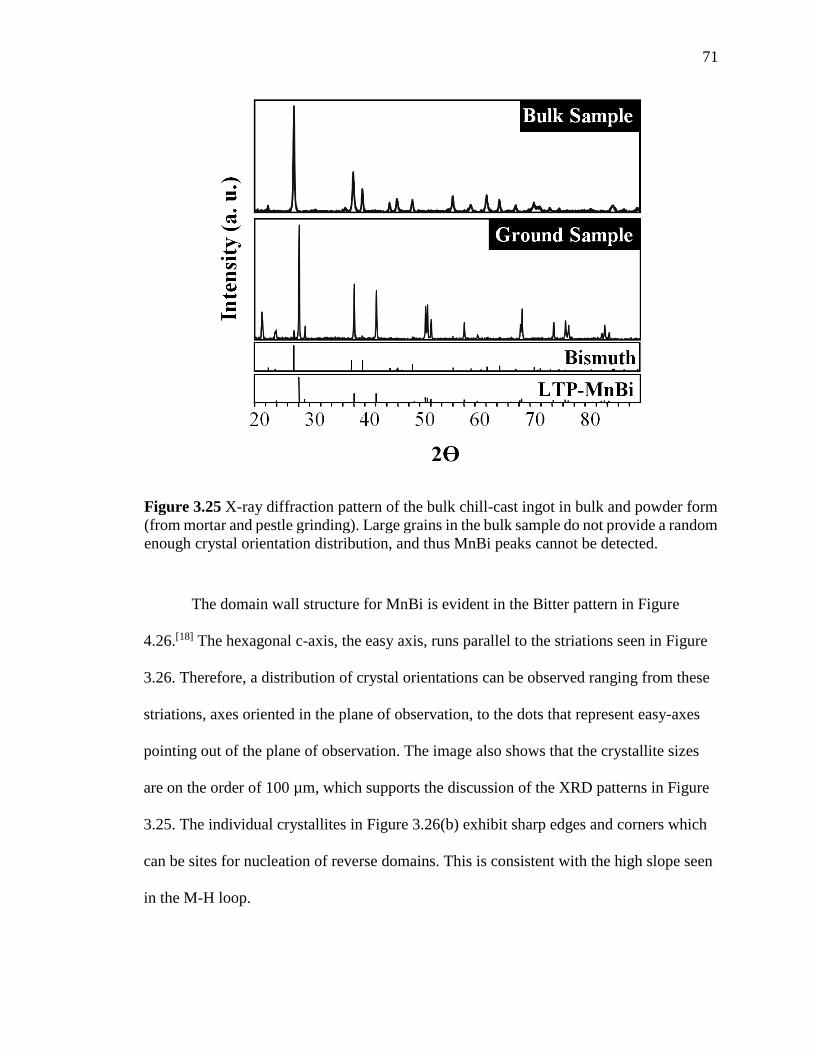
71
The domain wall structure for MnBi is evident in the Bitter pattern in Figure
4.26.[18] The hexagonal c-axis, the easy axis, runs parallel to the striations seen in Figure
3.26. Therefore, a distribution of crystal orientations can be observed ranging from these
striations, axes oriented in the plane of observation, to the dots that represent easy-axes
pointing out of the plane of observation. The image also shows that the crystallite sizes
are on the order of 100 µm, which supports the discussion of the XRD patterns in Figure
3.25. The individual crystallites in Figure 3.26(b) exhibit sharp edges and corners which
can be sites for nucleation of reverse domains. This is consistent with the high slope seen
in the M-H loop.
Figure 3.25 X-ray diffraction pattern of the bulk chill-cast ingot in bulk and powder form
(from mortar and pestle grinding). Large grains in the bulk sample do not provide a random
enough crystal orientation distribution, and thus MnBi peaks cannot be detected.
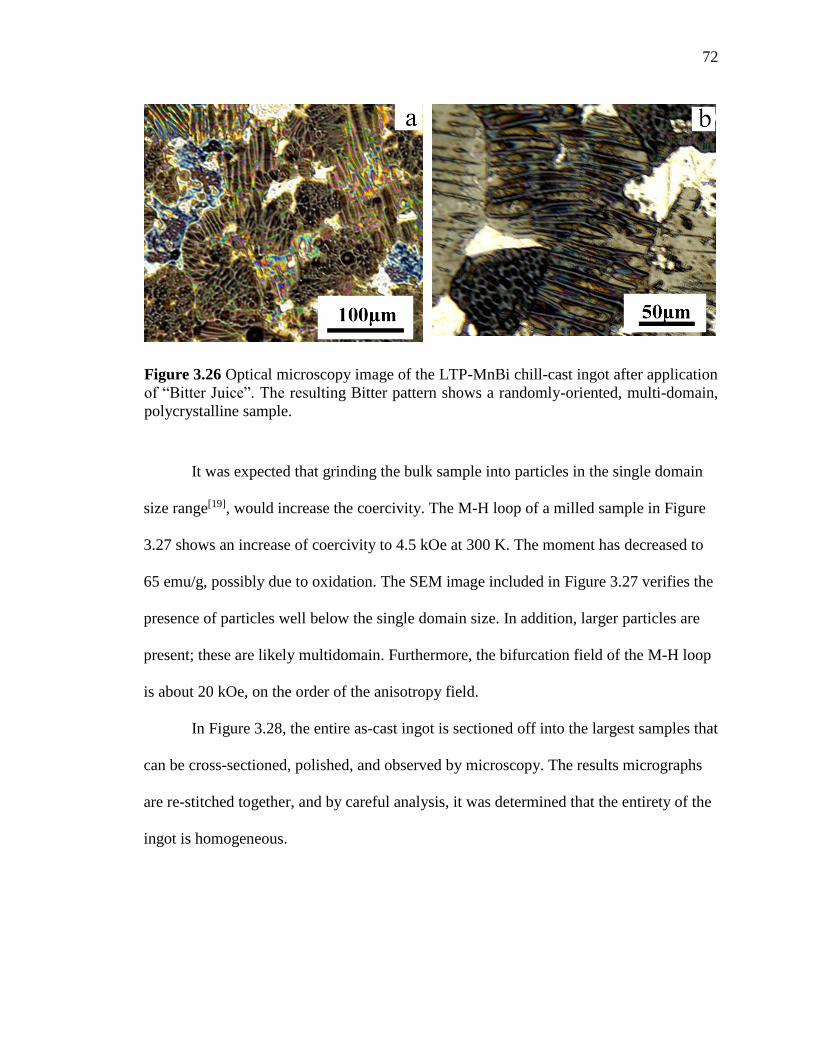
72
It was expected that grinding the bulk sample into particles in the single domain
size range[19], would increase the coercivity. The M-H loop of a milled sample in Figure
3.27 shows an increase of coercivity to 4.5 kOe at 300 K. The moment has decreased to
65 emu/g, possibly due to oxidation. The SEM image included in Figure 3.27 verifies the
presence of particles well below the single domain size. In addition, larger particles are
present; these are likely multidomain. Furthermore, the bifurcation field of the M-H loop
is about 20 kOe, on the order of the anisotropy field.
In Figure 3.28, the entire as-cast ingot is sectioned off into the largest samples that
can be cross-sectioned, polished, and observed by microscopy. The results micrographs
are re-stitched together, and by careful analysis, it was determined that the entirety of the
ingot is homogeneous.
Figure 3.26 Optical microscopy image of the LTP-MnBi chill-cast ingot after application
of “Bitter Juice”. The resulting Bitter pattern shows a randomly-oriented, multi-domain,
polycrystalline sample.
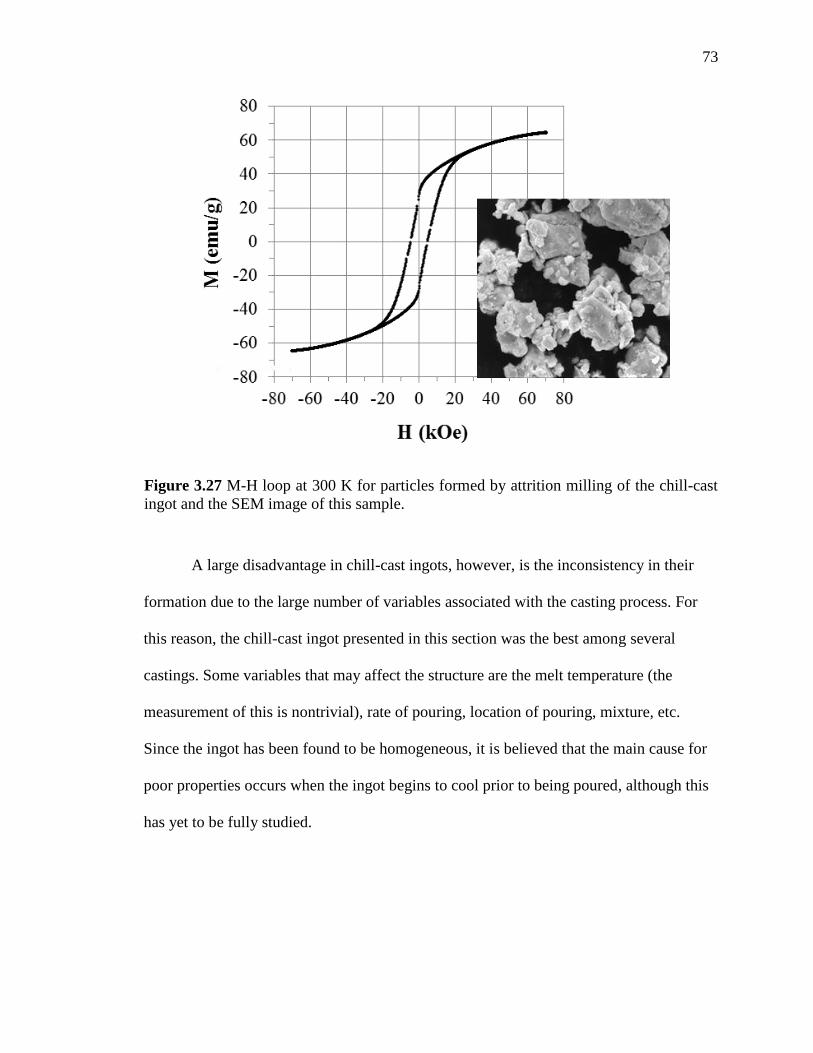
73
A large disadvantage in chill-cast ingots, however, is the inconsistency in their
formation due to the large number of variables associated with the casting process. For
this reason, the chill-cast ingot presented in this section was the best among several
castings. Some variables that may affect the structure are the melt temperature (the
measurement of this is nontrivial), rate of pouring, location of pouring, mixture, etc.
Since the ingot has been found to be homogeneous, it is believed that the main cause for
poor properties occurs when the ingot begins to cool prior to being poured, although this
has yet to be fully studied.
Figure 3.27 M-H loop at 300 K for particles formed by attrition milling of the chill-cast
ingot and the SEM image of this sample.
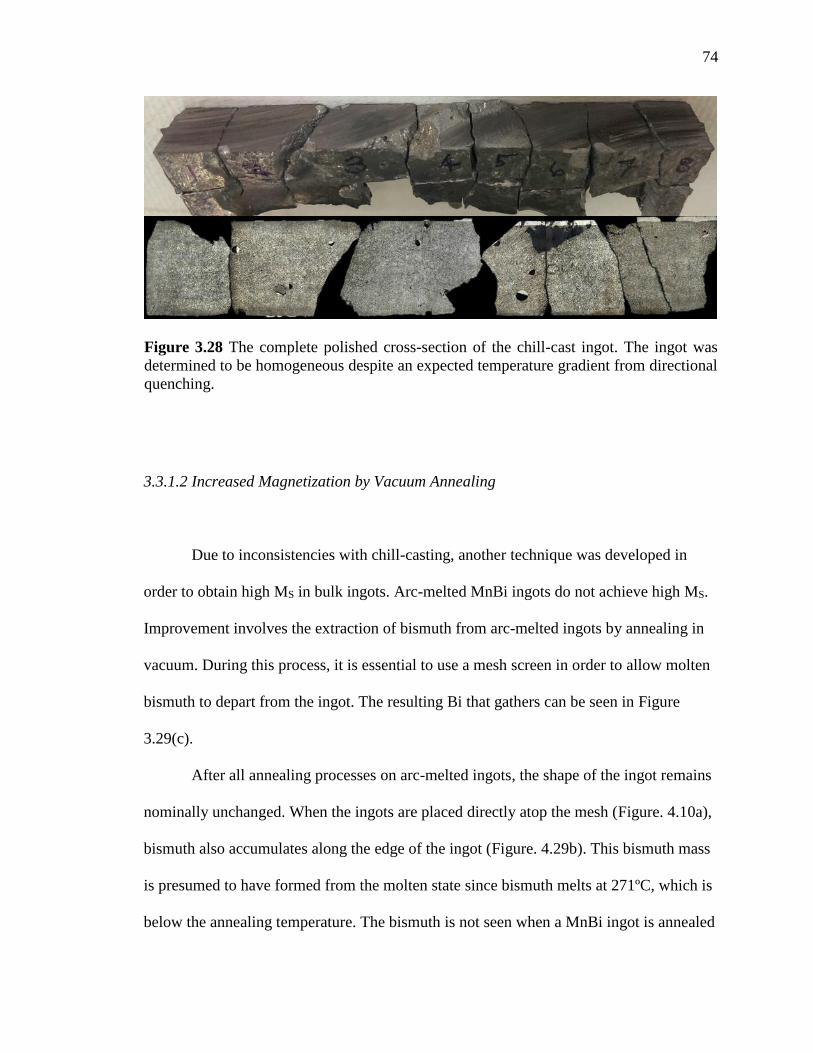
74
3.3.1.2 Increased Magnetization by Vacuum Annealing
Due to inconsistencies with chill-casting, another technique was developed in
order to obtain high MS in bulk ingots. Arc-melted MnBi ingots do not achieve high MS.
Improvement involves the extraction of bismuth from arc-melted ingots by annealing in
vacuum. During this process, it is essential to use a mesh screen in order to allow molten
bismuth to depart from the ingot. The resulting Bi that gathers can be seen in Figure
3.29(c).
After all annealing processes on arc-melted ingots, the shape of the ingot remains
nominally unchanged. When the ingots are placed directly atop the mesh (Figure. 4.10a),
bismuth also accumulates along the edge of the ingot (Figure. 4.29b). This bismuth mass
is presumed to have formed from the molten state since bismuth melts at 271ºC, which is
below the annealing temperature. The bismuth is not seen when a MnBi ingot is annealed
Figure 3.28 The complete polished cross-section of the chill-cast ingot. The ingot was
determined to be homogeneous despite an expected temperature gradient from directional
quenching.
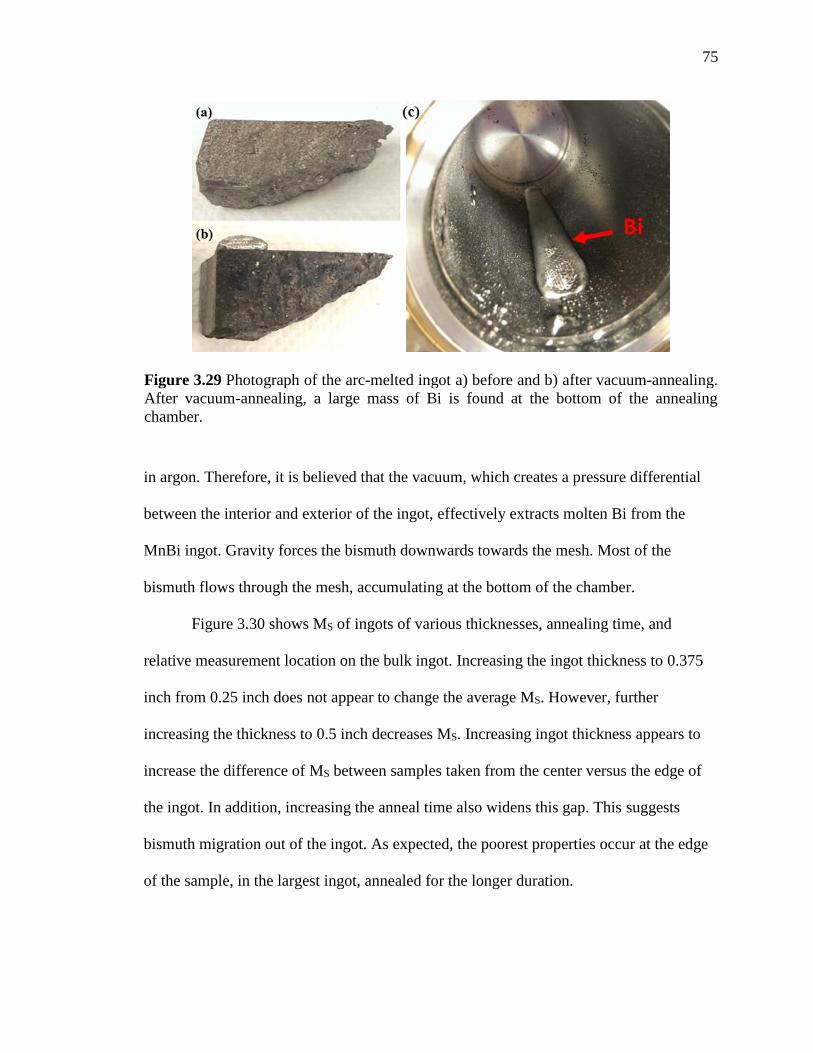
75
in argon. Therefore, it is believed that the vacuum, which creates a pressure differential
between the interior and exterior of the ingot, effectively extracts molten Bi from the
MnBi ingot. Gravity forces the bismuth downwards towards the mesh. Most of the
bismuth flows through the mesh, accumulating at the bottom of the chamber.
Figure 3.30 shows MS of ingots of various thicknesses, annealing time, and
relative measurement location on the bulk ingot. Increasing the ingot thickness to 0.375
inch from 0.25 inch does not appear to change the average MS. However, further
increasing the thickness to 0.5 inch decreases MS. Increasing ingot thickness appears to
increase the difference of MS between samples taken from the center versus the edge of
the ingot. In addition, increasing the anneal time also widens this gap. This suggests
bismuth migration out of the ingot. As expected, the poorest properties occur at the edge
of the sample, in the largest ingot, annealed for the longer duration.
Figure 3.29 Photograph of the arc-melted ingot a) before and b) after vacuum-annealing.
After vacuum-annealing, a large mass of Bi is found at the bottom of the annealing
chamber.
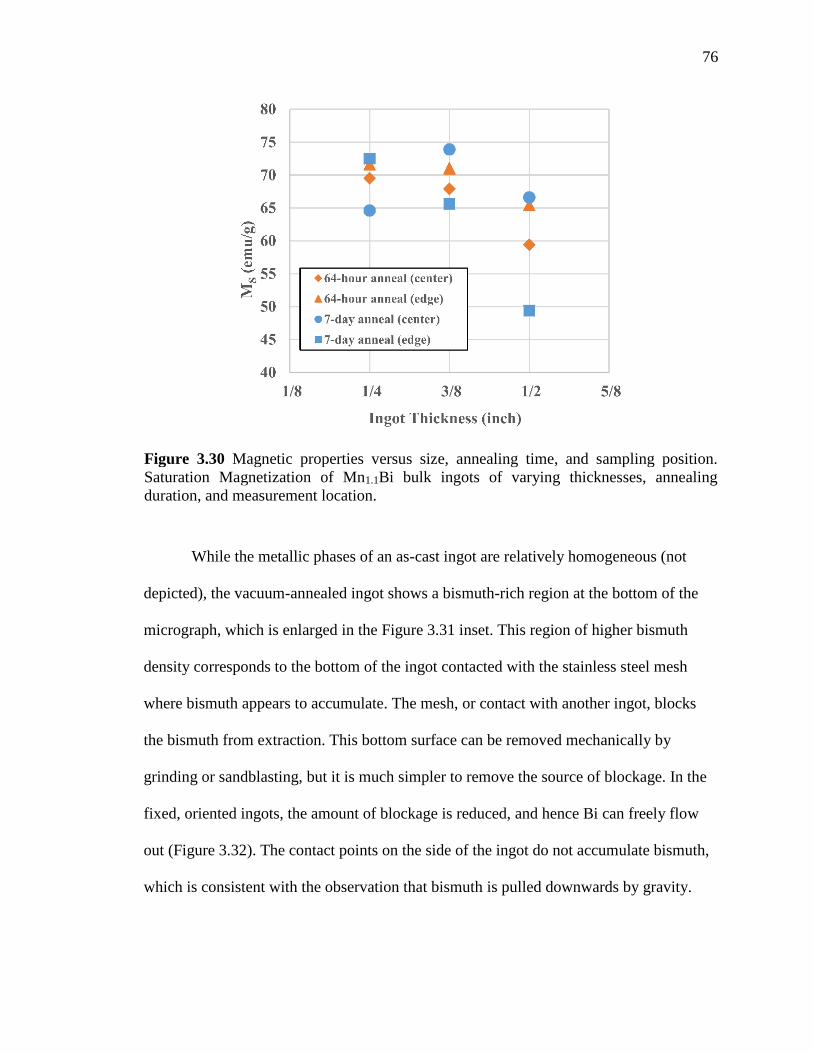
76
While the metallic phases of an as-cast ingot are relatively homogeneous (not
depicted), the vacuum-annealed ingot shows a bismuth-rich region at the bottom of the
micrograph, which is enlarged in the Figure 3.31 inset. This region of higher bismuth
density corresponds to the bottom of the ingot contacted with the stainless steel mesh
where bismuth appears to accumulate. The mesh, or contact with another ingot, blocks
the bismuth from extraction. This bottom surface can be removed mechanically by
grinding or sandblasting, but it is much simpler to remove the source of blockage. In the
fixed, oriented ingots, the amount of blockage is reduced, and hence Bi can freely flow
out (Figure 3.32). The contact points on the side of the ingot do not accumulate bismuth,
which is consistent with the observation that bismuth is pulled downwards by gravity.
Figure 3.30 Magnetic properties versus size, annealing time, and sampling position.
Saturation Magnetization of Mn1.1Bi bulk ingots of varying thicknesses, annealing
duration, and measurement location.
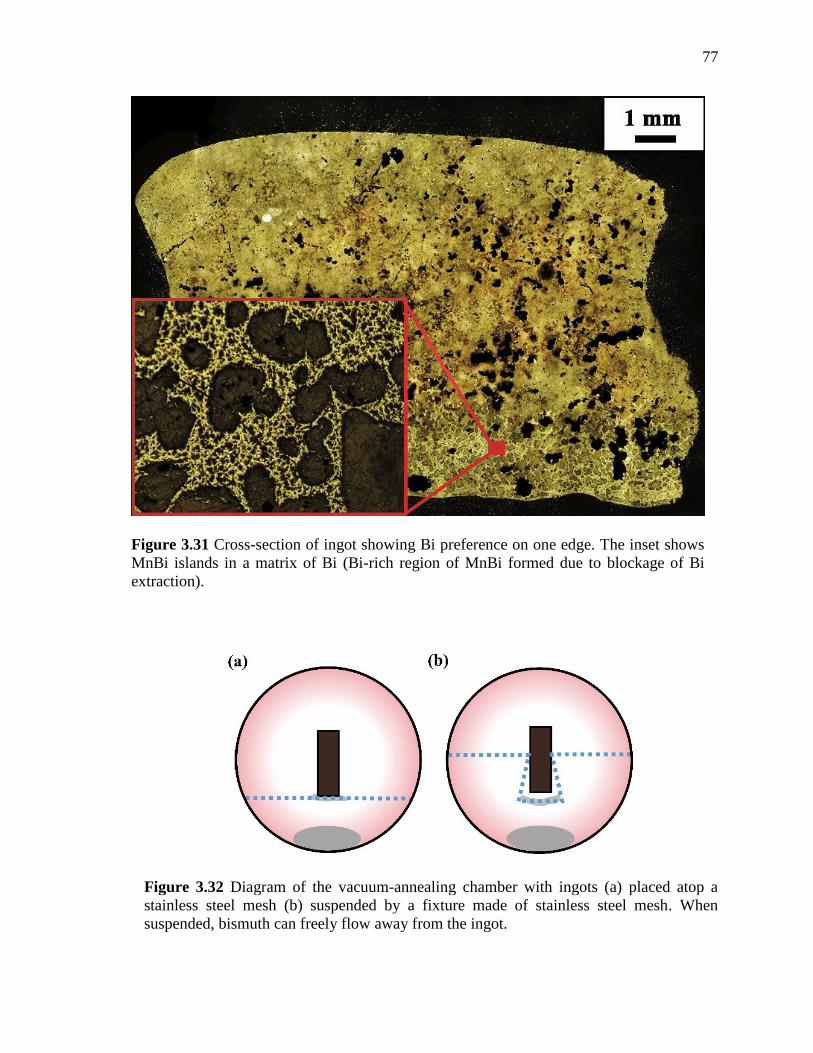
77
Figure 3.31 Cross-section of ingot showing Bi preference on one edge. The inset shows
MnBi islands in a matrix of Bi (Bi-rich region of MnBi formed due to blockage of Bi
extraction).
Figure 3.32 Diagram of the vacuum-annealing chamber with ingots (a) placed atop a
stainless steel mesh (b) suspended by a fixture made of stainless steel mesh. When
suspended, bismuth can freely flow away from the ingot.
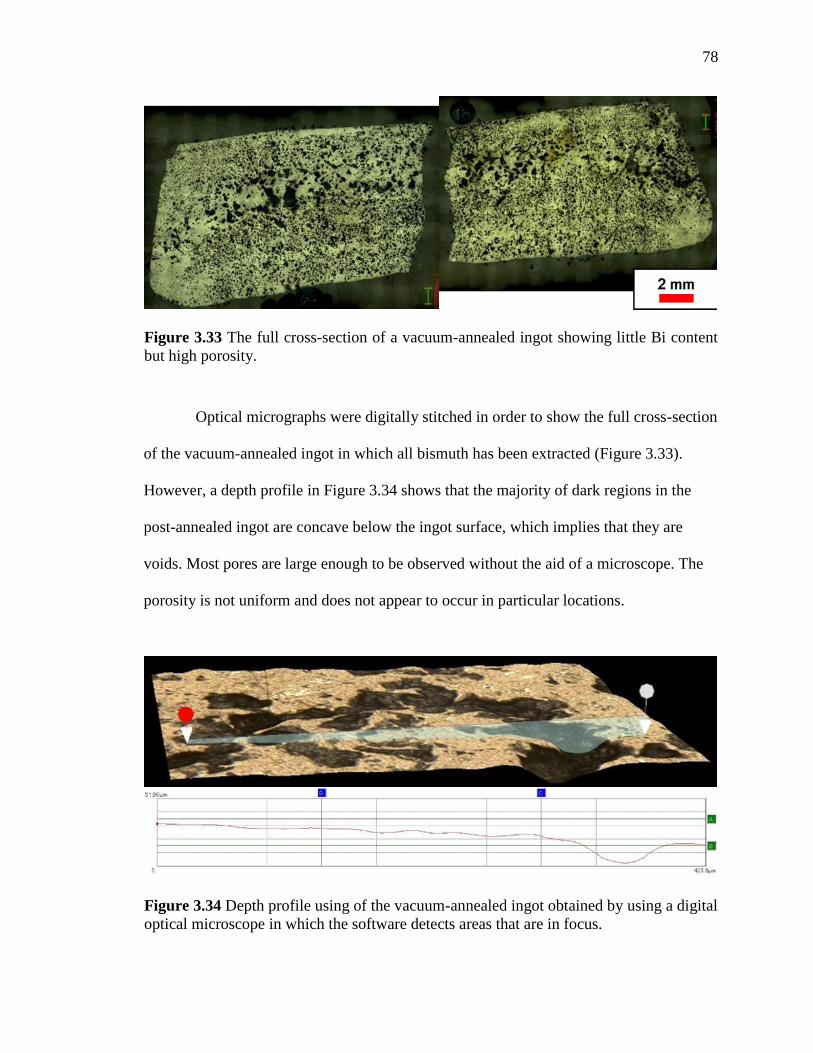
78
Optical micrographs were digitally stitched in order to show the full cross-section
of the vacuum-annealed ingot in which all bismuth has been extracted (Figure 3.33).
However, a depth profile in Figure 3.34 shows that the majority of dark regions in the
post-annealed ingot are concave below the ingot surface, which implies that they are
voids. Most pores are large enough to be observed without the aid of a microscope. The
porosity is not uniform and does not appear to occur in particular locations.
Figure 3.34 Depth profile using of the vacuum-annealed ingot obtained by using a digital
optical microscope in which the software detects areas that are in focus.
Figure 3.33 The full cross-section of a vacuum-annealed ingot showing little Bi content
but high porosity.
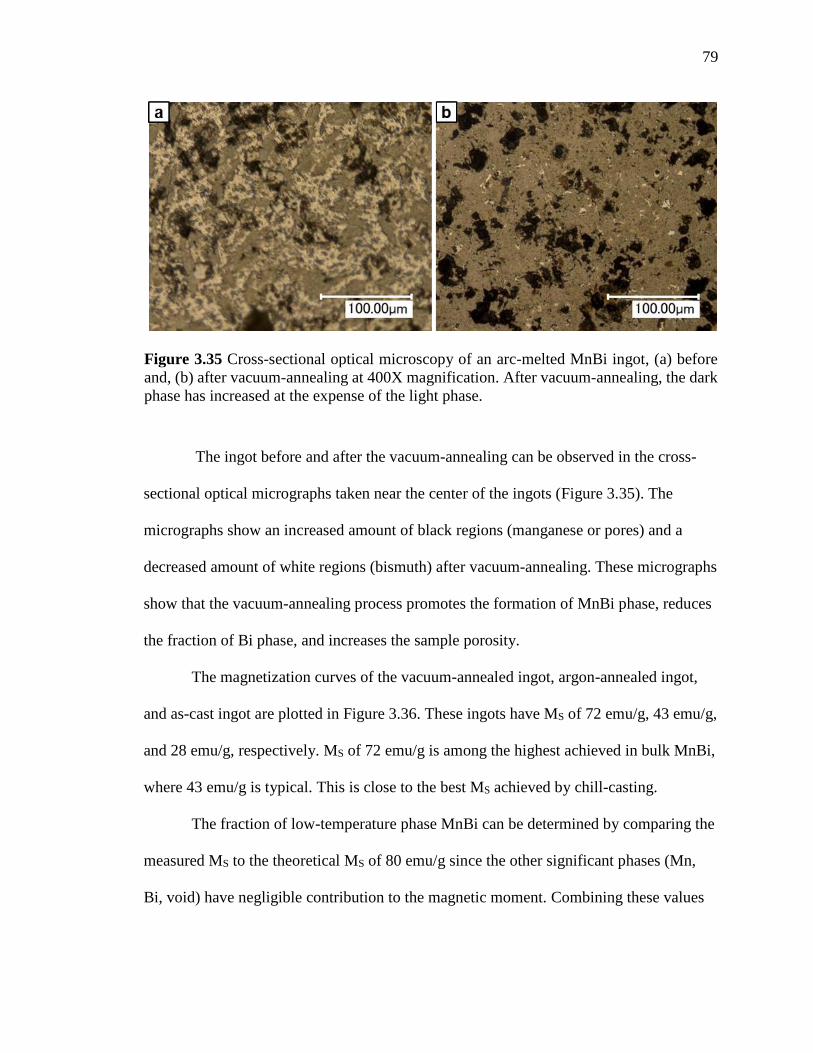
79
The ingot before and after the vacuum-annealing can be observed in the cross-
sectional optical micrographs taken near the center of the ingots (Figure 3.35). The
micrographs show an increased amount of black regions (manganese or pores) and a
decreased amount of white regions (bismuth) after vacuum-annealing. These micrographs
show that the vacuum-annealing process promotes the formation of MnBi phase, reduces
the fraction of Bi phase, and increases the sample porosity.
The magnetization curves of the vacuum-annealed ingot, argon-annealed ingot,
and as-cast ingot are plotted in Figure 3.36. These ingots have MS of 72 emu/g, 43 emu/g,
and 28 emu/g, respectively. MS of 72 emu/g is among the highest achieved in bulk MnBi,
where 43 emu/g is typical. This is close to the best MS achieved by chill-casting.
The fraction of low-temperature phase MnBi can be determined by comparing the
measured MS to the theoretical MS of 80 emu/g since the other significant phases (Mn,
Bi, void) have negligible contribution to the magnetic moment. Combining these values
Figure 3.35 Cross-sectional optical microscopy of an arc-melted MnBi ingot, (a) before
and, (b) after vacuum-annealing at 400X magnification. After vacuum-annealing, the dark
phase has increased at the expense of the light phase.
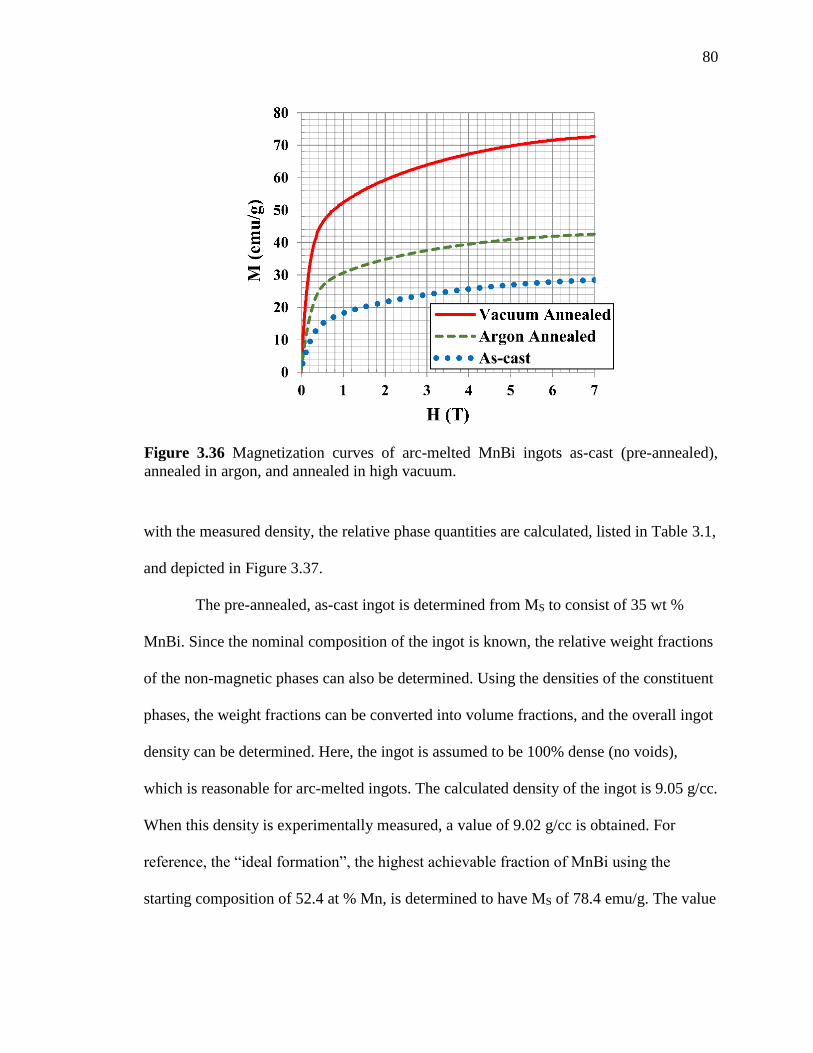
80
with the measured density, the relative phase quantities are calculated, listed in Table 3.1,
and depicted in Figure 3.37.
The pre-annealed, as-cast ingot is determined from MS to consist of 35 wt %
MnBi. Since the nominal composition of the ingot is known, the relative weight fractions
of the non-magnetic phases can also be determined. Using the densities of the constituent
phases, the weight fractions can be converted into volume fractions, and the overall ingot
density can be determined. Here, the ingot is assumed to be 100% dense (no voids),
which is reasonable for arc-melted ingots. The calculated density of the ingot is 9.05 g/cc.
When this density is experimentally measured, a value of 9.02 g/cc is obtained. For
reference, the “ideal formation”, the highest achievable fraction of MnBi using the
starting composition of 52.4 at % Mn, is determined to have MS of 78.4 emu/g. The value
Figure 3.36 Magnetization curves of arc-melted MnBi ingots as-cast (pre-annealed),
annealed in argon, and annealed in high vacuum.
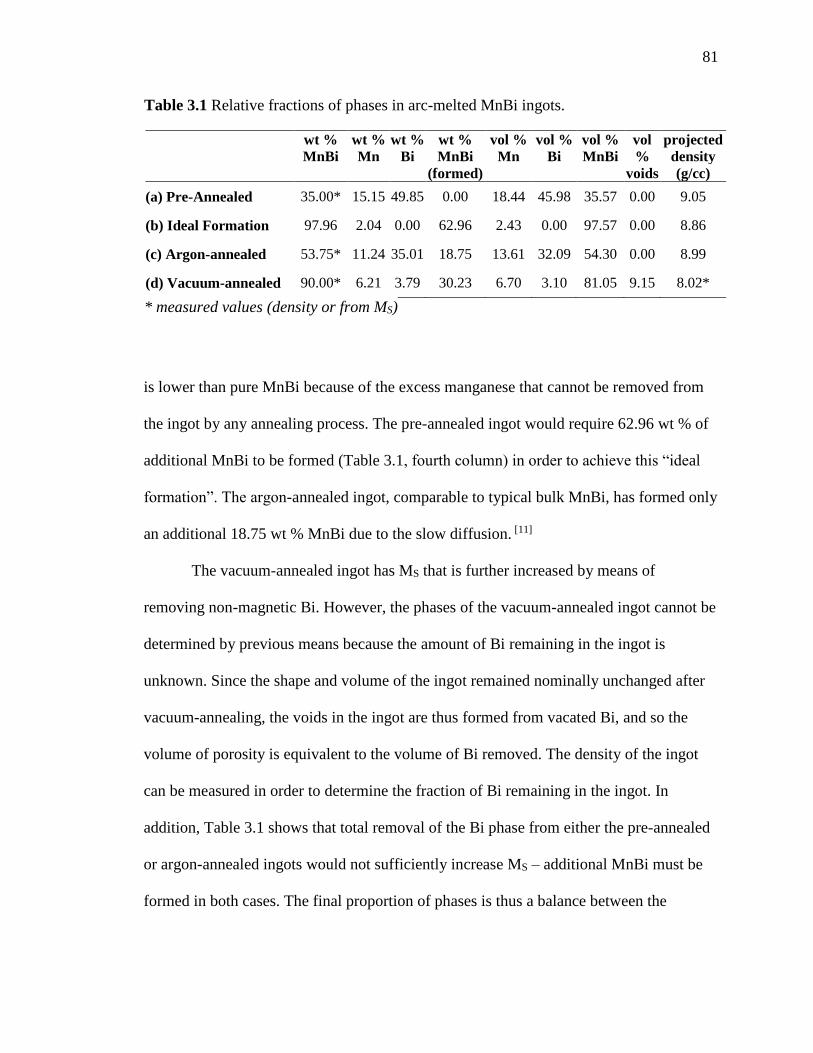
81
is lower than pure MnBi because of the excess manganese that cannot be removed from
the ingot by any annealing process. The pre-annealed ingot would require 62.96 wt % of
additional MnBi to be formed (Table 3.1, fourth column) in order to achieve this “ideal
formation”. The argon-annealed ingot, comparable to typical bulk MnBi, has formed only
an additional 18.75 wt % MnBi due to the slow diffusion. [11]
The vacuum-annealed ingot has MS that is further increased by means of
removing non-magnetic Bi. However, the phases of the vacuum-annealed ingot cannot be
determined by previous means because the amount of Bi remaining in the ingot is
unknown. Since the shape and volume of the ingot remained nominally unchanged after
vacuum-annealing, the voids in the ingot are thus formed from vacated Bi, and so the
volume of porosity is equivalent to the volume of Bi removed. The density of the ingot
can be measured in order to determine the fraction of Bi remaining in the ingot. In
addition, Table 3.1 shows that total removal of the Bi phase from either the pre-annealed
or argon-annealed ingots would not sufficiently increase MS – additional MnBi must be
formed in both cases. The final proportion of phases is thus a balance between the
Table 3.1 Relative fractions of phases in arc-melted MnBi ingots.
wt %
MnBi
wt %
Mn
wt %
Bi
wt %
MnBi
(formed)
vol %
Mn
vol %
Bi
vol %
MnBi
vol
%
voids
projected
density
(g/cc)
(a) Pre-Annealed 35.00* 15.15 49.85 0.00 18.44 45.98 35.57 0.00 9.05
(b) Ideal Formation 97.96 2.04 0.00 62.96 2.43 0.00 97.57 0.00 8.86
(c) Argon-annealed 53.75* 11.24 35.01 18.75 13.61 32.09 54.30 0.00 8.99
(d) Vacuum-annealed 90.00* 6.21 3.79 30.23 6.70 3.10 81.05 9.15 8.02*
* measured values (density or from MS)
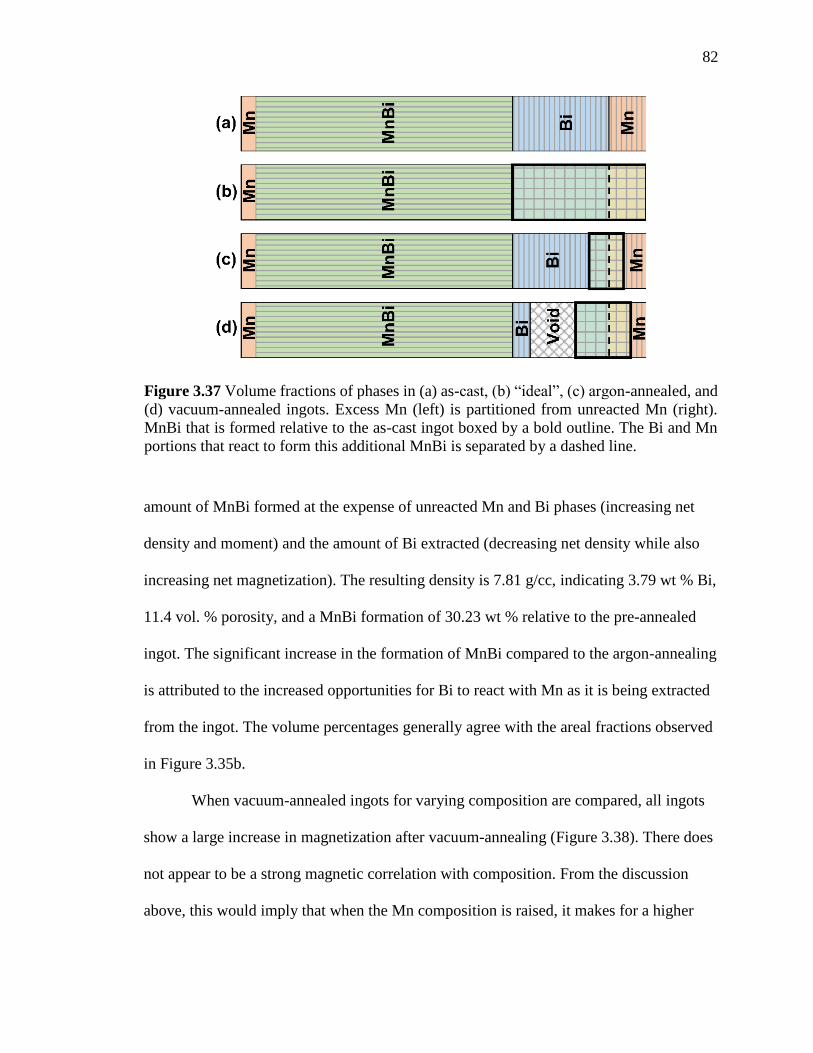
82
amount of MnBi formed at the expense of unreacted Mn and Bi phases (increasing net
density and moment) and the amount of Bi extracted (decreasing net density while also
increasing net magnetization). The resulting density is 7.81 g/cc, indicating 3.79 wt % Bi,
11.4 vol. % porosity, and a MnBi formation of 30.23 wt % relative to the pre-annealed
ingot. The significant increase in the formation of MnBi compared to the argon-annealing
is attributed to the increased opportunities for Bi to react with Mn as it is being extracted
from the ingot. The volume percentages generally agree with the areal fractions observed
in Figure 3.35b.
When vacuum-annealed ingots for varying composition are compared, all ingots
show a large increase in magnetization after vacuum-annealing (Figure 3.38). There does
not appear to be a strong magnetic correlation with composition. From the discussion
above, this would imply that when the Mn composition is raised, it makes for a higher
Figure 3.37 Volume fractions of phases in (a) as-cast, (b) “ideal”, (c) argon-annealed, and
(d) vacuum-annealed ingots. Excess Mn (left) is partitioned from unreacted Mn (right).
MnBi that is formed relative to the as-cast ingot boxed by a bold outline. The Bi and Mn
portions that react to form this additional MnBi is separated by a dashed line.
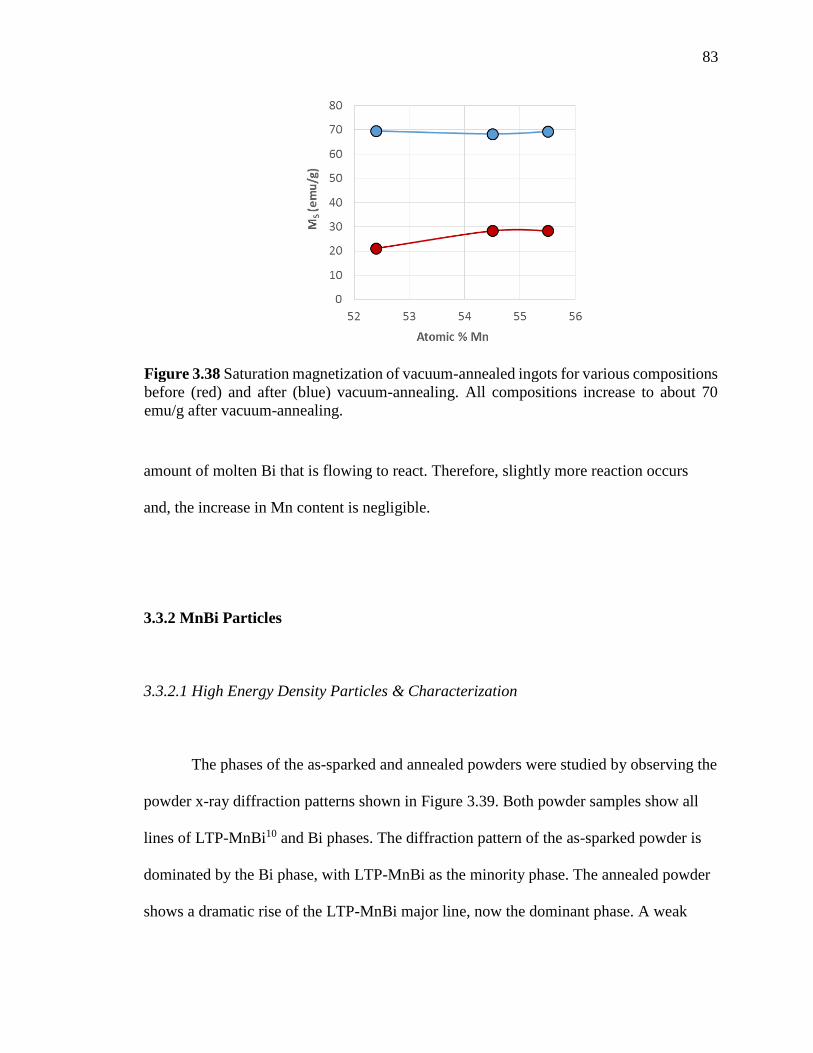
83
amount of molten Bi that is flowing to react. Therefore, slightly more reaction occurs
and, the increase in Mn content is negligible.
3.3.2 MnBi Particles
3.3.2.1 High Energy Density Particles & Characterization
The phases of the as-sparked and annealed powders were studied by observing the
powder x-ray diffraction patterns shown in Figure 3.39. Both powder samples show all
lines of LTP-MnBi10 and Bi phases. The diffraction pattern of the as-sparked powder is
dominated by the Bi phase, with LTP-MnBi as the minority phase. The annealed powder
shows a dramatic rise of the LTP-MnBi major line, now the dominant phase. A weak
Figure 3.38 Saturation magnetization of vacuum-annealed ingots for various compositions
before (red) and after (blue) vacuum-annealing. All compositions increase to about 70
emu/g after vacuum-annealing.
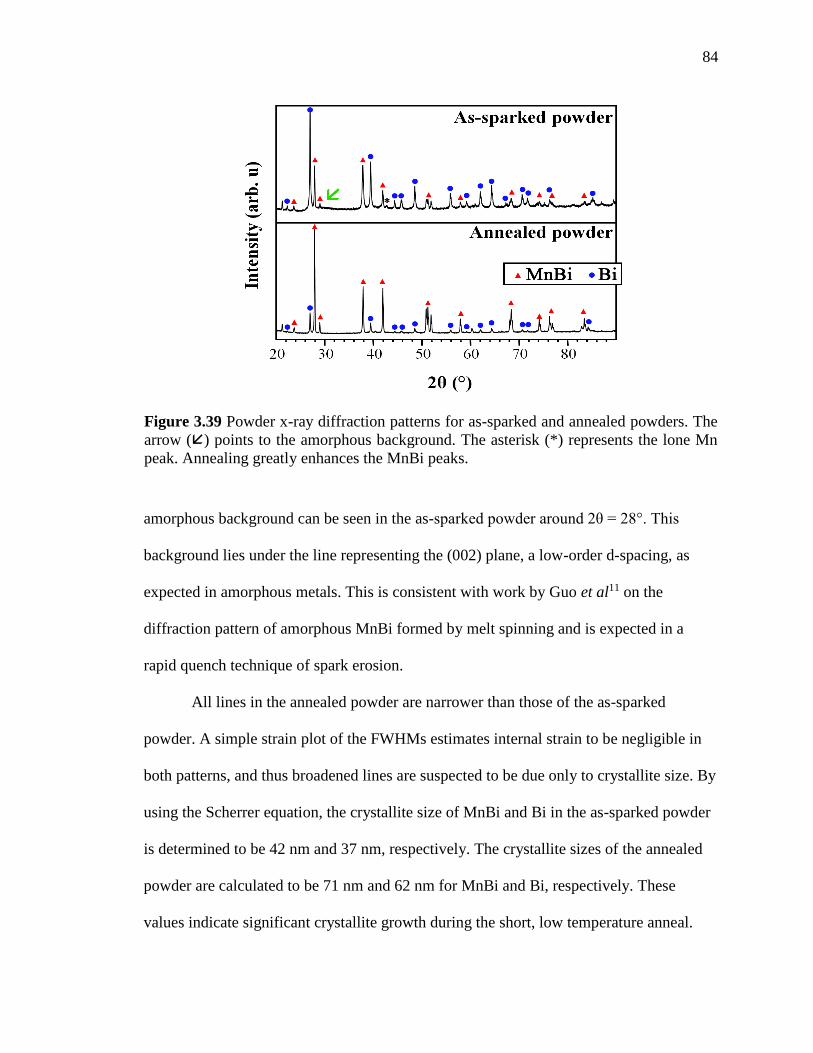
84
amorphous background can be seen in the as-sparked powder around 2θ = 28°. This
background lies under the line representing the (002) plane, a low-order d-spacing, as
expected in amorphous metals. This is consistent with work by Guo et al11 on the
diffraction pattern of amorphous MnBi formed by melt spinning and is expected in a
rapid quench technique of spark erosion.
All lines in the annealed powder are narrower than those of the as-sparked
powder. A simple strain plot of the FWHMs estimates internal strain to be negligible in
both patterns, and thus broadened lines are suspected to be due only to crystallite size. By
using the Scherrer equation, the crystallite size of MnBi and Bi in the as-sparked powder
is determined to be 42 nm and 37 nm, respectively. The crystallite sizes of the annealed
powder are calculated to be 71 nm and 62 nm for MnBi and Bi, respectively. These
values indicate significant crystallite growth during the short, low temperature anneal.
Figure 3.39 Powder x-ray diffraction patterns for as-sparked and annealed powders. The
arrow () points to the amorphous background. The asterisk (*) represents the lone Mn
peak. Annealing greatly enhances the MnBi peaks.
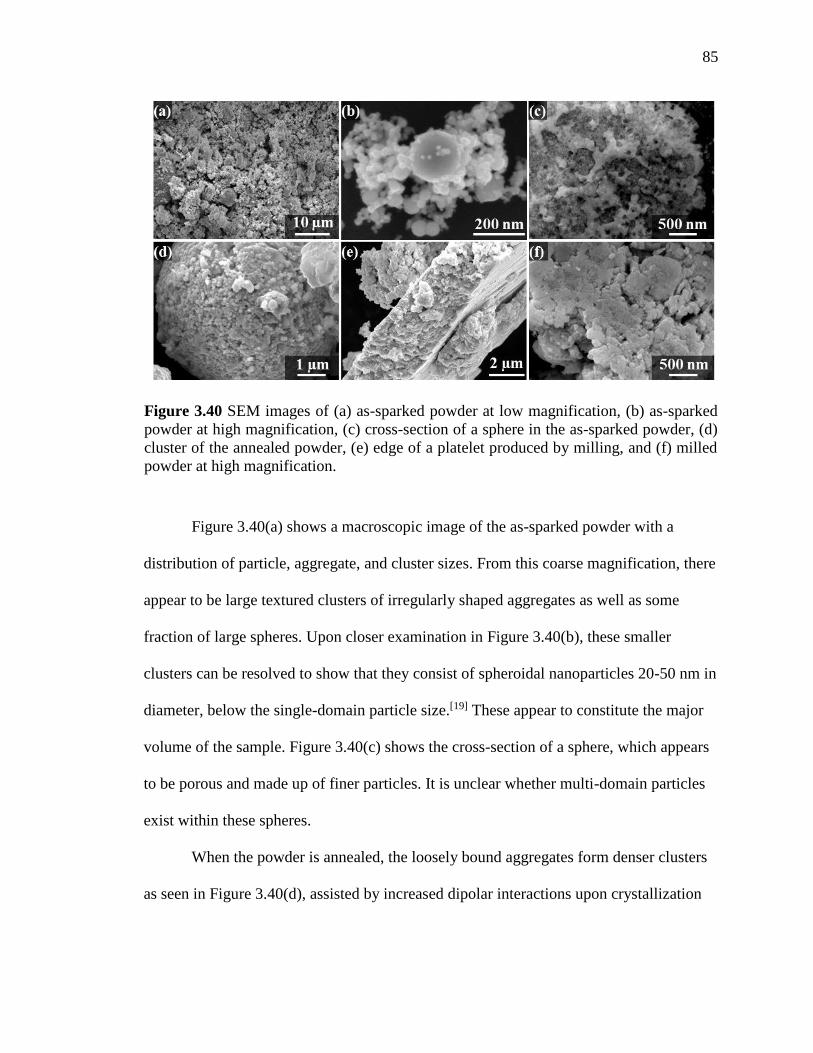
85
Figure 3.40(a) shows a macroscopic image of the as-sparked powder with a
distribution of particle, aggregate, and cluster sizes. From this coarse magnification, there
appear to be large textured clusters of irregularly shaped aggregates as well as some
fraction of large spheres. Upon closer examination in Figure 3.40(b), these smaller
clusters can be resolved to show that they consist of spheroidal nanoparticles 20-50 nm in
diameter, below the single-domain particle size.[19] These appear to constitute the major
volume of the sample. Figure 3.40(c) shows the cross-section of a sphere, which appears
to be porous and made up of finer particles. It is unclear whether multi-domain particles
exist within these spheres.
When the powder is annealed, the loosely bound aggregates form denser clusters
as seen in Figure 3.40(d), assisted by increased dipolar interactions upon crystallization
Figure 3.40 SEM images of (a) as-sparked powder at low magnification, (b) as-sparked
powder at high magnification, (c) cross-section of a sphere in the as-sparked powder, (d)
cluster of the annealed powder, (e) edge of a platelet produced by milling, and (f) milled
powder at high magnification.
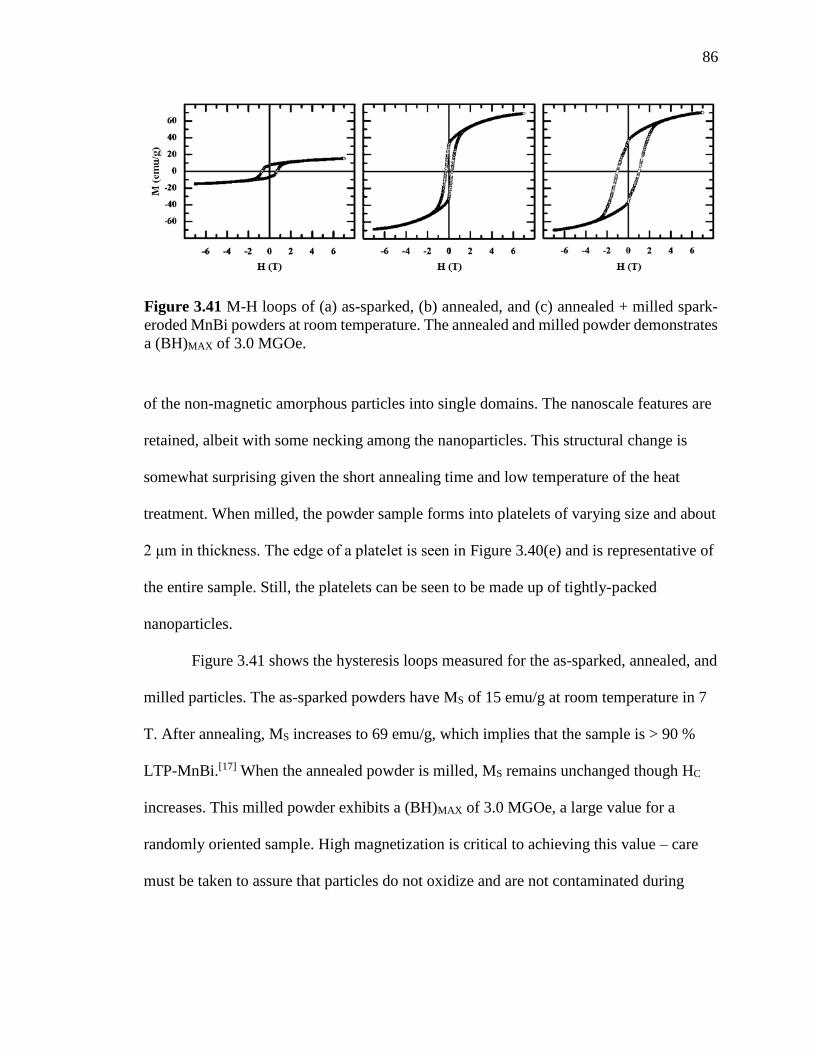
86
of the non-magnetic amorphous particles into single domains. The nanoscale features are
retained, albeit with some necking among the nanoparticles. This structural change is
somewhat surprising given the short annealing time and low temperature of the heat
treatment. When milled, the powder sample forms into platelets of varying size and about
2 μm in thickness. The edge of a platelet is seen in Figure 3.40(e) and is representative of
the entire sample. Still, the platelets can be seen to be made up of tightly-packed
nanoparticles.
Figure 3.41 shows the hysteresis loops measured for the as-sparked, annealed, and
milled particles. The as-sparked powders have MS of 15 emu/g at room temperature in 7
T. After annealing, MS increases to 69 emu/g, which implies that the sample is > 90 %
LTP-MnBi.[17] When the annealed powder is milled, MS remains unchanged though HC
increases. This milled powder exhibits a (BH)MAX of 3.0 MGOe, a large value for a
randomly oriented sample. High magnetization is critical to achieving this value – care
must be taken to assure that particles do not oxidize and are not contaminated during
Figure 3.41 M-H loops of (a) as-sparked, (b) annealed, and (c) annealed + milled spark-
eroded MnBi powders at room temperature. The annealed and milled powder demonstrates
a (BH)MAX of 3.0 MGOe.
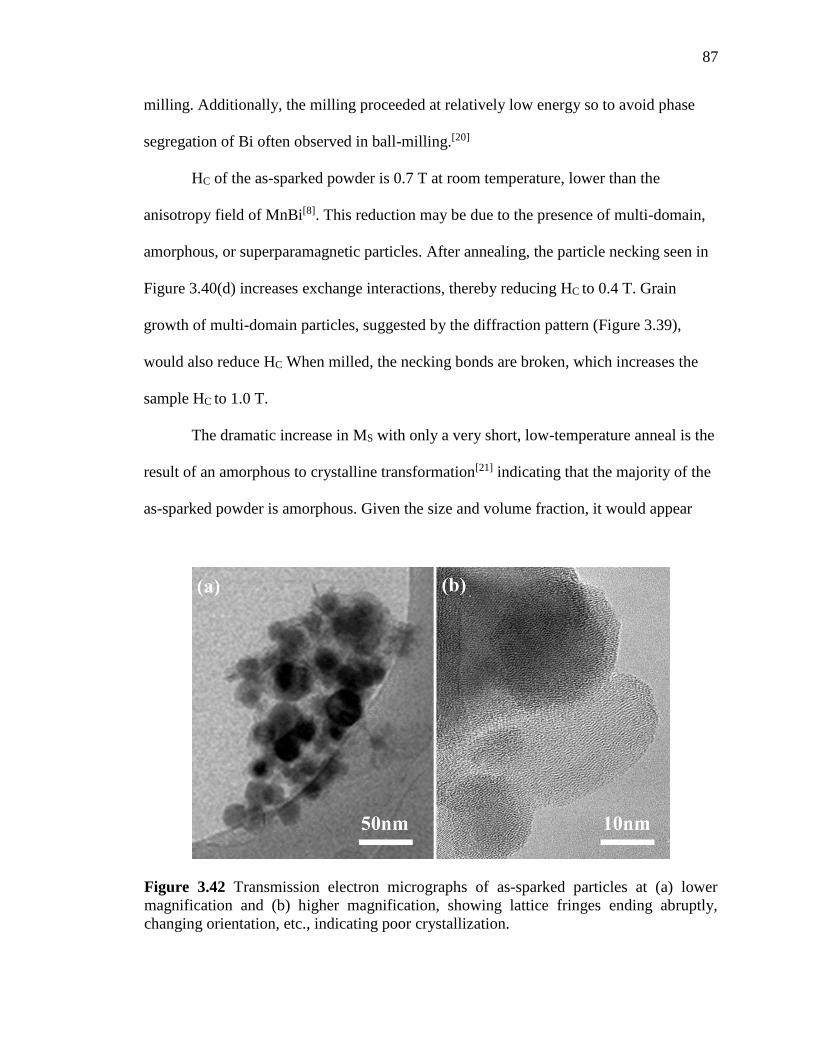
87
milling. Additionally, the milling proceeded at relatively low energy so to avoid phase
segregation of Bi often observed in ball-milling.[20]
HC of the as-sparked powder is 0.7 T at room temperature, lower than the
anisotropy field of MnBi[8]. This reduction may be due to the presence of multi-domain,
amorphous, or superparamagnetic particles. After annealing, the particle necking seen in
Figure 3.40(d) increases exchange interactions, thereby reducing HC to 0.4 T. Grain
growth of multi-domain particles, suggested by the diffraction pattern (Figure 3.39),
would also reduce HC When milled, the necking bonds are broken, which increases the
sample HC to 1.0 T.
The dramatic increase in MS with only a very short, low-temperature anneal is the
result of an amorphous to crystalline transformation[21] indicating that the majority of the
as-sparked powder is amorphous. Given the size and volume fraction, it would appear
Figure 3.42 Transmission electron micrographs of as-sparked particles at (a) lower
magnification and (b) higher magnification, showing lattice fringes ending abruptly,
changing orientation, etc., indicating poor crystallization.
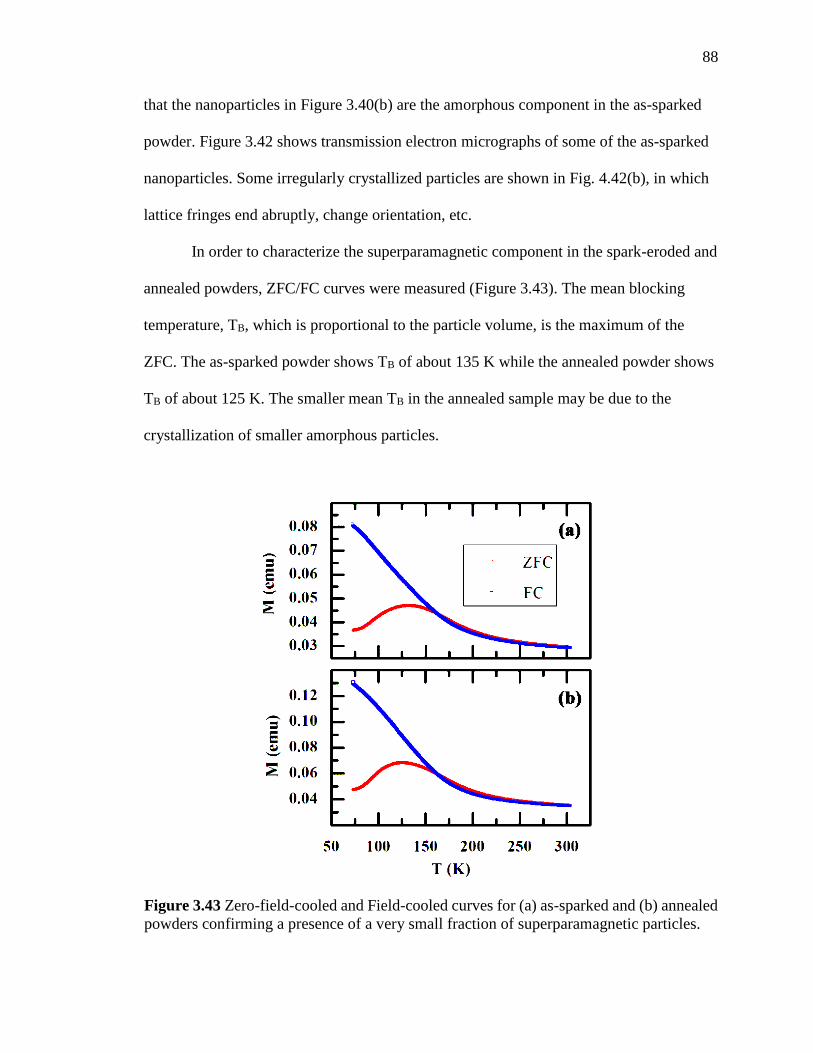
88
that the nanoparticles in Figure 3.40(b) are the amorphous component in the as-sparked
powder. Figure 3.42 shows transmission electron micrographs of some of the as-sparked
nanoparticles. Some irregularly crystallized particles are shown in Fig. 4.42(b), in which
lattice fringes end abruptly, change orientation, etc.
In order to characterize the superparamagnetic component in the spark-eroded and
annealed powders, ZFC/FC curves were measured (Figure 3.43). The mean blocking
temperature, TB, which is proportional to the particle volume, is the maximum of the
ZFC. The as-sparked powder shows TB of about 135 K while the annealed powder shows
TB of about 125 K. The smaller mean TB in the annealed sample may be due to the
crystallization of smaller amorphous particles.
Figure 3.43 Zero-field-cooled and Field-cooled curves for (a) as-sparked and (b) annealed
powders confirming a presence of a very small fraction of superparamagnetic particles.
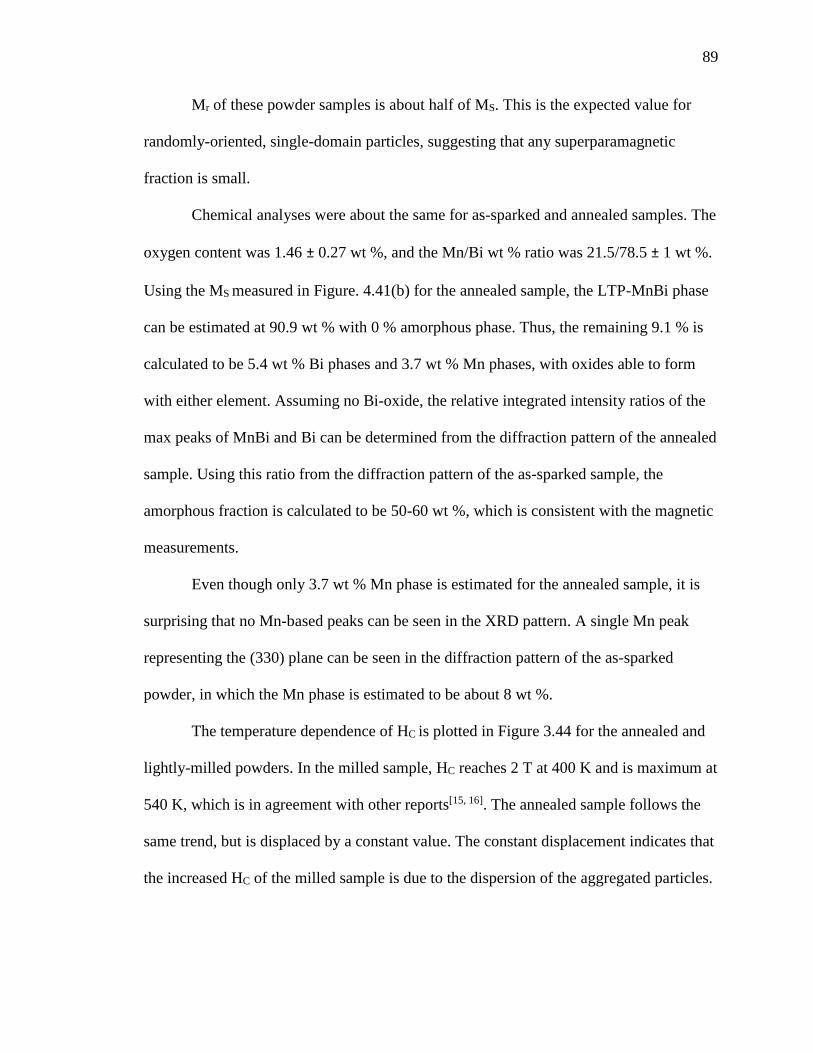
89
Mr of these powder samples is about half of MS. This is the expected value for
randomly-oriented, single-domain particles, suggesting that any superparamagnetic
fraction is small.
Chemical analyses were about the same for as-sparked and annealed samples. The
oxygen content was 1.46 ± 0.27 wt %, and the Mn/Bi wt % ratio was 21.5/78.5 ± 1 wt %.
Using the MS measured in Figure. 4.41(b) for the annealed sample, the LTP-MnBi phase
can be estimated at 90.9 wt % with 0 % amorphous phase. Thus, the remaining 9.1 % is
calculated to be 5.4 wt % Bi phases and 3.7 wt % Mn phases, with oxides able to form
with either element. Assuming no Bi-oxide, the relative integrated intensity ratios of the
max peaks of MnBi and Bi can be determined from the diffraction pattern of the annealed
sample. Using this ratio from the diffraction pattern of the as-sparked sample, the
amorphous fraction is calculated to be 50-60 wt %, which is consistent with the magnetic
measurements.
Even though only 3.7 wt % Mn phase is estimated for the annealed sample, it is
surprising that no Mn-based peaks can be seen in the XRD pattern. A single Mn peak
representing the (330) plane can be seen in the diffraction pattern of the as-sparked
powder, in which the Mn phase is estimated to be about 8 wt %.
The temperature dependence of HC is plotted in Figure 3.44 for the annealed and
lightly-milled powders. In the milled sample, HC reaches 2 T at 400 K and is maximum at
540 K, which is in agreement with other reports[15, 16]. The annealed sample follows the
same trend, but is displaced by a constant value. The constant displacement indicates that
the increased HC of the milled sample is due to the dispersion of the aggregated particles.

90
The yield for spark-eroded single domain particles of MnBi offers an impressive
economic advantage over other preparation methods. All of the powders reported here
were made in the 10 cm diameter laboratory cell illustrated in Figure A.2. The yield for
the powders discussed was > 100 g/hr. Under optimized conditions, MnBi has since been
spark-eroded with a yield of ≈ 360 g/hr in the same 10 cm diameter cell. Considering that
it has been shown that spark erosion is a readily scalable technique with high energy
efficiency[22], with only modest processing required to obtain optimum properties, it
seems likely that this production technique should be very competitive in the
marketplace.
Figure 3.44 Coercive force versus temperature for annealed and milled powders
demonstrating a positive temperature coefficient of coercivity.
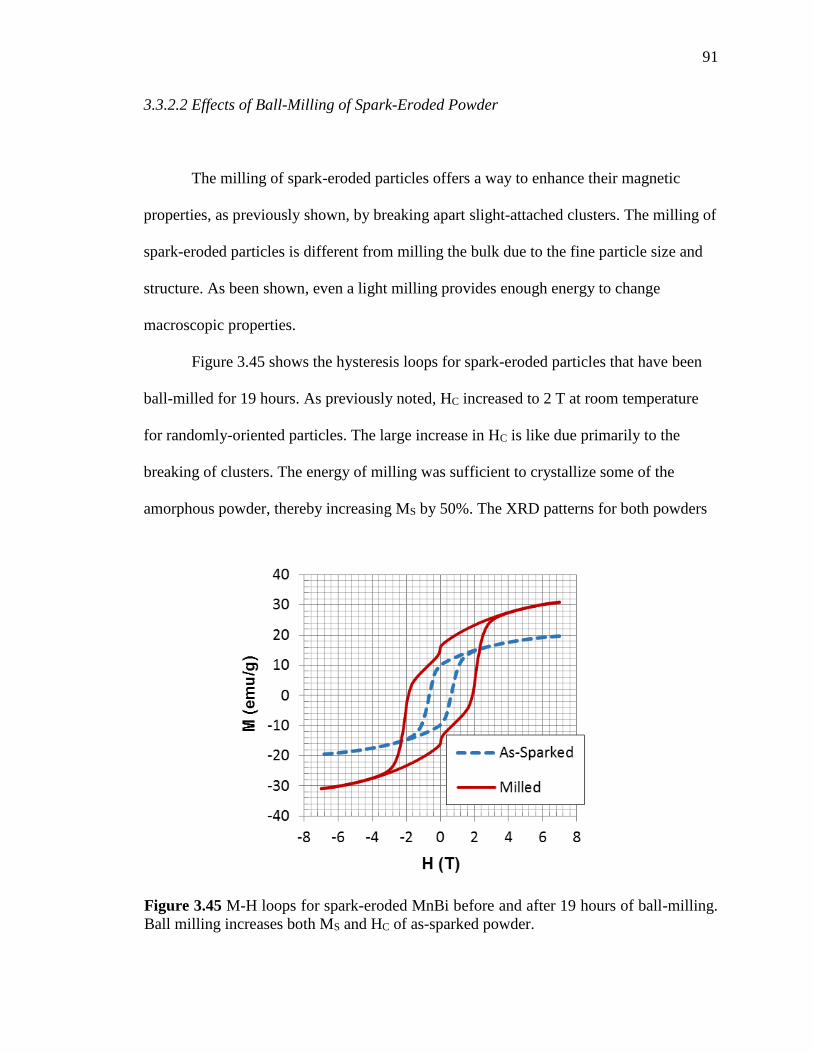
91
3.3.2.2 Effects of Ball-Milling of Spark-Eroded Powder
The milling of spark-eroded particles offers a way to enhance their magnetic
properties, as previously shown, by breaking apart slight-attached clusters. The milling of
spark-eroded particles is different from milling the bulk due to the fine particle size and
structure. As been shown, even a light milling provides enough energy to change
macroscopic properties.
Figure 3.45 shows the hysteresis loops for spark-eroded particles that have been
ball-milled for 19 hours. As previously noted, HC increased to 2 T at room temperature
for randomly-oriented particles. The large increase in HC is like due primarily to the
breaking of clusters. The energy of milling was sufficient to crystallize some of the
amorphous powder, thereby increasing MS by 50%. The XRD patterns for both powders
Figure 3.45 M-H loops for spark-eroded MnBi before and after 19 hours of ball-milling.
Ball milling increases both MS and HC of as-sparked powder.
92
are shown in Figure 3.46. There is an increase of peak intensities in the LTP-MnBi peaks
relative to Bi peaks.
When this milled powder is annealed, MS is lower than that of annealed powder
that has not been milled (Figure 3.47), and HC drops to 1 T. When the annealed powder is
milled, the same drop in MS is observed, but HC is 2 T. Since measures were taken in
preventing oxidation during milling, the lower MS is due to irreversible phase segregation
that occurs during ball-milling, which has previously been reported[20], or more likely,
due to the separation of aggregates, which creates magnetically disordered surfaces. The
SEM images in Figure 3.48 of the powder milled and annealed, and the reverse, show
some necking of the particles when annealing is last. This is a major reason for the
difference in HC.
Figure 3.46 XRD Patterns for spark-eroded MnBi before and after ball-milling. Ball-
milling increases the intensity of MnBi peaks.
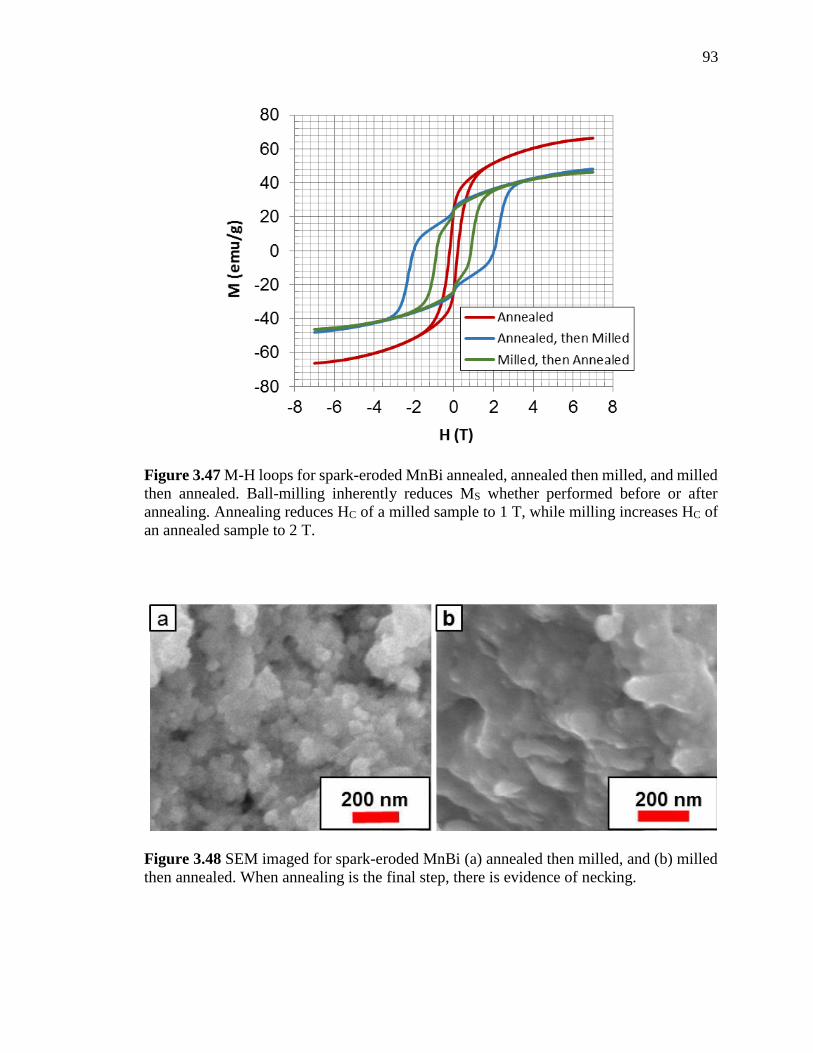
93
Figure 3.48 SEM imaged for spark-eroded MnBi (a) annealed then milled, and (b) milled
then annealed. When annealing is the final step, there is evidence of necking.
Figure 3.47 M-H loops for spark-eroded MnBi annealed, annealed then milled, and milled
then annealed. Ball-milling inherently reduces MS whether performed before or after
annealing. Annealing reduces HC of a milled sample to 1 T, while milling increases HC of
an annealed sample to 2 T.
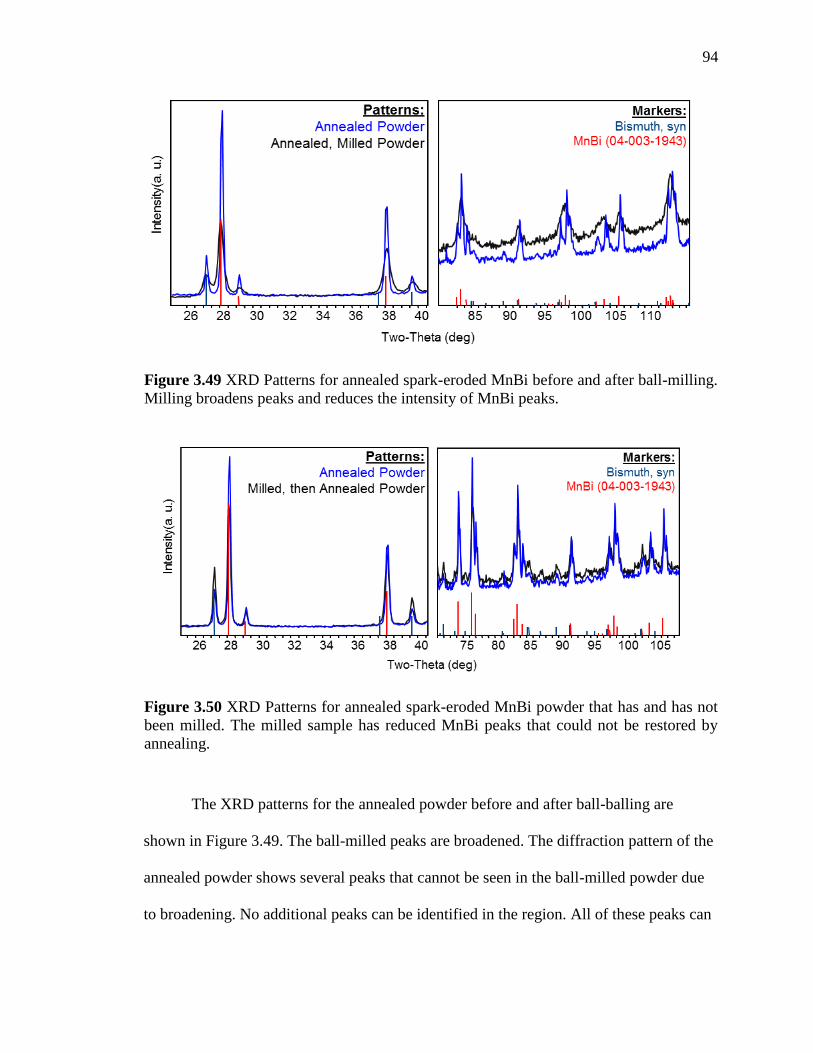
94
The XRD patterns for the annealed powder before and after ball-balling are
shown in Figure 3.49. The ball-milled peaks are broadened. The diffraction pattern of the
annealed powder shows several peaks that cannot be seen in the ball-milled powder due
to broadening. No additional peaks can be identified in the region. All of these peaks can
Figure 3.49 XRD Patterns for annealed spark-eroded MnBi before and after ball-milling.
Milling broadens peaks and reduces the intensity of MnBi peaks.
Figure 3.50 XRD Patterns for annealed spark-eroded MnBi powder that has and has not
been milled. The milled sample has reduced MnBi peaks that could not be restored by
annealing.
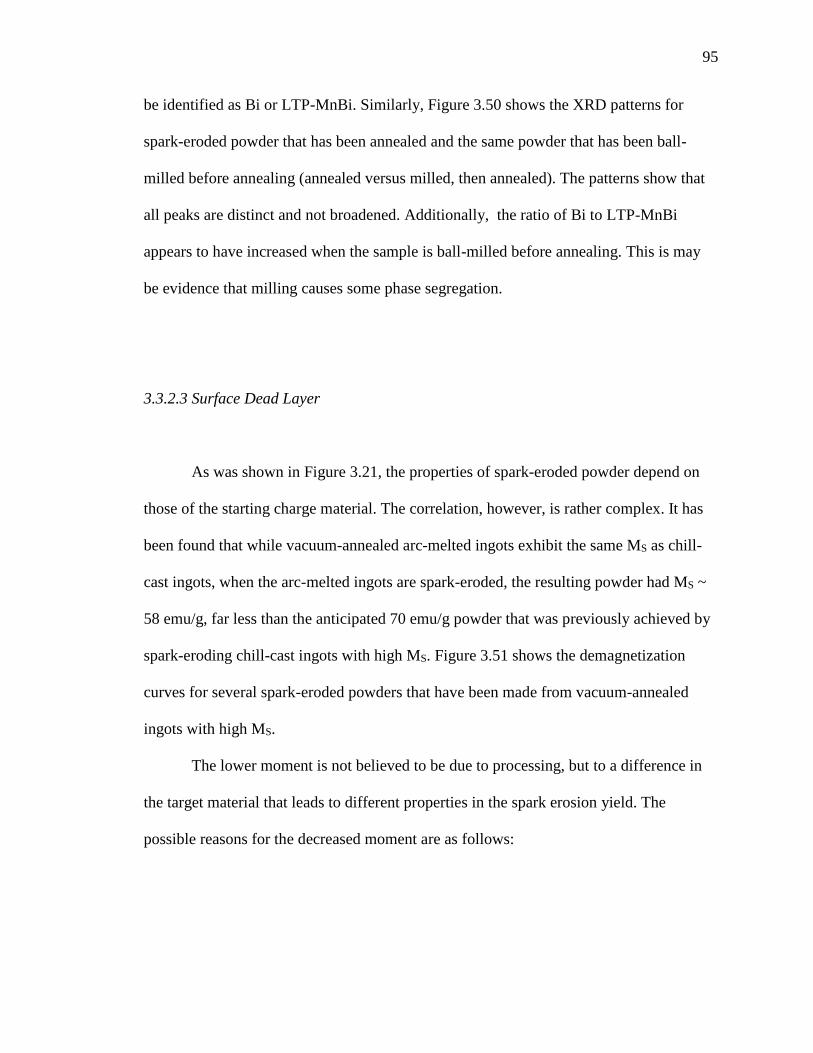
95
be identified as Bi or LTP-MnBi. Similarly, Figure 3.50 shows the XRD patterns for
spark-eroded powder that has been annealed and the same powder that has been ball-
milled before annealing (annealed versus milled, then annealed). The patterns show that
all peaks are distinct and not broadened. Additionally, the ratio of Bi to LTP-MnBi
appears to have increased when the sample is ball-milled before annealing. This is may
be evidence that milling causes some phase segregation.
3.3.2.3 Surface Dead Layer
As was shown in Figure 3.21, the properties of spark-eroded powder depend on
those of the starting charge material. The correlation, however, is rather complex. It has
been found that while vacuum-annealed arc-melted ingots exhibit the same MS as chill-
cast ingots, when the arc-melted ingots are spark-eroded, the resulting powder had MS ~
58 emu/g, far less than the anticipated 70 emu/g powder that was previously achieved by
spark-eroding chill-cast ingots with high MS. Figure 3.51 shows the demagnetization
curves for several spark-eroded powders that have been made from vacuum-annealed
ingots with high MS.
The lower moment is not believed to be due to processing, but to a difference in
the target material that leads to different properties in the spark erosion yield. The
possible reasons for the decreased moment are as follows:
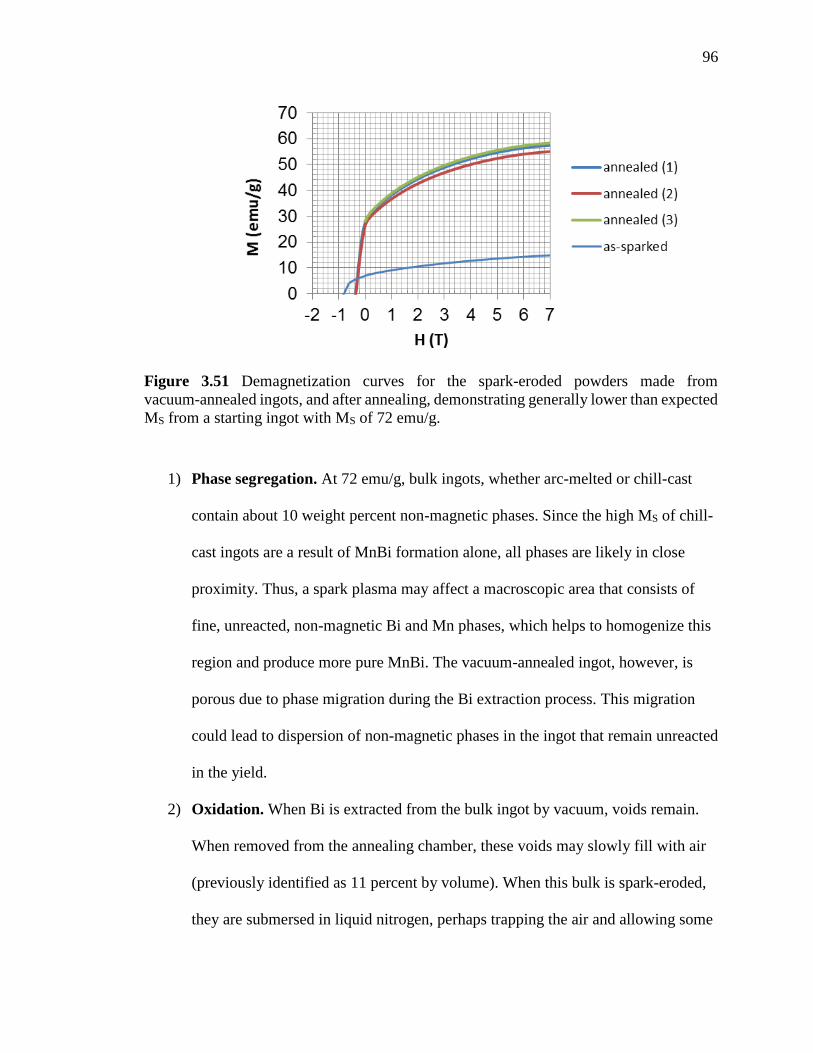
96
1) Phase segregation. At 72 emu/g, bulk ingots, whether arc-melted or chill-cast
contain about 10 weight percent non-magnetic phases. Since the high MS of chill-
cast ingots are a result of MnBi formation alone, all phases are likely in close
proximity. Thus, a spark plasma may affect a macroscopic area that consists of
fine, unreacted, non-magnetic Bi and Mn phases, which helps to homogenize this
region and produce more pure MnBi. The vacuum-annealed ingot, however, is
porous due to phase migration during the Bi extraction process. This migration
could lead to dispersion of non-magnetic phases in the ingot that remain unreacted
in the yield.
2) Oxidation. When Bi is extracted from the bulk ingot by vacuum, voids remain.
When removed from the annealing chamber, these voids may slowly fill with air
(previously identified as 11 percent by volume). When this bulk is spark-eroded,
they are submersed in liquid nitrogen, perhaps trapping the air and allowing some
Figure 3.51 Demagnetization curves for the spark-eroded powders made from
vacuum-annealed ingots, and after annealing, demonstrating generally lower than expected
MS from a starting ingot with MS of 72 emu/g.
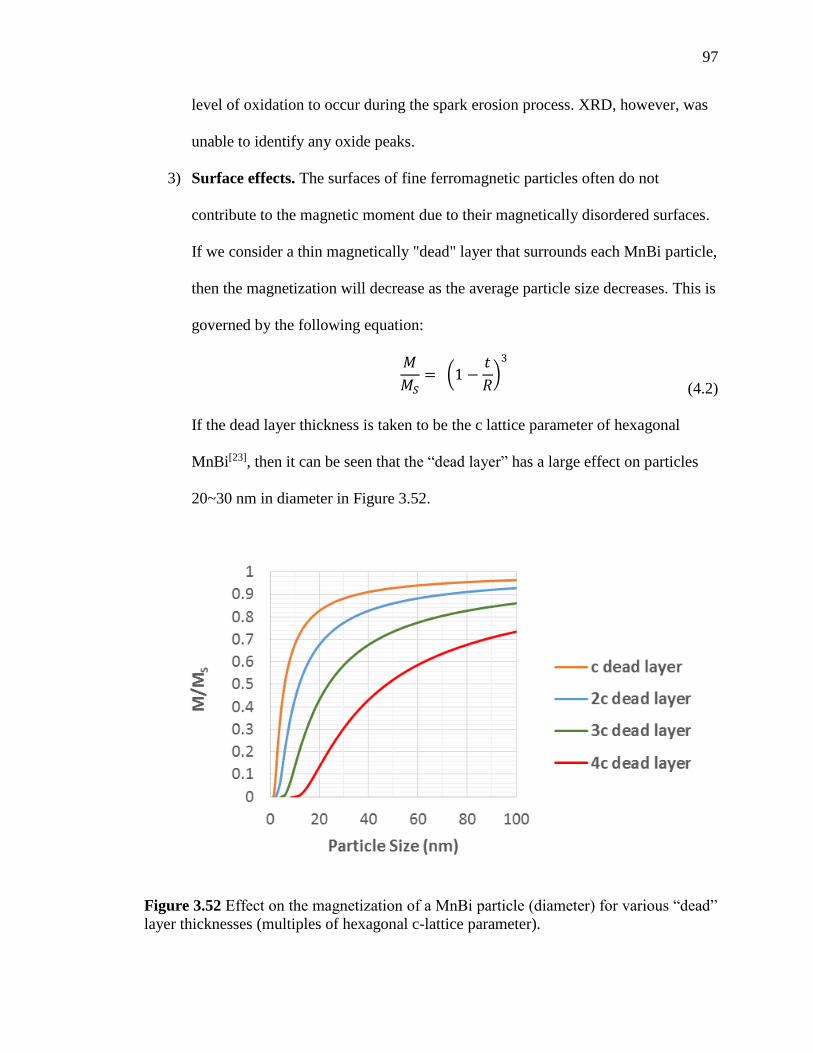
97
level of oxidation to occur during the spark erosion process. XRD, however, was
unable to identify any oxide peaks.
3) Surface effects. The surfaces of fine ferromagnetic particles often do not
contribute to the magnetic moment due to their magnetically disordered surfaces.
If we consider a thin magnetically "dead" layer that surrounds each MnBi particle,
then the magnetization will decrease as the average particle size decreases. This is
governed by the following equation:
(4.2)
If the dead layer thickness is taken to be the c lattice parameter of hexagonal
MnBi[23], then it can be seen that the “dead layer” has a large effect on particles
20~30 nm in diameter in Figure 3.52.
𝑀
𝑀𝑆= (1 −
𝑡
𝑅)
3
Figure 3.52 Effect on the magnetization of a MnBi particle (diameter) for various “dead”
layer thicknesses (multiples of hexagonal c-lattice parameter).
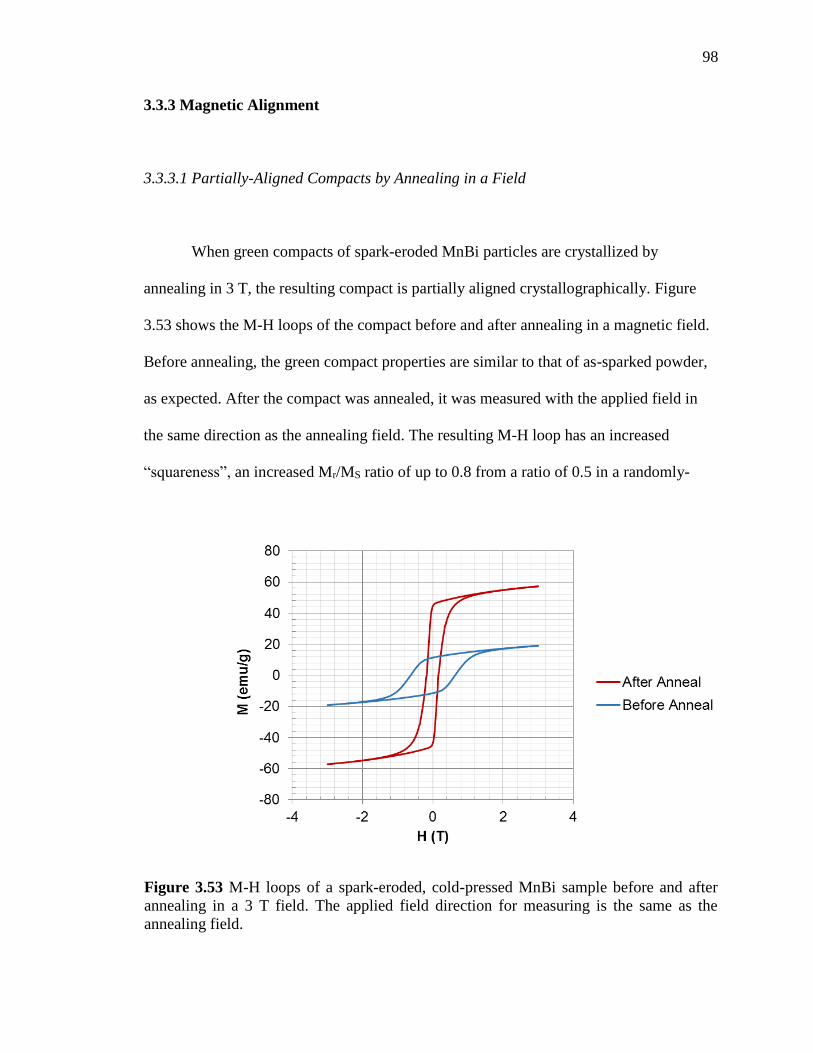
98
3.3.3 Magnetic Alignment
3.3.3.1 Partially-Aligned Compacts by Annealing in a Field
When green compacts of spark-eroded MnBi particles are crystallized by
annealing in 3 T, the resulting compact is partially aligned crystallographically. Figure
3.53 shows the M-H loops of the compact before and after annealing in a magnetic field.
Before annealing, the green compact properties are similar to that of as-sparked powder,
as expected. After the compact was annealed, it was measured with the applied field in
the same direction as the annealing field. The resulting M-H loop has an increased
“squareness”, an increased Mr/MS ratio of up to 0.8 from a ratio of 0.5 in a randomly-
Figure 3.53 M-H loops of a spark-eroded, cold-pressed MnBi sample before and after
annealing in a 3 T field. The applied field direction for measuring is the same as the
annealing field.
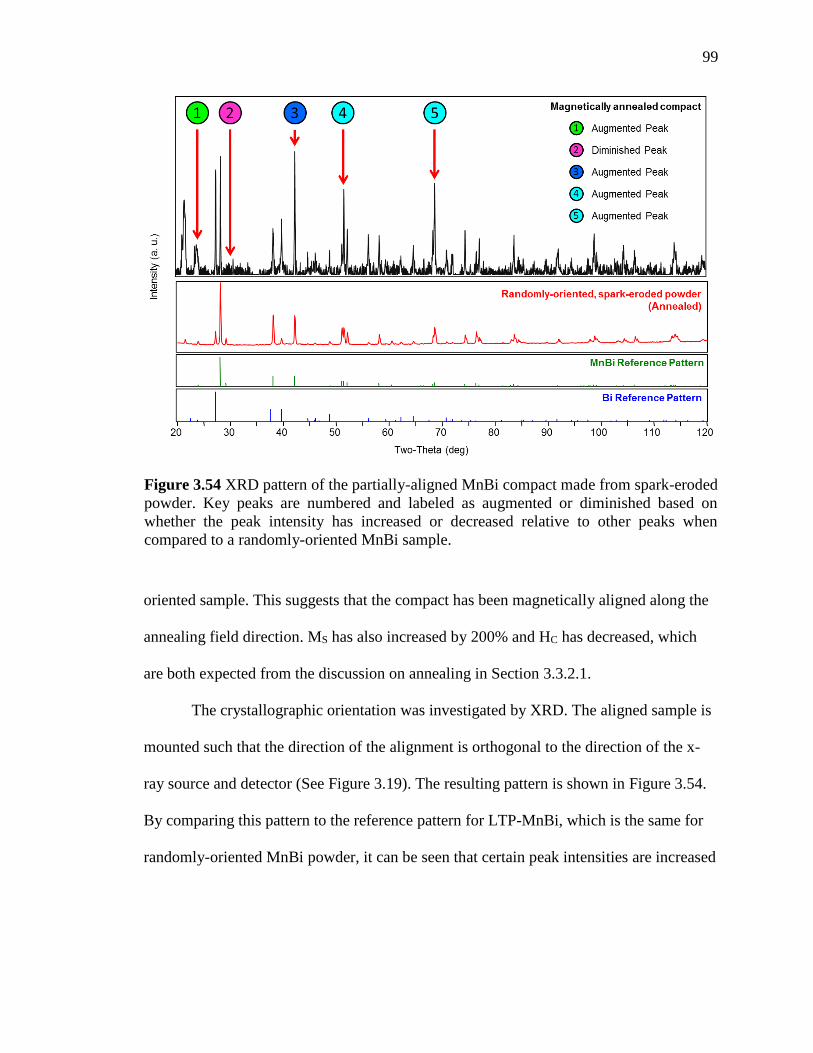
99
oriented sample. This suggests that the compact has been magnetically aligned along the
annealing field direction. MS has also increased by 200% and HC has decreased, which
are both expected from the discussion on annealing in Section 3.3.2.1.
The crystallographic orientation was investigated by XRD. The aligned sample is
mounted such that the direction of the alignment is orthogonal to the direction of the x-
ray source and detector (See Figure 3.19). The resulting pattern is shown in Figure 3.54.
By comparing this pattern to the reference pattern for LTP-MnBi, which is the same for
randomly-oriented MnBi powder, it can be seen that certain peak intensities are increased
Figure 3.54 XRD pattern of the partially-aligned MnBi compact made from spark-eroded
powder. Key peaks are numbered and labeled as augmented or diminished based on
whether the peak intensity has increased or decreased relative to other peaks when
compared to a randomly-oriented MnBi sample.
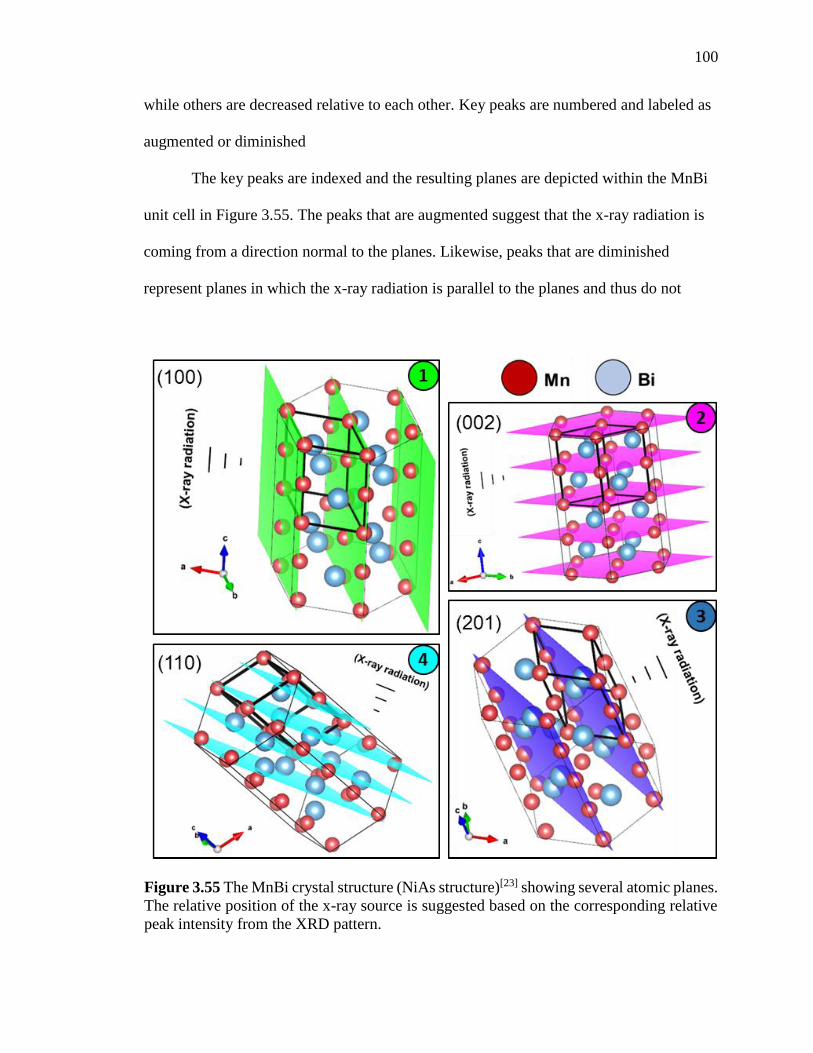
100
while others are decreased relative to each other. Key peaks are numbered and labeled as
augmented or diminished
The key peaks are indexed and the resulting planes are depicted within the MnBi
unit cell in Figure 3.55. The peaks that are augmented suggest that the x-ray radiation is
coming from a direction normal to the planes. Likewise, peaks that are diminished
represent planes in which the x-ray radiation is parallel to the planes and thus do not
Figure 3.55 The MnBi crystal structure (NiAs structure)[23] showing several atomic planes.
The relative position of the x-ray source is suggested based on the corresponding relative
peak intensity from the XRD pattern.
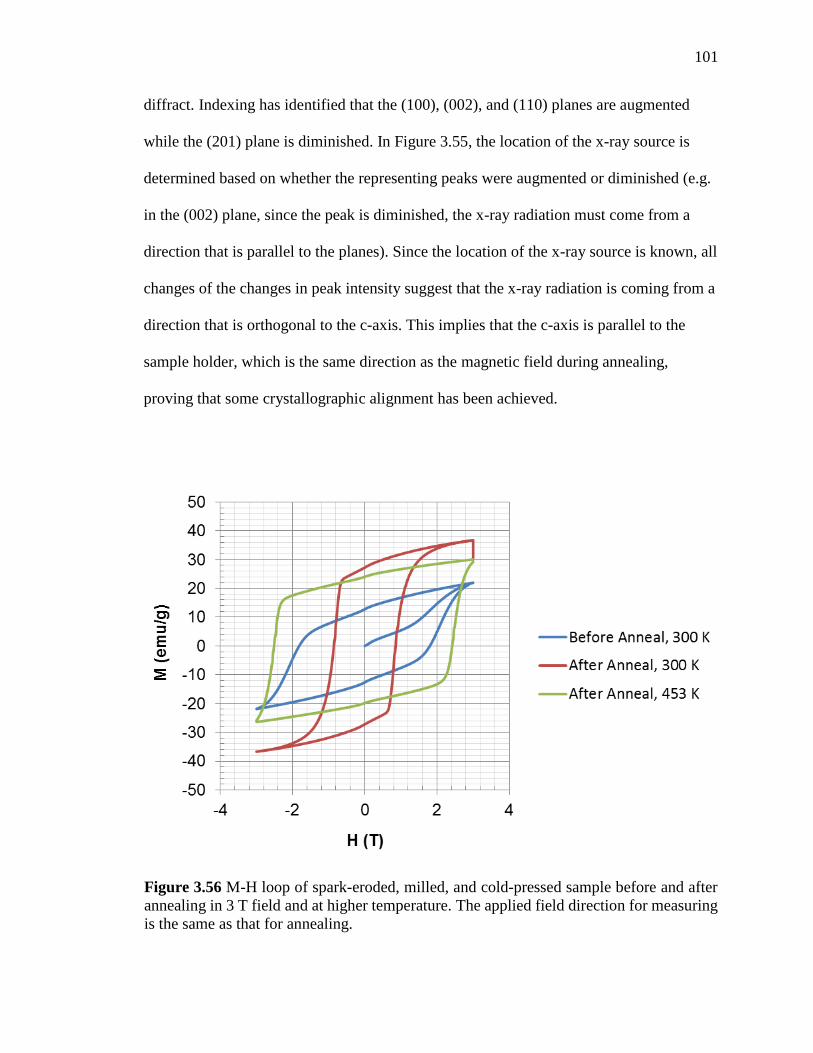
101
diffract. Indexing has identified that the (100), (002), and (110) planes are augmented
while the (201) plane is diminished. In Figure 3.55, the location of the x-ray source is
determined based on whether the representing peaks were augmented or diminished (e.g.
in the (002) plane, since the peak is diminished, the x-ray radiation must come from a
direction that is parallel to the planes). Since the location of the x-ray source is known, all
changes of the changes in peak intensity suggest that the x-ray radiation is coming from a
direction that is orthogonal to the c-axis. This implies that the c-axis is parallel to the
sample holder, which is the same direction as the magnetic field during annealing,
proving that some crystallographic alignment has been achieved.
Figure 3.56 M-H loop of spark-eroded, milled, and cold-pressed sample before and after
annealing in 3 T field and at higher temperature. The applied field direction for measuring
is the same as that for annealing.
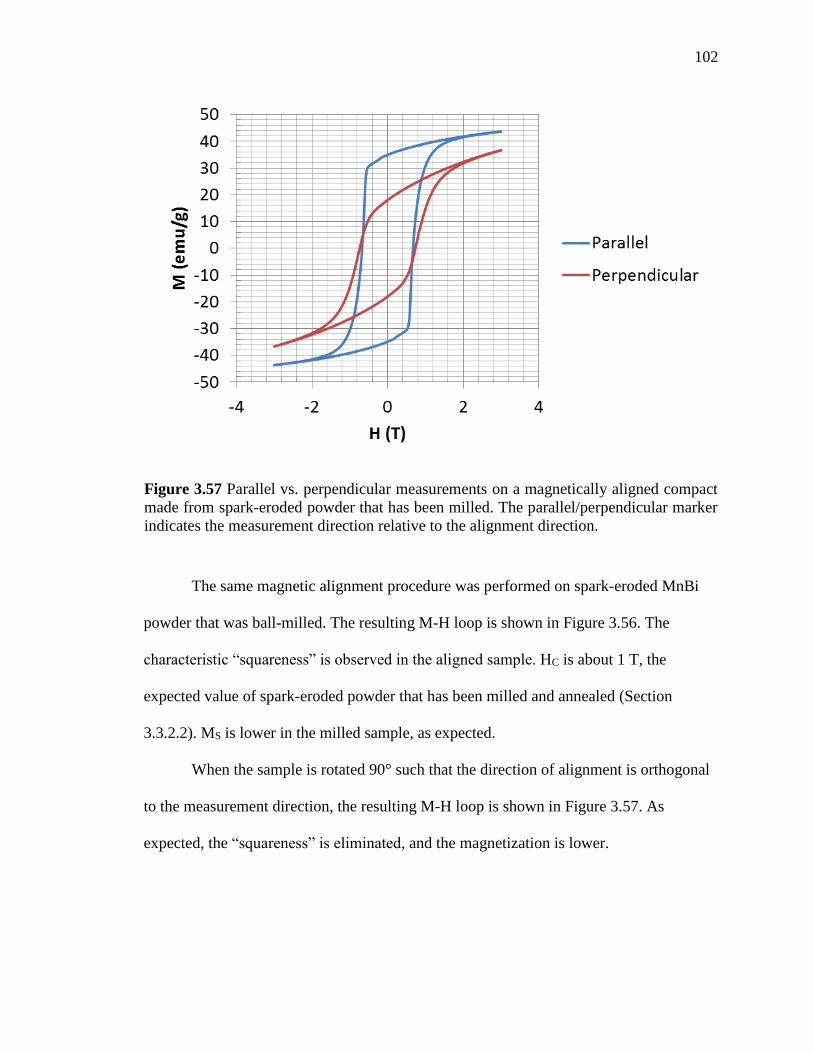
102
The same magnetic alignment procedure was performed on spark-eroded MnBi
powder that was ball-milled. The resulting M-H loop is shown in Figure 3.56. The
characteristic “squareness” is observed in the aligned sample. HC is about 1 T, the
expected value of spark-eroded powder that has been milled and annealed (Section
3.3.2.2). MS is lower in the milled sample, as expected.
When the sample is rotated 90° such that the direction of alignment is orthogonal
to the measurement direction, the resulting M-H loop is shown in Figure 3.57. As
expected, the “squareness” is eliminated, and the magnetization is lower.
Figure 3.57 Parallel vs. perpendicular measurements on a magnetically aligned compact
made from spark-eroded powder that has been milled. The parallel/perpendicular marker
indicates the measurement direction relative to the alignment direction.
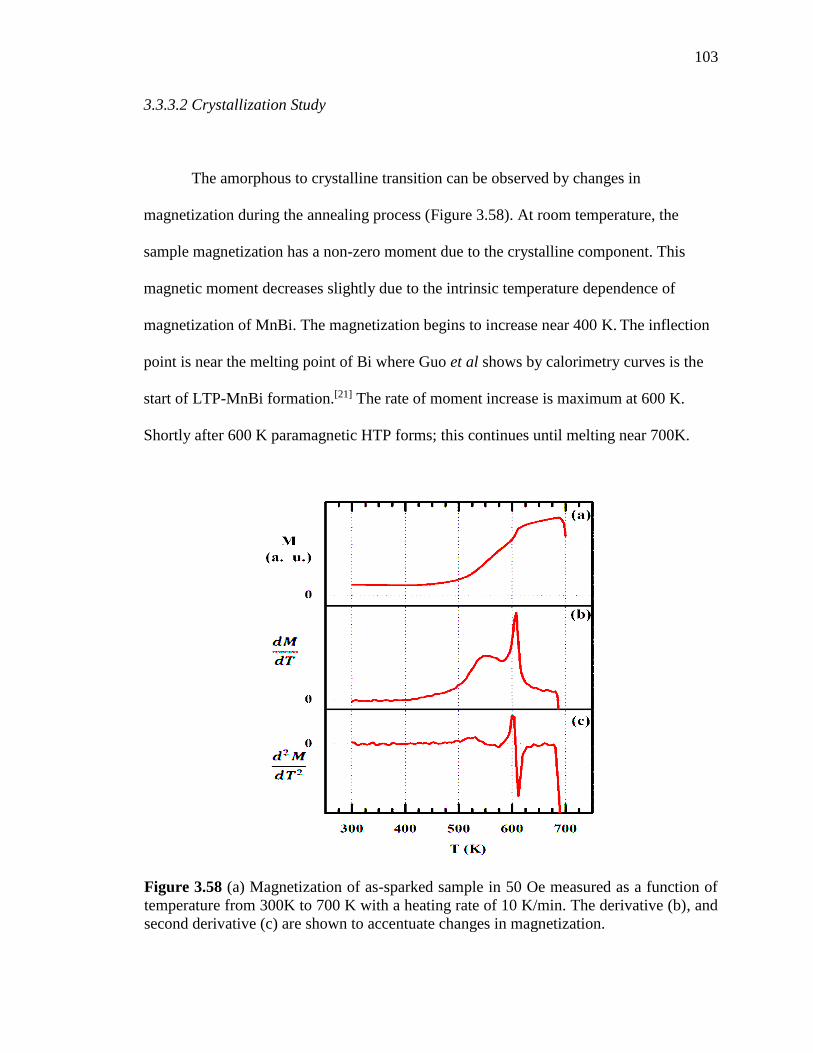
103
3.3.3.2 Crystallization Study
The amorphous to crystalline transition can be observed by changes in
magnetization during the annealing process (Figure 3.58). At room temperature, the
sample magnetization has a non-zero moment due to the crystalline component. This
magnetic moment decreases slightly due to the intrinsic temperature dependence of
magnetization of MnBi. The magnetization begins to increase near 400 K. The inflection
point is near the melting point of Bi where Guo et al shows by calorimetry curves is the
start of LTP-MnBi formation.[21] The rate of moment increase is maximum at 600 K.
Shortly after 600 K paramagnetic HTP forms; this continues until melting near 700K.
Figure 3.58 (a) Magnetization of as-sparked sample in 50 Oe measured as a function of
temperature from 300K to 700 K with a heating rate of 10 K/min. The derivative (b), and
second derivative (c) are shown to accentuate changes in magnetization.
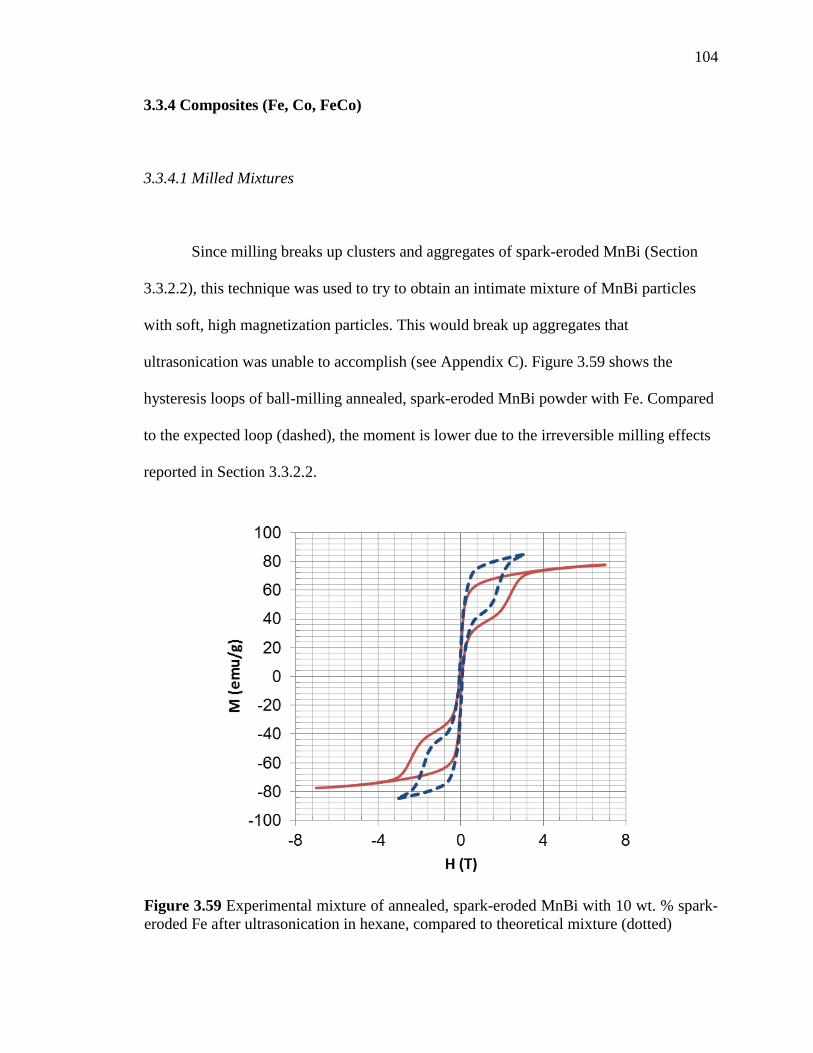
104
3.3.4 Composites (Fe, Co, FeCo)
3.3.4.1 Milled Mixtures
Since milling breaks up clusters and aggregates of spark-eroded MnBi (Section
3.3.2.2), this technique was used to try to obtain an intimate mixture of MnBi particles
with soft, high magnetization particles. This would break up aggregates that
ultrasonication was unable to accomplish (see Appendix C). Figure 3.59 shows the
hysteresis loops of ball-milling annealed, spark-eroded MnBi powder with Fe. Compared
to the expected loop (dashed), the moment is lower due to the irreversible milling effects
reported in Section 3.3.2.2.
Figure 3.59 Experimental mixture of annealed, spark-eroded MnBi with 10 wt. % spark-
eroded Fe after ultrasonication in hexane, compared to theoretical mixture (dotted)
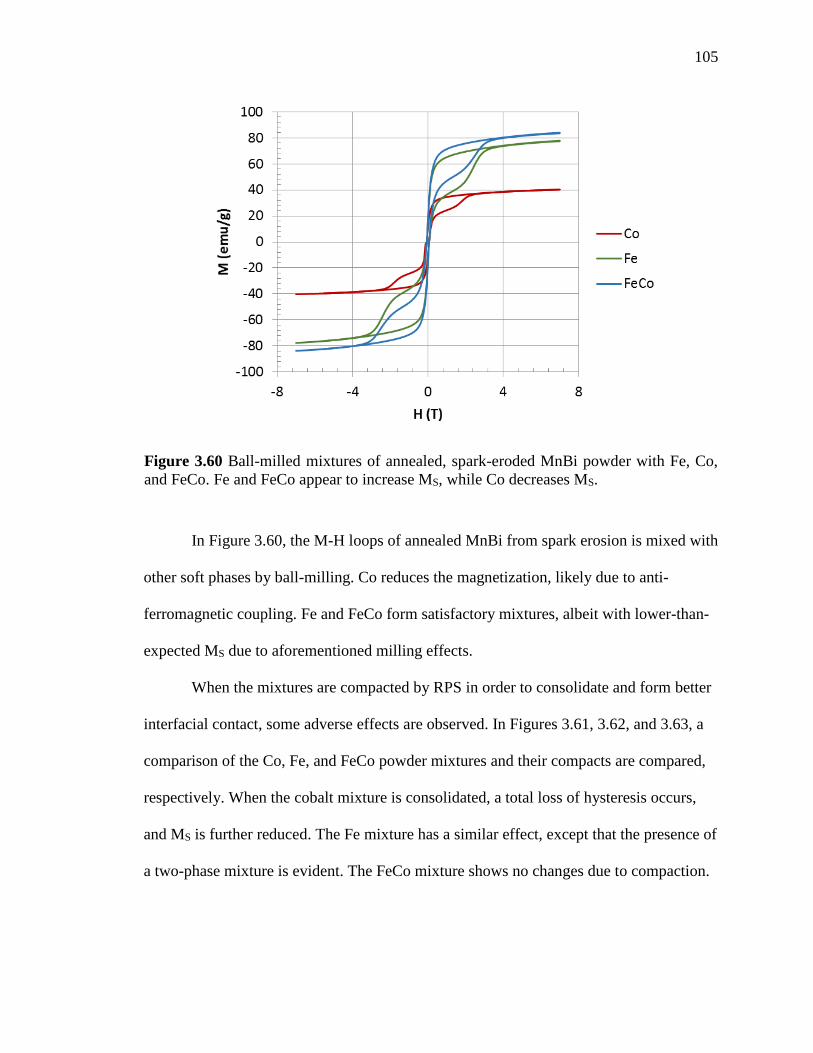
105
In Figure 3.60, the M-H loops of annealed MnBi from spark erosion is mixed with
other soft phases by ball-milling. Co reduces the magnetization, likely due to anti-
ferromagnetic coupling. Fe and FeCo form satisfactory mixtures, albeit with lower-than-
expected MS due to aforementioned milling effects.
When the mixtures are compacted by RPS in order to consolidate and form better
interfacial contact, some adverse effects are observed. In Figures 3.61, 3.62, and 3.63, a
comparison of the Co, Fe, and FeCo powder mixtures and their compacts are compared,
respectively. When the cobalt mixture is consolidated, a total loss of hysteresis occurs,
and MS is further reduced. The Fe mixture has a similar effect, except that the presence of
a two-phase mixture is evident. The FeCo mixture shows no changes due to compaction.
Figure 3.60 Ball-milled mixtures of annealed, spark-eroded MnBi powder with Fe, Co,
and FeCo. Fe and FeCo appear to increase MS, while Co decreases MS.
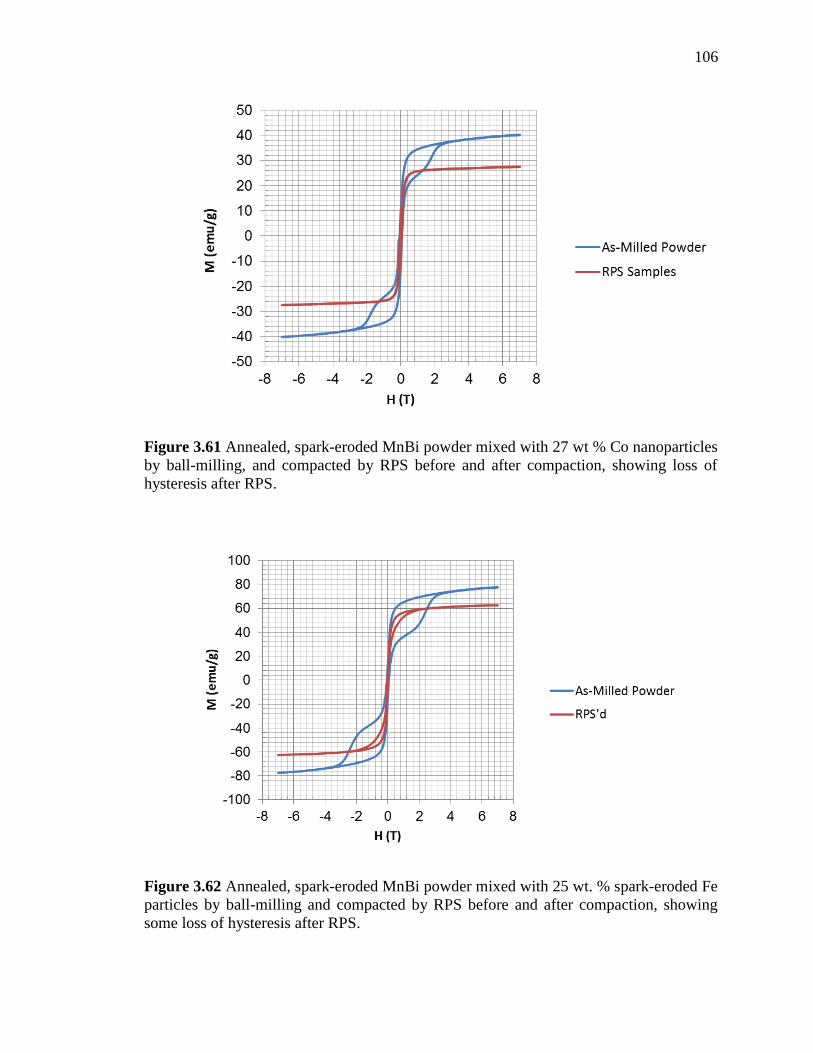
106
Figure 3.62 Annealed, spark-eroded MnBi powder mixed with 25 wt. % spark-eroded Fe
particles by ball-milling and compacted by RPS before and after compaction, showing
some loss of hysteresis after RPS.
Figure 3.61 Annealed, spark-eroded MnBi powder mixed with 27 wt % Co nanoparticles
by ball-milling, and compacted by RPS before and after compaction, showing loss of
hysteresis after RPS.
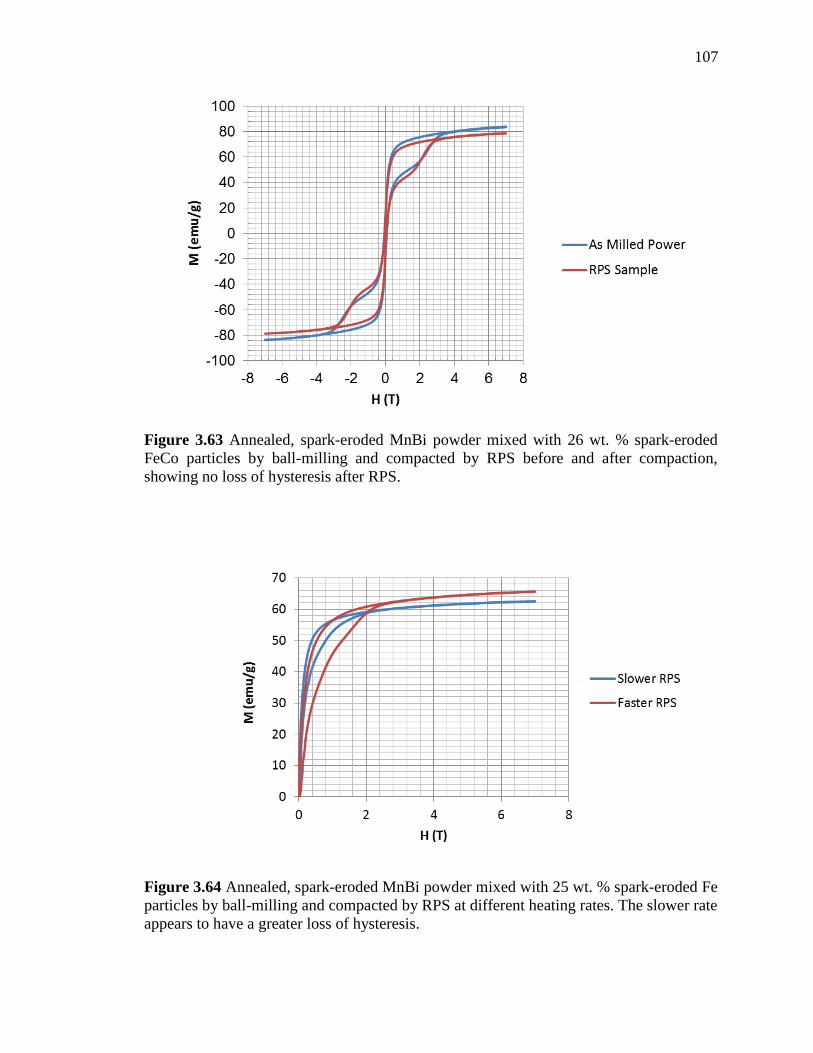
107
Figure 3.63 Annealed, spark-eroded MnBi powder mixed with 26 wt. % spark-eroded
FeCo particles by ball-milling and compacted by RPS before and after compaction,
showing no loss of hysteresis after RPS.
Figure 3.64 Annealed, spark-eroded MnBi powder mixed with 25 wt. % spark-eroded Fe
particles by ball-milling and compacted by RPS at different heating rates. The slower rate
appears to have a greater loss of hysteresis.
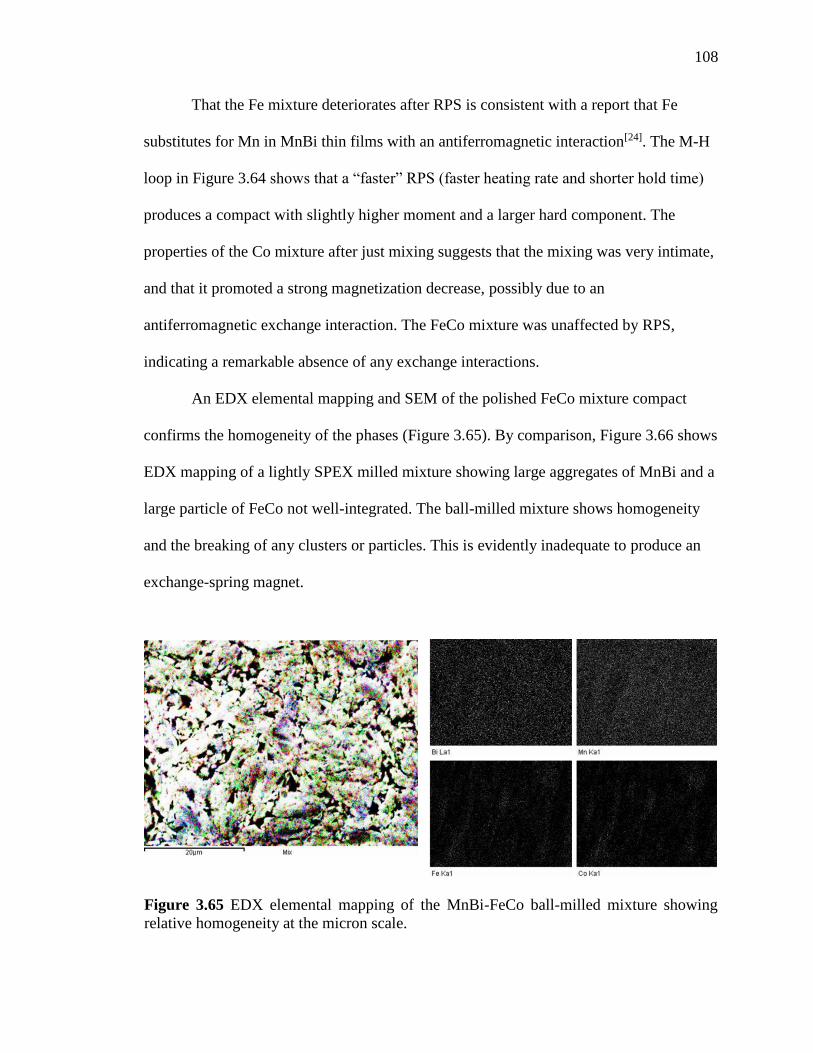
108
That the Fe mixture deteriorates after RPS is consistent with a report that Fe
substitutes for Mn in MnBi thin films with an antiferromagnetic interaction[24]. The M-H
loop in Figure 3.64 shows that a “faster” RPS (faster heating rate and shorter hold time)
produces a compact with slightly higher moment and a larger hard component. The
properties of the Co mixture after just mixing suggests that the mixing was very intimate,
and that it promoted a strong magnetization decrease, possibly due to an
antiferromagnetic exchange interaction. The FeCo mixture was unaffected by RPS,
indicating a remarkable absence of any exchange interactions.
An EDX elemental mapping and SEM of the polished FeCo mixture compact
confirms the homogeneity of the phases (Figure 3.65). By comparison, Figure 3.66 shows
EDX mapping of a lightly SPEX milled mixture showing large aggregates of MnBi and a
large particle of FeCo not well-integrated. The ball-milled mixture shows homogeneity
and the breaking of any clusters or particles. This is evidently inadequate to produce an
exchange-spring magnet.
Figure 3.65 EDX elemental mapping of the MnBi-FeCo ball-milled mixture showing
relative homogeneity at the micron scale.
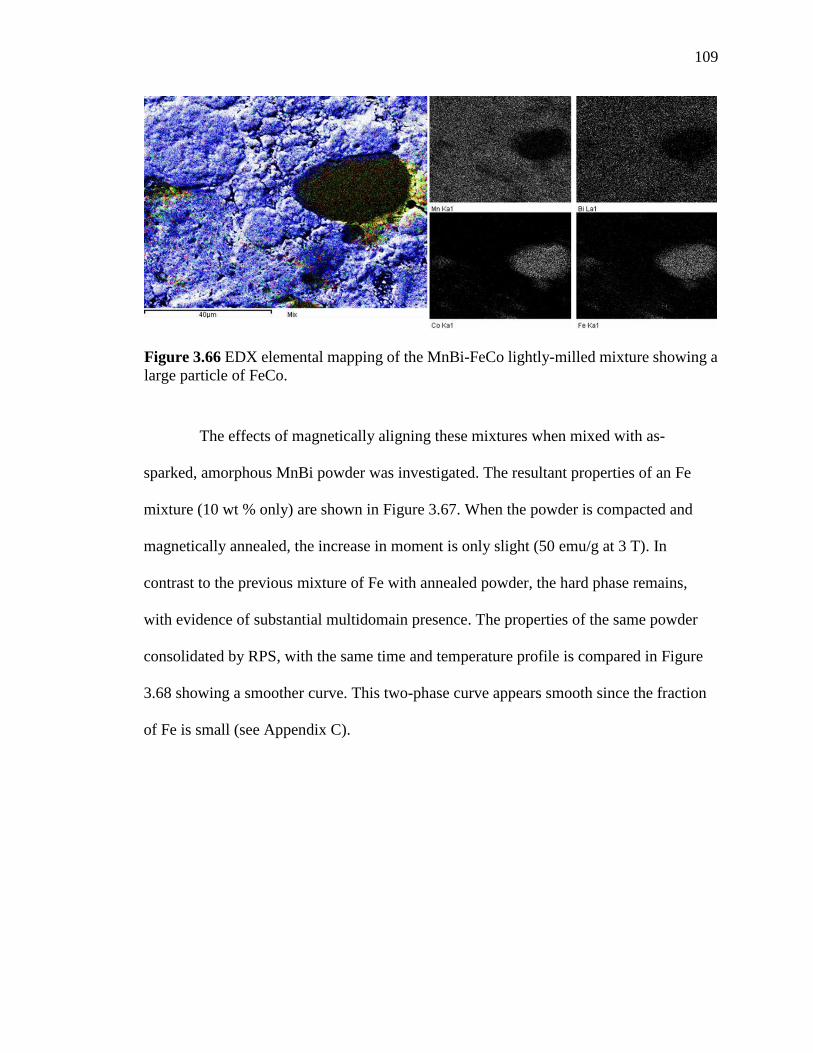
109
The effects of magnetically aligning these mixtures when mixed with as-
sparked, amorphous MnBi powder was investigated. The resultant properties of an Fe
mixture (10 wt % only) are shown in Figure 3.67. When the powder is compacted and
magnetically annealed, the increase in moment is only slight (50 emu/g at 3 T). In
contrast to the previous mixture of Fe with annealed powder, the hard phase remains,
with evidence of substantial multidomain presence. The properties of the same powder
consolidated by RPS, with the same time and temperature profile is compared in Figure
3.68 showing a smoother curve. This two-phase curve appears smooth since the fraction
of Fe is small (see Appendix C).
Figure 3.66 EDX elemental mapping of the MnBi-FeCo lightly-milled mixture showing a
large particle of FeCo.
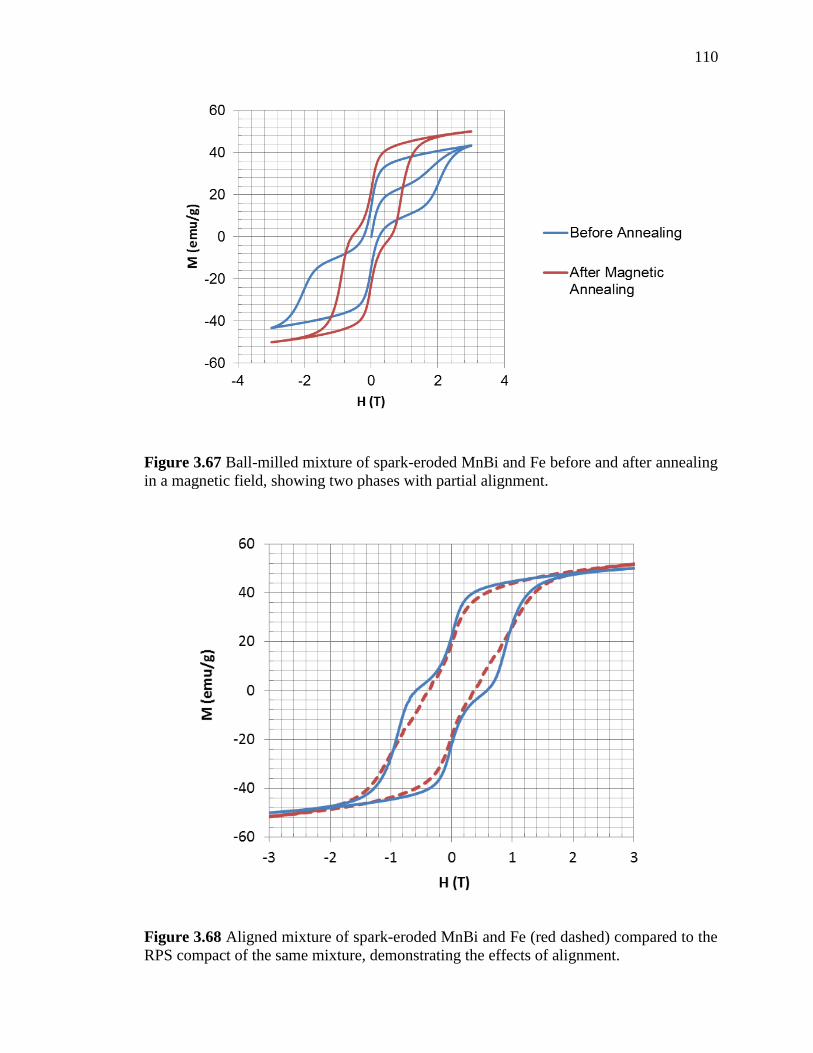
110
Figure 3.67 Ball-milled mixture of spark-eroded MnBi and Fe before and after annealing
in a magnetic field, showing two phases with partial alignment.
Figure 3.68 Aligned mixture of spark-eroded MnBi and Fe (red dashed) compared to the
RPS compact of the same mixture, demonstrating the effects of alignment.
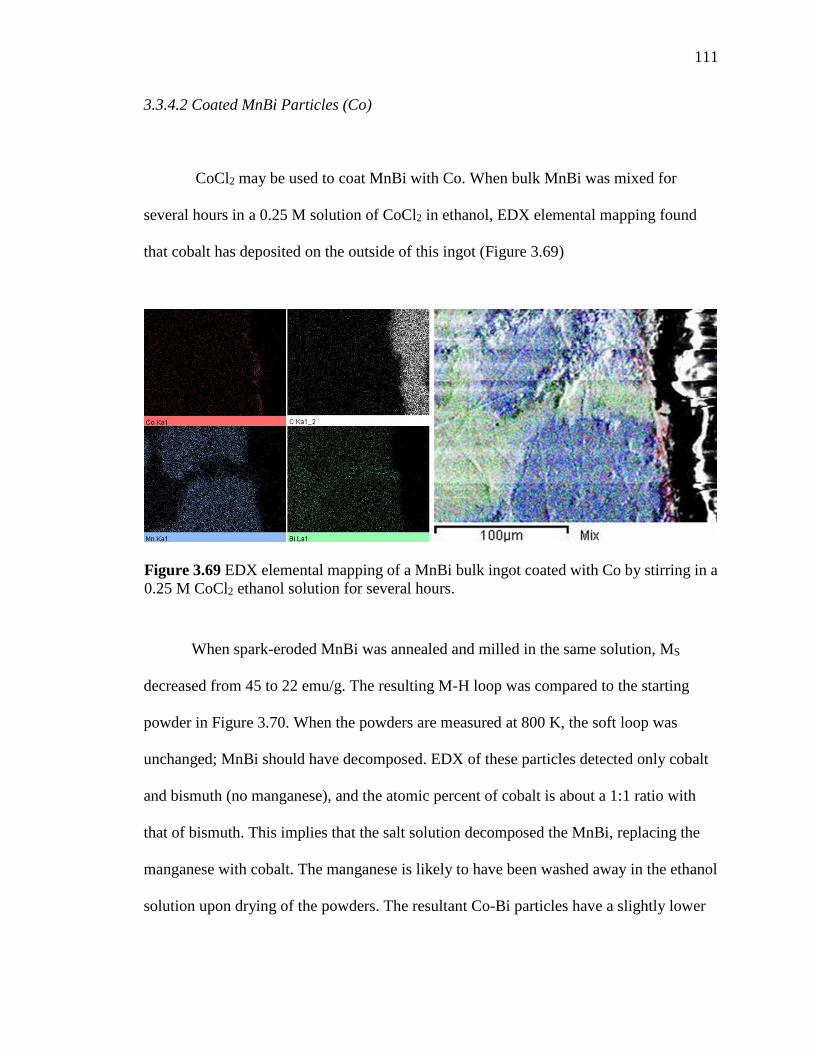
111
3.3.4.2 Coated MnBi Particles (Co)
CoCl2 may be used to coat MnBi with Co. When bulk MnBi was mixed for
several hours in a 0.25 M solution of CoCl2 in ethanol, EDX elemental mapping found
that cobalt has deposited on the outside of this ingot (Figure 3.69)
When spark-eroded MnBi was annealed and milled in the same solution, MS
decreased from 45 to 22 emu/g. The resulting M-H loop was compared to the starting
powder in Figure 3.70. When the powders are measured at 800 K, the soft loop was
unchanged; MnBi should have decomposed. EDX of these particles detected only cobalt
and bismuth (no manganese), and the atomic percent of cobalt is about a 1:1 ratio with
that of bismuth. This implies that the salt solution decomposed the MnBi, replacing the
manganese with cobalt. The manganese is likely to have been washed away in the ethanol
solution upon drying of the powders. The resultant Co-Bi particles have a slightly lower
Figure 3.69 EDX elemental mapping of a MnBi bulk ingot coated with Co by stirring in a
0.25 M CoCl2 ethanol solution for several hours.
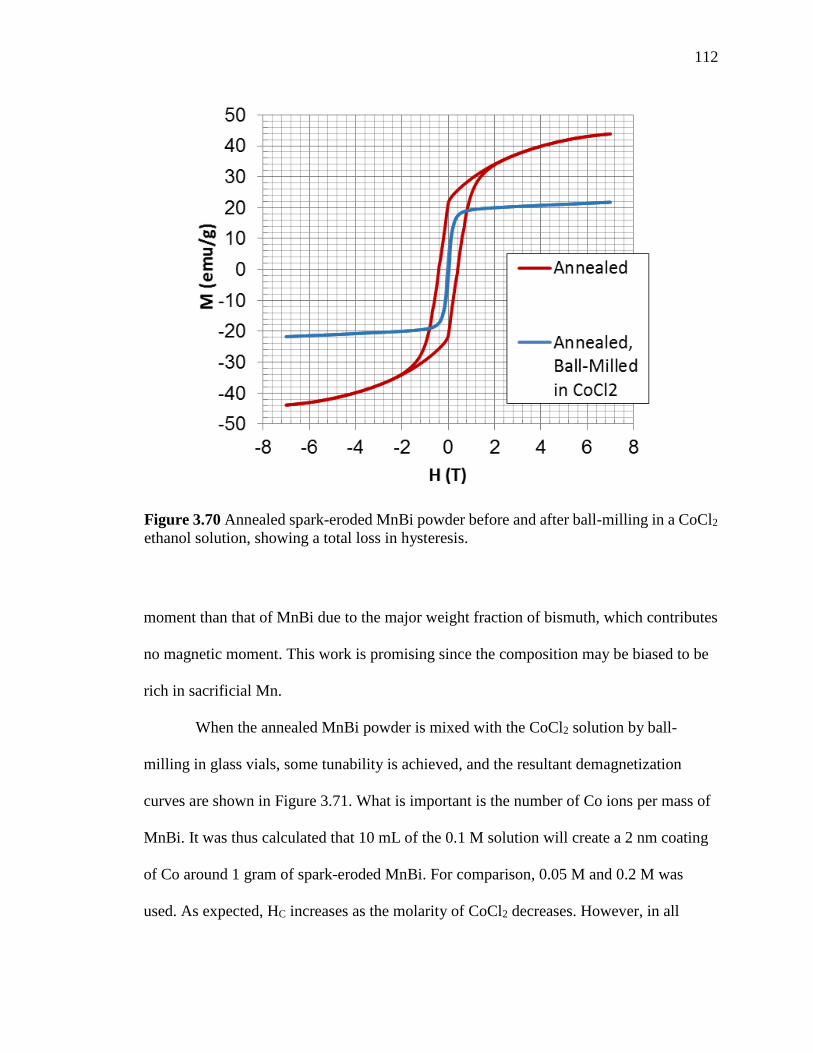
112
moment than that of MnBi due to the major weight fraction of bismuth, which contributes
no magnetic moment. This work is promising since the composition may be biased to be
rich in sacrificial Mn.
When the annealed MnBi powder is mixed with the CoCl2 solution by ball-
milling in glass vials, some tunability is achieved, and the resultant demagnetization
curves are shown in Figure 3.71. What is important is the number of Co ions per mass of
MnBi. It was thus calculated that 10 mL of the 0.1 M solution will create a 2 nm coating
of Co around 1 gram of spark-eroded MnBi. For comparison, 0.05 M and 0.2 M was
used. As expected, HC increases as the molarity of CoCl2 decreases. However, in all
Figure 3.70 Annealed spark-eroded MnBi powder before and after ball-milling in a CoCl2
ethanol solution, showing a total loss in hysteresis.
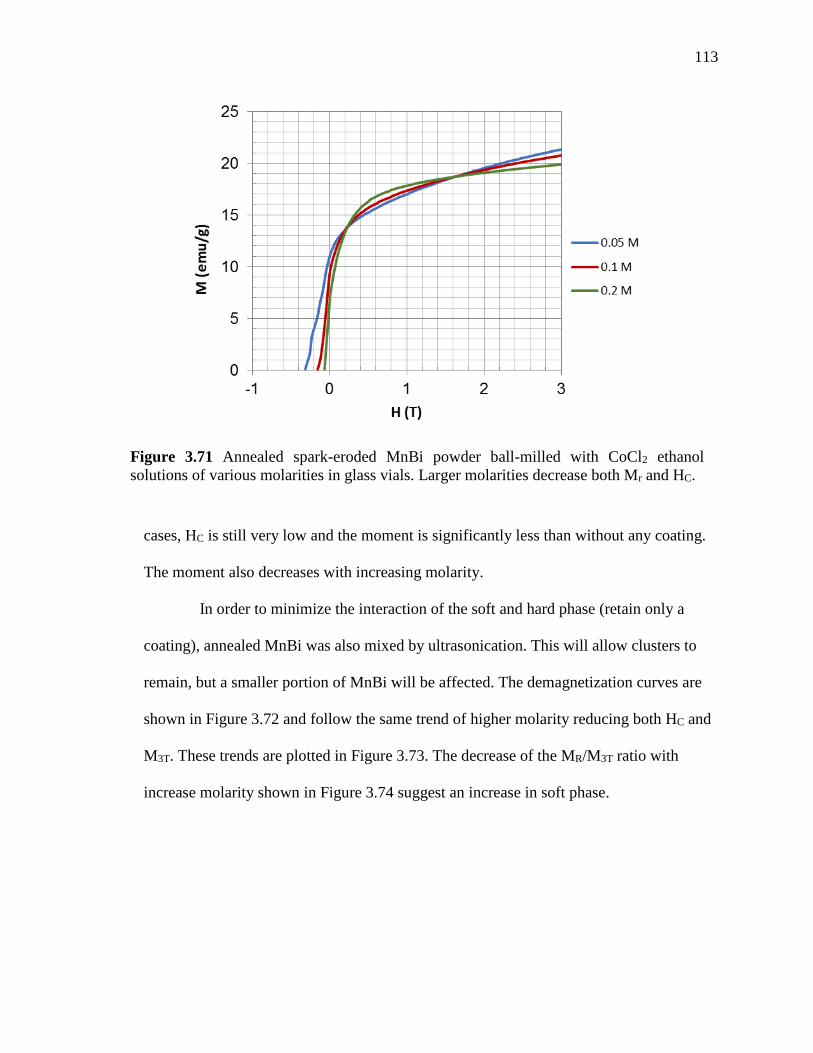
113
cases, HC is still very low and the moment is significantly less than without any coating.
The moment also decreases with increasing molarity.
In order to minimize the interaction of the soft and hard phase (retain only a
coating), annealed MnBi was also mixed by ultrasonication. This will allow clusters to
remain, but a smaller portion of MnBi will be affected. The demagnetization curves are
shown in Figure 3.72 and follow the same trend of higher molarity reducing both HC and
M3T. These trends are plotted in Figure 3.73. The decrease of the MR/M3T ratio with
increase molarity shown in Figure 3.74 suggest an increase in soft phase.
Figure 3.71 Annealed spark-eroded MnBi powder ball-milled with CoCl2 ethanol
solutions of various molarities in glass vials. Larger molarities decrease both Mr and HC.
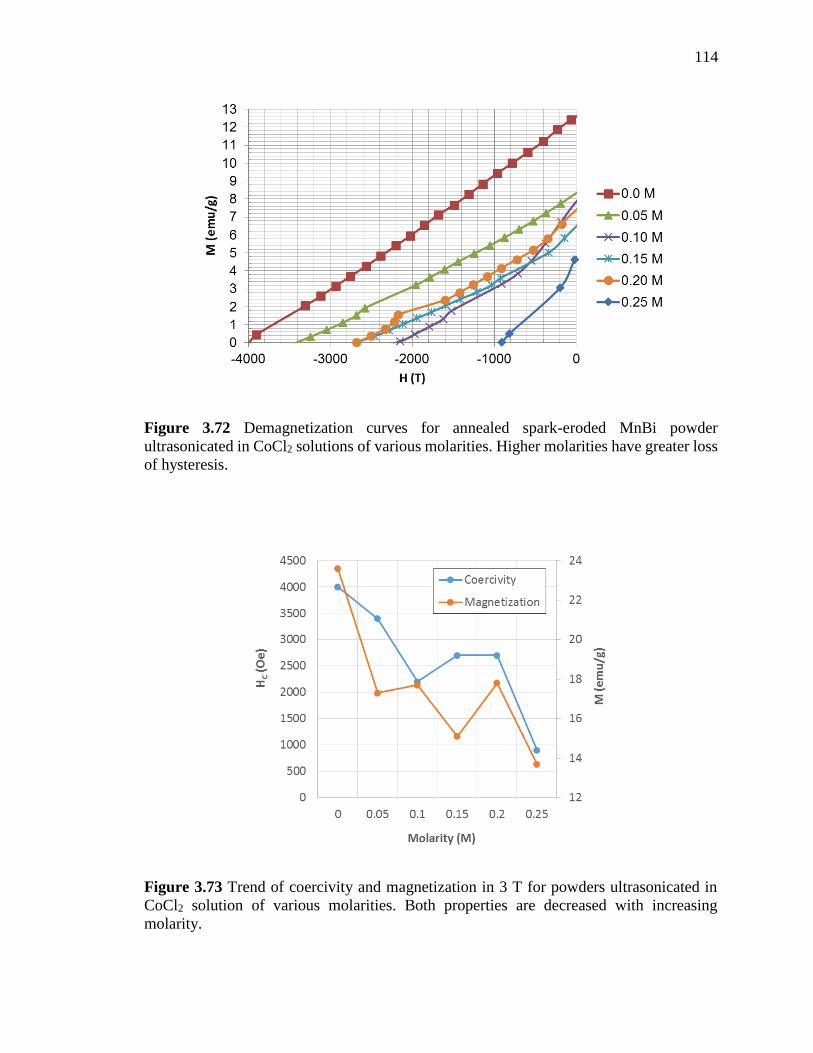
114
Figure 3.73 Trend of coercivity and magnetization in 3 T for powders ultrasonicated in
CoCl2 solution of various molarities. Both properties are decreased with increasing
molarity.
Figure 3.72 Demagnetization curves for annealed spark-eroded MnBi powder
ultrasonicated in CoCl2 solutions of various molarities. Higher molarities have greater loss
of hysteresis.
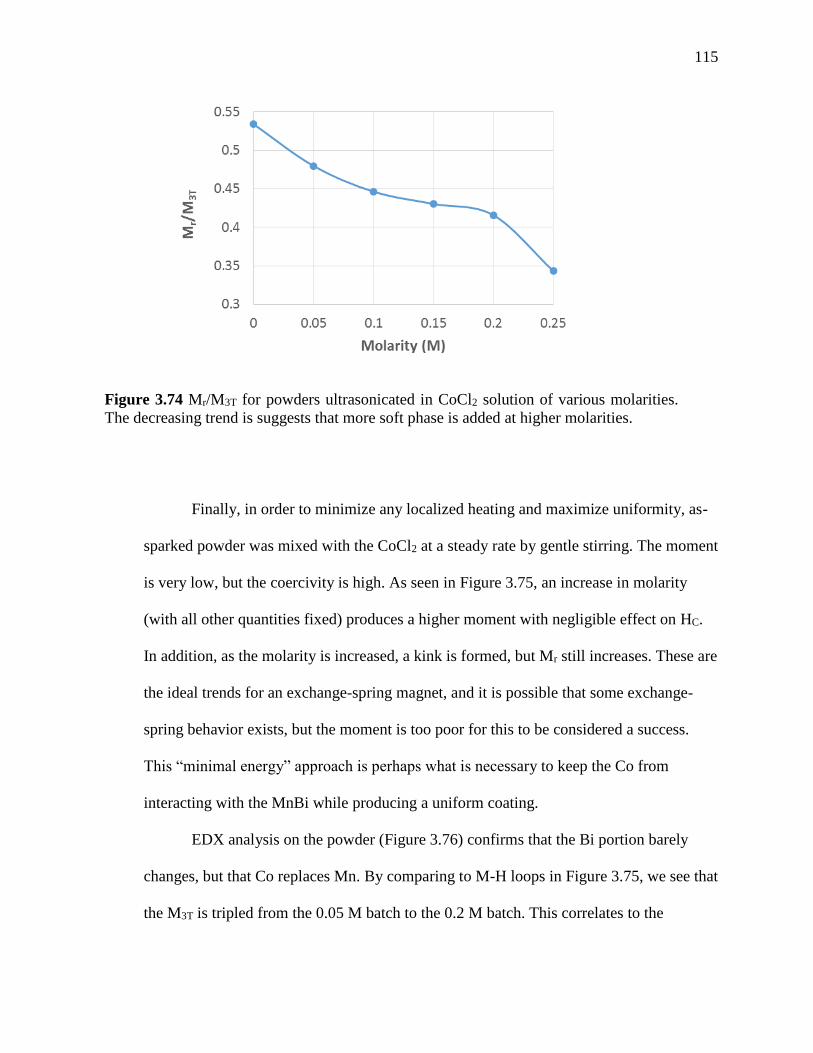
115
Finally, in order to minimize any localized heating and maximize uniformity, as-
sparked powder was mixed with the CoCl2 at a steady rate by gentle stirring. The moment
is very low, but the coercivity is high. As seen in Figure 3.75, an increase in molarity
(with all other quantities fixed) produces a higher moment with negligible effect on HC.
In addition, as the molarity is increased, a kink is formed, but Mr still increases. These are
the ideal trends for an exchange-spring magnet, and it is possible that some exchange-
spring behavior exists, but the moment is too poor for this to be considered a success.
This “minimal energy” approach is perhaps what is necessary to keep the Co from
interacting with the MnBi while producing a uniform coating.
EDX analysis on the powder (Figure 3.76) confirms that the Bi portion barely
changes, but that Co replaces Mn. By comparing to M-H loops in Figure 3.75, we see that
the M3T is tripled from the 0.05 M batch to the 0.2 M batch. This correlates to the
Figure 3.74 Mr/M3T for powders ultrasonicated in CoCl2 solution of various molarities.
The decreasing trend is suggests that more soft phase is added at higher molarities.
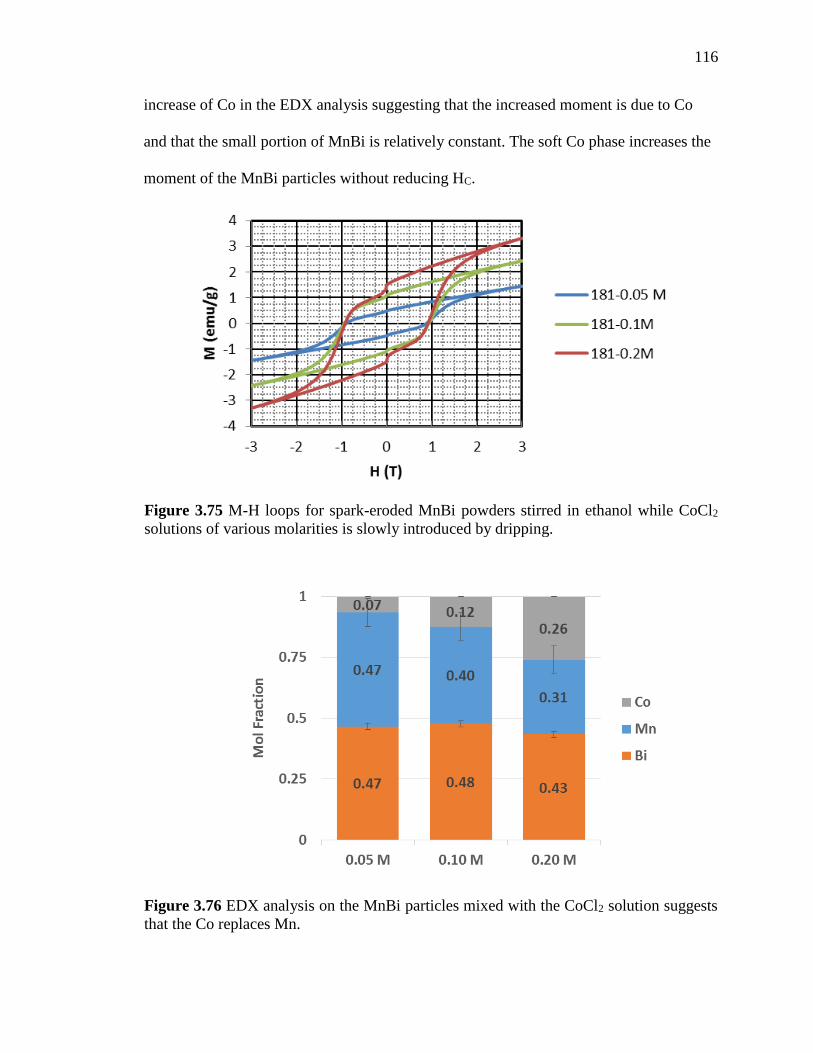
116
increase of Co in the EDX analysis suggesting that the increased moment is due to Co
and that the small portion of MnBi is relatively constant. The soft Co phase increases the
moment of the MnBi particles without reducing HC.
Figure 3.76 EDX analysis on the MnBi particles mixed with the CoCl2 solution suggests
that the Co replaces Mn.
Figure 3.75 M-H loops for spark-eroded MnBi powders stirred in ethanol while CoCl2
solutions of various molarities is slowly introduced by dripping.
117
3.4 Conclusions
High-purity bulk LTP-MnBi ingots have been achieved by chill-casting and
subsequent annealing. These polycrystalline ingots, consisting of large multi-domain
grains, exhibit low HC due to the nucleation of reverse domains. Because such ingots are
difficult to produce, another method for improving the magnetization of arc-melted ingots
was developed. By annealing the ingots in a vacuum with a mesh fixture, molten bismuth
is extracted from the ingot producing a porous ingot with MS comparable to the chill-cast
ingots.
With these bulk ingots, high-purity LTP-MnBi particles have been produced by
spark erosion, followed by subsequent annealing. The spark erosion yield consists of a
major portion of 20-30 nm particles formed into clusters and aggregates. A large fraction
of the as-sparked powders is amorphous and crystallizes rapidly. Once crystallized, the
MS is 69 emu/g, over 90 % of bulk value. These particles can be lightly milled to increase
HC without decreasing MS in order to yield (BH)MAX of 3.0 MGOe at room temperature
in a randomly-oriented sample.
It was found that with further milling of these powders, room-temperature HC of 2
T can be achieved. However, such milling reduces MS. Annealing these milled powders
does not increase MS, but decreases HC due to particle necking. The optimal milling
intensity for high (BH)MAX is thus a balance of increasing HC by breaking particle clusters
and retaining MS by avoiding phase segregation caused by localized heating.
118
Partially-aligned compacts of spark-eroded MnBi can be made by cold-pressing
and annealing in a magnetic field of 3 T. When the amorphous component of spark-
eroded MnBi is crystallized in a magnetic field, the crystals grow with their easy c-axis
aligned along the direction of the applied field. The crystallographic orientation of the
resulting compact was confirmed by x-ray diffraction studies on the aligned sample.
Spark-eroded powders that have been milled can also be aligned, which produces a larger
coercive force, albeit with lower MS.
Finally, spark-eroded particles were mixed with Fe, Co, and FeCo soft phases by
ultrasonication, ball-milling, and chemical solutions. When ball-milled and compacted by
RPS, the Co mixtures exhibit the most reduced magnetic properties. Mixtures of MnBi
and Fe undergo similar deterioration only when heated. The magnetic properties of the
FeCo mixture do not deteriorate, but remain two-phase. Presumably, the reasons for poor
properties (e.g. oxidation, contamination, surface effects, and phase segregation) prevent
the Fe or Co from negatively interacting with the MnBi. The magnetization of spark-
eroded particles, in which MS was only a few emu/g, was successfully increased by the
addition of Co without decreasing HC.
119
3.5 Acknowledgements
We wish to acknowledge useful discussions with Prof. Yang-Ki Hong, Dr. Jun
Cui, Prof. Eric Fullerton, and Dr. Frederick Spada. This work was funded by the ARPA-
E REACT Project No. 0472-1554 and Grant #121770.
This chapter, in part, is a reprint of the material as it appears in Journal of Applied
Physics, Volume 115, 2014, and IEEE Transactions on Magnetics, Volume 49, 2013, Phi-
Khanh Nguyen, Sungho Jin, and Ami E. Berkowitz. The dissertation author was the
primary investigator and author of these papers
120
3.6 References
[1] B. D. Cullity and C. D. Graham, “Introduction to Magnetic Materials”, John Wiley
& Sons, Inc, Hoboken, NJ (2009).
[2] K, J. Strnat, “Modern Permanent Magnets for Applications in Electro-
Technology”, Proceedings of the IEEE, Vol. 79, No. 6, 923 (1990).
[3] O. Gutfleisch, M. A. Willard, E. Bruck, C. H. Chen, S. G. Sankar, and J. P. Liu,
“Magnetic materials and devices for the 21st century: stronger, lighter, and more
energy efficient”, Adv. Mater. 23, 821-842 (2011).
[4] M. S. Walmer, C. H. Chen , M. H. Walmer, “A New Class of Permanent Magnetic
Materials For High Temperature Applications in TWT”, IEEE Trans. Magn. 2000,
36 , 3376 .
[5] S. D. Bader, “Collquium: Opportunities in nanomagnetism”, Rev. Mod. Phys., Vol.
78 (2006)
[6] E. F. Kneller and R. Hawig, “The Exchange-Spring Magnet: A New Material
Principle for Permanent Magnets”, IEEE Trans. Mag., Vol. 27, No. 4, (1991).
[7] R. Skomski and J. M. D. Coey, “Giant energy product in nanostructured two-phase
magnets”, Phys. Reg. B, Vol. 48, No. 21 (1993).
[8] T. Chen and W. Stutius, "The Phase Transformation and Physical Properties of the
MnBi and Mn1.08Bi Compounds", IEEE Mag. Trans. MAG-10, 581, (1974).
[9] E. Adams, W. M Hubbard, and A. M Syeles, "A New Permanent Magnet from
Powdered Manganese Bismuthide", J. Appl. Phys., Vol. 23, No. 11, pp. 1207-1211.
(1952).
[10] W. G. Moffatt, “The Handbook of Binary Phase Diagrams”, Vol. 4, General
Electric Company, Corporate Research and Development, Technology Marketing
Operation, Genium, (1981).
[11] A. F. Andresen, "The Magnetic and Crystallographic Properties of MnBi Studied
by Neutron Diffraction", Acta. Chem. Scan., Vol. 21, pp 1543-1554. (1967).
[12] H. Yoshida, T. Shima, T. Takahashi, and H. Fujimori, "Preparation of Highly Pure
MnBi Intermetallic Compounds by Arc-Melting", Mater. Trans, JIM, Vol. 40, No.
5, pp. 455-458. (1999).
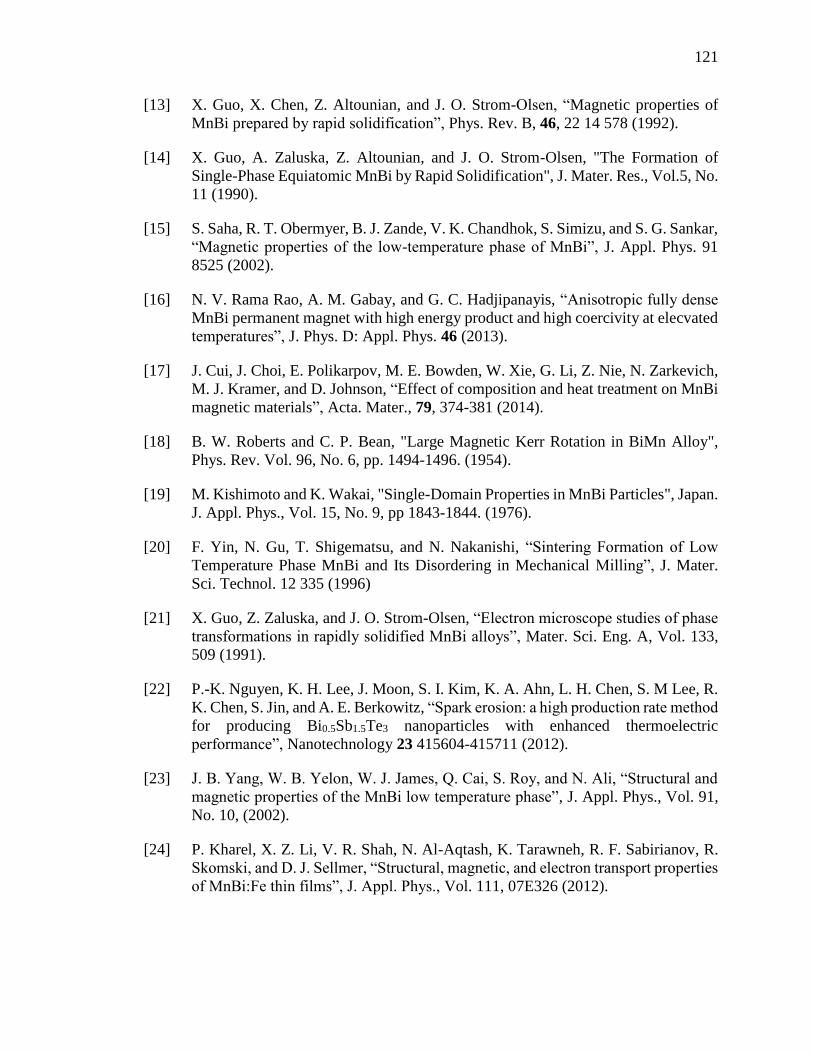
121
[13] X. Guo, X. Chen, Z. Altounian, and J. O. Strom-Olsen, “Magnetic properties of
MnBi prepared by rapid solidification”, Phys. Rev. B, 46, 22 14 578 (1992).
[14] X. Guo, A. Zaluska, Z. Altounian, and J. O. Strom-Olsen, "The Formation of
Single-Phase Equiatomic MnBi by Rapid Solidification", J. Mater. Res., Vol.5, No.
11 (1990).
[15] S. Saha, R. T. Obermyer, B. J. Zande, V. K. Chandhok, S. Simizu, and S. G. Sankar,
“Magnetic properties of the low-temperature phase of MnBi”, J. Appl. Phys. 91
8525 (2002).
[16] N. V. Rama Rao, A. M. Gabay, and G. C. Hadjipanayis, “Anisotropic fully dense
MnBi permanent magnet with high energy product and high coercivity at elecvated
temperatures”, J. Phys. D: Appl. Phys. 46 (2013).
[17] J. Cui, J. Choi, E. Polikarpov, M. E. Bowden, W. Xie, G. Li, Z. Nie, N. Zarkevich,
M. J. Kramer, and D. Johnson, “Effect of composition and heat treatment on MnBi
magnetic materials”, Acta. Mater., 79, 374-381 (2014).
[18] B. W. Roberts and C. P. Bean, "Large Magnetic Kerr Rotation in BiMn Alloy",
Phys. Rev. Vol. 96, No. 6, pp. 1494-1496. (1954).
[19] M. Kishimoto and K. Wakai, "Single-Domain Properties in MnBi Particles", Japan.
J. Appl. Phys., Vol. 15, No. 9, pp 1843-1844. (1976).
[20] F. Yin, N. Gu, T. Shigematsu, and N. Nakanishi, “Sintering Formation of Low
Temperature Phase MnBi and Its Disordering in Mechanical Milling”, J. Mater.
Sci. Technol. 12 335 (1996)
[21] X. Guo, Z. Zaluska, and J. O. Strom-Olsen, “Electron microscope studies of phase
transformations in rapidly solidified MnBi alloys”, Mater. Sci. Eng. A, Vol. 133,
509 (1991).
[22] P.-K. Nguyen, K. H. Lee, J. Moon, S. I. Kim, K. A. Ahn, L. H. Chen, S. M Lee, R.
K. Chen, S. Jin, and A. E. Berkowitz, “Spark erosion: a high production rate method
for producing Bi0.5Sb1.5Te3 nanoparticles with enhanced thermoelectric
performance”, Nanotechnology 23 415604-415711 (2012).
[23] J. B. Yang, W. B. Yelon, W. J. James, Q. Cai, S. Roy, and N. Ali, “Structural and
magnetic properties of the MnBi low temperature phase”, J. Appl. Phys., Vol. 91,
No. 10, (2002).
[24] P. Kharel, X. Z. Li, V. R. Shah, N. Al-Aqtash, K. Tarawneh, R. F. Sabirianov, R.
Skomski, and D. J. Sellmer, “Structural, magnetic, and electron transport properties
of MnBi:Fe thin films”, J. Appl. Phys., Vol. 111, 07E326 (2012).
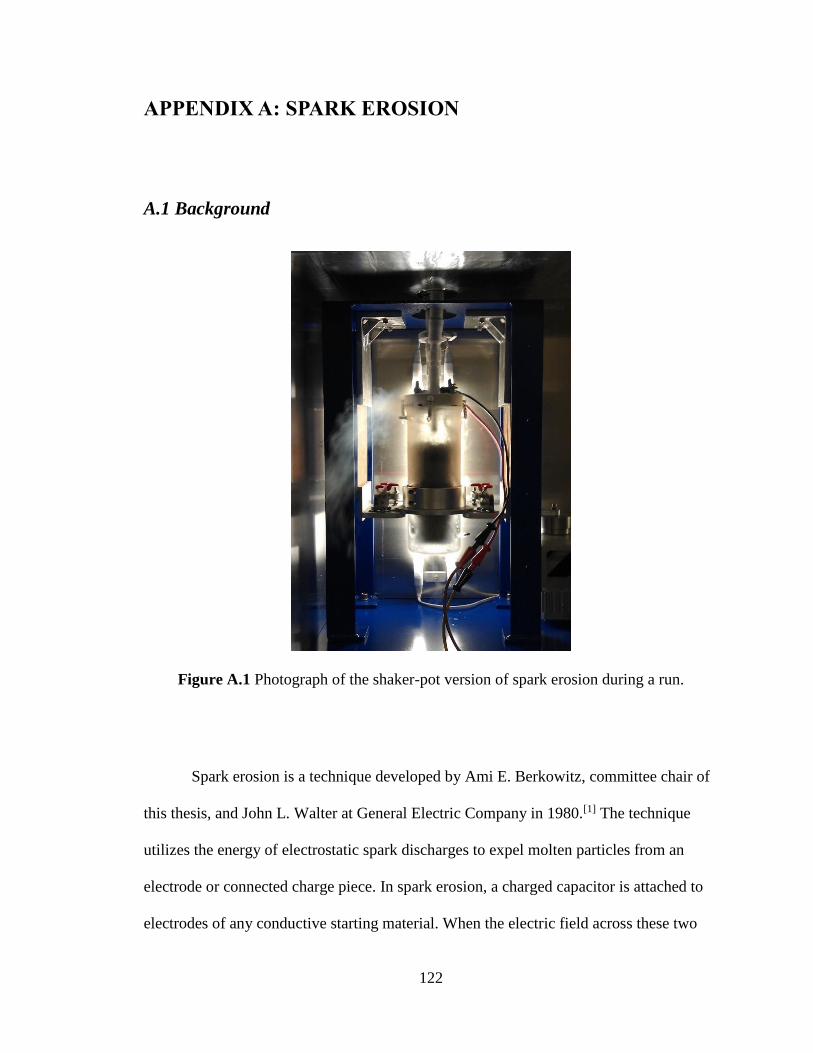
122
APPENDIX A: SPARK EROSION
A.1 Background
Spark erosion is a technique developed by Ami E. Berkowitz, committee chair of
this thesis, and John L. Walter at General Electric Company in 1980.[1] The technique
utilizes the energy of electrostatic spark discharges to expel molten particles from an
electrode or connected charge piece. In spark erosion, a charged capacitor is attached to
electrodes of any conductive starting material. When the electric field across these two
Figure A.1 Photograph of the shaker-pot version of spark erosion during a run.
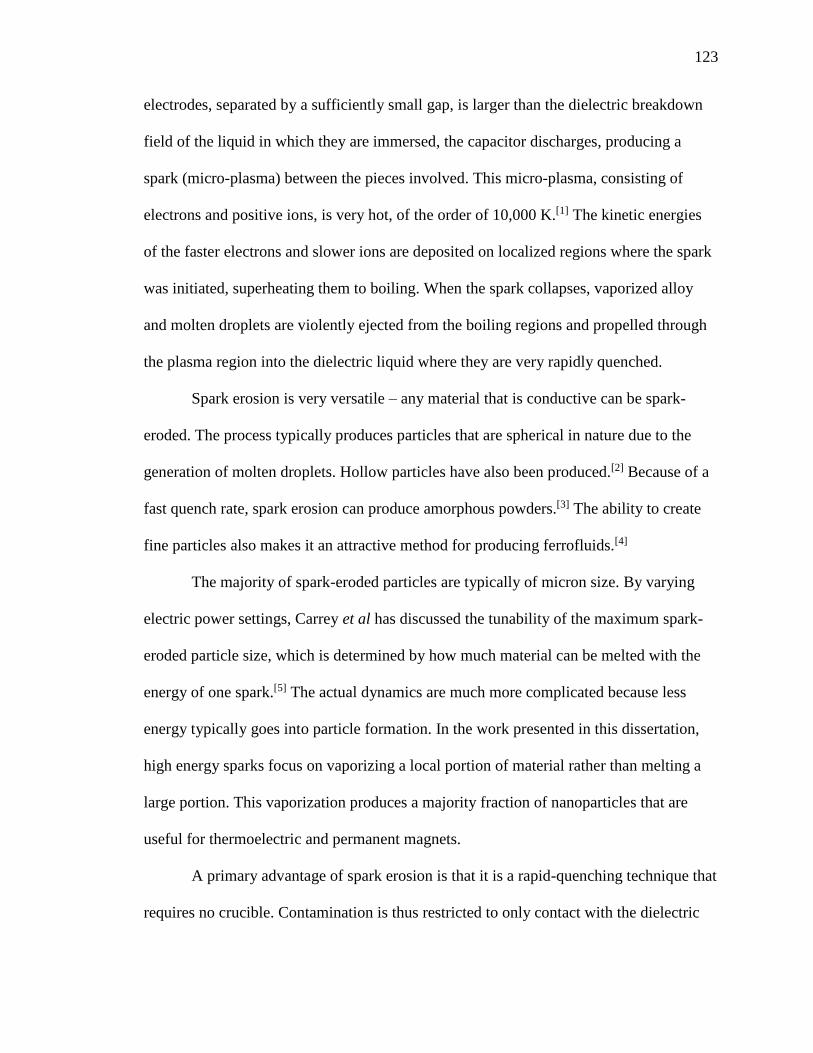
123
electrodes, separated by a sufficiently small gap, is larger than the dielectric breakdown
field of the liquid in which they are immersed, the capacitor discharges, producing a
spark (micro-plasma) between the pieces involved. This micro-plasma, consisting of
electrons and positive ions, is very hot, of the order of 10,000 K.[1] The kinetic energies
of the faster electrons and slower ions are deposited on localized regions where the spark
was initiated, superheating them to boiling. When the spark collapses, vaporized alloy
and molten droplets are violently ejected from the boiling regions and propelled through
the plasma region into the dielectric liquid where they are very rapidly quenched.
Spark erosion is very versatile – any material that is conductive can be spark-
eroded. The process typically produces particles that are spherical in nature due to the
generation of molten droplets. Hollow particles have also been produced.[2] Because of a
fast quench rate, spark erosion can produce amorphous powders.[3] The ability to create
fine particles also makes it an attractive method for producing ferrofluids.[4]
The majority of spark-eroded particles are typically of micron size. By varying
electric power settings, Carrey et al has discussed the tunability of the maximum spark-
eroded particle size, which is determined by how much material can be melted with the
energy of one spark.[5] The actual dynamics are much more complicated because less
energy typically goes into particle formation. In the work presented in this dissertation,
high energy sparks focus on vaporizing a local portion of material rather than melting a
large portion. This vaporization produces a majority fraction of nanoparticles that are
useful for thermoelectric and permanent magnets.
A primary advantage of spark erosion is that it is a rapid-quenching technique that
requires no crucible. Contamination is thus restricted to only contact with the dielectric
124
medium. The dielectric can be selected to be inert (e.g. liquid argon) so that it does not
interact with the sparking material. Alternatively, liquid nitrogen, dodecane, ethanol,
water, and carbon tetra-chloride have been suitable dielectrics for various materials.
Since the entire process can be performed in a hermetically sealed vessel, oxidation and
moisture can be minimized.
There are several configurations for utilizing spark erosion for particle
production.[5] The shaker-pot version is the method of choice because of the ability to
attain large yields while minimizing contamination and/or oxidation. Large yields are
desirable for scalability and economic feasibility. In this configuration, power is only
drawn to re-charge a capacitor that has discharged to form the powder-producing spark.
The process is thus very energy-efficient, typically operating at only a few hundred
watts.[6]
Figure A.2 Spark-eroded MnBi particle yield after 1 hour in a 4 inch ID glass pot. Rates
of as high as 360 grams per hour have been achieved.
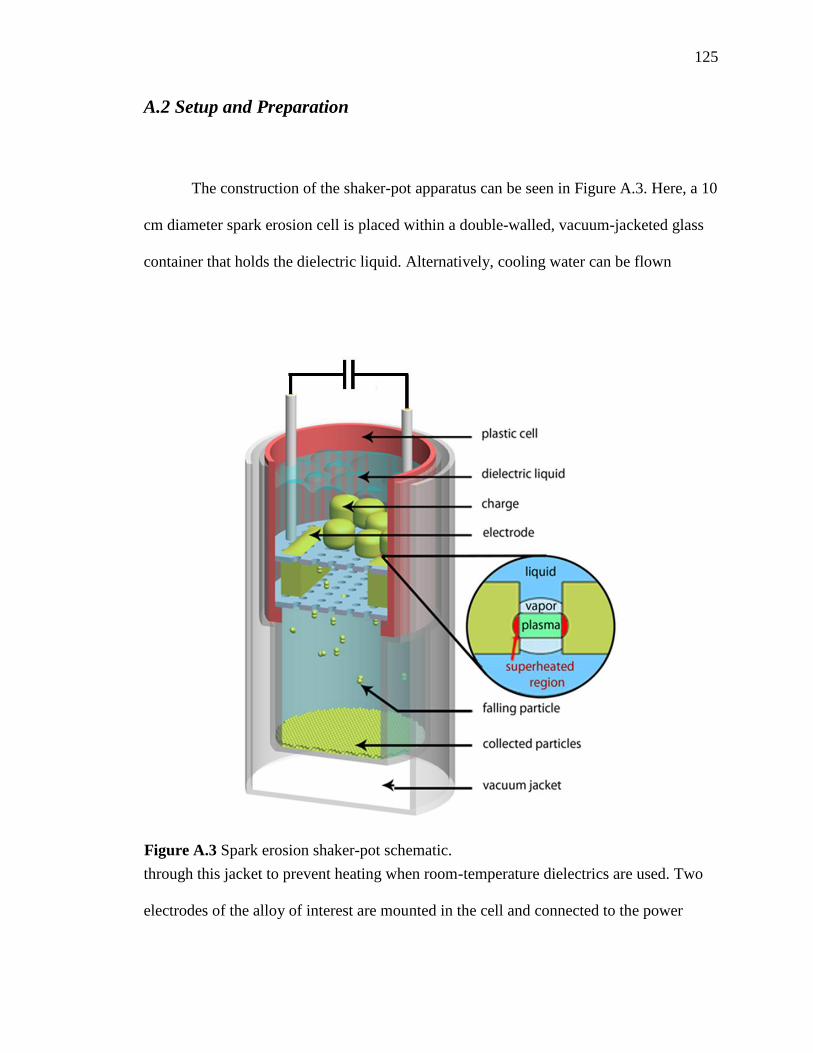
125
A.2 Setup and Preparation
The construction of the shaker-pot apparatus can be seen in Figure A.3. Here, a 10
cm diameter spark erosion cell is placed within a double-walled, vacuum-jacketed glass
container that holds the dielectric liquid. Alternatively, cooling water can be flown
through this jacket to prevent heating when room-temperature dielectrics are used. Two
electrodes of the alloy of interest are mounted in the cell and connected to the power
Figure A.3 Spark erosion shaker-pot schematic.
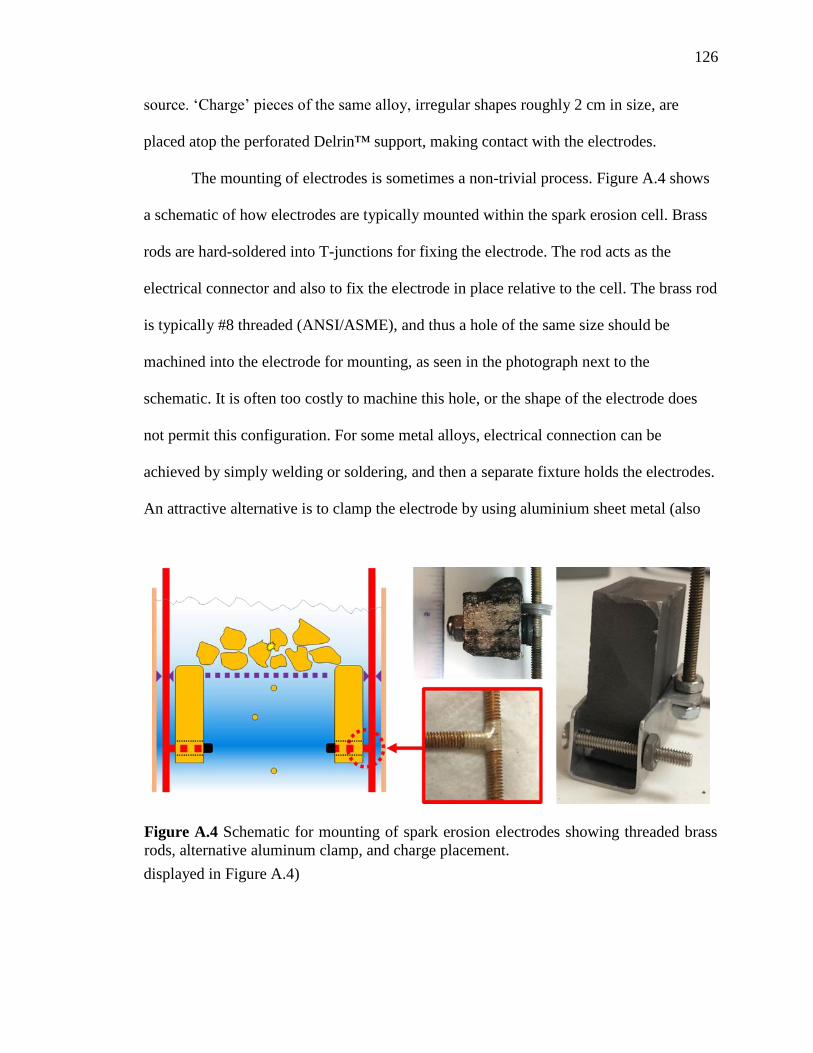
126
source. ‘Charge’ pieces of the same alloy, irregular shapes roughly 2 cm in size, are
placed atop the perforated Delrin™ support, making contact with the electrodes.
The mounting of electrodes is sometimes a non-trivial process. Figure A.4 shows
a schematic of how electrodes are typically mounted within the spark erosion cell. Brass
rods are hard-soldered into T-junctions for fixing the electrode. The rod acts as the
electrical connector and also to fix the electrode in place relative to the cell. The brass rod
is typically #8 threaded (ANSI/ASME), and thus a hole of the same size should be
machined into the electrode for mounting, as seen in the photograph next to the
schematic. It is often too costly to machine this hole, or the shape of the electrode does
not permit this configuration. For some metal alloys, electrical connection can be
achieved by simply welding or soldering, and then a separate fixture holds the electrodes.
An attractive alternative is to clamp the electrode by using aluminium sheet metal (also
displayed in Figure A.4)
Figure A.4 Schematic for mounting of spark erosion electrodes showing threaded brass
rods, alternative aluminum clamp, and charge placement.
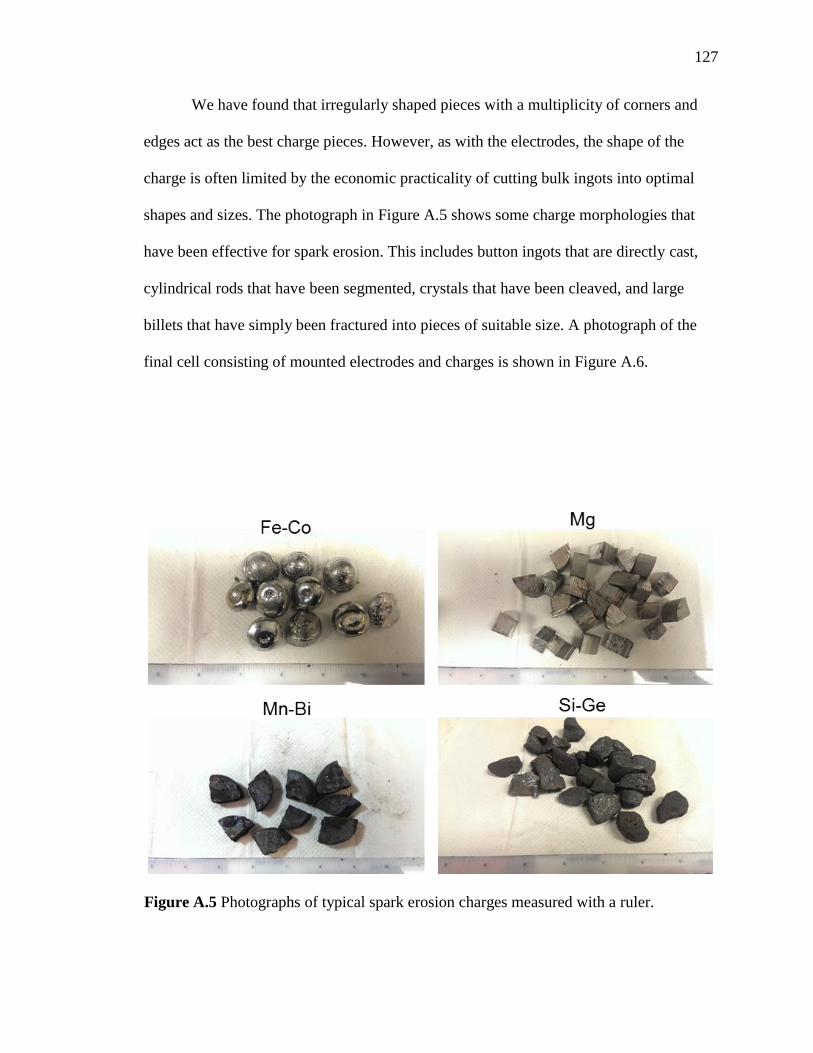
127
We have found that irregularly shaped pieces with a multiplicity of corners and
edges act as the best charge pieces. However, as with the electrodes, the shape of the
charge is often limited by the economic practicality of cutting bulk ingots into optimal
shapes and sizes. The photograph in Figure A.5 shows some charge morphologies that
have been effective for spark erosion. This includes button ingots that are directly cast,
cylindrical rods that have been segmented, crystals that have been cleaved, and large
billets that have simply been fractured into pieces of suitable size. A photograph of the
final cell consisting of mounted electrodes and charges is shown in Figure A.6.
Figure A.5 Photographs of typical spark erosion charges measured with a ruler.
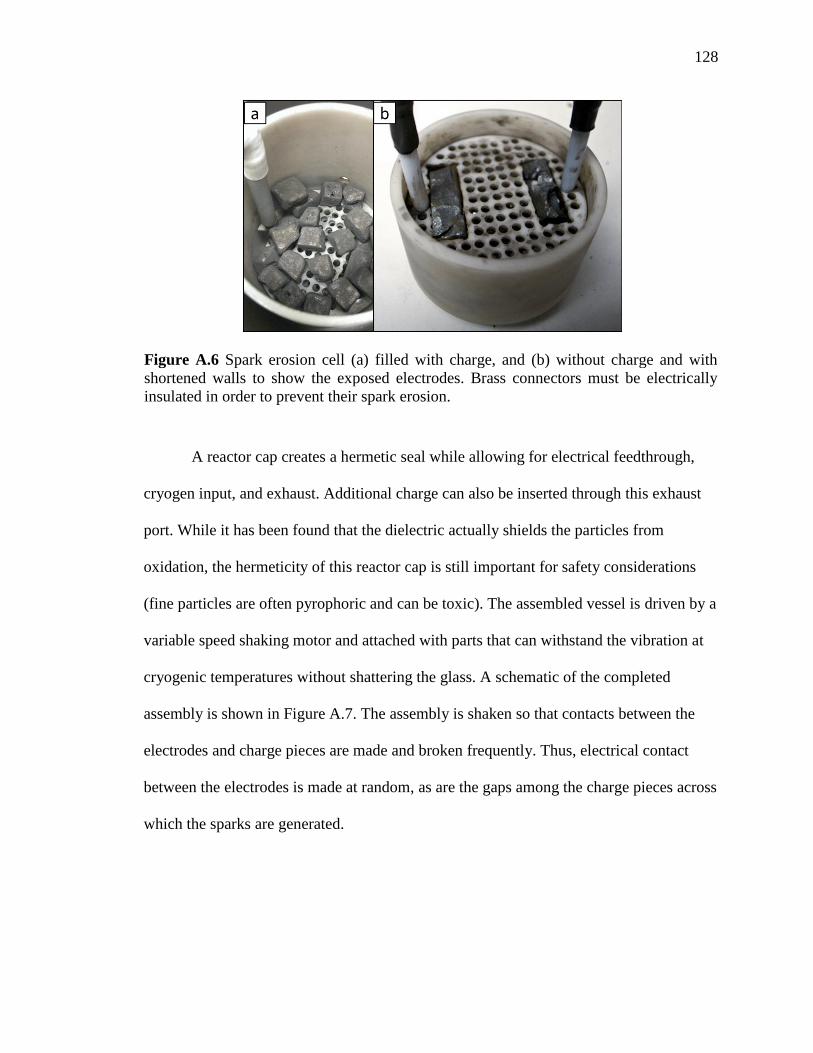
128
A reactor cap creates a hermetic seal while allowing for electrical feedthrough,
cryogen input, and exhaust. Additional charge can also be inserted through this exhaust
port. While it has been found that the dielectric actually shields the particles from
oxidation, the hermeticity of this reactor cap is still important for safety considerations
(fine particles are often pyrophoric and can be toxic). The assembled vessel is driven by a
variable speed shaking motor and attached with parts that can withstand the vibration at
cryogenic temperatures without shattering the glass. A schematic of the completed
assembly is shown in Figure A.7. The assembly is shaken so that contacts between the
electrodes and charge pieces are made and broken frequently. Thus, electrical contact
between the electrodes is made at random, as are the gaps among the charge pieces across
which the sparks are generated.
Figure A.6 Spark erosion cell (a) filled with charge, and (b) without charge and with
shortened walls to show the exposed electrodes. Brass connectors must be electrically
insulated in order to prevent their spark erosion.
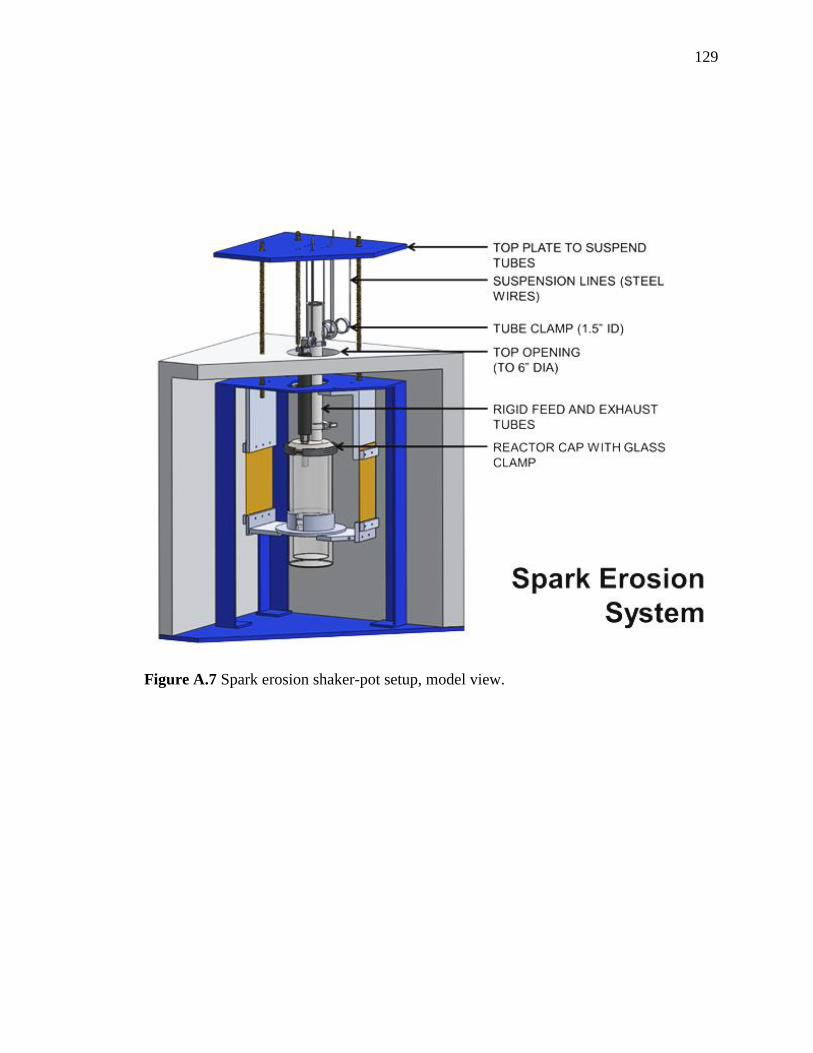
129
Figure A.7 Spark erosion shaker-pot setup, model view.
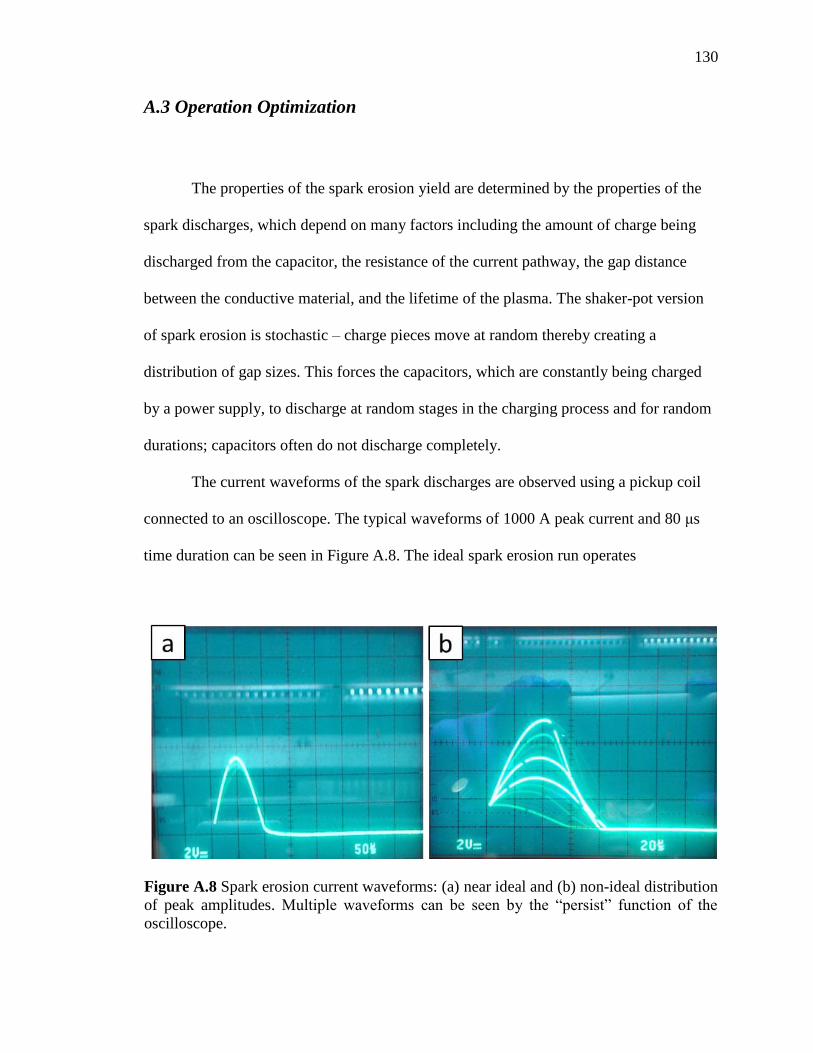
130
A.3 Operation Optimization
The properties of the spark erosion yield are determined by the properties of the
spark discharges, which depend on many factors including the amount of charge being
discharged from the capacitor, the resistance of the current pathway, the gap distance
between the conductive material, and the lifetime of the plasma. The shaker-pot version
of spark erosion is stochastic – charge pieces move at random thereby creating a
distribution of gap sizes. This forces the capacitors, which are constantly being charged
by a power supply, to discharge at random stages in the charging process and for random
durations; capacitors often do not discharge completely.
The current waveforms of the spark discharges are observed using a pickup coil
connected to an oscilloscope. The typical waveforms of 1000 A peak current and 80 μs
time duration can be seen in Figure A.8. The ideal spark erosion run operates
Figure A.8 Spark erosion current waveforms: (a) near ideal and (b) non-ideal distribution
of peak amplitudes. Multiple waveforms can be seen by the “persist” function of the
oscilloscope.
131
continuously at the maximum rate in which the all sparks produce uniformly high current
waveforms. This is shown in Figure A.8(a), while Figure A.8(b) shows a distribution of
peak currents (multiple sparks are seen due to “persistence mode” of trace). Failure to
achieve waveform uniformity can lead to a larger distribution of particle sizes and
morphologies.
In order to approach the ideal case, the shaking of the vessel and the packing of
the charge should be optimized. Since charge packing changes during a run, the shaking
requires monitoring and readjustment. Distribution of spark profiles can often be
eliminated simply by varying the shaking speed. Excessive quantities of charge may also
prevent ideal operation.
During the initial introduction of charge, configurations prone to “jamming”
should be avoided. Heavier charge may require an increase in the shaking amplitude,
which is changed by adjusting the camshaft length. If no gaps are formed during shaking
due to a “jam” or otherwise, the circuit is shorted. This could cause damage to the power
supply, cause excessive heat, or weld the charge pieces together. If a “jam” occurs during
a run, the power is turned off in order to avoid damage to the electronics.
Aside from spark uniformity, conditions should be adjusted in order to optimize
the yield rate. Initially, enough charge is added to form a current pathway without
shaking. So if shaken too slowly, sufficient gaps cannot be formed – the number of
sparks, the spark rate, will be high and a short may occur. If shaken too quickly, the spark
rate will be lower than optimal. Charge size and quantity are most key to spark (and
yield) rate. Larger charge pieces typically produce more uniform sparks at the expense of
yield rate due to fewer surface contacts.
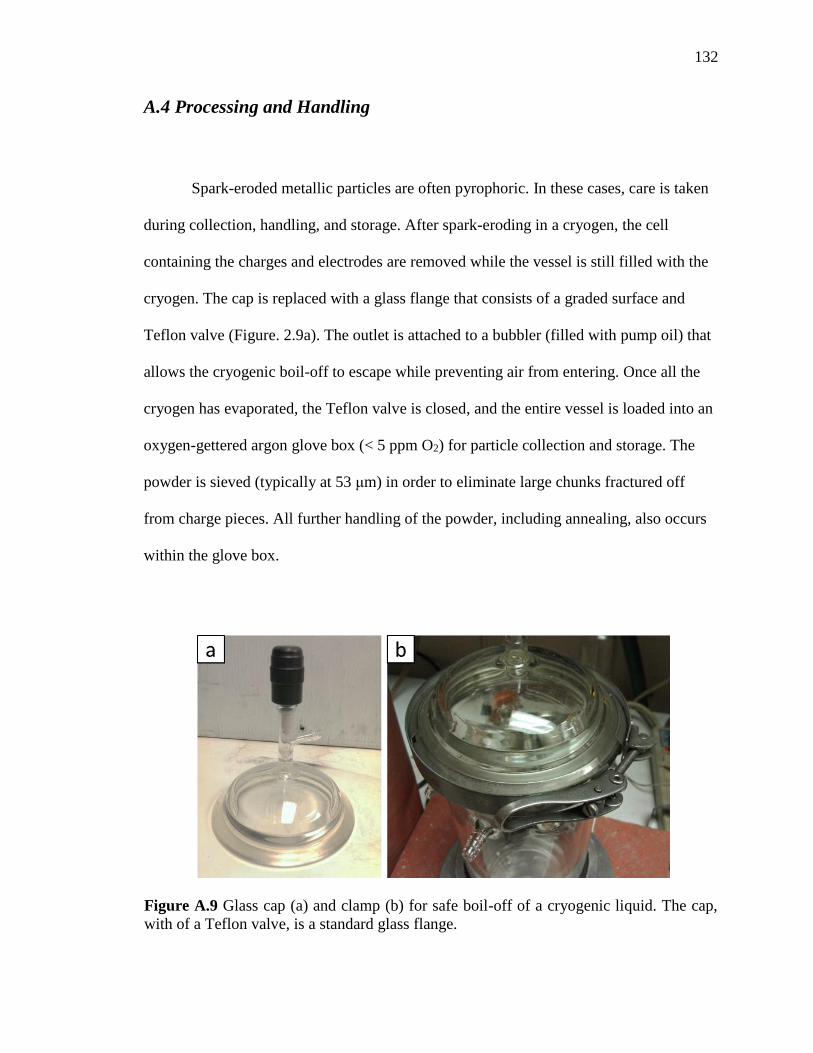
132
A.4 Processing and Handling
Spark-eroded metallic particles are often pyrophoric. In these cases, care is taken
during collection, handling, and storage. After spark-eroding in a cryogen, the cell
containing the charges and electrodes are removed while the vessel is still filled with the
cryogen. The cap is replaced with a glass flange that consists of a graded surface and
Teflon valve (Figure. 2.9a). The outlet is attached to a bubbler (filled with pump oil) that
allows the cryogenic boil-off to escape while preventing air from entering. Once all the
cryogen has evaporated, the Teflon valve is closed, and the entire vessel is loaded into an
oxygen-gettered argon glove box (< 5 ppm O2) for particle collection and storage. The
powder is sieved (typically at 53 μm) in order to eliminate large chunks fractured off
from charge pieces. All further handling of the powder, including annealing, also occurs
within the glove box.
Figure A.9 Glass cap (a) and clamp (b) for safe boil-off of a cryogenic liquid. The cap,
with of a Teflon valve, is a standard glass flange.
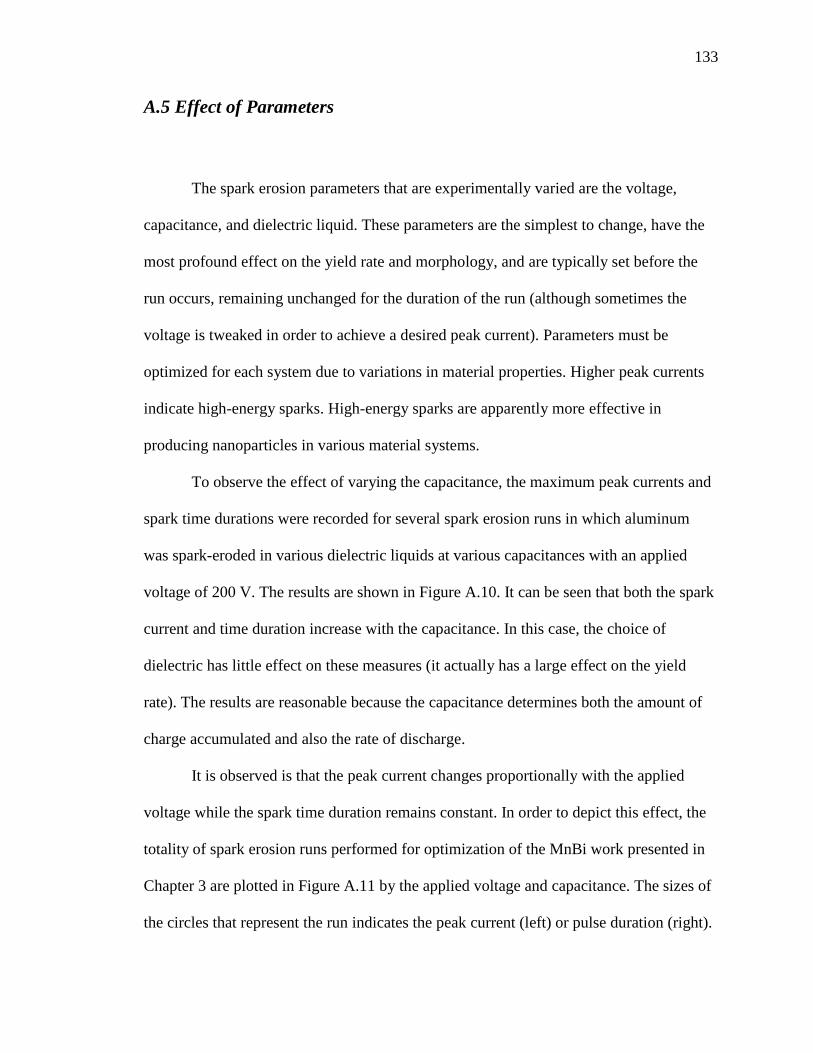
133
A.5 Effect of Parameters
The spark erosion parameters that are experimentally varied are the voltage,
capacitance, and dielectric liquid. These parameters are the simplest to change, have the
most profound effect on the yield rate and morphology, and are typically set before the
run occurs, remaining unchanged for the duration of the run (although sometimes the
voltage is tweaked in order to achieve a desired peak current). Parameters must be
optimized for each system due to variations in material properties. Higher peak currents
indicate high-energy sparks. High-energy sparks are apparently more effective in
producing nanoparticles in various material systems.
To observe the effect of varying the capacitance, the maximum peak currents and
spark time durations were recorded for several spark erosion runs in which aluminum
was spark-eroded in various dielectric liquids at various capacitances with an applied
voltage of 200 V. The results are shown in Figure A.10. It can be seen that both the spark
current and time duration increase with the capacitance. In this case, the choice of
dielectric has little effect on these measures (it actually has a large effect on the yield
rate). The results are reasonable because the capacitance determines both the amount of
charge accumulated and also the rate of discharge.
It is observed is that the peak current changes proportionally with the applied
voltage while the spark time duration remains constant. In order to depict this effect, the
totality of spark erosion runs performed for optimization of the MnBi work presented in
Chapter 3 are plotted in Figure A.11 by the applied voltage and capacitance. The sizes of
the circles that represent the run indicates the peak current (left) or pulse duration (right).
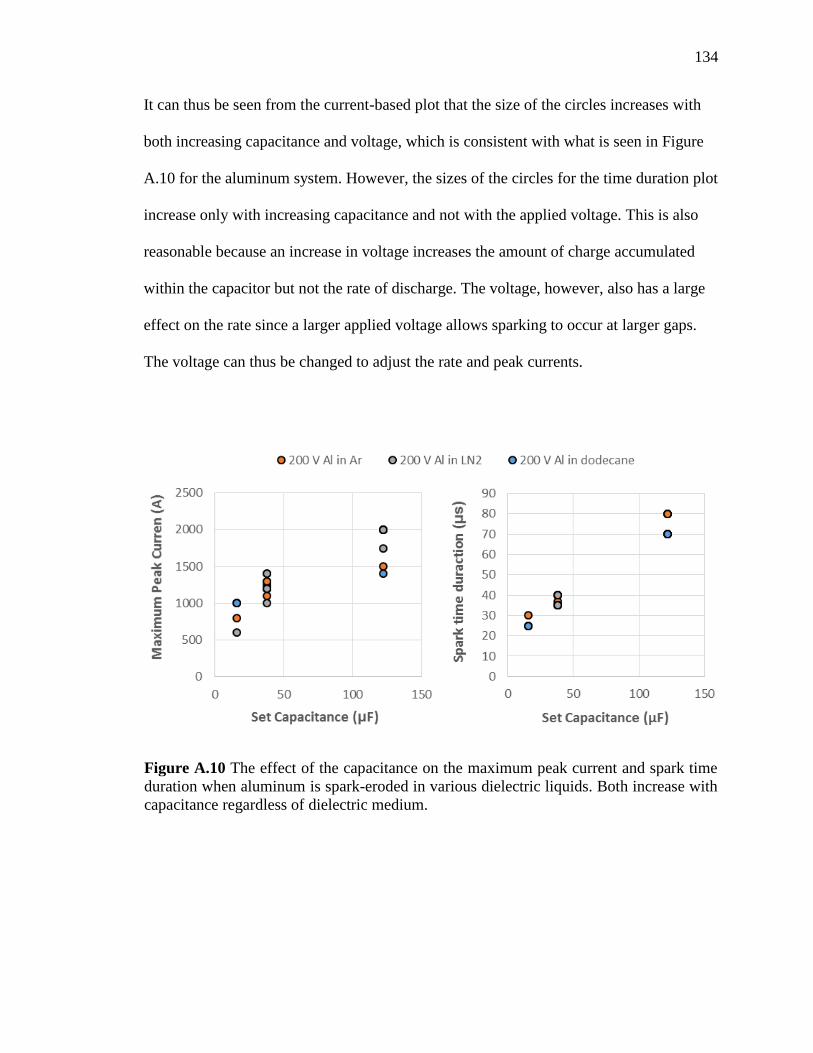
134
It can thus be seen from the current-based plot that the size of the circles increases with
both increasing capacitance and voltage, which is consistent with what is seen in Figure
A.10 for the aluminum system. However, the sizes of the circles for the time duration plot
increase only with increasing capacitance and not with the applied voltage. This is also
reasonable because an increase in voltage increases the amount of charge accumulated
within the capacitor but not the rate of discharge. The voltage, however, also has a large
effect on the rate since a larger applied voltage allows sparking to occur at larger gaps.
The voltage can thus be changed to adjust the rate and peak currents.
Figure A.10 The effect of the capacitance on the maximum peak current and spark time
duration when aluminum is spark-eroded in various dielectric liquids. Both increase with
capacitance regardless of dielectric medium.
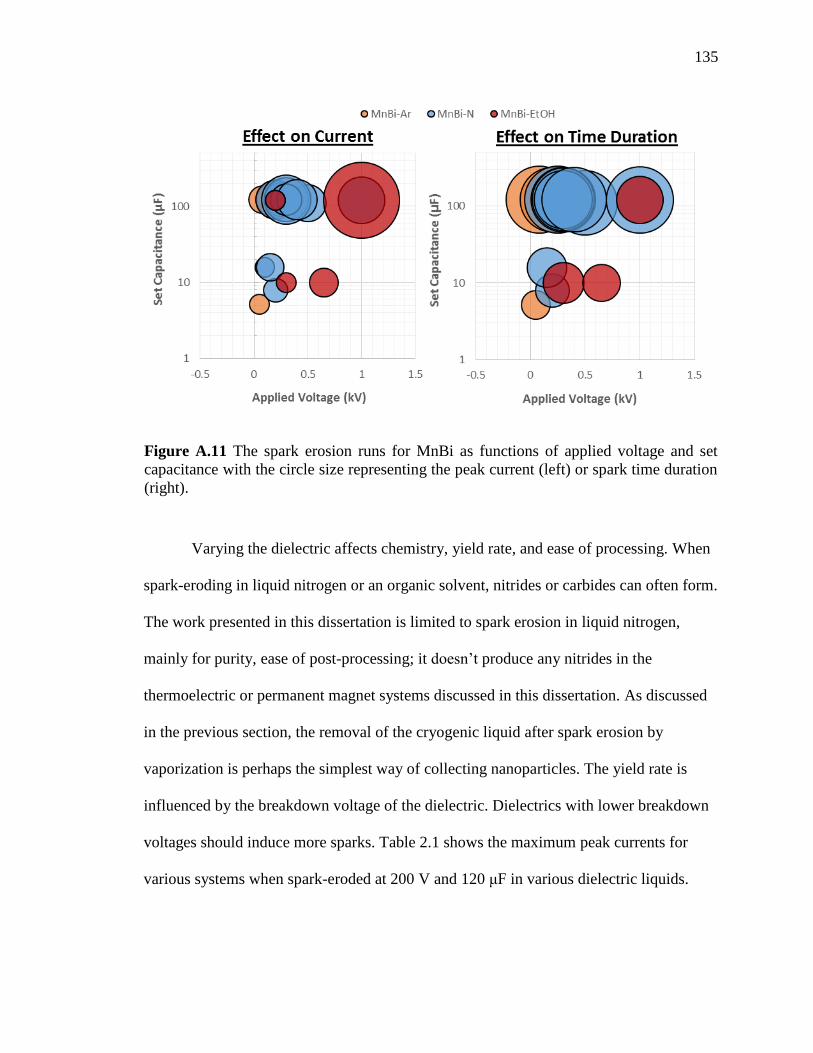
135
Varying the dielectric affects chemistry, yield rate, and ease of processing. When
spark-eroding in liquid nitrogen or an organic solvent, nitrides or carbides can often form.
The work presented in this dissertation is limited to spark erosion in liquid nitrogen,
mainly for purity, ease of post-processing; it doesn’t produce any nitrides in the
thermoelectric or permanent magnet systems discussed in this dissertation. As discussed
in the previous section, the removal of the cryogenic liquid after spark erosion by
vaporization is perhaps the simplest way of collecting nanoparticles. The yield rate is
influenced by the breakdown voltage of the dielectric. Dielectrics with lower breakdown
voltages should induce more sparks. Table 2.1 shows the maximum peak currents for
various systems when spark-eroded at 200 V and 120 μF in various dielectric liquids.
Figure A.11 The spark erosion runs for MnBi as functions of applied voltage and set
capacitance with the circle size representing the peak current (left) or spark time duration
(right).
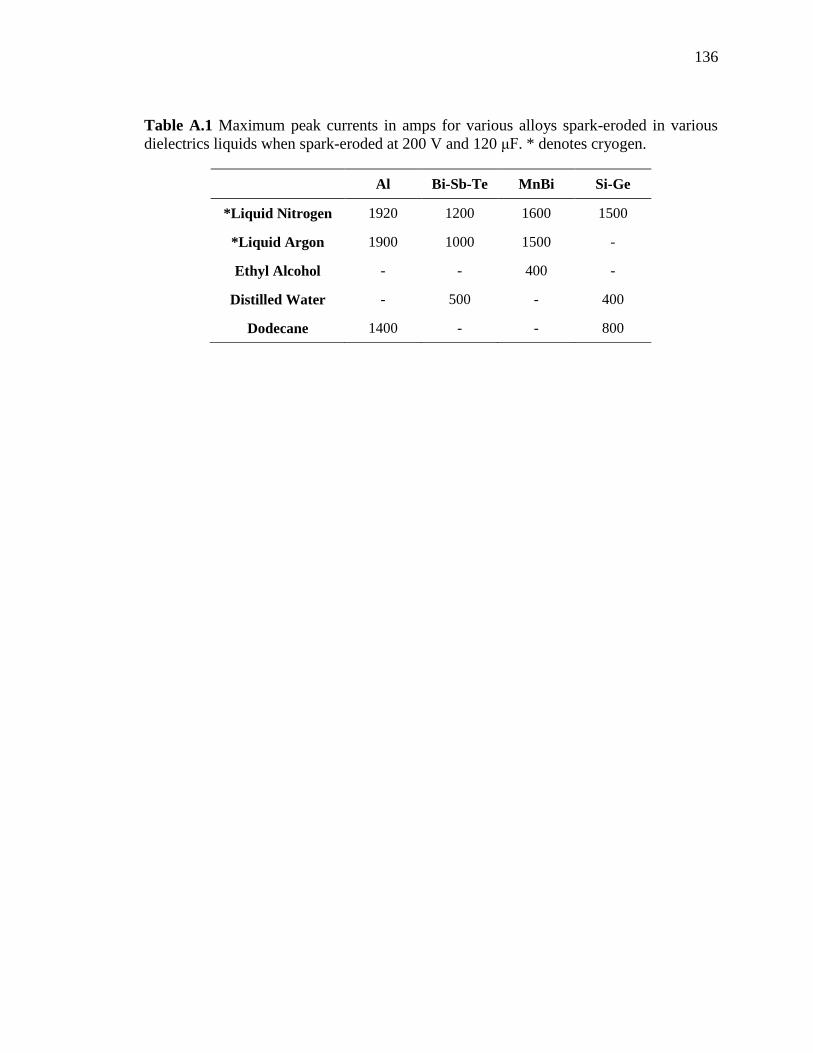
136
Table A.1 Maximum peak currents in amps for various alloys spark-eroded in various
dielectrics liquids when spark-eroded at 200 V and 120 μF. * denotes cryogen.
Al Bi-Sb-Te MnBi Si-Ge
*Liquid Nitrogen 1920 1200 1600 1500
*Liquid Argon 1900 1000 1500 -
Ethyl Alcohol - - 400 -
Distilled Water - 500 - 400
Dodecane 1400 - - 800
137
A.6 References
[1] A. E. Berkowitz and J. L. Walter, “Spark Erosion: A Method for Producing Rapidly
Quenched Fine Powders”, J. Mater. Res., 2 (2), 277 (1987).
[2] A. E. Berkowitz, H. Harper, D. J. Smith, H. Hu, Q. Jiang, V. C. Solomon, and H.
B. Radousky, “Hollow metallic microspheres produced by spark erosion”, Appl.
Phys. Lett., Vol. 85, No. 6, (2004).
[3] A. E. Berkowitz, J. L. Walter, and K.F. Wall, “Magnetic Properties of Amorphous
Particles Produced by Spark Erosion”, Phys. Rev. Lett., Vol. 46, No. 22, 1484
(1981).
[4] A. E. Berkowitz and J. L. Walter, “Ferrofluids Prepared by Spark Erosion”, J.
Magn. Mater., 39, 75 (1983).
[5] J. Carrey, H. B. Radousky and A. E. Berkowitz, "Spark-eroded particles: influence
of processing parameters", J. Appl. Phys., 95, 823 (2004).
[6] P.-K. Nguyen, K. H. Lee, J. Moon, S. I. Kim, K. A. Ahn, L. H. Chen, S. M Lee, R.
K. Chen, S. Jin, and A. E. Berkowitz, “Spark erosion: a high production rate method
for producing Bi0.5Sb1.5Te3 nanoparticles with enhanced thermoelectric
performance”, Nanotechnology 23 415604-415711 (2012).
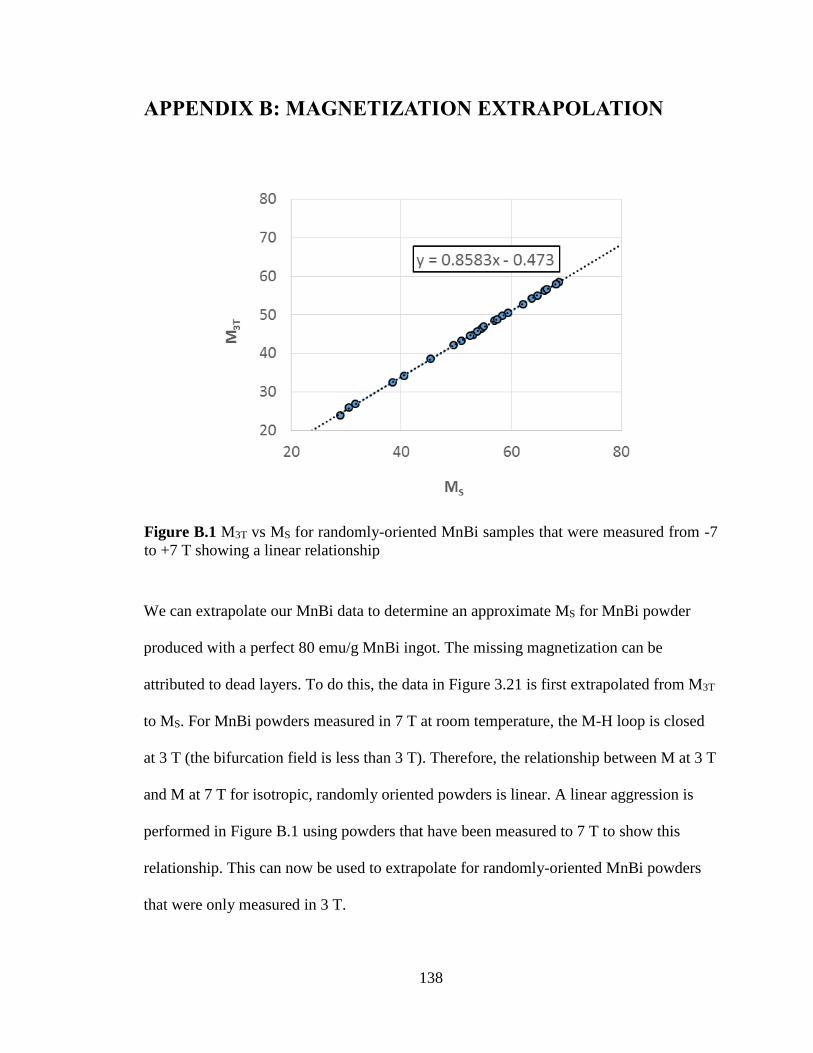
138
APPENDIX B: MAGNETIZATION EXTRAPOLATION
We can extrapolate our MnBi data to determine an approximate MS for MnBi powder
produced with a perfect 80 emu/g MnBi ingot. The missing magnetization can be
attributed to dead layers. To do this, the data in Figure 3.21 is first extrapolated from M3T
to MS. For MnBi powders measured in 7 T at room temperature, the M-H loop is closed
at 3 T (the bifurcation field is less than 3 T). Therefore, the relationship between M at 3 T
and M at 7 T for isotropic, randomly oriented powders is linear. A linear aggression is
performed in Figure B.1 using powders that have been measured to 7 T to show this
relationship. This can now be used to extrapolate for randomly-oriented MnBi powders
that were only measured in 3 T.
Figure B.1 M3T vs MS for randomly-oriented MnBi samples that were measured from -7
to +7 T showing a linear relationship
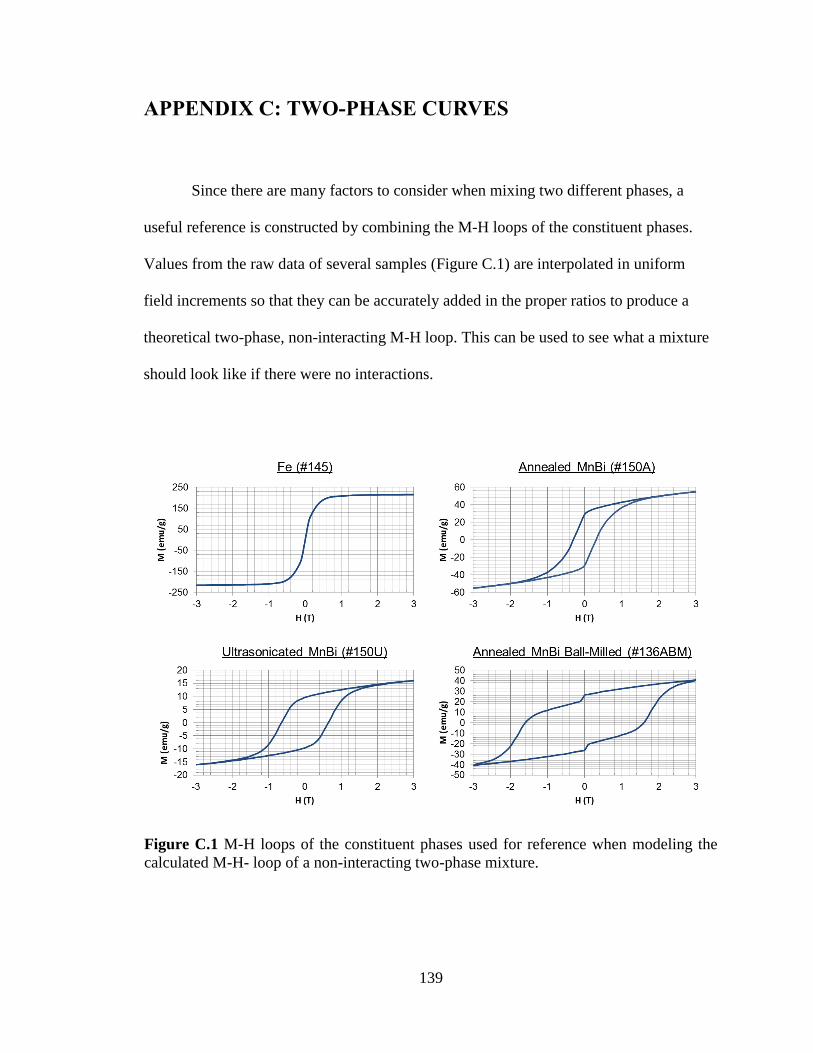
139
APPENDIX C: TWO-PHASE CURVES
Since there are many factors to consider when mixing two different phases, a
useful reference is constructed by combining the M-H loops of the constituent phases.
Values from the raw data of several samples (Figure C.1) are interpolated in uniform
field increments so that they can be accurately added in the proper ratios to produce a
theoretical two-phase, non-interacting M-H loop. This can be used to see what a mixture
should look like if there were no interactions.
Figure C.1 M-H loops of the constituent phases used for reference when modeling the
calculated M-H- loop of a non-interacting two-phase mixture.
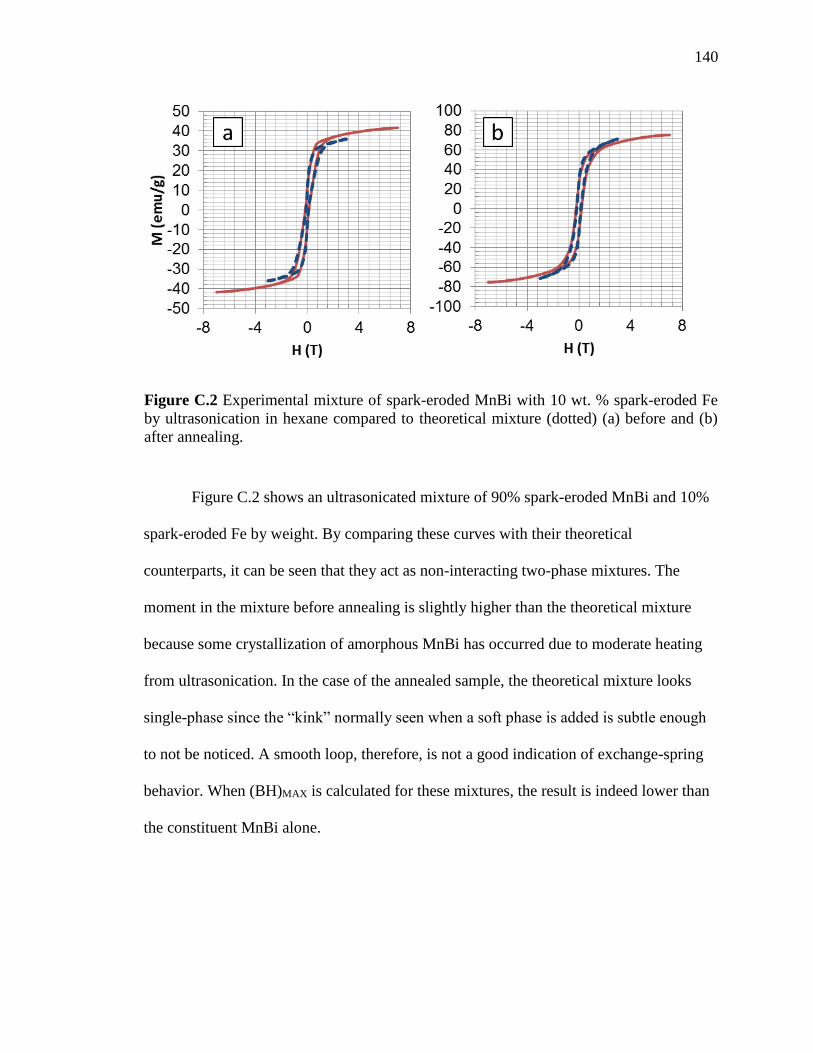
140
Figure C.2 shows an ultrasonicated mixture of 90% spark-eroded MnBi and 10%
spark-eroded Fe by weight. By comparing these curves with their theoretical
counterparts, it can be seen that they act as non-interacting two-phase mixtures. The
moment in the mixture before annealing is slightly higher than the theoretical mixture
because some crystallization of amorphous MnBi has occurred due to moderate heating
from ultrasonication. In the case of the annealed sample, the theoretical mixture looks
single-phase since the “kink” normally seen when a soft phase is added is subtle enough
to not be noticed. A smooth loop, therefore, is not a good indication of exchange-spring
behavior. When (BH)MAX is calculated for these mixtures, the result is indeed lower than
the constituent MnBi alone.
Figure C.2 Experimental mixture of spark-eroded MnBi with 10 wt. % spark-eroded Fe
by ultrasonication in hexane compared to theoretical mixture (dotted) (a) before and (b)
after annealing.
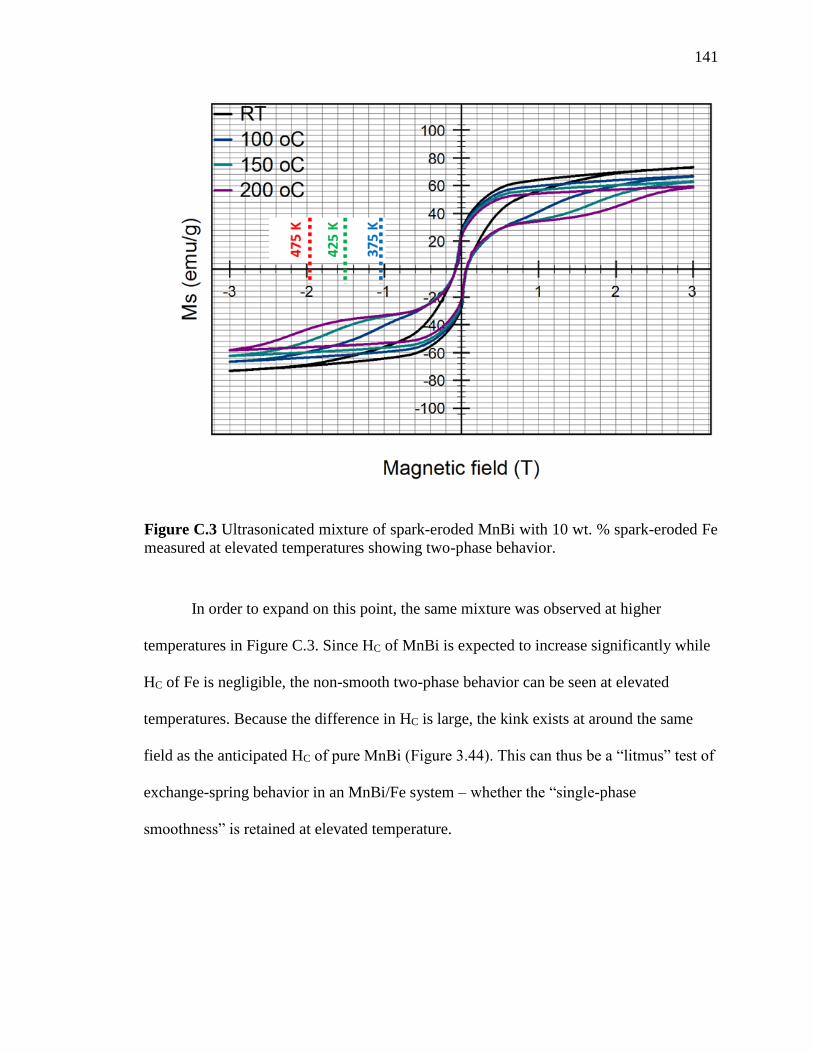
141
In order to expand on this point, the same mixture was observed at higher
temperatures in Figure C.3. Since HC of MnBi is expected to increase significantly while
HC of Fe is negligible, the non-smooth two-phase behavior can be seen at elevated
temperatures. Because the difference in HC is large, the kink exists at around the same
field as the anticipated HC of pure MnBi (Figure 3.44). This can thus be a “litmus” test of
exchange-spring behavior in an MnBi/Fe system – whether the “single-phase
smoothness” is retained at elevated temperature.
Figure C.3 Ultrasonicated mixture of spark-eroded MnBi with 10 wt. % spark-eroded Fe
measured at elevated temperatures showing two-phase behavior.