Surface-Water and Ground-Water Quality in the Yucaipa Area ...
47
Surface-Water and Ground-Water Quality in the Yucaipa Area, San Bernardino and Riverside Counties, California, 1996–98 By GREGORY O. MENDEZ, WESLEY R. DANSKIN, and CARMEN A. BURTON U.S. GEOLOGICAL SURVEY Water-Resources Investigations Report Prepared in cooperation with the 00-4269 SAN BERNARDINO VALLEY MUNICIPAL WATER DISTRICT 5020-74 Sacramento, California 2001
-
Upload
khangminh22 -
Category
Documents
-
view
1 -
download
0
Transcript of Surface-Water and Ground-Water Quality in the Yucaipa Area ...

Surface-Water and Ground-Water Quality in the Yucaipa Area, San Bernardino and Riverside Counties, California, 1996–98
By GREGORY O. MENDEZ, WESLEY R. DANSKIN, and CARMEN A. BURTON
U.S. GEOLOGICAL SURVEY
Water-Resources Investigations Report
Prepared in cooperation with the
00-4269
SAN BERNARDINO VALLEY MUNICIPAL WATER DISTRICT
5020
-74
Sacramento, California2001
U.S. DEPARTMENT OF THE INTERIOR GALE A. NORTON, Secretary
U.S. GEOLOGICAL SURVEY
Charles G. Groat, Director
The use of firm, trade, and brand names in this report is for identification purposes only and does not constitute endorsement by the U.S. Geological Survey.
For additional information write to: Copies of this report can be purchased from:
District Chief U.S. Geological Survey U.S. Geological Survey Information Services Placer Hall, Suite 2012 Box 25286 6000 J Street Federal Center Sacramento, CA 95819-6129 Denver, CO 80225
CONTENTS
Abstract.................................................................................................................................................................................. 1Introduction ........................................................................................................................................................................... 1Purpose and Scope....................................................................................................................................................... 2Methods of Investigation ............................................................................................................................................. 3Previous Investigations ................................................................................................................................................ 7Acknowledgments ....................................................................................................................................................... 8
Description of Study Area ..................................................................................................................................................... 8Physiography ............................................................................................................................................................... 8Population and Climate ............................................................................................................................................... 8Geology ....................................................................................................................................................................... 9Hydrology.................................................................................................................................................................... 9Land Use...................................................................................................................................................................... 11Water Use..................................................................................................................................................................... 16
Water Quality......................................................................................................................................................................... 16Surface Water............................................................................................................................................................... 16Ground Water............................................................................................................................................................... 22
Flowmeter Data ................................................................................................................................................. 26Depth-Dependent Samples ................................................................................................................................ 28
Isotopic Composition of Water .............................................................................................................................................. 29Oxygen-18 and Deuterium .......................................................................................................................................... 29Tritium ......................................................................................................................................................................... 31
Limitations and Future Needs................................................................................................................................................ 31Summary and Conclusions .................................................................................................................................................... 34Selected References ............................................................................................................................................................... 34
FIGURES
1–3. Maps showing: 1. Location of the Yucaipa area in the Santa Ana River drainage basin, southern California............................... 22. Physiography of the Yucaipa area, southern California .................................................................................... 33. Selected wells and surface-water-quality sites in the Yucaipa area, southern California.................................. 4
4. Graph showing tritium activity in precipitation at Los Angeles, California, 1953–96 ............................................ 65–8. Maps showing:
5. Surficial geology of the Yucaipa area, southern California............................................................................... 106. Ground-water levels at selected wells in the Yucaipa area, southern California, spring 1997.......................... 127. Land use in the Yucaipa area, southern California, 1990.................................................................................. 148. Water chemistry in samples from selected wells and surface-water sites in the
Yucaipa area, southern California ..................................................................................................................... 189. Trilinear diagrams showing major-ion composition of surface water and ground water in the Yucaipa area,
southern California ................................................................................................................................................... 2010. Map and graphs showing precipitation stations and cumulative precipitation for three February 1998 storms
in the Santa Ana River drainage basin, southern California..................................................................................... 2111. Boxplots showing concentration of selected constituents for selected wells and surface-water sites in the
Yucaipa area, southern California ............................................................................................................................ 2312. Map showing concentration of dissolved solids, nitrites plus nitrates, and dissolved oxygen for selected
wells and surface-water sites in the Yucaipa area, southern California.................................................................... 2413. Diagram showing driller’s log, electric logs, vertical flow rate, well construction, and water-quality sampling
for well 1S/2W-25R4 in the Yucaipa area, southern California ............................................................................... 27
Contents III
14. Graph showing isotopic concentrations of delta deuterium compared to delta oxygen-18 by site and by storm for selected wells and surface-water sites in the Yucaipa area, southern California................................................ 30
15. Map showing delta deuterium, delta oxygen-18, and tritium activity in selected wells and surface-water sites in the Yucaipa area, southern California .......................................................................................................... 32
TABLES
1. Location and characteristics of selected surface-water sites and wells in the Yucaipa area, southern California .. 13 2. Chemical and isotopic analyses of water from selected surface-water sites in the Yucaipa area, southern
California ................................................................................................................................................................ 36 3. Chemical and isotopic analyses of water from selected wells in the Yucaipa area, southern California................ 39
CONVERSION FACTORS, VERTICAL DATUM, ACRONYMS, AND ABBREVIATIONS, AND
WELL-NUMBERING SYSTEM
Conversion Factors
Multiply By To obtain
cubic foot per second (ft3/s) 0.02832 cubic meter per second
foot (ft) .3048 meter
foot per year (ft/yr) .3048 meter per year
gallon per day per square foot [(gal/d)/ft2] .3516 liter per day per square meter
gallon per minute (gal/min) .003785 cubic meter per minute
inch (in) 25.4 millimeter
inch per year (in/yr) 2.54 centimeter per year
mile (mi) 1.609 kilometer
Temperature is given in degrees Celsius (AC), which can be converted to degrees Fahrenheit (AF) by the following equation:
AF = 9/5(AC) + 32.
Vertical Datum
Sea level: In this report, “sea level” refers to the National Geodetic Vertical Datum of 1929 (NGVD of 1929)—a geodetic datum derived from a general adjustment of the first-order level nets of both the United States and Canada, formerly called Sea Level Datum of 1929.
Acronyms and Abbreviations mg/L milligrams per literHg/L micrograms per literHS/cm microseimens per centimeterδD delta deuteriumδ18O delta oxygen-18per mil parts per thousand, as used with delta (δ) notationpCi/L picocuries per liter
14C carbon-14CCYN Carbon Canyon DamCONV Converse Fire StationDEVO Devore Fire StationGIS geographic information system3H tritium
IV Contents
LKMA Lake MathewsLSD Land-Surface datum relative to NGVD of 1929MCL maximum contaminant levelMTS mountainsNO2 nitriteNO3 nitrateOAKG Oak GlenPRDO PradoSAR5 Santa Ana River 5th StreetSARM Santa Ana River near MentoneSMCL secondary maximum contaminant levelSNTO San Antonio DamVSMOW Vienna Standard Mean Ocean Water
Well-Numbering System
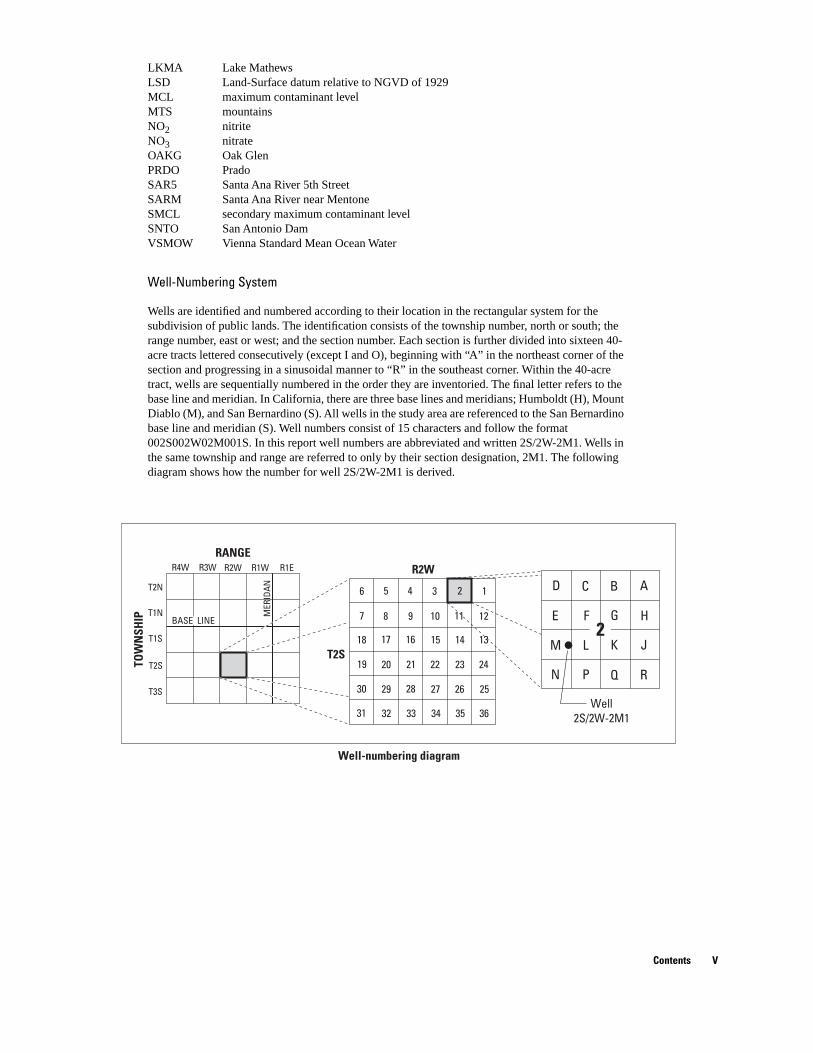
Wells are identified and numbered according to their location in the rectangular system for the subdivision of public lands. The identification consists of the township number, north or south; the range number, east or west; and the section number. Each section is further divided into sixteen 40-acre tracts lettered consecutively (except I and O), beginning with “A” in the northeast corner of the section and progressing in a sinusoidal manner to “R” in the southeast corner. Within the 40-acre tract, wells are sequentially numbered in the order they are inventoried. The final letter refers to the base line and meridian. In California, there are three base lines and meridians; Humboldt (H), Mount Diablo (M), and San Bernardino (S). All wells in the study area are referenced to the San Bernardino base line and meridian (S). Well numbers consist of 15 characters and follow the format 002S002W02M001S. In this report well numbers are abbreviated and written 2S/2W-2M1. Wells in the same township and range are referred to only by their section designation, 2M1. The following diagram shows how the number for well 2S/2W-2M1 is derived.
Well 2S/2W-2M1
D C A
E G H
J K L M
N Q R
6 5 3 2 1
7 8 10 11 12
18 17 16 15 14 13
19 20 21 22 23 24
30 29 28 26 25
31 32 33 34 35 36
27
R1W R1E
T1S
T1N
T2N
R2W RANGE
TOW
NSH
IP
R3W R4W
T2S
T3S
R2W
T2S
MER
IDAN
BASE 2
B
F
P
4
9 LINE
Well-numbering diagram
Contents V

−−−
Surface-Water and Ground-Water Quality in the Yucaipa Area, San Bernardino and Riverside Counties, California, 1996−98 By Gregory O. Mendez, Wesley R. Danskin, and Carmen A. Burton
ABSTRACT
The quality of surface water and ground water in the Yucaipa area was evaluated to deter-mine general chemical characteristics and to identify areas of recent ground-water recharge. Water samples, collected from 8 sites on 3 creeks and from 25 wells, were analyzed for general chemistry, nutrients, tritium, and stable isotopes of hydrogen and oxygen. At one production well (1S/2W-25R4), water samples were collected at discrete depths during pumping and a continuous profile of the vertical flow rate inside the well casing was recorded. In addition to general-chemistry samples, tritium and carbon-14 samples were collected at this well to interpret the age of water at different depths.
Results indicate that most water in the Yucaipa area is a calcium-bicarbonate type. The general chemical composition of surface water resembles that of ground water, although the concentration of most constituents is higher in ground water. The chemical composition of most ground-water samples is similar. Elevated concentrations of nitrate in some ground-water samples may indicate recharge from agricultural areas.
In surface water that recharges ground water tritium activity ranged from 7 to 18 picocuries per liter. The range of tritium activity found in ground water indicates different times since recharge and possible mixing along ground-water flow paths. The oldest ground-water sample had a tritium activity less than 0.3 picocuries per liter, indicating more than 50 years since recharge. Water samples that had tritium activity greater than 0.3 picocuries per liter indicate that some of the water was
recharged since 1952. The youngest ground water (greater than 7 picocuries per liter) was found near the hills and mountains surrounding the Yucaipa area; the oldest ground water (less than 0.3 picocuries per liter) was found in the Western Heights subbasin.
Testing of the vertical contribution of ground water to well 1S/2W-25R4 showed that more than one-half of the water flowed into the well between depths of about 450 and 600 feet below land surface; the rest of the water flowed into the well between 600 and about 850 feet below land surface. At a discharge rate of 750 gallons per minute, virtually no water was contributed to the well below a depth of about 850 feet. The water samples collected at this well ranged in age from less than 50 to less than 400 years before present.
INTRODUCTION
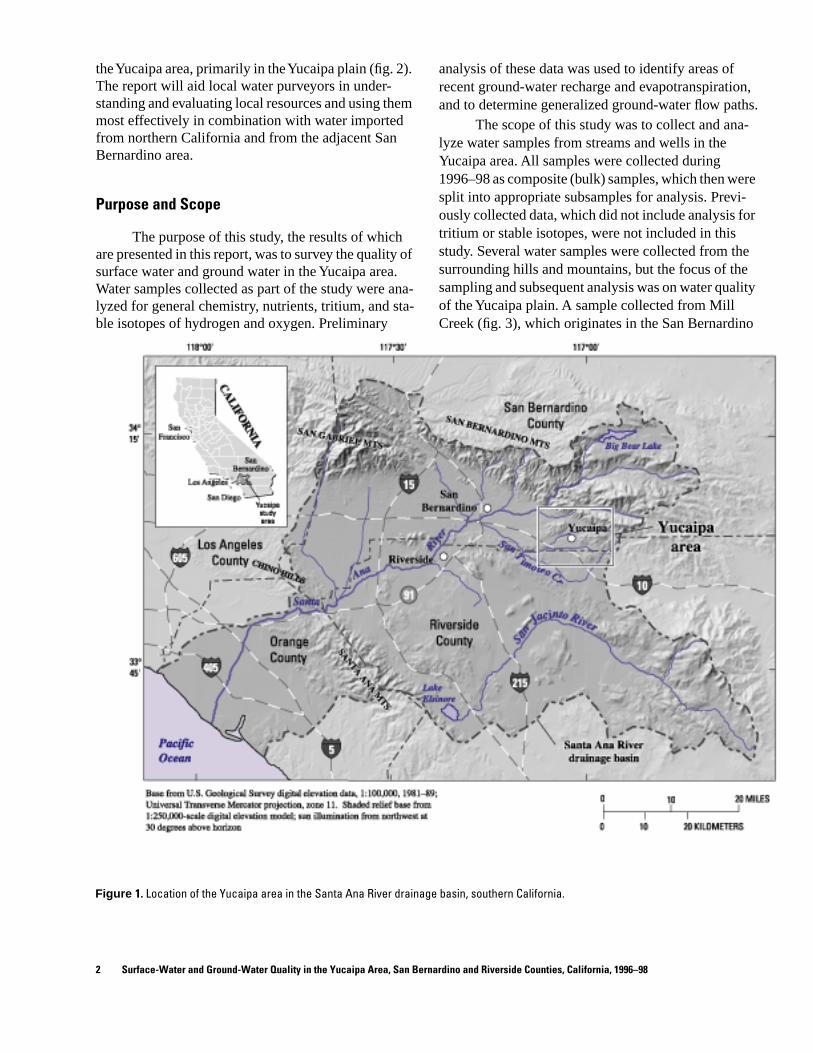
The Yucaipa area is about 12 mi southeast of the city of San Bernardino and about 75 mi east of the city of Los Angeles in the upper part of the Santa Ana River drainage basin (fig. 1). Since about 1970 and especially during the 1990’s, the widespread urbanization of southern California has extended inland from the coast into the Yucaipa area. Undeveloped land, agricultural land, and sparsely populated residential land have been converted into housing tracts. The net effect of this change in land use has been an increase in the demand for water, especially potable water for domestic use. Because the local supply of both surface water and ground water is limited in this semiarid region, water purveyors need an accurate assessment of water resources. This report assesses the quality of water in
Introduction 1
the Yucaipa area, primarily in the Yucaipa plain (fig. 2). analysis of these data was used to identify areas of The report will aid local water purveyors in under- recent ground-water recharge and evapotranspiration, standing and evaluating local resources and using them and to determine generalized ground-water flow paths. most effectively in combination with water imported The scope of this study was to collect and anafrom northern California and from the adjacent San lyze water samples from streams and wells in theBernardino area. Yucaipa area. All samples were collected during
1996–98 as composite (bulk) samples, which then were
Purpose and Scope split into appropriate subsamples for analysis. Previously collected data, which did not include analysis for
The purpose of this study, the results of which tritium or stable isotopes, were not included in this
are presented in this report, was to survey the quality of study. Several water samples were collected from the surface water and ground water in the Yucaipa area. surrounding hills and mountains, but the focus of the Water samples collected as part of the study were ana- sampling and subsequent analysis was on water quality lyzed for general chemistry, nutrients, tritium, and sta- of the Yucaipa plain. A sample collected from Mill ble isotopes of hydrogen and oxygen. Preliminary Creek (fig. 3), which originates in the San Bernardino
Figure 1. Location of the Yucaipa area in the Santa Ana River drainage basin, southern California.
2 Surface-Water and Ground-Water Quality in the Yucaipa Area, San Bernardino and Riverside Counties, California, 1996–98
Mountains east of Yucaipa, represents ground water emanating as springflow from nearby bedrock. This water is imported into the Yucaipa Regional Park and used to fill recreational lakes, and then recharges the ground water. Six depth-dependent water samples were collected from a single production well (1S/2W-25R4) and were compared to vertical flow rates within the well. A geographic information system (GIS) was developed to locate wells, to aid in interpretation of water-quality data, and to prepare figures for this report.
Methods of Investigation
Collection of several areally distributed surface-water samples was required to characterize surface-water quality and to identify the likely interaction between surface water and ground water. Because streamflow on the Yucaipa plain is infrequent and of short duration, simply finding surface water to sample can be difficult in this semiarid region. Fortuitously, the winter of 1997–98 was an El Niño year with greater than average runoff. Three storms in February 1998
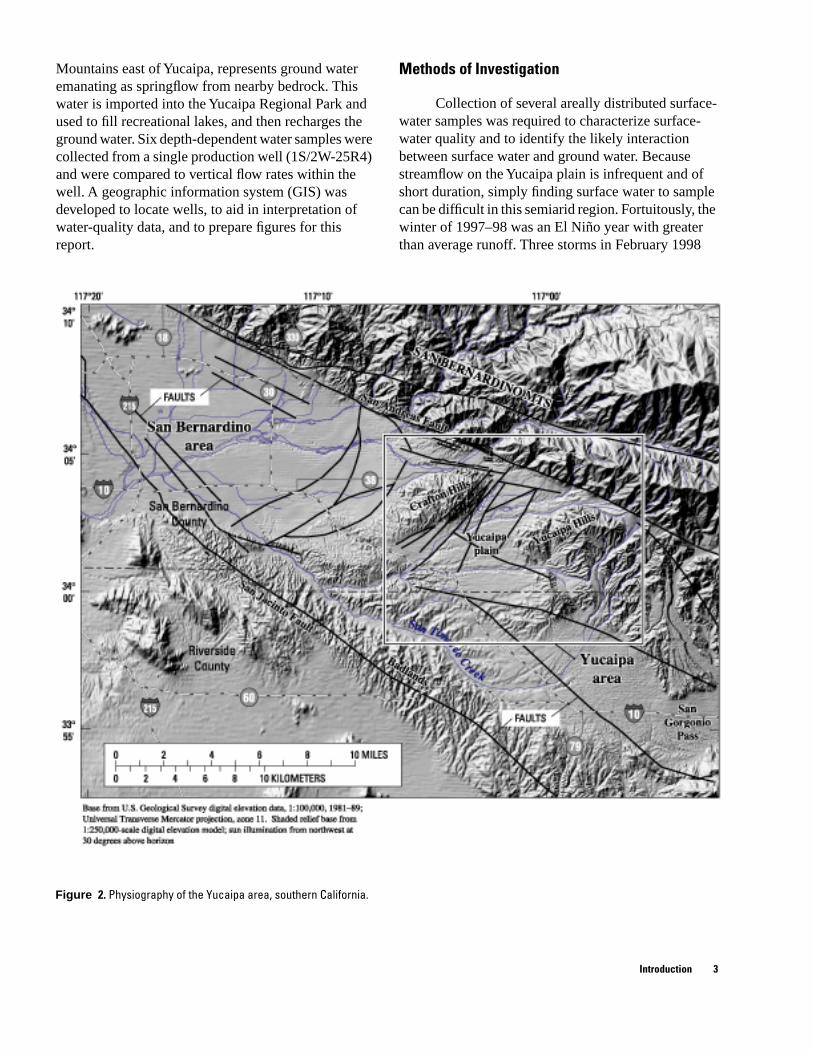
Figure 2. Physiography of the Yucaipa area, southern California.
Introduction 3

Figure 3. Selected wells and surface-water-quality sites in the Yucaipa area, southern California.
4 Surface-Water and Ground-Water Quality in the Yucaipa Area, San Bernardino and Riverside Counties, California, 1996–98

Figure 3—Continued.
Introduction 5
were selected to collect water samples. Streamflow was The strategy for sampling ground water was to sampled on Oak Glen and Yucaipa Creeks, which are collect samples throughout the Yucaipa area to identify the two primary streams in the area (fig. 3). Base-flow the general quality, the likely source of recharge, and
samples were collected on upper Oak Glen Creek in the the dominant paths of ground-water flow. Nearly all
foothills, where flow is present and originates as ground-water samples were obtained as bulk samples
springflow from bedrock or as snowmelt. Yucaipa from discharge pipes of production wells. At a new pro-
Creek originates in the southern part of the Yucaipa duction well (1S/2W-25R4), it was possible to obtain
Hills and has no base flow. One water sample was col- depth-dependent samples under pumped conditions using a sampling technique described by Izbicki and
lected from Mill Creek because part of its flow is others (1999). Coincident with sampling, the flow rate
pumped into the Yucaipa area in a pipeline and then is inside the casing of the production well was measured discharged at the Yucaipa Regional Park. The imported using a spinner tool. Flow-rate measurements were water is used for recreational purposes before it infil- used to determine the relative contributions of ground trates into the ground. Water in the pipeline is a mixture water from different strata to the pumped well. of streamflow diverted in the upper Mill Creek drainage In this study, naturally occurring stable isotopes basin and streamflow diverted under Highway 38 (fig. of oxygen (oxygen-18) and hydrogen (deuterium) were 3). Water from Mill Creek was collected as a single used to help determine the source of ground water and grab sample; other surface-water samples were col- to trace its movement. Atoms of oxygen-18 and deutelected, depending on the stream conditions, as either an rium have more neutrons and a greater atomic mass equal-width integrated sample or a grab sample. (weight) than do the more common isotopes,
2,250
Volume-weighted tritium
Decay-corrected to 1996
700
2,000 600
1,750
500
1,500
1,250 400
1,000 300
750 200
500
100 250
0 0 1950 1955 1960 1965 1970 1975 1980 1985 1990 1995 2000
YEAR
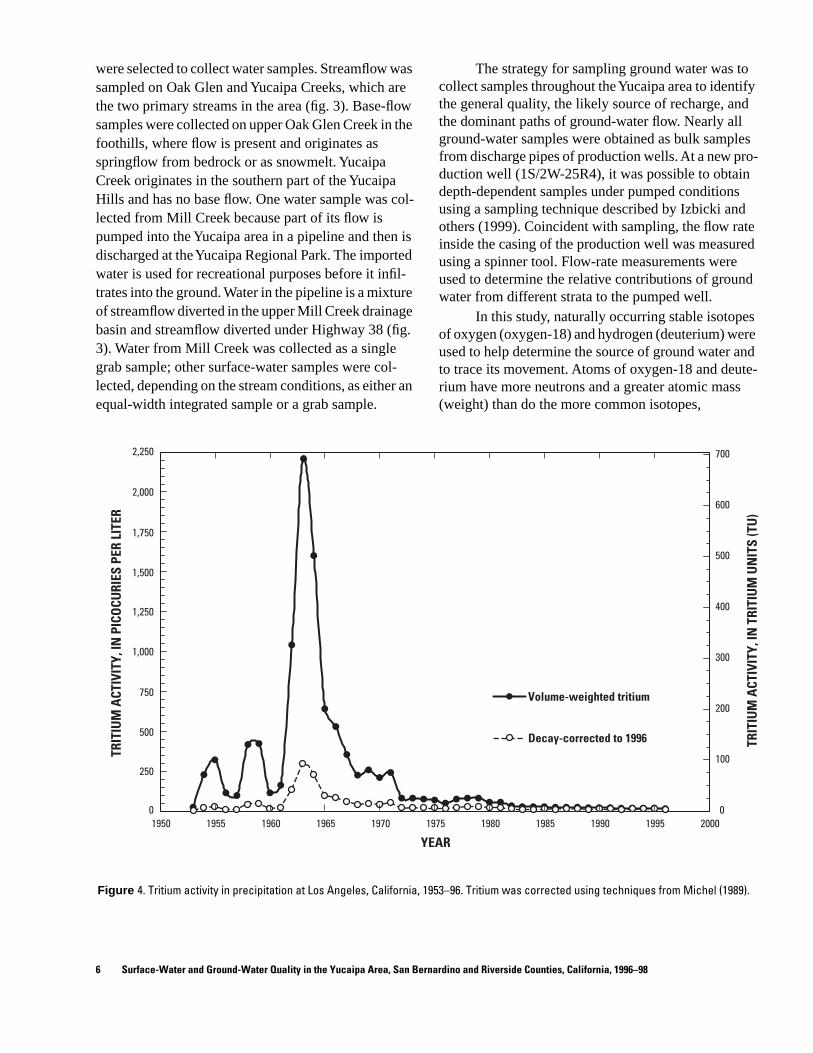
Figure 4. Tritium activity in precipitation at Los Angeles, California, 1953–96. Tritium was corrected using techniques from Michel (1989).
TRIT
IUM
ACT
IVIT
Y, IN
PIC
OCU
RIES
PER
LIT
ER
TRIT
IUM
ACT
IVIT
Y, IN
TRI
TIU
M U
NIT
S (T
U)
6 Surface-Water and Ground-Water Quality in the Yucaipa Area, San Bernardino and Riverside Counties, California, 1996–98
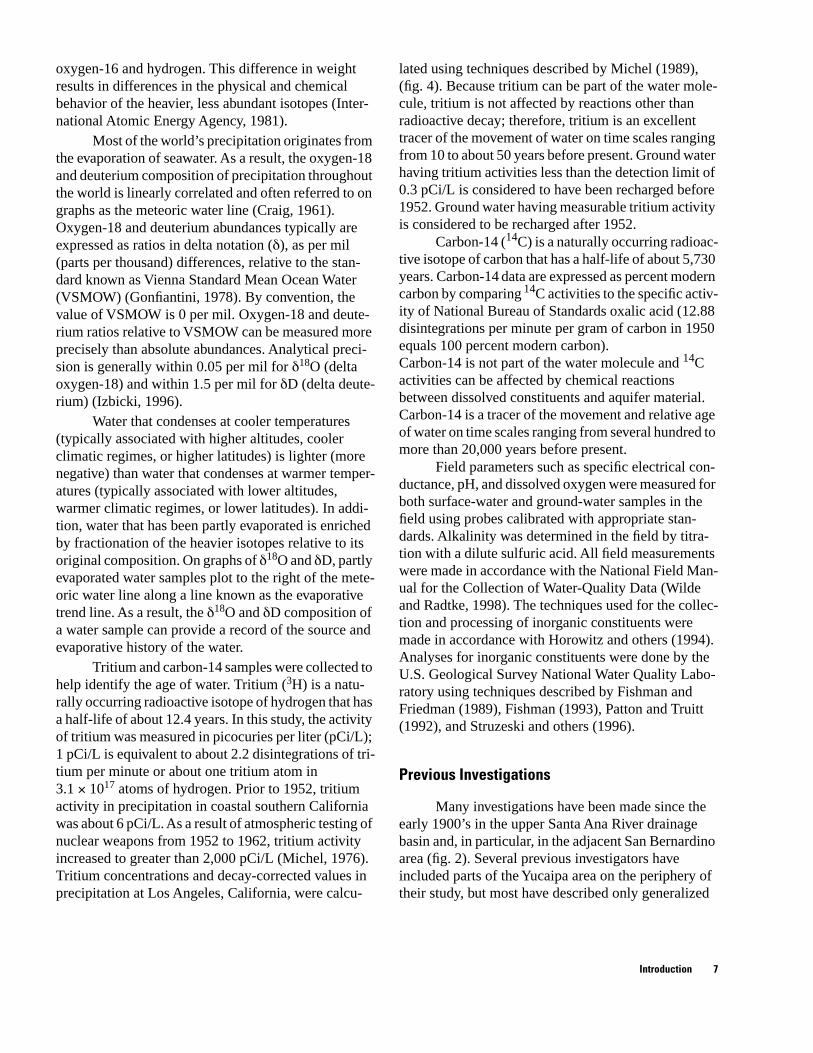
oxygen-16 and hydrogen. This difference in weight results in differences in the physical and chemical behavior of the heavier, less abundant isotopes (Inter-national Atomic Energy Agency, 1981).
Most of the world’s precipitation originates from the evaporation of seawater. As a result, the oxygen-18 and deuterium composition of precipitation throughout the world is linearly correlated and often referred to on graphs as the meteoric water line (Craig, 1961). Oxygen-18 and deuterium abundances typically are expressed as ratios in delta notation (δ), as per mil (parts per thousand) differences, relative to the standard known as Vienna Standard Mean Ocean Water (VSMOW) (Gonfiantini, 1978). By convention, the value of VSMOW is 0 per mil. Oxygen-18 and deuterium ratios relative to VSMOW can be measured more precisely than absolute abundances. Analytical precision is generally within 0.05 per mil for δ18O (delta oxygen-18) and within 1.5 per mil for δD (delta deuterium) (Izbicki, 1996).
Water that condenses at cooler temperatures (typically associated with higher altitudes, cooler climatic regimes, or higher latitudes) is lighter (more negative) than water that condenses at warmer temperatures (typically associated with lower altitudes, warmer climatic regimes, or lower latitudes). In addition, water that has been partly evaporated is enriched by fractionation of the heavier isotopes relative to its original composition. On graphs of δ18O and δD, partly evaporated water samples plot to the right of the meteoric water line along a line known as the evaporative trend line. As a result, the δ18O and δD composition of a water sample can provide a record of the source and evaporative history of the water.
Tritium and carbon-14 samples were collected to help identify the age of water. Tritium (3H) is a naturally occurring radioactive isotope of hydrogen that has a half-life of about 12.4 years. In this study, the activity of tritium was measured in picocuries per liter (pCi/L); 1 pCi/L is equivalent to about 2.2 disintegrations of tritium per minute or about one tritium atom in 3.1 Z 1017 atoms of hydrogen. Prior to 1952, tritium activity in precipitation in coastal southern California was about 6 pCi/L. As a result of atmospheric testing of nuclear weapons from 1952 to 1962, tritium activity increased to greater than 2,000 pCi/L (Michel, 1976). Tritium concentrations and decay-corrected values in precipitation at Los Angeles, California, were calcu
lated using techniques described by Michel (1989), (fig. 4). Because tritium can be part of the water molecule, tritium is not affected by reactions other than radioactive decay; therefore, tritium is an excellent tracer of the movement of water on time scales ranging from 10 to about 50 years before present. Ground water having tritium activities less than the detection limit of 0.3 pCi/L is considered to have been recharged before 1952. Ground water having measurable tritium activity is considered to be recharged after 1952.
Carbon-14 (14C) is a naturally occurring radioactive isotope of carbon that has a half-life of about 5,730 years. Carbon-14 data are expressed as percent modern carbon by comparing 14C activities to the specific activity of National Bureau of Standards oxalic acid (12.88 disintegrations per minute per gram of carbon in 1950 equals 100 percent modern carbon). Carbon-14 is not part of the water molecule and 14C activities can be affected by chemical reactions between dissolved constituents and aquifer material. Carbon-14 is a tracer of the movement and relative age of water on time scales ranging from several hundred to more than 20,000 years before present.
Field parameters such as specific electrical conductance, pH, and dissolved oxygen were measured for both surface-water and ground-water samples in the field using probes calibrated with appropriate standards. Alkalinity was determined in the field by titration with a dilute sulfuric acid. All field measurements were made in accordance with the National Field Manual for the Collection of Water-Quality Data (Wilde and Radtke, 1998). The techniques used for the collection and processing of inorganic constituents were made in accordance with Horowitz and others (1994). Analyses for inorganic constituents were done by the U.S. Geological Survey National Water Quality Laboratory using techniques described by Fishman and Friedman (1989), Fishman (1993), Patton and Truitt (1992), and Struzeski and others (1996).
Previous Investigations
Many investigations have been made since the early 1900’s in the upper Santa Ana River drainage basin and, in particular, in the adjacent San Bernardino area (fig. 2). Several previous investigators have included parts of the Yucaipa area on the periphery of their study, but most have described only generalized
Introduction 7
data and concepts for the Yucaipa area. Such generalized information includes description of the regional hydrology (Mendenhall, 1905), estimation of ground-water-storage capacity (Eckis, 1934), calculation of ground-water outflow from the Yucaipa area (Dutcher and Burnham, 1959; Burnham and Dutcher, 1960), depiction of ground-water levels and susceptibility of liquefaction during a major earthquake (Matti and Carson, 1991), and evaluation of regional water-management options (California Department of Water Resources, 1970, 1979, 1986).
The more detailed investigations in the Yucaipa area have focused on surficial geology and ground-water quantity. Surficial geology of the area has been mapped at a scale of 1:48,000 by Morton (1974) and more recently at a scale of 1:24,000 by Matti and others (1992). A detailed calculation of ground-water outflow from the area south of the Crafton Hills was made by Dutcher and Fenzel (1972). Sustainable yield of the ground-water basin was calculated by Mann (1986) and later by Todd (1988), and an explanation of the differences between the two yield calculations was made by Mann and Todd (1990). The potential for artificial recharge was evaluated by Moreland (1970). Changes in ground-water levels were summarized by Fletcher (1976) and Fox (1987), and a plan to monitor ground-water levels for much of the Yucaipa area was proposed by Fox (1990). A ground-water-flow model was developed for the upper part of the Oak Glen Creek drainage by Powers and Hardt (1974). Water-management plans were prepared for the Western Heights Water District (Egan and Associates, Inc., 1989) and for the Yucaipa Valley Water District (Camp, Dresser, and McKee, 1994).
Measurements of surface-water discharge in the Yucaipa area are scant. A much greater number of ground-water-level measurements are available for many wells in the area, including historical data that span several decades. Measurements of water quality for both surface water and ground water are made routinely to ensure that drinking-water standards are met. Other measurements of water chemistry, such as isotopic concentrations of hydrogen and oxygen, had not been made prior to this study.
Acknowledgments
The authors thank the San Bernardino Valley Municipal Water District for providing cooperative funding for this project. Also, we thank several
individuals in the Yucaipa area—in particular, Joseph B. Zoba, John “Jack” Nelson, Brent J. Anton, and Frank E. Jubula with the Yucaipa Valley Water District; E. Bernice Long, previously with the Western Heights Water District; and Michael L. Huffstutler, previously with the City of Redlands—who greatly aided us in obtaining and understanding field data. We thank U.S. Geological Survey colleagues Jonathan C. Matti for providing geologic map data and Kelly R. McPherson for creating a geographical information system that aided in analysis of data and preparation of map figures. We also thank the several individuals who helped review and prepare the report, including Alan Welch (review), Jim Bowers (review), Larry G. Schneider (illustrations), Jerrald A. Woodcox (editing), and James B. Baker (layout and publication).
DESCRIPTION OF STUDY AREA
Physiography
The study area is bordered on the west by the Crafton Hills, on the east by the Yucaipa Hills, on the north by the San Bernardino Mountains, and on the south by the badlands (fig. 2). Between the hills and mountains is a gently sloping area of unconsolidated deposits, commonly referred to as the Yucaipa plain or the Yucaipa ground-water basin. On the northwest side, the plain merges into the San Bernardino valley, and on the southeast side, the plain opens to the San Gorgonio Pass. The Yucaipa plain ranges in altitude from about 1,800 to 3,600 ft above sea level. The hills and mountains surrounding the plain range in altitude from about 3,000 ft in the Crafton Hills, to 5,000 ft along the ridge of the Yucapia Hills, to more than 8,000 ft in the San Bernardino Mountains.
Population and Climate
The study area includes parts of San Bernardino and Riverside Counties and the major cities of Yucaipa and Calimesa (fig. 3). In 1998, the population in the Yucaipa study area was about 38,200. Most residents in the area live on the plain, but many live in the surrounding foothills. Recent residential development is concentrated on the east side of Crafton Hills, on the Yucaipa Hills, and along the lower altitudes of the San Bernardino Mountains.
8 Surface-Water and Ground-Water Quality in the Yucaipa Area, San Bernardino and Riverside Counties, California, 1996–98

Climate in the study area is moderate with long, dry summers and short, wet winters. On the plain, summer temperatures range from about 60 to 100 oF and winter temperatures range from about 40 to 70 oF. Annual precipitation in this semiarid region averages about 18 in/yr on the plain, and as much as 40 in/yr in the San Bernardino Mountains (Todd, 1988). Precipitation falls almost exclusively as rain on the plain; snow is the predominant precipitation above an altitude of about 6,000 ft. Snowpack in the San Bernardino Mountains commonly lasts into April and, occasionally, May.
Geology
Bedrock, which forms the hills and mountains that surround the Yucaipa plain on the north, east, and west sides, is composed mostly of crystalline igneous and metamorphic rocks of Cenozoic to Mesozoic age (fig. 5). These basement rocks consist predominantly of granodiorite, although granite, quartz monzonite, tonalite, dioritic gneiss, and schist also are present (Matti and others, 1992). Basement rocks in the Yucaipa Hills are cataclastically deformed and contain abundant fractures and intruded quartz veins. Some sedimentary rocks, mostly sandstone, mantle part of the crystalline bedrock in the vicinity of Mill Creek. The badlands to the south consist of poorly to moderately consolidated continental deposits of Pleistocene and Pliocene age that have been uplifted and dissected. In the badlands, the deposits consist of alternating beds or lenses of gray, yellow, or brown gravel, sand, silt, and clay. The gravel is predominantly from granitic rocks but contains numerous fragments of metamorphic and volcanic rocks. These badland deposits are cut by numerous faults and in places are gently to intensely folded.
Between the San Bernardino Mountains and the badlands is a down-dropped block of crystalline rocks bounded on either side by the San Andreas Fault and the San Jacinto Fault (fig. 2). Erosion of the hills and mountains that surround the Yucaipa area has filled this tectonically created trough, called a graben, with alluvial deposits that are as much as 1,500 ft thick. The alluvial deposits are composed of several units ranging in age from late Pleistocene (very old alluvium) to Holocene age (recent alluvium) (fig. 5). The very old or older alluvium unconformably overlies most of the basement rocks. These alluvial deposits are both of late Pleistocene age and consist of boulders, gravel, sand, silt, and clay. Subsequent erosion of these moderately
to well-consolidated deposits has resulted in deeply incised streambeds such as the channels of Oak Glen and Yucaipa Creeks. Isolated deposits of slightly consolidated younger alluvium border parts of the stream channels and badlands. Unconsolidated recent alluvium is present in stream channels throughout the Yucaipa plain and has its greatest width in the Western Heights subbasin.
The geologic structure and landforms in the Yucaipa area are mostly a result of regional tectonism. To the north, the San Andreas Fault separates two tectonic plates—the North American Plate on the east and the Pacific Plate on the west (Harden, 1998, fig. 1–4). In addition to creating the sediment-filled graben that forms the Yucaipa ground-water basin, the structural forces associated with plate tectonics have caused several additional faults, some of which are visible at the land surface. One set of visible faults is subparallel to the northwest-trending San Andreas and San Jacinto Faults and includes the Banning and Oak Glen Faults; another set is nearly perpendicular to the first and includes the Chicken Hill Fault (fig. 5). Numerous additional barriers, which are hypothesized to be faults, have been inferred by geophysical and ground-water-level data.
Hydrology
The Yucaipa area is within the upper part of the Santa Ana River drainage basin and encompasses much of the San Timoteo Creek drainage (figs. 1 and 2). Although surface-water drainage is well defined to the north in the San Bernardino Mountains, the drainage becomes progressively less defined to the south in the more extensively eroded badlands. The Yucaipa area is drained by three primary streams: Wilson and Oak Glen Creeks, which flow from the San Bernardino Mountains, and Yucaipa Creek, which flows from the Yucaipa Hills (fig. 3). These streams coalesce and flow into San Timoteo Creek, which exits the area to the southwest (fig. 2).
The semiarid conditions in the Yucaipa area limit the quantity and frequency of streamflow. Generally, streamflow is present in the middle and lower reaches of Wilson, Oak Glen, and Yucaipa Creeks only for brief periods after rain. Flow in the upper reaches of Oak Glen Creek is perennial as a result of ground-water discharge from Ford Canyon in the San Bernardino Mountains (fig. 3). Some of this flow is diverted for public supply. Just upstream from the Casa Blanca Barrier
Description of Study Area 9
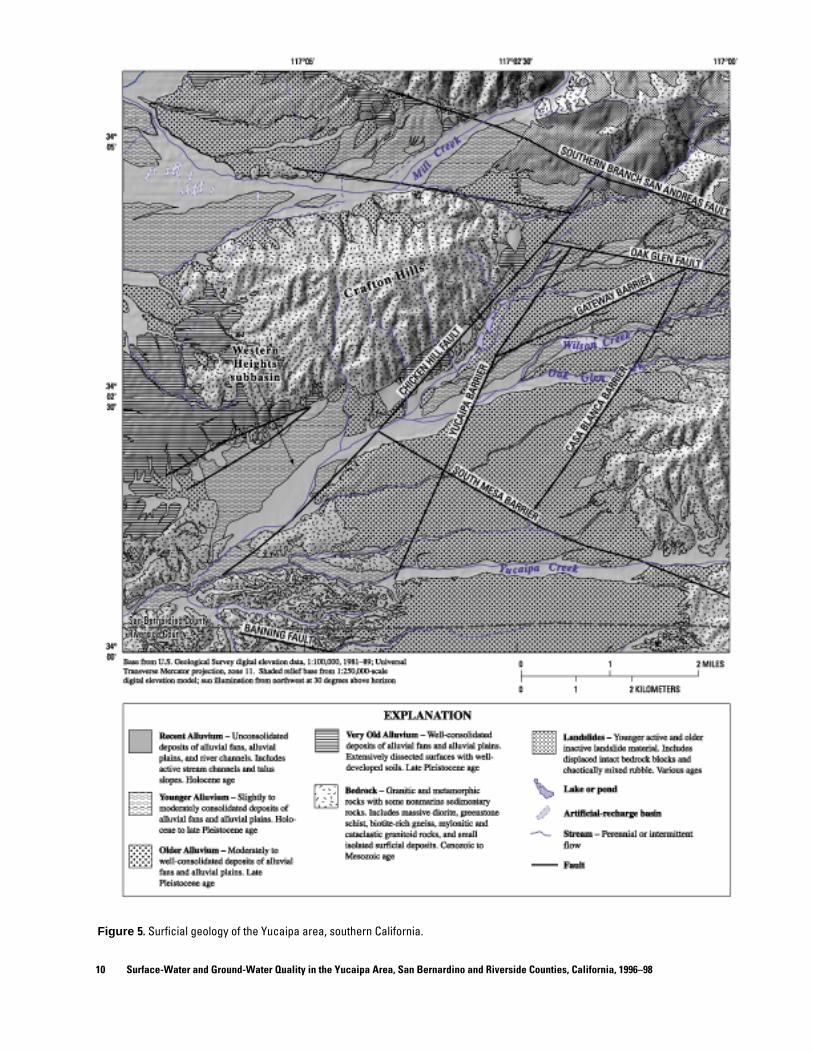
Figure 5. Surficial geology of the Yucaipa area, southern California.
10 Surface-Water and Ground-Water Quality in the Yucaipa Area, San Bernardino and Riverside Counties, California, 1996–98
(fig. 5), streamflow infiltrates into the unconsolidated deposits of the Yucaipa plain. In some places, flow in San Timoteo Creek is now perennial as a result of agricultural and urban runoff.
The unconsolidated deposits of the Yucaipa plain—the recent, younger, older, and very old alluvium (fig. 5)—constitute the primary source of ground water in the area and together compose the valley-fill aquifer. Permeability of these deposits ranges from 50 to 300 (gal/d)/ft2 (Burnham and Dutcher, 1960, p. 80). Recent river-channel deposits, especially near the hills and mountains, appear to be unweathered and very permeable, but most are above the water table. Most ground water occurs in the older, moderately consolidated alluvium at minimum depths of about 200 ft below land surface. Although the base of the valley-fill aquifer is unknown, it probably is more than 1,500 ft below land surface in most parts of the Yucaipa plain. In the western part of the plain, ground water historically was under artesian conditions, which may indicate the presence of fine-grained material of lower permeability within the valley-fill aquifer.
For the most part, the crystalline rocks of the surrounding hills and mountains and underlying the valley-fill aquifer are poorly permeable. However, the multi-directional tectonic forces in the Yucaipa area have created highly fractured, cataclastic rock, which in some places is moderately permeable. Some wells, including large municipal wells, have been completed in the crystalline rocks in order to increase well yield.
Faults are important not only because of their influence on the general topography, but also because of their influence on the flow of ground water. Fault zones in consolidated rocks commonly consist of fissures that may serve as conduits for ground-water flow. Conversely, faults that transect permeable unconsolidated materials may produce barriers to ground-water flow. For example, the San Andreas Fault along the base of the San Bernardino Mountains is known to be a barrier to ground-water flow because its trace in the alluvium at the mouth of nearly every canyon is marked by springs and dense vegetation. Although the barrier effects displayed by faults are not completely under-stood, the presence of offset beds, gouge material, sharp folds, and chemical cementation are suspected to contribute to reduced permeability.
On a basinwide scale, the general movement of both surface water and ground water is southward and westward from the surrounding hills and mountains. On a local scale, however, the movement of ground
water is more complex. Faults in the area divide the ground-water basin into several subbasins (Moreland, 1970), which previous investigators have characterized as being relatively isolated from one another (fig. 6). Flow in and between subbasins is complex and is not well understood except as can be inferred from contour maps of ground-water levels (Moreland, 1970, figs. 6–8; Todd, 1988, fig. 11). This lack of understanding of ground-water movement was a major impetus for this water-quality study, in particular for the collection of isotopic data.
Detailed ground-water-level maps for different time periods, possibly corroborated by results from a ground-water flow model, are needed to better under-stand the flow between subbasins and to help interpret water-quality data. As a starting point, however, ground-water-level data from spring 1997 were obtained from local water agencies (fig. 6 and table 1). On the basis of these data and ground-water-level maps from Moreland (1970), ground water in the Triple Falls Creek subbasin (fig. 6) appears to flow from the east to the west toward the north end of Crafton Hills. In the Wilson Creek and Crafton subbasins, ground water flows generally from north to south. In the Calimesa subbasin, ground water flows from east to west, toward the San Bernardino area. Insufficient data were available in the Western Heights subbasin to determine the direction of ground-water flow, but in the past (1930–70), a pumping depression was present near Dunlap Acres (Moreland, 1970).
Land Use
Originally, the Yucaipa area was inhabited by Native Americans, and the name “Yucaipa” is derived from the Serrano Indian word “Ucipe,” which means wet and sandy. Until the early 1800’s, the area was under Spanish rule as part of the San Bernardino Rancho. By 1860, the land was privately owned by a few families. In the early 1900’s, part of the area was sub-divided into apple orchards, and the area became synonymous with red apples.
After 1940, the Yucaipa area became extremely popular as a retirement destination. Many mobile-home parks were built, mostly along the upper part of the Yucaipa plain near the San Bernardino Mountains. Rural-type residential development continued to be popular and covered much of the central part of the Yucaipa plain. As more of the area was urbanized, cultivation of citrus was moved to the edges of the plain,
Description of Study Area 11

Figure 6. Ground-water levels at selected wells in the Yucaipa area, southern California, spring 1997.
12 Surface-Water and Ground-Water Quality in the Yucaipa Area, San Bernardino and Riverside Counties, California, 1996–98

Table Location and characteristics of selected surface-water sites and wells in the Yucaipa area, southern California.[YVWD, Yucaipa Valley Water District; WHWD, Western Heights Water District; SMWD, South Mesa Water District; LSD, land-surface datum; ft, foot; na, not applicable; —, no data]
Altitude of water Other well
Altitude table Depth of well
Open intervals Site name or State well number Well owner
identifiers Latitude Longitude of LSD
(ft above (ft) below LSD
(ft) sea level)1 (ft)
Description of Study A
rea
Upper Oak Glen Creek in Ford Canyon na na 340326 1165605 5,920 na na Oak Glen Creek in Ford Canyon na na 340320 1165612 5,560 na na Oak Glen Creek near Oak Glen na na 340307 1165621 3,550 na na Oak Glen Creek at 2nd street na na 340238 1170232 2,620 na na Yucaipa Creek at Mesa Grande Bridge na na 340051 1170026 2,880 na na Yucaipa Creek at 5th street na na 340049 1170314 2,390 na na Yucaipa Creek below Dunlap Acres na na 340037 1170643 1,880 na na Mill Creek at Yucaipa Regional Park na na 340316 1170251 2,630 na na 1S/1W-19G1 YVWD YVWD # 31 340415 1170127 3,086 2,883 384 1S/1W-27L1 YVWD YVWD # 25 340312 1165839 3,875 — 30 1S/1W-32C1 YVWD YVWD # 13 340253 1170027 3,194 3,177 307 1S/2W-24C2 YVWD YVWD # 51 340438 1170242 2,695 2,610 610 1S/2W-25A1 YVWD YVWD # 37 340343 1170212 2,780 2,584 305 1S/2W-25R4 YVWD YVWD # 53 340255 1170216 2,730 2,458 970 1S/2W-34N1 City of Redlands — 340202 1170502 2,157 1,790 — 1S/2W-36G1 YVWD YVWD # 46 340236 1170231 2,623 — 1,150 2S/1W-08F1 YVWD YVWD # 27 340054 1170029 2,878 2,819 314 2S/1W-15F2 YVWD YVWD # 61 340003 1165825 3,515 — 462 2S/2W-01J1 YVWD YVWD # 50 340124 1170213 2,600 2,284 352 2S/2W-02M1 YVWD YVWD # 11 340129 1170351 2,401 2,141 525 2S/2W-03E1 WHWD WHWD # 6 340148 1170454 2,170 1,794 599 2S/2W-03L1 City of Redlands Chicken Hill 340129 1170442 2,200 2,096 505 2S/2W-04G3 WHWD WHWD # 2A 340144 1170536 2,100 1,779 630 2S/2W-04G4 WHWD WHWD # 11 340137 1170535 2,080 — 1,690 2S/2W-04J2 WHWD WHWD # 5A 340135 1170516 2,095 1,773 1,100 2S/2W-04R1 WHWD WHWD # 9 340120 1170513 2,091 1,753 600 2S/2W-10B2 City of Redlands Hog Canyon #2 340106 1170450 2,180 2,105 700 2S/2W-11A1 YVWD YVWD # 24 340105 1170316 2,446 2,146 585 2S/2W-11D1 YVWD YVWD # 10 340057 1170406 2,327 2,129 515 2S/2W-14C1 SMWD SMWD # 2 340014 1170343 2,393 2,167 363 2S/2W-14R3 SMWD SMWD # 4 335924 1170317 2,340 — 1,000 2S/2W-24L1 YVWD YVWD # 48 335848 1170243 2,327 — 1,180 2S/2W-28C2 Fisherman's Retreat — 335829 1170552 1,943 — —
nananananananana—
15–3026–415230–590
—450–950
—340–1,140164–314189–462330–350
260–450; 465–525135–578198–485400–620
705–1,205; 1,210–1,690390–1,090150–576
260–440; 460–680320–585170–500205–363352–976
380–870; 930–1,160—
1Altitude of water levels provided by water districts for spring 1997. 13

Figure 7. Land use in the Yucaipa area, southern California, 1990.
14 Surface-Water and Ground-Water Quality in the Yucaipa Area, San Bernardino and Riverside Counties, California, 1996–98
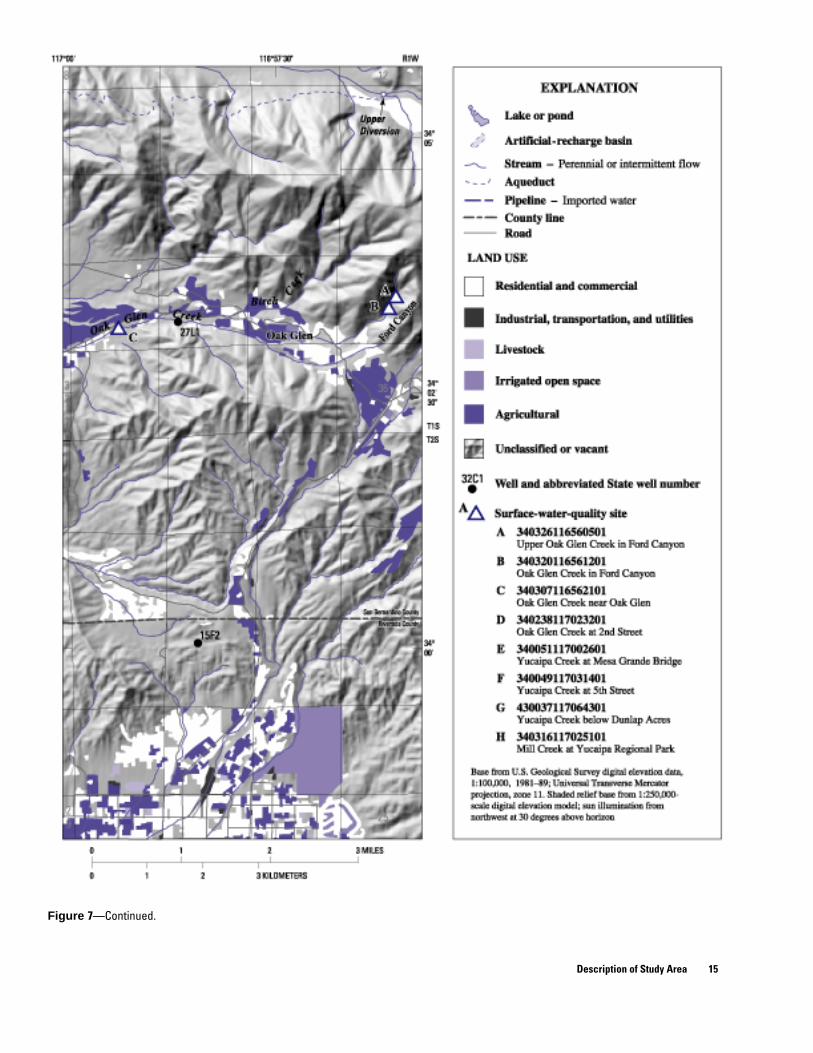
Figure 7—Continued.
Description of Study Area 15
and since about 1990, most of the citrus groves have been replaced with planned residential developments.
As of 1990, land use in the Yucaipa area was a combination of residential land covering much of the Yucaipa plain, and isolated pieces of agricultural land (fig. 7). The central part of the plain continues to be filled with small, older homes occupying as much as an acre of land. Mobile-home parks continue in their same location along the northern part of the plain. Recently constructed tract housing, at densities of 1 to 6 homes per acre, extends to the edges of the plain and onto the surrounding hills. Within the boundaries of the Yucaipa Valley Water District, which covers most of the plain, rural residential housing (less than or equal to 1 dwelling unit per acre) accounts for 35 percent of the land use, low-density residential housing (1 to 4 dwelling units per acre) accounts for 21 percent, and planned residential development (mixed residential, public land, and some commercial use) accounts for 29 percent (Camp, Dresser, and McKee, 1994).
The small amount of commercial development in the Yucaipa area is located along a few main streets, and there is almost no industrial development. Apple growing is still popular on the lower slopes of the San Bernardino Mountains, particularly along Oak Glen Creek, and each fall many visitors attend the apple harvest festival. The Yucaipa Regional Park, with its small lakes and grassy areas, is located on the northwest side of the Yucaipa plain adjacent to Crafton Hills. The small lakes are sustained by water imported from Mill Creek. On Wilson Creek, a large artificial-recharge basin has been constructed and can be used to recharge both local runoff and water imported from Mill Creek.
Water Use
Prior to the late 1800’s, the water supply of the Yucaipa area was limited to surface flow in the mountain streams and small quantities of springflow along the Chicken Hill Fault. In the 1890's and early 1900's, a number of flowing wells were completed in the West-ern Heights subbasin. At that time, several water companies were formed to distribute water for irrigation. Agricultural development during the period 1900–30 required the installation of more wells throughout the area. By the 1930’s, this increased pumping had lowered the hydraulic head in the valley-fill aquifer to below land surface. This gradual decline in ground-water levels continued until the post-World War II development boom began in 1945. A combination of
increased pumpage and reduced recharge caused by below-normal precipitation resulted in an increased rate of decline in ground-water levels of 10 to 20 ft/yr. This rate continued into the early 1960's and then decreased to 5 to 10 ft/yr (Moreland, 1970). Because population predictions indicate that local water needs will increase sharply over the next decade, it is likely that ground-water levels will continue to decline in some parts of the Yucaipa area.
WATER QUALITY
Water samples were collected from selected surface-water sites and wells in the Yucaipa area during 1996–98. These sites and wells are shown in figure 3 and listed in table 1. Results of chemical analyses of 15 surface-water samples from 8 sites on 3 creeks and of 32 ground-water samples from 25 wells are given in tables 2 and 3, respectively, in the back of this report. On the basis of these data, the major-ion composition of water was evaluated using Stiff (polygon) and Piper (trilinear) diagrams (figs. 8 and 9). A Stiff diagram shows the relative abundance of cations and anions expressed in milliequivalents per liter and plotted on one of four parallel horizontal axes (Stiff, 1951). The resulting polygon shows similarities or differences in general water chemistry, and the width of the polygon is an approximation of the total ionic content. A Piper diagram (Piper, 1944) shows the relative contribution of major cations and anions, on a charge-equivalent basis, to the total ionic content of the water. Percentage scales along the sides of the diagram indicate the relative concentrations, in milliequivalents per liter, of each major ion. Cations are shown in the left triangle, anions are shown in the right triangle, and the central diamond integrates the data.
Surface Water
Oak Glen, Yucaipa, and Mill Creeks were selected for the collection of water-quality samples. Four sites were located on Oak Glen Creek, in down-stream order: two sites in Ford Canyon, one site near the town of Oak Glen, and one site at the Second Street crossing, just downstream from the confluence with Wilson Creek. Three sites were chosen on Yucaipa Creek, in downstream order: at the Mesa Grande bridge, at the Fifth Street bridge, and southwest of Dunlap Acres downstream from the confluence with
16 Surface-Water and Ground-Water Quality in the Yucaipa Area, San Bernardino and Riverside Counties, California, 1996–98
Oak Glen Creek (fig. 3). One sample was collected at Yucaipa Regional Park where water from Mill Creek is imported to the park in a pipeline. The water in the pipeline originates as diversions from two locations on Mill Creek. The upper diversion is located in the incised drainage channel and is used as inflow to a powerhouse; the lower diversion is under the Highway 38 bridge (fig. 3).
The winter of 1997–98 was much wetter than average because of El Niño conditions. This weather pattern is caused by warming of the tropical Pacific Ocean and can result in extreme weather throughout the world and greater than average precipitation in southern California. As a result of El Niño conditions, February 1998 was the wettest February on record in southern California. Late-season storms typically come from the Pacific northwest, but also may result from warm, moist air drawn into southern California from the southwest. This latter effect produces many of the larger magnitude and longer duration storms.
Storms differ in magnitude, duration, intensity, and direction—each of which may produce changes in water chemistry. In February 1998, three storms were sampled. From the many precipitation stations in the Santa Ana River drainage basin, nine were chosen to show storm patterns (fig. 10). The first storm entered the basin from the west and started producing rain at Carbon Canyon Dam (CCYN). The rain started falling at about 0700 (local time) on February 3, was basin-wide in about 6 hours, and lasted about 16 hours. The greatest precipitation, 2.3 in., was recorded at Prado Dam (PRDO). The least precipitation, about 0.5 in., fell at higher altitudes in the mountains to the northeast of the study area at Converse Fire Station (CONV). Lower altitudes to the north and east of Yucaipa received approximately 2.0 in. of rain, as recorded at the Oak Glen station (OAKG).
The second storm was the smallest and entered the basin from the west and then moved eastward. Rain began falling in the western end of the Santa Ana River drainage basin during the morning of February 19 and moved into the rest of the basin starting at about 2000. The greatest precipitation, 0.8 in., was recorded at OAKG; the least was 0.1 in. at CONV.
The third storm was the largest and started in the mountains to the north. This storm is typical of an El Niño-influenced storm whereby tropical moisture from the southwest is entrained in a slow-moving, low-pressure system moving in from the northwest. The precipitation generally fell in two distinct periods(
except at the Devore Fire Station (DEVO) and San Antonio Dam (SNTO) stations, both of which recorded nearly constant rainfall (fig. 10). The first rain fell in the afternoon of February 22, and the rest fell in the early evening of February 23. The precipitation was greatest in the mountains to the north: 6.3 in. at DEVO; 5.2 in. at SNTO; and 4.5 in. at OAKG. The precipitation was least, about 1.9 in., in the southern part of the basin at the Santa Ana River at Fifth Street (SAR5) and at Lake Mathews (LKMA).
Storm runoff flows quickly out of the surrounding hills and mountains onto the plain with little time for the water to dissolve minerals and salts. As a result, water-quality samples from Yucaipa Creek had very low concentrations of dissolved solids, cations, and anions. At the two upstream sites, the concentration of dissolved solids (residue on evaporation) ranged from 40 to 57 mg/L (milligrams per liter) (table 2, at back of report). Calcium and bicarbonate, although low in concentration, were the dominant ions on the basis of milliequivalents (fig. 8).
The chemistry of Oak Glen Creek and Yucaipa Creek was similar in that water samples were dominated by calcium and bicarbonate ions. However, concentrations of sodium, magnesium, and sulfate were higher in samples from Oak Glen Creek. (fig. 8, table 2). Dissolved-solids concentrations also were higher in Oak Glen Creek, ranging from 74 to 249 mg/L (table 2). The higher concentrations of these constituents may result simply from the source of the water. Oak Glen Creek has its source in the San Bernardino Mountains and is perennial in the foothills, whereas the source for Yucaipa Creek is in the Yucaipa Hills. Samples collected during base flow in Oak Glen Creek near Oak Glen contained higher concentrations of ions than samples collected during stormflows (fig. 8). Calcium concentrations ranged from 24 to 45 mg/L in base-flow samples, and from 13 to 30 mg/L in stormflow samples. Dissolved-solids concentrations ranged from 120 to 249 mg/L during base flows, and from 74 to 227 mg/L during stormflows. Concentrations of other major ions also decreased during stormflows (fig. 8, table 2). This decrease in concentrations probably results from dilution of base flow with stormflow having a lower ionic strength.
The highest concentration of major ions in Yucaipa Creek was found at the downstream site, located below the confluence with Oak Glen Creek where the surface water exits the study area southwest of Dunlap Acres (figs. 8 and 9A). The dissolved-solids
Water Quality 17

Figure 8. Water chemistry in samples from selected wells and surface-water sites in the Yucaipa area, southern California.
18 Surface-Water and Ground-Water Quality in the Yucaipa Area, San Bernardino and Riverside Counties, California, 1996–98

Figure 8—Continued.
Water Quality 19

100
80
60
40
20
0
100
80
60
40
20
0
100 80
60 40
20 0
100
80
60
40
20
0 20
40
0
60
80
100
2040
06080100
0
20
40
60
80
100
80
60
100
40
20
0
8060
10040200
100 80
60 40
20 0
CALCIUM
CALCIUMPLUS
MAGNESIUMSU
LFATE
PLU
S CH
LORI
DE
SODIUMPLUS
POTASSIUM
MAGNES
IUM
CHLORIDE, FLUORIDE, NO2 + NO3
SULFATE
CARB
ONATE P
LUS
BICARB
ONATE
PERCENTAGE OF TOTAL MILLIEQUIVALENTS PER LITER
A EXPLANATION
Below� Dunlap� Acres
Oak Glen Creek - Base flow Mill Creek - Base flow Oak Glen Creek - Stormflow Yucaipa Creek - Stormflow
Below� Dunlap� Acres
100
80
60
40
20
0
100
80
60
40
20
0
100 80
60 40
20 0
100
80
60
40
20
0 20
40
0
60
80
100
2040
06080100
0
20
40
60
80
100
80
60
100
40
20
0
8060
10040200
100 80
60 40
20 0
CALCIUM
CALCIUMPLUS
MAGNESIUMSU
LFATE
PLU
S CH
LORI
DE
SODIUMPLUS
POTASSIUM
MAGNES
IUM
CHLORIDE, FLUORIDE, NO2 + NO3
SULFATE
CARB
ONATE P
LUS
BICARB
ONATE
PERCENTAGE OF TOTAL MILLIEQUIVALENTS PER LITER
B
15F2
24L1
24L1
14R3
28C2
1J1
15F2
28C2
28C2 Abbreviated State well number
1J1
EXPLANATION
Figure 9. Major-ion composition of (A) surface water and (B) ground water in the Yucaipa area, southern California.
20 Surface-Water and Ground-Water Quality in the Yucaipa Area, San Bernardino and Riverside Counties, California, 1996–98

118A00' 117A30' 117A00' 116A30'
34A15'
Sant
a
Ana River
SanJac into River
Lake� Elsinore
Big Bear� Lake
Temescal W
ash
SARM
LKMA
OAKG
PRDO
SNTO
DEVO
CONV
CCYN
SAR5
Pacific� Ocean
Santa Ana River� drainage basin
Yucaipa� study� area
20 MILES0 10
20 KILOMETERS0 0
1 (2.35)
2 (0.8)
3(6.3)
Precipitation station
1
33A 45'
3.0 First storm Sample period
6.0
2.5 5.0
2.0 4.0
1.5 3.0
1.0 2.0
0.5 1.0
0.0 0.0 Feb 2 Feb 3 Feb 4 Feb 22 Feb 23 Feb 24
1.0 DATE
Third storm Sample period
(6.3)
EXPLANATION0.8
Storm plots Station identifier and name
CUM
ULA
TIVE
PRE
CIPI
TATI
ON
, IN
INCH
ES
Second storm Sample period
0.6 CCYN: CONV: DEVO: LKMA:
0.4 OAKG: PRDO: SAR5:
0.2 SARM: SNTO:
0.0 Feb18 Feb19 Feb 20
DATE
Carbon Canyon Dam Converse Fire StationDevore Fire Station Lake Mathews near CoronaOak GlenPrado DamSanta Ana River (5th Street)Santa Ana River near MentoneSan Antonio Dam
Figure 10. Precipitation stations and cumulative precipitation for three February 1998 storms in the Santa Ana River drainage basin, southern California (note change in vertical scale on graphs). Arrows on map show direction storm started in basin; numbers indicate storm sequence sampled and largest amount of total precipitation, in inches. Precipitation data from U.S. Army Corps of Engineers (Gregory Peacock, written commun., 1998).
Water Quality 21

concentration was slightly greater than 100 mg/L (table 2). The Piper (trilinear) diagram for this surface-water sample shows that the dominant ions were mostly calcium and bicarbonate (fig. 9A). In comparison with the two upstream sites, this site had a much higher concentration of sulfate (22 mg/L compared to <3.2 mg/L) and a slightly higher concentration of chloride. The large differences in the concentrations of many constituents between the two upstream sites on Yucaipa Creek and the downstream site may be a result of runoff from Oak Glen Creek and the town of Yucaipa, or the differences may result from the larger discharge at the time of sampling of the downstream site (190 ft3/s in comparison to 2.3 ft3/s). The sample taken at the downstream site was collected during the rising limb of the runoff which typically carries more sediment.
As found in samples collected from Oak Glen Creek and Yucaipa Creek, the dominant ions in the sample collected from Mill Creek at the inlet to the Yucaipa Regional Park (site H) were calcium and bicarbonate (fig. 8). Most constituent concentrations, such as sodium, chloride, silica, phosphate, boron, and iron, were similar to concentrations in base-flow samples collected from Oak Glen Creek at site A and B in Ford Canyon (fig. 8 and table 2). These similarities would be expected because the source of the water in both creeks is the San Bernardino Mountains. Other constituents, such as calcium, magnesium, dissolved solids, and sulfate, had concentrations similar to those in stormflow (figs. 8 and 9; table 2). Lithium concentration [(5 Hg/L) micrograms per liter] was higher in the Mill Creek sample.
In addition to Stiff and Piper diagrams, the major-ion composition of water samples was evaluated using boxplots. The variability of selected constituents as well as differences between surface and ground water can be observed from these boxplots (fig. 11). Boxplots show the range of values for a selected water-quality constituent. The vertical size of the box is deter-mined by the range of the data, as in a histogram. The width of the box is meaningless and is for display purposes only. The median and selected percentiles of the data are indicated along with any outliers.
Phosphate showed the highest variability (ranging from the upper 75 to the lower 25 percentile fig. 11) of any constituent sampled, perhaps as a result of the higher phosphate concentrations found in storm runoff in Yucaipa Creek (table 2). Nitrate (NO3)
concentrations were low, ranging from 0.18 to 2.3 mg/L as nitrogen. These low values indicate the lack of a significant source of nitrate from runoff under these conditions. The higher values of nitrate were found in samples collected downstream from the agricultural land adjacent to Oak Glen Creek and Yucaipa Creek (figs. 7 and 12). Organic ammonia values ranged from less than the detection limit of 0.1 mg/L to 0.7 mg/L. More studies are needed to evaluate the rates at which species are converted to and from nitrate.
Calcium concentrations ranged from 5.8 to 45 mg/L. Chloride and fluoride concentrations ranged from 1.2 to 7.7 mg/L, and from 0.1 to 0.8 mg/L, respectively. Sulfate concentrations ranged from 1.4 to 37 mg/L. Sodium concentrations ranged from 2.2 to 15 mg/L. Iron and manganese concentrations ranged from less than the detection limit of 3 Hg/L to 110 Hg/L, and from less than the detection limit of 1 Hg/L to 15 Hg/L, respectively. Boron concentrations ranged from 7 to 24 Hg/L. Barium concentrations ranged from 4.3 to 20 Hg/L. All constituents were well below their respective maximum contaminant levels (MCL) (U.S. Environmental Protection Agency, 1994).
Concentrations of dissolved oxygen in samples collected during the summer from Mill and Oak Glen Creeks were 8.2 and 8.5 mg/L, respectively. Dissolved-oxygen concentrations in winter samples from Oak Glen and Yucaipa Creeks ranged from 9.4 to 10.8 mg/L. Lower dissolved-oxygen concentrations in the summer samples may result from less turbulence in the river than during winter stormflow, and may result from the lower solubility of oxygen in warmer water. Also in summer, dissolved oxygen can be depleted by biochemical processes, such as respiration by algae that consume dissolved, suspended, or precipitated organic matter.
Ground Water
Ground-water samples were collected from 25 wells mostly on the Yucaipa plain (fig. 3) and from 1 well in San Timoteo Canyon. On the basis of these samples, most ground water in the Yucaipa area shows little areal variability and is of good quality by U.S. Environmental Protection Agency (EPA) drinking water standards (U.S. Environmental Protection Agency, 1994). Dissolved-solids concentrations ranged
22 Surface-Water and Ground-Water Quality in the Yucaipa Area, San Bernardino and Riverside Counties, California, 1996–98

0
0
Dissolved Residue on oxygen pH evaporation
15 10 600
10 9 400
Outlier value of 712 not shown
mg/
L as
N
Outlier value of 200 not shown
mg/
L as
P
Hg/
L as
B
mg/
L as
F
mg/
L as
K
STAN
DARD
UN
ITS
mg/
L as
Na
mg/
L
mg/
L as
Mg
mg/
L
5 8 200
0 7 0 SW GW SW GW SW GW
Sodium Potassium Magnesium Calcium 120 6 30 100
80 4 20
50
40 2 10
Outlier value of 260 not shown
0 0 0 0 SW GW SW GW SW GW SW GW
Chloride Fluoride Sulfate 40 2.0 100
20 1.0 50
0 0 0 SW GW SW GW SW GW
Barium Boron Iron Manganese60 100
Outlier value of 330 not shown
150 Outlier value of 2,300 not shown
70
40 100 50
50 30
20 50
10
0 0 0 0 SW GW SW GW SW GW SW GW
Nitrite + Nitrate
Lower detached
Upper detached
Median
Upper outside
Lower outside
Phosphate EXPLANATION20 0.3 SW Surface-water samples GW Ground-water samples
0.2 Upper 90 percent mg/L Milligrams per liter
10 Upper 75 percent
Hg/L Micrograms per liter
0.1 Lower 25 percent Lower 10 percent
0 0 SW GW SW GW
Figure 11. Concentration of selected constituents for selected wells and surface-water sites in the Yucaipa area, southern California.
mg/
L as
Mn
mg/
L as
Ca
mg/
L as
Ba
mg/
L as
Cl
Hg/
L as
Fe
mg/
L as
SO 4
Water Quality 23

Figure 12. Concentration of dissolved solids, nitrites plus nitrates, and dissolved oxygen for selected wells and surface-water sites in the Yucaipa area, southern California.
24 Surface-Water and Ground-Water Quality in the Yucaipa Area, San Bernardino and Riverside Counties, California, 1996–98
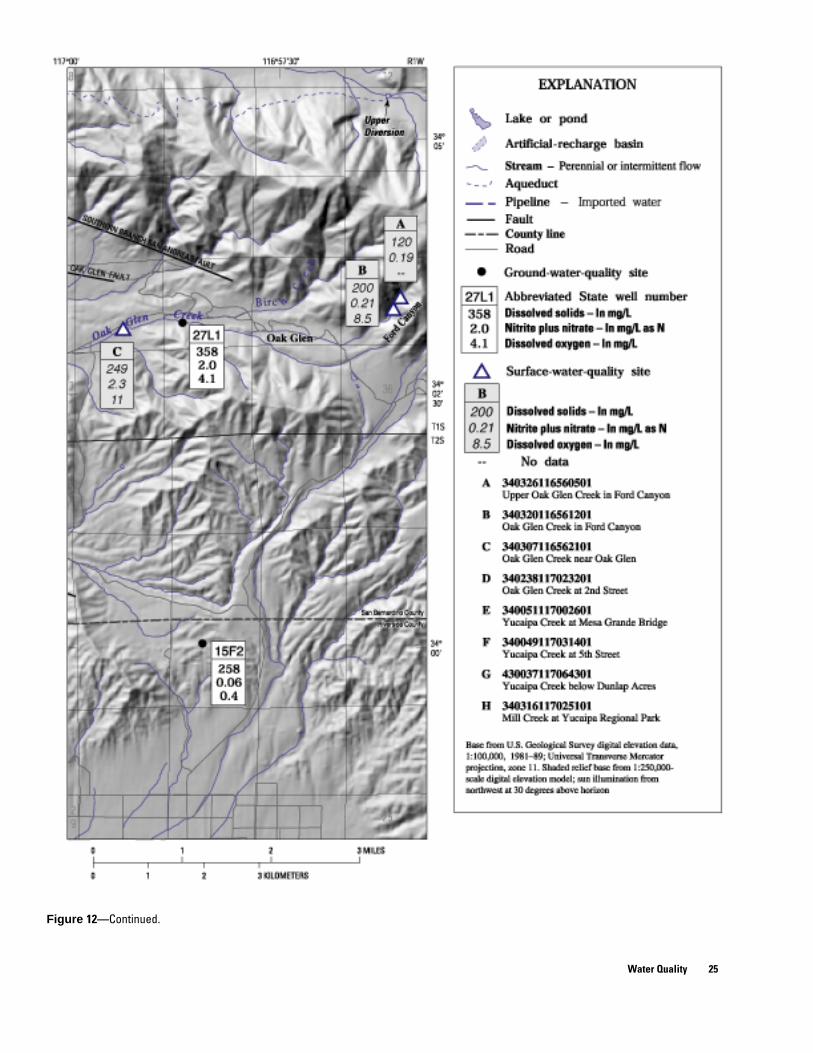
Figure 12—Continued.
Water Quality 25
from 186 to 563 mg/L (table 3, at back of report; fig. 12), with an outlier of 712 mg/L at well 2S/2W-1J1. Sodium concentrations ranged from 14 to 58 mg/L, with outliers of 120 mg/L and 200 mg/L at wells 2S/2W-28C2 and 2S/2W-1J1, respectively. Chloride concentrations ranged from 6.3 to 36 mg/L, with an outlier of 65 mg/L at well 2S/2W-28C2. Sulfate concentrations ranged from 13 to 86 mg/L, with an outlier of 260 mg/L at well 2S/2W-1J1. Iron concentrations ranged from less than the detection limit of 3 mg/L to 140 mg/L, with an outlier of 2,300 mg/L, also at well 2S/2W-1J1. This unusually high concentration of iron may result from corrosion of the steel well casing. The sample from well 2S/2W-1J1 also showed signs of a reducing environment and had no dissolved oxygen, a condition that causes iron to become soluble. Boron concentrations ranged from 20 to 70 Hg/L, with an outlier of 330 Hg/L at well 2S/2W-1J1.
As in surface water, calcium and bicarbonate were the major ions found in ground water on the basis of milliequivalence (figs. 8 and 9B). Four wells were not dominated by calcium and bicarbonate. Water from well 2S/2W-1J1 was high in sodium, sulfate, and dissolved-solids concentration and contained almost no magnesium. Water from this well also had elevated concentrations of fluoride and boron, which may indicate a contribution of mineralized ground water emanating from a nearby fault zone. This explanation seems plausible because well 2S/2W-1J1 is located near the intersection of the South Mesa and Casablanca Barriers (figs. 3 and 8). Wells 2S/2W-14R3 and 2S/2W-24L1 yielded water having more than 80 percent sodium and potassium and less than 20 percent calcium and magnesium (fig. 9B). These two wells are located south of the Banning and Cherry Valley Faults (figs. 3 and 8). Ground water moving to these wells probably has a geochemical signature more representative of the unconsolidated nonmarine sediment of the badlands than of the crystalline rocks found in the other hills and mountains in the Yucaipa area. Well 2S/2W-28C2 is located in San Timoteo Canyon, which is eroded into the badlands, and has the same water type as well 2S/2W-24L1 (fig. 9B). Well 2S/2W-28C2 is located near and probably downgradient from fishing ponds. The elevated concentrations of sodium, calcium, chloride, and bicarbonate in water from this well may result from evaporative processes
that occur in the ponds before water infiltrates into the ground.
Three wells (1S/2W-34N1, 2S/2W-3E1, and 2S/2W-4R1) located in the western part of the Yucaipa area and one well (1S/1W-19G1) in the northern part of the Yucaipa area yielded water with a high concentration of nitrate (fig. 12). Water from three of these wells (19G1, 34N1, and 3E1) had nitrate concentrations that exceed the MCL of 10 mg/L as N; water from well 2S/2W-4R1 had a nitrate concentration of 9.6 mg/L, just below the MCL. Water from these four wells also was higher in dissolved solids, sodium, calcium, chloride, sulfate, and bicarbonate. These wells are located downgradient from an area that has been used for agriculture (fig. 7). The high concentrations of these constituents at well 1S/2W-34N1 may result from agricultural practices and evaporative processes. The lower concentrations of nitrate in wells 2S/2W-3E1 and 2S/2W-4R1 may result either from a different source of nitrate or from dilution with less contaminated water as ground water moves through the area. The later seems more plausible, suggesting a separate but converging ground-water-flow path, possibly coincident with Oak Glen Creek.
Most constituents analyzed in ground-water samples were below their respective MCL’s. All sulfate concentrations, except for well 2S/2W-1J1, were below the Secondary Maximum Contaminant Level (SMCL) of 250 mg/L, as defined by the U.S. Environmental Protection Agency (1994). Water from one well (2S/2W-1J1) exceeded the SMCL for iron, which is 300 Hg/L. Water from two wells (1S/1W-19G1 and 2S/2W-28C2) exceeded the SMCL for manganese, which is 50 Hg/L. Barium concentration in all water samples was far below the MCL of 2,000 Hg/L.
In general, sodium, calcium, magnesium, chloride, nitrate, sulfate, and dissolved-solids concentrations were higher in ground water than in surface water (fig. 11) probably as a result of dissolution of minerals in the aquifer matrix. However, concentrations of iron, manganese, and phosphate were higher in surface water than in ground water.
Flowmeter Data
Flowmeter data were collected from well 1S/2W-25R4 using a commercial, vertical-axis current meter, commonly called a spinner tool. This tool
26 Surface-Water and Ground-Water Quality in the Yucaipa Area, San Bernardino and Riverside Counties, California, 1996–98
measures the velocity of water flowing inside the well casing by recording the number of revolutions per second made by a spinning impeller. Flowmeter data are helpful in determining the water-yielding character-istics of aquifer material opposite the screened interval and in evaluating mixtures of water collected at differ-ent depths within the well. A continuous profile of velocity was recorded for the entire depth of the well, and static data (stop counts) were collected every 10 ft.
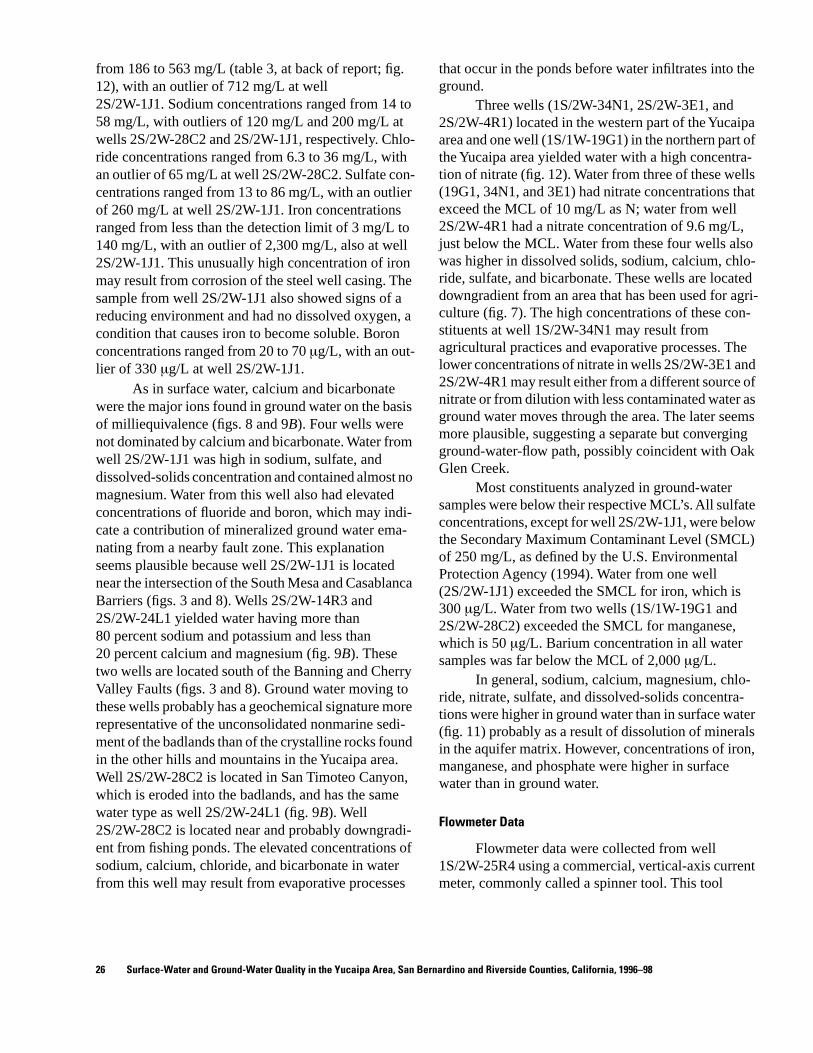
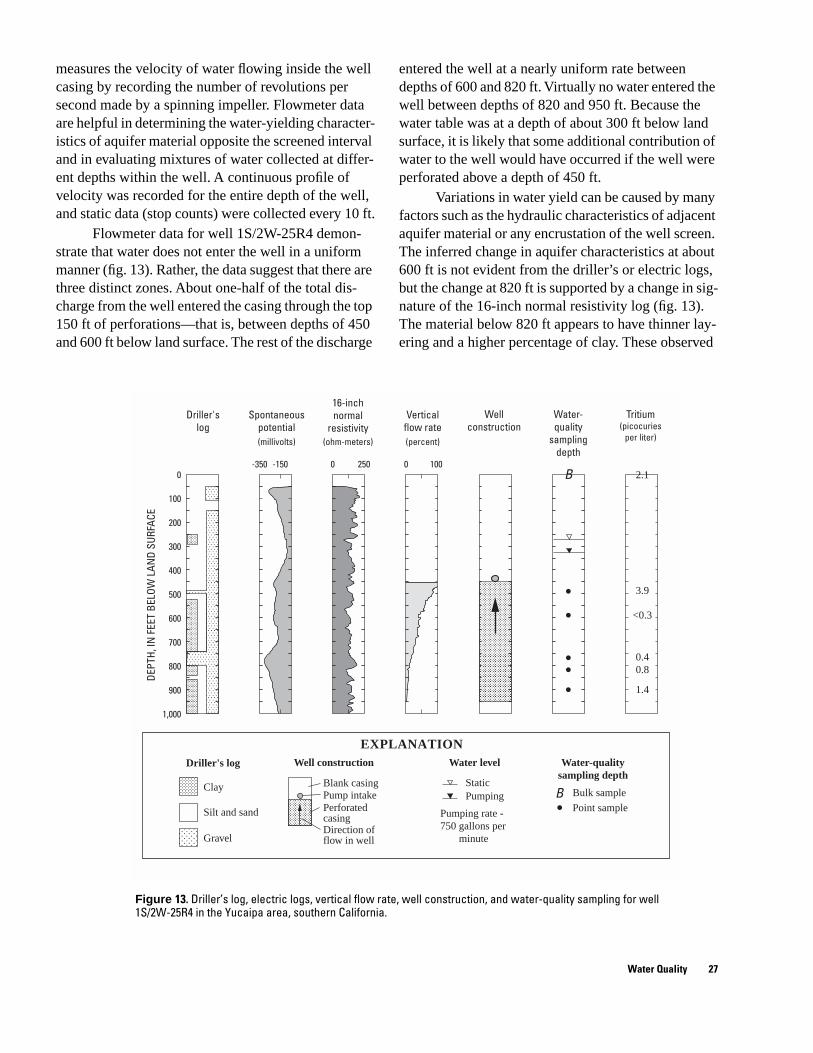
Flowmeter data for well 1S/2W-25R4 demon-strate that water does not enter the well in a uniform manner (fig. 13). Rather, the data suggest that there are three distinct zones. About one-half of the total dis-charge from the well entered the casing through the top 150 ft of perforations—that is, between depths of 450 and 600 ft below land surface. The rest of the discharge
entered the well at a nearly uniform rate between depths of 600 and 820 ft. Virtually no water entered the well between depths of 820 and 950 ft. Because the water table was at a depth of about 300 ft below land surface, it is likely that some additional contribution of water to the well would have occurred if the well were perforated above a depth of 450 ft.
Variations in water yield can be caused by many factors such as the hydraulic characteristics of adjacent aquifer material or any encrustation of the well screen. The inferred change in aquifer characteristics at about 600 ft is not evident from the driller’s or electric logs, but the change at 820 ft is supported by a change in sig-nature of the 16-inch normal resistivity log (fig. 13). The material below 820 ft appears to have thinner lay-ering and a higher percentage of clay. These observed
Water Quality 27
Figure 13. Driller’s log, electric logs, vertical flow rate, well construction, and water-quality sampling for well 1S/2W-25R4 in the Yucaipa area, southern California.
Driller'slog
Driller's log Water-quality�sampling depth
Water level��
Well construction
DEPT
H, IN
FEE
T BE
LOW
LAN
D SU
RFAC
E
Spontaneouspotential
16-inchnormal
resistivityVertical
flow rateWell
constructionWater-quality
samplingdepth
(millivolts) (ohm-meters) (percent)
0
100
200
300
400
500
600
700
800
900
Blank casing
Point sample
Bulk sampleStaticPumping
Pumping rate -�750 gallons per� minute
Perforated�casing
Pump intake
Direction of�flow in well
1,000
-150-350 0 250 0 100
Silt and sand
Gravel
Clay B
EXPLANATION
B
Tritium(picocuries
per liter)
3.9��
<0.3���
0.4�0.8�
�1.4
2.1

changes in flow rate and possible changes in lithology were used to select specific depths at which to sample water quality.
Depth-Dependent Samples
Depth-dependent and bulk samples for chemical and isotopic analyses were collected from production wells (table 3). Production wells generally have long screened intervals and can be open to more than one geologic or hydrogeologic unit. Bulk samples from production wells typically are a mixture of ground water from different units; nevertheless, only bulk samples were obtained for production wells sampled in this study, except for well 1S/2W-25R4, because of the expense and difficult logistics of depth-dependent sampling.
At well 1S/2W-25R4, depth-dependent chemical and flowmeter data were collected using special sample-collection techniques while the well was pumped. All depth-dependent water samples and one bulk sample were collected while the production well was discharging at a rate of 750 gal/min. To facilitate this discrete-depth sampling, the well had been modified with a temporary, lower capacity pump. A second bulk sample was collected while the well was pumped at a rate of 1,450 gal/min using the standard-capacity production pump. Depth-dependent water samples were collected using a high-pressure hose equipped with a one-way valve that allows water to enter from a specific depth (Gossell and others, 1995; Izbicki and others, 1999). The hose is lowered to the desired depth, the valve is opened, and the sample is collected. Then the hose is retrieved from the well, and the sample water is collected from the hose at land surface. Prior to sample collection, the well was pumped for over 12 hours to ensure that ground water entering the well through the screened interval was representative of the aquifer.
All samples were collected below the pump intake. The sample collected from the deepest part of the screened interval is interpreted as representing water entering below that depth. Water sampled above the lowest sample depth and below the pump intake is a mixture of water in the well at the first sample depth and water that entered the well between the two sample depths. The proportions of water in that mixture can be determined from the flowmeter data.
Results of the depth-dependent sampling show that the general water chemistry for the samples from well 1S/2W-25R4 are almost identical. Stiff diagrams of each sample collected at the different depths are similar to the Stiff diagram of the bulk sample shown in figure 8. This small vertical variability in general water chemistry can be explained in at least two ways. First, the geologic materials adjacent to the perforated intervals may be chemically similar despite their hydraulic differences (fig. 13). Second, ground water flowing in this recharge area near the mountains may not have had sufficient time to convert into chemically different, vertically stratified compositions.
Some vertical differences, however, were noted. The dissolved-oxygen concentrations were highest near the water table and lowest at the bottom of the well. The concentration of nitrate and nitrite also decreased with depth. Dissolved-solids and chloride concentrations tended to peak in the middle depths of the well. These results suggest that the most active part of the ground-water flow system is near the top of the well.
Tritium, a naturally occurring radioactive isotope of hydrogen, was used to determine the age (time since recharge) of the ground water. Tritium activity above the detection level of 0.3 pCi/L (picocuries per liter) was used as an indication of ground water recharged since 1952. Some processes that could affect tritium values are dispersion, mixing with different waters, and degassing during sampling. All depth-dependent samples from well 1S/2W-25R4 were analyzed for tritium. The highest tritium value (3.9 pCi/L) came from the shallowest sample depth, indicating that at least some of this water was recharged since 1952 (fig. 13). The other samples ranged from less than the detection limit of 0.3 pCi/L at 590 ft to 1.4 pCi/L (fig. 13 and table 3) at the bottom of the well.
The presence of an elevated value of tritium at the bottom of the well is unlikely, because it implies that younger water is present at the top and bottom of the well. A more likely explanation is that the bottom of the well is inactive and was not purged of water during pumping. This explanation is consistent with the flowmeter data showing that virtually no water enters the well below a depth of about 820 ft. If this explanation is correct, then all water-chemistry data collected for depths at 820 and 900 ft represent largely unpurged water originating from shallower perforated intervals.
28 Surface-Water and Ground-Water Quality in the Yucaipa Area, San Bernardino and Riverside Counties, California, 1996–98

--------------------
Tritium values for the bulk samples were 2.1 pCi/L for a pumping rate of 750 gal/min and 3.4 pCi/L for a pumping rate of 1,450 gal/min. The higher tritium value for the higher pumping rate indicates that more water is being withdrawn from the uppermost zone.
Depth-dependent samples at the lower pumping rate (750 gal/min) also were analyzed for 14C (table 3). The collected water samples are relatively young given the time scale for waters dated using 14C. Expressed as percent modern carbon, the 14C value was 86.1 in the well where no tritium (< 0.3 pCi/L) was detected (fig. 13). Assuming radioactive decay, with an initial 14C activity of 90 percent modern carbon (Izbicki and others, 1997, p. 16) and neglecting reactions with the aquifer material, this sample has an approximate time of recharge of less than 400 years before present.
A simple three-cell mixing model can be used to test the data and interpretations of the depth-dependent sampling. If Q1, Q2, and Q3 are the discharge rates for the upper, middle, and lower zones, respectively; and C1, C2, and C3 are concentrations of a selected constituent for the same zones, then
QT CT = Q1 C1 + Q2 C2 + Q3 C3, (1)
where QT and CT are total discharge and concentration from the well. Using flowmeter and tritium data,
750 (2.1) = 375 (3.9) + 375 (0) + 0 (1.4), or (2A)
375%3.9&2.1 ∼
750 - , (2B)
which suggests that the assumed contribution from each zone to total discharge is reasonable. Applying the same test to other constituents (alkalinity, sulfate, nitrate) yielded similar results. Additional depth-dependent samples from nearby wells might help verify these results and extend analysis to other parts of the Yucaipa area.
ISOTOPIC COMPOSITION OF WATER
Oxygen-18 and Deuterium
Surface-water isotopes at a particular site have a wide range of values (fig. 14A) which are highly influenced by the direction from which storms are generated and over time will approximate the values of ground water. Although all three storms originated in the north-west, the first and second storms entered the basin from the west and moved northeastward (fig. 10). The third storm entered the basin from the north and produced much more precipitation than did the first two storms. The third storm had warm moist air drawn into the system from the west. This effect typically occurs later in the rainy season and produces many of the larger magnitude, longer duration storms. Because the moist air from the storm is generated from a lower latitude and warmer climate than is air from the north, the precipitation is isotopically heavier (fig. 14).
Isotopic values for base flow (table 2) plot slightly above the meteoric water line (fig. 14B), and mean isotope ratios are −10.3 and −69.0 for δ18O and δD, respectively. The mean isotopic ratios for the first storm are −12.7 and −91.8 for δ18O and δD, respectively. These values are grouped below the meteoric water line near the bottom of the graph and indicate that this runoff is isotopically much lighter than is base flow. The mean isotope ratios for the second storm are −11.7 and −77.3 for δ18O and δD, respectively, and are grouped above the meteoric water line and slightly below the middle of the graph. The mean isotopic ratios for the third storm are −6.51 and −38.2 for δ18O and δD, respectively, and are grouped above the meteoric water line, near the top of the graph. Runoff from this storm is isotopically much heavier than is base flow.
Over time, the isotopic ratio of water vapor in different storms trends to an average value; therefore, the isotopic ratio of ground water is determined primarily by local differences in the temperature of condensation of water vapor, prior to its being recharged in different places and at different times. The deuterium content of precipitation varies seasonally as well as by storm and is highly dependent on storm- track trajectories (Friedman and others, 1992). The δ18O and δD ratios of water from most wells ranged from −8.11
Isotopic Composition of Water 29

A -20
-30
-40
-50
-60
-70
-80
-90
-100
-110 -14 -13 -12 -11 -10 -9 -8 -7 -6 -5 -4
Isotopic composition by site
28C2 (San Timoteo
Canyon)
in Ford Canyon near Oak Glen
Upper Ford Canyon
at 2nd Street
at Mesa Grande at 5th Street below Dunlap Acres
Ground-water sites
Oak Glen Creek
Yucaipa Creek
Mill Creek outlet at Regional Park
Meteoric water line
(Craig, 1961)
Evaporative trend line
Local ground-water line
A� B� C� D
E� F� G
H
DELTA OXYGEN-18 (δ 18O), IN PER MIL
B -20
-30
-40
-50
-60
-70
-80
-90
-100
-110 -14 -13 -12 -11 -10 -9 -8 -7 -6 -5 -4
Isotopic composition by storm
28C2 (San Timoteo
Canyon)
Ground-water sites
Base flow
Stormflow February 3, 1998 February 19, 1998February 23, 1998
Meteoric water line
(Craig, 1961)
First storm
Second storm
Third storm Evaporative trend line
Local ground-water line
DELTA OXYGEN-18 (δ 18O), IN PER MIL
Figure 14. Isotopic concentrations of delta deuterium (∂D) compared to delta oxygen-18 (∂18O) by site (A) and by storm (B) for selected wells and surface-water sites in the Yucaipa area, southern California.
DEL
TA D
EUTE
RIU
M (δ
D),
IN P
ER M
IL
DEL
TA D
EUTE
RIU
M (δ
D),
IN P
ER M
IL
30 Surface-Water and Ground-Water Quality in the Yucaipa Area, San Bernardino and Riverside Counties, California, 1996–98
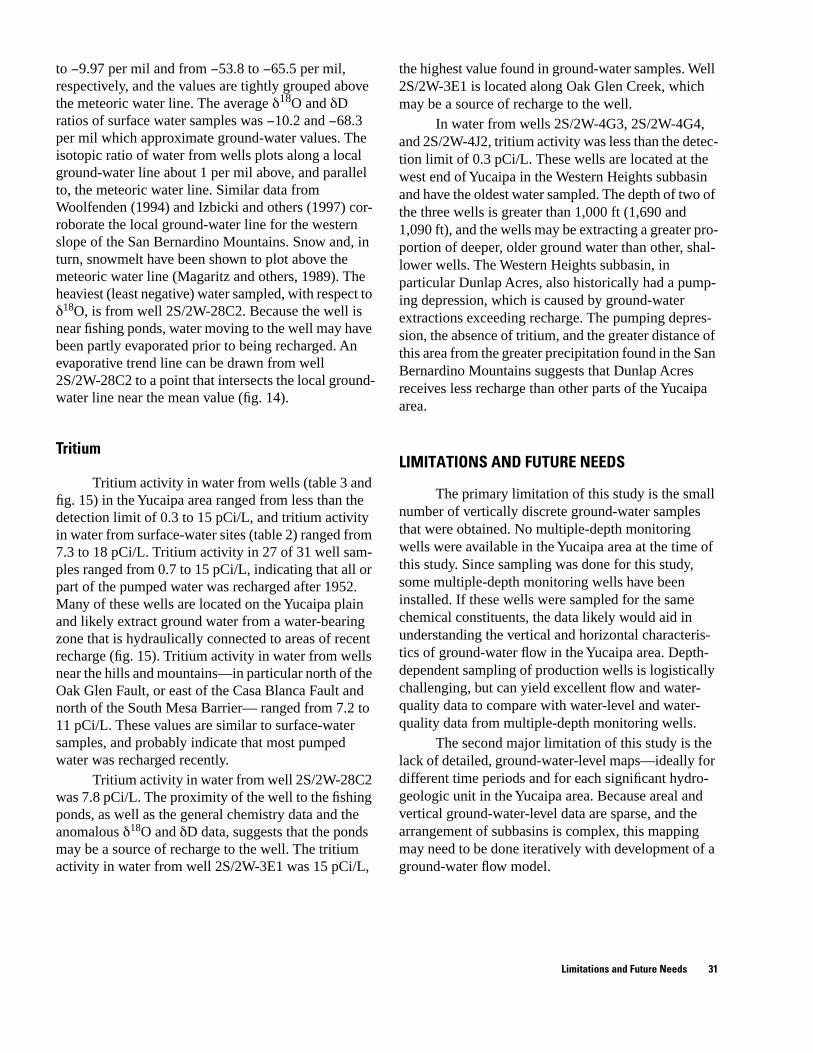
to −9.97 per mil and from −53.8 to −65.5 per mil, respectively, and the values are tightly grouped above the meteoric water line. The average δ18O and δD ratios of surface water samples was −10.2 and −68.3 per mil which approximate ground-water values. The isotopic ratio of water from wells plots along a local ground-water line about 1 per mil above, and parallel to, the meteoric water line. Similar data from Woolfenden (1994) and Izbicki and others (1997) corroborate the local ground-water line for the western slope of the San Bernardino Mountains. Snow and, in turn, snowmelt have been shown to plot above the meteoric water line (Magaritz and others, 1989). The heaviest (least negative) water sampled, with respect to δ18O, is from well 2S/2W-28C2. Because the well is near fishing ponds, water moving to the well may have been partly evaporated prior to being recharged. An evaporative trend line can be drawn from well 2S/2W-28C2 to a point that intersects the local ground-water line near the mean value (fig. 14).
Tritium
Tritium activity in water from wells (table 3 and fig. 15) in the Yucaipa area ranged from less than the detection limit of 0.3 to 15 pCi/L, and tritium activity in water from surface-water sites (table 2) ranged from 7.3 to 18 pCi/L. Tritium activity in 27 of 31 well samples ranged from 0.7 to 15 pCi/L, indicating that all or part of the pumped water was recharged after 1952. Many of these wells are located on the Yucaipa plain and likely extract ground water from a water-bearing zone that is hydraulically connected to areas of recent recharge (fig. 15). Tritium activity in water from wells near the hills and mountains—in particular north of the Oak Glen Fault, or east of the Casa Blanca Fault and north of the South Mesa Barrier— ranged from 7.2 to 11 pCi/L. These values are similar to surface-water samples, and probably indicate that most pumped water was recharged recently.
Tritium activity in water from well 2S/2W-28C2 was 7.8 pCi/L. The proximity of the well to the fishing ponds, as well as the general chemistry data and the anomalous δ18O and δD data, suggests that the ponds may be a source of recharge to the well. The tritium activity in water from well 2S/2W-3E1 was 15 pCi/L,
the highest value found in ground-water samples. Well 2S/2W-3E1 is located along Oak Glen Creek, which may be a source of recharge to the well.
In water from wells 2S/2W-4G3, 2S/2W-4G4, and 2S/2W-4J2, tritium activity was less than the detection limit of 0.3 pCi/L. These wells are located at the west end of Yucaipa in the Western Heights subbasin and have the oldest water sampled. The depth of two of the three wells is greater than 1,000 ft (1,690 and 1,090 ft), and the wells may be extracting a greater pro-portion of deeper, older ground water than other, shallower wells. The Western Heights subbasin, in particular Dunlap Acres, also historically had a pumping depression, which is caused by ground-water extractions exceeding recharge. The pumping depression, the absence of tritium, and the greater distance of this area from the greater precipitation found in the San Bernardino Mountains suggests that Dunlap Acres receives less recharge than other parts of the Yucaipa area.
LIMITATIONS AND FUTURE NEEDS
The primary limitation of this study is the small number of vertically discrete ground-water samples that were obtained. No multiple-depth monitoring wells were available in the Yucaipa area at the time of this study. Since sampling was done for this study, some multiple-depth monitoring wells have been installed. If these wells were sampled for the same chemical constituents, the data likely would aid in understanding the vertical and horizontal characteristics of ground-water flow in the Yucaipa area. Depth-dependent sampling of production wells is logistically challenging, but can yield excellent flow and water-quality data to compare with water-level and water-quality data from multiple-depth monitoring wells.
The second major limitation of this study is the lack of detailed, ground-water-level maps—ideally for different time periods and for each significant hydro-geologic unit in the Yucaipa area. Because areal and vertical ground-water-level data are sparse, and the arrangement of subbasins is complex, this mapping may need to be done iteratively with development of a ground-water flow model.
Limitations and Future Needs 31

δδδ δδδFigure 15. Delta deuterium (δD), delta oxygen-18 (δ18O), and tritium activity in selected wells and surface-water sites in the Yucaipa area, southern California.
32 Surface-Water and Ground-Water Quality in the Yucaipa Area, San Bernardino and Riverside Counties, California, 1996–98
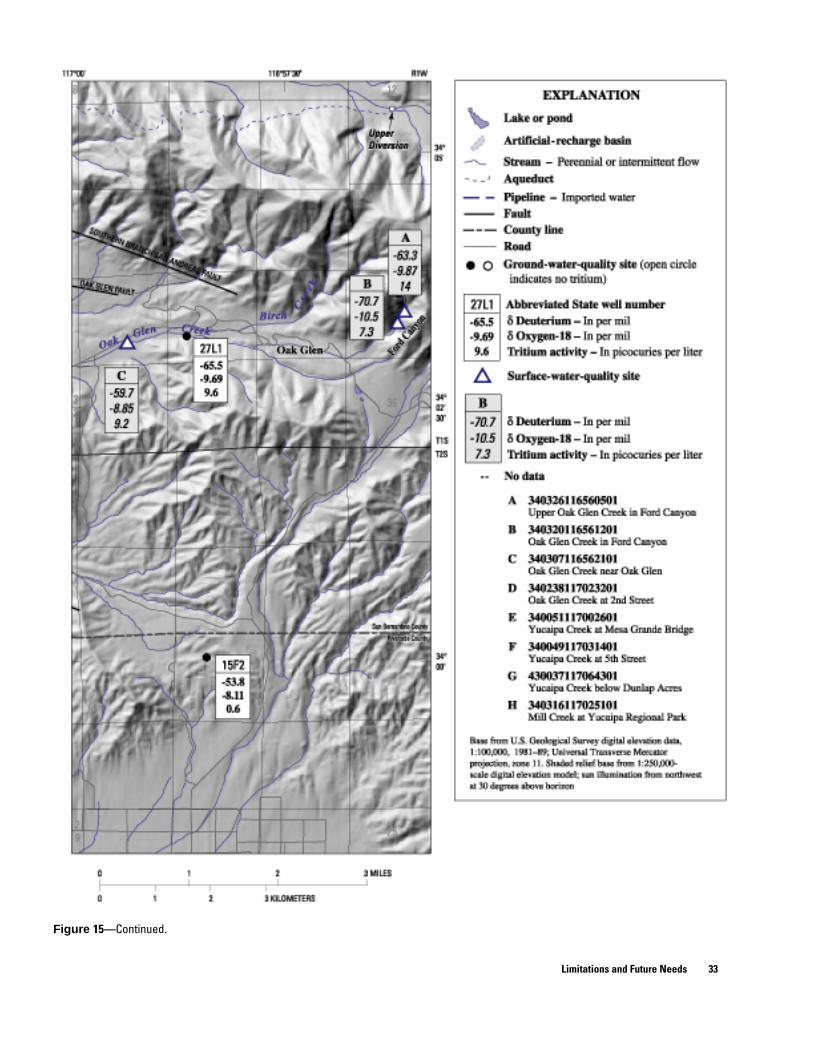
Figure 15—Continued.
Limitations and Future Needs 33

SUMMARY AND CONCLUSIONS
Most water sampled in the Yucaipa area is a calcium-bicarbonate type. The general chemical composition of surface water resembles that of ground water, although the concentrations of most constituents are higher in ground water. The ionic strength of most ground-water samples was similar. Elevated concentrations of nitrate were found in some ground-water samples from wells and may indicate recharge of water from agricultural areas. Water samples from nearby wells suggest that the elevated nitrate concentrations are diluted by ground water that originates as recharge from Oak Glen Creek.
Ground water was found to have a range of tritium activity, indicating different times since recharge and possible mixing along ground-water flow paths. The oldest water had tritium values less than 0.3 pCi/L, indicating more than 50 years since recharge. Tritium values greater than 0.3 pCi/L indicate that at least part of the pumped water was recharged since 1952. Ground water near the hills and mountains—in particular, ground water that is north of the Oak Glen Fault, or east of the Casa Blanca Barrier and north of the South Mesa Barrier—had tritium values similar to those of surface-water samples and indicates that it is likely to be the most recently recharged ground water.
Flowmeter data from well 1S/2W-25R4 showed that more than one-half of the water flowed into the well between depths of 450 and 600 ft below land surface. At a flow rate of 750 gal/min, virtually no water was contributed to the well below a depth of about 820 ft. Water recharged since 1952 was found in the upper-most part of the well. Water flowing into the well from depths below 590 ft probably was recharged more than 50 years and less than about 400 years before present. Tritium and flowmeter data from well 1S/2W-25R4 suggest that the well could extract additional water if perforations were present between the water table at a depth of about 300 ft below land surface and the top of existing perforations at a depth of 450 ft.
SELECTED REFERENCES
Burnham, W.L., and Dutcher, L.C., 1960, Geology and ground-water hydrology of the Redlands–Beaumont area, California, with special reference to ground-water outflow: U.S. Geological Survey Open-File Report, 352 p.
California Department of Water Resources, 1970, Meeting water demands in the Bunker Hill–San Timoteo
area—Geology, hydrology, and operation–economics studies: California Department of Water Resources Bulletin 104-5, 75 p.
———1979, Preliminary evaluation of State Water Project ground-water storage program, Bunker Hill–San Timoteo–Yucaipa basins: 82 p.
———1986, San Bernardino–San Gorgonio water resources management investigation: Southern District, 83 p.
Camp, Dresser, and McKee, 1994, Water facilities master plan for the Yucaipa Valley Water District: Final water master plan report [variously paged].
Craig, H., 1961, Isotope variation in meteoric waters: Science, v. 133, p. 1702–1703.
Dutcher, D.L., and Burnham, W.L., 1959, Geology and ground-water hydrology of the Mill Creek area, San Bernardino County, California: U.S. Geological Survey Open-File Report, 229 p.
Dutcher, D.L., and Fenzel, F.W., 1972, Ground-water out-flow, San Timoteo–Smiley Heights area, Upper Santa Ana Valley, southern California, 1927 through 1968: U.S. Geological Survey Open-File Report 72-0097, 30 p.
Eckis, Rollin, 1934, Geology and ground-water storage capacity of valley fill, South Coastal Basin Investigation: California Division of Water Resources Bulletin 45, 273 p.
Egan and Associates, Inc., 1989, Plan of water system development: Report to Western Heights Water Company [variously paged].
Fishman, M.J., 1993, Methods for analysis by the United States Geological Survey National Water Quality Laboratory—Determination of inorganic and organic constituents in water and fluvial sediments: U.S. Geological Survey Open-File Report 93-125, 217 p.
Fishman, M.J., and Friedman, L.C., eds., 1989, Methods for determination of inorganic substances in water and fluval sediments: Techniques of Water-Resources Investigations of the United States Geological Survey, book 5, chap. A1, 545 p.
Fletcher, G.L., 1976, Fluctuation of water levels in wells in the Yucaipa area, 1965–75: San Bernardino Valley Municipal Water District, Report No. ENG–76–E2, 17 p.
Fox, R.C., 1987, A hydrogeologic analysis and projected water level decline in Western Heights subbasin: A report for Western Heights Water Company, 21 p.
———1990, Groundwater resources monitoring plan: A report for Yucaipa Valley Water District, v. 1, 136 p.
Friedman, I., Smith, G.I., Gleason, J.D., Warden, A., and Harris, J.M., 1992, Stable isotope composition of waters in southeastern California: Journal of Geophysical Research, v. 97, no. D5, p. 5795–5812.
Gonfiantini, R., 1978, Standards for stable isotope measurements in natural compounds: Nature, v. 271, p. 534–536.
34 Surface-Water and Ground-Water Quality in the Yucaipa Area, San Bernardino and Riverside Counties, California, 1996–98
Gossell, M.A., Hanson, R.T., Izbicki, J.A., and Nishikawa, Tracy, 1995, Application of impeller-flow meter and discrete water-sampling techniques for improved ground-water well construction [abs.]: Eos, v. 76, no. 46, p. 182.
Harden, D.R., 1998, California Geology: Upper Saddle River: New Jersey, Prentice-Hall, Inc., 479 p.
Horowitz, A.J., Demas, C.R., Fitzgerald, K.K., Miller, T.L., and Rickert, D.A., 1994, U.S. Geological Survey protocol for the collection and processing of surface-water samples for the subsequent determination of inorganic constituents in filtered water: U.S. Geological Survey Open-File Report 94-539, 57 p.
International Atomic Energy Agency, 1981, Stable isotope hydrology: Deuterium and oxygen-18 in the water cycle: Technical Reports Series No. 210, 337 p.
Izbicki, J.A., 1996, Use of 18O and D to define seawater intrusion, in Bathala, C.T., ed., North America Water and Environment Congress, Anaheim, California, June 23–28, Proceedings: New York, American Society of Civil Engineers, 1 CD-ROM.
Izbicki, J.A., Christensen, A.H, and Hanson, R.T., 1999, U.S. Geological Survey combined well-bore flow and depth-dependent water sampler, U.S. Geological Survey Fact Sheet 196-99, 2 p.
Izbicki, J.A., Danskin, W.R, and Mendez, G.O., 1997, Chemistry and isotopic composition of ground water along a section near the Newmark area, San Bernardino County, California, U.S. Geological Survey Water-Resources Investigations Report 97-4179, 27 p.
Magaritz, M., Aravena, R, Pena, H., Suzuki, O., and Grilli, A., 1989, Water chemistry and isotopic study of streams and springs in northern Chile: Journal of Hydrology, v. 108, p. 323–341.
Mann, J.F., Jr., 1986, Revised safe yield of the Yucaipa sub-basins: San Bernardino Valley Muncipal Water District, unpub. report, 7 p.
Mann, J.F., Jr., and Todd, D.K., 1990, Perennial yield, Yucaipa groundwater basin: San Bernardino Valley Muncipal Water District and Yucaipa Valley Water District, unpub. report, 4 p.
Matti, J.C., and Carson, S.E., 1991, Liquefaction susceptibility in the San Bernardino Valley and vicinity, southern California—A regional evaluation: U.S. Geological Survey Bulletin 1898, 53 p.
Matti, J. C., Morton, D.M., Cox, B.F., Carson, S.E., and Yetter, T.J., 1992, Geologic map of the Yucaipa quadrangle, San Bernardino and Riverside Counties, California: U.S. Geological Survey Open-File Report 92-446, 14 p. and 1 map sheet.
Mendenhall, W.C., 1905, The hydrology of San Bernardino Valley, California: U.S. Geological Survey Water-Supply Paper 142, 124 p.
Michel, R.L., 1976, Tritium inventories of the world’s oceans and their implications: Nature, v. 263, p. 103–106.
———1989, Tritium deposition in the continental United States, 1953–1983: U.S. Geological Survey Water-Resources Investigations Report 89-4072, 46 p.
Moreland, J.A., 1970, Artificial recharge, Yucaipa, California: U.S. Geological Survey Open-File Report, 44 p.
Morton, D.M., 1974, Generalized geologic map of south-western San Bernardino County, California, plate 1B, in Fife, D.L., Rodgers, D.A., Chase, G.W., Chapman, R.H., and Sprotte, E.C., 1976, Geologic hazards in southwestern San Bernardino County, California: California Division of Mines and Geology Special Report 113, 40 p.
Patton, C.J., and Truitt, E.P., 1992, Methods of analysis by the United States Geological Survey National Water Quality Laboratory—Determination of total phosphorus by a Kjeldahl digestion method and an automated colorimetric finish that includes dialysis: U.S. Geological Survey Open-File Report 92-146, 39 p.
Piper, A.M., 1944, A graphic procedure in the geochemical interpretation of water analyses: American Geophysical Union Transactions, v. 25, p. 914–923.
Powers, W.R., III, and Hardt, W.F., 1974, Oak Glen water resources development study using modeling techniques, San Bernardino County, California: U.S. Geological Survey Water-Resources Investigations Report 31-74, 59 p.
Stiff, H.A., Jr., 1951, The interpretation of chemical water analysis by means of patterns: Journal of Petroleum Technology, v. 3, no. 10, p. 15–17.
Struzeski, T.M., DeGiacomo, W.J., and Zayhowski, E.J., 1996, Methods of analysis by the United States Geological Survey National Water Quality Laboratory—Determination of dissolved aluminum and boron in water by inductive coupled plasma-atomic emission spectrometry: U.S. Geological Survey Open-File Report 96-149, 17 p.
Todd, D.K., 1988, Perennial yield of the Yucaipa groundwater basin: Report to Yucaipa Valley Water District, 71 p.
U.S. Environmental Protection Agency, 1994, Drinking water standards and health advisories table: U.S. Environmental Protection Agency, Region IX, San Francisco, California, 25 p.
Wilde, F.D.,and Radtke, D.B., eds., 1998, National field manual for the collection of water-quality data: U.S. Geological Survey Techniques of Water-Resources Investigations, book 9, chap. A6, 218 p.
Woolfenden, L.R., 1994, Oxygen-18, deuterium, and tritium as tracers of imported water in the Rialto–Colton Basin, California, in Marston, R.A. and Hasfuther, V.R., Effects of human-induced changes on hydrologic systems: American Water Resources Association, p. 923–932.
Selected References 35
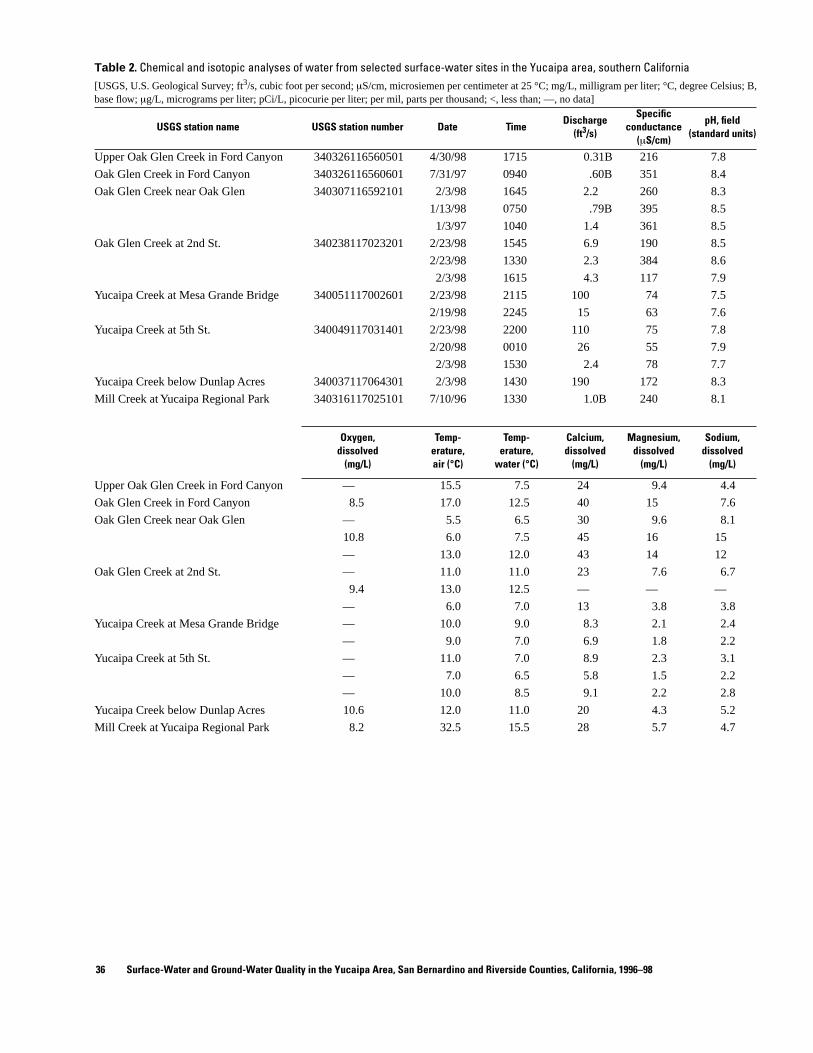
Table 2. Chemical and isotopic analyses of water from selected surface-water sites in the Yucaipa area, southern California [USGS, U.S. Geological Survey; ft3/s, cubic foot per second; HS/cm, microsiemen per centimeter at 25 °C; mg/L, milligram per liter; °C, degree Celsius; B, base flow; Hg/L, micrograms per liter; pCi/L, picocurie per liter; per mil, parts per thousand; <, less than; —, no data]
USGS station name USGS station number Date Time Discharge
(ft3/s)
Specific conductance
pH, field
(HS/cm) (standard units)
Upper Oak Glen Creek in Ford Canyon 340326116560501 4/30/98 1715 0.31B 216 7.8
Oak Glen Creek in Ford Canyon 340326116560601 7/31/97 0940 .60B 351 8.4
Oak Glen Creek near Oak Glen 340307116592101 2/3/98 1645 2.2 260 8.3
1/13/98 0750 .79B 395 8.5
1/3/97 1040 1.4 361 8.5
Oak Glen Creek at 2nd St. 340238117023201 2/23/98 1545 6.9 190 8.5
2/23/98 1330 2.3 384 8.6
2/3/98 1615 4.3 117 7.9
Yucaipa Creek at Mesa Grande Bridge 340051117002601 2/23/98 2115 100 74 7.5
2/19/98 2245 15 63 7.6
Yucaipa Creek at 5th St. 340049117031401 2/23/98 2200 110 75 7.8
2/20/98 0010 26 55 7.9
2/3/98 1530 2.4 78 7.7
Yucaipa Creek below Dunlap Acres 340037117064301 2/3/98 1430 190 172 8.3
Mill Creek at Yucaipa Regional Park 340316117025101 7/10/96 1330 1.0B 240 8.1
Oxygen, Temp- Temp- Calcium, Magnesium, Sodium, dissolved erature, erature, dissolved dissolved dissolved
(mg/L) air (°C) water (°C) (mg/L) (mg/L) (mg/L)
Upper Oak Glen Creek in Ford Canyon — 15.5 7.5 24 9.4 4.4
Oak Glen Creek in Ford Canyon 8.5 17.0 12.5 40 15 7.6
Oak Glen Creek near Oak Glen — 5.5 6.5 30 9.6 8.1
10.8 6.0 7.5 45 16 15
— 13.0 12.0 43 14 12
Oak Glen Creek at 2nd St. — 11.0 11.0 23 7.6 6.7
9.4 13.0 12.5 — — —
— 6.0 7.0 13 3.8 3.8
Yucaipa Creek at Mesa Grande Bridge — 10.0 9.0 8.3 2.1 2.4
— 9.0 7.0 6.9 1.8 2.2
Yucaipa Creek at 5th St. — 11.0 7.0 8.9 2.3 3.1
— 7.0 6.5 5.8 1.5 2.2
— 10.0 8.5 9.1 2.2 2.8
Yucaipa Creek below Dunlap Acres 10.6 12.0 11.0 20 4.3 5.2
Mill Creek at Yucaipa Regional Park 8.2 32.5 15.5 28 5.7 4.7
36 Surface-Water and Ground-Water Quality in the Yucaipa Area, San Bernardino and Riverside Counties, California, 1996–98
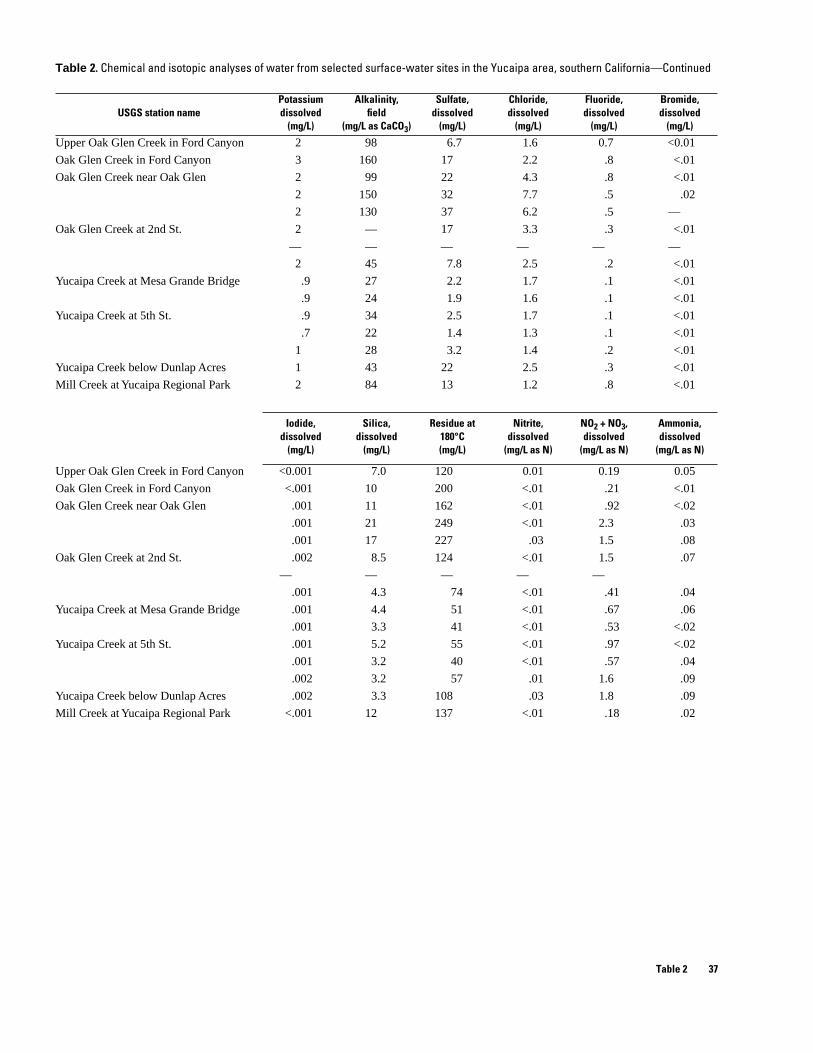
Table 2. Chemical and isotopic analyses of water from selected surface-water sites in the Yucaipa area, southern California—Continued
Potassium Alkalinity, Sulfate, Chloride, Fluoride, Bromide, dissolved field dissolved dissolved dissolved dissolved
(mg/L) (mg/L as CaCO3) (mg/L) (mg/L) (mg/L) (mg/L) USGS station name
Upper Oak Glen Creek in Ford Canyon 2 98 6.7 1.6 0.7 <0.01
Oak Glen Creek in Ford Canyon 3 160 17 2.2 .8 <.01
Oak Glen Creek near Oak Glen 2 99 22 4.3 .8 <.01
2 150 32 7.7 .5 .02
2 130 37 6.2 .5 —
Oak Glen Creek at 2nd St. 2 — 17 3.3 .3 <.01
— — — — — —
2 45 7.8 2.5 .2 <.01
Yucaipa Creek at Mesa Grande Bridge .9 27 2.2 1.7 .1 <.01
.9 24 1.9 1.6 .1 <.01
Yucaipa Creek at 5th St. .9 34 2.5 1.7 .1 <.01
.7 22 1.4 1.3 .1 <.01
1 28 3.2 1.4 .2 <.01
Yucaipa Creek below Dunlap Acres 1 43 22 2.5 .3 <.01
Mill Creek at Yucaipa Regional Park 2 84 13 1.2 .8 <.01
Iodide, Silica, Residue at Nitrite, NO2 + NO3, Ammonia, dissolved dissolved 180°C dissolved dissolved dissolved
(mg/L) (mg/L) (mg/L) (mg/L as N) (mg/L as N) (mg/L as N)
Upper Oak Glen Creek in Ford Canyon <0.001 7.0 120 0.01 0.19 0.05
Oak Glen Creek in Ford Canyon <.001 10 200 <.01 .21 <.01
Oak Glen Creek near Oak Glen .001 11 162 <.01 .92 <.02
.001 21 249 <.01 2.3 .03
.001 17 227 .03 1.5 .08
Oak Glen Creek at 2nd St. .002 8.5 124 <.01 1.5 .07
— — — — —
.001 4.3 74 <.01 .41 .04
Yucaipa Creek at Mesa Grande Bridge .001 4.4 51 <.01 .67 .06
.001 3.3 41 <.01 .53 <.02
Yucaipa Creek at 5th St. .001 5.2 55 <.01 .97 <.02
.001 3.2 40 <.01 .57 .04
.002 3.2 57 .01 1.6 .09
Yucaipa Creek below Dunlap Acres .002 3.3 108 .03 1.8 .09
Mill Creek at Yucaipa Regional Park <.001 12 137 <.01 .18 .02
Table 2 37
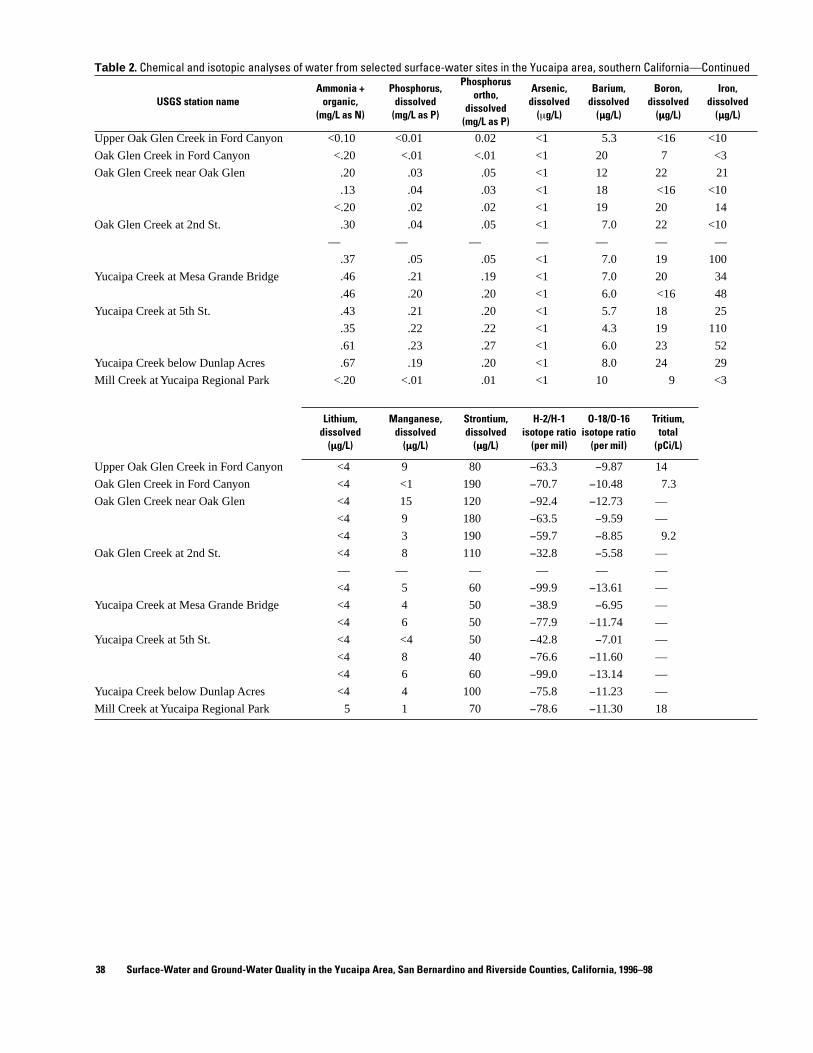
HHH HHH HHH
HHH HHH HHH
Table 2. Chemical and isotopic analyses of water from selected surface-water sites in the Yucaipa area, southern California—Continued
Ammonia + Phosphorus, Phosphorus
Arsenic, Barium, Boron, Iron,ortho,
organic, dissolved dissolved
dissolved dissolved dissolved dissolvedUSGS station name (mg/L as N) (mg/L as P)
(mg/L as P) (Hg/L) (Hg/L) (Hg/L) (Hg/L)
Upper Oak Glen Creek in Ford Canyon <0.10 <0.01 0.02 <1 5.3 <16 <10
Oak Glen Creek in Ford Canyon <.20 <.01 <.01 <1 20 7 <3
Oak Glen Creek near Oak Glen .20 .03 .05 <1 12 22 21
.13 .04 .03 <1 18 <16 <10
<.20 .02 .02 <1 19 20 14
Oak Glen Creek at 2nd St. .30 .04 .05 <1 7.0 22 <10
— — — — — — —
.37 .05 .05 <1 7.0 19 100
Yucaipa Creek at Mesa Grande Bridge .46 .21 .19 <1 7.0 20 34
.46 .20 .20 <1 6.0 <16 48
Yucaipa Creek at 5th St. .43 .21 .20 <1 5.7 18 25
.35 .22 .22 <1 4.3 19 110
.61 .23 .27 <1 6.0 23 52
Yucaipa Creek below Dunlap Acres .67 .19 .20 <1 8.0 24 29
Mill Creek at Yucaipa Regional Park <.20 <.01 .01 <1 10 9 <3
Lithium, Manganese, Strontium, H-2/H-1 O-18/O-16 Tritium, dissolved dissolved dissolved isotope ratio isotope ratio total
(Hg/L) (Hg/L) (Hg/L) (per mil) (per mil) (pCi/L)
Upper Oak Glen Creek in Ford Canyon <4 9 80 −63.3 −9.87 14
Oak Glen Creek in Ford Canyon <4 <1 190 −70.7 −10.48 7.3
Oak Glen Creek near Oak Glen <4 15 120 −92.4 −12.73 —
<4 9 180 −63.5 −9.59 —
<4 3 190 −59.7 −8.85 9.2
Oak Glen Creek at 2nd St. <4 8 110 −32.8 −5.58 —
— — — — — —
<4 5 60 −99.9 −13.61 —
Yucaipa Creek at Mesa Grande Bridge <4 4 50 −38.9 −6.95 —
<4 6 50 −77.9 −11.74 —
Yucaipa Creek at 5th St. <4 <4 50 −42.8 −7.01 —
<4 8 40 −76.6 −11.60 —
<4 6 60 −99.0 −13.14 —
Yucaipa Creek below Dunlap Acres <4 4 100 −75.8 −11.23 —
Mill Creek at Yucaipa Regional Park 5 1 70 −78.6 −11.30 18
38 Surface-Water and Ground-Water Quality in the Yucaipa Area, San Bernardino and Riverside Counties, California, 1996–98

Table 3. Chemical and isotopic analyses of water from selected wells in the Yucaipa area, southern California [State well number, see “Well-Numbering System” in text; USGS, U.S. Geological Survey; gal/min, gallons per minute; ft blw LSD, feet below land-surface datum; HS/cm, microsiemen per centimeter at 25 °C; mg/L, milligram per liter; Hg/L, microgram per liter; pCi/L, picocurie per liter; per mil, parts per thousand; °C, degree Celsius; B, bulk sample; <, less than; —, no data]
State well number USGS station number Date Time Flow rate (gal/min)
Depth to sample
(ft blw LSD)
Specific conductance
(HS/cm)
pH, field (standard
units)
Oxygen, dissolved
(mg/L)
Temperature, air °C
Temperature, water °C
1S/1W-19G01 340415117012701 7/29/97 1330 180 — 745 7.3 6.9 25.0 18.5
1S/1W-27L01 340312116583901 7/29/97 0930 240 — 568 7.1 4.1 19.5 14.0
1S/1W-32C01 340253117002701 7/29/97 1145 90 — 476 7.2 6.0 23.0 16.5
1S/2W-24C02 340438117024201 7/31/97 1230 — — 650 7.4 6.5 32.5 20.0
1S/2W-25A01 340343117021201 7/17/97 1330 260 — 584 7.6 8.0 — 21.5
1S/2W-25R04(B) 340255117021601 2/25/98 1600 750 — 477 7.6 — 11.0 19.0
-25R04 340255117021601 2/25/98 1730 750 480 458 7.4 8.2 10.5 11.0
-25R04 340255117021601 2/25/98 1930 750 590 491 7.4 7.5 6.0 13.5
-25R04 340255117021601 2/25/98 2100 750 770 510 7.5 7.4 3.5 12.0
-25R04 340255117021601 2/25/98 2330 750 820 513 7.5 6.0 2.5 12.0
-25R04 340255117021601 2/26/98 0030 750 900 486 7.4 6.0 2.5 12.5
-25R04(B) 340255117021601 5/1/98 1000 1450 — 463 7.6 8.2 13.5 19.5
1S/2W-34N01 340202117050201 7/10/96 1430 600 — 831 7.6 5.6 32.0 20.5
1S/2W-36G01 340236117023101 7/18/97 0950 1,700 — 466 7.6 6.9 — 20.0
2S/1W-08F01 340054117002901 7/16/97 1210 250 — 601 7.2 5.8 — 18.0
2S/1W-15F02 340003116582501 7/16/97 1430 140 — 445 7.8 .4 — 20.0
2S/2W-01J011 340124117021301 6/2/98 1945 2.5 — 1,100 7.8 .0 24.5 22.5
2S/2W-02M01 340129117035101 7/15/97 1200 550 — 569 7.7 8.5 — 20.5
-02M01 340129117035101 7/10/98 1210 550 — 553 7.7 — 29.5 20.0
2S/2W-03E01 340148117045401 7/9/96 1330 1,200 — 734 7.5 6.0 30.0 20.0
2S/2W-03L01 340129117044201 7/11/96 1120 450 — 498 7.7 9.2 30.0 19.5
2S/2W-04G03 340144117053601 7/10/96 1020 1,000 — 477 7.6 4.8 29.0 19.0
2S/2W-04G04 340137117053501 4/30/98 1430 1,550 — 417 7.6 3.4 29.0 21.5
2S/2W-04J02 340135117051601 7/10/96 0900 2,000 — 455 7.7 5.2 30.0 19.0
2S/2W-04R01 340120117051301 7/9/96 1430 300 — 717 7.4 1.6 34.5 19.5
2S/2W-10B02 340106117045001 7/11/96 0930 750 — 510 7.8 7.0 28.5 21.0
2S/2W-11A01 340105117031601 7/15/97 1450 725 — 496 7.8 6.6 — 21.5
2S/2W-11D01 340057117040601 7/15/97 1000 700 — 462 7.8 8.8 — 21.0
2S/2W-14C01 340014117034301 7/17/97 1000 250 — 522 7.6 8.8 — 21.5
2S/2W-14R03 335924117031701 7/17/97 0915 775 — 297 9.3 1.9 — 24.5
2S/2W-24L01 335848117024301 7/16/97 0925 2,100 — 346 7.9 5.4 — 23.0
2S/2W-28C021 335829117055201 7/28/97 1620 — — 942 7.6 .0 29.5 24.0
Table 3
See footnote at end of table. 39

40 Table 3. Chemical and isotopic analyses of water from selected wells in the Yucaipa area, southern California—Continued
Surface-Water and G
round-Water Q
uality in the Yucaipa Area, San B
ernardino and Riverside Counties, California, 1996–98
Calcium, Magnesium, Sodium, Potassium, Alkalinity, Sulfate, Chloride, Fluoride, Bromide, Iodide, State well number dissolved dissolved dissolved dissolved field dissolved dissolved dissolved dissolved dissolved
(mg/L) (mg/L) (mg/L) (mg/L) (mg/L as CaCO3) (mg/L) (mg/L) (mg/L) (mg/L) (mg/L)
1S/1W-19G01 78 18 42 1 190 86 34 0.8 0.10 0.001
1S/1W-27L01 67 22 14 2 220 69 9.7 .7 .04 .001
1S/1W-32C01 53 16 16 2 170 39 11 .5 .05 .001
1S/2W-24C02 69 15 42 1 220 57 18 .8 .07 .001
1S/2W-25A01 57 11 45 1 200 31 30 .8 .17 .001
1S/2W-25R04(B) 59 12 25 2 190 28 6.9 .6 .04 <.001
-25R04 55 12 23 2 200 27 6.4 .6 .04 <.001
-25R04 61 13 25 2 180 29 7.3 .6 .04 <.001
-25R04 63 13 28 2 190 29 7.9 .6 .04 <.001
-25R04 63 13 23 2 140 29 8.0 .6 .04 <.001
-25R04 61 14 21 2 170 27 7.0 .6 .04 .001
-25R04(B) 61 12 24 2 — 24 6.3 .6 .04 .001
1S/2W-34N01 95 23 40 2 210 60 32 .5 .13 .002
1S/2W-36G01 53 12 24 2 190 32 7.3 .5 .05 .001
2S/1W-08F01 62 19 33 .6 230 29 28 .6 .13 .002
2S/1W-15F02 34 20 25 5 190 16 18 .4 .09 .015
2S/2W-01J011 34 1.0 200 1 170 260 36 6.0 .12 .019
2S/2W-02M01 68 12 28 2 200 31 19 .7 .09 .001
-02M01 70 13 25 3 190 29 17 .5 .07 .001
2S/2W-03E01 98 22 21 2 220 68 17 .5 .14 .001
2S/2W-03L01 63 13 21 2 160 30 17 .5 .07 .001
2S/2W-04G03 58 12 22 2 180 31 12 .6 .06 .001
2S/2W-04G04 50 8.5 27 2 160 27 7.9 .6 .04 .002
2S/2W-04J02 61 12 17 2 170 29 7.8 .5 .04 .001
2S/2W-04R01 94 22 23 2 240 74 15 .5 .09 .001
2S/2W-10B02 55 8.7 41 3 160 — — — — —
2S/2W-11A01 46 8.0 44 2 160 39 18 .9 .08 .002
2S/2W-11D01 46 6.8 39 2 160 36 16 .6 .08 .001
2S/2W-14C01 51 14 33 1 200 13 26 .9 .13 .001
2S/2W-14R03 5.8 .9 58 .6 100 15 14 .5 .07 .003
2S/2W-24L01 28 3.5 39 2 140 14 11 .5 .07 .001
2S/2W-28C021 59 17 120 1 380 32 65 1.0 .38 .063
See footnote at end of table.

AAAHHH HHH HHH
Table 3. Chemical and isotopic analyses of water from selected wells in the Yucaipa area, southern California—Continued
State well number Silica,
dissolved (mg/L)
Residue at 180AC (mg/L)
Nitrite, dissolved
(mg/L as N)
NO2 + NO3, dissolved
(mg/L as N)
Ammonia, dissolved
(mg/L as N)
Ammonia + organic,
(mg/L as N
Phosphorus, dissolved
(mg/L as P)
Phosphorus ortho,
dissolved (mg/L as P)
Arsenic, dissolved
(Hg/L)
Barium, dissolved
(Hg/L)
Boron, dissolved
(Hg/L)
1S/1W-19G01 23 485 0.09 13 0.14 0.2 <0.01 0.02 <1 45 70
1S/1W-27L01 20 358 <.01 2.0 .03 <.2 <.01 <.01 <1 12 20
1S/1W-32C01 21 298 .02 5.3 .02 <.2 <.01 .01 <1 16 20
1S/2W-24C02 25 412 <.01 5.6 <.02 <.2 <.01 .02 <1 27 70
1S/2W-25A01 25 359 <.01 4.7 <.02 <.2 .01 .02 <1 19 60
1S/2W-25R04(B) 28 295 <.01 2.0 .03 <.1 <.01 .02 3 17 30
-25R04 28 283 <.01 1.9 .03 <.1 <.01 .02 3 16 40
-25R04 28 305 <.01 2.2 .03 <.1 <.01 .02 3 17 40
-25R04 28 317 <.01 1.9 .02 <.1 <.01 .02 2 18 40
-25R04 28 315 <.01 1.4 .03 <.1 <.01 .02 3 18 50
-25R04 28 303 <.01 1.0 .03 <.1 <.01 .02 3 19 40
-25R04(B) 26 290 .01 2.0 .06 <.1 <.01 <.01 3 16 30
1S/2W-34N01 25 512 <.01 24 .02 <.2 .01 .03 <1 58 30
1S/2W-36G01 26 293 <.01 2.1 <.02 <.2 <.01 .01 <1 15 20
2S/1W-08F01 24 369 <.01 4.2 <.02 <.2 .03 .03 <1 28 20
2S/1W-15F02 17 258 <.01 .06 <.02 <.2 <.01 <.01 <1 24 20
2S/2W-01J011 16 712 .05 5.3 .08 <.1 <.01 .02 <1 8 330
2S/2W-02M01 23 363 <.01 7.9 <.02 <.2 <.01 .01 <1 21 20
-02M01 25 354 <.01 7.8 .03 <.1 <.01 .02 <1 21 20
2S/2W-03E01 24 487 <.01 16 .03 <.2 <.01 .02 <1 27 20
2S/2W-03L01 26 314 <.01 6.7 .03 .2 <.01 .02 <1 15 20
2S/2W-04G03 24 287 <.01 1.6 .03 <.2 .03 .02 <1 23 20
2S/2W-04G04 23 260 .01 1.3 .05 <.1 <.01 .02 <1 17 30
2S/2W-04J02 25 281 <.01 2.6 .03 <.2 <.01 .02 <1 18 20
2S/2W-04R01 25 472 .01 9.6 .03 <.2 .02 .03 <1 29 20
2S/2W-10B02 — — <.01 4.9 .02 <.2 <.01 .01 <1 26 —
2S/2W-11A01 24 318 <.01 5.8 <.02 <.2 .02 .02 <1 24 30
2S/2W-11D01 22 294 <.01 3.9 <.02 <.2 .03 .02 <1 19 20
2S/2W-14C01 26 318 <.01 4.2 <.02 <.2 .03 .03 <1 32 20
2S/2W-14R03 15 186 <.01 1.9 <.02 <.2 <.01 .02 5 5 20
2S/2W-24L01 17 213 <.01 2.0 <.02 <.2 <.01 .01 <1 22 20
2S/2W-28C021 22 563 .02 <.05 .44 .3 .01 .13 <1 130 50
Table 3 See footnote at end of table.
41
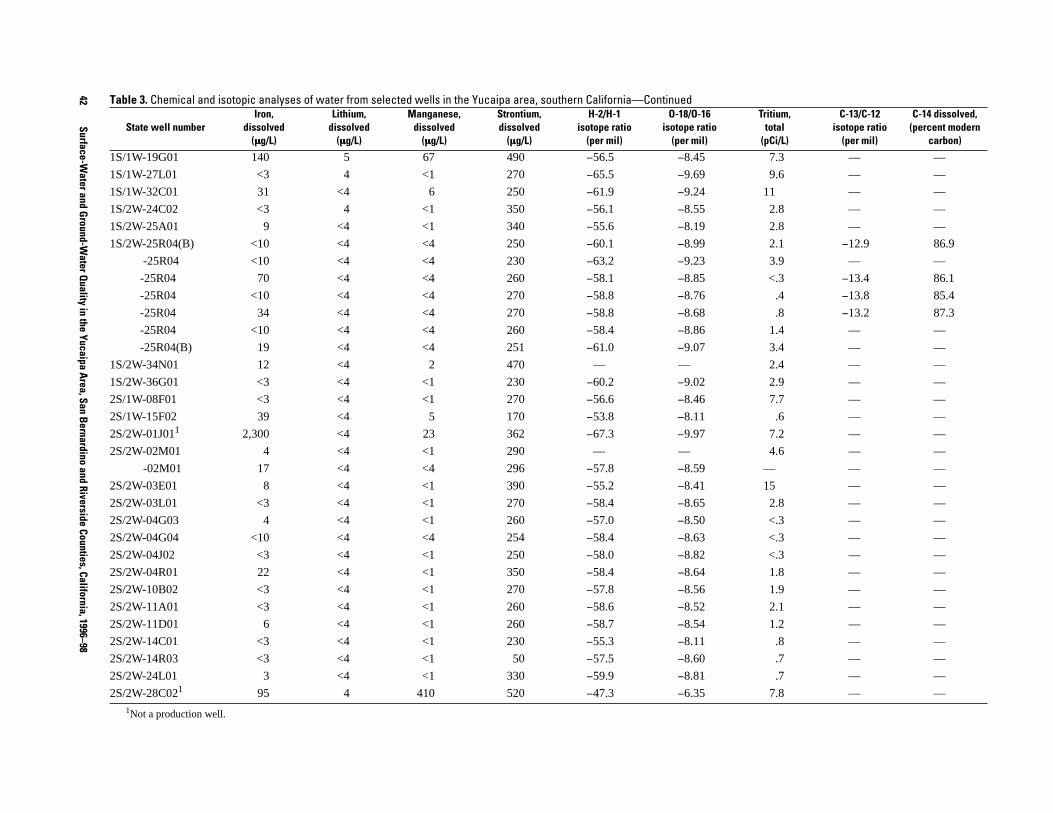
HHH HHH HHH HHH
42 Table 3. Chemical and isotopic analyses of water from selected wells in the Yucaipa area, southern California—Continued Iron, Lithium, Manganese, Strontium, H-2/H-1 O-18/O-16 Tritium, C-13/C-12 C-14 dissolved,
State well number dissolved dissolved dissolved dissolved isotope ratio isotope ratio total isotope ratio (percent modern (Hg/L) (Hg/L) (Hg/L) (Hg/L) (per mil) (per mil) (pCi/L) (per mil) carbon)
1S/1W-19G01 140 5 67 490 −56.5 −8.45 7.3 — —
1S/1W-27L01 <3 4 <1 270 −65.5 −9.69 9.6 — —
1S/1W-32C01 31 <4 6 250 −61.9 −9.24 11 — —
1S/2W-24C02 <3 4 <1 350 −56.1 −8.55 2.8 — —
1S/2W-25A01 9 <4 <1 340 −55.6 −8.19 2.8 — —
1S/2W-25R04(B) <10 <4 <4 250 −60.1 −8.99 2.1 −12.9 86.9
-25R04 <10 <4 <4 230 −63.2 −9.23 3.9 — —
-25R04 70 <4 <4 260 −58.1 −8.85 <.3 −13.4 86.1
-25R04 <10 <4 <4 270 −58.8 −8.76 .4 −13.8 85.4
-25R04 34 <4 <4 270 −58.8 −8.68 .8 −13.2 87.3
-25R04 <10 <4 <4 260 −58.4 −8.86 1.4 — —
-25R04(B) 19 <4 <4 251 −61.0 −9.07 3.4 — —
1S/2W-34N01 12 <4 2 470 — — 2.4 — —
1S/2W-36G01 <3 <4 <1 230 −60.2 −9.02 2.9 — —
2S/1W-08F01 <3 <4 <1 270 −56.6 −8.46 7.7 — —
2S/1W-15F02 39 <4 5 170 −53.8 −8.11 .6 — —
2S/2W-01J011 2,300 <4 23 362 −67.3 −9.97 7.2 — —
2S/2W-02M01 4 <4 <1 290 — — 4.6 — —
-02M01 17 <4 <4 296 −57.8 −8.59 — — —
2S/2W-03E01 8 <4 <1 390 −55.2 −8.41 15 — —
2S/2W-03L01 <3 <4 <1 270 −58.4 −8.65 2.8 — —
2S/2W-04G03 4 <4 <1 260 −57.0 −8.50 <.3 — —
2S/2W-04G04 <10 <4 <4 254 −58.4 −8.63 <.3 — —
2S/2W-04J02 <3 <4 <1 250 −58.0 −8.82 <.3 — —
2S/2W-04R01 22 <4 <1 350 −58.4 −8.64 1.8 — —
2S/2W-10B02 <3 <4 <1 270 −57.8 −8.56 1.9 — —
2S/2W-11A01 <3 <4 <1 260 −58.6 −8.52 2.1 — —
2S/2W-11D01 6 <4 <1 260 −58.7 −8.54 1.2 — —
2S/2W-14C01 <3 <4 <1 230 −55.3 −8.11 .8 — —
2S/2W-14R03 <3 <4 <1 50 −57.5 −8.60 .7 — —
2S/2W-24L01 3 <4 <1 330 −59.9 −8.81 .7 — —
2S/2W-28C021 95 4 410 520 −47.3 −6.35 7.8 — —
Surface-Water and G
round-Water Q
uality in the Yucaipa Area, San B
ernardino and Riverside Counties, California, 1996–98
1Not a production well.