Water quality technical report for Namoi surface water area ...
96
THE BASIN PLAN Water quality technical report for the Namoi surface water resource plan area (SW14) NSW Department of Planning, Industry and Environment | dpie.nsw.gov.au
-
Upload
khangminh22 -
Category
Documents
-
view
0 -
download
0
Transcript of Water quality technical report for Namoi surface water area ...

THE BASIN PLAN
Water quality technical report for the Namoi surface water resource plan area (SW14)
NSW Department of Planning, Industry and Environment | dpie.nsw.gov.au

Published by NSW Department of Planning, Industry and Environment
dpie.nsw.gov.au
Title: Water quality technical report for the Namoi surface water resource plan area (SW14)
First published: February 2020
Department reference number: INT18/109352
Acknowledgments
The soils maps in this report contain data sourced from the NSW Office of Environment and Heritage.
© State of New South Wales through Department of Planning, Industry and Environment [2020]. You may copy, distribute, display, download and otherwise freely
deal with this publication for any purpose, provided that you attribute the Department of Planning, Industry and Environment as the owner. However, you must obtain
permission if you wish to charge others for access to the publication (other than at cost); include the publication in advertising or a product for sale; modify the
publication; or republish the publication on a website. You may freely link to the publication on a departmental website.
Disclaimer: The information contained in this publication is based on knowledge and understanding at the time of writing (October 2018) and may not be accurate,
current or complete. The State of New South Wales (including the NSW Department of Planning, Industry and Environment), the author and the publisher take no responsibility, and will accept no liability, for the accuracy, currency, reliability or correctness of any information included in the document (including material provided by third parties). Readers should make their own inquiries and rely on their own advice when making decisions related to mate rial contained in this publication.

Water quality technical report for the Namoi surface water resource plan area (SW14)
Summary Good quality water protects public health, supports economic production and maintains a healthy river ecosystem. Water quality is mostly determined by land use, geology, climate, riparian vegetation and stream flow, and reflects the interactions of natural and man-made practices that occur in a drainage area and the riparian zone.
Degradation of water quality can put stress on a range of aquatic organisms, impinge on Aboriginal cultural and spiritual uses of water, increase the cost of drinking water treatment, contribute to public health risks and decreases the suitability of water for irrigation and agriculture.
Alteration of the Australian landscape since European settlement has resulted in marked changes in catchment conditions. Runoff from cropping areas, erosion of soil and nutrients from stream banks and discharge from saline areas have led to increased turbidity, salinity, sedimentation, nutrient loads and chemical residues. These in turn can degrade aquatic ecosystem health. The regulation of rivers through the construction of large storages and weirs lead to changes to flow regimes, thermal pollution, harmful algal blooms and disruption of longitudinal connectivity of river processes.
Water quality condition in the Namoi water resource planning area (WRPA) varies from poor to excellent. Water quality issues occurring within the catchment are the result of a combination of factors. These include alteration to natural flow regimes, changes to catchment conditions and land use change. Table 1 summarises the major water quality issues in the Namoi WRPA.
Table 1: Summary of major issues and causes of water quality degradation
Issue Location Potential causes
Harmful algal
blooms
uplands,
midlands,
lowlands
Stratification and warm water temperatures in Chaffey Dam. Less frequent blooms in
Keepit and Split Rock Dams and Yarrie Lake. Blooms during low flows in the Namoi
River at Walgett. High nutrient inputs.
Dissolved
oxygen and pH
outside of
normal ranges
uplands,
midlands,
lowlands
Reduced flow and increased low flow and cease to flow periods disrupting dissolved
oxygen dynamics and increasing eutrophication.
Increased
nutrients and
turbidity
uplands,
midlands,
lowlands
Stream bank and riparian condition, grazing and cropping practices, carp and feral
species. In the midlands and lowlands, increased sediment and nutrient input
associated with erosion.
Toxicants and
pesticides
midlands,
lowlands
Pesticide use in cropping areas, toxicants from mining activities.
Disruption to
organic carbon
cycling
midlands,
lowlands
Reduced freshes and high flows, disruption of longitudinal connectivity by Chaffey,
Split Rock and Keepit Dams.
Thermal
pollution
midlands Cold water released from Keepit Dam in summer. Localised impacts from Chaffey and
Split Rock Dams. Greater impact downstream of Split Rock Dam during bulk water
transfers. Warm water releases in winter.
NSW Department of Planning, Industry and Environment | INT18/109352 | i

Water quality technical report for the Namoi surface water resource plan area (SW14)
Contents Summary ......................................................................................................................................................i
Contents ...................................................................................................................................................... ii
List of tables................................................................................................................................................ iv
List of figures............................................................................................................................................... iv
1. Introduction ...........................................................................................................................................1
1.1. Purpose..........................................................................................................................................1
1.2. Context...........................................................................................................................................2
1.3. Catchment description ....................................................................................................................3
1.4. Water quality targets .......................................................................................................................4
1.4.1. Assessment using Basin Plan water quality targets ...................................................................5
1.4.2. Water quality targets for water-dependent ecosystems ..............................................................5
1.4.3. Water quality targets for raw water for treatment for human consumption ...................................6
1.4.4. Water quality targets for irrigation water ....................................................................................6
1.4.5. Water quality targets for recreational water ...............................................................................7
1.4.6. Salinity targets for long-term salinity planning and management.................................................7
2. Water quality parameters .......................................................................................................................8
2.1. Turbidity and suspended sediment ..................................................................................................8
2.2. Nutrients.........................................................................................................................................9
2.3. Dissolved oxygen............................................................................................................................9
2.4. pH................................................................................................................................................10
2.5. Water temperature and thermal pollution .......................................................................................11
2.6. Salinity .........................................................................................................................................11
2.7. Harmful algal blooms ....................................................................................................................12
2.8. Toxicants......................................................................................................................................13
2.9. Pathogens ....................................................................................................................................14
3. Water access rules and flow management in the Namoi WRPA.............................................................14
4. Methods ..............................................................................................................................................17
4.1. Site selection and monitoring.........................................................................................................17
4.2. Water quality index (WaQI) ...........................................................................................................19
4.3. Catchment stressor identification ...................................................................................................19
4.3.1. Conceptual mapping ..............................................................................................................20
4.3.2. Literature review ....................................................................................................................20
4.3.3. Summary statistics.................................................................................................................20
4.3.4. Data analysis .........................................................................................................................20
4.3.5. Spatial and GIS......................................................................................................................21
4.3.6. Local and expert knowledge ...................................................................................................21
NSW Department of Planning, Industry and Environment | INT18/109352 | ii

Water quality technical report for the Namoi surface water resource plan area (SW14)
4.4. Namoi WRPA Risk Assessment ....................................................................................................21
5. Results................................................................................................................................................22
5.1. Water quality index (WaQI) ...........................................................................................................22
5.1.1. Water-dependent ecosystems ................................................................................................22
5.1.2. Dissolved oxygen ...................................................................................................................23
5.1.3. Water temperature .................................................................................................................24
5.1.4. Irrigation ................................................................................................................................28
5.1.5. Recreation .............................................................................................................................28
5.2. Literature review ...........................................................................................................................29
5.3. Summary statistics........................................................................................................................30
5.3.1. Total annual flow....................................................................................................................33
5.4. Local and expert knowledge ..........................................................................................................33
5.5. Risk assessment...........................................................................................................................34
6. Discussion...........................................................................................................................................35
6.1. Elevated levels of salinity ..............................................................................................................36
6.2. Elevated levels of suspended matter..............................................................................................37
6.3. Elevated levels of nutrients............................................................................................................38
6.4. Elevated levels of cyanobacteria....................................................................................................41
6.5. Water temperature outside natural ranges .....................................................................................41
6.6. Dissolved oxygen outside natural ranges .......................................................................................42
6.7. Elevated levels of pesticides and other contaminants .....................................................................43
6.8. pH outside natural ranges .............................................................................................................43
6.9. Elevated pathogen counts .............................................................................................................44
6.10. Knowledge gaps........................................................................................................................44
7. Conclusion ..........................................................................................................................................46
References ................................................................................................................................................47
Appendix A. Water quality monitoring site locations .....................................................................................53
Appendix B. Water quality index (WaQI) method..........................................................................................55
Appendix C. Literature Review ....................................................................................................................57
Appendix D. Water quality summary statistics..............................................................................................61
Appendix E. Draftsman plots and Box plots by site ......................................................................................66
Macdonald River at Woolbrook ................................................................................................................67
Namoi River at Manilla Railway Bridge.....................................................................................................69
Cockburn River at Mulla Crossing............................................................................................................71
Peel River at Paradise Weir.....................................................................................................................73
Peel River at Carroll Gap.........................................................................................................................75
Mooki River at Breeza.............................................................................................................................77
NSW Department of Planning, Industry and Environment | INT18/109352 | iii

Water quality technical report for the Namoi surface water resource plan area (SW14)
Coxs Creek at Boggabri ..........................................................................................................................79
Namoi River at Gunnedah .......................................................................................................................81
Narrabri Creek at Narrabri .......................................................................................................................83
Namoi River at Bugilbone........................................................................................................................85
Namoi River at Goangra..........................................................................................................................87
List of tables Table 1: Summary of major issues and causes of water quality degradation ....................................................i
Table 2: Water quality processes ..................................................................................................................3
Table 3: Water quality targets for water dependent ecosystems objective for all aquatic ecosystems ...............5
Table 4: Salinity targets for irrigation water ....................................................................................................6
Table 5: Blue-green algae targets for recreational water.................................................................................7
Table 6: Salinity targets for purposes of long term salinity planning in the Namoi WRPA .................................7
Table 7: List of routine water quality monitoring stations in the Namoi WRPA................................................17
Table 8: List of continuous electrical conductivity monitoring stations in the Namoi WRPA.............................17
Table 9: List of continuous water temperature monitoring stations in the Namoi WRPA .................................18
Table 10: Water quality index scores for the Namoi WRPA 2010-2015 water quality data..............................22
Table 11: Water quality index scores for the Namoi WRPA 2007-2013 blue-green algal data ........................28
Table 12: Sites with high and medium risk to the health of water dependent ecosystems from turbidity ..........34
Table 13: Sites with high and medium risk to the health of water dependent ecosystems from total phosphorus
..................................................................................................................................................................34
Table 14: Sites with high and medium risk to the health of water dependent ecosystems from total nitrogen ..35
Table 15: Sites with high and medium risk to the health of water dependent ecosystems from pH .................35
Table 16: Sites with high and medium risk to the health of water dependent ecosystems from dissolved oxygen
..................................................................................................................................................................35
Table 18: Location of water quality monitoring stations in the Namoi WRPA..................................................53
Table 19: Review of published literature ......................................................................................................57
Table 20: Water quality summary statistics for the Namoi WRPA 2007-2015 water quality data.....................61
Table 21: Namoi River at Goangra electrical conductivity for purposes of long term salinity planning in the
Namoi WRPA.............................................................................................................................................65
Table 22: Comparison of annual salt loads in the Namoi WRPA ...................................................................65
List of figures Figure 1: Flow diagram illustrating the components of the Namoi surface water resource plan .........................2
Figure 2: Water quality zones and water quality monitoring sites for the Namoi WRPA ....................................4
NSW Department of Planning, Industry and Environment | INT18/109352 | iv
Water quality technical report for the Namoi surface water resource plan area (SW14)
Figure 3: Continuous water temperature monitoring sites in the Namoi WRPA ..............................................19
Figure 4: Conceptual diagram of the CSI process ........................................................................................20
Figure 5: Namoi WRPA water quality index scores.......................................................................................23
Figure 6: Routine dissolved oxygen (% saturation) (red square) and mean daily flow (ML/day) (blue line) at
selected sites in the Namoi WRPA ..............................................................................................................24
Figure 7: Minimum daily water temperature in the Peel River against mean daily flow downstream of Chaffey
Dam from 2009 to 2016 ..............................................................................................................................25
Figure 8: Water temperature downstream of Split Rock Dam compared to estimated 20th and 80th percentile
of natural temperature ................................................................................................................................26
Figure 9: Minimum daily water temperature in the Manilla River against mean daily flow downstream of Split
Rock Dam ..................................................................................................................................................26
Figure 10: Assessment of Namoi River downstream of Keepit Dam water temperature against MDBA target
“reference site” data from 2010 to 2016 .......................................................................................................27
Figure 11: Minimum daily water temperature in the Namoi River against mean daily flow downstream of Keepit
Dam from 2010 to 2016 ..............................................................................................................................27
Figure 12: Mean daily electrical conductivity (µS/cm) in Narrabri Creek at Narrabri from 2005 to 2015 ...........28
Figure 13: Harmful algal blooms in Chaffey Dam (Station 1) from 2007 to 2013 ............................................29
Figure 14: Water quality data for water quality parameters by site ................................................................32
Figure 15: Annual flow (ML/year) at selected gauging stations......................................................................33
Figure 16: River styles recovery potential in the Namoi catchment................................................................38
Figure 17: Soil total nitrogen for the Namoi catchment .................................................................................40
Figure 18: Soil total phosphorus for the Namoi catchment ............................................................................40
Figure 19: Soil pH for the Namoi catchment.................................................................................................44
Figure 20: Draftsman plots for Macdonald River at Woolbrook......................................................................67
Figure 21: Water quality data for Macdonald River at Woolbrook ..................................................................68
Figure 22: Draftsman plots for Namoi River at Manilla Railway Bridge ..........................................................69
Figure 23: Water quality data for Namoi River at Manilla Railway Bridge.......................................................70
Figure 24: Draftsman plots for Cockburn River at Mulla Crossing .................................................................71
Figure 25: Water quality data for Cockburn River at Mulla Crossing ..............................................................72
Figure 26: Draftsman plots for Peel River at Paradise Weir ..........................................................................73
Figure 27: Water quality data for Peel River at Paradise Weir.......................................................................74
Figure 28: Draftsman plots for Peel River at Carroll Gap ..............................................................................75
Figure 29: Water quality data for Peel River at Carroll Gap...........................................................................76
Figure 30: Draftsman plots for Mooki River at Breeza...................................................................................77
Figure 31: Water quality data for Mooki River at Breeza ...............................................................................78
Figure 32: Draftsman plots for Coxs Creek at Boggabri ................................................................................79
Figure 33: Water quality data for Coxs Creek at Boggabri ............................................................................80
Figure 34: Draftsman plots for Namoi River at Gunnedah.............................................................................81
NSW Department of Planning, Industry and Environment | INT18/109352 | v

35
36
37
38
39
40
41
82
83
84
85
86
87
88
Water quality technical report for the Namoi surface water resource plan area (SW14)
Figure : Water quality data for Namoi River at Gunnedah .........................................................................
Figure : Draftsman plots for Narrabri Creek at Narrabri.............................................................................
Figure : Water quality data for Narrabri Creek at Narrabri .........................................................................
Figure : Draftsman plots for Namoi River at Bugilbone .............................................................................
Figure : Water quality data for Namoi River at Bugilbone ..........................................................................
Figure : Draftsman plots for Namoi River at Goangra ...............................................................................
Figure : Water quality data for Namoi River at Goangra............................................................................
NSW Department of Planning, Industry and Environment | INT18/109352 | vi

Water quality technical report for the Namoi surface water resource plan area (SW14)
1. Introduction
1.1. Purpose The Murray Darling Basin Plan (2012) is an instrument of the Commonwealth Water Act (2007). It provides the framework for long term integrated management of water resources of the Murray Darling Basin. The Basin Plan requires that water quality management plans (WQMP) are developed for all water resource areas in the Basin. Each WQMP will:
Establish water quality objectives and targets for freshwater dependent ecosystems, irrigation water and recreational purposes;
Identify key causes of water quality degradation;
Assess risks arising from water quality degradation, and
Identify measures that contribute to achieving water quality objectives.
This report provides an overview of the water quality condition of the Namoi water resource plan area (WRPA) by comparing data to the Basin Plan water quality targets (Basin Plan 2012, Schedule 11). The Basin Plan water quality targets set out the appropriate water quality required for environmental, social, cultural and economic benefits in the Murray Darling Basin. Monitoring progress towards achieving the targets will identify trends and inform actions to address the causes of water quality decline. These targets have been used to assess existing water quality data, and to identify areas of risk to aquatic ecosystems, and recreational and irrigation use.
The report also outlines the factors influencing water quality in the region, specifically the likely causes of water quality degradation issues, as required by Chapter 10, Section 10.30 of the Basin Plan.
BASIN PLAN 10.30 Water quality management plan to identify key causes of water quality degradation. The water quality management plan must identify the causes or likely causes, of water quality degradation in the water resource plan area having regard to the key causes of water quality degradation identified in Part 2 of Chapter 9 and set out in Schedule 10.
The information in this report supports the development of the Namoi WQMP. It provides the background and technical information to develop water, land and vegetation management measures to maintain or improve water quality in the Namoi WRPA. Figure 1 is a flow diagram illustrating how this report supports other components of the surface water resource planning process.
NSW Department of Planning, Industry and Environment | INT18/109352 | 1

Water quality technical report for the Namoi surface water resource plan area (SW14)
Water Resource Plan
Land and
Vegetation
Management
Develop,
implement and
evaluate best
practice land
and vegetation
management
practices to
increase
productivity
and
sustainability
of riverine
landscapes
Long Term
Watering Plan
Primary
mechanism
outlining
watering
requirements
for key
environmental
assets.
Guides the
use of
environmental
water over a
20 year period
Resource DescriptionDescription of water resource plan area to provide an understanding of the region and its resources
Risk assessmentIdentifies risks of not achieving Basin Plan
environmental, social and economic outcomes
and proposes strategies for mitigation
Status and issues paperSummarises the current condition of water
resources and issues to consider when
developing the Water Resource Plan
Salinity Technical
ReportTechnical information and analysis
to develop water and land
management measures that
protect or improve salinity.
Water Quality Technical
ReportTechnical information and analysis
to develop water and land
management measures that
protect or improve water quality
Water Quality Management PlanProvides a framework to protect, improve and
restore water quality and salinity that is fit for
purpose
Water Sharing PlanDescribes water rights, compliance with
sustainable diversion limits, water quality
management, environmental watering, and
risks to water resources meeting critical human
needs
Incident Response GuideDescribes how water resources will be managed
during an extreme event
Monitoring Evaluation and Reporting PlanMonitoring the effectiveness of measures for the purpose of adaptive management and reports progress
against requirements of Schedule 12 of the Basin Plan
Issues
Assessment
Report
Figure 1: Flow diagram illustrating the components of the Namoi surface water resource plan
1.2. Context Water quality can be defined in terms of the physical, chemical and biological content of water and in terms of purpose and use. Water quality may be fit for one purpose, but not another. For example, water may be of good quality to irrigate crops, but may not support a healthy population of fish.
This report refers to water quality degradation or poor water quality as:
Elevated levels of nutrients, turbidity, blue-green algae, salinity, toxicants or pathogens, and
Water temperature, pH and dissolved oxygen outside of certain ranges.
Water quality is dynamic. The physical, chemical and biological content of water varies with time and location. Table 2 shows how water quality can be defined in three related, but slightly different ways.
NSW Department of Planning, Industry and Environment | INT18/109352 | 2

Water quality technical report for the Namoi surface water resource plan area (SW14)
Table 2: Water quality processes
Long term water quality Poor water quality event Ecosystem processes
This describes long-term average
trends over a period of months to
years. In this report the water
quality parameters used are from
monthly measurements at a
selection of locations.
Major trends are reported in five
year periods. Indicator targets are
listed in Tables 3 to 6.
These refer to occurrences of
water quality issues for set
periods of time that are generally
not ongoing.
Examples may include a
potentially toxic algal bloom or
anoxic blackwater (low-oxygen)
event. While the occurrence of
these events may be short lived,
their effects can be long-term.
Water quality parameters are bound
up in fundamental ecological
functions of rivers and catchments.
These are less easy to define as
‘good’ or ‘bad’, and often involve complex interrelationships.
Examples may include the movement
of organic carbon from floodplains to
rivers to support productivity, or the
delivery of sediment from upstream
to downstream.
1.3. Catchment description The Namoi River catchment is located in north-west New South Wales and covers approximately 42 000 km2. The Namoi River is some 700 km in length and rises in the rugged terrain of the Great Dividing Range, meandering westward onto the riverine plain to join the Barwon River at Walgett. The Namoi catchment borders the Gwydir and Castlereagh catchments and is bounded by the Great Divide in the east, the Liverpool and Warrumbungle Ranges in the south, and Mount Kaputar and the Nandewar Ranges in the North.
A number of major tributaries flow into the Namoi River. The Macdonald and Peel Rivers are in the eastern catchment area. Chaffey Dam is located in the upper sections of the Peel River. The Manilla River lies in the north-east of the catchment and flows into Split Rock Dam. Keepit Dam is the largest storage of the region and is located on the Namoi River upstream of the junction with the Peel River. The Mooki River and Coxs Creek join the Namoi River mid catchment at Gunnedah and Boggabri respectively. Smaller tributaries, anabranches and effluent channels characterise the lower catchment.
Flows in the Namoi River are heavily regulated by large dams and several in-stream regulatory structures, with significant allocation of water for irrigation. There are three weirs situated on the Namoi River downstream of Narrabri. Mollee Weir is designed to hold and re-regulate flows to improve the precision with which water can be supplied to the lower valley. Gunidgera Weir is located at Wee Waa and also assists with re-regulation. Its main function is to pass regulated flows into Gunidgera and Pian Creeks. There are also a number of small weirs on Pian Creek (Hazeldean, Greylands and Dundee Weirs) and Gunidgera Creek (Knights Weir) which re-regulate flows within these watercourses for local water users.
There are no wetlands in the Namoi catchment listed as wetlands of international importance under the Ramsar Convention. Namoi catchment does not contain extensive wetland complexes, however a feature of the lower Namoi floodplain, downstream of Narrabri, are many small lagoons, wetlands, and anabranches, as well as extensive areas of floodplain woodlands and high level flood runners. Lake Goran, a large (60 km2) semi-permanent internal drainage basin south of Gunnedah, provides habitat for large numbers of waterbirds, and has been listed as a wetland of national significance (DEWHA 2008).
Land use in the Namoi WRPA is largely grazing in the upper catchment with increased cultivation with distance down the catchment. Irrigated agriculture is mostly located in close proximity to, and downstream of Gunnedah. A detailed description of climate, land and water usage and water regulation infrastructures can be found in the Namoi resource description report (DoIW 2018a).
NSW Department of Planning, Industry and Environment | INT18/109352 | 3

Water quality technical report for the Namoi surface water resource plan area (SW14)
1.4. Water quality targets The Basin Plan water quality targets set out the appropriate water quality required for environmental, social, cultural and economic benefits in the Murray Darling Basin. Monitoring progress towards achieving the targets will identify trends and inform actions that address the causes of water quality decline. The Basin Plan identifies water quality “target application zones” approximating lowland, upland and montane areas of the major river valleys. Lowland areas have an altitude of less than 200 m, upland areas fall between 200 and 700 m and montane areas have an altitude greater than 700 m. The boundaries of these zones are shown in Figure 2.
Two water-dependent ecosystems are described in the Basin Plan; Declared Ramsar wetlands (streams and rivers; lakes and wetlands) and Other water-dependent ecosystems (streams, rivers, lakes and wetlands). The assessment of water quality targets in this report is focused on Other water-dependent ecosystems, as there are currently no Ramsar listed wetlands in the Namoi WRPA.
The Basin Plan water-dependent ecosystem targets for turbidity, total phosphorus, total nitrogen, dissolved oxygen and pH were developed following the methods outlined in the ANZECC Guidelines (2000). Water quality data for rivers and streams in ‘reference’ condition from each of the water quality zones were used to develop the target values for each zone (Tiller and Newall 2010). In zones where there were no reference sites, the appropriate default trigger value from the ANZECC Guidelines (2000) for slightly to moderately disturbed systems was used as the Basin Plan water quality target (Tiller and Newall 2010).
Figure 2: Water quality zones and water quality monitoring sites for the Namoi WRPA
NSW Department of Planning, Industry and Environment | INT18/109352 | 4

Water quality technical report for the Namoi surface water resource plan area (SW14)
1.4.1.Assessment using Basin Plan water quality targets
The ANZECC Guidelines (2000) are currently under revision (Guideline Document 4: Australian and New Zealand Guidelines for Fresh and Marine Water Quality 2000) as part of the broader revision of the National Water Quality Management Strategy. It is anticipated that there will be no default trigger values in the revised guidelines for Basin States as it is expected that these states have developed regional water quality targets as part of other water planning processes. Basin States may choose to use the water quality targets of the Basin Plan in lieu of the default trigger values of the ANZECC Guidelines (2000) if local water quality guidelines are not available. Trigger values and management targets are conceptually different. A trigger value is a concentration below which there is a low risk of adverse effects and if exceeded indicates that some form of action should commence. Management targets are long term objectives used to assess whether an environmental value is being achieved or maintained.
An assessment of Basin Plan water quality targets in NSW (Mawhinney and Muschal 2015) identified targets in some zones and zone boundaries as being inappropriate. Perceived poor water quality at a monitoring site may be due to an inappropriate target, rather than excessive pollutants. In these cases, the Basin Plan targets should be revised in preference for location specific targets which consider local catchment conditions.
It is anticipated the revision of the National Water Quality Management Strategy will improve the advice about comparing results from individual monitoring sites against water quality targets, with more emphasis on catchment assessments and flow-dependant trigger values. The Basin Plan allows an alternate target to be specified in the WQMP under certain conditions. It is expected that the recommendation to develop specific targets will also be retained in the revised National Water Quality Management Strategy. There will be further discussion of water quality targets in the Namoi WQMP.
1.4.2.Water quality targets for water-dependent ecosystems
The targets for water dependent ecosystems are to ensure water quality is sufficient to:
Protect and restore ecosystems;
To protect and restore ecosystem functions;
Ensure ecosystems are resilient to climate change, and
Maintain the ecological character of wetlands.
Turbidity, total phosphorus and total nitrogen annual medians in the Namoi WRPA should be below the target values listed in Table 3. For dissolved oxygen and pH the annual median should fall within the stated range. The toxicants targets are taken from the ANZECC water quality guidelines (2000) using the values for the protection of 95% of species. The 95% protection of species trigger values applies to typical, slightly to moderately disturbed systems.
Table 3: Water quality targets for water dependent ecosystems objective for all aquatic ecosystems
Water Quality
Zone
Ecosystem
Type
Turbidity
(NTU)
Total
Phosphorus
(µg/L)
Total
Nitrogen
(µg/L)
Dissolved
oxygen
(mg/L; or
% saturation)
pH Salinity Temperature
Toxicants
(must not
exceed
values in
3.4.1 of the
ANZECC
guidelines)
Water dependent ecosystems (not including Ramsar sites)
C2 (Namoi
Valley Montane
zone)
Streams, rivers,
lakes and
wetlands
25 20 250 90-110% 6.5-7.5
Between the
20th and 80th
percentile of
natural monthly
water
temperature
The
protection of
95% of
species
B2 (Namoi
valley, upland
zone)
Streams, rivers,
lakes and
wetlands
30 80 750 60-110% 7.5–8.5
A2 (Namoi
Valley Lowland
zone)
Streams, rivers,
lakes and
wetlands
200 200 1000 >5.0 mg/L; or
65-110% 7.0–8.3
End of valley
targets for
salinity in
Appendix 1 of
NSW Department of Planning, Industry and Environment | INT18/109352 | 5

Water quality technical report for the Namoi surface water resource plan area (SW14)
Schedule B to
the agreement
Ramsar listed water dependent ecosystems
C2 (Namoi
Valley Montane
zone)
Streams and
rivers 25 20 250 90-110% 6.5-7.5
Between the
20th and 80th
percentile of
natural monthly
water
temperature
The
protection of
99% of
species
Lakes and
wetlands 20 10 350 90–110% 6.5–8.0
B2 (Namoi
valley, upland
zone)
Streams and
rivers 15 45 490 90-110% 7.5–8.5
Lakes and
wetlands 20 10 350 90–110% 6.5–8.0
A2 (Namoi
Valley Lowland
zone)
Streams and
rivers 75 130 890
>5.0 mg/L; or
65-110% 7.0–8.3
End of valley
targets for
salinity in
Appendix 1 of
Schedule B to
the agreement
Lakes and
wetlands 20 10 350 90-110% 6.5-8.0
1.4.3.Water quality targets for raw water for treatment for human consumption
The target is to minimise the risk that raw water taken to be treated for human consumption results in adverse human health effects. The quality of raw water for treatment should also maintain palatability and odour ratings. The Public Health Act 2010 and the Public Health Regulation (2012) require drinking water suppliers to develop and adhere to a Drinking Water Management System (DWMS). The DWMS addresses the elements of the Framework for Management of Drinking Water Quality (Australian Drinking Water Guidelines (NHMRC and NRMMC, 2011)) and is a requirement of water suppliers operating licence (NSW Ministry of Health 2013). Water providers in the Namoi WRPA include Gunnedah Shire Council, Liverpool Plains Shire Council, Narrabri Shire Council, Tamworth Regional Council and Walgett Shire Council.
1.4.4.Water quality targets for irrigation water
The aim of the agriculture and irrigation target is that the quality of surface water, when used in accordance with the best irrigation and crop management practices and principles of ecologically sustainable development, does not result in crop yield loss or soil degradation. The target is for the electrical conductivity 95th percentile of each 10 year period that ends at the end of the water accounting period, not exceed 957 µS/cm. The target in Table 4 applies at sites where water is extracted by an irrigation infrastructure operator for the purpose of irrigation. In NSW, irrigation infrastructure operators are defined as a separate third party that holds a water access entitlement and delivers water to shareholders. These include NSW Irrigation Corporations, Private Irrigation Districts and Private Water Trusts. As there are no irrigation infrastructure operators in the Namoi WRPA, electrical conductivity data has not been assess against this target. The development of the Sodium Adsorption Ratio (SAR) target is outside the scope of this document and will be determined in future reporting when data is available.
Table 4: Salinity targets for irrigation water
Water Quality Zones Ecosystem Type
Electrical
conductivity
(µS/cm)
Sodium
adsorption ratio
All Streams, rivers, lakes
and wetlands 957 undetermined
NSW Department of Planning, Industry and Environment | INT18/109352 | 6

Water quality technical report for the Namoi surface water resource plan area (SW14)
1.4.5.Water quality targets for recreational water
The primary aim of these targets is to protect the health of humans from threats posed by the recreational use of water. This includes a low level of risk to human health from water quality threats posed by exposure to blue-green algae (cyanobacteria) through ingestion, inhalation or contact during recreational use of water resources. The targets are based on Chapter 6 of the National Health and Medical Research Council Guidelines for Managing Risk in Recreational Water (NHMRC 2008). In addition, it is also a general target that cyanobacterial scums should not be consistently present. The recreational water targets are listed in Table 5.
Table 5: Blue-green algae targets for recreational water
Water Quality
Zone
Ecosystem
Type Guidelines
All Recreational
water bodies
10 µg/L total microcystins; or 50 000 cells/mL toxic Microcystis aeruginosa; or
biovolume equivalent of 4 mm3/L for the combined total of all cyanobacteria where
suitable for a known toxin producer is dominant in the total biovolume; or
primary contact. 10 mm3/L for total biovolume of all cyanobacterial material where known toxins are
not present; or
Cyanobacterial scums consistently present
1.4.6.Salinity targets for long-term salinity planning and management
Electrical conductivity targets have not been described for each water quality zone of the Murray Darling Basin. Instead, the Murray Darling Basin End-of-Valley salinity targets, as described in Schedule B, Appendix 1 of the Commonwealth Water Act (2007), have been incorporated into the water quality targets. The End-of-Valley targets for the Namoi WRPA are listed in Table 6. As for the irrigation water targets, the time series electrical conductivity data has been used to assess this target rather than monthly samples.
Table 6: Salinity targets for purposes of long term salinity planning in the Namoi WRPA
Water Quality
Zones
Ecosystem
Type
End of Valley Targets (as absolute values)
Salinity (EC µS/cm) Salt Load (t/yr)
Median (50%ile) Peak (80%ile) Mean
All Streams, rivers,
lakes and
wetlands
475 715 127 600
NSW Department of Planning, Industry and Environment | INT18/109352 | 7

Water quality technical report for the Namoi surface water resource plan area (SW14)
2. Water quality parameters This report focuses on assessment of water quality parameters listed in the Basin Plan. These parameters represent general water quality condition and are most likely to demonstrate change over time from broad scale implementation of natural resource management.
2.1. Turbidity and suspended sediment Turbidity is a measure of water clarity. As light passes through water it is scattered by suspended material; the higher the scattering of light, the higher the turbidity. For example, after rain, water in rivers may appear brown due to scattering of light from high levels of suspended soils. Turbidity and the amount of total suspended solids are closely related in the Namoi River catchment.
The amount of suspended sediment in water is generally related to the intensity of human activity in the catchment, such as land clearing, accelerated erosion from agricultural land, stream banks or channels and localised issues such as the dispersive nature of the soil and stock access. High turbidity is often associated with increased flow following storm events.
Increased turbidity can lead to reduction in light penetration and primary production. It can also lead to blooms of some harmful blue-green algae species as they are able to out compete other algal species for light in highly turbid conditions (Oliver et al. 2010). Increased suspended sediments can also have negative impacts on plants through smothering (Brookes 1986) and on fish, for example, by clogging gills (Bruton 1985). Suspended matter can also provide a mode of transport for pollutants, such as heavy metals, (Chapman et al. 1998), nutrients and pesticides (Mawhinney 1998) and bacteria (Wilkinson et al. 1995).
Turbidity should be measured immediately without altering the original sample conditions such as temperature and pH (APHA 1995). Field turbidity is more representative of instream conditions and should be used in preference to laboratory measurement (Buckland et al. 2008).
Declining stream morphology, gully
erosion, side wall cut and head migration
Elevated levels of
suspended matter
Poor soil conservation
practices
Volume and manner of water
release for storages
Wave wash from
boats
Inappropriate frequency timing and
location of cultivation
Overgrazing of catchments, grazing of
riverbank and floodplains
Carp
Rapid drawdown of
water
NSW Department of Planning, Industry and Environment | INT18/109352 | 8

Water quality technical report for the Namoi surface water resource plan area (SW14)
2.2. Nutrients Nutrients such as nitrogen and phosphorus are important for sustaining growth and productivity within rivers but at high concentrations can become an issue in freshwater ecosystems. In many circumstances the inputs of nutrients to rivers has increased due to human activities. This process is known as eutrophication (meaning well-nourished) (Smith et al. 1999).
Sources of nutrient contamination include discharge from sewage treatment works, farms and industry, and runoff from agricultural land and urban storm water (Smith et al. 2006). Nutrients can be dissolved, bound within sediments, or adsorbed onto suspended material (i.e. soil or organic matter). Increased nutrient concentration can cause issues including nuisance algal blooms (Anderson et al. 2002), dissolved oxygen depletion (Dodds 2006) or inversely supersaturated and toxic effects to aquatic organisms (e.g. ammonia) (Davis and Koop 2006). This document generally refers to total nitrogen or total phosphorus as a basic measure of all forms of these two elements.
Elevated levels of
nutrients
Fertilisers
Nutrients from water storages
Animal waste
Sewage and industrial discharge
Soil and organic matter
Atmospheric
deposition
2.3. Dissolved oxygen Dissolved oxygen in water is essential for supporting fish and aquatic animals. If oxygen levels rise too high or drop too low it places stress on animals and can be fatal (Boulton et al. 2014). Dissolved oxygen may be measured as either the concentration of oxygen in water (mg/L), or as a percentage of the maximum amount of oxygen that may dissolve in water (% saturation). Dissolved oxygen concentrations vary throughout the day and are generally lowest at night when plants and algae are not producing oxygen.
Dissolved oxygen levels drop when respiration (microbes and animals breathing oxygen) out paces oxygen replenishment by primary production (photosynthesis from aquatic plants and algae, and atmospheric adsorption). This process is called ecosystem metabolism. Factors that influence metabolism include the concentration of organic carbon and nutrient bioavailability, temperature, light penetration, turbidity and hydrology (Caffrey 2004; Young et al. 2008). The Basin Plan targets for dissolved oxygen include a lower and upper range. Maintaining dissolved oxygen levels within this range indicates that ecosystem metabolism is largely in equilibrium.
When there is a sudden input of bioavailable organic carbon and nutrients, for example when flood waters inundate an area with high levels of fresh leaf litter and flush this material back into the river, microbial respiration can increase rapidly causing oxygen levels to drop to very low concentrations. These are known as anoxic blackwater events (Whitworth et al. 2012). Alternatively, high nutrient inputs can lead to excessive aquatic plant growth resulting in very high oxygen levels or supersaturation.
NSW Department of Planning, Industry and Environment | INT18/109352 | 9

Water quality technical report for the Namoi surface water resource plan area (SW14)
High microbial respiration as a result of
organic matter loading
Dissolved oxygen
outside natural
ranges
Eutrophication and excessive
plant and algal growth
Oxygen depletion in standing pools
Release of low oxygen bottom waters
from dams and weirs
2.4. pH The pH is a measure of how acidic or basic water is. The pH ranges between 0 (very acidic) to 14 (very basic) with 7 being neutral. pH outside of natural ranges can be harmful to plants and animals (Boulton et al. 2014). It influences the solubility and bioavailability of nutrients and carbon and the toxicity of pollutants (Closs et al. 2003). Very high or low pH can affect the taste of water, increase corrosion in pipes and pumps and reduce the effectiveness of drinking water treatment (WHO 2004).
The pH in water varies with soil type, geology and surface water and groundwater interactions. Human activities such as agricultural practices that expose acid sulphate soils and increase erosion may lead to decreased pH (Dent and Pons 1995). Eutrophication and excessive algal growth can lead to increases in pH (Boulton et al. 2014). Detrimental effects from pH on aquatic ecosystems are unlikely at the levels found across much of the Murray Darling Basin (Watson et al. 2009).
Eutrophication and excess plant
and algal growth
pH outside of
natural ranges
Agricultural practices that lead to
soil acidification
Urban runoff
Exposure to the air of soils containing
iron sulfide material
NSW Department of Planning, Industry and Environment | INT18/109352 | 10

Water quality technical report for the Namoi surface water resource plan area (SW14)
2.5. Water temperature and thermal pollution Water temperature influences many biological and ecosystem processes. Warmer temperatures can increase growth rates and metabolism of microbes, animals, plants and algae (Boulton et al. 2014; Kaushal et al. 2010). Temperature is also linked to spawning, breeding and migration patterns of many aquatic animals (Astles et al. 2003; Lessard and Hayes 2003). Higher temperatures can result in increased solubility of salts and decreased solubility of oxygen (Boulton et al. 2014).
Temperature is highly dynamic and varies at different time scales (e.g. seasonally and day/night). Human activities can have large impacts on temperature. Thermal water pollution can occur when dams stratify creating a cold bottom layer. If water is released from this bottom layer, it can lead to considerably colder water temperature than normal (Preece 2004). Thermal water pollution has had significant negative impacts on fish recruitment and can potentially influence ecosystem productivity and carbon cycling downstream of dams (Lugg and Copeland 2014; Webb et al. 2008).
The removal of riparian vegetation reduces shading, leading to increased water temperatures (Marsh et al. 2005; Rutherford et al. 2004). Other human activities such as discharge from power plants or warmer groundwater can also lead to increased river temperature (Lardicci et al. 1999). Climate change is also affecting river temperatures in the Murray Darling Basin (Pittock and Finlayson 2011).
Reduced flow
Thermal pollution
Water released from below
thermocline of large storages
Removal of shading riparian
vegetation
Climate change
2.6. Salinity Salinity is the presence of soluble salts in water. It is generally measured as electrical conductivity (the ability of dissolved salts to transmit an electric current). Increased salinity can have harmful effects on many plants and animals (James et al. 2003), effect drinking water supplies (WHO 2004) and cause damage and loss to cropping and horticulture sectors (Hillel 2000). The suitability of water for irrigation is often measured as a sodium adsorption ratio (SAR), which is a measure of the relative concentration of sodium, calcium and magnesium (Sposito and Mattigod 1977).
Increased electrical conductivity in rivers may be caused by the presence of salt in underlying soil, or bedrock released by weathering, salt deposited during past marine inundation of an area, or salt particles being carried over the land surface from the ocean. Australia’s arid climate provides insufficient rainfall to dilute the high levels of salt in the landscape. This has been further exacerbated by the increased mobilisation of salts by the use or discharge of saline groundwater to surface water, removal of deep-rooted native vegetation to be replaced with shallow-rooted crops or pastures and discharge of saline water from mining or industrial processes.
The initial stage of a flood is characterised by high electrical conductivity, often called a ‘first flush’. These appear as sharp spikes in the data followed by a rapid decline. As rainfall first starts to run off the landscape, it mobilises salts concentrated on the soil surface and washes them into the waterways. As flow increases, salts
NSW Department of Planning, Industry and Environment | INT18/109352 | 11

Water quality technical report for the Namoi surface water resource plan area (SW14)
concentrated in the bottom of pools are also flushed out. Following this peak, electrical conductivity drops rapidly due to the dilution of salts by rainwater. The irrigation industry is more likely to experience difficulties with these high salinity spikes before impacts of any long term accumulation are realised. It is advisable for irrigators to let this first flush pass downstream before commencing to pump.
Saline surface and shallow groundwater
drainage from irrigated landElevated levels of
salinity
Irrigation with groundwater at locations
where highly saline upper aquifer water
drains to lower aquifer
Replacement of deep-rooted
vegetation with shallow-rooted
vegetation
De-watering of
saline groundwater
Reduction of in-stream flows
limiting dilution
Use of water with a high ratio of sodium
to calcium and magnesium for irrigation
Increased deep drainage below
irrigated agricultural land displacing
saline groundwater to surface water
Irrigation at high
salinity risk locations
Saline water discharges
2.7. Harmful algal blooms Most algae are safe and are a natural part of aquatic ecosystems. However, some types of blue-green algae (cyanobacteria) can produce hepatotoxins, neurotoxins and contact irritants. When these species occur in bloom proportions (harmful algal blooms) they pose a serious risk to human, animal and ecosystem health (Chorus and Bartram 1999). In addition to toxin production, algal blooms can produce taste and odour problems in water supplies and blockages in irrigation systems. Harmful algal blooms can occur when there are suitable conditions including high levels of nitrogen and phosphorus, warm water temperatures and sunny days, low turbidity and calm water conditions where water may stratify (Anderson et al. 2002; Hudnell 2008). Blue-green algal blooms are normally associated with lakes and reservoirs, but do occur in rivers when conditions are favourable.
NSW Department of Planning, Industry and Environment | INT18/109352 | 12

Water quality technical report for the Namoi surface water resource plan area (SW14)
Harmful algal
blooms
Stratification
Water with little or no flow
Nutrients
Seeding from upstream
High temperatures
Sunlight
2.8. Toxicants Toxicants refer to chemical contaminants that have the potential to be toxic at certain concentrations. These include metals, inorganic and organic toxicants (Warne 2002; Warne et al. 2014). Toxicants can have public health impacts and induce stress and fatalities in plants and animals (Heugens et al. 2001; Newman 2009). Toxicants enter water from a range of human activities including agriculture, industry and mining, and can also enter surface waters naturally through groundwater connectivity.
Spray drift, vapour transport and runoff are the main pathways for pesticide transport into river systems (Mawhinney 1998, Raupach et al. 2001). Spray drift and vapour can both contribute low level but almost continuous inputs to the riverine ecosystem during the peak spraying season. The likelihood of pesticide drift is influenced by weather conditions, the method of application, equipment used and crop structure. Runoff tends to provide occasional high concentrations of pesticide contamination. Pesticides in runoff can be dissolved in the water, bound within sediments or adsorbed on to suspended particles.
Inappropriate disposal of pesticides
and toxicants
Elevated levels of
toxicants
Erosion of contaminated land
Carp
Leaching of toxicants
into groundwater
Increased deep drainage below
irrigated agricultural land displacing
saline groundwater to surface water
Toxicants in sewage
Runoff of pesticides and
other toxicants
NSW Department of Planning, Industry and Environment | INT18/109352 | 13

Water quality technical report for the Namoi surface water resource plan area (SW14)
2.9. Pathogens Bacteria and microorganisms occur naturally in rivers. Certain species have the potential to elicit disease symptoms; these are referred to as pathogens. In certain concentrations, pathogens can have negative impacts on public health (Prüss 1998; WHO 2004), aquatic animals (Gozlan et al. 2006), stock watering (LeJeune et al. 2001) and inhibit the use of water for irrigation (Steele and Odumeru 2004).
Human activities can increase the potential risk from pathogens including discharge of human and animal waste and sewage, and access of stock and animals to rivers and water supplies (Ferguson et al. 1996; Fong and Lipp 2005; Hubbard et al. 2004). Deal and Wood (1998) reported high levels of faecal coliforms were generally reported in spring and summer whilst autumn and winter had lower levels. The sources of the Escherichia coli in river samples were identified as both animal and human in origin. Current monitoring and knowledge of the presence of pathogen issues in the Namoi catchment is limited.
It is expected that increased runoff will result in increased faecal coliforms, as material such as soil and faecal matter is washed into waterways. Additionally, periods of low rainfall, low flow, and warm water temperatures provide appropriate conditions for faecal coliforms to multiply (Deal 1997).
Elevated levels of
pathogens
Major waterbird breeding events
Human and animal
waste
Sewage and
wastewater discharges
3. Water access rules and flow management in the Namoi WRPA
In parts of the catchment where flows are unregulated, there are very limited opportunities to manage water quality through flow management. The water sharing plan for the Namoi unregulated and alluvial water sources (2012) identifies cease to take rules. Generally pumping is not permitted when there is no visible flow at the access point, and water must not be taken from in-river or off-river pools when the water level in the pool is lower than its ‘full capacity’. ‘Full capacity’ can be approximated by the pool water level at the point where there is no visible flow into and out of that pool. The cease to pump rule ensures that additional pressure is not placed on pools by extracting water when the waterway has stopped flowing. During low flows, as pools contract, water quality can deteriorate, algal blooms occur, dissolved oxygen levels decline and fauna compete for the reducing food supplies.
In the regulated system downstream of Chaffey, Split Rock and Keepit Dams there is more scope to utilise flow rules and environmental flows to benefit water quality. In the water sharing plan for the Peel valley regulated, unregulated, alluvium and fractured rock water sources (2010) and water sharing plan for upper Namoi and Lower Namoi regulated river water source (2016), there are rules for both planned and adaptive environmental water. The following water rules can provide benefits to water quality.
NSW Department of Planning, Industry and Environment | INT18/109352 | 14

Water quality technical report for the Namoi surface water resource plan area (SW14)
End of system flow rule: Maintain a minimum release in the Namoi River at Walgett during the months of June, July and August to reflect flows that would have occurred naturally. This rule does not apply when the total water stored in Split Rock and Keepit Dams is less than 120 000 ML. The end of system flow rule provides benefits for riparian flow and connectivity of downstream pools.
Plan extraction limits - Sets a limit on the long term average volume of water that can be extracted. All water above the Namoi plan extraction limit (estimated 238 000 ML/year) is to be used for the environment. On a long-term average basis, the Namoi regulated water sharing plan ensures that approximately 73% of average annual flows (estimated 870 000 ML/year) in the river are preserved for the maintenance of basic environmental health. Maintaining base flow is important to slow the decline in water quality by preventing pools from stratifying and stagnating. In the Peel water source, the long term average commitment of water to the environment has been estimated at 252 900 ML/year. This equates to approximately 95% of the long term average flow in this water source.
Supplementary flow access rules - There are also restrictions on extractions under supplementary water access licences. Holders of these licences are able to extract water during announced periods as a result of high tributary inflows when flows exceed those required to meet other obligations and environmental needs. The volume that may be taken over a water year by each supplementary water access licence is set by the available water determination at the start of each water year. These restrictions are in place to:
Protect important rises in water levels;
Maintain floodplain and wetland inundation, and
Maintain natural flow variability.
Chaffey Dam stimulus flow: Environmental release rules were added following the enlargement of Chaffey Dam. Each water year, when the volume of water in Chaffey Dam is greater than 50 000 ML, the next 1 600 ML of inflows is set aside for the purpose of releasing as a stimulus flow for the Peel River. The stimulus flow is released between 1 July and 31 August or 1 March and 30 June if a flow of 50 ML or greater has not occurred in the Peel River at Piallamore in the preceding 90 days. The stimulus flow should last for seven days with a total volume of 1 600 ML and a peak of 500 ML/day occurring on the second day. Environmental benefits include increased water velocity scouring biofilms from rocks and logs, stimulated growth of aquatic plants along the river bank, fish movement between pools and increased flow flushing leaves and sticks into the river, increasing organic carbon.
Chaffey Dam environmental contingency allowance (ECA): The maximum volume available in the ECA account is 5 000 ML/year and cannot be carried over to the following water year. This volume may vary from year to year, depending on the available water determination. The ECA water is to be released to return natural flow variability to the upper reaches of the Peel River. Water in the ECA account can be used at the discretion of the NSW Environmental Water Manager.
Daily minimum flow release – The minimum daily flow release from Chaffey Dam (3 ML/day) and Keepit Dam (10 ML/day) deliver benefits to the rivers downstream of the storages.
The Namoi water sharing plan also recognises that the Minister, under Section 324 of the Act, can declare under extreme emergency circumstances that a greater share of the flow can be maintained in this Water Source for the environment and human safety. Instances where this may apply include, (but are not limited to) algal blooms that threaten human and animal health and chemical or other contaminant pollution (including excessive concentration of naturally occurring salts) where dilution flow is required.
The Commonwealth Environmental Water Office (CEWO) has general security water that must be managed to protect or restore environmental assets. The CEWO water must also be managed in accordance with the Basin Plan and the Basin Watering Strategy.
It is not the intent of the Water Quality Management Plan to propose the use of environmental water to address water quality issues. However, the release of environmental water for its designated purpose will provide water quality benefits for the Namoi River, such as breaking up stratification in pools, diluting salts, mobilising dissolved organic carbon and making conditions less favourable for harmful algal bloom development. Holders of environmental water in their independent decision making, must 'have regard' to
NSW Department of Planning, Industry and Environment | INT18/109352 | 15

Water quality technical report for the Namoi surface water resource plan area (SW14)
dissolved oxygen, salinity and recreational water quality when making decisions about the use of environmental water.
Environmental water is to be managed in accordance with the Long Term Watering Plan (LTWP), Basin Watering Strategy and Annual Basin Watering Priorities. In relation to water quality, the draft Namoi LTWP recognises water being of a quality unsuitable for use, as a risk to achieving environmental outcomes. Issues identified include poor water quality in terms of nutrients, dissolved oxygen and salinity, blue-green algae, chemical contaminants and cold water pollution.
There are opportunities to adjust the way water is delivered from Chaffey, Split Rock and Keepit Dams (including bulk water transfers from Split Rock to Keepit Dam) to provide additional water quality and environmental benefits to the aquatic ecosystem. Releasing large volumes water as a block, with very steep rising and falling limbs, has the potential to pose threats to the downstream rivers through bank slumping and bank erosion. Mimicking a natural flood event by maintaining natural flow variability and natural rates of change in water levels, with more gradual rising and falling limbs, can help reduce bank slumping. Increased water levels can inundate lower benches, flushing carbon into the system providing fuel to stimulate riverine food webs. High flow velocities can also scour silt and biofilms from rocks and logs in the river, resetting biofilm development and improving habitat quality.
The trade of water entitlement is another potential rule to manage risks to water quality. Trading entitlement out of an over allocated water source or away from a potentially sensitive area, could have long term benefits by assisting in mitigating the impact on instream values via reduced levels of extraction. Similarly, the trade of held environmental water into a stressed water source could provide benefits to water quality. Water trade has not been identified in this report as an immediate mitigation measure, as there is no certainty of where, when, or if it may occur.
NSW Department of Planning, Industry and Environment | INT18/109352 | 16

Water quality technical report for the Namoi surface water resource plan area (SW14)
4. Methods
4.1. Site selection and monitoring The water quality data used in this report were compiled from 11 routine water quality monitoring stations located within the Namoi WRPA. The data were collected on a monthly basis for the State Water Quality Assessment and Monitoring Program (SWAMP). This water quality monitoring program is responsible for collecting, analysing and reporting the ambient water quality condition of rivers in NSW. The program in its current form commenced in November 2007 replacing numerous regionally based water quality monitoring programs. The data set covers a five year period from July 2010 to June 2015. A five year time period was chosen as it is consistent with the Basin Plan (Schedule 12) five yearly review against water quality targets.
A full station list is given in Table 7 and the location of these sites in relation to the Basin Plan water quality zones is shown in Figure 2. The coordinates for all monitoring sites are listed in Appendix A.
Table 7: List of routine water quality monitoring stations in the Namoi WRPA
Basin Plan WQ zone Station Number
Station Name
C2 419010 Macdonald River at Woolbrook
B2 419022 Namoi River at Manilla Railway Bridge
B2 419016 Cockburn River at Mulla Crossing
B2 419024 Peel River at Paradise Weir
B2 419006 Peel River at Carroll Gap
B2 419027 Mooki River at Breeza
B2 419032 Coxs Creek at Boggabri
B2 419001 Namoi River at Gunnedah
B2 419003 Narrabri Creek at Narrabri
A2 419021 Namoi River at Bugilbone
A2 419026 Namoi River at Goangra
There are seven continuous electrical conductivity monitoring sites in the Namoi WRPA. These are located at existing river gauging stations and take electrical conductivity readings every 15 minutes. All continuous electrical conductivity data is stored in the HYDSTRA database. The Namoi River at Goangra is the Namoi catchment End-of-Valley salinity target site. The sites are listed in Table 8.
Table 8: List of continuous electrical conductivity monitoring stations in the Namoi WRPA
Station Number
Station Name
419097 Goonoo Goonoo Creek at Meadows Lane
419024 Peel River at Paradise Weir
419084 Mooki River at Ruvigne
419032 Coxs Creek at Boggabri
419001 Namoi River at Gunnedah
419003 Narrabri Creek at Narrabri
419026 Namoi River at Goangra
Blue-green algae monitoring in the Namoi WRPA focuses mainly on Chaffey, Split Rock and Keepit Dams. Samples are collected at two locations within each storage, covering the main recreational areas of the dam. A
NSW Department of Planning, Industry and Environment | INT18/109352 | 17
Water quality technical report for the Namoi surface water resource plan area (SW14)
sample is also collected downstream of the dams to determine if potentially toxic blue-green algae are being released into the rivers.
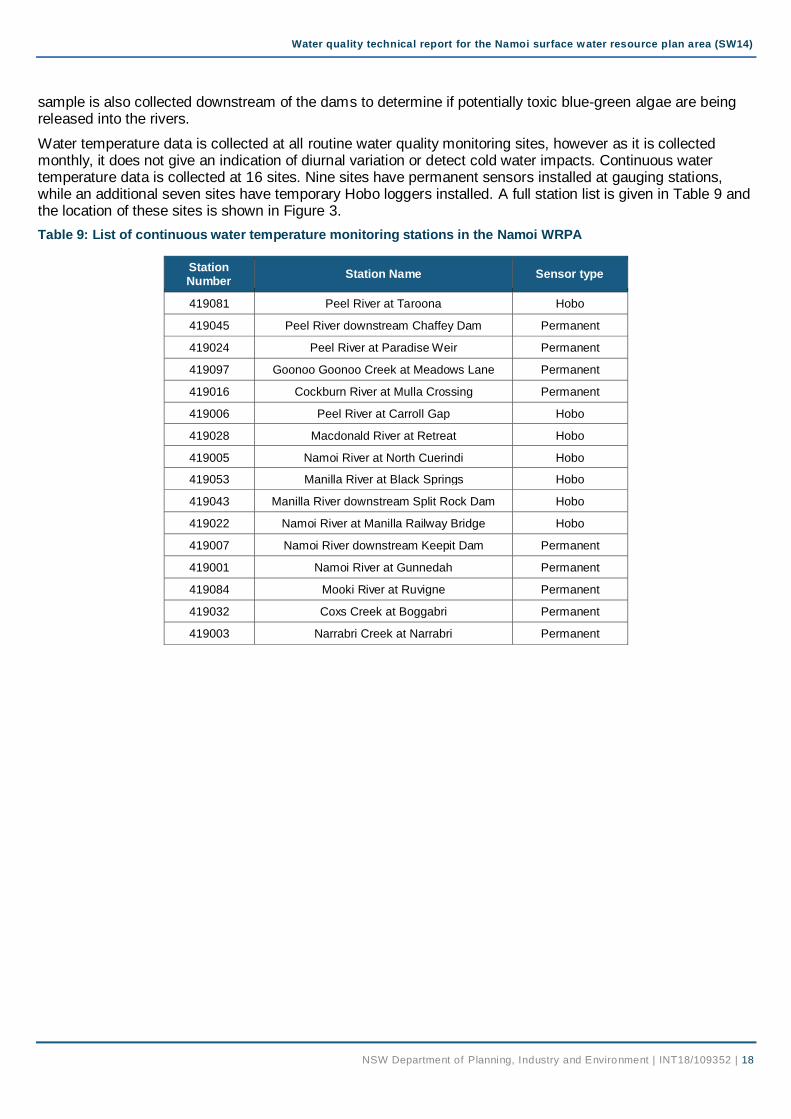
Water temperature data is collected at all routine water quality monitoring sites, however as it is collected monthly, it does not give an indication of diurnal variation or detect cold water impacts. Continuous water temperature data is collected at 16 sites. Nine sites have permanent sensors installed at gauging stations, while an additional seven sites have temporary Hobo loggers installed. A full station list is given in Table 9 and the location of these sites is shown in Figure 3.
Table 9: List of continuous water temperature monitoring stations in the Namoi WRPA
Station Number
Station Name Sensor type
419081 Peel River at Taroona Hobo
419045 Peel River downstream Chaffey Dam Permanent
419024 Peel River at Paradise Weir Permanent
419097 Goonoo Goonoo Creek at Meadows Lane Permanent
419016 Cockburn River at Mulla Crossing Permanent
419006 Peel River at Carroll Gap Hobo
419028 Macdonald River at Retreat Hobo
419005 Namoi River at North Cuerindi Hobo
419053 Manilla River at Black Springs Hobo
419043 Manilla River downstream Split Rock Dam Hobo
419022 Namoi River at Manilla Railway Bridge Hobo
419007 Namoi River downstream Keepit Dam Permanent
419001 Namoi River at Gunnedah Permanent
419084 Mooki River at Ruvigne Permanent
419032 Coxs Creek at Boggabri Permanent
419003 Narrabri Creek at Narrabri Permanent
NSW Department of Planning, Industry and Environment | INT18/109352 | 18
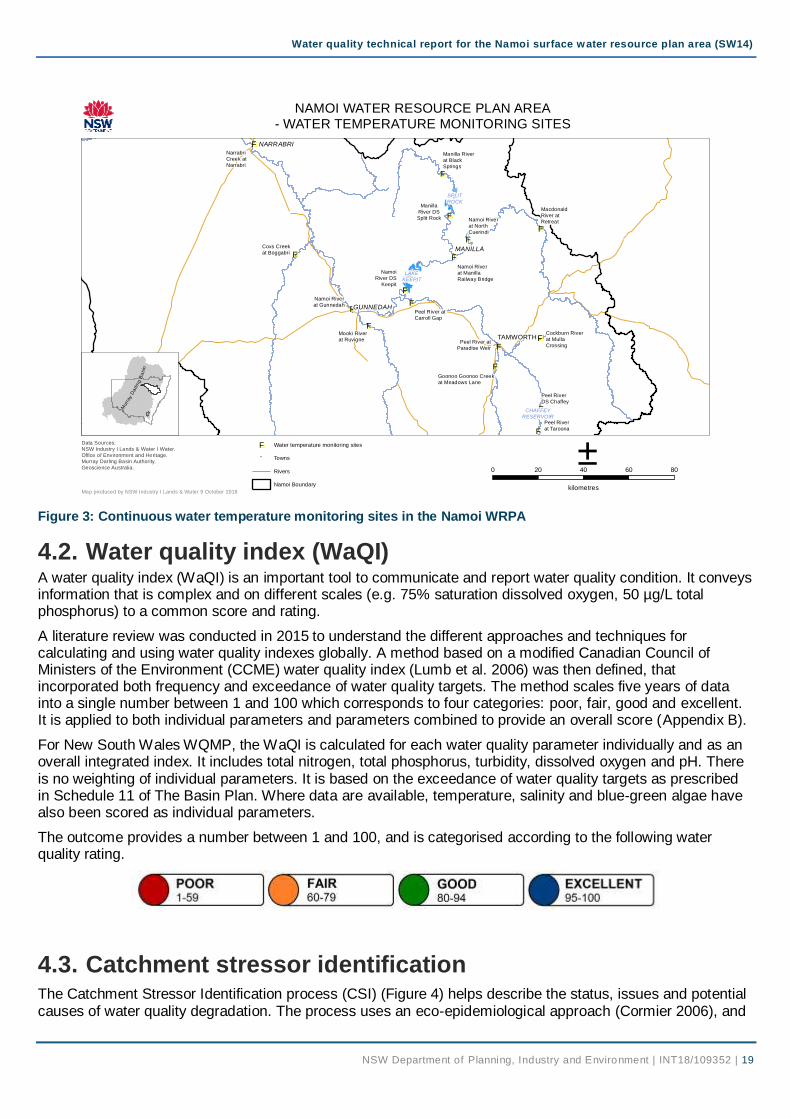
Water quality technical report for the Namoi surface water resource plan area (SW14)
Map produced by NSW Industry I Lands & Water 9 October 2018
GF Water temperature monitoring sites
" Towns
Rivers
Namoi Boundary
Data Sources:
NSW Industry I Lands & Water I Water.
Office of Environment and Heritage.
Murray Darling Basin Authority.
Geoscience Australia. 0 20 40 60 80
kilometres
±
"
"
"
"
"
GF
GF
GF
GF
GF
GF
GF
GF
GF
GF
GF
GF
GF
GF
GF
GF
Peel River
at Taroona
Peel River
DS Chaffey
Peel River at
Paradise Weir
Goonoo Goonoo Creek
at Meadows Lane
Cockburn River
at Mulla
Crossing
Peel River at
Carroll Gap
Macdonald
River at
RetreatNamoi River
at North
Cuerindi
Manilla River
at Black
Springs
Manilla
River DS
Split Rock
Namoi River
at Manilla
Railway Bridge
Namoi
River DS
Keepit
Namoi River
at Gunnedah
Mooki River
at Ruvigne
Coxs Creek
at Boggabri
Narrabri
Creek at
Narrabri
SPLIT
ROCK
CHAFFEY
RESERVOIR
LAKE
KEEPIT
MANILLA
NARRABRI
GUNNEDAH
TAMWORTH
NAMOI WATER RESOURCE PLAN AREA- WATER TEMPERATURE MONITORING SITES
Mur
ray
Darli
ng
Ba
sin
Figure 3: Continuous water temperature monitoring sites in the Namoi WRPA
4.2. Water quality index (WaQI) A water quality index (WaQI) is an important tool to communicate and report water quality condition. It conveys information that is complex and on different scales (e.g. 75% saturation dissolved oxygen, 50 µg/L total phosphorus) to a common score and rating.
A literature review was conducted in 2015 to understand the different approaches and techniques for calculating and using water quality indexes globally. A method based on a modified Canadian Council of Ministers of the Environment (CCME) water quality index (Lumb et al. 2006) was then defined, that incorporated both frequency and exceedance of water quality targets. The method scales five years of data into a single number between 1 and 100 which corresponds to four categories: poor, fair, good and excellent. It is applied to both individual parameters and parameters combined to provide an overall score (Appendix B).
For New South Wales WQMP, the WaQI is calculated for each water quality parameter individually and as an overall integrated index. It includes total nitrogen, total phosphorus, turbidity, dissolved oxygen and pH. There is no weighting of individual parameters. It is based on the exceedance of water quality targets as prescribed in Schedule 11 of The Basin Plan. Where data are available, temperature, salinity and blue-green algae have also been scored as individual parameters.
The outcome provides a number between 1 and 100, and is categorised according to the following water quality rating.
4.3. Catchment stressor identification The Catchment Stressor Identification process (CSI) (Figure 4) helps describe the status, issues and potential causes of water quality degradation. The process uses an eco-epidemiological approach (Cormier 2006), and
NSW Department of Planning, Industry and Environment | INT18/109352 | 19

Water quality technical report for the Namoi surface water resource plan area (SW14)
is broadly related to the approach developed by Cormier et al. (2003) for water quality planning in North America for the United States Environmental Protection Agency (USEPA). It identifies issues and causes based on the idea of abductive inference that is; considering possible causes of water quality degradation, weighing evidence and putting forward factors likely contributing to water quality degradation. Once the water quality degradation issues are defined, evidence is gathered and weighed before conclusions on probable causes synthesised.
The CSI process is intended to be iterative and involves conceptual mapping, data evaluation, literature reviews, GIS mapping and input of local and expert knowledge. The process consists of a standard set of procedures and outputs. The final output expresses what water quality degradation is present and the likely cause, using narrative, figures and maps.
Figure 4: Conceptual diagram of the CSI process
4.3.1.Conceptual mapping
Conceptual models are a useful step in mapping out possible causes of water quality degradation. They help define the scope of possible causes of water quality degradation and show interlinkages between both causes of degradation and between water quality parameters. A standard conceptual diagram for overall water quality and each parameter has been created based primarily on Schedule 10 of the Basin Plan. These standard models will then be revised for each parameter in each WRP area during the CSI process.
4.3.2.Literature review
A review of both published and grey literature has been undertaken for the Namoi WRPA. Published literature was reviewed using a standardised approach through the Web of Science database. Grey literature was reviewed in an informal manner through web searches and Google Scholar.
4.3.3.Summary statistics
The data used for this and the following analysis is primarily from the State Water Quality Assessment and Monitoring Program (SWAMP). Summary statistics of available data for each parameter in a WRP area will be defined. These include basic statistics such as range (minimum, maximum), central tendency (mean, median) and variability (standard deviation, interquartile range, coefficient of variation). These statistics help define basic patterns of water quality degradation.
4.3.4.Data analysis
Analysing water quality data is a crucial step in diagnosing issues and their causes. Basic analysis involved examining relationships between parameters, temperature and season, location and hydrology. Data analysis
NSW Department of Planning, Industry and Environment | INT18/109352 | 20

Water quality technical report for the Namoi surface water resource plan area (SW14)
is used to help understand the nature of ecological problems, their interdependencies, seasonal variances, relationship to flow regimes and spatial relationships. Data analysis was based on routine sampling conducted between 2010 and 2015.
4.3.5.Spatial and GIS
Existing spatial information relevant to the causes of water quality degradation for each parameter has been compiled into ArcGIS geodatabases. Initial maps have been produced with relevant spatial information and land use are determined through the CSI process for each WRP area boundary. The spatial information may be refined during the CSI process.
4.3.6.Local and expert knowledge
For each WRP area, meetings were held with the technical working group comprised of representatives from partner agencies and other invited experts. These meetings facilitated input of local knowledge and expert opinion to the WQMP. In general, these meetings occurred on a one-on-one or organisational basis. This approach was chosen to allow more freedom for people to speak and explore ideas. Information from these meetings was used to refine the scope of water quality degradation, conceptual diagrams, GIS mapping, and to guide further exploration. They also help define conclusions reached for the causes of water quality degradation and most relevant and fit-for-purpose information to include in this report and the WQMP.
4.4. Namoi WRPA Risk Assessment Risk assessments are the first steps in the development of a water resource plan for each surface water and groundwater planning area in the Murray Darling Basin. Risk assessments and associated water resource plans must be prepared having regard to current and future risks to the condition and continued availability of water resources in a water resource plan area, and outline strategies to address those risks.
The risk assessment approach compiles the best available information to highlight the range of potential risks that may be present. Where a risk is highlighted as medium or high, it does not necessarily imply that existing rules in the water sharing plan require change or are inadequate, but rather, that further detailed investigation may be required. The risk assessment also highlights where existing plan rules may already be mitigating the risk.
The risk to the health of water dependent ecosystems was assessed by identifying the risk, quantifying the impact based on instream values (consequence) and determining the probability of that consequence occurring (likelihood).
The consequence of poor water quality was determined using the HEVAE (High Ecological Value Aquatic Ecosystems) instream value. For each monitoring station, a reach was defined as 25 km upstream and downstream of the site. This was chosen as a conservative estimate of the spatial representativeness of water quality data and movement of instream biota within the river channel. The consequence decision support tree was then used to define the final consequence score using the HEVAE instream values within each reach area. For detailed description of the risk assessment process and outputs, refer to the Risk Assessment for the Namoi water resource plan area (SW14) (DoIW 2018b).
The calculation method for the likelihood scores varied between water quality attributes. The l ikelihood scores for total nitrogen, total phosphorus, dissolved oxygen, pH and turbidity were the frequency that the Basin Plan water quality target was exceeded, based on monthly sampling data for the five year period, 2010 to 2015.
Continuous electrical conductivity data from 2010 to 2015, rather than discrete monthly data, was used to assess risks from poor salinity. The electrical conductivity data was assessed against the Namoi End-of-Valley salinity target for the Namoi River at Goangra. The likelihood of water being unsuitable for irrigation was not calculated as there are no irrigator infrastructure operators located in the Namoi WRPA.
Water temperature risk was based on the presence of a dam classified as having a severe, moderate or low cold water pollution status, according to Preece (2004).
The objective for recreational water quality is to achieve a low risk to human health from water quality threats posed by exposure through ingestion, inhalation or contact during recreational use. Blue-green algae were
NSW Department of Planning, Industry and Environment | INT18/109352 | 21

Water quality technical report for the Namoi surface water resource plan area (SW14)
chosen as the indicator for risk to recreational water quality because of the potential for some species to impact on human health. The risk of water being unsuitable for recreational use considered the frequency of high concentrations of potentially toxic algal blooms (likelihood), compared to the degree of recreational usage of the water body where the sample was taken (consequence).
New South Wales currently manages the risk of human exposure to blue-green algal blooms through a coordinated regional approach with the Regional Algal Coordination Committees (RACC). State-wide and regional contingency plans and guidelines have been developed to provide methodologies on the management of algal blooms (NSW Office of Water 2014). The objective of the guidelines is to provide a risk assessment framework to assist with the effective management response to freshwater, estuarine and marine algal blooms. They aim to minimise the impact of algal blooms, by providing adequate warning to the public ensuring their health and safety in recreational situations and for stock and domestic use.
Under the current management of algal blooms, the level of human exposure to a bloom can be reduced by management practices such as issuing algal alerts. Alert levels have been developed and are used to determine the actions that need to be undertaken with respect to an algal incident. These alerts have been adopted from the National Health and Medical Research Council algal bloom response guidelines (NHMRC 2008). The risk to a site with a high recreational usage may be reduced by the management strategy of placing algal warning signs at the site and informing users of the risks and dangers. Therefore, where these warning arrangements are in place, a low consequence value was used.
Pathogens, pesticides, heavy metals and other toxic contaminants are not monitored regularly in the Namoi WRPA, so were not included in the risk assessment.
5. Results
5.1. Water quality index (WaQI)
5.1.1.Water-dependent ecosystems
The WaQI score for each parameter, and the overall score for each site, was calculated for the 2010 to 2015 water quality data set. The Macdonald River at Woolbrook, Mooki River at Breeza and Coxs Creek at Boggabri were the only sites in the Namoi WRPA to be rated as poor. The Peel River at Carroll Gap and Namoi River a Gunnedah were rated as fair with all other sites, good. The results from the WaQI are shown in Table 10 and summarised in Figure 5.
Table 10: Water quality index scores for the Namoi WRPA 2010-2015 water quality data
Site Name Rating WaQI Total N Total P Turbidity pH DO
Macdonald River at Woolbrook Poor 42 20 14 92 70 33
Namoi River at Manilla Railway Bridge Good 81 83 86 83 55 98
Cockburn River at Mulla Crossing Good 91 87 89 96 94 83
Peel River at Paradise Weir Good 93 95 96 95 86 90
Peel River at Carroll Gap Fair 73 61 68 54 96 95
Mooki River at Breeza Poor 48 58 16 44 69 84
Coxs Creek at Boggabri Poor 28 25 10 15 63 66
Namoi River at Gunnedah Fair 70 67 55 56 98 90
Narrabri Creek at Narrabri Poor 59 71 27 41 95 91
Namoi River at Bugilbone Good 89 87 82 87 94 92
Namoi River at Goangra Good 87 81 83 83 93 100
NSW Department of Planning, Industry and Environment | INT18/109352 | 22

Water quality technical report for the Namoi surface water resource plan area (SW14)
Figure 5: Namoi WRPA water quality index scores
5.1.2. Dissolved oxygen
Dissolved oxygen readings are collected near the water surface on a monthly basis. Figure 6 highlights the relationship between dissolved oxygen and the mean daily flow at selected monitoring stations in the Namoi valley. The largest impact on dissolved oxygen occurred in the Namoi River at Goangra during flooding in October 2016, rather than low flow conditions. High flows inundating high banks and benches, flushing organic material into the river can cause a drop in dissolved oxygen. Dissolved oxygen levels return to more normal levels once the flow has passed. There does not appear to be critical impacts from small increases in flow during low flow periods.
NSW Department of Planning, Industry and Environment | INT18/109352 | 23
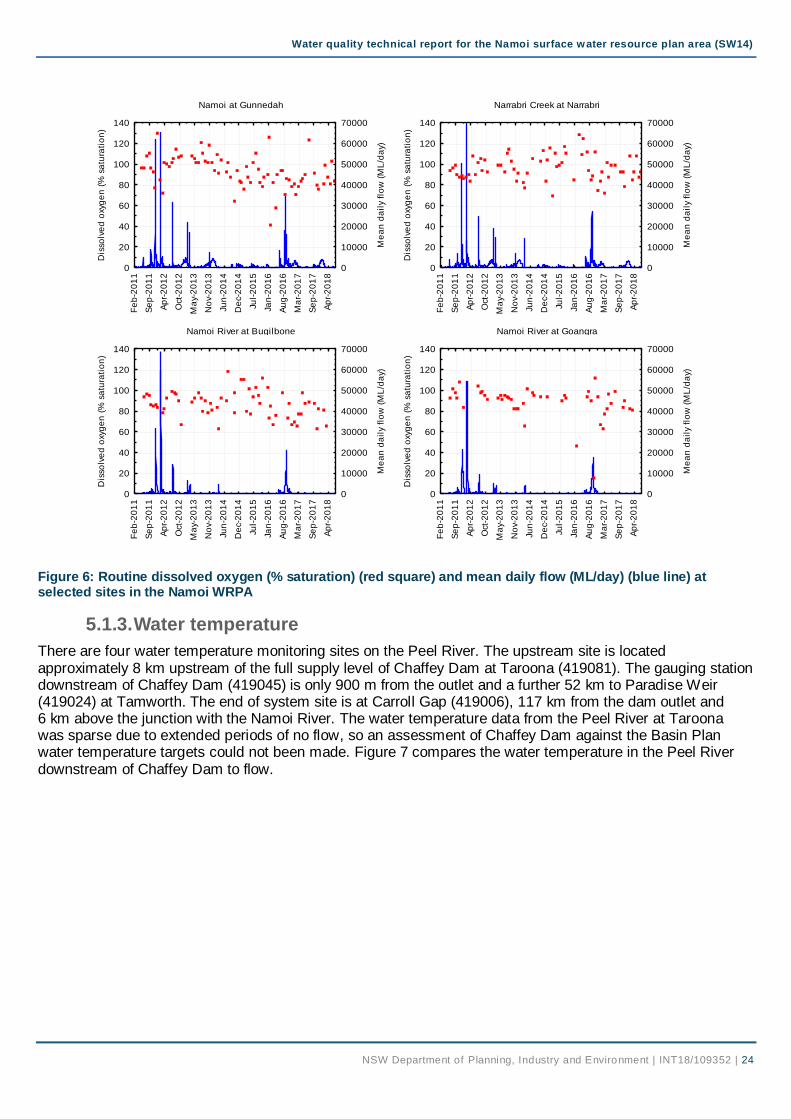
Water quality technical report for the Namoi surface water resource plan area (SW14)
Namoi at Gunnedah
Fe
b-2
01
1
Se
p-2
01
1
Ap
r-2
01
2
Oct
-20
12
Ma
y-2
01
3
No
v-2
01
3
Jun
-20
14
De
c-2
01
4
Jul-
20
15
Jan
-20
16
Au
g-2
01
6
Ma
r-2
01
7
Se
p-2
01
7
Ap
r-2
01
8
0
20
40
60
80
100
120
140
Dis
solv
ed
oxy
ge
n (
% s
atu
rati
on
)
0
10000
20000
30000
40000
50000
60000
70000
Me
an
da
ily
flo
w (
ML
/da
y)
Narrabri Creek at Narrabri
Fe
b-2
01
1
Se
p-2
01
1
Ap
r-2
01
2
Oct
-20
12
Ma
y-2
01
3
No
v-2
01
3
Jun
-20
14
De
c-2
01
4
Jul-
20
15
Jan
-20
16
Au
g-2
01
6
Ma
r-2
01
7
Se
p-2
01
7
Ap
r-2
01
8
0
20
40
60
80
100
120
140
Dis
solv
ed
oxy
ge
n (
% s
atu
rati
on
)
0
10000
20000
30000
40000
50000
60000
70000
Me
an
da
ily
flo
w (
ML
/da
y)
Namoi River at Bugilbone
Fe
b-2
01
1
Se
p-2
01
1
Ap
r-2
01
2
Oct
-20
12
Ma
y-2
01
3
No
v-2
01
3
Jun
-20
14
De
c-2
01
4
Jul-
20
15
Jan
-20
16
Au
g-2
01
6
Ma
r-2
01
7
Se
p-2
01
7
Ap
r-2
01
8
0
20
40
60
80
100
120
140
Dis
solv
ed
oxy
ge
n (
% s
atu
rati
on
)
0
10000
20000
30000
40000
50000
60000
70000
Me
an
da
ily
flo
w (
ML
/da
y)
Namoi River at Goangra
Fe
b-2
01
1
Se
p-2
01
1
Ap
r-2
01
2
Oct
-20
12
Ma
y-2
01
3
No
v-2
01
3
Jun
-20
14
De
c-2
01
4
Jul-
20
15
Jan
-20
16
Au
g-2
01
6
Ma
r-2
01
7
Se
p-2
01
7
Ap
r-2
01
8
0
20
40
60
80
100
120
140
Dis
solv
ed
oxy
ge
n (
% s
atu
rati
on
)
0
10000
20000
30000
40000
50000
60000
70000
Me
an
da
ily
flo
w (
ML
/da
y)
Figure 6: Routine dissolved oxygen (% saturation) (red square) and mean daily flow (ML/day) (blue line) at selected sites in the Namoi WRPA
5.1.3.Water temperature
There are four water temperature monitoring sites on the Peel River. The upstream site is located approximately 8 km upstream of the full supply level of Chaffey Dam at Taroona (419081). The gauging station downstream of Chaffey Dam (419045) is only 900 m from the outlet and a further 52 km to Paradise Weir (419024) at Tamworth. The end of system site is at Carroll Gap (419006), 117 km from the dam outlet and 6 km above the junction with the Namoi River. The water temperature data from the Peel River at Taroona was sparse due to extended periods of no flow, so an assessment of Chaffey Dam against the Basin Plan water temperature targets could not been made. Figure 7 compares the water temperature in the Peel River downstream of Chaffey Dam to flow.
NSW Department of Planning, Industry and Environment | INT18/109352 | 24

Water quality technical report for the Namoi surface water resource plan area (SW14)
Jul-09 Jan-10 Aug-10 Feb-11 Sep-11 Apr-12 Oct-12 May-13 Nov-13 Jun-14 Dec-14 Jul-15 Jan-16
0
5
10
15
20
25
30
35
Min
imum
daily w
ate
r te
mpera
ture
(°C
)
0
2000
4000
6000
8000
10000
12000
Mean d
aily flo
w (
ML/d
ay)
Mean daily flow Peel River DS Chaffey Dam (R)
Peel River DS Chaffey Dam (L)
Peel River at Paradise Weir (L)
Peel River at Carroll Gap (L)
Figure 7: Minimum daily water temperature in the Peel River against mean daily flow downstream of Chaffey Dam from 2009 to 2016
There are two water temperature monitoring sites on the Manilla River. One is located 10 km upstream of Split Rock Dam at Black Springs (419053) and the second 2 km downstream of the dam outlet (419043). The Manilla River joins the Namoi River at Manilla, approximately 34 km downstream of the dam. The Namoi River at Manilla Railway Bridge (419022) monitoring site is located less than one kilometre downstream of the junction of the Manilla and Namoi Rivers. The Split Rock Dam monthly 20th and 80th percentiles were calculated using the Manilla River at Black Springs hourly water temperature data. The monthly median temperature downstream of Split Rock Dam was calculated using the hourly water temperature data from the Manilla River downstream of Split Rock Dam. Figure 8 compares the monthly median temperature at the downstream Split Rock Dam site to the percentiles of the reference site. The thermal pollution WaQI score was 59, which is a poor rating. The water temperature data in Figure 9 is the daily minimum water temperature at the two sites on the Manilla River and the Namoi River at Manilla compared against the mean daily flow downstream of Split Rock Dam.
NSW Department of Planning, Industry and Environment | INT18/109352 | 25

Water quality technical report for the Namoi surface water resource plan area (SW14)
Feb-11 Sep-11 Apr-12 Oct-12 May-13 Nov-13 Jun-14 Dec-14 Jul-15 Jan-16
Date
6
8
10
12
14
16
18
20
22
24
26
28
30
32
Wa
ter
tem
pe
ratu
re (
°C)
Reference 20%ile
Reference 80%ile
Downstream Split Rock median
Figure 8: Water temperature downstream of Split Rock Dam compared to estimated 20th and 80th percentile of natural temperature
Aug-10 Feb-11 Sep-11 Apr-12 Oct-12 May-13 Nov-13 Jun-14 Dec-14 Jul-15 Jan-16
Date
0
5
10
15
20
25
30
Min
imu
m d
aily
wa
ter
tem
pe
ratu
re (
°C)
0
2000
4000
6000
8000
10000
Me
an
da
ily f
low
(M
L/d
ay)
Mean daily flow Manilla R downstream Split Rock Dam (R)
Manilla R at Black Springs (L)
Manilla R DS Split Rock Dam (L)
Namoi R at Manilla Rwy Bridge (L)
Figure 9: Minimum daily water temperature in the Manilla River against mean daily flow downstream of Split Rock Dam
There are two water temperature monitoring sites upstream of Keepit Dam. The Namoi River at North Cuerindi (419005) is 35 km upstream of the full storage level of Keepit Dam and Namoi River at Manilla Railway Bridge (419022) is 18 km above full storage level. The monitoring site below Keepit Dam is 2.2 km downstream of the outlet (Namoi River at Keepit, 419007). It is a further 60 km to Gunnedah (Namoi River at Gunnedah, 419001) and a total of 200 km to Narrabri (Narrabri Creek at Narrabri, 419003). The monthly 20th and 80th percentiles for Keepit (Figure 10) were calculated using the Namoi River at North Cuerindi hourly water temperature data.
NSW Department of Planning, Industry and Environment | INT18/109352 | 26

Water quality technical report for the Namoi surface water resource plan area (SW14)
The Namoi River at Manilla Railway Bridge site was not used as there is some evidence of cold water impacts from Split Rock Dam. The thermal pollution WaQI score, using the difference between the reference site and downstream data, was 56, which is a poor rating. Figure 11 compares the water temperature in the Namoi River downstream of Keepit Dam to flow.
Aug-10 Feb-11 Sep-11 Apr-12 Oct-12 May-13 Nov-13 Jun-14 Dec-14 Jul-15 Jan-16
Date
6
8
10
12
14
16
18
20
22
24
26
28
30
32
Wa
ter
tem
pe
ratu
re (
°C)
Reference 20%ile
Reference 80%ile
Downstream Keepit median
Figure 10: Assessment of Namoi River downstream of Keepit Dam water temperature against MDBA target “reference site” data from 2010 to 2016
Aug-10 Feb-11 Sep-11 Apr-12 Oct-12 May-13 Nov-13 Jun-14 Dec-14 Jul-15 Jan-16
Date
5
10
15
20
25
30
35
Min
um
um
da
ily w
ate
r te
mp
era
ture
(C
)
0
10000
20000
30000
40000
50000
60000
Me
an
da
ily f
low
(M
L/d
ay)
Mean daily flow Namoi R DS Keepit Dam (R)
Namoi at North Cuerindi (L)
Namoi at Manilla Rwy Bridge (L)
Namoi DS Keepit Dam (L)
Namoi at Gunnedah (L)
Figure 11: Minimum daily water temperature in the Namoi River against mean daily flow downstream of Keepit Dam from 2010 to 2016
NSW Department of Planning, Industry and Environment | INT18/109352 | 27

Water quality technical report for the Namoi surface water resource plan area (SW14)
5.1.4.Irrigation
The Basin Plan agriculture and irrigation salinity target is for the 95th percentile of the daily mean electrical conductivity, over a 10 year period, not to exceed 957 µS/cm. This target applies at sites where water is extracted by an irrigation infrastructure operator for the purpose of irrigation. As there are no irrigation infrastructure operators in the Namoi WRPA, this target has not been assessed.
The mean daily electrical conductivity in Narrabri Creek at Narrabri fluctuates throughout the year, with no results exceeding 1000 µS/cm. Below this level, water is generally considered safe for agriculture and irrigation. The highest electrical conductivity results are recorded during winter or periods of low flow and the lower readings in summer (Figure 12). As the highest readings were outside the peak irrigation periods, the risk of impacts to soil and crop health is minimised.
May-2005 Oct-2006 Feb-2008 Jul-2009 Nov-2010 Apr-2012 Aug-2013 Dec-2014
0
200
400
600
800
1000
1200
Mean d
aily e
lectr
ical conductivity (
µS
/cm
)
Figure 12: Mean daily electrical conductivity (µS/cm) in Narrabri Creek at Narrabri from 2005 to 2015
5.1.5.Recreation
The algal biovolume data from Chaffey Dam (Station 1) is displayed in Figure 13. The data are used to assign recreational alerts based on the National Health and Medical Research Council guidelines for recreational use. At the red alert level (4 mm3/L), waters are not suitable for recreational use and exceed the Basin Plan target. Figure 12 shows that Chaffey Dam was placed on red alert for recreational use on numerous occasions between 2007 and 2013. The WaQI score for harmful algal blooms for the major storages and the Namoi River at Walgett are shown in Table 11.
Table 11: Water quality index scores for the Namoi WRPA 2007-2013 blue-green algal data
Site Name WaQI Rating
Chaffey Dam 79 Fair
Split Rock Dam 100 Excellent
Keepit Dam 97 Excellent
Namoi River at Walgett 97 Excellent
NSW Department of Planning, Industry and Environment | INT18/109352 | 28

Water quality technical report for the Namoi surface water resource plan area (SW14)
Nov-2007 Jun-2008 Dec-2008 Jul-2009 Jan-2010 Aug-2010 Feb-2011 Sep-2011 Apr-2012 Oct-2012 May-2013
0
5
10
15
20
25
30
35
40
Pote
ntially toxic
alg
al bio
volu
me (
mm
3/L
)
Figure 13: Harmful algal blooms in Chaffey Dam (Station 1) from 2007 to 2013
5.2. Literature review A literature search was undertaken to gather information from the published literature relevant to water quality in the Namoi WRPA. Following is a summary of relevant information with more detailed information listed in Appendix C.
Over 60% of the river length in the Namoi valley has been substantially modified from natural condition, and 21% is severely impaired (Norris et al. 2001). The most impacted areas are the Peel River, Mooki River and Coxs Creek catchments, and the upper Manilla River near Barraba, with extensive reaches with less than 20% native woody riparian vegetation. Inversely, streams draining Mount Kaputar and the Pilliga Forest contain long reaches with greater than 80% cover (DoIW 2018b). Riparian vegetation is important as a carbon source, its shading reduces solar radiation, limiting in-channel autotrophic production (Kelleway et al. 2010) and as a source of large woody debris to protect against erosion and restore river health (Erskine et al. 2012).
An assessment of geomorphic condition was undertaken, based on three broad categories of condition – good, moderate and poor. Approximately 20% of the assessed streamlines were in good condition, 50% in moderate condition and 30% in poor condition (Lampert and Short 2004). It was recommended that conservation and rehabilitation actions be targeted initially at areas where the greatest success and continuity of effort is most likely to be achieved, such as Conservation and Strategic Priority reaches. Priority for further assessment and action should be given to the Pilliga outwash streams and the Upper Macdonald, as these areas contain a high proportion of fragile and rare River Styles (Lampert and Short 2004).
Olley and Scott (2002) found that 72 to 91% of sediment being transported through the middle and lower reaches of the Namoi River was attributed to gully and bank erosion. Since European settlement, the supply and transport of sediment in the Namoi River has changed markedly as a result of grazing and cropping, historical climate variations and dam construction. Of these, the introduction of grazing stock, which triggered widespread gully erosion, has had the largest effect (Olley and Scott 2002). Management of the incised channels will reduce the amount of sediment produced, particularly where the options enhance sediment entrapment. Stabilisation of gully networks can be encouraged by the exclusion of stock, revegetation, and the formation of in-stream wetlands. These provide the most effective ways of decreasing the turbidity and fine sediment load in these river systems (Olley and Scott 2002).
NSW Department of Planning, Industry and Environment | INT18/109352 | 29

Water quality technical report for the Namoi surface water resource plan area (SW14)
Suspended sediment transport along the Namoi River is very inefficient. Estimates that of the 400 kt/yr of sediment delivered to the Namoi River from Coxs Creek and the Mooki River, approximately 100 kt/yr passes Narrabri and less than 35 kt/y is conveyed to the Barwon River (Caitcheon et al. 1999). For this reason, a reduction in turbidity levels in response to land and vegetation management practices will take time, as large volumes of sediment are reworked through the system (Mawhinney 2011).
Water quality assessment in the Namoi catchment found the anion composition was generally bicarbonate dominant with no clear dominant cation. The Mooki River at Ruvigne was found to have higher concentrations of sodium and magnesium in some samples and chloride salts dominated when the Mooki River was flowing, raising concerns for irrigators extracting water in the lower Mooki Catchment. The highest concentrations of salt were in Mooki River, Coxs Creek, Goonoo Goonoo Creek and the lower Peel River (Mawhinney 2011).
Developing ecologically effective environmental flow regimes is a challenge for river managers globally and in many regulated rivers, sufficient water is rarely available to ensure that environmental flow releases are fully effective (Dyer and Thoms 2006). The Commonwealth Environmental Water Office (2016) believes there is insufficient environmental water to meet the need of environmental assets in the Namoi valley. Austin et al. (2010) estimated that climate change may reduce water yield in the Namoi River by almost 22% by 2030 and over 48% by 2070.
Water temperature, flows, habitat and food resource (prey size and availability) all impair fish recruitment. Flow magnitude and water temperature appear to have the largest effect in determining larval fish composition (Rolls et al. 2013). It is suggested that a lack of prey and food resources may be one reason why there is not a strong response to managed flow events (Rolls et al. 2013). In addition, where river channels have already been impacted by regulated flows, complex surfaces such as benches may have already been lost, so restoring more natural flows at these levels of channel, may have little immediate impact on nutrient processing (Woodward et al. 2015). Low level benches will need to be ‘rebuilt’ before environmental flows can increase connectivity.
The decline in water quality on the Liverpool Plains has coincided with the expansion of agriculture, and in particular, cropping (Mawhinney 1998). Large areas of native grasses have been replaced by annual crops, leaving soils prone to erosion and increasing the amount of water leaking through the soil profile into shallow water tables. The result has been high concentrations of nutrients, sediment, salt and pesticides in surface water, highly saline water tables rising in response to recharge, causing soil salinity, and contamination of groundwater by nitrates, salt and pesticides (Timms 1997).
The detection of agricultural chemical residues, particularly the insecticide endosulfan in routine water samples was a major issue in the Namoi Catchment in the 1990s (Muschal 2001, Mawhinney 2005). Additional insecticides detected include chlorpyrifos, dimethoate and profenofos (Mawhinney 2011). Commonly detected herbicides included atrazine, diuron, fluometuron, metolachlar, prometryn, simazine, MCPA and 2,4-D. The highest concentrations of atrazine were detected in Mooki River at Ruvigne and Coxs Creek at Boggabri (Mawhinney 2011). The delivery of pesticides to the aquatic environment appeared largely dependent on rainfall and flooding. When routine pesticide monitoring ceased, the movement of chemical residues into the river system was reducing in response to the adoption of industry best management guidelines and improved agronomic practices (Mawhinney 2005).
5.3. Summary statistics Boxplots have been used to show general water quality trends across the valley, and to display monitoring site variability within the Namoi WRPA. The boxplots in Figure 14 show the annual 25th, 50th and 75th percentile values, with error bars indicating the 10th and 90th percentile values for each water quality attribute at each site. There are numerous plots within Figure 14; A) total nitrogen, B) total phosphorus, C) turbidity, D) total suspended solids, E) dissolved oxygen, F) pH and G) electrical conductivity. Summary statistics for the key water quality parameters at each monitoring site have been displayed as tables in Appendix D. Additional detail for each individual site is shown in Appendix E.
The two monitoring sites located on the Liverpool Plains (Mooki River and Coxs Creek) show elevated concentrations of total nitrogen and total phosphorus. In the regulated rivers there was a general trend of increasing nutrient concentrations with distance downstream, with the highest results in the Namoi River at
NSW Department of Planning, Industry and Environment | INT18/109352 | 30

Water quality technical report for the Namoi surface water resource plan area (SW14)
Goangra. Turbidity also increased with distance down the Namoi River, reflecting the impact of the cumulative effects of land use, soil disturbance and human activity on water quality.
Dissolved oxygen levels fluctuated between sites in response to local drivers. In most cases the site median was between 90 and 100% saturation. The highest readings were in the Cockburn River at Mulla Crossing while the lowest dissolved oxygen readings were in the upper catchment in the Macdonald River at Woolbrook. The pH in the Namoi WRPA is slightly elevated (basic) at some sites, but not to the extent where it would impact on the health of aquatic ecosystems or agricultural enterprises. The highest results were in the Mooki River at Breeza.
The Mooki River at Breeza and Peel River at Carroll Gap had the highest median electrical conductivity. The salt load in the Namoi River at Goangra exceeded the End-of-Valley target in the high flow years of 2010-2011 and 2011-2012. Annual median electrical conductivity and salt loads are summarised in Tables 21 and 22 in Appendix D.
Draftsman plots for each site have been developed to assess the relationships between water quality parameters. These figures are shown in Appendix E. Sites generally showed a positive correlation between total nitrogen, total phosphorus and turbidity, indicating similar transport mechanisms for the three parameters. The highest total nitrogen and total phosphorus concentrations tended to coincide with increased flow, indicating that the majority of the nutrients are derived from diffuse sources rather than point sources. There were occasional high nutrient readings during low flow, indicating a mixture of nutrient sources, such as point source pollution, livestock access or release of nutrients from bed sediments at some sites. In contrast to nutrients and turbidity, electrical conductivity was negatively correlated to flow, and decreased as salts were diluted by high flows.
NSW Department of Planning, Industry and Environment | INT18/109352 | 31

Water quality technical report for the Namoi surface water resource plan area (SW14)
Woolb
rook
Nam
oi at M
anilla
Cockburn
Riv
er
Peel at P
ara
dis
e
Peel at C
arr
oll G
ap
Mooki at B
reeza
Coxs a
t B
oggabri
Nam
oi at G
unnedah
Narr
abri
at N
arr
abri
Nam
oi at B
ugilbone
Nam
oi at G
oangra
0.0
0.5
1.0
1.5
2.0
2.5
3.0T
N (
mg/L
)
Woolb
rook
Nam
oi at M
anilla
Cockburn
Riv
er
Peel at P
ara
dis
e
Peel at C
arr
oll G
ap
Mooki at B
reeza
Coxs a
t B
oggabri
Nam
oi at G
unnedah
Narr
abri
at N
arr
abri
Nam
oi at B
ugilbone
Nam
oi at G
oangra
0.0
0.2
0.4
0.6
0.8
TP
(m
g/L
)
Woolb
rook
Nam
oi at M
anilla
Cockburn
Riv
er
Peel at P
ara
dis
e
Peel at C
arr
oll G
ap
Mooki at B
reeza
Coxs a
t B
oggabri
Nam
oi at G
unnedah
Narr
abri
at N
arr
abri
Nam
oi at B
ugilbone
Nam
oi at G
oangra
0
100
200
300
400
Turb
idity (
NT
U)
Woolb
rook
Nam
oi at M
anilla
Cockburn
Riv
er
Peel at P
ara
dis
e
Peel at C
arr
oll G
ap
Mooki at B
reeza
Coxs a
t B
oggabri
Nam
oi at G
unnedah
Narr
abri
at N
arr
abri
Nam
oi at B
ugilbone
Nam
oi at G
oangra
0
50
100
150
200
250
TS
S (
mg/L
)
Woolb
rook
Nam
oi at M
anilla
Cockburn
Riv
er
Peel at P
ara
dis
e
Peel at C
arr
oll G
ap
Mooki at B
reeza
Coxs a
t B
oggabri
Nam
oi at G
unnedah
Narr
abri
at N
arr
abri
Nam
oi at B
ugilbone
Nam
oi at G
oangra
40
60
80
100
120
140
DO
(%
satu
ration)
Woolb
rook
Nam
oi at M
anilla
Cockburn
Riv
er
Peel at P
ara
dis
e
Peel at C
arr
oll G
ap
Mooki at B
reeza
Coxs a
t B
oggabri
Nam
oi at G
unnedah
Narr
abri
at N
arr
abri
Nam
oi at B
ugilbone
Nam
oi at G
oangra
7.0
7.5
8.0
8.5
9.0
pH
Woolb
rook
Nam
oi at M
anilla
Cockburn
Riv
er
Peel at P
ara
dis
e
Peel at C
arr
oll G
ap
Mooki at B
reeza
Coxs a
t B
oggabri
Nam
oi at G
unnedah
Narr
abri
at N
arr
abri
Nam
oi at B
ugilbone
Nam
oi at G
oangra
0
250
500
750
1000
1250
1500
EC
(µS
/cm
)
A) B)
C) D)
E) F)
G)
Figure 14: Water quality data for water quality parameters by site
NSW Department of Planning, Industry and Environment | INT18/109352 | 32

Water quality technical report for the Namoi surface water resource plan area (SW14)
5.3.1.Total annual flow
Many water quality attributes are strongly correlated to river flow conditions. Flow during the 2010 to 2015 data period was characterised by high flows in 2010 and 2011, and low flow from 2013 to 2015. Keepit Dam had a storage capacity of approximately 25% in mid-2010. Following heavy rainfall in August and September 2010 the dam filled to 100% capacity. Split Rock Dam capacity increased from 20% to over 80% in 2011/2012. There were no significant inflows from 2013 to 2015. Figure 15 illustrates the total annual flow at selected gauging stations from the upland, midland and lowland areas. The use of total annual flow gives a general indication of river flow conditions. No attempt has been made to assess individual results against flow at the time of sampling, or the timing of sampling in relation to high or low flow events. The general trend at most sites were higher nutrient and turbidity results during the wetter years and lower during dryer years.
2010/2011 2011/2012 2012/2013 2013/2014 2014/2015
0
200000
400000
600000
800000
1000000
1200000
1400000
1600000
Tota
l annual flow
(M
L)
Macdonald at Woolbrook
Namoi at Manilla
Peel at Paradise weir
Namoi at Gunnedah
Namoi at Goangra
Figure 15: Annual flow (ML/year) at selected gauging stations
5.4. Local and expert knowledge Meetings were held with relevant stakeholders and technical experts to gather information and identify water quality issues relevant for the development of the Namoi WRPA water quality technical report. Following is a summary of the key water quality issues identified.
Cold water pollution from Keepit Dam - Cold water pollution generally extends from Keepit Dam to Gunnedah. There is also evidence of warming during winter.
Turbidity - Turbidity increases with distance downstream due to increasing intensity of human activity, changing soil types and carp hot-spots. It was also acknowledged that even though highly turbid, the lower Namoi can still support macroinvertebrate and fish communities.
Nutrients – The recent upgrade of the Tamworth Wastewater Treatment Plant and the commissioning of the farm reuse scheme has resulted in a reduction in nutrients being returned to the Peel River.
River salinity - River salinity is largely isolated to tributaries flowing from the Melville Range on the western side of the Peel River such as Goonoo Goonoo, Timbumburi and Tangaratta Creeks, and tributaries on the Liverpool Plains. The electrical conductivity in these tributaries is high, but the salts are diluted in the Namoi River by regulated flows from Keepit Dam.
Anoxic blackwater - Anoxic blackwater has not been identified as a major issue in the Namoi WRPA.
NSW Department of Planning, Industry and Environment | INT18/109352 | 33

Water quality technical report for the Namoi surface water resource plan area (SW14)
Toxicants – Herbicide and insecticide residues from historical and current agricultural practices, change of land use from grazing to cropping, aerial spraying and spray drift were identified as issues. Chemical residues can also enter the river when irrigation infrastructure fails. Due to the lack of current data, the risk from agricultural chemical residues is largely unknown. There is a general concern from fishers and landholders regarding toxicants associated with the irrigation of cotton. Mine water and leachate from coal mining activities and coal seam gas exploration in the Narrabri area are of concern to many in the local community.
Blue-green algae - Blue-green algae are an issue for recreational use in Chaffey Dam, Keepit Dam, Split Rock Dam, Yarrie Lake and the Namoi River at Walgett. Harmful algal blooms are not regularly detected elsewhere in the catchment, possibly due to high flow from irrigation releases over summer and high turbidity in the lower catchment. Chaffey Dam can release algae to the Peel River downstream when water is flowing over the morning glory spillway during an algal bloom.
Pathogens - There is an unknown risk from the high prevalence of septic systems across the catchment.
Other issues raised included major barriers to fish passage, supporting refugia, protecting flow events, releasing water to mimic natural flow events, discretionary or more effective use of supplementary/environmental water and addressing water quality data gaps. The issue whether the water currently available is enough to meet the environmental needs of the Namoi valley was also raised.
There have been numerous projects undertaken to help address water quality in the Namoi WRPA. These include, but not limited to:
Invasive weed control and habitat restoration on the Peel River, Tamworth;
Namoi recreational fishing reserve rehabilitation – Removing noxious, invasive and environmental weeds, re-vegetation with native species and removing rubbish along the Namoi River; and
Cushans Reserve and Gunnedah racecourse rehabilitation – Improve fish habitat through introduction of large woody habitat, removal of invasive weeds, riparian fencing and revegetation.
5.5. Risk assessment The impact of the quality of the water in the Namoi catchment on the health of water dependent ecosystems was assessed by identifying the risk. This was achieved by quantifying the impact based on instream values (consequence) and determining the probability of that consequence occurring (likelihood). Tables 12 to 16 list the sites with medium and high risk scores in the Namoi Risk Assessment (DoIW 2018b) for each parameter. Narrabri Creek at Narrabri was rated as a high risk for turbidity and total phosphorus. There are high risks for both total phosphorus and total nitrogen in the Macdonald River at Woolbrook, and for total phosphorus in the Mooki River at Breeza. The Peel River at Paradise Weir and Macdonald River at Woolbrook are a high risk for dissolved oxygen.
Table 12: Sites with high and medium risk to the health of water dependent ecosystems from turbidity
Site Name Consequence Likelihood Level of Risk
Peel River at Paradise Weir Very high Low Medium
Peel River at Carroll Gap Medium Medium Medium
Mooki River at Breeza Medium Medium Medium
Coxs Creek at Boggabri Low High Medium
Narrabri Creek at Narrabri Very high Medium High
Table 13: Sites with high and medium risk to the health of water dependent ecosystems from total phosphorus
Site Name Consequence Likelihood Level of Risk
Macdonald River at Woolbrook Medium High High
Peel River at Paradise Weir Very high Low Medium
Mooki River at Breeza Medium High High
NSW Department of Planning, Industry and Environment | INT18/109352 | 34

Water quality technical report for the Namoi surface water resource plan area (SW14)
Coxs Creek at Boggabri Low High Medium
Namoi River at Gunnedah Medium Medium Medium
Narrabri Creek at Narrabri Very high High High
Table 14: Sites with high and medium risk to the health of water dependent ecosystems from total nitrogen
Site Name Consequence Likelihood Level of Risk
Macdonald River at Woolbrook Medium High High
Peel River at Paradise Weir Very high Low Medium
Peel River at Carroll Gap Medium Medium Medium
Coxs Creek at Boggabri Low High Medium
Namoi River at Gunnedah Medium Medium Medium
Narrabri Creek at Narrabri Very high Low Medium
Table 15: Sites with high and medium risk to the health of water dependent ecosystems from pH
Site Name Consequence Likelihood Level of Risk
Macdonald River at Woolbrook Medium Medium Medium
Manilla River at Manilla Railway Bridge Medium Medium Medium
Peel River at Paradise Weir Very high Low Medium
Mooki River at Breeza Medium Medium Medium
Narrabri Creek at Narrabri Very high Low Medium
Table 16: Sites with high and medium risk to the health of water dependent ecosystems from dissolved oxygen
Site Name
Macdonald River at Woolbrook
Consequence
Medium
Likelihood
High
Level of Risk
High
Cockburn River at Mulla Crossing Medium Medium Medium
Peel River at Paradise Weir Very high Medium High
Narrabri Creek at Narrabri Very high Low Medium
The risk to the health of water dependent ecosystems in the Namoi River at Goangra (End-of-Valley site) from salinity was low. The risk to the health of water dependent ecosystems from the release of cold water from Keepit Dam was high. Chaffey Dam was rated as a medium risk and Split Rock Dam rated as a low risk.
The three major storages and selected river sites were routinely monitored for blue-green algae. When algal blooms occur, the level of human exposure can be reduced by implementing management practices. The risk at a site with a high recreational usage can be reduced by the management strategies of issuing algal alerts, placing algal warning signs at the site and informing users of the risks and dangers. Therefore when these warning arrangements are in place, a consequence value of low was used. The risk rating from blue-green algae to recreational use for Chaffey Dam was medium and all other sites, low.
6. Discussion Water quality attributes in the Namoi WRPA were strongly correlated to flow. High flow from rainfall and runoff can result in higher turbidity, nutrients and possibly pesticides and pathogens, but lower electrical conductivity. The Basin Plan water quality targets were developed using data collected from 1991 through to 2009 to try and incorporate a spread of climatic and flow conditions (Tiller and Newall 2010). It was noted that although the time period covered a range of conditions, the data used was primarily collected at base or low flow and generally missed high flow and flood events. It should be noted that as the Basin Plan targets refer to low flow conditions, targets for flow dependent attributes are likely to be exceeded in wetter years. There was a general
NSW Department of Planning, Industry and Environment | INT18/109352 | 35

Water quality technical report for the Namoi surface water resource plan area (SW14)
trend of higher nutrient and turbidity results in the wetter years from 2010 to 2012, with many very high results collected in these years and annual medians exceeding the Basin Plan targets.
There is a general trend toward increasing turbidity, total nitrogen and total phosphorus concentrations with distance down the catchment as cumulative impacts increase. Despite this trend, the Macdonald River at Woolbrook was one of the sites in the Namoi WRPA to be rated by the WaQI as poor. Mawhinney and Muschal (2015) identified the targets for zone C2 Border Rivers, Gwydir and Namoi (Montane) as being inappropriate. The poor rating for the Macdonald River may be as a consequence of an inappropriate target, rather than an indication of the quality of the water at the site. This issue will be addressed further in the WQMP.
6.1. Elevated levels of salinity Assessment of the discrete electrical conductivity data has shown the highest salinity results were in the Peel River at Carroll Gap and the Mooki River at Breeza. The electrical conductivity was negatively related to discharge, with the highest results occurring during low and cease to flow periods. Progressing down the catchment, electrical conductivity levels were low in the Namoi River, and remained stable with distance down the catchment.
The continuous electrical conductivity data showed the highest daily mean electrical conductivity was in the Mooki River at Ruvigne (1594 µS/cm) followed by Coxs Creek at Boggabri (1164 µS/cm). Irrigating with water from these rivers could impact on agricultural productivity and cause soil structure decline. Due to unreliable surface water flows in these two catchments, irrigation is largely reliant on groundwater, reducing the risk of crop damage and increased soil salinity.
Regulated flows from Keepit Dam dilute the salts entering the Namoi River from unregulated tributaries, keeping electrical conductivity low. The bulk of the water stored in Keepit Dam is sourced during major flooding. Floodwater generally has a low electrical conductivity. The release of this water from Keepit Dam provides dilution flows in the Namoi River. As the electrical conductivity is not increasing with distance down the catchment, this suggests there is limited contribution to base flow from shallow saline groundwater. This agrees with connectivity studies in the lower catchment which identifies the lower Namoi River as a losing stream (Parsons et al. 2008).
The median data from the unregulated catchments shows a gradual increase in electrical conductivity following the commencement of heavy rainfall across the catchment in July/August 2010. McGeoch et al. (2017) hypothesised that an episodic decline in salinity in NSW rivers during the 2000’s may have been due to extended drought conditions. Long periods of low rainfall can cause a drop in shallow groundwater levels, resulting in a disconnection between saline groundwater and fresher surface water, causing the observed lower salinity levels in streams. The return of wetter conditions in 2010 would have recharged shallow water tables, increasing the contribution of groundwater to low flows, raising the electrical conductivity. In some cases the median electrical conductivity had reached a peak in 2013-2014 and then started to decline in 2014-2015, following the return of dryer conditions. Future monitoring will show whether recent salinity observations in unregulated catchments persist at current levels or decrease across all sites as shallow saline groundwater aquifers decline.
The electrical conductivity of surface water in the lowland area is generally considered excellent for irrigation purposes, but can be higher in low flow periods. The mean daily electrical conductivity in Narrabri Creek at Narrabri fluctuates throughout the year, though results do not exceed the agriculture and irrigation salinity target. The highest electrical conductivity results were recorded in winter and the lower readings in summer. As the target is exceeded in winter, when there is less water utilised for irrigation, the risk of any impacts on soil and crop health is further minimised. The Namoi End-of-Valley site (Namoi River at Goangra) was identified as having a low salinity risk to aquatic ecosystems.
Maintaining low flow in unregulated catchments and ensuring that freshes are available to the environment, helps to break up stratification, provide dilution flows and prevent saline water from sitting on the bottom of pools. This will maintain the health of the river and the continued use of the water for productive purposes. River salinity is not a major water quality issue in the lower Namoi River, despite the salt inputs from the Peel and Mooki Rivers and Coxs Creek. All water released from Keepit Dam has a low electrical conductivity and
NSW Department of Planning, Industry and Environment | INT18/109352 | 36

Water quality technical report for the Namoi surface water resource plan area (SW14)
dilutes saline inflows from tributaries, ensuring water is suitable for irrigation and the protection of water dependent ecosystems.
A salinity assessment needs to consider land salinity, salt load and stream electrical conductivity in an integrated framework to determine the hazard of a landscape. The Namoi salinity technical report (DoIW 2018c) uses the Hydrogeological Landscapes (HGL) framework to undertake an assessment, as well as determine the likely cause and identify solutions. In addition, salinity modelling has been used to assess catchment behaviour, define problem areas and quantify impacts. The use of discrete and continuous long term salinity data in these modelling frameworks increased both the accuracy and utility of the salinity models. The salinity assessment in the Namoi valley salinity technical report will inform and give support to the WQMP and identify water, land and vegetation measures to increase productivity and environmental sustainability.
6.2. Elevated levels of suspended matter The draftsman plots show there was generally a linear relationship between turbidity and total suspended solids at most sites in the Namoi WRPA. Turbidity and suspended sediments are closely related to discharge, with a general trend of increasing turbidity with distance down the catchment. The Mooki River at Breeza had the highest median turbidity of the unregulated catchments, followed by Coxs Creek at Boggabri.
The decline in water quality on the Liverpool Plains has coincided with the expansion of agriculture, and in particular, cropping. Large areas of native grasses have been replaced by annual crops, leaving soils prone to erosion (Mawhinney 1998). In addition, stock grazing, removal of groundcover, trampling and pugging by livestock, destabilising soils and erosion of stream banks, can all lead to increased turbidity (Wilson et al. 2008; Holmes et al. 2009). Carp contribute to increased turbidity by stirring up sediments when feeding, uprooting aquatic vegetation, and increasing bank destabilisation (Koehn 2004). Carp are common throughout most of the WRPA, and wetlands in the Namoi catchment have been identified as a carp breeding hot-spot for the Murray-Darling Basin (Gilligan et al. 2009).
High turbidity and suspended sediment is an issue throughout the floodplain area. High levels of turbidity are likely influenced by the combination of a number of factors including historical grazing practices, the wide spread conversion of land for cropping, bank and riparian condition, and presence of carp. Rapidly ascending and descending limbs of the hydrograph during irrigation releases can be responsible for channel erosion downstream of Keepit Dam. The fertile alluvial soils in the Liverpool Plains and lower Namoi River have a high clay content, which increases their susceptibility to resuspension within the water column. In addition, the very fine clay particles are able to remain in suspension during low flows.
The Namoi catchment is extensively cropped, and the mid to late 1990’s saw the widespread adoption of conservation farming practices such as minimum/zero till, stubble retention and a shift away from long fallowing. A reduction in turbidity levels in response to land and vegetation management practices will take time, as sediment transport down the Namoi River is very inefficient, and large volumes of sediment need to be reworked through the system. Future monitoring will indicate whether turbidity observations show the benefits of the introduction of land and catchment management practices.
River Styles® recovery potential (Figure 15) is synonymous with geomorphic condition. Recovery potential represents geomorphic stability and can indicate the capacity of a stream to return to good condition or to a realistic rehabilitated condition (Brierley and Fryirs 2005). Streams rated as having conservation or rapid recovery potential are likely to be the most stable and in a good condition, whereas streams with low recovery potential may never recover to a natural condition or may continue to decline quickly without intervention (Cook and Schneider 2006).
The highest priority for intervention action is the strategic recovery potential reaches. These are reaches of river that may be sensitive to disturbance, triggering impacts that can have off-site effects. Particular emphasis should be placed on reaches or point-impacts (nick-points), where disturbances may threaten the integrity of remnant or refuge reaches. Figure 16 identifies conservation and strategic recovery potential reaches throughout the Namoi River catchment. Proactive management strategies in these areas are the most effective means of river conservation, leading to improvements in water quality.
There are long reaches in the Peel River, Mooki River and Coxs Creek catchments, and the upper Manilla River near Barraba with low recovery potential, suggesting sparse riparian vegetation, erosion of the stream
NSW Department of Planning, Industry and Environment | INT18/109352 | 37

Water quality technical report for the Namoi surface water resource plan area (SW14)
bed and stream bank and low instream geomorphic diversity. These reaches are likely sources of suspended sediment. Inversely, the majority of the Namoi River has a high recovery potential. Lampert and Short (2004) identified that actions should be targeted in the Pilliga outwash streams and the Upper Macdonald River, as these areas contain conservation and strategic reaches with a high proportion of fragile and rare River Styles.
Figure 16: River styles recovery potential in the Namoi catchment
In the unregulated catchments, land and vegetation management are the key drivers for sediment entering waterways. The principal factor generating high sediment loads (and associated nutrients) is loss of vegetation in the catchment and/or the riparian zone, leading to increased hillslope, gully and bank erosion and suspended sediment loads in the river. The main sources of sediment are gully erosion in degraded areas and hillslope erosion where cover is seasonally low through grazing or tillage of cropped lands (National Land and Water Resources Audit 2001). The implementation of flow rules in these catchments will have little impact on reducing sediment inputs. In the regulated system, reducing the extent of bank erosion and slumping is possible through a more natural, gradual rising and falling limb of water releases from Chaffey, Split Rock and Keepit Dams.
6.3. Elevated levels of nutrients The lowest nitrogen and phosphorus concentrations in the Namoi WRPA were in the Cockburn River. This is a reflection of the low soil nutrients in parts of the Cockburn catchment area. The highest results were in the Mooki River and Coxs Creek. The basalt geology of the Liverpool Ranges produces soil with naturally high nitrogen and phosphorus (Figures 17 and 18). There was a gradual increase in nutrient concentrations with distance down the Namoi River reflecting the impact of the cumulative effects of land use, soil disturbance and human activity on water quality. Macdonald River at Woolbrook had a high risk to water dependent ecosystems from both total nitrogen and total phosphorus. Narrabri Creek at Narrabri and the Mooki River at Breeza also had a high risk for total phosphorus.
NSW Department of Planning, Industry and Environment | INT18/109352 | 38

Water quality technical report for the Namoi surface water resource plan area (SW14)
Nitrogen and phosphorus concentrations generally followed similar trends, indicating similar transport processes drive both parameters. Nutrients are usually attached to soil particles and mobilised by runoff and erosion during rainfall events, with higher concentrations at high flow. The only site not to follow this trend was the Peel River at Carroll Gap, where total phosphorus results were higher in the low flow years from 2007 to 2010, and then decreased with higher flows from 2010 to 2012. This suggests phosphorus was being derived from a point source, rather than diffuse sources. A new wastewater treatment plant and water reuse farm for Tamworth came online in 2010. Treated water that was previously returned to the Peel River is now delivered to a reuse farm. The lower total phosphorus results from 2013 to 2015 suggest the works were reducing nutrient inputs to the Peel River.
Concentrations of total nitrogen and total phosphorus in the Macdonald River at Woolbrook, above the Basin Plan target, resulted in a poor WaQI score of 42. Total phosphorus and total nitrogen was deemed to be a high risk to aquatic ecosystems at this site. The montane zone in the Namoi catchment is a priority area to develop local targets to determine if the low WaQI score at this site is due to poor water quality, or as a consequence of an inappropriate water quality target. The National Water Quality Management Strategy recommends and provides guidance for the development of regional and local targets. NSW has not developed targets beyond the default trigger values of the ANZECC Guidelines (2000) and therefore required to use the Basin Plan water quality targets for reporting or commit to the development of regional or location specific guidelines.
The Liverpool Plains are recognised as the largest dryland summer cropping area in NSW and the alluvial clay soils in this catchment are naturally high in phosphorus (Banks 1995). As these soils are eroded into the river system by floods and runoff events, the associated nutrients are transported downstream. Despite ongoing land management activities, the nutrient concentrations will continue to remain high in the Mooki River and Coxs Creek, and are unlikely to improve in the short term. The Liverpool Plains could have separate localised targets from the rest of the Namoi upland zone (B2), or accept that the targets are likely to be exceeded every year. The high concentrations of phosphorus from the Liverpool Plains also impacts upon Narrabri Creek at Narrabri which is located at the bottom of zone B2 at the boundary with the Namoi lowland zone (A2).
As for sediment, land and vegetation management are the key drivers for nutrients entering waterways in unregulated rivers. The implementation of flow rules upstream of major storages will have little impact on nutrient management. In the regulated system, reducing the extent of eutrophication caused by bank slumping is possible through a more natural, gradual rising and falling limb of water releases.
NSW Department of Planning, Industry and Environment | INT18/109352 | 39

Water quality technical report for the Namoi surface water resource plan area (SW14)
Map produced by NSW Industry I Lands & Water 30 August 2018
" Towns
Rivers
Namoi Boundary
Soil Total Nitrogen 0-5cm
Value
High : 0.776694
Low : 0.030852
Data Sources:
NSW Industry I Lands & Water I Water.
Office of Environment and Heritage.
Murray Darling Basin Authority.
Geoscience Australia.0 20 40 60 80
kilometres
±
"
"
"
"
"
"
""
"
"
WALGETT
COONAMBLE
MANILLA
NARRABRI
WEE WAA
PILLIGA
NUNDLEQUIRINDI
GUNNEDAH
TAMWORTH
NAMOI WATER RESOURCE PLAN AREA- SOIL TOTAL NITROGEN
Mur
ray
Darli
ng
Ba
sin
Figure 17: Soil total nitrogen for the Namoi catchment
Map produced by NSW Industry I Lands & Water 30 August 2018
" Towns
Rivers
Namoi Boundary
Soil Total Phosphorus 0-5cm
Value
High : 0.270717
Low : 0.0111924
Data Sources:
NSW Industry I Lands & Water I Water.
Office of Environment and Heritage.
Murray Darling Basin Authority.
Geoscience Australia.0 20 40 60 80
kilometres
±
"
"
"
"
"
"
""
"
"
WALGETT
COONAMBLE
MANILLA
NARRABRI
WEE WAA
PILLIGA
NUNDLEQUIRINDI
GUNNEDAH
TAMWORTH
NAMOI WATER RESOURCE PLAN AREA- SOIL TOTAL PHOSPHORUS
Murr
ay
Darlin
gB
asin
Figure 18: Soil total phosphorus for the Namoi catchment
NSW Department of Planning, Industry and Environment | INT18/109352 | 40

Water quality technical report for the Namoi surface water resource plan area (SW14)
6.4. Elevated levels of cyanobacteria Harmful algal blooms are a regular occurrence in Chaffey Dam, with the numbers of potentially toxic blue-green algae reaching the red alert level for recreational use most summers, and remaining on red alert for some months. Nutrient rich inflows from the upper catchment combined with warm, still water during summer, provide ideal conditions for algal growth.
Water is released from Chaffey and Split Rock Dams is via multi-level offtake towers. During algal blooms, the offtake depth is usually set at a lower depth, to minimise the release of blue-green algae from the water surface of the storage into the river downstream. Chaffey Dam had a medium risk to human health from blue-green algae, however the risk in the Peel River downstream of the dam was low. Providing safe water for downstream water users takes precedence over the impact of releasing cold water from below the thermocline. Chaffey Dam can seed the Peel River downstream with algae when water is flowing over the morning glory spillway during and algal bloom.
Phosphorus and nitrogen concentrations are generally not limiting to algal growth in the Namoi WRPA. Despite this, algal blooms are rare in the Namoi River, except for Walgett, indicating that other factors such as flow, turbidity and light availability are the limiting factors. The release of large volumes of water for irrigation over summer results in turbulent, high velocity water, which is not suitable for algal growth. Algal blooms can develop in Yarrie Lake over summer and in the Namoi River at Walgett during low flows.
Nutrient management in the catchment area of all three major storages is essential to reduce the risk of algal blooms within the dams. When algal blooms do occur, the level of human exposure can be reduced by implementing the established algal management framework. The risk at a site with a high recreational usage can be reduced via implementing the management strategies of erecting algal warning signs and informing users of the health risks, dangers and symptoms of ingesting or coming into contact with blue-green algae.
6.5. Water temperature outside natural ranges There are three large storages located in the Namoi WRPA; Chaffey, Split Rock and Keepit Dams. Keepit Dam has been identified as likely to cause severe cold water pollution, while Chaffey and Split Rock Dams release water via multi-level intake towers, and are expected to cause minor cold water pollution (Preece 2004).
Cold water pollution impacts below Chaffey and Split Rock Dams are relatively small and localised to the area immediately downstream of the dams, due to the typically small discharges and shallow withdrawal depth. Future assessments will identify if the completion of upgrade works to increase the storage capacity of Chaffey Dam influences cold water pollution impacts downstream.
Chaffey Dam has a long history of blue-green algal blooms. In September 2012, potentially toxic blue green algae were being released into the Peel River via the morning glory spillway. Tamworth town water supply is taken from the Peel River approximately 46 km downstream of Chaffey Dam. In this situation, water was released through the trash racks, which were lowered to mitigate against the continued release of algal rich water, resulting in the release of cold water over the 2012/2013 summer. The cold water impacts appear to be limited to immediately downstream of Chaffey Dam, with the water returning to a more natural temperature before Paradise Weir at Tamworth.
There is some thermal depression evident immediately downstream of Split Rock Dam during summer, particularly during 2012/2013. However, due to the low volumes of water being released, this does not persist down to the Namoi River at Manilla Railway Bridge (419022), restricting the impacts to immediately downstream of the dam. During a bulk water transfer from Split Rock to Keepit in 2013/2014, approximately 270 000 ML was released, reducing the storage capacity of Split Rock Dam from 85% down to 20%. The release of large volumes of up to 4 000 ML/day meant the cold water impacts did extend 35 km down to the Manilla monitoring site and possibly to the upper reaches of the impoundment of Keepit Dam.
In most years the median water temperature downstream of Split Rock Dam tracks closely with the 20th
percentile reference in summer and the 80th percentile reference in winter. This suggests the multi-level offtake can be used to minimise cold water pollution. The median water temperature downstream was lower than the reference site 20th percentile in the summers of 2012/2013 and 2013/14. The 2013/2014 results were due to
NSW Department of Planning, Industry and Environment | INT18/109352 | 41

Water quality technical report for the Namoi surface water resource plan area (SW14)
the bulk water transfer. High numbers of blue-green algae were present in Split Rock Dam in 2012/2013 at the amber alert level for recreational use. The trash racks may have been left at a lower depth to avoid releasing algal rich water downstream.
Regulated discharge from Keepit Dam is made via two fixed level pipes through the wall, with the intake centreline of both approximately 24 m below full storage level. The largest discharges take place between September and January. Keepit Dam has a relatively shallow mean depth (<10m), and large surface area. This means that thermal stratification can break down during summer, particularly at lower storage capacities, resulting in uniform water temperature from the surface to the bottom of the storage. An analysis of Keepit’s impact suggests the natural temperature regime of the Namoi River recovers within 100 km of the dam (Preece and Jones 2002).
Despite Keepit Dam releasing water from the bottom of the storage, there is only a relatively small thermal impact downstream. The temperature data for the North Cuerindi (upstream of Keepit Dam) and Gunnedah (downstream) sites are very similar, suggesting that water temperature has largely returned to a natural regime by Gunnedah. The storage volume from 2011 to 2012 was close to 100%. In these years the median water temperature downstream is less than the reference 20th percentile due to deeper water at the wall. From 2013 to 2016 the storage capacity in Keepit Dam was less than 50%. The shallow water depth means that mixing of the surface and bottom waters is likely to occur, resulting in the median water temperature downstream staying between the reference 20th and 80th percentile range. In a typical irrigation season, most of the cold hypolimnion can be removed through releases, effectively destratifying the water column earlier in the year (Boys et al. 2009). In addition, during high volume releases, water is drawn into the outlet from a range of depths rather than purely from the bottom of the storage. In this case, warmer water from closer to the surface would be drawn into the outlet, helping to raise the temperature of the water being released.
6.6. Dissolved oxygen outside natural ranges The dissolved oxygen levels at most sites was within the target range for the majority of the data period. During low and cease to flow periods dissolved oxygen levels become unpredictable and fluctuate from very high to very low. These variations are primarily driven by the response of instream biota in these rivers. High organic carbon, nutrients and water temperatures result in increased microbial respiration. High turbidity and suspended sediment during these times reduces light availability and likely reduces primary production.
In the Peel River at Paradise Weir, dissolved oxygen was often higher during low flow periods, likely due to sediment settling out of the water column, high nutrient concentrations, increased light penetration and increased photosynthesis from aquatic plant growth. The Paradise Weir site is also located in a large pool, which may be providing more suitable conditions for aquatic plant growth. The Peel River at Paradise Weir had a high risk to water dependent ecosystems from dissolved oxygen largely due to the very high consequence rating.
In addition to these factors, the solubility of oxygen decreases as water temperature increases, resulting in reduced dissolved oxygen levels. Namoi River at Bugilbone and Goangra are both located at the bottom of the catchment where a combination of low flow and warm, turbid water temperature can result in lower dissolved oxygen levels.
The annual median in the Macdonald River at Woolbrook was less than the 90% saturation lower limit in all years, resulting in a high risk to water dependent ecosystems. Dissolved oxygen concentrations fluctuate on a 24 hour basis. Dissolved oxygen increases during daylight hours when photosynthesis is occurring and decreases at night when respiration continues but photosynthesis does not. The water quality sampling program was designed to try and collect samples at approximately the same time of the day each month to allow for the assessment of trends. Samples at the Woolbrook site were generally collected early in the morning when dissolved oxygen would have been low.
The Basin Plan dissolved oxygen target ranges were designed specifically to be applied to monthly data, and provide an indication of any issues. Monitoring of dissolved oxygen is currently conducted monthly, however it does not capture the full diurnal variation. To fully capture dissolved oxygen dynamics, continuous monitoring during a range of hydrologic and seasonal conditions is required.
NSW Department of Planning, Industry and Environment | INT18/109352 | 42

Water quality technical report for the Namoi surface water resource plan area (SW14)
As for water temperature, there are no data available on the influence both within and downstream of the numerous weir structures on dissolved oxygen levels in the lower Namoi River.
Maintaining low and base flows through cease and commence to pump rules and protection of small freshes in unregulated catchments assist in flushing or turning over stratified pools. This breaks down the stratification and prevents water on the bottom of pools from becoming anoxic and unsuitable for aquatic fauna. In addition, low flows help prevent excessive algal and aquatic macrophyte growth which can result in supersaturated oxygen conditions.
During periods of extreme drought, when there are minimal releases from the major storages, the Namoi River can dry to a series of standing pools. The quality of the water in these remnant pools can be poor with low dissolved oxygen and increased nutrients and electrical conductivity. The frequency of these events occurring in the Namoi WRPA is low.
6.7. Elevated levels of pesticides and other contaminants Historically, pesticide residues have been a pollutant in the Namoi catchment with concern amongst water managers, industry groups and the community as a whole about the effects of exposure to agricultural chemicals on humans and the environment. Pesticide contamination in the Namoi valley was found to be reducing up until the mid-2000s when monitoring ceased (Mawhinney 2011). Development and implementation of the cotton industry’s best management practice guidelines and the introduction of genetically modified Bt resistant cotton each contributed to a trend of declining levels of insecticide and herbicide residues in waterways. However, the continued detection of herbicides used in dryland agriculture shows a need for natural filters such as grassed waterways, natural grasslands or vegetated buffer strips to reduce chemical concentrations in runoff and aerial drift. The management of agricultural chemical residues in rivers cannot be achieved through flow management.
There are no current monitoring data on the presence of toxicants in this area.
6.8. pH outside natural ranges The annual median pH at most sites was within the Basin Plan upper and lower limits. No sites were identified as having a pH at high risk of impacting the health of aquatic ecosystems. Soil pH generally increases with distance down the Namoi catchment, with the highest pH on the Liverpool Plains (Figure 19). This is reflected in the water quality results, with the lowest pH at the top of the catchment (Macdonald River at Woolbrook), and the highest pH results in the Mooki River and Coxs Creek. The pH tended to be more alkaline that acidic, but not to the extent where it would impact on aquatic ecosystems.
NSW Department of Planning, Industry and Environment | INT18/109352 | 43

Water quality technical report for the Namoi surface water resource plan area (SW14)
Map produced by NSW Industry I Lands & Water 30 August 2018
" Towns
Rivers
Namoi Boundary
Soil pH 0-5cm
Value
High : 7.91633
Low : 3.65925
Data Sources:
NSW Industry I Lands & Water I Water.
Office of Environment and Heritage.
Murray Darling Basin Authority.
Geoscience Australia.0 20 40 60 80
kilometres
±
"
"
"
"
"
"
""
"
"
WALGETT
COONAMBLE
MANILLA
NARRABRI
WEE WAA
PILLIGA
NUNDLEQUIRINDI
GUNNEDAH
TAMWORTH
NAMOI WATER RESOURCE PLAN AREA- SOIL pH
Mur
ray
Darli
ng
Ba
sin
Figure 19: Soil pH for the Namoi catchment
6.9. Elevated pathogen counts There are no current data on the extent of pathogens in the Namoi WRPA. It is expected that with ongoing inputs of human and animal waste, and access of stock and animals to rivers and streams, that pathogens would be present in waterways. Higher counts would be expected following rainfall and runoff flushing contaminants into the rivers. Similarly, high counts may be common during low flows in areas with point source pollution. There is an unknown risk from the high prevalence of septic systems across the catchment. As for other pollutants, pathogens cannot be managed through water planning.
6.10. Knowledge gaps Dissolved oxygen
Dissolved oxygen is not currently monitored immediately downstream of Keepit Dam. It is anticipated that water drawn from the bottom of the dam would have very low dissolved oxygen levels. It is not known if turbulence from the process of releasing the water from Keepit Dam re-oxygenates the water as it enters the river. Or, how far downstream the water needs to flow before it becomes oxygenated to a level suitable for aquatic organisms.
Dissolved oxygen data in the Namoi WRPA is collected monthly, which does not cover the full diurnal variation in the water column. Efforts are made to collect samples at approximately the same time each month to allow comparison at a site through time. However, this can result in some sites having a low median, because the data is routinely collected earlier in the morning, or inversely, high readings because the samples are collected later in the afternoon. The Basin Plan dissolved oxygen targets were developed to accommodate monthly data. However continuous real time data would provide a complete picture of dissolved oxygen variability. There are currently no continuous dissolved oxygen monitoring sites in the Namoi WRPA.
NSW Department of Planning, Industry and Environment | INT18/109352 | 44

Water quality technical report for the Namoi surface water resource plan area (SW14)
Water temperature
Clearing of vegetation in the riparian zone and poor geomorphic condition can lead to increased sunlight reaching the water surface, resulting in increased water temperatures. The extent and scale of this form of increased thermal pollution is unknown.
There are no data available on the influence both within and downstream of the numerous weir structures on water temperature in the lower Namoi River.
Event based monitoring
The current water quality monitoring program targets low and base flow conditions with limited, high flow event based monitoring. High velocity water is generally required to transport large concentrations and loads of suspended sediment and associated nutrients, pesticides and pathogens. Suspended solids and nutrients tend to increase during high river flow, when particulate matter is washed from the catchment, bank erosion contributes material and/or bed sediments are resuspended in the water column. The high velocity water in the upper catchment is capable of carrying greater quantities of sediment and nutrients. As the stream bed flattens out across the floodplain, these nutrient rich suspended particles fall out of suspension and are deposited on the floodplain and into river sediments. For streams upstream of the major storages, this material is deposited in the dam, settling out of the water column and providing a source of nutrients to sustain algal blooms. The deposition of sediment in the dam results in less material for instream bar and bench formation downstream.
Hazard mapping
Spatial modelling to develop hazard mapping, utilising the range of data sets available such as, riparian vegetation cover and geomorphic condition, and overlaying soil erosion risk areas, soil nitrogen and soil phosphorus could identify key areas most likely to contribute to poor water quality and guide the implementation of management decisions. In addition, the mapping and identification of high priority refuge pools would assist in the monitoring and delivery of water to maintain water quality suitable for water depended ecosystems during extended dry periods.
Additional water quality monitoring sites
There is also only one monitoring site located in the Montane water quality zone (Macdonald River at Woolbrook). Additional sites would provide a more accurate assessment of the quality of the water in this zone.
The current New South Wales surface water quality monitoring program has been in operation since 2007. It was established and designed to meet the objectives and data requirements at the time. A revision of the state wide water quality monitoring program is required to better meet the requirements of the Basin Plan and to fill identified information gaps.
Agricultural chemical, toxicants and pathogen data
There are no current data on the concentrations of agricultural chemicals in the creeks and rivers of the Namoi WRPA. As large quantities of insecticides and herbicides are used in the catchment, and the main transport mechanisms for their movement in the environment still exist, it is assumed that there is a risk that chemical residues are present in waterways. Without monitoring data, we cannot determine which chemicals are present, when, or the concentration. Similarly, it is only assumed that there are pathogens present in the waterways and toxicants in some areas.
Development of local water quality targets
It has been identified that some of the Basin Plan water quality targets may not be appropriate for some parameters, in some zones, particularly the Namoi Montane zone, and tributaries draining the Liverpool Plains. It was also identified that there are no relevant electrical conductivity targets for the Namoi WRPA, other than the End-of-Valley site on the Namoi River at Goangra. Time frames do not allow for the development of local targets before the completion of the WQMP, but they will be incorporated as a long-term strategy in the plan.
NSW Department of Planning, Industry and Environment | INT18/109352 | 45

Water quality technical report for the Namoi surface water resource plan area (SW14)
7. Conclusion The quality of the water in a river or stream is a reflection of underlying climate and geology and the multiple activities occurring in a catchment area. There are numerous factors contributing to the observed results, many of which are outside the influence of flow management and therefore cannot be addressed through water planning alone.
In unregulated catchments, greater emphasis must be focused on preventing pollutants such as sediment and nutrients from entering waterways through land, soil and vegetation management. As sediment is a major transport mechanism for many pollutants, practices such as maintaining groundcover, vegetated buffer strips and good agronomic practices together with management of riparian vegetation to reduce stream bank erosion provide simple and effective means to improve water quality. Land and vegetation management does not only address water quality issues in the rivers, but also harmful algal blooms in Chaffey, Split Rock and Keepit Dams.
In the regulated system, issues of dissolved oxygen, contribution of sediment and nutrients through bank slumping, dissolved organic carbon and to a lesser degree, cold water pollution can be addressed through the implementation of flow rules.
There are opportunities for government agencies, including NSW Local Land Services (LLS), Office of Environment and Heritage (OEH), DPI Fisheries and DPI Agriculture to work closely with DoI Water in managing external constraints through complementary measures. Collaboration between natural resource management groups to examine alignment of priorities has been a continued focus of NSW Government (NRC 2010). Alignment of natural resource management continues to be identified as a priority for LLS (Local Land Services 2016) and for the management of environmental water and water quality in New South Wales (OEH 2014). Alignment of priorities for river management will assist in strengthening the outcomes of mitigation measures.
The information and data analysis from this report will support the development of the Namoi Water Quality Management Plan (WQMP). Based on the water quality data and information available, water quality objectives for the Namoi WRPA will be formulated where there are flow ‘levers’ available to water managers. The WQMP will consider the impacts of wider natural resource and land management on water quality within the Namoi water resource plan area. It will provide a framework to protect and maintain water quality that is ‘fit for purpose’ for a range of outcomes. These uses and activities may include irrigation of crops, maintaining a healthy environment, recreational fishing or cultural and spiritual links to Country for Aboriginal communities.
NSW Department of Planning, Industry and Environment | INT18/109352 | 46

Water quality technical report for the Namoi surface water resource plan area (SW14)
References Abbasi, T., and S. A. Abbasi. 2012. Water quality indices. Elsevier.
Achterberg, E. P. 2014. Grand challenges in marine biogeochemistry. Frontiers in Marine Science 1: 7.
Anderson, D. M., P. M. Glibert, and J. M. Burkholder. 2002. Harmful algal blooms and eutrophication: nutrient sources, composition, and consequences. Estuaries 25: 704-726.
ANZECC and ARMCANZ. 2000. Australian guidelines for water quality monitoring and reporting. Australian and New Zealand Environment and Conservation Council and Agriculture and Resource Management Council of Australia and New Zealand. ISBN 09578245 1 3
APHA. 1995. Methods for the examination of water and waste water. American Public Health Association, Washington, DC.
Astles, K. L., R. K. Winstanley, J. H. Harris, and P. C. Gehrke. 2003. Regulated Rivers and Fisheries Restoration Project – Experimental study of the effects of cold water pollution on native fish. SW Fisheries Final Report Series No.44. NSW Fisheries Research Institute.
Austin, J., L. Zhang, R. N. Jones, P. Durack, W. Dawes, and P. Hairsine. 2010. Climate change impact on water and salt balances: an assessment of the impact of climate change on catchment salt and water balances in the Murray-Darling Basin, Australia. Climatic change 100: 607-631.
Banks, R.G. 1995. Soil Landscapes of the Curlewis 1:100 000 Sheet. Department of Conservation and Land Management.
Bauer, J. E., W.-J. Cai, P. A. Raymond, T. S. Bianchi, C. S. Hopkinson, and P. A. Regnier. 2013. The changing carbon cycle of the coastal ocean. Nature 504: 61-70.
Boulton, A., M. Brock, B. Robson, D. Ryder, J. Chambers, and J. Davis. 2014. Australian freshwater ecology: processes and management. John Wiley & Sons.
Boys C, Miles, N. and Raynor T. 2009. Scoping options for the ecological assessment of cold water plooution mitigation downstream of Keepit Dam, Namoi River. Report prepared for the Murray Darling Basin Authority. NSW Department of Primary Industries. ISBN 978-1-921257-82-7.
Brierley, G and Fryirs K. 2005. Geomorphology and river management: application of the river styles framework. Blackwell Publications, Oxford, UK.
Brock, M. A., D. L. Nielsen, and K. Crossle. 2005. Changes in biotic communities developing from freshwater wetland sediments under experimental salinity and water regimes. Freshwater Biology 50: 1376-1390.
Brookes, A. 1986. Response of aquatic vegetation to sedimentation downstream from river channelisation works in England and Wales. Biological Conservation 38: 351-367.
Brown, R. M., N. I. McClelland, R. A. Deininger, and R. G. Tozer. 1970. A water quality index - do we dare? Water Sew Works 117: 339-343.
Bruton, M. 1985. The effects of suspensoids on fish. Hydrobiologia 125: 221-241.
Buckland, S., Abid, A., Scott, B., Lovell, B., Fuller, D. 2008. Final Report – Improving Victoria’s surface water monitoring project – turbidity assessment methods. Prepared for West Gippsland Catchment Management Authority.
Caffrey, J. M. 2004. Factors controlling net ecosystem metabolism in US estuaries. Estuaries 27: 90-101.
Caitcheon, G.C., Beavis, S.G., Crapper, P., Deitrich, C.R., Green, T.R., Hancock, G., Jakeman, A.J., Olley, J.M., Olley, J.M., Wallbrink, P.J. and Zhang, L. 1999. Sediment and phosphorus sources in the Namoi River Basin. Compiled and edited by Caitcheon GC. CSIRO Land and Water and Australian National University.
Chapman, P. M., F. Wang, C. Janssen, G. Persoone, and H. E. Allen. 1998. Ecotoxicology of metals in aquatic sediments: binding and release, bioavailability, risk assessment, and remediation. Canadian Journal of Fisheries and Aquatic Sciences 55: 2221-2243.
Chorus, I., and J. Bartram. 1999. Toxic cyanobacteria in water: a guide to their public health consequences, monitoring and management.
NSW Department of Planning, Industry and Environment | INT18/109352 | 47

Water quality technical report for the Namoi surface water resource plan area (SW14)
Closs, G.B., Downes, B. and Boulton A. 2003. Freshwater ecology: a scientific introduction. Blackwell Publishing, Malden, Massachusetts, USA. ISBN 978-0-632-05266-0
Commonewalth Environmental Water Office. 2016. Portfolio Management Plan: Namoi River Valley 2016-2017. Comonwealth of Australia.
Cook, N. and Schneider, G. 2006. River Styles® in the Hunter Catchment. Science and Information Division, New South Wales Department of Natural Resources, Sydney, NSW.
Cormier, S. M. 2006. Ecoepidemiology: a means to safeguard ecosystem services that suport human welfare., p. 57-72. In G. Arapis, N. Goncharova and P. Baveye [eds.], Ecotoxicology, Ecological Risk Assesment and Multiple Stressors: NATO security through science series. Springer.
Cormier, S. M., S. B. Norton, and G. W. Suter. 2003. The US Environmental Protection Agency's Stressor Identification Guidance: A process for determining the probable causes of biological impairments. Human and Ecological Risk Assessment: An International Journal 9: 1431-1443.
Cude, C. G. 2001. Oregon water quality index a tool for evaluating water quality management effectiveness. Journal of American Water Resources Association 37: 125-137.
Davis, J. R., and K. Koop. 2006. Eutrophication in Australian rivers, reservoirs and estuaries - a southern hemisphere perspective on the science and its implications. Hydrobiologia 559: 23-76.
Deal, R 1997. Bacteriological quality of the state’s river systems for 1995/1996. CNR97.008. Centre for Natural Resources. Department of Land and Water Conservation, Parramatta.
Deal, R and Wood, J. 1998. Bacteriological quality of the state’s river systems for 1996/1997. CNR97.095. Centre for Natural Resources. Department of Land and Water Conservation, Parramatta. ISSN 1329-6434.
Dent, D. and L. Pons. 1995. A world perspective on acid sulphate soils. Geoderma 67: 263-276.
Department of Environment, Water, Heritage and Arts. 2008. Australian Wetlands Database: Directory of Important Wetlands in Australia. Australian Government, Canberra. Accessed online 27/11/2017, http://www.environment.gov.au/water/topics/wetlands/database/diwa.html
Dinius, S. 1987. Design of an index of water quality. Water Resources Bulletin 23: 823-843.
DIPNR. 2003. Point source salinity investigation project, Namoi Valley. Report prepared for the Namoi Catchment Management Authority by the Department of Infrastructure Planning and Natural Resources, Tamworth.
Dodds, W. K. 2006. Nutrients and the “dead zone”: the link between nutrient ratios and dissolved oxygen in the northern Gulf of Mexico. Frontiers in Ecology and the Environment 4: 211-217.
DoIW. 2018a. Namoi water resource plan surface water resource description. Department of Industry, Water, Parramatta.
DoIW. 2018b. Risk assessment of the Namoi water resource plan area (SW14). Department of Industry, Water, Parramatta.
DoIW. 2018c. Namoi salinity technical report. Department of Industry, Water, Parramatta.
Dunlop JE., Horrigan N., McGregor G., Kefford BJ., Choy S. and Prasad R. 2008. Effect of spatial variation on salinity tolerances of mactoinvertebrates in Eastern Australia and implications for ecosystem protection trigger values. Environmental Pollution 151: 621-630.
Dyer, F.J., and Thoms, M. C. 2006. Managing river flows for hydraulic diversity: an example of an upland regulated gravel-bed river. River Research and Applications. 22: 257–267.
Erskine, W. D., M. J. Saynor, A. Chalmers, and S. J. Riley. 2012. Water, wind, wood, and trees: Interactions, spatial variations, temporal dynamics, and their potential role in river rehabilitation. Geographical Research 50: 60-74.
Ferguson, C. M., B. G. Coote, N. J. Ashbolt, and I. M. Stevenson. 1996. Relationships between indicators, pathogens and water quality in an estuarine system. Water Research 30: 2045-2054.
Fong, T.T., and E. K. Lipp. 2005. Enteric viruses of humans and animals in aquatic environments: health risks, detection, and potential water quality assessment tools. Microbiology and molecular biology reviews 69: 357-371.
NSW Department of Planning, Industry and Environment | INT18/109352 | 48

Water quality technical report for the Namoi surface water resource plan area (SW14)
Gilligan, D., Hartwell, D. and McGregor, C. 2009. Identification of 'hot-spots' of carp reproduction in the Murray-Darling Basin. American Fisheries Society Conference, 30 August - 3 September 2009, Nashville, USA.
Gozlan, R. E., E. J. Peeler, M. Longshaw, S. St-Hilaire, and S. W. Feist. 2006. Effect of microbial pathogens on the diversity of aquatic populations, notably in Europe. Microbes and Infection 8: 1358-1364.
Gray, J. M., T. F. A. Bishop, and X. Yang. 2015. Pragmatic models for the prediction and digital mapping of soil properties in eastern Australia. Soil Research 53: 24-42.
Heugens, E. H., A. J. Hendriks, T. Dekker, N. M. van Straalen, and W. Admiraal. 2001. A review of the effects of multiple stressors on aquatic organisms and analysis of uncertainty factors for use in risk assessment. Critical reviews in toxicology 31: 247-284.
Hillel, D. 2000. Salinity management for sustainable irrigation: integrating science, environment, and economics. World Bank Publications.
Holmes, S., S. Speirs, P. Berney, and H. Rose. 2009. Guidelines for grazing in the Gwydir Wetlands and Macqaurie Marshes. NSW Department of Primary Industries.
Hubbard, R., G. Newton, and G. Hill. 2004. Water quality and the grazing animal. Journal of animal science 82: E255-E263.
Hudnell, H. K. 2008. Cyanobacterial harmful algal blooms: state of the science and research needs. Springer Science & Business Media.
Hurley, T., R. Sadiq, and A. Mazumder. 2012. Adaptation and evaluation of the Canadian Council of Ministers of the Environment Water Quality Index (CCME WQI) for use as an effective tool to characterize drinking source water quality. Water research 46: 3544-3552.
James, K. R., B. Cant, and T. Ryan. 2003. Responses of freshwater biota to rising salinity levels and implications for saline water management: a review. Australian Journal of Botany 51: 703-713.
Kaushal, S. S., Likens, G.E., Jaworski, N.A., Pace, M.L., Sides, A.M., Seekell, D., Belt, K.T., Secor, D.H. and Wingate R.L. 2010. Rising stream and river temperatures in the United States. Frontiers in Ecology and the Environment 8: 461-466.
Kelleway, J., Mazumder, D., Wilson, G.G., Saintilan, N., Knowles, L., Iles, J. and Kobayashi ,T. 2010. Trophic structure of benthic resources and consumers varies across a regulated floodplain wetland. Marine and Freshwater Research 61: 430-440.
Kingsford, R. T. 2000. Ecological impacts of dams, water diversions and river management on floodplain wetlands in Australia. Austral Ecology 25: 109-127.
Koehn, J. D. 2004. Carp (Cyprinus carpio) as a powerful invader in Australian waterways. Freshwater Biology 57: 882-894.
Korbel, K., P. Hancock, P. Serov, R. Lim, and G. Hose. 2013. Groundwater ecosystems vary with land use across a mixed agricultural landscape. Journal of Environmental Quality 42: 380-390.
Lampert G. and Short A. 2004. Namoi River Styles report. River Styles, indicative geomorphic condition and geomorphic priorities for river conservation and rehabilitation in the Namoi Catchment, North-west NSW. Department of Infrastructure, Planning and Natural Resources.
Lardicci, C., F. Rossi, and F. Maltagliati. 1999. Detection of thermal pollution: variability of benthic communities at two different spatial scales in an area influenced by a coastal power station. Marine Pollution Bulletin 38: 296-303.
LeJeune, J., T. Besser, N. Merrill, D. Rice, and D. Hancock. 2001. Livestock drinking water microbiology and the factors influencing the quality of drinking water offered to cattle. Journal of Dairy Science 84: 1856-1862.
Lessard, J. L., and D. B. Hayes. 2003. Effects of elevated water temperature on fish and macroinvertebrate communities below small dams. River research and applications 19: 721-732.
Local Land Services. 2016. State Strategic Plan 2016 - 2026. Local Land Services, NSW.
Lugg, A., and C. Copeland. 2014. Review of cold water pollution in the Murray–Darling Basin and the impacts on fish communities. Ecological Management & Restoration 15: 71-79.
NSW Department of Planning, Industry and Environment | INT18/109352 | 49
Water quality technical report for the Namoi surface water resource plan area (SW14)
Lumb, A., D. Halliwell, and T. Sharma. 2006. Application of CCME W ater Quality Index to monitor water quality: A case study of the Mackenzie River Basin, Canada. Environmental Monitoring and Assessment 113: 411-429.
Lumb, A., T. Sharma, and J.-F. Bibeault. 2011. A review of genesis and evolution of water quality index (WQI) and some future directions. Water Quality, Exposure and Health 3: 11-24.
Macdonald, M. J., W. R. Whalley, M. H. Julien, B. M. Sindel, and J. A. Duggin. 2012. Flood-induced recruitment of the invasive perennial herb Phyla canescens (lippia). The Rangeland Journal 34: 269-276.
McGeoch S, Mawhinney W and Muschal M. 2017. Evaluation of water quality data and historical trends in New South Wales rivers, Australia: 1970-2013. New South Wales Department of Primary Industries, Water, Sydney. ISBN978-1-74256-945-1.
Marsh, N., J. C. Rutherford, and S. E. Bunn. 2005. The Role of Riparian Vegetation in Controlling Stream Temperature in a Southeast Queensland Stream. CRC for Catchment Hydrology, Monash University.
Martin, C.E. and McCulloch M.T. 1999. Nd-Sr isotopic and trace element geochemistry of river sediments and soils in a fertilized catchment, New South Wales, Australia. Geochimica et Cosmochimica Acta, 63 (2): 287-305.
Mawhinney, W. 1998. Liverpool Plains water quality project. Land use, pesticide use and their impact on water quality on the Liverpool Plains. Department of Land and Water Conservation. ISSN 1329-8984.
Mawhinney, W. 2005. Case study, catchment water quality and cotton: northern NSW. WATERpak - a guide for irrigation managemnt in cotton and grain farming systems. Cotton Research and Development Corporation, Narrabri.
Mawhinney, W. 2011. Namoi water quality project 2002-2007 - Final report. NSW Office of Water, Sydney. ISBN 978 1 74263 160 8.
Mawhinney, W. and Muschal, M. 2015. Assessment of Murray Darling Basin Plan water quality targets in New South Wales; 2007 to 2012. New South Wales Department of Primary Industries, Water, Sydney. ISBN 978-1-74256-792-1.
Mitrovic S.M., Westhorpe D.P., Kobayashi T., Baldwen D.S., Ryan D. and Hitchcock J.N. 2014. Short-term changes in zooplankton density and community structure in response to different sources of dissolved organic carbon in an unconstrained lowland river: evidence of food web support. Journal of Plankton Research, 36(6): 1488-1500.
Murray-Darling Basin Authority. 2012. Basin Plan: Chapter 9 – Water quality and salinity management plan.
Muschal M. 2001. Central and North West Regions water quality program. 1999-2000 report on pesticides monitoring. New South Wales Department of Land and Water Conservation, Parramatta. ISSN 1327-1032.
Muschal M. and Warne M.St.J. 2003. Risk posed by pesticides to aquatic organisms in rivers of northern inland New South Wales, Australia. Human and Ecological Risk Assessment.
National Health and Medical Research Council. 2008. Guidelines for managing risks in recreational water. Canberra. ISBN 1864962720.
National Land and Water Resources Audit. 2001. Australian Agricultural Assessment, 2001. National Land and Water Resources Audit, Canberra.
Newman, M. C. 2009. Fundamentals of ecotoxicology. CRC press.
NHMRC and NRMMC. 2011. Australian Drinking Water Guidelines. National Water Quality Management Strategy. National Health and Medical Research Council and Natural Resource Management Ministerial Council, Commonwealth of Australia, Canberra. ISBN Online 1864965118.
Norris, R., Liston, P., Davies, N., Coysh, J., Dyer, F., Linke, S., Prosser, I. and Young, B. 2001. Snapshot of the Murray-Darling Basin river condition. Murray-Darling Basin Commission, Canberra, Australia.
Nowak, B. 1992. Histological changes in gills induced by residues of endosulfan. Aquatic toxicology 23: 65-83.
Nowak, B., and M. Julli. 1991. Residues of endosulfan in wild fish from cotton growing areas in New South Wales, Australia. Toxicological & Environmental Chemistry 33: 151-167.
NSW Department of Planning, Industry and Environment | INT18/109352 | 50

Water quality technical report for the Namoi surface water resource plan area (SW14)
NRC. 2010. Progress towards healthy resilient landscapes: Implementing the Standards and Targets and Catchment Action Plans – 2010 Progress report. NSW Natural Resource Commission, Sydney. Viewed 9 February 2017. http://www.nrc.nsw.gov.au/publications.
NSW Department of Primary Industries. 2006. Reducing the impact of weirs on aquatic habitat - New South Wales detailed weir review. Namoi CMA region. Report to the New South Wales Environmental Trust. NSW Department of Primary Industries, Flemington, NSW.
NSW Ministry of Health. 2013. NSW Guidelines for Drinking Water Management Systems. Health Protection NSW, NSW Ministry of Health, North Sydney, NSW.
NSW Office of Water. 2014. Draft Algal Risk Management Sub-Plan under the NSW Emergency Management Energy and Utility Services Supporting Plan, NSW Department of Primary Industries, Office of Water, Sydney.
OEH. 2014. Cooperative management of environmental water to improve river and wetland health in NSW. NSW and Office of Environment and Heritage, Goulburn St, Sydney.
Oliver, R., S. Mitrovic, and C. Rees. 2010. Influence of salinity on light conditions and phytoplankton growth in a turbid river. River Research and Applications 26: 894-903.
Olley J. and Scott A. 2002. Sediment supply and transport in the Murrumbidgee and Namoi Rivers since European settlement. CSIRO Land and Water Technical Report 9/02, December 2002.
Parsons S., Evans R. and Hoban. 2008. Surface - groundwater connectivity assessment. A report to the Australian Government from the CSIRO Murray-Darling Basin Sustainable Yields Project. CSIRO, Australia. ISSN 1835-095X.
Pittock, J., and C. M. Finlayson. 2011. Australia's Murray–Darling Basin: freshwater ecosystem conservation options in an era of climate change. Marine and Freshwater Research 62: 232-243.
Preece, R. 2004. Cold water pollution below dams in New South Wales: a desktop assessment.
Preece, R.M. and Jones, H.A. 2002. The effect of Keepit Dam on the temperature regime of the Namoi River, Australia. River Research and Applications 18: 397-414.
Prüss, A. 1998. Review of epidemiological studies on health effects from exposure to recreational water. International journal of epidemiology 27: 1-9.
Public Health Act 2010. New South Wales Government, Sydney.
Public Health Regulation 2012. New South Wales Government, Sydney.
Raupach, M.R., Briggs, P.R., Ford, P.W., Leys, J.F., Muschal, M., Cooper, B., and Edge, V.E. 2001. Endosulfan transport:I. Integrative assessment of airborne and waterborne pathways. Journal of Environmental Quality. 30:714-728.
Rolls, R. J., Growns, I.O., Khan, T.A., Wilson, G.G., Ellison, T.L., Prior, A. and Waring, C.C. 2013. Fish recruitment in rivers with modified discharge depends on the interacting effects of flow and thermal regimes. Freshwater Biology 58: 1804-1819.
Roulet, N. and T.R. Moore. 2006. Environmental chemistry: browning the waters. Nature 444: 283-284.
Rutherford, J.C., N.A. Marsh, P.M. Davies, and S.E. Bunn. 2004. Effects of patchy shade on stream water temperature: how quickly do small streams heat and cool? Marine and Freshwater Research 55: 737-748.
Smith, V.H., S.B. Joye, and R.W. Howarth. 2006. Eutrophication of freshwater and marine ecosystems. Limnology and Oceanography: 351-355.
Smith, V. H., G. D. Tilman, and J. C. Nekola. 1999. Eutrophication: impacts of excess nutrient inputs no freshwater, marine and terrestrial ecosystems. Environmental Pollution 100: 179-196.
Sposito, G., and S. V. Mattigod. 1977. On the chemical foundation of the sodium adsorption ratio. Soil Science Society of America Journal 41: 323-329.
Srebotnjak, T., G. Carr, A. de Sherbinin, and C. Rickwood. 2012. A global Water Quality Index and hot-deck imputation of missing data. Ecological Indicators 17: 108-119.
Steele, M., and J. Odumeru. 2004. Irrigation water as source of foodborne pathogens on fruit and vegetables. Journal of Food Protection 67: 2839-2849.
NSW Department of Planning, Industry and Environment | INT18/109352 | 51

Water quality technical report for the Namoi surface water resource plan area (SW14)
Terrado, M., D. Barceló, R. Tauler, E. Borrell, and S. de Campos. 2010. Surface-water-quality indices for the analysis of data generated by automated sampling networks. TrAC Trends in Analytical Chemistry 29: 40-52.
Tiller, D. and Newall, P. 2010. Water quality summaries and proposed water quality targets for the protection of aquatic ecosystems for the Murray-Darling Basin. Prepared by Karoo Consulting PTY LTD for the Murray-Darling Basin Authority.
Timms, W. 1997. Liverpool Plains Water Quality Project. 1996/97 Report on Groundwater Quality. Department of Land and Water Conservation. CNR97.108.
Van Oost, K., Quine, T.A, Govers, G., De Gryze, S., Six, J., Ritchie, J.C., McCarty, G.W. and Heckra, G. 2007. The impact of agricultural soil erosion on the global carbon cycle. Science 318: 626-629.
Water Act 2007. (Commonwealth). Schedule B – Appendix 1.
Water Sharing Plan for the Namoi Unregulated and Alluvial Water Source. 2012. New South Wales Government.
Water Sharing Plan for the Upper Namoi and Lower Namoi Regulated River Water Source. 2016. New South Wales Government.
Water Sharing Plan for the Peel Valley Regulated, Unregulated, Alluvium and Fractured Rock Water Sources. 2010. New South Wales Government.
Watson, G., Bullock, E., Sharpe, C. and Baldwin, D. 2009. Water quality tolerances of aquatic biota of the Murray-Darling Basin. Report to the Murray-Darling Basin Authority. Murray-Darling Freshwater Research Centre, Wodonga.
Warne, M. S. J. 2002. Derivation of the Australian and New Zealand water quality guidelines for toxicants. Australasian Journal of Ecotoxicology 7: 123-136.
Warne, M.S.J., Batley, G.E., Braga, O., Chapman, J.C., Fox, D.R., Hickey, C.W., Stauber, J.L. and Van Dam, R. 2014. Revisions to the derivation of the Australian and New Zealand guidelines for toxicants in fresh and marine waters. Environmental Science and Pollution Research 21: 51-60.
Webb, B. W., D. M. Hannah, R. D. Moore, L. E. Brown, and F. Nobilis. 2008. Recent advances in stream and river temperature research. Hydrological Processes 22: 902-918.
Westhorpe, D.P., Mitrovic, S.M. and Woodward, K.B. 2012. Diel variation of dissolved organic carbon during large flow events in a lowland river. Limnologica 42: 220-226.
Whitworth, K. L., D. S. Baldwin, and J. L. Kerr. 2012. Drought, floods and water quality: drivers of a severe hypoxic blackwater event in a major river system (the southern Murray–Darling Basin, Australia). Journal of Hydrology 450: 190-198.
WHO. 2004. Guidelines for drinking-water quality: recommendations. World Health Organization.
Wilkinson, J., A. Jenkins, M. Wyer, and D. Kay. 1995. Modelling faecal coliform dynamics in streams and rivers. Water Research 29: 847-855.
Wilson, G., P. Berney, D. Ryder, and J. Price. 2008. Stage 2: Grazing/Landuse in the Macquarie Marshes and Gwydir Wetlands-Final report to the New South Wales Department of Environment and Climate Change. University of New England, Armidale: 36.
Woodward, K. B., C. S. Fellows, S. M. Mitrovic, and F. Sheldon. 2015. Patterns and bioavailability of soil nutrients and carbon across a gradient of inundation frequencies in a lowland river channel, Murray– Darling Basin, Australia. Agriculture, Ecosystems & Environment 205: 1-8.
Young, R. G., C. D. Matthaei, and C. R. Townsend. 2008. Organic matter breakdown and ecosystem metabolism: functional indicators for assessing river ecosystem health. Journal of the North American Benthological Society 27: 605-625.
NSW Department of Planning, Industry and Environment | INT18/109352 | 52

Water quality technical report for the Namoi surface water resource plan area (SW14)
Appendix A. Water quality monitoring site locations Table 17: Location of water quality monitoring stations in the Namoi WRPA
Station Number
Station Name Latitude Longitude
Routine water quality
419010 Macdonald River at Woolbrook -30.965009 151.346794
419022 Namoi River at Manilla Railway Bridge -30.751757 150.716404
419016 Cockburn River at Mulla Crossing -31.060556 151.125833
419024 Peel River at Paradise Weir -31.100560 150.938627
419006 Peel River at Carroll Gap -30.938601 150.529189
419027 Mooki River at Breeza -31.259938 150.470435
419032 Coxs Creek at Boggabri -30.761985 149.985070
419001 Namoi River at Gunnedah -30.971885 150.254713
419003 Narrabri Creek at Narrabri -30.327984 149.781016
419021 Namoi River at Bugilbone -30.272869 148.820560
419026 Namoi River at Goangra -30.146054 148.389770
Blue-green algae
41910021 Chaffey Dam at Station 1 (Wall) -31.344809 151.136124
41910022 Chaffey Dam at Boat Ramp -31.345365 151.138902
419045 Peel River DS Chaffey Dam -31.341500 151.143700
41910041 Split Rock Dam at Station 1 -30.576202 150.699181
41910278 Split Rock Dam at Recreation Area -30.553611 150.685000
419043 Manilla River DS Split Rock Dam -30.587000 150.689000
41910001 Keepit Dam at Station 1 -30.828982 150.507521
41910279 Keepit Dam at Recreation Area -30.888889 150.502778
419007 Namoi River DS Keepit Dam -30.891200 150.496100
41910219 Yarrie Lake -30.368333 149.519167
419057 Namoi River at Walgett -30.015107 148.1206100
Continuous electrical conductivity
419097 Goonoo Goonoo Creek at Meadows Lane -31.179800 150.924800
419024 Peel River at Paradise Weir -31.100560 150.938627
419084 Mooki River at Ruvigne -31.035200 150.333900
419032 Coxs Creek at Boggabri -30.761985 149.985070
419001 Namoi River at Gunnedah -30.971885 150.254713
419003 Narrabri Creek at Narrabri -30.327984 149.781016
419026 Namoi River at Goangra -30.146054 148.389770
Continuous water temperature
419081 Peel River at Taroona -31.430300 151.135400
419045 Peel River downstream Chaffey Dam -31.341500 151.143700
NSW Department of Planning, Industry and Environment | INT18/109352 | 53

Water quality technical report for the Namoi surface water resource plan area (SW14)
419024 Peel River at Paradise Weir -31.100560 150.938627
419097 Goonoo Gonoo Creek at Meadows Lane -31.179800 150.924800
419016 Cockburn River at Mulla Crossing -31.060556 151.125833
419006 Peel River at Carroll Gap -30.938601 150.529189
419028 Macdonald River at Retreat -30.626400 151.109700
419005 Namoi River at North Cuerindi -30.679000 150.778000
419053 Manilla River at Black Springs -30.422200 150.651100
419043 Manilla River downstream Split Rock Dam -30.587000 150.689000
419022 Namoi River at Manilla Railway Bridge -30.751757 150.716404
419007 Namoi River downstream Keepit Dam -30.891200 150.496100
419001 Namoi River at Gunnedah -30.971885 150.254713
419084 Mooki River at Ruvigne -31.035200 150.333900
419032 Coxs Creek at Boggabri -30.761985 149.985070
419003 Narrabri Creek at Narrabri -30.327984 149.781016
NSW Department of Planning, Industry and Environment | INT18/109352 | 54

Water quality technical report for the Namoi surface water resource plan area (SW14)
Appendix B. Water quality index (WaQI) method A water quality index is a tool to communicate complex and technical water quality data in a simple and consistent way. It is useful for presenting information with different units (e.g. mg/L and % saturation) or characteristics (e.g. turbidity in a montane vs lowland river) on a common scale. It can also be used as a reporting tool for evaluation of changes in water quality over the life of a water quality management or water sharing plan.
For water quality management plans (WQMP) the WaQI is calculated as an overall integrated index (for five to eight parameters) and for each water quality parameter individually. These calculations are performed independently.
The overall WaQI for the WQMP includes total nitrogen, total phosphorus, turbidity, dissolved oxygen and pH. It is based on the exceedance of water quality targets as prescribed in Schedule 11 of The Basin Plan. Blue-green algae, salinity and temperature are calculated as individual parameters. To calculate the index a minimum of 30 samples is required across a five year period with a minimum of four samples in any one year.
The outcome provides a number between 1 and 100 that is categorised according to the following:
The index for both the overall score or, for an individual parameter is calculated as:
√𝐹12 + 𝐹22
𝑊𝑎𝑄𝐼 = ( )1.41421
Where F1 (frequency), the frequency of the number of failed tests per total tests, is:
𝑁𝑢𝑚𝑏𝑒𝑟 𝑜𝑓 𝑓𝑎𝑖𝑙𝑒𝑑 𝑡𝑒𝑠𝑡𝑠 𝐹1 = ( ) × 100
𝑇𝑜𝑡𝑎𝑙 𝑛𝑢𝑚𝑏𝑒𝑟 𝑜𝑓 𝑡𝑒𝑠𝑡𝑠
And where F2 (amplitude), the amplitude is the amount a value exceeded he target, is:
𝐹2 = (𝑛𝑠𝑒 ÷ [0.01𝑛𝑠𝑒 + 0.01])
Where nse (the normalised sum of excursions) is:
𝑛∑𝑖=1 𝑒𝑥𝑐𝑢𝑟𝑠𝑖𝑜𝑛 𝑖 𝑛𝑠𝑒 = ( )
𝑛𝑢𝑚𝑏𝑒𝑟 𝑜𝑓 𝑡𝑒𝑠𝑡𝑠
And where the excursion is:
𝐹𝑎𝑖𝑙𝑒𝑑 𝑡𝑒𝑠𝑡 𝑣𝑎𝑙𝑢𝑒 𝑖 𝐸𝑥𝑐𝑢𝑟𝑠𝑖𝑜𝑛 = (
𝑇𝑒𝑠𝑡 𝑜𝑏𝑗𝑒𝑐𝑡𝑖𝑣𝑒 )
or
𝑇𝑒𝑠𝑡 𝑜𝑏𝑗𝑒𝑐𝑡𝑖𝑣𝑒 𝐸𝑥𝑐𝑢𝑟𝑠𝑖𝑜𝑛 = ( )
𝐹𝑎𝑖𝑙𝑒𝑑 𝑡𝑒𝑠𝑡 𝑣𝑎𝑙𝑢𝑒 𝑖
NSW Department of Planning, Industry and Environment | INT18/109352 | 55

Water quality technical report for the Namoi surface water resource plan area (SW14)
How was the method determined?
A literature review of existing water quality index methods, purposes and reviews was conducted in 2015. There is extensive literature (over 500 papers), and a wide range of existing methods (more than 100) of calculating water quality indices. A number of individual index methods as well as key text and review papers (e.g Abbasi and Abbasi 2012; Achterberg 2014; Bauer et al. 2013; Brown et al. 1970; Cude 2001; Dinius 1987; Hurley et al. 2012; Lumb et al. 2011; Srebotnjak et al. 2012; Terrado et al. 2010; Van Oost et al. 2007) were reviewed to determine an appropriate index for NSW that is robust and meets our requirements.
The Canadian Council of Ministers of the Environment (CCME) water quality index (Roulet and Moore 2006) was chosen as method on which to base the WaQI. The key questions that were considered when making this decision were:
Has it been tested and accepted in peer review literature?
How widely is it used?
Can it be used without requiring calibration to biogeographically distinct regions?
Is it flexible, and can it be used with continuous data or toxicants if required?
Has it been tested against ecological indices (e.g. macroinvertebrates)?
Can it be easily presented and understood for reporting?
The method has been modified to remove a subindex that included the number of failed parameters. The subindex was excluded as only five to seven parameters will be used to calculate the NSW WaQI. In comparison, the CCME WQI is designed for up to +30 parameters.
NSW Department of Planning, Industry and Environment | INT18/109352 | 56

Water quality technical report for the Namoi surface water resource plan area (SW14)
Appendix C. Literature Review A Web of Science search was undertaken that always included ‘NSW’ and then one of the following ‘Namoi River’, ‘Peel River’, ‘Macdonald River’, ‘Mooki River’, ‘Manilla River’, ‘Coxs Creek’, ‘Boomi River’, ‘Chaffey Dam’, ‘Split Rock Dam’ or ‘Keepit Dam’. This search was supplemented with a search using the Google Scholar database and the terms ‘Namoi’, ‘Macdonald’, ‘Peel’, ‘river’ and ‘NSW’. The output is summarised in Table 19.
Table 18: Review of published literature
References Subcatchment Description
Macdonald et
al. 2012
Lowlands Flooding supports recruitment for weeds. Recruitment reduced by presence of
other vegetation. Hotter constant temperatures reduced germination.
Fluctuation and colder temperatures increases germination.
Kingsford 2000 Wetlands Water quality has had an effect on river red gum survival. Also studied the
Macquarie, Barmah, Millewa and Moira Marshes and Chowilla floodplain.
Brock et al.
2005
Wetlands Tested response to zooplankton hatching and seed germination to different
salinities in a range of wetlands. Salinity increases in soils when damp but not
when flooded. Aquatic plant germination and species richness decreased
significantly with increasing salinity. These decreases started immediately
between the lowest treatments of <300 to 1000 mg/L. Similar for zooplankton
hatching, Macquarie Marshes had significant declines above <300 mg/L,
Narran Lakes and Gwydir had declines above 1000 mg/L. Community stricture
changed above 1000 mg L Increased salinity however had no effects on Lake
Cowal, Darling Anabranch and Great Cumbung Swamp (ie up to 5000 mg/L
treatment). There was no change in community structure.
Korbel et al.
2013
Midlands and
lowlands
Groundwater at grazing sites had lower nitrogen than cropping sites.
Groundwater was higher in phosphorus at grazing sites than cropping. No
differences between seasons. Greater Dissolved Organic Carbon in summer.
Diethyl atrazine was present at two cotton cropping sites during summer – unlikely to be toxic at concentrations recorded.
Kelleway et al.
2010
Wetlands Carbon sources supporting consumers are varied and appear related to spatial
distribution of primary producers. Highlights the importance of riparian
vegetation as a carbon source, its influence on shading and decreases in in-
channel solar radiation limiting in-channel autotrophic production.
Nowak 1992 Midlands,
lowlands
Exposure of catfish to endosulfan increased the respiratory stress (increased
diffusion distance).
Nowak and Julli
1991
Lowlands Found residues of endosulfan in fish caught in cotton growing regions. The
concentration appeared to be controlled by the delivery of the pesticide to the
aquatic environment which appeared largely dependent on rainfall and flooding
than application season.
Norris et al.
2001
Namoi and all of
Basin
21% of the Namoi valley is severely impaired. 60% of river length has been
substantially modified from natural condition.
Rolls et al.
2013
Lowlands and
midlands
Temperature, flows, habitat and food resource (prey size and availability) all
impair fish recruitment. Flow magnitude and water temperature appeared to
have the largest effect in determining larval fish composition. Hypothesised that
NSW Department of Planning, Industry and Environment | INT18/109352 | 57
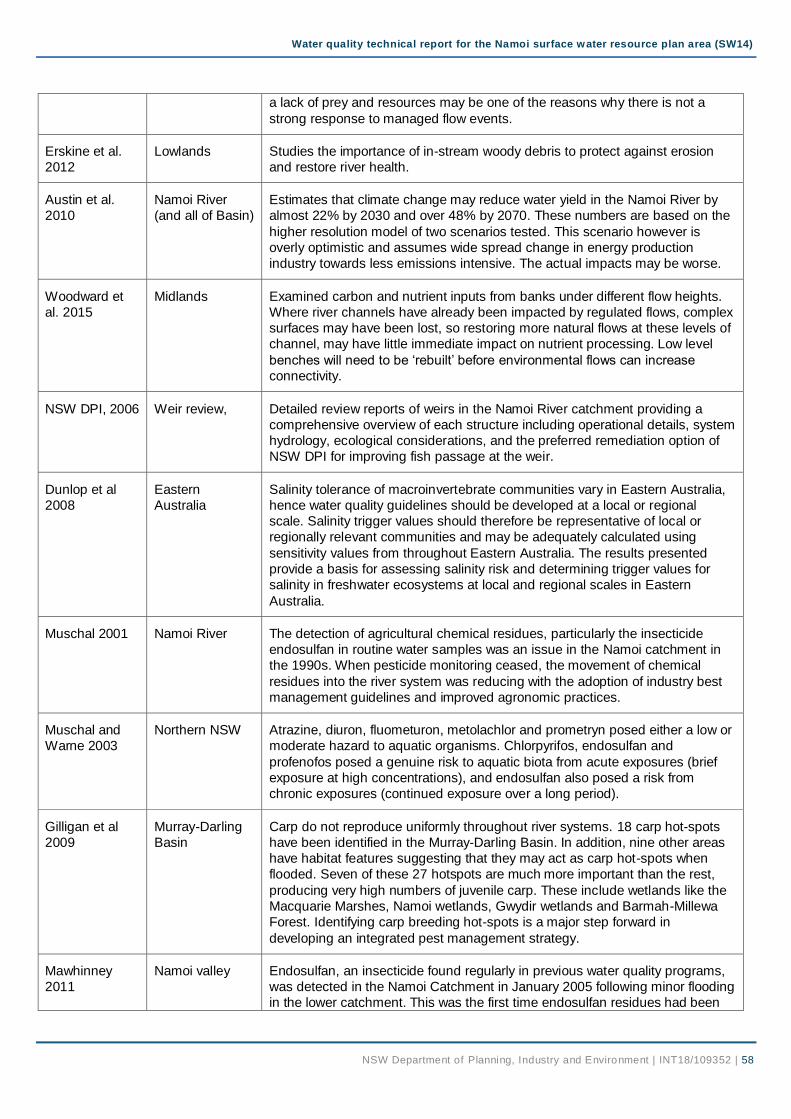
Water quality technical report for the Namoi surface water resource plan area (SW14)
a lack of prey and resources may be one of the reasons why there is not a
strong response to managed flow events.
Erskine et al.
2012
Lowlands Studies the importance of in-stream woody debris to protect against erosion
and restore river health.
Austin et al.
2010
Namoi River
(and all of Basin)
Estimates that climate change may reduce water yield in the Namoi River by
almost 22% by 2030 and over 48% by 2070. These numbers are based on the
higher resolution model of two scenarios tested. This scenario however is
overly optimistic and assumes wide spread change in energy production
industry towards less emissions intensive. The actual impacts may be worse.
Woodward et
al. 2015
Midlands Examined carbon and nutrient inputs from banks under different flow heights.
Where river channels have already been impacted by regulated flows, complex
surfaces may have been lost, so restoring more natural flows at these levels of
channel, may have little immediate impact on nutrient processing. Low level
benches will need to be ‘rebuilt’ before environmental flows can increase connectivity.
NSW DPI, 2006 Weir review, Detailed review reports of weirs in the Namoi River catchment providing a
comprehensive overview of each structure including operational details, system
hydrology, ecological considerations, and the preferred remediation option of
NSW DPI for improving fish passage at the weir.
Dunlop et al
2008
Eastern
Australia
Salinity tolerance of macroinvertebrate communities vary in Eastern Australia,
hence water quality guidelines should be developed at a local or regional
scale. Salinity trigger values should therefore be representative of local or
regionally relevant communities and may be adequately calculated using
sensitivity values from throughout Eastern Australia. The results presented
provide a basis for assessing salinity risk and determining trigger values for
salinity in freshwater ecosystems at local and regional scales in Eastern
Australia.
Muschal 2001 Namoi River The detection of agricultural chemical residues, particularly the insecticide
endosulfan in routine water samples was an issue in the Namoi catchment in
the 1990s. When pesticide monitoring ceased, the movement of chemical
residues into the river system was reducing with the adoption of industry best
management guidelines and improved agronomic practices.
Muschal and
Warne 2003
Northern NSW Atrazine, diuron, fluometuron, metolachlor and prometryn posed either a low or
moderate hazard to aquatic organisms. Chlorpyrifos, endosulfan and
profenofos posed a genuine risk to aquatic biota from acute exposures (brief
exposure at high concentrations), and endosulfan also posed a risk from
chronic exposures (continued exposure over a long period).
Gilligan et al
2009
Murray-Darling
Basin
Carp do not reproduce uniformly throughout river systems. 18 carp hot-spots
have been identified in the Murray-Darling Basin. In addition, nine other areas
have habitat features suggesting that they may act as carp hot-spots when
flooded. Seven of these 27 hotspots are much more important than the rest,
producing very high numbers of juvenile carp. These include wetlands like the
Macquarie Marshes, Namoi wetlands, Gwydir wetlands and Barmah-Millewa
Forest. Identifying carp breeding hot-spots is a major step forward in
developing an integrated pest management strategy.
Mawhinney
2011
Namoi valley Endosulfan, an insecticide found regularly in previous water quality programs,
was detected in the Namoi Catchment in January 2005 following minor flooding
in the lower catchment. This was the first time endosulfan residues had been
NSW Department of Planning, Industry and Environment | INT18/109352 | 58

Water quality technical report for the Namoi surface water resource plan area (SW14)
detected in the Namoi Valley since the 2000-2001 cotton growing season.
Residues of the herbicide atrazine continue to be detected at a variety of sites,
with the majority from two sites on the Liverpool Plains, the Mooki River at
Ruvigne and Coxs Creek at Boggabri.
Major ion data from selected sites in the Namoi catchment showed there was
no clear single dominant cation, with bicarbonate the dominant anion. The
Mooki River at Ruvigne had higher concentrations of sodium and magnesium
in some samples and chloride salts dominated when the Mooki River was
flowing.
Pollutants such as sediment, nutrients and pesticides can be prevented from
entering our waterways through land, soil and vegetation management.
Maintaining groundcover, vegetated buffer strips, best management practices
for chemical handling and application, minimum/zero tillage and good
agronomic practices in conjunction with the management of riparian vegetation
to reduce stream bank erosion provide simple and effective means to improve
water quality in the Namoi Catchment.
Martin and
McCulloch
1999
Chaffey Dam Chaffey dam sediment has isotopic and trace element compositions that
confirm that the dominant source of stream particulates is from basalt soils in
the steep upland part of the catchment rather than the addition of fertiliser.
Westhorpe et
al. 2012
Namoi River The magnitude and duration of flow within the Namoi lowland river system and
the mobilisation of large quantities of allochthonous carbon appeared to play a
role in increasing DOC concentration and the diel difference.
Mitrovic et al.
2014
Namoi River Zooplankton are particularly important in lowland river systems as they are key
organisms for the transfer of carbon to higher trophic levels. This study
indicates that allochthonous dissolved organic carbon (entering the system
from watershed sources) has the potential to be an important basal resource to
lowland river food webs. This may be particularly important in lowland sections
of unconstrained floodplain rivers during and immediately following floods
when allochthonous DOC is more available.
Olley and Scott
2002
Namoi River 72 to 91% of sediment being transported through the middle and lower reaches
of the Namoi River was attributed to gully and bank erosion.
Since European settlement the supply and transport of sediment in the Namoi
River has changed markedly as a result of grazing and cropping, historical
climate variations, and dam closures. Of these, the introduction of grazing
stock, which triggered widespread gully erosion, has had the largest effect.
Management of the incised channels will reduce the amount of sediment
produced, particularly where the options enhance sediment entrapment.
Stabilisation of gully networks can be encouraged by the exclusion of stock,
revegetation, and the formation of in-stream wetlands. These provide the most
effective ways of decreasing the turbidity and fine sediment load in these river
systems.
DIPNR 2003 Namoi valley A rapid assessment of electrical conductivity identified saline catchments for
implementation works. These are: Tangaratta Creek; Timbumburi Creek;
Currabubulla Creek; Goonoo Goonoo Creek (including Spring Creek); Werris
Creek; Yarramanbah Creek; Pump Station Creek; McDonalds Creek; Millers
Creek; Big Jacks Creek; Mooki River (upstream of Pine Ridge); Bomera Creek;
and Bobbiwaa Creek.
Caitcheon et al.
1999
Namoi valley Suspended sediment transport along the Namoi River is very inefficient.
Estimates that of the 400 kt/yr of sediment delivered to the Namoi River from
NSW Department of Planning, Industry and Environment | INT18/109352 | 59

Water quality technical report for the Namoi surface water resource plan area (SW14)
Coxs Creek and the Mooki River, approximately 100 kt/yr passes Narrabri and
less than 35 kt/y is conveyed to the Barwon River.
Research on discharges from the Narrabri sewage treatment plant into the
Namoi River found a significant local effect on total phosphorus concentrations.
However, with distance downstream, the phosphorus was assimilated by the
river, possibly through phytoplankton uptake and deposition, uptake by benthic
organisms or by adsorption onto the sediment of the river bed.
Boys et al. Keepit Dam Report provides background information and analysis to inform the design of a
2009 full impact study of cold water pollution and the operation of a multi-level
offtake in Keepit Dam. The current magnitude of cold water pollution
downstream of many storages in the Murray-Darling Basin is much larger than
what is experienced downstream of Keepit Dam. In a typical irrigation season,
most of the cold hypolimnion can be removed, effectively unstratifying the
water column earlier in the year.
Parsons et al.
2008
Namoi valley Assessment of surface groundwater connectivity found the Peel River is a
gaining stream in the upper reaches and a losing stream in the lower reaches.
The Namoi River upstream of Keepit Dam is also a gaining stream. The Mooki
River and the Namoi River from Gunnedah to Boggabri is a high loosing
stream, but becomes a gaining stream between Boggabri and Narrabri.
Downstream of Narrabri, the Namoi River and Pian Creek are both losing
streams.
Lampert and Namoi valley The River Style analysis of the Namoi catchment assessed around 10 000 kms
Short 2004 of named stream length. From this, 23 different River Styles were identified.
An assessment of geomorphic condition was undertaken, based on three
broad categories of condition – good, moderate and poor. Approximately 20%
of the assessed streamlines were in good indicative condition, 50% in
moderate indicative condition and 30% in poor indicative condition.
It was recommended that conservation and rehabilitation actions be targeted initially at areas where the greatest success and continuity of effort is most likely to be achieved. These are, as determined by areas where there is a concentration of Conservation and Strategic Priority reaches. Priority for further assessment and action should be given to the Pillaga outwash streams and the Upper Macdonald as these areas contain a high proportion of fragile and rare River Styles.
Mawhinney
1998
Liverpool Plains The decline in water quality on the Liverpool Plains has coincided with the
expansion of agriculture, and in particular, cropping. Large areas of native
grasses have been replaced by annual crops, leaving soils prone to erosion
and increasing the amount of water leaking through the soil profile into shallow
water tables. The result has been high concentrations of nutrients, sediment,
salt and pesticides in surface water, highly saline water tables rising in
response to recharge, causing soil salinity, and contamination of groundwater
by nitrates, salt and pesticides.
NSW Department of Planning, Industry and Environment | INT18/109352 | 60

Water quality technical report for the Namoi surface water resource plan area (SW14)
Appendix D. Water quality summary statistics Table 19: Water quality summary statistics for the Namoi WRPA 2007-2015 water quality data
Total Nitrogen (mg/L)
Total Phosphorus (mg/L)
Site Name N Mean Std Dev Std Error Min Q10 Q25 Median Q75 Q90 Max
Macdonald River at Woolbrook 71 0.620 0.311 0.037 0.200 0.330 0.400 0.580 0.720 0.990 2.200
Namoi River at Manilla Railway Bridge 96 0.649 0.307 0.031 0.270 0.390 0.505 0.585 0.715 0.890 2.400
Cockburn River at Mulla Crossing 92 0.502 0.544 0.057 0.170 0.210 0.260 0.355 0.530 1.100 4.800
Peel River at Paradise Weir 95 0.483 0.259 0.027 0.120 0.250 0.300 0.400 0.580 0.760 1.400
Peel River at Carroll Gap 96 0.881 0.436 0.045 0.280 0.480 0.570 0.750 1.000 1.500 2.300
Mooki River at Breeza 95 1.169 1.149 0.118 0.290 0.400 0.500 0.760 1.300 2.300 6.800
Coxs Creek at Boggabri 82 1.645 1.113 0.123 0.290 0.850 1.000 1.350 2.000 2.500 7.600
Namoi River at Gunnedah 96 0.822 0.663 0.068 0.180 0.410 0.520 0.655 0.875 1.200 4.800
Narrabri Creek at Narrabri 96 0.783 0.629 0.064 0.300 0.390 0.480 0.575 0.845 1.400 4.700
Namoi River at Bugilbone 85 0.840 0.422 0.046 0.360 0.480 0.590 0.720 1.000 1.300 2.900
Namoi River at Goangra 67 0.931 0.453 0.055 0.410 0.510 0.650 0.810 1.100 1.600 2.600
Site Name N Mean Std Dev Std Error Min Q10 Q25 Median Q75 Q90 Max
Macdonald River at Woolbrook 71 0.071 0.043 0.005 0.017 0.031 0.040 0.056 0.098 0.131 0.198
Namoi River at Manilla Railway Bridge 96 0.056 0.045 0.005 0.016 0.024 0.034 0.044 0.064 0.097 0.341
Cockburn River at Mulla Crossing 92 0.042 0.070 0.007 0.007 0.014 0.017 0.026 0.043 0.074 0.646
Peel River at Paradise Weir 95 0.046 0.031 0.003 0.014 0.024 0.029 0.038 0.053 0.072 0.234
Peel River at Carroll Gap 96 0.096 0.062 0.006 0.016 0.044 0.060 0.083 0.109 0.176 0.327
Mooki River at Breeza 95 0.313 0.314 0.032 0.067 0.097 0.123 0.186 0.350 0.753 1.480
Coxs Creek at Boggabri 82 0.393 0.238 0.026 0.084 0.186 0.223 0.294 0.522 0.709 1.320
Namoi River at Gunnedah 96 0.129 0.175 0.018 0.032 0.044 0.053 0.077 0.116 0.207 1.210
Narrabri Creek at Narrabri 96 0.181 0.166 0.017 0.047 0.065 0.089 0.127 0.186 0.384 1.230
NSW Department of Planning, Industry and Environment | INT18/109352 | 61

Water quality technical report for the Namoi surface water resource plan area (SW14)
Namoi River at Bugilbone 84 0.173 0.124 0.014 0.053 0.068 0.093 0.141 0.193 0.339 0.752
Namoi River at Goangra 67 0.186 0.110 0.013 0.061 0.078 0.117 0.162 0.220 0.318 0.605
Turbidity (NTU)
Site Name N Mean Std Dev Std Error Min Q10 Q25 Median Q75 Q90 Max
Macdonald River at Woolbrook 70 12.0 12.78 1.53 2.6 3.2 4.3 7.5 14.5 20.4 82.0
Namoi River at Manilla Railway Bridge 89 17.7 37.71 4.00 3.0 4.7 6.7 9.0 14.4 29.3 326.0
Cockburn River at Mulla Crossing 85 9.2 22.11 2.40 0.8 1.3 2.0 3.7 7.0 17.0 183.0
Peel River at Paradise Weir 87 16.9 32.68 3.50 5.1 6.4 8.6 10.7 14.3 21.0 295.0
Peel River at Carroll Gap 89 49.8 83.82 8.88 7.9 14.3 19.9 31.0 43.1 91.0 691.0
Mooki River at Breeza 87 74.3 157.94 16.93 9.0 15.6 20.0 27.0 40.3 85.9 851.0
Coxs Creek at Boggabri 73 159.9 173.98 20.36 14.7 41.6 56.0 83.1 191.0 379.0 861.0
Namoi River at Gunnedah 88 58.1 152.83 16.29 6.6 12.7 16.0 20.6 31.1 64.0 992.0
Narrabri Creek at Narrabri 87 61.7 107.97 11.58 8.0 16.6 22.0 31.3 52.0 159.0 900.0
Namoi River at Bugilbone 82 114.7 137.71 15.21 18.4 38.0 49.8 70.5 116.0 251.0 969.0
Namoi River at Goangra 62 159.3 185.35 23.54 33.4 42.0 55.2 97.2 194.0 306.0 994.0
Total Suspended Solids (mg/L)
Site Name N Mean Std Dev Std Error Min Q10 Q25 Median Q75 Q90 Max
Macdonald River at Woolbrook 71 10.2 9.11 1.08 5.0 5.0 5.0 8.0 11.0 16.0 66.0
Namoi River at Manilla Railway Bridge 96 16.4 29.77 3.04 5.0 5.0 7.0 10.0 14.0 25.0 270.0
Cockburn River at Mulla Crossing 92 9.3 14.54 1.52 5.0 5.0 5.0 5.0 8.5 13.0 130.0
Peel River at Paradise Weir 95 17.6 21.63 2.22 5.0 6.0 9.0 11.0 16.0 30.0 150.0
Peel River at Carroll Gap 96 55.5 64.93 6.63 13.0 20.0 28.0 40.0 56.5 79.0 470.0
Mooki River at Breeza 95 59.2 89.53 9.19 8.2 13.0 21.0 29.0 47.0 93.0 410.0
Coxs Creek at Boggabri 81 107.4 170.59 18.95 7.0 16.0 26.0 50.0 100.0 200.0 880.0
Namoi River at Gunnedah 96 79.4 200.87 20.50 7.0 15.0 19.0 26.0 36.0 100.0 1300.0
Narrabri Creek at Narrabri 96 62.2 141.07 14.40 8.0 14.0 20.0 30.0 47.5 89.0 960.0
Namoi River at Bugilbone 85 79.6 83.55 9.06 7.0 27.0 40.0 58.0 90.0 140.0 660.0
NSW Department of Planning, Industry and Environment | INT18/109352 | 62

Water quality technical report for the Namoi surface water resource plan area (SW14)
Namoi River at Goangra 66 116.1 143.75 17.69 20.0 30.0 45.0 72.0 120.0 240.0 870.0
Dissolved Oxygen (% saturation)
Site Name N Mean Std Dev Std Error Min Q10 Q25 Median Q75 Q90 Max
Macdonald River at Woolbrook 45 77 16.0 2.4 9 56 74 82 87 90 94
Namoi River at Manilla Railway Bridge 44 86 13.0 2.0 60 65 81 86 94 98 123
Cockburn River at Mulla Crossing 42 105 17.0 2.6 83 93 96 100 110 130 176
Peel River at Paradise Weir 45 96 10.9 1.6 77 86 89 94 101 113 124
Peel River at Carroll Gap 42 89 15.5 2.4 60 68 82 90 94 100 136
Mooki River at Breeza 42 94 17.5 2.7 49 67 87 96 103 119 125
Coxs Creek at Boggabri 35 97 34.8 5.9 31 54 81 92 118 129 223
Namoi River at Gunnedah 42 98 13.3 2.1 64 82 92 101 107 111 130
Narrabri Creek at Narrabri 38 96 10.7 1.7 69 83 89 95 104 111 116
Namoi River at Bugilbone 37 90 11.3 1.9 64 78 83 90 97 102 118
Namoi River at Goangra 28 93 8.3 1.6 66 82 91 94 97 102 108
pH
Site Name N Mean Std Dev Std Error Min Q10 Q25 Median Q75 Q90 Max
Macdonald River at Woolbrook 71 7.5 0.36 0.04 6.3 7.2 7.3 7.5 7.7 7.9 8.9
Namoi River at Manilla Railway Bridge 96 7.5 0.37 0.04 5.9 7.2 7.3 7.5 7.8 8.0 8.8
Cockburn River at Mulla Crossing 92 8.0 0.30 0.03 7.2 7.6 7.8 8.0 8.1 8.3 8.9
Peel River at Paradise Weir 95 7.8 0.34 0.03 7.2 7.4 7.6 7.8 8.0 8.3 9.0
Peel River at Carroll Gap 96 8.1 0.30 0.03 6.9 7.7 8.0 8.1 8.2 8.4 9.1
Mooki River at Breeza 95 8.5 0.34 0.04 7.4 8.1 8.3 8.5 8.7 8.8 9.2
Coxs Creek at Boggabri 82 8.2 0.63 0.07 6.2 7.3 7.8 8.3 8.6 8.9 9.5
Namoi River at Gunnedah 96 8.0 0.32 0.03 7.1 7.6 7.8 8.0 8.2 8.4 9.1
Narrabri Creek at Narrabri 96 7.9 0.31 0.03 7.0 7.6 7.7 7.9 8.2 8.3 8.6
Namoi River at Bugilbone 86 7.9 0.34 0.04 7.2 7.5 7.7 8.0 8.2 8.3 9.0
Namoi River at Goangra 66 8.0 0.32 0.04 7.3 7.6 7.9 8.1 8.2 8.5 8.7
NSW Department of Planning, Industry and Environment | INT18/109352 | 63

Water quality technical report for the Namoi surface water resource plan area (SW14)
Electrical Conductivity (µS/cm)
Site Name N Mean Std Dev Std Error Min Q10 Q25 Median Q75 Q90 Max
Macdonald River at Woolbrook 71 142 32.71 3.88 73 105 121 139 161 188 235
Namoi River at Manilla Railway Bridge 96 357 206.02 21.03 99 152 199 285 456 673 916
Cockburn River at Mulla Crossing 92 334 90.92 9.48 168 223 264 318 396 451 580
Peel River at Paradise Weir 95 415 95.27 9.77 212 267 350 421 474 539 616
Peel River at Carroll Gap 96 779 232.64 23.74 219 438 624 807 950 1076 1324
Mooki River at Breeza 95 979 323.20 33.16 289 547 771 928 1241 1413 1667
Coxs Creek at Boggabri 82 501 308.35 34.05 112 219 275 420 645 971 1498
Namoi River at Gunnedah 96 495 185.72 18.95 230 280 337 477 625 742 953
Narrabri Creek at Narrabri 96 443 156.35 15.96 146 258 329 412 547 675 818
Namoi River at Bugilbone 86 425 131.99 14.23 132 262 339 409 534 613 727
Namoi River at Goangra 67 414 125.40 15.32 203 260 315 396 509 599 681
NSW Department of Planning, Industry and Environment | INT18/109352 | 64

Water quality technical report for the Namoi surface water resource plan area (SW14)
Table 20: Namoi River at Goangra electrical conductivity for purposes of long term salinity planning in the Namoi WRPA
Year Salinity (EC µS/cm) Salt Load (t/year)
Median (50%ile) Peak (80%ile) Total
2001-2002 472 584 17 753
2002-2003 521 626 9 359
2003-2004 338 542 11 261
2004-2005 433 590 37 865
2005-2006 358 438 21 243
2006-2007 404 532 2 146
2007-2008 361 415 10 274
2008-2009 362 406 14 741
2009-2010 313 547 38 627
2010-2011 401 457 221 628
2011-2012 333 463 149 607
2012-2013 498 617 52 620
2013-2014 470 663 10 529
2014-2015 544 679 1 571
2015-2016 337 503 4 909
Mean 40 276
Table 21: Comparison of annual salt loads in the Namoi WRPA
Year Peel River at Paradise Weir
Namoi River at Gunnedah
Narrabri Creek at
Narrabri
Namoi River at
Goangra
2001-2002 84 547 3 538 17 753
2002-2003 3 696 92 829 92 112 9 359
2003-2004 16 823 38 675 40 271 11 261
2004-2005 6 693 35 316 53 018 37 865
2005-2006 9 352 46 968 49 502 21 243
2006-2007 1 194 31 584 28 708 2 146
2007-2008 11 100 24 421 31 420 10 274
2008-2009 18 892 60 264 56 427 14 741
2009-2010 6 398 23 612 35 624 38 627
2010-2011 59 913 193 249 237 871 221 628
2011-2012 33 261 159 398 199 170 149 607
2012-2013 12 898 113 341 126 923 52 620
2013-2014 4 965 104 321 87 893 10 529
2014-2015 5 091 42 985 32 087 1 571
2015-2016 11 371 21 203 17 769 4 909
Mean 14 403 71 514 72 822 40 276
NSW Department of Industry | PUBXX/YYYY | 65

Water quality technical report for the Namoi surface water resource plan area (SW14)
Appendix E. Draftsman plots and Box plots by site The mean daily discharge, turbidity, total nitrogen, total phosphorus and total suspended solids data in the draftsman plots has been natural log transformed to normalise the distribution of the data.
The box plots show the annual 25th, 50th and 75th percentile values, with error bars indicating the maximum and minimum values for each parameter. The data set extends from 2007 to 2015, and displays within site variability. In each figure there are numerous plots with A) total nitrogen, B) total phosphorus, C) turbidity, D) total suspended solids, E) dissolved oxygen, F) pH, G) electrical conductivity measured during monthly sampling and H) continuous electrical conductivity (where measured). Red lines indicate the Basin Plan water quality targets (and target ranges) from Schedule 11 of the Basin Plan for the appropriate zone. Total suspended solids have a lower detection limit of 5 mg/L.
Field turbidity monitoring commenced in the Namoi WRPA in 2009/2010 and dissolved oxygen in 2011.
NSW Department of Industry | PUBXX/YYYY | 66

Water quality technical report for the Namoi surface water resource plan area (SW14)
Macdonald River at Woolbrook Water quality monitoring in the Macdonald River at Woolbrook commenced in 2009. There was a strong positive correlation between total nitrogen and total phosphorus. Total nitrogen was correlated to turbidity, however the correlation between total phosphorus and turbidity was not as strong, suggesting mixed transport mechanisms. All three parameters are positively correlated to flow. Electrical conductivity was negatively correlated to flow suggesting concentration of salts at low flows and dilution at high flows.
The box plots show the median total nitrogen and total phosphorus results exceeded the Basin Plan water quality targets in all years. The median turbidity was less than the target value, with occasional high results when sampling coincided with high flow events. The dissolved oxygen levels were mostly less than the lower target value of 95% saturation with one very low result in 2013/2014. The median pH was close to or exceeded the upper limit of 7.5. Electrical conductivity showed a gradual increase over the sampling period, with a drop again in 2014/2015. The increase may be in response to the wetting up of the catchment in the middle of 2010 after the preceding dryer years, resulting in increased base flow contributions from more saline groundwater.
0 2 4 6 8
02
46
8
LnQ
20
60
DO
10
02
00
EC
0.2
0.6
1.0
LnTN
6.5
7.5
8.5
pH
0.0
50
.15
LnTP
2.0
3.0
4.0
LnTSS
1.0
2.5
4.0
LnNTU
0 2 4 6 8
10
20
20 40 60 80 100 150 200 0.2 0.6 1.0 6.5 7.5 8.5 0.05 0.10 0.15 2.0 3.0 4.0 1.0 2.0 3.0 4.0 10 15 20 25
10
20
TEMP
Macdonald River at Woolbrook
Figure 20: Draftsman plots for Macdonald River at Woolbrook
NSW Department of Industry | PUBXX/YYYY | 67

Water quality technical report for the Namoi surface water resource plan area (SW14)
2007-2
008
2008-2
009
2009-2
010
2010-2
011
2011-2
012
2012-2
013
2013-2
014
2014-2
015
0.0
0.5
1.0
1.5
2.0
2.5T
N (
mg/L
)
2007-2
008
2008-2
009
2009-2
010
2010-2
011
2011-2
012
2012-2
013
2013-2
014
2014-2
015
0.00
0.05
0.10
0.15
0.20
0.25
TP
(m
g/L
)
2007-2
008
2008-2
009
2009-2
010
2010-2
011
2011-2
012
2012-2
013
2013-2
014
2014-2
015
0
20
40
60
80
100
Turb
idity (
NT
U)
2007-2
008
2008-2
009
2009-2
010
2010-2
011
2011-2
012
2012-2
013
2013-2
014
2014-2
015
0
20
40
60
80
TS
S (
mg/L
)
2007-2
008
2008-2
009
2009-2
010
2010-2
011
2011-2
012
2012-2
013
2013-2
014
2014-2
015
0
20
40
60
80
100
120
DO
(%
satu
ration)
2007-2
008
2008-2
009
2009-2
010
2010-2
011
2011-2
012
2012-2
013
2013-2
014
2014-2
015
6.0
6.5
7.0
7.5
8.0
8.5
9.0
pH
2007-2
008
2008-2
009
2009-2
010
2010-2
011
2011-2
012
2012-2
013
2013-2
014
2014-2
015
50
100
150
200
250
EC
(µS
/cm
)
A) B)
C) D)
E) F)
G)
Figure 21: Water quality data for Macdonald River at Woolbrook
NSW Department of Industry | PUBXX/YYYY | 68

Water quality technical report for the Namoi surface water resource plan area (SW14)
Namoi River at Manilla Railway Bridge The draftsman plots show a positive correlation between total nitrogen, total phosphorus and turbidity, with all three paramerters also correlated to flow. Electrical conductivity was negatively correlated to flow.
The median total nitrogen, total phosphorus and turbidity results were less than the respective Basin Plan target values every year, with the highest results occurring during the high flows in 2010/2011. The majority of dissolved oxygen results were within the upper and lower ranges. The median pH was within the desired range from 2007 to 2011, but dropped below the lower limit from 2011 to 2014. The median electrical conductivity increased in 2009/2010, possibly in response to a concentration of salts during very low flows. The electrical conductivity decreased in 2010/2011 as high flows from the upper catchment flushed the salts from the sampling location. Similar to the Macdonald River at Woolbrook, the median electrical conductivity increased following the heavy rainfall and subsequent shallow groundwater recharge, and then decreased again in 2014/2015 as the catchment began to dry out.
2 4 6 8 10
24
68
10
LnQ
60
80
11
0
DO
20
06
00
EC
0.2
0.6
1.0
LnTN
6.0
7.0
8.0
pH
0.0
50
.20
LnTP
23
45
LnTSS
12
34
5
LnNTU
2 4 6 8 10
10
20
30
60 80 100 120 200 400 600 800 0.2 0.6 1.0 6.0 7.0 8.0 0.05 0.15 0.25 2 3 4 5 1 2 3 4 5 10 15 20 25 30
10
20
30
TEMP
Namoi River at Manilla Railway Bridge
Figure 22: Draftsman plots for Namoi River at Manilla Railway Bridge
NSW Department of Industry | PUBXX/YYYY | 69

Water quality technical report for the Namoi surface water resource plan area (SW14)
2007-2
008
2008-2
009
2009-2
010
2010-2
011
2011-2
012
2012-2
013
2013-2
014
2014-2
015
0.0
0.5
1.0
1.5
2.0
2.5T
N (
mg/L
)
2007-2
008
2008-2
009
2009-2
010
2010-2
011
2011-2
012
2012-2
013
2013-2
014
2014-2
015
0.00
0.05
0.10
0.15
0.20
0.25
0.30
0.35
TP
(m
g/L
)
2007-2
008
2008-2
009
2009-2
010
2010-2
011
2011-2
012
2012-2
013
2013-2
014
2014-2
015
0
50
100
150
200
Turb
idity (
NT
U)
2007-2
008
2008-2
009
2009-2
010
2010-2
011
2011-2
012
2012-2
013
2013-2
014
2014-2
015
0
20
40
60
80
100
TS
S (
mg/L
)
2007-2
008
2008-2
009
2009-2
010
2010-2
011
2011-2
012
2012-2
013
2013-2
014
2014-2
015
40
60
80
100
120
140
DO
(%
satu
ration)
2007-2
008
2008-2
009
2009-2
010
2010-2
011
2011-2
012
2012-2
013
2013-2
014
2014-2
015
5.5
6.0
6.5
7.0
7.5
8.0
8.5
9.0
pH
2007-2
008
2008-2
009
2009-2
010
2010-2
011
2011-2
012
2012-2
013
2013-2
014
2014-2
015
0
200
400
600
800
1000
EC
(µS
/cm
)
A)B)
C) 240 D) 270
E) F)
G)
Figure 23: Water quality data for Namoi River at Manilla Railway Bridge
NSW Department of Industry | PUBXX/YYYY | 70

Water quality technical report for the Namoi surface water resource plan area (SW14)
Cockburn River at Mulla Crossing One total nitrogen and total phosphorus outlier was removed from the data set used to create the draftsman plots to maintain focus on the core data. There was a positive correlation between total nitrogen, total phosphorus and turbidity, but not as clear a correlation between these parameters and flow. For all three parameters, high results were recorded at zero flow. Electrical conductivity decreased with increased flow.
The soils of the Cockburn River are generally of low fertility, resulting in low nutrient imputs. This is reflected in the box plots with the annual median total nitrogen and total phosphorus below the Basin Plan target levels. The lower clay content of the soils is also reflected in the low turbidity results. The median dissolved oxygen levels increased above the upper limit of 110% saturation during the low flows in 2014/2015, possibly in respose to increase filamentous algal growth at the site. The majority of pH results were within the upper and lower limits and do not pose a threat to aquatic ecosystems. Electrical conductivity continued to increase following the rainfall in 2010/2011. Future monitorng will show if results drop again, similar to other catchments.
0 2 4 6 8
02
46
8
LnQ
80
12
01
60
DO
20
04
00
EC
0.2
0.6
LnTN
7.5
8.5
pH
0.0
00
.10
LnTP
1.5
3.0
4.5
LnTSS
02
4
LnNTU
0 2 4 6 8
10
20
30
80 100 140 200 300 400 500 0.2 0.4 0.6 0.8 7.5 8.0 8.5 0.00 0.05 0.10 0.15 1.5 2.5 3.5 4.5 0 1 2 3 4 5 10 15 20 25 30
10
20
30
TEMP
Cockburn River at Mulla Crossing
Figure 24: Draftsman plots for Cockburn River at Mulla Crossing
NSW Department of Industry | PUBXX/YYYY | 71

Water quality technical report for the Namoi surface water resource plan area (SW14)
2007-2
008
2008-2
009
2009-2
010
2010-2
011
2011-2
012
2012-2
013
2013-2
014
2014-2
015
0.0
0.5
1.0
1.5
2.0T
N (
mg/L
)
2007-2
008
2008-2
009
2009-2
010
2010-2
011
2011-2
012
2012-2
013
2013-2
014
2014-2
015
0.00
0.05
0.10
0.15
0.20
0.25
TP
(m
g/L
)
2007-2
008
2008-2
009
2009-2
010
2010-2
011
2011-2
012
2012-2
013
2013-2
014
2014-2
015
0
10
20
30
40
50
60
Turb
idity (
NT
U)
2007-2
008
2008-2
009
2009-2
010
2010-2
011
2011-2
012
2012-2
013
2013-2
014
2014-2
015
0
10
20
30
40
50
60
TS
S (
mg/L
)
2007-2
008
2008-2
009
2009-2
010
2010-2
011
2011-2
012
2012-2
013
2013-2
014
2014-2
015
40
60
80
100
120
140
160
180
DO
(%
satu
ration)
2007-2
008
2008-2
009
2009-2
010
2010-2
011
2011-2
012
2012-2
013
2013-2
014
2014-2
015
7.0
7.5
8.0
8.5
9.0
9.5
pH
2007-2
008
2008-2
009
2009-2
010
2010-2
011
2011-2
012
2012-2
013
2013-2
014
2014-2
015
100
200
300
400
500
600
EC
(µS
/cm
)
A)4.8 B)
0.646
C) 130 D) 130
E)F)
G)
Figure 25: Water quality data for Cockburn River at Mulla Crossing
NSW Department of Industry | PUBXX/YYYY | 72

Water quality technical report for the Namoi surface water resource plan area (SW14)
Peel River at Paradise Weir There was a strong positive correlation between total phosphorus and turbidity, but not as strong a correlation between both parameters and flow. Results tend to remain stable until flows become very high. Total nitrogen showed a slight positive correlation to total phosphorus and turbidity, but a stronger correlation to flow. Electrical conductivity was negatively correlated to flow. Dissolved oxygen results were highest during low flows. The water quality samples at this site are collected from a large pool, which during low flows, can have high concentrations of green algae, which increases the dissolved oxygen levels.
The annual median total nitrogen, total phosphorus and turbidity were less than the respective Basin Plan targets in all years. Similarly, the pH was within the upper and lower range all years. Dissolved oxygen increased during the low flows in 2014/2015, but the annual median remained below the upper limit of 110% saturation. The electrical conductivity increased after the wetter 2010/2011, and continued to increase until 2014/2015. A similar trend can be observed in both the monthly and the continuous electrical conductivity data. Future monitorng will show if results drop again similar to other catchments.
2 3 4 5 6 7 8
24
68
LnQ
80
10
01
20
DO
20
04
00
60
0
EC
0.2
0.6
LnTN
7.5
8.5
pH
0.0
50
.15
LnTP
1.5
3.0
4.5
LnTSS
23
45
LnNTU
2 3 4 5 6 7 8
10
20
80 90 100 120 200 300 400 500 600 0.2 0.4 0.6 0.8 7.5 8.0 8.5 9.0 0.05 0.15 1.5 2.5 3.5 4.5 2 3 4 5 10 15 20 25
10
20
TEMP
Peel River at Paradise Weir
Figure 26: Draftsman plots for Peel River at Paradise Weir
NSW Department of Industry | PUBXX/YYYY | 73

Water quality technical report for the Namoi surface water resource plan area (SW14)
2007-2
008
2008-2
009
2009-2
010
2010-2
011
2011-2
012
2012-2
013
2013-2
014
2014-2
015
0.0
0.5
1.0
1.5T
N (
mg/L
)
2007-2
008
2008-2
009
2009-2
010
2010-2
011
2011-2
012
2012-2
013
2013-2
014
2014-2
015
0.00
0.05
0.10
0.15
0.20
0.25
TP
(m
g/L
)
2007-2
008
2008-2
009
2009-2
010
2010-2
011
2011-2
012
2012-2
013
2013-2
014
2014-2
015
0
50
100
150
200
250
Turb
idity (
NT
U)
2007-2
008
2008-2
009
2009-2
010
2010-2
011
2011-2
012
2012-2
013
2013-2
014
2014-2
015
0
25
50
75
100
125
150
TS
S (
mg/L
)
2007-2
008
2008-2
009
2009-2
010
2010-2
011
2011-2
012
2012-2
013
2013-2
014
2014-2
015
60
70
80
90
100
110
120
130
DO
(%
satu
ration)
2007-2
008
2008-2
009
2009-2
010
2010-2
011
2011-2
012
2012-2
013
2013-2
014
2014-2
015
7.0
7.5
8.0
8.5
9.0
9.5
pH
2007-2
008
2008-2
009
2009-2
010
2010-2
011
2011-2
012
2012-2
013
2013-2
014
2014-2
015
100
200
300
400
500
600
700
EC
(µS
/cm
)
2007-2
008
2008-2
009
2009-2
010
2010-2
011
2011-2
012
2012-2
013
2013-2
014
2014-2
015
200
300
400
500
600
700
EC
(µS
/cm
)
A) B)
C) D)
E)F)
G) H)
Figure 27: Water quality data for Peel River at Paradise Weir
NSW Department of Industry | PUBXX/YYYY | 74

Water quality technical report for the Namoi surface water resource plan area (SW14)
Peel River at Carroll Gap There was a strong positive correlation between total nitrogen and turbidity. The correlation between total nitrogen and total phosphorus and turbidity was not as strong. There was not a clear correlation between these three parameters and flow. Electrical conductivity was strongly negatively correlated to flow.
The annual median total nitrogen exceeded the Basin Plan target in the higher flow years from 2010 to 2013, and then declined again as flows decreased. Total phosphorus results were higher in the low flow years from 2007 to 2010, and then decreased with higher flows. This suggests phosphorus concentrations were derived from a point source rather than diffuse sources. A new wastewater treatment plant and water reuse farm for Tamworth came online in 2010. Treated water that was previously returned to the Peel River is now delivered to a reuse farm. The lower total phosphorus results from 2013 to 2015 suggest the works were reducing nutrient inputs to the Peel River. The annual median turbidity was higher in the low flow years from 2007 to 2010, and increased again in 2013 to 2015. This may be in response to high carp numbers in the Peel River, stirring up sediment. Dissolved oxygen and pH results were mostly within the upper and lower limits. Electrical conductivity decreased with the arrival of dilution flows in 2010. The recharge of shallow groundwater in the catchment area resulted in increased electrical conductivity from 2011 to 2015.
2 4 6 8
24
68
LnQ
60
10
0
DO
20
08
00
EC
0.4
0.8
1.2
LnTN
7.0
8.0
9.0
pH
0.0
50
.20
LnTP
2.5
4.0
5.5
LnTSS
23
45
6
LnNTU
2 4 6 8
10
20
30
60 80 100 120 200 600 1000 0.4 0.6 0.8 1.0 1.2 7.0 7.5 8.0 8.5 9.0 0.05 0.15 0.25 2.5 3.5 4.5 5.5 2 3 4 5 6 10 15 20 25 30
10
20
30
TEMP
Peel River at Carroll Gap
Figure 28: Draftsman plots for Peel River at Carroll Gap
NSW Department of Industry | PUBXX/YYYY | 75

Water quality technical report for the Namoi surface water resource plan area (SW14)
2007-2
008
2008-2
009
2009-2
010
2010-2
011
2011-2
012
2012-2
013
2013-2
014
2014-2
015
0.0
0.5
1.0
1.5
2.0
2.5T
N (
mg/L
)
2007-2
008
2008-2
009
2009-2
010
2010-2
011
2011-2
012
2012-2
013
2013-2
014
2014-2
015
0.00
0.05
0.10
0.15
0.20
0.25
0.30
0.35
TP
(m
g/L
)
2007-2
008
2008-2
009
2009-2
010
2010-2
011
2011-2
012
2012-2
013
2013-2
014
2014-2
015
0
50
100
150
200
250
Turb
idity (
NT
U)
2007-2
008
2008-2
009
2009-2
010
2010-2
011
2011-2
012
2012-2
013
2013-2
014
2014-2
015
0
50
100
150
200
250
TS
S (
mg/L
)
2007-2
008
2008-2
009
2009-2
010
2010-2
011
2011-2
012
2012-2
013
2013-2
014
2014-2
015
60
80
100
120
140
DO
(%
satu
ration)
2007-2
008
2008-2
009
2009-2
010
2010-2
011
2011-2
012
2012-2
013
2013-2
014
2014-2
015
6.5
7.0
7.5
8.0
8.5
9.0
9.5
pH
2007-2
008
2008-2
009
2009-2
010
2010-2
011
2011-2
012
2012-2
013
2013-2
014
2014-2
015
250
500
750
1000
1250
EC
(µS
/cm
)
A) B)
C) 300 380 D) 400 470
E) F)
G)
Figure 29: Water quality data for Peel River at Carroll Gap
NSW Department of Industry | PUBXX/YYYY | 76

Water quality technical report for the Namoi surface water resource plan area (SW14)
Mooki River at Breeza There was a positive correlation between total nitrogen, total phosphorus and turbidity, with all three parameters positively correlated to flow. Electrical conductivity was negatively correlated to flow.
The annual median total phosphorus exceeded the Basin Plan target all years. The basaltic geology of the Liverpool Ranges produced the phosphorus rich soils of the Liverpool Plains. The high phosphorus content in the soils is reflected in the qualty of the water at the Breeza monitoring site. The median turbidity is below the target value most years, however the results increased during high flows due to the high clay content of the soils. In addition, the soils on the Liverpool Plains are alkaline resulting in increased pH in the Mooki River. Dissolved oxygen was mostly within the upper and lower limits. Highly saline, shallow groundwater in this catchment results in high electrical conductivity. As with other catchments, the electrical conductivity increased following rainfall and flooding in 2010, and started to decrease again in 2014/2015 as shallow groundwater levels started to decline.
0 2 4 6 8
02
46
8
LnQ
60
10
0
DO
40
01
00
0
EC
0.5
1.5
LnTN
7.5
8.5
pH
0.2
0.6
LnTP
23
45
6
LnTSS
34
56
LnNTU
0 2 4 6 8
10
20
30
60 80 100 120 400 800 1200 1600 0.5 1.0 1.5 2.0 7.5 8.0 8.5 9.0 0.2 0.4 0.6 0.8 2 3 4 5 6 3 4 5 6 10 15 20 25 30
10
20
30
TEMP
Mooki River at Breeza
Figure 30: Draftsman plots for Mooki River at Breeza
NSW Department of Industry | PUBXX/YYYY | 77

Water quality technical report for the Namoi surface water resource plan area (SW14)
2007-2
008
2008-2
009
2009-2
010
2010-2
011
2011-2
012
2012-2
013
2013-2
014
2014-2
015
0
1
2
3
4T
N (
mg/L
)
2007-2
008
2008-2
009
2009-2
010
2010-2
011
2011-2
012
2012-2
013
2013-2
014
2014-2
015
0.0
0.2
0.4
0.6
0.8
1.0
TP
(m
g/L
)
2007-2
008
2008-2
009
2009-2
010
2010-2
011
2011-2
012
2012-2
013
2013-2
014
2014-2
015
0
50
100
150
200
250
Turb
idity (
NT
U)
2007-2
008
2008-2
009
2009-2
010
2010-2
011
2011-2
012
2012-2
013
2013-2
014
2014-2
015
0
50
100
150
200
250
TS
S (
mg/L
)
2007-2
008
2008-2
009
2009-2
010
2010-2
011
2011-2
012
2012-2
013
2013-2
014
2014-2
015
40
60
80
100
120
140
DO
(%
satu
raltio
n)
2007-2
008
2008-2
009
2009-2
010
2010-2
011
2011-2
012
2012-2
013
2013-2
014
2014-2
015
7.0
7.5
8.0
8.5
9.0
9.5
pH
2007-2
008
2008-2
009
2009-2
010
2010-2
011
2011-2
012
2012-2
013
2013-2
014
2014-2
015
0
250
500
750
1000
1250
1500
1750
EC
(µS
/cm
)
A) 6.8 5.2 5.0 B) 1.27 1.05 1.48 1.03
C)1200 400 600 370
D)410 390 380 280
E)F)
G)
Figure 31: Water quality data for Mooki River at Breeza
NSW Department of Industry | PUBXX/YYYY | 78

Water quality technical report for the Namoi surface water resource plan area (SW14)
Coxs Creek at Boggabri There was a positive correlation between total nitrogen, total phosphorus and turbidity. There was not a correlation between these parameters and flow, due to Coxs Creek not flowing for the majority of the monitoring period. The lack of flow also masked any correlation between electrical conductivity and flow. There was a positive correlation between dissolved oxygen and pH.
The annual median total nitrogen, total phosphorus and turbidity exceeded the Basin Plan target all years. Similar to the Mooki River, the extensive cropping of highly fertile, heavy clay soils on the Liverpool Plains results in high nutrient and turbidity levels in Coxs Creek. The annual median dissolved oxygen was within the upper and lower limits, with occasional high results in response to local drivers. The pH was also within the upper and lower limits. Electrical conductivity increased in 2010, following the flooding recharging shallow saline groundwater. Results decreased again in 2013.
0 2 4 6 8
02
46
8
LnQ
50
15
0
DO
20
08
00
14
00
EC
0.5
1.5
LnTN
6.5
8.0
9.5
pH
0.2
0.6
LnTP
23
45
6
LnTSS
34
56
LnNTU
0 2 4 6 8
10
20
30
50 100 150 200 200 600 1000 0.5 1.0 1.5 2.0 6.5 7.5 8.5 9.5 0.2 0.4 0.6 0.8 2 3 4 5 6 3 4 5 6 10 15 20 25 30
10
20
30
TEMP
Coxs Creek at Boggabri
Figure 32: Draftsman plots for Coxs Creek at Boggabri
NSW Department of Industry | PUBXX/YYYY | 79

Water quality technical report for the Namoi surface water resource plan area (SW14)
2007-2
008
2008-2
009
2009-2
010
2010-2
011
2011-2
012
2012-2
013
2013-2
014
2014-2
015
0
1
2
3
4
5T
N (
mg/L
)
2007-2
008
2008-2
009
2009-2
010
2010-2
011
2011-2
012
2012-2
013
2013-2
014
2014-2
015
0.0
0.2
0.4
0.6
0.8
1.0
1.2
1.4
TP
(m
g/L
)
2007-2
008
2008-2
009
2009-2
010
2010-2
011
2011-2
012
2012-2
013
2013-2
014
2014-2
015
0
100
200
300
400
500
600
Turb
idity (
NT
U)
2007-2
008
2008-2
009
2009-2
010
2010-2
011
2011-2
012
2012-2
013
2013-2
014
2014-2
015
0
100
200
300
400
500
600
TS
S (
mg/L
)
2007-2
008
2008-2
009
2009-2
010
2010-2
011
2011-2
012
2012-2
013
2013-2
014
2014-2
015
0
50
100
150
200
250
DO
(%
satu
ration)
2007-2
008
2008-2
009
2009-2
010
2010-2
011
2011-2
012
2012-2
013
2013-2
014
2014-2
0156.0
6.5
7.0
7.5
8.0
8.5
9.0
9.5
10.0
pH
2007-2
008
2008-2
009
2009-2
010
2010-2
011
2011-2
012
2012-2
013
2013-2
014
2014-2
015
0
250
500
750
1000
1250
1500
1750
EC
(µS
/cm
)
2007-2
008
2008-2
009
2009-2
010
2010-2
011
2011-2
012
2012-2
013
2013-2
014
2014-2
015
0
250
500
750
1000
1250
1500
EC
(µS
/cm
)
A)7.6 5.8 B)
C) 1400 850 900 D) 820 880 720
E)F)
G) H)
Figure 33: Water quality data for Coxs Creek at Boggabri
NSW Department of Industry | PUBXX/YYYY | 80

Water quality technical report for the Namoi surface water resource plan area (SW14)
Namoi River at Gunnedah There was a slight positive correlation between total nitrogen, total phosphorus and turbidity, with all three parameters not strongly correlated to flow. Electrical conductivity was negatively correlated to flow and there was a positive correlation between dissolved oxygen and pH.
The annual median total nitrogen and total phosphorus was less than the respective target values most years, exceeding the target in the wetter years from 2010 to 2012. The turbidity median only exceeded the target in 2007/2008. The Gunnedah monitoring site is located approximately 60 kms downstream of Keepit Dam. The dam has a stabilising effect on the quality of the water derived from the upper Namoi catchment, however high tributary inflows from the Peel and Mooki Rivers result in occasional high turbidity and nutrient concentrations. Annual dissolved oxygen and pH was within the desired upper and lower limits in all years. Releases from Keepit Dam generally dilutes salts in the Namoi River keeping the electrical conductivity low, however as for nutrients and turbidity, the electrical conductivity can fluctuate in response to tributary inflows from the saline Mooki River which enters the Namoi River approximately 4 kms upstream of the Gunnedah monitoring site, and from the Peel River. As for other catchments, there is the similar trend of lower electrical conductivity during 2010/2011, and then increasing in 2010 to 2014.
0 2 4 6 8 10
04
8
LnQ
70
90
12
0
DO
40
08
00
EC
0.5
1.5
LnTN
7.5
8.5
pH
0.2
0.6
LnTP
24
6
LnTSS
24
6
LnNTU
0 2 4 6 8 10
10
20
30
70 90 110 130 400 600 800 0.5 1.0 1.5 7.5 8.0 8.5 9.0 0.2 0.4 0.6 0.8 2 3 4 5 6 7 2 3 4 5 6 7 10 15 20 25 30
10
20
30
TEMP
Namoi River at Gunnedah
Figure 34: Draftsman plots for Namoi River at Gunnedah
NSW Department of Industry | PUBXX/YYYY | 81

Water quality technical report for the Namoi surface water resource plan area (SW14)
2007-2
008
2008-2
009
2009-2
010
2010-2
011
2011-2
012
2012-2
013
2013-2
014
2014-2
015
0
1
2
3
4
5T
N (
mg/L
)
2007-2
008
2008-2
009
2009-2
010
2010-2
011
2011-2
012
2012-2
013
2013-2
014
2014-2
015
0.0
0.2
0.4
0.6
0.8
TP
(m
g/L
)
2007-2
008
2008-2
009
2009-2
010
2010-2
011
2011-2
012
2012-2
013
2013-2
014
2014-2
015
0
20
40
60
80
100
Turb
idity (
NT
U)
2007-2
008
2008-2
009
2009-2
010
2010-2
011
2011-2
012
2012-2
013
2013-2
014
2014-2
015
0
100
200
300
400
TS
S (
mg/L
)
2007-2
008
2008-2
009
2009-2
010
2010-2
011
2011-2
012
2012-2
013
2013-2
014
2014-2
015
40
60
80
100
120
140
DO
(%
satu
ration)
2007-2
008
2008-2
009
2009-2
010
2010-2
011
2011-2
012
2012-2
013
2013-2
014
2014-2
0157.0
7.5
8.0
8.5
9.0
9.5
pH
2007-2
008
2008-2
009
2009-2
010
2010-2
011
2011-2
012
2012-2
013
2013-2
014
2014-2
015
200
400
600
800
1000
EC
(µS
/cm
)
2007-2
008
2008-2
009
2009-2
010
2010-2
011
2011-2
012
2012-2
013
2013-2
014
2014-2
015
200
400
600
800
1000
EC
(µS
/cm
)
A) B) 1.21
C) 800 2000 1700 340 700 D) 660 1300 1200
E) F)
G)H)
Figure 35: Water quality data for Namoi River at Gunnedah
NSW Department of Industry | PUBXX/YYYY | 82

Water quality technical report for the Namoi surface water resource plan area (SW14)
Narrabri Creek at Narrabri The draftsman plots show total nitrogen and total phosphorus were positively correlated, but both nutrients were not as strongly correlated to turbidity. All three parameters show a slight positive correlation to flow. There was a positive correlation between dissolved oxygen and pH. Electrical conductivity was negatively correlated to flow.
The annual median total phosphorus exceeds the Basin Plan target every year. Total nitrogen and turbidity results are close to the respective targets, exceeding them in the wetter years from 2010 to 2012. Dissolved oxygen and pH annual medians are within the desired range. As for the Gunnedah monitoring site, releases from Keepit Dam generally dilutes salts in the Namoi River keeping the electrical conductivity low, with some fluctuations due to tributary inflows. This monitoring site is located close to the boundary of the upland and lowland zones, where it is receiving the cumulative impacts from upstream, particularly high phosphorus inputs from the Liverpool Plains. The total phosphorus target may need to be assessed to determine if it is appropriate for this site.
0 2 4 6 8 10
04
8
LnQ
70
90
11
0
DO
20
05
00
80
0
EC
0.5
1.0
1.5
LnTN
7.0
8.0
pH
0.2
0.6
LnTP
23
45
67
LnTSS
23
45
6
LnNTU
0 2 4 6 8 10
15
25
70 80 90 100 200 400 600 800 0.5 1.0 1.5 7.0 7.5 8.0 8.5 0.2 0.4 0.6 0.8 2 3 4 5 6 7 2 3 4 5 6 15 20 25 30
15
25
TEMP
Narrabri Creek at Narrabri
Figure 36: Draftsman plots for Narrabri Creek at Narrabri
NSW Department of Industry | PUBXX/YYYY | 83
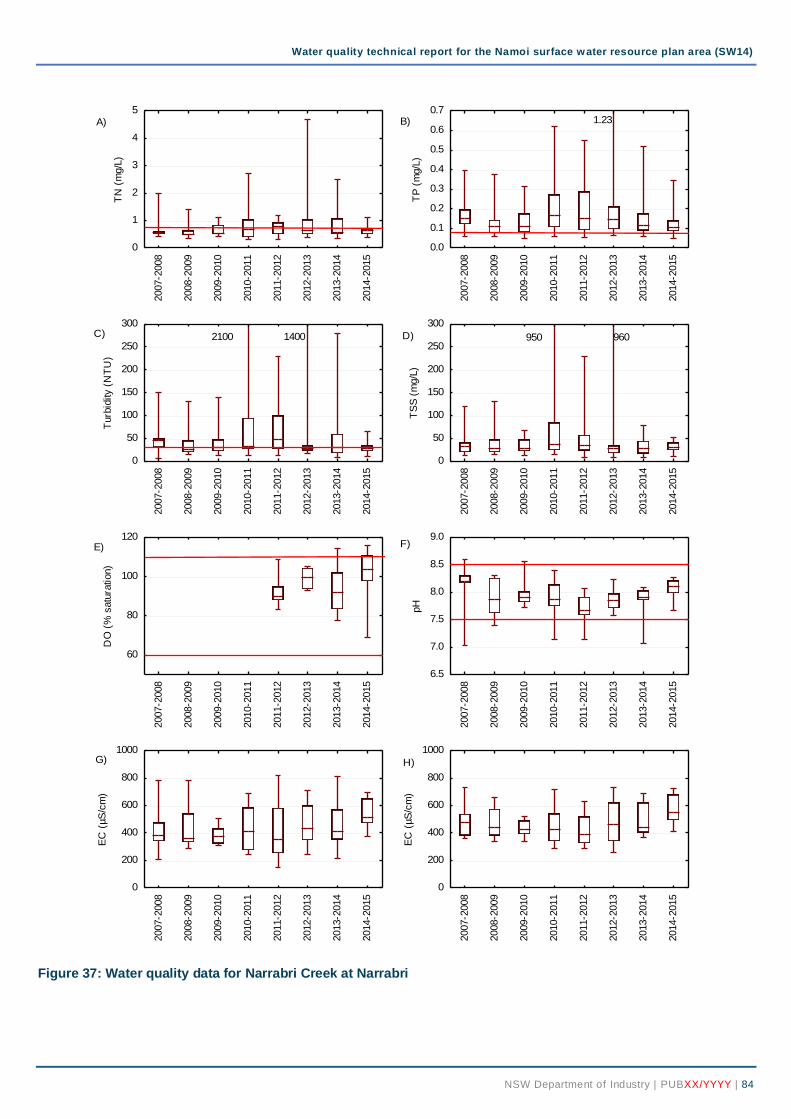
Water quality technical report for the Namoi surface water resource plan area (SW14)
2007-2
008
2008-2
009
2009-2
010
2010-2
011
2011-2
012
2012-2
013
2013-2
014
2014-2
015
0
1
2
3
4
5T
N (
mg/L
)
2007-2
008
2008-2
009
2009-2
010
2010-2
011
2011-2
012
2012-2
013
2013-2
014
2014-2
015
0.0
0.1
0.2
0.3
0.4
0.5
0.6
0.7
TP
(m
g/L
)
2007-2
008
2008-2
009
2009-2
010
2010-2
011
2011-2
012
2012-2
013
2013-2
014
2014-2
015
0
50
100
150
200
250
300
Turb
idity (
NT
U)
2007-2
008
2008-2
009
2009-2
010
2010-2
011
2011-2
012
2012-2
013
2013-2
014
2014-2
015
0
50
100
150
200
250
300
TS
S (
mg/L
)
2007-2
008
2008-2
009
2009-2
010
2010-2
011
2011-2
012
2012-2
013
2013-2
014
2014-2
015
60
80
100
120
DO
(%
satu
ration)
2007-2
008
2008-2
009
2009-2
010
2010-2
011
2011-2
012
2012-2
013
2013-2
014
2014-2
0156.5
7.0
7.5
8.0
8.5
9.0
pH
2007-2
008
2008-2
009
2009-2
010
2010-2
011
2011-2
012
2012-2
013
2013-2
014
2014-2
015
0
200
400
600
800
1000
EC
(µS
/cm
)
2007-2
008
2008-2
009
2009-2
010
2010-2
011
2011-2
012
2012-2
013
2013-2
014
2014-2
015
0
200
400
600
800
1000
EC
(µS
/cm
)
A) B) 1.23
C) 2100 1400 D) 950 960
E) F)
G) H)
Figure 37: Water quality data for Narrabri Creek at Narrabri
NSW Department of Industry | PUBXX/YYYY | 84

Water quality technical report for the Namoi surface water resource plan area (SW14)
Namoi River at Bugilbone There was a positive correlation between total nitrogen, total phosphorus and turbidity. Total phosphorus and turbidity were also correlated to flow. Correlation between total nitrogen and flow was not as clear. Electrical conductivity was negatively correlated to flow.
The total nitrogen, total phosphorus and turbidity annual medians were below the respective Basin Plan targets in all years. Dissolved oxygen and pH annual medians were within the desired range. The electrical conductivity results were similar to those of the upstream Narrabri Creek at Narrabri site, suggesting limited connectivity between surface water and shallow saline groundwater.
0 2 4 6 8
02
46
8
LnQ
70
90
11
0
DO
20
05
00
EC
0.4
0.8
1.2
LnTN
7.5
8.5
pH
0.1
0.3
0.5
LnTP
23
45
6
LnTSS
34
56
7
LnNTU
0 2 4 6 8
10
20
30
70 90 110 200 400 600 0.4 0.8 1.2 7.5 8.0 8.5 9.0 0.1 0.3 0.5 2 3 4 5 6 3 4 5 6 7 10 15 20 25 30
10
20
30
TEMP
Namoi River at Bugilbone
Figure 38: Draftsman plots for Namoi River at Bugilbone
NSW Department of Industry | PUBXX/YYYY | 85

Water quality technical report for the Namoi surface water resource plan area (SW14)
2007-2
008
2008-2
009
2009-2
010
2010-2
011
2011-2
012
2012-2
013
2013-2
014
2014-2
015
0.0
0.5
1.0
1.5
2.0
2.5
3.0T
N (
mg/L
)
2007-2
008
2008-2
009
2009-2
010
2010-2
011
2011-2
012
2012-2
013
2013-2
014
2014-2
015
0.0
0.2
0.4
0.6
0.8
TP
(m
g/L
)
2007-2
008
2008-2
009
2009-2
010
2010-2
011
2011-2
012
2012-2
013
2013-2
014
2014-2
015
0
100
200
300
400
Turb
idity
2007-2
008
2008-2
009
2009-2
010
2010-2
011
2011-2
012
2012-2
013
2013-2
014
2014-2
015
0
50
100
150
200
250
300
TS
S (
mg/L
)
2007-2
008
2008-2
009
2009-2
010
2010-2
011
2011-2
012
2012-2
013
2013-2
014
2014-2
015
60
80
100
120
DO
(%
satu
ration)
2007-2
008
2008-2
009
2009-2
010
2010-2
011
2011-2
012
2012-2
013
2013-2
014
2014-2
015
7.0
7.5
8.0
8.5
9.0
pH
2007-2
008
2008-2
009
2009-2
010
2010-2
011
2011-2
012
2012-2
013
2013-2
014
2014-2
015
0
200
400
600
800
EC
(µS
/cm
)
A) B)
C) 850D)
660
E)F)
G)
Figure 39: Water quality data for Namoi River at Bugilbone
NSW Department of Industry | PUBXX/YYYY | 86
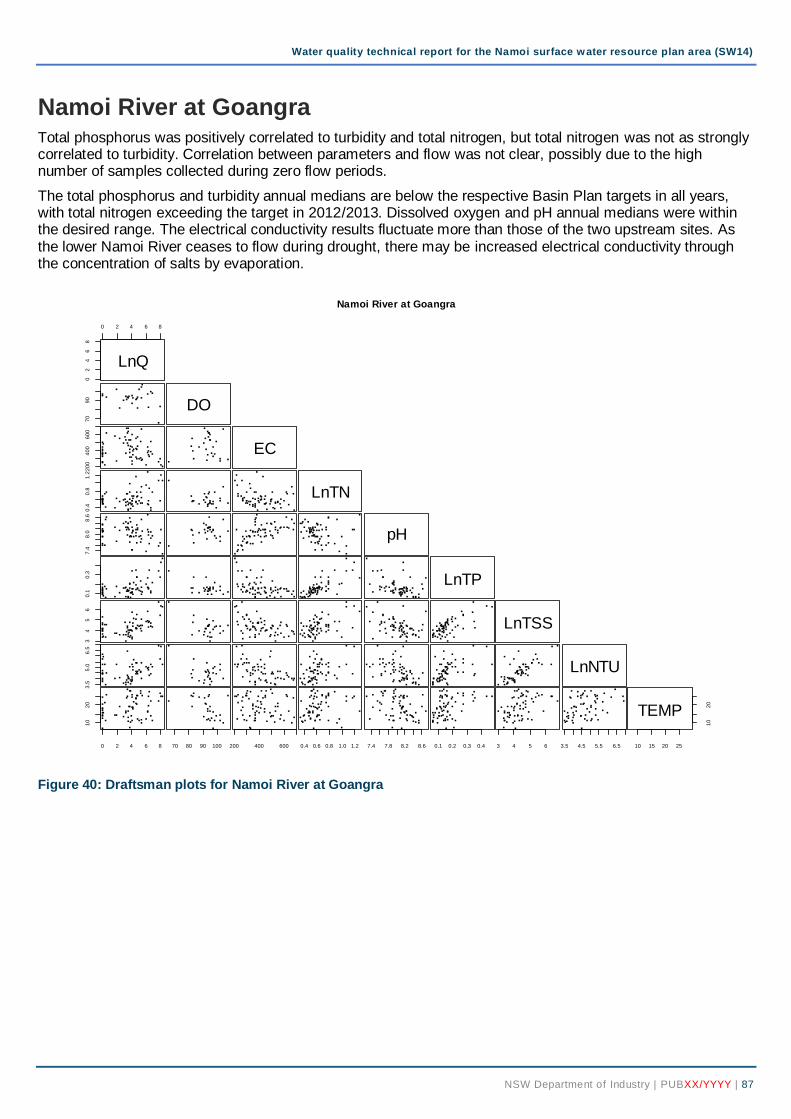
Water quality technical report for the Namoi surface water resource plan area (SW14)
Namoi River at Goangra Total phosphorus was positively correlated to turbidity and total nitrogen, but total nitrogen was not as strongly correlated to turbidity. Correlation between parameters and flow was not clear, possibly due to the high number of samples collected during zero flow periods.
The total phosphorus and turbidity annual medians are below the respective Basin Plan targets in all years, with total nitrogen exceeding the target in 2012/2013. Dissolved oxygen and pH annual medians were within the desired range. The electrical conductivity results fluctuate more than those of the two upstream sites. As the lower Namoi River ceases to flow during drought, there may be increased electrical conductivity through the concentration of salts by evaporation.
0 2 4 6 8
02
46
8
LnQ
70
90
DO
20
04
00
60
0
EC
0.4
0.8
1.2
LnTN
7.4
8.0
8.6
pH
0.1
0.3
LnTP
34
56
LnTSS
3.5
5.0
6.5
LnNTU
0 2 4 6 8
10
20
70 80 90 100 200 400 600 0.4 0.6 0.8 1.0 1.2 7.4 7.8 8.2 8.6 0.1 0.2 0.3 0.4 3 4 5 6 3.5 4.5 5.5 6.5 10 15 20 25
10
20
TEMP
Namoi River at Goangra
Figure 40: Draftsman plots for Namoi River at Goangra
NSW Department of Industry | PUBXX/YYYY | 87

Water quality technical report for the Namoi surface water resource plan area (SW14)
2007-2
008
2008-2
009
2009-2
010
2010-2
011
2011-2
012
2012-2
013
2013-2
014
2014-2
015
0.0
0.5
1.0
1.5
2.0
2.5
3.0T
N (
mg/L
)
2007-2
008
2008-2
009
2009-2
010
2010-2
011
2011-2
012
2012-2
013
2013-2
014
2014-2
015
0.0
0.1
0.2
0.3
0.4
0.5
0.6
TP
(m
g/L
)
2007-2
008
2008-2
009
2009-2
010
2010-2
011
2011-2
012
2012-2
013
2013-2
014
2014-2
015
0
100
200
300
400
Turb
idity (
NT
U)
2007-2
008
2008-2
009
2009-2
010
2010-2
011
2011-2
012
2012-2
013
2013-2
014
2014-2
015
0
100
200
300
400
500
600
TS
S (
mg/L
)
2007-2
008
2008-2
009
2009-2
010
2010-2
011
2011-2
012
2012-2
013
2013-2
014
2014-2
015
40
60
80
100
120
DO
(%
satu
ration)
2007-2
008
2008-2
009
2009-2
010
2010-2
011
2011-2
012
2012-2
013
2013-2
014
2014-2
015
7.0
7.5
8.0
8.5
9.0
pH
2007-2
008
2008-2
009
2009-2
010
2010-2
011
2011-2
012
2012-2
013
2013-2
014
2014-2
015
0
200
400
600
800
EC
(µS
/cm
)
2007-2
008
2008-2
009
2009-2
010
2010-2
011
2011-2
012
2012-2
013
2013-2
014
2014-2
015
0
200
400
600
800
EC
(µS
/cm
)
A)B)
C) 1100 800 950 D)870
E) F)
G) H)
Figure 41: Water quality data for Namoi River at Goangra
NSW Department of Industry | PUBXX/YYYY | 88