THE GROUND WATER QUALITY OF OYIGBO OIL CENTER AREA. (A CASE STUDY OF AFAM-NTA COMMUNITY, OYIGBO...
116
A RESEARCH ON THE GROUND WATER QUALITY OF OYIGBO OIL CENTER AREA. (A CASE STUDY OF AFAM-NTA COMMUNITY, OYIGBO LOCAL GOVERNMENT AREA. RIVERS STATE) BY EKEKE, RAWLINGS OKECHUKWU (a.k.a SIRLAW) (HND- IMT, B.TECH- UNIPORT, NIMECHE, NREP-USA) 1
-
Upload
independent -
Category
Documents
-
view
3 -
download
0
Transcript of THE GROUND WATER QUALITY OF OYIGBO OIL CENTER AREA. (A CASE STUDY OF AFAM-NTA COMMUNITY, OYIGBO...
A
RESEARCH
ON
THE GROUND WATER QUALITY OF OYIGBO OIL CENTERAREA.
(A CASE STUDY OF AFAM-NTA COMMUNITY, OYIGBOLOCAL GOVERNMENT AREA. RIVERS STATE)
BY
EKEKE, RAWLINGS OKECHUKWU (a.k.a SIRLAW)(HND- IMT, B.TECH- UNIPORT, NIMECHE, NREP-USA)
1
MARCH, 2015
DEDICATION
This project is dedicated to God Almighty for his
abundant grace and mercies throughout the period of
this research.
2

ACKNOWLEDGEMENT
I am grateful to God Almighty without whom this work
would not have been a success.
I am appreciative to my unmarried wife for her support
and prayers towards this research work.
Also, I acknowledge the unrelenting financial, moral
and academical efforts of my parents Sir and Mrs
Ekeke, Peter, my eminent Aunty Ekeke Violet, my uncle
Engr and Mrs Evans Ekeke, Pastor and Mrs Prince
Charles towards my project research in this academic
excellence pursuit.
3

To my sisters and brothers; Engr. Ekeke Steve Sorochi,
Ekeke Chizorom, Ekeke Matina and my boy Charles Joseph
, I also acknowledge your moral and financial support
towards the success of this project.
I will not fail to appreciate the kind gesture given
to me by my best friend Engr. Oluka Benjamin. my
manager Pastor Prince Charles, my colleagues and staff
of the department.
And mostly, I am grateful to my Boss Engr. Anike
Michael of mechanical Department, University of Enugu
Teaching Hospital. And also to my entire sundry for
being part of this success story.
TO GOD BE THE GLORY. AMEN
EKEKE, RAWLINGS OKECHUKWU
4
ABSTRACT
Water is a solvent and dissolves minerals from the
rocks with which it comes in contact. Ground water: is
the water located beneath the earth’s surface in soil
pore spaces and in the fractures of rock formations.
5
Groundwater may contain dissolved minerals and gases
that gives it the tangy taste enjoyed by many people.
Without these minerals and gases, the water would taste
flat.(see Adesanya, 1984; Egborge, 1991; Olabaniyi and
Owoyemi, 2004;2006) The most common dissolved mineral
substances are sodium, calcium, magnesium, potassium,
chloride, bicarbonate and sulphate. The samples
collected was tested for these physic chemical
parameters. This result shows a slight change with
respect to the W.H.O standards. The ground water
samples that have values of PH below WHO limit, higher
pb, fe2+, TDS, conductivity, Ca2+, Hco3, So42-, No3, on the
basis of WHO specifications, the ground water cannot be
regarded as portable owing to its high coliform counts
and acidic nature, From our study, the sample
investigated has PH less than WHO. Limit which
indicates that the water sample is acidic which may be
6

as a result of acid rain or dissolution of other
poisonous metals.
The corrosive effect of these gases may be associated
with the high rate of respiratory tract diseases in the
area.
TABLE OF CONTENT
Title page
i
Certification page
ii
Dedication iii
Acknowledgement iv
Abstract vi
Table of content vii
CHAPTER ONE; 7

1.0 Introduction 1
1.1 Background of the study
1
1.2 Statement of the problem
5
1.3 Aim and Objectives
8
1.4 Research hypothesis
8
1.5 Significance of the study
8
1.6 Scope of the study
9
1.7 Limitation of the study
10
1.8 Study Area
10
1.8.1 Population 11
1.8.2 Climate
11
8
1.8.3 Vegetation and soil
12
1.8.4 Relief and drainage
12
1.8.5 Economic activities
14
CHAPTER TWO
2.0 Conceptual frame work and literature review
15
2.1 Definitions of terms
15
2.2 Conceptual framework 21
2.2.1 How ground water occurs
21
2.3 Literature review 24
2.4 Common groundwater contaminants
38
2.5 Sources of contamination in ground water
40
9

CHAPTER THREE
3.0 Methodology 45
3.1 Sources of data
45
3.2 Method of data collection
46
3.3 sampling technique
46
3.4 Sample size 47
3.5 Method of data analysis
47
3.6 Test procedure and methodology
47
CHAPTER FOUR
4.0 Result presentation and data analysis
51
4.1 Data presentation 51
4.2 Physiochemical parameters 51
10

4.2.1 Site 1 (river)
51
4.2.2 Site 2 (well)
52
4.2.3 Site 3 (well)
54
4.2.4 Site 4 (river)
56
4.2.5 Site 5 (well)
58
4.2.6 Site 6 (river)
60
4.2.7 Site 7 (river)
62
4.3 Discussion 64
4.4 Environmental and health implication
70
CHAPTER FIVE
5.0 Summary and conclusion
7111

5.1 Summary of findings
71
CONCLUSION
73
POLICY IMPLICATION/ RECOMMENDATION 74
REFERENCES
75
12
CHAPTER ONE
1.0 INTRODUCTION
1.1 Background of the study
Oil plays a vast and vital role in our society as it is
organized today. Oil represents much more than just one
of the main energy sources used by mankind. Besides
being an important energy source, petroleum products
serve as feedstock for several consumer goods, thus
playing a growing and relevant role in people’s lives.
On the other hand, the oil industry holds a major
potential of hazards for the environment, and may
13

impact it at different levels: air, water, soil, and
consequently all living beings on our planet. Within
this context, the most widespread and dangerous
consequence of oil and gas industry activities is
pollution. Pollution is associated with virtually all
activities throughout all stages of oil and gas
production, from exploratory activities to refining.
Waste waters, gas emissions, solid waste and aerosols
generated during drilling, production and refining are
responsible for the most pollution. Other environmental
impacts include intensification of the greenhouse
effect, acid rain, poorer water quality, ground water
contamination, among others. The oil and gas industry
may also contribute to biodiversity loss as well as to
the destruction of ecosystems that in some cases may be
unique. Most potential environment impacts related to
oil and gas industry activities are already well
14

documented.(ikem et al, 2002, Edet, 2003 and regunath
et al 1987)
It is necessary to find ways to conciliate industry
development with environmental protection, that is,
with sustainable development. After recovered and
transported, crude oil has to go through refining
processes in order to be converted into products that
hold commercial value. Oil refineries are major
polluters, consuming large amounts of energy and water,
producing large quantities of waste waters, releasing
hazardous gases into the atmosphere and generating
solid waste that are difficult both to treat and to
dispose off.
In terms of the oil and gas impact on ground water
quality, it is seen in water contamination due to
effluent, wash water and cooling water discharges, and
seepage from storage and waste tanks; water
contamination due to discharges of water effluents rich
15

in inorganic salts without appropriate treatment
(slaine pollution). Thermal pollution due to discharge
of effluents with temperatures higher than recipient
water bodies. Ground water contamination by
inappropriate disposal of solid wastes resulting from
chemical industry processes, including effluent
treatment sludge and particulate matter from dust
collectors. The connections between water and energy
have been studied in recent years, with growing
recognition of how closely the two are linked. Water is
used, in varying quantities and ways in every step of
fossil fuel extraction and processing (ptacek et al,
2004).
For example, the amount of coal produced worldwide in
2009 required an estimated 1.3 to 4.5 billion cubic
meters (m) of water for extraction and processing. But
while interest has grown in the volume of water
required for energy production, the water- quality
16
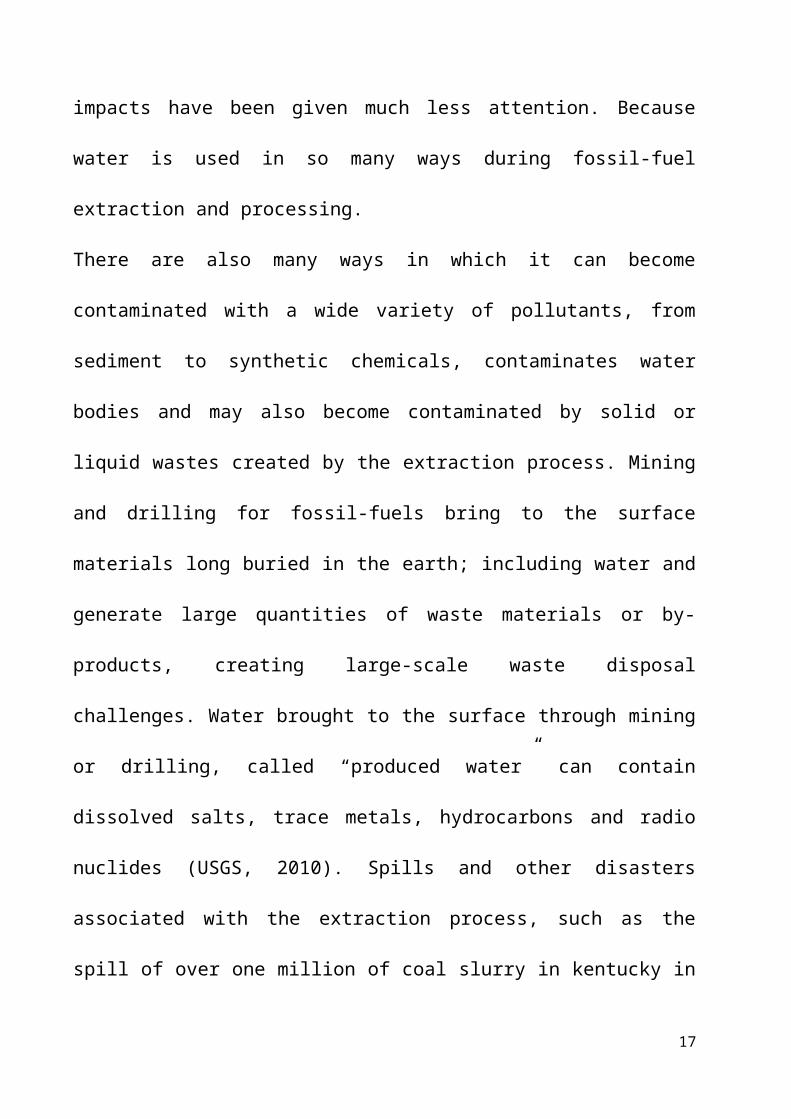
impacts have been given much less attention. Because
water is used in so many ways during fossil-fuel
extraction and processing.
There are also many ways in which it can become
contaminated with a wide variety of pollutants, from
sediment to synthetic chemicals, contaminates water
bodies and may also become contaminated by solid or
liquid wastes created by the extraction process. Mining
and drilling for fossil-fuels bring to the surface
materials long buried in the earth; including water and
generate large quantities of waste materials or by-
products, creating large-scale waste disposal
challenges. Water brought to the surface through mining
or drilling, called “produced water” can contain
dissolved salts, trace metals, hydrocarbons and radio
nuclides (USGS, 2010). Spills and other disasters
associated with the extraction process, such as the
spill of over one million of coal slurry in kentucky in
17

2000 when a containment dam failed, are anther source
of contamination (USDOE 2006), Finally, surface water
may drain into many openings and ground water
frequently accumulates in mines, leading to the
creation contamination of ground water quality.
Afam-nta-ndoki is one of the important oil producing
communities in Rivers stare of Nigeria. The Niger Delta
as a whole produces about 2 million barrels per day
with about 425 million cubic metres per day gas flared.
From this, a yearly input into the atmosphere of
400,000 tonnes of So2 has been estimated (ogunkoya and
Efi,2003). A part from this enormous amount of gas
flared into the environment, the activities of the
producing companies also lead to significant oil spills
and industrial effluent discharges that have the
potential to impair rainwater and ground water.
1.2 STATEMENT OF THE PROBLEM
18

Waste waters from oil and gas industries are being
discharged without appropriate treatment into rivers or
other locations where infiltration may occur. Water
effluents are not treated by any of the neutralization,
evaporation, aeration, flocculation, oil and grease
separation, carbon absorption and reverse osmosis;
solid wastes that cannot be recycled must be treated
appropriately before final disposal. From extraction to
end use, petroleum products affect surface water
qualify with hydrocarbon salts, nutrients, a host of
organic compounds, and various heavy metals. In many
areas around Afam-nta Ndoki in Oyigbo L.G.A, oil spills
and storm water run-off containing oil derivatives have
degraded ecosystems and human supply. Petroleum, also
known as Crude oil, comes from the remains of
prehistoric life subjected to heat and pressure for
millions of years. Over time, petroleum accumulated in
oil fields, between layers of impermeable rock. Crude
19

oil is extracted from tapping into the fields initial
pressure (known as primary recovery) to pressurizing
the fields with water or stream or other gases to force
the oil to the surface (known as secondary and
tertiary, or enhanced, recovery). The choice of
appropriate treatment is not properly complied with the
waste classification according to the pertinent
regulation(s) in Afam-nta Ndoki in Oyigbo L.G.A oil
producing area. Depending on the nature of the waste
possible treatment methods include incineration,
controlled landfill disposal, chemical immobilization
and solidification, encapsulation, burning in cement
kilns, etc but these treatments may be unavailable at
the site in Afam-nta Ndoki in Oyigbo Local Government
Area.
Water is considered absolutely essential to sustain
life. In Nigeria ground water has a major role to
satisfy the needs of domestic and agricultural
20

purposes. The ever growing demand of water resources
coupled with the rate at which much of the earth’s
fresh water being adversely affected by human
activities, demonstrates a developing crisis and
horrible future of environmental water resources are
not appropriately managed. Afam-nta-Ndoki is not an
exception to this future crisis indeed. Afam-nta Ndoki
with an average annual rainfall of 300mm is a city
located in an area that suffers critically from a
shortage of water resources. So the conservation of
improvised water resources is indispensable for the
sustainability of our economic development. For this
reason, in the past few decades more attention has been
given to the water quality in Afam-nta Ndoki. Afam-nta
Ndoki is facing water quality problems as well as
drinking water shortage, especially during the wet
season.
21

Many people from the community are suffering from
health problems due to consumption of the available
contaminated water. according to the report of
environmental professionals in Nigeria there were about
400 wells and drainages in the Afam-nta Ndoki
Community. Out of these, some are still living and
polluted by underground oil and spillages but not
maintained. Some of them become dumping places for
garbage.
Preventive maintenance of equipment and storage areas
are not measure put into consideration by oyigbo oil
producing center, to prevent occasional leaks. It is
based on these inherent problems that the research
questions are asked as follows;
1.What are the reasons for improper or lack of treatment
of water before disposal in the study areas?
2.Why are incineration method not considered before water
are discharged into rivers in the study areas?
22

3.What possible ways can this problem be curb in the
study areas?
4.why does production has its intended effect on ground
water quality
5.How can we proffer solution to these problems in the
study areas?
1.2AIM AND OBJECTIVES
The aim of the study is to examine the ground water
quality and its physiochemical properties in Afam-nta
Ndoki, Oyigbo Local Government area. The objectives of
the study are:
1.To examine the method of treatment of waste water in
the area.
2.To determine the causes of improper treatment of waste
water before disposal in the study area.
3.To proffer solution to the effect of oil production and
its intended effect on ground water quality.
23
1.4 RESEARCH HYPOTHESIS
For the purpose of this study, the research hypothesis
is
Hi: There is significant difference between the normal
water and underground water in the study area.
Ho: There is no significant difference between the
normal water and underground water.
1.5 SIGNIFICANCE OF STUDY
This research will serve as gateway to further research
on the negative impact or effect of oil spillage and
environmental pollution to the aquatic lives, human
beings and the environment at large. It will also
create a
background that will provide a long lasting measure to
curb the environmental law violation situations and
dangers of contaminated water in the lives of humans.
It is also geared towards providing a lasting solution
to Government and its agencies or commission which can
24

they can base their policies that will minimize or
eradicate completely the problems of gas flaring, oil
spillage and general water pollution and other factors
traceable to causing harm to human health as a result
of the quality of the water taken. The research work
will also serve as a basement towards understanding the
physiochemical parameters of good water and their
corresponding measures of detecting them. i.e the
instruments or type of equipment used to detect the
parameters and the methodology applied during the
process.
1.6 SCOPE OF THE STUDY
This study covers ground water quality in oil areas. It
specifically examines the impact of oil production on
ground water quality and investigates the causes of
improper treatment of the ground water in Afam-nta
community (study area).
25
1.7 LIMITATIONS OF STUDY
Ignorance of the community people, thereby hindering
me from collection of samples
Time constraint
Resources ( money)
Energy
Environmental or weather condition
1.8 STUDY AREA
The study area is Afam-Nta community which is located
in Oyigbo Local Government area of Rivers State.
Afam-Nta community is made up of three autonomous
communities . Afam-Nta community is bounded by
Obeakpu-Ndoki, Afam-Ukwu-Ndoki and Egberu-Ndoki. Afam-
Nta community lies between latitude N 40 52I 2011 and
longitude E 60 551 5311. Rivers state is bounded on the
North by Bayelsa State, South by the Akwa Ibom, South-
East by Abia State, and East by Imo State.
26

Hence, the interest in the area is both ecological
and economical.
The villages that makes up of the present Oyigbo local
government area are
historically grouped into three sub-clans, namely:
(1) Umuihueze Sub-clans.
These are the villages and towns: Okoloma-Ndoki,
Ayama, Obunku, Umuosi, Egber-Ndoki, Afam-Ukwu, Afam-
Nta, Obeakpu-Ndoki, Mgboji -Ndoki .
(2) Okobo Sub-clan.
These are Umuagbai, Mri-ihu, Obete, Okpontu, etc,
(3) Asa Sub-clans.
These are Obigbo, kom-kom, Izuoma, Obeama, Mmiri-
nwayi.
1.8.1. Population; According to the 2006 Census
figures, Oyigbo local Government area has a
population of 10,460. Afam-Nta community the study
27

area has a population of 1,307 (National Population
Commission, 2009).
1.8.2 CLIMATE
Afam-nta Ndoki features a tropical monsoon climate with
length and heavy rainy seasons and very short dry
seasons. Only the months of December and January truly
qualifies on dry season month in the city. The
harmattan, which climatically influences many cities in
West Africa, is less pronounced in Port- Harcourt’s
heaviest precipitation occurs during September with an
average of 370mm of rain. December on average is the
driest month of the year; with an average rainfall of
20mm. Temperature throughout the year in the city is
relatively constant, showing little variation
throughout the course of the year. Average temperatures
28

are typically between 250-280c in the city (C.U.Oyegun
and A. Adeyemo 1999).
1.8.3 VEGETATION AND SOIL
Afam-nta Ndoki in Oyigbo L.G.A of Rivers State has a
climate and vegetation has equatotrial high rainforest
zone of Nigeria. Rain falls nearly all the year round
with variations reaching its peak within the months of
July end of October gives rise to rainforest vegetation
of Afam-nta Ndoki. The relative humidity is also high.
Further it is a low land area in terms of relief and
pressure soil which favoured the growth of agriculture
both for food and sales. Therefore farming is a
dominant economic activity in Oyigbo Local Government
Area. Yam, cassava, vegetable are largely grown. Garri
processing for commercial purpose is practiced by
almost every family.
1.8.4 RELIEF AND DRAINAGE
29
In terms of the surface features of Afam-nta Ndoki is
very very unique. The area falls within the coastal
belt dominated by low-lying coastal plains which
structurally belong to the sedimentary formations of
the recent new Port-Harcourt city. It has an elevation
of just about 139m above sea level, the landscape of
the region comprises the coastal palms by a maze of
swamps, creek and water ways. Generally, the land
surface slope gently (3 -5 degrees on the average) in
the northwest (NW) to southeast (SE) direction C.U
Oyegun and A. Adeyemo (1999). The northern quadrants of
the region are characterized by gently rolling coastal
plains while swamp tidal basins, mud flats and sand
bars predominate in the southern section of the region.
The area has a very poor drainage, essentially due to
the combination of low relief, high water table and
high rainfall. The low relief of the region results is
strikingly gently slopes which have the effect of
30

making the flow velocities of the rivers very low. This
situation result in the formation of river meanders. To
a large extent, the drainage pattern is structurally
controlled on the coastal low lands and is mainly
dentritic pattern on the shore zone. The mouth of the
creeks and river system allows the river to empty into
the Atlantic Oceans. Rivers generally flows southwards
and southeast wards.
1.8.5 ECONOMIC ACTIVITIES
The Afam-nta Ndoki is a major industrial centre as it
has a large number of multinational firms as well as
other industrial concerns, particularly business
related to the petroleum industry. It is one of the
chief oil producing community in Rivers State in
Nigeria. Rivers State is one of the wealthiest States
in Nigeria in terms of gross domestic product and
foreign exchange revenue from the oil industry, crude
oil being its main export earner. Afam-nta Ndoki also
31
engages in farming as a dominant economic activity in
Oyigbo L.G.A. Yam, cassava, vegetable is largely grown.
Other forms of economic activities include trading and
fishing. The oil industries also operate on a large
scale here in Port- Harcourt as the heart of Nigerian’s
oil industry with virtually all major multinational oil
companies being represented there until recently owing
to security threat from Niger Delta militants and
cultists. Afam –nta Ndoki in Oyigbo has a lot of oil
wells.
32
CHAPTER TWO
2.0 CONCEPTUAL FRAMEWORK AND LITERATURE REVIEW
2.1 DEFINITION OF TERMS
Ground water: is the water located beneath the earth’s
surface in soil pore spaces and in the fractures of
rock formations. A unit of rock or an unconsolidated
deposit is called an aquifer when it can yield a usable
33

quantity of water. The depth at which soil pore spaces
or fractures and voids in rock become completely
saturated with water is called the water table.
Ground water is recharged from, and eventually flows
to, the surface naturally; natural discharge often
occurs at springs and seeps, and can form oases or
wetlands. Ground water is also, often withdrawn for
Agricultural, municipal, and industrial use by
constructing and operating extraction wells. The study
of the distribution and movement of ground water is
hydrogeology, also called ground water hydrology.
Typically, groundwater is thought of as liquid water
flowing through shallow aquifers, but in the technical
sense,it can also include soil moisture, permafrost
(frozen soil), immobile water in very low permeability
bedrock, and deep geothermal or oil formation water.
Ground water is hypothesized to provide lubrication
that can possibly influence the movement of faults. It
34

is likely that much of the earth’s surface contains
some water, which may be mixed with other fluids in
some instances.
Ground water is stored in and moves slowly through,
moderately to highly permeable rocks called aquifers.
The word aquifer comes from the two latin words ‘aqua’
or ‘water’ and ‘ferre’, to bear or carry. Aquifers
literally carry water under ground. An aquifer maybe a
layer of gravel or sand, a layer of sandstone or
cavernous limestone, a rubbly top or base of lava
flows, or even a large body of massive rock, such as
fractured granite, that has sizeable openings. In terms
of storage at anyone instant in time, ground water is
the largest single supply of fresh water available for
use by humans.
Ground water has been known to humans for thousands of
years. Scripture(Genesis 7:11) on the biblical flood
states that “ the fountains of the great deep (were)
35

broken up,” and Exodus, among its many references to
water and to wells, refers (20:4) to “water under the
earth.” Many other ancient chronicles show that humans
have long known that much water is contained
underground, but it is only within recent decades that
scientists and engineers have learned to estimate how
much groundwater is stored underground and have begun
to document its vast potential for use. An estimated
one million cubic meter of the world’s ground water is
stored within one-half meter of the land surface. Only
a fraction of this reservoir of ground water, however,
can be practicably tapped and made available on a
perennial basis through wells and springs. The amount
of groundwater in storage is more than 30 times greater
than the nearly 30,000 cubic meter volume in all the
fresh –water lakes and more than the 300 cubic meter of
water in all the world’s streams at any given time.
36

WATER QUALITY: Define the physiochemical parameters of
water in terms of contaminations. It defines water
range of impurities ranging from soluble impurities to
insoluble impurities. For the nation as a whole, the
chemical and biological character of ground water is
acceptable for most uses.The quality of groundwater in
some parts of the country, particularly shallow
groundwater, is changing as a result of human
activities. Groundwater is less susceptible to
bacterial pollution than surface water because the soil
and rocks through which groundwater flows screen out
most of the bacteria. Bacteria, however, occasionally
find their way into groundwater, sometimes in
dangerously high concentrations. But freedom from
bacterial pollution alone does not mean that the water
is fit to drink. Many unseen dissolved mineral and
organic constituents are present in groundwater in
various concentrations. Most are harmless or eve
37

beneficial; though occurring infrequently, others are
harmful and a few may be highly toxic.
Water is a solvent and dissolves minerals from the
rocks with which it comes in contact. Groundwater may
contain dissolved minerals and gases that gives it the
tangy taste enjoyed by many people. Without these
minerals and gases, the water would taste flat.(see
Adesanya, 1984; Egborge, 1991; Olabaniyi and Owoyemi,
2004;2006) The most common dissolved mineral substances
are sodium, calcium, magnesium, potassium, chloride,
bicarbonate and sulphate. In water chemistry, these
substances are called Common Constituents.
Water typically is not considered desirable for
drinking if the quantity of dissolved minerals exceeds
1,000mg/L (milligrams per liter). Water with a few
thousand mg/L of dissolved minerals is classed as
slightly saline, but it is sometimes used in areas
where less- mineralized water is not available. Water
38

from some wells and springs contains very large
concentrations of dissolved minerals and cannot be
tolerated by humans and other animals or plants. Many
parts of nation are underlain at depth by highly saline
ground water that has only very limited uses.
pH: It is used to express the intensity of acidic or
alkaline condition of the solution. Most of the water
resources are slightly acidic. WHO has recommended
maximum permissible limit of pH from 6.5 to 9.2 [97. At
all seven stations pH valves were found in Afam-nta in
Oyigbo Local Goevernment Area in Rivers State with
desirable limits and suitable range.
ELECTRICAL CONDUCTIVITY [EC] : Electrical Conductivity
is measure of water capacity to convey the electric
current. It signifies the total number of dissolved
acids.
TURBIDITY: In most of the water samples the turbidity
is due to presence of colloidal and very fine
39
dispersions. At all the seven sampling stations the
turbidity values in the range of 0.3 NTU to 1.2 NTU and
found within the limit prescribed by WHO.
TOTAL DISSOLVED SOLIDS (TDS) : TDS is the presence of
dissolved solids And it indicates the behaviour of
salinity in the groundwater. Water containing more than
50mb/L of TDS is not considered desirable for drinking
water supplies, but in unavoidable cases 1500mb/L is
also allowed.
TOTAL HARDNESS: Hardness is the property of water which
increases the boiling points of water. Hardness of
water mainly depends upon the amount of calcium or
magnesium salts or both.
SULPHATE: Sulphate is a nontoxic anion but ailment like
catharsis; dehydration and gastrointestinal irritation
have been linked to it when concentration is high.
CHLOLRIDE: The Department of National Health and
Welfare, Canada reported that, the chloride which comes
40

from natural and man-made sources are the main sources
of chloride in groundwater. The sources are
agricultural runoff, inorganic fertilizers, industrial
and septic tank effluents, animal feed stocks. Chloride
is not harmful to human at low concentration but could
alter the taste of water at concentrations above
250mg/L.
CALCIUM AND MAGNESIUM: The hardness is directly
related to calcium and magnesium content. In the
present study, the calcium concentration ranged between
4.7mg/L to 17.5mg/L and found below the permissible
limit of WHO while magnesium content in the water
samples was ranging from 0.4mg/L to 22.0 mg/L which was
found within the prescribed limit.
2.2 CONCEPTUAL FRAMEWORK
41

Quality of groundwater: For the Nation as a whole, the
chemical and biological character of groundwater is
acceptable for most uses. The quality of ground water
in some parts of the country, particularly shallow
groundwater, is changing as a result of human
activities. Groundwater is less susceptible to
bacterial pollution than surface water because the soil
and rocks through which groundwater flows screen out
most of the bacteria. Bacteria, however, occasionally
find their way into groundwater, sometimes in
dangerously high concentrations but freedom from
bacterial pollution alone does not mean that the water
is fit to drink. Many unseen dissolved mineral and
organic constituents are present in groundwater in
various concentrations. Most are harmless or even
beneficial; though occurring infrequently, others are
harmful and a few may be highly toxic.
2.2.1 HOW GROUNDWATER OCCURS
42

It is difficult to visualize water underground. Some
people believe that ground water collects in
underground takes or flows in underground rivers. In
fact, groundwater is simply the surface water that
fully saturates pores or cracks in soils and rocks.
Groundwater is replenished by precipitation and
depending on the local climate and geology, is unevenly
distributed in both quantity and quality. When rain
falls or snow melts, some of the water evaporates, some
is transpired by plants, some flows overland and
collects in streams, and some infiltrates into the
pores or cracks of the soil and rocks. The first water
that enters the soil replaces water that has
beenevaporated or used by plants during a preceding dry
period. Between the land surface and the aquifer water
is a zone that hydrologists call the unsaturated zone.
In this unsaturated zone, there is little water, mostly
smaller openings of the soil and rock; the large
43

openings usually contain air instead of water. After a
significant rain, the zone may be almost saturated;
after a long dry spell, it may be almost dry. Some
water is held in the unsaturated zone by molecular
attraction, and it will not flow toward or enter a
well. Similar forces hold enough water in a wet towel
to make it feel damp after it has stopped dripping.
After the water requirements for plant and soil are
satisfied, any excess water will infiltrate to the
water table, the top of the zone below which the
opening in rocks are saturated below the water table,
all the openings in the rocks are full of water that
moves through the aquifer to streams, springs, or wells
from which water is being withdrawn. Natural refilling
of aquifers at depth is a slow process because
groundwater moves slowly through the unsaturated zone
and the aquifer. The rate of charge is also an
important consideration. It has been estimated, for
44
example, that if the aquifer that underlies the high
plains of Texas and New Mexico- an area of slight
precipitation was emptied, it would take centuries to
refill the aquifer at the present small rate of
replenishment. In contrast, a shallow aquifer in an
area of substantial precipitation may be replenished
almost immediately.
Aquifers can be replenished artificially, for example,
large volumes of groundwater used for air conditioning
are returned to aquifers through recharge wells on long
Island, New York, Aquifers maybe artificially recharged
in two main ways: one way is to spread water over the
land in pits, furrows or ditches or to erect small dams
in stream channels to detain and deflect surface
runoff, thereby allowing it to infiltrate to the
aquifer; the other way is to construct recharge wells
and inject water directly into an aquifer. The latter
is a more expensive method but may be justified where
45
the spreading method is not feasible. Although some
artificial- recharge projects have been successful,
others have been disappointments there is still much to
be learned about different ground-water environments
and their receptivity to artificial-recharge practices.
A well, in simple concept, may be regarded as nothing
more than an extra pore in the rock. A well dug or
drilled into saturated rocks will fill with water
approximately to the level of the water table. If water
is pumped from a well, gravity will force water to move
from the saturated rocks into the well to replace the
pumped water. This leads to the question: Will water be
forced in fast enough under a pumping stress to assure
a continuing water supply? Some rock, such as clay or
solid granite, may have only a few hairline cracks
through which water can move. Obviously, such rocks
transmit only small quantities of water and are poor
aquifers. By comparison, rocks such as fractured
46

sandstones and cavernous limestone have large connected
openings that permit water to move more freely; such
rocks transmit larger quantities of water and are good
aquifers. The amounts of water that an aquifer will
yield to a well may range from a few hundred gallons a
day to as much as several million gallons a day.
2.3 LITERATURE REVIEW
Domestic oil and gas production and also clean water
are critical for economic growth, public health and
national security of Nigeria. As domestic oil and gas
production increase in new areas and old fields are
enhanced, there is increasing public concern about the
effects of energy production on surface-water and
groundwater quality. To a great extent, this concern
arises from the hydraulic fracturing techniques being
used today, including horizontal drilling, for
producing unconventional oil and gas in low-
permeability formation.
47

The US Geological Survey (USGS) John Intesley Powell
center for analysis and synthesis in hosting an
interdisciplinary working group of USGS scientists to
conduct a temporal and spatial analysis of surface-
water and groundwater quality in areas of
unconventional oil and gas development. The analysis
uses existing national and regional datasets to
describe water quality, evaluate water quality changes
over time where there are sufficient data, and evaluate
spatial and temporal data gaps.
Water quality is affected by natural processes and
anthropogenic activities within a water shed. Oil and
gas development and production operations at the
surface and below ground can affect water quality. At
the surface, activities at a drill site or production
facility, such as road and well-pad construction, leaks
from pits or tanks chemical spills and discharge of
wastewater, can potentially affect surface-water and
48
shallow groundwater quality. Below-ground activities,
such as drilling prior to casting installation, leaks
during or following hydraulic fracturing, failed casing
seals, pipeline breaks, abandoned wells, deep-well
disposal of flow back or produced wastewater, and
induced subsurface migration pathways, potentially can
affect shallow and deep ground water quality. The
effects of unconventional oil and gas development and
production on regional water quality have not been
previously described despite the fact that oil and gas
development in the United States began nearly 150 years
ago, and more than 4 million oil- and- gas related
wells (IHS) Energy, 2011) have been drilled with an
increasing trend in the use of hydraulic fractioning.
The objectives of the USGS Powell Center Work group are
to;
1.Better understand hydraulic fracturing in the united
State
49

2.Broadly assess the quality of surface water ground
water in areas of unconventional oil and gas
production.
3.Evaluate potential changes in water quality over time
4.Determine current baseline concentrations of major ions
in surface water and groundwater in areas of
unconventional oil and gas production.
5.Identify spatial and temporal data where further
information is needed to evaluate existing water
quality and water-quality trends
6.Identify future research needed to better understand
the effects of oil and gas production and hydraulic
fracturing on surface- water and groundwater fossil
fuels are produced, in varying quantities, in every
major region of the world.
The water related impacts of fossil fuel
extraction and refining in a given region are a
function of multiple factors including the amount and
50
type of fossil fuel produced, the extraction methods
used, physical and geological conditions and regulatory
requirement (Mieike et al 2010). In some cases, social
conditions such as political stability also influence
the links between water and energy. In Nigeria, for
example, political corruption and social tensions have
contributed to a high incidence of oil spills because
oil companies are often not held accountable for
polluting, and because of vandalism of oil pipelines.
At the global scale, 22 recent of all water used is for
industrial purposes, including mining and fossil-fuel
extraction and power generation (UN WWAP nid).
Estimates for the amount of water used globally
specifically for fossil-fuel extraction are not well
developed and many are based on water- intensity
estimates from one article (Gleick 1994) that is over
15 years old. Data on the water-quality impacts of
fossil-fuel extraction and processing are even more
51
poorly developed than those on water quantity and in
many cases are not available at all, as water quality
is not well monitored in many regions of the world. On
estimate for global water use for oil production,
produced by applying water intensities per unit of oil
extracted to global oil production figures, puts total
water use at 13 billion m of water for oil production
worldwide in 2006 (Maheu, 2009).
This estimate taken into account the differing water
intensities of oil produced in different part of
Nigeria.
The Powell Center Study is a collaboration with the
USGS National Water-Quality Assessment (NAWOA) Program,
which provided water-quality data from the USGS
National Water Information System (NWIS) and US
Environmental Protection Agency (EPA) Modern Storage
and Retrieval (STORET) data bases. Preliminary data
compilation for areas of unconventional oil and gas
52

production from the USGS and EPA data bases yielded
754,000 water-quality samples collected from 78,000
groundwater sampling sites and 32,000 surface water
sampling sites. Major ions, including calcium,
magnesium, sodium, bicarbonate (alkalinity), chloride
and sulfate, are the most commonly determined
constituents for most water-quality samples.
Concentrations of these constituents can be affected by
oil and gas development and are typically elevated in
produced waters, spatial and temporal analysis will
include summary statistics for major- ion
concentrations in samples of surface water, shallow
groundwater (within about 100feet of land surface ) and
deep groundwater for selected time periods in selected
unconventional oil and gas production areas. Where
sufficient data are available, changes in water quality
over time will be evaluated and described for each
area. Areas and time periods for which sufficient data
53

are unavailable will be identified as data gaps where
additional data collection maybe warranted to evaluate
water quality and water-quality trends.
From extraction to end use, petroleum products affects
surface water and groundwater, impairing water quality
with hydrocarbons, salts, nutrients, a host of organic
compounds and various heavy metals. In many areas
around the world, oil spills and storm water runoff
containing oil derivatives have degraded ecosystems and
human water supply.
Petroleum, also known as crude oil, comes from the
remains of prehistoric life subjected to heat and
pressure for millions of years over time, petroleum
accumulated in oil fields, between layers of
impermeable rock, crude oil is extracted from these
fields through a series of recovery methods that run
from tapping into the fields’ initial pressure (known
as primary recovery) to pressurizing the fields with
54

water or steam or other gases to force the oil to the
surface known as secondary and tertiary or enhanced,
recovery). Total daily global crude oil production
extraction) runs about 85 billion barrels, equivalent
to about 12 million metric tons (US EIA, 2010a). In
2009, Russia accounted for 12.9 percent of total global
production, followed by Saudi Arabia at 12 percent, the
US at 8.5 percent. Iran at 5.3 percent, and China at
4.9 percent. (BP2010). In the United States, about one-
quarter of domestic production comes from offshore
wells, but global offshore oil production is only about
6 percent of total global production. Producers convey
crude oil from the well via pipelines or ships to
refineries, where crude oil is distilled into a variety
of petroleum products, including gasoline, kerosene,
fuel oils, liquefied petroleum gas, various lubricants,
asphalt and precursors to plastic and pharmaceutical
products, among others. These petroleum products are
55
then distributed via various modes to other
manufacturers and to end users. Each of these steps
requires or can affect water. Oil fields themselves
usually contain large volumes of salt water. The water
that comes to the surface along with extracted crude
oil is known as produced water. Produced water can
contain hydrocarbon residues, heavy metals, hydrogen
sulfide, and boron, as well as elevated concentrations
of salts. The ratio of produced water to crude oil
tends to rise with the age of the well. Khatib and
Verbeek (2003) estimated that oil production generates
roughly three times as much produced water as crude
oil, equivalent to about 15 billion of produced water
annually world-wide.
Historically, producers disposed of this waste stream
with direct disposal into environment or into
evaporation pits that were often little more than holes
in the ground that allowed produced water sources or
56

streams fed by these aquifers (PettyJohn, 1971). Khatib
and Verbeek (2003) estimated that about 55 percent of
one major oil company’s produced water was re-injected
into the ground. Clark and Veil (2009) found that some
98 percent of produced water from onshore wells in the
United States was re-injected but that 91 percent of
produced water from offshore wells was simply
discharged into the ocean. Assuming that the 2 percent
rate of U.S onshore produced water that is not re-
injected can be applied globally- probably an
optimistic assessment- yields an annual worldwide total
of 300 million of produced water remaining on the
surface. The large volumes of produced water are the
greatest single connection between oil production and
water quality but each step of the oil extraction and
refining process has led to contamination of water
resources. Oil spills from wells are not uncommon and
can pollute vast areas both off shore and on shore,
57

generating clear and measurable environmental impact.
Spills during the conveyance of crude oil from the
point of extraction to refineries also occur with some
regularity. The Exxon Valdez oil tanker spill, which
garnered significant public attention, is only one
example of many and in fact does not rank among the top
25 largest oil spills worldwide (O’ Rourke and
Connolly, 2003). In Nigeria, an estimated 260,000
barrels of oil (41,000) spill each year into Niger
Delta and surrounding areas, with devastating impacts
on people, plants, wildlife (vidal 2010, Nassiter
2010). Marine spills, such as these can lead to fresh
water system contamination which the oil hits the
shoreline and drifts up through estuaries into streams.
In the U.S, spills into freshwater systems occur more
frequently than marine spills, between 1995 and 1996,
77 percent of all spills greater than 1000 gallon were
in land spills. The majority of these spills were from
58
oil pipelines (Yoshioka and Carpenter, 2002). After
production, Crude oil is refined through a series of
water-intensive processes: water is used for steam, as
part of the refining process, as wash water, and for
cooling. Process water typically becomes contaminated
with sulfur and ammonia, requiring treatment. Cooling
system water has little direct contact with petroleum
products, though trace contaminants may appear in
cooling system water. Such cooling water is the largest
consumptive water use in refining at a rate of three to
four units of cooling water per unit of crude oil,
depending on the type of cooling system. Because of the
large volumes of water required for operation,
refineries are often located adjacent to water sources.
The sheer size of many refineries – often covering
square kilometers of land- means that, in some
countries, precipitation on the refinery grounds must
be captured and treated so as not to contaminate
59
adjacent water bodies. Refined petroleum products
continue to affect water quality, though their impacts
typically become more diffuse oncethe products are
refined and distributed. In the United States, the
environmental protection Agency has recorede more than
490,000 confirmed leaks from under ground storage tanks
(USTs), which are generally used to store petroleum
products. As of March 2010, there were more than 600,00
active USTs and more than 1,734,000 closed USTs in the
country US EPA 2010). The total number of USTs
worldwide is not known. Leaking USTs can contaminate
groundwater resources with gasoline, diesel, fuel and
related compounds, such as benzene and toluene. The
total volumes leaked from USTs and the total volume of
ground water affected by such leaks, is not known. In
the U.S, more than 75 percent of refined petroleum
becomes gasoline, diesel and jet fuel (Teufel and
Azelton 2008). The distribution and combustion of these
60

fuels also affect surface water and groundwater. Once,
the refined gasoline and diesel fuels reach more
vehicles, spills and combustion by- products can become
non-point sources of pollution, washed by storm water
runoff into streams or infiltrating into groundwater.
Combustion of these fuels discharges nitrogen and other
contaminants to the atmosphere, which in turn can be
carried back to the earth in precipitation, increasing
pollution loadings to lakes and streams.
Incompletely combusted fuel and minor spills and leaks
from motor vehicles also generate contaminants. One
study found that runoff from motor vehicles also
generates contaminants. One study found that runoff
from one square kilometer of roads and parking lots
carried the equivalent of more than 180 barrels of oil
annually (NRDC, 2001).
Although there do not appear to be any estimates of the
total volume or impacts of such end-use impacts on even
61

a local scale, much less any global estimates,
extrapolating from this one estimate suggests that
storm water runoff carries the equivalent of almost 20
million barrels of oil (more than 3 million) annually
nationwide (about 0.8 percent of total annual motor
fuel consumption), though this should be considered
little more than an order of magnitude estimate. Total
global runoff from contaminated surfaces could not be
estimated from available data.
Unconventional petroleum, which includes tar sands and
oil shade, is not extracted with conventional wells,
unconventional petroleum requires more complex
extraction and processing than does crude oil, and its
water quality impacts are potentially many times
greater than those of conventional crude. Tar sands,
sometimes known as oil sands, are a mix of clay, sand,
water and bitumen. Bitumen is a thick, tarlike
substance that can be processed into “synthetic crude”
62

which can then be further processed by an oil refinery.
Bitumen is also used directly in asphalt and other
applications. Almost half of Canada’s total oil
production comes from Albert’s tar sand, equivalent is
about 1.5 million barrels of oil per day, or 86.4
million total in 2009 ( Gosselin et al 2010). The total
recoverable oil equivalent in Albert’s tar oil reserves
(Gosselin et al 2010).
Venezuela has a small commercial tar sands operation,
and small deposits have been found in the Middle East.
In eastern Utah, in U.S., a controversial effort to
develop tar sands is now under way (WRA 2010). Tar
sands production is more complicated and capital
intensive than typical petroleum production. Companies
extract bitumen either via surface mining or in situ,
which typically involves injecting steam into the tar
sands deposits to decrease bitumen’s viscosity and
enable it to flow into pools, where it can be
63
extracted. Tar sands mining operations use large
volumes of water to separate the bitumen from parent
materials. Roughly two-and-a- half units of water are
required to extract and process one unit of bitumen by
surface mining, yielding an annual water-use volume.
2.4 COMMON GROUNDWATER CONTAMINANTS
1. NITRATES: Dissolved nitrate is most common
contaminant in groundwater. High level can cause blue
baby disease (methamologlobiamia) in children, may form
caranogens and can accelerate eutrophication in surface
waters. Sources of nitrates include sewage,
fertilizers, air pollution, landfills and industries.
2. PATHOGENS: Bacteria and viruses that can cause water
borne diseases such as typhoid, cholera, dysentery,
polio, hepatitis, sources include sewage, landfills,
septic tanks and livestock;
3. TRACE METAL: Include lead, mercury, cadmium, copper,
chromium and nickel. These metals can be toxic and
64

carcinogenic. Sources include industrial and mine
discharges, fly ash from thermal power plants either
due to fall out or disposal in ash ponds. Industrial
solid waste dumping and leaching into ground water
through rainwater.
4. INORGANIC CONSTITUENTS: Inorganic dissolved salts
accumulation such as SO4, Chloride, etc along with Na, K
building up high dissolved solids and combination of
carbonates, bicarbonates along the Ca and Mg building
up high hardness of water and converting soft/sweet
water in to hard water creating gastrointestinal
problems in human being if they consume groundwater as
drinking source.
5. ORGANIC COMPOUNDS: Include volatile and semi-
volatile organic compounds like petroleum derivatives,
PCBs Pesticides. Sources include agricultural
activities, street drainages, sewage landfills,
65
industrial discharges, spills vehicular emissions fall
out etc.
Realizing the importance of groundwater quality in
urban areas and its deterioration, CPCB initiated
groundwater quality survey in problem areas (industrial
pockets) of the country during 1994. The findings were
published as CPCB publications. During 2001- 2003, the
survey was repeated. The findings of the survey are
presented in this report.
The Central Pollution Control Board (CPCB) with the
help of National Institute of Hydrology, Roorkee
Pollution Control Research Institute (PCRI), Haridwar
and Thane Municipal Corporation, Thane initiated
similar survey for Metro-cities. Metro-cities are the
cities having population of 1 million and above. There
are 35 such cities in India.
2.5 SOURCE OF CONTAMINATION IN GROUND WATER:
66

Underground sources of drinking water, especially in
outskirts of larger cities and villages are highly
polluted. Groundwater is threatened with pollution from
the following sources;
a)DOMESTIC WASTES: Domestic wastes and methods of their
disposal are of primary concern in urban areas. Prime
factors responsible for deteriorating the water quality
include pathogenic organisms, oxygen demand, nutrients
and solids from domestic wastes, solid wastes are the
potential sources of contamination as they are partly
burned and partly incorporated into the soil and pose
serious danger to ground water.
b)INDUSTRIAL WASTES: Most industries generally produce
wastes containing toxic heavy metals along with
hazardous organic and inorganic effluents. These
chemicals contaminate the ground water and severely
pollute it.
67
c)AGRICULTURAL WASTES: Fertilizers, Pesticides,
Insecticides, Herbicides, processing wastes and animal
waste etc. are constantly added to the water. Leachates
from agricultural land containing nitrates. Phosphates
and potash, more downward with percolating water and
join the aquifers below posing danger to the
groundwater.
Throwing rubbish and other unwanted things into the
water are not only the cause of water pollution, but a
harmless activity such as farming could lead to some
thing as insidious as nitrate pollution. Rising nitrate
levels have raised an alarm because of the possibility
of adverse effect on human and animals.
Methaemoglobinaemia or blue baby disease is caused by
the reaction of nitrate with haemoglobin, the oxygen
carrier in the blood, producing methaemoglobin, which
strangles the oxygen carrying capacity of the tissue.
Some claim that nitrate can wear down body’s immune
68

system while its derivatives may be carcinogenic.
Nitrate also causes eutrophication, although in India
and other tropical regions, it is though that
phosphates are more to be blamed for this asphyxiation
of water bodies.
d)RUNOFF FROM URBAN AREAS: Effluents from urban areas
contain large concentration of oils, grease nutrients,
heavy metals and detergents being soluble can pass
through the soil and pollute ground water. Raw sewage
dumped in shallow soak pits and seepage from polluted
lake pond or stream also pollute water. Rainfall could
pickup substantial contaminants from dust and air and
join the aquifer below. The infiltration of liquids
containing toxic pollutants may cause pollution in
sandy soil and well waters. Supply of potable water has
been affecting the contamination of water resources in
most of the developing countries. Rivers, Lakes and
groundwater have been polluted by industrial effluents,
69

pesticides and fertilizers from agricultural runoff and
urban waste. Chronic water scarcity is common in areas
where groundwater has been overdrawn for irrigation,
industrial use or to meet the requirements of urban
population, clearing of forests which increase surface
runoff and reduce groundwater have made the situation
worse. Many countries are fast using up their
groundwater and moving from a situation of crises to
disaster.
e)SOLUBLE EFFLUENTS: Several soluble effluents pollute
the groundwater critically. The extent of pollution is
more in sandy soils and humid regions having high water
table conditions. Global withdrawals of water have
grown by a fheter of over 6 between 1900 and 1995 more
than double the rate of population growth.
This is because of increasing water needs for
agriculture, industrialization and greater human uses
in urban cities.
70
According to W.H.O, about 460 million people, more than
8% of world’s population, live in countries than can be
considered to be highly water stressed. About 25% of
world’s population lives in countries where the
consumption of fresh water is so high that they are
likely to move into situation of serious water stress.
Agriculture takes about 70% of the water withdrawals,
often rising to 90% in dry tropics. Water withdrawals
for irrigation have increased by more than 60% which
has coincided with the green revolution. High yielding
crop varieties require a lot of water. Now water
withdrawals are so high that water bodies such as
rivers and lakes have shrunk in size. A direct impact
of this has been on the flow of rivers especially
during dry periods, which is vital for the aquatic
ecosystem. Along the coasts, increasing groundwater
withdrawals have led to the ingress of saline water
into ground water. Other potential sources of
71
groundwater contamination are waste water treatment
lagoons, mine spills, transport accidents, seepage
pits, urban and rural garbage, earthen septic tanks
refuse dumps barnyard manures, leaching and downward
movement of pollutants.
CHAPTER THREE
3.0 METHODOLOGY
INTRODUCTION
This chapter presents the methodology that was used in
the study; it gives a description of the study area and
the methods that was used to collect data from the
field. It gives a summary of the research design,72

sample population and size, data collection
instruments, measuring instruments, data collection
instruments, measuring instruments, data, type, data
processing and presentation and the problems
encountered during the process of data collection and
analysis.
3.1 SOURCES OF DATA
In carrying out this study, data was derived from two
sources namely primary and secondary sources.
Primary Data
The primary source involves the collection of ground
water from the field in the study area and this was
assumed to give first hand information on the subject
under study.
Secondary Source
Secondary data was obtained from sources like:
Annual reports, journal articles, internet, magazines,
newspapers, past survey reports and books related to
73
the subject of the study and these were consulted at
length to extract the information required to support
the findings from the study.
3.2 METHOD OF DATA COLLECTION
Groundwater sample was collected from seven (7)
different locations (well ) covering the area of Afam-
nta Community. The groundwater samples were collected
in sterilized plastic containers or good quality of
screw capped polyethylene bottles of 500ml capacity.
Sampling was carried out without adding any
preservatives in bottles. The containers were sealed
and the samples were protected from direct sunlight
during transportation and samples were then transported
to laboratory for laboratory investigation of physio-
chemical analysis.
3.3 SAMPLING TECHNIQUE
I used SPSS. The location (well) of study was chosen
using purposive sampling technique because of the
74
nature of the environment and the locations was
identified before commencement of sample collection.
Purposive sampling was involved in choosing the well
that has appropriate characteristics /properties
required for the study. The reasons for selection of
this method is that it is convenient and it helps the
researcher target those particular wells which is
really needed for the study. A random sampling method
was also used since most of the locations have the
required properties for the study.
3.4 SAMPLE SIZE
Groundwater sample were collected for physio-chemical
analysis from seven (7) sites, the groundwater samples
were collected from wells, water-logged and gutters. A
total of twenty one sampling points were analysed to
examine the quality of water.
3.5 METHOD OF DATA ANALYSIS
75
After collecting all the necessary data, these data
will be coded and edited, analyzed and rephrased to
eliminate errors and ensure consistency.
The data obtained from the analysis, was presented in
tables. Each sample presented in each table and all the
samples were presented and finally interpreted in the
discussion below.
3.6 TEST PROCEDURE AND METHODOLOGY
PH/ EC/TDS Determination of water sample:
These chemical properties were determined
electrometrically with a multi-parameter photometer.
CHLORIDE DETERMINATION FOR WATER SAMPLE
These were determined titrimetrically. About 100mls of
the sample was measured in a conical flask and 1ml of
potassium chromate indicator was added. The solution
was titrated with AgNO3 solution until the appearance of
brick red colour as the end point.
TOTAL SUSPENDED SOLIDS DETERMINATION FOR WATER SAMPLE
76

Whatman filter paper was first dried in an oven,
brought out, allow to cool, weighted and its initial
weight was noted. Thereafter, 100mls of the sample was
filtered through the filter paper. The filter was re-
dried and re-weighed.
DISSOLVED OXYGEN DETERMINATION FOR WATER SAMPLE.
The DO was determined electrometrically with DO meter
NITRATE DETERMINATION
The cuvette was filled with 6mls of sample and content
of one packet of H193728-0 was added, and shaken for 50
seconds. The cuvette was inserted into the instrument
and the reading was taken using H183200 multi-parameter
photometer.
PHOSPHATE DETERMINATION
The cuvette was filled with 10mls of sample while 10
drops of H193717A-O Molybdate reagent and content of
one packet of H193717B-O were added. The cuvette was
77
inserted into the instrument and the reading was taken
using H183200 multi-parameter photometer.
SULPHATE DETERMINATION
The cuvette was filled with 10mls of sample and the
content of one packet of H193751-0 indicator reagent
was added. It was shaken for 1 minute and cuvette was
inserted into the instrument. The reading was taken
using H183200 multi-parameter photometer.
THE HEAVY METALS DETERMINATION (APHA 301A)
A measured quantity of the sample were transferred into
kjeldahl flask; 20ml of concentrated nitric acid (HNO3)
was added and the sample pre-digested by heating gently
for 20 mins. More acid was there after added and
digestion was continued for 30-40 mins. Digestion was
stopped when a clear digest was obtained, the flask was
cooled and the content transferred into a 50ml
volumetric flask and made to the mark with distilled
78

water. The resulting solution was analysed for heavy
metals using the Atomic Absorption Spectrophotometer.
79

CHAPTER FOUR
4.0 RESULT PRESENTATION AND DATA ANALYSIS
4.1 DATE PRESENTATION:
The result of the physic – chemical parameters of
ground water is presented in the table below.
4.2 PHYSIOCHEMICAL PARAMETERS
4.2.1 Site 1 (river); the result of the physiochemical
analysis of the water samples collected from site 1 are
represented in the table below. The results are
compared with the World Health Organization (WHO)
guidelines for drinking water.
Table. 4.2.1 physicochemical parameters of sample 1
S/N Parameter Unit Sample 1 W.H.O
limit
1 PH 6.93 6.5-8.5
80

2 Conductivity Ns/cm 157.0 250
3 TDS Ppm 74.0 500
4 TSS Mg/L 0.005 -
5 DO Ppm 7.15 -
6 CL Mg/L 0.5 250
7 Hardness Mg/L 7 500
8 Po43- Mg/L 1.2 -
9 So42- Mg/L 0.00 250
10 No3 Mg/L 0.05 45.50
11 Hco3 Mg/L 1 -
12 Fe2+ Mg/L 0.05 0.3
13 Ca2+ Mg/L 13.8 25
14 Mg2+ Mg/L 12.2 50(0.50)
15 Na+ Mg/L 0.14 2
16 K2+ Mg/L 1.59 -
17 Cu Mg/L 0.03 1
18 Pb Mg/L 0.00 0.01
19 Zn Mg/L 0.02 5
81
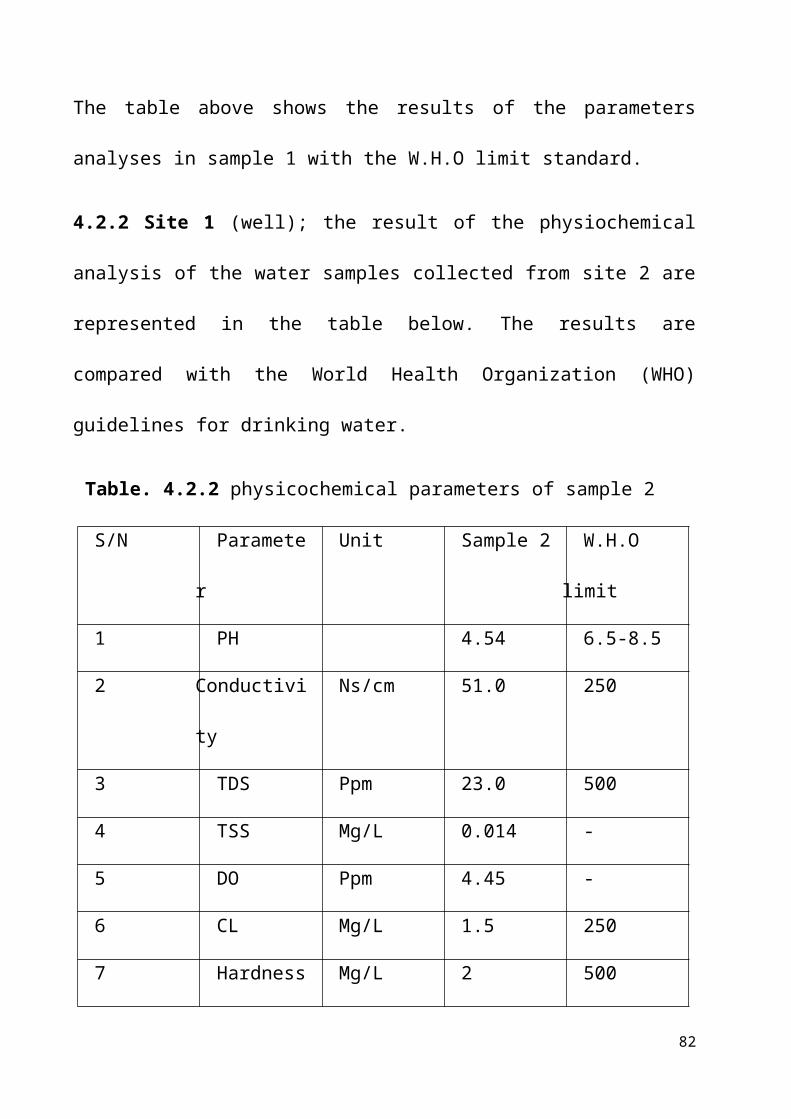
The table above shows the results of the parameters
analyses in sample 1 with the W.H.O limit standard.
4.2.2 Site 1 (well); the result of the physiochemical
analysis of the water samples collected from site 2 are
represented in the table below. The results are
compared with the World Health Organization (WHO)
guidelines for drinking water.
Table. 4.2.2 physicochemical parameters of sample 2
S/N Paramete
r
Unit Sample 2 W.H.O
limit
1 PH 4.54 6.5-8.5
2 Conductivi
ty
Ns/cm 51.0 250
3 TDS Ppm 23.0 500
4 TSS Mg/L 0.014 -
5 DO Ppm 4.45 -
6 CL Mg/L 1.5 250
7 Hardness Mg/L 2 500
82

8 Po43- Mg/L 1.5 -
9 So42- Mg/L 0.00 250
10 No3 Mg/L 0 50(0.50)
11 Hco3 Mg/L 0.26 -
12 Fe2+ Mg/L 1.28 0.3
13 Ca2+ Mg/L 1.58 25
14 Mg2+ Mg/L 6.0 50
15 Na+ Mg/L 1.07 -
16 K2+ Mg/L 1.50 -
17 Cu Mg/L 0.01 1
18 Pb Mg/L 0.01 0.01
19 Zn Mg/L 0.03 5
The table above shows the results of the physio
chemical parameters analyses in sample 2.
The PH of sample 2 is 4.54 which is below W H O limit
and this implies that the water sample is acidic.
83

4.2.3 Site 3 (river); the result of the physiochemical
analysis of the water samples collected from site 3 are
represented in the table below. The results are
compared with the World Health Organization (WHO)
guidelines for drinking water.
Table. 4.3.1 physicochemical parameters of sample 3
S/N Paramete
r
Unit Sample 3 W.H.O
limit
1 PH 6.91 6.5-8.5
84

2 Conducti
vity
Ns/cm 110.0 250
3 TDS Ppm 44.0 500
4 TSS Mg/L 0.007 -
5 DO Ppm 9.21 -
6 CL Mg/L 0.6 250
7 Hardness Mg/L 4 500
8 Po43- Mg/L 2.3 -
9 So42- Mg/L 0.00 250
10 No3 Mg/L 0 50(0.50)
11 Hco3 Mg/L 0.68 -
12 Fe2+ Mg/L 0.06 0.3
13 Ca2+ Mg/L 23.0 25
14 Mg2+ Mg/L 6.5 50
15 Na+ Mg/L 0.55 -
16 K2+ Mg/L 2.24 -
17 Cu Mg/L 0.48 1
18 Pb Mg/L 0.03 0.01
19 Zn Mg/L 0.00 5
85

The table above shows the result of the physio chemical
parameters analyses from sample 3.
The Ca2+ in water samples 3 is high though within the
limit. High Calcium concentration causes dental
calciosis which low concentration caused dental caries.
Hence it is essential to maintain moderated
concentration of Calcium in drinking water.
4.2.4 Site 4 (river); the result of the physiochemical
analysis of the water samples collected from site 4 are
represented in the table below. The results are
compared with the World Health Organization (WHO)
guidelines for drinking water.
86

Table. 4.2.4 physicochemical parameters of sample 4
S/N Paramet
er
Unit Sample
3
W.H.O
limit
1 PH 6.35 6.5-8.5
2
Conductivi
ty
Ns/cm 41.0 250
3 TDS Ppm 5.0 500
4 TSS Mg/L 0.011 -
5 DO Ppm 7.32 -
6 CL Mg/L 0.5 250
7 Hardness Mg/L 1 500
8 Po43- Mg/L 2.3 -
9 So42- Mg/L 0.00 250
10 No3 Mg/L 0.01 50(0.50
)
11 Hco3 Mg/L 0.60 -
12 Fe2+ Mg/L 0.00 0.3
87
13 Ca2+ Mg/L 2.67 25
14 Mg2+ Mg/L 5.7 50
15 Na+ Mg/L 0.97 -
16 K2+ Mg/L 1.84 -
17 Cu Mg/L 0.04 1
18 Pb Mg/L 0.001 0.01
19 Zn Mg/L 0.001 5
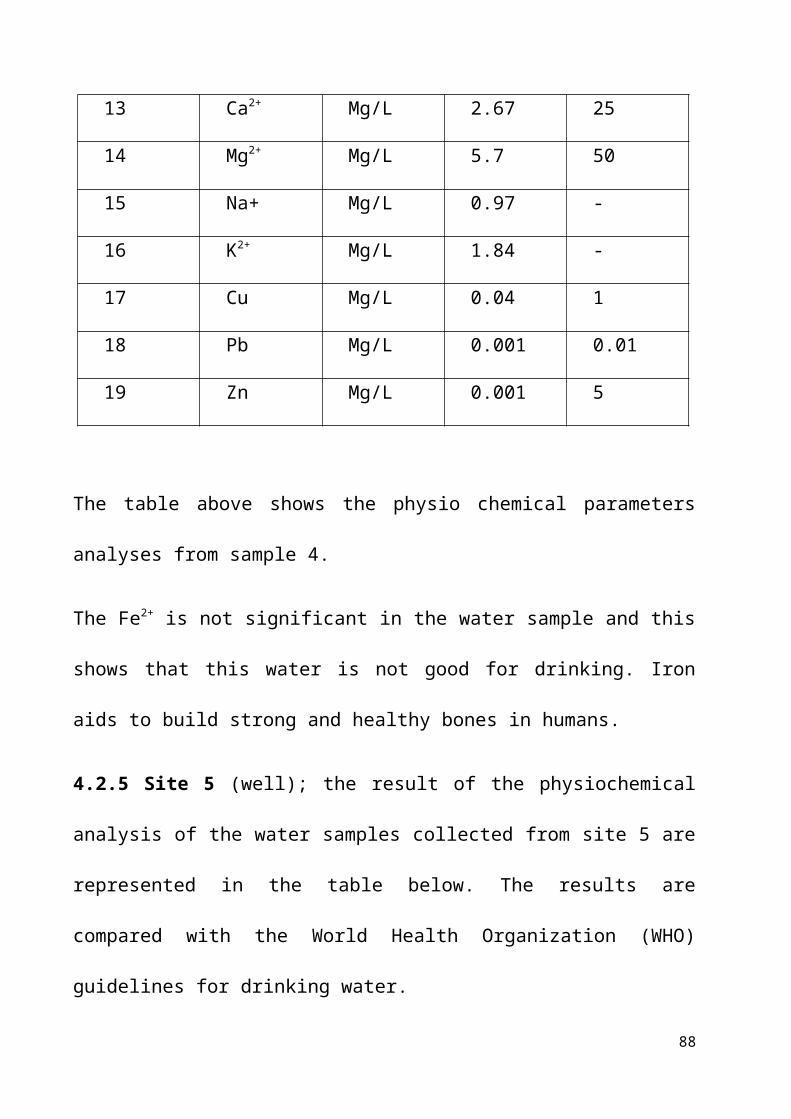
The table above shows the physio chemical parameters
analyses from sample 4.
The Fe2+ is not significant in the water sample and this
shows that this water is not good for drinking. Iron
aids to build strong and healthy bones in humans.
4.2.5 Site 5 (well); the result of the physiochemical
analysis of the water samples collected from site 5 are
represented in the table below. The results are
compared with the World Health Organization (WHO)
guidelines for drinking water.
88

Table. 4.2.5 physicochemical parameters of sample 5
S/N Paramete
r
Unit Sample 5 W.H.O
limit
1 PH 5.12 6.5-8.5
2 Conducti
vity
Ns/cm 60.1 250
3 TDS Ppm 23.0 500
4 TSS Mg/L 0.007 -
5 DO Ppm 9.11 -
6 CL Mg/L 2.0 250
7 Hardness Mg/L 6.0 500
8 Po43- Mg/L 2.0 -
89
9 So42- Mg/L 0.00 250
10 No3 Mg/L 0 50(0.50)
11 Hco3 Mg/L 0.58 -
12 Fe2+ Mg/L 0.16 0.3
13 Ca2+ Mg/L 2.0 25
14 Mg2+ Mg/L 4.01 50
15 Na+ Mg/L 1.00 -
16 K2+ Mg/L 1.20 -
17 Cu Mg/L 0.48 1
18 Pb Mg/L 0.02 0.01
19 Zn Mg/L 0.20 5
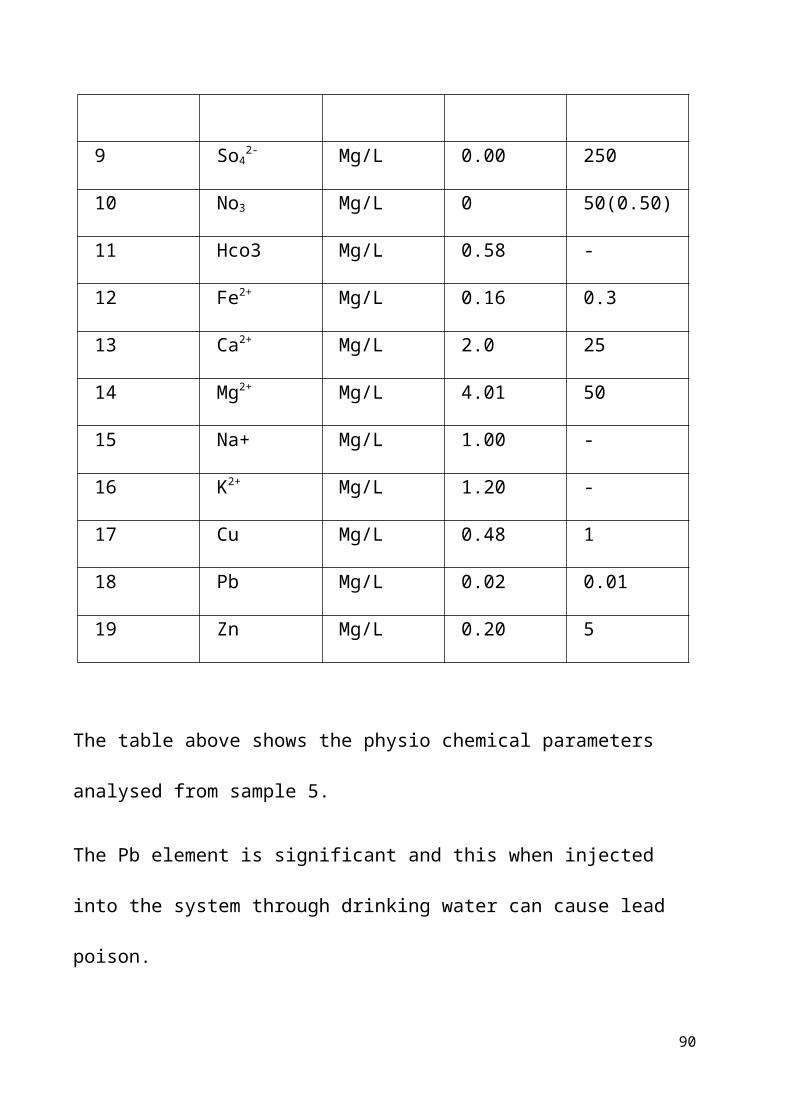
The table above shows the physio chemical parameters
analysed from sample 5.
The Pb element is significant and this when injected
into the system through drinking water can cause lead
poison.
90
The PH of the sample is below limit showing that the
sample is acidic.
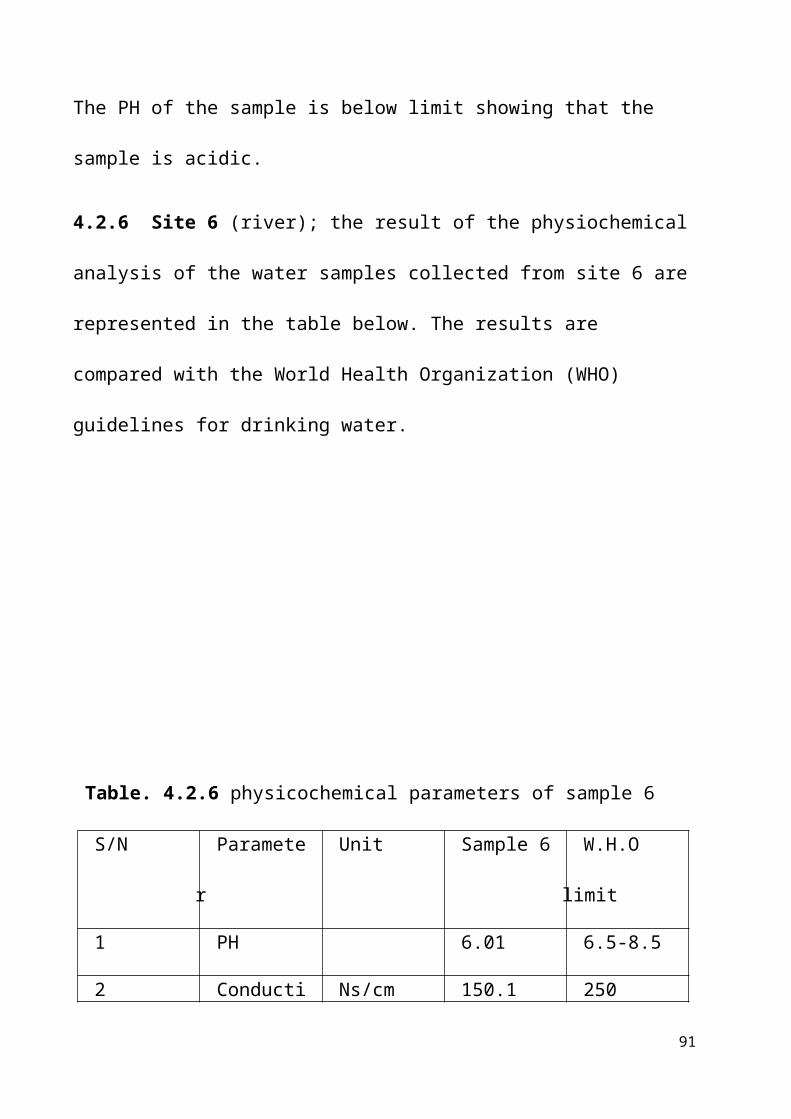
4.2.6 Site 6 (river); the result of the physiochemical
analysis of the water samples collected from site 6 are
represented in the table below. The results are
compared with the World Health Organization (WHO)
guidelines for drinking water.
Table. 4.2.6 physicochemical parameters of sample 6
S/N Paramete
r
Unit Sample 6 W.H.O
limit
1 PH 6.01 6.5-8.5
2 Conducti Ns/cm 150.1 250
91

vity
3 TDS Ppm 138.0 500
4 TSS Mg/L 0.014 -
5 DO Ppm 9.91 -
6 CL Mg/L 2.0 250
7 Hardness Mg/L 10 500
8 Po43- Mg/L 2.3 -
9 So42- Mg/L 0.00 250
10 No3 Mg/L 0.08 50(0.50)
11 Hco3 Mg/L 0.40 -
12 Fe2+ Mg/L 0.01 0.3
13 Ca2+ Mg/L 2.18 25
14 Mg2+ Mg/L 9.2 50
15 Na+ Mg/L 1.01 -
16 K2+ Mg/L 1.50 -
17 Cu Mg/L 0.01 1
18 Pb Mg/L 0.04 0.01
19 Zn Mg/L 0.02 5
92
The table above shows the physio chemical parameters
analysed from Sample 6.
Chloride is the indicator of contamination with animal
and human waste. Chloride is a common constituent of
all natural water and it is generally not classified as
harmful constituent. Chloride is significant in this
water sample.
4.2.7 Site 7 (river); the result of the physiochemical
analysis of the water samples collected from site 7 are
represented in the table below. The results are
compared with the World Health Organization (WHO)
guidelines for drinking water.
93
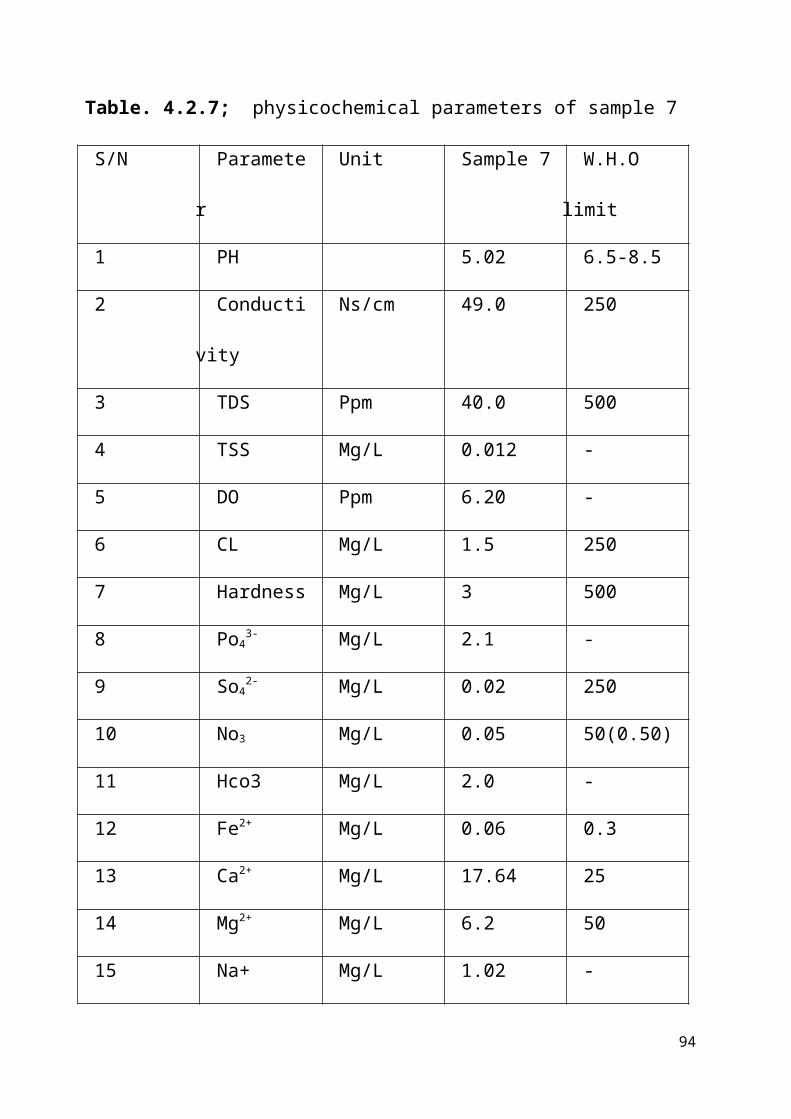
Table. 4.2.7; physicochemical parameters of sample 7
S/N Paramete
r
Unit Sample 7 W.H.O
limit
1 PH 5.02 6.5-8.5
2 Conducti
vity
Ns/cm 49.0 250
3 TDS Ppm 40.0 500
4 TSS Mg/L 0.012 -
5 DO Ppm 6.20 -
6 CL Mg/L 1.5 250
7 Hardness Mg/L 3 500
8 Po43- Mg/L 2.1 -
9 So42- Mg/L 0.02 250
10 No3 Mg/L 0.05 50(0.50)
11 Hco3 Mg/L 2.0 -
12 Fe2+ Mg/L 0.06 0.3
13 Ca2+ Mg/L 17.64 25
14 Mg2+ Mg/L 6.2 50
15 Na+ Mg/L 1.02 -
94
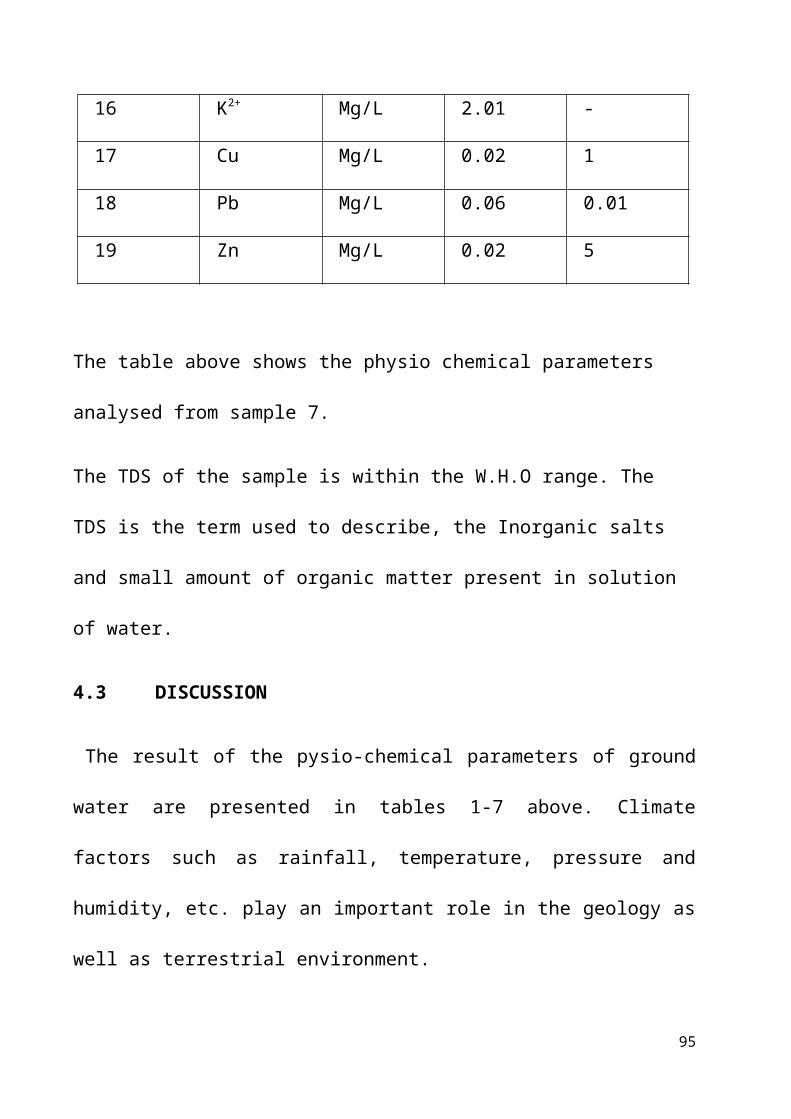
16 K2+ Mg/L 2.01 -
17 Cu Mg/L 0.02 1
18 Pb Mg/L 0.06 0.01
19 Zn Mg/L 0.02 5
The table above shows the physio chemical parameters
analysed from sample 7.
The TDS of the sample is within the W.H.O range. The
TDS is the term used to describe, the Inorganic salts
and small amount of organic matter present in solution
of water.
4.3 DISCUSSION
The result of the pysio-chemical parameters of ground
water are presented in tables 1-7 above. Climate
factors such as rainfall, temperature, pressure and
humidity, etc. play an important role in the geology as
well as terrestrial environment.
95

A sound knowledge of these factors help in
understanding the complex processes of these
interaction between the climate and biological
processes in water bodies.
PH is the scale of intensity of acidity and alkalinity
of water and measures the concentration of hydrogen
ions. The W.H.O limit for PH is 6.5-8.5. In the present
study, the PH values of ground water observed varied
from 4.5 to 6.91. The pH value was below limit in
samples 2, 4, 5, 6 and 7, and this shows that the water
sample is acidic. The higher the ground water acidity
in the area has been attributed to the dissolution in
rain water, effluents of acidic gases including Co2, No2
and So2 that originated from gas flares and vehicular
exhaust (Ogunkoya and Ef1,2003). The pH values of
samples 1 and 3 are within W H O limit and this occurs
however as ground water acidity is reduce as it
percolates the soil and under goes base – buffer
96

reactions. The PH values of samples 1 and 3, that fell
within the allowable range could be as a result of sea
water infiltration into the area thereby neutralizing
the acidity of the ground water.
PH is considered as an indicator of over all
productivity that causes diversity. Though PH has no
direct impact on consumers, it remains an important
parameter (USEPA, 1983) which controls water solubility
and the rate of metallic reaction. The results of all
parameters determined in the ground water shows that
the water is acidic and is not good for drinking.
The Electrical conductivity (EC) is a measure of water
capacity to convey the electric current. It signifies
the total number of dissolved acids. The W.H.O limit of
(EC) is 250Ns/cm samples 2 ,4,5 and 7 shows less
seasonal variation of conductance where as samples1, 3
and 6 show large seasonal variation reflecting
significant water-soil interaction resulting in the
97
dissolution of the geological medium. Locally, the
effect of salt water infiltration into the aquifer from
the tries influence Imo River in Afam-nta may also be
an important factor in the Stalinization of ground
water in the area.
TDS is the presence of dissolved solid and it indicates
the behaviour of salinity in the ground water. TDS is
one of the main quality parameter for any purpose.
Water containing more than 500 mg/L of TDS is not
considered desirable for drinking water supplies. All
the ground water samples investigated showed TDS level
lower than the allowable limits of W.H.O. The higher
values of TDS in sample land 6 revealed abundance of
major ions, arguable due to infiltration of pollutant
through dilution in sub-surface soil. The observation
may also account for the strong positive correlation
between TDS/cl, TDS/fe.
98
TSS and DO which was investigated from our samples
ranges between 0.005 – 0.014 and 4.45 – 9.91
respectively there are no prescribed standards
suggested by W.H.O for parameters of Tss and DO for
drinking purpose, so no comparison can be made fro
observed values.
Hardness is the property of water which increases the
boiling points of water. Hardness of water mainly
depends upon the amount of Calcium or Magnesium salts
or both. Total hardness is the indicator of
hydrogeology and aesthic quality of water. The W.H.O
limit for hardness is 500 mg/L the hardness for the
water samples investigated falls in within the W.H.O
limit and this shows that the waters is soft thereby
making the ground water portable.
Chloride comes from natural and man-made sources are
the main sources of chloride in ground water. The
sources are agricultural runoff, inorganic fertilizers,
99
industrial and septic tank effluents, animal feed
stocks, chloride is not harmful to human at low
concentration but could alter the taste of water at
concentrations above 250 mg/L. chloride mean values
obtained from this study were generally lower than the
W.H.O 250 mg/L limit.
Sulphate and nitrate (So42- and No3) sulphate is a non
toxic union but ailment like catharsis, dehydration and
gastrointestinal irritation have been linked to it when
concentration is high. Concentration of Sulphate in
water sample was insignificant in the samples
investigated.
Nitrates have low concentrate in the samples
investigated. Natural gas rich in oxides of Sulphur and
nitrogen are flared into the atmosphere n this general
area, at an average rate of 42.5 million cubic meters
per day. Never the less, the lower concentration of No3
in ground water may party be cause by the organic
100

carboh (present in the soil) reduction of nitrate to
nitrogen gas and sometimes to ammonia in the presence
of denitrifying microbes (how know and Glynn, 2005).
HCo3 was invested in our sample and raged from 2.0-
0.26. there are no prescribed standards suggested by W
H O for HCo3 for drinking purpose, so no comparison can
be made from the observation.
The enrichment of HCo3 in ground water is consistent
with the dissolution in ground water of biogenic Co2
trapped in the soil.
Calcium and Magnesium, the hardness is directly related
to Calcium and Magnesium content. In the present study,
Calcium concentration ranged between 1. 58 mg/L to 23.0
mg/L and ground below the permissible limit of W H O.
while Magnesium content in the water samples was rising
from 4.01 mg/L to 12.2 mg/L which was ground within
the prescribed limited. Ca2+ and Mg2+ are usually
released into ground water by the dissolution of field101
spars and micas (freeze and Chery, 1979) that are
important components of the Deltaic plain sands
aquifer.
Fe occurs higher their permissible limit in sample 2
and this suggests greater dissolution of fe from
metallic wastes and scraps and lateritic fe within the
soil particles. Other samples investigated falls within
the W H O permissible limit. Pb has W H O limit as 0.01.
the samples investigated has higher concentration above
the W H O permissible limit which is an indication of
high rate of atmosphere pollution by fumes from
autombile exhaust and other industrial sources,
industrial use of Pb produced materials. It may also
reflect the high filtering capacity of the soil with
rest to ground water.
Cu and Zn falls within the permissible W H O limit.
102

4.4 ENVIRONMENTAL AND HEALTH IMPLICATION
Results obtained from ground water samples indicate
total coliform counts of 0-7.38 log 10 cfu/mL. this
exceeds almost in all samples tested by the W H O
standard for water portability. The high coliform
counts suggest that ground water in the study area may
be potentially harmful.
The ingress of coliform bacteria may have been
facilitated by the shallow nature (0-4m) of the
aquifer, which enables easy access by percolating
contaminated water.
The result of this study and several others indicate
that the accelerated economic and population growth
brought by the oil exploration and production
activities in the study area generated adverse
environmental and health impacts. So2 and No2 gas are
103

actively poisonous and irritating both to the skin and
lungs. Current medically records from health
institution within this study area indicate that
respiratory tract diseases accounts for about 30% of
all diseases reported. Besides So2 and No2 are dissolved
by rain water to produce weak H2S04 and HNO3, which fall
on the earth as acid rain with corrosive effects.
CHAPTER FIVE
5.0 SUMMARY AND CONCLUSION
5.1 SUMMARY OF FINDINGS
Water is a solvent and dissolved minerals from the
rocks with which it comes in contact. Ground water may
contain dissolved minerals and gases that give it the
tinge taste enjoyed by many people. Without these
minerals and gases, the water would taste flat. The
most common dissolved mineral substances are Sodium,
104

Calcium, Potassium, Chloride, bicarbonate, and
Sulphate. In water chemistry, these substances are
called common constituents.
From our study, the sample investigated has PH less
than WHO. Limit which indicates that the water sample
is acidic which may be as a result of acid rain or
dissolution of other poisonous metals. Visual
observation showed that farm lands and bushes are
eroded as a result of bad water. Also the gaseous
emissions have been linked to increased green house
effect and the establishment of local heat Islands in
this area and this causes heating effect on the crops
and animals.
The measured pb concentrations of ground water are
higher in all causes than W.H.O limit recommended
maximum of 0.01mg/L. also, soil samples within the
study area have pb concentration up to 1.51pp which are
potentially in transit to the water table.
105

Consequently, edible vegetable show pb equality
impairment and bioaccumulation. The toxic effects of
excessive pb levels in human include significant damage
on the brain of both adults and infants (centernoetal,
2005), it is also known to induce heart related
diseases
The rapid population growth that out paced public
utilities development and the unsanitary habits of the
residents are reflected in the high coliform load in
ground water within the study area. Although the water
samples were not tested for specific pathogens, the
high microbial population present Suggests that it may
be harmful to health. This is confirmed by medical
records from major health institution within the study
area. Currently, gastro- enteritis account for between
10 and 15% in adults and 20 to 30% in infants of all
diseases reported.
106

CONCLUSION
The Physio-chemical assessment of ground water in major
parts of Afam–nta Community in Oyigbo local government
Area of Rivers State based on land uses covering
industrial, coastal, dry land residential, land fill
areas, etc were carried out. Majority of quality
parameters investigated were found below the WHO limit.
The sources of pollutants were diverse with industrial
effluent, municipal solids and septic having a great
impact on the ground water resources. The ground water
samples that have values of PH below WHO limit, higher
pb, fe2+, TDS, conductivity, Ca2+, Hco3, So42-, No3, on the
basis of WHO specifications, the ground water cannot be
regarded as portable owing to its high coliform counts,
while enhanced pb concentration makes the ground water
objectionable.
107

The unacceptable coliform counts in ground water may be
linked to the high rate of gastro-entreritis because
many inhabitants rely on ground water for domestic use.
The corrosive effect of these gases may be associated
with the high rate of respiratory tract diseases in the
area.
POLICY IMPLICATION / RECOMMENDATION
Based on the findings and conclusion, the following
recommendations are hereby made. It is believed that it
would help to alleviate the problems faced by the
individuals in Afam-Nta community.
First and foremost, there is need for continuous
regulation and quality control monitoring to prevent
and control pollution in order to safe guard human
health and facilitate Nigeria attainment of millennium
development goal (MDG) for water and sanitation.
108

Secondly, the effective maintenance of water quality of
local resources through appropriate control measures,
continuous monitoring of their quality parameters and
their use as a supplement t river. Water hall reduce
the water crisis in the city.
Thirdly, the government should set up a model to end
all gas flaring activities by oil companies operating
in Afam-nta Community and Oyigbo local Government Area
at large.
Finally, there should be adequate sensitization on the
dangers of polluted water to human health and the
environment
REFERENCES
1.Boumediene, m, and Achour, D. (2004) Denitrification of
underground waters by specific resin
exchange of ion. Desalination, 168, pp.
187-194
109

2.American Petroleum Institute (API). (2005) Guide to
State Groundwater Programs and
Standard. Publication No.4416 1220.
Washington, American Petroleum
Institute.
3.America Society for Testing and Materials (ASTM).
(1982) water; Annual Book of ASTM
Standards. Part 31, Washington, America
Society for testing and materials
(ASTM).
4.APHA/AWWA/WPCF. (1998) Standard methods for the
examination of water and wastewater. 20th ed.
Washington, APHA/AWWA/WPCF
5.Department of Environmental (DOE). (1972) Analysis of
Raw, portable and wastewater. London,
Department of Environment (DOE) PP 12-
16
110
6.Edet, A.E. (1993) Groundwater quality assessment in
parts eastern of Niger Delta.
Environmental Geology, 22, PP, 41-46
7.Federal Ministry of Environment (FmEnv). (1991)
Guidelines andstandards for
Environmental Pollution Control in
Nigeria, Nigeria, Federal Ministry of
Environment Fm Env), P 238
8.Freeze, R.A, and Cherry J.A. (1979) Groundwater .
2nded. New jersey Prentic Hall,
Eaglewood, cliff, PP.87
9.Ragunath, H.M. (1987) Groundwater. New delhi, Wiley
Eastern Ltd P.563
10. Ikem, A, Osibanjo, O, Shiridar, M.K.C. and Sobande
(2002) Evaluation of groundwater quality
characteristics near two waste
sites in Ibadan and Lagos, Nigeria.
111

Water, Air and Soil Pollution, 140,
PP. 307 – 333.
11. Jacobs, A, and wormwood, M (1981) Disorder of
metabolisim. In Brooner, F and coburn,
J.W.eds. Trace minerals, vol.1. New
York, Academic Press Inc, pp. 2.59.
12. Klassen, D.C Amodour, O.M. and Doull, J. (1986)
Casarett and Doull’s Toxicology: The basic
Science of Poisons. 3rd ed. New York,
Macmilian Publishing company, PP. 592-
596.
13. Adeyansa, A.O (1984). Acid rain in Nigeria,
Possibility and possible effects M.Sc
Thesis, Department of Chemistry University
of Ibadan, Nigeria.
14. Ayoade, J O (1988). Tropical hydrology and water
resources. macmillan, London.
112

15. APHA (1992), Standard method for the examination of
water and wastewater, Msc Thesis,
Department of D.C American Public Health
Association
16. Cooker, RU and DoomKamps, JC (1974), Geomorphology in
environmental management: an
introduction. Oxford University Press
London.
17. Efe, SL (2002), Urban Warming in Nigeria Cities: The
Case of Warri Metropolis. African Journal
of Environmental Studies, 3,
160- 168
18. Egborge, ABM (1991) Industrialization and heavy metal
Pollution in Warri River. 32nd
inaugural lecture, University of
Benin, Nigeria
19. Gould, JE and Mc Pherson, HJ (1987). Bacteriological
quality of river water in roof and ground
113
catchment system in Botswana. Water
international, 12, 135-138.
20. Peterson N, Bricheer O, Kennedy M: water quality
trends and geological mass balance;
John Whiley and Sons, P-139-17, (197)
21. Goltman H.Z, Clymo R.S. and Ohinstad M.A.M. methods
for Physical and Chemical analysis of
fresh water, I.B.P.H and Book No.8, and
edition Black well Scientific, Oxford
(1978)
22.Trivedi RK, and Goel P.K; Chemical and Biological
methods for water Pollution studies,
Environmental Publication, Karad,
India (1984)
23. Minns C.K. ; factors affecting fish species richness
in Onleria lake, Transaction of
American fish Society, 118, 533- 454 (1989)
114
24. Praparina N and ShashiKant K; Pollution Research 21;
187 190 (2002)
25. Meenakshi, Garg V.K, Kavita Rand Mallik A;
Groundwater quality in some villages of
Haryana, India, focus on fluoride
and Fluorosis, J. Han mater. 106, 85 -
97, (2004)
26. Lorraine C.B; Assessing the acute gastro intestinal
effects of ingesting naturally
occurring high levels of sulphate in
drinking water. Criti. Rev Clin. Lab.
Sci, 37, 389-400. (2000).
27. Hulchinson G.E; A Treatise on Limnology. Vol1 part 2,
Chemistry of lakes, John Whiley and
Sons, New York (1957)
28. Mahida, UN (1981), water pollution and disposal of
waste water on land. Mc graw Hill, New
Delhi
115
29. Olobaniyi SB and Owoyemi, F.B (2004), Quality of
Ground water in the Deltaic Plain Sands
aquifer of Warri and environs, Delta
State, Nigeria. Water Resources- Journal
of the Nigerian Ass. Hydrogeologists,
15, 38 – 45
30.Freeze, R.A and cherry, JA (1979), Ground water.
Prentice- Hall, Inc. New Jersey.
116