Pyramids Area, Giza, Egypt
19
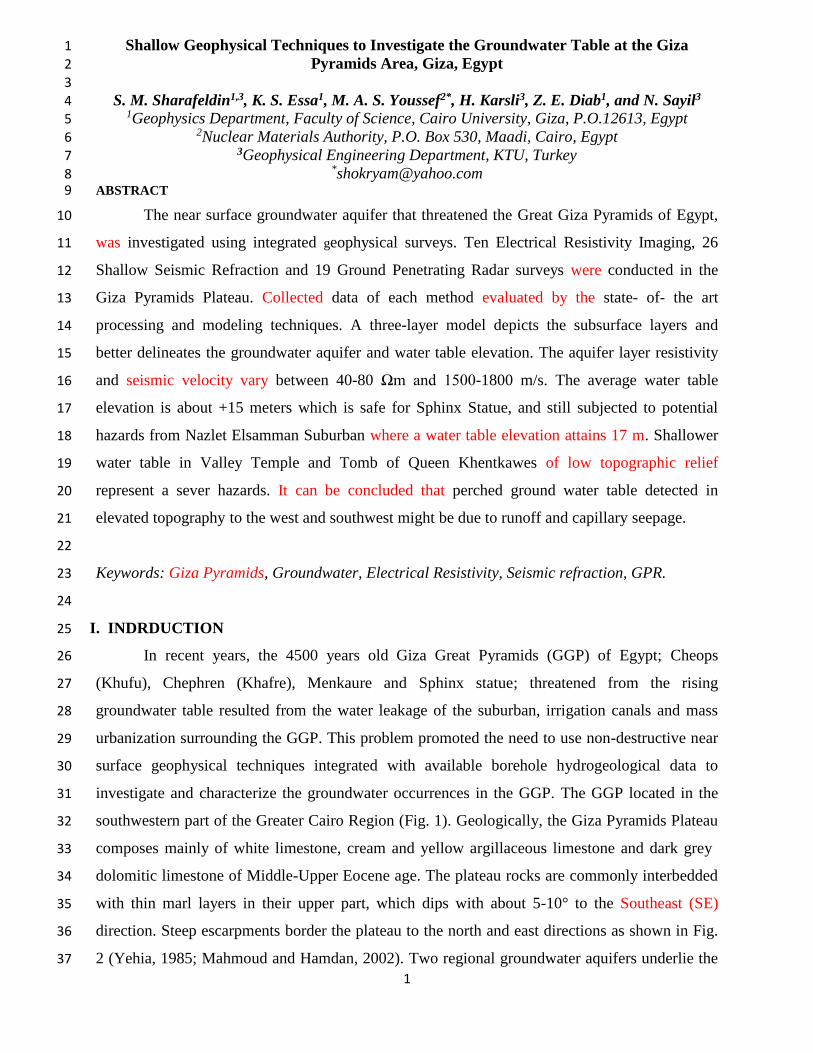
1 Shallow Geophysical Techniques to Investigate the Groundwater Table at the Giza 1 Pyramids Area, Giza, Egypt 2 3 S. M. Sharafeldin 1,3 , K. S. Essa 1 , M. A. S. Youssef 2* , H. Karsli 3 , Z. E. Diab 1 , and N. Sayil 3 4 1 Geophysics Department, Faculty of Science, Cairo University, Giza, P.O.12613, Egypt 5 2 Nuclear Materials Authority, P.O. Box 530, Maadi, Cairo, Egypt 6 3 Geophysical Engineering Department, KTU, Turkey 7 * [email protected] 8 ABSTRACT 9 The near surface groundwater aquifer that threatened the Great Giza Pyramids of Egypt, 10 was investigated using integrated geophysical surveys. Ten Electrical Resistivity Imaging, 26 11 Shallow Seismic Refraction and 19 Ground Penetrating Radar surveys were conducted in the 12 Giza Pyramids Plateau. Collected data of each method evaluated by the state- of- the art 13 processing and modeling techniques. A three-layer model depicts the subsurface layers and 14 better delineates the groundwater aquifer and water table elevation. The aquifer layer resistivity 15 and seismic velocity vary between 40-80 Ωm and 1500-1800 m/s. The average water table 16 elevation is about +15 meters which is safe for Sphinx Statue, and still subjected to potential 17 hazards from Nazlet Elsamman Suburban where a water table elevation attains 17 m. Shallower 18 water table in Valley Temple and Tomb of Queen Khentkawes of low topographic relief 19 represent a sever hazards. It can be concluded that perched ground water table detected in 20 elevated topography to the west and southwest might be due to runoff and capillary seepage. 21 22 Keywords: Giza Pyramids, Groundwater, Electrical Resistivity, Seismic refraction, GPR. 23 24 I. INDRDUCTION 25 In recent years, the 4500 years old Giza Great Pyramids (GGP) of Egypt; Cheops 26 (Khufu), Chephren (Khafre), Menkaure and Sphinx statue; threatened from the rising 27 groundwater table resulted from the water leakage of the suburban, irrigation canals and mass 28 urbanization surrounding the GGP. This problem promoted the need to use non-destructive near 29 surface geophysical techniques integrated with available borehole hydrogeological data to 30 investigate and characterize the groundwater occurrences in the GGP. The GGP located in the 31 southwestern part of the Greater Cairo Region (Fig. 1). Geologically, the Giza Pyramids Plateau 32 composes mainly of white limestone, cream and yellow argillaceous limestone and dark grey 33 dolomitic limestone of Middle-Upper Eocene age. The plateau rocks are commonly interbedded 34 with thin marl layers in their upper part, which dips with about 5-10° to the Southeast (SE) 35 direction. Steep escarpments border the plateau to the north and east directions as shown in Fig. 36 2 (Yehia, 1985; Mahmoud and Hamdan, 2002). Two regional groundwater aquifers underlie the 37
-
Upload
khangminh22 -
Category
Documents
-
view
0 -
download
0
Transcript of Pyramids Area, Giza, Egypt
1
Shallow Geophysical Techniques to Investigate the Groundwater Table at the Giza 1
Pyramids Area Giza Egypt 2 3
S M Sharafeldin13 K S Essa1 M A S Youssef2 H Karsli3 Z E Diab1 and N Sayil3 4 1Geophysics Department Faculty of Science Cairo University Giza PO12613 Egypt 5
2Nuclear Materials Authority PO Box 530 Maadi Cairo Egypt 6 3Geophysical Engineering Department KTU Turkey 7
shokryamyahoocom 8 ABSTRACT 9
The near surface groundwater aquifer that threatened the Great Giza Pyramids of Egypt 10
was investigated using integrated geophysical surveys Ten Electrical Resistivity Imaging 26 11
Shallow Seismic Refraction and 19 Ground Penetrating Radar surveys were conducted in the 12
Giza Pyramids Plateau Collected data of each method evaluated by the state- of- the art 13
processing and modeling techniques A three-layer model depicts the subsurface layers and 14
better delineates the groundwater aquifer and water table elevation The aquifer layer resistivity 15
and seismic velocity vary between 40-80 Ωm and 1500-1800 ms The average water table 16
elevation is about +15 meters which is safe for Sphinx Statue and still subjected to potential 17
hazards from Nazlet Elsamman Suburban where a water table elevation attains 17 m Shallower 18
water table in Valley Temple and Tomb of Queen Khentkawes of low topographic relief 19
represent a sever hazards It can be concluded that perched ground water table detected in 20
elevated topography to the west and southwest might be due to runoff and capillary seepage 21
22
Keywords Giza Pyramids Groundwater Electrical Resistivity Seismic refraction GPR 23
24
I INDRDUCTION 25
In recent years the 4500 years old Giza Great Pyramids (GGP) of Egypt Cheops 26
(Khufu) Chephren (Khafre) Menkaure and Sphinx statue threatened from the rising 27
groundwater table resulted from the water leakage of the suburban irrigation canals and mass 28
urbanization surrounding the GGP This problem promoted the need to use non-destructive near 29
surface geophysical techniques integrated with available borehole hydrogeological data to 30
investigate and characterize the groundwater occurrences in the GGP The GGP located in the 31
southwestern part of the Greater Cairo Region (Fig 1) Geologically the Giza Pyramids Plateau 32
composes mainly of white limestone cream and yellow argillaceous limestone and dark grey 33
dolomitic limestone of Middle-Upper Eocene age The plateau rocks are commonly interbedded 34
with thin marl layers in their upper part which dips with about 5-10deg to the Southeast (SE) 35
direction Steep escarpments border the plateau to the north and east directions as shown in Fig 36
2 (Yehia 1985 Mahmoud and Hamdan 2002) Two regional groundwater aquifers underlie the 37
2
Sphinx (Fig 3) the Quaternary aquifer of the Nile alluvium consists of graded sand and gravel 38
with intercalations of clay lenses at different depths exhibit water table at depth ranges between 39
15 to 4 meters below ground surface (bgs) The second aquifer is fissured carbonate aquifer that 40
covers the area below the Pyramids Plateau and the Sphinx where water table ranges in depth of 41
4 ndash 7 m bgs The recharge of the aquifer below Sphinx area occurred mainly through water 42
system leakage Irrigation and massive urbanization (AECOM 2010 and El-Arabi et al 2013) 43
Many geophysical studies carried out in the GGP mostly for archaeological exploration 44
and investigations (eg Dobecki T L 2005 Abbas et al 2009 and 2012) Geophysical studies 45
have an effective contribution in characterizing groundwater aquifers especially geoelectrical 46
resistivity seismic refraction and ground penetrating radar techniques Sharafeldin et al (2017) 47
studied the occurrence of the ground water table in GGP using combined VES ERI and GPR to 48
investigate the groundwater table in the area The present work implemented an integration of 49
Electrical Resistivity Imaging (ERI) Shallow Seismic Refraction (SSR) and Ground Penetrating 50
Radar (GPR) techniques to depict the groundwater table and characterize the aquifer in the Giza 51
Pyramids area The locations of different surveys conducted in the GGP are illustrated in Fig 4 52
53
II Method 54
II1 Electrical Resistivity Imaging (ERI) Surveys 55
Two-dimensional electrical resistivity imaging (tomography) surveys are usually carried 56
out using a multi-electrode system with 24 electrodes or more connected to a multi-core cable 57
(Griffiths and King 1965) Syscal-Pro resistivity meter IRIS Instruments France was deployed 58
at the site of the GGP using 24 multi-electrode dipole-dipole array configuration with 5m 59
electrode spacing The length of spread is 115m for each profile and attains 235 m maximum 60
depth of investigation Ten ERI profiles were performed to characterize the resistivity of 61
subsurface layers to delineate the groundwater aquifer (Fig 4) The topographic elevation of 62
each electrode is considered along ERI profile and linked to the Res2Dinv program The 63
acquired ERT data were processed using Prosys II software of IRIS Instruments to filter and 64
exterminate bad and noisy data acquired in the field and produced the pseudo resistivity sections 65
The Res2Dinv software implemented to invert the collected data along conducted ERT profiles 66
(Loke and Barker 1996 Loke 2012) This software works based upon automatically 67
subdividing the subsurface of desired profile into several rectangular prisms and then applies an 68
iterative least-squares inversion algorithm for solving a non-linear set of equations to determine 69
apparent resistivity values of the assumed prisms while decreasing the misfit values between the 70
predicted and the measured data Samples of interpreted data are shown in Figures 5 to 10 71
3
72
II2 Shallow Seismic Refraction (SSR) 73
Seismic refraction is widely used in determining the velocity and depth of weathering 74
layer static corrections for the deeper reflection data It is also employed in civil engineering for 75
the bedrock investigations and large scale building construction It is also used in groundwater 76
investigations detection of fracture zones in hard rocks examining stratigraphy and 77
sedimentology detecting geologic faults evaluating karst conditions and for hazardous waste 78
disposal delineation (Steeples 2005 Stipe 2015) A refraction technique is widely developed 79
for characterizing the groundwater table (Grelle and Guadagno 2009) Particularly the 80
unsaturated soil followed by saturated soil can be separated by a refracting interface (Haeni 81
1988) The seismic velocity values for the depth estimation of the groundwater can be used as an 82
indicator for water saturation The values of P-wave velocity are not uniquely correlated to the 83
aquifer layer but many authors related the P-wave velocities around 1500 ms to represent a 84
saturated layer (Grelle and Guadagno 2009) The tomographic studies view that the water table 85
corresponds to a P-wave velocity values of 1100 to1200 ms (Azaria et al 2003 Zelt et al 86
2006) 87
Twenty-six SSR profiles were acquired at GGP (Fig 4) OYO McSEIS-SX seismograph 88
with 24 geophones and channels was deployed in the GGP site to collect the seismic refraction 89
data with geophone spacing of 5m Sledge hammer with 10Kg and an iron-steel plate are used to 90
generate seismic P-wave Five shots per spread were gathered two off-set forward and reverse 91
and a split spread shot The spread length covers 115m Due to the historical and touristic nature 92
of the site a considerable amount of noise is imposing to the recorded data These noises were 93
minimized as possible by using the internal frequency domain filter and vertical stacking of 94
several shots during data acquisition The first arrival times were picked using SeisImager 95
software version 42 of Geometrics Tomographic inversion generate initial model from the 96
velocity model obtained by the time-term inversion then applying the inversion which 97
iteratively traces rays through the model with the goal of minimizing the RMS error between the 98
observed and calculated travel-times curves (Schuster 1998) SeisImager utilize a least squares 99
approach for the inversion step (Zhang and Toksoz 1998 Sheehan et al 2005 Valenta 2007) 100
A three layers model assumed to represent the subsurface succession with the inverted velocities 101
and thicknesses The top most layer exhibits a velocity range of 400-900 ms and thickness of 2 102
and 5 meters is correlated with loose dry sand fill and debris The second layer shows a velocity 103
range between 1200 and 2400 ms with 10 to 20 m thick This layer is correlated with wet and 104
saturated sand and fractured limestone The third layer shows a higher domain of velocity where 105
4
it ranges between 2800 and 3800 ms which can be correlated to marly limestone and limestone 106
The calculated arrival time for the resulted model is compared with the measured arrival time 107
and RMS error is calculated and illustrated on modeled seismic profiles Samples of interpreted 108
data are shown in Figures 5 to 10 109
II3 Ground Penetrating Radar (GPR) techniques 110
GPR is a non-invasive and effective geophysical technique to visualize the near surface 111
structure of the shallow subsurface and widely used to solve the environmental and engineering 112
problems (Jol and Bristow 2003 Comas et al 2004 Neal 2004) GPR is a site-specific 113
technique that imposed a vital limitation of the quality and resolution of the acquired data 114
(Daniels 2004) The GPR surveys were carried out using 100 MHz shielded antenna of MALA 115
ProEx GPR A total of 19 GPR profiles were performed along selected locations in the study 116
area (Figure 4) The GPR profiles range in lengths from 40 to 200 m according to the space 117
availability with a total GPR surveys of about 25 kilometer Wheel calibration was carried out 118
near the Great Sphinx along 30 m in distance the velocity used in calibration is 100 mmicros 119
resulted from WAAR test using 100 MHz unshielded antenna of Puls-Echo GPR Harari (1996) 120
showed that the groundwater table can be detected easily with a discerning selection of the 121
antenna frequency and he observed that the lower frequency antenna (eg100 MHz) was more 122
effective for locating the groundwater table depth Several basic processing techniques can be 123
applied to GPR raw data stating from DC-shift to migration (Annan 2005 Benedetto et al 124
2017) All 19 GPR profiles were processed to delineate subsurface layering and ground water 125
elevation in the study area Appropriate processing sequence for GPR data was applied to 126
facilitate interpretation of radargram sections using REFLEXWIN V 609 software (Sandmeier 127
2012) Firstly time-zero correction and then dewow filters to remove DC component and very 128
low frequency components were applied to all GPR data Then a band-pass filter was used to 129
improve the visual quality of the GPR data gain recovery was applied to enhance the appearance 130
of later arrivals because the effect of signal attenuation and geometrical spreading losses 131
(Cassidy 2009) Running average filters was the last filter applied Some sections of interpreted 132
data are shown in Figures 5 to 10 133
III Results and discussion 134
The integrated interpretation of the SSR ERI and GPR surveys supports a three layers 135
model assumed to represent the subsurface succession with the inverted velocities resistivities 136
and thicknesses The top most layer exhibits a velocity range of 400-900 ms and a resistivity 137
values varies between 10rsquos to 100rsquos Ohmm and is correlated with heterogeneous loose dry fill 138
and debris of thickness ranges between 2 and 5 meters The second layer shows a velocity range 139
5
between 1200 and 2400 ms and a resistivity values varies between 40 to 80 Ohmm this layer is 140
correlated with wet and saturated sand and fractured limestone and the thickness varies between 141
10 to 15 meters The third layer shows a high velocity ranges between 2800 to 3800 ms and a 142
resistivity values varies by changing the topographic elevation and marl intercalation in the 143
limestone layer GPR data delineated the subsurface succession and accurate detection of the 144
water table in area near Sphinx Valley Temple Mastaba and Tombs The interpreted ground 145
water table elevation ranges between 14-16 meters in these locations As the ground relief 146
increases toward the Mankaura Pyramids the water table is deeper and a perched water table 147
detected in elevations between 22 to 45 meters 148
Groundwater rise was detected in some locations which have an archaeological 149
importance these locations are Nazlet El-samman Village Sphinx Sphinx Temple Valley 150
Temple of Khafre Central Field of Mastaba and Khafre Cause Way 151
a- Nazlet El-samman Village is a suburban area located outside the core of the 152
archeological site The geophysical surveys SSR-3 amp 4 and GPR-2 conducted in the area 153
show a velocities of 1600-1800 ms and interpreted water table at elevation of 16-17 m 154
This elevation is fairly matched with a nearest piezometers-6 and 7 in the area where the 155
ground water elevation is 16-17 m The aquifer in this part is belonging to the Nile 156
Alluvium Aquifer This shallow water table might rise the water table level below Sphinx 157
area (Fig 5) causing a sever hazards 158
b- Sphinx Sphinx Temple Valley Temple of Khafre Central Field of Mastaba and 159
Khafre Cause Way this is the most important part of the study where the water appear 160
on the surface at the Valley temple and surrounding area of the Sphinx The locations of 161
the surveys were chosen according to the limited space approved by the Pyramid 162
Archaeological Authority The locations of the conducted data are shown in (Fig4) 163
Survey shows a good matching between the different techniques where the correlation 164
between different surveys results revealed that groundwater elevation between 14-15 m 165
The base level elevation of the Sphinx Status is 20 m and safe water table elevation 166
should be at elevation of 15 or less This level is lower than the suburban area of Nazlet 167
El-samman which might indicate a recharge of the aquifer below Sphinx and increase 168
capillary water rise 169
Sphinx and Sphinx Temple GPR-9 SSR-13 and ERI-1 conducted in front of Sphinx and 170
Sphinx Temple The integration of these surveys in front of Sphinx Temple the 171
groundwater elevation is about 145-155 m as shown in Figure 6 172
6
Valley Temple of Khafre and central field of Mastaba GPR profiles 3 4 5 10 and 11 173
SSR profiles 5 6 7 8 and 14 and ERI 2 The integration of this surveys in front of 174
Valley Temple of Khafre and central field of Mastaba the groundwater elevation is about 175
14-15 m as shown in Figure 7 176
Tomb of queen Khentkawes GPR-11 SSR-15 and ERI-3 conducted near the Tomb 177
Figure 7 shows the surveys conduct near the site The integration of this surveys in front 178
of Valley Tomb of queen Khentkawes the groundwater elevation is about 145-15 m 179
Valley Temple of Menkaure GPR-12 SSR-16 and ERI-4 conducted near the Temple 180
The integration of these surveys in front of Valley Temple of Menkaure the groundwater 181
elevation is about 165-17 m GPR profiles might detect the perched ground water table at 182
shallower depth from ground level (Fig 8) 183
Cause way to Menkaure Pyramid show high resistivity value near the surface and water 184
table located at elevation ranges from 22 to 24 m Menkaure Queens Pyramids and 185
Menkaure Quarry where the surveys in this part conducted at higher topographic relief 186
the correlation of the different techniques revealed that the water table might be 187
interpreted at elevations 45-58 m This might detect the perched ground water table at 188
shallower depth from ground level (Figs 9 and 10) 189
190
Table 1 shows a comparison of the ground water table elevation data recorded in 191
some piezometers illustrated in (Fig 12) installed by Cairo University in Wdi Temple 192
and Sphinx area (AECOM 2010) and the interpreted water table elevation resulted from 193
nearest conducted geophysical surveys There is a relatively good agreement between the 194
results and differences might be related to the tolerance in the geophysical data and exact 195
physical properties surface between the wet and saturated media Moreover the pumping 196
stations discharge might lower the water table in the site 197
198
Figure 11 represents a cross-section using the ERT and GPR data to illustrate the difference 199
of groundwater table elevation between the Great Sphinx to the small pyramids of Menkaure that 200
indicates the increase of groundwater elevation from west to east As the average water table 201
elevation to be about 15 m the water table to the west might be considered as perched water 202
table due to leakage surface runoff and capillary and fracture seepage Figure 12 represents the 203
compiled groundwater table elevation contour map from the geophysical surveys overlay the 204
groundwater table levels measured from some of the piezometers installed by Cairo University 205
(AECOM 2010) The present geophysical surveys proved that the pumping system installed by 206
7
AECOM 2010 lowering the groundwater levels in some piezometer and a need of more pumping 207
to compensate the recharge of the water leakage resulted from surrounding area of Sphinx 208
Figure 13 shows a 3D representation of the groundwater system in Great Giza Pyramids Plateau 209
and surrounding area 210
V Conclusions 211
The integrated interpretation of ERT SSR and GPR surveys was performed in Great Giza 212
Pyramids site successfully investigate the groundwater aquifer and water table elevation in Great 213
Giza Pyramid and assist the hazards mitigation An interpreted model consists of three layers 214
assumed to depict the subsurface layers and better delineation of the aquifer layer associated with 215
resistivity range of 40-80 Ωm and seismic velocity of 1500-1800 ms The average water table 216
depth is about 15m which is safe for the Sphinx status where the base foot at elevation of 20 m 217
The water table elevation increases in Nazlet Elsamman Village to 16-17m and might recharge 218
the aquifer below Sphinx and Valley Temple which considered a sever hazard on the site Tomb 219
of Queen Khentkawes threatened by water leakage resulted from vegetation in old cemetery and 220
nearby football field A parched groundwater table might exist in elevated area toward west and 221
southwest A great care should be taken to the effect of massive urbanization to the west of the 222
Great Giza Pyramids which might affect the groundwater model of the area The dewatering 223
system should be accomplished to avoid such hazards 224
225
Acknowledgements 226
Authors would like to thank Prof Jothiram Vivekanandan Chief-Executive Editor Prof Andrea 227
Benedetto the Associate Editor and the reviewer for their constructive comments for improving 228
our manuscript Geophysics Department Cairo University furnished all possible facilities to 229
conduct the research IIE-SRF funded the scholarship of S M Sharafeldin hosted by Geophysical 230
Engineering Department KTU Turkey Supreme Council of Archaeological authority 231
permission to conduct the surveys is highly acknowledged 232
233
234
235
236
237
238
239
240
241
8
References 242
Abbas A M Atya M EL-Emam A Ghazala H Shabaan F Odah H El-Kheder I and 243
Lethy A Integrated Geophysical Studies to Image the Remains of Amenemeht- II Pyramids 244
Complex in Dahshour Necropolis Giza Egypt NRIAG 2009 245
httpswwwresearchgatenetpublication234180809 246
247
Abbas A M El-sayed E A Shaaban F A and Abdel-Hafez T Uncovering the Pyramids-248
Giza Plateau in a Search for Archaeological Relics by Utilizing Ground Penetrating Radar 249
Journal of American Science 8(2) 1-16 2012 250
251
AECOM ECG and EDG Pyramids Plateau Groundwater Lowering Activity Groundwater 252
Modeling and Alternatives Evaluation USAID Contract No EDH-I-00-08-00024-00-Order 253
No02 2010 254
255
Annan A P [2005] Ground-penetrating radar In Near surface geophysics Butler DK (ed) 256
Society of exploration geophysicists Tulsa Investigations in Geophysics 13 357- 438 257
258
Azaria A Zelt C A and Levander A High-resolution seismic mapping at a groundwater 259
contamination site 3-D traveltime tomography of refraction data EGSndashAGUndashEUG joint 260
Assembly Abstracts from the meeting held in Nice 2003 261
262
Benedetto A Tosti F Ciampoli L B and DrsquoAmico F An overview of ground-penetrating 263
radar signal processing techniques for road inspections Signal Processing 132 201-209 2017 264
265
Cassidy N J Ground penetrating radar data processing modelling and analysis In Ground 266
penetrating radar theory and applications Jol HM (ed) ElsevierAmsterdam 141-176 2009 267
268
Comas X Slater L and Reeve A Geophysical evidence for peat basin morphology and 269 stratigraphic controls on vegetation observed in a northern peat land Journal of Hydrology 295 270 173-184 2004 271
272 Daniels DJ Ground penetrating radar (2nd edition) The Institution of Electrical Engineers 273 London 2004 274
275 Dobecki T L Geophysical Exploration at the Giza Plateau Egypt a Ten-Year Odyssey 276 Environmental amp Engineering Geophysical Society (EEGS) 18th EEGS Symposium on the 277 Application of Geophysics to Engineering and Environmental Problems 2005 278
279 El-Arabi N Fekri A Zaghloul E A Elbeih S F and laake A Assessment of 280 Groundwater Movement at Giza Pyramids Plateau Using GIS Techniques Journal of Applied 281
Sciences Research 9(8) 4711-4722 2013 282 283 Grelle G and Guadagno F M Seismic refraction methodology for groundwater level 284 determination ldquoWater seismic indexrdquo Journal of Applied Geophysics 68 301ndash320 2009 285 286
9
Griffiths D H and King R F Applied geophysics for Engineering and geologists Pergamon 287 press Oxford New York Toronto 221p 1965 288
289 Harari Z Ground-penetrating radar (GPR) for imaging stratigraphic features and 290
groundwater in sand dunes J Appl Geophys 36 43ndash52 1996 291 292 Jol H M and Bristow C S GPR in sediments advice on data collection basic processing and 293 interpretation a good practice guide In Ground penetrating radar in sediments Bristow CS and 294 Jol HM (ed) Geological Society London Special Publication 211 9- 28 2003 295
296
Loke M H and Barker R D Rapid least-squares inversion of apparent resistivity pseudo-297
sections by a quasi- Newton method Geophysical Prospecting 44 (1) 131ndash152 1996 298
299
Loke M H Tutorial 2-D and 3-D electrical imaging surveys Course Notes 2012 300
301
Mahmoud A A and Hamdan M A On the stratigraphy and lithofacies of the Pleistocene 302
sediments at Giza pyramidal area Cairo Egypt Sedimentology of Egypt 10 145-158 2002 303
304
Neal A Ground-penetrating radar and its use in sedimentology principles problems and 305
progress Earth science reviews 66 261-330 2004 306
307
Sandmeier K J The 2D processing and 2D3D interpretation software for GPR reflection 308
Seismic and refraction seismic Karlsruhe Germany httpwwwsandmeier-geode 2012 309
310
Schuster G T Basics of Exploration Seismology and Tomography Basics of Traveltime 311
Tomography Stanford Mathematical Geophysics Summer School Lectures 1998 312
(httputamgeophysutahedustanfordnode25html) 313
314
Sharafeldin M Essa KS Sayıl N Youssef MS Diab Z E and Karslı H 315
Geophysical Investigation Of Ground Water Hazards In Giza Pyramids And Sphinx Using 316
Electrical Resistivity Tomography And Ground Penetrating Radar A Case Study Extended 317
Abstract 9th Congress of the Balkan Geophysical Society Antalya Turkey DOI 1039972214-318
4609201702549 2017 319
320
Sheehan J R Doll W E and Mandell W A An Evaluation of Methods and Available 321
Software for Seismic Refraction Tomography Analysis JEEG 10 (1) 21ndash34 2005 322
323
Steeples D W Shallow Seismic Methods In Y Rubin amp S S Hubbard Hydrogeophysics (pp 324
215-251) Netherlands Springer 2005 325
326
Stipe T A Hydrogeophysical Investigation of Logan MT Using Electrical Techniques and 327
Seismic Refraction Tomography Degree of Master of Science in Geoscience Geophysical 328
Engineering Option Montana Tech 2015 329
330
10
Valenta J and Dohnal J 3D seismic travel time surveying ndash a comparison of the time- term 331
method and tomography (an example from an archaeological site) Journal of Applied 332
Geophysics 63 46-58 2007 333
334
Yehia A Geological structures of the Giza pyramids plateau Middle East Res Center Ain 335
Shams Univ Egypt Sci Res Series 5 100-120 1985 336
337
Zelt A C Azaria A and Levander A 3D seismic refraction travel time tomography at a 338
groundwater contamination site Geophysics 58(9) 1314ndash1323 2006 339
340
Zhang J and Toksoz M Nonlinear refraction traveltime tomography Geophysics 63(5) 341
1726ndash1737 1998 342
343
344
345
346
347
348
349
350
351
352
353
354
355
356
357
358
359
360
361
362
363
364
365
366
367
368
369
370
371
372
373
11
Table 1 Average interpreted Groundwater elevations to the nearest 8 piezometers installed 374
piezometers (modified after EACOM 2010) 375
Piezom No Surveyed Area Geophysical Data PiezomGWT (m) Interpreted GWT (m)
PZ-6 amp 7 Nazlet Elsaman SSR3 amp 4 GPR2 5 159-174 16-17
PZ-8 Sphinx Temple SSR3amp 4 GPR2 5 ERI1 157 145-155
PZ-11 amp 14 Valley Temple SSR14GPR10 amp ERI2 144 ndash 141 14-15
PZ-12 15 amp16 Sphinx SSR13 GPR9 amp ERI1 153- 156 15-155
376
377 378
Fig 1 Location map of the study area of Pyramids Plateau 379 380 381
382 383
Fig 2 Geologic map of the Giza Pyramid Plateau Egypt (Modified after Yehia 1985) 384 385 386
12
387 388 389 390
391 392 393 394 395 396 397 398 399 400 401 402 403 404 405
Fig 3 Ground water aquifers affected the Giza Pyramids Plateau (El-Arabi et al 2013) 406 407
408 409
410 Fig 4 locations for the profiles and techniques used along the different parts of the Giza Pyramids plateau 411
Nile Alluvium aquifer
Eocene Aquifer
13
Fig 5 SSR and GPR profiles in Nazlet El-semman Village
A-SSR3
B-GPR2
Water table
B-SSR13
C-GPR9
A- ERT1
Fig 6 ERI SSR and GPR profiles in Sphinx and sphinx Temple
14
Water table
Fig 7 ERT SSR and GPR profiles in Valley Temple of Khafre and central field of Mastaba
B-SSR14
C-GPR5
Water table
Fig 8 ERT SSR and GPR profiles in Tomb of queen Khentkawes
A- ERT3
B-SSR15
C-GPR11
A- ERT2
15
Fig 9 ERT SSR and GPR profiles in Valley Temple of Menkaure Fig 9 ERT SSR and GPR profiles in Valley Temple of Menkaure
Fig 9 ERT SSR and GPR profiles in Valley Temple of Menkaure
Water table
A- ERT7
B-SSR19
C-GPR16
Fig 10 ERT SSR and GPR profiles in Cause way to Menkaure Pyramid
Water table
C-GPR12
B-SSR16
A- ERT4
16
Figure 11 Cross-section using the ERT data shows how the groundwater elevation change from Sphinx to Menkaure Pyramid
Fig 12 Groundwater elevations map from the ERI SSR and GPR data taken across the study
area of the Giza Pyramids plateau including the installed piezometers and their groundwater
levels by Cairo University 2008
17
Fig 13 3D model of the Giza Pyramids Plateau illustrating the groundwater table
18
Authors response to the Associate Editor comment on the paper entitled ldquoShallow
Geophysical Techniques to Investigate the Groundwater Table at the Giza Pyramids
Area Giza Egyptrdquo gi-2017-48
Authors S M Sharafeldin K S Essa M A S Youssef H Karsli Z E Diab and N
Sayil
We would like to to thank Prof Jothiram Vivekanandan Chief-Executive Editor Prof
Andrea Benedetto the Associate Editor and the reviewer for their constructive comments for
improving our manuscript
Replies to the comments of the reviewer
Comment 1-
Authors present a case study dealing with a multi sensor approach in the assessment of
the water table level in the Giza Plateau The field data were collected by using 3
different geophysical techniques ERI SSR GPR Field setups and measurements
procedures are quite well described
Reply
Thank you very much for your valuable and helpful comments We have gone through the
manuscript taken into your considerations (corrected modified and added the missing
figures)
Comment 2-
I suggest the authors to introduce additional information about the gauges
calibration
Reply
We have done this in the text in GPR by measuring the velocity by using Unshielded Pulss-
Ekho GPR as stated in the text
Comment 3-
The data processing and analysis is performed through existing software It is not clear
in the text the use of the boreholes data The paper does not present novel tools or
analysis techniques furthermore the integration of data collected through different
instruments is quite common Despite this the study can be interesting for the specific
investigation site and for a cost-effective planning of future measurement campaigns
Reply
We have added a new table to compare the WT elevation results between piezometers and
geophysical surveys results
19
Comment 4-
A more interesting data presentation could be obtained by introducing the uncertainty
in the analysis
Reply
This was done by calculating the RMS errors between measured and calculated arrival time
Also in the models of ERI the RMS illustrated on the figures
Comment 5-
The text is generally well written but sometimes it is redundant As noticed by the
SC1 figures are not in the pdf
Reply
Thank you very much for your valuable and helpful comments We have modified the text to
avoid the redundant sentences Also we have added the missing Figures
Thank you