Element B Energy in Egypt
13
Element B We searched credible sources about the different types of energy forms used in Egypt, where does the energy go in life fields, how does the field of interest "transportation" affect the energy consumption, how much these forms of energy cost, how will the new solutions for energy might be effective, how long does it take Egypt to apply each of these solution effectively, how the Egyptian government will deal with these solutions concerning the obstacles and the facilities, and the environmental impact of energy usage. 1. Different types of energy forms used in Egypt: Oil: Egypt produced from domestic sources practically all the energy it consumed. Electricity was generated from oil- powered stations and hydro-powered turbines on the Nile, especially those of the Aswan High Dam. Oil and, increasingly, gas and their derivatives supplied other types of energy, and in 1990 Egypt was about to begin mining coal in Sinai. Solar energy, an abundant resource, had not been tapped because technology was not sufficiently developed to enable it to compete with other energy sources. Oil increasingly dominated the energy sector after the mid1970s . In 1986 petroleum constituted about 90 percent of production and about 75 percent of consumption, in addition to being one of the major foreign exchange earners. The first oil well was drilled in Egypt in 1886, but commercial production began only in 1913. Output remained minimal until the 1950s, when the government entered into joint ventures with foreign oil companies for exploration
-
Upload
independent -
Category
Documents
-
view
0 -
download
0
Transcript of Element B Energy in Egypt

Element BWe searched credible sources about the different types of energy forms used in Egypt, where does the energy go in life fields, how does the field of interest "transportation" affectthe energy consumption, how much these forms of energy cost, how will the new solutions for energy might be effective, how long does it take Egypt to apply each of these solution effectively, how the Egyptian government will deal with these solutions concerning the obstacles and the facilities, and theenvironmental impact of energy usage.
1.Different types of energy forms used in Egypt:
Oil:
Egypt produced from domestic sources practically all the energy it consumed. Electricity was generated from oil-powered stations and hydro-powered turbines on the Nile, especially those of the Aswan High Dam. Oil and, increasingly, gas and their derivatives supplied other types of energy, and in 1990 Egypt was about to begin mining coal in Sinai. Solar energy, an abundant resource,had not been tapped because technology was not sufficiently developed to enable it to compete with otherenergy sources.
Oil increasingly dominated the energy sector after the mid1970s . In 1986 petroleum constituted about 90 percent of production and about 75 percent of consumption, in addition to being one of the major foreign exchange earners. The first oil well was drilled in Egypt in 1886, but commercial productionbegan only in 1913. Output remained minimal until the 1950s, when the government entered into joint ventures with foreign oil companies for exploration

and development. Through the Egyptian General Petroleum Company (EGPC), which was established in 1962, the government pushed for production expansion after the 1974 oil price rise; by 1976 Egypt had an oil trade surplus. Production continued to grow in the 1980s, from nearly 29.4 million tons per year (1 ton = 6.6 to 8 barrels depending on density) in 1981 to an average of 42.7million tons per year between 1984 and 1988. The average was lowered somewhat by the drop in output in 1986 when oil prices plummeted from US$22 per barrel in the previous year to US$12 per barrel. Egypt became an observer member in the Organizationof Petroleum Exporting Countries (OPEC) in 1984, but its production policy was dictated less by OPEC's limits than by market conditions.
About 75 percent to 80 percent of oil output in the1980s came from the Gulf of Suez fields, and the rest from scattered sites in the Western, Arabian (or Eastern), and Sinai deserts and the Delta. The major foreign oil company in Egypt was Amoco, whichoperated in Egypt through its subsidiary, the Gulf of Suez Petroleum Company (GUPCO). The firm produced about one-half of the country's oil output. In 1987 it leased 19,000 square kilometers in Sinai for oil exploration. Other concessions were given to companies such as Shell and the Italian Azienda Generale Italiane dei Petroli (AGIP). The drop in oil prices in 1986 compelled the EGPC to agree to production sharing based on a sliding scale tied to the price of crude oil. Egypt's recoverable reserves were put at 4.5 billion barrels or the equivalent of less than fourteen years of production at the rate of the late 1980s. At the end of the decade, however, oil companies were confident that there was more oil tobe discovered in the Western Desert and possibly in

Sinai. If more oil should be found, it was likely that recovery costs would increase because of the greater depths at which deposits might be located, especially offshore.
Natural gas:
In addition to oil, important natural gas discoveries weremade during the1970s and 1980s, andgas was projected togain greatersignificance in the1990s. Natural gas, condensates, and butagas outputincreased steadilybetween 1980 and1988, from 1.8million tons to 6.8million tons (oilequivalent), or atan annual rate of 18percent. Gas wasexpected to be used mostly domestically, as an oil substitute, thus extending the period during which oil would be available for export. Gas reserves were estimated at about 0.28 trillion cubic meters and could be as high as 1.12 trillion cubic meters.In the Second Five-Year Plan (FY 1987-91), gas output was projected to increase by more than 76 percent over the 1986 level.
In 1989 the government signed thirty-five contractsfor gas exploration and development, mainly in the
Figure 1 Egyptian Nat. gas consumption

Western Desert. Many of these had awaited signaturefor some time. The government at first thought itself capable of producing gas on its own; however, the debt pressure, the fall of oil prices,and the large investment needed for the task forcedit to reconsider its position. Moreover, the government offered contracting firms better terms than previously, including payment in cash and oil (which the companies preferred) at international market prices, with a 15 percent discount for the government as a compensation for building the pipeline network. The company investing the most was Shell.
Coal:
A final source of energy in Egypt was coal from theMagharah mines in northeastern Sinai. The mines were thought to contain 25 million tons of recoverable reserves. They were closed in the 1960sbut were expected to produce 600,000 tons per year from 1989 onward. The fuel would be earmarked mainly for the 2,500-megawatt Zaafaranah complex onthe Gulf of Suez.
Figure 2 Egyptian forms of energy according the nature
Figure 2 Egyptianresources of energy
particpation

2.Energy fields of consumption:
The next and most important step was to establish, to the best of our present knowledge, a realistic scenario for the energy demand associated with the different economic sectors and that of the whole country.
For supply options to satisfy these demands using available sources up to the year 2020. The energy consumption of the different sectors in the base scenario.
Figure 3 Energy consumption by sector "fields of usage".
It should be noted that power production is treatedhere as a separate sector. When power generation, the largest energy consumer sector, is distributed among the other economic sectors, industry gets thepredominant share, followed by the residential and commercial sectors.
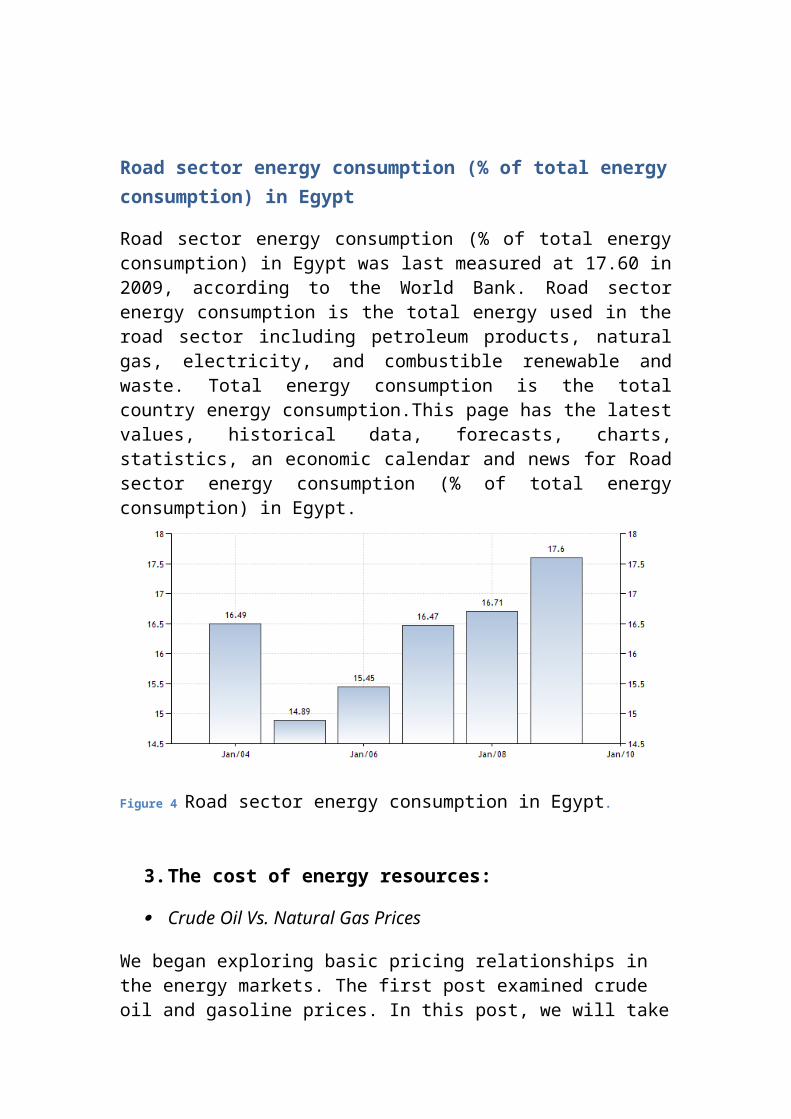
Road sector energy consumption (% of total energyconsumption) in Egypt
Road sector energy consumption (% of total energyconsumption) in Egypt was last measured at 17.60 in2009, according to the World Bank. Road sectorenergy consumption is the total energy used in theroad sector including petroleum products, naturalgas, electricity, and combustible renewable andwaste. Total energy consumption is the totalcountry energy consumption.This page has the latestvalues, historical data, forecasts, charts,statistics, an economic calendar and news for Roadsector energy consumption (% of total energyconsumption) in Egypt.
Figure 4 Road sector energy consumption in Egypt.
3.The cost of energy resources:
Crude Oil Vs. Natural Gas Prices
We began exploring basic pricing relationships in the energy markets. The first post examined crude oil and gasoline prices. In this post, we will take
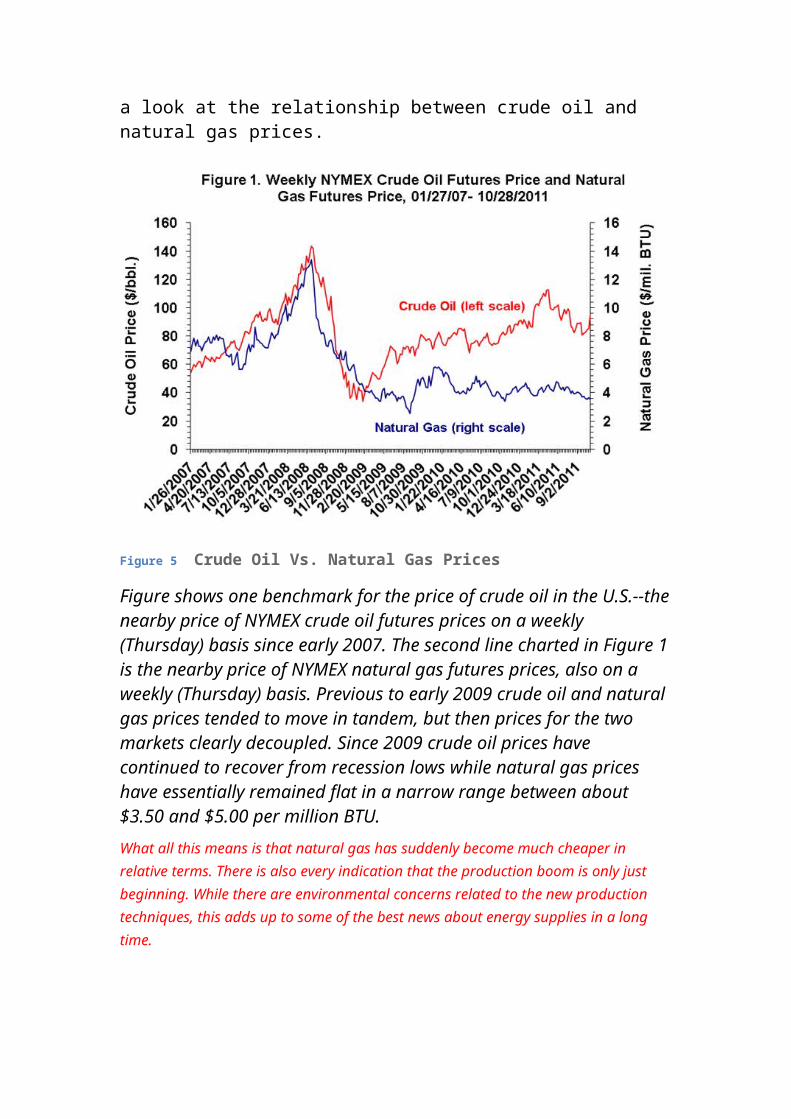
a look at the relationship between crude oil and natural gas prices.
Figure 5 Crude Oil Vs. Natural Gas Prices
Figure shows one benchmark for the price of crude oil in the U.S.--thenearby price of NYMEX crude oil futures prices on a weekly (Thursday) basis since early 2007. The second line charted in Figure 1is the nearby price of NYMEX natural gas futures prices, also on a weekly (Thursday) basis. Previous to early 2009 crude oil and natural gas prices tended to move in tandem, but then prices for the two markets clearly decoupled. Since 2009 crude oil prices have continued to recover from recession lows while natural gas prices have essentially remained flat in a narrow range between about $3.50 and $5.00 per million BTU.What all this means is that natural gas has suddenly become much cheaper in relative terms. There is also every indication that the production boom is only just beginning. While there are environmental concerns related to the new production techniques, this adds up to some of the best news about energy supplies in a long time.

Coal Vs. Natural Gas PricesCoal prices vary a lot around the country - based on quality and proximity to markets. The best time series I was able to find at the EIA website was for Central Appalachian coal, and if I'm doingthe math correctly (12000 btu/lb and 2000 lb/short ton) the comparison to Henry Hub natural gas prices looks like this:
Figure 6 Coal vs. Natural Gas Prices
So in close contact with the Electricity prices, the prices of electricity in Egypt range among the lowest in the world. The prices are fixed by the Egyptian government in a non-transparent manner and apply in equal manner to all regions. Electricity is highly subsidized. Since October 2004, several electricity tariffs were raised, by an average of 8.6 %, for the first time since 1992 and further 5 % increases were set for all electricitycustomers for each of the following five years. The last increasetook place in November 2008. In 2008, the rise summed up to 7.5 %, including an additional 2.5 %-increase caused by high oil prices. While the increase in some segments exceeded 18 %, pricesof the first segment of domestic consumption – less than 50 kWh per month, mainly composed of low income families –remained unchanged at 5 Pt (approximately 0.62 €-ct). The highest increasewas seen for the residential consumers with a demand of >1000 kWh/ month. The governmental plan was intended to gradually

accommodate the electricity prices to the actual cost of the electricity system. However, taking into consideration annual inflation rates exceeding 5 %, these increases may not suffice. The new electricity law is supposed to specify the main principles of price regulation such as the ones mentioned above. And for full price list in http://egyptera.org/en/t3reefa.aspx.
So from the previous, we concluded that we in strict need to another resources of cheap Energy, that will last for a long time.
4.The new solutions for energy:
Core Areas for Investment: solar energy, Wind energy.
Competitive Strengths and Capabilities
Strategic Geo-Climactic Location: Egypt’s consistently hot climate, high wind speeds and abundance of agricultural land give it a competitive advantage in renewable energy production. Furthermore, its proximity to European energy markets and energy-equipment manufacturers make it an attractive investment option.
Longer Hours of Sun and Wind Operation than in Europe: Every year, Egypt’s primary locations offer 2,400 or more hours of solar operation, compared with maximum European figures of 1,900 in Spain and Greece, the next-closest countries. As for wind energy, hours of operation in areas with the highest speeds can reach up to 3,900 hours per year.
Stable and Investor-Friendly Government Incentive System: Proving its commitment to the Renewable Energy sector, the Egyptian government developed an investor-friendly incentive system based on successful European incentive models. The government plans to introduce a feed-in tariff and a seamless licensing process to boost private investment. Furthermore, itwill reduce the cost of infrastructure investment for foreign renewable energy companies by identifying logistically suitable areas and at the same time providing the locations with connection access to the national grid.

Constraints:
Institutional and legal constraints: There is no law, regulation or effective policy to promote energy efficiency. There is no clear and comprehensive strategy and/or program for improving energy efficiency. Notwithstanding the creation of the new Energy EfficiencyUnit, still there is no dedicated institution that has clear implementation and executive authority for pursuingenergy efficiency objectives.
Data and Information Availability: There is little reliable data and information on energy use by subsectors, key industries, equipment and appliances. There are no mandatory fuel efficiency standards in transport, no mandatory energy efficiency building codes,no benchmarking for industries, and only few energy efficiency standards for appliances.
Capacity Constraints: There is an insufficient capacity to develop and undertake energy efficiency programs and projects.
Financial constraints: There are no dedicated funds or other financial mechanisms and incentives to support energy efficiency activities. Energy prices are well below costs and do not encourage energy savings.

In detail:
Solar Photovoltaic (PV)
Photovoltaic systems produceelectricity from sunlight throughsemiconducting cells utilisingthe photo-electric effects togenerate electrical energy.Photovoltaic panels come inmodular panels, which can befitted to the top of roofs, butother building-integrated panelsare also available. A typical PV panel can generate around 100kWe/m2/yr. To put this into context, a typical 72m2 house consumes around 9000kWh/year of energy, comprising of around 3478kWhe/year and 5580kWht /yr. Therefore, using a typical 3m2panel would generate 300kWhe/yr or 9% of the domestic electrical requirement. Similarly to SHW, solar PV depends on:
• Available roof space to install the system
• Orientation and exposure of the roof to be able to capture enough solar radiation
Solar PV systems are equally suitable for domestic and non-domestic buildings with greater emphasis on domestic. Domesticbuildings tend to have pitched roofs and therefore orientationis a strong factor, unlike commercial and industrial buildings, which often have flat roofs. The capacity assessment explores the entire regional building stock.
Wind Energy:
Egypt's Red Sea Coast region hastwo natural resources, land andstrong wind in enormous supply.The land and wind are essentiallyfree. But the cost of operatingthis type of Energy and
establishing its technology will cost a lot more than the effort of Egypt as developing country. As site selection for wind-power generation is a highly technical activity. A minimum average wind speed of 13 miles per hour during each month throughout the yearis required for cost-effective, utility-scale wind-power development. Many PA locations have high wind speeds during the winter months, but the minimum wind speed needs to be maintained throughout the summer months as well when electricity is most valuable. Many additional requirements need to be met before an energy developer or investment group is interested in making the large investment necessary to develop a wind farm.
5.Time limit of applying the renewable energy:We'll also consider both the solar and wind energy.The time limit of applying both solar and wind energies in Egypt as a combined solution will take tens of decadesor more, but it significantly can't be determined exactlyhow many years. But from this general view we concluded that applying these types of energy requires the long breath strategy that doesn't match the state of developing country like Egypt.
6.Environmental Limit:

References:1. http://www.londonheatmap.org.uk/Content/uploaded/
documents/Redbridge%20Study%20Body%20Chapter%205%20-%209.pdf
2. http://www.mongabay.com/history/egypt/egypt-energy.html 3. http://www.afdb.org/fileadmin/uploads/afdb/Documents/
Policy-Documents/Cata%20Energie%20Anglais.pdf4. http://www.tradingeconomics.com/egypt/road-sector-energy-
consumption-percent-of-total-energy-consumption-wb-data.html
5. http://www.gcrio.org/CSP/IR/IRegypt.html 6. http://www.farmdocdaily.illinois.edu/2011/11/
trends_in_crude_oil_and_natura.html7. http://www.gafi.gov.eg/content/invsectorsdocs/
RenewableEnergyvalue.pdf