Optimization of Energy Consumption and Surface Quality in Finish Turning

Page 1 of 20 Optimization Energy Model for Egypt
An Optimization Energy Model for Egypt
A.A. Tharwat*, M.M. Saleh*, D.S. Ali*
* Decision Support Department, Faculty of Computers and Information, Cairo University, P.O. 12311
Abstract: Energy plays an essential role in peace and war for any country. The Egyptian energy problem which represented in the following question: how could the limited available resources from the conventional energy (Petroleum) cover the high growth of demand of energy? The Egyptian energy problem erupted during the war in October 1973; the continuity of the problem gave a good motivation to the following two approaches: (1) creating optimal models to redistribute the available energy resources and (2) to search for alternative non-conventional energy resources (Natural Gas…etc). During the last three decades there are many energy models were developed to solve the energy problems [1], [3], [4], [5]. This article introduces a new mathematical energy model (Distribution of Energy Sources on Different Sectors DESDS), three objectives are considered in the proposed multi-objective nonlinear mathematical model: the 1st is to minimize the total cost, the 2nd is to minimize the pollution ratio, and the 3ed is to minimize the total governmental subsidy. Finally the model is implemented by using a real life data obtained from the Egyptian Organization of Energy Planning (EOEP), the results were compared with the EOEP distribution plan to explain the benefits of applying the proposed model to those types of problems. Keywords: Energy Models, Mathematical Models, and Multiobjective Nonlinear Programming.
بدأت مشكلة الطاقة فى مصر، . تلعب الطاقة دوراَ اساسياَ فى حياة أى دولة سواءاَ اثناء الحرب أوالسالم
دودية المـصادر مع مح ) اابترول(والتي تتمثل في التزايد المستمر للكميات المطلوبة من الطاقة التقليدية
في مصر ، واستمرارية تلك المشكلة ١٩٧٣التي تغطي تلك الطلبات، تفجرت مشكاة الطاقة التقليدية عام
أعطت دوافع قوية للتقدم في إتجاهين بحثيين على التوازي، أولهما أستنباط النماذج الرياضية التي تبحث
في المحاولة للبحث عن مصادر بديلة للطاقـة للتوزيع األمثل لمصادر الطاقة المحدودة، والثاني يتمثل
في العقود الثالثة الماضية تم تطوير العديد من النمـاذج الرياضـية ...). الطبيعي، الغاز(غير التقليدية
وتم التعامل مع ثالثة ) DESDS(التى اهتمت بحل مشكلة الطاقة، ويقدم هذا البحث نموذج رياضى جديد
) ٢(تخفيض التكلفة الكلية لتوزيـع الطاقـة، ) ١: (األهداف غير الخطية وهي أهداف في النموذج متعدد
كما تـم تطبيـق . تخفيض الدعم الحكومي المادي المخصص لتوزيع الطاقة ) ٣(تخفيض نسبة التلوث،
النموذج المقترح على بيانات حقيقية حصلنا عليها من جهاز تخطيط الطاقة بمصر، وقورنت النتائج التي
ن النموذج مع ماسبق إستخدامه من جهاز تخطيط الطاقة لتوضيح مزايا إستخدام النموذج في أستخرجت م
.تلك النوعية من المشاكل

Page 2 of 20 Optimization Energy Model for Egypt
Introduction Sufficient supplies of energy have always played a crucial role for people on the earth. In the early days heat was the most important energy form, providing people with cooking facilities and keeping them warm. Today most human activities are concerned with use of various forms of energy, and we experience a growth in energy consumption in most parts of the world. At the same time, the knowledge and concern about environmental consequences of energy utilization are increasing. In this situation there is a need for finding better energy supply systems for the future. A range of different computer models make an important contribution as decision support in the endeavor to improving energy supply systems. There are a several types of modeling tools such as optimization (mathematical model), simulation, and system dynamic. Optimization is an important activity in many fields of science and engineering. A lot of modeling, design, controls and decision-making problems can be formulated in terms of mathematical optimization. Moreover, there are several mathematical optimization techniques such as linear programming (LP), nonlinear programming (NLP), dynamic programming (DP), and multiobjective (linear / nonlinear) programming (MOP). Many real-world decision making problems need to achieve several objectives: minimize risks, maximize reliability, minimize deviations from desired levels, minimize cost, etc. The main goal of single- objective (SO) optimization is to find the optimal solution, which corresponds to the minimum or maximum value of a single objective function that lumps all different objectives into one. This type of optimization is useful as a tool, which should provide decision makers with insights into the nature of the problem, but usually cannot provide a set of alternative solutions that trade different objectives against each other. On the contrary, in a multiobjective optimization with conflicting objectives, there is no single optimal solution. The interaction among different objectives gives rise to a set of compromised solutions, largely known as the trade-off, nondominated, noninferior or Pareto-optimal solutions [12]. There are several of methods, which can handle and deal with multiobjectives problems such as weighting objectives method, hierarchical optimization method, trade-off method, global criterion method, and distance functions method. 1. Modeling Approaches: Models differentiate according to the overview of model designer and its field (economic, engineering…etc). Energy system models are often classified mainly into three types as follow [4]:
A. System engineering Models, B. Macroeconomic Models, or C. System Dynamics Models.
Page 3 of 20 Optimization Energy Model for Egypt
System engineering models interest in technical engineering side of energy problem and discus in details the different energy conversion technologies. Moreover, this type of models concentrate on the demand side, which calculate the energy demand in a separate model, and treat the different sorts of energy demand as a fixed parameter within the energy system model. For example, MARKAL model (optimization model---linear/dynamic programming) was developed by the Energy Technology Systems Analysis Programme (ETSAP) of the International Energy Agency (IEA) [5], and EFOM-ENV model (optimization model---linear/dynamic programming) was developed by European Commission DDG-XII F/1 (Belgium) [3]. Macroeconomic models, on the other hand, tend to focus on the demand side. These models usually incorporate larger parts of the economy. The development of each sub-sector in the economy depends on sensitivities, or elasticities, between relevant economic variables within and between the sub-sectors. The interaction between different sub-sectors can be treated using so-called input-output analysis, which is a model description of how commodities flow between sectors. Elasticities and input-output coefficients are calculated using regression analysis based on historical data. The energy supply side in the system is given less attention and is often limited to include a description of average investment and operating costs of different supply technologies. An underlying assumption in macroeconomic models is that the state of the economy is in equilibrium. It can be argued that this is a questionable assumption, because economic equilibrium is very rarely the case in the real world. At least it takes some time to reach equilibrium from the starting point. The high dependence of historical data in macroeconomic is also sometimes subject to critics, because historical relationships might not always be valid in the future. For example, ENPEP model was developed by International Atomic Energy Agency (IAEA), Austria, and ENERPLAN model (economic and simulation model) was developed by Tokyo Energy Analysis Group (Japan) [3]. A third approach that should be mentioned in this context is the use of system dynamics in energy system models. System dynamics is a tool for developing general mathematical simulation models for different kinds of processes (e.g. technical, biological or economic processes). Stocks, flows and feedback loops are the building blocks in a system dynamics model. The flexibility of this modeling concept makes it suitable for modeling technical and economic relationships in combination. Both relationships are indeed present in the development of energy systems. System dynamics models are not dependent on historical data to the same extent as macroeconomic models, and can also simulate systems that are not in equilibrium. The difference between optimization and simulation models is another characteristic that is important to be aware of. An optimization model tries to find the best possible solution to a specified problem based on maximization or minimization of an objective function. Optimal production plans or system expansion plans are often found using optimization models. Operations research and linear programming are optimization techniques that are very often used in system engineering models. Macroeconomic models tend to use nonlinear

optimization algorithms. Simulation models, on the other hand, try to predict the behavior of a system based on a set of assumptions, without necessarily searching for optimal solutions. System dynamics models are based on a pure simulation approach. There is no clear distinction between optimization and simulations models, and models are very often a combination, i.e. one part of the system is optimized, while the rest is simulated. Traditionally total energy system optimization models have often been applied in energy planning on a national level. However, the international trend of deregulating energy markets reduces the relevance of direct national energy planning.
2. Problem Definition: Energy is a driving engine for development. It is one of the basic factors to improve quality of life and to achieve the goals of the sustainable development. The policies of the electricity and energy sector aim at the optimum utilization of the primary energy resources. This will ensure timely supply of electrical energy in capacities sufficient of foster the economic and social development. The demand for energy has increased tremendously to meet technological needs and changing lifestyles as well as population growth. Conventional energy resources are reaching their natural limits and development of new and renewable sources of energy has not yet reached an economically feasible level permitting their use as an alternative to conventional resources. Figure-1 will explain simplify give the energy problem.
Figure -1 defines the energy problem
Energy Sources: 1. Gasoline gives thermal energy to the different sectors. 2. Kerosene gives thermal energy to the different sectors. 3. Gas oil gives both electricity and thermal energy to the different sectors. 4. Fuel oil gives both electricity and thermal energy to the different sectors. 5. Coal oil gives thermal energy to the different sectors.
Page 4 of 20 Optimization Energy Model for Egypt

6. Butagas (LPG) gives thermal energy to the different sectors. 7. Natural gas gives both electricity and thermal energy to the different sectors. 8. Wind gives electricity to the electric-sector. 9. Hydropower gives electricity to the electric-sector. Sectors (energy demand): 1. Industrial-sector: needs both electricity and thermal energy. 2. Agriculture-sector: needs both electricity and thermal energy. 3. Transportation-sector: needs both electricity and thermal energy. But,
electricity can be neglected according to annual report of Electricity Corporation.
4. Residential & commercial sector: need both electricity and thermal energy. 5. Government & public sector: need only electricity. 6. Electric-sector: converts the electrical energy sources to electricity. Energy source can’t be used in any purpose when it is in a crude form. Each source must pass through the intermediate process. Some of source is lost during this process in form water vapor, deposits, and the other things. For example, in case of natural gas, the production amount of thermal energy is only 90% from the consumption amount of natural gas through a preparing and converting process. This percentage is called efficiency factor (see table-2) [8]. There are efficiency factor for thermal energy and electricity.
Source Efficiency factor to convert source to electric energy%
Efficiency factor to convert source to thermal energy%
Petroleum product 26.6 90 Coal 0 70
Natural gas 17.5 90 Wind 30.7 0 LPG 0 90
Hydroelectric 95 0 Table -2 shows efficiency factor for conversion of energy sources to final energy form
Pollution Problem: These days, protection and preservation of the environment is one of the most important issues for all scientists and specialists interested in analyzing the interactions between energy and environment and their impact on sustainable development (see figure-2).
Figure-.2 shows dangerous effects of co2
Page 5 of 20 Optimization Energy Model for Egypt
Page 6 of 20 Optimization Energy Model for Egypt
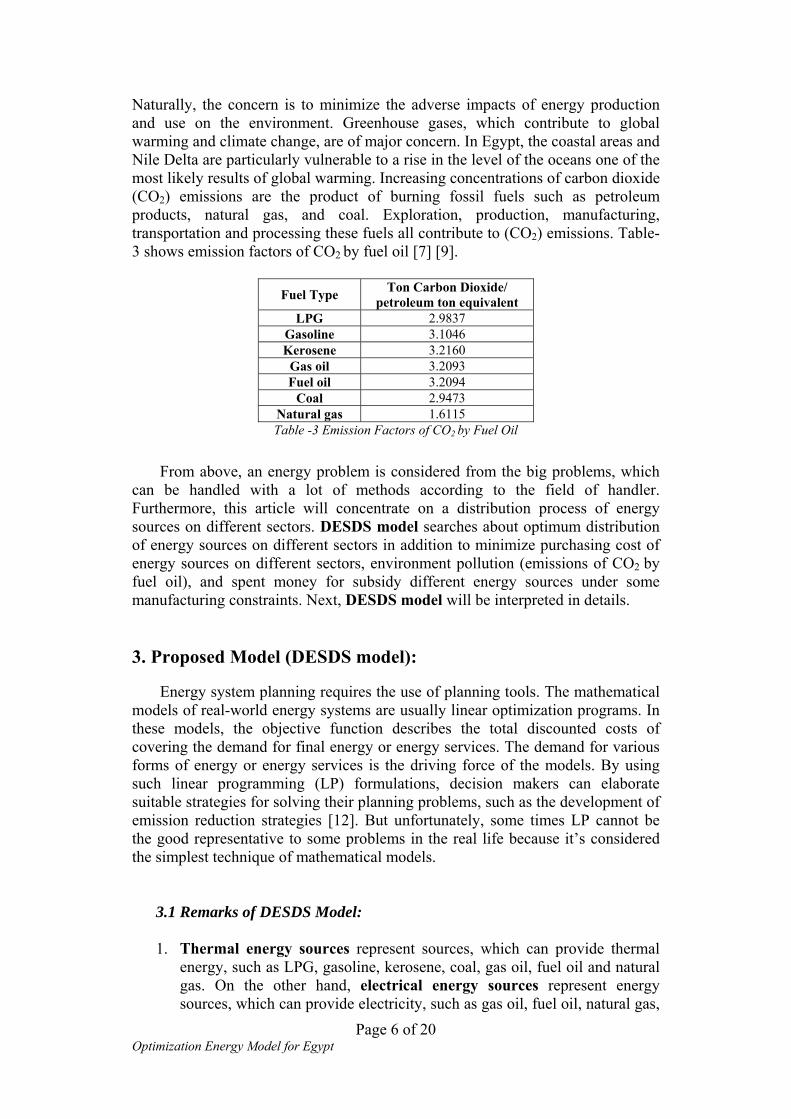
Naturally, the concern is to minimize the adverse impacts of energy production and use on the environment. Greenhouse gases, which contribute to global warming and climate change, are of major concern. In Egypt, the coastal areas and Nile Delta are particularly vulnerable to a rise in the level of the oceans one of the most likely results of global warming. Increasing concentrations of carbon dioxide (CO2) emissions are the product of burning fossil fuels such as petroleum products, natural gas, and coal. Exploration, production, manufacturing, transportation and processing these fuels all contribute to (CO2) emissions. Table-3 shows emission factors of CO2 by fuel oil [7] [9].
Fuel Type Ton Carbon Dioxide/ petroleum ton equivalent
LPG 2.9837 Gasoline 3.1046 Kerosene 3.2160
Gas oil 3.2093 Fuel oil 3.2094
Coal 2.9473 Natural gas 1.6115 Table -3 Emission Factors of CO2 by Fuel Oil
From above, an energy problem is considered from the big problems, which can be handled with a lot of methods according to the field of handler. Furthermore, this article will concentrate on a distribution process of energy sources on different sectors. DESDS model searches about optimum distribution of energy sources on different sectors in addition to minimize purchasing cost of energy sources on different sectors, environment pollution (emissions of CO2 by fuel oil), and spent money for subsidy different energy sources under some manufacturing constraints. Next, DESDS model will be interpreted in details. 3. Proposed Model (DESDS model): Energy system planning requires the use of planning tools. The mathematical models of real-world energy systems are usually linear optimization programs. In these models, the objective function describes the total discounted costs of covering the demand for final energy or energy services. The demand for various forms of energy or energy services is the driving force of the models. By using such linear programming (LP) formulations, decision makers can elaborate suitable strategies for solving their planning problems, such as the development of emission reduction strategies [12]. But unfortunately, some times LP cannot be the good representative to some problems in the real life because it’s considered the simplest technique of mathematical models.
3.1 Remarks of DESDS Model:
1. Thermal energy sources represent sources, which can provide thermal energy, such as LPG, gasoline, kerosene, coal, gas oil, fuel oil and natural gas. On the other hand, electrical energy sources represent energy sources, which can provide electricity, such as gas oil, fuel oil, natural gas,

Page 7 of 20 Optimization Energy Model for Egypt
wind and hydroelectric. Moreover, some energy sources can provide electricity and thermal energy such as gas oil, fuel oil and natural gas.
2. The gathered data aren’t in suitable form because of the difference
between the units for each source, such as the petroleum products with metrics tons and natural gas with cubic meters. A price was related to the unit of each source. So that, we are in need to make all units unified in one general unit which is petroleum ton equivalent (PTE).
3. Costs in DESDS model are evaluated in L.E/ petroleum ton equivalent. 4. Electric-sector is considered as supply element and demand element at the
same time, because it supplies the different sectors with electricity according to its needs, and it demands also electrical energy sources to be converted to electricity.
5. DESDS model observes an energy problem from simple viewpoint. Therefore, some economic factors are ignored such that exporting, and importing.
3.2 Assumptions of DESDS Model:
There are some assumptions which are needed for building the model, as follows:
1. Thermal energy sources have equal opportunity in satisfying the needs of different sectors from the thermal energy sources.
2. Electric sector is considered a unique source of electricity. With another way, any sector is taking its needs of electricity directly from electric sector.
3.3 Index of DESDS Model: Sets of model are divided mainly into two basic sets. The first set I represents an index for all energy sources, which is divided into three subsets I1, I2, and I3. On the other hand, the second set J stands for an index of different sectors, which also is divided into two subsets J1, and J2. I : Set of all energy sources. I = {1… 9} J : Set of different sectors. J = {1… 5} I1: Subset of I for energy sources which can give electricity. I2: Subset of I for energy sources which can give thermal energy. I3: Subset of I for energy sources which can provide both thermal and
electrical energy. J1: Subset of J for different sectors which needs thermal energy. J2: Subset of J for different sectors which needs electricity.
3.4 Decision Variables of DESDS Model:
There are two types of decision variables. The first type (parameters) has constant values, which will be given in model. On the other hand, the second type
Page 8 of 20 Optimization Energy Model for Egypt
(decision variables) will take its values after solving the model. Next, parameters and decision variables will be shown in details.
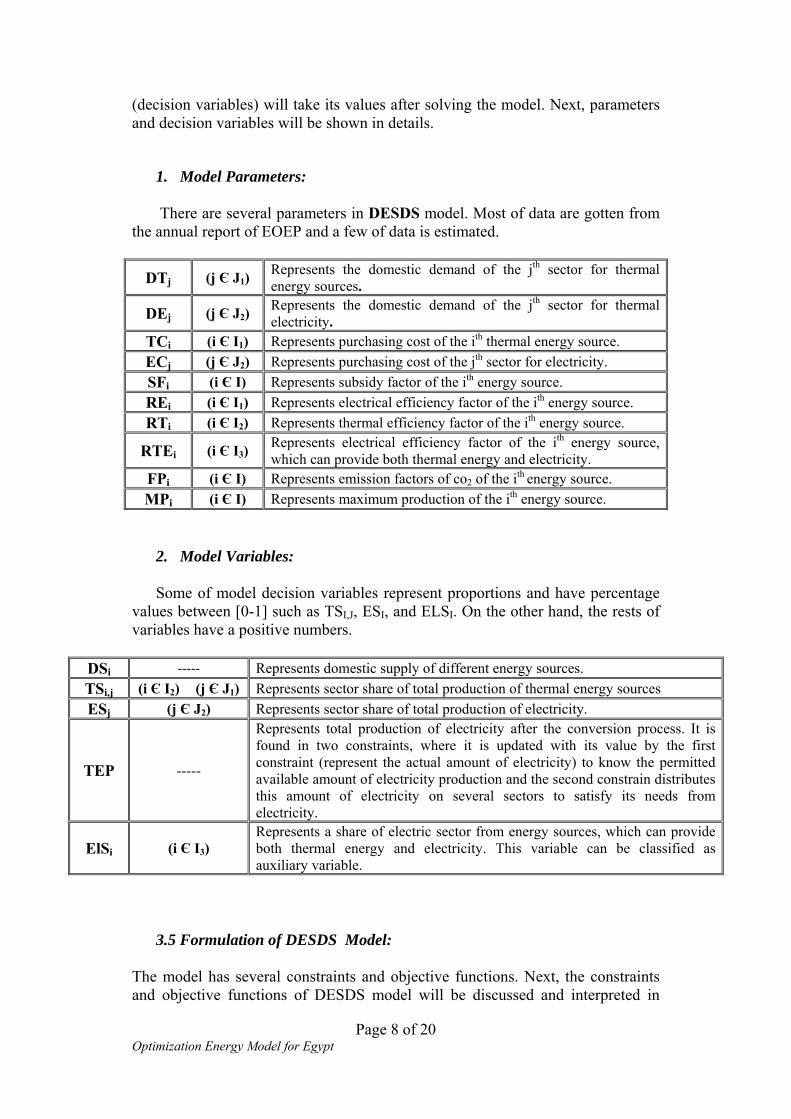
1. Model Parameters: There are several parameters in DESDS model. Most of data are gotten from the annual report of EOEP and a few of data is estimated.
DTj (j Є J1) Represents the domestic demand of the jth sector for thermal energy sources.
DEj (j Є J2) Represents the domestic demand of the jth sector for thermal electricity.
TCi (i Є I1) Represents purchasing cost of the ith thermal energy source. ECj (j Є J2) Represents purchasing cost of the jth sector for electricity. SFi (i Є I) Represents subsidy factor of the ith energy source. REi (i Є I1) Represents electrical efficiency factor of the ith energy source. RTi (i Є I2) Represents thermal efficiency factor of the ith energy source.
RTEi (i Є I3) Represents electrical efficiency factor of the ith energy source, which can provide both thermal energy and electricity.
FPi (i Є I) Represents emission factors of co2 of the ith energy source. MPi (i Є I) Represents maximum production of the ith energy source.
2. Model Variables:
Some of model decision variables represent proportions and have percentage values between [0-1] such as TSI,J, ESI, and ELSI. On the other hand, the rests of variables have a positive numbers.
DSi ----- Represents domestic supply of different energy sources. TSi,j (i Є I2) (j Є J1) Represents sector share of total production of thermal energy sources ESj (j Є J2) Represents sector share of total production of electricity.
TEP -----
Represents total production of electricity after the conversion process. It is found in two constraints, where it is updated with its value by the first constraint (represent the actual amount of electricity) to know the permitted available amount of electricity production and the second constrain distributes this amount of electricity on several sectors to satisfy its needs from electricity.
ElSi (i Є I3) Represents a share of electric sector from energy sources, which can provide both thermal energy and electricity. This variable can be classified as auxiliary variable.
3.5 Formulation of DESDS Model:
The model has several constraints and objective functions. Next, the constraints and objective functions of DESDS model will be discussed and interpreted in
details according to our previous knowledge with the energy problem, index of model, parameters, and decision variables.
1. Model Constraints: In general, model constraints mean that a restriction on objective functions values. Furthermore, objective functions can’t achieve without satisfying all constraints. Next, model constraints will be discussed in details, as follows:
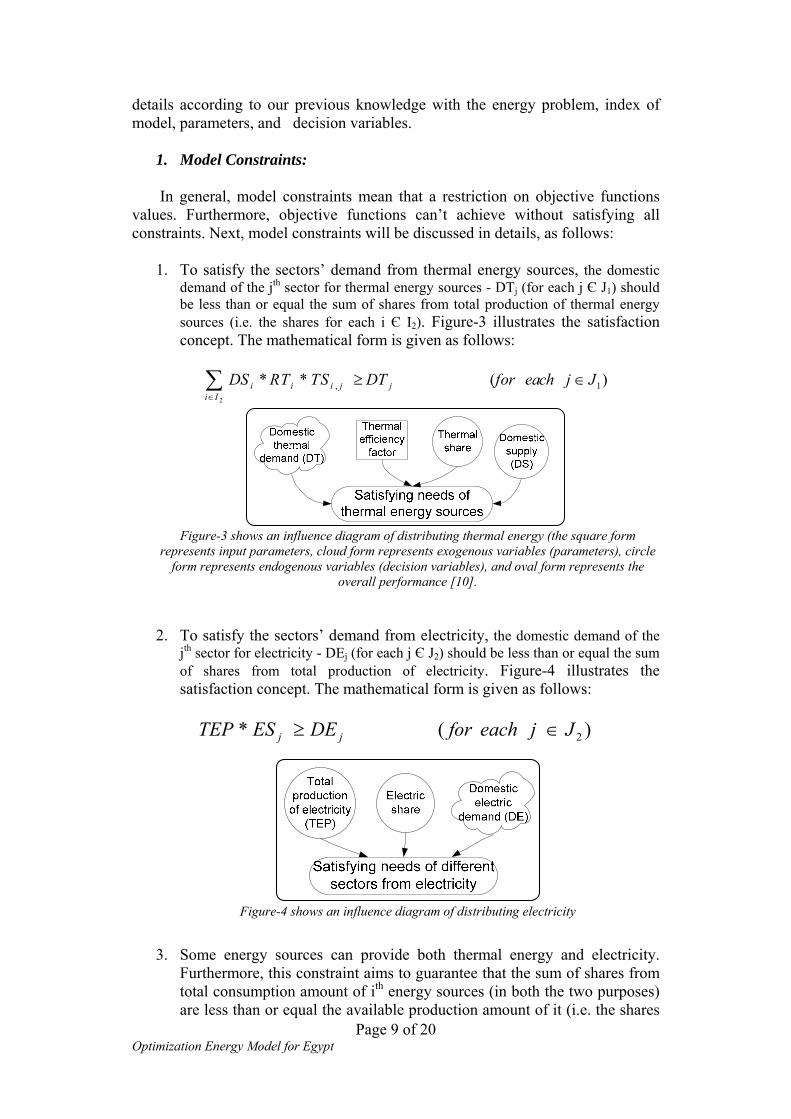
1. To satisfy the sectors’ demand from thermal energy sources, the domestic demand of the jth sector for thermal energy sources - DTj (for each j Є J1) should be less than or equal the sum of shares from total production of thermal energy sources (i.e. the shares for each i Є I2). Figure-3 illustrates the satisfaction concept. The mathematical form is given as follows:
Page 9 of 20 Optimization Energy Model for Egypt
) 2
, 1* * (i i i j ji I
DS RT TS DT for each j J∈
≥ ∈∑
Figure-3 shows an influence diagram of distributing thermal energy (the square form
represents input parameters, cloud form represents exogenous variables (parameters), circle form represents endogenous variables (decision variables), and oval form represents the
overall performance [10].
2. To satisfy the sectors’ demand from electricity, the domestic demand of the
jth sector for electricity - DEj (for each j Є J2) should be less than or equal the sum of shares from total production of electricity. Figure-4 illustrates the satisfaction concept. The mathematical form is given as follows:
)(* 2JjeachforDEESTEP jj ∈≥
Figure-4 shows an influence diagram of distributing electricity
3. Some energy sources can provide both thermal energy and electricity. Furthermore, this constraint aims to guarantee that the sum of shares from total consumption amount of ith energy sources (in both the two purposes) are less than or equal the available production amount of it (i.e. the shares
for each i Є I3). From above, ELSi, TSi,j have values between 0 and 1. The mathematical form is given as follows:
)(1 3,
1
IieachforTSELSJj
jii ∈≤+∑∈
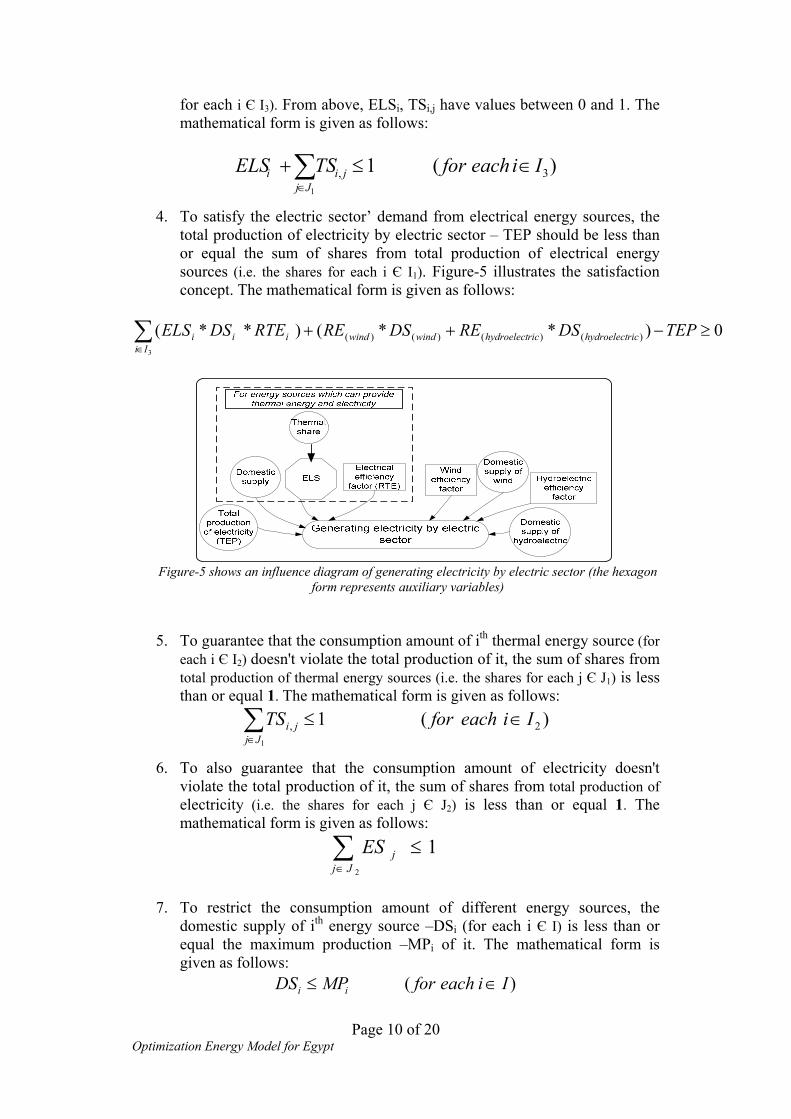
4. To satisfy the electric sector’ demand from electrical energy sources, the total production of electricity by electric sector – TEP should be less than or equal the sum of shares from total production of electrical energy sources (i.e. the shares for each i Є I1). Figure-5 illustrates the satisfaction concept. The mathematical form is given as follows:
0)**()**( )()()()(
3
≥−++∑∈
TEPDSREDSRERTEDSELS richydroelectrichydroelectwindwindIi
iii
Figure-5 shows an influence diagram of generating electricity by electric sector (the hexagon
form represents auxiliary variables) 5. To guarantee that the consumption amount of ith thermal energy source (for
each i Є I2) doesn't violate the total production of it, the sum of shares from total production of thermal energy sources (i.e. the shares for each j Є J1) is less than or equal 1. The mathematical form is given as follows:
∑∈
∈≤1
)(1 2,Jj
ji IieachforTS
6. To also guarantee that the consumption amount of electricity doesn't violate the total production of it, the sum of shares from total production of electricity (i.e. the shares for each j Є J2) is less than or equal 1. The mathematical form is given as follows:
∑∈
≤2
1Jj
jES
7. To restrict the consumption amount of different energy sources, the
domestic supply of ith energy source –DSi (for each i Є I) is less than or equal the maximum production –MPi of it. The mathematical form is given as follows:
)( IieachforMPDS ii ∈≤
Page 10 of 20 Optimization Energy Model for Egypt

8. To void negative values for the values of decision variables, all variables should be greater than or equal zero. In addition, this constraint is called negativity constraint.
0,,,, , ≥ijjii ELSESTSTEPDS
2. Objective Functions:
From above, DESDS model has mainly three objective functions as follows:
1. Objective function of total cost: Each sector needs thermal energy sources or/and electricity. Furthermore, this objective function aims to minimize purchasing cost of energy sources on different sectors. Figure -6 illustrates the objective function of total cost.
Figure-6 shows an influence diagram of total cost objective function
Objective function of total cost consists of two basic parts: • firstly, purchasing cost of PTE of ith thermal energy source for satisfying
needs of different sectors:
∑∈ 2
*Ii
ii DSTC
• Secondly, purchasing cost of PTE of electricity for satisfying jth sector’
demand:
jj ESTEPEC **Jj 2
∑∈
The final mathematical form is given as follows:
F1: ∑ ∑∈ ∈
+2 2
***Ii
jjJj
ii ESTEPECDSTC
2. Pollution objective function: aims to minimize a dangerous of CO2 emissions of ith energy source (for each i Є I) for protecting the environment. Figure-7 illustrates the main idea of this objective function. The mathematical form is given as follows:
F2: ∑∈Ii
ii DSFP *
Page 11 of 20 Optimization Energy Model for Egypt

Figure-7 shows an influence diagram of pollution objective function
3. Subsidy objective function: The government is presenting a lot of subsidy on different energy sources for reducing its price on a domestic consumer. As a matter of fact, subsidy money is considered as load on the government and the national income. For these reasons, subsidy objective function aims to minimize the subsidy government for ith energy source (for each i Є I). The mathematical form is given as follows:
∑∈Ii
ii DSSF * F3:
3.6 General Formulation of DESDS Model:
:Objectives
∑ ∑∈ ∈
+2 2
***Ii
jjJj
ii ESTEPECDSTCMinimize
∑∈Ii
ii DSFPMinimize *
∑∈Ii
ii DSSFMinimze *
Subject to
2
, 1* * (i i i j ji I
)DS RT TS DT for each j J∈
≥ ∈∑
)(* 2JjeachforDEESTEP jj ∈≥
)(1 3,1
IieachforTSELSJj
jii ∈≤+∑∈
0)**()**( )()()()(3
≥−++∑∈
TEPDSREDSRERTEDSELS richydroelectrichydroelectwindwindIi
iii
∑∈
∈≤1
)(1 2,Jj
ji IieachforTS
Page 12 of 20 Optimization Energy Model for Egypt

∑∈
≤2
1Jj
jES
)( IieachforMPDS ii ∈≤
0,,,, , ≥ijjii ELSESTSTEPDS
3.7 Input Data: [6] Now after explaining DESDS model in details, we can use a real life data to implement the model. The main source of input data is Egyptian Organization of Energy Planning (EOEP). In addition, this input data is the values of DESDS model parameters. Next, the input data (the parameters of DESDS model) will be given, as follows:
1. In DESDS model, the cost is divided into two main types: • Thermal cost (TCi): represents purchasing cost of PTE of thermal
energy sources (see, table-4).
Source Thermal cost (000’L.E/
000’petroleum ton equivalent) LPG 225
Gasoline 246.9 Kerosene 234.94
Coal 225.987 Gas oil 226.4 Fuel oil 176.904
Natural gas 150.651 Wind ----
Hydroelectric ---- Table-4 represents the cost of thermal energy sources
• Electric cost (ECi): represents a purchasing cost of electricity from electric sector. Moreover, the sectors get the electricity with different costs .In real life, electricity is evaluated by kilowatt hours (k.w.h), where the one petroleum ton equivalent = 4474.273 k.w.h (see, table-5).
Sector Electric cost (000'L.E /
000’petroleum ton equivalent ) Industry 593.74 Transport ----
Residential/Commercial 834.004 Agriculture 512.75
Government/Public 100.895 Table-5 represents electric cost
Page 13 of 20 Optimization Energy Model for Egypt

Page 14 of 20 Optimization Energy Model for Egypt
2. Available and maximum amount (MPi) of different energy sources will be given in (table-7).
Source Available amount of energy sources
Maximum amount of energy sources
LPG 1,864,625 2,613,625 Gasoline 1,360,580 2,500,580 Kerosene 1,109,800 1,536,800
Coal 39,000 45,000 Gas oil 5,892,848 8,000,848 Fuel oil 5,261,404 661,404
Natural gas 18,390,000 19,390,000 Wind 12,000 12,000
Hydroelectric 2,997,000 5,997,000 Table-6 represents the available and maximum amount of different energy source
3. Some sectors need thermal energy, electricity or both. The sectors’
demands of thermal energy sources and electricity will be given in table-7.
Sector Thermal Demand (DTj)
Electricity Demand (DEj)
Industry 11622658 2088000 Transport 9634690 0
Residential/Commercial 4071075 2162000 Agriculture 845000 212000
Government/Public 0 18210074 Table-7 represents the sectors’ demands of thermal energy sources and electricity
4. The government subsidy factor on different energy sources will be given
in table-8. Source Subsidy Factor (SFi) LPG 80
Gasoline 70.2 Kerosene 75.1
Coal 100.91 Gas oil 76.12 Fuel oil 78.2
Natural gas 100.3 Wind 100
Hydroelectric 105.5 Table-8 represents the amount of subsidy
Now, the model can be rewritten again with previous data input. Furthermore, the appendix will consist of the model with this data input.
3.8 Output analysis:
The solution method which was used in solving the model will be discussed in details in the appendix. Now, the values of decision variables will be introduced and handled next as follow:

Page 15 of 20 Optimization Energy Model for Egypt
1. Table-9 will be shown the values of DSi variable. Source Domestic supply LPG 1,864,625
Gasoline 2,500,580 Kerosene 1,536,800
Coal 39,000 Gas oil 8,000,848 Fuel oil 6,661,404
Natural gas 19048.019 Wind 12,000
Hydroelectric 5,997,000 Table-9 represents the values of DSi variable
2. The share of each sector from thermal energy sources will be shown also
in table-10. These values were resulted by multiplying the DSi and TSi,j for each source and each sector.
Source Industry Transport Agriculture Residential
&commercial Electric
LPG 1175,561.66 ----- ----- 1107,082.34 -----
Gasoline ----- 2,500,580 ----- ----- ----- Kerosene ----- 1,047,427.2 389,372.8 ----- -----
Coal 39,000 ----- ----- ----- ----- Gas oil ----- 1560,165.36 552,058.512 ----- 5896,624.976 Fuel oil ----- 5603,956.56 ----- ----- 657,447.42
Natural gas 11,711,560 ----- ----- 3,412,640 4,265,800 Table-10 represents the share of each sector from thermal energy sources
3. Total production of electricity is the value of TEP variable, where TEP =
8,191,067 petroleum ton equivalent. Share of each sector from electricity will be shown in table-11. These values were resulted by multiplying the DSi and ESi for each source and sector.
Sector Share of electricity
Industry 2,088,722.1 Residential &commercial 2,162,442.8
Agriculture 2,121,486.4 Government& Public 1,818,416.9
Table-11 represents the share of each sector from electricity
4. Consumption amount of electrical energy sources for producing the
electricity will be shown in table-12.
Source Electric sector Gas oil 5,760,610.56 Fuel oil 795,198.308
Natural gas 4,265,800 Wind 12,000
hydroelectric 5,997,000 Table-12 represents the consumption amount of electrical energy sources

Page 16 of 20 Optimization Energy Model for Egypt
5. Objective functions: f1= 46,099,803,000 L.E, f2 = 96,136,190 emissions of CO2, f3 = 4,145,052,000 L.E, and TEP = 8,191,067 petroleum ton equivalent.
Conclusion: Energy plays a vital role in the entire world. For that, this article interested in energy problem and making survey on energy models. Unfortunately, a few models in Egypt interested in energy problem. In addition, most energy models are simulation models. Main source of data model is annual report of EOEP. After solving DESDS model by using a real life data, DESDS model achieved in all cases results better than annual report of EOEP, as follows:
1. Reducing usage of petroleum products. 2. Achieving more protection of environment through decreasing of mission
amount of CO2. 3. All consumption amounts of different energy sources didn't violate its
available amount of it. Here the model was solved with an assumption that all parameters are deterministic. Some data is estimated because it isn’t available. For that, there are possibilities to make an extension of this study by solving the model again under uncertainty (stochastic programming /or fuzzy optimization). Nowadays, uncertainty should be taken in consideration at studying several matters such as economics, (renewable /or nonrenewable) energy sources, and stock market.
References [1] Ad J. Seebregts1, Gary A. Goldstein2, Koen Smekens1, “Energy/Environmental Modeling with the MARKAL Family of Models”, 1 Energy Research Centre of the Netherlands (ECN), Policy Studies unit, P.O. Box 1, 1755 ZG Petten, The Netherlands, e-mail: [email protected] 2 International Resources Group Ltd., 1211 Connecticut Ave. NW, Suite 700, Washington, DC 20036, USA, e-mail: [email protected] [2] Anthony Brooke, David Kendrick, Alexander Meeraus, and Ramesh Raman, “GAMS A User Guide”, Development Corporation, December 98GAMS. [3] Beeck. N. V., “Classification of Energy Models”, Communicated by dr.ing. W. van Groenendaal, Tilburg University & Eindhoven University of Technology, May 1999. http://greywww.kub.nl:2080/greyfiles/few/1999/doc/777.pdf#search='energy%20models%20777'

[4] Botterud. A., “ Energy System Models”, NTNU Norwegian University of Science and Technology, Faculty of Electrical Engineering and Telecommunications, Department of Electrical Power Engineering, January 2001. [5] David L. Greene, “Long-Term Energy Scenario Models: A Review of the Literature and Recommendations”, National Transportation Research Center Oak Ridge National Laboratory, February 28, 2001. http://www.ott.doe.gov/pdfs/models2050.pdf#search='models%202050energy' [6] EOEP (Egyptian Organization of Energy Planning). Annual report, (2000/2001). [7] ETSAP (2001) ETSAP website: http://www.ecn.nl/unit_bs/etsap [8] Hassan. Y, “Optimum Distribution of Energy Sources on Different Sectors”. Military Technical College (1980). [9] IPCC (Intergovernmental Panel on Climate Change), GHG Inventory Guidelines, 1996. [10] John Wiley and Sons, "System and Decision Making" in a management science approach, university of Canterbury, Christchurch, New Zealand, May 1995. [11] Ralph E. Steuer, "Multiple Criteria Optimization: Theory, Computation, and Application", College of Business Administration, University of Georgia. [12] Tobias Canz, “Fuzzy Linear Programming in DSS for Energy System Planning”, IIASA “International Institute for Applied Systems Analysis” A-2361 Laxenburg Austria, E-Mail: [email protected], WP-96-132, November 1996. http://www.iiasa.ac.at/Publications/Documents/WP-96-132
Appendix From above, DESDS model is formulated by multiobjective nonlinear programming (MONLP). MONLP has a several methods for dealing with multiobjective problems. Moreover, we can notice that the coefficients of all objective function haven't the same magnitude. For that, we tried to bring all objective functions coefficients into the same order magnitude. Firstly, the normalization concept (L1-norm) will be used to unite magnitude (measure unit) for all objective functions coefficients [11]. Normalization will convert the coefficients into percentages where
L1-norm = 1
vv
and ⎥⎦
⎤⎢⎣
⎡= ∑
−
n
iivv
11
Page 17 of 20 Optimization Energy Model for Egypt
Now, we can select anyone of multiobjective methods. Weighting Method (WM) will be used to deal with the model [11]. In general, weights are assigned to the objective functions according to importance of each objective function of decision maker (DM). For this reason, the weights of objective functions in DESDS model will be assumed to be equal for the three objectives, where w1= w2 = w3 = 1/3. The optimal solution will be obtained by solving the following weighting problem formulated:
Minimize w f(x) = ∑ wi fi(x) =
k
i 1(1)
Subject to x ∈X,
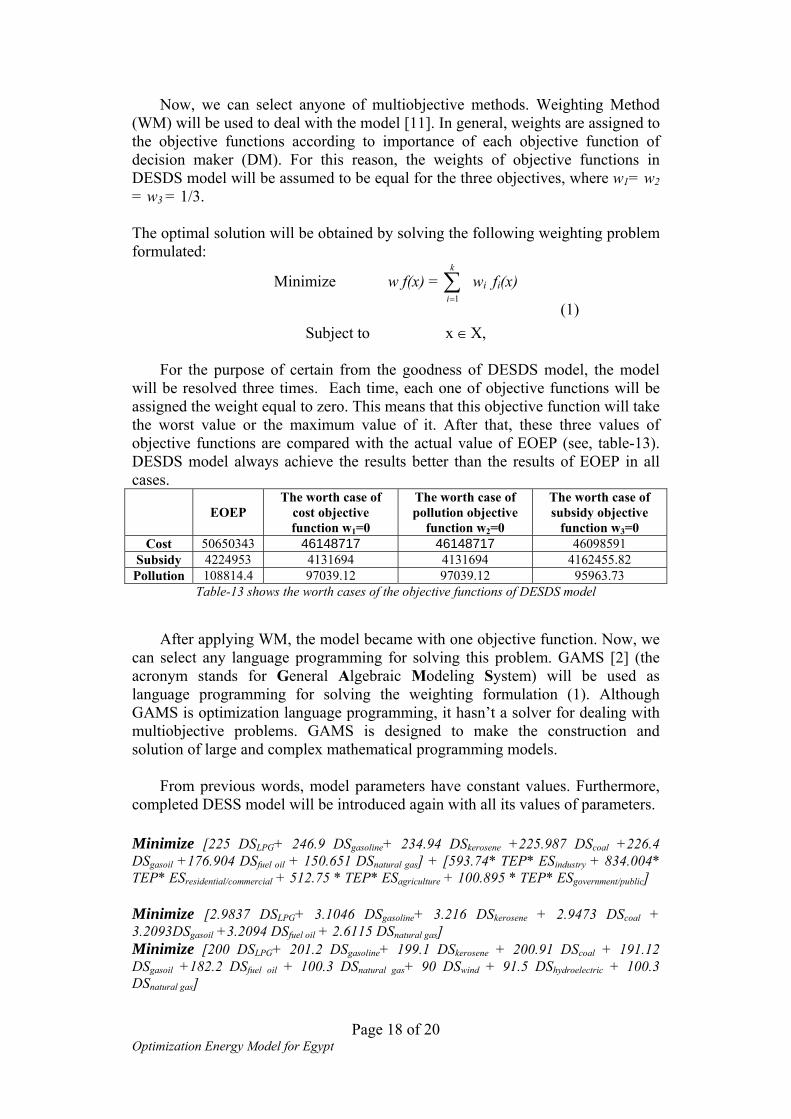
For the purpose of certain from the goodness of DESDS model, the model will be resolved three times. Each time, each one of objective functions will be assigned the weight equal to zero. This means that this objective function will take the worst value or the maximum value of it. After that, these three values of objective functions are compared with the actual value of EOEP (see, table-13). DESDS model always achieve the results better than the results of EOEP in all cases.
EOEP The worth case of
cost objective function w1=0
The worth case of pollution objective
function w2=0
The worth case of subsidy objective
function w3=0 Cost 50650343 46148717 46148717 46098591
Subsidy 4224953 4131694 4131694 4162455.82 Pollution 108814.4 97039.12 97039.12 95963.73
Table-13 shows the worth cases of the objective functions of DESDS model
After applying WM, the model became with one objective function. Now, we can select any language programming for solving this problem. GAMS [2] (the acronym stands for General Algebraic Modeling System) will be used as language programming for solving the weighting formulation (1). Although GAMS is optimization language programming, it hasn’t a solver for dealing with multiobjective problems. GAMS is designed to make the construction and solution of large and complex mathematical programming models. From previous words, model parameters have constant values. Furthermore, completed DESS model will be introduced again with all its values of parameters. Minimize [225 DSLPG+ 246.9 DSgasoline+ 234.94 DSkerosene +225.987 DScoal +226.4 DSgasoil +176.904 DSfuel oil + 150.651 DSnatural gas] + [593.74* TEP* ESindustry + 834.004* TEP* ESresidential/commercial + 512.75 * TEP* ESagriculture + 100.895 * TEP* ESgovernment/public] Minimize [2.9837 DSLPG+ 3.1046 DSgasoline+ 3.216 DSkerosene + 2.9473 DScoal + 3.2093DSgasoil +3.2094 DSfuel oil + 2.6115 DSnatural gas] Minimize [200 DSLPG+ 201.2 DSgasoline+ 199.1 DSkerosene + 200.91 DScoal + 191.12 DSgasoil +182.2 DSfuel oil + 100.3 DSnatural gas+ 90 DSwind + 91.5 DShydroelectric + 100.3 DSnatural gas]
Page 18 of 20 Optimization Energy Model for Egypt
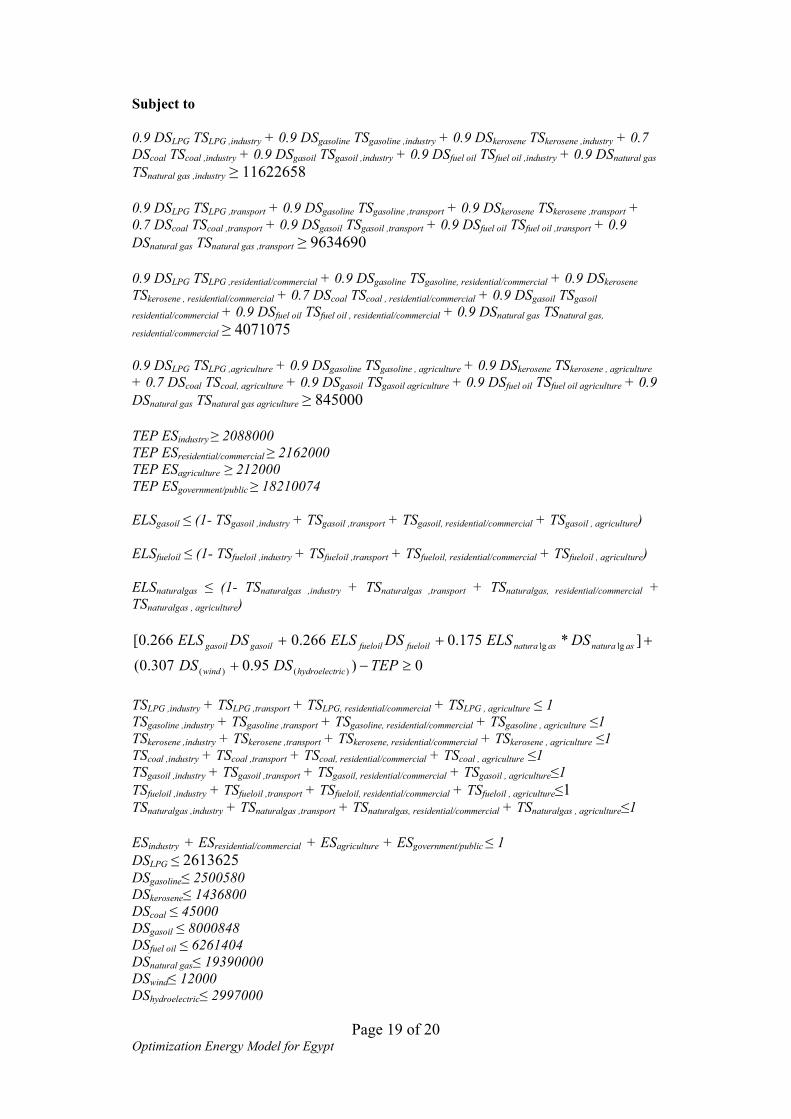
Subject to 0.9 DSLPG TSLPG ,industry + 0.9 DSgasoline TSgasoline ,industry + 0.9 DSkerosene TSkerosene ,industry + 0.7 DScoal TScoal ,industry + 0.9 DSgasoil TSgasoil ,industry + 0.9 DSfuel oil TSfuel oil ,industry + 0.9 DSnatural gas TSnatural gas ,industry ≥ 11622658 0.9 DSLPG TSLPG ,transport + 0.9 DSgasoline TSgasoline ,transport + 0.9 DSkerosene TSkerosene ,transport + 0.7 DScoal TScoal ,transport + 0.9 DSgasoil TSgasoil ,transport + 0.9 DSfuel oil TSfuel oil ,transport + 0.9 DSnatural gas TSnatural gas ,transport ≥ 9634690 0.9 DSLPG TSLPG ,residential/commercial + 0.9 DSgasoline TSgasoline, residential/commercial + 0.9 DSkerosene TSkerosene , residential/commercial + 0.7 DScoal TScoal , residential/commercial + 0.9 DSgasoil TSgasoil
residential/commercial + 0.9 DSfuel oil TSfuel oil , residential/commercial + 0.9 DSnatural gas TSnatural gas,
residential/commercial ≥ 4071075 0.9 DSLPG TSLPG ,agriculture + 0.9 DSgasoline TSgasoline , agriculture + 0.9 DSkerosene TSkerosene , agriculture + 0.7 DScoal TScoal, agriculture + 0.9 DSgasoil TSgasoil agriculture + 0.9 DSfuel oil TSfuel oil agriculture + 0.9 DSnatural gas TSnatural gas agriculture ≥ 845000 TEP ESindustry ≥ 2088000 TEP ESresidential/commercial ≥ 2162000 TEP ESagriculture ≥ 212000 TEP ESgovernment/public ≥ 18210074 ELSgasoil ≤ (1- TSgasoil ,industry + TSgasoil ,transport + TSgasoil, residential/commercial + TSgasoil , agriculture) ELSfueloil ≤ (1- TSfueloil ,industry + TSfueloil ,transport + TSfueloil, residential/commercial + TSfueloil , agriculture) ELSnaturalgas ≤ (1- TSnaturalgas ,industry + TSnaturalgas ,transport + TSnaturalgas, residential/commercial + TSnaturalgas , agriculture)
0)95.0307.0(
]*175.0266.0266.0[
)()(
lglg
≥−+
+++
TEPDSDS
DSELSDSELSDSELS
richydroelectwind
asnaturaasnaturafueloilfueloilgasoilgasoil
TSLPG ,industry + TSLPG ,transport + TSLPG, residential/commercial + TSLPG , agriculture ≤ 1 TSgasoline ,industry + TSgasoline ,transport + TSgasoline, residential/commercial + TSgasoline , agriculture ≤1 TSkerosene ,industry + TSkerosene ,transport + TSkerosene, residential/commercial + TSkerosene , agriculture ≤1 TScoal ,industry + TScoal ,transport + TScoal, residential/commercial + TScoal , agriculture ≤1 TSgasoil ,industry + TSgasoil ,transport + TSgasoil, residential/commercial + TSgasoil , agriculture≤1 TSfueloil ,industry + TSfueloil ,transport + TSfueloil, residential/commercial + TSfueloil , agriculture≤1 TSnaturalgas ,industry + TSnaturalgas ,transport + TSnaturalgas, residential/commercial + TSnaturalgas , agriculture≤1 ESindustry + ESresidential/commercial + ESagriculture + ESgovernment/public ≤ 1 DSLPG ≤ 2613625 DSgasoline≤ 2500580 DSkerosene≤ 1436800 DScoal ≤ 45000 DSgasoil ≤ 8000848 DSfuel oil ≤ 6261404 DSnatural gas≤ 19390000 DSwind≤ 12000 DShydroelectric≤ 2997000
Page 19 of 20 Optimization Energy Model for Egypt

0,,,,3212 , ≥ijjii ELSESTSTEPDS
Outputs of GAMS Program: The output from GAMS is produced on one file, which is designed to be read by human. It can of course be printed, erased or archived like any other file. The output file is the only place where GAMS can write results for inspection or for use by other programs. Figure-9 shows the final report of GAMS output file. To void the large domain of problem, 000’L.E / 000’petroleum ton is used for simplification as the measure unit of model variables.
Figure-9 shows the final report of GAMS output file
Page 20 of 20 Optimization Energy Model for Egypt
Copyright © 2022 FDOKUMEN