Chapter 3 Control Rights, Pyramids and Expropriation of State-owned Listed Enterprises
31
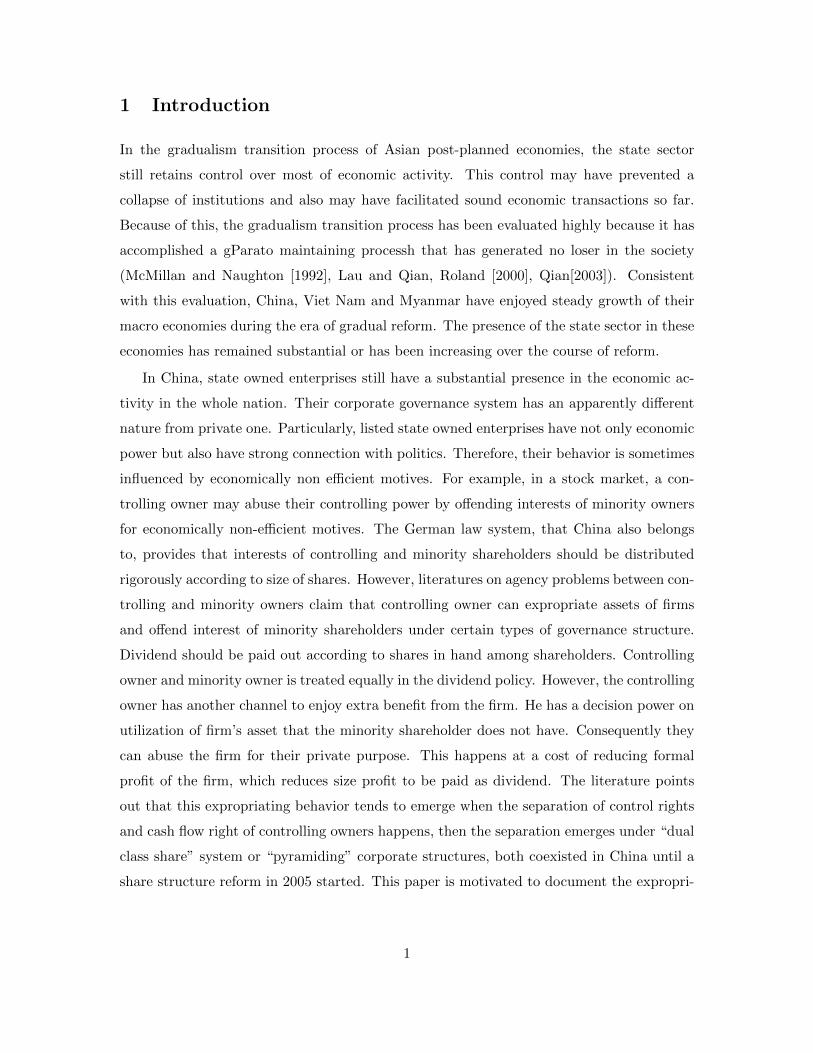
Chapter 3 Control Rights, Pyramids and Expropriation of State-owned Listed Enterprises: Evidence from the dual class share reform in China * Mariko Watanabe † March, 2011 Abstract Literatures of corporate governance claim that expropriation by controlling owner towards the listed firm emerges when separation of cash flow and control rights exist, and that the separation emerges when dual class shares or pyramiding corporate structures exist. In China, dual class share and pyramiding coexisted in listed companies until the dual share reform was implemented since 2005. Exploiting this good exogenous change in institution, which only resolve dual class share structure and pyramids remained, this paper tested how much the pyramiding allow the controlling owner to expropriate listed firm. Results show that: the larger control right and the smaller cash flow right are, size of expropriation becomes bigger; the expropriation is apparent for state controlled listed companies, though private owned firms do not. This is because level of control right ratio is higher than private though state firms’s control-cash slow right ratio is larger than private one. While the dual class share reform weakened the power to expropriate, separation still remains and generates expropriation. Structural estimation shows the size of expropriation to be 7 to 8 per cent of total asset at mean. If the gone share one voteh principle were to be realized, asset inflation could be reduced by 13 percent. Keywords: corporate governance, concentrated owner, expropriation, state owned en- terprises, China JEL classification Number: G32, G34 ,K22, P31, P34 * This paper is originally titled “Separation of Cash Flow and Control Rights of State Owned Listed Enterprises in China: Channels of Expropriation after the Discriminated Share Reform,” IDE Discussion Paper No.224. The author thanks to Sinofin Data company for data compiling. Author is responsible for any errors that may remain. † (Corresponding Author) Institute of Developing Economies, 3-2-2 Wakaba, Mihama, Chiba 261-8545, Japan. Phone: +81-3-299-9579, Fax: +81-3-299-9763, E-mail: [email protected]
Transcript of Chapter 3 Control Rights, Pyramids and Expropriation of State-owned Listed Enterprises
Chapter 3
Control Rights, Pyramids and Expropriation
of
State-owned Listed Enterprises:
Evidence from the dual class share reform in China∗
Mariko Watanabe†
March, 2011
Abstract
Literatures of corporate governance claim that expropriation by controlling ownertowards the listed firm emerges when separation of cash flow and control rights exist, andthat the separation emerges when dual class shares or pyramiding corporate structuresexist. In China, dual class share and pyramiding coexisted in listed companies until thedual share reform was implemented since 2005. Exploiting this good exogenous changein institution, which only resolve dual class share structure and pyramids remained, thispaper tested how much the pyramiding allow the controlling owner to expropriate listedfirm. Results show that: the larger control right and the smaller cash flow right are, sizeof expropriation becomes bigger; the expropriation is apparent for state controlled listedcompanies, though private owned firms do not. This is because level of control rightratio is higher than private though state firms’s control-cash slow right ratio is largerthan private one. While the dual class share reform weakened the power to expropriate,separation still remains and generates expropriation. Structural estimation shows thesize of expropriation to be 7 to 8 per cent of total asset at mean. If the gone share onevoteh principle were to be realized, asset inflation could be reduced by 13 percent.
Keywords: corporate governance, concentrated owner, expropriation, state owned en-terprises, ChinaJEL classification Number: G32, G34 ,K22, P31, P34
∗This paper is originally titled “Separation of Cash Flow and Control Rights of State Owned ListedEnterprises in China: Channels of Expropriation after the Discriminated Share Reform,” IDE DiscussionPaper No.224. The author thanks to Sinofin Data company for data compiling. Author is responsible forany errors that may remain.†(Corresponding Author) Institute of Developing Economies, 3-2-2 Wakaba, Mihama, Chiba 261-8545,
Japan. Phone: +81-3-299-9579, Fax: +81-3-299-9763, E-mail: [email protected]
1 Introduction
In the gradualism transition process of Asian post-planned economies, the state sector
still retains control over most of economic activity. This control may have prevented a
collapse of institutions and also may have facilitated sound economic transactions so far.
Because of this, the gradualism transition process has been evaluated highly because it has
accomplished a gParato maintaining processh that has generated no loser in the society
(McMillan and Naughton [1992], Lau and Qian, Roland [2000], Qian[2003]). Consistent
with this evaluation, China, Viet Nam and Myanmar have enjoyed steady growth of their
macro economies during the era of gradual reform. The presence of the state sector in these
economies has remained substantial or has been increasing over the course of reform.
In China, state owned enterprises still have a substantial presence in the economic ac-
tivity in the whole nation. Their corporate governance system has an apparently different
nature from private one. Particularly, listed state owned enterprises have not only economic
power but also have strong connection with politics. Therefore, their behavior is sometimes
influenced by economically non efficient motives. For example, in a stock market, a con-
trolling owner may abuse their controlling power by offending interests of minority owners
for economically non-efficient motives. The German law system, that China also belongs
to, provides that interests of controlling and minority shareholders should be distributed
rigorously according to size of shares. However, literatures on agency problems between con-
trolling and minority owners claim that controlling owner can expropriate assets of firms
and offend interest of minority shareholders under certain types of governance structure.
Dividend should be paid out according to shares in hand among shareholders. Controlling
owner and minority owner is treated equally in the dividend policy. However, the controlling
owner has another channel to enjoy extra benefit from the firm. He has a decision power on
utilization of firm’s asset that the minority shareholder does not have. Consequently they
can abuse the firm for their private purpose. This happens at a cost of reducing formal
profit of the firm, which reduces size profit to be paid as dividend. The literature points
out that this expropriating behavior tends to emerge when the separation of control rights
and cash flow right of controlling owners happens, then the separation emerges under “dual
class share” system or “pyramiding” corporate structures, both coexisted in China until a
share structure reform in 2005 started. This paper is motivated to document the expropri-
1
ation takes place if the separation of cash flow and control rights exists in the listed firms
in China utilizing newly enumerated data on dual class share and pyramiding structures,
and cash flow and control rights of whole listed companies in China for 2006 and 2007.
After the Chinese government saw several economic scandals that controlling owners
pumped up resources of listed companies then led them to bankruptcy, she initiated a
reform so called “discriminate share structure” of listed companies that aimed to “defrost”
circulation of locked shares in 2005. Thanks to this reform, many listed companies were
able to dissolve the dual class share structure that had been inducing “expropriation”
and illegally occupying assets of others by controlling owners. However, the pyramidal
ownership structure still remains, and it allows a controlling owner to expropriate a listed
company. This paper follows the course of the literature on agency problems between
controlling owners and minority owners, including the work of Fama and Jensen (1983) ,
Hart(2001), La Porta, de-Silanes and Shleifer (1998) , Bebchuk(1999), Bebchuk et.al (2000),
Classen, Djankov, Fan and Lang (1999), Claessen, Djankov and Lang (2000), Faccio, Lang
and Yong (2001), and Fan, Wong and Zhang (2005). The work presented here is new to
above in the following ways: (1) This paper sets a behavioral model of expropriation by
controlling owners over listed companies. Estimation is done based on this structural model.
It allows us to check whether or not the expropriation occurred due to inflating total assets.
(2) The structural model allows us to obtain structural parameters that measures size of
expropriation. Newly complied data that can distinguish control right and cash flow right
enabled us to estimate the parameters. (3) The first main finding is that expropriation via
account receivables is very apparent for the state owned listed firms through the period
of 1998 to 2007 that our data covers. (4) The second is that the larger control right and
the smaller cash flow right, then the expropriation become bigger. That means the state
owned listed enterprises show expropriation via the separation, though privately owned
listed firms do not. (5) The third finding is that expropriation via the separation still exists
even for a sample that already completed “discriminated share reform” because pyramiding
structure still pertains. The paper is organized as follows: Section 2 includes description of
literature on agency problems between controlling and minority owners and the institutional
setting of China’s equity market and corporate governance systems over listed companies.
A simple theoretical model of expropriation by controlling owners is presented in Section 3
2
along with an empirical test hypothesis. Description of data and estimation strategies are
given in Section 4, and Section 5 includes discussion of results. Conclusions are provided in
Section 6.
2 Literature and Chinese Institutions
2.1 Literature on the Agency Problem of Concentrated Ownership
“Expropriating” behavior of concentrated owners is the main topic of recent corporate
governance literature. Classic literature on corporate governance and ownership (such as
Jensen and Meckling, 1976) has analyzed agency problems between management and own-
ers. Recent literature has changed their focus onto structure among owners and conflicts
of interests between owners. By observing data, we can find that distribution of ownership
is strikingly different among economies. In the United States or Japan, most shares are
diversified, and it rarely happens to recognize a concentrated owner with more than a ten
percent share in a listed company. However, in most developing economies, each listed com-
pany has one concentrated owner or block of shareholders who can exercise overwhelming
power over the management, and influences other minority shareholders. Agency problems
between concentrated and minority shareholders may easily emerge. If both concentrated
and minority shareholders focus on maximizing only monetary benefit from the company,
their interests coincides with each other, and a conflict of interest between them will not
emerge. However, such conflict of interest does occur often in the real world. Theoretical
literature on corporate governance argues that this happens when a controlling owner has
the motive to extract private (non-monetary) as well as monetary benefits under certain
types of corporate or share structures (Bebchuk [1999], Bebchuk et.al [2000], Claessen et.al
[2000]CFaccio, Lang and Yong [2001]).
The literature argues that the controlling owner will be able to exert stronger controlling
power (control right) over the decision making of the listed company relative to the size of
the shares (cash flow right) in their hand. This phenomenon is called “separation of cash
flow and control rights”, and researchers in the literature claim that this separation may
emerge via the following three types of structure (Bebchuk et.al [2000]):
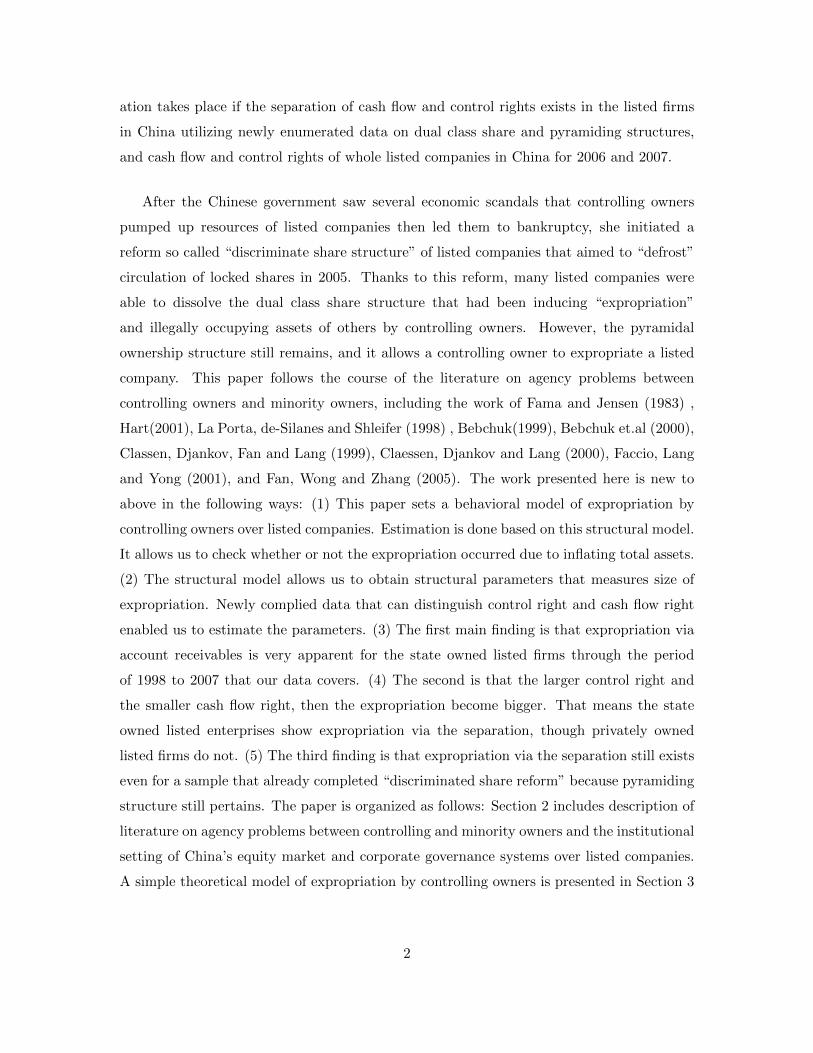
(a) Pyramiding. Formation of a corporate group by investing vertically, such as when
3
a holding company invests in its subsidiary and the subsidiary invests in its subsidiary
and lets the second or third subsidiary list their shares and finances for the whole group.
Pyramiding is common in Asian countries and is typical of large ethnic Chinese firms. It
is the most commonly used mechanism for concentrating control in a controlling minority
structure (La Porta, de-Silanes and Shleifer [1999]). Enumeration rule of cash flow right and
control right under this structure are defined following La Porta, et.al (1999) and Bebchuk
et.al(2000) as in Figure 1.
Figure 1: Cash Flow and Control Rights under Pyramiding
Source:Author.
(b) Cross-Holding. Shares are cross-held between member companies of a group in
which the controlling right of a core or holding company in the group may be increased by
each share. This is a famous and typical Japanese ownership style but rare in other Asian
economies.
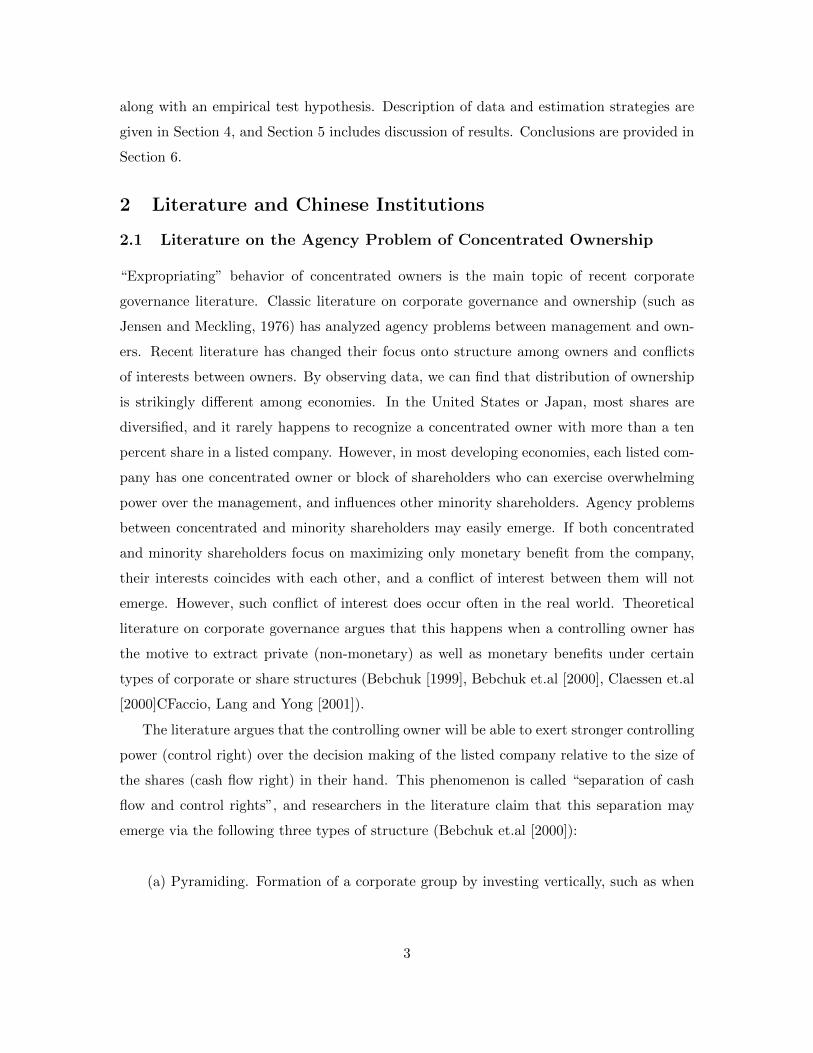
(c) Dual Class Share. Heterogeneous shares such as common and preferred stocks
4
Figure 2: Cash Flow and Control Rights under Dual Class Share
Source:Author.
coexist and give the controlling owner a stronger controlling right than the cash flow right
in their hand (Figure 2). This is common in countries with French laws such as many
Latin American economies. Most corporate laws in countries influenced by the German law
system, including China, prohibit the listed companies from violation of the one share one
vote principle. However, dual share systems existed in China until very recently.
2.2 Separation of Control and Cash Flow Rights in China
Institutional settings in China related to the controlling owner of listed firms are described
in this section.
2.2.1 Concentrated Ownership Structure
Table 1 presents an international comparison of the distribution of control rights. The
largest owners of listed companies in China hold about 35 percent of shares at mean and
5
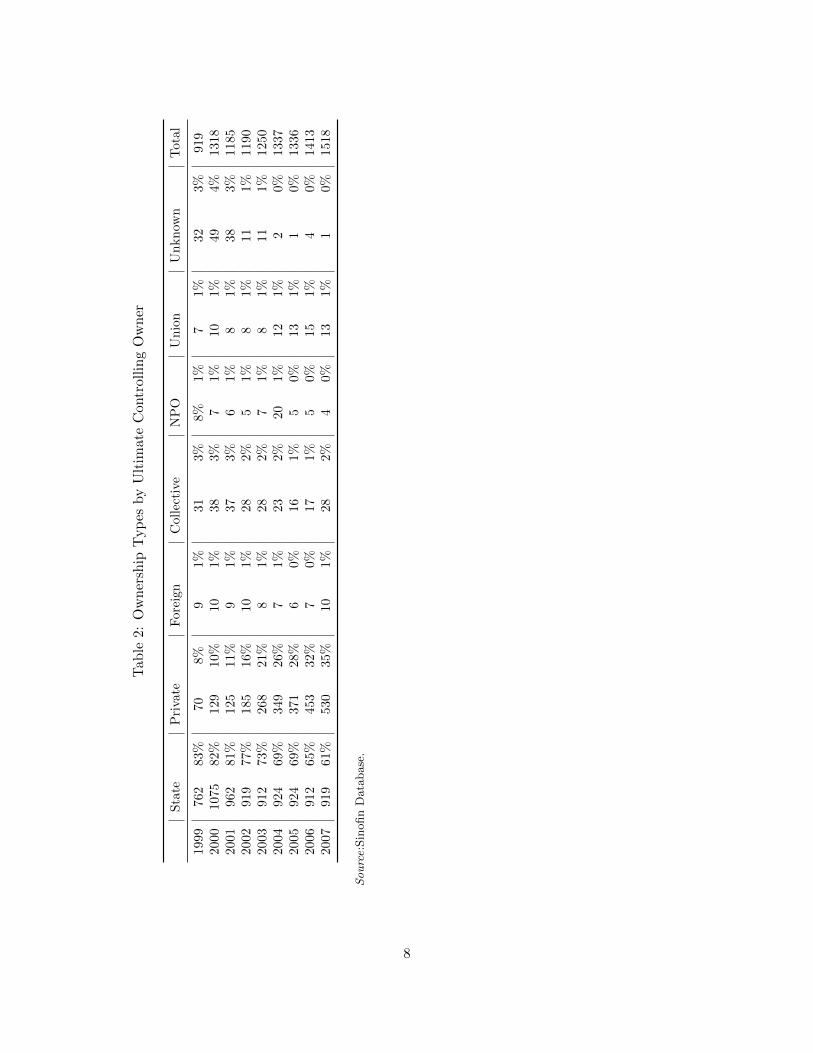
median. The second largest owners only hold six percent at median and nine percent at
mean. These statistics reveal that China belongs to a gconcentrated ownership structureh
group together with France and/or Germany, and is different from a highly gdispersed own-
ershiph group such as the United States, United Kingdom, or Japan. This “concentrated
ownership structure” is easily subject to controlling owners violating the interests of minor-
ity shareholders. In terms of ownership type, the state sector is the largest controller; this
was 60 to 80 percent during 1999 to 2007 (Table 2).
6

Tab
le1:
Con
centr
ated
Con
trol
lin
gO
wn
er:
Inte
rnat
ion
al
Com
pari
son
cou
ntr
yye
arn
o.of
Larg
est
share
hold
er2n
dL
arg
est
3rd
larg
est
com
pan
ym
inm
edia
nm
ean
max
min
med
ian
mea
nm
ax
min
med
ian
mea
nm
ax
Ch
ina
2000
1318
2.1
%44.6
%45.2
%88.6
%0.0
%5.3
%8.4
%42.4
%0.0
%1.9
%3.3
%24.8
%20
0715
180.8
%34.3
%36.0
%95.0
%0.1
%6.4
%8.9
%42.4
%0.0
%2.5
%3.6
%24.3
%F
ran
ce-
-0.0
%20.0
%29.4
%72.7
%0.0
%5.9
%6.4
%19.7
%0.0
%3.4
%3.0
%8.5
%G
erm
any
-37
20.0
%57.0
%49.6
%100.0
%0.0
%0.0
%2.9
%45.2
%0.0
%0.0
%0.6
%32.0
%U
K-
207
3.4
%9.9
%14.4
%78.9
%3.0
%6.6
%7.3
%26.3
%3.0
%5.2
%6.0
%25.7
%U
nit
edS
tate
sN
YS
E-
1309
0.0
%5.4
%8.5
%92.9
%0.0
%0.0
%3.7
%40.1
%0.0
%0.0
%1.8
%25.0
%N
asd
aq-
2831
0.0
%8.6
%13.0
%99.5
%0.0
%0.0
%5.7
%48.8
%0.0
%0.0
%3.0
%24.1
%
Source:C
hin
a:
Sin
ofin
Data
base
.O
ther
s:O
EC
D,
Corp
ora
teG
over
nance
:A
Surv
eyof
OE
CD
Countr
ies,
2001,
Table
1.1
7
Tab
le2:
Ow
ner
ship
Typ
esby
Ult
imat
eC
ontr
olli
ng
Ow
ner
Sta
teP
riva
teF
ore
ign
Coll
ecti
veN
PO
Un
ion
Un
kn
own
Tota
l
1999
762
83%
708%
91%
31
3%
8%
1%
71%
32
3%
919
2000
1075
82%
129
10%
10
1%
38
3%
71%
10
1%
49
4%
1318
2001
962
81%
125
11%
91%
37
3%
61%
81%
38
3%
1185
2002
919
77%
185
16%
10
1%
28
2%
51%
81%
11
1%
1190
2003
912
73%
268
21%
81%
28
2%
71%
81%
11
1%
1250
2004
924
69%
349
26%
71%
23
2%
20
1%
12
1%
20%
1337
2005
924
69%
371
28%
60%
16
1%
50%
13
1%
10%
1336
2006
912
65%
453
32%
70%
17
1%
50%
15
1%
40%
1413
2007
919
61%
530
35%
10
1%
28
2%
40%
13
1%
10%
1518
Source:S
inofin
Data
base
.
8
2.2.2 Dual Class Share in China: Discriminated Shares
In most civil law, particularly German law related economies, companies are prohibited
from violating the “one share one vote principle”. Company law in China also includes
similar provisions. However, for listing companies, the government imposes a restriction on
the circulation of particular types of shares.
The Chinese government has been reluctant to circulate control rights of firms, par-
ticularly those of large companies like listed ones, because the government was afraid of
they are out of control under transitional nature of institutions. In the early 1990’s, the
government introduced discriminative control over the shares of listed companies. Shares
were classified into: (1) state shares, (2) corporate shares (state owned corporation and
other corporate shares), (3) individual shares, and (4) foreign shares. Each classification
sets different control from the government. State shares (1) and state corporate shares (a
part of (2)) are called “state owned shares.” In the late 1990’s, when massive numbers of old
type SOE’s started being transformed into “limited share corporations” (corporations un-
der company law), the government demanded that “state owned shares” be the controlling
shares, ideally more than 50 percent but at least 25 percent. State shares ((1)) were allowed
to be sold and bought between state and private sectors but this also required permission of
the State Asset Committee in addition to decisions at board meetings inside the company.
State shares ((1)) and corporate shares ((2)) were prohibited from being transacted on the
security market according to several administrative guidelines1.
2.2.3 Pyramiding in China
As in other economies in Asia, pyramiding is very prevalent in China. Listed companies
are often owned and controlled by intermediate companies called “holding companies” or
“jituan gongsi”(a direct translation is “group company”). Most listed companies have been
established in order to function as a financing channel for the corporate group or controlling
owner, particularly for the companies listed in the early period. Companies that run the
1Institutions were structured based on the following administrative documents: 1992 May,15th,“Procedure on Experiments to Introduce the Limited Share Company”, “Opinion on Introducing theShare Limited Company”. 1993 April, 22nd, “Provisional Ordinance on Management of Issuing and Trans-action of Share.” 1994 March, 11th “Provisional Procedure of Treatment of State Owned Shares in ShareLimited Company Experiments”. 1994, November 3rd,“Provisional Procedure of Treatment of State OwnedShares in Share Limited Company” (See, Nomura Capital Market Research 2008)
9
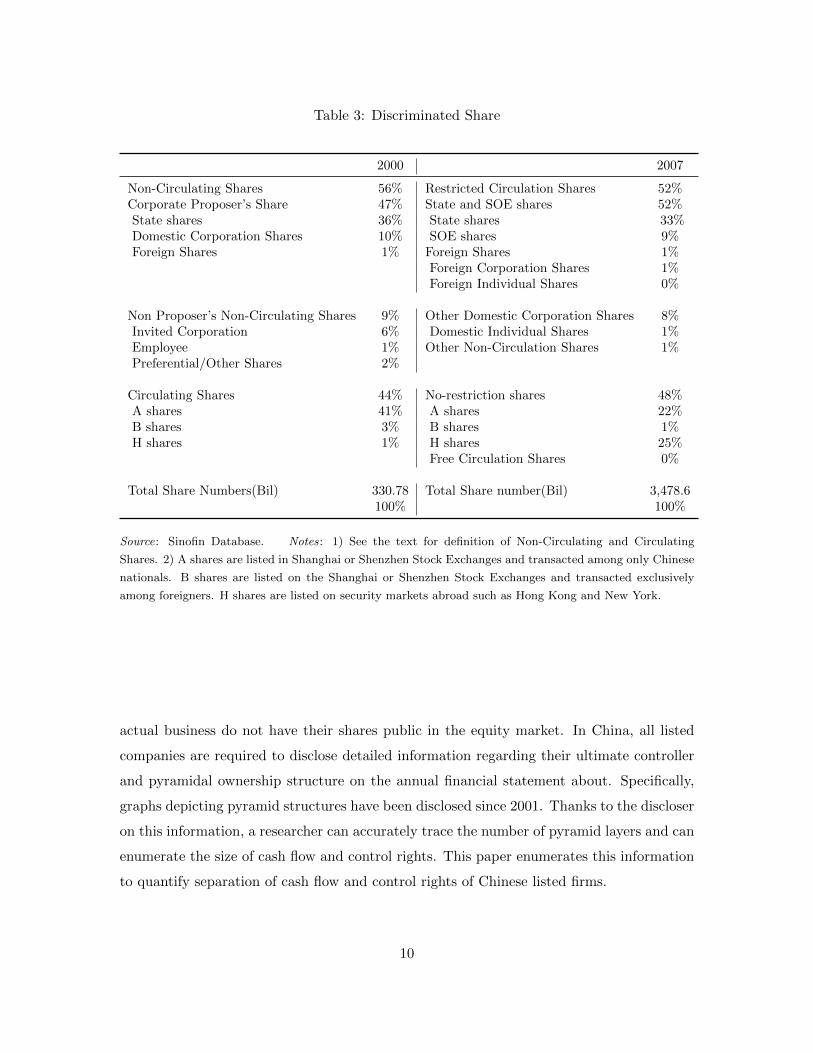
Table 3: Discriminated Share
2000 2007
Non-Circulating Shares 56% Restricted Circulation Shares 52%Corporate Proposer’s Share 47% State and SOE shares 52%State shares 36% State shares 33%Domestic Corporation Shares 10% SOE shares 9%Foreign Shares 1% Foreign Shares 1%
Foreign Corporation Shares 1%Foreign Individual Shares 0%
Non Proposer’s Non-Circulating Shares 9% Other Domestic Corporation Shares 8%Invited Corporation 6% Domestic Individual Shares 1%Employee 1% Other Non-Circulation Shares 1%Preferential/Other Shares 2%
Circulating Shares 44% No-restriction shares 48%A shares 41% A shares 22%B shares 3% B shares 1%H shares 1% H shares 25%
Free Circulation Shares 0%
Total Share Numbers(Bil) 330.78 Total Share number(Bil) 3,478.6100% 100%
Source: Sinofin Database. Notes: 1) See the text for definition of Non-Circulating and Circulating
Shares. 2) A shares are listed in Shanghai or Shenzhen Stock Exchanges and transacted among only Chinese
nationals. B shares are listed on the Shanghai or Shenzhen Stock Exchanges and transacted exclusively
among foreigners. H shares are listed on security markets abroad such as Hong Kong and New York.
actual business do not have their shares public in the equity market. In China, all listed
companies are required to disclose detailed information regarding their ultimate controller
and pyramidal ownership structure on the annual financial statement about. Specifically,
graphs depicting pyramid structures have been disclosed since 2001. Thanks to the discloser
on this information, a researcher can accurately trace the number of pyramid layers and can
enumerate the size of cash flow and control rights. This paper enumerates this information
to quantify separation of cash flow and control rights of Chinese listed firms.
10
2.2.4 Data on Pyramid Layer, Cash Flow and Control Rights of listed compa-nies in China
Research on the presence of separation among controlling and cash flow rights in China
are accumulating now. Teneve et.al (2002) tried to document and measures the size of
separation during the time when disclosure of information on the whole pyramidal structure
was not formally required. Based on their original survey to 257 firms it was found that listed
companies in the Shanghai Exchange, non-circulating shareholders, state, legal persons and
employees dispatched 72 out of 76 directors of surveyed companies. They claim that, if
this number can be regarded as a proxy of control rights, non-circulating shareholders held
95 percent of control rights, this in contrast to their cash flow share of 70 percent. They
asserted the existence of separation of control and cash flow rights. Fan, Wong and Zhang
(2005) were the first to document the number of pyramid layers for a sample of newly listed
companies. They also measured the size of control and cash flow rights based on the layer
structure. Their data shows that for about 60 percent of the firms that were going to issue
their shares for the first time, the number of pyramid layers was two on average. Pyramid
layers are thicker for privately controlled firms than for government controlled firms. The
ratio of cash-flow to control rights is higher for government controlled firms (.97) than for
privately controlled firms (.54).
Our data for this paper used includes exact figures cash flow and control rights infor-
mation. It is enumerated based on information of pyramidal ownership structures for the
all listed companies for the 2006 and 2007 (Table ??). The data shares a similar tendency
with above literature. The number of pyramids for privately controlled firms (2.5 at mean)
is larger than that of state controlling firms (2.4 at mean). The ratio of cash-flow to control
rights of privately controlled firms (.70 at mean, .76 at median) is lower than that of state
controlled firms (.90 at mean and 1 at median).
However, level of control right ratio, that directly determines power to expropriate,
is higher for the state owner listed enterprises (.39 at mean in 2007) than the privately
owned firms (.28 at mean). Literature on agency problems between controlling owners
and minority share holders has discussed agency problems among privately owned firms.
However, this agency problem may occur in state owned firms as well if there are private
benefits of controlling owners and the corporate structures mentioned above. Case studies
11

in China reveal that listed companies under the state sector have gone bankrupt as a result
of expropriation via accounts receivable. One example is given in the next section.
Table 4: Cash Flow Right, Control Right and Number of Pyramid Layers of all Listed Firms
Obs mean std. dev. min median max
2007 All Listed FirmsNumber of Pyramid Layers 1542 2.3 0.9 1 2 7Cash-flow Right 1542 0.33 0.17 0.01 0.30 1.0Control Rights 1542 0.38 0.16 0.05 0.37 1.0Cash-flow Right/Control Right 1542 0.84 0.24 0.06 1.0 1.0
2006 All listed firmsNumber of Pyramid Layers 1432 2.3 0.8 1 2 7Cash-flow Right 1431 0.32 0.17 0.01 0.30 0.99Control Rights 1432 0.38 0.15 0.07 0.36 0.99Cash-flow Right/Control Right 1431 0.83 0.25 0.05 1.0 1.0
2007 State Controlling FirmsNumber of Pyramid Layers 792 2.4 0.8 1 2 6Cash-flow Right 792 0.35 0.16 0.02 0.34 0.84Control Rights 792 0.39 0.15 0.05 0.39 0.84Cash-flow Right/Control Right 792 0.90 0.19 0.10 1.0 1.0Share of the largest owner 792 0.38 0.15 0.04 0.37 0.84
2007 Privately Controlling FirmsNumber of Pyramid Layers 361 2.5 0.9 1 2 7Cash-flow Right 361 0.23 0.14 0.01 0.20 0.78Control Rights 361 0.31 0.14 0.09 0.28 0.91Cash-flow Right/Control Right 361 0.70 0.27 0.06 0.76 1.00Share of the largest owner 361 0.30 0.13 0.05 0.27 0.78
2007 Reform Complete FirmsNumber of Pyramid Layers 1192 2.4 0.82 1 2 7Cash-flow Right 1192 0.31 0.16 0.06 0.29 0.84Control Rights 1192 0.37 0.15 0.05 0.36 0.91Cash-flow Right/Control Right 1192 0.83 0.24 0.01 1 1Share of the largest owner 1192 0.35 0.15 0.04 0.34 0.84
Source: Sinofin Database.
Notes: 1) 2007 data includes information for companies that were in preparation for listings but not yet
issuing shares. Therefore, for some corporation, control and cash flow rights are reported as 100 per cent
though regarded listed company. 2) The sample of state controlling and privately controlling firms does not
include all listed companies, but only the ones used in estimation are presented here.
12
2.3 Expropriation via Accounts Receivable: The Case of Jinan QingqiMotorcycle
Jinan Qingqi Motorcycle, a state controlled company under the Jinan Municipal City gov-
ernment, Shangdong Province, was the number one company in the motorcycle market of
China and one of the most active emerging companies in the 1990fs. In its annual report of
2001, the Jinan Qingqi Motorcycle, Co. Ltd. auditor announced that judgment regarding
a part of accounts receivable and loan guarantees toward the holding company of China
Qingqi Motorcycle Group Company, the controlling owner of the listed company, would
be withheld. The listed company focused on production of motorcycles, and it depended
on the China Qingqi Group Company, the holding company of the group and controlling
owner of the listed company, for purchase of materials or patented technology and sales of
goods. The listed company was heavily dependent on the holding company and in sales
reached 45 percent of the total (Jinan Qingqi Motorcycle Co. Ltd. 2000 Annual Report,
p. 14). In 2001, accounts receivable of the holding company totaled 2.47 billion RMB and
for the subsidiary company in the group .343 billion RMB. It reached 62 percent of total
assets, and total accounts receivable of the company were 63 percent of total assets. The
auditor asserted in the annual report in 2001 that there was little prospect that the accounts
receivable would be repaid until a substantial reconstruction of the holding company starts.
The auditor also claimed that the listed company had made a guarantee to the holding
company and subsidiaries in the group regarding bank loans amounting to 739.86 million
RMB; 471.57 million of this was in default by the end of 2001. The company turned deficits
for two years from 2000.
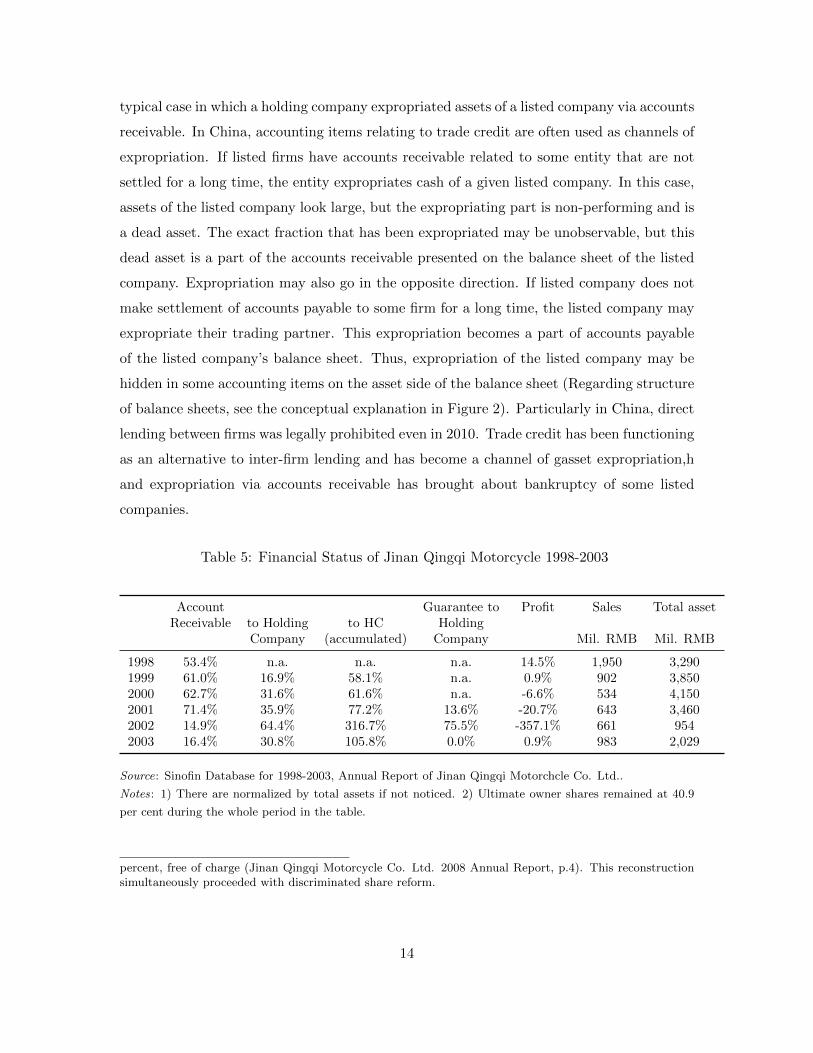
Table 5 presents the development of accounts receivable for the holding company as
well as profit, sales, and assets of Jinan Qingqi Motorcycle. The auditor’s claim ignited a
de facto bankruptcy process organized by the government. In 2003, The Jinan Municipal
City Government, the ultimate controller of the listed company, announced a commitment
to reduce the non-performing accounts receivable .6 to .8 billion RMB. This came to three
times the total assets of the listed company in 2002. The Jinan Government simultaneously
started to look for new investors who would merge the motorcycle production department
(Jinan Qingqi Motorcycle Co. Ltd., Annual Report 2003, pp.19-20)2 This incident is a
2Finally, the listed company sold out to state owned enterprises under the central government, the ChinaArmament Industry Group in 2008. Jinan Municipal Government sold all shares of the company, 40.9
13
typical case in which a holding company expropriated assets of a listed company via accounts
receivable. In China, accounting items relating to trade credit are often used as channels of
expropriation. If listed firms have accounts receivable related to some entity that are not
settled for a long time, the entity expropriates cash of a given listed company. In this case,
assets of the listed company look large, but the expropriating part is non-performing and is
a dead asset. The exact fraction that has been expropriated may be unobservable, but this
dead asset is a part of the accounts receivable presented on the balance sheet of the listed
company. Expropriation may also go in the opposite direction. If listed company does not
make settlement of accounts payable to some firm for a long time, the listed company may
expropriate their trading partner. This expropriation becomes a part of accounts payable
of the listed company’s balance sheet. Thus, expropriation of the listed company may be
hidden in some accounting items on the asset side of the balance sheet (Regarding structure
of balance sheets, see the conceptual explanation in Figure 2). Particularly in China, direct
lending between firms was legally prohibited even in 2010. Trade credit has been functioning
as an alternative to inter-firm lending and has become a channel of gasset expropriation,h
and expropriation via accounts receivable has brought about bankruptcy of some listed
companies.
Table 5: Financial Status of Jinan Qingqi Motorcycle 1998-2003
Account Guarantee to Profit Sales Total assetReceivable to Holding to HC Holding
Company (accumulated) Company Mil. RMB Mil. RMB
1998 53.4% n.a. n.a. n.a. 14.5% 1,950 3,2901999 61.0% 16.9% 58.1% n.a. 0.9% 902 3,8502000 62.7% 31.6% 61.6% n.a. -6.6% 534 4,1502001 71.4% 35.9% 77.2% 13.6% -20.7% 643 3,4602002 14.9% 64.4% 316.7% 75.5% -357.1% 661 9542003 16.4% 30.8% 105.8% 0.0% 0.9% 983 2,029
Source: Sinofin Database for 1998-2003, Annual Report of Jinan Qingqi Motorchcle Co. Ltd..
Notes: 1) There are normalized by total assets if not noticed. 2) Ultimate owner shares remained at 40.9
per cent during the whole period in the table.
percent, free of charge (Jinan Qingqi Motorcycle Co. Ltd. 2008 Annual Report, p.4). This reconstructionsimultaneously proceeded with discriminated share reform.
14

Figure 3: Channels of “Expropriation”
Source:Author.
2.4 Discriminated Share Reform since 2005
In the early 2000’s, defects of “discriminated shares” and the presence of large blocks of
concentrated owners, particularly in the background of state sectors in the stock market,
became apparent. Expropriation via inter-firm transactions as in the case of Jinan Qingqi as
well as various types of negative behavior by controlling owners became apparent. There was
misuse of cash collected from minority shareholders without their consent. In one extreme
case, dividend payments were paid in cash to shareholders immediately after a new increase
in capital where that of most controlling owners did not increase but was just collected from
minority shareholders. In this case, if the controlling owners had 60 percent of shares, they
automatically received 60 percent of the cash collected from minority shareholders. In order
to dissolve the unequal position of controlling and minority shareholders, and to realize the
principle of “one share, one vote, one price,” the government announced that it would take
steps to correct discrimination among the shares3.
Government reform demanded that each listed company negotiate among shareholders
regarding how to compromise the interests of circulating and the non-circulating share-
holders in order to allow non-circulating shares to circulate. Each listed companies held a
3Committee of Security Regulation China, “Guidance on Experiment on Reform Discriminated Share”in 29 May, 2005.
15
shareholder meeting and reached agreement on a scheme that would allow compensation
from non-circulated to circulating shareholders. In most cases, circulating share holders
were compensated by receiving additional shares free of charge. 66 percent of the reformed
company gave the shares held by non-circulated owners to circulated owners, and 15 per-
cent of the cases showed an increase in capital placed free of charge to circulating share
holders (Nomura Institute of Capital Market Research, 2007). Through negotiation, over
compensation schemes benefiting minority shareholders, the hidden legacy of past manage-
ment that had piled up in the accumulation of non-performing accounts receivable assets,
and a new scheme to write off non-performing assets, were discussed simultaneously.
In the empirical study reported below, a simple behavior model is developed to capture
expropriation behavior by inflating assets such as utilizing accounts receivable. Empirical
test are then done to test whether or not expropriation has actually occurred, particularly
after discriminated share reform was completed. Our data implies that privately controlled
firms have more pyramid layers and larger separation of control and cash-flow rights in
China. In the literature so far, few argues through which channel expropriation takes places.
Classens Djankov, Fan, and Lang (1999) regressed separation of control and cash flow rights
on market valuation change. However, they did not set a behavioral model. Expropriation
or private consumption of assets by controlling owners is to some extent traceable through
financial statements. Because listed companies cannot throw away money with no record,
these firms accomplish their negative behavior by hiding in some accounting items on the
financial statements that are used as channels of expropriation.
3 Empirical Framework
3.1 A Model of Expropriationh by Asset Inflation
Here, I present a behavioral model of this empirical study. A listed firm has two hetero-
geneous owners: controlling owner and minority owners. Manager of the firm completely
follows decision by the controlling owner. Though the corporate law of China provided
to maintain “one share one vote” principle, there is a difference in power influencing over
decision making on firm. Under this setting, controlling owner can “expropriate” the as-
set of listed firm for the private purpose of controlling owner. There exists informational
asymmetry between controlling owners and minority owners over decision by the controlling
16
owner.
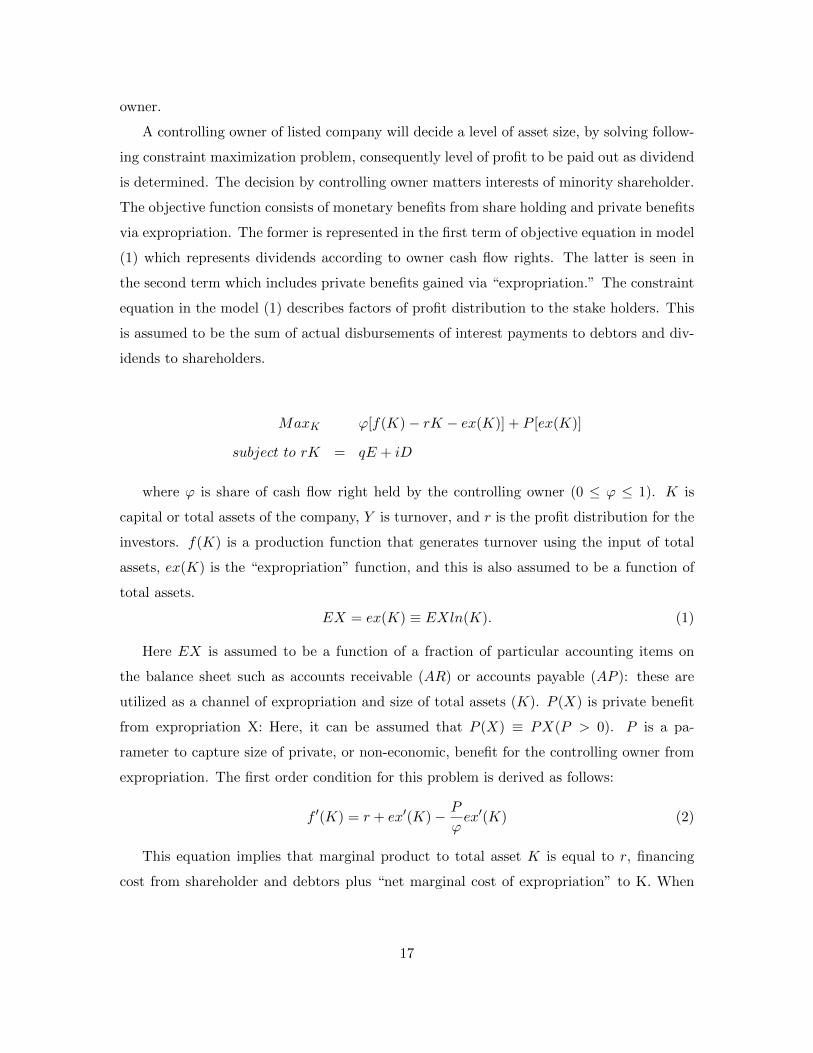
A controlling owner of listed company will decide a level of asset size, by solving follow-
ing constraint maximization problem, consequently level of profit to be paid out as dividend
is determined. The decision by controlling owner matters interests of minority shareholder.
The objective function consists of monetary benefits from share holding and private benefits
via expropriation. The former is represented in the first term of objective equation in model
(1) which represents dividends according to owner cash flow rights. The latter is seen in
the second term which includes private benefits gained via “expropriation.” The constraint
equation in the model (1) describes factors of profit distribution to the stake holders. This
is assumed to be the sum of actual disbursements of interest payments to debtors and div-
idends to shareholders.
MaxK ϕ[f(K) − rK − ex(K)] + P [ex(K)]
subject to rK = qE + iD
where ϕ is share of cash flow right held by the controlling owner (0 ≤ ϕ ≤ 1). K is
capital or total assets of the company, Y is turnover, and r is the profit distribution for the
investors. f(K) is a production function that generates turnover using the input of total
assets, ex(K) is the “expropriation” function, and this is also assumed to be a function of
total assets.
EX = ex(K) ≡ EXln(K). (1)
Here EX is assumed to be a function of a fraction of particular accounting items on
the balance sheet such as accounts receivable (AR) or accounts payable (AP ): these are
utilized as a channel of expropriation and size of total assets (K). P (X) is private benefit
from expropriation X: Here, it can be assumed that P (X) ≡ PX(P > 0). P is a pa-
rameter to capture size of private, or non-economic, benefit for the controlling owner from
expropriation. The first order condition for this problem is derived as follows:
f ′(K) = r + ex′(K) − P
ϕex′(K) (2)
This equation implies that marginal product to total asset K is equal to r, financing
cost from shareholder and debtors plus “net marginal cost of expropriation” to K. When
17

total asset is increased for expropriation benefit, it decreases size of profit that paid out as
dividend. Therefore, difference from gross benefit from expropriation (ex′f(K)) minus loss
and gain from expropriation (1 − Pϕ ex
′(K)) becomes net marginal cost of expropriation.
In this empirical exercise, how to set functional form of expropriation and production
functions is a key question. In order to check robustness of the claim that expropriation
and separation of cash flow right and control right, author employed two different forms of
expropriation function.
3.2 Expropriation via Accounts Receivable
The first specification takes a following rather strict assumption: (1) expropriation is done
via “accounts receivable” terms. (2) To capture the relationship, we assume that both
production function f (K) and expropriation function ex(K) takes the Cobb-Douglas form,
which is reasonably flexible. Under this assumption, f(K) ≡ aY lnK has a derivative of
Y/K, ex(K) ≡ bEXlnK has the derivative ex(K) on K as EX/K. As we assume that
expropriation is α per cent of accounts receivable (AR), expropriation can be formalized as
EX = αAR. (3)
Plugging equation (3) and Y/K as derivative of f(K) into equation (2), testable equa-
tions are derived as follows:
aY
K= r + ex′(K) − P
ϕ= r + bα
AR
K− Pbα
AR
ϕKY
K= β0r + β1
AR
K− β2
AR
ϕK+ ξit + εit (4)
where, β0 = 1/a, β1 = bα/a, β2 = Pbα/a. ϕ is cash flow right ratio of the controlling
owners. ξit is unobservable motivation to expropriate, and εit represents other unobservable
factors. Here, the first order condition implies following economic relationship: (1) If terms
with ex′(K) were statistically insignificant and only r is significant, the size of total assets
of the company would be at the socially efficient level. This would be free from any waste
for expropriation by the ultimate owner. (2) If the coefficients of ex’(K) , particularly β2,
were confirmed to be statistically significant, effective financial cost for the controlling owner
would be lowered, and the assets of the firm is excessively and inefficiently increased. In this
case, expropriation by the controlling owner emerges at a cost of the violation of minority
shareholderfs interests.
18

3.3 Expropriation due to Separation of Control and Cash-Flow Rights
The second specification takes more general form of expropriation by focusing on a relation-
ship that separation of control and cash flow rights allows expropriation out of firmfs assets
if private benefit exists. Literature related to agency problems of concentrated ownership
indicates that separation of control and cash flow rights allows a concentrated owner to
achieve expropriation to gain private benefit. This relationship is taken into consideration.
To make this relationship tractable, here we assume that size of expropriation is a
function total asset and control power of controlling owner:
EX = ex(K, ρ) ≡ BKα1g(ρ)α2 (5)
ρ(0 ≤ ρ ≤ 1) is the ratio of “control right” of the ultimate controllers; this is the sum
of shares controlled by the ultimate controller. Here, we assume P (X) ≡ X instead of
P (X) ≡ PX to make the test equation operational. Researcher does not know an exact
form of ρ, g(ρ). Furthermore, we set g(ρ) = 1− 1/ρ because it enable us to easily interpret
relationship between control right and cash flow right. By inserting equation (5) in the first
order condition for the controller(eq.(2)), the test equation becomes,
f ′(K) = r + (1 − 1
ϕ)ex′(K) = r + (1 − 1
ϕ)Bα1K
α1−1(1 − 1
ρ)α2. (6)
Economic implication of this equation is basically same as equation (4): marginal prod-
uct to K is equal to financing cost r minus net marginal cost of expropriation. The specifi-
cation here presume that expropriation happens if control right is bigger and cash flow right
is smaller. Based on this relationship, if ρ > ϕ happens, that is, separation of control right
and cash flow right happens, unit benefit of expropriation is big compared to unit cost of
expropriation, asset inflation for expropriation appears. If separation of cash flow right and
control right does NOT happen, that is, ρ = ϕ holds, and further if coefficient of control
right term α2 = −1, net cost of expropriation become completely independent to cash flow
and control rights. As long as α2 < 0 holds, the bigger control rights and the smaller cash
flow rights, that is the separation of cash flow and control right is bigger or level of control
right bigger, expropriation becomes bigger. If α2 > 0, expropriation becomes increasing
functions of control right and cash flow right simultaneously. In this case separation of
cash flow and control rights will decreases expropriation. To test relationship between cash
19
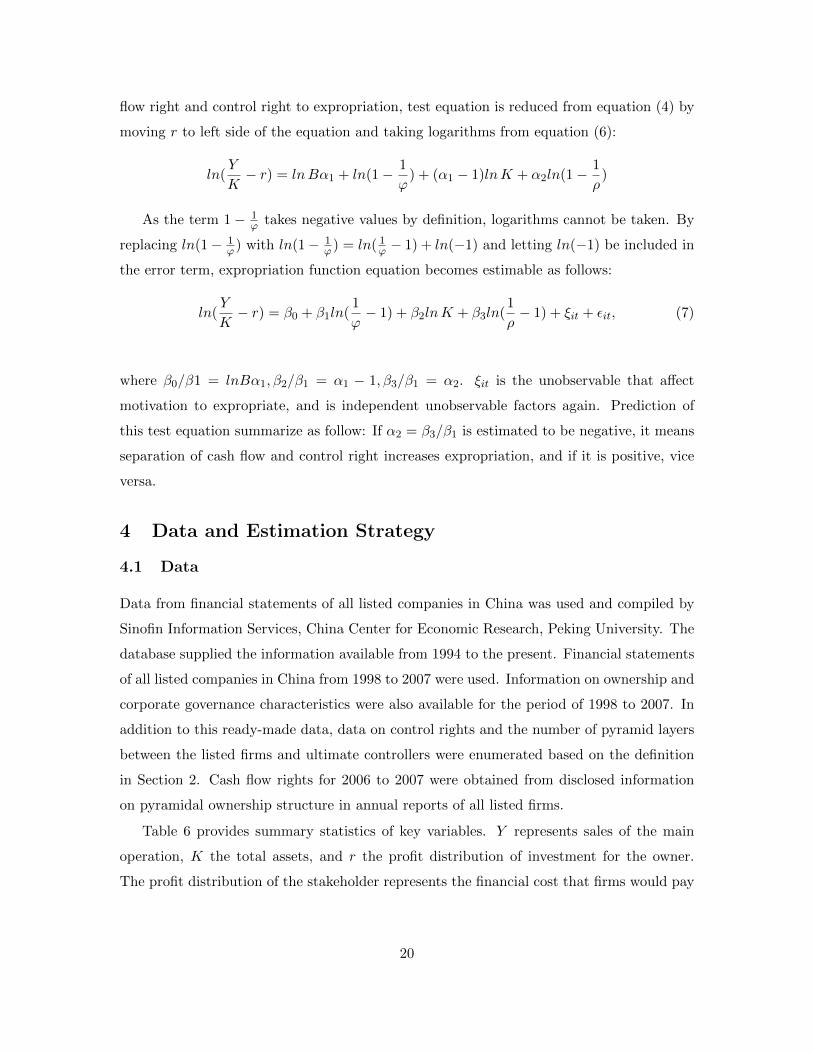
flow right and control right to expropriation, test equation is reduced from equation (4) by
moving r to left side of the equation and taking logarithms from equation (6):
ln(Y
K− r) = lnBα1 + ln(1 − 1
ϕ) + (α1 − 1)lnK + α2ln(1 − 1
ρ)
As the term 1 − 1ϕ takes negative values by definition, logarithms cannot be taken. By
replacing ln(1 − 1ϕ) with ln(1 − 1
ϕ) = ln( 1ϕ − 1) + ln(−1) and letting ln(−1) be included in
the error term, expropriation function equation becomes estimable as follows:
ln(Y
K− r) = β0 + β1ln(
1
ϕ− 1) + β2lnK + β3ln(
1
ρ− 1) + ξit + εit, (7)
where β0/β1 = lnBα1, β2/β1 = α1 − 1, β3/β1 = α2. ξit is the unobservable that affect
motivation to expropriate, and is independent unobservable factors again. Prediction of
this test equation summarize as follow: If α2 = β3/β1 is estimated to be negative, it means
separation of cash flow and control right increases expropriation, and if it is positive, vice
versa.
4 Data and Estimation Strategy
4.1 Data
Data from financial statements of all listed companies in China was used and compiled by
Sinofin Information Services, China Center for Economic Research, Peking University. The
database supplied the information available from 1994 to the present. Financial statements
of all listed companies in China from 1998 to 2007 were used. Information on ownership and
corporate governance characteristics were also available for the period of 1998 to 2007. In
addition to this ready-made data, data on control rights and the number of pyramid layers
between the listed firms and ultimate controllers were enumerated based on the definition
in Section 2. Cash flow rights for 2006 to 2007 were obtained from disclosed information
on pyramidal ownership structure in annual reports of all listed firms.
Table 6 provides summary statistics of key variables. Y represents sales of the main
operation, K the total assets, and r the profit distribution of investment for the owner.
The profit distribution of the stakeholder represents the financial cost that firms would pay
20
for debtor and shareholders4. As variables for channels for “expropriation” by controllers, it
is ideal if exact values of accounts receivable to the holding company (the ultimate owner)
can be used. These figures have been required in the financial statements of all listed
companies, at least since 2001. However, samples of this data are limited in availability and
contradict one another relative to year-to-year financial statements. Further, this value is
missing for many firms. Therefore, we gave up using the account receivable to the holding
company, but used accounts receivable as a whole. Other than these variables appearing
in the theoretical model, the followings were added as control variables: (1) year dummies,
(2) type of ultimate ownership dummies, and (3) a share reformed dummy.
4.2 Source of Endogeneity and Identification Strategy
Estimation here is interested in estimating correct size of expropriation. In order to accom-
plish this target, I need to correctly estimate the structural parameters above. Equations
(4) and (7) are the test equations to be identified, which describe rules on how the control-
ling owner balances his private expropriation motive and a formal profit distribution policy.
In (4), account-receivables is the channel for expropriation of controlling owner. Account
receivable for expropriation motives reduces profit substantially, as the case of Jinan Qingqi
shows. Therefore, it is presumably correlated with unobservable expropriating motivation .
At the same time, size of profit distributed to debtor and shareholders is also correlated with
the expropriating motivation . The profit distribution to the stake-holders r is endogenous
here. In (7), expropriation is facilitated/constraint by configuration of cash flow right and
control right, and it is represented in a part of total asset when expropriation is realized.
Therefore, lnK is endogenous here. As we have endogenous variables in the test equations,
the equations are estimated by instrumental variables instead of ordinary least squares.
4.3 Instruments
In order to remedy endogeneity explained above, I need the instruments that are correlated
with r or lnK, but are not correlated with error terms. What is the exogenous variation that
identifies this expropriating action? I exploited a nature of time structure between formal
4This consists of following accounting items: (1) financial expense, including payment to debtors andothers related to financing activity plus (2) loss or profit for minority shareholders plus (3) profit to theordinary owner plus (4) profit to the preferential owner.
21
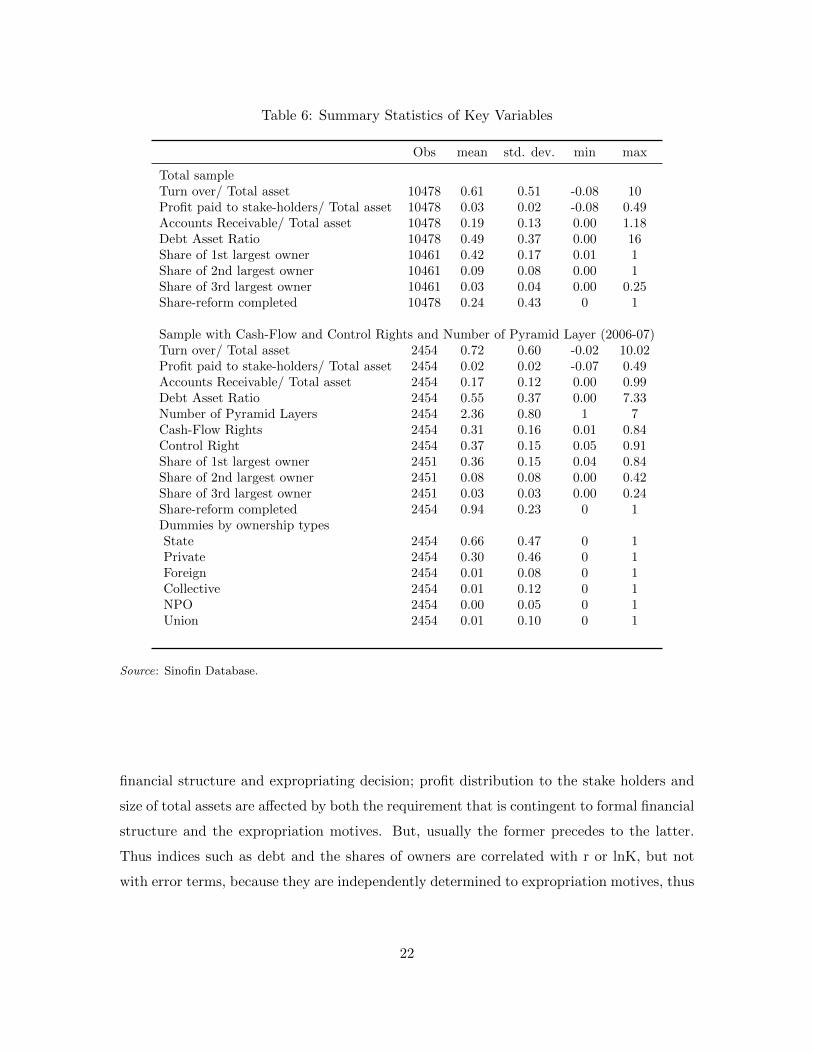
Table 6: Summary Statistics of Key Variables
Obs mean std. dev. min max
Total sampleTurn over/ Total asset 10478 0.61 0.51 -0.08 10Profit paid to stake-holders/ Total asset 10478 0.03 0.02 -0.08 0.49Accounts Receivable/ Total asset 10478 0.19 0.13 0.00 1.18Debt Asset Ratio 10478 0.49 0.37 0.00 16Share of 1st largest owner 10461 0.42 0.17 0.01 1Share of 2nd largest owner 10461 0.09 0.08 0.00 1Share of 3rd largest owner 10461 0.03 0.04 0.00 0.25Share-reform completed 10478 0.24 0.43 0 1
Sample with Cash-Flow and Control Rights and Number of Pyramid Layer (2006-07)Turn over/ Total asset 2454 0.72 0.60 -0.02 10.02Profit paid to stake-holders/ Total asset 2454 0.02 0.02 -0.07 0.49Accounts Receivable/ Total asset 2454 0.17 0.12 0.00 0.99Debt Asset Ratio 2454 0.55 0.37 0.00 7.33Number of Pyramid Layers 2454 2.36 0.80 1 7Cash-Flow Rights 2454 0.31 0.16 0.01 0.84Control Right 2454 0.37 0.15 0.05 0.91Share of 1st largest owner 2451 0.36 0.15 0.04 0.84Share of 2nd largest owner 2451 0.08 0.08 0.00 0.42Share of 3rd largest owner 2451 0.03 0.03 0.00 0.24Share-reform completed 2454 0.94 0.23 0 1Dummies by ownership typesState 2454 0.66 0.47 0 1Private 2454 0.30 0.46 0 1Foreign 2454 0.01 0.08 0 1Collective 2454 0.01 0.12 0 1NPO 2454 0.00 0.05 0 1Union 2454 0.01 0.10 0 1
Source: Sinofin Database.
financial structure and expropriating decision; profit distribution to the stake holders and
size of total assets are affected by both the requirement that is contingent to formal financial
structure and the expropriation motives. But, usually the former precedes to the latter.
Thus indices such as debt and the shares of owners are correlated with r or lnK, but not
with error terms, because they are independently determined to expropriation motives, thus
22

we can expect them to work as instrumental variables5.6
5 Results
5.1 Expropriation via Accounts Receivable as it exists for State Con-trolled Companies
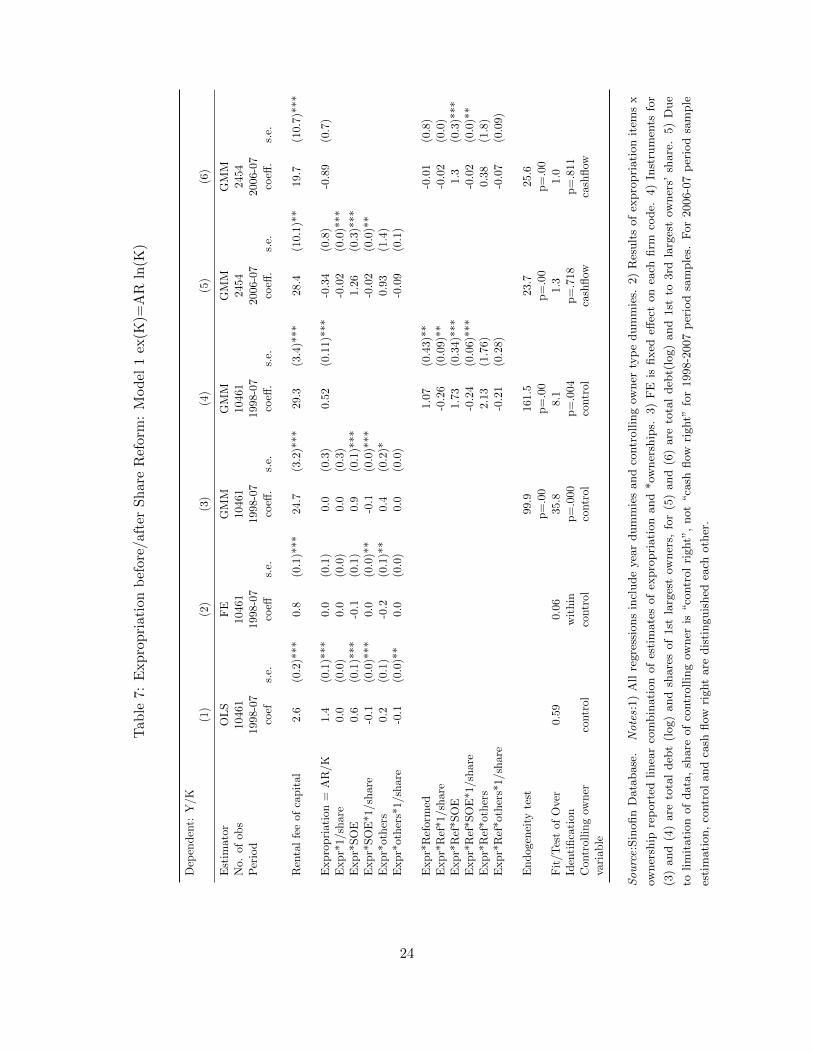
Table 7 displays results of the estimates of “expropriation via account receivable” equation
(4).Comparisons among OLS and fixed effect reveal that the fixed effect estimator corrects
overestimation due to time invariant factors, but it got underestimated due to lack of care
for the endogeneity problem in decisions on total asset size. GMM estimates indicate that
expropriation by the controlling owner occurred for the state owned firms even after the
reform of discriminated shares was completed. Private owned firms show a weak effect of
expropriation when I do not distinguish the effect of the discriminated share reform. Esti-
mation of a spline function was used to capture the impact of discriminated share reform.
Lower column of Table 7 shows the results. They indicate that a state controlled firm,
even those who completed discriminated share reform, are suffered from expropriation by
the controlling owner, though size of coefficients get smaller. Though the discriminated
share reform reduced expropriation to some extent, but not resolve the problem completely.
For private firms who completed share reform, expropriation via accounts receivable dis-
appeared. This means that expropriation has not yet disappeared because the pyramidal
ownership structure still remains. We further test this in more general form of specifica-
tion; that is, specification of “expropriation due to separation of control right and cash-flow
right” (equation 7).
5Modigliani-Mirror theorem proposed that financial structure do not affect the firms value (representedin total asset size or profit) if the following three factors do not hold:(1) asymmetry effect of bankruptcyto debtor and shareholder, (2) asymmetry effect of tax policy, (3) incentives of management. Idea to findinstruments variable here depends on the assumption that (1) and (2) factors are independent to (3) incentivebias of management, the main interest of this paper.
67 Endogeneity tests of instruments variables (Ho= IV are exogenous) are not rejected for general form,but rejected for expropriation via account receivables. See Table 7 and 8.
23
Tab
le7:
Exp
rop
riat
ion
bef
ore/
afte
rSh
are
Ref
orm
:M
od
el1
ex(K
)=A
Rln
(K)
Dep
enden
t:Y
/K(1
)(2
)(3
)(4
)(5
)(6
)
Est
imat
orO
LS
FE
GM
MG
MM
GM
MG
MM
No.
ofob
s10
461
1046
110
461
1046
124
54
2454
Per
iod
1998
-07
1998
-07
1998
-07
1998
-07
200
6-07
2006-
07
coef
s.e.
coeff
s.e.
coeff
.s.
e.co
eff.
s.e.
coeff
.s.
e.co
eff.
s.e.
Ren
tal
fee
ofca
pit
al2.
6(0
.2)*
**0.
8(0
.1)*
**24
.7(3
.2)*
**29
.3(3
.4)*
**28
.4(1
0.1
)**
19.
7(1
0.7
)***
Expro
pri
atio
n=
AR
/K1.
4(0
.1)*
**0.
0(0
.1)
0.0
(0.3
)0.
52(0
.11)*
**
-0.3
4(0
.8)
-0.8
9(0
.7)
Expr*
1/sh
are
0.0
(0.0
)0.
0(0
.0)
0.0
(0.3
)-0
.02
(0.0
)***
Expr*
SO
E0.
6(0
.1)*
**-0
.1(0
.1)
0.9
(0.1
)***
1.26
(0.3
)***
Expr*
SO
E*1
/shar
e-0
.1(0
.0)*
**0.
0(0
.0)*
*-0
.1(0
.0)*
**-0
.02
(0.0
)**
Expr*
other
s0.
2(0
.1)
-0.2
(0.1
)**
0.4
(0.2
)*0.9
3(1
.4)
Expr*
other
s*1/
shar
e-0
.1(0
.0)*
*0.
0(0
.0)
0.0
(0.0
)-0
.09
(0.1
)
Expr*
Ref
orm
ed1.
07(0
.43)*
*-0
.01
(0.8
)E
xpr*
Ref
*1/s
har
e-0
.26
(0.0
9)**
-0.0
2(0
.0)
Expr*
Ref
*SO
E1.
73(0
.34)*
**
1.3
(0.3
)***
Expr*
Ref
*SO
E*1
/shar
e-0
.24
(0.0
6)**
*-0
.02
(0.0
)**
Expr*
Ref
*oth
ers
2.13
(1.7
6)
0.38
(1.8
)E
xpr*
Ref
*oth
ers*
1/sh
are
-0.2
1(0
.28)
-0.0
7(0
.09)
Endog
enei
tyte
st99
.916
1.5
23.
725
.6p=
.00
p=
.00
p=
.00
p=
.00
Fit
/Tes
tof
Over
0.59
0.06
35.8
8.1
1.3
1.0
Iden
tifica
tion
wit
hin
p=
.000
p=
.004
p=
.718
p=
.811
Con
trol
ling
owner
contr
olco
ntr
olco
ntr
olco
ntr
olca
shflow
cash
flow
vari
able
Source:S
inofin
Data
base
.Notes:1
)A
llre
gre
ssio
ns
incl
ude
yea
rdum
mie
sand
contr
ollin
gow
ner
typ
edum
mie
s.2)
Res
ult
sof
expro
pri
ati
on
item
sx
owner
ship
rep
ort
edlinea
rco
mbin
ati
on
of
esti
mate
sof
expro
pri
ati
on
and
*ow
ner
ship
s.3)
FE
isfixed
effec
ton
each
firm
code.
4)
Inst
rum
ents
for
(3)
and
(4)
are
tota
ldeb
t(l
og)
and
share
sof
1st
larg
est
owner
s,fo
r(5
)and
(6)
are
tota
ldeb
t(lo
g)
and
1st
to3rd
larg
est
owner
s’sh
are
.5)
Due
tolim
itati
on
of
data
,sh
are
of
contr
ollin
gow
ner
is“co
ntr
ol
right”
,not
“ca
shflow
right”
for
1998-2
007
per
iod
sam
ple
s.F
or
2006-0
7p
erio
dsa
mple
esti
mati
on,
contr
ol
and
cash
flow
right
are
dis
tinguis
hed
each
oth
er.
24

5.2 Expropriation Due to Separation of Control and Cash-Flow Right
Table 8 includes results of two specifications of equation 4. Estimates in (1) specify control
right itself, and in (2) it is specified as 1− 1ϕ . Results show the second specification fits more
than the first one. Expropriation of the state owned listed firm is affected by configuration
of cash flow and control rights as well as total asset size. The expropriation become larger
when cash flow right is smaller,and control right is larger. This implies that the larger
the separation between control right and cash flow right is, at the same time, the larger
ratio of control right is, the larger the expropriation. This is a support for the literature
that claims separation of cash flow and control right generates expropriation for listed state
owned companies. The state owned listed enterprises shows expropriation because its level
of control right is higher, though degree of separation is smaller than private firms. Contrary
to the state owned firms, private owned listed firms shows opposite sings of coefficients for
the cash flow right and that of control rights is not significant. Configuration of cash flow
and control right does not affect expropriation of private owned firms.
5.3 Model Prediction and Counterfactual Simulation
As estimation is based on a structural model in this paper, it is possible to retrieve struc-
tural parameters of expropriation function, and ratio of expropriation out of expropriated
account channels etc. The expropriation for the state owned enterprises is estimated to
be 6.8 percent of total assets in the general form, and to be 7.8 per cent in the form that
assume expropriation via account receivables. The equation of gexpropriation via account
receivableh shows that expropriated ratio out of total account receivable (α) is 4.4 per cent,
and private value, in other word non-economic value, of expropriation (P) is 1.7 per cent of
total account receivables (Table 9). For private owned firms, the results showed a negative
expropriation. Table 10 shows counterfactual simulations. They show how much expro-
priation would be reduced if separation of control and cash-flow rights is resolved, that is,
control and cash-flow rights are completely identical for all sample firms. Excess investment,
or asset inflation, may be reduced by about 13 percent for state controlled firms.
25
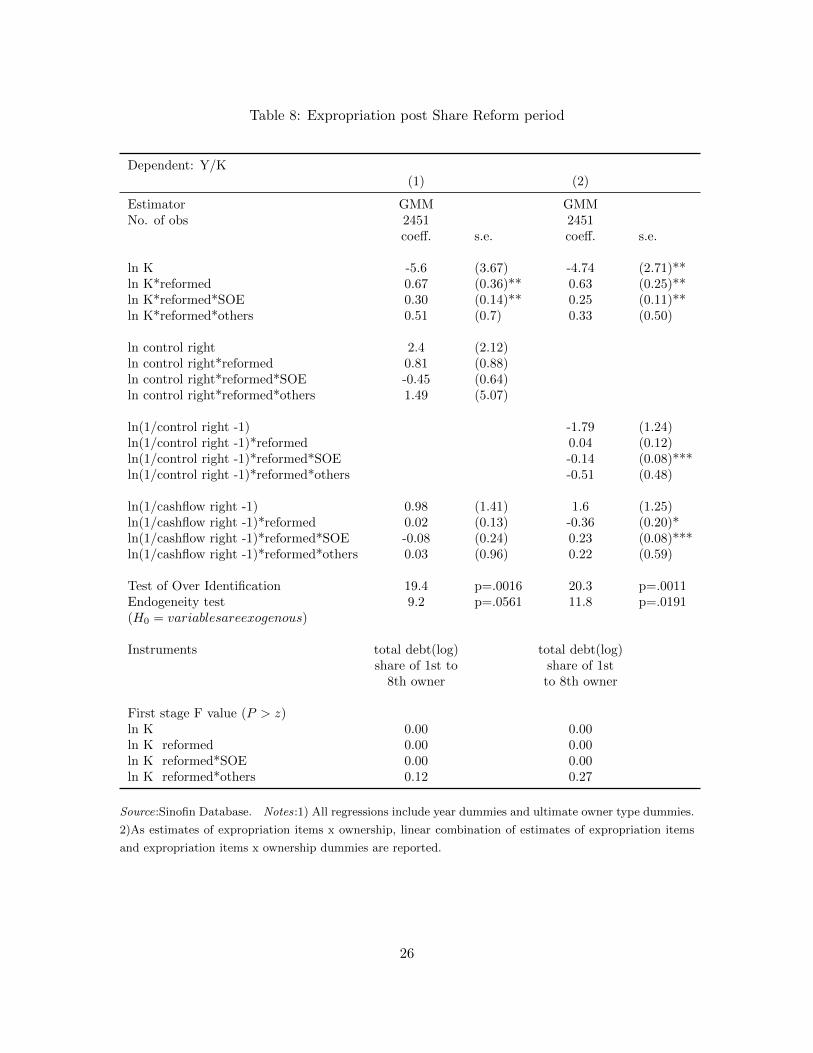
Table 8: Expropriation post Share Reform period
Dependent: Y/K(1) (2)
Estimator GMM GMMNo. of obs 2451 2451
coeff. s.e. coeff. s.e.
ln K -5.6 (3.67) -4.74 (2.71)**ln K*reformed 0.67 (0.36)** 0.63 (0.25)**ln K*reformed*SOE 0.30 (0.14)** 0.25 (0.11)**ln K*reformed*others 0.51 (0.7) 0.33 (0.50)
ln control right 2.4 (2.12)ln control right*reformed 0.81 (0.88)ln control right*reformed*SOE -0.45 (0.64)ln control right*reformed*others 1.49 (5.07)
ln(1/control right -1) -1.79 (1.24)ln(1/control right -1)*reformed 0.04 (0.12)ln(1/control right -1)*reformed*SOE -0.14 (0.08)***ln(1/control right -1)*reformed*others -0.51 (0.48)
ln(1/cashflow right -1) 0.98 (1.41) 1.6 (1.25)ln(1/cashflow right -1)*reformed 0.02 (0.13) -0.36 (0.20)*ln(1/cashflow right -1)*reformed*SOE -0.08 (0.24) 0.23 (0.08)***ln(1/cashflow right -1)*reformed*others 0.03 (0.96) 0.22 (0.59)
Test of Over Identification 19.4 p=.0016 20.3 p=.0011Endogeneity test 9.2 p=.0561 11.8 p=.0191(H0 = variablesareexogenous)
Instruments total debt(log) total debt(log)share of 1st to share of 1st
8th owner to 8th owner
First stage F value (P > z)ln K 0.00 0.00ln K reformed 0.00 0.00ln K reformed*SOE 0.00 0.00ln K reformed*others 0.12 0.27
Source:Sinofin Database. Notes:1) All regressions include year dummies and ultimate owner type dummies.
2)As estimates of expropriation items x ownership, linear combination of estimates of expropriation items
and expropriation items x ownership dummies are reported.
26
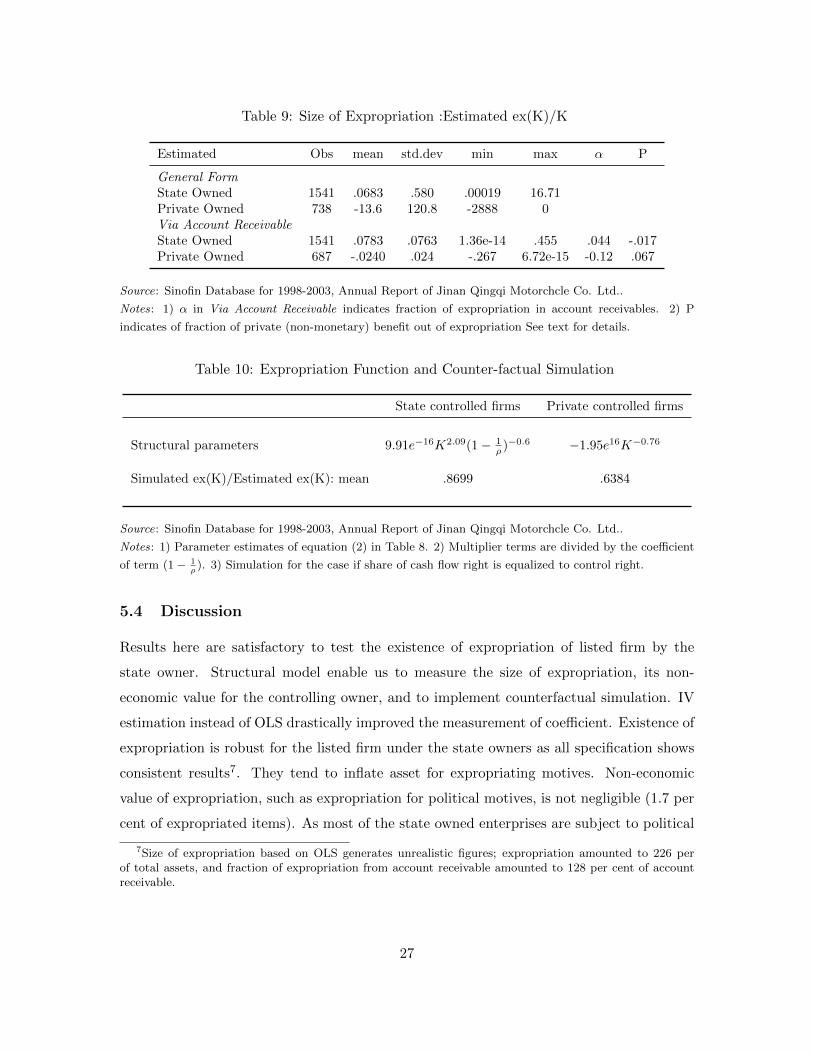
Table 9: Size of Expropriation :Estimated ex(K)/K
Estimated Obs mean std.dev min max α P
General FormState Owned 1541 .0683 .580 .00019 16.71Private Owned 738 -13.6 120.8 -2888 0Via Account ReceivableState Owned 1541 .0783 .0763 1.36e-14 .455 .044 -.017Private Owned 687 -.0240 .024 -.267 6.72e-15 -0.12 .067
Source: Sinofin Database for 1998-2003, Annual Report of Jinan Qingqi Motorchcle Co. Ltd..
Notes: 1) α in Via Account Receivable indicates fraction of expropriation in account receivables. 2) P
indicates of fraction of private (non-monetary) benefit out of expropriation See text for details.
Table 10: Expropriation Function and Counter-factual Simulation
State controlled firms Private controlled firms
Structural parameters 9.91e−16K2.09(1 − 1ρ )−0.6 −1.95e16K−0.76
Simulated ex(K)/Estimated ex(K): mean .8699 .6384
Source: Sinofin Database for 1998-2003, Annual Report of Jinan Qingqi Motorchcle Co. Ltd..
Notes: 1) Parameter estimates of equation (2) in Table 8. 2) Multiplier terms are divided by the coefficient
of term (1 − 1ρ). 3) Simulation for the case if share of cash flow right is equalized to control right.
5.4 Discussion
Results here are satisfactory to test the existence of expropriation of listed firm by the
state owner. Structural model enable us to measure the size of expropriation, its non-
economic value for the controlling owner, and to implement counterfactual simulation. IV
estimation instead of OLS drastically improved the measurement of coefficient. Existence of
expropriation is robust for the listed firm under the state owners as all specification shows
consistent results7. They tend to inflate asset for expropriating motives. Non-economic
value of expropriation, such as expropriation for political motives, is not negligible (1.7 per
cent of expropriated items). As most of the state owned enterprises are subject to political
7Size of expropriation based on OLS generates unrealistic figures; expropriation amounted to 226 perof total assets, and fraction of expropriation from account receivable amounted to 128 per cent of accountreceivable.
27
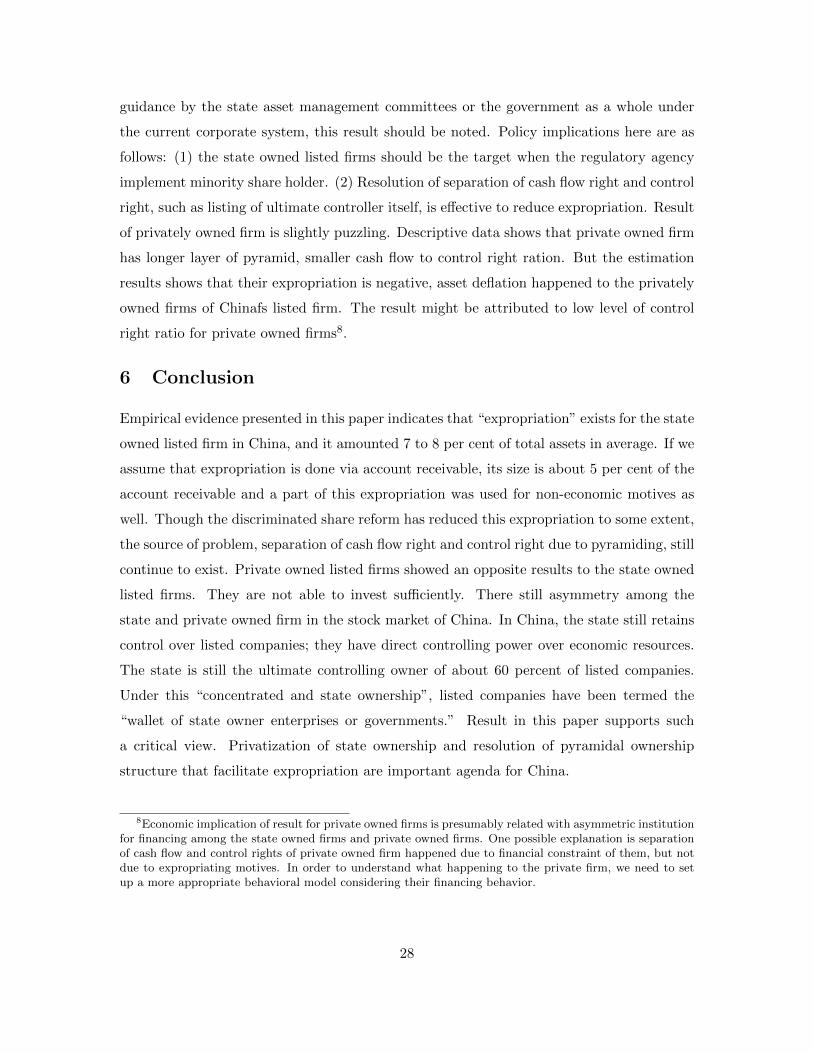
guidance by the state asset management committees or the government as a whole under
the current corporate system, this result should be noted. Policy implications here are as
follows: (1) the state owned listed firms should be the target when the regulatory agency
implement minority share holder. (2) Resolution of separation of cash flow right and control
right, such as listing of ultimate controller itself, is effective to reduce expropriation. Result
of privately owned firm is slightly puzzling. Descriptive data shows that private owned firm
has longer layer of pyramid, smaller cash flow to control right ration. But the estimation
results shows that their expropriation is negative, asset deflation happened to the privately
owned firms of Chinafs listed firm. The result might be attributed to low level of control
right ratio for private owned firms8.
6 Conclusion
Empirical evidence presented in this paper indicates that “expropriation” exists for the state
owned listed firm in China, and it amounted 7 to 8 per cent of total assets in average. If we
assume that expropriation is done via account receivable, its size is about 5 per cent of the
account receivable and a part of this expropriation was used for non-economic motives as
well. Though the discriminated share reform has reduced this expropriation to some extent,
the source of problem, separation of cash flow right and control right due to pyramiding, still
continue to exist. Private owned listed firms showed an opposite results to the state owned
listed firms. They are not able to invest sufficiently. There still asymmetry among the
state and private owned firm in the stock market of China. In China, the state still retains
control over listed companies; they have direct controlling power over economic resources.
The state is still the ultimate controlling owner of about 60 percent of listed companies.
Under this “concentrated and state ownership”, listed companies have been termed the
“wallet of state owner enterprises or governments.” Result in this paper supports such
a critical view. Privatization of state ownership and resolution of pyramidal ownership
structure that facilitate expropriation are important agenda for China.
8Economic implication of result for private owned firms is presumably related with asymmetric institutionfor financing among the state owned firms and private owned firms. One possible explanation is separationof cash flow and control rights of private owned firm happened due to financial constraint of them, but notdue to expropriating motives. In order to understand what happening to the private firm, we need to setup a more appropriate behavioral model considering their financing behavior.
28

Reference
Bebchuk, Lucian. A. (1999), A Rent-Protection Theory of Corporate Ownership and
Control, NBER WP. 7203
Bebchuk Lucian. A. Reinier Kraakman, and George Triantis (2000), Stock Pyra-
mids, Cross-Ownership and Dual Class Equity: The Mechanisms and Agency Costs of Sep-
arating Control from Cash-Flow Right,Concentrated Corporate Ownership, in R. K. Morck
ed., University of Chicago Press.
Classens, S. Simom Djankov, Joseph Fan and Larry Lang (1999), Expropriation of
Minority Shareholders in East Asia, mimeo.
Classens, S. Djankov, S. and L. H.P Lang (2000), The separation of ownership and
control in East Asian Corporations, Journal of Financial Economics, 58 2000, pp, 81-112.
Faccio, M., L.P.H Lang and L. Young (2001), Dividends and Expropriation, American
Economic Review, Vol. 91. No. 1, 2001.
Fama, Eugen F. and Michael. C. Jensen (1983) , Separation of Ownership and
Control, The Journal of Law and Economics, vol. 26 (June 1983)
Fan, Joseph, T. J. Wong and Zhang Tianyu (2005), The emergence of corporate
pyramids in China, Center for Economic Institution Working Paper Series, No.2005-16.
Hart, Oliver (2001), Financial Contracting, Journal of Economic Literature, 2001 De-
cember.
Jensen, Michael. C. and W. Meckling (1976) , Theory of the Firm: Managerial Behav-
ior, Agency Costs and Ownership Structure , Journal of Financial Economics, Vol. 3., No.4.
29
Lau, Lawrence and Qian Yingyi, Roland Gerald (2000), Reform without Losers:
An Interpretation of China’s Dual Track Approach to Transition, Journal of Political Econ-
omy, Vol. 108, no.1.
La Porta, Rafael, Florencio Lopez-de=Silanies and Andre Shleifer (1999), Cor-
porate Ownership Around the World, Journal of Finance, Vol. 54, No. 2 (Apr., 1999), pp.
471-517 .
McMillan John and Naughton, Barry(1992), How to reform a Planned Economy:
Lessons from China, Oxford Review of Economic Policy, Vol. 8. No. 1.
Nomura Institute of Capital Market Research (2007), Encyclopedia of China’s Se-
curity Market, Nikkei Book Publishing.
Qian, Yinyi (2003), How Reform Worked in China, Search of Prosperity-Analytic Narra-
tives on Economic Growth, Rodrik, Dani.ed., Princeton University Press.
Shaghai Stock Exchange Research Center (2006), China Corporate Governance Re-
port (2006): The Corporate Governance Report of State Holding Listed Companies, Fudan
University Press (In Chinese).
Tenev, S. Zhang, C. and L. Brefort (2002), Corporate Governance and Enterprise
Reform in China;Building the Institutions of Modern Markets, World Bank and IFC.
30