Corporate Governance and State Expropriation Risk
14
Corporate governance and state expropriation risk ☆ Burcin Col a, ⁎, Vihang Errunza b,1 a Lubin School of Business, Pace University, One Pace Plaza, New York, NY 10038, USA b Desautels Faculty of Management, McGill University, 1001 Sherbrooke Street West, Montreal, Quebec H3A 1G5, Canada article info abstract Article history: Received 27 January 2014 Received in revised form 15 April 2015 Accepted 25 April 2015 Available online 30 April 2015 Recent studies show that the transfer of corporate governance structure across borders has signif- icant valuation consequences. It is equally important to consider the valuation effect of state ex- propriation risk as well as its interaction with quality of corporate governance. Using a sample of cross-border acquisitions during 1989–2009, we find that targets, which operate under some degree of state expropriation risk, receive a significantly lower premium. The target shareholders are not fully rewarded for the improvement in firm governance since the benefits of improvement are mitigated under predation. Our results provide evidence for twin-agency theory of Stulz (2005) through cross-border mergers. © 2015 Elsevier B.V. All rights reserved. JEL classification: G15 G34 G38 Keywords: Cross-border mergers Valuation State expropriation Corporate governance “Businesspeople need to think harder about political risk”, The Economist, February 10th 2011” 1. Introduction A number of studies have investigated the valuation impact of cross-border investments. In general, the improvements resulting from transfer of investor protection and corporate governance as well as bonding to better institutions have positive valuation effects. 2 However, in view of the “twin agency problems” identified by Stulz (2005), it is important to condition the valuation effects on gov- ernment intervention broadly defined as expropriation. 3 Indeed, recent surveys conducted by the Economist Intelligence Unit suggest that political risk has jumped towards the top of corporate agendas. 4 World Bank’s Multilateral Investment Guarantee Agency (MIGA) Journal of Corporate Finance 33 (2015) 71–84 ☆ We thank Bo Becker, Artyom Durnev, Lawrence Kryzanowski, Craig Lewis, Adolfo de Motta, Hernan Ortiz-Molina, Laura Starks and participants at 2011 Northern Finance Association Meetings as well as the 2011 FMA European Meetings, FMA Annual Meetings, Australasian Finance and Banking Conference, Desautels-HEC- Rotman Winter Workshop for insightful comments. Col acknowledges financial support from CFGR. Errunza acknowledges financial support from the Bank of Montreal Chair at McGill University, IFM2 and SSHRC. ⁎ Corresponding author. Tel.: +1 212 618 6401. E-mail addresses: [email protected] (B. Col), [email protected] (V. Errunza). 1 Tel.: +1 514 398 3876. 2 See for example, La Porta et al. (2002), Chari et al. (2010), Kuipers et al. (2009), Doidge et al. (2004), and Bris and Cabolis (2008). 3 The term “expropriation” refers to a wide range of activities including the outright seizure of firm assets, solicitation of bribes, overregulation and confiscatory tax- ation. Throughout the paper we use the terms “political risk” and “expropriation risk” interchangeably since state expropriation is a common form of political risk, which is broadly defined as the involuntarily forced divestment of foreign direct investment. In our empirical analysis, however, our main measure focuses on the risk of con- tract viability/expropriation and profits repatriation. 4 See for example World Investment Prospects to 2011 – Foreign Direct Investment and the Challenge of Political Risk, p.7 available at (http://www.eiu.com). Also see Bloomberg (October 20th, 2010) for the court action by Exxon and ConocoPhillips against Venezuela and by Yukos against Russia. http://dx.doi.org/10.1016/j.jcorpfin.2015.04.005 0929-1199/© 2015 Elsevier B.V. All rights reserved. Contents lists available at ScienceDirect Journal of Corporate Finance journal homepage: www.elsevier.com/locate/jcorpfin
Transcript of Corporate Governance and State Expropriation Risk

Corporate governance and state expropriation risk☆
Burcin Col a,⁎, Vihang Errunza b,1
a Lubin School of Business, Pace University, One Pace Plaza, New York, NY 10038, USAb Desautels Faculty of Management, McGill University, 1001 Sherbrooke Street West, Montreal, Quebec H3A 1G5, Canada
a r t i c l e i n f o a b s t r a c t
Article history:Received 27 January 2014Received in revised form 15 April 2015Accepted 25 April 2015Available online 30 April 2015
Recent studies show that the transfer of corporate governance structure across borders has signif-icant valuation consequences. It is equally important to consider the valuation effect of state ex-propriation risk as well as its interaction with quality of corporate governance. Using a sampleof cross-border acquisitions during 1989–2009, we find that targets, which operate under somedegree of state expropriation risk, receive a significantly lower premium. The target shareholdersare not fully rewarded for the improvement infirmgovernance since the benefits of improvementare mitigated under predation. Our results provide evidence for twin-agency theory of Stulz(2005) through cross-border mergers.
© 2015 Elsevier B.V. All rights reserved.
JEL classification:G15G34G38
Keywords:Cross-border mergersValuationState expropriationCorporate governance
“Businesspeople need to think harder about political risk”, The Economist, February 10th 2011”
1. Introduction
A number of studies have investigated the valuation impact of cross-border investments. In general, the improvements resultingfrom transfer of investor protection and corporate governance aswell as bonding to better institutionshave positive valuation effects.2
However, in view of the “twin agency problems” identified by Stulz (2005), it is important to condition the valuation effects on gov-ernment intervention broadly defined as expropriation.3 Indeed, recent surveys conducted by the Economist Intelligence Unit suggestthat political risk has jumped towards the top of corporate agendas.4World Bank’sMultilateral Investment Guarantee Agency (MIGA)
Journal of Corporate Finance 33 (2015) 71–84
☆ We thank Bo Becker, Artyom Durnev, Lawrence Kryzanowski, Craig Lewis, Adolfo de Motta, Hernan Ortiz-Molina, Laura Starks and participants at 2011 NorthernFinance Association Meetings as well as the 2011 FMA European Meetings, FMA Annual Meetings, Australasian Finance and Banking Conference, Desautels-HEC-RotmanWinterWorkshop for insightful comments. Col acknowledges financial support fromCFGR. Errunza acknowledges financial support from the Bank ofMontrealChair at McGill University, IFM2 and SSHRC.⁎ Corresponding author. Tel.: +1 212 618 6401.
E-mail addresses: [email protected] (B. Col), [email protected] (V. Errunza).1 Tel.: +1 514 398 3876.2 See for example, La Porta et al. (2002), Chari et al. (2010), Kuipers et al. (2009), Doidge et al. (2004), and Bris and Cabolis (2008).3 The term “expropriation” refers to a wide range of activities including the outright seizure of firm assets, solicitation of bribes, overregulation and confiscatory tax-
ation. Throughout the paperweuse the terms “political risk” and “expropriation risk” interchangeably since state expropriation is a common formof political risk,whichis broadly defined as the involuntarily forced divestment of foreign direct investment. In our empirical analysis, however, our main measure focuses on the risk of con-tract viability/expropriation and profits repatriation.
4 See for exampleWorld Investment Prospects to 2011 – ForeignDirect Investment and the Challenge of Political Risk, p.7 available at (http://www.eiu.com). Also seeBloomberg (October 20th, 2010) for the court action by Exxon and ConocoPhillips against Venezuela and by Yukos against Russia.
http://dx.doi.org/10.1016/j.jcorpfin.2015.04.0050929-1199/© 2015 Elsevier B.V. All rights reserved.
Contents lists available at ScienceDirect
Journal of Corporate Finance
j ourna l homepage: www.e lsev ie r .com/ locate / jcorpf in

reveals in their most recent survey that expropriation is the third most cited cause for companies that have scaled back, canceled, ordelayed investments in conflict-affected states.5
The potential impact of a predatory state should be reflected in the market’s expectation of cross-border merger premia. Indeed,the valuation discount due to state expropriation risk should result in target shareholders receiving a lowermerger premium. Further,according to the twin agency theory of Stulz (2005), managerial diversion and state expropriation are complementary. In countrieswith predatory governments,managerswill consumemore private benefits because anymoney they leave in the firmmay be partial-ly expropriated by the state. Moreover, while more transparencymakes it harder for insiders to appropriate from outside investors, itmakes expropriation by the state easier. As a result, shareholdersfind it costly to improve governance and disclosure since the benefitsof restraining managerial diversion are not fully realized by the shareholders but are shared with the state.6 Thus, the value of cross-border transfer of better governance and more disclosure is also in question under predation.
Hence, in this paper, we investigate two related issues. First, what is the valuation impact of state expropriation for cross-bordermergers that involve targets from predatory states. Second, what is the effect of improved shareholder protection and transparencywhen the target is subject to significant expropriation risk.
Our paper is related to studies that identify a number of country-level variables such as culture difference, market segmentation,legal environment and investor protection difference as sources of value gains in cross-border mergers, see for example, Moeller andSchlingemann (2005), Francis et al. (2008) and Chakrabarti et al. (2009). Nonetheless, the value implications of target governmentpolicies that influence foreign investment decision have not yet been reported.7 In a recent paper, Ellis et al. (2012) investigatewheth-er a country’s governance explains the shareholder wealth creation by studying the stock-price reaction of cross-border acquirers tomerger announcements. However, there are major differences between their and our study. First, we are interested in the wealth ac-crued to target shareholders and thuswe look at target announcement returns (premia). Second, their governance index is a compos-ite index that does not differentiate legal institutions frompolitical institutions.Wedifferentiate between the two in order to study theimpact of state expropriation as well as its interactionwith the legal institutions.8 Third, our samples andmethodologies are different.Their sample contains public acquirers and both public and private targets whereas we focus only on public firms for both acquirersand targets. They conduct their tests on unadjusted cross-border acquirer returns. We use a matching acquisition methodology andmeasure the target cross-border merger premium relative to a similar domestic acquisition for univariate tests. For multivariatetests, we use unadjusted target cumulative abnormal returns. Our work is also related to studies that focus on the value created bythe transfer of corporate governance and legal standards through cross-border mergers, see for example, Bris and Cabolis (2008),Chari et al. (2010), Feito-Ruiz and Menéndez-Requejo (2011), Kuipers et al. (2009) and Martynova and Renneboog (2008). Thesestudies find that abnormal returns are higher when acquirer’s corporate governance standards are stricter than the target’s. Weargue that the positive value of bonding to better investor protection and stricter accounting standards are conditional on the targetcountry’s government policies towards firms. Studies by Desai et al. (2007), Desai and Dharmapala (2006) and Stulz (2005) focus onthe relation between firm governance and state expropriation but do not investigate their implications on firm value. Cosset et al.(2014) study the impact of political institutions on foreign firms’ choice of their U.S. cross-listing venue. Finally, whereas Durnevand Fauver (2011) study cross-sectional relationship between predation, governance and value, we use cross-border merger eventsto analyze the valuation effects of changes in corporate governance and not the levels. Further, Durnev and Fauver (2011) use Tobin’s qwhich is significantly affected by industrial organization andhence should be adjustedwith respect tofirm’s industry (Lindenberg andRoss, 1981).9 For an international sample this might be more challenging since there may not be sufficient number of firms in eachindustry for each country.
We use a sample of 902 cross-border acquisitions from36 target countries during the period from1989 to 2009.Our sample periodcovers the periodwhen expropriation risk posed a great threat to businesses aswe acknowledge that outright asset expropriations arefar less common now than they were a few decades ago. Our results, however, could extend beyond our sample period and are appli-cable to today’s business environment as expropriation riskmight take other forms such as contract viability, overregulation and con-fiscatory taxation. These risks still rank as some of the highest concerns on corporate agendas as they consider investing in Latin-America, Middle East and North Africa.10
We investigate cross-bordermergers since they introduce an exogenous shock to domestic firm’s ownership and thus offer an op-portunity to explore the valuation consequences of detrimental state policies against foreign firms. Moreover, the target firm usuallyadopts the accounting standards, disclosure practices, and corporate governance regulations of the country of the acquiring firm. The
5 See MIGAWorld Investment and Political Risk Report, p.94 available at (http://www.miga.org/documents/WIPR10ebook.pdf).6 The first order condition that equalizes marginal benefits of improving firm governance with its marginal costs shows that the optimal level of firm governance
drops when the state becomes more predatory. Thus, it is optimal for shareholders to set upweaker governance and distort managerial contract from pure value max-imization when state expropriation risk is high. See Stulz (2005) and Durnev and Fauver (2011) for the theoretical models. See Durnev et al. (2009) for empirical ev-idence on sub-optimal corporate transparency when there is state expropriation risk.
7 The importance of political risk on volatility of stock returns and cost of capital has been studied extensively. See for example Boutchkova et al. (2012) and Beaulieuet al. (2005).
8 We are not thefirst one to treat them separately. Qi et al. (2010) analyze the joint impact of country-level political institutions and legal institutions indetermining afirm’s cost of debt finance in international credit markets. Moreover, there is an ongoing debate in financial and economic development literature as to which institu-tional factors aremost important. Haber et al. (2008) term this debate as the “legal origins view” versus the “political institutions view.” See their paper formore detail.
9 Most studies that explore governance-value relation use industry-adjusted Q. See for example, Gompers et al. (2003) and Bebchuk and Cohen (2005). For an ex-tensive review on recent corporate governance and corporate control research see Netter et al. (2009).10 See World Investment and Political Risk 2013 Report (WIPR) available at http://www.miga.org/documents/WIPR13.pdf and for recent examples in Russia seehttp://expropriationnewsrussia.com/en/.
72 B. Col, V. Errunza / Journal of Corporate Finance 33 (2015) 71–84

nationality of a target firm also changes when it is 100% acquired by a foreign firm, which implies that target firm becomes subject toacquirer country laws. Thus, cross-border mergers provide an excellent setting to test value implications of firm and country-levelgovernance as well as a cleaner test that is less subject to endogeneity concerns of traditional tests of firm governance and value.We followprevious studies and calculate the valuation effect of themerger as the targets’ cumulative abnormal return around the an-nouncement date. We control for other factors identified by past studies as determinants of the premium, to isolate value effects forour variables of interest.11
Wefind that under somedegree of expropriation risk, targets receive a significantly lower premium. Ceteris paribus, a one standarddeviation increase in expropriation risk (for example, the target is a Russian firm instead of a South Korean firm) decreases the pre-mium by 4.57%, which is 21% of the average cross-border merger premium. Since there is no evidence that relative expropriation riskbetween the target and the acquirer countrymatters, we focus on target country expropriation risk. Although, themerger premium issignificantly larger in acquisitions forwhich the shareholder protection of the acquirer is better than the target’s in the absence of stateexpropriation, the positive value of investor protection transfer is not realized for targets in predatory states. Indeed, the target share-holders are not rewarded for the improvement in firm governance since the benefits of improvement are mitigated under predation.Our findings are similar when we look at the transfer of accounting standards instead of shareholder protection. Overall, our resultssuggest that the value of the transfer of better shareholder protection and accounting standards depends on the target country’s gov-ernment policies towards firms. Thus our results provide evidence in support of the twin-agency theory of Stulz (2005).
Disentangling the valuation implications of minority shareholder expropriation either by insiders or by state is challenging due tohigh correlations between the country-level indices. Cross-border merger setting allows us to use differences in investor protection,not the levels, which helps with the issue. In addition, we provide further robustness tests using sub-sample analysis and firm-level corporate governance scores. Next, we form portfolios of individual target firms in a given industrywithin each country and cal-culate their average premium. Averaging premia at the portfolio level helps average deal-specific synergies at the industry-level andreduces problems associatedwith correlated errors, thusmaking the testsmuchmore efficient.12 Since the decision to participate in across-border acquisition is an endogenous choice and thefirmanddeal characteristicsmight be endogenously related to country char-acteristics, we employ treatment effects regressions. We also use alternate measures of state expropriation, alternative samples andevent windows. Our results remain robust.
The paper is organized as follows. We describe our framework, the data and the empirical methodology in the nextsection. Section 3 discusses the empirical results. Robustness tests are provided in Section 4. Final section concludes.
2. Methodology and data
2.1. Methodology
We proxy the merger premium with the target abnormal returns at the announcement of the acquisition. All returns aredenominated in U.S. $ and returns are estimated using symmetric eventwindows around the announcement date. Cumulative abnor-mal returns (CARs) sum the abnormal returns over the event- window, with abnormal returns estimated using the followingmarketmodel.
Ri jt ¼ ai þ bmi Rmjt þ bwi Rwt þ eit
where Rijt refers to the daily stock return for the target firm i in country j, Rmjt is themarket return in country j, and Rwt is the return ontheMSCIworld index.13 The residual eit is the excess return for each firm and day.14 Themarketmodel is run using 250 days,with theestimation window ending 42 days before the event. We compute and accumulate the target abnormal returns over the followingevent windows: (−2, +2), (−5, +5), (−30, +30) and (−30, −3). We use (−2, +2) event window as our proxy for the mergerpremium in our main tests. In the robustness section, we repeat our tests using longer event windows.
In our univariate tests, wemeasure the cross-border merger premium relative to a similar domestic acquisition that takes place inthe same target country and industry. Because the two target firms in each pair are from the same country and industry, matching-acquisition-adjusted premia measure the incremental announcement effect of the cross-border acquisition that is driven by the for-eign nationality of the acquirer.15 However, the difference between cross-border merger premium and domestic merger premiummatched by country and industry may introduce errors, which the control variables included in the multivariate analysis may notbe able to eliminate. Hence, for multivariate tests, we follow Ellis et al. (2012) and use unmatched CARs.16
11 These factors include bargaining power, competition in the market for corporate control and managerial ability. For more details, see Bris and Cabolis (2008).12 We thank Laura Starks for the suggestion.13 We report our results with the value-weighted indices. The results are similar when we use equally weighted indices instead.14 Daily data is based on trading days.15 Matching procedure not only helps us eliminate the effect of other target country- and industry-specific variables, but also is used by Bris and Cabolis (2008) andtherefore helpful in benchmarking our results.16 We thank an anonymous referee for this suggestion.
73B. Col, V. Errunza / Journal of Corporate Finance 33 (2015) 71–84

Table 1Summary statistics.
Panel A. Construction of the sample
Number ofacquisitions
Median total assets-target ($M)
Median total assets-acquirer ($M)
Median transactionvalue ($M)
SDC sample (1) Cross-border mergers 2927 171.05 2995.60 148.25Domestic mergers 10,949 156.10 1139.85 83.88Difference (p-value) (0.0005) (0.0000) (0.0000)Total 13,876 159.00 1339.45 94.39
SDC sample with stock price information (2) Cross-border mergers 1463 185.40 3492.20 194.81Domestic mergers 5853 178.50 1317.70 113.69Difference(p-value) (0.0339) (0.0000) (0.0000)Total 7316 179.50 1569.75 126.92
Difference between (1)-(2) (0.0000) (0.0000) (0.0000)Final Sample (3) Cross-border mergers 902 172.55 3829.40 246.42
Domestic mergers 902 151.05 1112.60 189.29Difference (p-value) (0.0223) (0.0000) (0.0106)Total 1804 161.90 2095.80 217.65
Difference between (2)-(3) (0.0087) (0.0000) (0.0000)Difference between (1)-(3) (0.8771) (0.0070) (0.0000)
The table shows the total assets for the target and the acquirer firms at the announcement of the acquisition and the transaction values for the three samples.SDC sample (1) consists of all domestic and cross-border mergers of publicly listed firm between January 1989 and December 2009. Leverage buyouts,spin-offs, recapitalizations, self-tender offers, exchange offers, repurchases, minority stake purchases, acquisitions of minority interest, and privatizationsare excluded. SDC sample with stock information (2) contains the acquisitions where the historical stock price information is available on DataStream forboth for target and acquirer firms. Final sample (3) includes only the cross-border mergers for which a matching domestic acquisition where the target firmbelongs to the same country and industry and the closest in size to the cross-border target can be identified. Total assets and transaction values are reportedin $ millions. Tests of differences are based on Wilcoxon rank sum test. p-values are reported in parentheses.
Panel B. Number of acquisition
Target nation SDC sample Final Sample Acquirer nation SDC sample Final Sample Expropriation risk
N % of sample N % of sample N % of sample N % of sample
Argentina 28 0.20 1 0.11 Argentina 14 0.10 3 0.33 6.20Australia 682 4.91 71 7.87 Australia 606 4.37 27 2.99 3.69Austria 27 0.19 1 0.11 Austria 39 0.28 4 0.44 2.34Belgium 53 0.38 4 0.44 Belgium 69 0.50 11 1.22 2.89Brazil 115 0.83 9 1.00 Brazil 81 0.58 3 0.33 5.61Canada 1552 11.18 102 11.31 Canada 1465 10.56 59 6.54 2.91Chile 28 0.20 2 0.22 Chile 13 0.09 3.35Colombia 24 0.17 1 0.11 Colombia 21 0.15 5.31Denmark 61 0.44 5 0.55 Denmark 80 0.58 10 1.11 3.21Finland 55 0.40 2 0.22 Finland 70 0.50 16 1.77 2.71France 359 2.59 37 4.10 France 438 3.16 68 7.54 2.86Germany 246 1.77 13 1.44 Germany 280 2.02 54 5.99 2.75Hong Kong 119 0.86 8 0.89 Hong Kong 130 0.94 11 1.22 3.49India 186 1.34 11 1.22 India 163 1.17 10 1.11 5.20Indonesia 32 0.23 3 0.33 Indonesia 17 0.12 2 0.22 5.40Israel 56 0.40 3 0.33 Israel 54 0.39 12 1.33 4.44Italy 105 0.76 4 0.44 Italy 145 1.04 21 2.33 3.32Japan 696 5.02 13 1.44 Japan 753 5.43 28 3.10 3.04Malaysia 93 0.67 3 0.33 Malaysia 104 0.75 4 0.44 4.36Mexico 48 0.35 2 0.22 Mexico 43 0.31 2 0.22 3.75Netherlands 95 0.68 19 2.11 Netherlands 151 1.09 49 5.43 2.55Norway 129 0.93 22 2.44 Norway 95 0.68 5 0.55 3.22Philippines 34 0.25 1 0.11 Philippines 33 0.24 3 0.33 5.12Poland 59 0.43 1 0.11 Poland 35 0.25 3.87Portugal 21 0.15 2 0.22 Portugal 13 0.09 1 0.11 3.29Russia 55 0.40 1 0.11 Russia 63 0.45 5 0.55 5.48Singapore 95 0.68 6 0.67 Singapore 95 0.68 13 1.44 2.68South Africa 178 1.28 10 1.11 South Africa 180 1.30 16 1.77 3.88South Korea 109 0.79 8 0.89 South Korea 107 0.77 7 0.78 3.83Spain 83 0.60 2 0.22 Spain 119 0.86 24 2.66 2.50Sweden 183 1.32 13 1.44 Sweden 208 1.50 31 3.44 3.18Taiwan 67 0.48 9 1.00 Taiwan 59 0.43 5 0.55 2.51Thailand 51 0.37 2 0.22 Thailand 38 0.27 4.87Turkey 29 0.21 1 0.11 Turkey 14 0.10 5.37U.K. 1100 7.93 134 14.86 U.K. 1152 8.30 141 15.63 2.61U.S. 6417 46.25 376 41.69 U.S. 6330 45.62 181 20.07 2.58
74 B. Col, V. Errunza / Journal of Corporate Finance 33 (2015) 71–84

2.2. Data
2.2.1. Construction of the sampleOur mergers and acquisitions data come from SDC Thompson’s International M&A database. We obtain information on all com-
pleted acquisitions of public companies between January 1989 and December 2009 for all available countries. We exclude leveragebuyouts, spin-offs, recapitalizations, self-tender offers, exchange offers, repurchases, minority stake purchases, acquisitions of minor-ity interest, and privatizations. The initial dataset has 13,876 completed acquisitions of which 2927 correspond to cross-border deals.Stock price information is obtained fromDataStream. The SDC dataset with historical stock price information has 7316 completed ac-quisitions of which 1463 are cross-border. Panel A of Table 1 shows that compared to the initial SDC sample (sample (1)), the acqui-sitions, where the historical stock price information is available (sample (2)), are composed of acquirers and targets that are larger interms of total assets for both domestic and cross-border transactions. Median cross-border target in sample (1) has $171 million inassetswhereas the one in sample (2) has $185million.Median cross-border acquirer in sample (1) has around $3 billion in assets ver-sus $3.5 billion in sample (2). Moreover, themedian transaction value is higher in sample (2) relative to sample (1): $195million ver-sus $148 million for the cross-border acquisitions.
Finally, we employ a matching sample procedure by identifying a domestic merger for each cross-border merger in our sample.We select, for each cross-border deal, a domestic merger that meets the following criteria: (i) The target firm belongs to the samecountry; (ii) the target firm belongs to the same industry (two-digit SIC code) as the target firm of the cross-border merger; (iii)the target firm is the closest in terms of total assets to the target of the corresponding cross-border merger.17,18
The final sample (sample (3)) that satisfies the above criteria consists of 1804 observations. There are 902 cross-border mergersand 902 corresponding domestic mergers for which we have complete information. Panel A of Table 1 describes the constructionof our final sample. For both cross-border and domestic mergers, median target total assets in the final sample (3) are smaller relativeto sample (2) but not significantly different than those of the initial SDC sample.Median cross-border target has $173million in assetswhereas there are $151million for the domestic transactions. This indicates that with respect to target firms, thematching procedureis very efficient. On the other hand, median total assets of the acquirers and the median transaction values for the cross-border
Panel B. Number of acquisition
Target nation SDC sample Final Sample Acquirer nation SDC sample Final Sample Expropriation risk
N % of sample N % of sample N % of sample N % of sample
Other 605 4.36 Other 599 4.32 76 8.42Total 13,876 100.00 902 100.00 Total 13,876 100.00 902 100.00
The table summarizes the number and the frequency of acquisitions by target and acquirer country. SDC sample consists of all domestic and cross-bordermergers of publicly listed firm between January 1989 and December 2009. Final sample includes only the cross-border mergers for which a matchingdomestic acquisition where the target firm belongs to the same country and industry and the closest in size to the cross-border target can be identified.Note that in the final sample there are no targets in the other category, however, there are 76 acquirers from 11 countries. Expropriation risk is time-seriesaverage of ICRG Investment Profile where larger values indicate greater risk.
Panel C. Description of the final sample
Target industry Acquirer industry Announcement year Deal characteristics
Agriculture and consumer products 14.67% Agriculture and consumer products 13.79% 1989–1991 1.66% Diversifying 41.13%Basic manufacturing 16.55% Basic manufacturing 18.13% 1992–1994 1.00% Stock offer 15.96%Machinery and electronics 26.67% Machinery and electronics 29.26% 1995–1997 9.09% Cash offer 78.38%Utilities and transportation 5.78% Utilities and transportation 8.45% 1998–2000 30.38% Hostile 2.22%Wholesale and retail trade 4.11% Wholesale and retail trade 5.79% 2001–2003 16.07% Multiple bidders 6.43%Financial services 10.55% Financial services 8.67% 2004–2006 20.07% Full ownership 73.84%Tourism and other services 21.67% Tourism and other services 15.91% 2007–2009 21.73% Majority ownership 89.58%Total 100.00% 100.00% 100.00%
The table summarizes the final sample with 902 cross-border acquisitions by target and acquirer industry, year of the merger announcement and deal characteristics.Final sample includes only the cross-bordermergers for which amatching domestic acquisitionwhere the targetfirmbelongs to the same country and industry and theclosest in size to the cross-border target can be identified. Majority ownership is a dummy variable that denotes whether the acquirer holds 50% or more of the targetfirm’s equity following the acquisition. Full ownership is a dummy variable that denotes whether the acquirer holds 100% of the target firm’s equity following the ac-quisition. Cash offer is a dummy for the deals that are paid fully with cash and stock offer is a dummy for the deals that are paid fully by the acquirer’s stock. Diversifyis a dummy variable that denotes whether the target is in the same two-digit SIC industry Code as the acquirer. Agriculture and consumer products are firms withtwo-digit SIC codes 00–19; basic manufacturing 20–29; machinery and electronics 30–39; utilities and transportation 40–49; wholesale and retail trade 50–59; finan-cial services 60–69; tourism and miscellaneous services 70–99 s.
17 Ellis et al. (2012) show that year has an explanatory power on themarket reactions around acquisition announcements.Whenwe impose that the domesticmergeris announced in the same year as the cross-border merger, we lose 40% of the observations, which leaves us with a smaller cross-sectional variation in terms of stateexpropriation as well as investor protection. Thus, we report our main univariate analysis without year matching and control for year-fixed effects in the multivariateanalysis.18 The final sample also excludes observations when there is a single acquisition in a given country, and industry as well as when the matching target firm is eithermore than double in size or less than half in size than the corresponding cross-border target. Instead of target size, we have also alternatively matched with acquirersize and the ratio of the acquirer to target size. The results do not change.
Table 1 (continued)
75B. Col, V. Errunza / Journal of Corporate Finance 33 (2015) 71–84

acquisitions are larger relative to both sample (1) and sample (2), with $3.8 billion and $246 million, respectively. For all three sam-ples, the targets and acquirers in cross-border mergers are significantly larger in size than the corresponding targets and acquirers ofthe domestic mergers. In addition, cross-border mergers are higher in transaction value relative to the domestic mergers.
Our final sample of cross-border mergers contains acquisition announcements for target firms from 36 countries and acquiringfirms from 42 countries. Panel B of Table 1 provides the number and the frequency of acquisitions by target and acquirer country.The frequencies of our final sample by target country distribution are not very different from the original SDC sample and thus, a fairlygood representation. A large number of our targets (376 out of 902, or 41.7%) andour acquirers (181 out of 902, or 20%) come from theUnited States. Our sample has 69 (7.6%) targets from Asia, 259 (28.7%) from Europe, 13 (1.4%) from Latin America, 10 (1.1%) fromAfrica, 104 (11.5%) from North America excluding U.S., and 71 (7.9%) from Oceania. Similarly, we have 147 (16.3%) acquirers fromAsia, 411 (45.5%) from Europe, 31 (3.4%) from Latin America, 35 (3.9%) from Africa, 61 (6.7%) from North America excluding U.S.,and 37 (4.1%) fromOceania.We acknowledge that our final sample is dominated by cases where the target is a US, a UK or a Canadianfirm, the countries with the strongest shareholder rights. This is not only because we require continuous non-missing stock price in-formation to conduct an event study but also because these are the countries where most of the acquisitions take place as shown bythe overall SDC sample statistics. We address this concern in our robustness tests where we exclude the transactions with the US, UKand Canadian targets. Panel C describes our final sample with respect to the deal characteristics. Most of the mergers are friendly(98%) anduse cash as themeans of payment (78%). Almost 90%of themacquire control (more than 50% of the shares) and 74% acquire100% of the target shares. Around 41% of them are a conglomerate, which is defined as the acquisition of a target with a different two-digit SIC code. The largest number of both targets and acquirers are from themachinery and electronics industry and the lowest num-ber of them are from the wholesale and retail industry.
2.2.2. Quality of investor protection and state expropriationThe indices on shareholder protection and accounting standards were first provided by La Porta et al. (1998). We use the revised
anti-director index from Djankov et al. (2008) as our main measure of the effectiveness of shareholder protection.19Wemultiply theanti-directors indexwith the efficiency of the legal system to obtain the index of shareholder protection.We follow earlier studies andcalculate the corporate governance quality transfer through a cross-border merger as the difference between the shareholder protec-tion index of the acquirer firm and the shareholder protection index of the target firm.20 Expropriation risk variable is extractedfrom the International Country Risk Guide (ICRG).We use the variable called “ICRG Investment Profile”which is defined as the assess-ment of risk of investment due to contract viability/expropriation and profits repatriation.We prefer to use this index to LLSV govern-ment expropriation index because of its time-varying nature. The index ranges from 0 (high expropriation risk) to 12 (lowexpropriation risk). We subtract the index values from 12 so that larger numbers correspond to larger risk of expropriation. Table 1Panel B provides the time-series averages of the state expropriation risk measure across countries. The average scores range from2.34 (Austria) to 6.20 (Argentina). The definitions and sources of all other country-level, firm-level and deal-level variables used inthe paper are provided in Appendix A.
3. Results
3.1. Merger premium: cross-border versus domestic acquisitions
First, we look at the target abnormal returns around acquisition announcements of both the cross-border and domestic M&As inour sample. We use five-day event window, (−2, +2), as our proxy for themerger premium. However, in order to assess themarketimpact of the acquisitions in general, we also look at the event windows with longer horizon. In addition, we use these longer eventwindows for our robustness tests later on. Table 2 reports the average and median CARs for each of the following event windows:(−2, +2), (−5, +5), (−30, +30) and (-30, -3). Our proxy for merger premium has a median of 16.6% (and a mean of 21.7%) forcross-border acquisitions and a median of 15.2% (and a mean of 17%) for domestic acquisitions. During the ten days surroundingan acquisition announcement (for the event window (−5, +5)), cross-border target firms experience a median of 20.3% abnormalreturn and domestic firms experience a median of 15.9 % (both significant at the 1% level). During the two months surrounding anacquisition announcement (for the event window (−30, +30)), cross-border target shareholders realize a 29.7% abnormal return,and domestic targets realize a 20.5% abnormal return (both significant at the 1% level). There is a significant price run-up in days(−30,−3) for targets: 6.6% for cross-border mergers and 5.7% for domestic mergers. The CARs for the cross-border are significantlylarger than the CARs for the domestic acquisitions for all windows.
In order to benchmark our results to prior studies, for our univariate tests we compute matching-acquisition-adjusted CARs(MACARs) for target firms of each cross-border merger in our sample. MACARs are simply calculated as the difference between theCARs of the cross-border merger and the CARs of thematching domestic merger, where thematching is done as described in the pre-vious section. The mean and the median values of MACARs reported in Table 2 for five days surrounding the acquisition announce-ment (for the event window (−2, +2)) are 4.66% and 3.44%, respectively (both significant at 1%).
19 To address Spamann’s (2010) concern that the original anti-director index is not accurate, we use Spamann’s anti- director index as a robustness check. Djankovet al. (2008) also create an anti-self- dealing index, which focuses on private enforcementmechanisms such as disclosure, approval, and litigation. They argue that thislegal control system provides better legal protection for minority shareholders than the anti-director index. For robustness we use their anti-self-dealing index as analternative measure of shareholder rights as well. The results remain unchanged.20 Same methodology is applied to the accounting standards index.
76 B. Col, V. Errunza / Journal of Corporate Finance 33 (2015) 71–84

3.2. Expropriation risk and transfer of investor protection quality
In this section,we investigate the relation between themerger premia and state expropriation aswell as the interaction among thetwin agency problems.21 According to Stulz (2005) expropriation by the state leads to greater consumption of private benefits becauseanymoney the insiders leave in the firmwill be partially expropriated by the state. In addition, better transparency for outside share-holders also implies beingmore transparent to the state, and therefore, may have additional costs in predatory states. Previous studieshave shown the value in transferring better institutions that provide better governance andmore transparency through cross-bordermergers (Bris and Cabolis, 2008; Chari et al., 2010; Martynova and Renneboog, 2008). However, with predation the value of thesetransfers are in question. If the twin agency theory holds, then the value in better protection brought by the acquirer is mitigatedby the target state expropriation risk. We, therefore, explore the valuation effects of corporate governance transfers in the presenceof state expropriation.
3.2.1. Univariate resultsIn Table 3, we first classifymergerswith respect to themedian of the state expropriation index of the target country.We report the
medians for both the matching-adjusted and unadjusted returns. The upper section of Panel A on Table 3 shows that, adjusting by amatching domestic acquisition, adjusted premia are significantly larger for the cross-border mergers when target state expropriationrisk is below median (5.57% compared to 0.86%, the difference is significant at 5%).22 When we look at the premia differences sepa-rately for the cross-border and the domestic mergers, the numbers are not inconsistent with our hypothesis as we should observelower premia for the cross-border targets under predatory states but not for the domestic ones. The premia differences in Panel Ashow that the median is lower for those in cross-border deals (15.25% versus 17.36%, though not significant) whereas it is higherfor the domestic deals (15.47% versus 13.73%).
We also investigate if acquirer state expropriation risk is an important factor. In the lower section of Panel A, we report the medianunadjusted and adjusted CARs for target firms based on the expropriation risk of both target and the acquirer country. While we recog-nize that the CARs appear to be relatively smaller when acquirer is from a country with a higher expropriation risk than the target; themedian differences are not statistically significant.We, thus focus on target state expropriation risk for the remaining part of our analysis.
Next, we classify cross-border mergers relative to the investor protection indices of target and acquirer firms as well as the targetstate expropriation risk.We use two different indices for the quality of the investor protection: shareholder protection and accountingstandards. Panel B of Table 3 shows that both the adjusted and unadjusted merger premia are larger when the acquirer shareholderprotection is better than the target’s compared to the acquisitions where target shareholder protection is better than the acquirer’s.This is consistentwith earlier literature showing that better shareholder protection in the acquirer’s country results in a highermergerpremium.Whenwe decompose the sample into twowith respect to target state expropriation risk, we find that the difference in pre-mium due to better shareholder protection of the acquirer is only significant in the below-median-expropriation risk sample. To bespecific, for the low expropriation risk sample, the median premium is 19% when the acquirer has better shareholder protectionand 12.35%when the opposite is true (the difference is significant at 1%). However, for the high expropriation risk sample, the differ-ences in premia between the two subsamples are not statistically significant indicating that the differences in shareholder protectiondo not determine themerger premium. The univariate results withmatching-adjusted premia in the lower panel are consistent withthe results with the unadjusted premia.23
21 After themerger, the target firm becomes subject to the government policies in the country of the acquiring company as well as to those in its home country. Sincethe merger premium should reflect market expectations of potential wealth creation from the merger, we also checked whether the acquirer state expropriation riskhas any valuation impact on target returns. Our findings are consistent with the main results that focus on target state expropriation.22 We also use alternative cut-off points to classify the target countries with respect to state expropriation risk. The difference between adjusted premia remains sig-nificantly larger for acquisitions when target state expropriation risk is below the mean or the 75th percentile.23 Panel B of Table 3 also tells us that it is 2.7 timesmore likely that the acquirer has lower or equal shareholder protection relative to the target. This is due to the factthat our sample is dominated by cases where the target is a US, a UK or a Canadian firm, the countries with the strongest shareholder rights. We address this in therobustness section.
Table 2Cumulative abnormal announcement returns for target firms.
Mean Median
Cross-border Domestic Difference(p-value)
Cross-border Domestic Difference(p-value)
CAR (−2, +2) 21.72%*** 17.06%*** (0.0000) 16.61%*** 15.23%*** (0.0011)CAR (−5, +5) 24.59%*** 18.67%*** (0.0000) 20.27%*** 15.90%*** (0.0000)CAR (−30, −3) 8.64%*** 4.68%*** (0.0013) 6.59%*** 5.69%*** (0.0237)CAR (−30, +30) 32.01%*** 18.68%*** (0.0000) 29.69%*** 20.45%*** (0.0000)MACAR (−2, +2) 4.66%*** 3.44%***
The table provides mean and median cumulative abnormal returns (CARs) for the targets of the final sample of 902 cross-border and matching domestic acquisitions.CARs are reported for various windows around the announcement day. CAR is calculated using themarketmodel, where the parameters are estimated over the periodstarting 250 days to 42 days prior to the announcement using theMSCI world index and the local market index as the regressors in themarketmodel. All event returnsarewinsorized at the .5% and 99.5% level.MACARs are calculated as the difference between the CARs of the cross-bordermerger and the CARs of thematching domesticmerger. The significance level of median is based on Wilcoxon signed-rank test. Tests of median differences are based on Wilcoxon rank sum test. The difference inmeans t-test assumes unequal variances. p-values are reported in parentheses. The symbols ***, ** and * denote significance at 1, 5 and 10 percent levels, respectively.
77B. Col, V. Errunza / Journal of Corporate Finance 33 (2015) 71–84

Whenwe look at the accounting standards for the overall sample, the unadjusted premia results are consistentwith those that usethe shareholder protection indices. For the overall sample, merger premium is higher when acquirers have better accounting stan-dards. After taking the target state expropriation risk into account, the higher merger premia due to better accounting standards ofthe acquirers are only pronounced for low state expropriation risk targets (20.91% versus 12.42%, significant at 1%). In the lowerpanel, after adjusting with a matching domestic acquisition, better accounting standards in the acquirer’s country relative to the tar-get’s country results in a lower adjusted premium, but the difference is not statistically significant.Whenwe classify the sample againdepending on the target state expropriation, for targets with low state expropriation risk, the accounting standards difference in ac-quirer versus target country does not affect the matched merger premium. For targets with high state expropriation risk, the marketdoes not reward targets that can potentially adopt the better accounting standards of the acquirer. Overall, these results suggest thatvalue of the transfer of better shareholder protection and accounting standards depends on the target country’s government policiestowards firms. However, these univariate resultsmay also be driven bymany other factors. Therefore, in the next sectionwe runmul-tivariate fixed-effect regressions to account for these factors.
3.2.2. Multivariate resultsIn this section,we explore the relation between themerger premiumand target state expropriation, aswell as the value effects of the
interaction between investor protection and predatory government policies after controlling for other factors.We control country char-acteristics such as differences between the economic development of the acquirer nation and the target nation. Our proxy for economicdevelopment is GDP per capita. The regulatory environment regarding mergers may also affect the competition in the market for cor-porate control, and hence the merger premia. We therefore construct a dummy variable that equals one when the country has merger
Table 3Median target CARs and state expropriation risk.
Panel A
Target State Expropriation Risk
Below Median Above Median Difference (p-value)
Cross-border CAR 17.36%*** 15.25%*** (0.1798)Domestic CAR 13.73%*** 15.47%*** (0.0410)Matching Acquisition-adjusted CAR (MACAR) 5.57%*** 0.86% (0.0224)N 439 463
State Expropriation Risk
Acquirer is more riskythan the target (1)
Acquirer is less riskythan the target (2)
Acquirer is equallyrisky as the target
Difference (1)−(2)(p-value)
Cross-border CAR 14.97%*** 17.47%*** 17.83%*** (0.1750)Matching Acquisition-adjusted CAR (MACAR) 1.83%** 3.46%*** 4.69%** (0.5612)N 341 319 242
Panel B
Quality of Investor Protection Shareholder protection Accounting standards
State Expropriation Risk State Expropriation Risk
All BelowMedian
AboveMedian
N All BelowMedian
AboveMedian
N
Cross-border CARs Acquirer N Target 18.78%*** 19.00%*** 18.41%*** 243 18.35%*** 20.91%*** 14.35%*** 489Acquirer b Target 13.34%*** 12.35%*** 14.89%*** 659 14.38*** 12.42%*** 16.42%*** 413Difference (p-value) (0.0002) (0.0000) (0.7063) (0.0711) (0.0034) (0.2317)N 902 439 463 902 439 463
State Expropriation Risk State Expropriation Risk
All BelowMedian
AboveMedian
N All BelowMedian
AboveMedian
N
Matching Acquisition-adjusted CAR (MACAR) Acquirer N Target 4.64%*** 8.01%*** 0.59% 243 1.78%** 5.30%** −1.21% 489Acquirer b Target 2.11%** 4.94%*** 1.27% 659 5.77%*** 6.86%*** 4.66%*** 413Difference (p-value) (0.0869) (0.0878) (0.7101) (0.2040) (0.7852) (0.0144)N 902 439 463 902 439 463
The table showsmedian CARs andmatching-acquisition adjusted CARs (MACARs) for the target firms during a five-day event window around cross-bordermerger an-nouncements. CAR is calculated using themarket model, where the parameters are estimated over the period starting 250 days to 42 days prior to the announcementusing the MSCI world index and the local market index as the regressors in the market model. All event returns are winsorized at the .5% and 99.5% level. MACARs arecalculated as the difference between the CARs of the cross-border merger and the CARs of the matching domestic merger. We report the median of the MACARs. Weclassify deals based on the index of state expropriation of the target country and then also based on the indices of investor protection of the target and acquirer country.State expropriation index is increasing in the expropriation risk. The significance tests are based on Wilcoxon signed-rank test. Tests of differences are based onWilcoxon rank sum test. p-values are reported in parentheses. The symbols ***, ** and * denote significance at 1, 5 and 10 percent levels, respectively.
78 B. Col, V. Errunza / Journal of Corporate Finance 33 (2015) 71–84

control laws inplace in the year of announcement of the corresponding cross-bordermerger, and equals zero otherwise. Both theoreticaland empirical M&A literature has shown that deal characteristics affect merger premia. Hence we control for the following deal charac-teristics: the attitude of the deal (hostile versus friendly), the industry relatedness of the target and the acquirer (focused versus diver-sifying), means of payment (all cash, all stock or mixed) and the number of bidders (Bradley et al., 1988). We also control for the ADRlisting of target firms, which is an alternativeway of committing to a higher quality of investor protection (Doidge et al., 2004).We con-struct a dummy that equals one when the target firm has an ADR listed at the time of themerger announcement and zero otherwise.24
Finally, we use pre-announcement stock price run-up to control for the prior stock performance as well as other stock-specific issues(such as illiquidity) that could potentially influence merger premium. Since we are using dollar returns, we do not separately controlfor exchange rate changes, which determine target returns and the frequency of cross-border acquisitions (Erel et al., 2012).
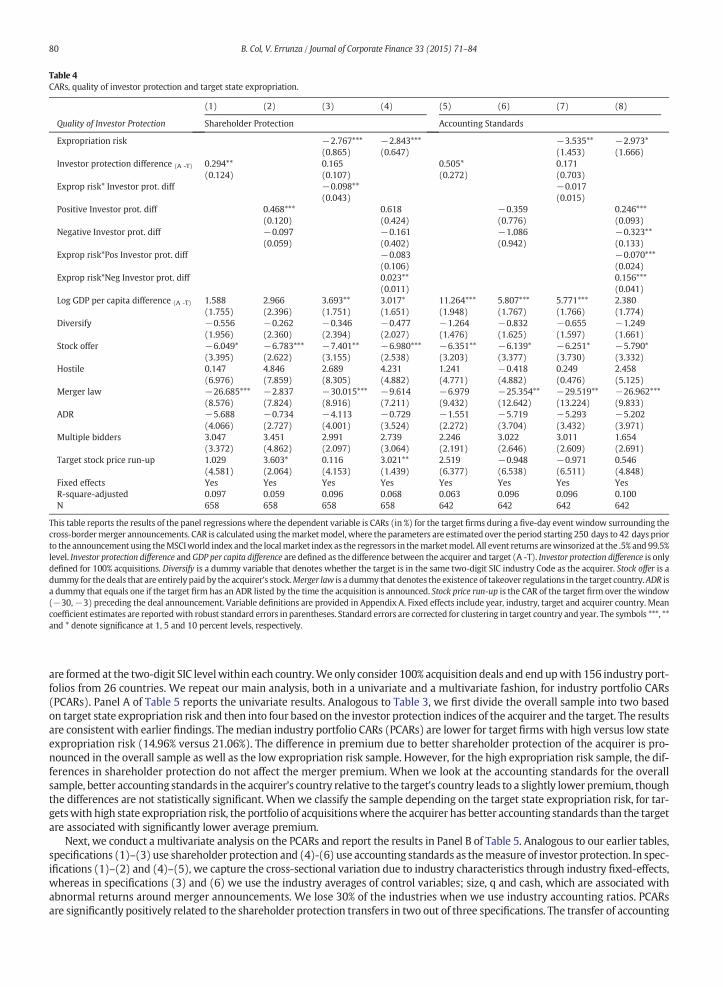
Table 4 reports our results.We startwith regressions that only include investor protection to benchmark our results to recent stud-ies. Bris and Cabolis (2008) results show that the difference in shareholder protection and accounting standards between the twocountries involved explainsmerger premia.25 Therefore, inmodel (1)we regress themerger premiumon the difference in sharehold-er protection indices between the acquirer and the target in 100% acquisitions. Our results confirm their findings. The merger premi-um is significantly larger in acquisitions forwhich the shareholder protection of the acquirer is better than the target’s. A one standarddeviation increase in the difference in shareholder protection results in 4.5% increase in the average premium.26We then split the cor-porate governance index differences into positive and negative values to seewhether the value effects of the transfer are symmetric.27
Our results suggest that it is not. In model (2), the coefficient is only significant for the positive shareholder protection difference im-plying that the shareholders of a target firm that is acquired by a firm from a stronger shareholder protection environment receive asignificantly larger premiumwhile those acquired by a firm from a weaker shareholder protection environment do not receive a sig-nificantly lower premium.28
In model (3), we include the expropriation risk index of the target country, alongside its interaction with the shareholder protec-tion difference. We use the differences in shareholder protection and accounting standards, not the levels, in order to avoid the arti-facts of collinearity. Though the correlations between expropriation risk and investor protection are high for levels, they are muchlower for differences.29 If the value in better protection brought by the acquirer is mitigated by the target state expropriation risk,wewould expect the interaction to have a negative coefficient. The results suggest that the targetswith predatory states receive a sig-nificantly lower premium. The discount due to target state expropriation is economically significant. A one standard deviation in-crease in expropriation risk decreases the premium by 4.57%, which is 21% of the average cross-border merger premium.30 Whenwe include state expropriation risk, the coefficient on shareholder protection difference is no longer significant. The negative coeffi-cient on the interaction term of expropriation risk with shareholder protection transfer suggests that the positive value of better in-vestor protection transfer ismitigated by the target state expropriation risk.Model (4) indicates further evidence for this relation. Thenegative difference in indices, which implies a lower premium when targets are acquired by a firm from a weaker shareholder pro-tection environment under no risk of expropriation, now implies a larger premium for those targets under risk of expropriation.The coefficients on the control variables are mostly consistent with the previous M&A studies. Acquisitions that are paid by stockare associated with significantly lower premia in all specifications. Moreover, the coefficients on the industry diversification havethe expected signs though they are not significant. The positive coefficients of the GDP per capita difference between the acquirerand the target suggest a higher premium for the targets that are acquired by more developed acquirers. The proxies for the competi-tion in themarket for corporate control (multiple bidders andmerger laws indicators) also have the expected signs. Finally, in some ofthe specifications, target pre-announcement stock price run-up has significantly positive effects on the premia.
We run similar regressions, models (5)-(8), using accounting standards as proxy for the quality of investor protection. The resultsare similar to those with the shareholder protection. The transfer of better accounting standards hence more transparency is associ-atedwith highermerger premiumonly in the absence of state expropriation.Overall, these results provide evidence for the twin agen-cy problems.31 The exogenous shocks to corporate governance are valued differently in the presence of state expropriation.
3.3. Portfolio approach
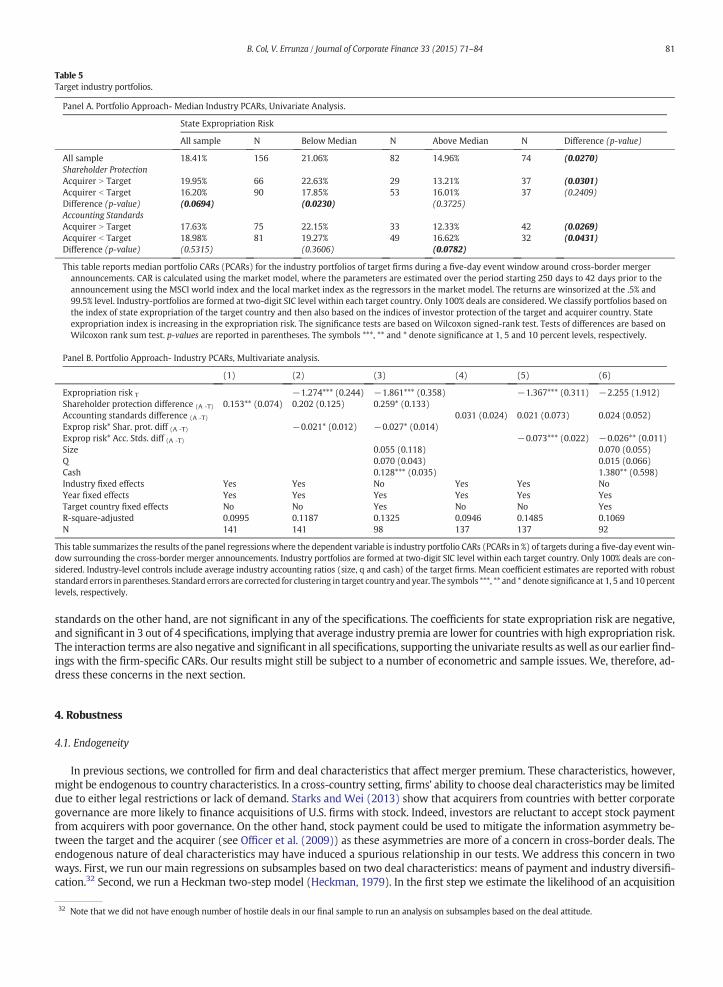
In this section, in order to reduce problems associated with correlated errors, we form portfolios of individual target firms in agiven industry within each country and calculate an average premium for these target portfolios. Averaging premia at the portfoliolevel also helps averaging deal-specific synergies at the industry-level, thusmaking the testsmore efficient. Target-industry portfolios
24 We also take into accountwhether the acquirer has anADR. This is important since some of these acquirers are largemultinational that are based in low governancecountries but are bonded to stronger regulations via ADRs. When we exclude those we lose 21.6% of our acquirers, but the main results do not change.25 They also show that it is significant only for 100% acquisitions. Thus, in our multivariate tests we define investor protection difference only for 100% acquisitions.26 The number is calculated as 0.294*15.3, where 15.3 is the standard deviation of the difference in shareholder protection for 100% acquisitions.27 In Table 3, observations where there was no difference in investor protection were included with the negative protection difference; however, in this section theyare excluded so that when we use the interaction, the coefficient on expropriation risk could be identified.28 This result is also consistent with Bris and Cabolis (2008) and Martynova and Renneboog (2008) results.29 We report the correlations in the Appendix B.30 The number is calculated as−2.767*1.65, where 1.65 is the standard deviation of the target state expropriation risk. The average cross-border premium is 21.7% asreported in Table 2.31 We also testwhether insider ownership has any effect on the value of corporate governance transfers andwhether state expropriationmatters for this relationship.We use insider ownership fromWorldscope measured as the percentage of closely held shares relative to the total shares outstanding. In unreported results, we findthat higher insider ownership prior to the merger reduces the adverse impact of poor country governance particularly for targets that operate under predatory states.These results are consistent with Stulz’s argument that that higher insider ownership is optimal especially for firms that face twin agency problems.
79B. Col, V. Errunza / Journal of Corporate Finance 33 (2015) 71–84
are formed at the two-digit SIC levelwithin each country.We only consider 100% acquisition deals and endupwith 156 industry port-folios from 26 countries. We repeat our main analysis, both in a univariate and a multivariate fashion, for industry portfolio CARs(PCARs). Panel A of Table 5 reports the univariate results. Analogous to Table 3, we first divide the overall sample into two basedon target state expropriation risk and then into four based on the investor protection indices of the acquirer and the target. The resultsare consistent with earlier findings. Themedian industry portfolio CARs (PCARs) are lower for target firmswith high versus low stateexpropriation risk (14.96% versus 21.06%). The difference in premium due to better shareholder protection of the acquirer is pro-nounced in the overall sample as well as the low expropriation risk sample. However, for the high expropriation risk sample, the dif-ferences in shareholder protection do not affect the merger premium. When we look at the accounting standards for the overallsample, better accounting standards in the acquirer’s country relative to the target’s country leads to a slightly lower premium, thoughthe differences are not statistically significant. When we classify the sample depending on the target state expropriation risk, for tar-getswith high state expropriation risk, the portfolio of acquisitionswhere the acquirer has better accounting standards than the targetare associated with significantly lower average premium.
Next, we conduct a multivariate analysis on the PCARs and report the results in Panel B of Table 5. Analogous to our earlier tables,specifications (1)–(3) use shareholder protection and (4)-(6) use accounting standards as themeasure of investor protection. In spec-ifications (1)–(2) and (4)–(5), we capture the cross-sectional variation due to industry characteristics through industry fixed-effects,whereas in specifications (3) and (6) we use the industry averages of control variables; size, q and cash, which are associated withabnormal returns around merger announcements. We lose 30% of the industries when we use industry accounting ratios. PCARsare significantly positively related to the shareholder protection transfers in two out of three specifications. The transfer of accounting
Table 4CARs, quality of investor protection and target state expropriation.
(1) (2) (3) (4) (5) (6) (7) (8)
Quality of Investor Protection Shareholder Protection Accounting Standards
Expropriation risk −2.767***(0.865)
−2.843***(0.647)
−3.535**(1.453)
−2.973*(1.666)
Investor protection difference (A -T) 0.294**(0.124)
0.165(0.107)
0.505*(0.272)
0.171(0.703)
Exprop risk* Investor prot. diff −0.098**(0.043)
−0.017(0.015)
Positive Investor prot. diff 0.468***(0.120)
0.618(0.424)
−0.359(0.776)
0.246***(0.093)
Negative Investor prot. diff −0.097(0.059)
−0.161(0.402)
−1.086(0.942)
−0.323**(0.133)
Exprop risk*Pos Investor prot. diff −0.083(0.106)
−0.070***(0.024)
Exprop risk*Neg Investor prot. diff 0.023**(0.011)
0.156***(0.041)
Log GDP per capita difference (A -T) 1.588(1.755)
2.966(2.396)
3.693**(1.751)
3.017*(1.651)
11.264***(1.948)
5.807***(1.767)
5.771***(1.766)
2.380(1.774)
Diversify −0.556(1.956)
−0.262(2.360)
−0.346(2.394)
−0.477(2.027)
−1.264(1.476)
−0.832(1.625)
−0.655(1.597)
−1.249(1.661)
Stock offer −6.049*(3.395)
−6.783***(2.622)
−7.401**(3.155)
−6.980***(2.538)
−6.351**(3.203)
−6.139*(3.377)
−6.251*(3.730)
−5.790*(3.332)
Hostile 0.147(6.976)
4.846(7.859)
2.689(8.305)
4.231(4.882)
1.241(4.771)
−0.418(4.882)
0.249(0.476)
2.458(5.125)
Merger law −26.685***(8.576)
−2.837(7.824)
−30.015***(8.916)
−9.614(7.211)
−6.979(9.432)
−25.354**(12.642)
−29.519**(13.224)
−26.962***(9.833)
ADR −5.688(4.066)
−0.734(2.727)
−4.113(4.001)
−0.729(3.524)
−1.551(2.272)
−5.719(3.704)
−5.293(3.432)
−5.202(3.971)
Multiple bidders 3.047(3.372)
3.451(4.862)
2.991(2.097)
2.739(3.064)
2.246(2.191)
3.022(2.646)
3.011(2.609)
1.654(2.691)
Target stock price run-up 1.029(4.581)
3.603*(2.064)
0.116(4.153)
3.021**(1.439)
2.519(6.377)
−0.948(6.538)
−0.971(6.511)
0.546(4.848)
Fixed effects Yes Yes Yes Yes Yes Yes Yes YesR-square-adjusted 0.097 0.059 0.096 0.068 0.063 0.096 0.096 0.100N 658 658 658 658 642 642 642 642
This table reports the results of the panel regressionswhere the dependent variable is CARs (in %) for the target firms during a five-day event window surrounding thecross-bordermerger announcements. CAR is calculated using themarketmodel, where the parameters are estimated over the period starting 250 days to 42 days priorto the announcement using theMSCIworld index and the localmarket index as the regressors in themarketmodel. All event returns arewinsorized at the .5% and 99.5%level. Investor protection difference andGDP per capita difference are defined as the difference between the acquirer and target (A -T). Investor protection difference is onlydefined for 100% acquisitions. Diversify is a dummy variable that denotes whether the target is in the same two-digit SIC industry Code as the acquirer. Stock offer is adummy for the deals that are entirely paid by the acquirer’s stock.Merger law is a dummy that denotes the existence of takeover regulations in the target country.ADR isa dummy that equals one if the target firm has an ADR listed by the time the acquisition is announced. Stock price run-up is the CAR of the target firm over the window(−30,−3) preceding the deal announcement. Variable definitions are provided in Appendix A. Fixed effects include year, industry, target and acquirer country. Meancoefficient estimates are reportedwith robust standard errors in parentheses. Standard errors are corrected for clustering in target country and year. The symbols ***, **and * denote significance at 1, 5 and 10 percent levels, respectively.
80 B. Col, V. Errunza / Journal of Corporate Finance 33 (2015) 71–84
standards on the other hand, are not significant in any of the specifications. The coefficients for state expropriation risk are negative,and significant in 3 out of 4 specifications, implying that average industry premia are lower for countries with high expropriation risk.The interaction terms are also negative and significant in all specifications, supporting the univariate results aswell as our earlier find-ings with the firm-specific CARs. Our results might still be subject to a number of econometric and sample issues. We, therefore, ad-dress these concerns in the next section.
4. Robustness
4.1. Endogeneity
In previous sections, we controlled for firm and deal characteristics that affect merger premium. These characteristics, however,might be endogenous to country characteristics. In a cross-country setting, firms’ ability to choose deal characteristicsmay be limiteddue to either legal restrictions or lack of demand. Starks and Wei (2013) show that acquirers from countries with better corporategovernance are more likely to finance acquisitions of U.S. firms with stock. Indeed, investors are reluctant to accept stock paymentfrom acquirers with poor governance. On the other hand, stock payment could be used to mitigate the information asymmetry be-tween the target and the acquirer (see Officer et al. (2009)) as these asymmetries are more of a concern in cross-border deals. Theendogenous nature of deal characteristics may have induced a spurious relationship in our tests. We address this concern in twoways. First, we run our main regressions on subsamples based on two deal characteristics: means of payment and industry diversifi-cation.32 Second, we run a Heckman two-step model (Heckman, 1979). In the first step we estimate the likelihood of an acquisition
32 Note that we did not have enough number of hostile deals in our final sample to run an analysis on subsamples based on the deal attitude.
Table 5Target industry portfolios.
Panel A. Portfolio Approach- Median Industry PCARs, Univariate Analysis.
State Expropriation Risk
All sample N Below Median N Above Median N Difference (p-value)
All sample 18.41% 156 21.06% 82 14.96% 74 (0.0270)Shareholder ProtectionAcquirer N Target 19.95% 66 22.63% 29 13.21% 37 (0.0301)Acquirer b Target 16.20% 90 17.85% 53 16.01% 37 (0.2409)Difference (p-value) (0.0694) (0.0230) (0.3725)Accounting StandardsAcquirer N Target 17.63% 75 22.15% 33 12.33% 42 (0.0269)Acquirer b Target 18.98% 81 19.27% 49 16.62% 32 (0.0431)Difference (p-value) (0.5315) (0.3606) (0.0782)
This table reports median portfolio CARs (PCARs) for the industry portfolios of target firms during a five-day event window around cross-border mergerannouncements. CAR is calculated using the market model, where the parameters are estimated over the period starting 250 days to 42 days prior to theannouncement using the MSCI world index and the local market index as the regressors in the market model. The returns are winsorized at the .5% and99.5% level. Industry-portfolios are formed at two-digit SIC level within each target country. Only 100% deals are considered. We classify portfolios based onthe index of state expropriation of the target country and then also based on the indices of investor protection of the target and acquirer country. Stateexpropriation index is increasing in the expropriation risk. The significance tests are based on Wilcoxon signed-rank test. Tests of differences are based onWilcoxon rank sum test. p-values are reported in parentheses. The symbols ***, ** and * denote significance at 1, 5 and 10 percent levels, respectively.
Panel B. Portfolio Approach- Industry PCARs, Multivariate analysis.
(1) (2) (3) (4) (5) (6)
Expropriation risk T −1.274*** (0.244) −1.861*** (0.358) −1.367*** (0.311) −2.255 (1.912)Shareholder protection difference (A -T) 0.153** (0.074) 0.202 (0.125) 0.259* (0.133)Accounting standards difference (A -T) 0.031 (0.024) 0.021 (0.073) 0.024 (0.052)Exprop risk* Shar. prot. diff (A -T) −0.021* (0.012) −0.027* (0.014)Exprop risk* Acc. Stds. diff (A -T) −0.073*** (0.022) −0.026** (0.011)Size 0.055 (0.118) 0.070 (0.055)Q 0.070 (0.043) 0.015 (0.066)Cash 0.128*** (0.035) 1.380** (0.598)Industry fixed effects Yes Yes No Yes Yes NoYear fixed effects Yes Yes Yes Yes Yes YesTarget country fixed effects No No Yes No No YesR-square-adjusted 0.0995 0.1187 0.1325 0.0946 0.1485 0.1069N 141 141 98 137 137 92
This table summarizes the results of the panel regressionswhere the dependent variable is industry portfolio CARs (PCARs in %) of targets during a five-day event win-dow surrounding the cross-border merger announcements. Industry portfolios are formed at two-digit SIC level within each target country. Only 100% deals are con-sidered. Industry-level controls include average industry accounting ratios (size, q and cash) of the target firms. Mean coefficient estimates are reported with robuststandard errors in parentheses. Standard errors are corrected for clustering in target country and year. The symbols ***, ** and * denote significance at 1, 5 and 10percentlevels, respectively.
81B. Col, V. Errunza / Journal of Corporate Finance 33 (2015) 71–84

beingfinancedwith cash rather than stock and the likelihood of a diversifying acquisition rather than a non-diversifying acquisition. Inthe second step, we use the predicted values of those likelihoods rather than the dummy variables we used previously.
Table C.1 in the Appendix reports the results of themultivariate regressions by deal types. The first two columns are based on pay-mentmethod and the last two are based on industry diversification. In all of the subsamples, the signs of the coefficients are consistentwith the previous findings. Remarkably, the discount on premium due to target state expropriation risk is significant in all specifica-tions The negative coefficient on the interaction term remains significant except for non-diversifying acquisitions.
Next, we report the results of the two-step estimation. Panel A of Table C.2 reports the probit regressions where we test whetherthe likelihood of the deal being financed by cash or being diversifying depends on target and acquirer country characteristics.We findevidence consistent with the literature. The targets that have stronger shareholder protection are more likely to be paid for with cashand the likelihood is decreasing in the difference between the indices. We also find that acquirers with state expropriation risk aremore likely to finance the acquisitionswith cash. This may be because acquirer stock is selling at a discount due to the state expropri-ation risk. Neither corporate governance nor the state expropriation risk, however, has an effect on the likelihood of the deal beingdiversifying. Using the predicted values of the likelihoods that are estimated in columns (2) and (4) in Panel A, we run the secondstep regressions that are analogous to our main regressions. We report the results in Panel B of Table C.2. After accounting forendogeneity, the results mainly remain consistent.33
4.2. Sample selection bias
The decision to participate in a cross-border acquisition is an endogenous choice made by the target and acquirer firms. Target oracquirer government policiesmay affect the decision to participate in a cross-borderM&A. To our knowledge, none of the studies haveshown the effects of these policies on the intensity of cross-border M&As.34 We, thus, first run a probit regression on the initial SDCsample and estimate the probability that a target firm will take a cross-border rather than a domestic deal. The results are reportedin Panel A of Table C.3. The explanatory variables are based on the studies on the determinants of FDI and cross-border M&As (Seefor example Erel et al., 2012; Makaew, 2012; Rossi and Volpin, 2004). The results of the selection equation support previous findingsthat target firms are more likely to sell their shares to a foreign acquirer if the investor protection is weak in the target country. Theresults also show that a firm is less likely to be a target in a cross-border acquisition if the target government is predatory. This is notsurprising since studies have shown the detrimental effect of political risk on the volume of FDI inflows to a country. Since the indicesof corporate governance and state expropriation risk are significant, we employ Heckman (1979) procedure.We report the results inPanel B of Table C.3. After controlling for the selection bias, the results continue to hold.
4.3. Alternative measures of state expropriation
Wewould like to ensure that our findings are not specific to the state expropriation measure used. First, we employ a more com-prehensive measure, the ICRG political risk rating, which provides a means of assessing the political stability of the country. It rangesfrom0 (least stable) to 100 (most stable).We subtract the scores from100 so that the higher values indicate greater political risk. Firstthree columns of Table C.4 replicate our tests using this political risk rating. The results are consistent with the earlier findings.
The political risk measures provided by ICRG are usually subject to criticism due to their ex-post nature (see Glaeser et al. (2004)).Ideally, a good proxy for political institutions should capture investors’ ex-ante views of government behavior rather than the ex-postgovernment performance. We therefore use Freedom House (2009) political rights index as an alternative measure to quantify acountry’s overall political environment. Thepolitical rights index ranges fromone to seven,where a lower rating corresponds to stron-ger political rights. Strong political rights indicate a political system that includes free and fair elections, those who are elected rule,competitive political parties or other political groupings, the opposition plays an important role and has actual power, and minoritygroups have reasonable self-government or can participate in the government through informal consensus. We repeat our maintests using this measure and report the results in Table C.4 through columns (4)-(6). The results remain consistent. Overall, these re-sults suggest that our previous findings were not specific to our state expropriation measure.
4.4. Multicollinearity issues
A common limitation of the international studies is that country-level indices regarding the legal and political institutions are high-ly correlated.35 In our main tests, we use a pooled sample and an interaction term to test the relationship between corporate gover-nance transfers and state expropriation. Even though we use the transfer of governance (the difference between the acquirer andtarget investor protection) rather than the target corporate governance in our analysis, we still would like to establish that the signif-icance on the interaction term is not an artifact of correlated terms.36 We, therefore, first run our regressions on valuation effects ofcorporate governance transfers for two subsamples: (1) acquisitions where the target state expropriation risk is higher than the me-dian and (2) acquisitions where the target state expropriation risk is lower than the median. Our results are reported in Table C.5.
33 The lambda coefficients (Mill’s ratio) are significant for the means of payment suggesting evidence of endogeneity.34 Although the importance of changes in political institutions and the influence of relevant policies in host countries have received considerable attention in overallFDI literature. See for example Jun and Singh (1996), Jensen (2003) and Gastanaga et al. (1998).35 We report the correlations table for our variables of interest in the Appendix B.36 We thank Bo Becker for pointing out this issue.
82 B. Col, V. Errunza / Journal of Corporate Finance 33 (2015) 71–84

Overall, the transfer of better transparency and shareholder protection is associated with higher premium only for targets with lowstate expropriation risk.
Next, we repeat our tests using firm-level corporate governance practices. In a domestic M&A study, Wang and Xie (2009) usefirm-level corporate governance scores and find that the difference between shareholder rights has significant positive effects onboth target, and bidder announcement returns.We use corporate governance ratings that are provided under Intangible ValueAssess-ment (IVA) rating model by the Institutional Shareholder Services (ISS). The ratings are mostly concerned with board structure andshareholder rights and are provided for an international sample of firms, which constitute the MSCI index. In our M&A sample,only 37 observations have the firm-level corporate governance rating available for both the acquirer and the target firm. We repeatourmain regressions using this sample and report the results in Table C.6.37We recognize that the rather small sample sizemay affectthe power of our tests. Nonetheless, our main results carry through. Overall, these results are consistent with our main findings andsuggest that the value of the corporate governance transfers is contingent on target state policies.
4.5. Alternative samples and event windows
Our sample is dominated by U.S., U.K. and Canadian firms. It is thus possible that our results come from the differences betweenthese three countries and the others. Therefore, in this section we replicate them, first excluding each of these countries separately,and then altogether from our sample. We lose 43% of the initial sample when we exclude U.S., 17% of the observations when we ex-clude U.K and 9% of the sample when we exclude Canadian target firms. Table C.7 reports the results. The coefficients on the expro-priation risk remain negative in all alternative samples and significant in three out of the four subsamples. The transfer of shareholderprotection, when included alone is significantly positive for samples that exclude U.S. only, Canada only as well as all three countriestogether. It is, however, not significant when we exclude U.K targets alone. The interaction term is negative and significant when weexcludeU.S., U.K, Canadian targets separately aswell aswhenwe exclude them altogether. Thus, our results are robust to such countryexclusions.
So far our analysis is based on themerger premiummeasured around a five-day eventwindow. As the leakage of the news is likelyto start earlier and the market reactions could drag over a longer period, in this section we use longer event windows to check therobustness of our main results.38 Table C.8 shows that the main results continue to hold when the dependent variables are CARsfor the event windows (−5. +5) and (−30. +30).
5. Conclusion
Recent studies show that the transfer of corporate governance structure across borders has significant valuation consequences.However, it is important to consider the valuation effect of expropriation risk by the state as well as the interaction among the socalled “twin agency problems”. According to “twin agency theory” (Stulz, 2005), expropriation by the state leads to greater consump-tion of private benefits because anymoney the insiders leave in the firmwill be partially expropriated by the state. In addition, bettertransparency for outside shareholders also implies being more transparent to the state, and therefore, may have additional costs inpredatory states. Previous studies have shown the value in transferring better institutions that provide better governance and moretransparency through cross-border mergers. However, in the presence of state expropriation, it may be optimal for firms to operatewith poorer governance and disclose less information. Therefore, the value of cross-border transfer of better governance and moredisclosure is also in question under predation.
In this paper, we look at themerger premium for cross-border merger targets. We find that targets that operate in states with ex-propriation risk receive a significantly lower premium.We also show that the exogenous shocks to corporate governance are valueddifferently in the presence of state expropriation.Without state expropriation, the cross-border merger premium is significantly larg-er for acquisitionswhere acquirer shareholders are better protected than the target shareholders. However, we find that under risk ofexpropriation, better protection transfer is associatedwith a lower premium.We interpret thesefindings as such that the target share-holders are not fully rewarded for the improvement in firm governance since the benefits of improvement is very likely mitigatedwhen the state is predatory. Our findings are similarwhenwe look at the transfer of accounting standards instead of shareholder pro-tection. Overall, our results suggest that the value of the transfer of better shareholder protection and accounting standards dependson the target country’s government policies towards firms. We thus provide evidence on the valuation impact of twin-agency prob-lems through cross-border mergers.
Appendix A. Supplementary data
Supplementary data to this article can be found online at http://dx.doi.org/10.1016/j.jcorpfin.2015.04.005.
References
Beaulieu, M.C., Cosset, J.C., Essaddam, N., 2005. The impact of political risk on the volatility of stock returns: The case of Canada. J. Int. Bus. Stud. 36 (6), 701–718.Bebchuk, L.A., Cohen, A., 2005. The costs of entrenched boards. J. Financ. Econ. 78, 409–433.
37 Note that this is the largest sample we can obtain for our mergers and acquisitions dataset.38 We thank an anonymous referee for this suggestion.
83B. Col, V. Errunza / Journal of Corporate Finance 33 (2015) 71–84

Boutchkova, M., Durnev, A., Doshi, H., Molchanov, A., 2012. Precarious politics and return volatility. Rev. Financ. Stud. 25, 1111–1154.Bradley, M., Desai, A., Kim, H., 1988. Synergistic gains from corporate acquisitions and their division between the stockholders of target and acquiring firms. J. Financ.
Econ. 21 (1), 3–40.Bris, A., Cabolis, C., 2008. The value of investor protection: firm evidence from cross-border mergers. Rev. Financ. Stud. 21, 605–648.Chakrabarti, R., Jayaraman, N., Gupta-Mukherjee, S., 2009. Mars-venus marriages: culture and cross-border M&A. J. Int. Bus. Stud 40, 216–236.Chari, A., Oimet, P.P., Tesar, L.L., 2010. The value of control in emerging markets. Rev. Financ. Stud. 23, 1741–1770.Cosset, J.C., Martineau, C., Samet, A., 2014. Do political institutions affect the choice of the US cross-listing venue? J. Multl. Financ. Manag. 27, 22–48.Desai, M., Dharmapala, D., 2006. Corporate tax avoidance and high-powered incentives. J. Financ. Econ. 79, 145–179.Desai, M., Dyck, A., Zingales, L., 2007. Theft and taxes. J. Financ. Econ. 84, 591–623.Djankov, S., La Porta, R., Lopez-de-Silanes, F., Shleifer, A., 2008. The law and economics of self-dealing. J. Financ. Econ. 88, 430–465.Doidge, C., Karolyi, G.A., Stulz, R.M., 2004. Why are foreign firms listed in the U.S. worth more? J. Financ. Econ. 71, 205–238.Durnev, A., Fauver, L., 2011. Stealing from thieves. Working paper. University of Iowa.Durnev, A., Errunza, V., Molchanov, A., 2009. Property rights protection, corporate transparency and growth. J. Int. Bus. Stud. 40, 1533–1562.Ellis, J., Moeller, S., Schlingemann, F.P., Stulz, R.M., 2012. Globalization, governance and returns to cross-border acquisitions. NBER Working Paper #16676.Erel, I., Liao, R.C., Weisbach, M.S., 2012. Determinants of cross-border mergers and acquisitions. J. Financ. 67 (3), 1045–1082.Feito-Ruiz, I., Menéndez-Requejo, S., 2011. Cross-border mergers and acquisitions in different legal environments. Int. Rev. Law Econ. 31 (3), 169–187.Francis, B.B., Hasan, I., Sun, X., 2008. Financial market integration and the value of global diversification: evidence for U.S. acquirers in cross-border mergers and ac-
quisitions. J. Bank. Financ. 32, 1522–1540.Freedom House, 2009. Annual freedom in the world survey: political rights and civil liberties rating. pp. 1980–2008 http://www.freedomhouse.org.Gastanaga, V., Nugent, J., Pashamova, B., 1998. Host country reforms and FDI inflows: how much difference do they make? World Dev. 26, 1299–1314.Glaeser, E.L., La Porta, R., Lopez-de-Silanes, F., Shleifer, A., 2004. Do institutions cause growth? J. Econ. Growth 9, 271–303.Gompers, P., Ishii, J., Metrick, A., 2003. Corporate governance and equity prices. Q. J. Econ. 118, 107–155.Haber, S., North, D.C., Weingast, B.R., 2008. Political institutions and financial development. Stanford University Press, Stanford, CA.Heckman, J., 1979. Sample selection bias as a specification error. Econometrica 47, 153–161.Jensen, N., 2003. Democratic governance and multinational corporations: political regimes and inflows of foreign direct investment. Int. Organ. 57, 587–616.Jun, K., Singh, H., 1996. The determinants of foreign direct investment in developing countries. Transl. Corp. 5, 67–105.Kuipers, D.R., Miller, D., Patel, A., 2009. The legal environment and corporate valuation: Evidence from cross-border takeovers. Int. Rev. Econ. Financ. 18, 552–657.La Porta, R., Lopez-de-Silanes, F., Shleifer, A., Vishny, R., 1998. Law and finance. J. Polit. Econ. 106, 1113–1147.La Porta, R., Lopez-de-Silanes, F., Shleifer, A., Vishny, R., 2002. Investor protection and corporate valuation. J. Financ. 57, 1147–1170.Lindenberg, E.B., Ross, A.S., 1981. Tobin’s q ratio and industrial organization. J. Bus. 54, 1–32.Makaew, T., 2012. Waves of international mergers and acquisitions. AFA 2012 Chicago meetings paper.Martynova, M., Renneboog, L., 2008. Spillover of corporate governance standards in cross-border mergers and acquisitions. J. Corp. Financ. 14, 200–223.Moeller, S., Schlingemann, F.P., 2005. Global diversification and bidder gains: a comparison between cross-border and domestic acquisitions. J. Bank. Financ. 29,
533–564.Netter, J., Poulsen, A., Stegemoller, M., 2009. The rise of corporate governance in corporate control research. J. Corp. Financ. 15 (1), 1–9.Officer, M.S., Poulsen, A.B., Stegemoller, M., 2009. Target-firm information asymmetry and acquirer returns. Eur. Finan. Rev. 13 (3), 467–493.Qi, Y., Roth, L., Wald, J.K., 2010. Political rights and the cost of debt. J. Financ. Econ. 95, 202–226.Rossi, S., Volpin, P.F., 2004. Cross-country determinants of mergers and acquisitions. J. Financ. Econ. 74, 277–304.Spamann, H., 2010. The “antidirector rights index” revisited. Rev. Financ. Stud. 23 (2), 467–486.Starks, L.T., Wei, K.D., 2013. Cross-border mergers and differences in corporate governance. Int. Rev. Financ. http://dx.doi.org/10.1111/irfi.12008.Stulz, R., 2005. The limits of financial globalization. J. Financ. 60, 1595–1638.Wang, C., Xie, F., 2009. Corporate governance transfer and synergistic gains from mergers and acquisitions. Rev. Financ. Stud. 22, 829–858.
84 B. Col, V. Errunza / Journal of Corporate Finance 33 (2015) 71–84