
pre-owned market - Asian Sky Media
64
AUSTRALIA SECOND QUARTER 2018 UPCOMING AIRCRAFT COUNTRY PROFILE CITATION LATITUDE & LONGITUDE MARKET SUMMARIES SPECIAL FEATURE PRE-OWNED MARKET HAWKER 800 SERIES JETS & HELICOPTERS CHARTER REPORT ASIA-PACIFIC OUTLOOK METRICS & MOOD INTERVIEWS BEI ZHUANG AVION PACIFIC VICE PRESIDENT
-
Upload
khangminh22 -
Category
Documents
-
view
1 -
download
0
Transcript of pre-owned market - Asian Sky Media

AUSTRALIA
SECOND QUARTER 2018
SECON
D Q
UAR
TER 2018
ASIAN SK
Y QU
ARTER
LY
UPCOMING AIRCRAFT
COUNTRY PROFILE
CITATION LATITUDE & LONGITUDE
MARKET SUMMARIES
SPECIAL FEATURE
PRE-OWNED MARKETHAWKER 800 SERIES
JETS & HELICOPTERS
CHARTER REPORT
ASIA-PACIFIC OUTLOOK METRICS & MOOD
INTERVIEWSBEI ZHUANG
AVION PACIFIC VICE PRESIDENT


One of the main objectives of Asian Sky Quarterly is to give our readers valuable insight into current business jet and helicopter market conditions, where we see the changes occurring (market dynamics) and, in the course of doing so, hopefully pass on some enlightenment as to where the market is going. And sometimes this means to understand the market today, we need to look back.
In Q2 2017, after months of question, speculation and doubt, we saw that the market had begun to stabilize and buyers were finally being enticed back by attractive prices and plenty of supply. In a nut shell, the market was awash with great value, the knowledgeable buyers recognized this and jumped in. A great Buyer’s Market.
Fast forward one year to Q2 2018 and what started as a trickle is now a flood. The market has swung almost 180 degrees and we are now seeing the emergence of a Seller’s Market – lower inventory levels and rising prices.
But, this story isn’t as simple as that. Optimism which has been on the rise since Q2 2016, finally plateaued in Q1 2018. Now, we’re seeing a slight change in mood as pessimistic feelings toward the economy are popping up, with Mainland China being the main influencer. The cause? There is, of course, great debate, although most would point a finger at the volatile climate between the US and China.
Still, even with these pessimism tendencies towards the economy, purchase intentions are up and the pre-owned market is very active. This last quarter saw a much higher level of business jet transactions (96) than the second quarters of 2017 (83) and 2016 (70). Average asking prices have also stabilized and the percentage of fleet for sale has declined. All these changing markets dynamics may then get compounded in a twisted way and strangely serve to stimulate demand even more as there is definitely a feeling of “you better buy it now ‘cause in six months it’ll be gone or cost you more”.
On the helicopter side, the story is a little more difficult to read but could also be encouraging. The market has seen an oversupply of inventory — the result of the downturn in oil and gas — since ASG first began its surveys in 2016. But for the first time now, we are seeing inventory levels decreasing. The optimist says this could finally suggest a trend reversal and such a claim may not be totally unfounded as O&G is recovering, with growth in other multi-mission applications continuing too – especially in EMS and firefighting roles here in the Asia-Pacific region. The pessimist, though, says sellers have finally just given up on the possible sale of their aircraft and taken them off the market. And there may be some truths in this perspective too. Looking at a few of the larger helicopters on the market — the S92 and H225 — transactions are few and days on market are increasing. The S76C+, used in the O&G operations, has reached an average days on market of 866. In the end,
PUBLISHER’S NOTE
SPECIAL THANKS TO OUR CONTRIBUTORS:
any step toward a Seller’s Market, like we are seeing with business jets, for helicopters is far off and all we can do is wait and see. Average asking prices here are continuing to decrease, while the percentage of fleet for sale remains high.
As for the rest of this issue of Asian Sky Quarterly, our Summer edition features a look at the Cessna Citation Longitude and Latitude aircraft. We also examine the ever-popular Hawker 800 series in our Pre-Owned Aircraft profile. Fittingly, business aviation in Australia is profiled this quarter, including views and opinions form plenty of experts based in that continent. We also had the chance to speak with Bei Zhuang, Vice President at Avion Pacific and partner of ASG, who gave us her insights on China’s GA industry.
Sincerely,Jeffrey C. Lowe
Managing Director, Asian Sky Group
SECOND QUARTER 2018 — ASIAN SKY QUARTERLY | 1

2 | ASIAN SKY QUARTERLY — SECOND QUARTER 2018
or expenses howsoever caused, whether arising directly or indirectly from any error or omission in compiling such information. This report also uses third party information not compiled by ASG. ASG is not responsible for such information and makes no representation about the accuracy, completeness or any other aspect of information contained. The information, data, articles, or resources provided by any other parties do not in any way signify that ASG endorses the same.
ADVERTISING/AIRCRAFT SALES ENQUIRIES:[email protected]
Asian Sky GroupSuite 1401, 14 Floor, Fortis Tower 77-79 Gloucester Road, Wan Chai, Hong Kong Tel: (852) 2235 9222 | Fax: (852) 2528 [email protected] www.asianskygroup.comwww.asianskymedia.com
ECONOMICSOverview of the Asia-Pacific region’s current status and specific country’s GDP versus their business jet fleet size.
MOOD & INTENTIONSResults of the survey on the Asia-Pacific region’s outlook on current economic status, aircraft utilization, purchase intentions and influencing factors.
SPECIAL FEATURECHARTER DEMAND AND POPULAR CHARTER ROUTES IN ASIA PACIFICA summary of the growing demand for business jet charter and a look into the most popular regional routes for charter.
INTERVIEW: BEI ZHUANG, VICE PRESIDENT, AVION PACIFICDiscussing her experience in the business aviation industry and expectations in the Mainland China business jet market.
COUNTRY PROFILE - AUSTRALIAOverview and examination of Australia’s business aviation industry, its business jet operating environment and potential for the future.
PUBLISHER
EDITORIALLitalia YoakumIris Zhou
DESIGNMichael Wong Aya LeungRobert Li
MARKET RESEARCH & DATA ANALYSISBowen Zhang
DATA SUPPORTAvinava SenguptaCandice Yue Casper ZhuangDaiana IermolaievaJersey Wu Michelle Shen
The materials and information provided by Asian Sky Group Limited (“ASG”) in this report is for reference only. Any information we provide about how we may interpret the data and market, or how certain issues may be addressed is provided generally without considering your specific circumstances. Such information should not be regarded as a substitute for professional advice. Independent professional advice should be sought before taking action on any matters to which information provided in this report may be relevant.
ASG shall not be liable for any losses, damage, costs or expenses howsoever caused, arising directly or indirectly from the use of or inability to use this report or use of or reliance upon any information or material provided in this report or otherwise in connection with any representation, statement or information on or contained in this report.
ASG endeavors to ensure that the information contained in this report is accurate as at the date of publication, but does not guarantee or warrant its accuracy or completeness, or accept any liability of whatever nature for any losses, damage, costs
UPCOMING SPOTLIGHT CESSNA CITATION LONGITUDE & LATITUDE An introduction to the midsize and super mid-size jets, with a complete look at series’ range, payload capacity and evolution over the years.
MARKET DYNAMICSAn in-depth analysis of inventory levels, market trends and the changing price signals for the business jet and helicopter fleets in the Asia-Pacific region, given the continual fluctuations in supply and demand.
PRE-OWNED MARKET SPOTLIGHT HAWKER 800 SERIESA comprehensive market performance analysis of the pre-owned Hawker 800 series market.
MARKET SUMMARY - JETSA look at the market performance of featured pre-owned business jets over the last 12 months.
MARKET SUMMARY - HELICOPTERSA look at the market performance of featured pre-owned helicopters over the last 12 months.
04 26
06
12
28
16
37
43
54 18
CONTENTS

globaljetcapital.com
An operating lease is a popular financing tool that can provide you with the benefits of a private aircraft
without the traditional risks of aircraft ownership. There are several different options, but in each case you do not take
ownership of the aircraft, but have the full use of it as if you did. Plus instead of a large down payment, you put down a more
modest security deposit and return the aircraft at the end of the lease term to Global Jet Capital.
You can choose to:
· Enter into a sale and leaseback arrangement for your current aircraft
· Identify a new or pre-owned aircraft for us to purchase
· Assign your purchase contracts to us for your new, on-order aircraft
If you’re thinking about a true operating lease, give us a call at +1 (844) 436-8200.
We’ll get you in the air.
LEASING & LENDING SOLUTIONS FOR PRIVATE AIRCRAFT
Allocation of Capital
Loan
Lease
Lower Residual Value Risk Predictable CostsEasily adjust to changing needsOff Balance Sheet
Assets:
Liabilities:
BalanceSheet
FIND OUT WHY SMART BUSINESSES ARE TURNING TO OPERATING LEASES.
找出为什么精明的商家正在转向经营租赁。
Visit us at ABACE - Booth P224
GJCP 22442 - Asian Sky - April 2018-2.indd 1 3/15/18 3:11 PM

4 | ASIAN SKY QUARTERLY — SECOND QUARTER 2018
AustraliaAustralia’s economy grew above the 2.8 percent expectation by 3.1 percent year-on-year (y/y) in Q1 of 2018. The acceleration indicates that Australia has recovered from the slowdown of Q4, which was caused by the implementation of large mining projects. The growth resurgence is attributed to a rise in exports, which contributed half of the quarterly increase. Australia’s economic outlook is predominantly positive; however, household consumption is a cause for concern.
Hong KongGrowth in Q1 of 2018 reached 4.7 percent y/y, accelerating from 3.4 percent the previous quarter. The increase, which was the fastest annual pace for any quarter in seven years, was supported by household consumption and service exports. Economic growth gained momentum as domestic spending was boosted by low unemployment and rising asset values. Simultaneously, the external sector was bolstered by a rebound in tourism and strong global demand for exports. The announcement of the 18-19 budget in February illustrated the government’s intention to focus on longer term economic development.
IndiaIndia’s economy expanded 7.7 percent y/y in the first three months of 2018, above market forecasts of 7.3 percent. Boosted by accelerated growth in manufacturing and investments, Q1 showed the strongest growth rate in seven quarters. The overall Q1 sentiment indicates that the Southeast Asian nation is finally moving past issues caused by structural reform following demonetisation and introduction of the goods and services tax.
IndonesiaIndonesia’s Q1 GDP fell slightly from the previous quarter growing at 5.06 percent y/y, down from 5.07 percent. The decline reflects still-weak consumption, which typically accounts for more than half of the country’s GDP. Government spending also contributed to the decline as it remains low after a 46.1 percent decline in Q4 2017.
JapanFor the first time in nine quarters, Japan’s economy shrank declining by 0.6 percent, over the prior quarter. The slowdown in growth is attributed to decreases in demand and a strong yen. Bad weather at the beginning of the quarter drove up food prices and dampened internal demand and consumption. External demand was adversely affected by a slowdown in global electronic products. GDP contraction in Q1 is expected to be temporary and Japan is projected to resume growth in the next quarter.
Mainland ChinaChina’s economy grew 6.8 percent y/y in Q1 of 2018. The GDP growth rate has stayed within the range of 6.7 percent to 6.9 percent for 11 quarters, with the jobless rate and inflation remaining stable, according to China’s National Bureau of Statistics. The growth is attributed to strong consumer demand, continued property investment and an expansion in the services industry, which grew at 7.5 percent year on year in this quarter.
MalaysiaGrowth in Q1 2018 slowed in Malaysia to 5.4 percent, down from 5.9 percent in Q4 2017. The slowdown comes amid uncertainty of the county’s new administration, led by Mahathir Mohamad. The government continues its efforts to boost domestic demand, which expanded 6.9 percent in this quarter. However, the economy remains reliant on exports which account for 67.7 percent of GDP. Despite the initial slowdown, growth is expected to be positive throughout the year, supported by domestic demand as well as growth in manufacturing and services.
PhilippinesThe Philippine economy posted 6.8 growth in Q1 2018. This is the 10th consecutive quarter that the economy grew by 6.5 percent or better. Industry and services contributed to the country’s growth, while agriculture and net exports weakened. Accelerating inflation is attributed to the country’s inability to reach the growth rate target of 7.0 to 8.0 percent.
TaiwanTaiwan’s growth slowed to 3.02 percent in Q1 2018, down from 3.4 percent Q4 2017. Still, the GDP beat forecasts of 2.77 percent, due to strong growth in exports and private consumption. In terms of consumption the outlook for 2018 is positive as during the first quarter it expanded by 3.0 percent, accelerating at the fastest pace since Q2 of 2015. Nevertheless, risks for the Taiwanese economy include a potential peak in the tech cycle and weaker demand for semiconductors caused by lower smartphone sales globally.
SingaporeSingapore’s economy grew an impressive 4.4 percent in Q1 2018, up from 3.6 percent in the last quarter of 2017. The robust growth in Q1 was supported by the manufacturing sector, as well as the finance and insurance, and the wholesale trade sector. In addition, unemployment fell from 3.0 percent to 2.8 percent in the first quarter, creating a positive outlook for domestic consumption in the next quarter.
South KoreaSouth Korea’s economy returned to growth and expanded by 2.8 percent y/y in Q1 of 2018. This growth is attributed to a 5.8 percent increase in government spending and a rise in exports, which was likely created by the Winter Olympics, an influx of tourism from Mainland China and surging shipments of memory chips. While Q1 saw an increase in the unemployment rate, the economy is expected to grow steadily throughout the year with an expected annual growth of 3.04 percent.
ThailandThailand is undergoing a holistic economic expansion with growth in areas including tourism, exports and manufacturing. The economy grew by 4.8 percent in Q1 2018, the fastest first quarter growth in five years and up from 4.0 percent the previous quarter. Strong performance prompted Thailand’s National Planning Agency to increase its annual forecast by 0.8%.
2018Q1 ECONOMICS
* China's researching area includes Mainland China, Hong Kong, Macau & Taiwan.

SECOND QUARTER 2018 — ASIAN SKY QUARTERLY | 5
GDP (BILLION USD)*
BUSINESS JET FLEET AND GDP BY COUNTRY
BUSINESS JET FLEET CIVIL TURBINE HELICOPTER FLEET
* GDP Source: Tradingeconomics.com
* 2014 - 2017 ASG data, historically adjusted using Jetnet fleet yearly increases.
Comprehensive coverage and overview of the business jet and civil helicopter fleet in the Asia-Pacific region, visit www.asianskymedia.com for more!
YEAR END 2017Asia Pacific Business Jet and Civil Helicopter Fleet Report
ECONOMICS
China
Japan
IndiaAustralia
South Korea
Indonesia
Taiwan Thailand
Malaysia
Singapore
Hong Kong
Philippines
New Zealand
Papua New Guinea
9,491
608
274272
210
382
136
170
13512895
14
36
1
250
170
140
114
9
16
3
32
20
39
48
43
55
351
184
138
504947
5854
39
242017
6
12,128
2,349
1,4661,223913
565
417
318
339330
313
192
19
1,8621,5641,306
913
511
420
323300276272
191
15
749
ASIA PACIFIC REGION CIVIL HELICOPTER FLEET REPORT – YEAR END 2016 I
ASIA PACIFIC REGIONCIVIL HELICOPTERS
YEAR END 2017
Sponsored by
ASIA PACIFIC REGIONCIVIL HELICOPTERS
YEAR END 2017
Sponsored by
6
884
609
487
287
165
111103
157
213229
1521
6515,0094,909
2013 2014 2015 2016 2017 2018Q1 2013 2014 2015 2016 2017 2018Q1 2013 2014 2015 2016 2017 2018Q1

6 | ASIAN SKY QUARTERLY — SECOND QUARTER 2018
55+21+24+G 41+27+17+9+6+GTurboprop (24%) Service Providers
(FBO,MRO,etc) (41%)Business Jet (55%)
Civil Helicopter (21%)39+31+21+5+4+G
RESPONDENT LOCATION
Rest of the World (4%)
Aircraft Owner / Charter Broker (6%)
Aircraft Sales / Charter Broker (9%)
Central Asia(21%)
Other (17%)
Oceania (5%)
Greater China (31%)
400+RESPONDENTS
Southeast & Northeast Asia (39%)
19+17+15+15+11+7+5+4+4+3+GTOP 10 RESPONDENT’S LOCATION
Malaysia (5%)
Australia (4%)
Indonesia (7%)
India (17%)
Singapore (15%)
China (19%)
Hong Kong (15%)
Philippines (11%)
Thailand (3%)Pakistan (4%)
100%
90%
30%
0%
40%
10%
50%
20%
60%
70%
80%
RESPONDENT AIRCRAFT TYPE RESPONDENT CATEGORY
Aircraft Operator (27%)
2015Q4
2016Q2
2016Q4
2016Q1
2016Q3
2017Q1
2017Q2
2018Q2
2018Q1
2017Q4
2017Q3
In the second quarter of 2018, over 400 respondents participated in ASG’s survey regarding the mood and intentions of the current business aviation market.
Regions with the most respondents include:1. Southeast and Northeast Asia (158 valid respondents, including Malaysia, Indonesia, Singapore, Brunei, Philippines, Thailand, Myanmar, Cambodia, Laos, Vietnam, Japan, and South Korea)2. Central Asia (82 valid respondents, including India, Pakistan, UAE, etc.) 3. Greater China (123 valid respondents, including Mainland China, Taiwan, Hong Kong and Macau)4. Oceania in Respondent’s Location (21 valid respondents, including Australia and New Zealand)
Pess
imist
ic(W
ill g
et w
orse
)O
ptim
istic
(Will
get
bet
ter)
MOOD & INTENTIONS:ASIA-PACIFIC REGION SURVEY 2018Q2
82%OF TOTAL
RESPONDENTS
25%
30%
45%
24%
30%
46%
36%
30%
34%
22%
30%
48%
26%
27%
47%
45%38%
34%35%
21%27%
52%
56%56%
52%
37%28%
34%
32%
11%16%
10%15%
Past Low Point
At Low Point
Not Reached Low Point
WHAT IS OUR CURRENT ECONOMIC STATUS? (QUARTERLY COMPARISON)
Over 60% of the respondents from this quarter’s survey are from aircraft operators and aircraft services providers (FBO, MRO, etc.) and we also have feedback from aircraft brokers (9%), aircraft end users (6%) and respondents from other related areas, as well.

SECOND QUARTER 2018 — ASIAN SKY QUARTERLY | 7
MOOD & INTENTIONS: ASIA-PACIFIC REGION SURVEY 2018Q2
90%
100%
100%
Incr
ease
dU
ncha
nged
Dec
reas
ed
90%
30%
30%
0%
40%
40%
10%
50%
50%
20%
60%
60%
70%
70%
80%
80%
2016Q2
2016Q2
2016Q4
2017Q2
2016Q4
2016Q3
2017Q1
2016Q3
2017Q3
2017Q1
2017Q4
2018Q2
2018Q1
2018Q2
2018Q1
2017Q4
2017Q3
2017Q2
Level of pessimistic feelings for economics have continued to increase since 2018Q1. This quarter, 55% of respondents believed that the economy passed its low point and will improve, which is 10% higher than 2017Q2. The number of respondents who believe the current economy is at its low point and will get better is 28%; 9% lower than the previous quarter and the 2nd lowest number since 2015 Q4. Alternatively, 16% of respondents believed that the economy has not yet reached its lowest point and will continue to worsen; a 5% increase compared to 2018 Q1 and the highest rate since 2017 Q3..
Among the respondents, aircraft owners and charter users show elevated levels of optimism, while aircraft sales and charter brokers show a higher level of pessimism.
In general, respondents who believed that the current economic situation has passed its low point or is at its low point can be described
OPTIMISM LEVELS SINCE 2016Q2 - REGIONAL DIFFERENCES
HOW IS YOUR AIRCRAFT UTILIZATION COMPARED TO 12 MONTHS AGO?
24%
37%
24%
11%
4%
OverallGreater China SE & NE Asia Central Asia Oceania
Up by 20% and more (>20%)
Up but less than 20% (0 - 20%)
The same (0%)
Down but less than 20% (-20 - 0%)
Down by 20% or more (<-20%)
as optimistic. This quarter, 84% of respondents believed that our economy will improve in the future – this is a 5% decrease from 2018 Q1, which has continued to decline since 2016 Q3.
The optimistic level for Greater China (Mainland, Hong Kong, Macau and Taiwan) is lower than average this quarter, and it has endured a 12% decrease compared to 2018 Q1, which is the highest decrease since 2016 Q2. Central Asia showed the highest optimistic level of 92%, while the average for this quarter was 84%. However, compared to last quarter it is a 2% decrease. The optimistic level for Southeast and Northeast Asia has decreased by 3% to 89%, compared to last quarter. Oceania, however, continued its decline to 75% from the previous quarter, making it the least optimistic region of the surveyed area.
89%
84%
91%
80%83% 84%
79%
54%57%
43%
54%
53%54%
61%
66%
69%
79%
73%
62%
68%
70%79%
81%
86%
52%
91%
85%
78%75%
87% 88%
76%
90%92%
89%
92% 94%92%
100%
95%

8 | ASIAN SKY QUARTERLY — SECOND QUARTER 2018
27 22 31 25 45 58 41 52 3530 32 31 44 33 17 38 18 1842 46 38 31 23 25 21 30 47
MOOD & INTENTIONS: ASIA-PACIFIC REGION SURVEY 2018Q2
PESSIMISTIC
AIRCRAFT UTILIZATION:REGIONAL DIFFERENCES
This quarter, 15% of respondents (-3% since last quarter, -18% since 2016 Q1) in the surveyed area said their expected aircraft utilization has decreased. 61% of respondents said their aircraft utilization increased, which is a 2% decrease compared to last quarter.
* An Optimistic-Pessimistic Signal Line has been added to regional aircraft usage trend analyses for Greater China, Oceania and South and East Asia regions. An optimistic mood is derived from more people indicating a ‘higher’ aircraft utilization than 12 months ago, and a pessimistic mood is derived from more people indicating ‘lower’ aircraft utilization than 12 months ago.
Greater China
46% of respondents indicated their aircraft utilization in 2018 Q1 increased, which is significantly lower compared to last quarter (60% at 2018 Q1). 21% of respondents stated their aircraft utilization was lower compared to 12 months ago, which is a similar level compared to previous quarters’ result. This quarter is the first time, since 2016 Q2, that the total expected aircraft utilization stopped increasing.
Oceania
35% of respondents have indicated their aircraft utilization increased, 17% lower than 2018 Q1. 47% of respondents stated their aircraft utilization decreased, 17% higher than 2018 Q1. The total aircraft utilization has entered the pessimistic zone again in 2018 Q2.
Southeast and Northeast Asia
In 2018 Q2, 70% of respondents recorded an increased use of aircraft, which has continued to be the highest number since 2015 Q4 and 9% higher compared to 2018 Q1. Aircraft utilization in this area has been increasing since 2017 Q2.
32 34 38 47 51 55 60 60 4632 19 28 24 31 23 19 22 3337 47 34 29 18 22 21 18 21
2016Q2
2016Q2
2016Q3
2016Q3
2016Q4
2016Q4
2017Q1
2017Q1
2017Q2
2017Q2
2017Q3
2017Q3
2018Q2
2018Q2
2018Q1
2018Q1
2017Q4
2017Q4
37% 47
%
34%
29%
18%
21%
21%
21%
18%22%32
%
19% 28
%
24% 31
%
19% 22%
23%32
%
33%
33%
34% 38
% 47%
46%
46%
51% 60
%
60%
55%
41 35 37 19 56 65 59 61 7036 28 36 48 18 13 14 22 2023 37 27 33 26 22 27 17 1023%
37%
27% 33
%
26%
27%
17%
10%
26%
36%
28% 36
%
48%
18%
14% 22
%
20%
13%
41%
35%
37%
19%
56% 59%
61% 70
%
65%
GREATER CHINA
OCEANIA
Decreased The Same Increased Signal Line*
Decreased The Same Increased Signal Line*
Decreased The Same Increased Signal Line*
PESSIMISTIC
OPTIMISTIC
SOUTHEAST AND NORTHEAST ASIA
Improved Aircraft Utilization
Improved Aircraft Utilization
Aircraft Utilization Worsen
OPTIMISTIC
OPTIMISTIC
PESSIMISTIC
42% 46
%
38%
31%
23%
21% 30
%
25%30
%
32%
31%
44%
33% 38
%
18%
27%27
%
22% 31
%
25%
45%
41% 52
%58%
2016Q2
2016Q3
2016Q4
2017Q1
2017Q2
2017Q3
2018Q2
2018Q1
2017Q4

SECOND QUARTER 2018 — ASIAN SKY QUARTERLY | 9
In this quarter’s market survey, ASG recorded over 100 responses from the Asia-Pacific region regarding the satisfaction factors of management companies and those of charter brokers. And over 240 respondents answered questions regarding the end users’ travel behaviours.
Similarly, compared to last quarter, when asked “Do you or your client own or charter a private aircraft?”, 9% of respondents only charter an aircraft, while 34% just own a private aircraft. The remaining 57% would both own
SATISFACTION KEY FACTORS:CHARTER OPERATOR VS. CHARTER BROKER
(OUTER IS BETTER)
Charter Operator
Charter Broker
27+73+GWHERE ARE WE IN THE CURRENT
PRE-OWNED MARKET?
Contact Operator (73%) Contact Broker (27%)
MOOD & INTENTIONS: ASIA-PACIFIC REGION SURVEY 2018Q2
57+9+34+GDO YOU OR YOUR CLIENT OWN OR CHARTER
A PRIVATE AIRCRAFT?
WHEN CHARTERING AN AIRCRAFT, WHAT IS YOUR PRIMARY SOURCE?
Just Charter (9%)
Just Own (34%) Both Own and Charter (57%)
240+OF TOTAL
RESPONDENTS
39%
49%
23% 26
%
2%
39%
36%
21%
4%
40%
29%
21%
10%
47%
28%
17%
8%
31%
30%
22%
28%
19%
23% 22%
32%
29% 28%
33%31%30% 29%
25%
19%
27%
48%
43%
56% 54%
59%
41%38%
41%
2016Q2
2016Q3
Balanced Market in general - Demand and Supply are on
the same level
2016Q4
Seller’s Market in gen-eral - High demand,
low supply
Buyer’s Market in general - High supply,
low demand
2017Q1
I’m not sure 2017Q2
2017Q3
2018Q2
2017Q1
2017Q4
PURCHASE INTENTION 2016Q2 - 2018Q2*
Yes, a new aircraft2017Q3 Yes, a pre-owned aircraft2017Q4 No / I’m not sure2018Q1 2018Q2
and charter an aircraft, implying that to charter an aircraft is reasonable for those who already own one.
On the charter operator / broker side, when asked the primary choice when chartering an aircraft, 73% of respondents would contact a charter operator first
Quality of Maintenance
Value for Money (Price)
Quality ofOn-board Service
Operational Efficiency
Customer Service
Operational Safety
Most Satisfied

10 | ASIAN SKY QUARTERLY — SECOND QUARTER 2018
PURCHASE INTENTION - FIXED WING (OUTER IS PREFERRED)
PURCHASE INTENTION - HELICOPTER(OUTER IS PREFERRED)
PURCHASE DECISIONS - INFLUENCING FACTORS(OUTER IS LIMITING)*
Turboprop/Piston Fixed Wing(Such as King Air Series)
Midsize Jet(Such as G200 & CL650)
Single Turbine Helicopter(Such as Bell 206)
Small Jet(Such as Citation Series, Hawker Series)
Piston Helicopter(Such as Robinson R22)
Corporate Airliner(Such as ACJ, BBJ)
Twin Turbine(Such as Sikorsky S-76C+)
Large Jet(Such as G650,Falcon 8X)
Price
No Interesting Aircraft
Government / Public Opinion
No Need
Most Limiting
PURCHASE INTENTION - REGIONAL DIFFERENCES (FIXED WING)
Corporate Airliner Large Jet Medium Jet Small Jet Turboprop / Piston Fixed Wing
Greater China
22% 27% 19% 12%
Oceania 33% 17% 8% 8% 33%
SE & NE Asia
24% 38% 24%
Central Asia 34% 24% 20% 7%
10%
15%
19%
4%
PURCHASE INTENTION
Regarding professional aircraft sales’ opinions of the current pre-owned market, 47% of respondents believed that the current market is still in a ‘Buyer’s Market’ with low demand and high supply; notably higher compared to the past two quarters, with one reason being that the majority of such respondents were from Greater China. 28% (29% last quarter) of respondents believed that we are now in a balanced market with equal demand and supply and the remaining 17% (21% last quarter) believed that we have moved into a ‘Seller’s Market’, with higher demand on the market.
Based on the Market Dynamics analysis from ASG’s research department, ASG now believes the pre-owned business jet market has entered a balanced market. Notably, the pre-owned market for large and long-range business jets have improved. For details, please go to the Market Dynamics section of this issue of Asian Sky Quarterly.
Regarding the Purchase Intentions of 2018 Q2, the demand for both new aircraft and pre-owned aircraft has slightly risen and together represent over 60% of the respondents who now have the intention of buying an aircraft.
* Since 2017 Q3’s market survey, a new method was applied filtering out those respondents who are not relevant to this question, reflecting a percentage drop in the category “No / I’m not sure”.
Most Preferred
Most Preferred
MOOD & INTENTIONS: ASIA-PACIFIC REGION SURVEY 2018Q2
Purchase intention by region is shown in a graph to understand regional differences for fixed-wing aircraft. Greater China has a significantly higher need for large jets, while turboprops are more suitable for Oceania. Corporate airliners are commonly needed (12-33%) in all areas. Additionally, the medium and small jets categories are wanted, but on a relatively lower level
同级翘楚航空新典,邀您赏鉴。
G500™坐拥宽阔奢华,纵享九成音速。
何惧时光飞流,我有湾流在手。
广告
GULFSTREAM.COM
蔡海文 (Herman Chai), +86 10 8535 1866 或 +86 139 1064 2948许建钿 (Peter Hoi), +852 2918 1600 或 +852 6928 6988刘自强 (Matthew Liu), +86 10 8535 1866 或 +86 159 0115 7089
OceaniaGreater China Central Asia SE & NE Asia

SECOND QUARTER 2018 — ASIAN SKY QUARTERLY | 11
同级翘楚航空新典,邀您赏鉴。
G500™坐拥宽阔奢华,纵享九成音速。
何惧时光飞流,我有湾流在手。
广告
GULFSTREAM.COM
蔡海文 (Herman Chai), +86 10 8535 1866 或 +86 139 1064 2948许建钿 (Peter Hoi), +852 2918 1600 或 +852 6928 6988刘自强 (Matthew Liu), +86 10 8535 1866 或 +86 159 0115 7089

12 | ASIAN SKY QUARTERLY — SECOND QUARTER 2018
Asia Pacific has continued to be an important driver of the world’s economic development, accounting for over one third of the global growth in 2017, according to the World Bank. At the same time, the airline industry has also reported continued growth in the region. Traffic data from the Association of Asia Pacific Airlines reflects a 9.3% y-o-y increase in the region’s international passengers carried by airlines in April 2018, with a total of 29.8 million international travelers. The increase in demand for private air travel is also expected to expand.
Business jet charter has long been a preferred mode of transportation for business travelers hoping to travel quickly and efficiently, in a private and secure environment. Popularity has gradually expanded to include high-end leisure tourists. Today, charter users can be categorized into three types: corporate, private and government. In the Asia Pacific, the primary need for business jet charter continues to be for corporate use.
Within the region, a migration of production facilities and factories popped up in countries around the region, including Vietnam, Cambodia, Myanmar, the Philippines, Bangladesh and Indonesia, as traditional manufacturing costs in China became less economical. Infrastructure in these new manufacturing hubs was, and continues to be, scarce and unrefined; a minor inconvenience factory owners and corporations have come to accept in exchange for lower manufacturing costs. Thus, the benefit of globalization and the emergence of the Asia-Pacific consumer market encouraged firms to expand their intra-pacific business, creating air travel demand.
Faced with various travel difficulties, such as lack of infrastructure and few scheduled flights, business jet charter has presented itself as a means for corporates to reach various locations in a short amount of time, avoiding delays and other costs often associated with commercial travel.
Sports teams, event organizers, and movie production groups are also among the users in the corporate category. These clients often value security and convenience, avoiding hassle in busy terminals and less interaction from overenthusiastic fans.
The second type of charter passenger is the private user. Private users include Ultra-High-Net-Worth-Individuals (UHNWIs), celebrities traveling for private purposes, and VVIP. This group values privacy, as well as security. UHNW customers are wealthy individuals with a net
worth of US$30 million or above. When flying on a scheduled flight, they often travel as first class or business class passengers. It is likely that an UHNW either already owns a business jet or is connected to someone who owns a business jet.
The third type of jet charter user is the government. Government officials often use business jet charter for domestic travel and international diplomatic visits. On some occasions, royal families may use charter services that are operated by a trusted domestic charter operator. These users value security and privacy above all else, and, additionally, benefit from the efficient travel provided by a non-scheduled charter flight.
With an increasing pool of customers who are willing and capable to opt for charter services, in addition to the optimistic views of the operators regarding the future of business jet usage; charter demand seems to have a very promising future in the Asia-Pacific region.
Views: Future Business Jet Usage
Very Pessimistic
Very Optimistic
SlightlyOptimistic
Neutral
SlightlyPessimistic
Asian Sky Group recently conducted a survey among operators in the Asia-Pacific region in December 2017. The operators were asked their sentiments regarding the future of business jet usage in the region. More than half of the respondents replied positively, with 58% having an optimistic view. 35% of the respondents had a neutral opinion and said that they needed more time to analyze the market, whereas, only 6% had a pessimistic view.
I
SUMMER 2018 CHARTER REPORT |
ASIA-PACIFIC BUSINESS JETCHARTER REPORT 2018
SPECIAL FEATURE:CHARTER DEMAND
DOWNLOAD NOW: WWW.ASIANSKYMEDIA.COM/CHARTER-REPORT

SECOND QUARTER 2018 — ASIAN SKY QUARTERLY | 13
Many private air travel industry experts have kept a close eye on the rapid growth of the HNWI and UHNWI populations; understanding that there is a direct correlation between HNWI and UHNWI growth and business jet charter demand.
Over the past four years, the Asia-Pacific region has seen a dramatic increase in the population of individuals possessing a worth of more than US$50 million in assets. As of 2017, there were around 37,000 individuals who belonged to this category. This number has grown by almost 5,000 within the past four years, representing an average annual growth of 16%.
The Asia-Pacific region has also witnessed a rise in the number of individuals worth over US$550 million in assets. By 2017, there were a total of 1,930 individuals belonging to this category.
Taking solely the Asia Pacific into consideration — the operating challenges, strict cabotage rules and restrictions on charter operators in certain countries pose some limitations on the growth of the charter market. Regardless, there have been strong signals indicating the growth of the charter industry, with more HNWI and UHNWI opting for private jet charter services. A key reason for the growing demand is the need for these individuals to save time and reduce the hassles of commercial air transport. With the means and the desire to do so, HNWI and UHNWI are propelling the demand of the charter industry to newer heights.
UHNWI Population Growth UHNWI Population Growth by Region
UHNWI Population (+50M USD)
2018
20162017
2015
2017201620152014
29,959
10%14.5%
18.5%32,35037,040
43,915
1,260
8,800
5,140
2,920
1,160
9,960
310
390
310
1,400
2,610
2,010
770
Australia
Mainland China
Hong Kong
India
Indonesia
Japan
Malaysia
New Zealand
Philippines
Singapore
South Korea
Taiwan
Thailand8,
153
6,87
05,
910
5,45
5
1,86
8
19,2
5715
,950
13,7
0012
,57714
,637
12,5
7011
,230
10,5
52
1,65
01,
510
1,37
5
East Asia Greater China Oceania South East Asia
ASIA PACIFIC UHNWI POPULATION ANALYSIS
SOURCE: Knight Frank and WealthX
DOWNLOADNOW
www.asianskymedia.com/
charter-report

14 | ASIAN SKY QUARTERLY — SECOND QUARTER 2018
Beijing
Hong Kong
Shanghai
Sorong
Bali
SingaporeMaldives
Phuket
Subang
SaipanManila
Macau
Bangkok
Tokyo
8
6
1
4
2
9
7
3
5
10
Sanya
Seoul
NOTE:• The popular charter flight routes in the above map include locations in the Asia-Pacific region only, excluding Australia, India and New Zealand.
• The Popular Charter Airport table considers popular departure and arrival airports separately. The data in this table includes locations in the Asia-Pacific region only, excluding India.
Popular Charter Airport
Top 10 popular charter routes in Asia Pacific
INCR
EASI
NG
PO
PULA
RITY
Other popular charter routes in Asia Pacific
POPULAR CHARTER ROUTESIN ASIA-PACIFIC
SPECIAL FEATURE: CHARTER REPORT 2018
Mainland China
Hong Kong
Singapore
Macau
Maldives
Mainland China
Malaysia
Philippines
Australia
Mainland China
Mainland China
Hong Kong
Singapore
Thailand
Mainland China
Malaysia
Australia
Macau
Philippines
Maldives
Beijing Capital International
Hong Kong International
Singapore Seletar
Macau International
Malé (Ibrahim Nasir)/Velana International
Shenzhen Bao’an International
Kuala Lumpur/Sultan Abdul Aziz Shah/Subang
Manila Ninoy Aquino International
Sydney Kingsford Smith
Hohhot Baita International
Beijing Capital International
Hong Kong International
Singapore Seletar
Don Mueang International
Shenzhen Bao’an International
Kuala Lumpur/Sultan Abdul Aziz Shah/Subang
Sydney Kingsford Smith
Macau International
Manila Ninoy Aquino International
Malé (Ibrahim Nasir)/Velana International
PEK
HKG
XSP
MFM
MLE
SZX
SZB
MNL
SYD
HET
PEK
HKG
XSP
DMK
SZX
SZB
SYD
MFM
MNL
MLE
Location LocationDeparture - Airport Arrival - AirportIATA IATA

SECOND QUARTER 2018 — ASIAN SKY QUARTERLY | 15
NOTE: Duration of flight is calculated with the following assumptions: June wind, 0.8 Mach speed, and 500 lbs payload.
Top 10 Popular Charter Routes (Popularity from Highest to Lowest)
ROUTES DURATION/DISTANCE1: Highest 3: LowestPOPULAR MODELS
BEIJING
SHANGHAI
1: Challenger 605
2: Global Series
3: Gulfstream G450
128K - 38K
1hr 25mins
648nm
MACAU
MANILA
1: Global Series
2: Challenger 850
3: Gulfstream G450
238K - 57K
1hr 35mins
655nm
SINGAPORE
HONG KONG
1: Falcon 2000LX
2: Challenger 605
3: Gulfstream G450
358K - 77K
3hrs 37mins
1,529nm
HONG KONG
BEIJING
1: Gulfstream G450
2: Challenger 300
3: Challenger 605
435K - 60K
2hrs 42mins
1,133nm
SUBANG
MACAU
1: Challenger 605
2: Global Series
3: Challenger 850
540K - 68K
3hrs 42mins
1,446nm
HONG KONG
TOKYO
1: Global Series
2: Challenger 850
3: Challenger 605
665K - 76K
3hrs 38mins
1,766nm
SUBANG
SINGAPORE
1: Gulfstream G150
2: Gulfstream G550
3: Challenger 300
716K - 28K
45mins
252nm
BANGKOK
PHUKET
1: Hawker 850XP
2: Citation CJ3/Bravo
3: Gulfstream G200
811K - 20K
1hr 3mins
401nm
HONG KONG
MALÉ
1: Challenger 605
2: Falcon 2000
3: Global Series
985K - 95K
5hrs 37mins
2,742nm
HONG KONG
SAIPAN
1: Challenger 605
2: Global Series
3: Gulfstream G450
1075K - 82K
4hrs 40mins
1,925nm
The Asia-Pacific region is dominated by charter flights having a flight duration of less than five hours. Charter operators in the region believe that passengers who plan on flying out of the Asia Pacific, and have a flight time of over seven hours, usually opt for flying commercial first class and then utilizing local charter services at the destinations. This growing trend among the customers results in increasing popularity and demand for short range charter flights in the Asia-Pacific region. Unsurprisingly, nine out of the top ten busiest charter routes are short range flights, with an average flight time of 2 hours 23 minutes.
The busiest charter route in the Asia Pacific is from Beijing to Shanghai (PEK-PVG) followed by Macau to Manila (MFM-MNL). Charter package prices range depending on the availability, the aircraft model used, the nautical miles separating the destinations and the airport specific operating costs.
The popularity of the airports may vary from season to season, with certain airports seeing an increase in activity due to tourism spikes in certain seasons. Overall, Beijing Capital Airport (PEK) ranks as the most popular charter airport.
PRICE RANGEIndicative Price in USD

16 | ASIAN SKY QUARTERLY — SECOND QUARTER 2018
Tell me about your experience in the industry?I joined Avion in 1996 when both the company and the GA industry in China were in their infancy. Apart from professional helicopter enterprises, there were few GA service providers, let alone firms pitching into aircraft operation and trade. The industry, as well, was facing a shortage of aviation talents, either pilots, flight crew or specialists in aircraft transaction and operation. Those early batches of aviation employees in China were similar to me, plunging into the GA industry rather late in their lives.
I used to be an English teacher prior to ending up at Avion. Though it was a decent and stable job in the eyes of many people, I preferred giving a new twist to my life at that time. When Mr. Wu Zhendong, the founder of Avion, invited me to join Avion, I stumbled into this industry inspired by my curiosity towards it.
I got my first glimpse into GA through translation work, since the accessible materials regarding aviation and aircraft at that time came from markets outside of China. This has always been one of Avion’s target: We are committed to bridging the industry between China and Western countries, capitalizing on the more mature experience from the western market to facilitate the growth of general aviation in China.
I then obtained experience through coordinating with pilots, crew and clients during helicopter operations.
How has the general aviation industry in China evolved since the time you started out?China’s GA industry has undergone a lot of hardships. Since the reform and opening-up in China most industries gained fast-pace development and reached their boom, with the exception of general aviation, which is one of the last industries to take off because of national security, infrastructure and social wealth.
I’ve been working in this industry for 22 years. The first 15 or 16 years observed a quite slow expansion of China’s GA industry. Although several investors were aware of the potential, they failed to move into great success as they didn’t understand and expect that aviation, as a capital and talent intensive industry, was very unlikely to make great profits in a short period.
The industry didn’t grow rapidly until the past five or six years. The development has attracted a lot of new investors to set up GA operations.
I have reason to believe that there’s a bright future lying ahead for general aviation in China. The industry chain is much more improved compared with that of decades ago, from R&D, manufacturing, sales, training to operation, maintenance and other aspects. Investors are also now well prepared in terms of capital and the Chinese government has introduced favorable GA policy.
Known as the first ever holistic general aviation (GA) solution provider in Mainland China, Avion Pacific Limited (Avion) took the lead in adding value to the industry through its comprehensive services and its contribution to compiling CCAR 91 regulations. Avion was established in 1993 and has been
committed to offering quality solutions for GA operators throughout the world for over 20 years, focusing on aviation consultancy, aircraft transactions, maintenance and operation.
Since the company’s early years, Ms. Zhuang Bei, Vice President, has been a crucial part of the team and in the continued development of GA in mainland China.
EXPANDING GA IN CHINA
INTERVIEW:
Interview by Iris Zhou
BEI ZHUANG, AVION PACIFIC VICE PRESIDENT

SECOND QUARTER 2018 — ASIAN SKY QUARTERLY | 17
What are the current market trends in China and what are your expectations for the future of the industry?We can take note of the more developed GA markets in Europe, the US and even in India and Brazil to foresee the possible development trends. In terms of operation, we can forecast further growth in terms of business aviation and general aviation operations used in public services, such as aerial forest fire protection and offshore transportation service.
The upcoming trend, as far as I’m concerned, is that GA services will be directly used by customers. The uprise of charter clubs in the US is a proof of this. In China, the government is now advocating for the use of GA for commuters in rural and mountainous areas. This sector has more room to grow than GA used in the public service sector. Taking cloud seeding as an example – if there are 100 aircraft aimed at sharing the workload which can be easily done by 50 aircraft, the market is unlikely to grow in a sound way. But it’s a different case with aircraft utilization of individual customers. This market, as we can expect, still has plenty of room to expand before reaching saturation.
What services does Avion provide? In the early years, Avion provided GA technical support and consultancy. The company has since evolved into a GA solutions provider for world-renowned firms, including Mobil and FedEx. During the past two decades, we’ve flexed our muscles by training both rotary- and fixed-wing pilots and flight crew who have grown to become a strong force for this industry. In addition, we provide training for pilots and technical support staff of the domestic Police Air Force through our training school partner. We are now most active in aircraft sales, as a broker for the likes of Sikorsky, McDonnell Douglas, King Air, Dassault and so on. We have successfully completed over 200 sales
Avion established Kings Aviation Limited in 2011, focusing on helicopter operations. We also recently entered the MRO business, as a representative of Australia-based MRO provider Heli-One. Aircraft leasing is another field that we look forward to entering into.
Through these ventures and partnership, Avion can truly provide a comprehensive set of services.
INDUSTRY INSIDER
Through these ventures and partnership, Avion can truly provide a comprehensive set of services.
How does Avion set itself apart from the growing number of general aviation companies in the country? The philosophy we hold is that we are willing to provide value-added
services to our clients in the pre- and follow-up session of each
aircraft transaction, consulting project or any support provided. In
terms of aircraft sales, we help our clients to expand their market by
leveraging our network and resources. We’ve been able to establish a
solid reputation through our clients’ recognition rather than traditional
advertisement. Most clients come back because of our excellence in
resources and service.
www.avionpacific.com/en.php

18 | ASIAN SKY QUARTERLY — SECOND QUARTER 2018
COUNTRY PROFILE
AUSTRALIA
ADELAIDE INT'L
PERTH INT'L | PERTH JANDAKOT
MELBOURNE ESSENDON
SYDNEY KINGFORD SMITH INT'L | SYDNEY BANKSTOWN
BRISBANE INT'L | REDCLIFFE
CAIRNS INT'L
MOUNT ISA
TOWNSVILLE
GOLD COAST
COFFS HARBOUR
DARWIN
5
15
18
4
14 17
2
12
3
131
11
6 8
16
7
17
9
19
33 3534
36 37 38 39 41 45
46 47 48 50 53 54
49 51 52
42 43
44
28 29 30
20 21 22 23 24
25
31
40
26
27
32
10
5
15
4
14
2
12
3
13
1
11
6
16
7
17
8
18
9
19
23
33
25
35
27
37
24
34
26
36
28
38
20
30
40
29
39
22
32
21
31
10
Airport FBO MRO Jet Operator Helicopter Operator
Airflite
Archerfield Jet Base
Ausjet Aviation
AvWest
Cobham
ExecuJet
ExecuJet
Executive Airlines
Hawker Pacific
Hawker Pacific
Hawker Pacific
Hawker Pacific
HMaxem Aviation
Melbourne Jet Base1
Pearl Flight Centre
Pearl Flight Centre
Platinum BAC
Rossair Charter
Shortstop Jet Charter
Airbus Helicopters
Airwork Group
AMSA
Heliflite
Sikorsky Helitech
Hawker Pacific
Eagle Copter MA.
Air Gold Coast
AgustaWestland
ExecuJet
Executive Airlines
Marker Aviation
Airflite
ExecuJet
Heliwest
Premiair Aviation
ExecuJet
Hawker Pacific
Heliflite
Qantas MA.
Steven Hegarty
Air Affairs Australia
Flight Options
Global Jet International
Revesco Aviation
ExecuJet
Australian Corporate Jet Centres
Luft Aviation Charter
CHC
McDermott Aviation
Babcock
Bristow
Heli West
Microflite Helicopter
Jayrow Helicopters
41
42
43
44
45
46
47
48
49
50
51
52
53
54

SECOND QUARTER 2018 — ASIAN SKY QUARTERLY | 19
COUNTRY PROFILE: AUSTRALIA
AUSTRALIALocated on its own continent and situated between the Pacific and Indian oceans, Australia is famous for its abundance of natural wonders — from the Great Barrier Reef to the Australian Outback.
The country’s economy is just as impressive, boasting one of the most highly-developed markets in the world and one of the wealthiest in the Asia-Pacific region. Australia has enjoyed a record-breaking 108 consecutive quarters without recession and the outlook for 2018 indicates the country will continue this trend. While positive, Australia’s growth is unbalanced: mining remains the largest source of Australia’s economic expansion, typically contributing just under 40% of quarterly growth.
Although the country is comparable in size to the mainland United States, the population density is sparse, with pockets concentrated in urban areas along the Southeastern coastline, as well as down the western coast. Between the two coastlines is a vast region of desert and grasslands, which has made growing sustainable communities difficult. Consequently, this middle region is relatively uninhabited.
Connecting the East and West, Australia has long relied on aviation as a mode of transport for people and goods, as well as for medical and agricultural use. The longevity of Australia’s business aviation industry has led to it being one of the most developed and mature markets in the Asia-Pacific region. Still, the country’s industry faces several challenges, including the retention of aviation workforce and overregulation.
by Litalia Yoakum
Between the two coastlines is a vast region of desert and grasslands, which has made growing sustainable communities difficult.
In terms of charter, about a fourth of the business jets in Australia offer charter services. Air Affairs Australia, Global Jet International and ExecuJet are among the top operators.
“From a charter perspective, the market was somewhat flat for most of 2017 but then had a positive upswing in the last quarter of the year and pleasingly has continued in the early stages of 2018,” said ExecuJet’s Vice President, Asia Pacific Darren McGoldrick. “Our movements through ExecuJet’s Sydney and Melbourne FBOs also reflected this increased activity, while our MROs in Sydney, Melbourne and Perth have had a continual steady stream of work.”
Similarly, Melbourne Jet Base saw “a significant increase in demand for handling of international arrivals / departures in Melbourne to Asia, specifically China.”
5+16+22+18+39+GBusiness Jet Fleet Distribution by Age
6-10 Years, 29 (16%)
11-15 Years, 40 (22%) 16-20 Years, 34 (18%)
0-5 Years, 10 (5%)>20 Years, 73 (39%)
STATUS QUO
With 186 business jets, Australia is home to the second largest fleet in the Asia-Pacific region. The average age of a business jet in the country is 20 years; significantly higher than the majority of the region’s fleet, which is between five and 10 years old.
The maturity in this market continues to be reflected by its movement of pre-owned aircraft. While the business jet market posted a net increase of five aircraft in 2017 — a 2.8% growth from 2016 — 12 pre-owned aircraft were added to the fleet. The only new delivery into the market in 2017 was a Bombardier Challenger 650; the first time this model has entered the Australian market.
While historically pre-owned aircraft acquisitions have represented the core of Australia’s business aviation movements, Satcom Direct’s Business Development Manager Craig Macartney, who is based in Melbourne, explained “there is a lot of interest in new orders — the Global 7500 and G650ER — which will come through next year through early 2020.”
14 +10 +7 +7 +6 +6 G
loba
l Jet
In
tern
atio
nal
Flig
ht O
ptio
ns
Business Jets Fleet by Operators and OEM
Bombardier 14 3 1 1 5 24
Cessna 10 3 1 3 17
Dassault 1 1
Embraer 4 4
Gulfstream 1 1
Hawker 2 1 3
Total 14 10 7 7 6 6 50
Air A
ffairs
Au
stra
lia
Tota
l
Exec
uJet
Reve
sco
Avia
tion
Aust
ralia
n Co
rpor
ate
Jet
Cent
res
1014 7 7 6 6
Data Source: Asian Sky Group Fleet Report (Year-End 2017)
Total Fleet186

20 | ASIAN SKY QUARTERLY — SECOND QUARTER 2018
Civil Helicopters Fleet by Mission and OEM
Priv
ate
Offs
hore
EMS
Char
ter
Mul
ti-M
issi
on
Corp
orat
e
SAR
Law
Enf
orce
men
t
Trai
ning
Tota
l
Aérospatiale Gazelle 1 1
Airbus 193 33 30 12 15 3 6 11 7 310
Amateur-Built Aircraft 1 1
Bell 243 33 3 21 8 22 14 7 4 355
Enstrom 1 1 1 3
Leonardo 8 10 21 26 1 4 70
MD 16 7 2 1 26
Robinson 6 12 4 2 24
Sikorsky 3 1 31 7 42
Total 472 97 85 61 31 29 23 23 11 832
100+21+18+13+7+6+5+5+2472
97 85 61 31 29 23 23 11
770 +3%
+6%
+2%
+1%
174
2014 2015 2016
793
185
805
187
Business Jets
Civil Turbine Helicopters
Fleet Growth 2014 - 2016
Data Source: Asian Sky Group Infrastructure Report 2017Total number of hangars only includes FBO and MRO facilities in this report.
23 7
Number of Hangars
1
COUNTRY PROFILE: AUSTRALIA
REGULATORY REFORM
“The CASA Regulatory Reform Process has been ongoing since the 1990s with many operational parts still remaining unresolved,” says Australian Business Aviation Association (ABAA) CEO, David Bell. “This has led to frustration and uncertainty within the industry. Unfortunately, CASA has had five CEOs over recent years, each with their individual approach to the reform process. The ABAA has contributed to many CASA working groups since 2004, with limited progress being achieved.”
Several sectors within the industry are said to be dealing with this red tape, from training schools and pilots to infrastructure.
For years, groups, such as the Aircraft Owners and Pilots Association (AOPA) of Australia, the Australian Federation of Air Pilots and The Australian Aviation Associations Forum (TAAAF), have advocated on behalf of highly-regulated flight schools and pilots, who face exorbitant fees and licensing requirements. The burden of overregulation on this
sector has pushed the industry to outsource pilots from overseas, with flying schools being sold to foreign investors.
While commercial airliners are at the forefront of the shortage — with pilots offered attractive packages to work for carriers in China, general and business aviation operators face a smaller pool of talent and often can’t compete with the salaries of the largest carriers. And, the issue with personnel doesn’t stop with pilots but continues toward all segments in the industry from mechanics to engineers.
Bell explained one way to aid in the personnel shortage would be the introduction of an HECS-HELP loan scheme for aviation trainees. The financial aid program is currently offered by the Australian Government to assist students in financing higher education courses.
Bell also cited regulations placed on business jets at the Sydney Airport. “The curfew (11pm to 6am) at Sydney Airport has been a challenge for the ABAA for several years. Unfortunately, business jets with an
Business Jet Parking Civil Helicopter Parking Both

SECOND QUARTER 2018 — ASIAN SKY QUARTERLY | 21
57+12+10+7+4+3+3+3+1+GData Source: Asian Sky Group Fleet Report (Year-End 2017)
Helicopter Fleet — Mission Breakdown
Total Fleet832
SAR 31 (4%)
Training 29 (3%)
Charter 23 (3%)Private 23 (3%)
EMS 61 (7%)
Offshore85 (10%)
Law Enforcement 11 (1%)
Corporate 97 (12%) Multi-Mission 472 (57%)
MTOW of 34,000 kg or greater, which comply with ICAO Chapter IV noise standard, are not approved to operate during curfews at Sydney, even though business jets less than 34,000 kg MTOW, which comply with the less stringent Chapter III noise standard, are approved until December 2022.”
Most in the industry seemingly agree with Melbourne Jet Base, who says: “Government regulation is stifling small general aviation operators. Reducing regulations and removing artificial constraints on capacity, along with increasing private investment into companies like Melbourne Jet Base, will better promote Australia’s business aviation offerings globally.”
INFRASTRUCTURE
According to Tourism Australia, the country’s government agency responsible for promoting the country as a destination for travel, “international arrivals to Australia increased 8.9 percent in the 12 months to June 2017.” The increase was stimulated by the leisure segment “with holiday arrivals up 11.3% and visiting friends & relatives (VFR) arrivals up 5.4%.”
Though the increase in visitors to Australia is a welcome stimulant to the economy and the commercial aviation industry, the additional movements mean there are more aircraft and bigger aircraft. While commercial aviation generally takes precedence, facilities for business jets are “generally good,” according to Melbourne Jet Base.
“FBO capability is generally good across the country but the lack of access to major capital city airports does present problems at times, although this has improved recently due to a change in priority for business aviation aircraft, similar to that of the scheduled airlines.”
ExecuJet’s McGoldrick further explained, “…parking can be problematic especially during peak periods. Regional ports may require pavement concessions for operations. As in many places throughout Asia Pacific, hangarage is generally of short supply.”
Melbourne Jet Base, set to open at the end of 2018, is prepared to serve Australia’s business aviation industry. “Our new facility will offer a more integrated package of services such as luxurious lounges, hangarage, immigration and customs, pilot accommodation and refuelling to private jet clients, than anything currently offered in Australia,” says
FOR OTHER COUNTRIES’ AIRCRAFT FLEET AND INFRASTRUCTURE PROFILES, DOWNLOAD OUR REPORT AT: WWW.ASIANSKYMEDIA.COM

22 | ASIAN SKY QUARTERLY — SECOND QUARTER 2018
the Company. “It’s our hope that this new facility will put Melbourne on the global business aviation radar and be the first choice for business aviation operators.”
While infrastructure, itself, is “generally good,” the regulations imposed on different areas are taxing.
Satcom Direct’s Macartney explained one of the regulatory areas impacting infrastructure is border protection: “Acts of parliament, which are designed to protect our borders and keep citizens safe, have a flow-on effect on business aviation passengers and the principals of those aircraft. Historically, there has always been a liberal interpretation
of how to apply different procedures. Now, with an increased focus on security, the interpretations of those regulations are tidying up.”
Satcom Direct’s APAC Regional Director, Nathan Andrews reiterated this statement using the example of Perth Airport. “Perth Airport has no defined FBO that will allow for off-terminal clearance processing. As such, business aviation clientele must go through the normal international terminal before moving forward.”
Andrews explained, “In business aviation, part of the allure and attraction is a seamless entry. This isn’t the case here.”
Data Source: Asian Sky Group Infrastructure Report 20171 CIQ: Customs, Immigration and Quarantine; 2 Aircraft Refueling: Fuel Arrangement Service
FBO’s Facilities and Services
Airflite Perth International Airport ● ● ● ● ●
Archerfield Jet Base Archerfield Airport ● ● ● ●
Ausjet Aviation Essendon Airport ● ● ● ● ●
AvWest Perth International Airport ● ● ● ● ●
Cobham Adelaide International Airport ● ● ● ●
ExecuJetEssendon Airport ● ● ● ● ●
Sydney Kingsford Smith International/Mascot Airport ● ● ● ● ●
Executive Airlines Essendon Airport ● ● ● ● ●
Hawker Pacific
Brisbane International Airport ● ● ● ● ●
Brisbane International Airport ● ● ● ●
Cairns International Airport ● ● ● ● ●
Perth International Airport ● ● ● ●
Sydney Kingsford Smith International/Mascot Airport ● ● ● ●
Maxem Aviation Perth International Airport ● ● ● ● ●
Melbourne Jet Base1 Melbourne Airport
Pearl Flight CentreDarwin International Airport ● ● ● ● ●
Perth International Airport ● ● ● ● ●
Platinum BACEssendon Airport ● ● ● ● ●
Gold Coast Airport ● ● ● ● ●
Rossair Charter Adelaide International Airport ● ● ● ●
Shortstop Jet Charter Essendon Airport ● ● ● ● ●
FBO Name Airport Aircraft Hangarage
VIP Lounges
Aircraft Handling
On-Site CIQ
Aircraft Refueling 2
2 Fuel Arrangement Service
1 Under Construction
COUNTRY PROFILE: AUSTRALIA

SECOND QUARTER 2018 — ASIAN SKY QUARTERLY | 23
COUNTRY PROFILE: AUSTRALIA
MRO Capabilities by Model
Airfl
ite
Exec
uJet
(MEL
)
Exec
uJet
(PER
)
Exec
uJet
(SYD
)
Haw
ker P
acifi
c
Airfl
ite
Exec
uJet
(MEL
)
Exec
uJet
(PER
)
Exec
uJet
(SYD
)
Haw
ker P
acifi
c
●
●
●
●
●
●
●
●
●
●
●
●
●
●
●
●
●
●
●
●
●
●
●
●
●
●
●
●
●
●
●
●
●
●
●
●
●
●
●
●
●
●
●
●
●
●
●
●
●
●
●
●
●
●
●
●
●
●
●
●
●
●
●
●
●
●
●
●
●
●
●
●
●
●
●
●
●
●
●
●
●
●
●
●
●
●
●
●
●
●
●
●
●
●
●
●
●
●
●
●
●
●
●
●
●
●
●
●
●
●
●
●
●
●
●
●
●
●
●
●
●
●
●
●
●
●
●
●
●
●
●
●
●
●
Learjet 35/36
Learjet 40/45/45XR
Learjet 60/60XR
CRJ200
Challenger 300
Challenger 601
Challenger 604
Challenger 605
Challenger 850
Global Express
Global Express XRS
Global 5000
Global 6000
Falcon 7X
Falcon 8X
Falcon 10
Falcon 20
Falcon 50/EX
Falcon 200
Falcon 900
Falcon 2000
Citation I
Citation II/Bravo
Citation III/VI/VII
Citation V
Citation XLS/+
Citation X/+
Citation CJ1/+
Citation CJ2/+
Citation Sovereign/+
Citation Longitude
Citation Mustang
Hawker 400A/B
Hawker 400XP
Hawker 750
Hawker 800 A/B/850XP
Hawker 900XP
Hawker 4000
Phenom 100
Phenom 300
Legacy 500
Legacy 600
Legacy 650
ERJ135/ER/LR
Lineage 1000
BOMBARDIER
GULFSTREAM
DASSAULT
TEXTRON
EMBRAERAirw
ork
Gro
up
AMSA
(BN
E)
Qant
as
●
●
●
● ●
●
ACJ318
ACJ319
ACJ320
ACJ321
BBJ
BBJ2
BBJ3
AIRBUS
BOEING
G100
G150
G200
G280
GIV/GIV-SP/G300/G400
GV
G350/G450
G500/G550
G650/G650ER
Both
Line Maintenance (Fixed-wing)/Field Maintenance (Helicopter)
●
●
● Base Maintenance (Fixed-wing)/Overhaul (Helicopter)
CITY ABBREVIATION
BNE
BS
CNS
JD
MEL
PER
SYD
Brisbane
Bankstown
Cairns
Jandakot
Melbourne
Perth
Sydney

24 | ASIAN SKY QUARTERLY — SECOND QUARTER 2018
Airfl
ite
Air G
old
Coas
t
Exec
utiv
e Ai
rline
s
Hawk
er P
acific
(CNS
)
Hawk
er P
acific
(SYD
)
Mar
ker A
viat
ion
Prem
iair
Avia
tion
Stev
en H
egar
ty
Airb
us A
ustra
lia
Eagl
e Co
pter
s
Hawk
er P
acific
(SYD
)
Hel
iwes
t Ser
vice
Siko
rsky
Hel
itech
●
●
●
●
●
●
●
●
●
●
●
●
●
●
●
●
●
●
●
●
●
●
●
●
●
●
●
●
●
●
●
●
●
●
●
●
●
●
●
●
●
●
●
●
●
●
●
●
●
●
●
●
●
●
●
●
●
●
●
●
●
●
●
●
●
●
●
●
●
●
●
●
●
●
●
●
●
●
●
●
●
●
●
●
●
●
●
●
●
●
●
King Air 90
King Air 200/250
King Air 300/350
Cessna 172
Cessna 182
Cessna 205
Cessna 206
Cessna 207
Cessna 400
Caravan
Grand Caravan
Baron
Bonanza
H120
H125
H130
H135
H145
H155
H215
H225
AS355
AS365
BK117
TBM700
TBM850
TBM900
TBM910
TBM930
204
205
206
212
214
230
407
412
427
429
430
AW109
AW119
AW139
AW169
S76
S92
TEXTRON AIRBUS
TBM
BELL
LEONARDO
SIKORSKY
R22
R44
R66
ROBINSON
Agus
taW
estla
nd
Hel
iflite
(BNE
)
Hel
iflite
(SYD
)
●
●
●
●
●
●
●
●
●
●
Airw
ays
Avia
tion
Avia
tion
Spec
ialis
ts
Clon
curr
y Ai
r
Der
by A
ir
Hel
ibiz
Hel
icop
ter R
ebui
lds
Hel
i-Eng
inee
ring
Hel
iflite
(BS)
Hel
iflite
(JD
)
Hel
i-Mus
ter N
T
Hel
i Ser
vice
s
Hel
ispi
rit
Hel
i Wes
t
Jetp
oint
Kest
rel A
viat
ion
Lleg
e
Long
reac
h
Nac
Hel
icop
ters
Nau
tilus
Avi
atio
n
Nor
ther
n H
elic
opte
r
NQ
Avia
tion
Serv
ice
Pear
l Coa
st H
elic
opte
r
Prof
. Hel
icop
ter
Pror
otor
Aus
tralia
Skyl
ine
Avia
tion
Sout
h W
est A
viat
ion
Supe
rair
Serv
ice
●
●
●
●
●
●
●
●
●
●
●
●
●
●
●
●
●
●
●
●
●
●
●
●
●
●
●
●
● ●
●
● ●
● ●
● ●
●
●
●
●
●
●
●
●
●
●
●
●
●
Siko
rsky
Hel
itech
COUNTRY PROFILE: AUSTRALIA

HELICOPTER MARKET
Helicopter operations in Australia began with the introduction of military helicopters in the 1940s, followed by use of civil helicopters in the 1950s. The helicopter market, both piston and turbine, has since grown to become one of the most mature in the Asia-Pacific region.
In 2017, the total fleet size of the civil turbine market increased from 808 to 832 aircraft. Bell Helicopter remained the market leader, with its Bell 206 model the most popular aircraft of the Australian fleet.
Bell’s present popularity in Australia is a contrast to the rest of the Asia Pacific, where Airbus dominates most markets in terms of fleet size. This popularity is expected to be temporary, however. Not only is Australia’s Bell fleet much older than Airbus’s, but the company is currently taking initiative to further penetrate the Australian market.
Multi-mission, corporate and offshore are the most popular mission segments of the fleet. Helicopters used for offshore oil and gas have, in recent years, been on the decline. During this time, operators of offshore helicopters looked to diversify their fleets, leading to an increase in helicopters used in the multi-mission category. Still, with the recovery of global oil prices, drilling is likely to become more active.
FUTURE
Industry members in Australia have strong opinions on the future of business aviation in the country. All agree that CASA needs to take immediate action.
“Overregulating will always impede growth and although the Australian aviation regulator has move to the US-model [of regulating] in certain areas, the industry has a long way to go to make aircraft purchasing and operating a more pleasant and efficient process,” says Universal Weather & Aviation’s Senior Account Manager of Australia/New Zealand/Indonesia.
Bell and the ABAA are continuing to make appeals to the governing body, asking for standardized regulations and less red tape. One of the organization’s aims is to “simulate economic activity” and promote the importance of business aviation. In the meantime, expectations are high for growth and activity.
COUNTRY PROFILE: AUSTRALIA

26 | ASIAN SKY QUARTERLY — SECOND QUARTER 2018
SPECS
Maximum Cruise Speed4 Passenger RangeTakeoff Field LengthLanding DistanceMaximum Operating AltitudeMaximum Limit Speed
446 ktas (826 km/h)2,700 nm (5,000 km)3,580 ft (1,091 m)2,480 ft (756 m)45,000 ft (13,716 m)0.80 Mach
476 ktas (882 km/h)3,500 nm (6,482 km)4,900 ft (1,494 m)3,400 ft (1,036 m)45,000 ft (13,716 m)0.84 Mach
ManufacturerModelThrust
Pratt & Whitney PW306D1 5,907 lb (26.28 kN)
ENGINES
HoneywellHTF7700L 7,600 lb (33.81 kN)
STANDARD FEATURES
• Fully integrated autothrottles• Garmin SVT• Touch-screen control panels• Flight Management systems (FMS)• Transponders with ADS-B Out capability
First Delivery: Aug 2015
First Delivery: Second Quarter 2018
• Fully integrated autothrottles• Three large 14-inch glass displays• Four touch-screen controllers• Garmin synthetic vision system (SVT™)• Synoptics for key systems• Industry-leading diagnostics• In-flight diagnostics reporting• ACARS – VHF
PERFORMANCES LONGITUDE
LONGITUDE
LATITUDE
LATITUDE
Citation Latitude
AIRCRAFT SPOTLIGHT CITATION LATITUDE & LONGITUDE
American general aviation aircraft manufacturer Cessna Aircraft Company, known for its piston-powered aircraft, began producing business jets in the early 1970s. Since then, the Citation family has flourished and developed a dedicated following of owners and operators along the way. In January 2017, Cessna — now a subsidiary of US
conglomerate Textron — celebrated its 45th anniversary of the first Citation delivery. The family of business jets is now visible across the globe with a growing market in the Asia-Pacific region, bringing together a mix of high performance, maximum comfort and cost-efficient operation that owners worldwide can rely on.
Over the course of the now 45 plus years of Citation production, Cessna has built variant after variant since the original Citation I model. Improving and perfecting design, size, avionics and performance has earned Cessna several accolades, while meeting customer’s evolving expectations.
CITATION LATITUDE
In 2015, Cessna’s midsize Citation Latitude entered the market; advertised as a more spacious and comfortable aircraft than its predecessors. By October 2017, Cessna had delivered 100 Latitudes. The midsize jet boasts a larger cross section than most other aircraft in the Citation series, complete with a flat floor and six-foot stand-up cabin. Its additional 30 inches of legroom amid the standard nine passenger configuration makes for a more relaxed flight experience.
Powered by Pratt & Whitney Canada PW306D1 engines, the Latitude can fly a high-speed cruising range of 2,700 nautical-miles, taking passengers nonstop from Los Angeles to New York or Geneva to Dubai. The aircraft’s take-off field length is an impressive 3,580 feet, allowing the Latitude to reach more general aviation airports.
With a cabin altitude of 5,950 feet while cru is ing at an operat ing a l t i tude of 45,000 feet, the Latitude’s pressurization system allows passengers to feel fresh and comfortable. Staying connected is another factor in passenger satisfaction, with the Latitude featuring a wireless cabin management system providing connectivity and entertainment to each passenger through personal electronic devices.

SECOND QUARTER 2018 — ASIAN SKY QUARTERLY | 27
UPCOMING AIRCRAFT
Citation Longitude
RANGE MAP
Citation Longitude range map from Hong Kong
Citation Latitude range map from Hong Kong
SydneyPerth
Singapore
FromHong Kong
Lagos
Istanbul
Moscow
BeijingTokyo
Up front, pilots will enjoy the Citation line’s largest cockpit, which utilizes Garmin G5000 avionics. The flight deck includes three 14-inch displays, designed to provide pilots with the information they need for a reliable and efficient flight. Displays are customizable via touch screen control panels, allowing flight crews to organize and prioritize flight data as needed.
Following the Latitude’s Civil Aviation Administration of China (CAAC) and Civil Aviation Safety Authority of Australia (CASA) certification earlier this year, the aircraft made its first deliveries into the China market. And, the midsize jet continues to be one of the best-selling of its size category, now reaching a global fleet of more than 110.
CITATION LONGITUDE
After being announced in 2012, Cessna’s super-midsize business jet, the Citation Longitude, is expected to enter service later this year. With more range and greater payload capacity than the Citation Latitude, the Longitude’s cross section parallels that of the Latitude, with a flat floor and six-foot stand-up cabin. The Longitude’s maximum number of passengers is 12, an increase from nine in its predecessor.
With an extended range of 3,500NM and a full fuel payload of 1,600 pounds, the aircraft can take four passengers nonstop from Singapore to Beijing or Hong Kong to Mumbai. Cessna selected the Honeywell HTF7000 engines to power the Longitude, which come equipped with fully-integrated autothrottles with envelope protection. Additionally, the full-efficient engines deliver low-cost maintenance.
Cabin pressure is similar to that of the Latitude with an altitude of 5,950ft, delivering the quietest cabin in the super midsize class, complemented by a soundproof fuselage including 15 acoustic windows and isolated interior panels. Onboard, passengers can also enjoy what has become the standard connectivity and cabin management systems found in the Citation series. Easily accessible during flight is the walk-in baggage compartment.
The Garmin 5000 flight deck proved to be dependable in the Citation Latitude, consequently the Longitude has adopted the same avionics system. New to the deck is Garmin’s Head-up Display (GHD 2100) and enhanced vision capability.
In March 2018, the upcoming Longitude demonstrated its capabilities in a successful circumnavigation of the globe. The aircraft’s world tour took the Longitude more than 31,000 nautical miles, flying 27 legs and visiting 12 countries. The new super-midsize business jet has been designed to be among the most cost effective of the Citation series, featuring the longest maintenance intervals in its class — 800 hours or 18 months.
www.cessna.txtav.com

AIRCRAFT SOLD1
WORLDWIDE
PRE-OWNED BUSINESS JETS FOR SALE
INVENTORY VALUE (USD)1
Source: JETNET & ASG
$7,911M
$5,951M
$1,054M
MOVING TOWARDS BUYER’S MARKET
MOVING TOWARDS SELLER’S MARKET
MARKET TREND1
WORLDWIDE
WORLDWIDE
ASIA PACIFIC
1 The historical inventory value and transactions are subject to change based on latest market information updates. 2 ASG’s Inventory Value line is calculated by taking the total number of aircraft for sale from a selection of 26 different models, multiplied by their average asking prices.
The Inventory Value Line represents the number of aircraft actively being marketed for sale in USD terms.2
The Trend Line represents the market’s direction in terms of the balance between sellers and buyers (supply and
demand) at today’s price levels. A rising Trend Line indicates that pre-owned activity is stabilizing, with sellers of
aircraft increasingly likely to find buyers.
The Signal Line represents an indication of where the market’s direction may be heading in the future. A Signal
Line consistently falling below the Trend Line indicates that any improvement in the market’s direction may not be
entirely sustainable.
Jun2016
Mar MarApr AprMay MayJun JunJulAug AugSep SepJul OctNov NovDec DecJan2017
Oct Jan2018
Feb Feb
$1,040MMAR 2018
$5,752MMAR 2018
TREND REVERSAL
$1,510M
TREND IMPROVEMENT
Jun2016
Mar MarApr AprMay MayJun JunJulAug AugSep SepJul OctNov NovDec DecJan2017
Oct Jan2018
Feb Feb
20
3734
3035
32
2328
3228
2125
3025
2225
22
30
40
31
25
36
30
24
30
28 | ASIAN SKY QUARTERLY — SECOND QUARTER 2018
MARKET DYNAMICS

AVERAGE DAYS ON MARKET
520
470
420
370
320
270
220
14%
12%
8%
9%
6%
7%
13%
11%
% OF FLEET FOR SALE
AVERAGE ASKING PRICE
MIL
LIO
N U
SD
25
22
23
20
21
24
17
18
19
10%
Source: JETNET & ASG
MARKET DYNAMICS
Jun 16
Jun17
Aug 16
Oct17
Aug17
Apr17
Feb17
Dec16
Oct16
Dec17
Feb18
Apr18
Jun18
WORLDWIDE
ASIA PACIFIC
WORLDWIDE
ASIA PACIFIC
WORLDWIDE
ASIA PACIFIC
Jun 16
Jun17
Aug 16
Oct17
Aug17
Apr17
Feb17
Dec16
Oct16
Dec17
Feb18
Apr18
Jun18
Jun 16
Jun17
Aug 16
Oct17
Aug17
Apr17
Feb17
Dec16
Oct16
Dec17
Feb18
Apr18
Jun18
SECOND QUARTER 2018 — ASIAN SKY QUARTERLY | 29

SUPPLY / DEMAND INDICATORS
SUPPLY VS. DEMAND RATIO AVERAGE DAYS ON MARKET
BUSINESS JETS2018 Q2
% OF FLEET FOR SALE MODEL
ACJ31825.0%
ACJ31914.1%
BBJ11.9%
BBJ217.4%
CL6045.3%
CL6053.8%
CL85015.5%
GL50006.3%
GL60005.3%
L6008.0%
L6503.1%
L100020.0%
F2000LX2.3%
F2000LXS2.9%
F2000S5.3%
F7X8.4%
F900DX
F900EXe
8.3%
9.2%
F900EX
F900LX
6.8%
3.2%
G20011.9%
G2800.7%
G4507.3%
G5505.3%
G6504.0%
G650ER8.2%
AVERAGE
AIR
BUS
BOEI
NG
BOM
BARD
IER
EMBR
AER
DASS
AU
LTG
ULF
STRE
AM
The above chart reflects where certain aircraft models are positionedin terms of supply and demand (based on a ratio of completed transactions compared to the number of sellers and the average number of days on the market for a transaction to take place).
For some model types, given the market indicators shown on the previous page, the stabilization in pre-owned asking prices and decline in inventory level appear to have stimulated increased demand, leading to an increase in transactions and a more balanced state of supply and demand.
These indications do not necessarily mean that prices will be higher in the future, but it does indicate that sellers of these particular models are more likely to find willing buyers in a shorter period of time than the overall average.
This can be seen most with certain Gulfstream (G200, G450, G550, G650) and Bombardier models (Challenger 604/605 & Global 6000) where more transactions are occurring relative to the number for sale, and transactions are requiring less time on the market for sellers to complete.
AVER
AGE
Source: JETNET & ASG
DAYS ON MARKET
0 200 400 600 800 10000
Average AC for sale / Total sold in last 12 months
6.7% Average
100%200%300%400%
DEMANDSUPPLY >
MARKET DYNAMICS
NO TRANSACTIONS
30 | ASIAN SKY QUARTERLY — SECOND QUARTER 2018

AIR
BUS
BOEI
NG
BOM
BARD
IER
EMBR
AER
DASS
AU
LTG
ULF
STRE
AM
BalancedSupply & Demand
MARKET POSITIONING
The above chart provides a visual representation of the Supply /Demand Ratio of each aircraft model relative to the overall market, and is based on a ‘Marketability’ calculation for each particular model including the following four market indicators:
1. The percentage of aircraft for sale relative to its fleet size.2. The number of aircraft sold relative to the average number for sale.3. The average days for sale relative to the overall market average.4. The momentum of the marketplace (represented by the trend towards supply and demand market equilibrium portrayed earlier).
When taking into account these four factors, the large and medium sized jet, such as Challenger 600, Falcon 2000 & 900 Series, as well as the various Gulfstream models, appear well positioned to find buyers available.
* ASG chose 26 popular aircraft models as described in this report
MOVING TOWARDSBUYER’S MARKET
MOVING TOWARDS SELLER’S MARKET
ACJ318
ACJ319
BBJ 1
BBJ 2
CL604
CL605
CL850
GL5000
GL6000
L600
L650
L1000
F2000LX
F2000LXS
F2000S
F7X
F900DX
F900EX
F900EXe
F900LX
G200
G280
G450
G550
G650
G650ER
Source: JETNET & ASG
BUSINESS JETS
MARKET DYNAMICS
SECOND QUARTER 2018 — ASIAN SKY QUARTERLY | 31

AIRCRAFT SOLD1
WORLDWIDE
MARKET DYNAMICS
PRE-OWNED CIVIL HELICOPTERS FOR SALE
$1,124M
$128M
$1,354M
$113M
7 6
10108 7 7 7
10 10
69 10 9 99
7
24
7
13 12
7
1
6
WORLDWIDE
ASIA PACIFIC
$1,410MMAR 2018
Source: JETNET & ASG
MOVING TOWARDS BUYER’S MARKET
MOVING TOWARDS SELLER’S MARKET
INVENTORY VALUE (USD)1
MARKET TREND1
WORLDWIDE
1 The historical inventory value and transactions are subject to change based on latest market information updates. 2 ASG’s Inventory Value line is calculated by taking the total number of aircraft for sale from a selection of 16 different models, multiplied by their average asking prices.
The Inventory Value Line represents the number of aircraft actively being marketed for sale in USD terms.2
The Trend Line represents the market’s direction in terms of the balance between sellers and buyers (supply and
demand) at today’s price levels. A rising Trend Line indicates that pre-owned activity is stabilizing, with sellers of
aircraft increasingly likely to find buyers.
The Signal Line represents an indication of where the market’s direction may be heading in the future. A Signal
Line consistently falling below the Trend Line indicates that any improvement in the market’s direction may not be
entirely sustainable.
$176MMAR 2018
TREND WORSENING
TREND IMPROVEMENT
Jun2016
Mar MarApr AprMay MayJun JunJulAug AugSep SepJul OctNov NovDec DecJan2017
Oct Jan2018
Feb Feb
Jun2016
Mar MarApr AprMay MayJun JunJulAug AugSep SepJul OctNov NovDec DecJan2017
Oct Jan2018
Feb Feb
TREND IMPROVEMENT
TREND REVERSAL
32 | ASIAN SKY QUARTERLY — SECOND QUARTER 2018

MARKET DYNAMICS
7
MIL
LIO
N U
SD
6.5
5.5
4.5
6
5.0
4
8.0%
5.0%
6.0%
7.0%
2.0%
3.0%
4.0%
0.0%
1.0%
% OF FLEET FOR SALE
700
650
500
400
450
550
600
350
AVERAGE DAYS ON MARKET
Source: JETNET & ASG
AVERAGE ASKING PRICE
WORLDWIDE
WORLDWIDE
ASIA PACIFIC
ASIA PACIFIC
WORLDWIDE
ASIA PACIFIC
Jun 16
Jun17
Aug 16
Oct17
Aug17
Apr17
Feb17
Dec16
Oct16
Dec17
Feb18
Apr18
Jun18
Jun 16
Jun17
Aug 16
Oct17
Aug17
Apr17
Feb17
Dec16
Oct16
Dec17
Feb18
Apr18
Jun18
Jun 16
Jun17
Aug 16
Oct17
Aug17
Apr17
Feb17
Dec16
Oct16
Dec17
Feb18
Apr18
Jun18
SECOND QUARTER 2018 — ASIAN SKY QUARTERLY | 33

MARKET DYNAMICS
CIVIL HELICOPTERS2018 Q2
SIKO
RSKY
BELL
HEL
ICO
PTER
LEO
NA
RDO
AIR
BUS
HEL
ICO
PTER
S
050%100%150%200%250%300%350%
S76C+15.8%
S76C++12.4%
S92A2.5%
BELL 412EP5.6%
BELL 412HP6.6%
BELL 4296.1%
AW1393.3%
AS332L14.5%
H2258.9%
EC135P27.8%
EC135T24.2%
EC1451.0%
EC155B28.6%
H1558.4%
AW109E PWR15.0%
AW109SP GN5.1%
AVER
AGE
0 100 200 300 400 500 600 700 800
AVERAGE
Average AC for sale / Total sold in last 12 months
6.0%Average
The above chart reflects where certain aircraft models are positioned in terms of supply and demand (based on a ration of completed transactions compared to the number of sellers, and average number of days on the market for a transaction to take place).
SUPPLY / DEMAND INDICATORS
Source: JETNET & ASG
SUPPLY VS. DEMAND RATIO AVERAGE DAYS ON MARKET
% OF FLEET FOR SALE MODEL
DAYS ON MARKET
NO TRANSACTIONS
NO TRANSACTIONS
NO TRANSACTIONS
34 | ASIAN SKY QUARTERLY — SECOND QUARTER 2018
DEMANDSUPPLY >

MARKET DYNAMICS
The above chart provides a visual representation of the Supply / Demand Ratio of each aircraft model relative to the overall market, resulting in a ‘Marketability’ calculation of each particular model based on the following four market indicators:
1. The percentage of aircraft for sale relative to its fleet size.2. The number of aircraft sold relative to the average number for sale.3. The average days for sale relative to the overall market average.4. The momentum of the marketplace (represented by the trend towards supply and demand market equilibrium portrayed earlier).
SIKO
RSKY
BELL
HEL
ICO
PTER
LEO
NA
RDO
AIR
BUS
HEL
ICO
PTER
S
S76C+
S76C++
S92A
BELL 412EP
BELL 412HP
BELL 429
AW139
AS332L1
H225
EC135P2
EC135T2
EC145
EC155B
H155
AW109E PWR
AW109SP GN
MARKET POSITIONING
Source: JETNET & ASG
BalancedSupply & Demand
CIVIL HELICOPTERS
MOVING TOWARDSBUYER’S MARKET
MOVING TOWARDS SELLER’S MARKET
SECOND QUARTER 2018 — ASIAN SKY QUARTERLY | 35


SECOND QUARTER 2018 — ASIAN SKY QUARTERLY | 37
PRE-OWNED MARKET SPOTLIGHTHAWKER 800 SERIESA development of the British Aerospace BAe 125 twinjet, the Hawker 800 was the final variant of the BAe 125 series and began delivery in 1984. Already ahead of its time, the aircraft was the first corporate jet to feature an electronic flight instrument system cockpit. The 800 was manufactured between 1984 and 1995, producing over 400 deliveries.

38 | ASIAN SKY QUARTERLY — SECOND QUARTER 2018
PRE-OWNED SPOTLIGHT
In 1993, US defense contractor Raytheon Company purchased the corporate aircraft division and rebranded the 125 with the Hawker 800 moniker. Just one year later, Raytheon merged its Beech Aircraft Corporation and Raytheon Corporate Jets units becoming Raytheon Aircraft Corporation. The company has since been renamed to Hawker Beechcraft Corporation and, most recently, Beechcraft – a subsidiary of Textron Aviation..
Since then, the 800 series has emerged as somewhat of a workhorse, offering reliability and high standards in a midsize jet. The cabin of the 800, which has remained the same throughout the series, is 5.75-feet in height, six-feet in width and 21.3-feet in length. The typical configuration of the 800 allows for eight passengers, plus two crew members. The maximum take-off weight (MTOW) is 27,400-pounds
and the maximum payload capacity is 2,000lbs. While the 800 can just about reach New York from Los Angeles, with a 2,390-nautical mile range, in Asia it reaches most of Indochina from Shanghai.
The more well-known, and more successful, of the series is the 800XP (Extended Performance). It entered service in 1995. As the third-generation of the series, the cabin size of the aircraft remained the same but the variant offers improved payload capabilities, enhanced performance and updated systems. Powered by Honeywell TFE 731-5BR turbofan engines, the XP flies an increased range of 2,470nm and has increased payload capacity of 2,050lbs with a MTOW of 28,000lbs. Updated systems on the XP include Rockwell Collins Pro Line 21 avionics suite.
MODEL
REGION
850XP800XP
800XP 900XP850XP800XPI
900XP
GRAND TOTAL
800XPI
Entry into ServiceTotal Aircraft In OperationEngine ModelAvionicsWinglets“Maximum RangeTyp. PassengersPassenger Cabin Volume
Northern AmericaLatin America and the Caribbean Western EuropeAsiaMiddle EastSub-Saharan AfricaEurope - BalticsOceaniaEastern EuropeEurope - Common Wealth of Independent StatesNorthern Africa
US BasedAsia Pacific BasedGrand Total
1995417
Honeywell TFE 731-5BRCollins Pro Line 21
No2,120 N.M.
8 Pax551 Cu. Ft.
300421922101442121
72%8%417
200551
Honeywell TFE 731-5BRCollins Pro Line 21
No2,120 N.M.
8 Pax551 Cu. Ft.
3156222111
61%10%51
200699
Honeywell TFE 731-5BRCollins Pro Line 21
Yes2,615 N.M.
8 Pax551 Cu. Ft.
6186
114223
11
62%18%99
2007182
Honeywell TFE 731-50RCollins Pro Line 21
No2,825 N.M.
8 Pax551 Cu. Ft.
1201416111141
212
66%12%182
512694746272286444
68%11%749
800XPI800XP
AGE AND MODEL DISTRIBUTION - CURRENT IN OPERATION
MODEL COMPARISON
OPERATING REGION - BREAKDOWN BY MODEL
850XP 900XP
10
20
0
30
40
60
80
70
90
50
2012
2010
2006
2000
2009
2005
1999
2008
2002
2004
1998
1996
2007
2001
2011
2003
1997
1995
Data Source: JETNET
Data Source: Conklin & de Decker & JETNET
Data Source: JETNET
No.
of A
ircra
ft in
Ope
ratio
n

SECOND QUARTER 2018 — ASIAN SKY QUARTERLY | 39
PRE-OWNED SPOTLIGHT
In 2005, the Hawker 800XPI entered service, manufactured for only one year. This was around the same time the Hawker 850XP entered service in 2006. While the XPI features a redesigned interior and upgraded avionics — the Collins Pro Line 21, it doesn’t include the Hawker winglets which were introduced with the 850XP model. The 850XP also features an extended range of 2,615nm, as well as increased payload capacity of 2,120lbs.
One year later the Hawker 900XP entered service, maintaining many features of the Hawker 850XP, including the winglets, avionics and cabin design, while upgrading to the more powerful Honeywell TFE 731-50R engines. The improved engines make way for an increased range of 2,825nm and allow for enhanced climbing capability.
Worldwide, the 800 series — including the 800XP, 800XPI, 850XP and 900XP — stood at 749, as of June 2018. The US, which is base to
68% of the operating fleet, is the most popular market for the series, largely due to the country’s vast number of smaller airports and domestic travel. The Asia Pacific is base to only 11%, a reflection of the country’s need for longer-range aircraft and lack of regional airports.
The majority (96%) of the series is wholly-owned, while 2% is part of a fractional ownership program and the other 2% is under shared-ownership. In the US, fractional ownership was made popular by NetJets, the American subsidiary of Berkshire Hathaway. During the late 1990s, NetJets purchased a large fleet of the Hawker 800 series, which were mostly sold almost a decade later to make room for newer models, like the Phenom 300.
The 800XP, manufactured from 1995 to 2005, has the highest number of aircraft in service; 417. As of June 2018, around 11% of
VALUE DEPRECIATION: HAWKER 850XP, 900XP (2008 MODEL) & HAWKER 800XP (2003 MODEL)
ASKING PRICES & INDICATED TRANSACTION PRICES TREND ALL MODEL COMBINED
2008
Q1
2009
Q1
2010
Q1
2011
Q1
2012
Q1
2015
Q1
2013
Q1
2016
Q1
2014
Q1
2017
Q1
2018
Q1
2008
Q3
2009
Q3
2010
Q3
2011
Q3
2012
Q3
2015
Q3
2013
Q3
2016
Q3
2014
Q3
2017
Q3
2008
Q2
2009
Q2
2010
Q2
2011
Q2
2012
Q2
2015
Q2
2013
Q2
2016
Q2
2014
Q2
2017
Q2
2008
Q4
2009
Q4
2010
Q4
2011
Q4
2012
Q4
2015
Q4
2013
Q4
2016
Q4
2014
Q4
2017
Q4
2016
-08
2017
-08
2017
-02
2018
-02
2016
-10
2017
-10
2017
-04
2018
-04
2016
-11
2017
-11
2017
-05
2018
-05
2016
-12
2017
-12
2017
-06
2018
-06
2016
-07
2017
-07
2017
-01
2018
-01
2016
-09
2017
-09
2017
-03
2018
-03
2008 Hawker 850XP
Average Asking Price
2008 Hawker 900XP
High Asking Price
2003 Hawker 800XP
Low Asking Price
Average Selling Price
16.015.014.013.012.011.010.09.08.07.06.05.04.03.02.01.0
$7
$6
$5
$4
$3
$2
$1
$0
* Source: Vref.
RESI
DU
AL
VALU
E (M
USD
)A
SKIN
G /
SO
LD P
RIC
E (M
USD
)
POSITIONING:HAWKER 800/900 SERIES VS. OTHER POPULAR MODELS
2,20
0
1.5
2.5
3.5
2
3
4
4.5
5
2,50
0
2,80
0
2,30
0
2,60
0
2,90
0
2,40
0
2,70
0
3,00
0
3,10
0 TOTA
L AN
NU
AL C
OST
(M U
SD /
YEAR
)*
MAX RANGE (N.M.)
Legacy 500
Legacy 450 G150
H850XP H800XP H900XP
L60XRAstra SP
H800
Cit. Latitude
Cit. Sovereign
Cit. X
* The estimated total annual cost is based on aircraft ownership cost for 10 years including financing, plus yearly operating costs and regional adjustments.
Source: Conklin & de Decker 2017
800XPI 900XP800XP 850XP
* Data source: JETNET & ASG
NO
. OF
AIR
CRA
FT F
OR
SALE
TRANSACTION SUMMARY - BREAKDOWN BY MODEL
2017
/09
2017
/05
2018
/01
2017
/01
2017
/03
2017
/11
2017
/07
2018
/03
2017
/02
2017
/10
2017
/06
2018
/04
2018
/02
2017
/04
2017
/12
2017
/08
2
35
1
1
2
2
2
111 8
3
5
2
2
2
3
2
4
4
4
5
11
6
1
7
11
3
4
11
2
8
1
1
5
1
4
2
7
1
7
1
4
4
1
2018
/05

40 | ASIAN SKY QUARTERLY — SECOND QUARTER 2018
PRE-OWNED SPOTLIGHT
the fleet was available for sale. The 800XPI variant had the lowest number of aircraft in operation, with 51, and about 8% on the market; down from the past couple of years. The 850XP operating fleet stood at 99, with around 13% of the fleet on the market; an increase from the previous year. With 182 operating worldwide, the 900XP had around 7% on the market; a decline from previous years. Overall inventory levels of the Hawker series have dropped between June 2016 and June 2018, from 12.7% to 10.6%; its total inventory value was also reduced from US$292M to US$189M, affected by both reduced average asking price and inventory level.
The average price for the 800XP sits at around US$1.6M. From there, prices gradually increase depending on year and model. The 800XPI has an average asking price of US$2.55M, while the 850XP is at US$3.28M. The newer 900XP models have an average asking price of US$4.75M.
Asking prices are in line with the series’ depreciation value. A 2003 800XP has a depreciation value of US$2.2M, while a 2008 850XP has a value of US$3.2M. A 2008 900XP has a value of approximately US$4M.
The Hawker 800 series is the only offering available for those looking for an aircraft with a range of around 2,500nm, at a price point of around US$2M to $2.5M. Now a product of Textron Aviation, the 800 and its variants continue to be reliable and attractive aircraft, particularly for buyers in the US.
AVERAGE ASKING PRICE TREND - MAJOR MODELS
Ave
rage
Ask
ing
Pric
e (M
USD
)
3.3
4.2
2.9
4.75.1
4.1
5.1
2.4
Hawker 850XP Hawker 900XPHawker 800XP Hawker 800XPI
1.71.82.2 2.2
1.6
2.6
3.2
2.3
2017
/05
2018
/01
2016
/09
2017
/09
2018
/05
2017
/01
2016
/07
2017
/07
2018
/03
2016
/11
2017
/11
2018
/06
2017
/03
2017
/06
2018
/02
2016
/10
2017
/10
2017
/02
2016
/08
2017
/08
2018
/04
2016
/12
2017
/12
2017
/04
225
369
359
394
DAYS ON MARKET - MAJOR MODELS
100
300
200
400
550
600
150
350
500
250
450
Hawker 850XP Hawker 900XPHawker 800XP Hawker 800XPI
335
543
412
233187
420 412
250
273
339
221
2017
/05
2018
/01
2016
/09
2017
/09
2018
/05
2017
/01
2016
/07
2017
/07
2018
/03
2016
/11
2017
/11
2018
/06
2017
/03
2017
/06
2018
/02
2016
/10
2017
/10
2017
/02
2016
/08
2017
/08
2018
/04
2016
/12
2017
/12
2017
/04
PERCENTAGE FOR SALE - MAJOR MODELS
8.0%
4.0%
12.0%
18.0%
10.0%
16.0%
6.0%
14.0%
Hawker 850XP Hawker 900XPHawker 800XP Hawker 800XPI
2017
/05
2018
/01
2016
/09
2017
/09
2018
/05
2017
/01
2016
/07
2017
/07
2018
/03
2016
/11
2017
/11
2018
/06
2017
/03
2017
/06
2018
/02
2016
/10
2017
/10
2017
/02
2016
/08
2017
/08
2018
/04
2016
/12
2017
/12
2017
/04
* Data source: JETNET
INV
ENTO
RY L
EVEL
(M
USD
) $292
12.7%
$229
12.1%
$235
11.3%
$254
12.0%
$206
11.3%
$173
10.1%$270
12.6%
$218
11.6%
$215
9.9%
$223
11.2%
$197
10.8%
$221
11.2%
$286
12.7%
$221
11.6%
$223
10.4%
$242
11.8%
$206
11.5%
$208
10.8%
$262
12.5%
$216
11.6%
$180
10.3%
$234
11.6%
$206
10.8%
$189
10.6%
2017
/05
2018
/01
2016
/09
2017
/09
2018
/05
2017
/01
2016
/07
2017
/07
2018
/03
2016
/11
2017
/11
2018
/06
2017
/03
2017
/06
2018
/02
2016
/10
2017
/10
2017
/02
2016
/08
2017
/08
2018
/04
2016
/12
2017
/12
2017
/04
INVENTORY LEVEL, ASKING PRICES & PERCENTAGE FOR SALEInventory Level % In Operation for Sale

SECOND QUARTER 2018 — ASIAN SKY QUARTERLY | 41
PRE-OWNED SPOTLIGHT
AIRCRAFTMODEL YEAR ASKING PRICE AFTT
800XP 1996 $1,195,000 12,706
800XP 1996 $1,250,000 4,585
800XP 1996 Make Offer 6,716
800XP 1998 $1,000,000 12,042
800XP 1997 Make Offer 4,209
800XP 1997 $1,149,000 8,170
800XP 1997 $1,195,000 7,964
800XP 1997 $1,550,000 8,846
800XP 1998 Make Offer 8,011
800XP 1998 $1,950,000 10,700
800XP 1998 $1,975,000 10,700
800XP 1998 Make Offer 6,425
800XP 1999 $1,500,000 4,478
800XP 1999 $1,700,000 7,043
800XP 1999 $1,395,000 7,365
800XP 1999 Make Offer 6,369
800XP 1999 $1,750,000 6,322
800XP 1999 Make Offer 4,530
800XP 1999 $1,495,000 4,586
800XP 1999 $1,500,000 4,609
800XP 1999 Make Offer 6,401
800XP 1999 Make Offer 4,328
800XP 1999 $1,595,000 4735
800XP 1999 Make Offer 8076
800XP 1999 Make Offer 4668
800XP 2000 Make Offer 4813
800XP 2000 $1,550,000 4179
800XP 2000 $2,450,000 6087
800XP 2000 Make Offer 4368
800XP 2000 $1,050,000 12494
800XP 2000 $1,050,000 11920
800XP 2000 Make Offer 4639
800XP 2000 Make Offer 4238
800XP 2000 $1,050,000 12730
800XP 2000 $1,000,000 12455
800XP 2000 $1,050,000 12412
800XP 2001 $1,050,000 11169
800XP 2001 Make Offer 6063
800XP 2001 Make Offer 3046
800XP 2002 Make Offer 9855
* Data Source: Asian Sky Group & JETNET
AIRCRAFTMODEL YEAR ASKING PRICE AFTT
800XP 2002 Make Offer 1720
800XP 2002 Make Offer 8891
800XP 2002 $2,495,000 3603
800XP 2002 $2,095,000 7604
800XP 2002 $2,375,000 8319
800XP 2003 Make Offer 8032
800XP 2003 Make Offer 3566
800XP 2004 $1,495,000 6323
800XP 2004 Lease Only 3480
800XP 2004 $2,500,000 6928
800XP 2004 Make Offer 8207
800XP 2004 Make Offer 8913
800XP 2005 Make Offer 3397
800XP 2005 $3,000,000 7241
800XPI 2005 $2,100,000 7154
800XPI 2006 Make Offer 6494
800XPI 2006 $3,000,000 7600
800XPI 2006 Make Offer 6981
850XP 2006 $2,595,000 7195
850XP 2006 $4,100,000 2842
850XP 2006 Make Offer 2501
850XP 2006 $3,750,000 2162
850XP 2006 Make Offer 4107
850XP 2006 $3,000,000 3442
850XP 2007 $3,395,000 2463
850XP 2007 Make Offer 2580
850XP 2007 Lease Only 1400
850XP 2008 $3,500,000 2057
900XP 2007 Make Offer 5892
900XP 2008 Make Offer 1505
900XP 2009 $3,649,000 3000
900XP 2008 Make Offer 2800
900XP 2008 $3,750,000 3317
900XP 2008 Make Offer 2714
900XP 2009 $3,850,000 4008
900XP 2010 Make Offer 1195
900XP 2010 $4,400,000 2967
900XP 2011 Make Offer 3167
900XP 2011 $6,000,000 1675
900XP 2012 Make Offer 1033
900XP 2012 $6,200,000 723
MARKET CHARACTERISTICS - BREAKDOWN BY MODEL
MARKET AVAILABILITY
EQUIPMENT / PROGRAM 800XP 800XPI 850XP 900XP
FM Immunity8.33 Channel SpacingFDRRVSMSATCOMEngine Maintenance ProgramCVRHigh-Speed DataTCASTWAS
45%61%
--
51%96%
-43%94%
-
--
75%-
75%100%100%
-100%100%
38%46%69%85%85%92%
----
---
100%79%
100%100%
-100%100%

42 | ASIAN SKY QUARTERLY — SECOND QUARTER 2018

SECOND QUARTER 2018 — ASIAN SKY QUARTERLY | 43
AIRCRAFT POSITIONING
1,00
0
2,00
0
3,00
0
2,50
0
3,50
0
4,50
0
4,00
0
5,50
0
5,00
0
6,00
0
6,50
0
7,50
0
7,00
0
8,00
0
500
1
2
3
4
6
7
8
9
10
11
12
13
14
15
16
ACJ318
G550
F8X
F7XG500
CL650
G650ER
LINEAGE 1000EGLOBAL 6000
GLOBAL 5000
LEGACY 650
LEGACY 600
G350
CIT. X+
LEGACY 500
CL300
LEGACY 450
CIT. SOVEREIGN+
CIT. SOVEREIGN
F900EX EASY
F50EXG200H4000CIT. XLS+
H850XP
L40XR
L45XR
CIT. ENCORE+
CIT. ENCORECIT. M2 CIT. ULTRA
CIT. EXCEL
H800
G100
CIT. CJ3+
H900XP
L75
L70
CIT. CJ4
CIT. CJ1CIT. CJ1+
HONDAJETPREMIER 1A PHENOM 100E
ECLIPSE 550
CIT. MUSTANG
CIT. XLS
CIT. VII
L60XR
CIT. CJ2+
NEXTANT 400XTI
ASTRA SP
CL605G-IVSP
CL350
F2000
CL850
GLOBAL EXPRESS XRS
GLOBAL EXPRESS
G-V
G600
G280
F2000LXS
F2000S
F900EXG-IV
CL604
F2000LX
F2000EX
F2000DX
H800XPPHENOM 300
G300CIT. X
G150
CIT. LATITUDE
G650
G450F900LX
17
18192021222324
1,50
0
BUSINESS JETS
* The estimated total yearly cost is based on aircraft ownership cost for 10 years including financing, plus annual operating costs and regional adjustments.
TOTA
L AN
NU
AL C
OST
(MIL
LIO
N U
SD/Y
EAR
)
MAX RANGE (N.M.)
Source: Conklin & de Decker 2017
CORP. AIRLINERLONG RANGELARGEMEDIUMLIGHTVERY LIGHT
BBJ3ACJ321
ACJ320BBJ2
BBJACJ319
CIT. CJ3
DIAMOND 1A
CIT. BRAVO
H400XPBEECHJET 400
CIT. CJ2

MARKET SUMMARY -- JETSA
IRBU
S
44 | ASIAN SKY QUARTERLY — SECOND QUARTER 2018
0+0+0 0+0+0 4+0+0 0+0+0 0+0+0 2+0+0 0+0+0 0+0+0 2+0+0 0+0+0 0+0+0 0+0+0 0+0+00+14+0 0+14+0 0+14+0 0+10+0 0+12+0 0+14+0 0+14+0 0+14+0 0+14+0 0+14+0 0+14+0 0+18+0 0+20+00+0+0 0+0+0 0+0+0 0+0+0 0+0+0 0+0+0 0+0+0 0+0+0 1+0+0 0+0+0 0+0+0 1+0+0 0+0+00+4+0 0+4+0 0+4+0 0+4+0 0+4+0 0+4+0 0+4+0 0+4+0 0+5+0 0+5+0 0+5+0 0+5+0 0+5+0 4 4 4 4 44 44
5 5 5 5
1 1
5
7 7 7 77 7 77 75
6
109
112
MARKET SUMMARY PER MODEL — BUSINESS JETS
ACJ318
$29.4$29.3
$30.0
SPECS
FOR SALE
No. for Sale Avg Asking Price Avg Days on Market
SOLD21
11
Past 12 Months Past 3 Months
2018 Q2 2018 Q1
Max Range
Max Speed
Typ. Passengers
4,253 N.M. / 7,877 km (with ACTs)
Mach 0.82
19
5 (25.0%) 30.0M USD1,237
5 (25.0%) 29.3M USD1,072
INVENTORY LEVEL, PRICE TREND & TRANSACTIONS
ACJ319
$35.7
$39.3 $39.3
SPECS
FOR SALE
No. for Sale Avg Asking Price Avg Days on Market
SOLD40
Past 12 Months Past 3 Months
2018 Q2
Max Range
Max Speed
Typ. Passengers
6,000 N.M. /11,112 km
Mach 0.82
19
10 (14.1%)39.3M USD 322
• There are currently 10 Airbus ACJ319s available for sale, 5 on-market and 5 off-market. This represents 14% of the total 70 aircraft in service. The inventory level saw a significant increase in the Q2 2018.
• Current asking prices range from US$81M for a 2011 model with around 1500 hours to US$18M for a 1999 model with 8678 total hours. Average asking price of Q2 2018 risen to US$54.8M.
• In Q2 2018, the average days on market for sale decrease significantly to 322 days from 508 days in Q1 2017 with 3 aircraft newly entered market.
• There was no transaction completed in Q2 2018.
• There are currently 5 Airbus ACJ318s available for sale, 3 on-market and 2 off-market. The inventory level stayed at 5 in Q2 2018, which represents 25% of the total 20 aircraft in service.
• Current asking prices range from US$30M for a 2008 model with 2,627 hours to US$29.95M for a 2009 model with around 3,000 total hours. Average ask-ing price of Q2 2018 went up to US$30.0M.
• In Q2 2018, the average days on market for sale risen to 1,237 days.• There was one transaction completed in Q2 2018 and another under sales
pending.
2017 Q1
2017 Q1
7 (9.9%)39.3M USD 508
41
2018 Q2
Average Asking Price
Average Asking Price
For Sale vs. Sold
For Sale vs. Sold
2018 Q2 2018 Q1
Jun Sep Dec Mar Jun2017 2018
SoldFor Sale
Jun Sep Dec Mar Jun2017 2018
SoldFor Sale
Source: JETNET & ASG

BOEIN
GMARKET SUMMARY -- JETS
SECOND QUARTER 2018 — ASIAN SKY QUARTERLY | 45
40
0+8+0 0+8+0 0+8+0 0+12+0 0+16+0 0+16+0 0+16+0 0+16+0 0+16+0 0+20+0 0+16+0 0+16+0 0+16+00+0+0 0+0+0 0+0+0 0+0+0 0+0+0 0+0+0 0+0+0 0+0+0 0+0+0 0+0+0 4+0+0 0+0+0 0+0+0 2+0+0 1+0+0 0+0+0 1+0+0 0+0+0 0+0+0 2+0+0 0+0+0 0+0+0 3+0+0 1+0+0 0+0+0 0+0+0 0+ 16+ 0 0+ 18+ 0 0+ 17+ 0 0+ 18+ 0 0+ 18+ 0 0+ 18+ 0 0+ 18+ 0 0+ 17+ 0 0+ 14+ 0 0+ 16+ 0 0+ 16+ 0 0+ 16+ 0 0+ 16+ 0
BBJ
SPECS
FOR SALE
No. for Sale Avg Asking Price Avg Days on Market
SOLD
8 1
10 3
Past 12 Months Past 3 Months
2018 Q2 2018 Q1
Max Range
Max Speed
Typ. Passengers
6,235 N.M. / 11,547 km (with 9 ACTs)
Mach 0.82
19
16 (11.9%) 40.9M USD775
18 (13.4%) 37.3M USD712 16 16 1616
1417 18 18 18 17 18
1618
21 1132
$39.2
$37.3
$33.8
$35.9
$40.9
• There are currently 16 Boeing BBJs available for sale. This represents approximately 13% of the total 135 aircraft in service. The inventory level fluc-tuates in Q2 2018 with 1 new aircraft entered into the market and 4 aircraft was sold from the market.
• The BBJ pre-owned market is segmented into two main categories: 2008 YOM & up, typically asking US$49 million and above; and 2002 YOM & down, typically asking low USD 20s million and down. Current asking prices range from US$92.5M for a 2011 model with only ferry hours to US$19.5M for a 1999 model with 10,115 total hours. Currently, the average days on market for sale in Q2 2018 is going up to 775 days from 712 days in Q1 2018.
Average Asking Price
For Sale vs. Sold
2018 Q2 2018 Q1
Jun Sep Dec Mar Jun2017 2018
SoldFor Sale
Jun Sep Dec Mar Jun2017 2018
SoldFor Sale
BBJ2
• The BBJ2 market is a very limited one with only 23 aircraft in service world-
wide and it is very much concentrated in the Middle East, where more than 50% of the aircraft are in service. Asia only represents 22% of the market - a mere 5 aircraft.
• Currently there are only 4 BBJ2 for sale, 2 on-market and 2 off-market, decrease from 5 in Q1 2018. This represents approximately 18% of the total 22 aircraft in service.
• There was one transaction completed in April, which was also the only trans-action in the past 12 months.
SPECS
FOR SALE
No. for Sale Avg Asking Price Avg Days on Market
SOLD11
00
Past 12 Months Past 3 Months
2018 Q2
2018 Q2
2018 Q1
2018 Q1
Max Range
Max Speed
Typ. Passengers
5,620 N.M. / 10,408 km (with 7 ACTs)
Mach 0.82
19
4 (17.4%) 59.0M USD811
5 (22.7%) 69.0M USD713
$62.0
$69.0$69.6
2 23
4 4
12
4 44 45
44
$59.0
Average Asking Price
For Sale vs. Sold
Source: JETNET & ASG

BOM
BARD
IER
MARKET SUMMARY -- JETS
46 | ASIAN SKY QUARTERLY — SECOND QUARTER 2018
1+ 0+ 0 0+ 0+ 0 1+ 0+ 0 0+ 0+ 0 0+ 0+ 0 0+ 0+ 0 2+ 0+ 0 0+ 0+ 0 0+ 0+ 0 1+ 0+ 0 0+ 0+ 0 0+ 0+ 0 0+ 0+ 0 0+ 11+ 0 0+ 12+ 0 0+ 11+ 0 0+ 10+ 0 0+ 10+ 0 0+ 10+ 0 0+ 9+ 0 0+ 6+ 0 0+ 6+ 0 0+ 7+ 0 0+ 7+ 0 0+ 7+ 0 0+ 7+ 0 7+ 0+ 0 2+ 0+ 0 8+ 0+ 0 3+ 0+ 0 7+ 0+ 0 8+ 0+ 0 7+ 0+ 0 6+ 0+ 0 6+ 0+ 0 7+ 0+ 0 3+ 0+ 0 8+ 0+ 0 8+ 0+ 0 0+ 30+ 0 0+ 39+ 0 0+ 36+ 0 0+ 47+ 0 0+ 49+ 0 0+ 52+ 0 0+ 50+ 0 0+ 49+ 0 0+ 51+ 0 0+ 52+ 0 0+ 52+ 0 0+ 53+ 0 0+ 62+ 0 62
53 52 52 5251 5049 49 47
8 8 8
36
866 7 73 2
39
37 7
30
7 7 7 7 69 10 11 1112
10 10
6
21 1 1
CHALLENGER 604/605
$5.3 CL604
$10.1CL605
$11.7$12.7 $12.4
$5.0$5.3
CHALLENGER 850
$8.5
$7.2
$8.3
• There were 32 CL604 and 19 CL605 on the market for sale, representing 5.3% and 3.8% of the total fleet, respectively.
• The average asking price of CL604 in Q1 2018 was US$5.3M, a 6% increase from Q1 2018. The average asking price of CL605 was US$12.4M, increasing by 3% from Q1 2018.
• The average days on market of CL604 and CL605 were, respectively, 326 and 332 days.
• Q2 2018 recorded 9 CL604 transactions. In addition, 8 CL605 transactions were completed, same as Q1 2018.
• There were 71 CL850 operating worldwide and 11 were on market for sale, accounting for 15.5% of the total active fleet.
• The average asking price in Q2 2018 was US$8.3M.• The average days on market of CL850 in Q2 2018 reduced to 221 days, from
677 days in Q1 2018.• In Q2 2018, 2 CL850 transaction was recorded, which is the same as the
previous quarter.
SPECS
FOR SALE
No. for Sale Avg Asking Price Avg Days on Market
SOLDPast 12 Months Past 3 Months
Max Range
Max Speed
Typ. Passengers
2,811 N.M. / 5,206 km
Mach 0.80
14
SPECS
FOR SALE
No. for Sale Avg Asking Price Avg Days on Market
SOLD318
338
Past 12 Months Past 3 Months
Max Range
Max Speed
Typ. Passengers
CL605
4,000 N.M. / 7,408 km
Mach 0.82
9
CL604
4,027 N.M. / 7,458 km
Mach 0.82
9
11 (3.8%) 12.4M USD332
15 (5.2%) 11.7M USD269
419
4210
2018 Q2
2018 Q2
2018 Q1
2018 Q1
2018 Q2 2018 Q1
2018 Q2 2018 Q1
19 (5.3%) 5.3M USD326
32 (8.8%) 5.0M USD300
52
40
2018 Q2
2018 Q2
2018 Q1
2018 Q1
11 (15.5%) 8.3M USD221
10 (14.5%) 7.2M USD677
Average Asking Price
For Sale vs. Sold
Average Asking Price
For Sale vs. Sold
Jun Sep Dec Mar Jun2017 2018
SoldFor Sale
Jun Sep Dec Mar Jun2017 2018
SoldFor Sale
Source: JETNET & ASG

BOM
BARD
IERMARKET SUMMARY -- JETS
SECOND QUARTER 2018 — ASIAN SKY QUARTERLY | 47
0+ 0+ 0 0+ 0+ 0 1+ 0+ 0 1+ 0+ 0 0+ 0+ 0 0+ 0+ 0 0+ 0+ 0 1+ 0+ 0 1+ 0+ 0 4+ 0+ 0 1+ 0+ 0 3+ 0+ 0 1+ 0+ 0 0+ 14+ 0 0+ 15+ 0 0+ 16+ 0 0+ 15+ 0 0+ 15+ 0 0+ 10+ 0 0+ 10+ 0 0+ 10+ 0 0+ 9+ 0 0+ 9+ 0 0+ 10+ 0 0+ 10+ 0 0+ 14+ 01+ 0+ 0 2+ 0+ 0 4+ 0+ 0 2+ 0+ 0 1+ 0+ 0 2+ 0+ 0 1+ 0+ 0 1+ 0+ 0 3+ 0+ 0 1+ 0+ 0 0+ 0+ 0 3+ 0+ 0 1+ 0+ 0 0+ 14+ 0 0+ 17+ 0 0+ 13+ 0 0+ 14+ 0 0+ 15+ 0 0+ 18+ 0 0+ 16+ 0 0+ 16+ 0 0+ 17+ 0 0+ 18+ 0 0+ 19+ 0 0+ 20+ 0 0+ 18+ 0
GLOBAL 5000
$20.5
$17.8
$13.9
$15.4
1820 19
1518
14 13 141817 171616
13
13 4
1 1 12 2 21
• There were 14 Global 5000 for sale in Q2 2018, remaining constant as the previous quarter. With 221 operating worldwide, the for-sale fleet represented 6.3% of the total active fleet.
• The average asking price in Q2 2018 was US$15.4M, a 13% decrease from Q1 2018.
• The asking prices ranged from US$ 8.5M to US$ 25.9M, which was slightly lower than the last quarter’s.
• The average days on market was 269 days, down from 274 days in Q1 2018. • There were 7 Global 5000 transactions in Q2 2018.
SPECS
FOR SALE
No. for Sale Avg Asking Price Avg Days on Market
SOLDPast 12 Months Past 3 Months
Max Range
Max Speed
Typ. Passengers
5,200 N.M. / 9,630 km
Mach 0.89
13
217
165
2018 Q2
2018 Q2
2018 Q1
2018 Q1
14 (6.3%) 15.4M USD269
14 (6.4%) 17.8M USD274
$40.2SPECS
FOR SALE
No. for Sale Avg Asking Price Avg Days on Market
SOLDPast 12 Months Past 3 Months
Max Range
Max Speed
Typ. Passengers
GLOBAL 6000
6,000 N.M. / 11,112 km
Mach 0.88
13
$41.8
$28.5
$36.3 $36.3
14 1415 15 16 15
10 10 9 9 10 1010
13
1 11 114
• There were 14 Global 6000 on the market and 264 in-operation aircraft. It represented 5.3% of the total active fleet.
• The average asking price of Global 6000 in Q2 2018 was US$36.3M, which increased by 5% from US$34.7M in Q1 2018.
• The asking prices ranged from US$28.5M to US$48M.• The average days on market for sale of Global 6000 was 280 days, up from
208 days in Q1 2018. • In Q2 2018, there was 1 transaction, same as that of Q1 2018.
121
141
2018 Q21
2018 Q2
2018 Q1
2018 Q1
14 (5.3%) 36.3M USD280
15 (5.8%) 36.3M USD208
Average Asking Price
Average Asking Price
For Sale vs. Sold
For Sale vs. Sold
Jun Sep Dec Mar Jun2017 2018
SoldFor Sale
Jun Sep Dec Mar Jun2017 2018
SoldFor Sale
Source: JETNET & ASG

DASS
AULT
MARKET SUMMARY -- JETS
48 | ASIAN SKY QUARTERLY —SECOND QUARTER 2018
0+ 0+ 0 1+ 0+ 0 1+ 0+ 0 2+ 0+ 0 1+ 0+ 0 1+ 0+ 0 1+ 0+ 0 2+ 0+ 0 3+ 0+ 0 4+ 0+ 0 2+ 0+ 0 1+ 0+ 0 2+ 0+ 0 0+ 7+ 0 0+ 9+ 0 0+ 9+ 0 0+ 10+ 0 0+ 11+ 0 0+ 10+ 0 0+ 8+ 0 0+ 8+ 0 0+ 10+ 0 0+ 11+ 0 0+ 13+ 0 0+ 14+ 0 0+ 16+ 0
FALCON 900DX/EX/EX EASy/LX
FALCON 2000LX/LXS/S
1614 13
11 1110 10 9 97
1088
1 1 1231 1 122 2
4
FALCON 2000LX
FALCON 2000S
$27.9
$16.5$19.0
MAKEOFFER
MAKE OFFER$25.0
$16.0
$27.9
FALCON 2000LXS
$13.2$12.4
$16.5 $16.7
$12.8
4+ 0+ 0 6+ 0+ 0 3+ 0+ 0 0+ 0+ 0 1+ 0+ 0 2+ 0+ 0 2+ 0+ 0 4+ 0+ 0 1+ 0+ 0 4+ 0+ 0 2+ 0+ 0 0+ 0+ 0 2+ 0+ 0 0+ 23+ 0 0+ 24+ 0 0+ 26+ 0 0+ 26+ 0 0+ 26+ 0 0+ 25+ 0 0+ 24+ 0 0+ 25+ 0 0+ 23+ 0 0+ 26+ 0 0+ 28+ 0 0+ 29+ 0 0+ 30+ 030 29 28 26 26 262623 2324 2425 25
2 4 41 12 2
632 4
F900DX
$8.4F900EX $6.4 $6.7
$15.7
$14.7 $18.3$17.4
F900EX EASy
$18.5
$20.8F900LX
$21.8$22.7
$11.5
$13.0 $12.9
$11.5
• There are 23 Falcon 900 series aircraft available on market for sale, including 2 Falcon 900DXs, 19 Falcon 900EXs/EASys and 2 Falcon 900LXs. The inventory level goes down, comparing to that in Q1 2018.
• The average asking prices for Falcon 900EX and 900EX EASy are US$ 6.7M and US$ 15.7M; the average asking prices for Falcon 900LX is US$ 18.5M, decreasing from US$ 20.8M in Q1 2018.
• Currently, the average days on market for Falcon 900 series is 338 days, growing from 266 days in Q1 2018, and this is mainly resulted from the transaction that many long-listed Falcon 900EXs/EASys aircraft are either off market or finally sold.
• In Q2 2018, there are 10 Falcon 900 series aircraft transactions, a significant increase compare to Q1 2018.
SPECS
FOR SALE
No. for Sale Avg Asking Price Avg Days on Market
SOLD1 | 10 | 1
17 | 18 1 | 3
Past 12 Months Past 3 Months
Q2 | Q1
Q2 | Q1
Q2 | Q1
Q2 | Q1
Q2 | Q1
Q2 | Q1
Q2 | Q1
Q2 | Q1
Q2 | Q1
Q2 | Q1
Q2 | Q1
Q2 | Q1
Q2 | Q1
Q2 | Q1
Reporting quarter vs. Previous quarter
Reporting quarter vs. Previous quarter
Reporting quarter vs. Previous quarter
Reporting quarter vs. Previous quarter
Max Range
Max Speed
Typ. Passengers
F900DX
4,100 N.M. /
Mach 0.83
12
16 | 12 7 | 1
2 | 11 | 1
6 | 42 | 0
0 | 00 | 0
6 | 62 | 1
F900EX
4,500 N.M. /
Mach 0.83
12
F900EX EASy
4,500 N.M. /
Mach 0.83
12
F900LX
4,750 N.M. /
Mach 0.83
12
2 | 112.9M USD | 11.5M USD 51 | 877
3 | 312.8M USD | 13.2M USD 155 | 127
8 | 22 6.7M USD |6.4M USD324 | 272
2 | 1 25.0M USD |27.9M USD143 | 51
11 | 10 15.7M USD |17.4M USD204 | 191
2 | 5 16.0M USD |16.5M USD153 | 79
2 | 4 18.5M USD | 20.8M USD218 | 432
7,593 km 8,334 km 8,334 km 8,800 km
2000S
3,350 N.M. /
Mach 0.83
10
SPECS
FOR SALE
No. for sale Avg Asking Price
Avg Days on Market
SOLDPast 12 Months Past 3 Months
Max Range
Max Speed
Typ. Passengers
2000LX
4,000 N.M. /
Mach 0.83
10
2000LXS
4,000 N.M. /
Mach 0.83
10
7,408 km 7,408 km 6,208 km
• There are 7 Falcon 2000 series aircraft on market for sale, including 3 Falcon 2000LX, 2 Falcon 2000LXS and 2 Falcon 2000S. The inventory level goes down from 10 in Q1 2018.
• The average asking prices for Falcon 2000LX is US$ 12.8M; the average asking prices for Falcon 2000LXS is US$ 25M; the average asking prices for Falcon 2000S is US$ 16M.
• The average days on market for Falcon 2000 series aircraft is 151 days in Q2 2018, increasing from 102 days in Q1 2018.
• wq32In Q2 2018, there are 4 transactions of Falcon 2000 series aircraft, remaining stable with that in the last quarter.
Average Asking Price
Average Asking Price
For Sale vs. Sold
For Sale vs. Sold
Jun Sep Dec Mar Jun2017 2018
SoldFor Sale
Jun Sep Dec Mar Jun2017 2018
SoldFor Sale
Source: JETNET & ASG

DASSAU
LTMARKET SUMMARY -- JETS
SECOND QUARTER 2018 — ASIAN SKY QUARTERLY | 49
0+ 0+ 0 1+ 0+ 0 3+ 0+ 0 2+ 0+ 0 2+ 0+ 0 4+ 0+ 0 1+ 0+ 0 4+ 0+ 0 2+ 0+ 0 0+ 0+ 0 2+ 0+ 0 2+ 0+ 0 3+ 0+ 0 0+ 23+ 0 0+ 21+ 0 0+ 19+ 0 0+ 22+ 0 0+ 25+ 0 0+ 24+ 0 0+ 25+ 0 0+ 25+ 0 0+ 24+ 0 0+ 24+ 0 0+ 26+ 0 0+ 28+ 0 0+ 31+ 03128
2624 24 2425 25
2219
2123
25
3 324 4
2 2 21 12
$26.7
$24.9
$25.8
FALCON 7X
$26.9
• There are 23 Falcon 7X aircraft on market for sale. The inventory level has been fluctuating since 2018. Most Falcon 7Xs available for sale were manu-factured in 2013 and 2012, which account for 41% and 23%, respectively.
• The average asking price for 7X in Q2 2018 is around US$ 26.2M, almost the same with that in Q1 2018.
• Currently, the average days on market for sale in Q2 2018 is around 306 days, a slightly higher than 298 days in the last quarter, and that’s partially resulted from the transactions of long-listed aircraft and some new-to-market aircraft decreasing the number of average days on market.
• In Q2 2018, there are 6 Falcon 7X transactions, indicating a continuously active market trend from Q1 2018.
5,950 N.M. / 11,018 km
Mach 0.90
12
SPECS
FOR SALE
No. for Sale Avg Asking Price Avg Days on Market
SOLDPast 12 Months Past 3 Months
Max Range
Max Speed
Typ. Passengers
234
228
2018 Q2
2018 Q2
2018 Q1
2018 Q1
23 (8.4%) 26.9M USD306
22 (8.0%) 25.8M USD257
2013 FALCON 7X SN199397 HOURS SINCE NEW173 CYCLES SINCE NEW
AIRCRAFT HIGHLIGHT• One Owner Since New
• Low Hours
• No Damage Record & Charter History
• EASA Compliance
• Triple FMS, CVR, QAR, FDR, RAAS & Weather Radar
• Inmarsat Aero H+ Satcom
• Swift Broadband
• Stunning BMW Interior
AVIONICS • VHF communication dual Honeywell• Dual Honeywell HF Radio• Emergency Locator Transmitter with Nav Interface• VOR/ ILS/ MKR and GPS modules• Triple FMS module• Lightning sensor• Dual ATC transponder Mode S• RAAS• Cockpit Voice Recorder• Quick Access Recorder• Additional Wi-Fi handset Aircell• Electronic Jeppesen Charts• Third VHF Radio• Honeywell Secal• Inmarsat Aero H+ (Satellite Communication System)• ADF [email protected] +852 2235 9222
OUR INVENTORY
INTERIOR • 14 Passenger Configuration• Forward Double Club• Dining Group• Credenza (Multi-Purpose Storage Cabinets)• Two (2), Three Place Divans• One Tracking Magazine Rack• The aircraft interior shall meet regulation.
ASKING PRICE:
CALL FOR PRICING
Average Asking Price
For Sale vs. Sold
Jun Sep Dec Mar Jun2017 2018
SoldFor Sale
Source: JETNET & ASG

DASS
AULT
MARKET SUMMARY -- JETS
50 | ASIAN SKY QUARTERLY —SECOND QUARTER 2018
Source: JETNET & ASG
2010 FALCON 7XOFF MARKET FOR SALE
AIRCRAFT HIGHLIGHT• Engine Enrolled on Honeywell ESP Gold
• APU Enrolled on Honeywell MSP Gold
• 12 Passengers Configuration, Fwd / Aft Lavatory
• Part 135, CPDLC, FANS 1A Compliance
• ADSB-Out
• EASy II Avionic Suite
• HUD & EVS
• Honeywell LSS-860 Lightning Sensor System
AVIONICS • Standard FLY-BY-WIRE (FBW) 2.3.1• HUD, CVR ,EVS & EVAS• Honeywell LSS-860 Lightning Sensor System• PWC Monitoring Data Collection Transmission Unit• Three (3) Honeywell VHF COMM• Two (2) Honeywell VHF NAV• Two (2) Honeywell DF-855 ADF• Two (2) Honeywell DM-855 DME• Two (2) Honeywell KHF-1050 HF COMM• Two (2) Honeywell GPS-90X GPS• Two (2) Honeywell XS-857A Transponder• Honeywell WU-880 Weather Radar• Two (2) Honeywell KRA-405B Radio Altimeter• Single (1) ACSS TCAS 3000• Single (1) Honeywell RESCU 406AF ELT• Single (1) Honeywell MK V EGPW [email protected] +852 2235 9222
OUR INVENTORY
INTERIOR • 12 Passenger Configuration• 17 inches Fwd LCD Monitor• 17 inches Aft Bulkhead LCD Monitor• Galley Pocket / Sliding Door• Aft Cabin Tracking CurtainTwo (2)• 30 inches Fwd RH Lavatory• LH 43 inches & 71 inches RH Galley / Bar Area• Four (4) 20 inches Individual Seats w/ Electrical
Lumbar• Retractable Dining / Conference Table
ASKING PRICE:
CALL FOR PRICING
File Photo

EMBRA
ERMARKET SUMMARY -- JETS
SECOND QUARTER 2018 — ASIAN SKY QUARTERLY | 51
LINEAGE 1000/E• There were 4 Lineage 1000 on market for sale, out of the 20 in-service air-
craft. It represented a 20.0% inventory.• The average asking price of Lineage 1000 in Q2 2018 was US$ 30.7M, which
was higher than Q1 2018’s. • The asking price ranged from US$ 24.0M to US$ 38.0M. • The average days on market for sale of Lineage 1000 was 794 days, compared
to 808 days in Q1 2018.• In Q2 2018, there was no transaction, marking a relatively quiet market com-
pared to the one transaction in the previous quarter.
FOR SALE
SPECS
No. for Sale Avg Asking Price Avg Days on Market
SOLDPast 12 Months Past 3 Months
Max Range
Max Speed
Typ. Passengers
Lineage 1000
4,400 N.M. / 8,149 km
Mach 0.82
19
Lineage 1000E
4,600 N.M. / 8,520 km
Mach 0.82
19
10
11
2018 Q2
2018 Q2
2018 Q1
2018 Q1
4 (20.0%) 30.7M USD794
7 (24.1%) 27.4M USD808
Source: JETNET & ASG
0+ 4+ 0 0+ 4+ 0 0+ 7+ 0 0+ 7+ 0 0+ 8+ 0 0+ 7+ 0 0+ 7+ 0 0+ 7+ 0 0+ 7+ 0 0+ 7+ 0 0+ 7+ 0 0+ 7+ 0 0+ 7+ 0 0+ 0+ 0 0+ 0+ 0 0+ 0+ 0 0+ 0+ 0 0+ 0+ 0 1+ 0+ 0 0+ 0+ 0 0+ 0+ 0 0+ 0+ 0 0+ 0+ 0 0+ 0+ 0 0+ 0+ 0 0+ 0+ 0 77 7 7 7 7 74
1
7 74
7
$28.0$27.4
$25.1
$30.7
Average Asking Price
For Sale vs. Sold
8
Jun Sep Dec Mar Jun2017 2018
SoldFor Sale
LEGACY 600/650
• There were 3 Legacy 650 and 14 Legacy 600 on market for sale. With respectively 96 and 174 aircraft operating worldwide, the for-sale fleet represented 3.1% and 8.0% respectively of the total active fleet.
• The average asking prices of Legacy 650 in Q2 2018 was US$12.3M, decreasing by 3% from US$ 12M in Q1 2018. The average asking price of Legacy 600 in Q2 2018 was US$ 7.3M, a 7% increase from Q1 2018.
• The asking price of Legacy 650 ranged from US$9.5M to US$15.0M; while the asking price of Legacy 600 ranged from US$ 5.2M to US$ 9.5M.
• The average days on market for sale of Legacy 650 were 380 days, increasing by 31% from 551 in Q1 2018. Legacy 600’s average days on market for sale was 173 days; falling by 4% from 312 in Q1 2018
• In Q1 2018, there were five Legacy 650 transactions, up from two transactions in Q1 2018; there were five transactions of Legacy 600, rising from one transactions in Q1 2018.
SPECS
FOR SALE
No. for Sale Avg Asking Price Avg Days on Market
SOLDPast 12 Months Past 3 Months
Max Range
Max Speed
Typ. Passengers
Legacy 600
3,400 N.M. / 6,297 km
Mach 0.80
13
Legacy 650
3,640 N.M. / 7,112 km
Mach 0.80
13
55
72
3 (3.1%) 12.3M USD173
7 (7.3%) 11.5M USD312
175
151
2018 Q2
2018 Q2
2018 Q1
2018 Q1
2018 Q2 2018 Q1
2018 Q2 2018 Q1
14 (8.0%) 7.3M USD380
13 (7.5%) 6.8M USD551 0+ 0+ 0 6+ 0+ 0 4+ 0+ 0 1+ 0+ 0 3+ 0+ 0 1+ 0+ 0 5+ 0+ 0 3+ 0+ 0 1+ 0+ 0 1+ 0+ 0 1+ 0+ 0 1+ 0+ 0 3+ 0+ 0 0+ 17+ 0 0+ 15+ 0 0+ 15+ 0 0+ 20+ 0 0+ 24+ 0 0+ 22+ 0 0+ 22+ 0 0+ 23+ 0 0+ 24+ 0 0+ 30+ 0 0+ 29+ 0 0+ 33+ 0 0+ 36+ 0 36
3329 30
24 2422 22 2020 20 20
23
3 31553 1 1
4 61 1
$11.5
$8.1
$13.4Legacy 650
Legacy 600
$12.3
$6.8 $7.3
Average Asking Price
For Sale vs. Sold
Jun Sep Dec Mar Jun2017 2018
SoldFor Sale

GU
LFST
REA
MMARKET SUMMARY -- JETS
52 | ASIAN SKY QUARTERLY — SECOND QUARTER 2018
G200 & G280
G450
• There were 29 G200 on market in Q2 2018, accounting for 11.9% of the total fleet. The inventory level is 9% lower than 2018 Q1.
• The average asking price for a G200 in Q2 2018 was US$4.4M, no change compared to Q1 2018.
• The average days on market of the G200 in Q2 2018 was 338 days. • There were two G280s on market, accounting for 1.9% of the total fleet. The
inventory level has remained the same compared to Q1 2018.
G200
3,050 N.M. / 5,651km
Mach 0.81
8
G280
3,600 N.M. / 6,667 km
Mach 0.84
8
SPECS
FOR SALE
No. for Sale Avg Asking Price Avg Days on Market
SOLDPast 12 Months Past 3 Months
Max Range
Max Speed
Typ. Passengers
52
42
1 (0.7%) 16.8M USD216
2 (1.9%) 14.0M USD301
4011
4211
2018 Q2
2018 Q2
2018 Q1
2018 Q1
2018 Q2 2018 Q1
2018 Q2 2018 Q1
29 (11.9%) 4.3M USD338
32 (13.0%) 4.6M USD253
• There were 26 G450s on market for sale in 2018 Q2, representing 7.3% of the total fleet. The inventory level has increased since Q1 2018.
• The average asking price of a G450 in Q2 2018 was US$14.2M, 3.4% lower than that of Q1 2018.
• The average days on market in Q2 2018 was 328 days.• In Q2 2018 there were nine G450s sold, with transaction levels slightly higher
than that of Q1, showing steady growth.
SPECS
FOR SALE
No. for Sale Avg Asking Price Avg Days on Market
SOLDPast 12 Months Past 3 Months
Max Range
Max Speed
Typ. Passengers
4,350 N.M. / 8,056 km
Mach 0.85
13
359
368
2018 Q2 2018 Q1
2018 Q2 2018 Q1
26 (7.3%) 14.0M USD328
21 (5.9%) 15.2M USD355
6+ 0+ 0 3+ 0+ 0 4+ 0+ 0 3+ 0+ 0 1+ 0+ 0 6+ 0+ 0 1+ 0+ 0 2+ 0+ 0 4+ 0+ 0 3+ 0+ 0 5+ 0+ 0 4+ 0+ 0 6+ 0+ 0 0+ 30+ 0 0+ 32+ 0 0+ 32+ 0 0+ 34+ 0 0+ 40+ 0 0+ 33+ 0 0+ 34+ 0 0+ 38+ 0 0+ 30+ 0 0+ 29+ 0 0+ 34+ 0 0+ 33+ 0 0+ 37+ 0 $16.8
$5.0 G200
$14.0G280$15.1
$4.6 $4.3
3733 32 323334 34
29 30 3034
3840
64
24 4
1 1
6 653 3 3
Average Asking Price
For Sale vs. Sold
Jun Sep Dec Mar Jun2017 2018
SoldFor Sale
2+ 0+ 0 3+ 0+ 0 4+ 0+ 0 2+ 0+ 0 2+ 0+ 0 2+ 0+ 0 3+ 0+ 0 1+ 0+ 0 2+ 0+ 0 6+ 0+ 0 2+ 0+ 0 4+ 0+ 0 1+ 0+ 0 0+ 26+ 0 0+ 21+ 0 0+ 21+ 0 0+ 21+ 0 0+ 21+ 0 0+ 28+ 0 0+ 24+ 0 0+ 27+ 0 0+ 29+ 0 0+ 32+ 0 0+ 34+ 0 0+ 36+ 0 0+ 33+ 0 21 2121 21
3336
3432
29
2427 27
26
14 4
12 2 22 23 326
$14.9$15.2
$13.8
$14.0
Average Asking Price
For Sale vs. Sold
Jun Sep Dec Mar Jun2017 2018
SoldFor Sale
Source: JETNET & ASG

GU
LFSTREAM
MARKET SUMMARY -- JETS
SECOND QUARTER 2018 — ASIAN SKY QUARTERLY | 53
2+ 0+ 0 4+ 0+ 0 3+ 0+ 0 4+ 0+ 0 2+ 0+ 0 2+ 0+ 0 4+ 0+ 0 5+ 0+ 0 5+ 0+ 0 5+ 0+ 0 3+ 0+ 0 2+ 0+ 0 7+ 0+ 0 0+ 29+ 0 0+ 24+ 0 0+ 21+ 0 0+ 19+ 0 0+ 17+ 0 0+ 22+ 0 0+ 24+ 0 0+ 24+ 0 0+ 28+ 0 0+ 31+ 0 0+ 34+ 0 0+ 35+ 0 0+ 35+ 0 G650 & G650 ER
G550• There were 29 G550s on market in Q2 2018. The inventory level has been
increasing since the beginning of the year and has increased by 53% since Q1 2018.
• There has been an increase of 1% in the total number of aircraft in operation, from 545 in Q1 2018 to 552 in Q2 2018.
• The average asking price for a G550 in Q2 2018 was around US$ 25.0M, an increase of 7%, from US$ 23.3M since Q1 2018.
• The average days on market for a G550 has decreased to 178 days in Q2 2018 from 257 days in Q1 2018, a decrease of around 31%.
• In Q2 2018, there were nine G550 transactions, reflecting a slower pre-owned market than the previous quarter. Transaction activity decreased by 25% compared to Q1 2018.
SPECS
FOR SALE
No. for Sale Avg Asking Price Avg Days on Market
SOLDPast 12 Months Past 3 Months
Max Range
Max Speed
Typ. Passengers
6,750 N.M. / 12,501 km
Mach 0.87
18
419
438
2018 Q2 2018 Q1
2018 Q2 2018 Q1
29 (5.3%) 25.0M USD178
19 (3.5%) 23.3M USD257
SPECS
FOR SALE
No. for Sale Avg Asking Price Avg Days on Market
SOLDPast 12 Months Past 3 Months
Max Range
Max Speed
Typ. Passengers
G650
7,000 N.M. / 12,964 km
Mach 0.90
18
G650ER
7,500 N.M. / 13,890 km
Mach 0.90
18
• There were 16 G650/650ER aircraft available on market in Q2 2018, an increase of 48% since Q1 2018.
• The average asking prices for G650/650ER models were US$56.2 and US$ 62.4 respectively.
• The average days on market for the G650/650ER series in Q2 2018 was 354 and 97 days, respectively. This marks an increase of 12% for the G650 series and a decrease of 74% for the G650ER series since Q1 2018.
• In Q2 2018, there were four G650 series aircraft transactions, which remains the same compare to Q1 2018.
• In Q2 2018, no G650ER aircraft were sold. This has been a decrease compare to Q1 2018, which was 3 transactions.
30
33
8 (8.2%) 62.4M USD97
5 (5.8%) 62.8M USD369
154
134
2018 Q2
2018 Q2
2018 Q1
2018 Q1
2018 Q2 2018 Q1
2018 Q2 2018 Q1
8 (4.0%) 56.2M USD354
7 (3.5%) 56.9M USD315
$23.5
$22.8
$23.3
$25.0
35 35 3431
28 29
24 2422 21
1719
24
7
24
2 255 4 43 32
5
Average Asking Price
For Sale vs. Sold
Jun Sep Dec Mar Jun2017 2018
SoldFor Sale
2+ 0+ 0 2+ 0+ 0 0+ 0+ 0 3+ 0+ 0 2+ 0+ 0 2+ 0+ 0 1+ 0+ 0 4+ 0+ 0 0+ 0+ 0 0+ 0+ 0 1+ 0+ 0 1+ 0+ 0 0+ 0+ 0 0+ 16+ 0 0+ 20+ 0 0+ 16+ 0 0+ 12+ 0 0+ 12+ 0 0+ 15+ 0 0+ 17+ 0 0+ 18+ 0 0+ 16+ 0 0+ 16+ 0 0+ 18+ 0 0+ 19+ 0 0+ 17+ 0 12 1215
1719 20
1816 16 16 161718
1 2 2 3 2 24
1 1
$55.4
$61.8$58.3
$56.9
$62.8
$58.5
$65.8
$56.2
$62.4
Average Asking Price
For Sale vs. Sold
Jun Sep Dec Mar Jun2017 2018
SoldFor Sale
Source: JETNET & ASG

54 | ASIAN SKY QUARTERLY — SECOND QUARTER 2018
* The estimated total yearly cost is based on aircraft ownership cost for 10 years including financing, plus yearly operating cost and regional adjustments.
MAX RANGE (N.M.)
CIVIL HELICOPTERSAircraft Acquisition Price vs Maximum Range
750
700
650
600
550
500
450
350
250
400
300
200
0.50
1.00
2.00
4.00
8.00
0.25
AIR
CR
AFT
ACQ
UIS
TIO
N P
RIC
E (M
ILLI
ON
USD
)
HEAVY(SUPER) MEDIUMLIGHT TWINSINGLE TURBINEPISTON
R22 BETA II
EN480BS-333
MD 500E
MD 530FMD 520N
MD 600N
AW119KX
H225
H175
H155
S-76C++
AC312*
EC145AW 109 GN
H145
BELL 412EPI
AW139 S-76D
H125
H135(P3)H135(T3)
BELL 430
BELL 407GXPBELL 206L4
BELL 429
AW189
AS332 L1E
AC313*
S-92
MD 902
AW169
AW109 POWER
H120
R44 RAVEN II
BELL 407
H130
R66
AC311*
AIRCRAFT POSITIONING
Source: JETNET & ASG

MARKET SUMMARY -- HELICOPTERS
SECOND QUARTER 2018 — ASIAN SKY QUARTERLY | 55
EC135T2 & P2
EC135T2
332 N.M. / 614 km
127 Knots
6
EC135P2
332 N.M. / 614 km
127 Knots
6
SPECS
FOR SALE
No. for Sale Avg Asking Price Avg Days on Market
SOLDPast 12 Months Past 3 Months
Max Range
Max Speed
Typ. Passengers
• For the EC135 T2 model, the overall inventory level of the market remained at six in Q2 2018, accounting for 4.2% of the overall fleet in operation.
• For the EC135 P2 model, inventory level of the market increased from 11 in Q1 2018 to 12 in Q2 2018, accounting for 7.8% of the overall fleet in operation.
• Average asking price decreased from US$2.6M in Q1 2018 to $US2.4M for T2, awhile the SP model’s asking price decreased from US$2.6M in Q1 2018 to US$2.5M in Q2 2018.
• There was one EC135 T2 transaction and no EC135 P2 transactions in Q2 2018.
00
00
12 (7.2%) 2.5M USD907
11 (7.2%) 2.6M USD899
21
11
2018 Q2
2018 Q2
2018 Q1
2018 Q1
2018 Q2 2018 Q1
2018 Q2 2018 Q1
6 (4.2%) 2.4M USD610
6 (4.2%) 2.4M USD533
AIRBU
S
MARKET SUMMARY PER MODEL — CIVIL HELICOPTERSINVENTORY LEVEL, PRICE TREND & TRANSACTIONS
0+ 0+ 0 0+ 0+ 0 1+ 0+ 0 1+ 0+ 0 0+ 0+ 0 0+ 0+ 0 0+ 0+ 0 0+ 0+ 0 0+ 0+ 0 0+ 0+ 0 0+ 0+ 0 0+ 0+ 0 0+ 0+ 0 0+ 18+ 0 0+ 18+ 0 0+ 18+ 0 0+ 17+ 0 0+ 15+ 0 0+ 15+ 0 0+ 14+ 0 0+ 14+ 0 0+ 14+ 0 0+ 11+ 0 0+ 11+ 0 0+ 12+ 0 0+ 11+ 0 $1.8
$2.7EC135P2
EC135T2
$2.6 $2.5
$2.4$2.4
$3.1
1 1
Jun Sep Dec Mar Jun2017 2018
SoldFor Sale
11 12 11 1114 1514
17 18 18 1814 15
Average Asking Price
For Sale vs. Sold
AS332L1 & H225
SPECS
FOR SALE
No. for Sale Avg Asking Price Avg Days on Market
SOLDPast 12 Months Past 3 Months
Max Range
Max Speed
Typ. Passengers
H225
452 N.M. / 837 km
142 Knots
19
AS332L1
452 N.M. / 837 km
142 Knots
19
10
11
15 (8.9%) 19.0M USD520
15 (9.0%) 19.0M USD436
00
00
2018 Q2
2018 Q2
2018 Q1
2018 Q1
2018 Q2 2018 Q1
2018 Q2 2018 Q1
3 (4.5%) 4.0M USD1103
3 (4.5%) 4.0M USD1020
AS332L1• The overall inventory level of the market had remained at three, accounting
for 4.5% of the overall fleet in operation. Average days on market increased from 1020 in Q1 2018 to 1103 in Q2 2018. Average asking price remained at $US4.0 in Q2 2018. There were no transactions in Q1 2018.
H225• The overall inventory level of the market remained at 15, accounting for 8.9%
of the overall fleet in operation. Average days on market increased from 436 in Q1 2018 to 520 in Q2 2018. Average asking price remained at $US19.0M There were no transactions in Q2 2018.
0+ 0+ 0 0+ 0+ 0 0+ 0+ 0 1+ 0+ 0 0+ 0+ 0 0+ 0+ 0 0+ 0+ 0 0+ 0+ 0 0+ 0+ 0 0+ 0+ 0 0+ 0+ 0 0+ 0+ 0 0+ 0+ 0 0+ 18+ 0 0+ 18+ 0 0+ 18+ 0 0+ 18+ 0 0+ 19+ 0 0+ 18+ 0 0+ 18+ 0 0+ 18+ 0 0+ 18+ 0 0+ 16+ 0 0+ 16+ 0 0+ 14+ 0 0+ 15+ 0 $8.5$4.0 $4.0
AS332L1
H225
$22.4$19.0 $19.0
15 1416 16
18 1818 1818 1819
1
18 18
Average Asking Price
For Sale vs. Sold
Jun Sep Dec Mar Jun2017 2018
SoldFor Sale
Source: JETNET & ASG

MARKET SUMMARY -- HELICOPTERS
56 | ASIAN SKY QUARTERLY — SECOND QUARTER 2018
AIR
BUS
EC145
EC155B & H155
SPECS
FOR SALE
No. for Sale Avg Asking Price Avg Days on Market
SOLDPast 12 Months Past 3 Months
Max Range
Max Speed
Typ. Passengers
461 N.M. / 855 km
131 Knots
9
• The overall inventory level of the market remained at eight in Q2 2018, accounting for 1.0% of the overall fleet in operation.
• Average days on market decreased from 430 in Q1 2018 to 249 in Q2 2018. • Average asking price decreased slightly US$3.8M in Q1 2018 to US$3.7M in
Q2 2018.• There were four transactions in Q1 2018.
84
61
2018 Q2
2018 Q2
2018 Q1
2018 Q1
8 (1.0%) 3.7M USD249
8 (1.0%) 3.8M USD430
EC155B• The overall inventory level of the market remained at 8 in Q2 2018, account-
ing for 28.6% of the overall fleet in operation. Average days on market increased from 992 in Q1 2018 to 1062 in Q2 2018. Average asking price remained at US$2.0M in Q2 of 2018. There was one transaction in Q2 2018.
H155• The overall inventory level of the market increased from 12 in Q1 2018 to 13
in Q2 2018, accounting for 8.9% of the overall fleet in operation. Average days on market increased from 730 in Q1 2018 to 756 in Q2 2018. Average asking price decreased from US$5.6M in Q1 2018 to $US5.2M in Q2 2018. There were three transactions in Q1 2018.
SPECS
FOR SALE
No. for Sale Avg Asking Price Avg Days on Market
SOLDPast 12 Months Past 3 Months
Max Range
Max Speed
Typ. Passengers
EC155B
516 N.M. / 955 km
135 Knots
13
H155
516 N.M. / 955 km
150 Knots
13
43
10
12 (8.4%) 5.6M USD730
11
00
2018 Q2
2018 Q2
2018 Q1
2018 Q1
2018 Q2 2018 Q1
2018 Q2 2018 Q1
8 (28.6%) 2.0M USD1062
8 (28.6%) 2.0M USD992
13 (8.9%) 5.2M USD756
Average Asking Price
For Sale vs. Sold 2+ 0+ 0 0+ 0+ 0 2+ 0+ 0 1+ 0+ 0 0+ 0+ 0 0+ 0+ 0 0+ 0+ 0 0+ 0+ 0 0+ 0+ 0 0+ 0+ 0 2+ 0+ 0 1+ 0+ 0 0+ 0+ 0 0+ 8+ 0 0+ 10+ 0 0+ 10+ 0 0+ 8+ 0 0+ 9+ 0 0+ 8+ 0 0+ 9+ 0 0+ 9+ 0 0+ 9+ 0 0+ 9+ 0 0+ 9+ 0 0+ 8+ 0 0+ 9+ 0 $4.8
$5.4
$3.8$3.7
9 8 8 8 89 9 10 109 9 99
1 12 2 2
Jun Sep Dec Mar Jun2017 2018
SoldFor Sale
2+ 0+ 0 1+ 0+ 0 1+ 0+ 0 0+ 0+ 0 0+ 0+ 0 0+ 0+ 0 0+ 0+ 0 1+ 0+ 0 0+ 0+ 0 0+ 0+ 0 0+ 0+ 0 0+ 0+ 0 0+ 0+ 0 0+ 21+ 0 0+ 22+ 0 0+ 21+ 0 0+ 20+ 0 0+ 22+ 0 0+ 23+ 0 0+ 24+ 0 0+ 19+ 0 0+ 20+ 0 0+ 22+ 0 0+ 22+ 0 0+ 21+ 0 0+ 22+ 022 21 21 2122 222322 2220 20
24
19
1 1 1 2
$4.6H155
EC155B
$5.6
$2.0$3.3
$5.2
$2.0
Average Asking Price
For Sale vs. Sold
Jun Sep Dec Mar Jun2017 2018
SoldFor Sale
Source: JETNET & ASG

BELLMARKET SUMMARY -- HELICOPTERS
SECOND QUARTER 2018 — ASIAN SKY QUARTERLY | 57
BELL 4292008 EC155B1 SN6825FEATURED AIRCRAFT
BELL 412EP/412HP
Bell 412EP
356 N.M. / 659 km
140 Knots
9
Bell 412HP
349 N.M. / 646 km
133 Knots
14
SPECS
FOR SALE
No. for Sale Avg Asking Price Avg Days on Market
SOLDPast 12 Months Past 3 Months
Max Range
Max Speed
Typ. Passengers
Bell 412EP• Inventory level increased from 29 in Q1 2018 to 31 in Q2 2018, accounting
for 5.6% of the overall fleet in operation. Average days on market decreased from 547 in Q1 2018 to 509 in Q2 2018. Average asking price decreased from US$4.9M in Q1 2018 to USD$4.0M in Q2 2018. There were six transactions during Q2 2018.
Bell 412HP• The overall inventory level of the market increased from three in Q1 2018 to
four in Q2 2018, accounting for 6.5% of the overall fleet in operation. Average days on market decreased from 282 in Q1 2018 to 206 in Q2 2018. Average asking price decreased from US$3M in Q1 2018 to US$2.8M in Q2 2018. There were no transactions in Q2 2018.
30
51
4 (6.6%) 2.8M USD206
3 (4.9%) 3.0M USD282
206
184
2018 Q2
2018 Q2
2018 Q1
2018 Q1
2018 Q2 2018 Q1
2018 Q2 2018 Q1
31 (5.6%) 4.0M USD509
29 (5.3%) 4.9M USD547
• The overall inventory level of the market increased from 16 in Q1 2018 to 19 in Q2 2018, accounting for 6.1% of the overall fleet in operation.
• Average days on market increased from 343 in Q1 2018 to 370 in Q2 2018.• Average asking price increased from US$5.4M in Q1 2018 to $5.7M in Q2
2018.• There were no transactions in Q2 2018.
368 N.M. / 681 km
130 Knots
7
SPECS
FOR SALE
No. for Sale Avg Asking Price Avg Days on Market
SOLDPast 12 Months Past 3 Months
Max Range
Max Speed
Typ. Passengers
60
74
2018 Q2
2018 Q2
2018 Q1
2018 Q1
19 (6.1%) 5.7M USD370
16 (5.1%) 5.4M USD343 0+ 0+ 0 0+ 0+ 0 0+ 0+ 0 0+ 0+ 0 3+ 0+ 0 1+ 0+ 0 0+ 0+ 0 0+ 0+ 0 0+ 0+ 0 1+ 0+ 0 0+ 0+ 0 1+ 0+ 0 0+ 0+ 0 0+ 19+ 0 0+ 19+ 0 0+ 19+ 0 0+ 16+ 0 0+ 15+ 0 0+ 16+ 0 0+ 17+ 0 0+ 17+ 0 0+ 17+ 0 0+ 15+ 0 0+ 15+ 0 0+ 16+ 0 0+ 16+ 0 16 16
19 19 1916 1615 1515
17 1717
1 1 13
$5.5
$5.3
$5.4
$5.7
Average Asking Price
For Sale vs. Sold
Jun Sep Dec Mar Jun2017 2018
SoldFor Sale
1+ 0+ 0 3+ 0+ 0 2+ 0+ 0 0+ 0+ 0 4+ 0+ 0 1+ 0+ 0 2+ 0+ 0 6+ 0+ 0 1+ 0+ 0 3+ 0+ 0 1+ 0+ 0 0+ 0+ 0 1+ 0+ 0 0+ 35+ 0 0+ 30+ 0 0+ 35+ 0 0+ 32+ 0 0+ 33+ 0 0+ 33+ 0 0+ 33+ 0 0+ 35+ 0 0+ 37+ 0 0+ 36+ 0 0+ 36+ 0 0+ 29+ 0 0+ 33+ 0 2 2
3329
36 36 3733 33 33 32
35 35 3530
146
1 1 113 3
$5.2
$3.0BELL 412HP
BELL 412EP
$3.0 $2.8
$4.9$5.3
$4.0
Average Asking Price
For Sale vs. Sold
Jun Sep Dec Mar Jun2017 2018
SoldFor Sale
Source: JETNET & ASG
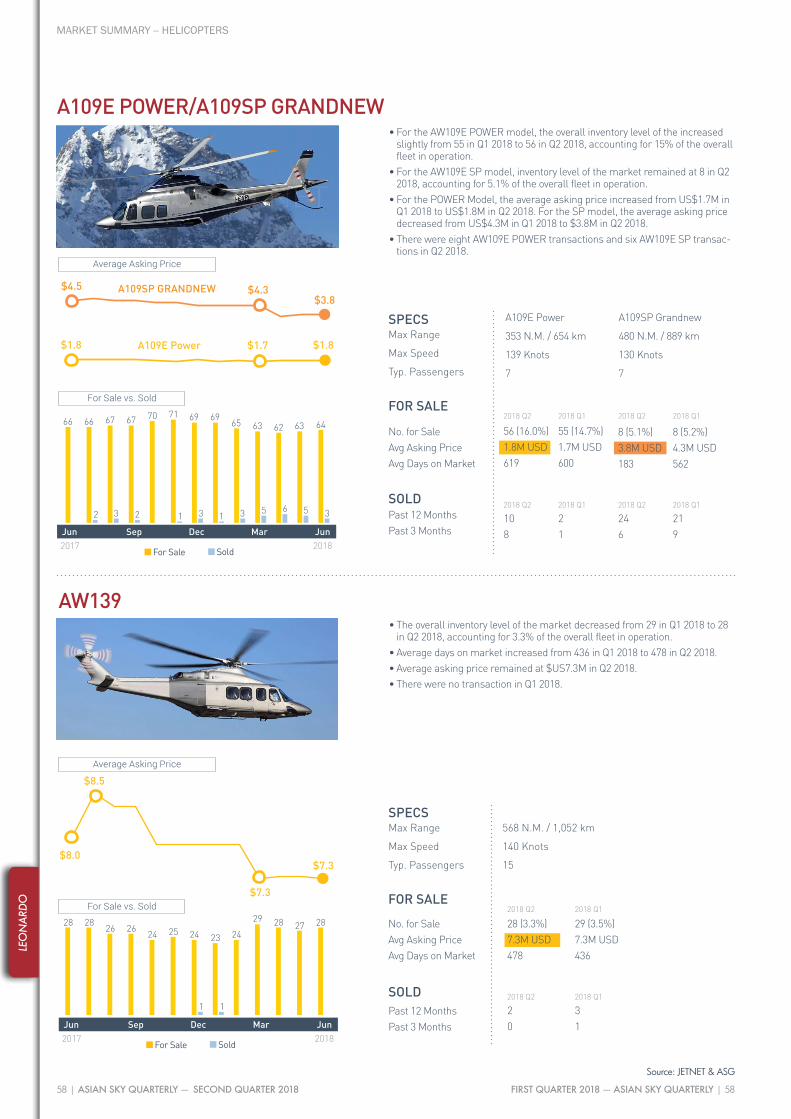
58 | ASIAN SKY QUARTERLY — SECOND QUARTER 2018
Source: JETNET & ASG
LEO
NA
RDO
MARKET SUMMARY -- HELICOPTERS
A109E POWER/A109SP GRANDNEW
AW139
• For the AW109E POWER model, the overall inventory level of the increased slightly from 55 in Q1 2018 to 56 in Q2 2018, accounting for 15% of the overall fleet in operation.
• For the AW109E SP model, inventory level of the market remained at 8 in Q2 2018, accounting for 5.1% of the overall fleet in operation.
• For the POWER Model, the average asking price increased from US$1.7M in Q1 2018 to US$1.8M in Q2 2018. For the SP model, the average asking price decreased from US$4.3M in Q1 2018 to $3.8M in Q2 2018.
• There were eight AW109E POWER transactions and six AW109E SP transac-tions in Q2 2018.
SPECS
FOR SALE
No. for Sale Avg Asking Price Avg Days on Market
SOLDPast 12 Months Past 3 Months
Max Range
Max Speed
Typ. Passengers
A109SP Grandnew
480 N.M. / 889 km
130 Knots
7
A109E Power
353 N.M. / 654 km
139 Knots
7
246
219
8 (5.1%) 3.8M USD183
8 (5.2%) 4.3M USD562
108
21
2018 Q2
2018 Q2
2018 Q1
2018 Q1
2018 Q2 2018 Q1
2018 Q2 2018 Q1
56 (16.0%) 1.8M USD619
55 (14.7%) 1.7M USD600
568 N.M. / 1,052 km
140 Knots
15
SPECS
FOR SALE
No. for Sale Avg Asking Price Avg Days on Market
SOLDPast 12 Months Past 3 Months
Max Range
Max Speed
Typ. Passengers
• The overall inventory level of the market decreased from 29 in Q1 2018 to 28 in Q2 2018, accounting for 3.3% of the overall fleet in operation.
• Average days on market increased from 436 in Q1 2018 to 478 in Q2 2018.• Average asking price remained at $US7.3M in Q2 2018.• There were no transaction in Q1 2018.
20
31
2018 Q2
2018 Q2
2018 Q1
2018 Q1
28 (3.3%) 7.3M USD478
29 (3.5%) 7.3M USD436
FIRST QUARTER 2018 — ASIAN SKY QUARTERLY | 58
0+ 0+ 0 0+ 0+ 0 0+ 0+ 0 0+ 0+ 0 0+ 0+ 0 1+ 0+ 0 1+ 0+ 0 0+ 0+ 0 0+ 0+ 0 0+ 0+ 0 0+ 0+ 0 0+ 0+ 0 0+ 0+ 0 0+ 28+ 0 0+ 27+ 0 0+ 28+ 0 0+ 29+ 0 0+ 24+ 0 0+ 23+ 0 0+ 24+ 0 0+ 25+ 0 0+ 24+ 0 0+ 26+ 0 0+ 26+ 0 0+ 28+ 0 0+ 28+ 0$8.0
$8.5
$7.3
$7.3
23
28 2824
28 282729
26 2624 2425
11
Average Asking Price
For Sale vs. Sold
Jun Sep Dec Mar Jun2017 2018
SoldFor Sale
3+ 0+ 0 5+ 0+ 0 6+ 0+ 0 5+ 0+ 0 3+ 0+ 0 1+ 0+ 0 3+ 0+ 0 1+ 0+ 0 0+ 0+ 0 2+ 0+ 0 3+ 0+ 0 2+ 0+ 0 0+ 0+ 0 0+ 64+ 0 0+ 63+ 0 0+ 62+ 0 0+ 63+ 0 0+ 65+ 0 0+ 69+ 0 0+ 69+ 0 0+ 71+ 0 0+ 70+ 0 0+ 67+ 0 0+ 67+ 0 0+ 66+ 0 0+ 66+ 0 6963 63 6462
66 66 6567 67 70 6971
12 3 31 3 5 6 53 2
$1.8 $1.7 $1.8A109E Power
A109SP GRANDNEW$4.5 $4.3$3.8
Average Asking Price
For Sale vs. Sold
Jun Sep Dec Mar Jun2017 2018
SoldFor Sale

Source: JETNET & ASG
SIKORSKY
MARKET SUMMARY -- HELICOPTERS
SECOND QUARTER 2018 — ASIAN SKY QUARTERLY | 59
0+ 0+ 0 0+ 0+ 0 0+ 0+ 0 0+ 0+ 0 2+ 0+ 0 5+ 0+ 0 0+ 0+ 0 2+ 0+ 0 0+ 0+ 0 1+ 0+ 0 1+ 0+ 0 0+ 0+ 0 0+ 0+ 0 0+ 49+ 0 0+ 55+ 0 0+ 54+ 0 0+ 53+ 0 0+ 54+ 0 0+ 52+ 0 0+ 56+ 0 0+ 55+ 0 0+ 56+ 0 0+ 53+ 0 0+ 53+ 0 0+ 51+ 0 0+ 52+ 0$7.1 $7.3
$3.9S-76C+
S-76C++
$2.3 $2.0
$6.4
$4.9
$6.2
52 5251 54 5453 5349
5356 5655 55
22 51 1
Average Asking Price
For Sale vs. Sold
Jun Sep Dec Mar Jun2017 2018
SoldFor Sale
S-76C+ / S-76C++
SPECS
FOR SALE
No. for Sale Avg Asking Price Avg Days on Market
SOLDPast 12 Months Past 3 Months
Max Range
Max Speed
Typ. Passengers
S-76C+
335 N.M. / 620 km
155 Knots
12
S-76C++
335 N.M. / 620 km
155 Knots
12
S76C+• The overall inventory level of the market dropped from 27 in Q1 2018 to 23 in
Q2 2018, with the for sale fleet representing 15.8% of the overall fleet. The average days on market increased from 802 in Q1 2018 to 866 in Q2 2018. The average asking price decreased from US$2.3M in Q1 2018 to $2.0M in Q2 2018. There were one transaction during Q2 2018.
S76C++• The overall inventory level of the market remained at 26, accounting for 12%
of the overall fleet in operation. Average days on market increased from 537 days in Q1 2018 to 555 in Q2 2018. Average asking price decreased from US$6.4M in Q1 2018 to US$6.2M in Q2 2018. There were no transactions during Q2 2018.
40
62
26 (12.4%) 6.4M USD537
91
106
2018 Q2
2018 Q2
2018 Q1
2018 Q1
2018 Q2 2018 Q1
2018 Q2 2018 Q1
23 (15.8%) 2.0M USD866
27 (18.6%) 2.3M USD802
9,593 HOURS SINCE NEW20,686 CYCLES SINCE NEW
2003 S76C+ SN760554
ASKING PRICE:
CALL FOR PRICING
[email protected] +852 2235 9222
OUR INVENTORY
26 (12.4%) 6.2M USD555
AIRCRAFT HIGHLIGHT• Utility / Offshore Configuration
• Brand New Paint
• Engines Enrolled on PBH
• Dual Controls
• HUMS
• FMS / TCAS / GPS / ELT
• Weather Radar
• Emergerey Floatation Gear
AVIONICS • Caledonian CPT-900 ADELT• Collins ADF-462 ADF• ADS-B• Meggitt Control System Air Conditioning• Two (2) Honeywell SPZ7600 AUTOPILOT or AFCS• L3 Communications FA2100 CVDR CVR and/or FDR• Collins DMW-42 DME• Honeywell MK XXII EGPWS 里• ARTEX INC C406-NHM ELT• Garmin GPS400 GPS / FMS• Honeywell VXP HUMS• Instantaneous Vertical Speed Indicator• Two (2) Collins VHF-22A VHF COMM• Standard Horizon GX Series VHF MARINE• Two (2) Collins VIR-32 VHF NAV• Public Address / Intercom (PA) System
INTERIOR • 12 Passenger Configuration• Utility / Offshore Configuration.

Source: JETNET & ASG
SIKO
RSKY
MARKET SUMMARY -- HELICOPTERS
60 | ASIAN SKY QUARTERLY — SECOND QUARTER 2018
S-92 • The overall inventory level of the market decreased from nine in Q1 2018 to
seven in Q2 2018, accounting for 3.2% of the overall fleet in operation.• Average days on market increased from 557 in Q1 2018 to 664 in Q2 2018.• Average asking price decreased from US$16.7M in Q1 2018 to US$16.1M in
Q2 2018.• There were no transactions during Q2 2018.
SPECS
FOR SALE
No. for Sale Avg Asking Price Avg Days on Market
SOLDPast 12 Months Past 3 Months
Max Range
Max Speed
Typ. Passengers
474 N.M. / 877 km
155 Knots
19
00
20
2018 Q2
2018 Q2
2018 Q1
2018 Q1
7 (2.5%) 16.7M USD664
9 (3.2%) 16.7M USD557
10,357 HOURS SINCE NEW2005 S76C+ SN760592
AIRCRAFT HIGHLIGHT• OGP Compliant
• Enrolled on SBH & PAP
INTERIOR • Twelve (12) passenger interior with tan leather seat-
ing complete with space for two (2) stretchers.
• Additional accessories include passenger ear protectors & HEEL system.
AVIONICS • Primus 440 Weather Radar
• Penny & Giles Flight Data Recorder (FDR)
• Penny & Giles Cockpit Voice Recorder (CVR)
• Penny & Giles Air Data
• Collins TDR 90 Trasponder Mode A/C
• BC Goodrich AD1355D w/ JET Standby Power Supply
• Collins Radio Altimeter
• Caledonian Airborne Systems CPT-900 Emergency Locator Transmitter (ADELT)
• Dual Life LCR92S AHRS
• Dukane Underwater Locator Beacon
• Trimble Free Flight 2101 GPS
ASKING PRICE:
CALL FOR PRICING
[email protected] +852 2235 9222
OUR INVENTORY
0+ 0+ 0 0+ 0+ 0 0+ 0+ 0 0+ 0+ 0 0+ 0+ 0 0+ 0+ 0 0+ 0+ 0 0+ 0+ 0 0+ 0+ 0 0+ 0+ 0 0+ 0+ 0 0+ 0+ 0 1+ 0+ 0 0+ 7+ 0 0+ 7+ 0 0+ 9+ 0 0+ 9+ 0 0+ 9+ 0 0+ 8+ 0 0+ 8+ 0 0+ 8+ 0 0+ 8+ 0 0+ 7+ 0 0+ 7+ 0 0+ 7+ 0 0+ 7+ 0 $16.1$16.7
$23.3
7 7 7 7 8 88 97
98 97
1
Average Asking Price
For Sale vs. Sold
Jun Sep Dec Mar Jun2017 2018
SoldFor Sale

The new generation H160 boasts a range
of unparalleled safety features. Maximized
pilot visibility, intuitive information display,
unrivalled pilot assistance with Helionix®,
and unmatched � ight envelope protection.
What’s more, it carries up to 12 passengers
with a radius of action of 120 NM, while
burning 15% less fuel. With so many
impressive features, the H160 is a huge
step forward not just for its category, but
for the environment, too.
Safety. We make it � y.
FLYWE MAKE IT
RELY ON.
14043_AIR_H160_Helicopter_297x210_AsianSky_1.1.indd 1 12/09/2017 10:05

WWW.DASSAULTFALCON.COM
BEIJING: +86 10 5696 5200 I HONG KONG: +852 3621 0522 I SHANGHAI: +86 189 1157 7115
Get ready to experience the largest, tallest and widest cabin in business aviation. The Falcon 6X has a 5,500 nm (10,186 km) range and a top speed of Mach .90. In setting a higher, wider standard, it truly stands alone. Falcon 6X.The roomiest, most productive 5,500 nm you’ll ever experience.
IT RAISESTHE BAR
WIDER.
6X_210x297_AS_uk.indd 1 12/03/2018 16:49