Information pyramids for informed biodiversity conservation
24
Biodiversity and Conservation 11: 2093–2116, 2002. © 2002 Kluwer Academic Publishers. Printed in the Netherlands. Information pyramids for informed biodiversity conservation JACOB McC. OVERTON 1,∗ , R.T. THEO STEPHENS 2 , JOHN R. LEATHWICK 1 and ANTHONY LEHMANN 3 1 Landcare Research, Private Bag 3127, Hamilton, New Zealand; 2 Department of Conservation, P.O. Box 112, Hamilton, New Zealand; 3 Swiss Center forthe Cartography of Fauna, Terreaux 14, CH-2000 Neuchâtel, Switzerland; ∗ Author for correspondence (e-mail: [email protected]; fax: +64-7-858-4964) Received 15 November 2001; accepted in revised form 29 April 2002 Abstract. We discuss a paradigm for informed ecosystem management that provides a quantitative and rigorous foundation for informing conservation decisions and sustainable ecosystem management. Infor- mation pyramids incorporate conceptual and technological advances in ecosystem depiction and provide a framework for the integration and generalization of raw data into forms that are spatially extensive and at the appropriate level of generalization for a particular use. The basic tenets of the pyramid are: (1) Higher levels of the pyramid are entirely derived from a foundation of underlying data. (2) The process of generalization and integration upward should be objective and explicit. (3) Pyramids for different purposes often overlap, with common data and common methods for integration. (4) All levels of the pyramid should be developed together, including base data, methods and kinds of integration, and algorithms for using the information for planning and decision-making. Information pyramids are a powerful approach to organizing research science, and provide a mechanism by which research, data collection, storage and generalization can be focused on conservation outcomes. Common data and methods lead to increased efficiency, while also allowing for separate disciplines and programs. A case study of an integrated pyramid from New Zealand is discussed, which illustrates the characteristics of information pyramids. Components of this pyramid are discussed that provide examples of integration and generalization at various levels of the pyramid, from base data, to derived data, to spatial predictions and classifications, to a method of integrating this information into conservation decisions. Key words: Biodiversity indicators, Ecosystem depiction, Ecosystem management, Environmental do- mains, Generalized regression analysis and spatial prediction, Information pyramids Abbreviations: GRASP – generalized regression analysis and spatial prediction, LCDB – land cover database, LRI – land resource inventory, MCA – measuring conservation achievement. Introduction The increased focus on ecosystem management has presented a number of challen- ges to conservation biology. Ecosystem management spans a range of activities at a range of spatial scales. Conservation activities range from site-focused activities to regional and national planning, reporting, and regulation. The resulting information needs are likewise varied in detail and scale. For instance, consider the following list of questions that might be posed by conservation managers:
-
Upload
khangminh22 -
Category
Documents
-
view
1 -
download
0
Transcript of Information pyramids for informed biodiversity conservation

Biodiversity and Conservation 11: 2093–2116, 2002.© 2002 Kluwer Academic Publishers. Printed in the Netherlands.
Information pyramids for informed biodiversityconservation
JACOB McC. OVERTON1,∗, R.T. THEO STEPHENS2, JOHN R. LEATHWICK1
and ANTHONY LEHMANN3
1Landcare Research, Private Bag 3127, Hamilton, New Zealand; 2Department of Conservation, P.O. Box112, Hamilton, New Zealand; 3Swiss Center for the Cartography of Fauna, Terreaux 14, CH-2000Neuchâtel, Switzerland; ∗Author for correspondence (e-mail: [email protected];fax: +64-7-858-4964)
Received 15 November 2001; accepted in revised form 29 April 2002
Abstract. We discuss a paradigm for informed ecosystem management that provides a quantitative andrigorous foundation for informing conservation decisions and sustainable ecosystem management. Infor-mation pyramids incorporate conceptual and technological advances in ecosystem depiction and providea framework for the integration and generalization of raw data into forms that are spatially extensive andat the appropriate level of generalization for a particular use. The basic tenets of the pyramid are: (1)Higher levels of the pyramid are entirely derived from a foundation of underlying data. (2) The process ofgeneralization and integration upward should be objective and explicit. (3) Pyramids for different purposesoften overlap, with common data and common methods for integration. (4) All levels of the pyramidshould be developed together, including base data, methods and kinds of integration, and algorithms forusing the information for planning and decision-making. Information pyramids are a powerful approachto organizing research science, and provide a mechanism by which research, data collection, storage andgeneralization can be focused on conservation outcomes. Common data and methods lead to increasedefficiency, while also allowing for separate disciplines and programs. A case study of an integrated pyramidfrom New Zealand is discussed, which illustrates the characteristics of information pyramids. Componentsof this pyramid are discussed that provide examples of integration and generalization at various levelsof the pyramid, from base data, to derived data, to spatial predictions and classifications, to a method ofintegrating this information into conservation decisions.
Key words: Biodiversity indicators, Ecosystem depiction, Ecosystem management, Environmental do-mains, Generalized regression analysis and spatial prediction, Information pyramids
Abbreviations: GRASP – generalized regression analysis and spatial prediction, LCDB – land coverdatabase, LRI – land resource inventory, MCA – measuring conservation achievement.
Introduction
The increased focus on ecosystem management has presented a number of challen-ges to conservation biology. Ecosystem management spans a range of activities at arange of spatial scales. Conservation activities range from site-focused activities toregional and national planning, reporting, and regulation. The resulting informationneeds are likewise varied in detail and scale. For instance, consider the following listof questions that might be posed by conservation managers:

2094
1. What threatened species are present at this site?2. What is the natural distribution of this threatened species?3. What is the natural vegetation composition of this region?4. What is the current vegetation condition for this region?5. What increase in vegetation condition is achieved by potential management ac-
tions in this area?6. What difference in the state of overall natural heritage is achieved by government
expenditure on conservation in this country?The questions in this list increase progressively in their generality and spatial
scale. The information required to answer them will also need an accompanying in-crease in its integration and generality.
These examples illustrate that biodiversity conservation demands information ata range of spatial scales and a range of levels of generalization. Management acti-vities extend from single species at single sites, to entire communities over regions,to entire natural heritage assets nationally and internationally. Management done at aparticular site might take into account local data about the conservation problems ata site, such as a list of weed species present and their abundances, or the abundancesof rare animal species and threats to them, such as introduced predators. However,reams of site-specific information will not be useful (or available) for regional ornational decision-making. These different types of activities require information atvery different levels of detail and generalization.
The challenges of supplying information at such a range of scales in a manner thatis ecologically meaningful may be one of the reasons that coordinated and informedecosystem management at regional and national scales is still in its infancy. No con-servation agency has the ability to define and quantify conservation outcomes, andattempts to quantify the outputs of conservation and environmental management arefew (Metric and Weitzman 1998; Weitzman 1998). The measures proposed generallycapture only a narrow portion of total conservation output (Cullen 1995, 1999), andoften fail to link the output measure to value creation for society and future genera-tions (Gowdy 1997; Clough et al. 1998). Nevertheless, there has been an increasedmove to making regional or national conservation decisions on a more systematic andquantitative basis. Regional conservation planning (Margules and Pressey 2000) hasfocused largely on the issue of reserve selection and design (e.g., Davis et al. 1999;Noss et al. 1999). Stephens (1999) has designed systems to deal with conservationallocation and reporting at national scales. Such conservation efforts are usually sup-ported by coordinated research to provide and integrate a wide range of physical andbiological information needs such as that in northeast New South Wales, Australia,summarized by Ferrier et al. (this issue) and Cawsey et al. (this issue).
The move to broader ecosystem management has garnered wide support (Chris-tensen et al. 1996), but has also generated controversy. In particular, the ability toadequately define, measure and depict ecosystems has been questioned (Fitzsimmons1999) and debated (e.g., O’Neill 2001). While much is not known about ecosys-

2095
tems, there is also much that is known, including component parts, processes andemergent properties. Biotic components of ecosystems, such as individual speciesare reasonably well documented, as are some of the physical components, such assoils or climatic inputs. A fair amount is understood about some of the processes,such as nutrient cycles; and about some of the emergent properties, such as speciesrichness, or net primary productivity. A productive approach is to not get distract-ed by the unknown, and to work with that which can be measured and described,while continuing to develop ways of dealing with less well known or less tangibleproperties.
Generalizations of various types about ecosystems have been available for a longtime. For instance, a map of vegetation types can be considered a generalization aboutecosystems. Vegetation is an important component of ecosystems, and a descriptionor classification of the vegetation pattern is thus an ecosystem classification (albeitnot a complete one). Furthermore, we can describe some of the emergent ecosystemproperties of vegetation, including species diversity, total biomass, and net primaryproductivity. The prediction across the landscape of particular ecosystem attributes,such as plant distributions, and rigorous methods to distill and generalize informationare two essential components for conservation management.
Traditional approaches to vegetation mapping have both operational and concep-tual difficulties and reflect the technological constraints of a time when maps weremade with pens on paper. The traditional approach to vegetation mapping is to decide(usually in advance) on a number of vegetation classes, and then map (predict) thespatial extent of each class. Boundaries of each vegetation type are determined bydrawing lines on maps using a combination of field observations and either aerialphoto-interpretation or remote sensing image classification techniques. The opera-tional difficulties of such an approach are that it results in a flexible and unscalableclassification and that the prediction process is often a subjective interpretation thatis neither explicit nor repeatable. Conceptual difficulties with traditional approach-es include that they impose a discrete structure onto species associations that is in-consistent with the large amount of independence in species associations, and thatthe sharp, smoothed boundaries are poor representations of what are often complex,fractal shapes and clinal variation.
Advances in computing and spatial analysis allow for more rigorous ecosystemdepiction that is consistent with their real properties and allow us to escape existingparadigms for spatial generalization. Biotic and abiotic components of ecosystemscan be predicted, such as species distribution (e.g., Franklin 1995; Leathwick 1998),species richness (e.g., Lehmann et al., this issue), vegetation biomass (e.g., Overtonet al. 2000), or soil characteristics (McKenzie and Ryan 1999). The resulting spa-tial predictions of ecosystem characteristics can be integrated further. For instance,species richness and natural community composition can be estimated by summingseveral species predictions (Leathwick 2001; Lehmann et al. 2002). Alternatively,biotic domains can be defined from the classification of predicted species distribution

2096
(Peters and Thackway 1998; Overton et al. 2000; Leathwick 2001). Environmen-tal domains provide ecosystem classifications derived from environmental variables(Hargrove et al. 2001; Leathwick et al. 2001) with numerous other possible uses ofenvironmental information available (Faith and Walker 1996; Hargrove and Hoffman2000; Overton and Leathwick 2001). While many of these approaches are compu-tationally (and memory) intensive, increases in computing power and storage allowthem to be implemented at both broad scales as well as high spatial resolution.
These quantitative approaches to the depiction and generalization of ecosystemsare at the heart of information pyramids. Pyramids provide a vision for harnessingconceptual and technological advances for a robust and rigorous approach to devel-oping environmental indicators and informing conservation decisions. In this paper,we first describe and develop the general concept of information pyramids, listingand discussing a number of central tenets of the pyramids. We then detail a case studyof an integrated information pyramid developed for making conservation decisions,incorporating a number of quantitative approaches to ecosystem depiction. The topof this example pyramid is the measuring conservation achievement (MCA) process(Stephens 1999; Stephens et al. 2002) developed by the New Zealand Department ofConservation. Various components required by the MCA process are described, andused as examples of information integration and generalization. In particular, examplecomponents are chosen that represent recent advances in information integration. Thefundamental data required for each step are discussed in the sections in which it isused.
Information pyramids
Managers and scientists operate within an information pyramid, in which base dataform the bottom of the pyramid, with increasing integration and generalization ofthese data moving up the pyramid. Figure 1 shows an information pyramid for themanagement of terrestrial biodiversity, labeled with components relevant to New Zea-land. Information pyramids are a metaphor for a powerful paradigm for organizingresearch science, recognizing common data and common methods, and leading toincreased efficiency, while also allowing for separate disciplines and programs.
The core of an information pyramid is the integration and generalization ofdata and knowledge. We use the term integrate to mean combining different in-formation, often of quite different types, such as biological information with envi-ronmental information. Generalizing information involves the identification of pat-terns, or the process of distilling detailed information into reduced forms, such as theclassification of the vegetation composition in an area into vegetation types.
Our formulation of these ideas was instigated by similar ideas in both the MfEEnvironmental Performance Indicator Programme discussion documents (Ministryfor the Environment 1997; Burley 1998).

2097
Figure 1. An information pyramid. The leftmost visible face of the pyramid shows examples of the bio-physical components for terrestrial biodiversity that are the focus of this paper. The right face shows ex-amples of institutional components that are not addressed in this paper. The base of the pyramid is rawdata, which is integrated and generalized to middle layers of the pyramid. Middle layers can be used at thatlevel, and can also be integrated and generalized further to provide the information needs of the top of thepyramid.
Tenets and characteristics of the information pyramid
Here we list four basic tenets of information pyramids and discuss their characteristicsand advantages.
1. Higher levels of the pyramid are entirely derived from a foundation of un-derlying data. This tenet makes the fairly strict requirement that all generalizationsand integrations of data be strictly data defined, ensuring a rigorous and objectivepyramid. The example pyramid (Figure 1 and described below) gives a number ofdifferent ways in which data are integrated or generalized upwards. While it mightwell be necessary to use components of the pyramid that are not data defined, thisshould be viewed as an interim measure, until the data are available.
2. The process of generalization and integration upward should be objective andexplicit. The information pyramid should be based on explicit methods of integratingupwards that are as objective as possible. Almost all methods, including quantitativeones, require subjective decisions or assumptions. It is important that these decisionsbe explicitly recognized and stated. This has a number of advantages. The work canbe repeated and the same result should be obtained. This can be a useful check of

2098
procedures and allows the process to be repeated with updated data, or under changedconditions. The process of developing methods of integration and generalization, andthe data underlying them, can be fully specified and debated to arrive at the bestmethod.
Without these information requirements, conservation decisions are largelybased on personal opinion, sometimes of only one person. For example, the re-cognition of vegetation types is often based on the opinions or judgments of a fewpeople. One could never repeat the process of making a vegetation map and getthe same result, under the traditional approach, often even if the same people didit. This also applies to many existing general ecosystem classifications. Using suchsubjective approaches results in a pyramid that is based on weights of opinion,rather than objective data.
3. Pyramids for different purposes often overlap, with common data and commonmethods for integrating upward. Unlike Egyptian or Mayan pyramids, informationpyramids may be nested and overlapping (Figure 2). Pyramids are nested when theinformation at the top of one pyramid becomes part of another pyramid. Thus, ratherthan being composed of components, information pyramids are in fact composed ofmany nested and overlapping pyramids, where each component pyramid is a generali-
Figure 2. Nested and overlapping information pyramids. Related pyramids share common fundamentaldata, as well as common methods for integrating upwards. Each pyramid is both composed of a number ofsmaller pyramids, as well as part of larger pyramids.

2099
zation or integration of information. Information pyramids do not suggest that onlyone generalization or integration is possible from base data. Instead, the situation ismore like that in Figure 2, where multiple generalizations are possible.
Pyramids overlap when a number of generalizations use the same underlying in-formation. For instance, climate information may be used to make environmentaldomains, or predict species distributions or soil properties. Environmental domains,which are classifications of environment, are used as a conservation framework inboth the MCA process described here, as well as the Environmental PerformanceIndicators Programme (EPIP, Ministry for the Environment 1997), and reporting byregional councils. Predictions of pest abundance, such as brushtail possums, can beused in both the MCA process to address issues of reducing biodiversity loss in nativeforests, and in a national strategy for control of bovine tuberculosis, of which possumsare an important reservoir. On a more general level, many of the factors that determinenatural community composition and ecosystems properties are identical to those thatinfluence human use of landscape for productive purposes and the risks associatedwith those uses (e.g., McHarg 1969). For example, information on soils, climate, landcover and remote imagery is useful in assessing issues related to suitability for cropsor pollution risks and movement. Thus, pyramids for terrestrial biodiversity will haveoverlap with pyramids for agricultural productivity or pollution issues.
Pyramids also overlap because of common methods for integration and generali-zation. Database management techniques and metadata development are often quitegeneral techniques. Classification techniques for example can be used to make en-vironmental domains, or biotic domains, or soil classifications. Mechanistic modelsare often specific to a particular system, but use very general techniques. Spatialmodeling techniques, e.g. GRASP, are quite general in approach and can be appliedto a wide variety of systems and problems. Spatial prediction techniques, surfacefitting, and geographic information systems are further examples of approaches andmethods that are common to many types of information pyramids.
Distinct but overlapping pyramids provide a powerful solution to the tension be-tween cooperation and competition between and within agencies. The pyramids oftencorrespond to scientific programs or administrative responsibilities. The overlap ofthe pyramids recognizes the data and methods shared between pyramids, and providesa clear avenue for cooperation between agencies. Of course, one of the inevitabletensions in coordinated research programs is patch protectionism and competitionbetween and within agencies. The pyramid paradigm allows for the recognition ofthe common data and methods underlying these programs, while also respecting ad-ministrative boundaries.
4. All levels of the pyramid should be developed together, including base data,methods and kinds of integration, and algorithms for using the data for planningand decision-making. While information pyramids can be developed from the top,bottom, or middle, the ideal is for these approaches to be pursued together. Workingfrom the top of the pyramid identifies the way in which information will be used,
2100
and gathers data and makes the appropriate generalizations to provide the needed in-formation. A bottom-up approach first identifies the sorts of data currently available,or that can be gathered, such as vegetation plots, or types of remote imagery. Thebottom-up approach might also say which kinds of information cannot be measuredor are too costly, such as extensive measurements of biomass, or species compositionof microbes. The middle parts of the pyramid focus on the ways of integrating andgeneralizing this information. The methods and approaches to generalizing the infor-mation are important constraints on what information can be provided, and advancesin ecosystem depiction need to be incorporated into methods of decision-making.
Pursuing just one of these approaches leads to short comings. A bottom-up ap-proach can be a very inefficient method of developing an information pyramid. Alarge amount of data could potentially be gathered, and most of it would never getused. Gathering data without a vision for use, or without providing the data in a formthat can be used, is a waste of time. Data gathered in this way might not providethe required information, might lack crucial information (such as spatial locations, ortaxonomic information), and might lack the organization or format for others to use.
Similar problems exist in the middle of the pyramid. The majority of scientistswork in the lower parts of the pyramid. As a result, a common tendency is to makespatial predictions or other models or products, and expect others to recognize theirvalue and develop a way to use them. Similarly, much research is not outcomefocused. Equally difficult problems can also occur in trying to create a pyramidsolely from the top. A top-down approach could design an elegant system for mak-ing conservation decisions that required all sorts of information that could never bemeasured, would be expensive to collect, or did not take into account underlyingknowledge and understanding.
The approach of working from the bottom or middle alone also leads to pyra-mids that are dysfunctional and likely to be abandoned. This is because base dataand integrated information have been developed, but little or no mechanism existsfor transferring these into a basis for management decisions. This may well be theexplanation for why a number of visionary indicators programs have been developed,with excellent procedures for producing rigorous estimates of required parameters,and then abandoned. When pressure developed to cut the funding, there was no oneto say, ‘Hey hang on! We use that information all the time to make decisions!’
Building all levels of the information pyramids together provides a targeted ap-proach that recognizes constraints in underlying data while taking advantage of tech-nological and conceptual advances in ecosystem depiction.
A case study from New Zealand
Here, we illustrate information pyramids using a case study from New Zealand thatprovides an example of a coordinated effort to generalize biodiversity information

2101
and use this information to make conservation decisions. The New Zealand Depart-ment of Conservation has been criticized both by the public (e.g., Hartley 1997) andby central government control agencies for its inability to report on the differencemade by the Crown’s expenditure on conservation to the state of the nation’s heritage.In response, the Department (Stephens 1999) has developed the measuring conser-vation achievement (MCA) method to measure the value created by conservationmanagement.
We use the case study to provide concrete examples of the tenets of informationpyramids, and demonstrate the role of recent advances in spatial prediction and quan-titative ecosystem depiction. Rather than try to cover all the diverse information needsof the MCA, we have focused on a number of biological and physical componentsthat illustrate the use and application of information pyramids, and provide exam-ples of the integration and generalization of information (Figure 3). These examplesdemonstrate how different levels of the pyramid are derived from lower, fundamentallevels, while contributing to upper, derived levels.
This example also illustrates the advantages of building up the entire pyramidsimultaneously. During the process of MCA development, new ways of depictingbiodiversity information have been utilized and incorporated in the process. Similarly,
Figure 3. Information integration for the MCA process. Here, the pyramid is reduced to two dimensionsfor simplicity. The MCA draws upon a number of smaller pyramids that integrate and generalize infor-mation to forms useable by the MCA and other purposes. While the MCA draws upon a broad range ofbiophysical and institutional information, this figure shows only the components that are discussed in thetext as examples of information integration and generalization.

2102
the types of data collected and spatial predictions and generalizations have been influ-enced largely by the MCA developmental process. While the case study here relatesto a particular pyramid, it is important to keep in mind that all pyramids overlapwith others. There are many overlaps between the pyramid described here and otherpyramids in New Zealand related to environmental performance and environmentalperformance indicators. Pieces of this pyramid, such as environmental domains andtree modeling, have been partly or mostly developed under other research programs.
Measuring conservation achievement
The MCA process is the top of our example pyramid. This process attempts to achievethe largest conservation bang for the limited conservation dollar, and provides a num-ber of tools, including a basis for accountability, the basis for reporting conservationgains, losses and the difference made, and an identification of priority sites for con-servation action. To attain these goals, it draws on a broad range of institutional,biological and physical information, such as environmental variables, topographicand cadastral data, land cover, animal pest, weed and other human disturbance data atits base. The MCA process provides an explicit algorithm for integrating these datato estimate representativeness, naturalness, irreplaceability and vulnerability of theareas affected by potential conservation projects. These estimates are then linked toinformation on design, cost and risk of the potential projects to assess site prioritiza-tion, project cost-effectiveness, and achievement reporting.
Conservation management aims to defend or improve the condition of natural heri-tage by controlling exotic pests, weeds and other forms of human-induced disturbance.Conservation achieved is measured by the difference made to the intensity and diversi-ty of human-induced disturbance pressures. Five types of human-induced disturbancepressures are recognized: biota removal by humans, physico-chemical resource altera-tion, consumption by introduced species, competition by introduced species, and frag-mentation. Spatially explicit information is required for each of these types of distur-bance. Naturalness is defined as the absence of these disturbances and their effects. Theeffects of conservation actions are measured by the difference in predicted site value withand without conservation management, and is then discounted for time and risk of non-achievement to provide a measure of conservation output (Figure 4).
The output measure enables direct comparison of the value and cost-effectivenessof diverse and seemingly incomparable conservation projects such as possum control,wilding pine control, stock fencing, preventing the drainage of some wetland or cre-ation of a marine reserve. The underlying information pyramid provides the basis fora number of important measurement and reporting tools used to manage conservationbusiness and to measure the performance of the Department’s conservation manag-ers. These include spatially explicit reporting on conservation gains, losses and thedifference made across the landscape, identification of priority sites for conservationaction, and conservation project cost-effectiveness analysis.

2103
Figure 4. The MCA conceptualization of conservation outcome size and derived measures. The benefitof conservation is the difference in site value with and without management. This outcome size is thencombined with estimates of urgency and feasibility to assess project merit. Project merit is combined withnet present value cost to assess project cost-effectiveness.
What value does it add?Trial implementations of the MCA process indicate large potential gains in effi-ciency in conservation achievement. Demonstrations in the Twizel conservancy, onthe South Island of New Zealand (Stephens et al. 2002) show that efficacy var-ies over three orders of magnitude between projects. An optimum set of projectslead to three times as much estimated value, for the same overall budget, as didthe current set of projects. As part of this project, the costs and benefits of im-plementation of the MCA were estimated. The implementation expenses includeddevelopment, national databases, and operational costs. The benefits were estimat-ed as the increased amount of conservation merit achieved by the optimal ratherthan the actual conservation measures. The dollar value of the benefits, estimatedby the cost of producing those benefits without the MCA process, was 87 timesthe cost of implementation (Stephens et al. 2002), implying a cost:benefit ratio of87:1.
Climate surfaces
Climate surfaces are an example of data generalization and integration that occurs inthe lower levels of information pyramids. Climate is an important driver for a widerange of biotic and abiotic patterns. While climate stations are the main source ofinformation for climatic averages, these stations provide only local (point) measure-ments, which are of themselves of little use for most applications. Point data must beintegrated and scaled up into regional or national coverages. When these stations are

2104
used as the basis for extrapolating biodiversity characteristics across the landscape,the value of the investment in climate stations becomes apparent.
At the beginning of the work to develop environmental domains and species mod-eling, climate surfaces for New Zealand were not available. Despite the large expendi-ture on weather forecasting, and the massive amounts of climate station data available,simple weather spatial predictions of long-term average climate were not availablefor the country. As a prerequisite for other work that required this component ofthe information pyramid, climate surfaces were developed (Leathwick and Stephens1998). Despite spatial patterns in climate being hugely important in determining theproductivity and sustainability of many natural resources, it is notable that these sur-faces were not produced until required for a particular application. Once available,they are then useful for a wide variety of uses.
The climate surfaces for New Zealand include both fundamental surfaces, as well anumber of surfaces that are calculated from the fundamental surfaces. The calculationof the secondary surfaces represents the integration of physiological knowledge on theimportance of different climatic factors influencing biological processes, mainly invegetation. These climate surfaces can then be used as important spatial predictors ofbiotic patterns for GRASP analyses, or are combined with other sorts of environmentalinformation like landform variables, as is done in environmental domains.
Remote sensing imagery and derived products
Remote sensing imagery provides a powerful source of spatially explicit informationabout the landscape. Raw satellite imagery provides the base data, which must becorrected and standardized in various ways before they are useful. Usually the imagemust be orthorectified, and reflectances must be corrected for the angle of the sun andthe viewing angle (Shepherd and Dymond 2000). In addition, the slope and aspect ofthe land surface affect the reflectances, requiring topographic corrections (Shepherdand Dymond, in press). These corrections integrate a number of different types ofinformation. After these corrections have been taken into account, the spectral infor-mation is available as a spatial predictor layer for further integration or generalization.A variety of forms of integrated remotely sensed information are also currently beingproduced, including layers of fraction of photosynthetically active radiation, woodyvegetation, and classified imagery (J. Dymond, personal communication), with theaim of producing uniform layers for all of New Zealand.
Once corrected or classified, there is still the question of how the patterns of spec-tral reflectances help predict the patterns of biodiversity or ecosystem characteristics.
There are well-developed techniques for carrying out this in remote sensing in-cluding both supervised and unsupervised classifications of the imagery, combinedwith groundtruthing.
The land cover database (LCDB) developed by Terralink and a consortium ofend users primarily used SPOT3 and SPOT4 satellite imagery, along with auxillary

2105
information, to classify all New Zealand into about a dozen land cover types. Poly-gons of land cover were hand digitized from imagery, guided by classification of theimagery as well as by auxiliary spatial information. Despite its traditional approachesto spatial integration, the LCDB provides an important national classification of landcover. By combining it with other sorts of information, we can quantify how muchinformation the classifications convey for particular uses.
The New Zealand land resource inventory (NZLRI)
NZLRI (Newsome 1992) provides classifications of land use capability (LUC) for allNew Zealand. The NZLRI used a polygon-based approach developed in the 1980s,which was the only way to get national coverage, given the limited computing poweravailable at the time. Polygons of uniform LUC were defined, and the fundamentalbase attributes, such as slope, drainage, soil type, etc., were estimated. Heterogeneitywithin the polygons was depicted by denoting primary and secondary values of thebase attributes for each polygon. However, no information was available on the spatialdistribution of these different properties within the polygon.
The usefulness of this work can be seen by the fact that it is still an importantsource of spatial information for further levels of classification. Some of the soil andsubstrate information in the LRI is used as the substrate information in environmentaldomains and spatial predictions, such as species modeling. Hopefully, new updatedlayers of soil information will be developed using newer information and techniques.Progress in this direction is being made through work on standardizing a national soilsdatabase, and on methods for using this data to provide spatially explicit depictionsof soil characteristics.
Environmental domains
Environmental domains analysis (Mackey et al. 1988; Belbin 1993; Hargrove et al.2001; Leathwick et al. 2001) is becoming increasingly well known as a means ofecosystem classification. A domains analysis integrates climatic, soil and landformdata and generalizes this information by classifying areas into domains of similarenvironmental characteristics. Thus, domains are defined as areas of similar environ-ment, using environmental variables that have fundamental functional significancein determining physiological performance and/or proven statistical importance in de-termining species distributions. Domains of similar environment are used as surro-gates of areas of similar ecosystem character. Environmental domains classificationsprovide a method of depicting ecosystems that is consistent with many ecosystemproperties.
To produce an environmental domains classification, the region of interest is firstdepicted by a digital elevation model (DEM) comprised of pixels of a given size,each with a location in geographic space. A number of environmental variables are

2106
then predicted for each pixel, thus defining the environmental space for each pixel.Non-hierarchical clustering is used to define a large number (≈1000) of groups ofpixels (domains) that are similar in environmental space. Hierarchical clustering isthen used on these domains to produce a dendrogram of similarity between the do-mains. This dendrogram provides the full domains classification for the region, anddifferent number of groups can be produced by cutting the dendrogram at the de-sired resolution. These groups in environmental space can then be mapped back intogeographic space. While pixels within a domain are close in environmental space,they can be scattered and distant in geographic space. Currently, a national domainsimplementation for New Zealand, Land Environments New Zealand (LENZ, Figure5), is underway and due for completion by July 2002. LENZ is funded by the Ministryfor the Environment (MfE) under the EPIP.
Figure 5. Land environments of New Zealand (LENZ). This is the current national implementation ofenvironmental domains, depicted for Level I (20 group) and Level II (100 group).

2107
Other uses of environmental information provide continuous measures, ratherthan classifications (Belbin 1993; Faith and Walker 1996; Overton and Leathwick2001). For instance, environmental distinctiveness provides another method for in-tegrating the same environmental information that underlies environmental domainsclassifications, providing complementary applications. Environmental distinctivenessdoes not impose a discrete classification onto the continuous environmental variation,but instead, calculates a continuous measure of the distance of each pixel from somereference set of pixels. Environmental distinctiveness is used directly within the MCAprocess to assess site distinctiveness.
GRASP predictions
Generalized regression analysis and spatial prediction (GRASP) has been defined asboth a general concept and a specific implementation in Splus (Lehmann et al. 2002).As a concept, GRASP is defined as a combination of regression modeling and spatialprediction that defines relationships in predictor space and uses these relationshipsto predict in geographic space. Regression modeling is used to establish relation-ships between a response variable and a set of spatial predictors. These relationshipsare then used to make spatial predictions of the response. The GRASP process re-quires point measurements of the response, as well as regional coverages of predictorvariables that are statistically (and preferably causally) important in determining thepatterns of the response.
GRASP is an important method for integrating and generalizing information upthe pyramid (Figure 6). GRASP integrates information by combining quite differentsorts of information to make spatial predictions. Knowledge is also generalized byidentifying the relationships between the different variables. For instance, GRASPcould use a survey of the abundance of a species (the response), and existing spatialcoverages of environmental (e.g., climate, landform) variables (the predictors) for aregion. A multiple regression (here we use GAMs) can be used to establish the sta-tistical relationship between the species abundance and the environmental variables.These regression relationships can then be used to predict species abundance fromthe environmental surfaces. The generalization of the knowledge comes both fromthe relationships seen in the regressions, as well as the spatial predictions.
A specific implementation in Splus has been developed that facilitates this process(Lehmann et al. 2002). GRASP (the implementation) is an interface and collection offunctions in Splus designed to facilitate modern regression analysis and the use ofthese regressions for making spatial predictions. GRASP standardizes the modelingprocess and makes it more reproducible and less subjective, while preserving anal-ysis flexibility. The set of functions provides a toolbox that allows quick and easydata checking, model building and evaluation, and calculation of predictions. Thecurrent version uses only generalized additive models (GAMs), a modern regressiontechnique.

2108
Figure 6. GRASP. This is an important method for integrating and generalizing information up the pyr-amid. A multiple regression (here we use GAMs) is used to establish the statistical relationship betweenthe species abundance and the environmental variables. These regression relationships can then be used topredict the species abundance from the environmental surfaces. The GUI for the Splus implementation isalso shown.
Ferrier et al. (two papers, this special issue) provide excellent examples of similarwork in Australia, modeling up to 2300 species, and using a wide range of differentbiological information.
Natural distributions of canopy tree speciesHere we describe work that integrates environmental information with existing plot-based surveys of forest canopy composition. Measurements of tree abundances inlargely undisturbed forests were combined with climate and landform variables toestablish the relationships between tree species abundance and environment in undis-turbed forest. These relationships were used to predict what tree composition wouldbe for all New Zealand in the absence of human influence.
At the beginning of the work, climate surfaces were unavailable, and data werestored in hard copies in banana boxes in the basement of a research institute. Muchwork was required to organize the data into a relational database and create climate

2109
surfaces. Much of this work was performed under climate change research, and hadstrong overlap with environmental domains work in creating and testing the utility ofclimatic surfaces for the prediction of ecosystem characteristics.
Tree species distributions were modeled in relationship to environment (Leath-wick 1998, 2001; Leathwick and Austin 2001, Leathwick and Whitehead 2001) usingGRASP. Environmental variables consisted of climate surfaces and landform vari-ables from the LRI. Individual tree species abundances were regressed against envi-ronmental variables using GAMs. Since the genus Nothofagus is noted for being atnon-equilibrium with its environment, the models of Nothofagus included a spatialvariable to account for this patchiness. Regressions of many other species includedNothofagus abundance as predictor variables (Leathwick 2001, 2002).
These regression models were used to predict individual species abundances foreach of the pixels in a 1-km DEM of New Zealand. This results in spatial predictionsof forest community composition that incorporates known biogeographic effects andflow-on competition effects. These predictions are useful in themselves, e.g., for un-derstanding species distributions or designing restoration potential. They can also beintegrated further in various ways. One example is given in the Biotic domains sectionbelow.
Vegetation condition, weeds, and pestsIn two projects specifically designed to address information needs identified by theMCA process, we are predicting vegetation condition, weed distributions, and the dis-tribution of an introduced pest. All these predictions are designed to provide specificinformation needs for ongoing implementations, as well as provide a general dem-onstration of the power and insight gained by combining single observations acrossthe landscape into general patterns and spatial predictions. Unfortunately, the data forthis were not available, and had to be collected and collated from a wide variety ofsources and formats. These projects modeled vegetation or possum data as a functionof climatic surfaces, landform variables, or land cover (described above). As such,they integrated information on vegetation, or possum abundance with existing spatialpredictions.
For the vegetation data, the study area was confined to the central part of theSouth Island of New Zealand. We used existing information from appropriateplot-based surveys with data stored in the NVS database (Wiser et al. 2001). Weidentified the distribution of existing information, and collected new information tosample areas and environmental or land cover combinations without data (seeCawsey et al. (this issue) for a similar process). The resulting database of previousand additional vegetation plots was then used to make spatial predictions aboutvegetation condition and weed distributions. Vegetation condition can be difficult todefine. One of the advantages of the explicit, quantitative approach advocated hereis that it forces decisions about what is meant by vegetation condition, and makesthem explicit. We are predicting a number of indices of vegetation condition,
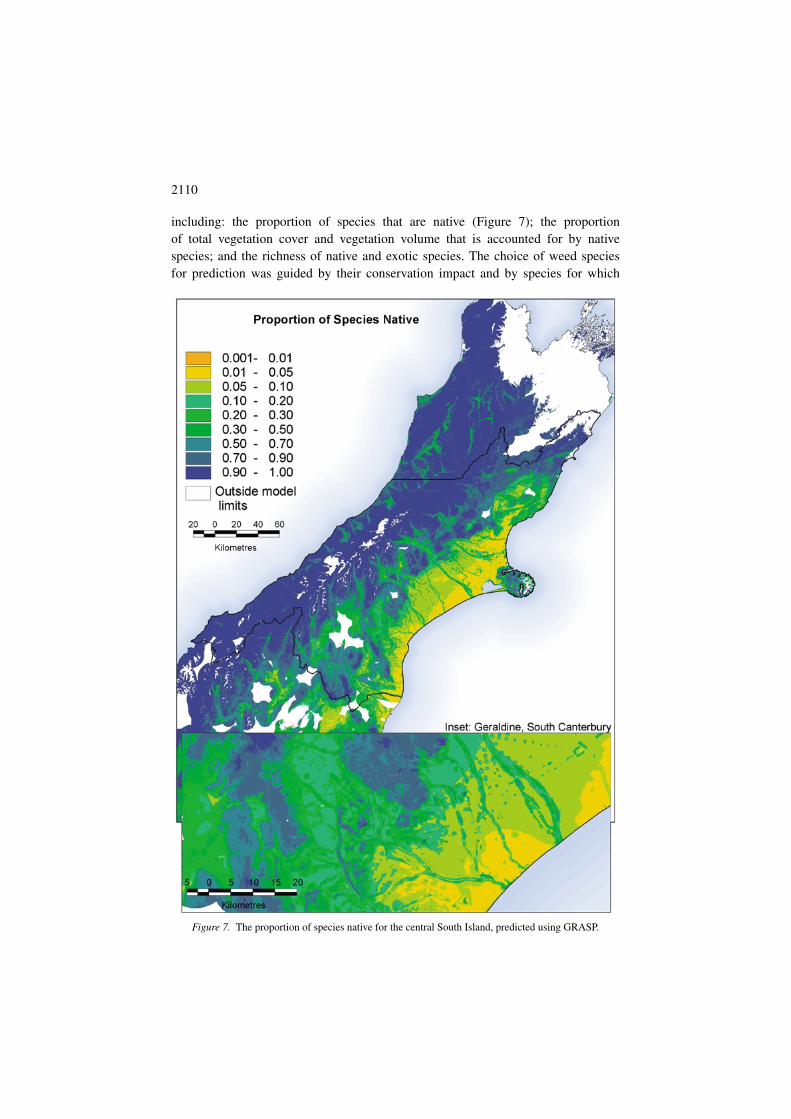
2110
including: the proportion of species that are native (Figure 7); the proportionof total vegetation cover and vegetation volume that is accounted for by nativespecies; and the richness of native and exotic species. The choice of weed speciesfor prediction was guided by their conservation impact and by species for which
Figure 7. The proportion of species native for the central South Island, predicted using GRASP.
2111
active control is carried out. In addition to the spatial predictions, the relationshipsof each weed species with environmental variables are used to guide insights intothe species ecology and distribution.
The brushtail possum, Trichosorus vulpecula, is an Australian endemic that hasgone awry in New Zealand. Introduced to establish a fur trade over a century ago,the species now damages native forests, predates nests of native birds, and car-ries bovine tuberculosis (Clout and Ericksen 2000). Extensive control of possumsby poisons and trapping is carried out for conservation outcomes and control ofbovine tuberculosis. In 1996, a national trap catch protocol (Warburton 2000) waswidely adopted and used as an index of possum abundance before or after controloperations. As a result, there now exist numerous trap catch surveys spread aroundthe country. While considerable effort was required to collect and collate evenpart of this data information, it provides a valuable opportunity for spatial inte-gration and generalization. Integrating scattered trap catch surveys with existingclimate and landform variables, using GRASP, provided a rich model of the largescale behavior of the trap catch index and a spatial prediction of it as an index ofpossum abundance for MCA purposes. This example also illustrates overlappingpyramids; predictions of possum abundance and insights into the effects of seasonand set type on the trap catch index are of widespread interest for regional andlocal planning of pest control measures.
Biotic domains
Individual spatial predictions can be further generalized in various ways. For exam-ple, while environmental domains describe areas similar in environmental attributes,biotic domains define areas similar in predicted community composition. This canbe done using different sets of species, and at different number of groups, resultingin flexible, scalable classifications of natural vegetation (Figure 8). A biotic domainsanalysis for tree species (tree domains) is shown in Figure 9. This tree domains anal-ysis is based on the predicted community composition of natural forests, using pre-dictions for 43 individual tree species. It provides a generalization of the patterns ofpredicted natural forest pattern for New Zealand (Leathwick 2001).
Biotic domains follow the ‘predict first, classify later’ approach to vegetation clas-sification, and avoid many of the problems of traditional vegetation maps (Overtonet al. 2000). They are based on rigorous spatial extrapolations from objective pointmeasurements, while traditional vegetation classifications are based on non-repeat-able spatial predictions of subjective forest classes. Biotic domains are fully scalable.The full realization of the classification is the dendrogram of similarity betweengroups (extending to the individual pixels). Furthermore, species abundances areallowed to vary independently in this classification. Overall, the properties of thisclassification are much more consistent with the general properties of ecologicalcommunity composition.

2112
Figure 8. The biotic domains approach to ecosystem classification. Biotic domains follow the ‘predictfirst, classify later’ approach to vegetation classification, and avoid many of the problems of traditionalvegetation maps. Individual species predictions from GRASP can be classified in different ways and atdifferent numbers of groups, resulting in flexible, scalable classifications.
Synthesis
While the vision described here may seem almost common sense, examples of co-ordinated pyramids of research and indicators informing conservation decisions arerare. The usual situation is one of disorganized and disparate data that cannot be usedin a coordinated fashion, and of few methods for integrating upwards and guidingdecision-making. When generalizations of ecosystem patterns do exist, they are gen-erally subjective and not based on any underlying data. If indicators exist, there isoften little or no mechanism for using them in a coordinated fashion.
Information pyramids provide a framework for organizing conservation scienceand the underlying research and information needs. The advantages of explicitly op-erating within information pyramids are numerous, including: (1) management de-cisions focused onto using indicators and other information explicitly derived frommonitoring measurements, (2) missing components of the pyramid are more easilyidentified, resulting in increased efficiency of gathering data and generating indica-tors, (3) research efforts are focused on understanding important relationships. Infor-mation pyramids draw upon advances in quantitative ecosystem depiction to providethe basis for informed ecosystem management.

2113
Figure 9. Tree domains for New Zealand. Individual predictions of natural tree distributions were inte-grated in a biotic domains classification. Names of the groups were defined post hoc to describe the meanpredicted composition in the group.
The example pyramid illustrates a number of properties of the information pyra-mids. The integration and generalization of data and knowledge upwards are shownin all examples, from base data, such as climate stations or vegetation plots, to climatesurfaces or predicted species distributions or environmental domains, to estimation of

2114
distinctiveness or importance of sites, and then to optimal sets of conservation pro-jects. Base data and derived layers are useful on a range of different generalizations.Climate surfaces for instance, can be used for predicting species distributions or soilcharacteristics, or for inclusion in environmental domains. Environmental domainsare useful for the MCA process, the indicators programme, and a broad range of otherapplications. Quantitative and explicit methods are used throughout for integrationand generalization, allowing the methods and results to be verified and repeated withupdated information, or for different scenarios.
The challenges to the construction of information pyramids are many. Tech-nical and computational barriers remain, and are just recently being overcomethrough rapid advances in computing power. The science needed to underpin theintegration methods is following, with many quantitative and statistical issues re-maining. While the cross-disciplinary and integrative nature of the triangles is oneof its strengths, it also poses one of its greatest challenges. Many competitive andterritorial barriers exist both within and between institutions regarding data andresearch and management activities. While one of the advantages of the pyramidis that missing pieces of data can be identified, it is often not clear what the bestway is to get lower levels of the pyramid responsive to higher levels. Despite theinformation needs being defined, there may not be a means to actually get thatdata produced. The lack of the appropriate data remains the largest barrier to usingthese approaches.
Although this paper focuses on biodiversity issues, the information pyramid isvery general and can be applied to a wide variety of other situations. Integrated eco-system management must consider the biodiversity values of the landscape, the poten-tial for human production activities, and also the environmental impacts and risks ofthese activities. Much of the same biophysical information, such as soils and climate,underlies all these activities, as do the same methods of integration and generaliza-tion. Processes such as MCA can be combined with systems such as environmentalaccounting to assess the societal costs and benefits of various patterns of land use.Overall, information pyramids provide a vision that applies to producing and usingthe entire range of environmental and social indicators.
Acknowledgements
The work described here has had important contribution from many people, includingGary Barker, Kirsty Johnston, Gareth Wilson, Bruce Warburton and Dan Rutledge.We wish to thank Bill Lee for comments on the manuscript and M. Anne Austin forcareful editing and Rochelle Holland for revisions. New Zealand’s Foundation of Re-search, Science, and Technology provided funding under Contract C09642. The Mini-stry for the Environment funded the development of LENZ under the EnvironmentalPerformance Indicators Programme.

2115
References
Belbin L. 1993. Environmental representativeness: regional partitioning and reserve selection. BiologicalConservation 66: 223–230.
Burley J. 1998. Joining the revolution: a strategy for the standardization integration and dissemination ofbiodiversity information – as a prospective model for the management of other kinds of environmentalinformation. Manaaki Whenua – Landcare Research, Lincoln, New Zealand.
Cawsey E.M., Austin M.P. and Baker B.L. 2002. Regional vegetation mapping in Australia: a case studyin the practical use of statistical modelling. Biodiversity and Conservation 11: 2239–2274 (this issue).
Christensen N.L., Bartuska A.M., Brown J.H., Carpenter S., D’Antonio C, Francis R., Franklin J.F., Mac-Mahon J.A., Noss R.F., Parsons D.J., Peterson C.H., Turner M.G. and Woodmansee R.G. 1996. The re-port of the Ecological Society of America Committee on the scientific basis for ecosystem management.Ecological Applications 6: 665–691.
Clough P., Barnett J. and Gale S. 1998. The marginal value of conservation. Report for The Treasury andDepartment of Conservation by New Zealand Institute of Economic Research (Inc.), Wellington, NewZealand.
Clout C. and Ericksen K. 2000. Anatomy of a disastrous success: the brushtail possum as an invasive spe-cies. In: Montague T.L. (ed.), The Bushtail Possum: Biology, Impact and Management of an IntroducedMarsupial. Manaaki Whenua Press, Lincoln, New Zealand, pp. 1–9.
Cullen R. 1995. Output measurement for evaluation of ecosystem protection programmes. University ofStirling, Ecological Economics Discussion Paper 95/6.
Cullen R. 1999. Biodiversity protection: measurement of output. Proceedings of AARES Conference 20–22 January 1999, Christchurch, New Zealand.
Davis F.W., Stoms D.M. and Andelman S. 1999. Systematic reserve selection in the USA: an examplefrom the Columbia Plateau ecoregion. Parks 9: 31–41.
Faith D.P. and Walker P.A. 1996. Environmental diversity: on the best possible use of surrogate data forassessing the relative biodiversity of sets of areas. Biodiversity and Conservation 5: 399–415.
Ferrier S., Watson G., Pearce J. and Drielsma M. 2002a. Extended statistical approaches to modellingspatial pattern in biodiversity in northeast New South Wales. I. Species-level modelling. Biodiversityand Conservation 11: 2275–2307 (this issue).
Ferrier S., Drielsma M., Manion G. and Watson G. 2002b. Extended statistical approaches to modellingspatial pattern in biodiversity in northeast New South Wales. II. Community-level modelling. Biodiver-sity and Conservation 11: 2309–2338 (this issue).
Fitzsimmons A.K. 1999. Defending Illusions: Federal Protection of Ecosystems. Rowman and LittlefieldPublishers, Lanham, Maryland.
Franklin J. 1995. Predictive vegetation mapping: geographical modelling of biospatial patterns in relationto environmental gradients. Progress in Physical Geography 19: 474–499.
Gowdy J.M. 1997. The value of biodiversity: markets, society and ecosystems. Land Economics 73:25–41.
Hargrove W.W. and Hoffman F.M. 2000. An analytical assessment tool for predicting changes in a speciesdistribution, map following changes in environmental conditions. Proceedings of the Fourth Interna-tional Conference on Integrating GIS and Environmental Modeling (GIS/EM4): Problems, Prospectsand Research Needs. Banff, Alberta, Canada.
Hargrove W.W., Hoffman F.M. and Sterling T. 2001. The do-it-yourself supercomputer. Scientific Ameri-can 265: 72–79.
Hartley P. 1997. Conservation Strategies for New Zealand. The Business Round Table, Wellington, NewZealand.
Leathwick J.R. 1998. Are New Zealand’s Nothofagus species in equilibrium with their environment? Jour-nal of Vegetation Science 9: 719–732.
Leathwick J.R. 2001. New Zealand’s potential forest pattern as predicted from current species-environmentrelationships. New Zealand Journal of Botany 39: 447–464.
Leathwick J.R. 2002. Intra-generic competition among Nothofagus in New Zealand’s primary indigenousforests. Biodiversity and Conservation 11: 2177–2187 (this issue).
2116
Leathwick J.R. and Austin M.P. 2001. Competitive interactions between tree species in New Zealand’s oldgrowth indigenous forests. Ecology 82: 2560–2573.
Leathwick J.R. and Stephens R.T.T. 1998. Climate surfaces for New Zealand. Contract ReportLC9798/126, Landcare Research, Hamilton, New Zealand.
Leathwick J.R. and Whitehead D. 2001. Soil and atmospheric water deficits, and the distributions of NewZealand’s indigenous tree species. Functional Ecology 15: 233–242.
Leathwick J.R., Overton J.McC., Emmett D., McLeod M. and Lynn I.H. 2001. Environmental domainsfor the Canterbury and Waikato Regions: a case study in the definition of spatial classifications forbiodiversity management in New Zealand. Environmental Performance Indicators, Technical Paper No.68 Biodiversity. Ministry for the Environment, Wellington, New Zealand.
Lehmann A., Leathwick J.R. and Overton J.Mc.C. 2002. Assessing New Zealand fern diversity from spatialpredictions of species assemblages. Biodiversity and Conservation 11: 2217–2238 (this issue).
Lehmann A., Overton J.McC. and Leathwick J.R. 2002. GRASP: generalized regression analysis and spa-tial prediction. Ecological Modelling 157: 187–205.
Mackey B.G., Nix H.A., Hutchinson M.F., McMahon J.P. and Fleming P.M. 1988. Assessing represen-tativeness of places for conservation reservation and heritage listing. Environmental Management 12:501–514.
Margules C.R. and Pressey R.L. 2000. Systematic conservation planning. Nature 405: 243–253.McHarg I.L. 1969. Design with Nature. Natural History Press, Garden City, New York.McKenzie N.J. and Ryan P.J. 1999. Spatial prediction of soil properties using environmental correlation.
Geoderma 89: 67–94.Metric A. and Weitzman M.L. 1998. Conflicts and choices in biodiversity preservation. Journal of Eco-
nomic Perspectives 12: 21–34.Ministry for the Environment 1997. Environmental Performance Indicators: Proposals for Air, Freshwater
and Land. Ministry for the Environment, Wellington, New Zealand.Newsome P.F.J. 1992. New Zealand Resource Inventory. ARC/INFO data manual. DSIR.Noss R.F., Strittholt J.R., Vance-Borland K., Carroll C. and Frost P.A. 1999. A conservation plan for the
Klamath–Siskiyou ecoregion. Natural Areas Journal 19: 392–411.O’Neill R.O. 2001. Is it time to bury the ecosystems concept? (with full military honors, of course!).
Ecology 82: 3275–3284.Overton J.McC., Leathwick J.R. and Lehmann A. 2000. Predict first, classify later – a new paradigm of
spatial classification for environmental management: a revolution in the mapping of vegetation, soil,land cover, and other environmental information. In: 4th International Conference on Integrating GISand Environmental Modelling (GIS/EM4), Banff, Alberta, Canada.
Overton J.McC. and Leathwick J.R. 2001. Measuring environmental distinctiveness. Science for Conser-vation 174: 20 pp.
Peters D. and Thackway R. 1998. A new biogeographic regionalisation for Tasmania. Tasmanian Parksand Wildlife Service GIS section.
Shepherd J. and Dymond J. 2000. BRDF Correction of Vegetation in Avhrr Imagery. Remote Sensing ofEnvironment 74: 397–408.
Shepherd J. and Dymond J. (in press) Correcting satellite imagery for the variance of reflectance andillumination with Topography. International Journal of Remote Sensing.
Stephens R.T.T. 1999. Measuring conservation achievement. In: Blaschke P.M. and Green K. (eds), Biodi-versity Now! Joint Societies Conference, Wellington, 1997. Selected papers. Department of Conserva-tion, Wellington, New Zealand, pp. 13–39.
Stephens R.T.T., Brown D.J. and Thornley N.J. 2002. Measuring conservation achievement: concepts andtheir application over the Twizel area. Science for Conservation 200: 114 pp.
Warburton B. 2000. Monitoring possum populations. In: Montague T.L. (ed.), The Bushtail Possum: Bi-ology, Impact and Management of an Introduced Marsupial. Manaaki Whenua Press, Lincoln, NewZealand, pp. 132–142.
Weitzman M.L. 1998. The Noah’s ark problem. Econometrica 66: 1279–1298.Wiser S.K., Bellingham P.J. and Burrows L.E. 2001. Managing biodiversity information: development of
New Zealand’s National vegetation Survey databank. New Zealand Journal of Ecology 25: 1–17.