General Mechanisms for Inverted Biomass Pyramids in Ecosystems
25
arXiv:0811.3657v1 [q-bio.PE] 22 Nov 2008 General Mechanisms for Inverted Biomass Pyramids in Ecosystems Hao Wang a,* , Wendy Morrison b , Abhinav Singh c , Howard (Howie) Weiss a a School of Mathematics, Georgia Institute of Technology, Atlanta, GA 30332, USA b School of Biology, Georgia Institute of Technology, Atlanta, GA 30332, USA c School of Physics, Georgia Institute of Technology, Atlanta, GA 30332, USA Abstract Although the existence of robust inverted biomass pyramids seem paradoxical, they have been observed in planktonic communities, and more recently, in pristine coral reefs. Understanding the underlying mechanisms which produce inverted biomass pyramids provides new ecological insights, and for coral reefs, may help mitigate or restore damaged reefs. We present three classes of predator-prey models which elucidate mechanisms that generate robust inverted biomass pyramids. The first class of models exploits well-mixing of predators and prey, the second class has a refuge (with explicit size) for the prey to hide, and the third class incorporates the immigration of prey. Our models indicate that inverted biomass pyramids occur when the prey growth rate, prey carrying capacity, biomass conversion efficiency, the predator life span, or the immigration rate of prey fish is sufficiently large. In the second class, we discuss three hypotheses on how refuge size can impact the amount of prey available to predators. By explicitly incorporating a refuge size, these can more realistically model predator-prey interactions than refuge models with implicit Preprint submitted to Elsevier 22 November 2008
-
Upload
independent -
Category
Documents
-
view
1 -
download
0
Transcript of General Mechanisms for Inverted Biomass Pyramids in Ecosystems
arX
iv:0
811.
3657
v1 [
q-bi
o.PE
] 2
2 N
ov 2
008
General Mechanisms for Inverted Biomass
Pyramids in Ecosystems
Hao Wang a,∗, Wendy Morrison b, Abhinav Singh c,
Howard (Howie) Weiss a
aSchool of Mathematics, Georgia Institute of Technology, Atlanta, GA 30332, USA
bSchool of Biology, Georgia Institute of Technology, Atlanta, GA 30332, USA
cSchool of Physics, Georgia Institute of Technology, Atlanta, GA 30332, USA
Abstract
Although the existence of robust inverted biomass pyramids seem paradoxical, they
have been observed in planktonic communities, and more recently, in pristine coral
reefs. Understanding the underlying mechanisms which produce inverted biomass
pyramids provides new ecological insights, and for coral reefs, may help mitigate
or restore damaged reefs. We present three classes of predator-prey models which
elucidate mechanisms that generate robust inverted biomass pyramids. The first
class of models exploits well-mixing of predators and prey, the second class has a
refuge (with explicit size) for the prey to hide, and the third class incorporates the
immigration of prey. Our models indicate that inverted biomass pyramids occur
when the prey growth rate, prey carrying capacity, biomass conversion efficiency,
the predator life span, or the immigration rate of prey fish is sufficiently large. In the
second class, we discuss three hypotheses on how refuge size can impact the amount
of prey available to predators. By explicitly incorporating a refuge size, these can
more realistically model predator-prey interactions than refuge models with implicit
Preprint submitted to Elsevier 22 November 2008
refuge size.
Key words: inverted biomass pyramids, coral reef, predator-prey model, refuge,
immigration.
1 Introduction
The biomass structure is a fundamental characteristic of ecosystems (Odum,
1971). The shape of biomass pyramids encodes not only the structure of com-
munities, but also integrates functional characteristics of communities, such
as patterns of energy flow, transfer efficiency, and turnover of different compo-
nents of the food web (Odum, 1971; Reichle, 1981; Del Giorgia et al., 1999).
A trophic pyramid is a graphical representation showing the energy or biomass
at each trophic level in a closed ecosystem. Energy pyramids illustrate the
production or turnover of biomass and the energy flow through the food chain,
while biomass pyramids illustrate the biomass or abundance of organisms at
each trophic level. When energy is transferred to the next higher trophic level,
typically only 10% is used to build new biomass (Pauly and Christensen, 1995)
and the remainder is consumed by metabolic processes. Hence, in a closed
ecosystem, each trophic level of the energy pyramid is roughly 10% smaller
than the level below it, and thus inverted energy pyramids cannot exist.
A standard biomass pyramid is found in terrestrial ecosystems such as grass-
land ecosystems or forest ecosystems, where a larger biomass of producers sup-
∗ Corresponding author: Telephone: 1-404-894-3949; Fax: 1-404-894-4409;
Email address: [email protected].
2

port a smaller biomass of consumers (Dash, 2001). Although they appear to be
rare, inverted biomass pyramids exist in nature. They have been observed in
planktonic ecosystems (Del Giorgia et al., 1999), where phytoplankton main-
tain a high production rate and are consumed by longer lived zooplankton
and fish. Recently, inverted biomass pyramids have also been observed in pris-
tine coral reefs in the Southern Line Islands and Northwest Hawaiian Islands
(Friedlander and Martini, 2002; Sandin et al., 2008), where the benthic coral
cover provides refuge for prey fish (Figure 1). At least one prominent researcher
suspects that an apparent inverted biomass pyramid exists on a reef off the
North Carolina coast, and he speculates this is due to significant immigration
of prey fish into the reef (M. Hay, pers. comm., 2008). In this manuscript, we
introduce three classes of predator-prey models to study how inverted biomass
pyramids can arise via these three distinct mechanisms.
2 Well-Mixed Mechanism
Most predator-prey models implicitly assume that predators and prey are
well mixed, and many incorporate a Holling-type predation response (Holling,
1959a,b). Although the “well mixed” assumption is usually far from being
satisfied when prey are animals, it appears to be a reasonable assumption
for phytoplankton-herbivore interactions in aquatic ecosystems, and we first
discuss the existence of inverted biomass pyramids in this setting.
We begin by considering the standard Lotka-Volterra predator-prey model
with mass-action predation response (Lotka, 1925; Volterra, 1926), described
by the system
3
dx
dt= ax − bxy, (1)
dy
dt= cbxy − dy, (2)
where
x : prey biomass density, y : predator biomass density,
a : prey growth rate, b : per capita predation rate,
c : biomass conversion efficiency, d : predator death rate.
The interior equilibrium point (x∗, y∗) =
(
d
cb,a
b
)
is neutrally stable (a center),
at which the predator:prey biomass ratio is
y∗
x∗
=ac
d. (3)
The ratio is greater than 1 if and only if ac > d. We obtain our first result in
biomass pyramid theory:
Result 1 For the model (1)-(2), if ac > d (the prey growth rate multiplied by
the conversion efficiency is greater than the predator death rate), the biomass
pyramid is inverted; otherwise, the biomass pyramid is standard.
Result 1 provides a rigorous foundation for the belief expressed by some biolo-
gists that inverted biomass pyramids result from the high growth rate of prey
and low death rate of predators (Del Giorgia et al., 1999). Result 1 further
suggests that the biomass conversion efficiency can significantly influence the
shape of the biomass pyramid.
We now incorporate a general well-mixed predation response into the predator-
prey model, which is described by the system
4
dx
dt= ax − f(x)y, (4)
dy
dt= cf(x)y − dy, (5)
where
f(x) : predation response function.
At the interior equilibrium point (x, y), the ratio y/x = a/f(x), where f(x) =
d/c. Thus the predator:prey biomass ratio is
y
x=
ac
d. (6)
This interior equilibrium point is attracting when the system (4)-(5) is eventu-
ally bounded and has no stable limit cycles. The system is eventually bounded
if there is a bounded region where all solutions eventually enter into and stay
in. Result 1 remains valid for this extended model whenever the interior equi-
librium point is stable. Actually, whenever the prey grow exponentially, Result
1 is robust to variations in refuge-dependent predation patterns.
We now incorporate logistic prey growth into the preceding predator-prey
model, which is described by the system
dx
dt= ax
(
1 −x
K
)
− f(x)y, (7)
dy
dt= cf(x)y − dy, (8)
where
K : prey carrying capacity,
and the predation functional response f(x) is a strictly increasing function.
Any reasonable predation function must satisfy this monotone condition, which
5
all three Holling-type functions do. The monotonicity implies that the inverse
function f−1 exists (Inverse function in Wikipedia, internet), and thus the x-
component of the interior equilibrium point can be solved from cf(x) = d as
x = f−1(d/c). The biomass ratio at the interior equilibrium point (x, y) can
be written as
y
x=
ac
d
[
1 −f−1(d/c)
K
]
. (9)
This formula modifies the biomass ratio in model (1)-(2) and model (4)-(5) by
the factor 1−f−1(d/c)
K. This interior equilibrium point is attracting when the
predator-extinction equilibrium (K, 0) is unstable and there exist no stable
limit cycles. For instance, if f(x) =bx
η + xis a Holling type II functional
response, then the interior equilibrium point is globally attracting whenever
ηd
b − d< K <
η(b + d)
b − d. Under the stability condition, we obtain the new
result:
Result 2 For the model (7)-(8), ifac
d
[
1 −f−1(d/c)
K
]
> 1, the biomass pyra-
mid is inverted; otherwise, the biomass pyramid is standard.
The new condition for the inverted biomass pyramid depends additionally on
the prey carrying capacity K. We see that the predator:prey biomass ratio is
an increasing function of the prey growth rate (a), the conversion efficiency
(c), and the prey carrying capacity (K), while the biomass ratio is a decreasing
function of the predator death rate (d). As a conclusion, we have the following
result:
Result 3 The increase of prey growth rate, the conversion efficiency, the prey
carrying capacity, or the predator life span facilitates the occurrence of inverted
biomass pyramids.
6
Result 3 is robust whenever the predation function is an increasing function
of prey density. We will see in the next section that the same relations hold
for refuge-dependent predation functions.
3 Refuge Mechanism
Seeking refuge from predators is a general behavior of most animals in nat-
ural ecosystems (Cowlishaw, 1997; Sih, 1997) where the refuge habitats can
include burrows (Clarke et al., 1993), trees (Dill and Houtman, 1989), cliff
faces (Berger, 1991), thick vegetation (Cassini, 1991), or rock talus (Holmes,
1991). Some ecologists even believe that refuges provide a general mecha-
nism for interpreting ecological patterns (Hawkins et al., 1993), specifically the
extent of predator-prey interactions (Huffaker, 1958; Legrand and Barbosa,
2003; Rossi et al., 2006). Aquatic ecologists have recently observed inverted
biomass pyramids in pristine coral reefs, where the benthic coral cover pro-
vides the refuge for prey fish (Friedlander and Martini, 2002; Sandin et al.,
2008).
In Singh et al. (2008), we needed to introduce a refuge with explicit size.
Although the Holling type III functional response offers the prey a refuge at
low population density (Murdoch and Oaten, 1975), the refuge is only implicit,
and one can not specify the size of the refuge. Some authors include an explicit
refuge size into their models by multiplying the prey density by 1−r, where 0 ≤
r < 1 is a proxy of the refuge size (McNair, 1986; Sih, 1987; Hausrath, 1994;
Kar, 2005; Huang et al., 2006; Kar, 2006; Ko and Ryu, 2006). This procedure
has two fundamental drawbacks. The first is that for these modified predation
response functions, the switch point, where the predation rate starts to quickly
7

increase, critically depends on both the proxy refuge size and the proxy half-
saturation constant (independent of the refuge size). The latter dependence is
undesirable. For our model, it is important that the switch point be a function
of only the refuge size. The second drawback is that, unlike the Holling-type
functional responses which are mechanistically derived from basic biological
principles, we have seen no derivation in the literature and we are unable to
mechanistically derive these functional forms from basic biological principles
to incorporate a refuge.
We now introduce a family of predator-prey models with explicit refuge size,
which we call refuge-modulated predator-prey (RPP) models. An im-
portant feature of this family is that the switch points for the functional
responses depend solely on the size of the refuge. We group these models into
three classes, RPP Types I, II, and III, depending on the mechanistic depen-
dence of prey availability for predators on the refuge size. All previous refuge
models assume the mechanism behind our Type I class.
3.1 Refuge-Modulated Predator-Prey Models
In our recent work (Singh et al., 2008), we modeled the biomass of fish in coral
reefs. Small fish find refuge in coral reefs by hiding in holes where large preda-
tors cannot enter (Hixon and Beets, 1993). This field observation motivated us
to incorporate a refuge into the standard predator-prey model, where the coral
reef refuge size influences the pattern of predation response. We introduced
the following family of models:
8
dx
dt= ax
(
1 −x
K
)
− f(x, r)y, (10)
dy
dt= cf(x, r)y − dy, (11)
where
r : refuge size,
f(x, r) : refuge-dependent predation response,
and f(x, r) is a strictly increasing function of prey biomass density x. For each
fixed r, the function fr(x) = f(r, x) is strictly increasing in x, and thus its
inverse f−1r exists. We solve for the x-component of the interior equilibrium
point from cf(x, r)− d = 0 as x = f−1r (d/c). The biomass ratio at the interior
equilibrium point (x, y):
y
x=
ac
d
[
1 −f−1
r (d/c)
K
]
. (12)
For each fixed refuge size r, the relationships between the biomass ratio and
other parameters are the same as in the well-mixed predator-prey models.
This provides the robustness of Result 3. Additional hypotheses are needed
to determine the relationship between the biomass ratio and the refuge size.
Although the field observation in Hixon and Beets (1993) suggests that prey
fish hide in refuge places from predators, it is still unclear how the refuge
regulates the prey availability for predators. In the next subsection, we propose
three hypotheses all motivated from biological considerations.
9
3.2 Hypotheses on Refuge Effects
We model three biological hypotheses on how prey availability for predators
depends on the refuge size (Figure 2). We call these models RPP (Refuge-
modulated Predator-Prey) Type I, Type II, and RPP Type III. All predation
functions depend on the maximum predation rate b, the refuge size r, the
minimum predation rate regulator β, and the slope regulator ξ.
RPP Type I: This model assumes that the prey availability for predators
decreases as the refgue size increases. Prey hide in the refuge, but trade-
off protection (i.e. increased survival) for a decrease in growth or reproduc-
tion due to lower quality resources within the refuge (Persson and Eklov,
1995; Gonzalez-Olivares and Ramos-Jiliberto, 2003; Reaney, 2007). Thus an
increase in the size of the refuge protects more of the prey and results in less
prey available to the predator. Thus, the prey availability for predators is the
prey density outside the refuge and f(x, r) is a decreasing function of refuge
size r. We choose the following representive function that can be fitted to
empirical data:
f(x, r) =b
1 + βe−ξ(x−r). (13)
The variable x is the total prey density (per unit area) and thus the prey
availability for predators is x − r.
The parameter β captures the minimum predation rate as follows: when no
prey and no refuge are available, the predation rate isb
1 + β, which is the
minimum predation rate. We should choose β sufficiently large such that
1
1 + β<< 1, since it is reasonable to have a small predation rate when no
prey are available. The parameter ξ determines the slope of the predation
10
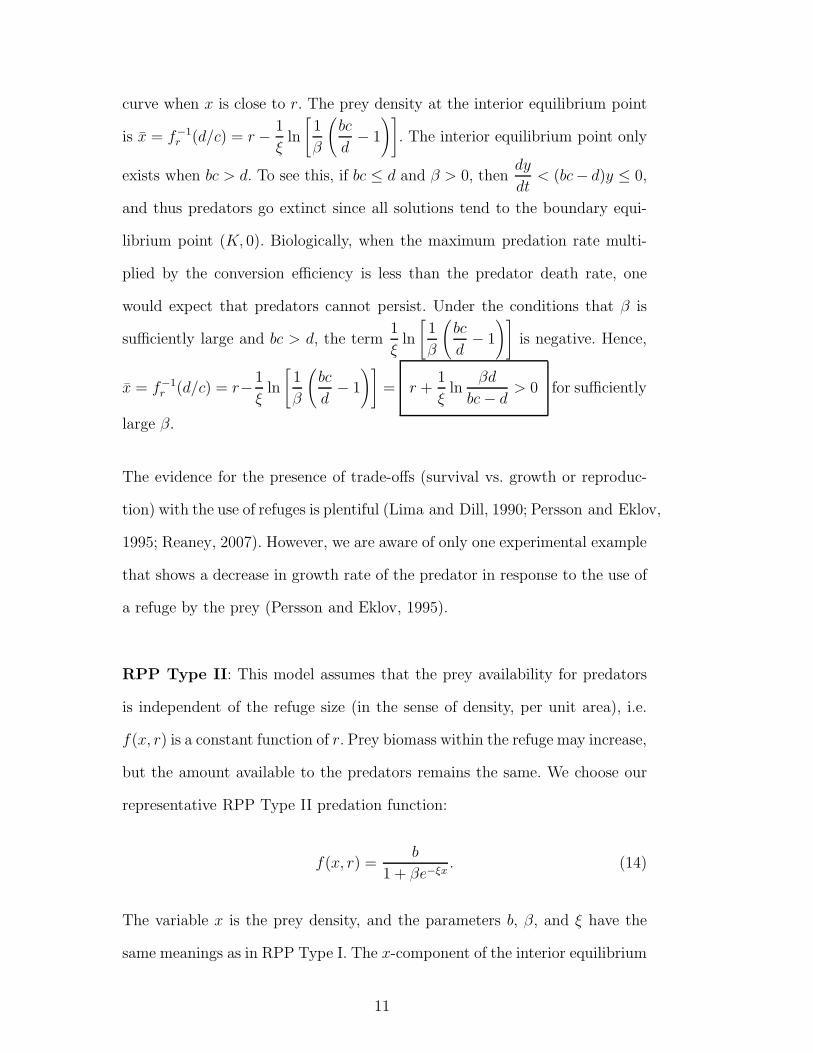
curve when x is close to r. The prey density at the interior equilibrium point
is x = f−1r (d/c) = r −
1
ξln
[
1
β
(
bc
d− 1
)]
. The interior equilibrium point only
exists when bc > d. To see this, if bc ≤ d and β > 0, thendy
dt< (bc− d)y ≤ 0,
and thus predators go extinct since all solutions tend to the boundary equi-
librium point (K, 0). Biologically, when the maximum predation rate multi-
plied by the conversion efficiency is less than the predator death rate, one
would expect that predators cannot persist. Under the conditions that β is
sufficiently large and bc > d, the term1
ξln
[
1
β
(
bc
d− 1
)]
is negative. Hence,
x = f−1r (d/c) = r−
1
ξln
[
1
β
(
bc
d− 1
)]
= r +1
ξln
βd
bc − d> 0 for sufficiently
large β.
The evidence for the presence of trade-offs (survival vs. growth or reproduc-
tion) with the use of refuges is plentiful (Lima and Dill, 1990; Persson and Eklov,
1995; Reaney, 2007). However, we are aware of only one experimental example
that shows a decrease in growth rate of the predator in response to the use of
a refuge by the prey (Persson and Eklov, 1995).
RPP Type II: This model assumes that the prey availability for predators
is independent of the refuge size (in the sense of density, per unit area), i.e.
f(x, r) is a constant function of r. Prey biomass within the refuge may increase,
but the amount available to the predators remains the same. We choose our
representative RPP Type II predation function:
f(x, r) =b
1 + βe−ξx. (14)
The variable x is the prey density, and the parameters b, β, and ξ have the
same meanings as in RPP Type I. The x-component of the interior equilibrium
11
point is x = f−1r (d/c) =
1
ξln
βd
bc − d> 0 for bc > d and sufficiently large β.
We know of no biological examples of RPP Type II. However, we believe
that RPP Types I and III are the extremes of a continuum, suggesting that
condition can exist where the prey available to predators is not affected by
the area within the refuge.
RPP Type III: This model assumes that the prey availability for predators
increases as the refuge size increases. This may occur when resources such as
food and mating sites are available within the refuge, allowing the prey to
increase in numbers until some limiting resource forces a number of the prey
to emigrate from the refuge in search for new habitat. The number of immi-
grants should be positively related to refuge size. Thus, f(x, r) is an increasing
function of r. Our representative RPP Type III predation function looks quite
similar to our Type I predation function, but the parameters require different
interpretations:
f(x, r) =b
1 + βe−ξ(x+r). (15)
The variable x is the exterior (out of refuge) prey density (per unit area), and
x + r is the total prey density (per unit area). This model assumes that the
refuge stores a substantial amount of prey and constantly provides food to
predators, and thus the prey availability is the total prey density (per unit
area), i.e. x + r.
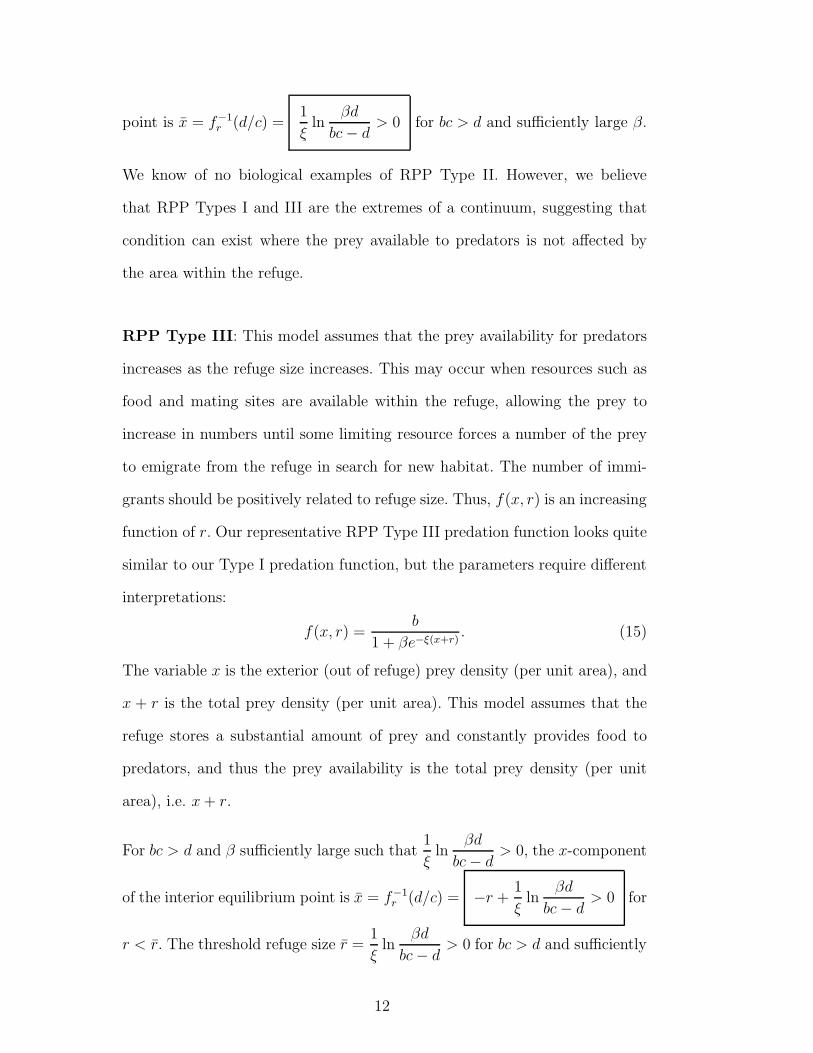
For bc > d and β sufficiently large such that1
ξln
βd
bc − d> 0, the x-component
of the interior equilibrium point is x = f−1r (d/c) = −r +
1
ξln
βd
bc − d> 0 for
r < r. The threshold refuge size r =1
ξln
βd
bc − d> 0 for bc > d and sufficiently
12
large β. Because the refuge size in the model is measured by density (per unit
area), it is biologically reasonable to assume a threshold maximum value for
the refuge size.
The Elk Refuge in Yellowstone National Park is one example of a RPP Type
III. The Elk Refuge provides protection (and food) to the elk during winter in-
creasing survival to 97% (Lubow and Smith, 2004). The surviving elk migrate
out of the refuge and provide a source of food for predators in Yellowstone
National Park and surrounding areas (Smith, pers. comm., 2008). Our RPP
Type III is also analogous to spillover and larval export hypotheses in marine
protected areas (MPA) (Ward et al., 2001). MPAs are areas of the ocean that
are protected from fishing (i.e. man is the predator). The fish within these
MPAs are hypothesized to increase the number of fish (prey) available out-
side the protected area through two mechanisms. The first, spillover, occurs
when adult fish become crowded within the MPA and immigrate into the sur-
rounding area. The second occurs when the fish within the MPA increase their
reproductive output, increasing the number of recruits available to surround-
ing areas (larval export). While support for the spillover hypothesis is present
(though limited spatially), it is much harder to prove the benefits of larval
export (Ward et al., 2001).
We now make a couple of general remarks about the RPP-type functional
responses. We always assume that f(0, r) > 0 and small, i.e. for each fixed r,
the predation rate at zero prey density is positive, but minimal. For Holling-
type responses, f(0, r) = 0. We believe our choice is reasonable, since when the
main prey species are no longer available, predators may temporarily switch
to alternative lower quality food sources (Warburton et al., 1998). Thus, one
13
must choose β sufficiently large such that1
1 + β<< 1. If we fit this predation
function to empirical data, ξ may need to be chosen large, depending on the
size of β. When the prey availability is high, f(x, r) is close to the maximum
predation rate b. Mathematically, the refuge size r solely determines the shift
of the predation curve.
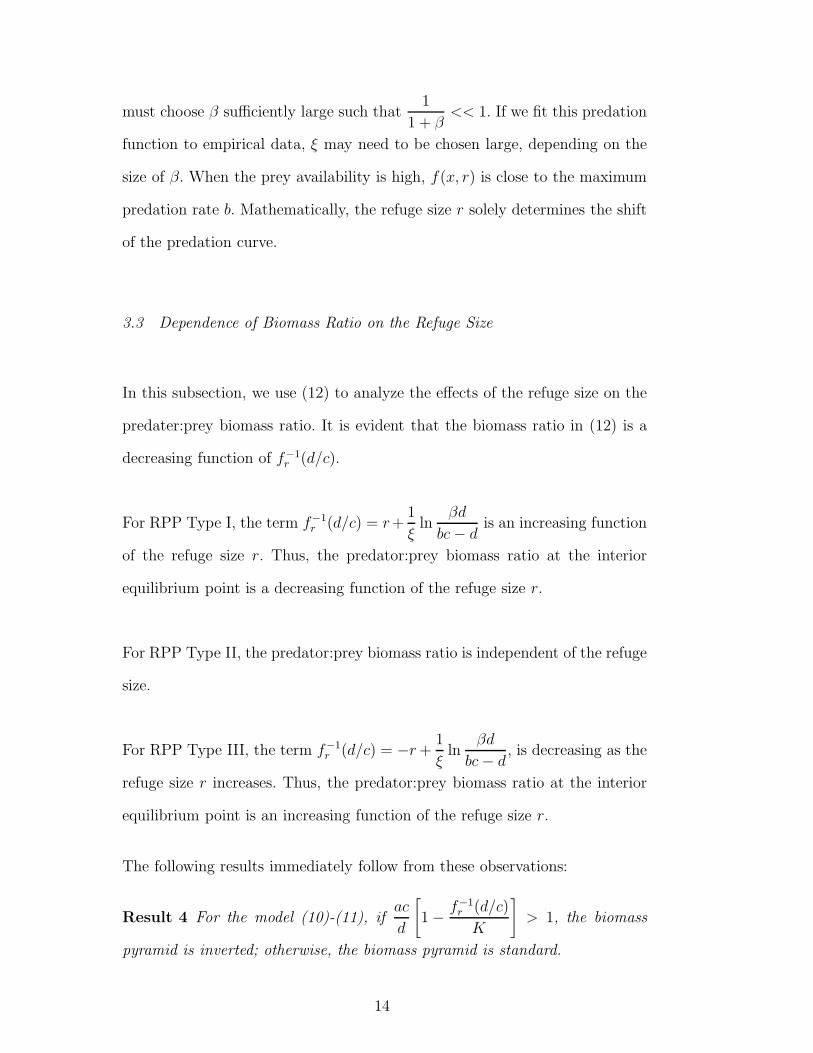
3.3 Dependence of Biomass Ratio on the Refuge Size
In this subsection, we use (12) to analyze the effects of the refuge size on the
predater:prey biomass ratio. It is evident that the biomass ratio in (12) is a
decreasing function of f−1r (d/c).
For RPP Type I, the term f−1r (d/c) = r+
1
ξln
βd
bc − dis an increasing function
of the refuge size r. Thus, the predator:prey biomass ratio at the interior
equilibrium point is a decreasing function of the refuge size r.
For RPP Type II, the predator:prey biomass ratio is independent of the refuge
size.
For RPP Type III, the term f−1r (d/c) = −r +
1
ξln
βd
bc − d, is decreasing as the
refuge size r increases. Thus, the predator:prey biomass ratio at the interior
equilibrium point is an increasing function of the refuge size r.
The following results immediately follow from these observations:
Result 4 For the model (10)-(11), ifac
d
[
1 −f−1
r (d/c)
K
]
> 1, the biomass
pyramid is inverted; otherwise, the biomass pyramid is standard.
14
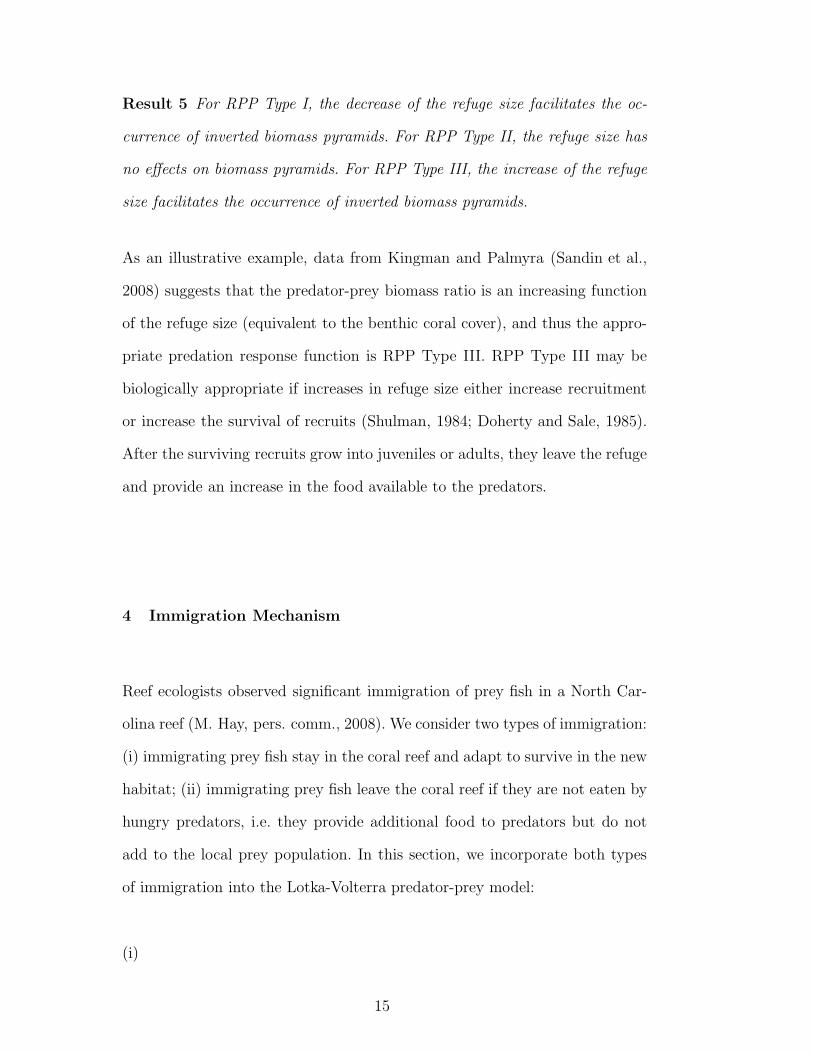
Result 5 For RPP Type I, the decrease of the refuge size facilitates the oc-
currence of inverted biomass pyramids. For RPP Type II, the refuge size has
no effects on biomass pyramids. For RPP Type III, the increase of the refuge
size facilitates the occurrence of inverted biomass pyramids.
As an illustrative example, data from Kingman and Palmyra (Sandin et al.,
2008) suggests that the predator-prey biomass ratio is an increasing function
of the refuge size (equivalent to the benthic coral cover), and thus the appro-
priate predation response function is RPP Type III. RPP Type III may be
biologically appropriate if increases in refuge size either increase recruitment
or increase the survival of recruits (Shulman, 1984; Doherty and Sale, 1985).
After the surviving recruits grow into juveniles or adults, they leave the refuge
and provide an increase in the food available to the predators.
4 Immigration Mechanism
Reef ecologists observed significant immigration of prey fish in a North Car-
olina reef (M. Hay, pers. comm., 2008). We consider two types of immigration:
(i) immigrating prey fish stay in the coral reef and adapt to survive in the new
habitat; (ii) immigrating prey fish leave the coral reef if they are not eaten by
hungry predators, i.e. they provide additional food to predators but do not
add to the local prey population. In this section, we incorporate both types
of immigration into the Lotka-Volterra predator-prey model:
(i)
15
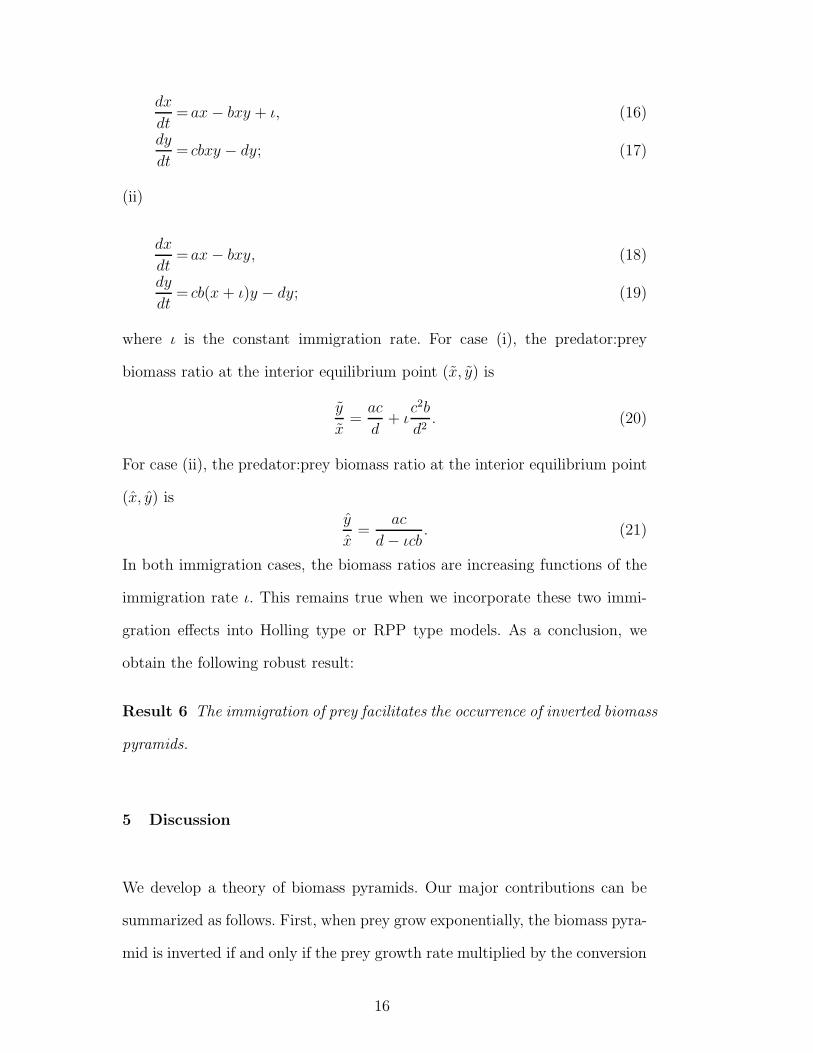
dx
dt= ax − bxy + ι, (16)
dy
dt= cbxy − dy; (17)
(ii)
dx
dt= ax − bxy, (18)
dy
dt= cb(x + ι)y − dy; (19)
where ι is the constant immigration rate. For case (i), the predator:prey
biomass ratio at the interior equilibrium point (x, y) is
y
x=
ac
d+ ι
c2b
d2. (20)
For case (ii), the predator:prey biomass ratio at the interior equilibrium point
(x, y) is
y
x=
ac
d − ιcb. (21)
In both immigration cases, the biomass ratios are increasing functions of the
immigration rate ι. This remains true when we incorporate these two immi-
gration effects into Holling type or RPP type models. As a conclusion, we
obtain the following robust result:
Result 6 The immigration of prey facilitates the occurrence of inverted biomass
pyramids.
5 Discussion
We develop a theory of biomass pyramids. Our major contributions can be
summarized as follows. First, when prey grow exponentially, the biomass pyra-
mid is inverted if and only if the prey growth rate multiplied by the conversion
16

efficiency is greater than the predator death rate. Second, the increase of prey
growth rate, the conversion efficiency, the prey carrying capacity, or the preda-
tor life span robustly facilitates the development of inverted biomass pyramids.
Third, based on plausible biological hypotheses, we introduce a new series of
predator-prey models (called RPP type models) which explicitly and naturally
incorporates a prey refuge. Fourth, depending on the nature of an ecosystem,
the occurrence of inverted biomass pyramids can be positively or negatively
related to, or independent of, the refuge size. Fifth, the immigration of prey
facilitates the occurrence of inverted biomass pyramids.
We propose three new refuge-dependent predation functions with explicit
refuge size, which capture the three essential biological hypotheses on the
refuge (Figure 2). The three can be combined into one function
f(x, r) =b
1 + βe−ξ[x−(2−i)r], (22)
where i is the index of RPP type, that is, i = 1 for RPP Type I, i = 2 for
RPP Type II, and i = 3 for RPP Type III.
Some, but not all, of the prey that hide in the refuge are available to predators.
Thus, there should be a discount rate for the refuge size in the predation
function of either RPP Type I (assume no prey in the refuge are available) or
RPP Type III (assume all prey in the refuge are available). We incorporate
this discount rate into the general refuge-dependent predation function:
f(x, r) =b
1 + βe−ξ(x+ηr), (23)
where −1 ≤ η ≤ 1. This model is close to RPP Type I if −1 ≤ η < 0, close to
RPP Type II if η = 0, and close to RPP Type III if 0 < η ≤ 1. We call η as
the refuge-effect parameter.
17
What characteristics of the prey might lead to RPP Type I versus RPP Type
III? As stated above, RPP Type I will occur when the use of the refuge
results in strong trade-offs between survival and reproduction or growth. Most
previous theoretical models assume that the hypothesis for RPP Type I is
the case; however, we hypothesize that RPP Type III will occur when the
prey have the ability to reproduce within the refuge and/or when the refuge
increases prey survival through a population bottleneck.
Prey animals seek refuges to hide from predators and thus it is sometimes
necessary to explicitly incorporate the refuge mechanism into the predation
function of predator-prey models. The family of RPP-type models explicitly
incorporating the refuge size can more accurately describe realistic predator-
prey interactions in ecosystems. We believe that RPP-type models provide
the next generation of models for predator-prey interactions. In the coming
Winter, we plan to test these models via microcosm experiments.
Acknowledgement
We would like to thank Mark Hay for insightful comments and helpful dis-
cussions, Alan Friedlander and Bruce Smith for their useful feedback and
references to our questions. We also would like to thank Lin Jiang for his sug-
gestions and allowing us to perform refuge experiments in his lab in the near
future.
18
References
Berger, J., 1991. Pregnancy incentives, predation constraints and habitat
shifts: experimental and field evidence for wild bighorn sheep. Anim. Behav.
41, 61-77.
Cassini, M.H., 1991. Foraging under predation risk in the wild guinea pig
Cavia aperea. Oikos 62, 20-24.
Clarke, M.F., da Silva, K.B., Lair, H., Pocklington, R., Kramer, D.L., and
Mclaughlin, R.L., 1993. Site familiarity affects escape behaviour of the east-
ern chipmunk, Tamius striatus. Oikos 66, 533-537.
Cowlishaw, G., 1997. Refuge use and predation risk in a desert baboon pop-
ulation. Anim. Behav. 54, 241-253.
Dash, M.C., 2001. Fundamentals of Ecology. Tata McGraw-Hill.
Del Giorgia, P.A., Cole, J.J., Caraco, N.F., and Peters, R.H., 1999. Linking
Planktonic Biomass and Metabolism to Net Gas Fluxes in Northern Tem-
perate Lakes. Ecology 80, 1422-1431.
Dill, L.M. and Houtman, R., 1989. The influence of distance to refuge on
flight-initiation distance in the grey squirrel (Sciurus carolinensis). Can. J.
Zool. 67, 232-235.
Doherty, P.J. and Sale, P.F., 1985. Predation on juvenile coral reef fishes: and
exclusion experiment. Coral Reefs 4, 225-234.
A.M. Friedlander and Martini E.E., 2002. Contrasts in density, size, and
biomass of reef fishes between the northewestern and the main Hawaiian
islands: the effects of fishing down apex predators. Marine Ecology Progress
Series 230, 253-264.
Gonzalez-Olivares, E. and Ramos-Jiliberto, R., 2003. Dynamic consequences
of prey refuges in a simple system: more prey, fewer predators and enhanced
19
stability. Ecological modeling 166, 135-146.
Hausrath, A., 1994. Analysis of a model predator-prey system with refuges. J.
Math. Anal. Appl. 181, 531-545.
Hawkins, B.A., Thomas, M.B., and Hochberg, M.E., 1993. Refuge theory and
biological control. Science 262, 1429-1432.
M. Hay, 2008. Personal Communication.
Hixon, M.A. and Beets, J.P., 1993. Predation, Prey Refuges, and the Structure
of Coral-Reef Fish Assemblages. Ecological Monographs 63, 77-101.
Holling, C.S., 1959a. The components of predation as revealed by a study of
small mammal predation of the European Pine Sawfly. Canadian Entomol-
ogist 91, 293-320.
Holling, C.S., 1959b. Some characteristics of simple types of predation and
parasitism. Canadian Entomologist 91, 385-398.
Holmes, W.G., 1991. Predator risk affects foraging piks: observational and
experimental evidence. Anim. Behav. 42, 111-119.
Huang, Y., Chen, F., and Zhong, L., 2006. Stability analysis of a prey-predator
model with holling type III response function incorporating a prey refuge.
Applied Mathematics and Computation 182, 672-683.
Huffaker, C.B., 1958. Experimental studies on predation: dispersion factors
and predator-prey oscillations. Hilgardia 27, 343-383.
Kar, T.K., 2005. Stability analysis of a prey-predator model incorporation a
prey refuge. Commun. Nonlinear Sci. Numer. Simul. 10, 681-691.
Kar, T.K., 2006. Modelling and analysis of a harvested prey-predator system
incorporating a prey refuge. Journal of Computational and Applied Math-
ematics 185, 19-33.
Ko, W. and Ryu, K., 2006. Qualitative analysis of a predator-prey model
with Holling type II functional response incorporating a prey refuge. J.
20
Differential Equations 231, 534-550.
Legrand, A. and Barbosa, P., 2003. Plant morphological complexity impacts
foraging efficiency of adult Coccinella septempunctata L. (Coleoptera: Coc-
cinellidae). Environ. Entomol. 32, 1219-1226.
Lima, S.L. and Dill, L.M., 1990. Behavioral decisions made under the risk
of predation: a review and prospectus. Canadian Journal of Zoology 68,
619-640.
Lotka, A.J., 1925. Elements of Physical Biology. Williams and Wilkins, Balti-
more.
Lubow, B.C. and Smith, B.L., 2004. Population dynamics of the Jackson elk
herd. Journal of Wildlife management 68, 810-829.
MacHutchon, A.G. and Harestad, A.S., 1990. Vigilance behaviour and use
of rocks by Columbian ground squirrels. Canadian Journal of Zoology 68,
1428-1433.
McNair, J., 1986. The effects of refuges on predator-prey interactions: A re-
consideration. Theoret. Population Biol. 29, 38-63.
Murdoch, W.W. and Oaten, A., 1975. Predation and Popluation Stability.
Advances in Ecological Research 9, 1-131.
Odum, E.P., 1971. Fundamentals of Ecology. W.B Saunders, Philadelphia,
Pennsylvania, USA.
Pauly, D. and Christensen, V., 1995. Primary production required to sustain
global fisheries. Nature 374, 255-257.
Persson, L. and Eklov, P., 1995. Prey refuges affecting interactions between
piscivorous perch and juvenile perch and roach. Ecology 76, 70-81.
Reaney, L.T., 2007. Foraging and mating opportunities influence refuge use in
the fiddler crab, Uca mjoebergi. Animal Behaviour 73, 711-716.
Reichle, D.E., 1981. Dynamic Properties of Ecosystems. Cambridge University
21
Press, New York, USA.
Rossi, M.N., Reigada, C., and Godoy, W.A.C., 2006. The role of habitat
heterogeneity for the functional response of the spider Nesticodes rufipes
(Araneae: Theridiidae) to houseflies. Appl. Entomol. Zool. 41, 419-427.
Sandin, S.A., Smith, J.E., DeMartini, E.E., Dinsdale, E.A., Donner, S.D.,
Fiedlander, A.M., et al., 2008. Baselines and Degradation of Coral Reefs in
the Northern Line Islands. PLoS ONE 3, e1548.
Shulman, M.J., 1984. Resource limitation and recruitment patterns in a coral
reef fish assemblage. J. Exp. Mar. Biol. Ecol. 74, 85-109.
Sih, A., 1987. Prey refuges and predator-prey stability. Theoret. Population
Biol. 31, 1-12.
Sih, A., 1997. To hide or not to hide? Refuge use in a fluctuating environment.
Trends in Ecology & Evolution 12, 375-376.
Singh, A., Wang, H., Morrison, W., and Weiss, H., 2008. Fish Biomass Struc-
ture at Pristine Coral Reefs and Degradation by Fishing. Manuscript.
Smith, B., 2008. Personal Communication.
Volterra, V., 1926. Variazioni e fluttuazioni del numero d’individui in specie
animali conviventi. Mem. R. Accad. Naz. dei Lincei. Ser. VI, Vol. 2.
Warburton, K., Retif, S., and Hume, D., 1998. Generalists as sequential spe-
cialists: diets and prey switching in juvenile silver perch. Environmental
Biology of fishes 51, 445-454.
Ward T.J., Heinemann, D., and Evans, N., 2001. The Role of Marine Re-
serves as Fisheries Management Tools: a review of concepts, evidence and
international experience. Bureau of Rural Sciences, Canberra, Australia.
White, J.A. and Andow, D.A., 2007. Foraging for intermittently refuged prey:
theory and field observations of a parasitoid. Journal of Animal Ecology 76,
1244-1254.
22

Wikipedia. Link: http://en.wikipedia.org/wiki/Inverse function.
23
Figure 1. This figure is reproduced from Sandin et al. (2008). At Kingman
coral reef, it was recently discovered that apex predators constitute 85% of
the total fish biomass. The biomass pyramid is clearly inverted in this pristine
coral reef. This is in sharp contrast to most reefs where the prey biomass
substantially dominates the total fish biomass.
Figure 2. Three biological hypotheses for the effects of the refuge size on the
prey availability for predators. Type I: the prey availability for predators is
a decreasing function of the refuge size, because the refuge provides places
for prey to hide from predators. Type II: the prey availability for predators is
independent of the refuge size in the sense of density (per unit area), because
in a number of cases prey biomass is proportional to the refuge size. Type III:
the prey availability for predators is an increasing function of the refuge size,
because the refuge both provides prey to predators and stores prey for latter
consumption by predators.
24
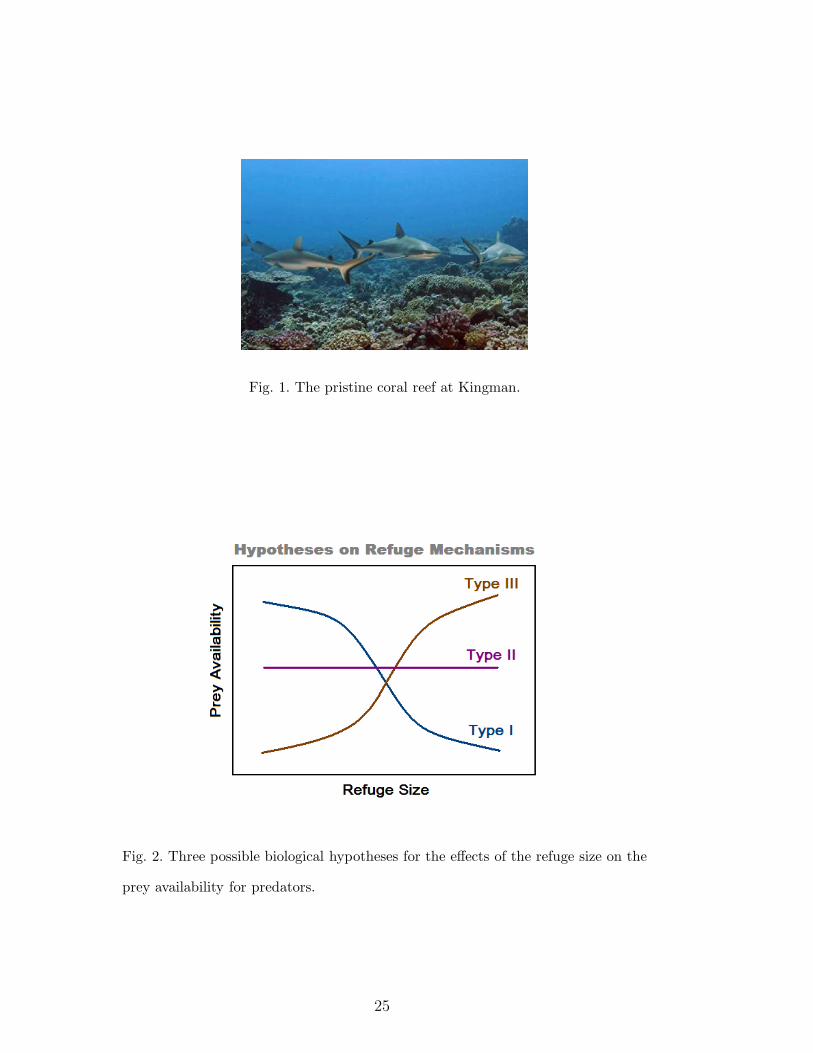
Fig. 1. The pristine coral reef at Kingman.
Fig. 2. Three possible biological hypotheses for the effects of the refuge size on the
prey availability for predators.
25