Assessment of Groundwater Movement at Giza Pyramids ...
12
4711 Journal of Applied Sciences Research, 9(8): 4711-4722, 2013 ISSN 1819-544X This is a refereed journal and all articles are professionally screened and reviewed ORIGINAL ARTICLES Corresponding Author: Salwa F. Elbeih, Engineering Applications and Water Division, National Authority for Remote Se- nsing and Space Sciences (N ARSS),Egypt E-mail: [email protected] Assessment of Groundwater Movement at Giza Pyramids Plateau Using GIS Techniques 1 Nahed El-Arabi, 1 Akram Fekri, 2 El-Sayed A. Zaghloul, 2 Salwa F. Elbeih and 3 Andreas laake 1 Research Institute for Groundwater (RIGW), National Water Research Center, El-Kanater El-Khairiya, Egypt 2 Engineering Applications and Water Division, National Authority for Remote Sensing and Space Sciences (NARSS), Egypt 3 Geophysical Advisor, Schlumberger WesternGeco, Egypt ABSTRACT Giza Pyramids Plateau is recognized as one of the most unique archaeological sites in the world and it was recently declared as one of the most iconic travel spots on the planet. During the last three decades, the rise of groundwater levels in Greater Cairo has become a severe problem threatening the existing and recent buildings. The main aim of this research is to assess the groundwater movement at Giza Pyramids Plateau through an integrated groundwater and GIS platform. The main inputs include groundwater quality, groundwater level and depth to groundwater. GIS is used as a tool to assess the groundwater flow pattern in the buffer zones based on the UNESCO classification. It could be observed that all areas witnessing a rise in the water level are located within the transition zone around the pyramids. Sphinx area has several recharge sources due to leakage of sewage water, seepage from canals and vertical percolation from irrigation water especially that it is located in a relatively low area. Key words: Giza Pyramids Plateau – Groundwater – GIS - UNESCO Buffer zones Introduction The rising of groundwater levels represents a threat to the Egyptian Heritage of the Giza Pyramids Plateau (GPP) particularly since the area surrounding the plateau has been developed into the suburb of Greater Cairo. Understanding the passage ways of rain water on the plateau, groundwater and sewage from both the Nile flood plain and Abo Roash area play an important role in the conservation strategy for the unique artifacts of the Giza Plateau (Fig. 1) During the last three decades, the rise of groundwater levels in Greater Cairo has become a severe problem threatening the existing and recent buildings. This problem became more severe generally at old historic districts and monument areas with higher population density. The water rising problems are attributed to undesirable quantitative changes in groundwater levels, resulting from the rapid increase of population, associated with different negative human activities and the consequent extensive urban and sub-urban expansion. In addition, water rising problems are attributed to construction of some spontaneous houses at the southeastern margins of the northeastern foot and parts of the eastern foot of the GPP. Merging of geological and hydrogeological maps aims at preserving the Egyptian heritage of the GPP. Fig. 1: Threats to GPP from different sources of water flow
-
Upload
khangminh22 -
Category
Documents
-
view
1 -
download
0
Transcript of Assessment of Groundwater Movement at Giza Pyramids ...

4711 Journal of Applied Sciences Research, 9(8): 4711-4722, 2013 ISSN 1819-544X This is a refereed journal and all articles are professionally screened and reviewed ORIGINAL ARTICLES
Corresponding Author: Salwa F. Elbeih, Engineering Applications and Water Division, National Authority for Remote Se-nsing and Space Sciences (N ARSS),Egypt
E-mail: [email protected]
Assessment of Groundwater Movement at Giza Pyramids Plateau Using GIS Techniques 1Nahed El-Arabi, 1Akram Fekri, 2El-Sayed A. Zaghloul, 2Salwa F. Elbeih and 3Andreas laake 1Research Institute for Groundwater (RIGW), National Water Research Center, El-Kanater El-Khairiya, Egypt 2Engineering Applications and Water Division, National Authority for Remote Sensing and Space Sciences (NARSS), Egypt 3 Geophysical Advisor, Schlumberger WesternGeco, Egypt ABSTRACT
Giza Pyramids Plateau is recognized as one of the most unique archaeological sites in the world and it was recently declared as one of the most iconic travel spots on the planet. During the last three decades, the rise of groundwater levels in Greater Cairo has become a severe problem threatening the existing and recent buildings. The main aim of this research is to assess the groundwater movement at Giza Pyramids Plateau through an integrated groundwater and GIS platform. The main inputs include groundwater quality, groundwater level and depth to groundwater. GIS is used as a tool to assess the groundwater flow pattern in the buffer zones based on the UNESCO classification. It could be observed that all areas witnessing a rise in the water level are located within the transition zone around the pyramids. Sphinx area has several recharge sources due to leakage of sewage water, seepage from canals and vertical percolation from irrigation water especially that it is located in a relatively low area. Key words: Giza Pyramids Plateau – Groundwater – GIS - UNESCO Buffer zones
Introduction
The rising of groundwater levels represents a threat to the Egyptian Heritage of the Giza Pyramids Plateau (GPP) particularly since the area surrounding the plateau has been developed into the suburb of Greater Cairo. Understanding the passage ways of rain water on the plateau, groundwater and sewage from both the Nile flood plain and Abo Roash area play an important role in the conservation strategy for the unique artifacts of the Giza Plateau (Fig. 1)
During the last three decades, the rise of groundwater levels in Greater Cairo has become a severe problem threatening the existing and recent buildings. This problem became more severe generally at old historic districts and monument areas with higher population density. The water rising problems are attributed to undesirable quantitative changes in groundwater levels, resulting from the rapid increase of population, associated with different negative human activities and the consequent extensive urban and sub-urban expansion. In addition, water rising problems are attributed to construction of some spontaneous houses at the southeastern margins of the northeastern foot and parts of the eastern foot of the GPP. Merging of geological and hydrogeological maps aims at preserving the Egyptian heritage of the GPP.
Fig. 1: Threats to GPP from different sources of water flow
4712 J. Appl. Sci. Res., 9(8): 4711-4722, 2013
The study was a part of a collaboration work between Schlumberger WesternGeco Egypt and National Authority for Remote Sensing and Space Sciences Egypt (NARSS) and the Research Institute for Groundwater (GIGW) (NARSS/WesternGeco 2012). The main aim of this research is to assess the groundwater movement at Giza Pyramids Plateau through an integrated groundwater and GIS platform. The main inputs include groundwater quality, groundwater level and depth to groundwater in addition to some historical data. GIS is used to assess the groundwater flow pattern within the core and buffer zones based on UNESCO classification.
Study Area Description:
The pyramids plateau represents a part of the eastern border of the Western Desert and occupies a part of
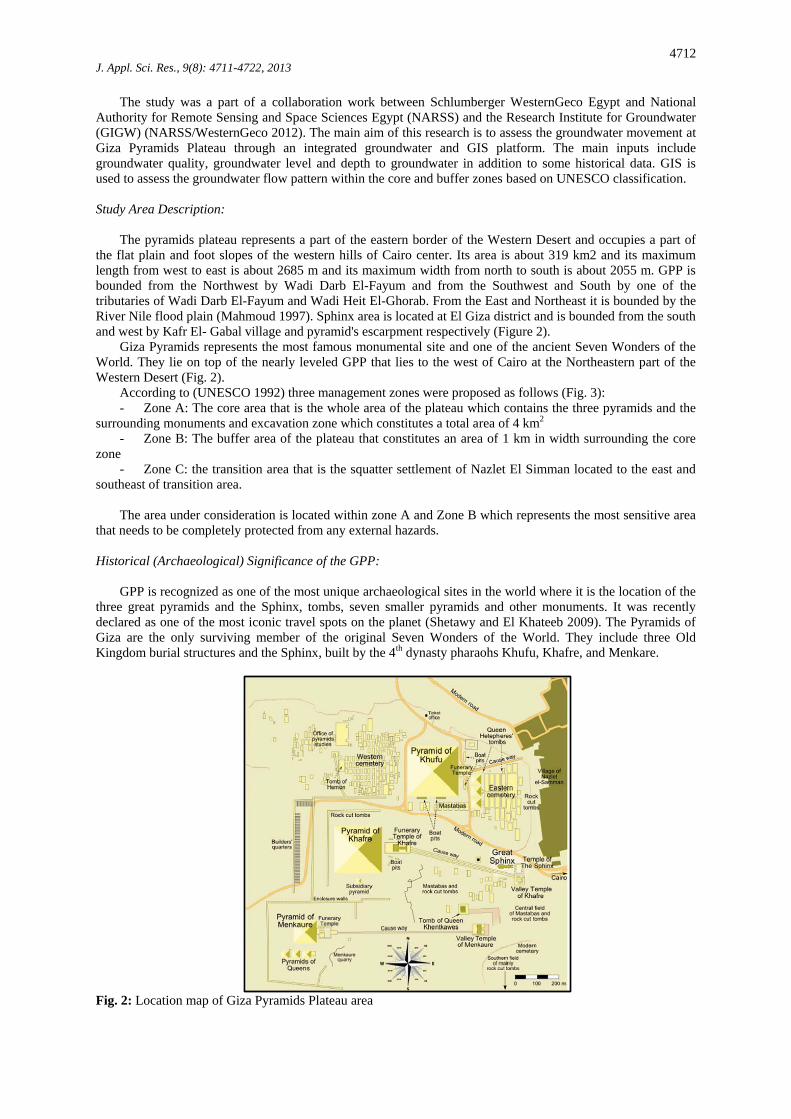
the flat plain and foot slopes of the western hills of Cairo center. Its area is about 319 km2 and its maximum length from west to east is about 2685 m and its maximum width from north to south is about 2055 m. GPP is bounded from the Northwest by Wadi Darb El-Fayum and from the Southwest and South by one of the tributaries of Wadi Darb El-Fayum and Wadi Heit El-Ghorab. From the East and Northeast it is bounded by the River Nile flood plain (Mahmoud 1997). Sphinx area is located at El Giza district and is bounded from the south and west by Kafr El- Gabal village and pyramid's escarpment respectively (Figure 2).
Giza Pyramids represents the most famous monumental site and one of the ancient Seven Wonders of the World. They lie on top of the nearly leveled GPP that lies to the west of Cairo at the Northeastern part of the Western Desert (Fig. 2).
According to (UNESCO 1992) three management zones were proposed as follows (Fig. 3): - Zone A: The core area that is the whole area of the plateau which contains the three pyramids and the
surrounding monuments and excavation zone which constitutes a total area of 4 km2 - Zone B: The buffer area of the plateau that constitutes an area of 1 km in width surrounding the core
zone - Zone C: the transition area that is the squatter settlement of Nazlet El Simman located to the east and
southeast of transition area. The area under consideration is located within zone A and Zone B which represents the most sensitive area
that needs to be completely protected from any external hazards.
Historical (Archaeological) Significance of the GPP: GPP is recognized as one of the most unique archaeological sites in the world where it is the location of the
three great pyramids and the Sphinx, tombs, seven smaller pyramids and other monuments. It was recently declared as one of the most iconic travel spots on the planet (Shetawy and El Khateeb 2009). The Pyramids of Giza are the only surviving member of the original Seven Wonders of the World. They include three Old Kingdom burial structures and the Sphinx, built by the 4th dynasty pharaohs Khufu, Khafre, and Menkare.
Fig. 2: Location map of Giza Pyramids Plateau area

4713 J. Appl. Sci. Res., 9(8): 4711-4722, 2013 Physiographic features:
The climatic conditions in the study area are characterized to be semi-arid; warm in winter with little rain
and hot to dry in summer. The climate is characterized by the following parameters (Table 1). Concerning the rainfall precipitation, the mean annual rainfall does not exceed 25 mm and it is generally scarce over most of the year and occurs occasionally in the form of sudden and short showers associated with wind. The annual mean relative humidity is about 46 % with a maximum of 70 % in November and a minimum of 30 % in May. The maximum annual temperature is 28°C while the minimum annual temperature is 13.8°C. For wind, the prevailing wind blows is from northwest and seasonal wind known as (Khamaseen) blows from the Southwest and South. The wind speed varies from 7 to 14 km/h.
Fig. 3: Management zones of the pyramids plateau. (Adopted from UNESCO management plan 1992) Table 1: The climatic conditions of GPP
Station Max. Ann. Temp °C Min. Ann. Temp. °C Ann. Rainfall mm / year
R. Humidity %
Giza 28.5 13.8 22.2 46 Beni-Suef 37.0 5.5 7.8 49 Helwan 39 15 25 46
Stratigraphy:
Stratigraphically, the GPP is made up of the Eocene carbonate rocks. The exposed Middle Eocene rocks of
the GPP are subdivided from base to top into Mokattam, Observatory, Qurn and Wadi Garawi Formations; whereas the Upper Eocene rocks are represented by Wadi Hof Formation (Strougo 1985). Oligocene, Pliocene and Quaternary sands and gravels unconformably cover the Eocene rocks in several parts (Dowidar and Abdallah 2001).
Geomorphic Features:
Geomorphologically, the area under consideration is subdivided into four distinctive units; plateau,
escarpments and cliffs, terraces and the Nile Flood plain. The elevations of the plateau range between 20 m at the northeastern and eastern bottom and 105.8 m in the western side top summits (Mahmoud 1997). The top of the GPP is flat and varies in elevation from 60 to 106 masl whereas the elevation of the area of the pyramids

4714 J. Appl. Sci. Res., 9(8): 4711-4722, 2013 varies from 60 to 70 masl. The dip angles range between 4° and 7° for the eastern –part of the plateau near Sphinx (Dowidar and Abdallla 2001).
Structures:
The fractures of the study area exist in three main sets trending west – northwest, northwest and northeast.
The west – northwest oriented fractures are dominant in the northern, western and eastern sides of Cheops Pyramids and North of Chephrea Pyramids (Dowidar and Abdallah 2001).
Regional Groundwater flow in Greater Cairo:
Several previous studies took place that includes detailed information about the groundwater movement and
piezometric water levels for the Greater Cairo area including: RIGW 1983, Abd El Salam 1984, RIGW 1989, National Authority for Tunnels 2010. The historical regional groundwater flow in Greater Cairo show remarkable changes between 1962 and 1982 as shown in Figs. 4a and 4b .It is observed that there are remarkable changes in the groundwater level and its movement on the local scale between 1962 and 1982 which is similar to the conditions in the old and historic districts of Eastern Greater Cairo (Al Azhar, Ghamra, Ain El- Sira, Kubri El- Koba) where a local movement has been developed. This local movement is a result of groundwater rising due to leakage from the water supply, old sewage system, and from the unsewered sub-urban areas in the high altitudes since 1972. In 1972, a remarkable groundwater depression was taking place in the western fringes of Giza Governorate near Sphinx and at the same time a groundwater rise was observed in the eastern portion due to the over exploitation of groundwater from two main sources; Nadi El Remaya and El Golf Club.
Fig. 4a: Piezometric Contour Map in Greater Cairo in 1962 (adopted after RIGW, 1989 and Abdel Salam 1984)

4715 J. Appl. Sci. Res., 9(8): 4711-4722, 2013
Figs. 4b: Piezometric Contour Map in Greater Cairo in 1982 (adopted after RIGW, 1989 and Abdel Salam 1984) Materials and Methods Data Sets:
The materials used in this research are: • Geological, hydrogeological and geomorphological maps • Land use map including urban, agricultural and industrial layers • Hydrogeological map of the Nile Delta 1:500, 000 and Cairo 1: 100, 000 • Production wells within the Sphinx area (Fig. 5) • Depth to groundwater from production and piezometric wells • Chemical analysis of fifteen groundwater samples • Well locations, depth to groundwater, groundwater level and groundwater quality maps • Correlation of lithological and hydrogeological data collected from drilled wells
4716 J. Appl. Sci. Res., 9(8): 4711-4722, 2013
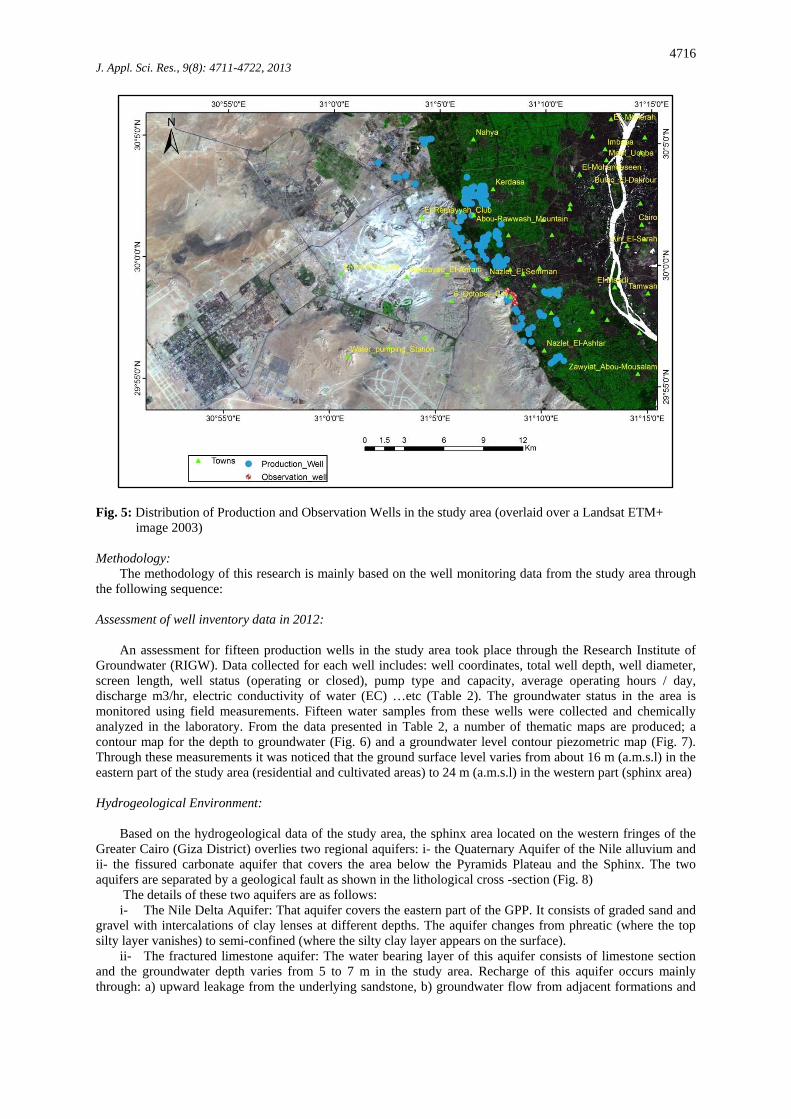
Fig. 5: Distribution of Production and Observation Wells in the study area (overlaid over a Landsat ETM+ image 2003) Methodology:
The methodology of this research is mainly based on the well monitoring data from the study area through the following sequence: Assessment of well inventory data in 2012:
An assessment for fifteen production wells in the study area took place through the Research Institute of
Groundwater (RIGW). Data collected for each well includes: well coordinates, total well depth, well diameter, screen length, well status (operating or closed), pump type and capacity, average operating hours / day, discharge m3/hr, electric conductivity of water (EC) …etc (Table 2). The groundwater status in the area is monitored using field measurements. Fifteen water samples from these wells were collected and chemically analyzed in the laboratory. From the data presented in Table 2, a number of thematic maps are produced; a contour map for the depth to groundwater (Fig. 6) and a groundwater level contour piezometric map (Fig. 7). Through these measurements it was noticed that the ground surface level varies from about 16 m (a.m.s.l) in the eastern part of the study area (residential and cultivated areas) to 24 m (a.m.s.l) in the western part (sphinx area)
Hydrogeological Environment:
Based on the hydrogeological data of the study area, the sphinx area located on the western fringes of the
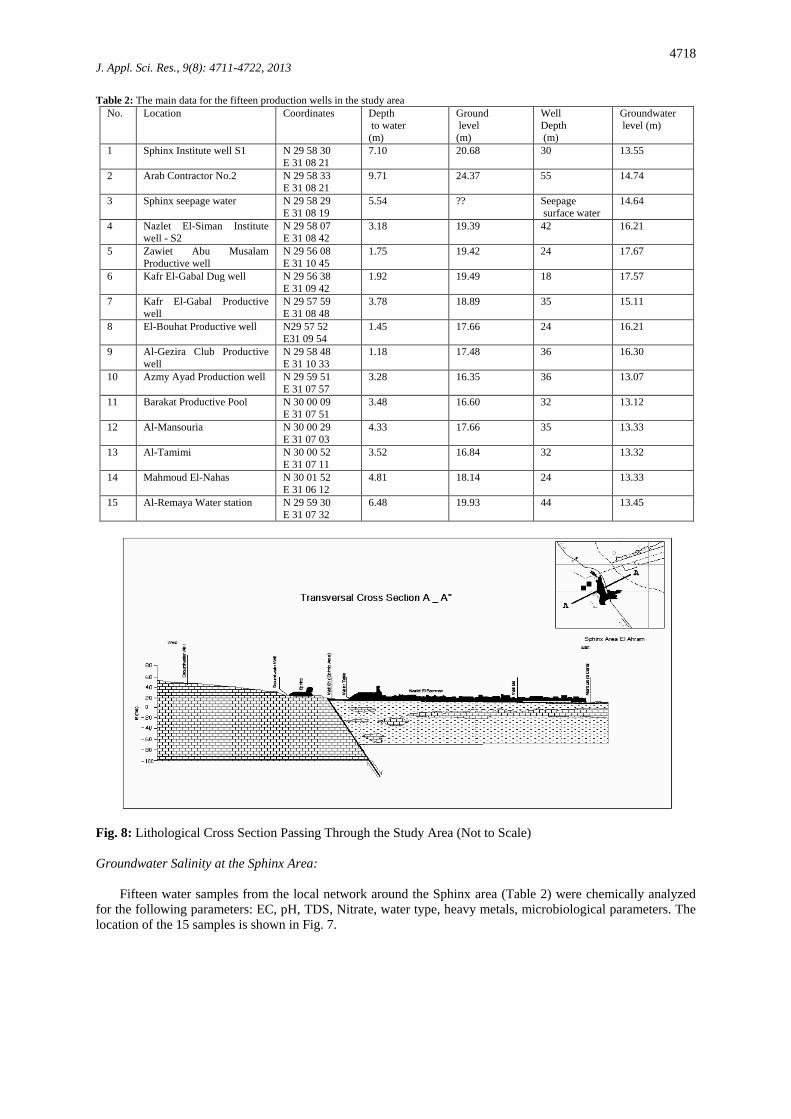
Greater Cairo (Giza District) overlies two regional aquifers: i- the Quaternary Aquifer of the Nile alluvium and ii- the fissured carbonate aquifer that covers the area below the Pyramids Plateau and the Sphinx. The two aquifers are separated by a geological fault as shown in the lithological cross -section (Fig. 8)
The details of these two aquifers are as follows: i- The Nile Delta Aquifer: That aquifer covers the eastern part of the GPP. It consists of graded sand and
gravel with intercalations of clay lenses at different depths. The aquifer changes from phreatic (where the top silty layer vanishes) to semi-confined (where the silty clay layer appears on the surface).
ii- The fractured limestone aquifer: The water bearing layer of this aquifer consists of limestone section and the groundwater depth varies from 5 to 7 m in the study area. Recharge of this aquifer occurs mainly through: a) upward leakage from the underlying sandstone, b) groundwater flow from adjacent formations and
4717 J. Appl. Sci. Res., 9(8): 4711-4722, 2013 c) infiltration from the surface (irrigation and/or rainfall). The groundwater quality of this aquifer shows large variations of salinity ranging from 1000 to 8000 ppm.
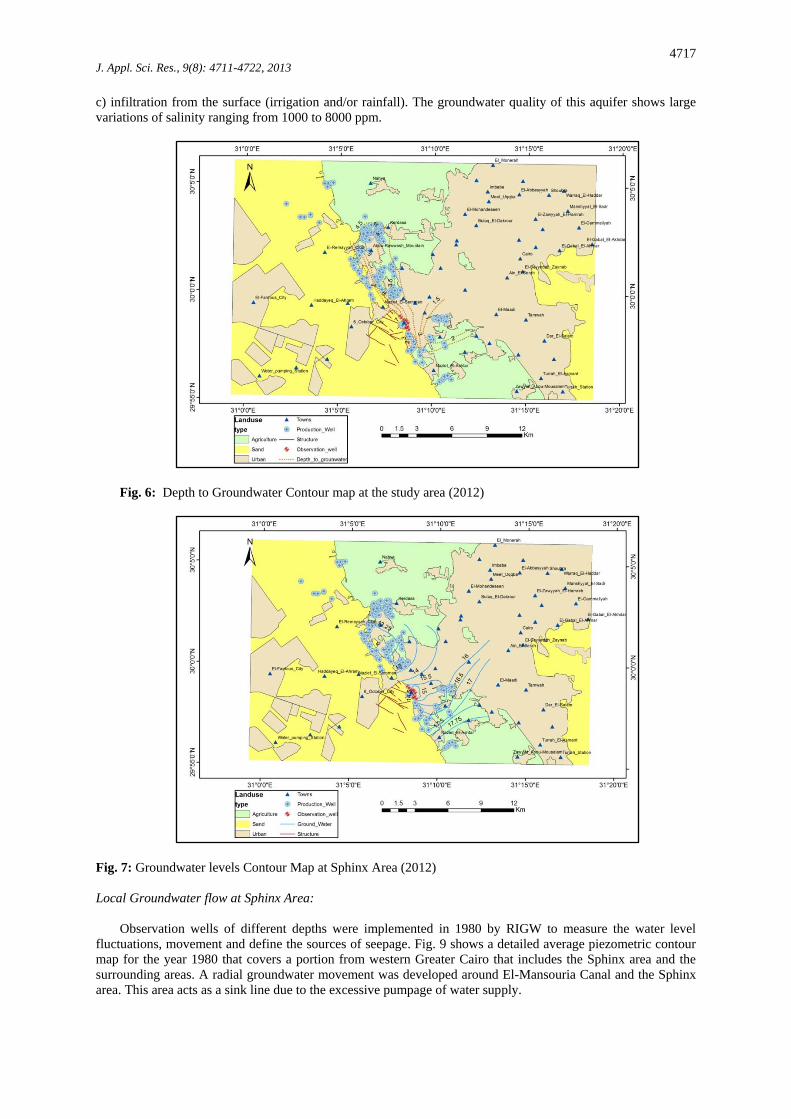
Fig. 6: Depth to Groundwater Contour map at the study area (2012)
Fig. 7: Groundwater levels Contour Map at Sphinx Area (2012) Local Groundwater flow at Sphinx Area:
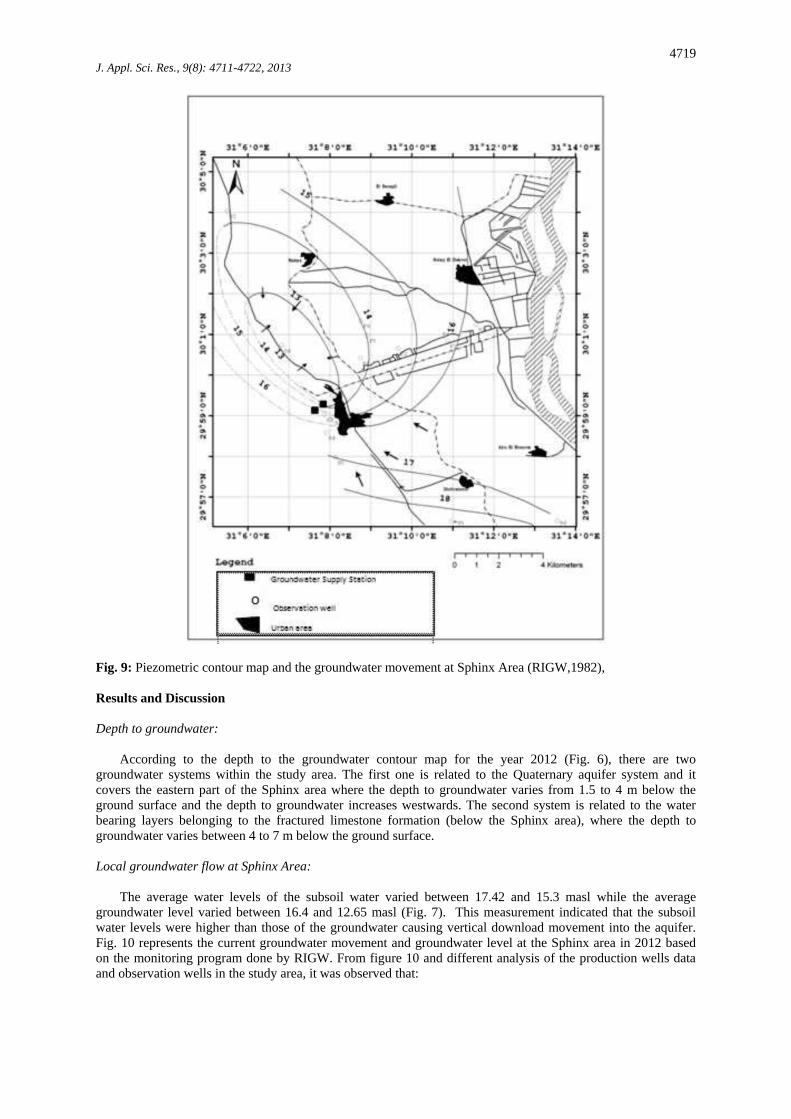
Observation wells of different depths were implemented in 1980 by RIGW to measure the water level
fluctuations, movement and define the sources of seepage. Fig. 9 shows a detailed average piezometric contour map for the year 1980 that covers a portion from western Greater Cairo that includes the Sphinx area and the surrounding areas. A radial groundwater movement was developed around El-Mansouria Canal and the Sphinx area. This area acts as a sink line due to the excessive pumpage of water supply.
4718 J. Appl. Sci. Res., 9(8): 4711-4722, 2013 Table 2: The main data for the fifteen production wells in the study area
Groundwater level (m)
Well Depth (m)
Ground level (m)
Depth to water (m)
Coordinates Location No.
13.55 30 20.68 7.10 N 29 58 30 E 31 08 21
Sphinx Institute well S1 1
14.74 55 24.37 9.71 N 29 58 33 E 31 08 21
Arab Contractor No.2 2
14.64 Seepage surface water
?? 5.54 N 29 58 29 E 31 08 19
Sphinx seepage water 3
16.21 42 19.39 3.18 N 29 58 07 E 31 08 42
Nazlet El-Siman Institute well - S2
4
17.67 24 19.42 1.75 N 29 56 08 E 31 10 45
Zawiet Abu Musalam Productive well
5
17.57 18 19.49 1.92 N 29 56 38 E 31 09 42
Kafr El-Gabal Dug well 6
15.11 35 18.89 3.78 N 29 57 59 E 31 08 48
Kafr El-Gabal Productive well
7
16.21 24 17.66 1.45 N29 57 52 E31 09 54
El-Bouhat Productive well 8
16.30 36 17.48 1.18 N 29 58 48 E 31 10 33
Al-Gezira Club Productive well
9
13.07 36 16.35 3.28 N 29 59 51 E 31 07 57
Azmy Ayad Production well 10
13.12 32 16.60 3.48 N 30 00 09 E 31 07 51
Barakat Productive Pool 11
13.33 35 17.66 4.33 N 30 00 29 E 31 07 03
Al-Mansouria 12
13.32 32 16.84 3.52 N 30 00 52 E 31 07 11
Al-Tamimi 13
13.33 24 18.14 4.81 N 30 01 52 E 31 06 12
Mahmoud El-Nahas 14
13.45 44 19.93 6.48 N 29 59 30 E 31 07 32
Al-Remaya Water station 15
Fig. 8: Lithological Cross Section Passing Through the Study Area (Not to Scale) Groundwater Salinity at the Sphinx Area:
Fifteen water samples from the local network around the Sphinx area (Table 2) were chemically analyzed
for the following parameters: EC, pH, TDS, Nitrate, water type, heavy metals, microbiological parameters. The location of the 15 samples is shown in Fig. 7.
4719 J. Appl. Sci. Res., 9(8): 4711-4722, 2013
Fig. 9: Piezometric contour map and the groundwater movement at Sphinx Area (RIGW,1982),
Results and Discussion
Depth to groundwater:
According to the depth to the groundwater contour map for the year 2012 (Fig. 6), there are two
groundwater systems within the study area. The first one is related to the Quaternary aquifer system and it covers the eastern part of the Sphinx area where the depth to groundwater varies from 1.5 to 4 m below the ground surface and the depth to groundwater increases westwards. The second system is related to the water bearing layers belonging to the fractured limestone formation (below the Sphinx area), where the depth to groundwater varies between 4 to 7 m below the ground surface. Local groundwater flow at Sphinx Area:
The average water levels of the subsoil water varied between 17.42 and 15.3 masl while the average
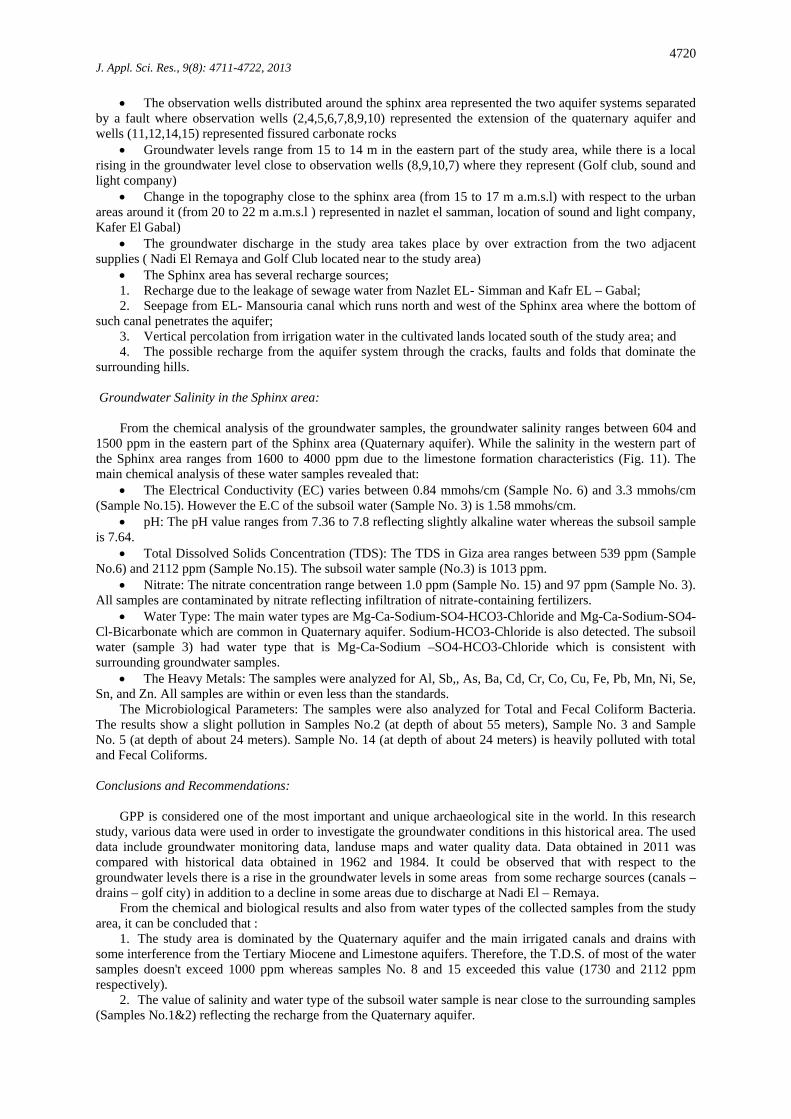
groundwater level varied between 16.4 and 12.65 masl (Fig. 7). This measurement indicated that the subsoil water levels were higher than those of the groundwater causing vertical download movement into the aquifer. Fig. 10 represents the current groundwater movement and groundwater level at the Sphinx area in 2012 based on the monitoring program done by RIGW. From figure 10 and different analysis of the production wells data and observation wells in the study area, it was observed that:
4720 J. Appl. Sci. Res., 9(8): 4711-4722, 2013
• The observation wells distributed around the sphinx area represented the two aquifer systems separated by a fault where observation wells (2,4,5,6,7,8,9,10) represented the extension of the quaternary aquifer and wells (11,12,14,15) represented fissured carbonate rocks
• Groundwater levels range from 15 to 14 m in the eastern part of the study area, while there is a local rising in the groundwater level close to observation wells (8,9,10,7) where they represent (Golf club, sound and light company)
• Change in the topography close to the sphinx area (from 15 to 17 m a.m.s.l) with respect to the urban areas around it (from 20 to 22 m a.m.s.l ) represented in nazlet el samman, location of sound and light company, Kafer El Gabal)
• The groundwater discharge in the study area takes place by over extraction from the two adjacent supplies ( Nadi El Remaya and Golf Club located near to the study area)
• The Sphinx area has several recharge sources; 1. Recharge due to the leakage of sewage water from Nazlet EL- Simman and Kafr EL – Gabal; 2. Seepage from EL- Mansouria canal which runs north and west of the Sphinx area where the bottom of
such canal penetrates the aquifer; 3. Vertical percolation from irrigation water in the cultivated lands located south of the study area; and 4. The possible recharge from the aquifer system through the cracks, faults and folds that dominate the
surrounding hills.
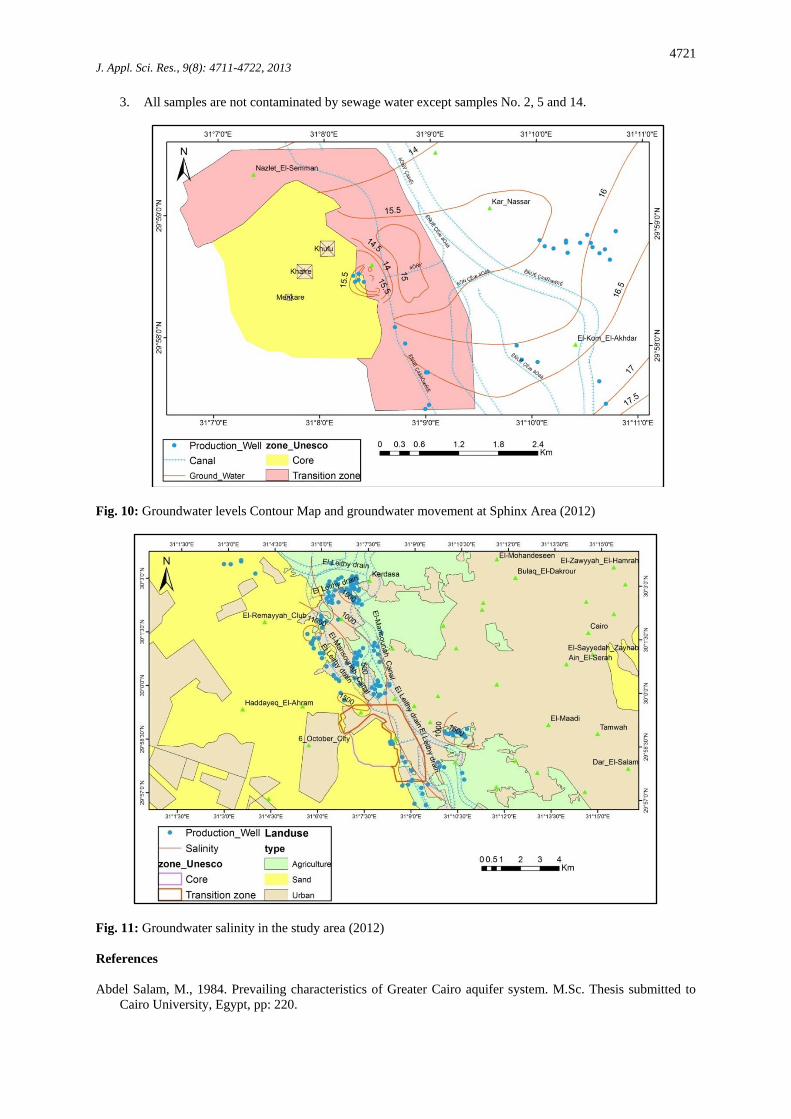
Groundwater Salinity in the Sphinx area: From the chemical analysis of the groundwater samples, the groundwater salinity ranges between 604 and
1500 ppm in the eastern part of the Sphinx area (Quaternary aquifer). While the salinity in the western part of the Sphinx area ranges from 1600 to 4000 ppm due to the limestone formation characteristics (Fig. 11). The main chemical analysis of these water samples revealed that:
• The Electrical Conductivity (EC) varies between 0.84 mmohs/cm (Sample No. 6) and 3.3 mmohs/cm (Sample No.15). However the E.C of the subsoil water (Sample No. 3) is 1.58 mmohs/cm.
• pH: The pH value ranges from 7.36 to 7.8 reflecting slightly alkaline water whereas the subsoil sample is 7.64.
• Total Dissolved Solids Concentration (TDS): The TDS in Giza area ranges between 539 ppm (Sample No.6) and 2112 ppm (Sample No.15). The subsoil water sample (No.3) is 1013 ppm.
• Nitrate: The nitrate concentration range between 1.0 ppm (Sample No. 15) and 97 ppm (Sample No. 3). All samples are contaminated by nitrate reflecting infiltration of nitrate-containing fertilizers.
• Water Type: The main water types are Mg-Ca-Sodium-SO4-HCO3-Chloride and Mg-Ca-Sodium-SO4-Cl-Bicarbonate which are common in Quaternary aquifer. Sodium-HCO3-Chloride is also detected. The subsoil water (sample 3) had water type that is Mg-Ca-Sodium –SO4-HCO3-Chloride which is consistent with surrounding groundwater samples.
• The Heavy Metals: The samples were analyzed for Al, Sb,, As, Ba, Cd, Cr, Co, Cu, Fe, Pb, Mn, Ni, Se, Sn, and Zn. All samples are within or even less than the standards.
The Microbiological Parameters: The samples were also analyzed for Total and Fecal Coliform Bacteria. The results show a slight pollution in Samples No.2 (at depth of about 55 meters), Sample No. 3 and Sample No. 5 (at depth of about 24 meters). Sample No. 14 (at depth of about 24 meters) is heavily polluted with total and Fecal Coliforms.
Conclusions and Recommendations:
GPP is considered one of the most important and unique archaeological site in the world. In this research
study, various data were used in order to investigate the groundwater conditions in this historical area. The used data include groundwater monitoring data, landuse maps and water quality data. Data obtained in 2011 was compared with historical data obtained in 1962 and 1984. It could be observed that with respect to the groundwater levels there is a rise in the groundwater levels in some areas from some recharge sources (canals – drains – golf city) in addition to a decline in some areas due to discharge at Nadi El – Remaya.
From the chemical and biological results and also from water types of the collected samples from the study area, it can be concluded that :
1. The study area is dominated by the Quaternary aquifer and the main irrigated canals and drains with some interference from the Tertiary Miocene and Limestone aquifers. Therefore, the T.D.S. of most of the water samples doesn't exceed 1000 ppm whereas samples No. 8 and 15 exceeded this value (1730 and 2112 ppm respectively).
2. The value of salinity and water type of the subsoil water sample is near close to the surrounding samples (Samples No.1&2) reflecting the recharge from the Quaternary aquifer.
4721 J. Appl. Sci. Res., 9(8): 4711-4722, 2013
3. All samples are not contaminated by sewage water except samples No. 2, 5 and 14.
Fig. 10: Groundwater levels Contour Map and groundwater movement at Sphinx Area (2012)
Fig. 11: Groundwater salinity in the study area (2012) References Abdel Salam, M., 1984. Prevailing characteristics of Greater Cairo aquifer system. M.Sc. Thesis submitted to
Cairo University, Egypt, pp: 220.
4722 J. Appl. Sci. Res., 9(8): 4711-4722, 2013 Ahmed, A.A. Shetawy, Samah Mohamed El Khateeb, 2009. The pyramids plateau: A dream searching for
survival. Tourism Management., 30: 819-827. Dowidar, H.M. and A.M.A. Abdallah, 2001. Structural setting of the Giza pyramids plateau and the effect of
fractures and other factors on the stability of its monumental parts, Egypt. Annals Geol. Surv. Egypt, XXIV, 393-412.
Mahmoud, S.S., 1997. Pyramids Plateau, Landforms and problems. Geographic Research Series, Egyptian Geographic Society
NARSS/WesternGeco, 2012. "Integration of Geoscience and Archaeology to Support Site Management and the Preservation of Egyptian Heritage". Final Report
National Authority for Tunnels EIA, 2010. Study for Greater Cairo Metro Line 4 Phase 1 final report. Prepared by Environics
RIGW, 1982. "Groundwater Study for Sphinx Area". Arabic Technical report RIGW, 1983. "Groundwater Studies for Greater Cairo". Arabic technical report, RIGW and Academy of
Scientific Research for Technology, 1983 RIGW, 1989. Hydrogeological Map of Egypt, Cairo, scale 1:100,000. First Edition El- Qanatir Egypt Strougo A., 1985. Eocene Stratigraphy of the Giza Pyramids plateau. Mid. East Res. Cent. Ain Shams Univ., Sc.
Res. Ser., 5: 79-99 UNESCO, 1992. Site management plan of the Giza plateau, retrieved from (retrieved from
http://www.cultnat.org 2013).