34418-013: Southwest Area Integrated Water Resources Planning ...
52
Environmental Monitoring Report Project No.34418-013 Final Report August 2015 BAN: Southwest Area Integrated Water Resources Planning and Management Project Prepared by Bangladesh Water Development Board for the People’s Republic of Bangladesh and the Asian Development Bank.
-
Upload
khangminh22 -
Category
Documents
-
view
0 -
download
0
Transcript of 34418-013: Southwest Area Integrated Water Resources Planning ...
Environmental Monitoring Report Project No.34418-013 Final Report August 2015
BAN: Southwest Area Integrated Water Resources Planning and Management Project
Prepared by Bangladesh Water Development Board for the People’s Republic of Bangladesh and the Asian Development Bank.

This environmental monitoring report is a document of the borrower. The views expressed herein do not necessarily represent those of ADB's Board of Directors, Management, or staff, and may be preliminary in nature. In preparing any country program or strategy, financing any project, or by making any designation of or reference to a particular territory or geographic area in this document, the Asian Development Bank does not intend to make any judgments as to the legal or other status of any territory or area.
SOUTHWEST AREAIntegrated Water Resources Planning and Management Project
Bangladesh Water Development Board
SOUTHWEST AREAIntegrated Water Resources Planning and Management Project
Bangladesh Water Development Board
GOVERNMENT OF THE PEOPLE’S REPUBLIC OF BANGLADESH
Ministry of Water Resources
Bangladesh Water Development Board
ADB Loan 2200-BAN (SF) / GON Grant 0036 BAN
ENVIRONMENT MONITORING REPORT
FINAL REPORT
August, 2015
SAIWRPMP, BWDB, Environment Monitoring Report, August, 2015 a
ACRONYMS AND ABBREVIATIONS
ADB Asian Development Bank
BWDB Bangladesh Water Development Board
DAE Department of Agricultural Extension
DFR Draft Final Report
DOE Department of Environment
DOF Department of Fisheries
DPHE Department of Public Health Engineering
DTW Deep Tube Well
EAP Environmental Action Plan
ECA Environment Conservation Act
ECC Environmental Clearance Certificate
ECR Environment Conservation Rules
EIA Environmental Impact Assessment
EIRR Economic Internal Rate of Return
EMP Environmental Management Plan
EMU Environmental Management Unit
ERP Environmental Responsible Procurement
FAP Flood Action Plan
FAO UN Food and Agricultural Organisation
FCDI Flood Control, Drainage and Irrigation
FD Forest Department
FGD Focus Group Discussion
FPCO Flood Planning Coordination Organisation
GC Governing Council
GRM Grievance Redress Mechanism
GOB Government of Bangladesh
GPP Guidelines for People's Participation
GPWM Guidelines for Participatory Water Management
GRC Grievance Redress Centre
GWT Ganges Water Treaty
IEC Important Environmental Components
IEE IMED
Initial Environmental Examination Implementation, Monitoring and Evaluation Division
IPM Integrated Pest Management
ISPAN Irrigation Support Project for Asia and Near East
IWM Institute of Water Modelling
IWRM Integrated Water Resources Management
IWRMP Integrated Water Resources Management Plan
JMC Joint Management Committee
KJDRP Khulna Jessore Drainage Rehabilitation Project
SAIWRPMP, BWDB, Environment Monitoring Report, August, 2015 b
LLP Low Lift Pump
LGI Local Government Institution
MOA Ministry of Agriculture
MOEF Ministry of Environment and Forest
MOWR Ministry of Water Resources
Mt Metric Ton
NEDECO Netherlands Engineering Consultants
NGO Non-Governmental Organisation
NWMP National Water Management Plan
NWPo National Water Policy
O&M Operation and Maintenance
PAP Project Affected Person
PCU Project Coordination Unit
PIU Project Implementation Unit
PMO Project Management Office
PRRA Participatory Rapid Rural Appraisal
PPTA Project Preparation Technical Assistance
PSC Project Steering Committee
PWD Public Works Department
RSDP Resettlement and Social Development Plan
SEIA Summary Environmental Impact Assessment
SIEE Summary Initial Environmental Examination
SIP Subproject Implementation Plan
SMO Subproject Management Office
SSWRDSP Small Scale Water Resources Development Sector Project.
STW Shallow Tube Well
SAIWRPMP Southwest Area Integrated Water Resources Planning and Management Project
SAIWRPMP-AF Southwest Area Integrated Water Resources Planning and Management Project-Additional Financing
SWMC Surface Water Modelling Center
UNDP United Nations Development Program
WARPO Water Resources Planning Organisation
WHO World Health Organization
WMO Water Management Organization
WSSL Water Sealed Sanitary Latrine
SAIWRPMP, BWDB, Environment Monitoring Report, August, 2015 i
Glossary of Environmental Terms
Abatement Reducing the degree of intensity of, or eliminating, pollution. Acid A corrosive solution with a Ph of less than 7 (Source: US EPA) Air pollution Air is made up of a number of gases, mostly nitrogen and oxygen and, in smaller amounts,
water vapour, carbon dioxide and argon and other trace gases. Air pollution occurs when harmful chemicals and particles are emitted to the air – due to human activity or natural forces – at a concentration that interferes with human health or welfare or that harms the environment in other ways.
Air quality A measure of the level of pollution in the air. Algae
Simple rootless plants that grow in sunlit waters in proportion to the amount of available nutrients. They can affect water quality adversely by lowering the dissolved oxygen in the water. They are food for fish and small aquatic animals.
Algal Blooms Sudden spurts of algal growth, which can affect water quality adversely and indicate potentially hazardous changes in local water chemistry.
Alternative energy sources Energy that does not come from fossil fuels (such as coal, oil, gas), for example wind, flowing water, solar energy and biomass.
Amenities Benefits of a property, such as nearby playgrounds, swimming pools, community centres or parks.
Atmosphere The mass of air surrounding the Earth. Backyard burning An illegal method of getting rid of household waste, possibly in an attempt to save on bin
charges, that releases levels of pollutants into the air, so harming air quality and risking the health of those burning the waste and of their neighbors.
BER Short for Building Energy Rating, which says how much energy a home needs for heating, lighting and hot water. Homes are placed on a scale from A to G. A-rated homes need the least amount of energy while G-rated need the most. Since 1 January 2009, all homes being sold or rented must have a BER certificate. BER ratings are carried out by BER Assessors registered with the Sustainable Energy Authority of Ireland.
Biodegradable waste Organic waste, typically coming from plant or animal sources (for example food scraps and paper), which other living organisms can break down.
Biodiversity A short form of the phrase ‘biological diversity’, which means the variety of life on this planet and how it interacts within habitats and ecosystems. Biodiversity covers all plants, animals and micro-organisms on land and in water. See also ecosystem, habitat and organism.
Bioenergy All types of energy derived from biomass, including biofuels. Biofuels Liquid transport fuels made from biomass. Biomass A source of fuel made from living and recently-dead plant materials such as wood, leaves
and the biodegradable part of industrial and municipal waste. Biosphere The portion of Earth and its atmosphere that can support life (Source: US EPA) Black bin (grey bin) A wheelie bin used in certain local authorities to collect waste that cannot be recycled or
composted. Bring bank
A place where you can bring materials for recycling, for example glass, newspapers, heavy cardboard and textiles. See also recycling centre and civic amenity site.
Brown bin A wheelie bin used in some local authorities to collect organic waste such as food and light garden waste (for example grass cuttings).
Bye-law A rule made by a local authority to govern activities within the area it controls. Examples include bye-laws covering waste disposal, traffic or public events or signs.
Carbon count A measure of the amount of carbon dioxide you produce through your lifestyle every day, for example through driving or using electrical appliances and lighting.
Carbon credit A unit of carbon dioxide bought to reduce greenhouse gas emissions. See carbon offset. Carbon dioxide (CO 2) A colourless gas that is naturally produced from animals and people in exhaled air and the
decay of plants. It is removed from the atmosphere by photosynthesis in plants and by dissolving in water, especially on the surface of oceans. The use of fossil fuels for energy is increasing the concentration of carbon dioxide in the atmosphere, which is believed to contribute to global warming. See also greenhouse gases and photosynthesis.
Carbon emissions In the context of climate change, carbon dioxide released when substances, especially oil, gas, and coal, are burned by vehicles and planes, by factories and by homes.
Carbon footprint A measure of the impact our activities have on the environment, especially climate change, often reported as the units of tonnes (or kg) of carbon dioxide each of us produces over a given period of time.
Carbon monoxide A highly poisonous, odourless, tasteless and colourless gas that is formed when carbon material burns without enough oxygen. Carbon monoxide is toxic when inhaled because it combines with your blood and prevents oxygen from getting to your organs. If a person is exposed to carbon monoxide over a period, it can cause illness and even death. Carbon Monoxide has no smell, taste or colour. This is why it is sometimes called the “Silent Killer”. The most common causes of carbon monoxide poisoning in the home are house fires, faulty heating appliances such as boilers, blocked chimney or flues, and rooms not properly ventilated. Carbon Monoxide alarms can be used as a backup to provide a warning to
SAIWRPMP, BWDB, Environment Monitoring Report, August, 2015 ii
householders in the event of a dangerous build up of carbon monoxide. Carbon neutral A situation that arises when the amount of carbon dioxide released into the air equals the
amount of carbon dioxide removed from the air, for example by planting trees, or the amount saved by using renewable energy sources to produce the same amount of energy. See also renewable energy.
Carbon offset A unit, equal to one ton of carbon dioxide, that individuals, companies or governments buy to reduce short-term and long-term emissions of greenhouse gases. The payment usually funds projects that generate energy from renewable sources such as wind or flowing water. Individuals can choose whether to buy an offset (for example to compensate for air travel), but governments and large industries are sometimes required to buy them to meet international targets aimed at reducing greenhouse gases.
Carbon tax A tax on fuels according to their carbon content, which aims to encourage people and businesses to use fuels with less carbon and reduce the amount of energy they use.
Carpooling Sharing a car to a destination to reduce fuel use, pollution and travel costs. CFCs Short for ‘chloroflurocarbons’, which are chemicals used in manufacturing and, in the past,
in aerosol cans and refrigerators, which can damage the ozone layer. CFL bulbs Short for ‘compact fluorescent lamp’ bulbs, which are light bulbs that use a fraction of the
energy of traditional filament bulbs and last up to five times longer. CFL bulbs will completely replace filament bulbs in Ireland by 1 September 2012.
‘Change’ campaign The Government’s campaign to change how people in Ireland think about climate change and encourage us to change how we behave. It includes a website, which has carbon calculators that can calculate the carbon foootprint of individuals, businesses and local authorities.
Civic amenity site A public or private facility that accepts recyclable and non-recyclable materials such as garden and household waste and certain hazardous wastes such as paints, batteries and electrical and electronic devices. See also bring bank, recycling centre and WEEE.
Climate The pattern of weather in a particular region over a set period of time, usually 30 years. The pattern is affected by the amount of rain or snowfall, average temperatures throughout the year, humidity, wind speeds and so on. Ireland has a temperate climate, in which it doesn’t get too hot or too cold.
Climate change A change in the climate of a region over time due to natural forces or human activity. In the context of the UN Framework Convention on Climate Change, it is the change in climate caused by higher levels of greenhouse gases in the atmosphere due to human activities as well as natural climate changes. See also global warming, and UN Framework Convention on Climate Change.
Compost A rich soil-like material produced from decayed plants and other organic matter, such as food and animal waste, that decomposes (breaks down) naturally. Most food waste can be put into compost, but you should not include meat, bones, cheese, cooking oils and fish. These may take a long time to break down and attract unwanted pests.
Compostable Material from plants or animals that can be used to create compost because it will decompose naturally over time.
Composting The process of deliberately allowing food, garden and other suitable organic wastes to break down naturally over time to produce compost.
Conservation Preserving or protecting animals and resources such as minerals, water and plants through planned action (such as breeding endangered species) or non-action (such as not letting taps run unnecessarily).
Cryptosporidium A tiny parasite that can infect people if it is present in drinking water. Deforestation The reduction of trees in a wood or forest due to natural forces or human activity such as
burning or logging. Development plan A public plan that sets out the development objectives and policies of a local authority for its
area. It covers a six-year period and states the local authority’s goals for a range of areas such as maintaining and improving roads and parks, preserving and enhancing amenities (such as playgrounds or swimming pools), zoning land for homes, businesses, factories and farming and providing services and facilities such as waste disposal and sewerage. Members of the public have opportunities to make submissions on the plan before it is agreed.
Dioxins Highly toxic chemicals that can be formed in small amounts from forest fires or volcanoes but more often are produced unintentionally from industrial activities and from incinerating waste and burning fossil fuels.
Disposal, dispose of
In this guide, getting rid of waste by discarding it into a bin and, when it is collected, by incincerating it or sending it to landfill.
Domestic charges Fees paid to local authorities for providing services such as collecting domestic waste. Domestic waste Waste produced within the home, including garden waste. See also household waste. Draught proofing A way to stop heat from escaping a home, for example by sealing window frames and using
draught excluders under doors. Dumping Disposing of waste illegally by not using bins or official recycling centres, civic amenity sites
or landfills. Ecosystem A community of organisms that depend on each other and the environment they inhabit. Ecotourism Small-scale tourism in fragile and protected areas that aims to have a low impact on the
SAIWRPMP, BWDB, Environment Monitoring Report, August, 2015 iii
environment, benefit local communities and enable tourists to learn more about the natural and cultural history of the place. See also sustainable tourism.
Effluent Liquid wastes such as sewage and liquid waste from industries. Electric vehicle A vehicle that is driven by an electric motor or battery and is generally less noisy and less
polluting than common combustion engine vehicles. Emissions In the context of the atmosphere, gases or particles released into the air that can contribute
to global warming or poor air quality. Emissions projections Forecast of emissions into the future taking into account current and future economic and
policy developments Emssions Trading Allowance
Pemission to emit to the atmosphere, one tonne of carbon dioxide equivalent, during a specific trading period. The allowance is only valid for the purpose of the Directive and can only be transferred in accordance with the Directive.
End-of -life vehicle A vehicle such as a car or small van that is scrapped and sent for recycling. Energy efficiency Actions to save fuels, for example better building design, changing production processes,
developing better transport policies, using better road vehicles and using insulation and double glazing in homes.
Energy rating A rating given to electrical appliances such as ovens, washing machines, dishwashers and refrigerators according to how much energy they use. Ratings are on a scale from A to G, with A-rated appliances using the least energy and G-rated needing the most. The less energy an appliance uses, the better it is for the environment and the more you will save on your bill.
Energy Star A voluntary international label that identifies appliances that meet certain standards of energy efficiency. Within the European Union, the label relates to office equipment such as computers and photocopiers.
Environmental impact statement
A statement about the expected effects on the environment of a proposed project or development such as a new road or waste water treatment plant, including how any severe effects on the environment will be addressed.
Flora and fauna The plants and animals that are native to a particular area or period of time. Fossil fuels
Fuels – such as coal, gas, peat and oil – that are formed in the ground over a long time from dead plants and animals and are used up once they are burned for energy.
Fuel povert y Being unable to heat a home to a safe and comfortable level because of low household income or having to spend more than 10% of household income to heat a home to a comfortable level because the home is not energy efficient.
Global warming The gradual increase in temperature of the Earth’s surface caused by human activities that cause high levels of carbon dioxide and other gases to be released into the air.
Green bin A wheelie bin used in certain local authorities to collect dry cardboard, paper, tins and other recyclable waste, including certain plastics.
Green design A design, usually of a building, that includes environmentally-friendly features such as solar panels, skylights or recycled building materials.
Greener Homes Scheme A system run by the Sustainable Energy Authority of Ireland (SEI) to provide grants to homeowners who intend to install in their existing homes a new renewable energy heating system, for example heat pumps, solar panels or wood chip or pellet boilers. For more information, visit the.
Greenhouse effect The warming of the Earth’s atmosphere caused by increasing levels of gases, such as water vapour and carbon dioxide. These gases absorb radiation emitted naturally from the ground, so slowing down the loss of energy from Earth. The greenhouse effect has always existed; without it, Earth would be too cold for plants, animals and people to survive. But because of the increase in greenhouse gas emissions in recent years, the greenhouse effect is a lot stronger, so leading to global warming. See also global warming, greenhouse gases and radiation.
Greenhouse gases Gases such as carbon dioxide and methane, which tend to trap heat radiating from the Earth’s surface, so causing warming in the lower atmosphere. The major greenhouse gases that cause climate change are carbon dioxide (CO2), methane (CH4) and nitrous oxide (NO2). See also greenhouse effect and global warming.
Ground water Water that collects or flows underground in the small spaces in soil and rock. It might be a source of water for springs and wells and then used for drinking water.
Habitat The area occupied by a community or species (group of animals or plants), such as a forest floor, desert or sea shore.
Hazardous waste
Waste that poses a risk to human health or the environment and needs to be handled and disposed of carefully. Examples include oil-based paints, car batteries, weed killers, bleach and waste electrical and electronic devices.
Home Energy Saving Scheme
A scheme operated by the Sustainable Energy Authority of Ireland to provide grants to certain homeowners to improve the energy efficiency of their home. For more information,
Household waste
Waste that contains paper, cardboard, textiles (for example fabric or carpet), timber, food, garden clippings, glass, plastic and other manufactured materials.
Incinerator A furnace that is designed to burn waste at very high temperatures under controlled conditions and is licensed by national regulatory authorities. Most modern and efficient incinerator generate heat and energy from burning waste.
Insulation In this guide, material such as foam or glass wool that is used in homes and other buildings
SAIWRPMP, BWDB, Environment Monitoring Report, August, 2015 iv
to prevent heat loss, reduce noise and improve comfort. Kyoto Protocol, Kyoto agreement
An international agreement signed in Japan in 1997, attached to the UN Framework Convention on Climate Change. Under the agreement, which has been in force in Ireland since 2005, industrialised countries promised to reduce their combined greenhouse gas emissions to at least 5 percent below 1990 levels over the period 2008-2012. See also UN Framework Convention on Climate Change.
Landfill A site that is specially designed to dispose of waste and operates with a licence granted by the Environmental Protection Agency (EPA). The EPA reviews licences and, with local authorities, monitors landfills around the country for emissions.
Litter Waste that is thrown away carelessly, mainly made up of plastic, metal, glass, paper or food. Common examples are chewing gum and cigarette butts.
MBT
Short for ‘mechanical biological treatment’, which is a way of sorting and treating waste. The waste is first sorted mechanically into materials that can and cannot be recycled. Any waste that can be recycled is then broken down biologically, often through composting, while the rest is usually sent to landfill. See also composting.
Mulch Leaves, straw or compost used to cover growing plants to protect them from the wind or cold.
Municipal waste Waste produced in urban areas, mainly made up of household waste but also some small commercial waste that is similar to household waste.
Noise pollution Noises that disturb the environment and people’s ability to enjoy it, for example continually sounding house alarms, loud music, air conditioning or other electrical units and aircraft or motor engines.
NPWS
Short for National Parks and Wildlife Service, which works under the Department of the Environment, Heritage and Local Government to manage and maintain State-owned national parks and nature reserves and protect and preserve Ireland’s native animals and plants.
NSS
Short for National Spatial Strategy, which is the Government’s 20-year plan to balance population growth and social and economic development between different regions in Ireland. By matching where people work more closely to where they live, the strategy aims to improve people’s quality of life and sense of community, enhance local investment and create a better environment.
Noxious gases
Poisonous gases that can harm people and the environment. Some gases have a strong smell, for example sulphur dioxide and methane, while others, such as carbon monoxide, do not have any smell at all.
Oil spill
The harmful release of oil into the environment, usually through water, which is very difficult to clean up and often kills birds, fish and other wildlife.
Organic food Plants and animals that are grown or reared without the use of synthetic fertilisers, pesticides or hormones.
Organic In this guide, matter from living, or once-living, things. Organism Any living thing, from bacteria and fungi through to insects, plants, animals and humans. Ozone layer The thin protective layer of gas 10 to 50km above the Earth that acts as a filter for ultraviolet
(UV) radiation from the sun. High UV levels can lead to skin cancer and cataracts and affect the growth of plants.
Particulate matter
Fine solid or liquid particles that pollute the air and are added to the atmosphere by natural and man-made processes at the Earth’s surface. Examples of particulate matter include dust, smoke, soot, pollen and soil particles.
Pay by weight
A system in which the amount you pay for bin collections depends on the amount of waste you throw away. The more waste you reduce, reuse, recycle or compost, the less you pay for waste disposal.
Pesticides A general term for any chemicals that are used to kill weeds, fungi, insects or other pests. Permits
In the context of waste, certificates or other documents granted by local authorities to private companies to collect and manage waste or to operate waste management facilities such as recycling centres.
Planning permission
Permission granted by a local authority for new buildings or for extensions, once nobody objects to the plans.
Plastic bag levy
An environmental tax that customers must pay when they accept a plastic or laminated bag from a retailer. There is no tax on small bags, such as those for fresh meat or loose fruit and vegetables. Money raised from the tax is put into a special fund that is used to protect the environment.
Post -consumer waste
Waste collected after a consumer has disposed of it, for example sweet wrappers or packaging from small electronic goods such as mobile phones or MP3 players.
Radiation
A form of energy that is transmitted in waves, rays or particles from a natural source, such as the sun and the ground, or an artificial source, such as an x-ray machine. Radiation can be ionising or non-ionising. Ionising radiation includes ultraviolet rays, radon gas and X-rays. Too much exposure to ionising radiation can be harmful, leading to increased risk of cancer. Non-ionising radiation includes visible light, radio waves and microwaves. This type of radiation is less risky to health because it contains less energy, but it can still be harmful at high levels for a long time.
Radioactive A material is said to be radioactive if it emits radiation.
SAIWRPMP, BWDB, Environment Monitoring Report, August, 2015 v
Radon
A common radioactive gas emitted from ordinary soils and rock. Radon has no smell, taste or colour and can seep into homes, building up to dangerous levels if there is not enough ventilation. Being exposed to high levels of radon gas over a long period of time increases the risk of developing lung cancer. For more information on how to check radon levels
Recycle
To break waste items down into their raw materials, which are then used to re-make the original item or make new items.
Reforestation The process of planting trees in forest lands to replace those that have been cut down. Refuse Another name for waste. Renewable energy
Energy from renewable resources such as wind power, solar energy or biomass.
Renewable resource
A resource that can be used again and again without reducing its supply because it is constantly topped up, for example wind or sun rays.
Reuse
To use an item more than once for the same purpose, which helps save money, time, energy and resources.
River basin
The portion of land drained by a river and the streams that flow into it. The quality of a river basin affects the quality of water, so efforts to protect and improve water quality must often include plans for managing river basins.
Sewage
Liquid wastes from communities, which may be a mixture of domestic effluent from homes and liquid waste from industry.
Smog
Air pollution consisting of smoke and fog, which occurs in large urban and industrial areas and is mainly caused by the action of sunlight on burned fuels, mostly from car exhausts. Smog can cause eye irritations and breathing problems and damage plant life.
Smokeless fuel Solid fuel, such as charcoal, that does not release smoke when it is burned. Solar panel
A panel fixed to the roof of a building that uses special cells to collect energy from the sun and convert it to electricity to heat the building and/or power the lights, appliances or equipment.
Standing c harges
Fixed fees that must be paid for a certain period, often a year, to continue receiving a service. Examples include standing charges for bin collections or gas supply. Other charges may apply depending on the use of the service over a given period of time.
Surface water Water that is collected on the ground or in a stream, river, lake, wetland or ocean. Sustainable development
Development using land or energy sources in a way that meets the needs of people today without reducing the ability of future generations to meet their own needs.
Sustainable tourism
A form of tourism that meets the needs of current tourists and host communities while protecting and enhancing tourism for the future by balancing economic and social needs with a respect for different cultures and the environment. See also ecotourism.
Toxic Poisonous or harmful to the body (ecotoxic relates to damage to the environment). Toxin
A poisonous substance that can either be natural (produced by plants, animals or bacteria) or manufactured.
Traffic calming, traffic management
Policies, rules or actions by a local authority designed to reduce traffic speed or limit the amount of traffic in an area at certain times of day.
Tidy towns
An annual competition run by the Department for the Environment, Heritage and Local Government to reward large and small towns around the country for their efforts to maintain and improve their area. Towns can choose whether to take part and are given marks under a number of headings, such as landscaping, litter control, roads and footpaths, wildlife and natural amenities and residential areas.
Utility (public) A company that provides the public with essentials such as electricity or water. UN Framework Convention on Climate Change
An international treaty joined by 192 countries that has the goal of preventing ‘dangerous’ human interference with the climate system and sets general rules for tackling climate change.
UNESCO World Heritage Site
A natural or man-made site that has outstanding universal value and meets at least one of 10 conditions decided by UNESCO, the United Nations Educational, Scientific and Cultural Organisation. Ireland has two World Heritage Sites: the pre-historic sites of Newgrange, Knowth and Dowth in Co. Meath and Skellig Michael, a religious settlement from the 7 th century off the coast of Co. Cork.
Ventilation
In this guide, the movement of air between the inside and outside of a building usually through windows, doors and air vents built into the building’s walls or ceilings.
Warmer Homes Scheme
A scheme, run by Sustainable Energy Ireland, that aims to improve the energy efficiency of private owned or rented homes occupied by low income households. The scheme trains and offers grants to community organisations to carry out work such as attic insulation, draught proofing, installing lagging jackets and so on.
Waste management
The management of waste collection, handling, processing, storage and transport from where it is produced to where it is finally disposed. See waste prevention.
Waste prevention
An aspect of waste management that involves reducing the amount of waste we produce and minimising the potential harm to human health or the environment from packaging or ingredients in products.
Water vapour Water in its gas form – instead of liquid or solid (ice). WEEE
Short for Waste Electrical and Electronic Equipment (WEEE), which are any unwanted devices with a plug or battery – from a remote control or digital camera to a vacuum cleaner or fridge freezer. These devices must be disposed of carefully to avoid damage to the

SAIWRPMP, BWDB, Environment Monitoring Report, August, 2015 vi
environment. To get rid of an unwanted device, you can bring it to a civic amenity site or leave it with a retailer when you are buying a new device. All WEEE left in retail outlets and civic amenity sites are collected for recycling.
Wind energy
Energy harnessed from the wind at wind farms and converted to power. See also wind turbine.
Wind turbine
An engine or machine, usually mounted on a towe, that captures the force of the wind and converts it to electricity.
Zero emissions
An engine, motor or other energy source that does not produce any gas or release any harmful gases directly into the environment.
Southwest Area Integrated Water Resources Planning and Management Project, BWDB
SAIWRPMP, BWDB, Environment Monitoring Report, August, 2015 1
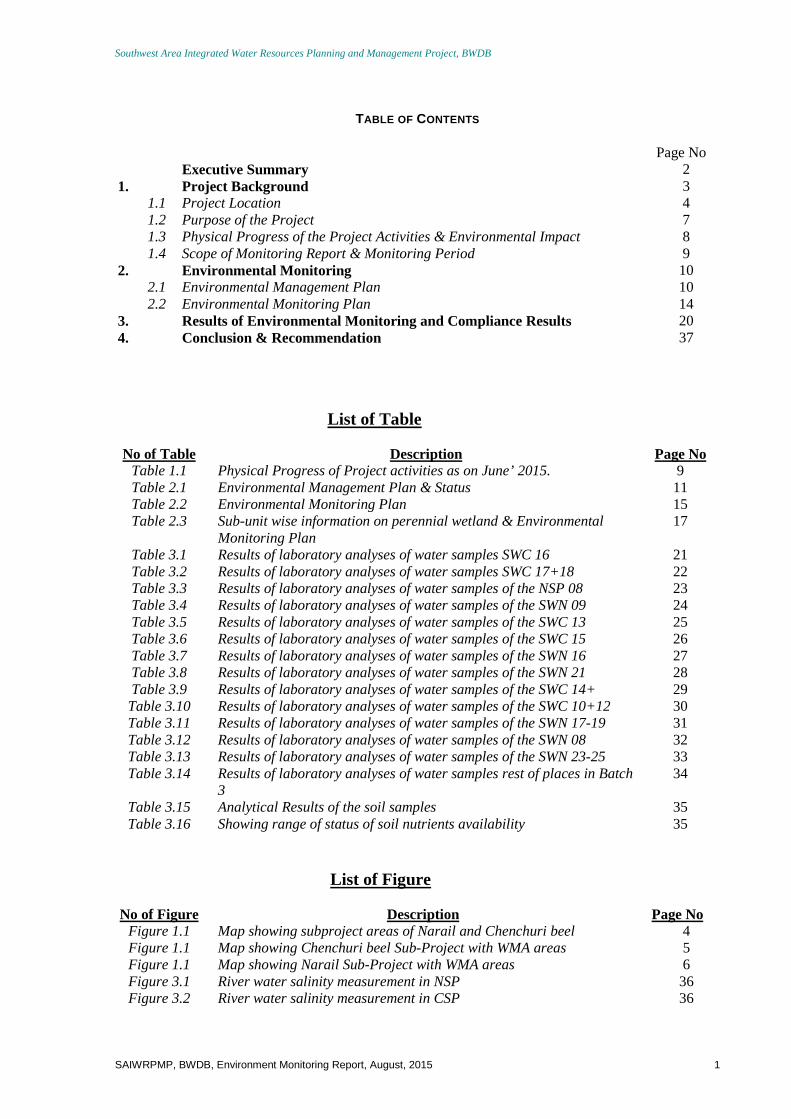
TABLE OF CONTENTS
Page No Executive Summary 2
1. Project Background 3 1.1 Project Location 4 1.2 Purpose of the Project 7 1.3 Physical Progress of the Project Activities & Environmental Impact 8 1.4 Scope of Monitoring Report & Monitoring Period 9
2. Environmental Monitoring 10 2.1 Environmental Management Plan 10 2.2 Environmental Monitoring Plan 14
3. Results of Environmental Monitoring and Compliance Results 20 4. Conclusion & Recommendation 37
List of Table
No of Table Description Page No Table 1.1 Physical Progress of Project activities as on June’ 2015. 9 Table 2.1 Environmental Management Plan & Status 11 Table 2.2 Environmental Monitoring Plan 15 Table 2.3 Sub-unit wise information on perennial wetland & Environmental
Monitoring Plan 17
Table 3.1 Results of laboratory analyses of water samples SWC 16 21 Table 3.2 Results of laboratory analyses of water samples SWC 17+18 22 Table 3.3 Results of laboratory analyses of water samples of the NSP 08 23 Table 3.4 Results of laboratory analyses of water samples of the SWN 09 24 Table 3.5 Results of laboratory analyses of water samples of the SWC 13 25 Table 3.6 Results of laboratory analyses of water samples of the SWC 15 26 Table 3.7 Results of laboratory analyses of water samples of the SWN 16 27 Table 3.8 Results of laboratory analyses of water samples of the SWN 21 28 Table 3.9 Results of laboratory analyses of water samples of the SWC 14+ 29 Table 3.10 Results of laboratory analyses of water samples of the SWC 10+12 30 Table 3.11 Results of laboratory analyses of water samples of the SWN 17-19 31 Table 3.12 Results of laboratory analyses of water samples of the SWN 08 32 Table 3.13 Results of laboratory analyses of water samples of the SWN 23-25 33 Table 3.14 Results of laboratory analyses of water samples rest of places in Batch
3 34
Table 3.15 Analytical Results of the soil samples 35 Table 3.16 Showing range of status of soil nutrients availability 35
List of Figure
No of Figure Description Page No Figure 1.1 Map showing subproject areas of Narail and Chenchuri beel 4 Figure 1.1 Map showing Chenchuri beel Sub-Project with WMA areas 5 Figure 1.1 Map showing Narail Sub-Project with WMA areas 6 Figure 3.1 River water salinity measurement in NSP 36 Figure 3.2 River water salinity measurement in CSP 36
Southwest Area Integrated Water Resources Planning and Management Project, BWDB
SAIWRPMP, BWDB, Environment Monitoring Report, August, 2015 2
Executive Summary ADB is seriously concerned that the project being funded does not affect the environment due to the
intervention. To prevent any such possibility, Environment Management Plan must be prepared,
followed and monitored so that the environment does not undergo any negative impact on the nature.
The project comprises two large Sub-projects namely Chenchuri Beel Sub-Project located in 3
Upazilas, of Narail district, namely- Narail, Lohagara & Kalia encompassing a gross area of 25,500 ha
(revised 20,697 ha excluding sub-units already taken over by LGED & adding one existing irrigation
scheme of 1057 ha) and Narail Sub-Project located mainly in Narail & Kalia Upazila of Narail district
and some part in Avoynagar Upazila of Jessore district encompassing a gross area of 31,500 ha
(revised 19,260 ha excluding sub-units already taken over by LGED). The project is expected to have
generally positive impacts on the environment including (i) improved flood management, (ii) improved
water use efficiency through preparation and implementation to IWMPs such as water retention and
storage for cultivation in the dry seasons that also induce less groundwater extraction in the project
areas; (iii) reduced salinity intrusion through water regulating structures thereby preventing land
degradation; (iv) reduce water logging through drainage improvement structures and measures.
On the other hand, negative impacts identified include (i) possible exacerbation of downstream salinity
intrusion due to water abstraction from the rivers; (ii) obstruction of fish migration between the rivers
and internal water bodies by regulators and other structures (including that past impacts when existing
structures were placed); (iii) water quality deterioration due to agriculture intensification; and (iv)
impacts during construction of structures and embankments. These were mitigation through (i)
implementation a continuous salinity monitoring and information sharing program at the project and
downstream areas with promotion of coordinated water abstraction; (ii) introducing and promoting fish-
friendly operation of regulators with provision of fish culture opportunities to professional fisher folks,
(iii) introducing integrated pest management and effective soil nutrient management as a part of
agriculture extension; and (iv) ensuring safe and environmentally sound construction practices. These
were incorporated in the EIA. At the level of SMO, a sub-divisional engineer was assigned as
environmental officers responsible for field level EMP implementation and reporting, with training and
monitoring by PMO and the ISP consultants.
Southwest Area Integrated Water Resources Planning and Management Project, BWDB
SAIWRPMP, BWDB, Environment Monitoring Report, August, 2015 3
1. Project Background
South-west Area covers the south bank of the Ganges and the Lower Meghna rivers with an area
of 4 million ha (27% of the country’s total) and the population of 28.8 miilion as in 2004 (23% of
the total). About 51% of the population is poor, highest next to the Northwest among the four
main regions. In water sector there are 78 public flood control, drainage/irrigation (FCD/I)
systems covering 1.1 million ha. The area has the most acute water management problems in
Bangladesh. Of particular concern is the water shortage due to reduced inflow in to the Ganges
tributaries and associated social and environmental hardships, including salinity intrusion,
livelihood loss, and environmental degradation. Other challenges include (i) flood inflow from the
Ganges,in the monsoon and deterioration of existing FCD/I systems; (ii) drainage congestion and
sedimentation of tidal channels caused by coastal polder construction and reduced tidal swept
volume; (iii) arsenic contamination (highest in the country); and (iv) vulnerability to cyclones and
tidal surges. Improving water management is most critically needed in the area.
The present Southwest Integrated Water Resources Planning and Management Project
(SWAIWRPMP) was taken to enhance economic growth and sustainable development in the rural
areas of some selected districts in South-Western region Narail & Jessore, Magura, Faridpur,
Gopalgonj and Rajbari) comprising a gross area of 100,000 ha through rehabilitation of existing flood
control system, improvement of drainage & irrigation which controlled by Integrated Water
Management & participatory approach. The present project is financed by jointly ADB, GoN & GoB.
The project cost according to latest revised DPP is 29425.53 lakh bdt & revised implementation period
is 2006-07 to 2014-15 (Original 2006-2013). Initially study made on 13 candidate sub-project from
which 2 (two) large sub-project was selected (ChenchuriBeel Sub-Project: Gross 25,500ha, net 17,900
ha & Narail Sub-Project: Gross 31500, net 23,440 ha) totaling Gross 57,000 ha against planned Gross
area of the project 100,000 ha. Balance 43,000 ha was to be implemented during project
implementation period. The revised figure of the two subject which were selected for implementation,
which exist in Narail district & some part of Avoynagar Upazila of Jessore district. Later on,
rehabilitation of damages caused by storm Aila-2009 in the selected district Khulna and Satkhira in the
south-west region was included in the project plus 780 meter of emergency bank protection work to
save a candidate sub-project namely Purulia-Charbhatpara in Gopalgonjdistrict as included during
Joint MTR in June-July of 2010. The project covers geographical area of about Gross 1,00,000 ha
under original project (Gross 57000 ha. in Chenchuri Beel & Narail sub-projects) plus emergency
additional Gross 74800 ha in four polder under Aila-2009 rehabilitation works in Khulna & Satkhira
districts. The total area of the project implemented is 1,74,800 ha. The main objective of the project is
to enhanced livelihoods and livelihoods opportunities impacted by integrated water resources
management (IWRM) as a result of upgraded infrastructures, increased user participation and
improved decentralized service delivery, and strengthening institutional capacity for planning,
implementing, operating, maintaining and monitoring demand driven participatory IWRM plans. In
order to achieve aforesaid objectives, the project includes both institutional and investment programs
Southwest Area Integrated Water Resources Planning and Management Project, BWDB
SAIWRPMP, BWDB, Environment Monitoring Report, August, 2015 4
those contribute in reducing poverty by securing and environmental conductive to improve health
within project target areas and promoting GoB’s sector reform process through the establishment of
institutional arrangements for participatory project management.
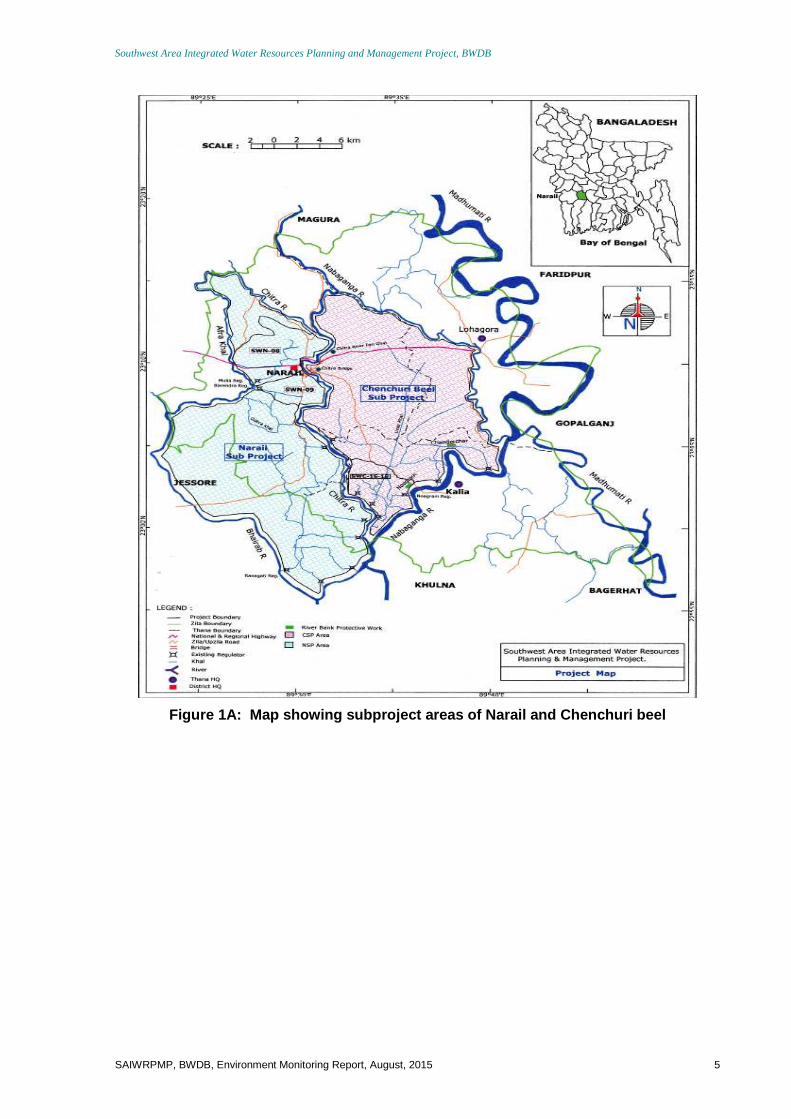
1.1 Project Location: The Project is located in the Southwest region of Bangladesh covering the
districts of Narail, Jessore, Magura, Faridpur and Rajbari and rehabilitation of damages caused by Aila
Storm in the selected polders in Khulna & Satkhira districts with the objective to rehabilitate a total area
of about 100,000 ha. Two sub-Projects, Chenchuri Beel Subproject(CBSP) & Narail subproject (NSP)
Figure-1A , which was found economically & socially feasible will be rehabilitated fully under the
project covering an area of about 57,000 ha (revised 40,000 ha excluding subunit area already taken
over by LGED plus new area under Chenchuri Irrigation Scheme). Balance 43,000 ha (revised 61000
ha) will be rehabilitated after their feasibility studies from amongst 11 Candidate subprojects
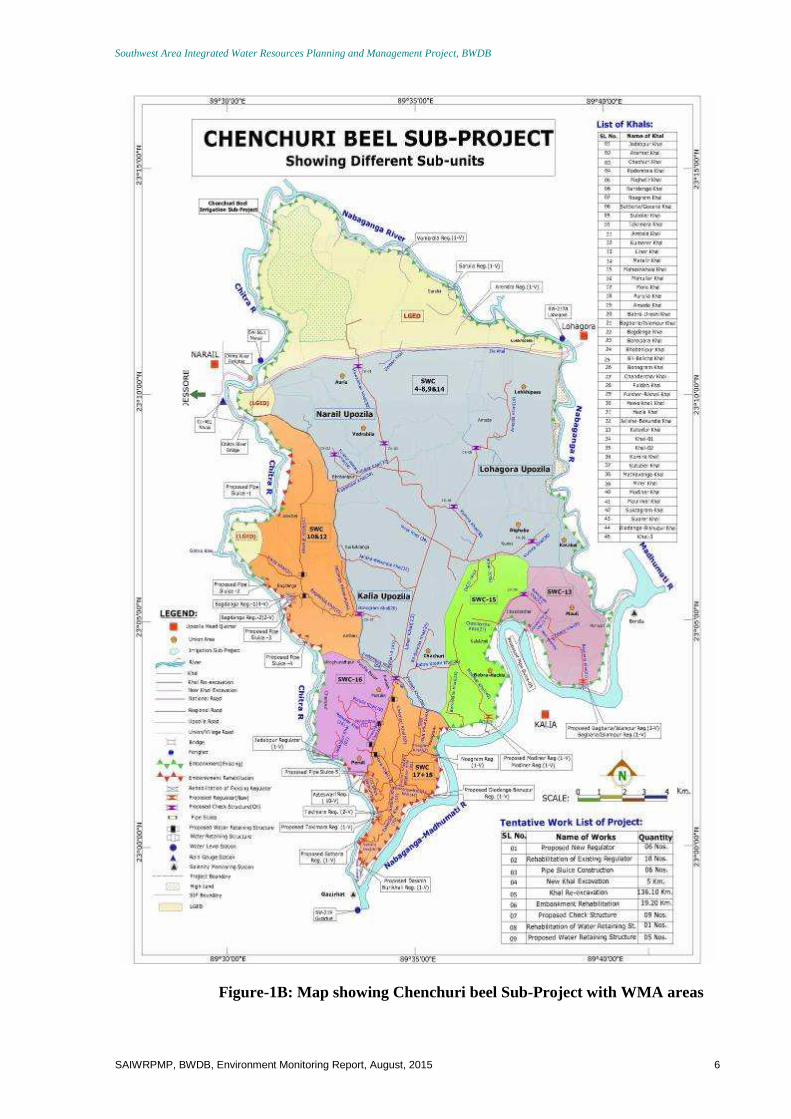
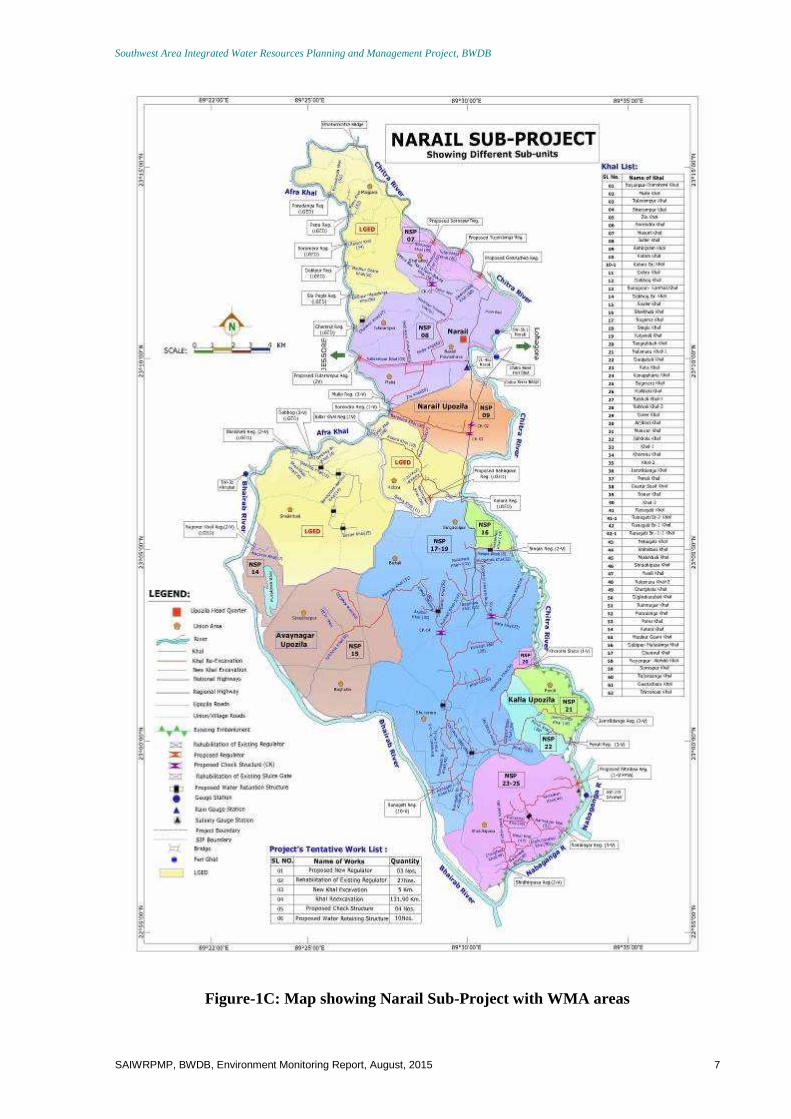
preliminarily identified in the PPTA study. Figure-1B shows CBSP with its WMA areas, Figure-1C
shows NSP with its WMA areas.
Southwest Area Integrated Water Resources Planning and Management Project, BWDB
SAIWRPMP, BWDB, Environment Monitoring Report, August, 2015 5
Figure 1A: Map showing subproject areas of Narail and Chenchuri beel
Southwest Area Integrated Water Resources Planning and Management Project, BWDB
SAIWRPMP, BWDB, Environment Monitoring Report, August, 2015 6
Figure-1B: Map showing Chenchuri beel Sub-Project with WMA areas
Southwest Area Integrated Water Resources Planning and Management Project, BWDB
SAIWRPMP, BWDB, Environment Monitoring Report, August, 2015 7
Figure-1C: Map showing Narail Sub-Project with WMA areas
Southwest Area Integrated Water Resources Planning and Management Project, BWDB
SAIWRPMP, BWDB, Environment Monitoring Report, August, 2015 8
1.2 Purpose of the Project: The Goal of the project is to reduce poverty incidence measured in
terms of incomes and nutritional status of the population. The purpose of the project is to
institutionalize effective mechanisms for enhancing and sustaining the performance of FCD/I systems.
The overall objective of the project is to enhance economic growth and reduce poverty in the rural
areas of the Districts of Narail, Magura, Jessore, Faridpur, Rajbari and Gopalgonj. The intermediate
objective is to enhance and sustain water security and livelihoods of rural people within the
hydrological boundaries defined by existing low-performing flood control and drainage systems.
After the Aila storm of May 2009 it was decided that the project would finance a part of rehabilitation of
damages caused by Aila storm in the Districts of Khulna and Sathkira. See Figure-1A that shows map
of ongoing Narail and Chenchuri Beel Sub-project, Figure 1B shows map of Narail Sub-Project with
WMA areas, Figure 1D shows SWAIWRPMP with location of additional subprojects and Figure 1E
shows locations of seven selected additional for which feasibility study was conducted.
The project consists of the following parts:
Part A: Integrated Water Management Plans Preparing IWMPs for additional FCD/I schemes covering 43,000 ha of land in the project area, to be
selected by the selection criteria stipulated in the Loan Agreement from 11 no. Candidate Schemes.
Since the two ongoing subproject have been reduced to 39000 ha due to taking areas by LGED, more
areas than contemplated 43,000 ha, now can be brought under IWMP study, balance 61,000 ha or
more with the arrangement of additional funding of USD 20 million.
Part B: Productive and Sustainable Water Management Systems Part B. a SIP Preparation and WMA formation with beneficiary Mobilization
(1) Supporting the preparation of SIPs and beneficiary mobilization of the concerned WMAs by
forming ad-hoc WMA and subordinate water management groups within the subunit and
preparing an SIP by setting specific impact targets and associated program
(2) Establishing empowered WMAs through(a) enrolling members and mobilizing functional
subgroups.(b)registering them together with executive committees and operational rules.(c)
collecting cash contribution equivalent to annual O&M requirement for the concerned facilities to
be transferred to them and (d)recruiting and fielding facilitators ,and
(3) Undertaking participatory detail design of water management structures
Part B.b Water management and associated structure: (1) providing water management infrastructure
specified in the SIP including flood embankment, regulators, sluice gates and pipes, and water
retention structures, re-excavation of drainage/irrigation canals and local riverbank protection And
(11) training the WMAs in monitoring civil works and strengthening internal technical audit.
Part B.c Enhanced production and Livelihoods through support services developing beneficiary’s skills
for enhancing productivity and incomes and the WMAs capacities, through (a) providing extension
Southwest Area Integrated Water Resources Planning and Management Project, BWDB
SAIWRPMP, BWDB, Environment Monitoring Report, August, 2015 9
services including campaign for improved nutrient management, field demonstration and training
and workshops and farmer tours and (b) supporting productive income generation activities by
poorest subgroups including (a) promoting social forestry, nurseries, crop cultivation and live
stocks. (b)Training the subgroups in such activities through the concerned departments and
private providers mobilized under the project.
Part B.d Sustainable O &M System : (i) For the project facilities to be managed by WMAs , supporting
in formulating WMA O &M committees preparing O&M plans and training for (a) monitoring
construction activities (b )annual inspection (c) preparing and implementing annual O &M plans
and (d) implementing the O&M plans and (ii) for project facilities to be jointly managed by BWDB,
LGIs and WMAs establishing a joint management system between BWDB,LGIs and the WMAs
including institutionalizing (a preparation of annual O &M plans following a standardized guidelines
and (b) implementation of O&M plans.
Part C: Project Management System and Strengthen ing Institutions
Part C .a Project Management System: Establishing JMC and training them and their sub-committee in
making subproject activity decisions at the scheme and at the sub unit level respectively, including
project implementation and annual O &M.
Part C .b Strengthening Institutions through Training and Advisory Support : (1) Providing training to
public and non- public institutions involved in the project activities for (a) participatory IWM
preparation (b)Socially involvement of WMA development and management (c) management of
diverse stakeholder interest (d) generic issues: social safeguards (e) design and construction
management (f) environmental management(g) agriculture, fisheries and livelihood
enhancement(h) sustainable O & M (i) quality control (11) Providing support for the progress of
the policy and institutional actions to be carried out under the project.
The Present Project (Extended period): The present project is an extension of the SAIWRPMP
that has been declared as complete on 30 June, 2014, having physical achievement of 97% and
financial achievement of 91.56% (over 3rd DPP revision).The present project is for one year for
“Follow up Support” for strengthening of WMGs formed for sustainable operation and
maintenance giving handholding practical O & M training to the WMOs plus activities relating to
WMO development by continuing training on O&M, Agriculture, Fisheries, Gender & Livelihood,
support to marginal poor by supplying goods to increase their livelihood income, and some civil
works essentially required to meet the need of the WMOs for one more year (2014-15).
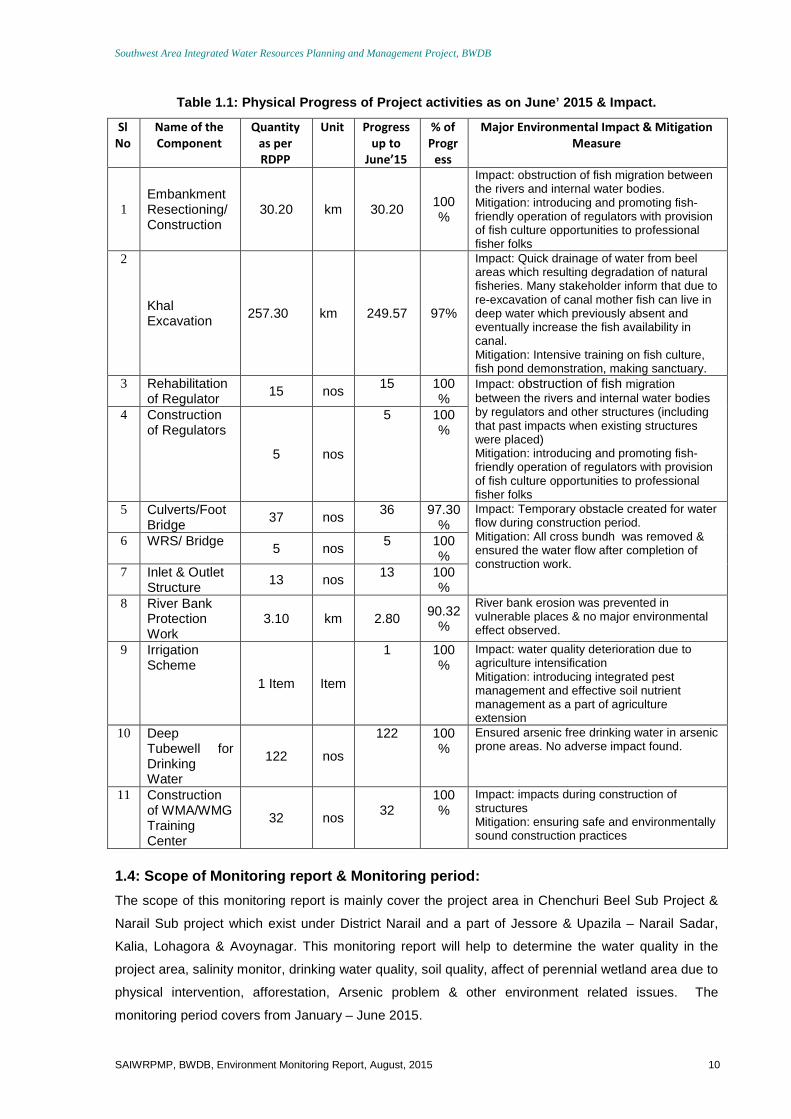
1.3: Physical Progress of Project activities:
Main physical work component of this project was – Khal Re-excavation, Embankment
construction/Re-sectioning, Construction of New Regulator, Rehabilitation of existing Regulator,
Construction of Pipe Inlet/Outlet, Construction of Bridge & Foot Bridge, River Bank Protection work,
Installation of deep tube well & construction of WMG training center. The physical progress of the
project as on June 2015 is illustrated in below Table 1.1.
Southwest Area Integrated Water Resources Planning and Management Project, BWDB
SAIWRPMP, BWDB, Environment Monitoring Report, August, 2015 10
Table 1.1: Physical Progress of Project activities as on June’ 2015 & Impact.
Sl
No
Name of the
Component
Quantity
as per
RDPP
Unit Progress
up to
June’15
% of
Progr
ess
Major Environmental Impact & Mitigation
Measure
1 Embankment Resectioning/Construction
30.20 km 30.20 100%
Impact: obstruction of fish migration between the rivers and internal water bodies. Mitigation: introducing and promoting fish-friendly operation of regulators with provision of fish culture opportunities to professional fisher folks
2
Khal Excavation
257.30 km 249.57 97%
Impact: Quick drainage of water from beel areas which resulting degradation of natural fisheries. Many stakeholder inform that due to re-excavation of canal mother fish can live in deep water which previously absent and eventually increase the fish availability in canal. Mitigation: Intensive training on fish culture, fish pond demonstration, making sanctuary.
3 Rehabilitation of Regulator
15 nos 15 100
% Impact: obstruction of fish migration between the rivers and internal water bodies by regulators and other structures (including that past impacts when existing structures were placed) Mitigation: introducing and promoting fish-friendly operation of regulators with provision of fish culture opportunities to professional fisher folks
4 Construction of Regulators
5 nos
5 100%
5 Culverts/Foot Bridge
37 nos 36 97.30
% Impact: Temporary obstacle created for water flow during construction period. Mitigation: All cross bundh was removed & ensured the water flow after completion of construction work.
6 WRS/ Bridge 5 nos
5 100%
7 Inlet & Outlet Structure
13 nos 13 100
% 8 River Bank
Protection Work
3.10 km 2.80 90.32%
River bank erosion was prevented in vulnerable places & no major environmental effect observed.
9 Irrigation Scheme
1 Item Item
1 100%
Impact: water quality deterioration due to agriculture intensification Mitigation: introducing integrated pest management and effective soil nutrient management as a part of agriculture extension
10 Deep Tubewell for Drinking Water
122 nos
122
100%
Ensured arsenic free drinking water in arsenic prone areas. No adverse impact found.
11 Construction of WMA/WMG Training Center
32 nos
32
100%
Impact: impacts during construction of structures Mitigation: ensuring safe and environmentally sound construction practices
1.4: Scope of Monitoring report & Monitoring period :
The scope of this monitoring report is mainly cover the project area in Chenchuri Beel Sub Project &
Narail Sub project which exist under District Narail and a part of Jessore & Upazila – Narail Sadar,
Kalia, Lohagora & Avoynagar. This monitoring report will help to determine the water quality in the
project area, salinity monitor, drinking water quality, soil quality, affect of perennial wetland area due to
physical intervention, afforestation, Arsenic problem & other environment related issues. The
monitoring period covers from January – June 2015.
Southwest Area Integrated Water Resources Planning and Management Project, BWDB
SAIWRPMP, BWDB, Environment Monitoring Report, August, 2015 11
2. Environmental Monitoring
The main civil work of this project is – Khal Re-excavation, Embankment construction/Re-sectioning,
Construction of New Regulator, Rehabilitation of existing Regulator, Construction of Pipe Inlet/Outlet,
Construction of Bridge & Foot Bridge, River Bank Protection work, Installation of arsenic safe drinking
deep tubewell & construction of WMG training center. During the PPTA this project was categorized as
“A (Red)” under Environment Category of ADB. But during the implementation of the project no major
environmental adverse effect was observed. However, during implementation of the project it was
observed that there was no such factor to categorize as A category. The project implemented such a
way that any environmental adverse effect could be minimized by other mean of activities & IWRM.
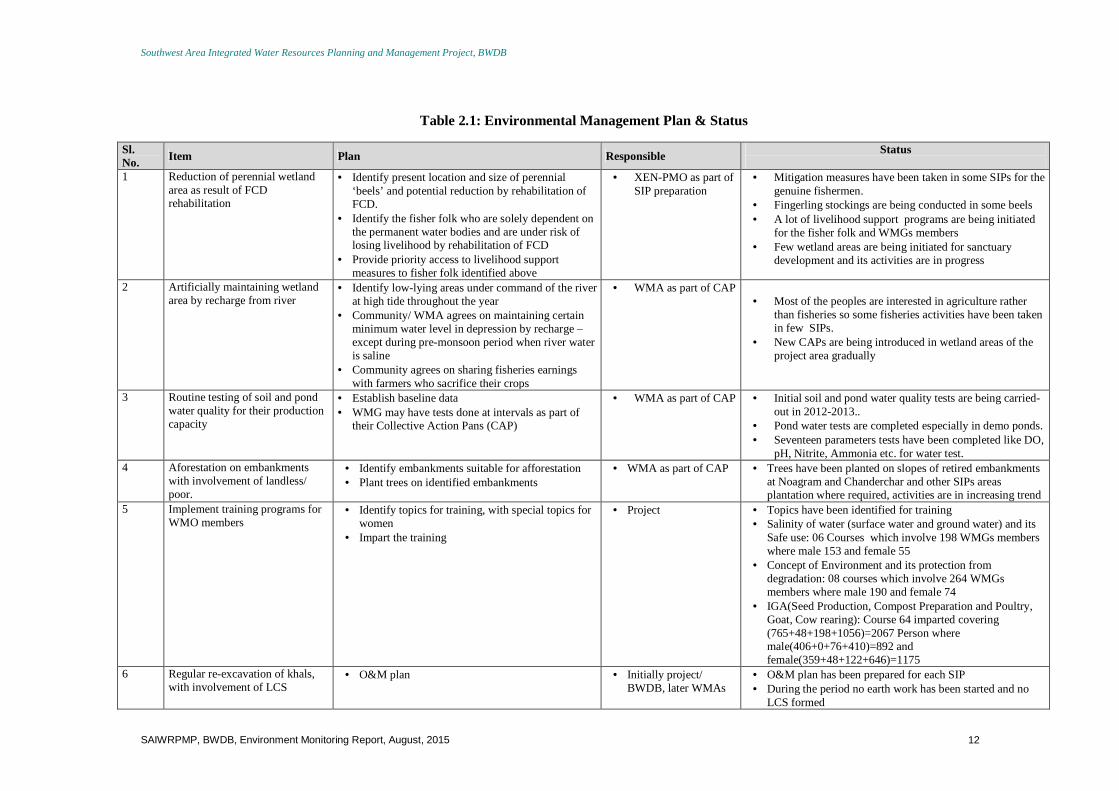
2.1: Environmental Management Plan
The individual Sub-unit Implementation Plan (SIP)reports contain an Environmental Management Plan
for the concerned subunit(s). The contents are summarized in the below Table 2.1 for all SIP’s.
Southwest Area Integrated Water Resources Planning and Management Project, BWDB
SAIWRPMP, BWDB, Environment Monitoring Report, August, 2015 12
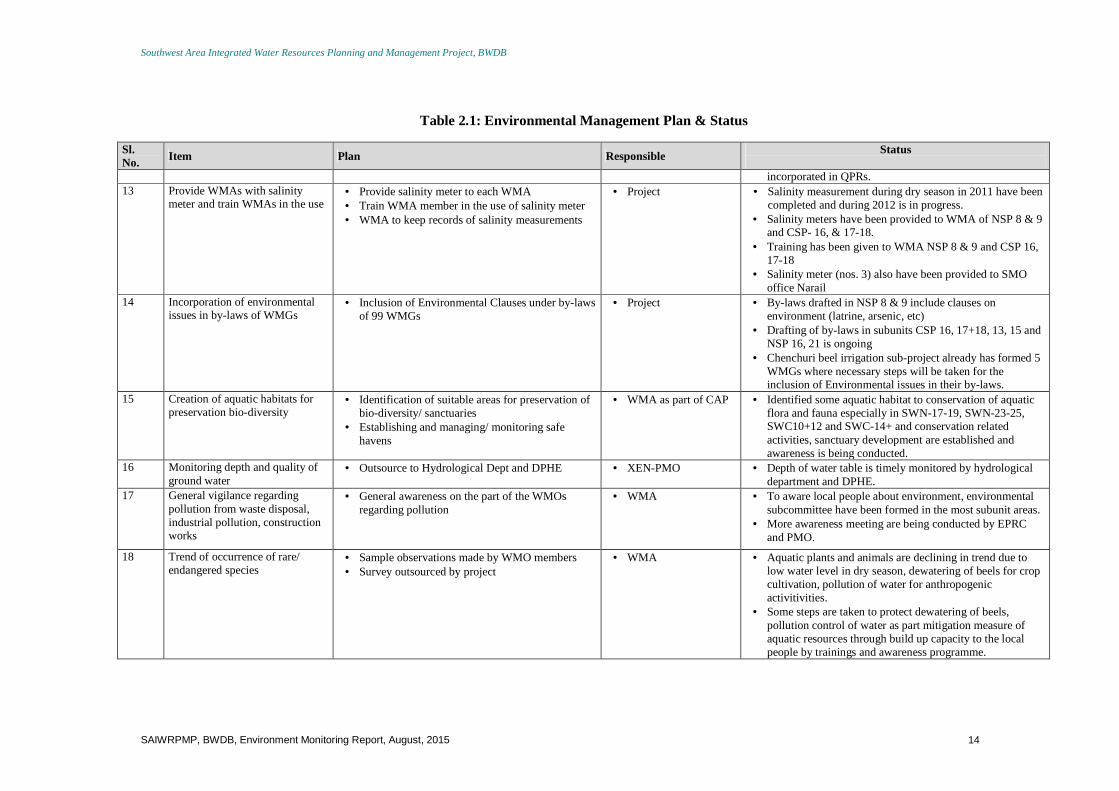
Table 2.1: Environmental Management Plan & Status
Sl. No. Item Plan Responsible Status
1 Reduction of perennial wetland
area as result of FCD rehabilitation
• Identify present location and size of perennial ‘beels’ and potential reduction by rehabilitation of FCD.
• Identify the fisher folk who are solely dependent on the permanent water bodies and are under risk of losing livelihood by rehabilitation of FCD
• Provide priority access to livelihood support measures to fisher folk identified above
• XEN-PMO as part of SIP preparation
• Mitigation measures have been taken in some SIPs for the genuine fishermen.
• Fingerling stockings are being conducted in some beels • A lot of livelihood support programs are being initiated
for the fisher folk and WMGs members • Few wetland areas are being initiated for sanctuary
development and its activities are in progress
2 Artificially maintaining wetland area by recharge from river
• Identify low-lying areas under command of the river at high tide throughout the year
• Community/ WMA agrees on maintaining certain minimum water level in depression by recharge – except during pre-monsoon period when river water is saline
• Community agrees on sharing fisheries earnings with farmers who sacrifice their crops
• WMA as part of CAP • Most of the peoples are interested in agriculture rather
than fisheries so some fisheries activities have been taken in few SIPs.
• New CAPs are being introduced in wetland areas of the project area gradually
3 Routine testing of soil and pond water quality for their production capacity
• Establish baseline data • WMG may have tests done at intervals as part of
their Collective Action Pans (CAP)
• WMA as part of CAP • Initial soil and pond water quality tests are being carried-out in 2012-2013..
• Pond water tests are completed especially in demo ponds. • Seventeen parameters tests have been completed like DO,
pH, Nitrite, Ammonia etc. for water test. 4 Aforestation on embankments
with involvement of landless/ poor.
• Identify embankments suitable for afforestation • Plant trees on identified embankments
• WMA as part of CAP • Trees have been planted on slopes of retired embankments at Noagram and Chanderchar and other SIPs areas plantation where required, activities are in increasing trend
5 Implement training programs for WMO members
• Identify topics for training, with special topics for women
• Impart the training
• Project • Topics have been identified for training • Salinity of water (surface water and ground water) and its
Safe use: 06 Courses which involve 198 WMGs members where male 153 and female 55
• Concept of Environment and its protection from degradation: 08 courses which involve 264 WMGs members where male 190 and female 74
• IGA(Seed Production, Compost Preparation and Poultry, Goat, Cow rearing): Course 64 imparted covering (765+48+198+1056)=2067 Person where male(406+0+76+410)=892 and female(359+48+122+646)=1175
6 Regular re-excavation of khals, with involvement of LCS
• O&M plan • Initially project/ BWDB, later WMAs
• O&M plan has been prepared for each SIP • During the period no earth work has been started and no
LCS formed
Southwest Area Integrated Water Resources Planning and Management Project, BWDB
SAIWRPMP, BWDB, Environment Monitoring Report, August, 2015 13
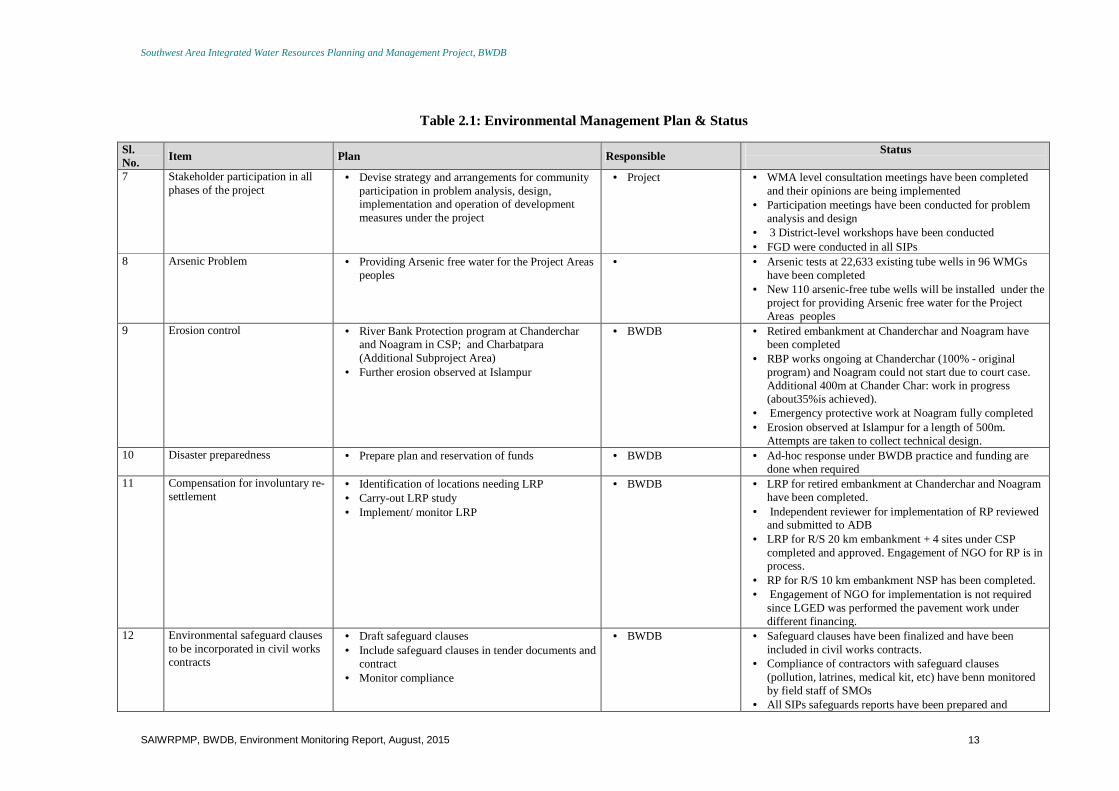
Table 2.1: Environmental Management Plan & Status
Sl. No. Item Plan Responsible Status
7 Stakeholder participation in all
phases of the project • Devise strategy and arrangements for community
participation in problem analysis, design, implementation and operation of development measures under the project
• Project • WMA level consultation meetings have been completed and their opinions are being implemented
• Participation meetings have been conducted for problem analysis and design
• 3 District-level workshops have been conducted • FGD were conducted in all SIPs
8 Arsenic Problem • Providing Arsenic free water for the Project Areas peoples
• • Arsenic tests at 22,633 existing tube wells in 96 WMGs have been completed
• New 110 arsenic-free tube wells will be installed under the project for providing Arsenic free water for the Project Areas peoples
9 Erosion control • River Bank Protection program at Chanderchar and Noagram in CSP; and Charbatpara (Additional Subproject Area)
• Further erosion observed at Islampur
• BWDB • Retired embankment at Chanderchar and Noagram have been completed
• RBP works ongoing at Chanderchar (100% - original program) and Noagram could not start due to court case. Additional 400m at Chander Char: work in progress (about35%is achieved).
• Emergency protective work at Noagram fully completed • Erosion observed at Islampur for a length of 500m.
Attempts are taken to collect technical design. 10 Disaster preparedness • Prepare plan and reservation of funds • BWDB • Ad-hoc response under BWDB practice and funding are
done when required 11 Compensation for involuntary re-
settlement • Identification of locations needing LRP • Carry-out LRP study • Implement/ monitor LRP
• BWDB • LRP for retired embankment at Chanderchar and Noagram have been completed.
• Independent reviewer for implementation of RP reviewed and submitted to ADB
• LRP for R/S 20 km embankment + 4 sites under CSP completed and approved. Engagement of NGO for RP is in process.
• RP for R/S 10 km embankment NSP has been completed. • Engagement of NGO for implementation is not required
since LGED was performed the pavement work under different financing.
12 Environmental safeguard clauses to be incorporated in civil works contracts
• Draft safeguard clauses • Include safeguard clauses in tender documents and
contract • Monitor compliance
• BWDB • Safeguard clauses have been finalized and have been included in civil works contracts.
• Compliance of contractors with safeguard clauses (pollution, latrines, medical kit, etc) have benn monitored by field staff of SMOs
• All SIPs safeguards reports have been prepared and
Southwest Area Integrated Water Resources Planning and Management Project, BWDB
SAIWRPMP, BWDB, Environment Monitoring Report, August, 2015 14
Table 2.1: Environmental Management Plan & Status
Sl. No. Item Plan Responsible Status
incorporated in QPRs.
13 Provide WMAs with salinity meter and train WMAs in the use
• Provide salinity meter to each WMA • Train WMA member in the use of salinity meter • WMA to keep records of salinity measurements
• Project • Salinity measurement during dry season in 2011 have been completed and during 2012 is in progress.
• Salinity meters have been provided to WMA of NSP 8 & 9 and CSP- 16, & 17-18.
• Training has been given to WMA NSP 8 & 9 and CSP 16, 17-18
• Salinity meter (nos. 3) also have been provided to SMO office Narail
14 Incorporation of environmental issues in by-laws of WMGs
• Inclusion of Environmental Clauses under by-laws of 99 WMGs
• Project • By-laws drafted in NSP 8 & 9 include clauses on environment (latrine, arsenic, etc)
• Drafting of by-laws in subunits CSP 16, 17+18, 13, 15 and NSP 16, 21 is ongoing
• Chenchuri beel irrigation sub-project already has formed 5 WMGs where necessary steps will be taken for the inclusion of Environmental issues in their by-laws.
15 Creation of aquatic habitats for preservation bio-diversity
• Identification of suitable areas for preservation of bio-diversity/ sanctuaries
• Establishing and managing/ monitoring safe havens
• WMA as part of CAP • Identified some aquatic habitat to conservation of aquatic flora and fauna especially in SWN-17-19, SWN-23-25, SWC10+12 and SWC-14+ and conservation related activities, sanctuary development are established and awareness is being conducted.
16 Monitoring depth and quality of ground water
• Outsource to Hydrological Dept and DPHE • XEN-PMO • Depth of water table is timely monitored by hydrological department and DPHE.
17 General vigilance regarding pollution from waste disposal, industrial pollution, construction works
• General awareness on the part of the WMOs regarding pollution
• WMA • To aware local people about environment, environmental subcommittee have been formed in the most subunit areas.
• More awareness meeting are being conducted by EPRC and PMO.
18 Trend of occurrence of rare/ endangered species
• Sample observations made by WMO members • Survey outsourced by project
• WMA • Aquatic plants and animals are declining in trend due to low water level in dry season, dewatering of beels for crop cultivation, pollution of water for anthropogenic activitivities.
• Some steps are taken to protect dewatering of beels, pollution control of water as part mitigation measure of aquatic resources through build up capacity to the local people by trainings and awareness programme.
Southwest Area Integrated Water Resources Planning and Management Project, BWDB
SAIWRPMP, BWDB, Environment Monitoring Report, August, 2015 15
2.2 Environmental Monitoring Plan
The environmental data collection and monitoring plan is based on the assumptions that rehabilitation and
development of FCD schemes may
� Reduce the number and size of perennial wetland areas and negatively affect pure fisher folks in
their livelihood as well as aquatic flora & fauna
� Reduce the natural grazing land and therefore indirectly contribute to reduction of number of
bovines
� Increase household dependency on fuel wood (rather than manure) as fuel for cooking
� Reduce the jungle area and thus contribute to reduction of terrestrial flora and fauna
� Lower the water table by increased use of tube wells for irrigation
The environmental monitoring plan status is showed in the below Table 2.2 & Sub Unit wise information
on perennial wetland & Environmental Monitoring Plan is described in Table 2.3 . Reporting of
Performances of Environmental Impact and safeguards monitoring parameters in different type of Civil
work (Sample format of Rehabilitation of Regulator, Khal Re-excavation) presented in Appendix 1 &
Sample Environmental Monitoring Matrix for construction work is presented in Appendix 2 .
`
Southwest Area Integrated Water Resources Planning and Management Project, BWDB
SAIWRPMP, BWDB, Environment Monitoring Report, August, 2015 16
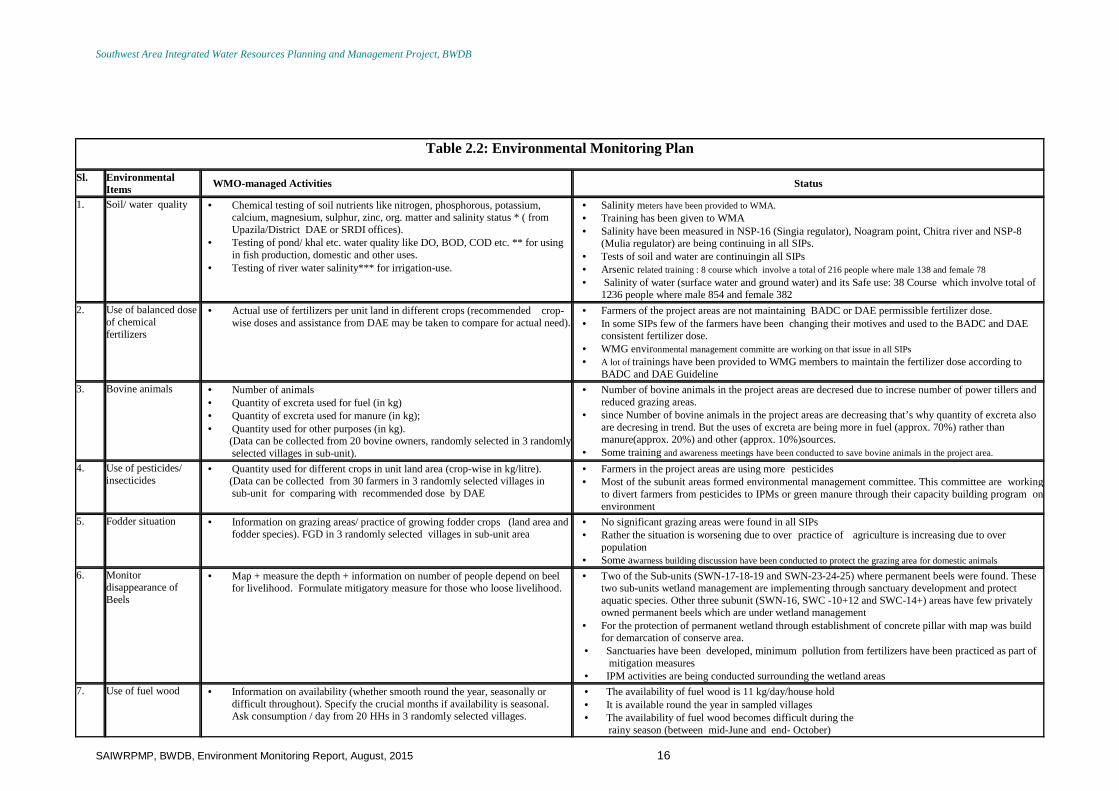
Table 2.2: Environmental Monitoring Plan
Sl. Environmental Items WMO-managed Activities Status
1. Soil/ water quality • Chemical testing of soil nutrients like nitrogen, phosphorous, potassium, calcium, magnesium, sulphur, zinc, org. matter and salinity status * ( from Upazila/District DAE or SRDI offices).
• Testing of pond/ khal etc. water quality like DO, BOD, COD etc. ** for using in fish production, domestic and other uses.
• Testing of river water salinity*** for irrigation-use.
• Salinity meters have been provided to WMA. • Training has been given to WMA • Salinity have been measured in NSP-16 (Singia regulator), Noagram point, Chitra river and NSP-8
(Mulia regulator) are being continuing in all SIPs. • Tests of soil and water are continuingin all SIPs • Arsenic related training : 8 course which involve a total of 216 people where male 138 and female 78 • Salinity of water (surface water and ground water) and its Safe use: 38 Course which involve total of
1236 people where male 854 and female 382
2. Use of balanced dose of chemical fertilizers
• Actual use of fertilizers per unit land in different crops (recommended crop-wise doses and assistance from DAE may be taken to compare for actual need).
• Farmers of the project areas are not maintaining BADC or DAE permissible fertilizer dose. • In some SIPs few of the farmers have been changing their motives and used to the BADC and DAE
consistent fertilizer dose. • WMG environmental management committe are working on that issue in all SIPs
• A lot of trainings have been provided to WMG members to maintain the fertilizer dose according to BADC and DAE Guideline
3. Bovine animals • Number of animals • Quantity of excreta used for fuel (in kg) • Quantity of excreta used for manure (in kg); • Quantity used for other purposes (in kg). (Data can be collected from 20 bovine owners, randomly selected in 3 randomly
selected villages in sub-unit).
• Number of bovine animals in the project areas are decresed due to increse number of power tillers and reduced grazing areas.
• since Number of bovine animals in the project areas are decreasing that’s why quantity of excreta also are decresing in trend. But the uses of excreta are being more in fuel (approx. 70%) rather than manure(approx. 20%) and other (approx. 10%)sources.
• Some training and awareness meetings have been conducted to save bovine animals in the project area.
4. Use of pesticides/ insecticides
• Quantity used for different crops in unit land area (crop-wise in kg/litre). (Data can be collected from 30 farmers in 3 randomly selected villages in
sub-unit for comparing with recommended dose by DAE
• Farmers in the project areas are using more pesticides • Most of the subunit areas formed environmental management committee. This committee are working
to divert farmers from pesticides to IPMs or green manure through their capacity building program on environment
5. Fodder situation • Information on grazing areas/ practice of growing fodder crops (land area and fodder species). FGD in 3 randomly selected villages in sub-unit area
• No significant grazing areas were found in all SIPs • Rather the situation is worsening due to over practice of agriculture is increasing due to over
population • Some awarness building discussion have been conducted to protect the grazing area for domestic animals
6. Monitor disappearance of Beels
• Map + measure the depth + information on number of people depend on beel for livelihood. Formulate mitigatory measure for those who loose livelihood.
• Two of the Sub-units (SWN-17-18-19 and SWN-23-24-25) where permanent beels were found. These two sub-units wetland management are implementing through sanctuary development and protect aquatic species. Other three subunit (SWN-16, SWC -10+12 and SWC-14+) areas have few privately owned permanent beels which are under wetland management
• For the protection of permanent wetland through establishment of concrete pillar with map was build for demarcation of conserve area.
• Sanctuaries have been developed, minimum pollution from fertilizers have been practiced as part of mitigation measures
• IPM activities are being conducted surrounding the wetland areas 7. Use of fuel wood • Information on availability (whether smooth round the year, seasonally or
difficult throughout). Specify the crucial months if availability is seasonal. Ask consumption / day from 20 HHs in 3 randomly selected villages.
• The availability of fuel wood is 11 kg/day/house hold • It is available round the year in sampled villages • The availability of fuel wood becomes difficult during the
rainy season (between mid-June and end- October)
Southwest Area Integrated Water Resources Planning and Management Project, BWDB
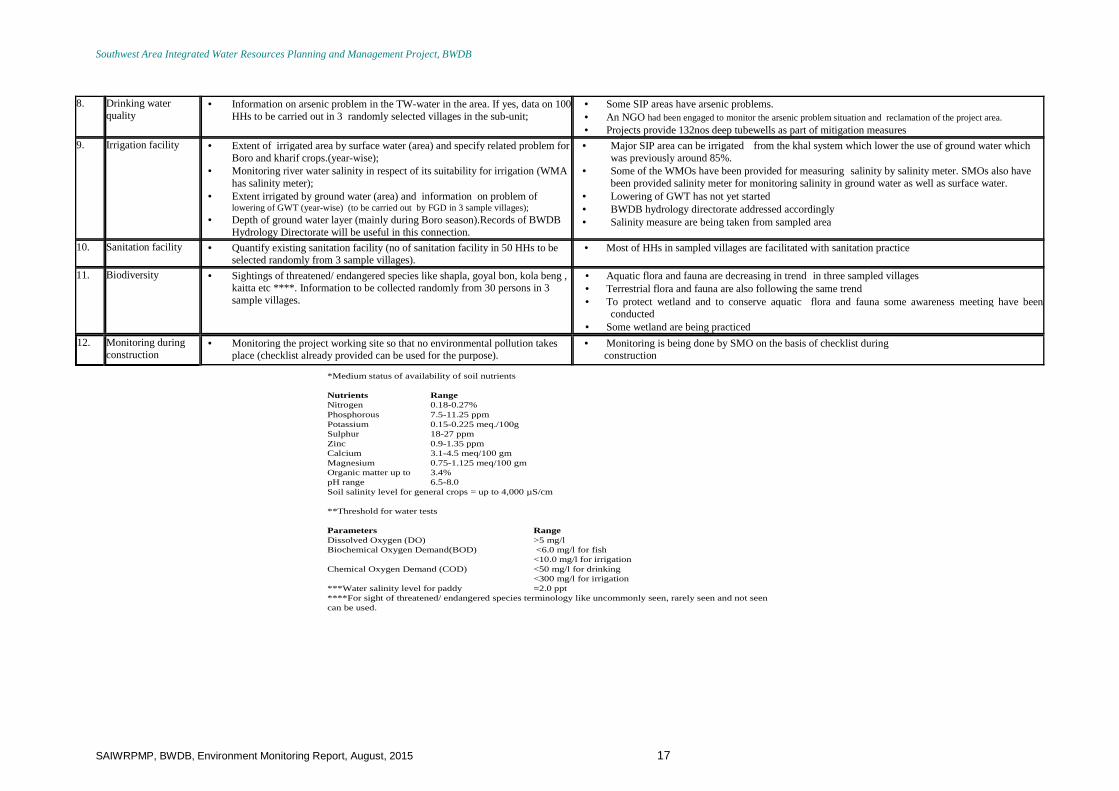
SAIWRPMP, BWDB, Environment Monitoring Report, August, 2015 17
8. Drinking water quality
• Information on arsenic problem in the TW-water in the area. If yes, data on 100 HHs to be carried out in 3 randomly selected villages in the sub-unit;
• Some SIP areas have arsenic problems. • An NGO had been engaged to monitor the arsenic problem situation and reclamation of the project area. • Projects provide 132nos deep tubewells as part of mitigation measures
9. Irrigation facility • Extent of irrigated area by surface water (area) and specify related problem for Boro and kharif crops.(year-wise);
• Monitoring river water salinity in respect of its suitability for irrigation (WMA has salinity meter);
• Extent irrigated by ground water (area) and information on problem of lowering of GWT (year-wise) (to be carried out by FGD in 3 sample villages);
• Depth of ground water layer (mainly during Boro season).Records of BWDB Hydrology Directorate will be useful in this connection.
• Major SIP area can be irrigated from the khal system which lower the use of ground water which was previously around 85%.
• Some of the WMOs have been provided for measuring salinity by salinity meter. SMOs also have been provided salinity meter for monitoring salinity in ground water as well as surface water.
• Lowering of GWT has not yet started • BWDB hydrology directorate addressed accordingly • Salinity measure are being taken from sampled area
10. Sanitation facility • Quantify existing sanitation facility (no of sanitation facility in 50 HHs to be selected randomly from 3 sample villages).
• Most of HHs in sampled villages are facilitated with sanitation practice
11. Biodiversity • Sightings of threatened/ endangered species like shapla, goyal bon, kola beng , kaitta etc ****. Information to be collected randomly from 30 persons in 3 sample villages.
• Aquatic flora and fauna are decreasing in trend in three sampled villages • Terrestrial flora and fauna are also following the same trend • To protect wetland and to conserve aquatic flora and fauna some awareness meeting have been
conducted • Some wetland are being practiced
12. Monitoring during construction
• Monitoring the project working site so that no environmental pollution takes place (checklist already provided can be used for the purpose).
• Monitoring is being done by SMO on the basis of checklist during construction
*Medium status of availability of soil nutrients
Nutrients Range Nitrogen 0.18-0.27%Phosphorous 7.5-11.25 ppmPotassium 0.15-0.225 meq./100gSulphur 18-27 ppmZinc 0.9-1.35 ppmCalcium 3.1-4.5 meq/100 gmMagnesium 0.75-1.125 meq/100 gmOrganic matter up to 3.4% pH range 6.5-8.0Soil salinity level for general crops = up to 4,000 µS/cm
**Threshold for water tests
Parameters RangeDissolved Oxygen (DO) >5 mg/l Biochemical Oxygen Demand(BOD) <6.0 mg/l for fish
<10.0 mg/l for irrigationChemical Oxygen Demand (COD) <50 mg/l for drinking
<300 mg/l for irrigation***Water salinity level for paddy =2.0 ppt****For sight of threatened/ endangered species terminology like uncommonly seen, rarely seen and not seen can be used.
Southwest Area Integrated Water Resources Planning and Management Project, BWDB
SAIWRPMP, BWDB, Environment Monitoring Report, August, 2015 18
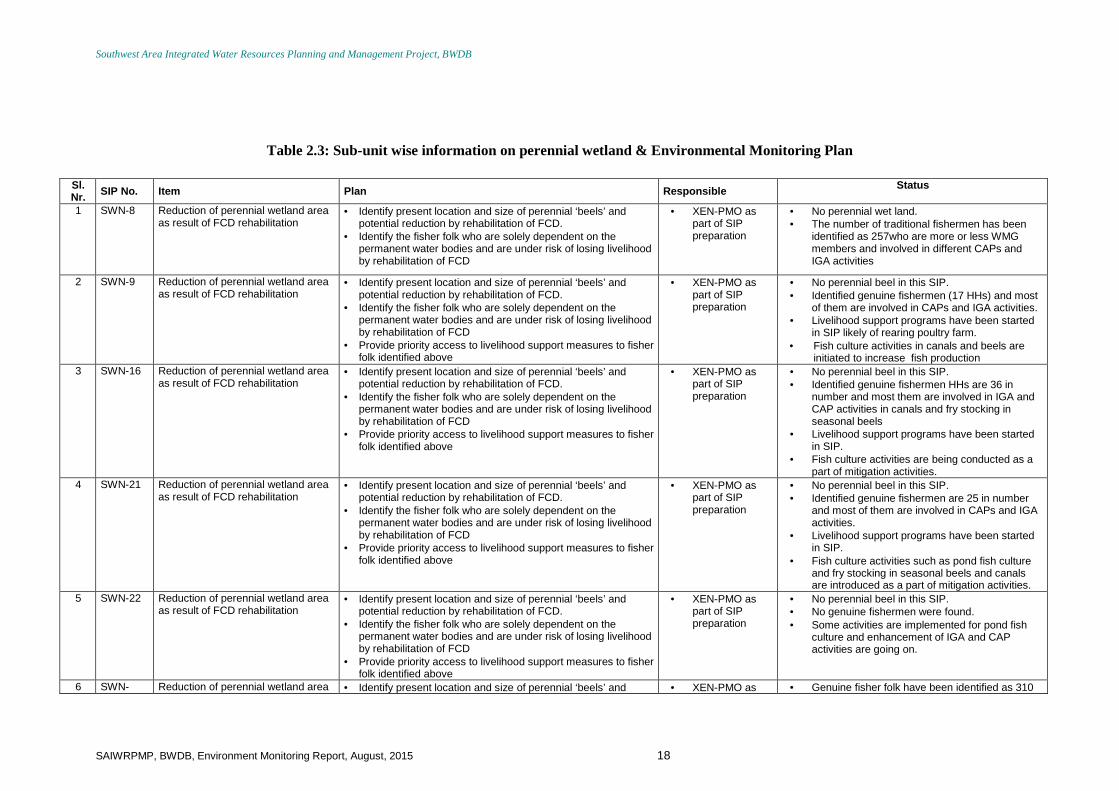
Table 2.3: Sub-unit wise information on perennial wetland & Environmental Monitoring Plan
Sl. Nr. SIP No. Item Plan Responsible Status
1 SWN-8 Reduction of perennial wetland area
as result of FCD rehabilitation • Identify present location and size of perennial ‘beels’ and
potential reduction by rehabilitation of FCD. • Identify the fisher folk who are solely dependent on the
permanent water bodies and are under risk of losing livelihood by rehabilitation of FCD
• XEN-PMO as part of SIP preparation
• No perennial wet land. • The number of traditional fishermen has been
identified as 257who are more or less WMG members and involved in different CAPs and IGA activities
2 SWN-9 Reduction of perennial wetland area as result of FCD rehabilitation
• Identify present location and size of perennial ‘beels’ and potential reduction by rehabilitation of FCD.
• Identify the fisher folk who are solely dependent on the permanent water bodies and are under risk of losing livelihood by rehabilitation of FCD
• Provide priority access to livelihood support measures to fisher folk identified above
• XEN-PMO as part of SIP preparation
• No perennial beel in this SIP. • Identified genuine fishermen (17 HHs) and most
of them are involved in CAPs and IGA activities. • Livelihood support programs have been started
in SIP likely of rearing poultry farm. • Fish culture activities in canals and beels are
initiated to increase fish production 3 SWN-16 Reduction of perennial wetland area
as result of FCD rehabilitation • Identify present location and size of perennial ‘beels’ and
potential reduction by rehabilitation of FCD. • Identify the fisher folk who are solely dependent on the
permanent water bodies and are under risk of losing livelihood by rehabilitation of FCD
• Provide priority access to livelihood support measures to fisher folk identified above
• XEN-PMO as part of SIP preparation
• No perennial beel in this SIP. • Identified genuine fishermen HHs are 36 in
number and most them are involved in IGA and CAP activities in canals and fry stocking in seasonal beels
• Livelihood support programs have been started in SIP.
• Fish culture activities are being conducted as a part of mitigation activities.
4 SWN-21 Reduction of perennial wetland area as result of FCD rehabilitation
• Identify present location and size of perennial ‘beels’ and potential reduction by rehabilitation of FCD.
• Identify the fisher folk who are solely dependent on the permanent water bodies and are under risk of losing livelihood by rehabilitation of FCD
• Provide priority access to livelihood support measures to fisher folk identified above
• XEN-PMO as part of SIP preparation
• No perennial beel in this SIP. • Identified genuine fishermen are 25 in number
and most of them are involved in CAPs and IGA activities.
• Livelihood support programs have been started in SIP.
• Fish culture activities such as pond fish culture and fry stocking in seasonal beels and canals are introduced as a part of mitigation activities.
5 SWN-22 Reduction of perennial wetland area as result of FCD rehabilitation
• Identify present location and size of perennial ‘beels’ and potential reduction by rehabilitation of FCD.
• Identify the fisher folk who are solely dependent on the permanent water bodies and are under risk of losing livelihood by rehabilitation of FCD
• Provide priority access to livelihood support measures to fisher folk identified above
• XEN-PMO as part of SIP preparation
• No perennial beel in this SIP. • No genuine fishermen were found. • Some activities are implemented for pond fish
culture and enhancement of IGA and CAP activities are going on.
6 SWN- Reduction of perennial wetland area • Identify present location and size of perennial ‘beels’ and • XEN-PMO as • Genuine fisher folk have been identified as 310
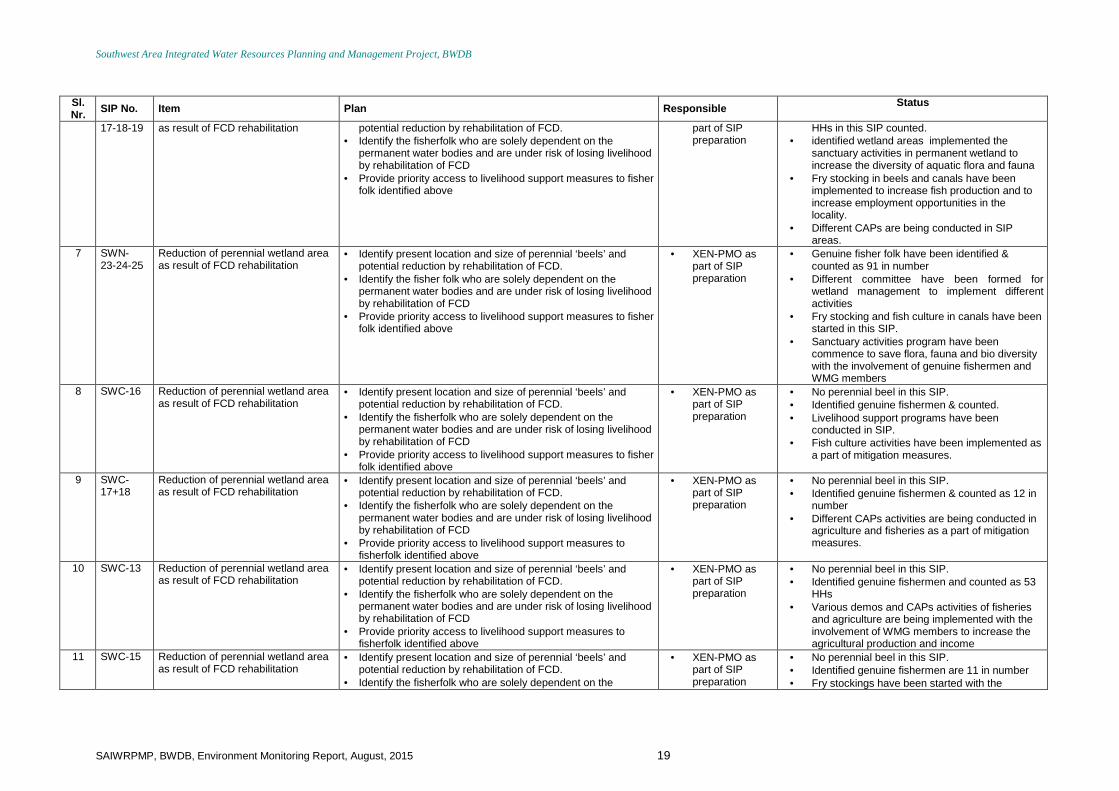
Southwest Area Integrated Water Resources Planning and Management Project, BWDB
SAIWRPMP, BWDB, Environment Monitoring Report, August, 2015 19
Sl. Nr. SIP No. Item Plan Responsible Status
17-18-19 as result of FCD rehabilitation potential reduction by rehabilitation of FCD.
• Identify the fisherfolk who are solely dependent on the permanent water bodies and are under risk of losing livelihood by rehabilitation of FCD
• Provide priority access to livelihood support measures to fisher folk identified above
part of SIP preparation
HHs in this SIP counted. • identified wetland areas implemented the
sanctuary activities in permanent wetland to increase the diversity of aquatic flora and fauna
• Fry stocking in beels and canals have been implemented to increase fish production and to increase employment opportunities in the locality.
• Different CAPs are being conducted in SIP areas.
7 SWN- 23-24-25
Reduction of perennial wetland area as result of FCD rehabilitation
• Identify present location and size of perennial ‘beels’ and potential reduction by rehabilitation of FCD.
• Identify the fisher folk who are solely dependent on the permanent water bodies and are under risk of losing livelihood by rehabilitation of FCD
• Provide priority access to livelihood support measures to fisher folk identified above
• XEN-PMO as part of SIP preparation
• Genuine fisher folk have been identified & counted as 91 in number
• Different committee have been formed for wetland management to implement different activities
• Fry stocking and fish culture in canals have been started in this SIP.
• Sanctuary activities program have been commence to save flora, fauna and bio diversity with the involvement of genuine fishermen and WMG members
8 SWC-16 Reduction of perennial wetland area as result of FCD rehabilitation
• Identify present location and size of perennial ‘beels’ and potential reduction by rehabilitation of FCD.
• Identify the fisherfolk who are solely dependent on the permanent water bodies and are under risk of losing livelihood by rehabilitation of FCD
• Provide priority access to livelihood support measures to fisher folk identified above
• XEN-PMO as part of SIP preparation
• No perennial beel in this SIP. • Identified genuine fishermen & counted. • Livelihood support programs have been
conducted in SIP. • Fish culture activities have been implemented as
a part of mitigation measures.
9 SWC-17+18
Reduction of perennial wetland area as result of FCD rehabilitation
• Identify present location and size of perennial ‘beels’ and potential reduction by rehabilitation of FCD.
• Identify the fisherfolk who are solely dependent on the permanent water bodies and are under risk of losing livelihood by rehabilitation of FCD
• Provide priority access to livelihood support measures to fisherfolk identified above
• XEN-PMO as part of SIP preparation
• No perennial beel in this SIP. • Identified genuine fishermen & counted as 12 in
number • Different CAPs activities are being conducted in
agriculture and fisheries as a part of mitigation measures.
10 SWC-13 Reduction of perennial wetland area as result of FCD rehabilitation
• Identify present location and size of perennial ‘beels’ and potential reduction by rehabilitation of FCD.
• Identify the fisherfolk who are solely dependent on the permanent water bodies and are under risk of losing livelihood by rehabilitation of FCD
• Provide priority access to livelihood support measures to fisherfolk identified above
• XEN-PMO as part of SIP preparation
• No perennial beel in this SIP. • Identified genuine fishermen and counted as 53
HHs • Various demos and CAPs activities of fisheries
and agriculture are being implemented with the involvement of WMG members to increase the agricultural production and income
11 SWC-15 Reduction of perennial wetland area as result of FCD rehabilitation
• Identify present location and size of perennial ‘beels’ and potential reduction by rehabilitation of FCD.
• Identify the fisherfolk who are solely dependent on the
• XEN-PMO as part of SIP preparation
• No perennial beel in this SIP. • Identified genuine fishermen are 11 in number • Fry stockings have been started with the
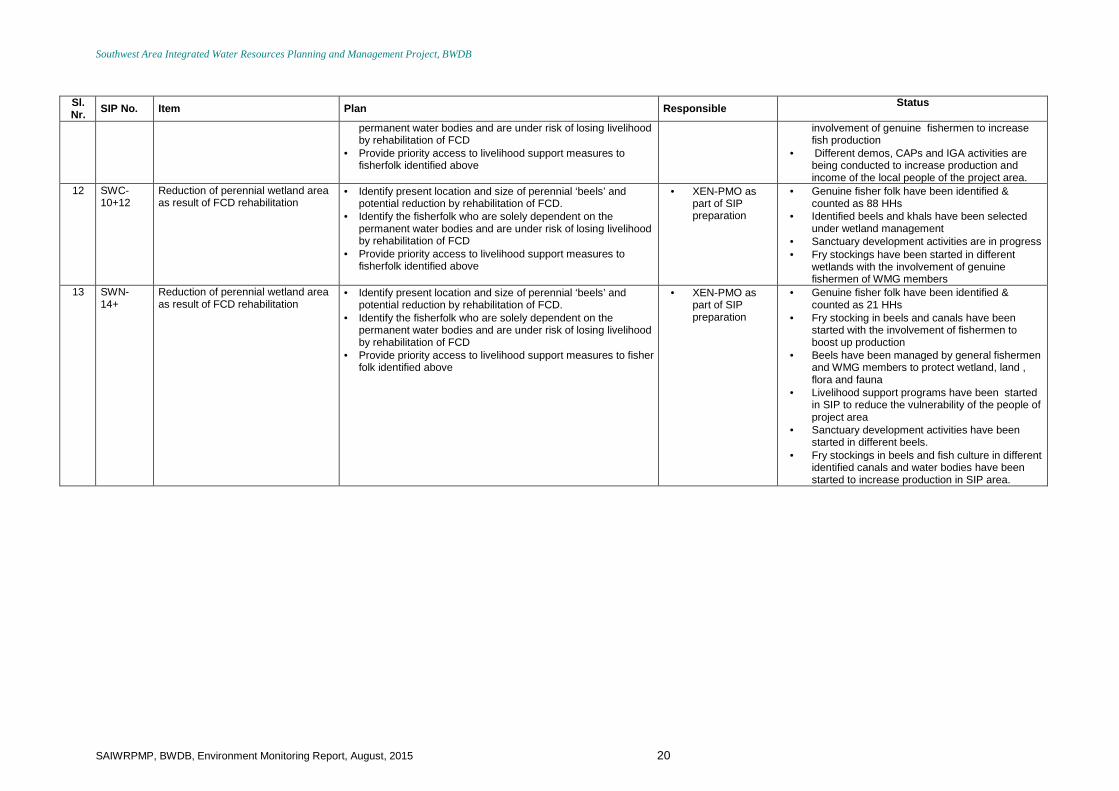
Southwest Area Integrated Water Resources Planning and Management Project, BWDB
SAIWRPMP, BWDB, Environment Monitoring Report, August, 2015 20
Sl. Nr. SIP No. Item Plan Responsible Status
permanent water bodies and are under risk of losing livelihood by rehabilitation of FCD
• Provide priority access to livelihood support measures to fisherfolk identified above
involvement of genuine fishermen to increase fish production
• Different demos, CAPs and IGA activities are being conducted to increase production and income of the local people of the project area.
12 SWC-10+12
Reduction of perennial wetland area as result of FCD rehabilitation
• Identify present location and size of perennial ‘beels’ and potential reduction by rehabilitation of FCD.
• Identify the fisherfolk who are solely dependent on the permanent water bodies and are under risk of losing livelihood by rehabilitation of FCD
• Provide priority access to livelihood support measures to fisherfolk identified above
• XEN-PMO as part of SIP preparation
• Genuine fisher folk have been identified & counted as 88 HHs
• Identified beels and khals have been selected under wetland management
• Sanctuary development activities are in progress • Fry stockings have been started in different
wetlands with the involvement of genuine fishermen of WMG members
13 SWN- 14+
Reduction of perennial wetland area as result of FCD rehabilitation
• Identify present location and size of perennial ‘beels’ and potential reduction by rehabilitation of FCD.
• Identify the fisherfolk who are solely dependent on the permanent water bodies and are under risk of losing livelihood by rehabilitation of FCD
• Provide priority access to livelihood support measures to fisher folk identified above
• XEN-PMO as part of SIP preparation
• Genuine fisher folk have been identified & counted as 21 HHs
• Fry stocking in beels and canals have been started with the involvement of fishermen to boost up production
• Beels have been managed by general fishermen and WMG members to protect wetland, land , flora and fauna
• Livelihood support programs have been started in SIP to reduce the vulnerability of the people of project area
• Sanctuary development activities have been started in different beels.
• Fry stockings in beels and fish culture in different identified canals and water bodies have been started to increase production in SIP area.
Southwest Area Integrated Water Resources Planning and Management Project, BWDB
SAIWRPMP, BWDB, Environment Monitoring Report, August, 2015 21
3. Results of environmental monitoring and complian ce results
During participatory planning of 13 sub-units, 7 under NSP and 6 under CBSP, Laboratory analyses of surface water (ponds and khals) have been carried out based on requirements of fishery production and the results are furnished below batch wise for 3 batches: Results of laboratory analyses of water samples in different SIP are described separately in below tables.
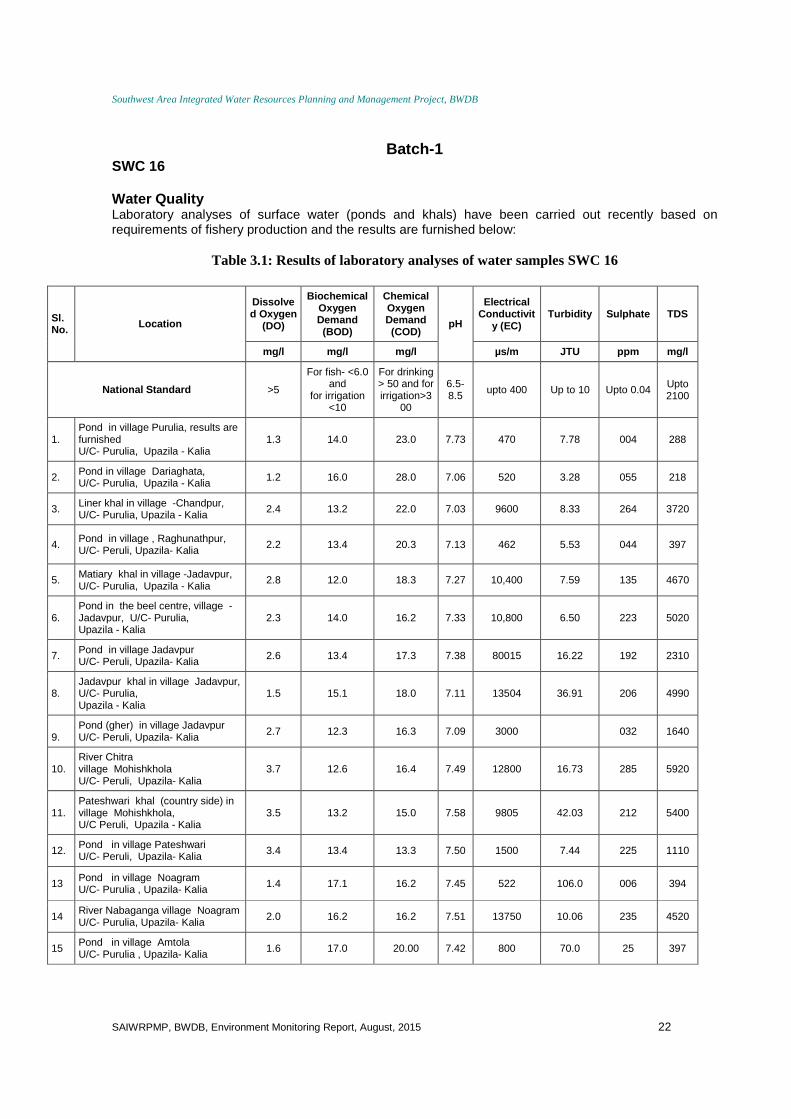
Southwest Area Integrated Water Resources Planning and Management Project, BWDB
SAIWRPMP, BWDB, Environment Monitoring Report, August, 2015 22
Batch-1 SWC 16 Water Quality Laboratory analyses of surface water (ponds and khals) have been carried out recently based on requirements of fishery production and the results are furnished below:
Table 3.1: Results of laboratory analyses of water samples SWC 16
Sl. No. Location
Dissolved Oxygen
(DO)
Biochemical Oxygen Demand (BOD)
Chemical Oxygen Demand (COD)
pH
Electrical Conductivit
y (EC) Turbidity Sulphate TDS
mg/l mg/l mg/l µs/m JTU ppm mg/l
National Standard >5
For fish- <6.0 and
for irrigation <10
For drinking > 50 and for irrigation>3
00
6.5-8.5 upto 400 Up to 10 Upto 0.04 Upto
2100
1. Pond in village Purulia, results are furnished U/C- Purulia, Upazila - Kalia
1.3 14.0 23.0 7.73 470 7.78 004 288
2. Pond in village Dariaghata, U/C- Purulia, Upazila - Kalia 1.2 16.0 28.0 7.06 520 3.28 055 218
3. Liner khal in village -Chandpur, U/C- Purulia, Upazila - Kalia 2.4 13.2 22.0 7.03 9600 8.33 264 3720
4. Pond in village , Raghunathpur, U/C- Peruli, Upazila- Kalia 2.2 13.4 20.3 7.13 462 5.53 044 397
5. Matiary khal in village -Jadavpur, U/C- Purulia, Upazila - Kalia
2.8 12.0 18.3 7.27 10,400 7.59 135 4670
6. Pond in the beel centre, village -Jadavpur, U/C- Purulia, Upazila - Kalia
2.3 14.0 16.2 7.33 10,800 6.50 223 5020
7. Pond in village Jadavpur U/C- Peruli, Upazila- Kalia 2.6 13.4 17.3 7.38 80015 16.22 192 2310
8. Jadavpur khal in village Jadavpur, U/C- Purulia, Upazila - Kalia
1.5 15.1 18.0 7.11 13504 36.91 206 4990
9.
Pond (gher) in village Jadavpur U/C- Peruli, Upazila- Kalia 2.7 12.3 16.3 7.09 3000 032 1640
10. River Chitra village Mohishkhola U/C- Peruli, Upazila- Kalia
3.7 12.6 16.4 7.49 12800 16.73 285 5920
11. Pateshwari khal (country side) in village Mohishkhola, U/C Peruli, Upazila - Kalia
3.5 13.2 15.0 7.58 9805 42.03 212 5400
12. Pond in village Pateshwari U/C- Peruli, Upazila- Kalia 3.4 13.4 13.3 7.50 1500 7.44 225 1110
13 Pond in village Noagram U/C- Purulia , Upazila- Kalia 1.4 17.1 16.2 7.45 522 106.0 006 394
14 River Nabaganga village Noagram U/C- Purulia, Upazila- Kalia 2.0 16.2 16.2 7.51 13750 10.06 235 4520
15 Pond in village Amtola U/C- Purulia , Upazila- Kalia 1.6 17.0 20.00 7.42 800 70.0 25 397
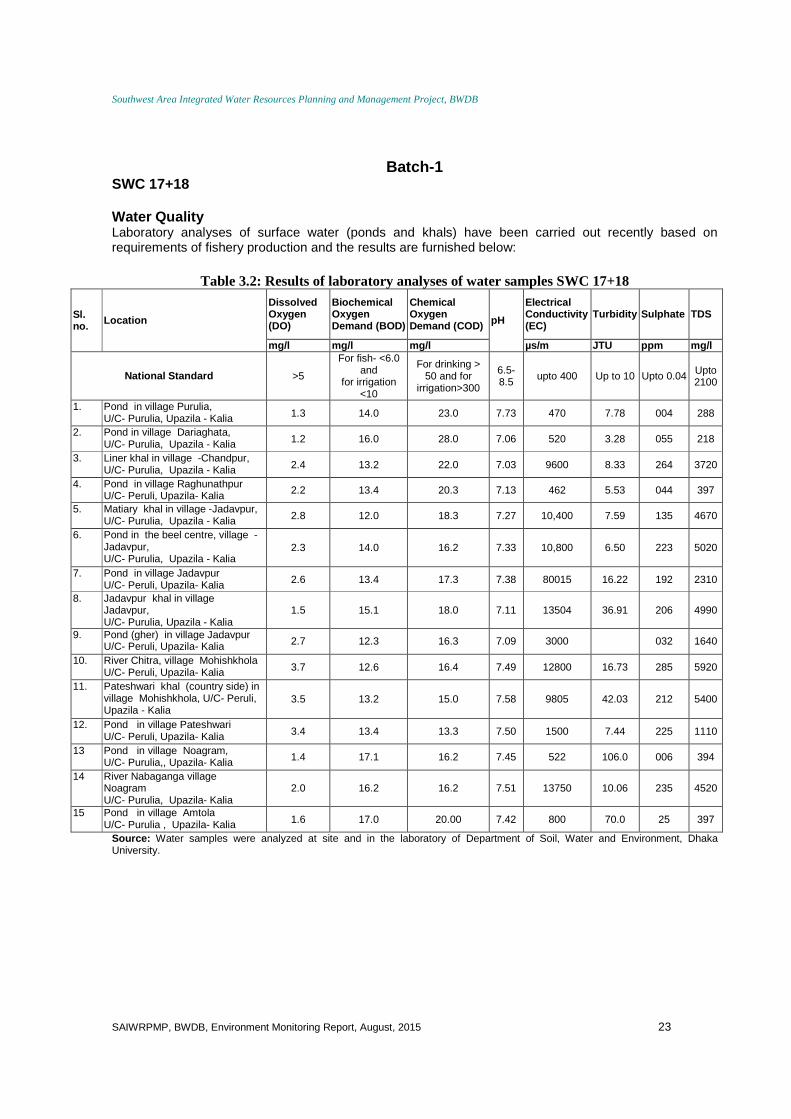
Southwest Area Integrated Water Resources Planning and Management Project, BWDB
SAIWRPMP, BWDB, Environment Monitoring Report, August, 2015 23
Batch-1
SWC 17+18 Water Quality Laboratory analyses of surface water (ponds and khals) have been carried out recently based on requirements of fishery production and the results are furnished below:
Table 3.2: Results of laboratory analyses of water samples SWC 17+18
Sl. no. Location
Dissolved Oxygen (DO)
Biochemical Oxygen Demand (BOD)
Chemical Oxygen Demand (COD) pH
Electrical Conductivity (EC)
Turbidity Sulphate TDS
mg/l mg/l mg/l µs/m JTU ppm mg/l
National Standard >5
For fish- <6.0 and
for irrigation <10
For drinking > 50 and for
irrigation>300
6.5-8.5 upto 400 Up to 10 Upto 0.04 Upto
2100
1. Pond in village Purulia, U/C- Purulia, Upazila - Kalia 1.3 14.0 23.0 7.73 470 7.78 004 288
2. Pond in village Dariaghata, U/C- Purulia, Upazila - Kalia 1.2 16.0 28.0 7.06 520 3.28 055 218
3. Liner khal in village -Chandpur, U/C- Purulia, Upazila - Kalia 2.4 13.2 22.0 7.03 9600 8.33 264 3720
4. Pond in village Raghunathpur U/C- Peruli, Upazila- Kalia 2.2 13.4 20.3 7.13 462 5.53 044 397
5. Matiary khal in village -Jadavpur, U/C- Purulia, Upazila - Kalia 2.8 12.0 18.3 7.27 10,400 7.59 135 4670
6. Pond in the beel centre, village -Jadavpur, U/C- Purulia, Upazila - Kalia
2.3 14.0 16.2 7.33 10,800 6.50 223 5020
7. Pond in village Jadavpur U/C- Peruli, Upazila- Kalia 2.6 13.4 17.3 7.38 80015 16.22 192 2310
8. Jadavpur khal in village Jadavpur, U/C- Purulia, Upazila - Kalia
1.5 15.1 18.0 7.11 13504 36.91 206 4990
9. Pond (gher) in village Jadavpur U/C- Peruli, Upazila- Kalia 2.7 12.3 16.3 7.09 3000 032 1640
10. River Chitra, village Mohishkhola U/C- Peruli, Upazila- Kalia 3.7 12.6 16.4 7.49 12800 16.73 285 5920
11. Pateshwari khal (country side) in village Mohishkhola, U/C- Peruli, Upazila - Kalia
3.5 13.2 15.0 7.58 9805 42.03 212 5400
12. Pond in village Pateshwari U/C- Peruli, Upazila- Kalia 3.4 13.4 13.3 7.50 1500 7.44 225 1110
13 Pond in village Noagram, U/C- Purulia,, Upazila- Kalia 1.4 17.1 16.2 7.45 522 106.0 006 394
14 River Nabaganga village Noagram U/C- Purulia, Upazila- Kalia
2.0 16.2 16.2 7.51 13750 10.06 235 4520
15 Pond in village Amtola U/C- Purulia , Upazila- Kalia 1.6 17.0 20.00 7.42 800 70.0 25 397
Source: Water samples were analyzed at site and in the laboratory of Department of Soil, Water and Environment, Dhaka University.
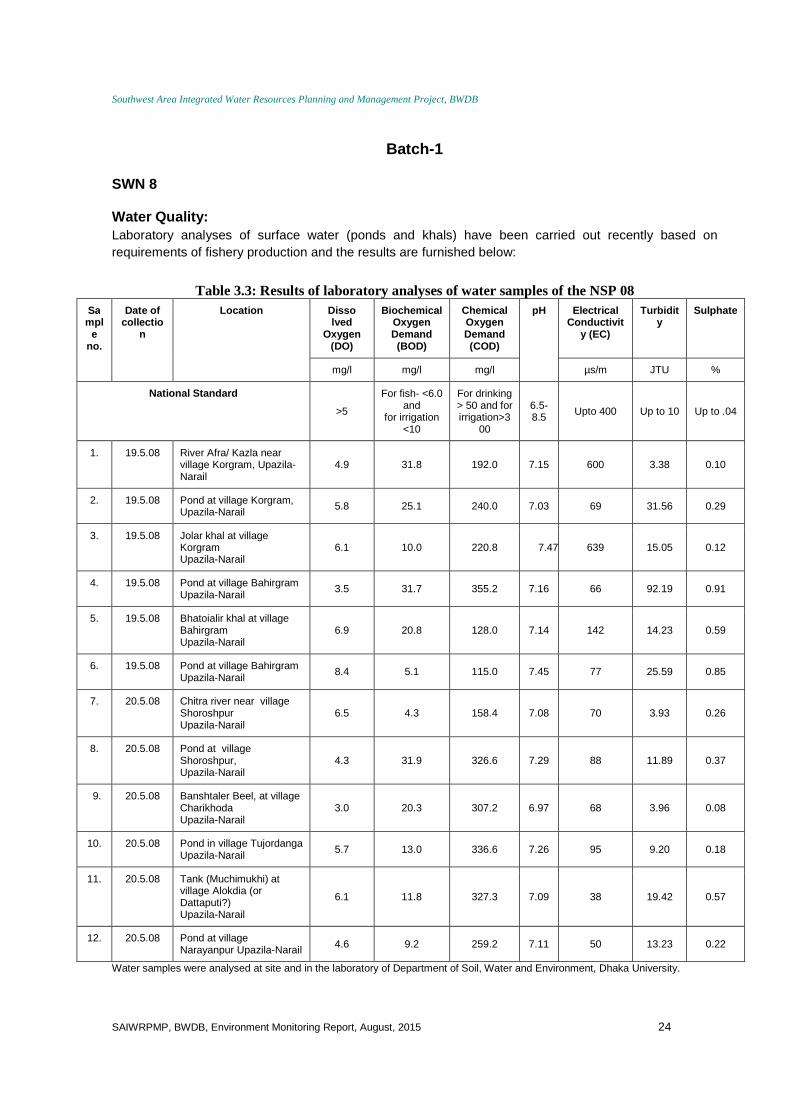
Southwest Area Integrated Water Resources Planning and Management Project, BWDB
SAIWRPMP, BWDB, Environment Monitoring Report, August, 2015 24
Batch-1 SWN 8 Water Quality: Laboratory analyses of surface water (ponds and khals) have been carried out recently based on requirements of fishery production and the results are furnished below:
Table 3.3: Results of laboratory analyses of water samples of the NSP 08
Sampl
e no.
Date of collectio
n
Location Disso lved
Oxygen (DO)
Biochemical Oxygen Demand (BOD)
Chemical Oxygen Demand (COD)
pH Electrical Conductivit
y (EC)
Turbidity
Sulphate
mg/l mg/l mg/l µs/m JTU %
National Standard
>5
For fish- <6.0 and
for irrigation <10
For drinking > 50 and for irrigation>3
00
6.5-8.5 Upto 400 Up to 10 Up to .04
1. 19.5.08 River Afra/ Kazla near village Korgram, Upazila-Narail
4.9 31.8 192.0 7.15 600 3.38 0.10
2. 19.5.08 Pond at village Korgram, Upazila-Narail 5.8 25.1 240.0 7.03 69 31.56 0.29
3. 19.5.08 Jolar khal at village Korgram Upazila-Narail
6.1 10.0 220.8 7.47 639 15.05 0.12
4. 19.5.08 Pond at village Bahirgram Upazila-Narail
3.5 31.7 355.2 7.16 66 92.19 0.91
5. 19.5.08 Bhatoialir khal at village Bahirgram Upazila-Narail
6.9 20.8 128.0 7.14 142 14.23 0.59
6. 19.5.08 Pond at village Bahirgram Upazila-Narail
8.4 5.1 115.0 7.45 77 25.59 0.85
7. 20.5.08 Chitra river near village Shoroshpur Upazila-Narail
6.5 4.3 158.4 7.08 70 3.93 0.26
8. 20.5.08 Pond at village Shoroshpur, Upazila-Narail
4.3 31.9 326.6 7.29 88 11.89 0.37
9. 20.5.08 Banshtaler Beel, at village Charikhoda Upazila-Narail
3.0 20.3 307.2 6.97 68 3.96 0.08
10. 20.5.08 Pond in village Tujordanga Upazila-Narail 5.7 13.0 336.6 7.26 95 9.20 0.18
11. 20.5.08 Tank (Muchimukhi) at village Alokdia (or Dattaputi?) Upazila-Narail
6.1 11.8 327.3 7.09 38 19.42 0.57
12. 20.5.08 Pond at village Narayanpur Upazila-Narail 4.6 9.2 259.2 7.11 50 13.23 0.22
Water samples were analysed at site and in the laboratory of Department of Soil, Water and Environment, Dhaka University.
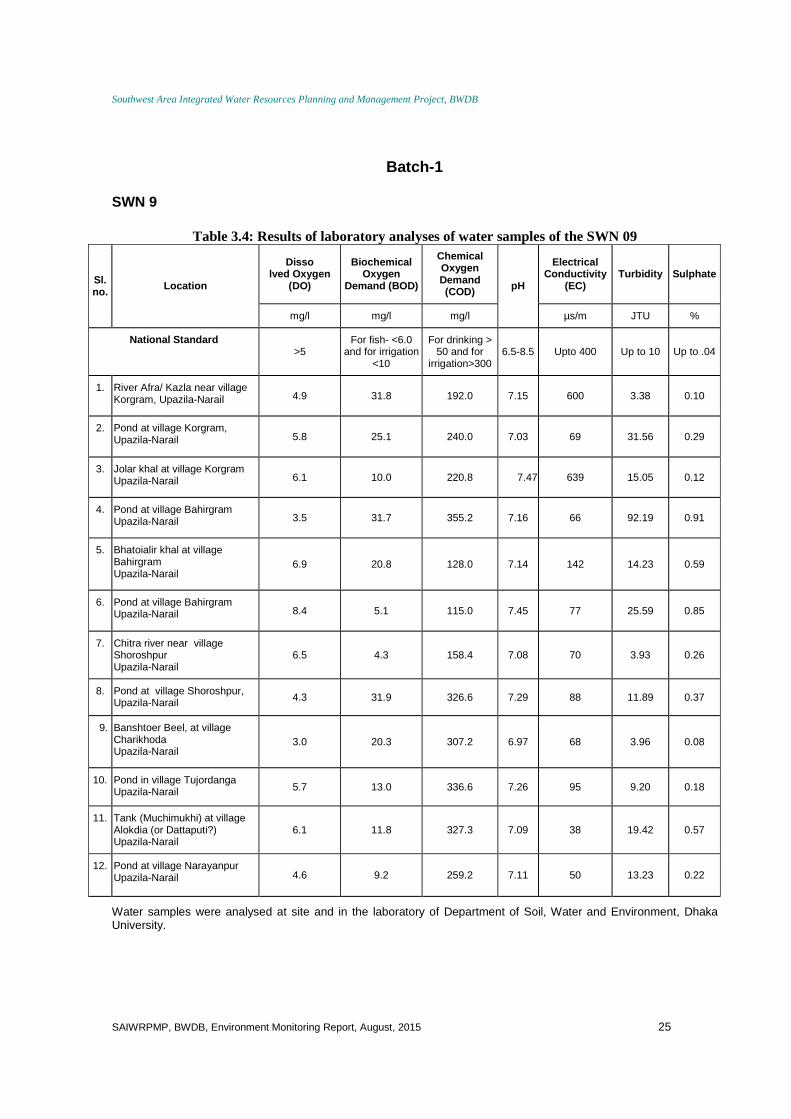
Southwest Area Integrated Water Resources Planning and Management Project, BWDB
SAIWRPMP, BWDB, Environment Monitoring Report, August, 2015 25
Batch-1
SWN 9
Table 3.4: Results of laboratory analyses of water samples of the SWN 09
Sl. no. Location
Disso lved Oxygen
(DO)
Biochemical Oxygen
Demand (BOD)
Chemical Oxygen Demand (COD) pH
Electrical Conductivity
(EC) Turbidity Sulphate
mg/l mg/l mg/l µs/m JTU %
National Standard >5
For fish- <6.0 and for irrigation
<10
For drinking > 50 and for
irrigation>300 6.5-8.5 Upto 400 Up to 10 Up to .04
1. River Afra/ Kazla near village Korgram, Upazila-Narail 4.9 31.8 192.0 7.15 600 3.38 0.10
2. Pond at village Korgram, Upazila-Narail 5.8 25.1 240.0 7.03 69 31.56 0.29
3. Jolar khal at village Korgram Upazila-Narail 6.1 10.0 220.8 7.47 639 15.05 0.12
4. Pond at village Bahirgram Upazila-Narail 3.5 31.7 355.2 7.16 66 92.19 0.91
5. Bhatoialir khal at village Bahirgram Upazila-Narail
6.9 20.8 128.0 7.14 142 14.23 0.59
6. Pond at village Bahirgram Upazila-Narail 8.4 5.1 115.0 7.45 77 25.59 0.85
7. Chitra river near village Shoroshpur Upazila-Narail
6.5 4.3 158.4 7.08 70 3.93 0.26
8. Pond at village Shoroshpur, Upazila-Narail 4.3 31.9 326.6 7.29 88 11.89 0.37
9. Banshtoer Beel, at village Charikhoda Upazila-Narail
3.0 20.3 307.2 6.97 68 3.96 0.08
10. Pond in village Tujordanga Upazila-Narail 5.7 13.0 336.6 7.26 95 9.20 0.18
11. Tank (Muchimukhi) at village Alokdia (or Dattaputi?) Upazila-Narail
6.1 11.8 327.3 7.09 38 19.42 0.57
12. Pond at village Narayanpur Upazila-Narail 4.6 9.2 259.2 7.11 50 13.23 0.22
Water samples were analysed at site and in the laboratory of Department of Soil, Water and Environment, Dhaka University.
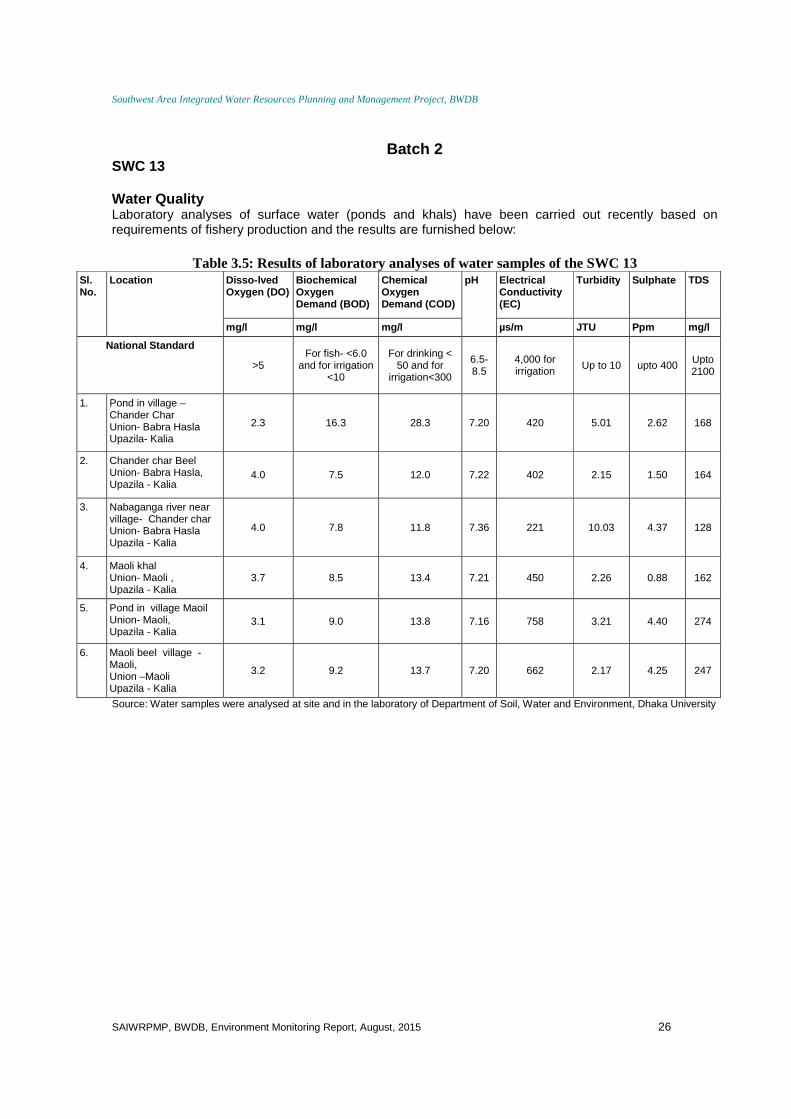
Southwest Area Integrated Water Resources Planning and Management Project, BWDB
SAIWRPMP, BWDB, Environment Monitoring Report, August, 2015 26
Batch 2 SWC 13 Water Quality Laboratory analyses of surface water (ponds and khals) have been carried out recently based on requirements of fishery production and the results are furnished below:
Table 3.5: Results of laboratory analyses of water samples of the SWC 13 Sl. No.
Location Disso -lved Oxygen (DO)
Biochemical Oxygen Demand (BOD)
Chemical Oxygen Demand (COD)
pH Electrical Conductivity (EC)
Turbidity Sulphate TDS
mg/l mg/l mg/l µs/m JTU Ppm mg/l
Nation al Standard
>5 For fish- <6.0
and for irrigation <10
For drinking < 50 and for
irrigation<300
6.5-8.5
4,000 for irrigation Up to 10 upto 400 Upto
2100
1. Pond in village – Chander Char Union- Babra Hasla Upazila- Kalia
2.3 16.3 28.3 7.20 420 5.01 2.62 168
2. Chander char Beel Union- Babra Hasla, Upazila - Kalia
4.0 7.5 12.0 7.22 402 2.15 1.50 164
3. Nabaganga river near village- Chander char Union- Babra Hasla Upazila - Kalia
4.0 7.8 11.8 7.36 221 10.03 4.37 128
4. Maoli khal Union- Maoli , Upazila - Kalia
3.7 8.5 13.4 7.21 450 2.26 0.88 162
5. Pond in village Maoil Union- Maoli, Upazila - Kalia
3.1 9.0 13.8 7.16 758 3.21 4.40 274
6. Maoli beel village - Maoli, Union –Maoli Upazila - Kalia
3.2 9.2 13.7 7.20 662 2.17 4.25 247
Source: Water samples were analysed at site and in the laboratory of Department of Soil, Water and Environment, Dhaka University
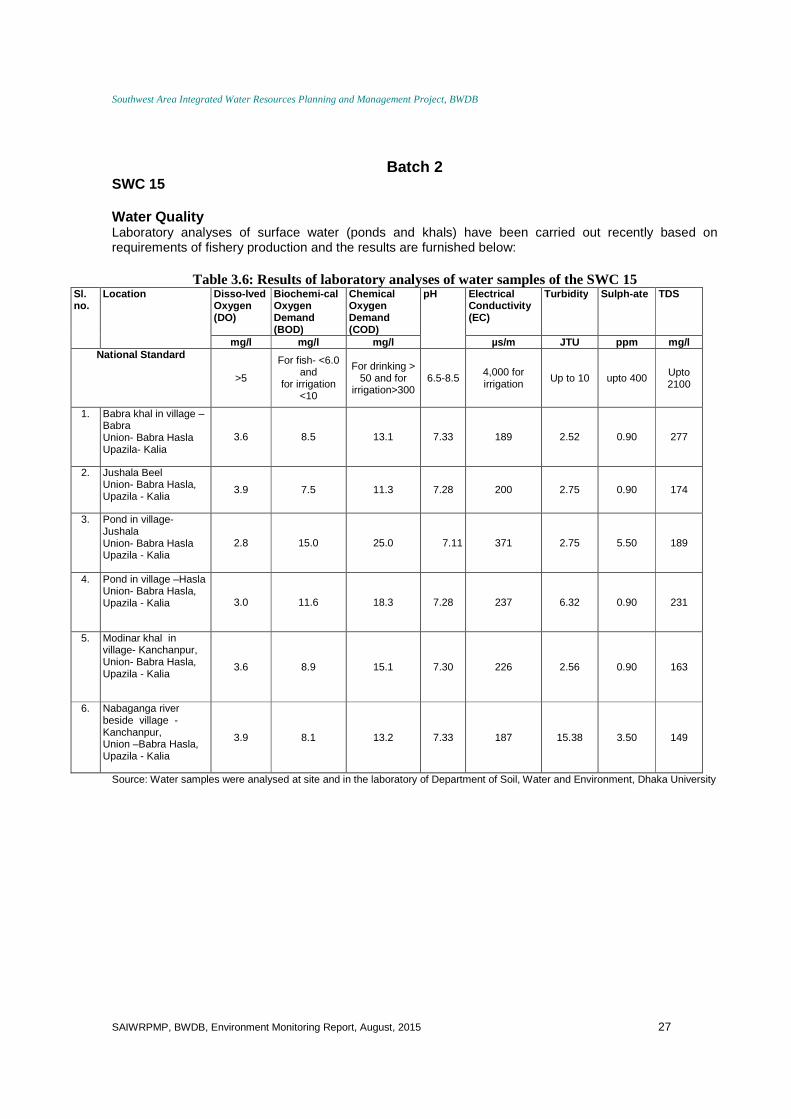
Southwest Area Integrated Water Resources Planning and Management Project, BWDB
SAIWRPMP, BWDB, Environment Monitoring Report, August, 2015 27
Batch 2
SWC 15 Water Quality Laboratory analyses of surface water (ponds and khals) have been carried out recently based on requirements of fishery production and the results are furnished below:
Table 3.6: Results of laboratory analyses of water samples of the SWC 15 Sl. no.
Location Disso -lved Oxygen (DO)
Biochemi -cal Oxygen Demand (BOD)
Chemical Oxygen Demand (COD)
pH Electrical Conductivity (EC)
Turbidity Sulph -ate TDS
mg/l mg/l mg/l µs/m JTU ppm mg/l National Standard
>5
For fish- <6.0 and
for irrigation <10
For drinking > 50 and for
irrigation>300 6.5-8.5
4,000 for irrigation Up to 10 upto 400 Upto
2100
1. Babra khal in village –Babra Union- Babra Hasla Upazila- Kalia
3.6 8.5 13.1 7.33 189 2.52 0.90 277
2. Jushala Beel Union- Babra Hasla, Upazila - Kalia
3.9 7.5 11.3 7.28 200 2.75 0.90 174
3. Pond in village- Jushala Union- Babra Hasla Upazila - Kalia
2.8 15.0 25.0 7.11 371 2.75 5.50 189
4. Pond in village –Hasla Union- Babra Hasla, Upazila - Kalia 3.0 11.6 18.3 7.28 237 6.32 0.90 231
5. Modinar khal in village- Kanchanpur, Union- Babra Hasla, Upazila - Kalia
3.6 8.9 15.1 7.30 226 2.56 0.90 163
6. Nabaganga river beside village - Kanchanpur, Union –Babra Hasla, Upazila - Kalia
3.9 8.1 13.2 7.33 187 15.38 3.50 149
Source: Water samples were analysed at site and in the laboratory of Department of Soil, Water and Environment, Dhaka University
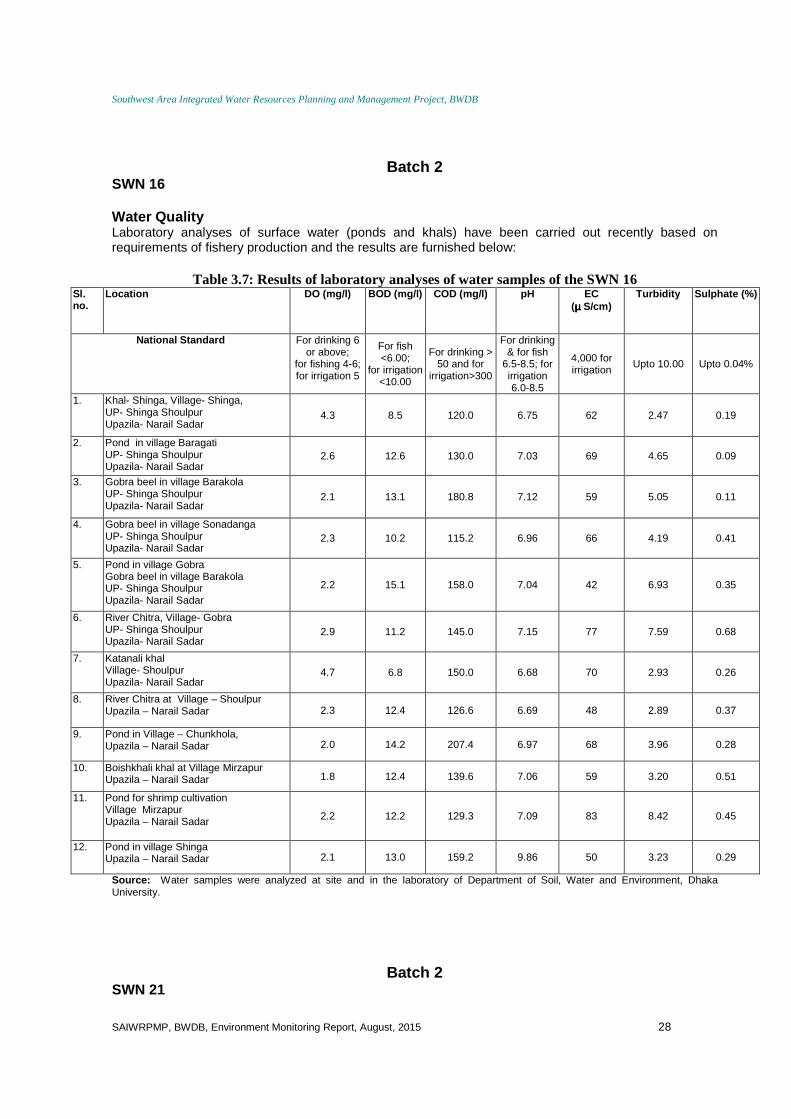
Southwest Area Integrated Water Resources Planning and Management Project, BWDB
SAIWRPMP, BWDB, Environment Monitoring Report, August, 2015 28
Batch 2
SWN 16 Water Quality Laboratory analyses of surface water (ponds and khals) have been carried out recently based on requirements of fishery production and the results are furnished below:
Table 3.7: Results of laboratory analyses of water samples of the SWN 16 Sl. no.
Location DO (mg/l) BOD (mg/l) COD (mg/l) pH EC (µµµµ S/cm)
Turbidity Sulphate (%)
National Standard For drinking 6 or above;
for fishing 4-6; for irrigation 5
For fish <6.00;
for irrigation <10.00
For drinking > 50 and for
irrigation>300
For drinking & for fish
6.5-8.5; for irrigation 6.0-8.5
4,000 for irrigation
Upto 10.00 Upto 0.04%
1. Khal- Shinga, Village- Shinga, UP- Shinga Shoulpur Upazila- Narail Sadar
4.3 8.5 120.0 6.75 62 2.47 0.19
2. Pond in village Baragati UP- Shinga Shoulpur Upazila- Narail Sadar
2.6 12.6 130.0 7.03 69 4.65 0.09
3. Gobra beel in village Barakola UP- Shinga Shoulpur Upazila- Narail Sadar
2.1 13.1 180.8 7.12 59 5.05 0.11
4. Gobra beel in village Sonadanga UP- Shinga Shoulpur Upazila- Narail Sadar
2.3 10.2 115.2 6.96 66 4.19 0.41
5. Pond in village Gobra Gobra beel in village Barakola UP- Shinga Shoulpur Upazila- Narail Sadar
2.2 15.1 158.0 7.04 42 6.93 0.35
6. River Chitra, Village- Gobra UP- Shinga Shoulpur Upazila- Narail Sadar
2.9 11.2 145.0 7.15 77 7.59 0.68
7. Katanali khal Village- Shoulpur Upazila- Narail Sadar
4.7 6.8 150.0 6.68 70 2.93 0.26
8. River Chitra at Village – Shoulpur Upazila – Narail Sadar 2.3 12.4 126.6 6.69 48 2.89 0.37
9. Pond in Village – Chunkhola, Upazila – Narail Sadar 2.0 14.2 207.4 6.97 68 3.96 0.28
10. Boishkhali khal at Village Mirzapur Upazila – Narail Sadar 1.8 12.4 139.6 7.06 59 3.20 0.51
11. Pond for shrimp cultivation Village Mirzapur Upazila – Narail Sadar 2.2 12.2 129.3 7.09 83 8.42 0.45
12. Pond in village Shinga Upazila – Narail Sadar 2.1 13.0 159.2 9.86 50 3.23 0.29
Source: Water samples were analyzed at site and in the laboratory of Department of Soil, Water and Environment, Dhaka University.
Batch 2 SWN 21
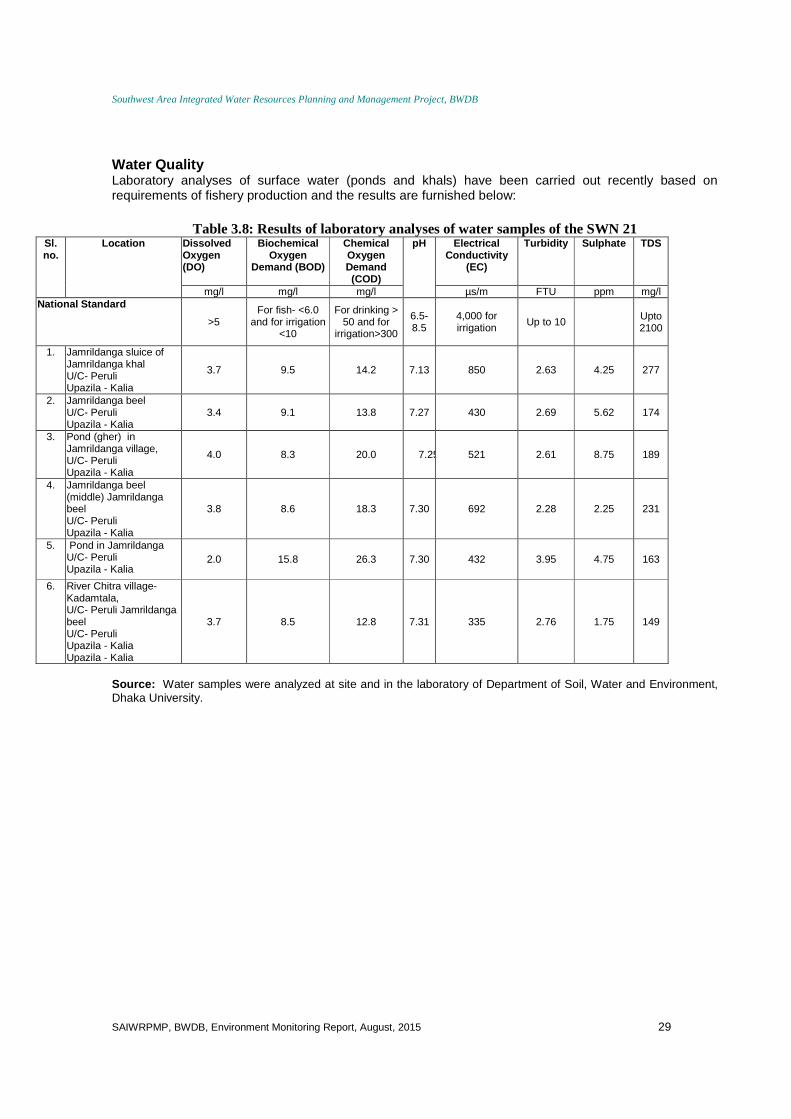
Southwest Area Integrated Water Resources Planning and Management Project, BWDB
SAIWRPMP, BWDB, Environment Monitoring Report, August, 2015 29
Water Quality Laboratory analyses of surface water (ponds and khals) have been carried out recently based on requirements of fishery production and the results are furnished below:
Table 3.8: Results of laboratory analyses of water samples of the SWN 21 Sl. no.
Location Dissolved Oxygen (DO)
Biochemical Oxygen
Demand (BOD)
Chemical Oxygen Demand (COD)
pH Electrical Conductivity
(EC)
Turbidity Sulphate TDS
mg/l mg/l mg/l µs/m FTU ppm mg/l National Standard
>5 For fish- <6.0
and for irrigation <10
For drinking > 50 and for
irrigation>300
6.5-8.5
4,000 for irrigation Up to 10
Upto 2100
1. Jamrildanga sluice of Jamrildanga khal U/C- Peruli Upazila - Kalia
3.7 9.5 14.2 7.13 850 2.63 4.25 277
2. Jamrildanga beel U/C- Peruli Upazila - Kalia
3.4 9.1 13.8 7.27 430 2.69 5.62 174
3. Pond (gher) in Jamrildanga village, U/C- Peruli Upazila - Kalia
4.0 8.3 20.0 7.25 521 2.61 8.75 189
4. Jamrildanga beel (middle) Jamrildanga beel U/C- Peruli Upazila - Kalia
3.8 8.6 18.3 7.30 692 2.28 2.25 231
5. Pond in Jamrildanga U/C- Peruli Upazila - Kalia
2.0 15.8 26.3 7.30 432 3.95 4.75 163
6. River Chitra village- Kadamtala, U/C- Peruli Jamrildanga beel U/C- Peruli Upazila - Kalia Upazila - Kalia
3.7 8.5 12.8 7.31 335 2.76 1.75 149
Source: Water samples were analyzed at site and in the laboratory of Department of Soil, Water and Environment, Dhaka University.
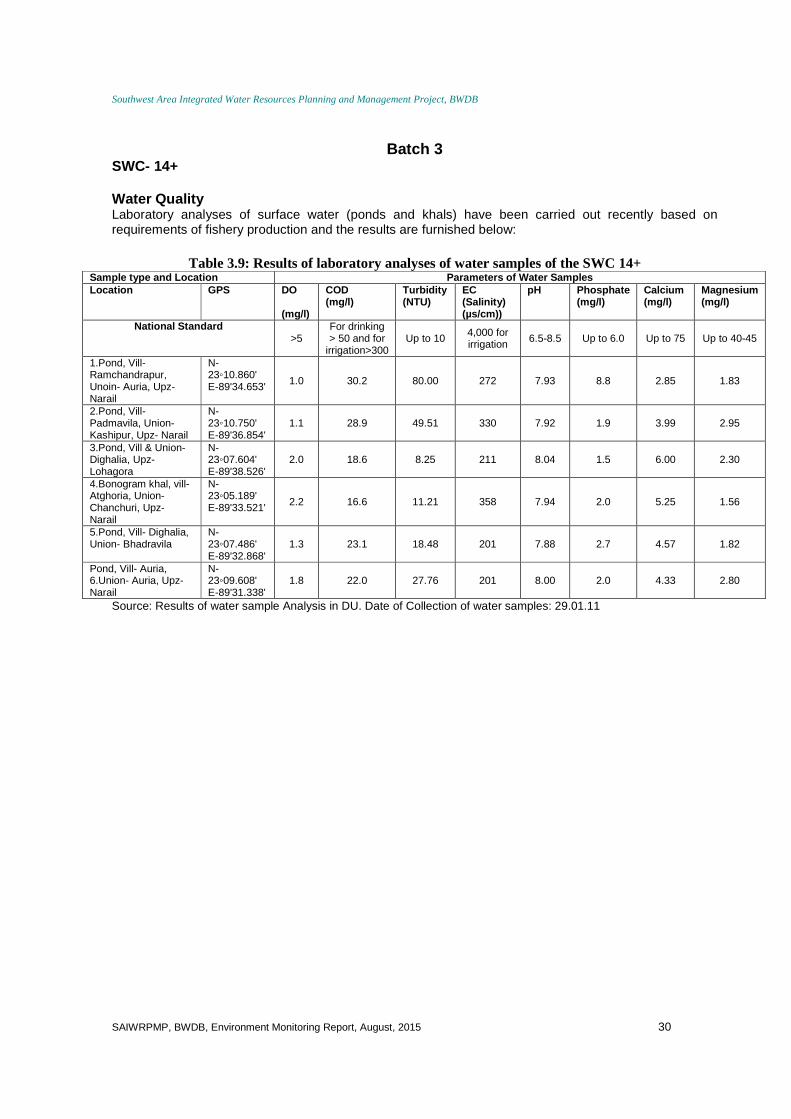
Southwest Area Integrated Water Resources Planning and Management Project, BWDB
SAIWRPMP, BWDB, Environment Monitoring Report, August, 2015 30
Batch 3 SWC- 14+ Water Quality Laboratory analyses of surface water (ponds and khals) have been carried out recently based on requirements of fishery production and the results are furnished below:
Table 3.9: Results of laboratory analyses of water samples of the SWC 14+
Sample type and Location Parameters of Water Samples Location GPS DO
(mg/l)
COD (mg/l)
Turbidity (NTU)
EC (Salinity) (µs/cm))
pH Phosphate (mg/l)
Calcium (mg/l)
Magnesium (mg/l)
National Standard >5
For drinking > 50 and for
irrigation>300 Up to 10 4,000 for
irrigation 6.5-8.5 Up to 6.0 Up to 75 Up to 40-45
1.Pond, Vill- Ramchandrapur, Unoin- Auria, Upz- Narail
N-23◦10.860' E-89'34.653' 1.0 30.2 80.00 272 7.93 8.8 2.85 1.83
2.Pond, Vill- Padmavila, Union- Kashipur, Upz- Narail
N-23◦10.750' E-89'36.854'
1.1 28.9 49.51 330 7.92 1.9 3.99 2.95
3.Pond, Vill & Union- Dighalia, Upz- Lohagora
N-23◦07.604' E-89'38.526'
2.0 18.6 8.25 211 8.04 1.5 6.00 2.30
4.Bonogram khal, vill-Atghoria, Union- Chanchuri, Upz- Narail
N-23◦05.189' E-89'33.521' 2.2 16.6 11.21 358 7.94 2.0 5.25 1.56
5.Pond, Vill- Dighalia, Union- Bhadravila
N-23◦07.486' E-89'32.868'
1.3 23.1 18.48 201 7.88 2.7 4.57 1.82
Pond, Vill- Auria, 6.Union- Auria, Upz- Narail
N-23◦09.608' E-89'31.338'
1.8 22.0 27.76 201 8.00 2.0 4.33 2.80
Source: Results of water sample Analysis in DU. Date of Collection of water samples: 29.01.11
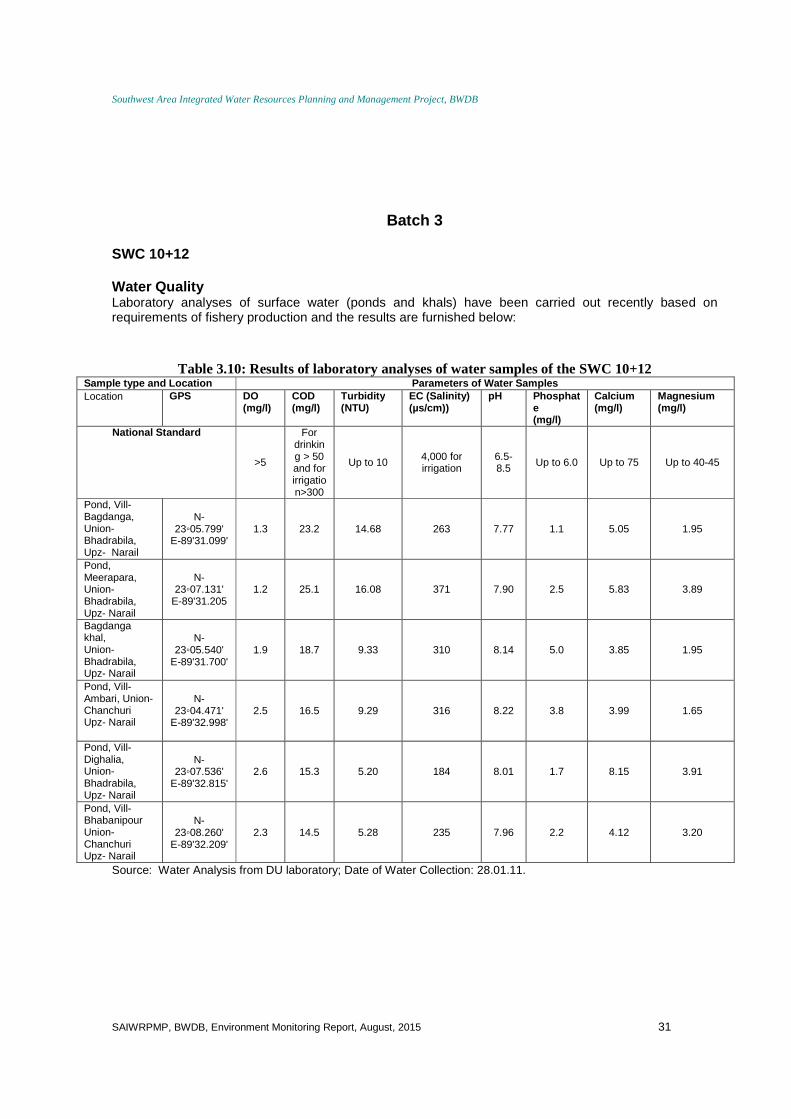
Southwest Area Integrated Water Resources Planning and Management Project, BWDB
SAIWRPMP, BWDB, Environment Monitoring Report, August, 2015 31
Batch 3 SWC 10+12 Water Quality Laboratory analyses of surface water (ponds and khals) have been carried out recently based on requirements of fishery production and the results are furnished below:
Table 3.10: Results of laboratory analyses of water samples of the SWC 10+12 Sample type and Location Parameters of Water Sa mples Location GPS DO
(mg/l) COD (mg/l)
Turbidity (NTU)
EC (Salinity) (µs/cm))
pH Phosphate (mg/l)
Calcium (mg/l)
Magnesium (mg/l)
National Standard
>5
For drinking > 50 and for irrigation>300
Up to 10 4,000 for irrigation
6.5-8.5 Up to 6.0 Up to 75 Up to 40-45
Pond, Vill-Bagdanga, Union- Bhadrabila, Upz- Narail
N-23◦05.799'
E-89'31.099' 1.3 23.2 14.68 263 7.77 1.1 5.05 1.95
Pond, Meerapara, Union- Bhadrabila, Upz- Narail
N-23◦07.131'
E-89'31.205 1.2 25.1 16.08 371 7.90 2.5 5.83 3.89
Bagdanga khal, Union- Bhadrabila, Upz- Narail
N-23◦05.540'
E-89'31.700' 1.9 18.7 9.33 310 8.14 5.0 3.85 1.95
Pond, Vill- Ambari, Union- Chanchuri Upz- Narail
N-23◦04.471'
E-89'32.998' 2.5 16.5 9.29 316 8.22 3.8 3.99 1.65
Pond, Vill- Dighalia, Union- Bhadrabila, Upz- Narail
N-23◦07.536'
E-89'32.815' 2.6 15.3 5.20 184 8.01 1.7 8.15 3.91
Pond, Vill- Bhabanipour Union- Chanchuri Upz- Narail
N-23◦08.260'
E-89'32.209' 2.3 14.5 5.28 235 7.96 2.2 4.12 3.20
Source: Water Analysis from DU laboratory; Date of Water Collection: 28.01.11.
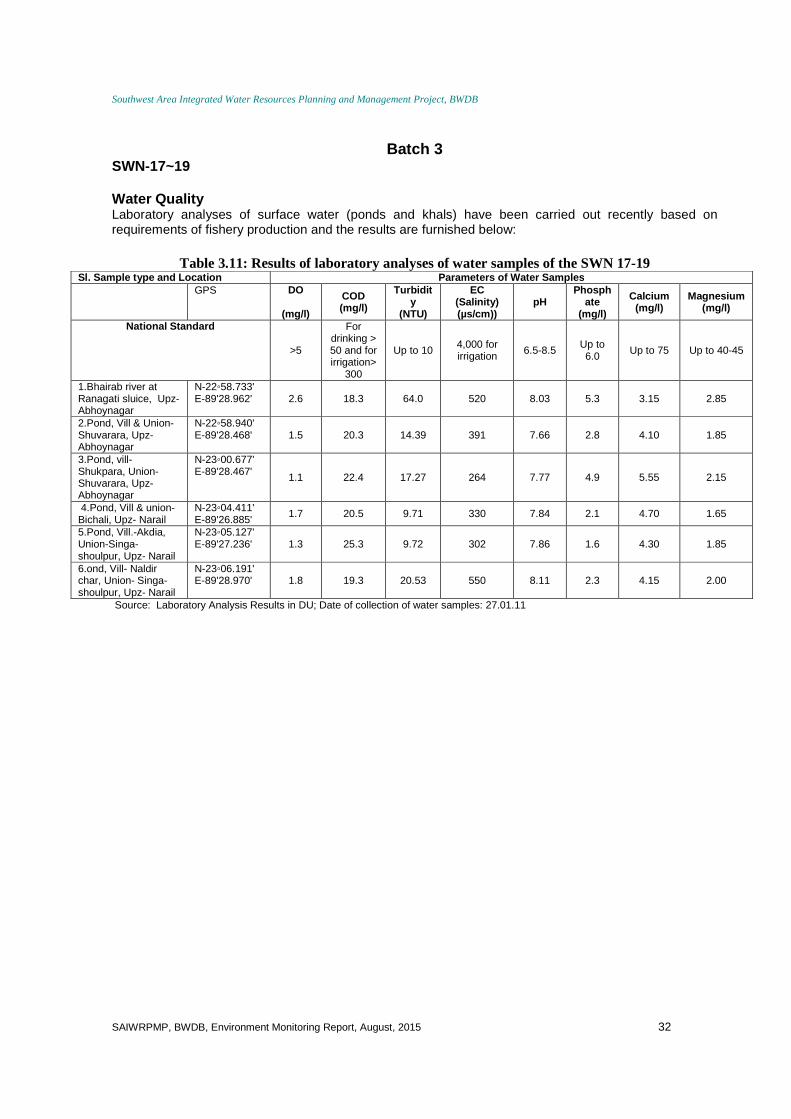
Southwest Area Integrated Water Resources Planning and Management Project, BWDB
SAIWRPMP, BWDB, Environment Monitoring Report, August, 2015 32
Batch 3 SWN-17~19 Water Quality Laboratory analyses of surface water (ponds and khals) have been carried out recently based on requirements of fishery production and the results are furnished below:
Table 3.11: Results of laboratory analyses of water samples of the SWN 17-19 Sl. Sample type and Location Parameters of Water Samples GPS DO
(mg/l)
COD (mg/l)
Turbidity
(NTU)
EC (Salinity) (µs/cm))
pH Phosph
ate (mg/l)
Calcium (mg/l)
Magnesium (mg/l)
National Standard
>5
For drinking > 50 and for irrigation>
300
Up to 10 4,000 for irrigation 6.5-8.5
Up to 6.0 Up to 75 Up to 40-45
1.Bhairab river at Ranagati sluice, Upz- Abhoynagar
N-22◦58.733' E-89'28.962' 2.6 18.3 64.0 520 8.03 5.3 3.15 2.85
2.Pond, Vill & Union-Shuvarara, Upz- Abhoynagar
N-22◦58.940' E-89'28.468' 1.5 20.3 14.39 391 7.66 2.8 4.10 1.85
3.Pond, vill- Shukpara, Union- Shuvarara, Upz- Abhoynagar
N-23◦00.677' E-89'28.467' 1.1 22.4 17.27 264 7.77 4.9 5.55 2.15
4.Pond, Vill & union- Bichali, Upz- Narail
N-23◦04.411' E-89'26.885'
1.7 20.5 9.71 330 7.84 2.1 4.70 1.65
5.Pond, Vill.-Akdia, Union-Singa-shoulpur, Upz- Narail
N-23◦05.127' E-89'27.236' 1.3 25.3 9.72 302 7.86 1.6 4.30 1.85
6.ond, Vill- Naldir char, Union- Singa-shoulpur, Upz- Narail
N-23◦06.191' E-89'28.970' 1.8 19.3 20.53 550 8.11 2.3 4.15 2.00
Source: Laboratory Analysis Results in DU; Date of collection of water samples: 27.01.11
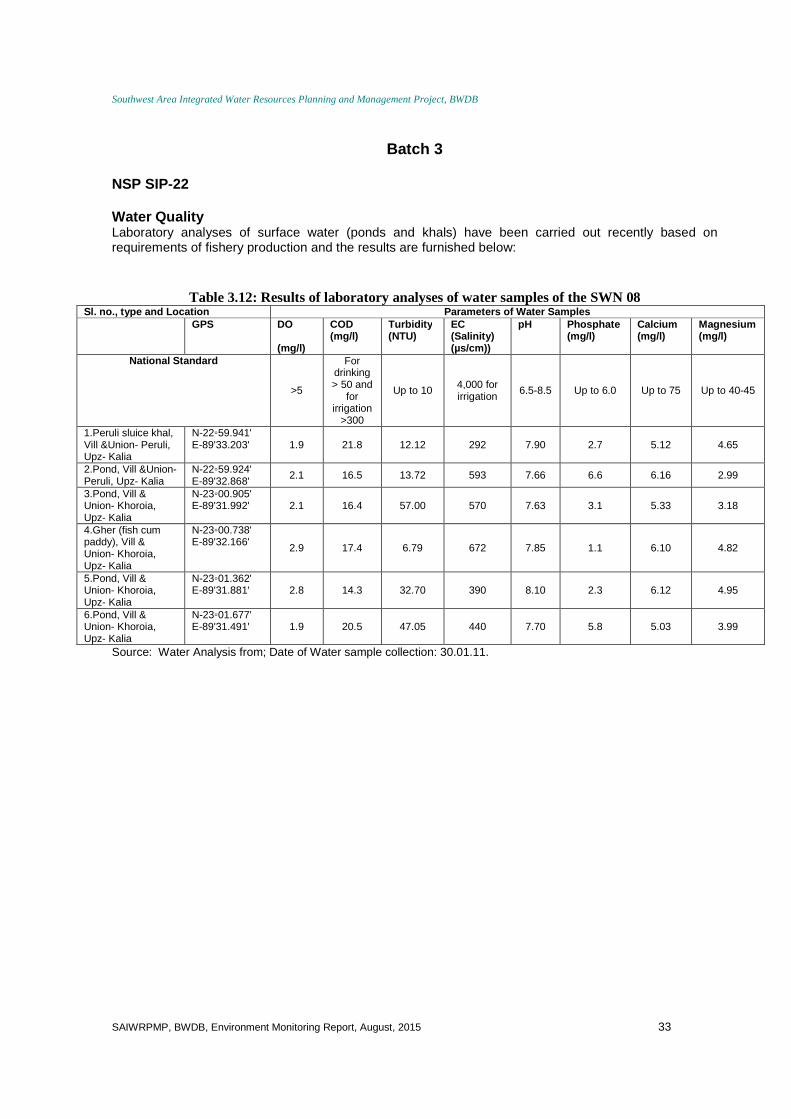
Southwest Area Integrated Water Resources Planning and Management Project, BWDB
SAIWRPMP, BWDB, Environment Monitoring Report, August, 2015 33
Batch 3 NSP SIP-22 Water Quality Laboratory analyses of surface water (ponds and khals) have been carried out recently based on requirements of fishery production and the results are furnished below:
Table 3.12: Results of laboratory analyses of water samples of the SWN 08 Sl. no., type and Location Parameters of Water Samples GPS DO
(mg/l)
COD (mg/l)
Turbidity (NTU)
EC (Salinity) (µs/cm))
pH Phosphate (mg/l)
Calcium (mg/l)
Magnesium (mg/l)
National Standard
>5
For drinking > 50 and
for irrigation
>300
Up to 10 4,000 for irrigation
6.5-8.5 Up to 6.0 Up to 75 Up to 40-45
1.Peruli sluice khal, Vill &Union- Peruli, Upz- Kalia
N-22◦59.941' E-89'33.203' 1.9 21.8 12.12 292 7.90 2.7 5.12 4.65
2.Pond, Vill &Union- Peruli, Upz- Kalia
N-22◦59.924' E-89'32.868'
2.1 16.5 13.72 593 7.66 6.6 6.16 2.99
3.Pond, Vill & Union- Khoroia, Upz- Kalia
N-23◦00.905' E-89'31.992' 2.1 16.4 57.00 570 7.63 3.1 5.33 3.18
4.Gher (fish cum paddy), Vill & Union- Khoroia, Upz- Kalia
N-23◦00.738' E-89'32.166'
2.9 17.4 6.79 672 7.85 1.1 6.10 4.82
5.Pond, Vill & Union- Khoroia, Upz- Kalia
N-23◦01.362' E-89'31.881' 2.8 14.3 32.70 390 8.10 2.3 6.12 4.95
6.Pond, Vill & Union- Khoroia, Upz- Kalia
N-23◦01.677' E-89'31.491' 1.9 20.5 47.05 440 7.70 5.8 5.03 3.99
Source: Water Analysis from; Date of Water sample collection: 30.01.11.
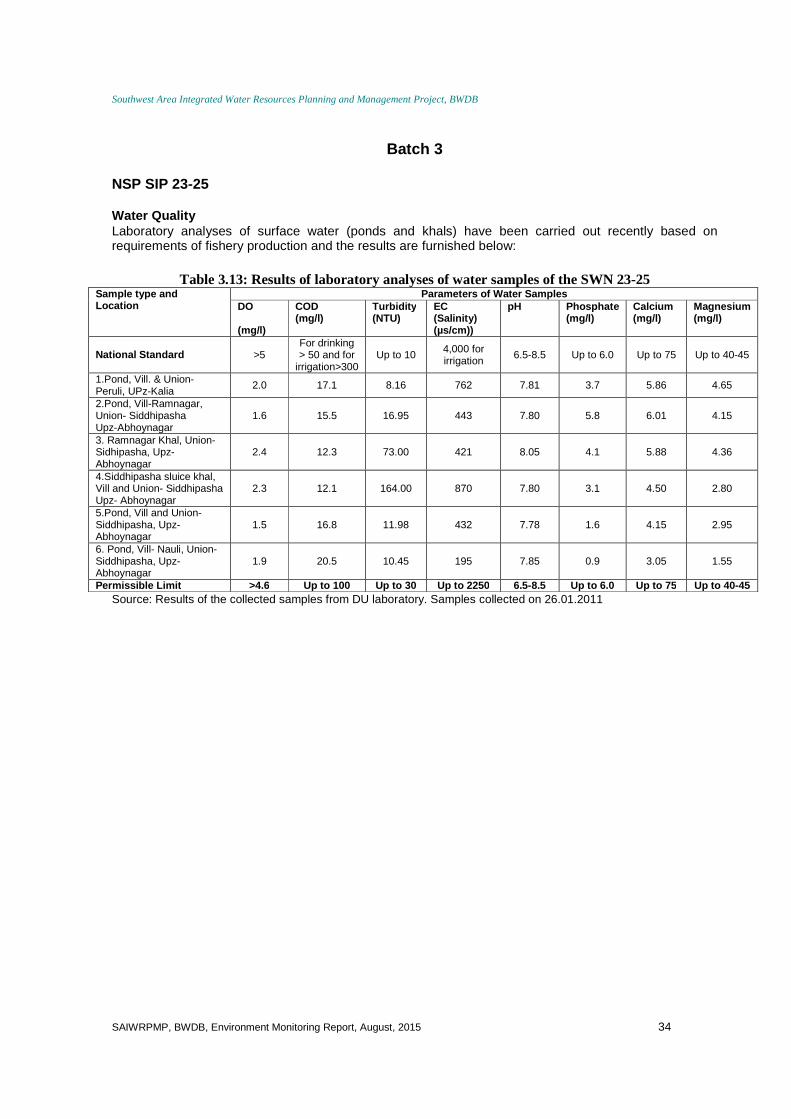
Southwest Area Integrated Water Resources Planning and Management Project, BWDB
SAIWRPMP, BWDB, Environment Monitoring Report, August, 2015 34
Batch 3 NSP SIP 23-25 Water Quality Laboratory analyses of surface water (ponds and khals) have been carried out recently based on requirements of fishery production and the results are furnished below:
Table 3.13: Results of laboratory analyses of water samples of the SWN 23-25 Sample type and Location
Parameters of Water Samples DO (mg/l)
COD (mg/l)
Turbidity (NTU)
EC (Salinity) (µs/cm))
pH Phosphate (mg/l)
Calcium (mg/l)
Magnesium (mg/l)
National Standard >5 For drinking > 50 and for
irrigation>300 Up to 10 4,000 for
irrigation 6.5-8.5 Up to 6.0 Up to 75 Up to 40-45
1.Pond, Vill. & Union- Peruli, UPz-Kalia
2.0 17.1 8.16 762 7.81 3.7 5.86 4.65
2.Pond, Vill-Ramnagar, Union- Siddhipasha Upz-Abhoynagar
1.6 15.5 16.95 443 7.80 5.8 6.01 4.15
3. Ramnagar Khal, Union- Sidhipasha, Upz- Abhoynagar
2.4 12.3 73.00 421 8.05 4.1 5.88 4.36
4.Siddhipasha sluice khal, Vill and Union- Siddhipasha Upz- Abhoynagar
2.3 12.1 164.00 870 7.80 3.1 4.50 2.80
5.Pond, Vill and Union- Siddhipasha, Upz- Abhoynagar
1.5 16.8 11.98 432 7.78 1.6 4.15 2.95
6. Pond, Vill- Nauli, Union- Siddhipasha, Upz- Abhoynagar
1.9 20.5 10.45 195 7.85 0.9 3.05 1.55
Permissible Limit >4.6 Up to 100 Up to 30 Up to 2250 6.5-8.5 Up to 6.0 Up to 75 Up to 40 -45 Source: Results of the collected samples from DU laboratory. Samples collected on 26.01.2011
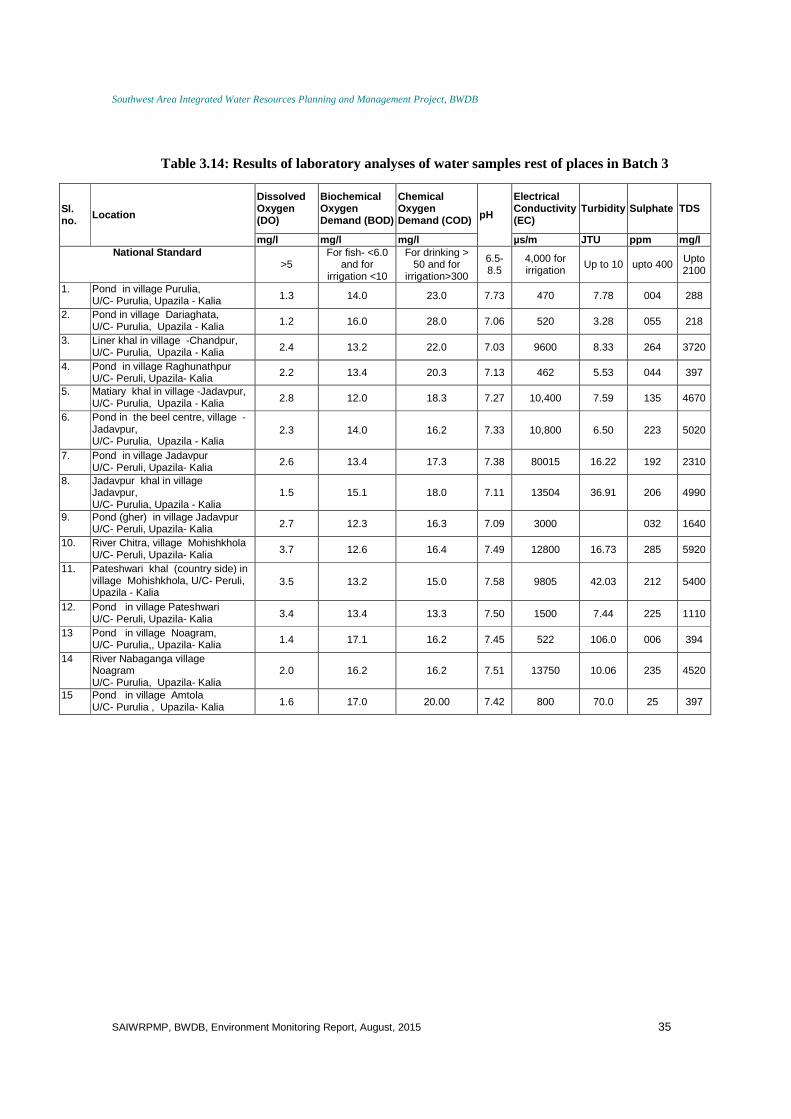
Southwest Area Integrated Water Resources Planning and Management Project, BWDB
SAIWRPMP, BWDB, Environment Monitoring Report, August, 2015 35
Table 3.14: Results of laboratory analyses of water samples rest of places in Batch 3
Sl. no. Location
Dissolved Oxygen (DO)
Biochemical Oxygen Demand (BOD)
Chemical Oxygen Demand (COD) pH
Electrical Conductivity (EC)
Turbidity Sulphate TDS
mg/l mg/l mg/l µs/m JTU ppm mg/l National Standard
>5 For fish- <6.0
and for irrigation <10
For drinking > 50 and for
irrigation>300
6.5-8.5
4,000 for irrigation
Up to 10 upto 400 Upto 2100
1. Pond in village Purulia, U/C- Purulia, Upazila - Kalia 1.3 14.0 23.0 7.73 470 7.78 004 288
2. Pond in village Dariaghata, U/C- Purulia, Upazila - Kalia 1.2 16.0 28.0 7.06 520 3.28 055 218
3. Liner khal in village -Chandpur, U/C- Purulia, Upazila - Kalia 2.4 13.2 22.0 7.03 9600 8.33 264 3720
4. Pond in village Raghunathpur U/C- Peruli, Upazila- Kalia 2.2 13.4 20.3 7.13 462 5.53 044 397
5. Matiary khal in village -Jadavpur, U/C- Purulia, Upazila - Kalia 2.8 12.0 18.3 7.27 10,400 7.59 135 4670
6. Pond in the beel centre, village -Jadavpur, U/C- Purulia, Upazila - Kalia
2.3 14.0 16.2 7.33 10,800 6.50 223 5020
7. Pond in village Jadavpur U/C- Peruli, Upazila- Kalia 2.6 13.4 17.3 7.38 80015 16.22 192 2310
8. Jadavpur khal in village Jadavpur, U/C- Purulia, Upazila - Kalia
1.5 15.1 18.0 7.11 13504 36.91 206 4990
9. Pond (gher) in village Jadavpur U/C- Peruli, Upazila- Kalia 2.7 12.3 16.3 7.09 3000 032 1640
10. River Chitra, village Mohishkhola U/C- Peruli, Upazila- Kalia 3.7 12.6 16.4 7.49 12800 16.73 285 5920
11. Pateshwari khal (country side) in village Mohishkhola, U/C- Peruli, Upazila - Kalia
3.5 13.2 15.0 7.58 9805 42.03 212 5400
12. Pond in village Pateshwari U/C- Peruli, Upazila- Kalia 3.4 13.4 13.3 7.50 1500 7.44 225 1110
13 Pond in village Noagram, U/C- Purulia,, Upazila- Kalia 1.4 17.1 16.2 7.45 522 106.0 006 394
14 River Nabaganga village Noagram U/C- Purulia, Upazila- Kalia
2.0 16.2 16.2 7.51 13750 10.06 235 4520
15 Pond in village Amtola U/C- Purulia , Upazila- Kalia 1.6 17.0 20.00 7.42 800 70.0 25 397
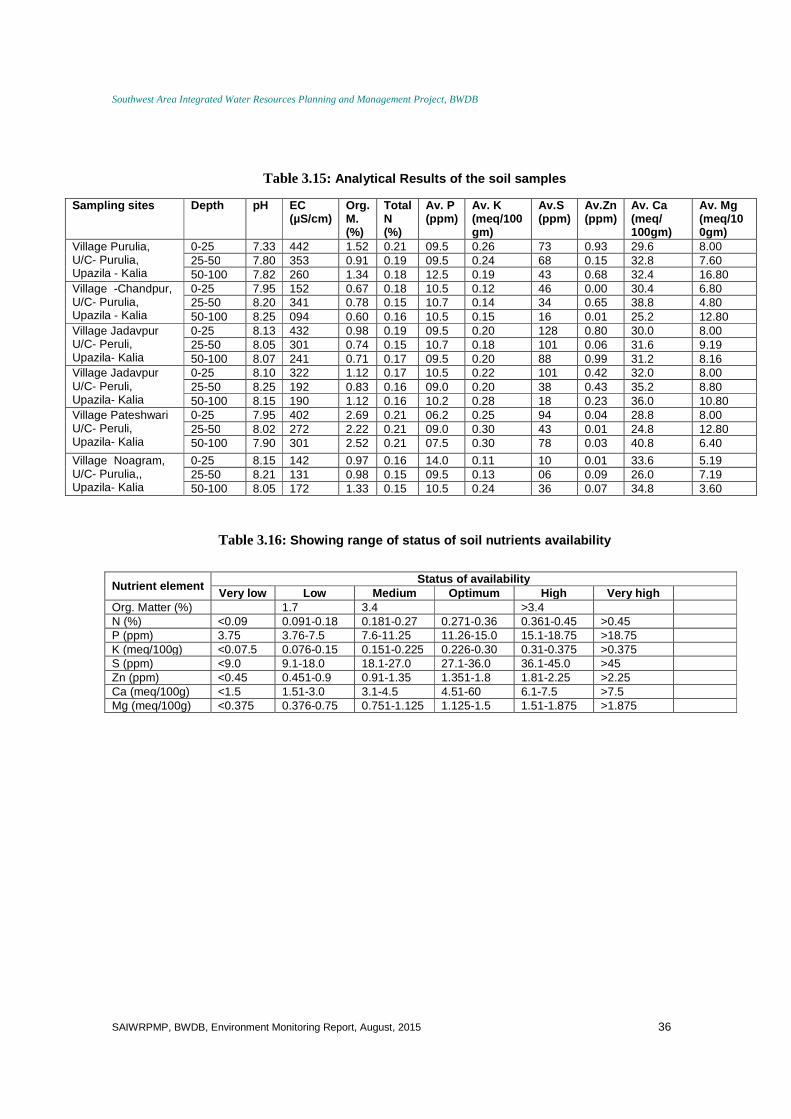
Southwest Area Integrated Water Resources Planning and Management Project, BWDB
SAIWRPMP, BWDB, Environment Monitoring Report, August, 2015 36
Table 3.15: Analytical Results of the soil samples
Sampling sites Depth pH EC (µS/cm)
Org. M. (%)
Total N (%)
Av. P (ppm)
Av. K (meq/100gm)
Av.S (ppm)
Av.Zn (ppm)
Av. Ca (meq/ 100gm)
Av. Mg (meq/100gm)
Village Purulia, U/C- Purulia, Upazila - Kalia
0-25 7.33 442 1.52 0.21 09.5 0.26 73 0.93 29.6 8.00 25-50 7.80 353 0.91 0.19 09.5 0.24 68 0.15 32.8 7.60 50-100 7.82 260 1.34 0.18 12.5 0.19 43 0.68 32.4 16.80
Village -Chandpur, U/C- Purulia, Upazila - Kalia
0-25 7.95 152 0.67 0.18 10.5 0.12 46 0.00 30.4 6.80 25-50 8.20 341 0.78 0.15 10.7 0.14 34 0.65 38.8 4.80 50-100 8.25 094 0.60 0.16 10.5 0.15 16 0.01 25.2 12.80
Village Jadavpur U/C- Peruli, Upazila- Kalia
0-25 8.13 432 0.98 0.19 09.5 0.20 128 0.80 30.0 8.00 25-50 8.05 301 0.74 0.15 10.7 0.18 101 0.06 31.6 9.19 50-100 8.07 241 0.71 0.17 09.5 0.20 88 0.99 31.2 8.16
Village Jadavpur U/C- Peruli, Upazila- Kalia
0-25 8.10 322 1.12 0.17 10.5 0.22 101 0.42 32.0 8.00 25-50 8.25 192 0.83 0.16 09.0 0.20 38 0.43 35.2 8.80 50-100 8.15 190 1.12 0.16 10.2 0.28 18 0.23 36.0 10.80
Village Pateshwari U/C- Peruli, Upazila- Kalia
0-25 7.95 402 2.69 0.21 06.2 0.25 94 0.04 28.8 8.00 25-50 8.02 272 2.22 0.21 09.0 0.30 43 0.01 24.8 12.80 50-100 7.90 301 2.52 0.21 07.5 0.30 78 0.03 40.8 6.40
Village Noagram, U/C- Purulia,, Upazila- Kalia
0-25 8.15 142 0.97 0.16 14.0 0.11 10 0.01 33.6 5.19 25-50 8.21 131 0.98 0.15 09.5 0.13 06 0.09 26.0 7.19 50-100 8.05 172 1.33 0.15 10.5 0.24 36 0.07 34.8 3.60
Table 3.16: Showing range of status of soil nutrients availabil ity
Nutrient element Status of availability
Very low Low Medium Optimum High Very high Org. Matter (%) 1.7 3.4 >3.4 N (%) <0.09 0.091-0.18 0.181-0.27 0.271-0.36 0.361-0.45 >0.45 P (ppm) 3.75 3.76-7.5 7.6-11.25 11.26-15.0 15.1-18.75 >18.75 K (meq/100g) <0.07.5 0.076-0.15 0.151-0.225 0.226-0.30 0.31-0.375 >0.375 S (ppm) <9.0 9.1-18.0 18.1-27.0 27.1-36.0 36.1-45.0 >45 Zn (ppm) <0.45 0.451-0.9 0.91-1.35 1.351-1.8 1.81-2.25 >2.25 Ca (meq/100g) <1.5 1.51-3.0 3.1-4.5 4.51-60 6.1-7.5 >7.5 Mg (meq/100g) <0.375 0.376-0.75 0.751-1.125 1.125-1.5 1.51-1.875 >1.875
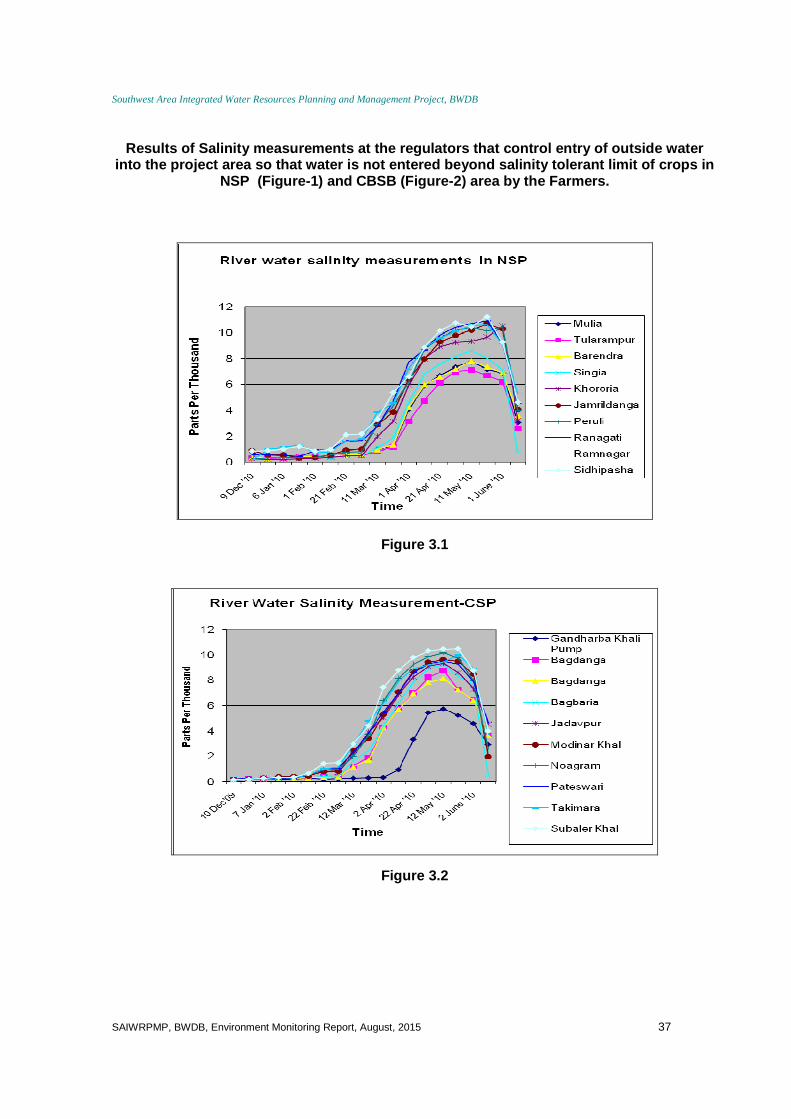
Southwest Area Integrated Water Resources Planning and Management Project, BWDB
SAIWRPMP, BWDB, Environment Monitoring Report, August, 2015 37
Results of Salinity measurements at the regulators that control entry of outside water into the project area so that water is not entered beyond salinity tolerant limit of crops in
NSP (Figure-1) and CBSB (Figure-2) area by the Far mers.
Figure 3.1
Figure 3.2
Southwest Area Integrated Water Resources Planning and Management Project, BWDB
SAIWRPMP, BWDB, Environment Monitoring Report, August, 2015 38
4. Conclusion & Recommendation
According to the last environmental safeguard review mission (1-5 April, 15), the mission expressed the
satisfaction the progress made so far for implementation of the environmental management plan. The
project already completed successfully all the physical work without any major environmental hazard. In
this situation, the WMG and BWDB should closely monitor EMP and compliance measures. The major
environmental impacts which found during the execution of the project (for example – losses of the
biodiversity of native freshwater fish and other aquatic life, degradation and shrinking of open water
bodies and wetlands, water pollution & sedimentation in canals, water pollution due to increased use of
agrochemicals, increase of salinity etc) needs long term and periodic monitoring by the WMGs, BWDB,
Department of Fisheries and Department of Agriculture Extension. From the experience of the project, it is
proposed that all future FCD/I projects give particular consideration to fisheries impacts, make
appropriate adjustments to structural design and include specific migratory provisions to assist the fishing
communities whose livelihood will unavoidably be adversely affected. The department of fisheries must
be fully involved and assisted where necessary. Publicly owned water bodies and small fishponds in
project areas was tried to protect through fish pond demonstration & intensive training program to
motivated the stakeholder not to drained out water bodies rather use for culture fisheries. At the end of
the project it was found positive impact in culture fisheries as it increased more from the baseline
(findings of IMED mid term review Report). No fish friendly structure was introduced in the project area
like fish-pass, it is recommended that to incorporate fish friendly structure (if economically feasible &
physically viable) in future FCDI project. Some sanctuary was built from the project which helped to
preserve aquatic biodiversity which may replicate in future FCDI project. Inside the FCDI project,
extensive programs of aquaculture may be undertaken. A good example of this kind programme is
integrated rice-fish culture. The future water manager could follow ecosystem based management
approaches for implementing FCD/I project.
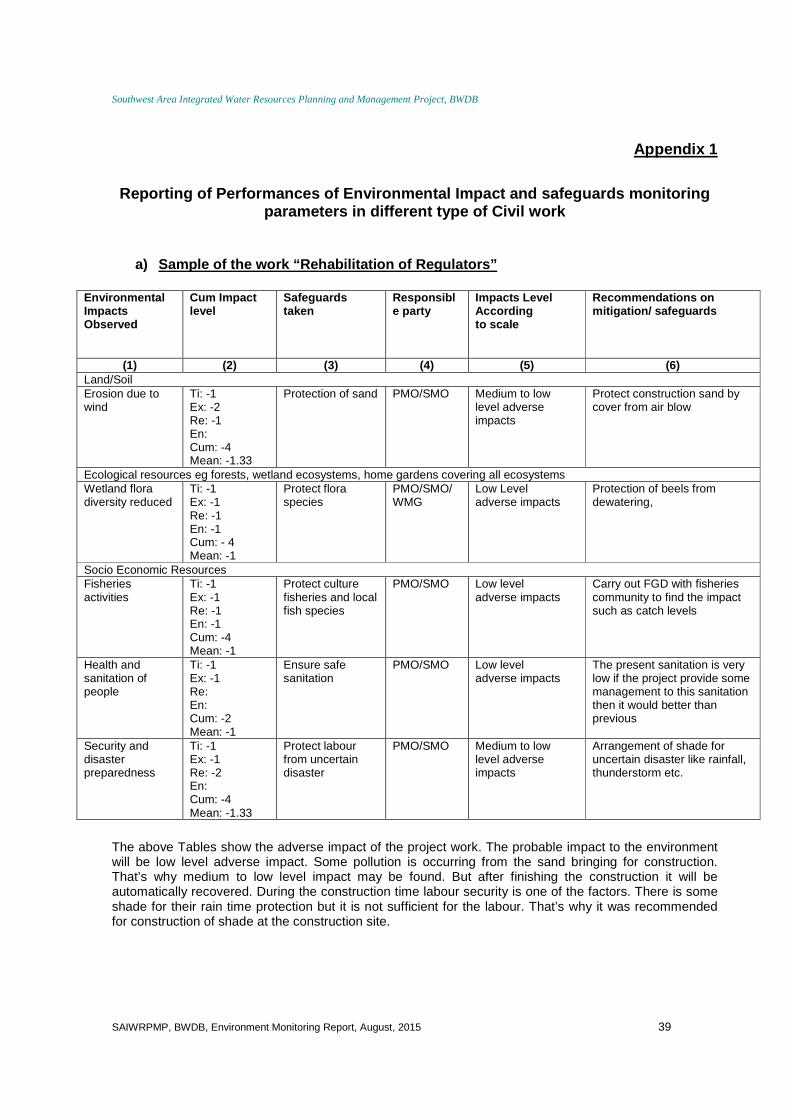
Southwest Area Integrated Water Resources Planning and Management Project, BWDB
SAIWRPMP, BWDB, Environment Monitoring Report, August, 2015 39
Appendix 1
Reporting of Performances of Environmental Impact a nd safeguards monitoring
parameters in different type of Civil work
a) Sample of the work “Rehabilitation of Regulators ”
Environmental Impacts Observed
Cum Impact level
Safeguards taken
Responsible party
Impacts Level According to scale
Recommendations on mitigation/ safeguards
(1) (2) (3) (4) (5) (6) Land/Soil Erosion due to wind
Ti: -1 Ex: -2 Re: -1 En: Cum: -4 Mean: -1.33
Protection of sand PMO/SMO Medium to low level adverse impacts
Protect construction sand by cover from air blow
Ecological resources eg forests, wetland ecosystems, home gardens covering all ecosystems Wetland flora diversity reduced
Ti: -1 Ex: -1 Re: -1 En: -1 Cum: - 4 Mean: -1
Protect flora species
PMO/SMO/WMG
Low Level adverse impacts
Protection of beels from dewatering,
Socio Economic Resources Fisheries activities
Ti: -1 Ex: -1 Re: -1 En: -1 Cum: -4 Mean: -1
Protect culture fisheries and local fish species
PMO/SMO Low level adverse impacts
Carry out FGD with fisheries community to find the impact such as catch levels
Health and sanitation of people
Ti: -1 Ex: -1 Re: En: Cum: -2 Mean: -1
Ensure safe sanitation
PMO/SMO Low level adverse impacts
The present sanitation is very low if the project provide some management to this sanitation then it would better than previous
Security and disaster preparedness
Ti: -1 Ex: -1 Re: -2 En: Cum: -4 Mean: -1.33
Protect labour from uncertain disaster
PMO/SMO Medium to low level adverse impacts
Arrangement of shade for uncertain disaster like rainfall, thunderstorm etc.
The above Tables show the adverse impact of the project work. The probable impact to the environment will be low level adverse impact. Some pollution is occurring from the sand bringing for construction. That’s why medium to low level impact may be found. But after finishing the construction it will be automatically recovered. During the construction time labour security is one of the factors. There is some shade for their rain time protection but it is not sufficient for the labour. That’s why it was recommended for construction of shade at the construction site.
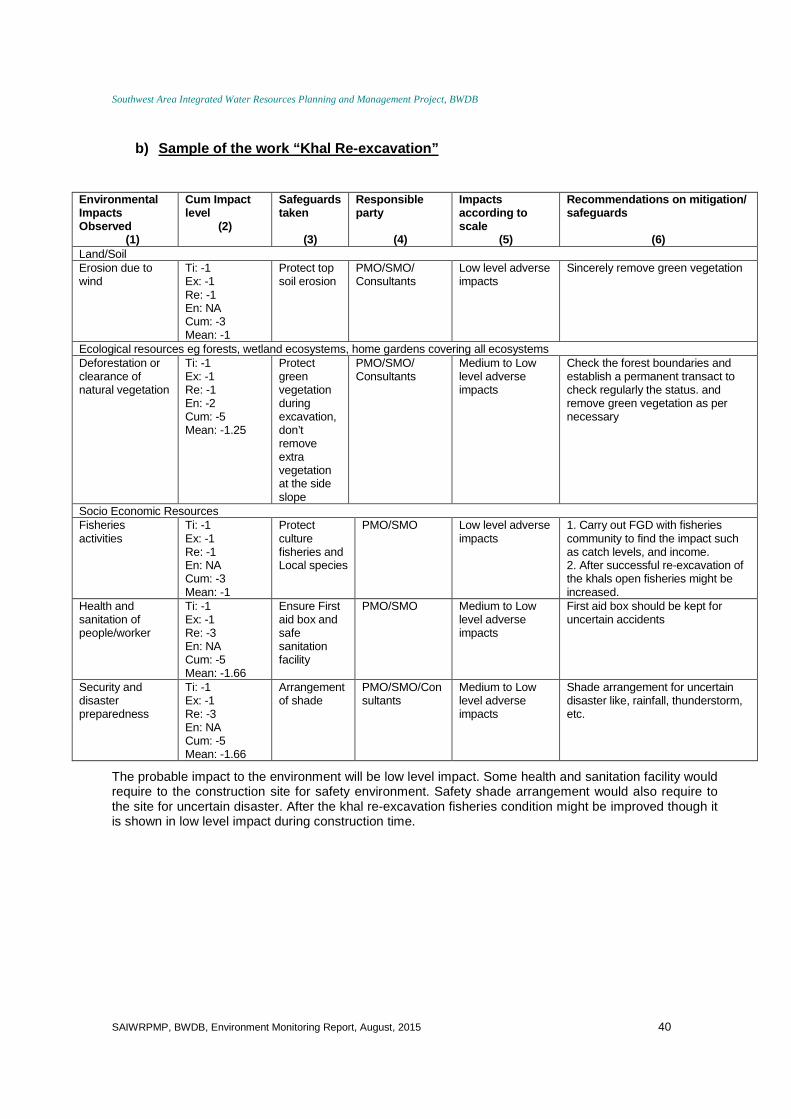
Southwest Area Integrated Water Resources Planning and Management Project, BWDB
SAIWRPMP, BWDB, Environment Monitoring Report, August, 2015 40
b) Sample of the work “Khal Re-excavation”
Environmental Impacts Observed
(1)
Cum Impact level
(2)
Safeguards taken
(3)
Responsible party
(4)
Impacts according to scale
(5)
Recommendations on mitigation/ safeguards
(6) Land/Soil Erosion due to wind
Ti: -1 Ex: -1 Re: -1 En: NA Cum: -3 Mean: -1
Protect top soil erosion
PMO/SMO/ Consultants
Low level adverse impacts
Sincerely remove green vegetation
Ecological resources eg forests, wetland ecosystems, home gardens covering all ecosystems Deforestation or clearance of natural vegetation
Ti: -1 Ex: -1 Re: -1 En: -2 Cum: -5 Mean: -1.25
Protect green vegetation during excavation, don’t remove extra vegetation at the side slope
PMO/SMO/ Consultants
Medium to Low level adverse impacts
Check the forest boundaries and establish a permanent transact to check regularly the status. and remove green vegetation as per necessary
Socio Economic Resources Fisheries activities
Ti: -1 Ex: -1 Re: -1 En: NA Cum: -3 Mean: -1
Protect culture fisheries and Local species
PMO/SMO Low level adverse impacts
1. Carry out FGD with fisheries community to find the impact such as catch levels, and income. 2. After successful re-excavation of the khals open fisheries might be increased.
Health and sanitation of people/worker
Ti: -1 Ex: -1 Re: -3 En: NA Cum: -5 Mean: -1.66
Ensure First aid box and safe sanitation facility
PMO/SMO Medium to Low level adverse impacts
First aid box should be kept for uncertain accidents
Security and disaster preparedness
Ti: -1 Ex: -1 Re: -3 En: NA Cum: -5 Mean: -1.66
Arrangement of shade
PMO/SMO/Consultants
Medium to Low level adverse impacts
Shade arrangement for uncertain disaster like, rainfall, thunderstorm, etc.
The probable impact to the environment will be low level impact. Some health and sanitation facility would require to the construction site for safety environment. Safety shade arrangement would also require to the site for uncertain disaster. After the khal re-excavation fisheries condition might be improved though it is shown in low level impact during construction time.
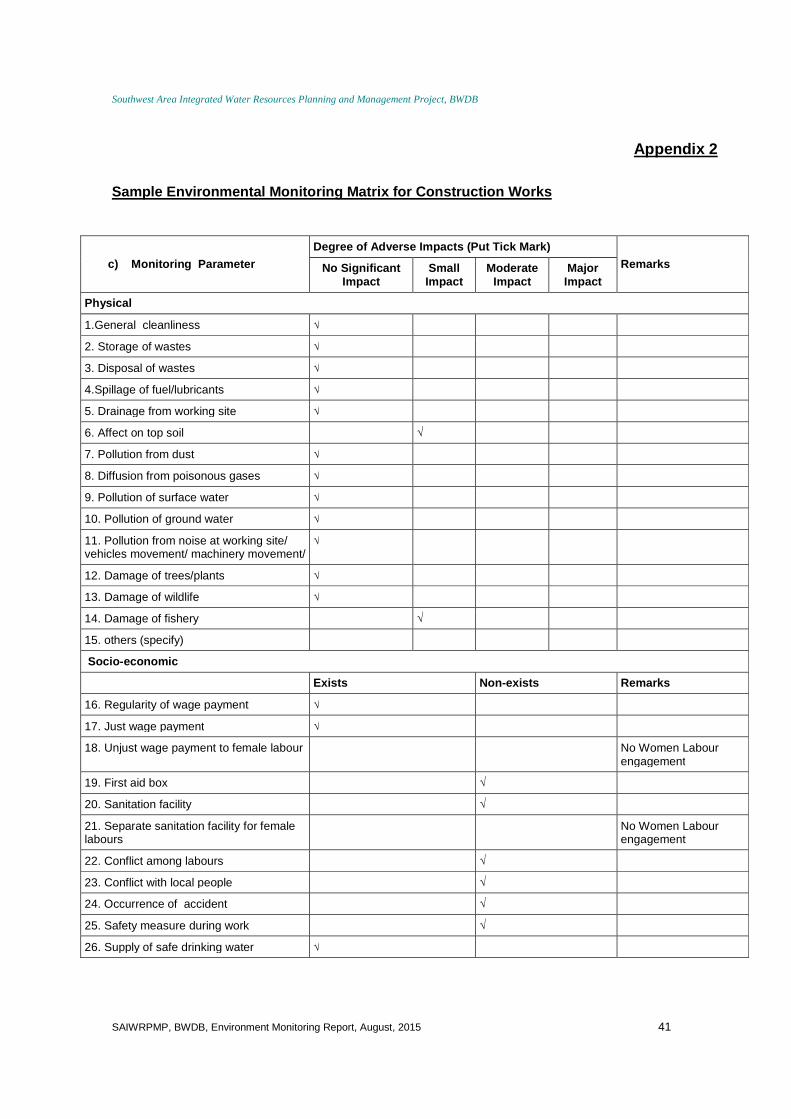
Southwest Area Integrated Water Resources Planning and Management Project, BWDB
SAIWRPMP, BWDB, Environment Monitoring Report, August, 2015 41
Appendix 2
Sample Environmental Monitoring Matrix for Construc tion Works
c) Monitoring Parameter
Degree of Adverse Impacts (Put Tick Mark)
Remarks No Significant Impact
Small Impact
Moderate Impact
Major Impact
Physical
1.General cleanliness √
2. Storage of wastes √
3. Disposal of wastes √
4.Spillage of fuel/lubricants √
5. Drainage from working site √
6. Affect on top soil √
7. Pollution from dust √
8. Diffusion from poisonous gases √
9. Pollution of surface water √
10. Pollution of ground water √
11. Pollution from noise at working site/ vehicles movement/ machinery movement/
√
12. Damage of trees/plants √
13. Damage of wildlife √
14. Damage of fishery √
15. others (specify)
Socio -economic
Exists Non-exists Remarks
16. Regularity of wage payment √
17. Just wage payment √
18. Unjust wage payment to female labour No Women Labour engagement
19. First aid box √
20. Sanitation facility √
21. Separate sanitation facility for female labours
No Women Labour engagement
22. Conflict among labours √
23. Conflict with local people √
24. Occurrence of accident √
25. Safety measure during work √
26. Supply of safe drinking water √