Water and Poverty Situation in Oyun Local Government Area, North-Central Nigeria
31
AFRREV STECH, Vol. 3(1) February, 2014 Copyright© IAARR 2013: www.afrrevjo.net 55 Indexed African Researches Reviews Online: www.arronet.info/afrrevstech AFRREV STECH An International Journal of Science and Technology Bahir Dar, Ethiopia Vol. 3 (1), S/No 6, February, 2014: 55-85 ISSN 2225-8612 (Print) ISSN 2227-5444 (Online) WATER AND POVERTY SITUATION IN OYUN LOCAL GOVERNMENT AREA, NORTH- CENTRAL NIGERIA ASHAOLU, ENIOLA DAMILOLA Department of Geography and Environmental Management Faculty of Social Sciences University of Ilorin, P.M.B 1515, Ilorin, Nigeria E-mail: [email protected], Tel: +2348036070929 & ABUBAKAR, IYABO MUNIRAT Department of Geography, Kwara State Polytechnic P.M.B 1375, Ilorin, Kwara State, Nigeria Abstract This study looks into the water and poverty situation in Oyun Local Government Area, North-central Nigeria. A well-structured questionnaire is used to collect data at household level. Thirty
Transcript of Water and Poverty Situation in Oyun Local Government Area, North-Central Nigeria
AFRREV STECH, Vol. 3(1) February, 2014
Copyright© IAARR 2013: www.afrrevjo.net 55 Indexed African Researches Reviews Online: www.arronet.info/afrrevstech
AFRREV STECH An International Journal of Science and Technology
Bahir Dar, Ethiopia
Vol. 3 (1), S/No 6, February, 2014: 55-85
ISSN 2225-8612 (Print) ISSN 2227-5444 (Online)
WATER AND POVERTY SITUATION IN OYUN
LOCAL GOVERNMENT AREA, NORTH-
CENTRAL NIGERIA
ASHAOLU, ENIOLA DAMILOLA
Department of Geography and Environmental Management
Faculty of Social Sciences
University of Ilorin, P.M.B 1515, Ilorin, Nigeria
E-mail: [email protected], Tel: +2348036070929
&
ABUBAKAR, IYABO MUNIRAT
Department of Geography, Kwara State Polytechnic
P.M.B 1375, Ilorin, Kwara State, Nigeria
Abstract
This study looks into the water and poverty situation in Oyun Local
Government Area, North-central Nigeria. A well-structured
questionnaire is used to collect data at household level. Thirty
AFRREV STECH, Vol. 3(1) February, 2014
Copyright© IAARR 2013: www.afrrevjo.net 56 Indexed African Researches Reviews Online: www.arronet.info/afrrevstech
households were sampled at random in each of the 11 wards in the
LGA, giving a total of 330 households. The data were analyzed using
percentages, Kendall’s correlation coefficient and WPI (Composite
Index Method). The results revealed that Ojoku scored highest (62.4)
while Igbonna scored lowest (52.0), which shows that it is the most
water poor in the area. The result of the overall WPI (58.34) shows
that the water and poverty situation in the whole of the LGA is slightly
above average. The study concludes that the overall water and
poverty situation in Oyun LGA is fair. It is therefore recommended
that appropriate measure should be taken to improve the overall
water accessibility and usage in the LGA by creating more water
supply points in the community and renovating/upgrading the existing
water works in the area for improved pipe borne water supply. Also,
water use should be extended beyond domestic usage into other
sectors that can increase productivity and hence, the overall poverty
level in the area.
Key words: Water, Scarcity, Poverty, Access, Capacity, Resources,
Uses, Environment
Introduction
Unlike wars and natural disasters, the global water crisis does not
make media headlines and it is the poor people suffering the most
from the water and sanitation crisis, especially poor women who often
lack the political voice needed to assert their claims to water (Human
Development Report, 2006).The studies of experts have established
the linkages between water and poverty, by suggesting that improving
access to water and sanitation, coupled with holistic water
management approach is a gateway for eradicating poverty and
sustaining economic growth (World Bank, 1996; Asian Development
Bank, 2003; World Commission on Dams, 2000;Mlote et al., 2002,
Lawrence, et al., 2003). Holistic water management involves
appropriate use of water resources while taking into consideration
AFRREV STECH, Vol. 3(1) February, 2014
Copyright© IAARR 2013: www.afrrevjo.net 57 Indexed African Researches Reviews Online: www.arronet.info/afrrevstech
those factors relevant for human development. Such factors include,
water for domestic, agriculture and industrial use as well as for
ecological maintenance (Mlote et al., 2002).
It is high time we stopped seeing water as an infinite free gift of
nature but as a resource that needs to be conserved and managed for
optimal usage. This is because of the growing awareness of global
water crisis that is imminent and the need for proper management of
this resource to sustain human existence. According to the Food and
Agriculture Organization (FAO) and UN Water, global water use has
been growing at more than double the rate of population increase in
the last 100 years (UN Water, 2011).World population is predicted to
grow from 7 billion to 9.1 billion by the year 2050, putting a further
stress on water resources to meet increased food, energy, and
industrial demands (World Water Assessment programme, 2012). The
importance of water can never be overemphasized because the modern
society was build and sustained by water availability. At the global
level, 70 percent of water withdrawals are for the agricultural sector,
11 percent are to meet municipal demands, and 19 percent are for
industrial needs (FAO, 2011).
However, only 20% of the world population has access to running
water and over 1 billion people do not have access to safe water (The
World Water Organization, 2010).This incidence of inadequate water
accessibility affects the health of the people worldwide and leads to
diseases that claim thousands of lives across the globe. World Health
Organization (2008) reported that about 3.575 million people die each
year from water related diseases. Annual mortality rate in children
under five years from water related diseases is estimated to be about 4
million in developing countries (Warner, 1998).Half of the population
in developing countries is suffering from water-related diseases (The
World Water Organization, 2010). In these developing countries,
nearly 80% of diseases are linked to water, leading to 3 million early
deaths (UN News Service, 2009).
Ashaolu &Abubakar: Water & Poverty Situation in Oyun L.G.A.
AFRREV STECH, Vol. 3(1) February, 2014
Copyright© IAARR 2013: www.afrrevjo.net 58 Indexed African Researches Reviews Online: www.arronet.info/afrrevstech
Moreover, the preceding statistics is as a result of water scarcity
experienced and looming in almost every part of the world. Water
scarcity occurs even in region where there is abundance of rainfall or
fresh water. The quality of water available, how it is used, distributed
and conserved in communities can determine if there is enough to
meet the demands of households, farms, industry and the environment
(WHO, 2009). The incidence of water scarcity that can be attributed to
a changing climate and population growth has been the focus of recent
researches (Seckleret al., 1998; Vörösmarty et al., 2000). According to
Chris (2012) Water scarcity, which can be described as the lack of
access to adequate quantities of water for human and environmental
uses, is becoming a serious concern in many countries of the world.
Despite this growing concern on water scarcity, there is no rigid
definition of water scarcity or how it can be measured.
However, water scarcity can be seen as physical scarcity and
economic scarcity. Physical scarcity is when there is not enough water
to meet demand; its implications include severe environmental
degradation, declining aquifer, and unequal water distribution (FAO,
2012). Economic water scarcity on the other hand is when there is a
lack of investment and proper management to meet the demand of
people who do not have the financial capability to use existing water
sources (FAO, 2012).According to WHO (2009) about 1.2 billion
people (almost one fifth of the world) live in regions of physical water
scarcity and another 500 million people approaching this scenario.
About 1.6 billion (1/4 of the world population) faced economic water
shortage (where countries lack the infrastructure to tap water from
rivers and aquifers). It is also predicted by the International Water
Management Institute in year 2000, that by 2025 about 1.8 billion
people will live in countries or regions with absolute water scarcity
and almost half of the world living in conditions of water stress, based
on the vagaries of present climatic condition (IWMI, 2000).
AFRREV STECH, Vol. 3(1) February, 2014
Copyright© IAARR 2013: www.afrrevjo.net 59 Indexed African Researches Reviews Online: www.arronet.info/afrrevstech
The scenarios of water scarcity presented above has led to the
evolution of various approaches in calculating water scarcity or stress,
to be able to come up with a solution that will improve the overall
water use and management in human society. Some of these
approaches include Falkenmark index; which measured water scarcity
in terms of the amount of renewable freshwater that is available for
each person each year (Falkenmarket al., 1989).Criticality ratio; which
measured water scarcity in terms of the proportion of total annual
water withdrawals relative to total available water resources in an
environment (Raskin, et al., 1997).Demand management approach put
forward by Seckler et al. (1998), which treated water scarcity as a
function of a country's water balance against its projected needs and
measuring the adaptive capacity of a country by assessing its potential
for infrastructure development as well as efficiency improvements.
From all these, a more holistic approaches to the determination of
water scarcity which incorporate social, economic and political factors
with physical measures of water scarcity is known as the Water
Poverty Index (WPI). This approach takes into account the role of
income and wealth in determining water scarcity by measuring:(a) the
level of access to water; (b) water quantity, quality, and variability; (c)
water used for domestic and productive purposes; (d) capacity for
water management; and (e) environmental aspects (Sullivan, 2001a,
2001b, 2002; Lawrence, et al., 2003).
As reported by IRIN, United Nations Development Programme
(UNDP) experts have emphasized that improving water supply and
sanitation are key to reducing many aspects of poverty. Klaus Topfer
(ex-UN Environment Programme chief) at the World Water Week
Symposium in Stockholm, 2002 said “without adequate clean water,
there can be no escape from poverty.” WHO also emphasized that
improved water provision will instantly improves health, especially in
poor communities, hours spent in fetching water could be invested in
other activities that will lift people out of poverty (IRIN,
Ashaolu &Abubakar: Water & Poverty Situation in Oyun L.G.A.
AFRREV STECH, Vol. 3(1) February, 2014
Copyright© IAARR 2013: www.afrrevjo.net 60 Indexed African Researches Reviews Online: www.arronet.info/afrrevstech
2006).Improved water provision in the entire facet of the society can
only be achieved through a holistic water management approach.
Hence, Water Poverty Index (WPI) is calculated using a composite
index approach in this study to understand the water and poverty
situation in Oyun Local Government Area of Kwara state, Nigeria.
The Research area
Oyun is located on latitude 8° 7' 0" North and longitude 4° 42' 0" East.
The headquarters is at Ilemona and the whole Local Government Area
covers a landmass of about 476km2. It comprises two districts namely
Odo-ogun and Oke-ogun, Odo-ogun comprises of the following
wards; Erin-Ile North ward, Erin-Ile South ward, Ilemona ward, Ira
ward, Aho/Inanja ward, Igbonna ward and Oke-Ogun comprises of the
following; Ijagbo ward, Ipee ward, Igosun ward, Ikotun ward, Ojoku
ward. The location of Oyun makes it to share a common political
boundary with Oyo State in South, Asa local Government to the West
and Irepodun local Government to the East and North.Oyun LGA is
situated in the transition zone between the forest and savannah regions
in Kwara state, North-central of Nigeria. Its climate is of the wet and
dry tropical type with mean annual rainfall of about 1,318mm and
mean monthly temperature of 32°C,the highest temperature is
observed in March. The area receives rainfall from the south-westerly
air masses, which invade the country from the gulf of guinea coast,
i.e. the tropical Atlantic. The moist air stream is overhead by the
Northeast trade wind which originated from above the Sahara and
therefore bring dry and dust laden wind in the dry season (October-
March). Temperature is high throughout the year round, mean
monthly value at 26-28°C with mean daily sunshine hours as low as
5hours.
The geological form of the study areas are comprises of crystalline
rock of the Precambrian age. The rock types include schist, quartzite,
geniss and granite, among others. These rocks are sometimes faulted
AFRREV STECH, Vol. 3(1) February, 2014
Copyright© IAARR 2013: www.afrrevjo.net 61 Indexed African Researches Reviews Online: www.arronet.info/afrrevstech
and weakened in nature and they form low inselberg. Mean depth to
water is sometimes at 3-4 meters depth. Oyun has a general
undulating landscape with the surface shape like a bigger letter “W”,
while Oyun River flows through the valley. The main river which
drains Oyun local government is the Oyun River with several
tributaries which include River Agun, River Eleyoka, River Enji,
River Omoleyin and others. Oyun River occupies a fairly wide valley
and flows in south-north direction. The inhabitants of Oyun are
predominantly farmers, growing both food and tree crops. The vast
Savannah grassland that characterized the vegetation of the area is
highly conducive for the production of food crops such as sweet
potatoes, cassava, yam, plantation, banana, vegetables pepper among
others. Tree crops that are grown here include palm trees, cashew,
mangoes, and orange etc. Livestock rearing is also common in this
area. The inhabitants also engage in various occupations such as
pottery, cloth weaving, block making, smithery, poultry farm, bread
bakery, Trading. There are salary earning opportunities in educational
institutions, hospitals, banks and few available government
establishments. The population of Oyun LGA was estimated to be
94,454, with the number of male given as 47,890 and female as
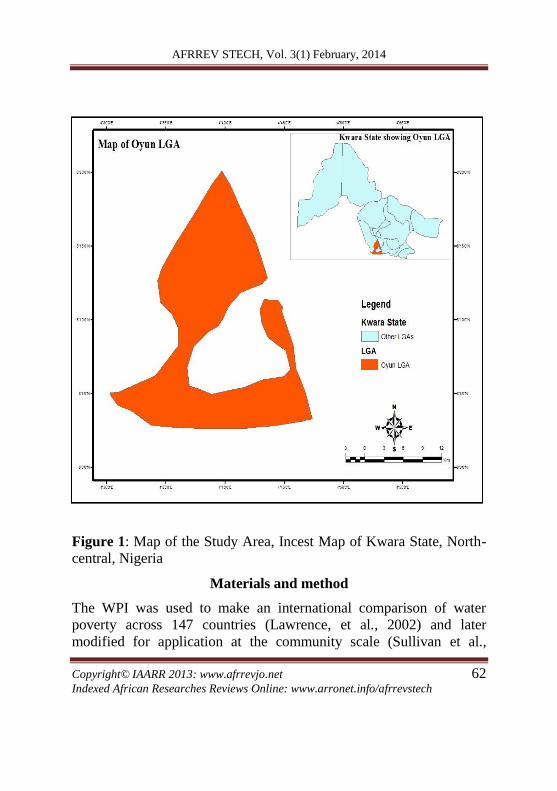
46,564(National Population Commission, 2006). See figure1 for the
map of the study area.
Ashaolu &Abubakar: Water & Poverty Situation in Oyun L.G.A.
AFRREV STECH, Vol. 3(1) February, 2014
Copyright© IAARR 2013: www.afrrevjo.net 62 Indexed African Researches Reviews Online: www.arronet.info/afrrevstech
Figure 1: Map of the Study Area, Incest Map of Kwara State, North-
central, Nigeria
Materials and method
The WPI was used to make an international comparison of water
poverty across 147 countries (Lawrence, et al., 2002) and later
modified for application at the community scale (Sullivan et al.,
AFRREV STECH, Vol. 3(1) February, 2014
Copyright© IAARR 2013: www.afrrevjo.net 63 Indexed African Researches Reviews Online: www.arronet.info/afrrevstech
2003). As a result of the findings at the community level, it has been
suggested that the WPI is more appropriate for use at the community
scale. However, there is no data base for the required data for this
study at the community level. Therefore, a detailed questionnaire
comprising 35 questions in total was designed to get the information
required in calculating a water poverty index as well as added
information on community water supply, health, general hygiene and
sanitation. This questionnaire was administered at household level in
the research area. A total of 330 copies of questionnaire were
administered in the whole of the LGA, 30 copies in each ward of the
LGA. The households were selected at random with each household
providing a representative to speak on their behalf and provided the
necessary information in the presence of every other member of the
households.
The questionnaire is divided into two parts; the first part is on the
general attribute of the households while the second part is on the
WPI. The second part was divided into five parts to cater for the
information on resources (R), access (A), capacity (C), uses (U) and
environment (E). Each of these five components was subdivided into
sub-components. The sub-components were similar to the ones
employed by the original author but with little modification to suite
the local community; see Table 1 for the sub-components used in this
study. However, the people perceptions on water quality in the area
were relied on because of the difficulties arising from getting water
sample for laboratory analysis. Also, there is no weather station in the
study area that would enable us to determine the rainfall trend in the
area and the closest weather station is the one in Ilorin, the state
capital which cannot give us the rainfall situation in the study area
because of spatio-temporal variation in rainfall distribution. Therefore
we relied on the people’s perception on how rainfall has varied
(increase or decrease) in the last 10 years in the area.
Ashaolu &Abubakar: Water & Poverty Situation in Oyun L.G.A.
AFRREV STECH, Vol. 3(1) February, 2014
Copyright© IAARR 2013: www.afrrevjo.net 64 Indexed African Researches Reviews Online: www.arronet.info/afrrevstech
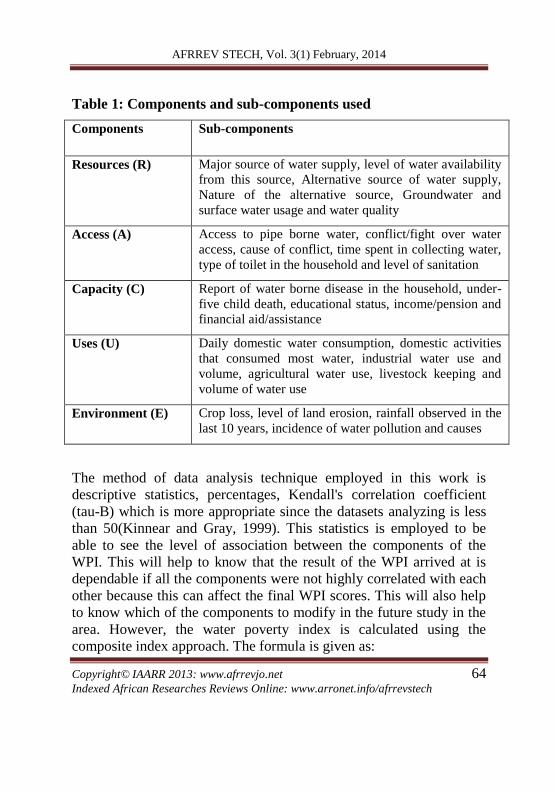
Table 1: Components and sub-components used
Components Sub-components
Resources (R) Major source of water supply, level of water availability
from this source, Alternative source of water supply,
Nature of the alternative source, Groundwater and
surface water usage and water quality
Access (A) Access to pipe borne water, conflict/fight over water
access, cause of conflict, time spent in collecting water,
type of toilet in the household and level of sanitation
Capacity (C) Report of water borne disease in the household, under-
five child death, educational status, income/pension and
financial aid/assistance
Uses (U) Daily domestic water consumption, domestic activities
that consumed most water, industrial water use and
volume, agricultural water use, livestock keeping and
volume of water use
Environment (E) Crop loss, level of land erosion, rainfall observed in the
last 10 years, incidence of water pollution and causes
The method of data analysis technique employed in this work is
descriptive statistics, percentages, Kendall's correlation coefficient
(tau-B) which is more appropriate since the datasets analyzing is less
than 50(Kinnear and Gray, 1999). This statistics is employed to be
able to see the level of association between the components of the
WPI. This will help to know that the result of the WPI arrived at is
dependable if all the components were not highly correlated with each
other because this can affect the final WPI scores. This will also help
to know which of the components to modify in the future study in the
area. However, the water poverty index is calculated using the
composite index approach. The formula is given as:
AFRREV STECH, Vol. 3(1) February, 2014
Copyright© IAARR 2013: www.afrrevjo.net 65 Indexed African Researches Reviews Online: www.arronet.info/afrrevstech
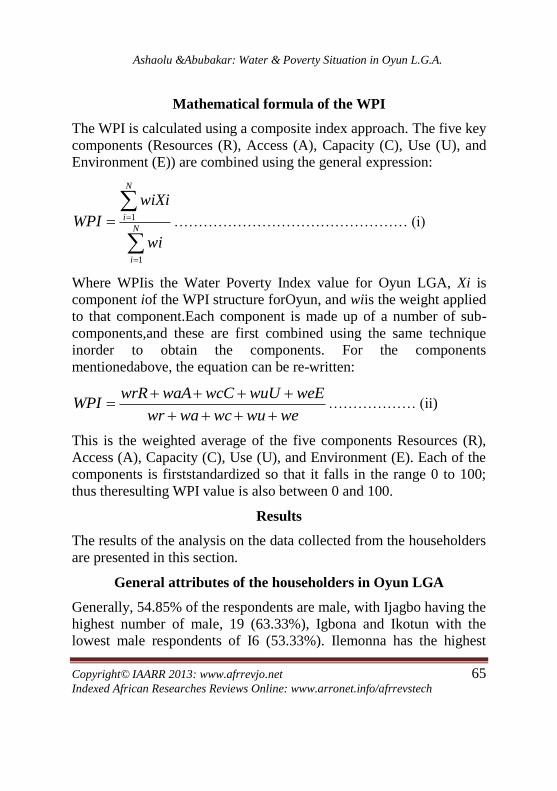
Mathematical formula of the WPI
The WPI is calculated using a composite index approach. The five key
components (Resources (R), Access (A), Capacity (C), Use (U), and
Environment (E)) are combined using the general expression:
1
1
N
i
N
i
wiXi
WPI
wi
………………………………………… (i)
Where WPIis the Water Poverty Index value for Oyun LGA, Xi is
component iof the WPI structure forOyun, and wiis the weight applied
to that component.Each component is made up of a number of sub-
components,and these are first combined using the same technique
inorder to obtain the components. For the components
mentionedabove, the equation can be re-written:
wrR waA wcC wuU weEWPI
wr wa wc wu we
……………… (ii)
This is the weighted average of the five components Resources (R),
Access (A), Capacity (C), Use (U), and Environment (E). Each of the
components is firststandardized so that it falls in the range 0 to 100;
thus theresulting WPI value is also between 0 and 100.
Results
The results of the analysis on the data collected from the householders
are presented in this section.
General attributes of the householders in Oyun LGA
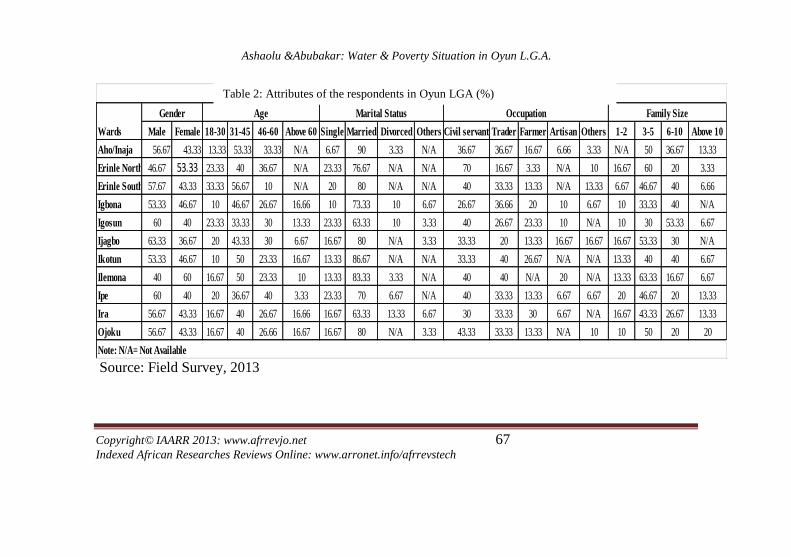
Generally, 54.85% of the respondents are male, with Ijagbo having the
highest number of male, 19 (63.33%), Igbona and Ikotun with the
lowest male respondents of I6 (53.33%). Ilemonna has the highest
Ashaolu &Abubakar: Water & Poverty Situation in Oyun L.G.A.
AFRREV STECH, Vol. 3(1) February, 2014
Copyright© IAARR 2013: www.afrrevjo.net 66 Indexed African Researches Reviews Online: www.arronet.info/afrrevstech
number of female respondents, 18 (60%) and Ijagbo with the lowest
number of female respondents, 11(36.67%).In Oyun LGA, 72.42% of
the population of the household interviewed is between age 31-60 and
76.97% are married. Most of the responded are civil servants and
traders, 15.76% are farmer.However, larger percentage of those that
are civil servants and traders still practices subsistence farming or
gardening. In the area, the household with family size between 3-5
ranges is the highest (46.97%) and the households with 6-10 people
are 31.21%. The attributes of the respondents/households in each ward
of Oyun LGA is presented in Table 2.
AFRREV STECH, Vol. 3(1) February, 2014
Copyright© IAARR 2013: www.afrrevjo.net 67 Indexed African Researches Reviews Online: www.arronet.info/afrrevstech
Male Female 18-30 31-45 46-60 Above 60 Single Married Divorced Others Civil servant Trader Farmer Artisan Others 1-2 3-5 6-10 Above 10
Aho/Inaja 56.67 43.33 13.33 53.33 33.33 N/A 6.67 90 3.33 N/A 36.67 36.67 16.67 6.66 3.33 N/A 50 36.67 13.33
Erinle North 46.67 53.33 23.33 40 36.67 N/A 23.33 76.67 N/A N/A 70 16.67 3.33 N/A 10 16.67 60 20 3.33
Erinle South 57.67 43.33 33.33 56.67 10 N/A 20 80 N/A N/A 40 33.33 13.33 N/A 13.33 6.67 46.67 40 6.66
Igbona 53.33 46.67 10 46.67 26.67 16.66 10 73.33 10 6.67 26.67 36.66 20 10 6.67 10 33.33 40 N/A
Igosun 60 40 23.33 33.33 30 13.33 23.33 63.33 10 3.33 40 26.67 23.33 10 N/A 10 30 53.33 6.67
Ijagbo 63.33 36.67 20 43.33 30 6.67 16.67 80 N/A 3.33 33.33 20 13.33 16.67 16.67 16.67 53.33 30 N/A
Ikotun 53.33 46.67 10 50 23.33 16.67 13.33 86.67 N/A N/A 33.33 40 26.67 N/A N/A 13.33 40 40 6.67
Ilemona 40 60 16.67 50 23.33 10 13.33 83.33 3.33 N/A 40 40 N/A 20 N/A 13.33 63.33 16.67 6.67
Ipe 60 40 20 36.67 40 3.33 23.33 70 6.67 N/A 40 33.33 13.33 6.67 6.67 20 46.67 20 13.33
Ira 56.67 43.33 16.67 40 26.67 16.66 16.67 63.33 13.33 6.67 30 33.33 30 6.67 N/A 16.67 43.33 26.67 13.33
Ojoku 56.67 43.33 16.67 40 26.66 16.67 16.67 80 N/A 3.33 43.33 33.33 13.33 N/A 10 10 50 20 20
Table 3.1: Attributes of the Respondents in Oyun LGA (%)
Note: N/A= Not Available
Wards
Gender Age Marital Status Occupation Family Size
Source: Field Survey, 2013
Table 2: Attributes of the respondents in Oyun LGA (%)
Ashaolu &Abubakar: Water & Poverty Situation in Oyun L.G.A.
AFRREV STECH, Vol. 3(1) February, 2014
Copyright© IAARR 2013: www.afrrevjo.net 68 Indexed African Researches Reviews Online: www.arronet.info/afrrevstech
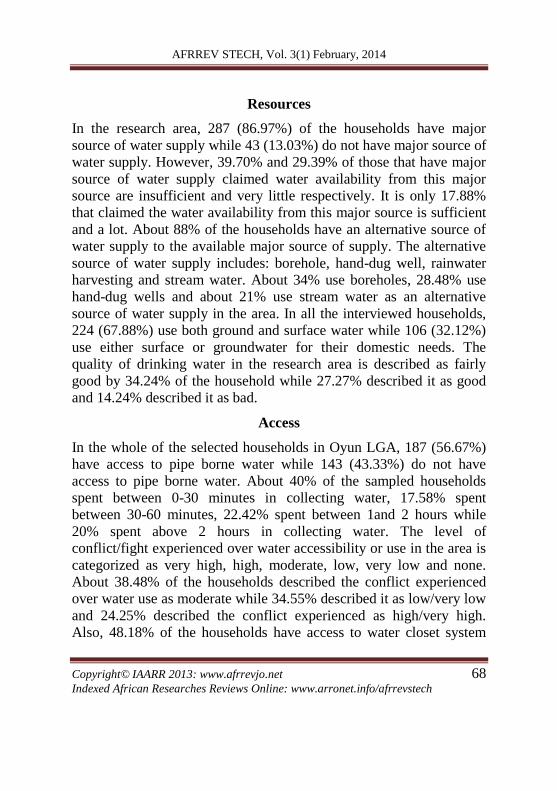
Resources
In the research area, 287 (86.97%) of the households have major
source of water supply while 43 (13.03%) do not have major source of
water supply. However, 39.70% and 29.39% of those that have major
source of water supply claimed water availability from this major
source are insufficient and very little respectively. It is only 17.88%
that claimed the water availability from this major source is sufficient
and a lot. About 88% of the households have an alternative source of
water supply to the available major source of supply. The alternative
source of water supply includes: borehole, hand-dug well, rainwater
harvesting and stream water. About 34% use boreholes, 28.48% use
hand-dug wells and about 21% use stream water as an alternative
source of water supply in the area. In all the interviewed households,
224 (67.88%) use both ground and surface water while 106 (32.12%)
use either surface or groundwater for their domestic needs. The
quality of drinking water in the research area is described as fairly
good by 34.24% of the household while 27.27% described it as good
and 14.24% described it as bad.
Access
In the whole of the selected households in Oyun LGA, 187 (56.67%)
have access to pipe borne water while 143 (43.33%) do not have
access to pipe borne water. About 40% of the sampled households
spent between 0-30 minutes in collecting water, 17.58% spent
between 30-60 minutes, 22.42% spent between 1and 2 hours while
20% spent above 2 hours in collecting water. The level of
conflict/fight experienced over water accessibility or use in the area is
categorized as very high, high, moderate, low, very low and none.
About 38.48% of the households described the conflict experienced
over water use as moderate while 34.55% described it as low/very low
and 24.25% described the conflict experienced as high/very high.
Also, 48.18% of the households have access to water closet system
AFRREV STECH, Vol. 3(1) February, 2014
Copyright© IAARR 2013: www.afrrevjo.net 69 Indexed African Researches Reviews Online: www.arronet.info/afrrevstech
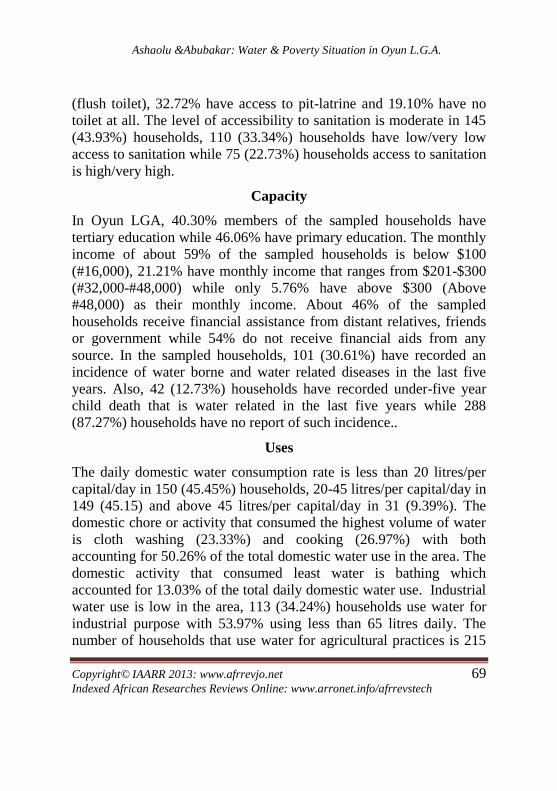
(flush toilet), 32.72% have access to pit-latrine and 19.10% have no
toilet at all. The level of accessibility to sanitation is moderate in 145
(43.93%) households, 110 (33.34%) households have low/very low
access to sanitation while 75 (22.73%) households access to sanitation
is high/very high.
Capacity
In Oyun LGA, 40.30% members of the sampled households have
tertiary education while 46.06% have primary education. The monthly
income of about 59% of the sampled households is below $100
(#16,000), 21.21% have monthly income that ranges from $201-$300
(#32,000-#48,000) while only 5.76% have above $300 (Above
#48,000) as their monthly income. About 46% of the sampled
households receive financial assistance from distant relatives, friends
or government while 54% do not receive financial aids from any
source. In the sampled households, 101 (30.61%) have recorded an
incidence of water borne and water related diseases in the last five
years. Also, 42 (12.73%) households have recorded under-five year
child death that is water related in the last five years while 288
(87.27%) households have no report of such incidence..
Uses
The daily domestic water consumption rate is less than 20 litres/per
capital/day in 150 (45.45%) households, 20-45 litres/per capital/day in
149 (45.15) and above 45 litres/per capital/day in 31 (9.39%). The
domestic chore or activity that consumed the highest volume of water
is cloth washing (23.33%) and cooking (26.97%) with both
accounting for 50.26% of the total domestic water use in the area. The
domestic activity that consumed least water is bathing which
accounted for 13.03% of the total daily domestic water use. Industrial
water use is low in the area, 113 (34.24%) households use water for
industrial purpose with 53.97% using less than 65 litres daily. The
number of households that use water for agricultural practices is 215
Ashaolu &Abubakar: Water & Poverty Situation in Oyun L.G.A.
AFRREV STECH, Vol. 3(1) February, 2014
Copyright© IAARR 2013: www.afrrevjo.net 70 Indexed African Researches Reviews Online: www.arronet.info/afrrevstech
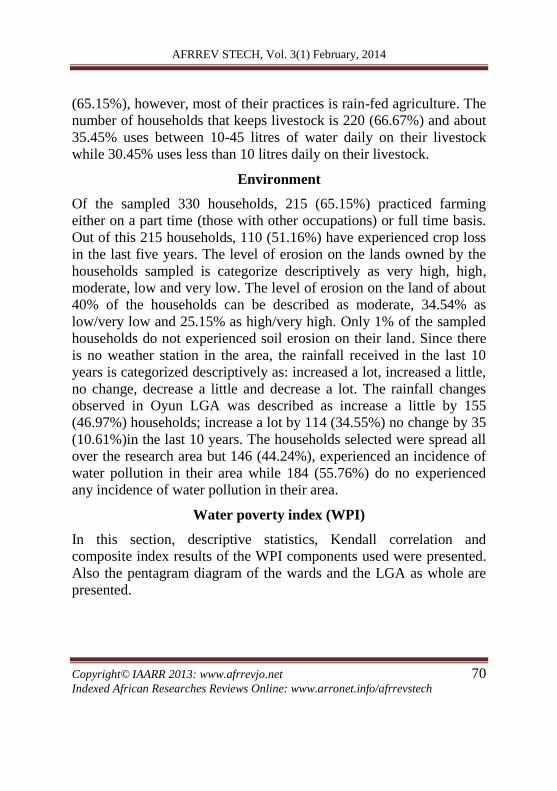
(65.15%), however, most of their practices is rain-fed agriculture. The
number of households that keeps livestock is 220 (66.67%) and about
35.45% uses between 10-45 litres of water daily on their livestock
while 30.45% uses less than 10 litres daily on their livestock.
Environment
Of the sampled 330 households, 215 (65.15%) practiced farming
either on a part time (those with other occupations) or full time basis.
Out of this 215 households, 110 (51.16%) have experienced crop loss
in the last five years. The level of erosion on the lands owned by the
households sampled is categorize descriptively as very high, high,
moderate, low and very low. The level of erosion on the land of about
40% of the households can be described as moderate, 34.54% as
low/very low and 25.15% as high/very high. Only 1% of the sampled
households do not experienced soil erosion on their land. Since there
is no weather station in the area, the rainfall received in the last 10
years is categorized descriptively as: increased a lot, increased a little,
no change, decrease a little and decrease a lot. The rainfall changes
observed in Oyun LGA was described as increase a little by 155
(46.97%) households; increase a lot by 114 (34.55%) no change by 35
(10.61%)in the last 10 years. The households selected were spread all
over the research area but 146 (44.24%), experienced an incidence of
water pollution in their area while 184 (55.76%) do no experienced
any incidence of water pollution in their area.
Water poverty index (WPI)
In this section, descriptive statistics, Kendall correlation and
composite index results of the WPI components used were presented.
Also the pentagram diagram of the wards and the LGA as whole are
presented.
AFRREV STECH, Vol. 3(1) February, 2014
Copyright© IAARR 2013: www.afrrevjo.net 71 Indexed African Researches Reviews Online: www.arronet.info/afrrevstech
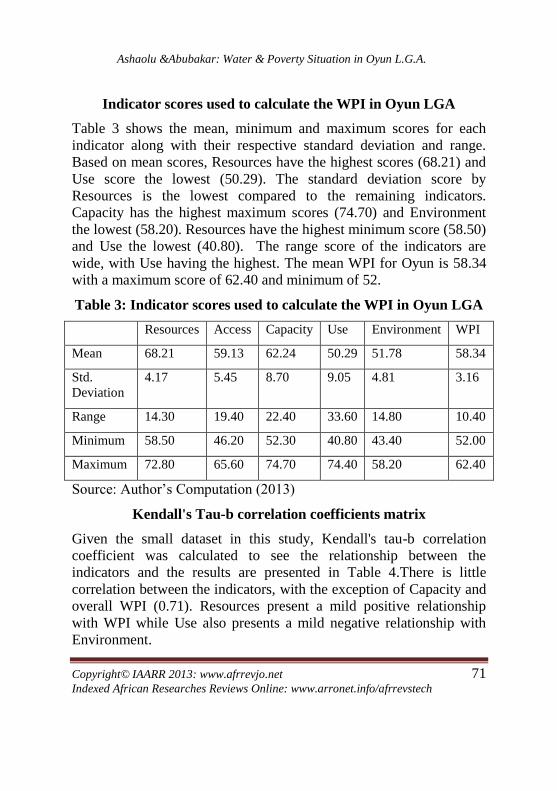
Indicator scores used to calculate the WPI in Oyun LGA
Table 3 shows the mean, minimum and maximum scores for each
indicator along with their respective standard deviation and range.
Based on mean scores, Resources have the highest scores (68.21) and
Use score the lowest (50.29). The standard deviation score by
Resources is the lowest compared to the remaining indicators.
Capacity has the highest maximum scores (74.70) and Environment
the lowest (58.20). Resources have the highest minimum score (58.50)
and Use the lowest (40.80). The range score of the indicators are
wide, with Use having the highest. The mean WPI for Oyun is 58.34
with a maximum score of 62.40 and minimum of 52.
Table 3: Indicator scores used to calculate the WPI in Oyun LGA
Resources Access Capacity Use Environment WPI
Mean 68.21 59.13 62.24 50.29 51.78 58.34
Std.
Deviation
4.17 5.45 8.70 9.05 4.81 3.16
Range 14.30 19.40 22.40 33.60 14.80 10.40
Minimum 58.50 46.20 52.30 40.80 43.40 52.00
Maximum 72.80 65.60 74.70 74.40 58.20 62.40
Source: Author’s Computation (2013)
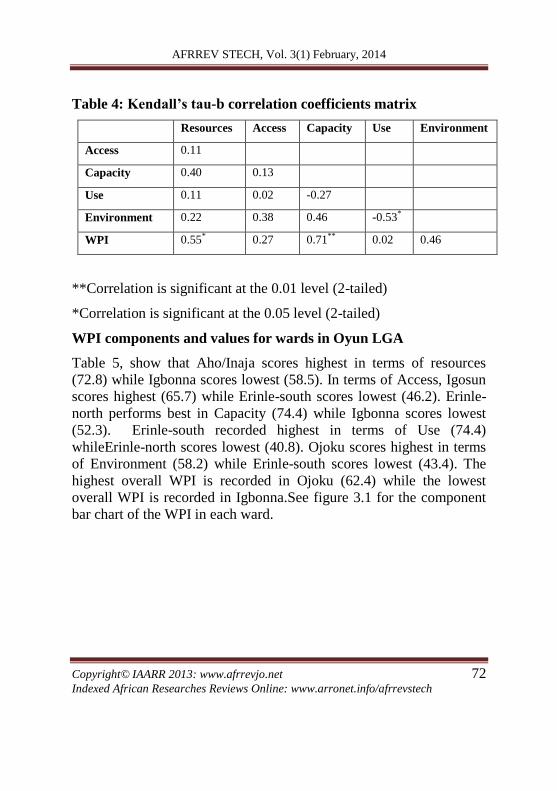
Kendall's Tau-b correlation coefficients matrix
Given the small dataset in this study, Kendall's tau-b correlation
coefficient was calculated to see the relationship between the
indicators and the results are presented in Table 4.There is little
correlation between the indicators, with the exception of Capacity and
overall WPI (0.71). Resources present a mild positive relationship
with WPI while Use also presents a mild negative relationship with
Environment.
Ashaolu &Abubakar: Water & Poverty Situation in Oyun L.G.A.
AFRREV STECH, Vol. 3(1) February, 2014
Copyright© IAARR 2013: www.afrrevjo.net 72 Indexed African Researches Reviews Online: www.arronet.info/afrrevstech
Table 4: Kendall’s tau-b correlation coefficients matrix
Resources Access Capacity Use Environment
Access 0.11
Capacity 0.40 0.13
Use 0.11 0.02 -0.27
Environment 0.22 0.38 0.46 -0.53*
WPI 0.55* 0.27 0.71** 0.02 0.46
**Correlation is significant at the 0.01 level (2-tailed)
*Correlation is significant at the 0.05 level (2-tailed)
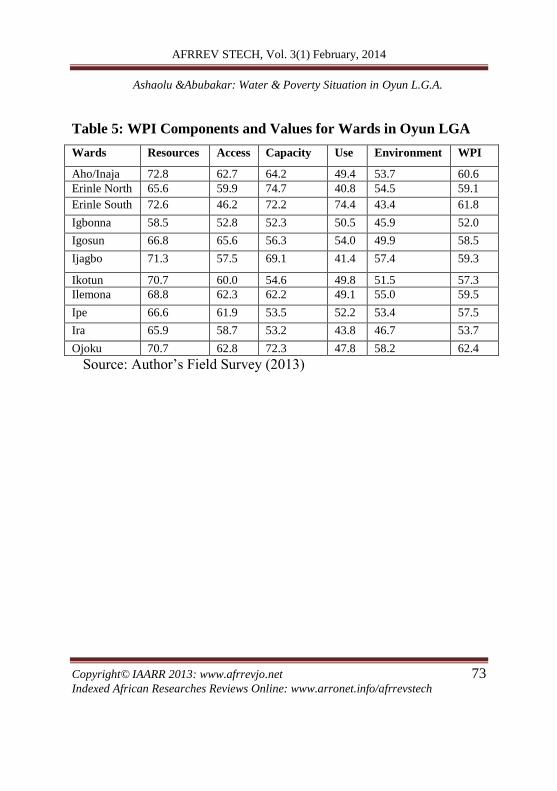
WPI components and values for wards in Oyun LGA
Table 5, show that Aho/Inaja scores highest in terms of resources
(72.8) while Igbonna scores lowest (58.5). In terms of Access, Igosun
scores highest (65.7) while Erinle-south scores lowest (46.2). Erinle-
north performs best in Capacity (74.4) while Igbonna scores lowest
(52.3). Erinle-south recorded highest in terms of Use (74.4)
whileErinle-north scores lowest (40.8). Ojoku scores highest in terms
of Environment (58.2) while Erinle-south scores lowest (43.4). The
highest overall WPI is recorded in Ojoku (62.4) while the lowest
overall WPI is recorded in Igbonna.See figure 3.1 for the component
bar chart of the WPI in each ward.
AFRREV STECH, Vol. 3(1) February, 2014
Copyright© IAARR 2013: www.afrrevjo.net 73 Indexed African Researches Reviews Online: www.arronet.info/afrrevstech
Table 5: WPI Components and Values for Wards in Oyun LGA
Wards Resources Access Capacity Use Environment WPI
Aho/Inaja 72.8 62.7 64.2 49.4 53.7 60.6
Erinle North 65.6 59.9 74.7 40.8 54.5 59.1
Erinle South 72.6 46.2 72.2 74.4 43.4 61.8
Igbonna 58.5 52.8 52.3 50.5 45.9 52.0
Igosun 66.8 65.6 56.3 54.0 49.9 58.5
Ijagbo 71.3 57.5 69.1 41.4 57.4 59.3
Ikotun 70.7 60.0 54.6 49.8 51.5 57.3
Ilemona 68.8 62.3 62.2 49.1 55.0 59.5
Ipe 66.6 61.9 53.5 52.2 53.4 57.5
Ira 65.9 58.7 53.2 43.8 46.7 53.7
Ojoku 70.7 62.8 72.3 47.8 58.2 62.4
Source: Author’s Field Survey (2013)
Ashaolu &Abubakar: Water & Poverty Situation in Oyun L.G.A.
AFRREV STECH, Vol. 3(1) February, 2014
Copyright© IAARR 2013: www.afrrevjo.net 74 Indexed African Researches Reviews Online: www.arronet.info/afrrevstech
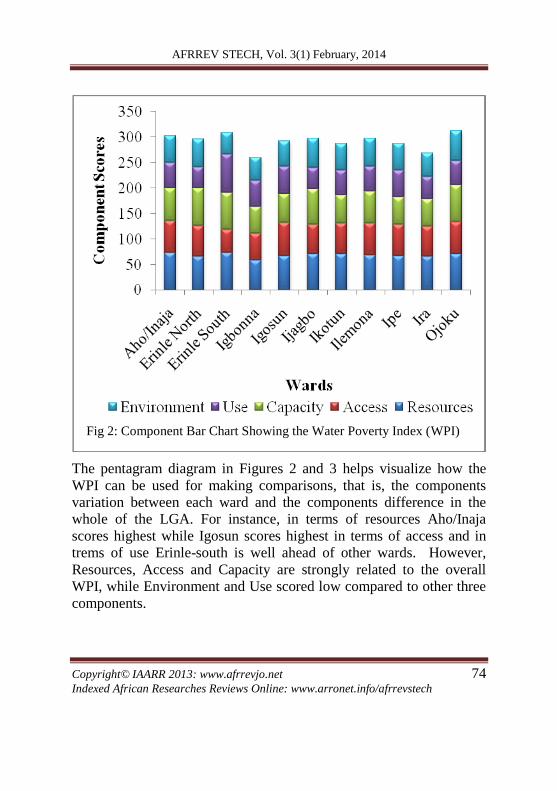
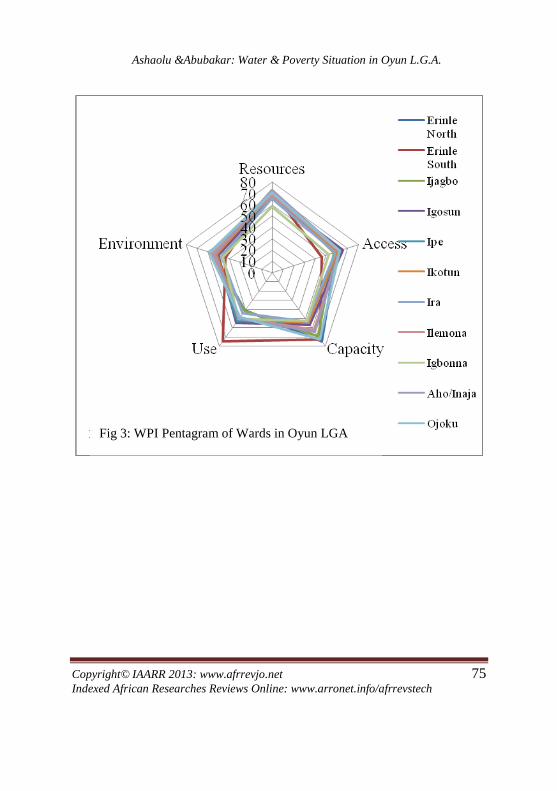
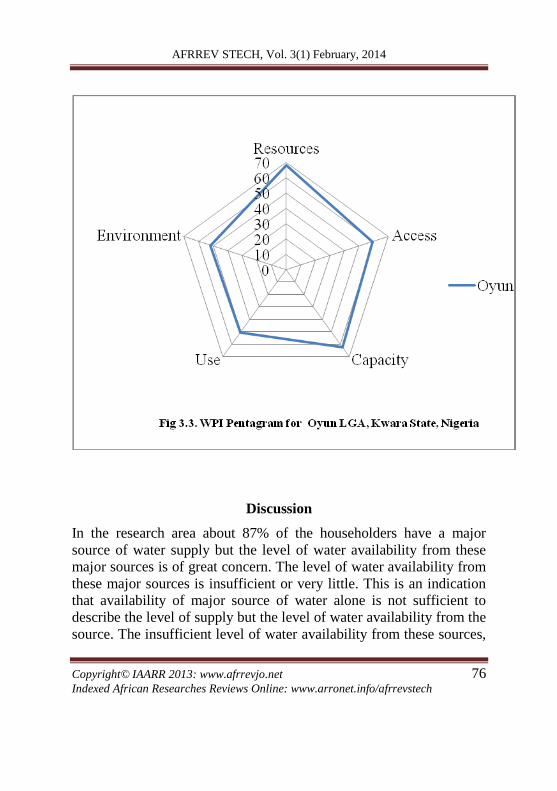
The pentagram diagram in Figures 2 and 3 helps visualize how the
WPI can be used for making comparisons, that is, the components
variation between each ward and the components difference in the
whole of the LGA. For instance, in terms of resources Aho/Inaja
scores highest while Igosun scores highest in terms of access and in
trems of use Erinle-south is well ahead of other wards. However,
Resources, Access and Capacity are strongly related to the overall
WPI, while Environment and Use scored low compared to other three
components.
Fig 2: Component Bar Chart Showing the Water Poverty Index (WPI)
AFRREV STECH, Vol. 3(1) February, 2014
Copyright© IAARR 2013: www.afrrevjo.net 75 Indexed African Researches Reviews Online: www.arronet.info/afrrevstech
Fig 3: WPI Pentagram of Wards in Oyun LGA
Ashaolu &Abubakar: Water & Poverty Situation in Oyun L.G.A.
AFRREV STECH, Vol. 3(1) February, 2014
Copyright© IAARR 2013: www.afrrevjo.net 76 Indexed African Researches Reviews Online: www.arronet.info/afrrevstech
Discussion
In the research area about 87% of the householders have a major
source of water supply but the level of water availability from these
major sources is of great concern. The level of water availability from
these major sources is insufficient or very little. This is an indication
that availability of major source of water alone is not sufficient to
describe the level of supply but the level of water availability from the
source. The insufficient level of water availability from these sources,
AFRREV STECH, Vol. 3(1) February, 2014
Copyright© IAARR 2013: www.afrrevjo.net 77 Indexed African Researches Reviews Online: www.arronet.info/afrrevstech
made about 88% of the householders to seek an alternative of source
of water supply. The alternative sources of water supply in Oyun LGA
include hand-pump boreholes, hand-dug wells, stream and rainwater
harvesting. About 62% use both boreholes and hand-dug wells as an
alternative source of water supply because they believe the quality of
water from these two sources are fairly good compared to the stream
water.
About 57% households in Oyun LGA have access to pipe borne
water. The number of households with access to pipe borne is affected
by the distribution coverage and the status of the pipe borne water
provider (water works) in the area. There are about eight water works
in the area. The source of supply for these water works are weir (3),
boreholes (3) and dams (2). With the number of water works in the
area, it is expected that the pipe borne water coverage in the area
should be more than 57%. However, three out of the eight water
works are not functioning while the performances of the remaining
five are not optimal. This can be attributed to the inadequate
maintenance and old equipment in the water works. About 40% of the
sampled households spent between 0-30 minutes in collecting water
daily. It is important to note that those households that spent this time
are those with the privilege of owing private wells. Also, 22.42% and
20% of the householders spent between 1-2 hours and above 2 hours
respectively in collecting water daily. These are households that does
not own private wells but have to resort to collecting water from the
few public boreholes provided by the government or from the stream.
As reported by some of the households in the area, “some of us spent
most of our days at the public boreholes as if it is our second home,
trying to collect enough water for our households”. This is because the
water is rationed most of the time as a result of the stiffness of the
hand driven boreholes which make people to spend more than
necessary time at point. The study revealed that households with
private wells experienced little or no conflict over water accessibility.
Ashaolu &Abubakar: Water & Poverty Situation in Oyun L.G.A.
AFRREV STECH, Vol. 3(1) February, 2014
Copyright© IAARR 2013: www.afrrevjo.net 78 Indexed African Researches Reviews Online: www.arronet.info/afrrevstech
Conflicts over water accessibility in the area are experienced mainly at
the public boreholes and streams. Insufficient level of water
availability is the cause of conflicts in the whole area. Most of the
people do not always respect the arrangement of rationing the water at
the public boreholes. They always want to collect water into all the
containers brought to the borehole as against the lay down rules of
rationing, which often leads to fight outbreaks.
Also, the fight experienced during the dry season is usually high
because the water table would have dropped considerably and the
seasonal streams in the area would have reduced in size or completely
dried up. As narrated by one of the householders, fight over water
accessibility in the dry season is terribly high. It usually resulted into
“free for all” fight where people sustained injuries. He stressed
further, that on some few occasions, it requires police intervention to
check the outbreak of the fight. A respondent recalled “I have been
standing on the queue for over 2 hours waiting to collect water, tired
and stressed out, someone mistakenly stepped on me and it resulted
into serious fight where lots of water containers were broken.” This
revealed the psychological effect spending longer time in getting
water can have on people.
The study revealed that only 48.18% of the sampled households have
access to flush toilet while 32.72% have access to pit latrine and
19.10% have no toilet at all. The type of toilet used will determine the
volume of water used for cleaning up and flushing. This has serious
implication on the sanitation and health of the people. The level of
access to sanitation is considerably low in 33.34% of the sampled
households, while 43.93% have moderate accessibility to sanitation
and 22.78% have high access to sanitation. Those households with
poor sanitation access are those with no toilets, poorly designed pit
toilet and have no private well. The time spent in getting water
determines how it is used. There are scenarios where households with
pit latrine of flush toilets decided to use open spaces for defecation
AFRREV STECH, Vol. 3(1) February, 2014
Copyright© IAARR 2013: www.afrrevjo.net 79 Indexed African Researches Reviews Online: www.arronet.info/afrrevstech
because there is no enough water for cleaning up and flushing the
toilet after usage. Households with private wells have high and
moderate sanitation; hence, water availability improves the level of
sanitation. However, there are households with private wells with fair
level of sanitation. This shows that water availability alone is not
enough to improve sanitation but the level of information and
habit/attitude of the people towards sanitation.
The level of sanitation in the area can be attributed to the percentage
of households (30.61%) that have recorded an incidence of water
borne and water related diseases in the last five years. Also, 12.3% of
the households have recorded under-five year child death that is water
related in the last five years. The level of sanitation, water borne
diseases and under-five year child death recorded in some households
can be attributed to the level of income of the householders. The
monthly income of about 59% of the sampled households is below
$100 (#16000), 21.21% monthly income ranges from $201-$300
(#32,000 - #48,000). This is an indication that the larger percentage of
the Oyun LGA residents is low income earners. This also reflects in
the small percentage of the households that have the capability of
owing a private well. Despite all this, the level of education in the area
is quite interesting. From the 330 sampled households, 40.30% of the
members have tertiary education while 46.06% have secondary
education. The level of education attained is believed to have direct
relationship on the level of income, which supposed to influence the
ability and capability to access a better water supply. However, the
level accessibility to water supply in the whole area can only be
described as been fair. This scenario in Oyun LGA reflects what is
obtainable in Nigeria as a whole.
Water is use mostly for domestic purpose and for livestock keeping
because most of the residents of this area keep livestock.
WHO/UNICEF (2000) give an estimate of 20 l/c/das the volume of
water required for basic domestic health and hygiene needs. In Oyun,
Ashaolu &Abubakar: Water & Poverty Situation in Oyun L.G.A.
AFRREV STECH, Vol. 3(1) February, 2014
Copyright© IAARR 2013: www.afrrevjo.net 80 Indexed African Researches Reviews Online: www.arronet.info/afrrevstech
45.45% of the sampled households use less than 20 l/c/d. This
percentage also reflected in the level of access to sanitation in the
whole area. Cloth washing and cooking accounted for about 50.26%
of the domestic water use while bathing (13.03%) consumed the least.
Industrial and agricultural water use in Oyun is very low compared to
domestic water usage. This can be attributed to the fact that it is rain-
fed agriculture that is practiced in the area. Also, the minimal water is
used for industrial purpose because there is no heavy industry in this
area. The few light industries that use water are block making and
bread making industries.
Farming is practiced either on full time or part time by 65.15% of the
sampled households. Out of this 65.15%, 51.16% have experienced
crop loss in the last five years. It is only 25.15% of the households
that have experienced high/very high erosion rate on their land.
Rainfall received in the area in described to be on the increase in the
last 10 years. Though the description is subjective but one can be
certain that rainfall received in the area is on the increase because
81.51% of the sampled households in the area described the rainfall
received as increase a little/increase a lot. Since rain-fed agriculture is
been practiced in this area, increase in rainfall, other things being
equal can increase crop yield. Hence, increase in income of the
farmers, thereby reducing the level of poverty in the area. The results
of the survey revealed that 44.24% of the sampled households
experienced incidence of water pollution, such as dumping of feaces
and refuse into streams, defecating around the major sources of water.
The incidence of water pollution is however common in hand-dug
wells. They are sometimes polluted by septic tanks or during the
process of evacuating the soak-away.
The results of the overall scores for each component in the area show
that Resources (68.21%) score highest, followed by Capacity
(62.24%), Access (59.13%), Environment (51.78) and Use (50.29%)
which is the lowest of all scores. As you can see in Table 3.4, the WPI
AFRREV STECH, Vol. 3(1) February, 2014
Copyright© IAARR 2013: www.afrrevjo.net 81 Indexed African Researches Reviews Online: www.arronet.info/afrrevstech
range from a low of 52.0 to a high of 62.4 among the wards, while the
overall WPI for Oyun is 58.34%.The results of the Kendall’s
correlation show that there is a mild negative correlation (r= -0.53)
between the Use and Environment. This show that the Use which is
not optimized in the area can be ascribed to water quality and stress,
the level at which water and the environment generally are given
importance in the LGA’s strategic and regulatory framework. The
resources and the capacity of the people in the area has a mild positive
relationship (r= 0.55) and strong positive relationship (r= 0.71) with
the overall WPI. However, there is no relationship between the
Capacity and Access to water resources in the area. This is an
indication that the capacity of the people in the area count for nothing
in the accessibility to the available water resources which is somewhat
ironic.
Aho/Inaja ward scores the highest in terms of Resources (72.8), this
can be attributed to the large surface reservoir and the number of
water supply points in relation to the population in the area. Also,
majority of the households have alternative source of supply and uses
both ground and surface water to meet their daily domestic need.
Igbonna scored lowest on Resources (58.5), this can be attributed to
the insufficient supply from the major sources of water supply and the
quality of the water in particular. Igosun scored highest in terms of
Access (65.6), this is because about 87% of the population have
access to pipe borne water, 80% have access to toilet (flush and pit
toilet) and more than 50% have good sanitation practices. Erinle-
south scored least on Access (52.8), more than half of the population
does not have access to pipe borne water supply. Erinle-north ranked
highest on Capacity (74.7), this can be attributed to the level of
education, income and minor cases of water related diseases or death
recorded in the area. Igbonna scored least on Capacity (52.3), this is
also attributed to the level of income, the number of water related
diseases recorded in the area in the last five years. Erinle-south ranked
Ashaolu &Abubakar: Water & Poverty Situation in Oyun L.G.A.
AFRREV STECH, Vol. 3(1) February, 2014
Copyright© IAARR 2013: www.afrrevjo.net 82 Indexed African Researches Reviews Online: www.arronet.info/afrrevstech
highest on Use (74.4), this is attributed to the high volume of domestic
water use, the water use by the bakery and block making industries as
well as water use in gardening. Erin-north scored lowest on Use
(40.8), which is attributed to low water use by the few light industries
in the area and on gardening. Ojoku scored highest on environment
(58.2), which can be attributed to the minute incidence of crop loss
recorded in the last five years and few cases of water pollution
incidence. Erinle-south scored least on Environment (43.3), this is as
result of the high crop loss rate the nature of erosion recorded in the
area. Ojoku ward scored highest WPI (62.4),this can be attributed to
the availability of water resources, the high level of accessibility and
capacity in the area. While Igbonna scored lowest WPI (52.0), which
can be attributed to the low level of accessibility, capability and the
general sanitation of the area. However, the overall WPI for the whole
LGA is 58.34, which is an indication that the overall water and
poverty situation in Oyun LGA is fair.
Conclusion
In conclusion, WPI provide a better understanding of the relationship
between the extent of water availability, the ease of abstraction or
accessibility and the level of community welfare. This study presented
the situation of water and poverty in Oyun LGA of Kwara state,
Nigeria. The results of the analysis show that water resource is high in
the study area but the level of accessibility is low compared to the
available water resources. This was attributed to the fact that majority
of the households in this area are low income earner as revealed by the
study. The study further revealed that the usage is also low because
water is used mostly for domestic consumption while industrial usage
is limited to the few light industries such as block and bread making
industries available in the area. Also, available water Resources,
Capacity and access were better than Use and Environment in relation
to the overall water poverty situation in the area. The study concluded
that the overall water and poverty situation in Oyun LGA is fair. It is
AFRREV STECH, Vol. 3(1) February, 2014
Copyright© IAARR 2013: www.afrrevjo.net 83 Indexed African Researches Reviews Online: www.arronet.info/afrrevstech
therefore recommended that appropriate measure should be taken to
improve the overall water accessibility and usage in the LGA by
creating more water supply points in the community and
renovating/upgrading the existing water works in the area for
improved pipe borne water supply. Also, water use should be
extended beyond domestic usage into other sectors that can increase
productivity and hence, the overall poverty level in the area. The local
authority should put in place functioning health inspecting and waste
management bodies to improve the general sanitation and hygiene of
the residents of the area. If the aforementioned recommendations are
put into place, it is hoped that the overall water and poverty situation
in Oyun would improve significantly.
References
Asian Development Bank (2003). Bringing Potable Water to the Far-
FlungIslands of the Philippines. Manila.
Chris White (2012) Understanding water scarcity: Definitions and
measurements, Global Water Forum, retrieved from
http://www.globalwaterforum.org/2012/05/07/understanding-water-
scarcity on 21st September, 2013
Falkenmark, M., Lundqvist, J., & Widstrand, C. (1989). Macro-scale water
scarcityrequires micro-scale approaches: Aspects of vulnerability
in semi-arid development. Natural Resources Forum, 13(4), 258-
267.
Food and Agriculture Organization (2011). AQUASTAT, retrieved from
www.fao.org/nr/water/aquastat/water_use/index.stm, 18th
May, 2013.
Food and Agriculture Organization (2012). Coping with Water Scarcity: An
Action Framework for Agriculture and Food Security, FAO Water
Report 38, Rome: 2012.
Ashaolu &Abubakar: Water & Poverty Situation in Oyun L.G.A.
AFRREV STECH, Vol. 3(1) February, 2014
Copyright© IAARR 2013: www.afrrevjo.net 84 Indexed African Researches Reviews Online: www.arronet.info/afrrevstech
Human Development Report (2006). Beyond scarcity: Power, poverty and
the global water crisis. Published for the United Nations
Development Programme (UNDP), Palgrave Macmillan
Houndmills, Basingstoke, Hampshire RG21 6XS and175 Fifth
Avenue, New York.
International Water Management Institute (2000). The International Water
Management Institute (IWMI) global water scarcity study.
IRIN (2006) In-depth: Running Dry: the Humanitarian Impact of Global
Water Crisis, retrieved from
http://www.irinnews.org/indepthmain.aspx?InDepthId=13&ReportI
d on 23rd September, 2013.
Kinnear, P. R., & Gray, C. D. (1999). SPSS for Windows made simple.
Psychology Press.
Lawrence, P., Meigh, J. R., & Sullivan, C. A. (2002). The water poverty
index: An international comparison. Staffordshire (UK): Keele
Economics Department Working Paper.
Mlote D. M.Steven, Caroline Sullivan and Jeremy Meigh (2002). Water
Poverty Index: a Tool for Integrated Water Management, 3rd
WaterNet/Warfsa Symposium 'Water Demand Management for
Sustainable Development', Dar es Salaam, 30-31 October 2002.
Raskin, P., Gleick, P., Kirshen, P., Pontius, G., & Strzepek, K. (1997). Water
Futures: Assessment of Long-range Patterns and Prospects,
Stockholm Environment Institute, Stockholm, Sweden
Seckler, D., Amarasinghe, U., Molden, D., de Silva, R., & Barker, R. (1998).
World water demand and supply, 1990 to 2025: Scenarios and
issues. IWMI Research Report 19. Colombo: International Water
Management Institute (IWMI)
Sullivan, C. A. (ed.) (2001). The Development of a Water Poverty Index: A
Feasibility Study. The Centre for Ecology and Hydrology
(Wallingford)
Sullivan, C.A. (2001b). The potential for calculating a meaningful water
poverty index. Water International, Dec. 2001.
AFRREV STECH, Vol. 3(1) February, 2014
Copyright© IAARR 2013: www.afrrevjo.net 85 Indexed African Researches Reviews Online: www.arronet.info/afrrevstech
Sullivan, Caroline (2002). Calculating a Water Poverty Index, World
Development, 30 (7): 1195-1211.
The World Water Organization, (2010) Water Facts & Water Stories from
Across the Globe, retrieved
fromhttp://www.theworldwater.org/water_facts.php on 18th March,
2011.
UN News Service (2009) Ballooning global population adding to water
crisis, warns new UN report, UN News Centre, March 12,
2009, retrieved from
http://www.un.org/apps/news/story.asp?NewsID=30167&Cr=water
&Cr1=supplyon 26th March, 2011.
UN Water, (2012). Statistics: Graphs & Maps, retrieved
fromwww.unwater.org/statistics_use.html, on 20thSeptember, 2013.
Vörösmarty, C. J., Green, P., Salisbury, J., & Lammers, R. B. (2000). Global
water resources: Vulnerability from climate change and population
growth. Science, 289(5477), 284-288.
Warner D (1998) Drinking water supply and environmental sanitation for
health. Presented at the International Conference for Sustainable
Development, Paris.
World Health Organization (2008) Guidelines to Potable Water Quality,
Incorporating 1st and 2nd Addenda, Vol. 1, Recommendation.
Retrieved on-line on March 25, 2013 from
www.who.int/water_sanitation_health/dwgfulltext.pdf
World Water Assessment Programme (2012). World Water Development
Report, Vol. 1: Managing Water under Uncertainty and Risk,
Paris: UNESCO, 2012.
World Bank (1996). Evolution of Poverty and Welfare in Nigeria (1985 –
1992), World Bank Policy Research Working Paper 1715
Washington D.C.
World Commissions on Dam (2000). Dams and Development: A New
Framework for Decision-Making, retrieved from
http://www.dams.org/report/ on 5th June, 2013.
Ashaolu &Abubakar: Water & Poverty Situation in Oyun L.G.A.