reducing poverty, accelerating development
286
INDIA REDUCING POVERTY, ACCELERATING DEVELOPMENT 20749 2000 *' *. 0 0 * 0. a 0 0 0 :A~~~. S* . * 0 0*. * * : ::* * 0 0*. * * - * . : : :, *. * .. * * ,3 : : 0 i i 0 * i0 e ,0 A A WOL BAN CONR.TD OX- ., : * . *: 0 : : * 0 * ~ . 0 * * . 0 * * A WOL BAKCUTR TD OXFORD~~~~~~~~ Public Disclosure Authorized Public Disclosure Authorized Public Disclosure Authorized Public Disclosure Authorized
-
Upload
khangminh22 -
Category
Documents
-
view
3 -
download
0
Transcript of reducing poverty, accelerating development

INDIAREDUCING POVERTY,
ACCELERATING DEVELOPMENT20749
2000
*' *. 0
0 * 0.
a 00
0
:A~~~.
S* . * 00*. * *
: ::* * 00*. * * -
* .
: : :, *.
* .. ** ,3 : : 0 i i 0 * i0
e ,0
A A WOL BAN CONR.TD
OX- .,
: * .
*: 0 :
: * 0* ~ . 0 *
* . 0
* *
A WOL BAKCUTR TD
OXFORD~~~~~~~~
Pub
lic D
iscl
osur
e A
utho
rized
Pub
lic D
iscl
osur
e A
utho
rized
Pub
lic D
iscl
osur
e A
utho
rized
Pub
lic D
iscl
osur
e A
utho
rized


INDIAREDUCING POVERTY,
ACCELERATING DEVELOPMENT

The report was completed in December 1999. It does not include developments andpolicy changes since then, such as the Union Budget presented in February, the Marchamendment of the TRAI Act and the EXIM policy of 1 April. The report uses GDPdata available at the time, the revised series of 30 June 1999. The 28 January QuickEstimates of GDP revised the series back to 1993-4, reducing the absolute level ofGDP and changing the year-to-year growth rates. For readers of this report, therevisions most obvious effects would be:
(a) to raise the ratios of the various variables to GDP shown in this report by 0.1to 0.2 percentage points, and
(b) for 1998-9, to raise growth rate 6.8 per cent as compare to 6 per cent in the earlierestimate.

INDIAREDUCING POVERTY,
ACCELERATING DEVELOPMENT
THE WORLD BANK
OXFORDUNIVERSITY PRESS
OXFORDUNIVERSITY PRESS
YMCA Library Building, Jai Siligli Road, New Delhi 110001
Oxford University Press is a department of'the University of Oxford. It ftirthers theUniversity's objective of excellence in research, scholarship, and education
by publishing worldwide in
Oxford New York
Athens Auckland Bangkok Bogota Buenos Aires CalcuttaCape Town Chennai Dar es Salaam Delhi Florence Hong Kong Istanbul
Karachi Kuala Luilipur Madrid Melbourne Mexico City Mum1baiNairobi Paris Sao Paolo Singapore Taipei Tolkyo Toronto Warsaw
with associated companies in Berlin IbadaniOxford is a registered trade mark of Oxford University Press
in the UK and in certain other countries
Published in IndiaBy Oxford University Press, New Delhi
© Oxford University Press 2000The moral rights of the author have been asserted
Database right Oxford University Press (maker)First published 2000
Oxford University Press 2000
All rights reserved. No part of this publication may be reproduiced,stored in a retrieval systenm, or transm-itted, in any form- or by any means,
withotut the prior permission in writing of Oxford University Press,or as expressly perm-itted by law, or under terms agreed with the appropriate
reprographics rights organization. Enquiries concerning reproductionoutside the scope of the above should be sent to the Rights Department,
Oxford University Press, at the address aboveYou miust not circulate this book in any other binding or cover and you mlust
im1pose this sam-e condition on any acquirer
ISBN 0-821 3-4775-6
The World Bank does not guaranitee the accuLracy of the data included in this publication and accepts noresponsibility whatsoever for any consequLenlce of their use. Tlhe boundaries, colouirs, denomlliniationis, and other
informiatioin shown on any m-ap in this volumie do not imply on the part of the World Bank Group any judgenment onthe legal status of any territory or the endorsenment or acceptance of such bounidaries.
Typeset in Garamond 10.5 on 12 by Excellent Laser Typesetters, Delhi 110 034Printed at Rashtriya Printers, Delhi 110 032
Published by Manzar Khan, Oxford University PressYMCA Library Building, Jai Singh Road, New Delhi 110 001
Acknowledgements
This Report was prepared by a team led by Sanjay Kathuria and James Hanson. It was supported by a core teamof Bank staff consisting of Bala Bhaskar Naidu Kalimili, Priya Mathur, Harpinder Oberai, Farah Zahir, ShahnazRana, Shunalini Sarkar, and Rita Soni. The Report draws upon an interdisciplinary team, both from within theWorld Bank and outside. For Chapter 1, Valerie Kozel and Stephen Howes were primarily responsible; forChapter 2, David Peters and Venita Kaul; for Chapter 3, Fahrettin Yagci; for Chapter 4, Arindam Das-Gupta;and for Chapter 5, Clive Harris. Other primary contributors include: Deepak Ahluwalia (agriculture), BenoitBlarel (agriculture), Carter Brandon (environment), Luis Constantino (decentralization), Paramita Dasgupta (statefinances, small savings, and general), Gaurav Datt (poverty), Edward Heneveld (education), Monica Jain (poverty),Bala Bhaskar Naidu Kalimili (macroeconomic projections, growth analysis, and debt data management andanalysis), Rajni Khanna (contingent liabilities), David Marsden (decentralization), Priya Mathur (environment andprivatization), William McCarten (state finances), Kari Nyman (energy), Harpinder Oberai (labour markets,gender, and governance data management and analysis); Gajanand Pathmanathan (agriculture), Garry Pursell (anti-dumping), Salman Zaidi (poverty), Farah Zahir (governance, budgetary and financial management, growthanalysis, public enterprises, and central and state fiscal data management and analysis).
Background papers for the review were prepared by 0. P. Mathur (decentralization), Shubhashish Gangopadhyay,Wilima Wadhwa, and Bibek Debroy (udicial and civil service reforms), Omkar Goswami (corporate governance),and CRISIL (public enterprises). The CII conducted a survey of the business environment for 210 small and largefirms in all parts of India.
Apart from the very useful comments of the task team members, the Report benefited from comments byPedro Alba, Mukesh Ambani (Reliance Industries), Alok Bansal, Bhavna Bhatia, Milan Brahmbatt, Tim Callen(IMF), Shahrokh Fardoust, Edgardo Favaro, Keith Hinchcliffe, Karin Kapadia, Homi Kharas, Sandeep Mahajan,Will Martin, Smita Misra, Lucio Monari, Djamal Mostefai, Tawhid Nawaz, Martin Rama, V. J. Ravishankar,Patricia Reynolds (IMF), Panneer Selvam, Rajesh Sinha, Suresh Tendulkar, Christopher Towe (IMF), Sanjay Vani,Maj-lis Voss, Michael Walton, John Williamson, J. P. Wogart, and Adrian Wood. Peer reviewers were KaushikBasu (Cornell University and World Bank), Philip Keefer, Ashok Lahiri (National Institute of Public Financeand Policy), Sanjay Pradhan, and Helcio T'okeshi (on behalf of PREM Economic Policy). The Report also benefitedfrom the comments of the Quality Assurance Group review team led by Gobind Nankani.
Data analysis and management were done by Bala Bhaskar Naidu Kalimili, Priya Mathur, Harpinder Oberai,and Farah Zahir. Kanishka Ghoshal helped with the states' database. Bita Hadjimicliael did the analysis of customs

vi * Acknowledgements
tariff data, while Mihir Pandey and Samiran Chakrabarti provided the analysis on non-tariff barriers. The desktoppublishing was done by Shahnaz Rana, Shunalini Sarkar, and Rita Soni. Jillian Badami and Naomi Dass providedlogistical support. Priya Mathur and Harpinder Oberai provided all-round contributions in getting the Reportready.
The Report was discussed with the Government of India on 10 August 1999. As the government emphasized,the longer term, strategic issues for accelerating development and reducing poverty are critical for India.Consequently, these issues are the focus of this report. The World Bank would like to acknowledge thc commentsreceived at the meeting as well as later, in writing, from the Ministries/Departments of Agriculture, AdministrativeReforms and Public Grievances, Commerce, Consumer Affairs, Economic Affairs, Education, Family Welfare,Food and Civil Supplies, Health, Labour, Personnel, Power, Telecommunications, Social Justice and Empow-erment, Statistics, Water Affairs, and Women and Child Development. The Reserve Bank of India also providedvery valuable and extensive comments. The World Bank is also grateful for the help rendered by variousgovernment agencies, including the Reserve Bank of India, the Department of Statistics, the Ministry of Finance,the Ministry of Industry, and the Directorate General of Commercial Intelligence and Statistics (DGCI&S).
Finally, we are very grateful to Oxford University Press for bringing out this report in such a short time.

Contents
List of Tables ix
List of Boxes x
List of Figures xi
List of Annexes xii
List of Annex Tables xiii
Abbreviations xv
Economic Development Data xviii
India Social Indicators xxi
Overview 1
Progress and Problems in Poverty Reduction 1Potential Problems in Accelerating Poverty Reduction, Sustaining Growth 4A Second Wave of Reforms to Reduce Poverty Faster 6Circumstances Propitious for Reforms and Acceleration of Growth 8Issues for Further Analysis 9
1 Poverty Reduction: Progress and Challenges 10Overview 10Poverty Reduction: The Long View from the 1950s to the early 1990s 11Reduction in Poverty in the Mid-1990s: A Mixed Picture 14Macroeconomic Concerns: Inflation and Agricultural Performance 16Divergence in Poverty Reduction between States 17Summary 18
2 Improving Health and Education for the Poor 21Overview 21Education and Health Outcomes in India 22

viii * Contents
Characteristics of Education and Health Services 24A Similar Story in Health and Education Services for the Poor 28Solutions being Found in Education and Health 29A Way Forward: Delivering More and Better Education and Health to the Poor 31
3 Reducing Poverty Faster: The Role of State Fiscal and Sectoral Reforms 33
Overview 33Differential Growth and Widening Disparities among States 34State-level Reforms to Reduce Poverty 37Cutting the States' Fiscal Deficits and Raising their Development Spending 37Reforming Power and Irrigation at the State Level 40Decentralization: Emerging Issues and the Eleventh Finance Commission 42
4 Good Governance: The Business of Government 46
Overview 46Rule of Law, Contract Enforcement, and the Business Environment 48Improving Public Administration: Strengthening Performance Incentives and Accountability
in a Downsized Civil Service 51Sound Budgetary and Financial Management 52Improving Public Services through Effective Decentralization 56
5 Improving Infrastructure to Reduce Poverty and Support Growth 62
Overview 62India's Public Provision of Infrastructure 64Attracting Private Investment in Infrastructure-Evolving Policies 66Developing Specialist Regulatory Agencies 69
6 Increasing the Demand for Labour: Deregulation to Increase Export, Growth,Agricultural Growth, and Labour Market Flexibility 74
Overview 74Deregulation to Increase Trade, Growth, and Labour Demand 75Improving Labour Market Flexibility 82Improving Agriculture's Contribution to Development 86
7 Raising and Using Capital Well: The Financial System and Corporate Governance 89
Sound Financial System to Allocate Credit and Reduce Vulnerability 91Strengthening the Framework for Corporate Governance 99
8 Growth, Macroeconomic Developments, and Policies 102
Overview 102Economic Growth in 1998-9 and over the Longer Run 103Inflation and Monetary Policy 106Reducing the Fiscal Deficit and Realigning Government to Speed Up Development
and Reduce Vulnerability 108Balance of Payments 119
9 India's Development Prospects 130
Bibliography 133
Annex Tables 139
Statistical Appendix 187

Tables
1.1 Annual Average Growth in Price Indices 16
1.2 Annual Average Growth in Wage Rates of Unskilled Agriculture Male Labourers 17
3.1 Real Per Capita Income of the Fourteen Largest Indian States 35
3.2 Standard Deviation of States' Per Capita Output 36
3.3 State Poverty and Social Indicators and their Standard Deviations 36
3.4 Main Fiscal Trends in All States 38
3.5 Financing of All States Fiscal Deficit 38
5.1 India: Investments in Infrastructure and Other Investments 64
6.1 India's Regulation of Agricultural Markets and Agro-industry 87
8.1 GDP Growth 1981-99 104
8.2 India and High-growth East Asia: A Statistical Comparison 106
8.3 Fiscal Slippage 1998-9 112
8.4 Fiscal Deficit in the New Accounting Framework 1990-2000 113
8.5 Change in Social and Economic Infrastructure and Interest Spending 1991-2 and 1997-8 115
8.6 Finances of CPEs 1990-2000 116
8.7 Balance of Payments 1990-2001 121

Boxes
1.1 NSS versus NAS 15
1.2 Reforms in India's Anti-poverty Programmes 19
2.1 India's District Primary Education Programme 25
2.2 Himachal Pradesh: A Successful Experiment in Improving Primary Education 30
3.1 Financing State Governments' Deficit: Borrowing and Guarantees 39
3.2 India's Experience with State-level VAT 40
3.3 The Growing Importance of Small Savings in State Finances 43
4.1 Project LARGE 49
4.2 Public Enterprise Governance: A System that has not Delivered 53
4.3 The Effectiveness of Voice 56
4.4 Improving Environmental Governance 57
5.1 Progress in Infrastructure Provision 63
5.2 The Perverse Impact of Subsidies 66
5.3 Privatizing Distribution in Orissa 68
5.4 Design of Regulatory Agency Powers: Lessons from Telecoms 70
6.1 China's Exports and India's Forgone Exports 76
6.2 India: One of the Most Protected Countries 77
6.3 Recent Developments in Trade Policy 79
6.4 Gokaldas Exports: Constrained by SSI Reservation 81
6.5 The Adverse Consequences of Anti-dumping in India 83
6.6 Women in the Indian Labour Market 85
7.1 The Narsimhan II, Khan, Gupta, and RBI Reports on the Financial Sector 90
8.1 The Need to Improve India's Data 109

Figures
1.1 Trends in Poverty 1950s through mid-1990s 121.2 Rural Poverty Levels by State 13
1.3 Headcount Rates (Rural India) 18
2.1 Literacy in India 1951-97 22
2.2 Infant Mortality Rates in India 244.1 India's International Ranking on Selected Governance Indicators 47
6.1 India's Share in World Trade, REER, and Tariffs 76
7.1 India M3:GDP, Deposit Rate, and Inflation 918.1 India: Inflation and Money (M3) Growth 1994-9 107
8.2 Public Sector Deficits 1990-2000 110
8.3 Central Government Surpluses/Deficits: Developing Countries
over 20 Million Population 1118.4 Gross Capital Formation by Private Corporate Sector and Consolidated with
Deficit of General Government 118

Annexes
4.1 Effectiveness and Efficiency of Financial Management: Selections from the Reportsof the CAG for 1997-8 59
4.2 Budgeting and Expenditure Management: A Suggested Reform Programme 594.3 Effectiveness and Efficiency of Tax Administration: Systems Appraisals by tlle CAG 604.4 A Suggested Reform Programme for Central Tax Administration 615.1 Functional Characteristics of Regulatory Bodies 725.2 Responsibilities of Regulatory Bodies 738.1 Analysing India's GDP Growth and the Role of Reform 1238.2 Environment, Economic Growth, and Poverty 1268.3 India's Progress in Privatization 1991-9 128

Annex Tables
1.1 Poverty in India 1951-97 141
2.1 India: Per Capita Income, Fertility, Infant Mortality, and Literacy in Selected Years 142
3.1 Fiscal Deficit and Debt Stock Fourteen Major States 144
4.1 International Comparisons of Selected Governance Indicators 145
4.2 Efficiency of Government in Delivering Services 148
4.3 Quality, Integrity and Efficiency of Public Services Delivered by Public Agencies 148
4.4 Predictability, Responsiveness and Availability of Rules and Regulations 149
4.5 Efficiency of the Court System in Resolving Business Disputes 149
4.6 Obstacles in the Operation and Growth of Business 150
4.7 (a) Payment of Bribes 151
(b) Extra Unofficial Payments to Public Officials 151
(c) Percentage of Contract Value in Additional or Unofficial Payment toSecure Government Contracts 151
4.8 Summary Evaluation of Budget and Financial Management Practices 152
4.9 Public Financial Management: Evaluation of Outputs and Outcomes 153
4.10 Variations between Budget/Revised Estimates and Actuals 154
4.11 Revenue Effect of Tax Concessions 154
4.12 Central Tax Revenue and Buoyancy 155
4.13 Assessment of Tax Structure and Administration 156
4.14 Facilitation Indicators for Import Containers, Selected Countries (1998) 157
4.15 Structure of Rural Local Government 158
4.16 Decentralization of Local Government: A Report Card 158
4.17 Expenditure and Revenue Decentralization and Financial Autonomy ofRural Local Bodies 1996-7 158

xiv * Annex Tables
6.1 Capital Employed per Worker in Domestic Industries Corresponding withPrincipal Exports and Imports 1994-5 159
6.2 India and China: Selected Trade Indicators 1987-96 1616.3 Coverage Ratio for Non-Tariff Barriers on Indian Imports: Weighted and Simple Averages 1626.4 India's Share in World Trade, REER, and Tariffs 1646.5 Share in World Exports: India and Selected Countries 1998 1646.6 India: Tariff Structure 1990-9 1656.7 Real Exchange Rate of India's Main Trading Partners and Competitors 1981-99 1666.8 Foreign Direct and Portfolio Investment 1687.1 India: Structure of Selected Institutions of the Financial System 1697.2 Indicators of Indian Banking Policy 1968-99: The Deposit Rate, Loan Ceiling
Minimum Rate, CRR, and SLR in Selected Years 1707.3 Scheduled Commercial Banks' Investments and Other Assets 1717.4 Bank Resources to Small versus Medium and Large Industries 1728.1 Domestic Demand 1981-97 1738.2 Key Interest Rates 1994-9 1748.3 Sources of Change in Base Money 1988-9 to 1997-8 1768.4 Imports: Customs and Non-Customs 1996-7-1998-9 1778.5 Central Government Finances 1990-2000 1788.6 Evolution of the Public Sector Deficit 1990-9 1798.7 Central Government Salary Bill and Establishment Strength 1990-1997 1808.8 State Government Finances 1818.9 India: Finances of CPEs 1828.10 Yearwise/PSU-wise Details of Shares Disinvested since 1991-2 1838.11 India: Estimated Capital Inflows and Debt Stocks 1991-2 to 1998-9 1848.12 Details of Mobilization in the Primary Market 185

Abbreviations and Acronyms
ACR Annual Confidential Report CIF cost, insurance, and freightAD anti-dumping CII Confederation of Indian IndustryADR additional drawing right CPE central public enterpriseAIDS Acquired Immuno-deficiency CPI consumer price index
Syndrome CPIAL consumer price index forAP Andhra Pradesh agricultural labourersAPP anti-poverty programme CPSE Central public sector enterpriseAPSEB Andhra Pradesh State Electricity CRR cash reserve ratio
Board CSO Central Statistical OrganizationARM additional resource mobilization CSS centrally sponsored schemeBE Budget estimate CVC Central Vigilance CommissionBHEL Bharat Heavy Electricals Limited CVD countervailing dutyBIFR Board for Industrial and Financial DGCI&S Directorate General of Commercial
Reconstruction Intelligence and StatisticsBOP balance of payments DoT Department of TelecommunicationsBOT build-operate-transfer DPC District Planning CommitteeBPCL Bharat Petrochemicals Limited DPEP District Primary EducationBSES Bombay Suburban Electiricity Programme
Supply Ltd. DRS Debt Reporting SystemCAG Comptroller and Auditor EAS Employment Assurance Scheme
General EDI Electronic Document InterchangeCAMEL Capital adequacy, asset quality EFC Eleventh Finance Commission
management, earnings and EXIM Export-Importliquidity systems FCI Food Corporation of India
CBI Central Bureau of Investigation FDI foreign direct investmentCD certificate of deposit FEMA Foreign Exchange ManagementCEO Chief Executive Officer FI finance institutionCERC Central Electricity Regulatory FIT foreign institutional investor
Commission FOB free on board

xvi * Abbreviations and Acronyms
FSU former Soviet Union NBFC non-banking financial companyGAIL Gas Authority of India Limited NCAER National Council of AppliedGCR Global Competitiveness Report Economic ResearchGDP gross domestic product NCERT National Council of EducationGDR general drawing right Research and TrainingGFCF gross fixed capital formation NFHS National Family Health SurveyGFD Gross Fiscal Deficit NGO non-governmental organizationGNFS goods and non-factor services NPA non-performing assetsGNP gross national product NIPFP National Institute of PublicGOI Government of India Finance and PolicyGSDP Gross State Domestic Product NRI Non Resident IndianHP Himachal Pradesh NR(NR)D non-resident (non-repatriable)HPCL Hindustan Petrochemicals Limited depositsICICI Industrial Credit and Investment NSDP Net State Domestic Product
Corp,oration of India NSS National Sample SurveyICL International Container Line NSSF National Small Savings FundIDBI Industrial Development Bank NSSO National Sample Survey
of India OrganizationIFS International Financial Statistics NTB non-tariff barrierIFPRI International Food Policy Research NTPC National Thermal Power
Institute CorporationILO International Labour Organization O&M overheads and maintenanceIMF International Monetary Fund OCC Oil Coordination CommitteeIOC Indian Oil Corporation OECD Organization for Economic Co-IPCL Indian Petrochemicals Limited operation and DevelopmentIPP independent power producers OLS Ordinary Least SquaresIRDP Integrated Rural Development ONGC Oil and Natural Gas Commission
Programme PAC Public Accounts CommitteeIW industrial workers PDS Public Distribution SystemJGSY Jawahar Gram Samridhi Yojana POWERGRID Power Grid Corporation of IndiaJNCP Jawaharlal Nehru Container Port Ltd.JNPT Jawaharlal Nehru Port Trust PPP purchasing power parityJRY Jawahar Rozgar Yojana PROBE Public Report on Basic EducationKWh kilowatt Hour in IndiaLARGE Legal Adjustments and Reforms PSE Public Sector Enterprise
for Globalizing the Economy QR quantitative restrictionMFA Multi-fibre Arrangement RBI Reserve Bank of IndiaMISH Market Information Survey of RE revised estimate
Households REER real effective exchange rateMODVAT modified value added tax RER real exchange rateMoF Ministry of Finance RIB Resurgent India BondMoHFW Ministry of Health and Family RRB regional rural bank
Welfare SAIL Steel Authority of India LimitedMoU memorandum of understaiiding SDR special drawing rightMP Member of Parliament SEB State Electricity BoardMPC Metropolitan Planning Committee SEBI Securities and Exchange Board ofMTNL Mahanagar Telephone Nigam India
Limited SEWA Self-employed Womens'MW Megawatt AssociationNABARD National Bank for Agriculture and SFC State Finance Commission
Rural Development SGSY Swarnajayanti Gram SwarozgarNAS National Accounts Statistics Yojana

Abbreviations and Acronyms * xvii
SICA Sick Industrial Companies Act UPSEB Uttar Pradesh State ElectricitySPE State public enterprise BoardSSI small-scale industry US United StatesTEC Tata Electric Companies USO Universal Service ObligationTFP Total Factor Productivity UT Union TerritoryTPDS targeted public distribution system UTI Unit Trust of IndiaTRAI Telecom Regulatory Authority of VAT value added tax
India VDIS Voluntary Disclosure IncomeTRC Tax Reforms Committee SchemeUNCTAD United Nations Conference on VSNL Videsh Sanchar Nigam Limited
Trade and Development WUA Water Users' AssociationUNDP United Nations Development WMA ways and means advances
Programme WPI wholesale price indexUP Uttar Pradesh WTO World Trade Organization

Economic Development Data
GNP Per Capita (US $, 1998-9) 430'
US $ Bn % of GDP Annual growth rate (% pa, constant prices)
1998-9 1970-1- 1975-6- 1980-1- 1985-6- 1991-2- 1997-8-Gross domestic product 1975-6 1980-1 1985-6 1990-1 1998-9 1998-9
GDP at factor cost 392 91.6 3.0 3.1 5.0 6.3 6.5 6.0GDP at market prices 428 100.0 2.9 3.1 5.4 6.3 6.4 5.0Gross domestic investment 102 23.8 4.6 3.1 7.0 7.4 8.5 7.7Gross domestic saving 92 21.5 7.3 -0.1 10.1 7.1 4.8 8.9Current account balance -3 -0.7 - - - - -
Output, employment, and Value added Labour forceb Value added per worker
productivity (1990-1) US $ Bn % of total M % of total US $ Bn % of total
Agriculture 89 30.8 186 66.8 480 46.1Industry 79 27.1 36 12.7 2215 212.8Services 122 42.1 57 20.5 2139 20.5.5Total/average 290 100.0 279 100.0 1041 100.0
General government' Central government
Government finance Rs Bn % of GDP Rs Bn % of GDP
1998-9 1998-9 1991-2-1998-9 1998-9 1998-9 1991-2-1998-9Revenue receipts 3080 17.1 17.6 1577 8.7 9.0Revenue expenditures 3907 21.6 21.3 2181 12.1 11.9
Revenue surplus/deficit (-) -828 -4.6 -3.7 -605 -3.4 -2.8Capital expenditures 616 3.4 3.6 523 2.9 2.9External assistance (net)d 23 0.1 0.4 9 0.1 0.4
Money, credit, and prices 1992-3 1993-4 1994-5 1995-6 1996-7 1997-8 1998-9
Rs billion outstanding, end of period:
Money and quasi money 3668 4344 5314 6040 7018 8272 9743Bank credit to government (net) 1762 2039 2224 2578 2886 3306 3867

Economic Development Data * xix
Bank credit to commercial sector 2201 2378 2927 3446 3763 4327 6869
Money and quasi money as % of GDP 48.0 49.5 51.2 49.6 49.8 52.9 54.0
Wholesale price index (1981-2 = 100) 228.7 247.8 274.7 295.8 314.6 329.8 6.9
Annual percentage changes in:Wholesale price index 10.1 8.4 10.9 7.7 6.4 4.8 -97.9
Wholesale price index 11.4 15.7 9.1 15.9 12.0 14.5 17.0
Bank credit to commercial sector 17.1 8.0 23.1 17.7 9.2 15.0 12.5
Merchandise exports
Balance of payments (US $ millions) 1996-7 1997-8 1998-9 (Average 1991-2/1998-9) US $ million % of total
Exports 41,607 45,109 47,484 Tea 397 1.5
Merchandise, fob 34,133 35,680 34,298 Iron Ore 459 1.7
Imports of goods & NFS 55,696 59,297 58,565 Chemicals 2174 8.0
Merchandise, cif 48,948 51,187 47,544 Leather & Leather products 1506 5.6
of which crude petroleum 5,222 4278 3350 Textiles 3455 12.8
of which petroleum products 4814 3939 3084 Garments 3278 12.1
Trade balance -14,815 -15,507 -13,246 Gems and jewelry 4450 16.5
Non-factor service (net) 726 1319 2165 Engineering goods 3487 12.9Others 7808 28.9
Resource Balance -14,089 -14,188 -11,081 Total' 27,013 100.00
Net factor incomee -3307 -3521 -3544 External debt, 31 March 1999 US $ M
Net transfersf 12,367 11,830 10,280 Public & publicly guaranteed 85,208
Private non-guaranteed 8409Balance of Current Account -5209 -5879 4345 Total (including IMF and short-term) 98,231
Foreign investment 6133 5385 2401 % current
Official grants andc aid 410 379 307 Debt service ratiofor 1998-9 receipts
Net medium- & long term capital 3230 4139 4380 Public Gross disbursements 10,627 10,256 9952 P t& pubcly guaranteed 21.0
Principal repayments 7397 6117 5572 Prtvate non-guaranteed 1.8
Other capital flowsg -1892 -940 -159 Total (including IMF and short term) 24.0
Non-resident deposits -3350 1125 1742 IBRD/IDA lending,
Net transactions with IMF -975 -613 -393 31 March 1999
Overall Balances 6202 4209 4326 (US $ millions) IBRD IDA
Change in net reserves -5227 -3596 -3933 Outstanding and disbursed 8114 18,652
Gross reserves (end of year)h 22,664 26,260 30,193 Undisbursed 3512 4463
Rate of exchange, end Oct. 1999 US $ 1.00 = Rs 43.454 Outstanding incl. undisbursed 11,626 23,204
-Not available.
The per capita GNP estimate is at market prices, using World Bank Atlas methodology. Other conversions to dollars in this
table are at the prevailing average exchange rate for the period covered.
b Total labour force from 1991 Census. Excludes data for Assam and Jammu & Kashmir.
c Budget estimates and transfers between centre and states have been netted out.
d As recorded in the government budget.
Figures given cover all investment income (net), Major payments are interest on foreign loans and charges paid to IMF, and majorreceipts is interest earned on foreign assets.
f Figures given include workers' remittances but excclude official grant assistance which is included within official loans and grants,and non-resident deposits which are shown separately.
g Includes short-term net capital inflow, changes in reserve valuation, and other items.
h Excluding gold.Total exports (commerce); net of crude petroleum exports.
Sources: Union Budget Documents; RBI State Finance Reports; RBI Annual Reports; DGCI&S; World Bank estimates.

xx * Economic Development Data
Rs/US $Currency Official Unified Marketa
Prior to June 1966 4.766 June 1966 to mid-December 1971 7.50Mid-December 1971 to end-June 1972 7.28
1971-2 7.441972-3 7.711973-4 7.791974-5 7.981975-6 8.651976-7 8.941977-8 8.561978-9 8.211979-80 8.081980-1 7.891981-2 8.93
1982-3 9.631983-4 10.311984-5 11.891985-6 12.241986-7 12.791987-8 12.971988-9 14.481989-90 16.661990-1 17.951991-2 24.521992-3 24.61 30.651993-4 31.361994-5 31.401995-6 33.461996-7 35.501997-8 37.161998-9 42.00
September 1999 43.54October 1999 43.45November 1999 43.39Note: The Indian fiscal year runs from 1 April through 31 March.Source: IMF, International Finance Statistics (IFS), line 'rf'; Reserve Bank of India.a A dual exchange rate system was created in March 1992, with a free market for about 60 per cent of foreign exchange transactions.
The exchange rate was reunified at the beginning of March 1993 at the free market rate.

India Social Indicators
Same region/income groupLatest single year (1992-7, latest single year)
1970-5 1980-5 1992-7 South Asia Low income
POPULATIONTotal population, mid-year (millions) 613.5 765.1 962.4 1281.3 2035.6
Growth rate (O annual average) 2.3 2.1 1.4 1.5 1.7Urban population (%b of population) 21.3 24.3 27.4 27.0 28.4
Total fertility rate (births per woman) 5.6 4.8 3.3 3.5 4.0
POVERTY(% of population)National headcount index 35.0 - -
Urban headcount index - 30.5 - -
Rural headcount index - - 36.7 - -
INCOMEGNP per capita (US $) 160 260 430 - -
Consumer price index (1995 = 100) 21 41 117 117 122Food price index (1995 = 100) - 38 115 - -
INCOME/CONSUMPTION DISTRIBUTIONGini index - - 29.7 - -
Lowest quintile (% of income or consumption) 5.9 - 9.2 - -
Highest quintile (% of income or consumption) 49.4 - 39.3 - -
SOCIAL INDICATORSPublic Expenditure
Health (%o of GDP) - - 0.7 0.8 1.0Education (% of GNP) 2.7 3.5 3.4 3.0 -
Social security and welfare (%/ of GDP) - - - - _
Gross Primary School Enrolment Rate(%/ of age group)
Total 79 96 101 - -

xxii * India Social Indicators
Same region/income groupLatest single year (1992-7, latest single year)
1970-5 1980-5 1992-7 South Asia Low income
Male 94 111 110 - -Female 62 80 90 - -
Access to Safe Water(% of population)
Total 31 54 85 81 69Urban 80 80 87 84 80Rural 18 47 85 80 66
Immunization Rate(% under 12 months)
Measles - 1 81 81 74DPT - 41 90 87 76
Child malnutrition (/o under 5 years) - - 53 53 -
Life Expectancy at Birth(years)
Total 50 55 63 62 59Male 51 56 62 62 58Female 49 55 64 63 60
MortalityInfant (per thousand live births) 132 97 71 77 82Under 5 (per thousand live births) 206 177 88 100 118Adult (15-59)
Male (per 1000 population) 324 261 212 219 274Female (per 1000 population) 353 279 202 212 255
Maternal (per 100,000 live births) - 460 440 - -
- Not available.
Source: 1999 World Development Indicators CD-ROM, World Bank
Overview
This Report is a pilot in the World Bank's new approach poverty reduction and a way out of poverty. Chapterto country economic reports, embodying the Bank's Comr 3 focuses on the Indian states, which are key actors inprehensive Development Framework. Experience world- human development and infrastructure provision, aswide indicates that poverty reduction and sustainable well as in regulation and governance. Chapter 4 dealsdevelopment require sound macroeconomic policies, with governance issues, an area of major concern of theopen trade relations, and increases in human and World Bank because of its links to poverty reductionphysical capital. But sustained development also re- and development. The next three chapters deal withquires a comprehensive framework that includes ways to increase growth and its poverty-reducing(1) good governance; (2) sound legal, incentive, and content through improvements in (a) infrastructure;regulatory frameworks that protect property rights, (b) the incentive and regulatory framework to encour-enforce contracts, and stimulate competitive markets; age efficiency and labour demand-a key element in(3) a sound financial sector, adequately regulated and poverty reduction; and (c) the financial system andsupervised with a basis in internationally accepted corporate governance. Chapter 8 deals with recentaccounting and auditing standards; (4) health, educa- developments, the sustainability of growth and ways totion, and social services that reach .the poor, women, reduce vulnerability to macroeconomic crises that hurtand girls effectively; (5) quality infrastructure and the poor. Finally, Chapter 9 provides a brief forecastpublic services to promote rural development and of India's prospects and summarizes policies that wouldlivable cities; and (6) policies to promote environmen- accelerate poverty reduction and sustained develop-tal and human sustainability (Wolfensohn 1998). ment. The Report's discussion of agriculture (in Chap-
The World Bank's new approach to economic ter 6)-a sector critical for poverty reduction that is stillreports provides a medium-term perspective on these of major importance for the economy-summarizeselements and on the economy's potential vulnerabili- the extensive analysis in the World Bank report India:ties, including those in the short run. Given the Towards Rural Development and Poverty Reduction. Theframework's breadth, this Report's coverage is limited unifying theme for this Report is thus acceleratingto the most important issues. In other areas, it points poverty reduction and sustained development.out directions for further analysis. The Report beginswith a chapter on reducing poverty-the yardstick Progress and Problems in Poverty Reductionagainst which development is measured and the WorldBank's principal concern. It is followed by a chapter Steady Progress since Independenceon human development, which is both an indicator of India is an ancient civilization with a proud history. It

2 * India. Reducing Poverty, Accelerating Development
is one of the world's largest and most heterogeneous between male and female access to social services arecountries. Prior to Independence, India suffered fre- diminishing.quent, devastating famines and secular stagnation. Hencepoverty reduction and agriculture were central themes Slugg'sh Poverty Reduction in Recent Yearsof India's founding fathers. Uplifting the poor andintegrating them into the mainstream is a recurrent Despite the improvements in human developmenttheme of India's Five Year Plans. Universal access to and higher GDP growth in the mid-1990s, India'seduication is enshrined in the Constitution. India has household sample surveys suggest that poverty reduc-established a wide array of anti-poverty programmes tion has been sluggish recently. In the early 1990s,and much of India's thinking on poverty has been poverty worsened following the stabilization (correc-mainstreamed internationally. India has successfully tion) of the unsustainable policies of the 1980s, a pooreliminated famines and severe epidemics. It has made harvest, and a decline in food availability (Tendulkarprogress in reducing poverty and in its social indica- 1998). Soon, poverty began to fall again and by 1993-4tors, which at the time of Independence in 1947 were was somewhat below the 1987 level. However, fromamong the world's worst. Its vibrant democracy and 1993-4 until 1997 (the last available survey), improve-free press have been major factors in these achieve- ment has been limited in the rural areas which containments. over 70 per cent of the poor. Moreover, analysis
Poverty incidence began to decline steadily in the suggests that the large poor states in the north andmid-1970s, which roughly coincided with a rise in east, containing 40 per cent of India's population,growth in gross domestic product (GDP) and agricul- have lagged in reducing poverty since the late 1970sture. Since 1980, India's 5.8 per cent per annum trend (Chapters 1 and 3).GDP growth is the highest among large countries The estimated slowdown in overall reduction ofoutside East Asia. Empirical analyses suggest that poverty may merely reflect one of India's many statis-agricultural growth and human development were key tical inconsistencies-the estimates of consumptionfactors in the decline in poverty across states (Chapter and foodgrains consumption in the national accounts1). However, the development strategy of the 1970s suggest much faster consumption growth than theand 1980s, based on an extensive system of protection, sample surveys, while the surveys suggest little wors-regulation, and public sector presence in the economy, ening of distribution. The need to improve the consis-and on worsening fiscal deficits in the 1980s, proved tency and quality of these and other statistics, in orderunsustainable. to provide a firmer basis for policy making, is a major
recommendation of this Report.
Quick Recovery from 1991 Crisis
The 1991 balance-of-payments and fiscal crisis was met Despite Achievements, Significantby stabilization and reforms that opened up the Challenges Aheadeconomy, reduced the public sector's role, and liber- More worrisome is the possibility that growth becamealized and strengthened the financial sector over the less potent in reducing povertv in the 1990s. Furthernext few years. The policies generated a surprisingly work is needed on this complex issue. Nonetheless thequick recovery and then an unprecedented three characteristics of agricultural growth in the 1990s; theconsecutive years of 7.7 per cent per annum average slowdown of growth in the poor states; and thegrowth, led by increases in productivity at the macro- problems of infrastructure, social services, and povertyeconomic level and a booming private sector. The 3.3 programmes, especially in poorer states which areper cent per annum agricultural growth during the linked to their increasing fiscal problems, poor incen-1990s has been about the same as in the 1980s and much tive frameworks, and weaknesses in governance andhigher than the declining rate of population growth, institutions, are all problems that may explain the lackcurrently estimated at about 1.6 per cent per annum of progress in reducing rural poverty (Chapters 1, 2,(Chapter 8). 3, and 8; note that statements made regarding indi-
Improvement in social indicators, including gender- vidual state's or states' GDP as a group refer to the oldrelated indicators, has continued in the 1990s. For (1980-1 based) GDP accounts; once they are rebased,example, literacy rates continue to rise and infant like national GDP, on the new (1993-4 based) ac-mortality rates continue to fall. Life expectancy at counts, the growth rates of states could be differentbirth has increased, as have school enrolments. Gaps from what the old accounts show, since the new GDP

Overview * 3
accounts include a much higher estimate of national Institutional weaknesses and governance issuesagricultural output). Agriculture's average growth has exacerbate the lack of funds (Chapters 2 and 4). Forremained roughly constant since 1980 according to the example, not only are teacher-pupil ratios very low,new GDP series. However, productivity growth in the teacher absenteeism is common. Numbers workingsector seems to be slowing, even in the Punjab and in employment programmes or attending schoolHaryana, where some analysts suggest that environ- appear far smaller in surveys than in official statistics-mental issues are a concern. Further, agricultural growth for example, in 1995-6, the National Sample Surveyin some of the poorer states seems to have lagged (NSS) showed gross attendance ratios of 85 per centbehind. Public spending on agriculture has focused on versus the Department of Education's gross enrolmentsubsidies, which lead to inefficiencies and environmen- ratio of 104 per cent. Large fractions of the povertytal problems and at best have limited impact on funds go to administrative costs or are diverted, leavingpoverty. Implicit and explicit subsidies have crowded less for the poor. For example, a study in UP suggestsout public investment and social spending in govern- that under the new, targeted PDS much of the grainments' budgets and substantially worsened the fiscal that reached public distribution centres went to theproblems of states. While private investment in agri- poor, but that there was a 40 per cent shortfall betweenculture has increased, to some extent this reflects off-take and what reached the distribution centresinefficiencies and distortions that are partly related to (Kriesel and Zaidi 1999).the subsidies, such as the purchase of pumps to reach Thus, despite its many achievements, India facesdeep aquifers and generator sets to run them when free, significant challenges and needs to take some difficultlow quality power fails. Moreover, the limited growth political decisions to realize its potential. Concertedin agricultural productivity may also reflect the limited policy action is needed to lift the more than 300 millionderegulation, which has left many distortions in the poor, 34 per cent of the population and increasinglysector. For example, restrictions on domestic and concentrated in the poorer states, out of poverty. Better,international agricultural trade contribute to occa- and more education and health spending is needed tosional, sharp transitory increases in prices, which hurt provide better access for the poor, females, and otherthe poor (Chapters 3, 6, and 8). disadvantaged groups and improve basic services across
The poorer states have lower GDP growth, not just the board. For example, major challenges in reducingweak agricultural growth. Partly, of course, this re- poverty and getting India's population ready for theflects their structure-agriculture is a large percentage demands of the twenty-first century are raising theof their GDP. However, the poor states' lower growth literacy rate from the current 62 per cent (50 per centalso reflects differences in initial conditions and state- for females); enroling the over 30 million children,level policies. The poorer states' problems in infra- mostly poor, who are out of school; and increasing thestructure, human development, and, in some cases, overall average years of quality schooling. In addition,governance, have limited their ability to take full inequalities faced by women in participating fully inadvantage of the post-1991 reforms. Moreover, catch- the political, legal, and economic systems need to being up is a problem because of their increasingly severe addressed. The decline in infrastructure spendingfiscal problems-in the late 1980s the states began needs to be reversed, to increase the rate and spread ofunsustainable increases in spending and large untargeted growth and to meet urban needs that will rise as thesubsidies (explicit and implicit) that have never been 73 per cent of the population that still lives in ruraladjusted, which has led to a large, costly debt build up. areas shifts to the cities. Improvements at state levelIndian states are constitutionally prevented from exter- particularly improved service delivery in the poorestnal borrowing and limited in their domestic borrowing states, will be critical in meeting these challenges.by central government. Nonetheless, several states, At the national level, implementation of the oftenincluding some of the poorest, now face unsustainable discussed second phase of reforms, to complete thedebt service obligations, mainly to the central govern- external and internal deregulation of goods and factorment, which in turn had borrowed to fund these loans, markets, will speed the growth of better paying jobs.Infrastructure and social spending have slowed in most East Asian countries, despite the recent crisis, stillstates as a consequence of the high debt service particu- have a much lower poverty incidence and better sociallarly in the highly indebted and poorer states. States' indicators than India. For example, Indonesia, whichproblems have worsened in the last two years, with the in the mid-1960s had a similar per capita income tocascading down of the excessive central public sector India and which was the hardest hit by the East Asianwage settlement of 1997 (Chapters 2 and 3). crisis, has a literacy rate of 80 per cent and less than

4 * India: Reducing Poverty, Accelerating Development
20 per cent of its population was below the poverty the still low indicators of human development; andline in 1998 (World Bank 1999a). Moreover, except governance and institutional issues, particularly in thefor Indonesia, the crisis countries are rebounding social sectors (Chapters 2 and 4), all pose potentialsurprisingly rapidly, reflecting their strong underlying problems for the growth of productivity in an economy-base of infrastructure and human development. wide sense.
Potential Problems in Accelerating Large Central and State Deficits Related toPotential Reduction, SustainingGrowthLarge Explicit and Implicit Subsidies
Another major concern for sustained development isThe East Asian experience of the 1970s and 1980s, and the large general government (consolidated central andthe differential experience of India's states, suggest that state) deficit. India's fiscal deficit has been among theIndia needs to get back to a higher growth path, which world's highest and in 1998-9 it deteriorated by roughlyis also more effective at reducing poverty, through 2 per cent of GDP. The consolidated public sectorimproved public spending and a strengthening of deficit of 9.6 per cent of GDP in 1998-9 was not muchincentives, institutions, and governance, particularly lower than the peak of 10.9 per cent registered in thein the poorer states. To make a significant dent in crisis year of 1990-1. The centre's deficit deterioratedpoverty, growth needs to be at least maintained in by 0.8 per cent to 6.5 per cent of GDP in 1998-9India's high growth states and increased significantly in (including net loans to states) and was far higher thanthe poorer states. the budgeted figure of 5.3 per cent (all figures exclude
disinvestment revenues). The current (revenue) deficit
India's Futurte Growth and increased to 4 per cent of GDP, the highest in theIndia'soFutrery GReuthond decade, meaning India is increasingly borrowing toPoverty Reduction finance current expenditure. Meanwhile, states' com-
India's growth of 6 per cent in 1998-9 was one of bined deficit rose to 4.2 per cent of GDP, the worstworld's highest. However, it mainly reflected good ever (Chapter 8). Reflecting the recent fiscal deteriora-harvests; all major non-agricultural sectors grew less tion, the ratio of Central government debt to GDP,than in 1997-8 when overall GDP growth was 5 which fell in the mid-1990s, has now risen to about 60per cent. The reversion to the average post-1980 growth per cent of GDP, and has led to comment from thetrend during the last two years may partly reflect a Reserve Bank of India (RBI) (1999f, pp. v-12-v-17). Thesluggishness related to the shake out of excess capacity large and rising fiscal deficit and large public sector debtand partly the slowing world economy. However, (mostly internal) raise investors' concerns aboutanother important factor in slowing growth is prob- macroeconomic instability and inflation (which wouldably the slowing of reforms, along with a worsening hurt the poor), and crowds out private credit in theof the fiscal deficit and rises in tariffs-reforms that had banking system.earlier contributed to higher productivity, a higher The 1999-2000 Union Budget projected a cut ofshare of world trade, and rapid growth (Chapters 6 and 0.9 per cent of GDP in the central deficit. Achieving8 and Annex 8.1). Also, the delivery of social services this target depends on a substantial rise in tax revenueand anti-poverty programmes, necessary to include and containing revenue expenditure growth to only 9India's poor in the growth process and largely a state per cent. Preliminary data from the first seven monthsfunction, would have benefited not only from higher of 1999-2000 suggest taxes are growing slower thanfunding but improved institutions and governance. projected and expenditure faster, partly because of
Indeed these and other issues touched upon above support for and lending to states to finance their highraise concerns about maintaining even the current deficits. The Union Budget also changed the accountingpace of development. Current rates of investment have treatment of the growing small saving funding of states'supported a GDP growth of 5-6 per cent per annum deficit from a central government loan to an item inin the last two years, and can go on doing so provided the 'National Small Savings Fund' in the centre's publicthe productivity of resources continues to increase in accounts. This accounting change reduces the centre'sthe macroeconomic sense. However, the deterioration deficit figures by about 1.3 per cent of GDP but leavesof infrastructure (Chapter 5); slower pace of reforms the (consolidated) general government fiscal deficit(Chapters 6 and 8) and resulting uncertainty for inves- unchanged. It will be important to pay close attentiontors; lack of agricultural deregulation (Chapter 6); to the policy on small savings, as the centre sets the
Overview * 5
rates and implicitly guarantees the deposits. A positive but a loss of share of world markets for the second
fiscal development was the sharp upward adjustment consecutive year. Regarding the capital account, the
of domestic diesel prices in October 1999, an attempt Resurgent India Bond raised $ 4.2 billion despite
to correct for the potential deficit in the oil pool; it also the turmoil in international markets. However, FDI
maintained the liberalization of the sector. The states' declined and portfolio flows turned negative. The net
and the public enterprises' deficits are likely to suffer impact of these developments was a rise of about $ 3.9
continued pressure from the cascading effect on wages billion in international reserves (including special
and pensions of the excessive central wage settlement drawing rights (SDRs) and IMF reserves but not
of 1997. As noted, the interest costs of the debt have gold), to a comfortable end-fiscal year level of $ 30.2
increasingly crowded out infrastructure, maintenance, billion (7.6 months of imports, and comfortably larger
and social spending in central and state budgets. than potential short-term claims). The projection for
Implicit and explicit subsidies at the central and, 1999-2000 is a slight widening of the current account
especially, state levels are a major factor in the deficit. deficit, to 1.4 per cent of GDP, reflecting continued
The Ministry of Finance estimated these subsidies high oil prices. On the capital account, increases in
at over 14 per cent of GDP in 1994-5. In addition portfolio investment (despite continued low levels of
to increasing the deficit, they are distortionary, non- private capital flows worldwide) and 'other' capital
transparent, and at best have uncertain equity conse- inflows which appear strong thus far in 1999, will offset
quences; at worst they are anti-equity. While states a decline in net long-term borrowings after the one-
are directly responsible for many of the subsidies, the time Resurgent India Bond (RIB) issue in 1998-9. These
centre's funding of states supports them indirectly. inflows will finance much of the larger deficit and
Another structural factor in the deficit is the tax permit some increase in reserves, although the reserve
system, with central taxes declining by over 1.5 per cent cover is likely to decline marginally to 7.2 months of
of GDP over 1991-8. The growing services sector imports (Chapters 8 and 9). The external debt situation
is inadequately taxed and agriculture, part of the state remains comfortable, and external debt to GDP as well
tax base, remains outside the system. The tax base has as debt to current receipts ratios have steadily fallen
been widened recently, but nonetheless remains fairly since 1992-3. A large proportion of external debt is to
narrow, with under 15 million taxpayers. As various multilateral and bilateral lenders and/or is long term.
experts have noted, the approach to sharing of taxation Careful monitoring by government and changes in the
revenues, lack of a full-fledged value added tax (VAT) underlying economic factors have led to a substantial
(including services), and failure of states to tax agricul- fall in short- term debt, from over $ 8.5 billion (10
ture have complicated fiscal decentralization and per cent of external debt) in 1991 to an estimated $ 4.3
generated tax-based inefficiencies (Chapters 3 and 4). billion (4.4 per cent) in March 1999.
Expenditure management and efficiency could be im- The fundamentals of India's slow export growth lie
proved, as recognized in the last two finance ministers' in the lack of further tariff reform, high infrastructure
calls for an Expenditure Reforms Commission. The and transactions costs, and continued domestic regula-
civil service is large. Many public enterprises continue tions such as small-scale sector reservation and labour
to operate at low efficiency in areas where the private laws that reduce India's comparative advantage in
sector could function more effectively and generate labour-intensive products and, consequently, the de-
more taxable revenues.. mand for labour. As a'result, India may find it difficultto take advantage of the next upsurge in world trade
Comfortable BOP but Domestic Policies and the international agreement to phase out textile
Continue to Constrain Competitiveness and garment quotas by 2005, and be not well preparedfor greater competition that will arise from the elimi-
In contrast to the fiscal situation, India's balance nation of the remaining quantitative restrictions on
of payments (BOP) remains comfortable. In 1998-9, imports no later than April 2001 (of which half, mainly
the BOP strengthened substantially, with the current the special import licence restrictions, are due to go
account deficit improving to 1 per cent of GDP. This by April 2000). Indeed, India already faces growing
improvement reflected the low oil prices that prevailed competition from a recovering East Asia. A bright spot
for much of the year and a $ 4 billion drop in non- in the current account is the rapid growth of computer
customs imports that reduced imports by over 7 service exports, which do not suffer from the anti-
per cent. However exports also declined, by 4 per cent export biases mentioned above, but even they may be
in dollar terms, reflecting not only weak markets hurt if telecom infrastructure lags behind.

6 * India: Reducing Poverty, Accelerating Development
Financial System Remains a Concern quality of the judiciary. However, 'justice delayed isThedfinancial system is an- justice denied', particularly for the poor, and in India
The public sector-dominatedg i nan sus tem is and the enormous backlog of cases and legal processes canother major area impinging on sustained growth and, deadcionby1-0ersThedlysddtteindirectly, poverty reduction. The financial sector delaydecisions by 10-20 years. Thesedelays addto thmobilizes substantial resources but still invests a large problems of the poor in obtaining protection from thepart of them in government debt, in the case of banks legal system. All these problems, as well as the bank-
ruptcy and liquidation processes, raise credit costs,about 40 per cent of deposits. This pattern of asset increase non-performing assets (Chapters 4 and 7),holding by the financial sector does reduce India's hindr gon-perform in assets the and ofsusceptibility to financial crises but it also reduces nder good credit allocation and limit the ability ofsuscept. .,, .. I . the poor to use their limited real assets effectively.credit availability to the private sector. From a macro- . .eeconomic standpoint, these large holdings levels of beFinally, the environmental dimension needs todeonomic standpointhe thefletn le theoldngs hir ofh be kept in mind. The Finance Ministry's 1998-9debt are simply the reflection of the long history of high Economic Survey farsightedly included a chapter onfiscal deficits and the need for someone to hold the enonm ent whichts oudedia rhresulting debt; funds can be made available to the pri- burden of environmental and resource degradationvate sector at reasonable cost only as public debt de- on t of a concern and reso Regrtares
clies elaiveo GP Asecndfctoraiinthe cost on the poor, a concern which this Report shares.clines relative to GD P. A second factor raising th ot As noted above, environmental degradation and un-of private sector credit is non-performing assets (NPAs). sstnable enofroueencourad by ubNPAs are a low fraction of total bank assets (3 per cent sustainable usage of resources, encouraged by subsidies
NPAsarea lw facton f ttalban asets(3 er ent and unclear property rights, may be factors in slowingnet of provisions) or GDP (under 2 per cent), but arelarge relative to lending to the private sector (or to bank agricultural growth in some states and limitations
on improvements in the quality of life generally. Oftencapital). The large NPAs in turn require large provi- t p s f tsions, another factor pushing up real lending rates. the poor suffer from the environmental problemRegul, ation fand rsup sion have iroved subsan associated with unclear allocation of property rights
Regulation andt supervision have improved substan- to clean air, water, etc. The human sustainability oftially since the 1980s and are largely up to international the cities is threatened by water and air pollution,standards, but they remain well below the steady evo- which partly reflects distortionary pricing and partly
lution of international best practices. The payments lack of funding for public infrastructure (Chapter 8system continues to lag behind international standards, and Annex 8.2)according to participants in the sector. The capitalmarkets are deep for a low-income country and im-provements have been made-notably the setting up A Second Wave of Reforms toof the electronic National Stock Exchange and thecreation of a depository that has reduced transactions Reduce Poverty Fastercosts by dematerializing an increasing number of All recent governments have discussed the need for ashares. Nonetheless, transparency needs improvement, ,
noaly in the activities of the dominant Unit Trust second wave of reforms to launch Ini ontd higenofab an in seatitlens, to hel .avi pam ests growth path that reduces poverty faster. However, asof India and in settlements, to help avoid payments noe, refrshv lwd raigsm netitcrises such as the one that hit the Bombay Stock Ex- noted, reforms have slowed creating somechange in June 1998. More fundamentally, . among investors. Many excellent suggestions for re-
rccoul ntfig form are contained in such reports as the Hussainauditing, and also corporate governance could b.enefit Committee on small-scale sector reservation, thefrom improvement to make India more attractive to Rakesh Mohan Committee on infrastructure, the Tenth
domestic and foreign investors (Chapter 7). Finance Commission on intergovernmental finances,
the Fifth Pay Commission on downsizing the civilservice, the Tarapore Committee on the capital ac-
Enforcement of property rights and contracts is in- count and its implications for the macroeconomiccreasingly identified by analysts as a critical institu- framework, the Narasimham Committees on the fi-tional element in development. Clarity and security of nancial sector, the Disinvestment Commission reports,property and land rights and timely recourse to an recent Economic Surveys, RBI Annual Reports, andefficient legal system are important not only to inves- the 1999 Export-Import Policy. In addition to thesetors but to sustainable increases in living standards for contributions, the comprehensive framework outlinedthe poor. Surveys indicate a respect for India's adher- above may provide some assistance. While a basicence to the rule of law and the independence and consensus on the need for the second wave of reforms
Overview * 7
has emerged, for example in the programmes of the Realigning Central and state governments to focus on
two major political parties, it needs to be translated core public activities would have high social payoffs. Basic
into substantive action. education and health and infrastruLture need better and
Broadly speaking the reforms would be most effec- more public spending to reduce poverty and speed
tive to the extent they reduce the risk of macroeconomic growth. Withdrawal of government from non-core
instability, increase the access of the poor to human activities through faster privatization (not just sales of
development, improve governance and reduce distor- minority shares) in manufacturing and service sectors,
tions, and improve the demand for labour. Poorer for example airlines and hotels, and increased private
states in particular will need to enact these reforms to sector participation in infrastructure, would permit a
overccme the initial lags and accelerate development. downsizing, upgrading, and focusing of government
Perhaps the most effective, cross-cutting reform would and the civil service on truly public sector activities.
be cuts in explicit and implicit subsidies together with It would also increase the current low returns on
privatization in power to raise the current low collec- capital invested in these areas and raise taxable rev-
tions of user charges (that represents a major part of enues. It is also worth noting that the current lack of
the implicit subsidies). Cutting the subsidies would attention and investment in these sectors is reducing
cut the fiscal deficit and thereby reduce risks of their saleability. Improvements in the budgets from
macroeconomic instability and the crowding out of reduced explicit and implicit subsidies and higher taxes
private borrowers; it would free up public funds for from former public enterprises would permit much
social and infrastructure spending to help the poor and needed increases in spending on infrastructure and
speed growth; it would encourage private sector inter- basic human development at the centre and state levels.
est in infrastructure; it would reduce distortions and At the state level, states such as Andhra Pradesh,
environmental degradation; and it would probably Haryana, Orissa, and UP are embarking on much
improve equity (Box 5.2 and Chapter 8). In the needed realignments of government in varying degrees
petroleum sector, the link that was established between and sectors.
domestic and international prices with the September Better and more spending on health and education.
1997 liberalization has been an important factor in Faster poverty reduction cannot be accomplished with-
cutting subsidies, and needs to be sustained. Another out improving the delivery of health and education
policy to reduce subsidies that could be enhanced is the services. This will involve more effective spending on
increasing use of cesses on fuels to fund road infrastruc- elementary education and basic health systems, with
ture. Obviously, state governments will play a major better targeting on improving the quality and quantity
part in cutting power and irrigation subsidies. There of services to the poor and with more public funding
have been welcome movements towards reform in to address the unfinished agenda. The effectiveness of
some states, including some of the poorer states public education and health services in poverty reduc-
such as Andhra Pradesh, Haryana, Orissa, and UP. tion can be improved by focusing on meeting consumer
However, state governments are not always prepared needs and the holistic needs of children, realigning the
to embark on the reform path. In this context, in- role of the state towards primary education and health,
creasing emphasis on states' performance in Central and making efforts to encourage improvements in and
government transfers, increasing the proportion that better use of private education and health services.
states borrow directly from markets, without Central Governance could be improved in a variety of ways. In
guarantees (and reducing state borrowings from the the public sector, tax structure and collection and
Centre), and limiting states' ability to ease their hard expenditure management would benefit from improve-
budget constraint, such as reducing access to high cost ment. Effective decentralization-including improving
small savings and limiting guarantees, would provide the state and local institutional capacity and greater
important incentives for reform. A welcome develop- 'voice', a more efficient sharing of the tax base across
ment along these lines is the recent use of memoran- different levels of government, and closer links of
dums of understanding (MoU) to encourage fiscal costs, revenues, and service delivery-would improve
discipline between the Ministry of Finance (MoF) and governance, outcomes, and the inclusion of the poor
states that receive extraordinary financing to ease the (Chapter 4). This is particularly the case in primary
impact of the recent hefty pay revision. And links health and education delivery that impacts heavily on
between Centre-state finance and state performance the opportunities for the poor to escape poverty. In
appropriately form part of the Eleventh Finance this regard, it is worth noting that India's decentrali-
Commission's terms of reference. zation to the third tier of rural and urban local bodies

8 * India: Reducing Poverty, Accelerating Development
already has a firm legal basis in the 73rd and 7 4th Improved infrastructure provision, both public andConstitutional Amendments (1992). Effective decen- private, would help accelerate growth. The currentlytralization and greater deregulation would help reduce inadequate provision of high quality, reliable, andcorruption, a mounting concern of central and state reasonably priced infrastructure services represents agovernments, as would improving public administra- major barrier to continued growth of the economy andtion and procedures, incentives and disincentives, and services to the poor, and to the diffusion of the benefitsaccountability (Chapter 6). The legal system would of liberalization. The development of infrastructurebenefit from a reduction in delays and disincentives to needs an effective delineation of responsibilities be-frivolous litigation and appeals, which would make tween regulator and policy maker, and the creation oflegal remedies more accessible to the poor and help independent regulators within a broader restructuringreduce the non-performing assets that burden the of the sectors. In many sectors, privatization andfinancial system and drive up borrowing costs. State greater reliance on competition could improve servicegovernments also need to enforce property rights and delivery in many areas. Above all, infrastructure im-law and order, to provide an attractive environment for provement will depend on the removal of implicit andinvestment. explicit subsidies and a move to remunerative user
Completion of the deregulation of goods and factor charges (Chapter 5).markets, notably through deregulation of agriculture,articulation of a time-bound tariff-reduction programme,completion of the WTO commitments, and develop- Circumstances Propitious for Reformsment of a less negotiated/more rules-based treatment and Acceleration of Growthof FDI, would stimulate poverty reduction throughhigher, more labour-using growth. It would also Events at the end of 1999 seem favourable to thehelp get India ready to take advantage of the pick-up initiation of the second wave of reforms. The centralin the world economy and the increased competition, government that took office in October 1999 hasdomestic and international, that is developing. Further already made progress by passing legislation to open upderegulation of labour markets and the small scale insurance (the Insurance Regulatory and Developmentsector would increase the demand for labour (Chapter Authority Bill), liberalizing foreign exchange regula-6). tion (the Foreign Exchange Management Bill), allowing
In thefinancial system India needs to speed up judicial trading in derivatives (the Securities Contract Regula-resolution of cases and debt recovery and improve tion [Amendment] Bill), and protecting trade marksbankruptcy and liquidation procedures. Accounting (the Trademarks Bill). The government enjoys a moreand auditing and financial system regulation and comfortable majority than the previous government,supervision, though much improved since the 1980s, which will permit it to move forward more easily onneed to move much closer to steadily improving subsidy cuts (as it demonstrated by implementing abest international practices, especially as the financial 40 per cent diesel price hike in October, in spite ofsystem becomes more privatized and links with the pressures for roll-back), government realignment, andinternational economy increase (Chapter 7). The RBI reform. At the state level, reforming governmentsalso needs to deal more rapidly with weak banks and received electoral support and non-reforming govern-prevent their non-performing assets from increasing. ments seem to have lost support. Some of the poorerLending to the private sector needs to improve, which and most indebted state governments-such as in Uttarwill depend on a reduced fiscal deficit (to reduce Pradesh-are embarking on a path of comprehensivecrowding out) and better incentives to lend and reforms, similar to the economic restructuring launchedcollect, including privatization of banks. The payments by the Government of Andhra Pradesh (that was re-system lags behind improvements elsewhere in the elected in October 1999). These reform efforts arefinancial sector and would benefit from some quick aimed at (a) restructuring state-level expenditure andimprovements. Finally, more transparency, such as improving governance so as to maximize the outcomesmaking the massive UTIs activities more open, reduc- achieved by public spending and private investments ining settlement times in the capital market, and improv- the state; and (b) enhancing the revenue base throughing accounting, auditing, and corporate governance, tax policy and administrative reforms and improvedas laid out in the draft Companies Bill, 1998, would cost recovery from publicly provided non-merit goodshelp reduce vulnerability and improve the allocation and services. These developments suggest that theof scarce capital (Chapter 7). chances of real reform happening are much brighter

Overview * 9
than they have been in the past; if these do occur, then, * decentralization experiences that will be most
as this Report suggests, growth could accelerate to the effective in improving the quality and effectiveness of
7.5 per cent and higher levels of the mid-1990s. India the decentralization process in the Indian context
would then have a real opportunity to reduce poverty (including studies of states' devolution of revenue and
substantially in the new millennium. taxing powers to local governments to decentralizeservices);
* possible paths to fiscal adjustment at the centralIssues for Further Analysis and state level, taking into account the linkage between
In several places in the Report, gaps in the knowledge fiscal deficits, growth, and poverty reduction, andIn sevral paces n theRepor, gap in th knweg drawing on international experiences;
base and in country experience have been identified as X X
issues deserving further analysis and research. Work on * approaches to corporate restructuring, public and
these and related issues will be important in reducing private, and the constraints imposed by the labour
poverty in India. market, drawing on international experience;
Some of the issues are fundamental and involve * possible paths to privatization of banks, while
cross-cutting work in various areas, and often these are decreasing the vulnerability of the banking system
the most important issues. These include through regulation and supervision that approachesbest practices and improvements in accounting, audit-
* improving the delivery of social services to the ing, and corporate governance;
poor; * further ways to strengthen institutions and mo-
the links between growth, poverty reduction, and dalities for delivery and repayments of micro-creditsgovernance, especially at the state level; and agricultural loans;
the nature, causes, and cures of urban poverty; options before India in the next round of trade
Other issues involve examination and comparison negotiations;
of policy options, based on experience within India and . linkages between trade, growth, employment,
internationally. These include and education.
* possible policy paths for deeper restructuring of Finally, as noted at various places in the Report, a
government at all levels, to help 'right-structure and, key issue for policy making is improvement in the
as necessary, right-size' the state in India; quality and consistency of various statistics.

Poverty Reduction:Progress and Challenges
Reducingpoverty andprovidingfor minimum needs is the ultimate yardstick against which to measuredevelopment. 7These have been major concerns of India's governments since Independence in 1947.Experience suggests that reducingpoverty requires coordinated macroeconomic and sectoral efforts andreforms. High rates of economic growth, especially in agriculture, have contributed to rapid decreasesin poverty incidence in India and elsewhere. Good infrastructure, a well-educated and mobile labourforce, effective institutions, and a stable political and social environment are enabling conditions.Conversely, low levels of education and ill-health, exacerbated by social and structural barriers, reduceopportunitiesfor escapinggpoverty and improving the quality of life. Low itncomes and inadequate safetynets leave persons vulnerable, particularly women and children. The importance of thesefactors explainsIndian, states' differential success in reducing poverty.
Overview since the early 1990s, despite a period of high growthin the mid-1990s.
Since the mid-1970s, India's growth rate has risen, What factors are behind the slowdown in povertypoverty has declined, and social indicators have reduction? This chapter looks at the evidence andimproved-literacy and enrolments have risen, morbid- some economic factors that may explain the slow-ity and mortality have declined, and the gender gap down; human development/social sector issues arehas narrowed. Despite this progress, India's poverty discussed in the next chapter. Although much moresituation remains a serious concern: in 1993-4, every research is needed on the slowdown in povertythird person in India still lived in conditions of ab- reduction, some hypotheses have emerged. First, thesolute poverty (Datt 1997), meaning India had 50 slowing of poverty reduction may partly be a statisticalper cent more poor than all of sub-Saharan Africa. artefact-the National Accounts Statistics (NAS) sug-In the social sectors, India's indicators remain below gest a faster growth of consumption and cereal avail-comparator countries and even some African countries ability than the household surveys. The differences(see Annex Table 4.1). Moreover, recently released NSS between the surveys and the NAS suggest a need fordata suggest that poverty has declined only marginally better statistics, a theme that echoes throughout this

Poverty Reduction: Progress and Challenges * 11
report (see Box 8.1). A second and more worrisome of poverty was 53 per cent, about the same as inpossibility is that growth, including agricultural growth 1970-4. Then, from 1973-4 to the mid-1980s, povertywhich was previously identified as a major factor in incidence declined fairly steadily from its earlierreducing poverty, has become less effective in reducing range-from 54 per cent in 1973-4 to 38 per cent inpoverty in the l990s (World Bank 1999b). Third, while 1986-7, a decline of about 2 per cent per annum.some of the better-off states have exhibited rapid Poverty reduction slowed in the late 1980s, probablygrowth and reduced poverty, most of the poorer states due to poor weather conditions and the resultanthave increasingly lagged behind. If these poor states downturn in agricultural production, but the publicwere to grow faster, poverty would fall more quickly. distribution system (PDS) and anti-poverty programmesTheir lagging performance probably reflects not only kept poverty from rising as it had in such circum-lags in infrastructure and human development, but also stances in the past. Poverty incidence dropped sharplythese states' relatively weaker property rights and in 1990, for reasons that are not altogether clear, andgovernance (Chapter 4 discusses governance issues in whatever contribution the macroeconomic situationIndia). In addition, the poorer states' fiscal problems, made was clearly unsustainable. In 1991-2, a transitoryrelated to distortionary and non-transparent subsidies, worsening of poverty incidence occurred with the 1991poor expenditure management, low (and declining) BOP crisis and decline in growth and stabilizationshares of spending on social and physical capital, and measures. However, the increased poverty incidenceineffective spending on basic services and anti-poverty was also related to other factors-poor harvests, limitedprogrammes certainly contributed to limiting these agricultural imports, and large agriculture procure-states' growth and poverty reduction (Chapter 3 fo- ment in the following year that kept food pricescuses on differences in state growth and fiscal manage- high-and there may be statistical questions related toment). the small samples in those years3 and the price indices
used to deflate the expenditure data (Tendulkar 1998;Datt and Ravallion 1998; Dubey and Gangopadhyay
Poverty Reduction: The Long View from 1998). By 1993-4 the incidence of poverty had fallen
the 1 950s to the Early 1 990s to 35 per cent. This was well below the 53 per cent ofthe early 1970s, but only slightly below the 38 per cent
Since Independence, Indian governments have accorded achieved in 1987-8.4great importance to poverty reduction. Poverty reduc-tion has been a major goal of all Five-Year Plans. To people below this expenditure considered poor. These expendi-measure its success in achieving this goal, the govern- tures correspond to a total household expenditure estimated asmeasurenits sucessione acieving othusehoal, sves govrn- sufficient to provide 2400 calories daily in rural areas and 2100ment commissioned a series of household surveys on calories daily in urban areas, plus some basic non-food items.poverty, beginning in 1951. These surveys provide an caoe ra ra,pussm a1 o-odIespoverty, beginning in 1951. These surveys provide an This Report, and other recent World Bank reports on povertyunparalleled record of a developing country's efforts to in India, use the poverty line as defined by the 1993 Planning
reduce poverty. 1 Commission Expert Group on Estimation of the Proportion ofIndia has reduced the percentage of population the Poor, but use slightly different price indices. The resulting
living in poverty since the 1970s, but progress has figures are slightly lower than the Expert Group's in 1993-4 (forbeen uneven over time and across states and the a full discussion including issues in poverty measurement innumber of poor has continued to rise, albeit at a slower India, see Annex 1 in World Bank 1997a and other works cited
rate.Fromthothe mid-1970s, poverty therein).rate. From the early 1950s to the mid-1970s, poverty 3 Some have suggested that the NSS figures are subjectrates fluctuated without a clear trend, as shown in to error because of the limited size of the recent annual rounds.Fig. 1.12 (See also Annex Table 1.1 and Ravallion and The NSS 51t,e 5 2und ofand 5 3 rd rounds sampled approximatelyDatt 1996a). In 1951-5, the average headcount index 40,000 households for the consumption module of the survey.
Experiments with questionnaire design reduced the comparableBetween 1951 and 1997, the NSSO has undertaken thirty- sample to an estimated 20,000 households at the all-India level,
eight national household surveys that have obtained reasonably but some simulations show that this is estimated to give ancomparable consumer expenditure information. acceptable confidence interval of only + /-1 percentage point in
2 The numbers discussed in the text and shown in Figure 1.1 the poverty estimate. The 'quinquennial' surveys, most recentlyrefer to the so-called headcount index; other poverty measures 1993-4 and 1987-8, are much larger, with about 115,000 house-show similar patterns. India's official measure of poverty is a holds.headcount index based on the food-energy method. The poverty 4 Between the 1987-8 and 1993-4 surveys, urban povertyline is the monthly per capita expenditure in 1973-4 all-India dropped 6 percentage points, while rural poverty declined onlyprices of Rs 49 in rural areas and Rs 57 in urban areas, with 2.5 percentage points. This compares to a typical drop in rural
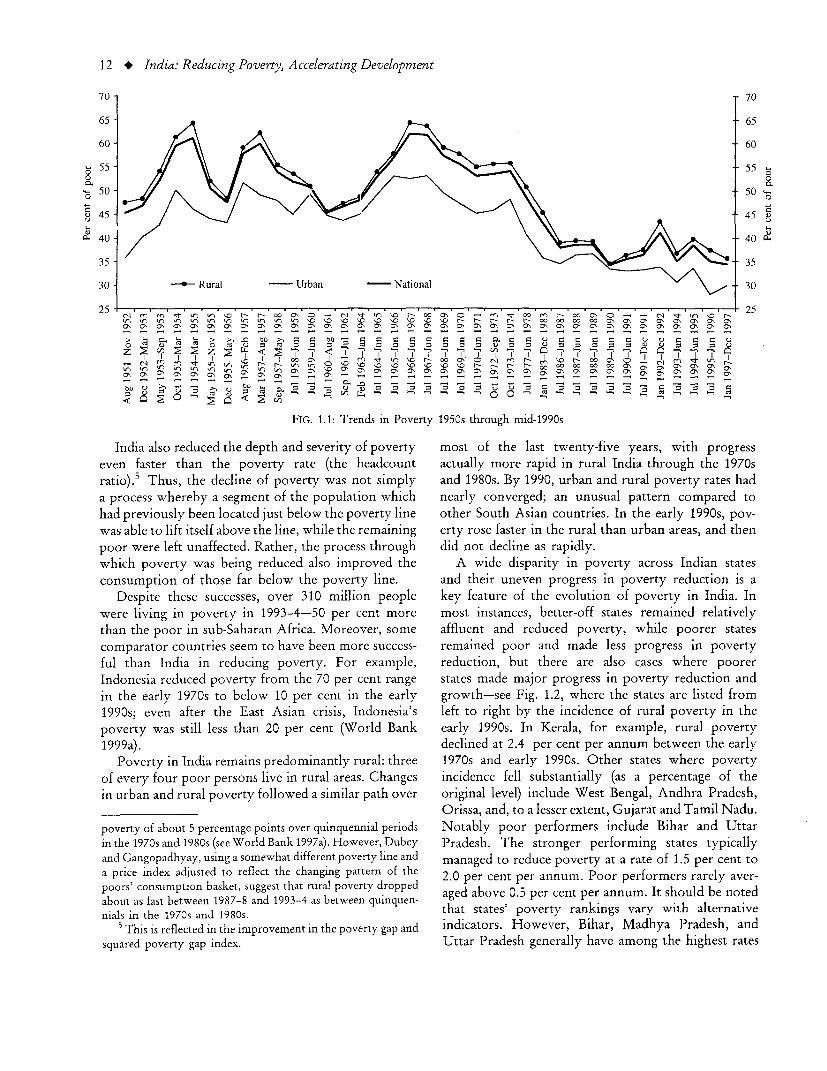
12 * India: Reducing Poverty, Accelerating Development
70 70
65 65
60 60
-. 55 55 _ co 00. cc
- 50 - 50 -
045 -45)
A- 40- 400
35- 35
30 - th Rural - Urban - National 30
25h-aId. .p Ii .been I .b th p e ln 00. In Oh er O 9 90, p o v0. > ~~r- . 00 3-. 00 0'n 00 000 .0 'a 0 0 00 00
wa a) to lf \e "C the0 \0 w0 t0 r i r- ose 0 r in the rurl C, C), CY, a, tCy, '9 Cy,~~~~~~~~~~~~~~~~~~~~~~~~~~~~~~~~~~~~~~~~~~~~~~~~~~~~~~~~~~~~~~~~~~~~~~~~~~~~~~~~~~~~~~~~~~~~~~~~~~~~~~~~~~~~~~~~~~~~~~~~~G , .,- ,-- ,-
I il UIt 'III m..~,
- C') ~ CO ~r .0 00) N - NON ON C" C') CONC'NON0 N '
_ 0 0 0 ~~~~~~~ ~~0~1 0 "
FIG. 1.w1: Trends in Poverty 1950s through mid-1990s
India also reduced the depth and severity of poverty most of the last twenty-five years, with progresseven faster than the poverty rate (the headcount actually more rapid in rural India through the 1970sratio).' Thus, the decline of poverty was not simply and 1980s. By 1990, urban and rural poverty rates hada process whereby a segment of the population which nearly converged; an unusual pattern compared tohad previously been located ust belowthe overty line other South Asian countries. In the early 1990s, pov-was able to lift itself above the line, while the remaining erty rose faster in the rural than urban areas, and thenpoor were left unaffected. Rather, the process through did not decline as rapidly.which poverty was being reduced also improved the A wide disparity in poverty across Indian statesconsumption of those far below the poverty line, and their uneven progress in poverty reduction is a
Despite these successes, over 310 million people key feature of the evolution of poverty in India. Inwere living in poverty in 1993-4-50 per cent more most instances, better-off states remained relativelythan the poor in sub-Saharan Africa. Moreover, some affluent and reduced poverty, while poorer statescomparator countries seem to have been more success- remained poor and made less progress in povertyful than India in reducing poverty. For example, reduction, but there are also cases where poorerIndonesia reduced poverty from the 70 per cent range states made major progress in poverty reduction andin the early 1970s to below 10 per cent in the early growth-see Fig. 1.2, where the states are listed from1990s; even after the East Asian crisis, Indonesia's left to right by the incidence of rural poverty in thepoverty was stillI less than 20 per cent (World Bank early 1990s. In Kerala, for example, rural poverty1 999a). declined at 2.4 per cent per annum between the early
Poverty in India remains predominantly rural: three 1970s and early 1990s. Other states where povertyof every four poor persons live in rural areas. Changes incidence fell substantially (as a percentage of thein urban and rural poverty followed a similar path over original level) include West Bengal, Andhra Pradesh,
Orissa, and, to a lesser extent, Gujarat and Tamil Nadu.poverty of about 5 percentage points over quinquennial periods Notably poor performers include Bihar and Uttarin the 1970s and 1980s (see World Bank 1997a). However, Dubey Pradesh. The stronger performing states typicallyand Gangopadhyay, using a somewhat different poverty line and managed to reduce poverty at a rate of 1.5 per cent toa price index adjusted to reflect the changing pattern of the 20prcn e nu.Po efresrrl vrpoors' consumption basket, suggest that rural poverty dropped aged above 0.5 per cent per annum. It should be notedabout as fast between 1987-8 and 1993-4 as between quinquen- that states' poverty rankings vary with alternativenials in the 1970s and 1980s.
This is reflected in the improvement in the poverty gap and indicators. However, Bihar, Madhya Pradesh, andsquared poverty gap index. Uttar Pradesh generally have among the highest rates

Poverty Reduction: Progress and Challenges * 13
80 - 807- Average 1990-4 0l Decline from Average 1970-4
70 __ 70
60 - 60
50 -50 A.
40 -40
30 - ~~~~~~~~~~~~~~~~~~~~~~~~~30 20 - ~~~~~~~~~~~~~~~~~~~~~~~~~~20
10 - ~~~~~~~~~~~~~~~~~~~~~~~~~~~~~10
0 o~~~~~~~~~~~~~~~~~~~~~~~~~~~~~~~
> A = ° Y O Ya .0 a U a -l"Z z .0a
0 aa ; a
FIG. 1.2: Rural Poverty Levels by State
of poverty whichever the index used; Kerala, Haryana, mean consumption) and a distribution componentand Punjab have the least (see Chapters 2 and 3, UNDP shows that the rise in growr.h in mean consumption1999; World Bank 1997a). It is also important to note accounts for about 87 per cent of the cumulative declinethat the sample sizes in some of the states are small, in poverty, with changes in distribution accounting forimplying a large error of estimate in their figures. the rest, that is only 13 per cent (Datt 1997). TheFinally, it is important to note that there exist large opposite side of the coin is that the Surveys suggestdisparities in poverty within states (Dreze and Srinivasan that inequality was not increased much by higher1996). growth-according to the NSS, the Gini coefficients
of expenditure rose (worsened) by about 10 per centFactors in Reducing Poverty from the 1970s from 1974 to 1978 in both rural and urban areas, and
to the Early 1990s since then have remained fairly close to 0.29 and 0.35
The historical evidence across countries, in India respectively, a relatively even distribution of incomeTh hitrcleiec cos onre,i ni for a developing country.
over time, and across Indian states suggests that the Diffeveln r cuty of J
majo facors n rducig poertyare(a) aste inDifferent rates of agricultural growth and increasesmajor factors in reducing poverty are (a) fastr in mrural wages were major factors which led to different
growth, particularly agricultural growth that raises levels as well as rates of decline of poverty across Indian
agricultural wages and tends to depress the (relative)ll and attl1996of Green rolutin,, , ,, \, .inrastuctur.(se states (Ravallion and Datt 1996b). Green revolution
price of food, (b) lower inflation, (c) technology, irrigation, and infrastructure were associ-Chapter 5), and (d) human resource development, alnlnotably female literacy6 (see Chapter 2). Most anti- farm employment such wagsi and Haryn a
poverty programmes seem to have had little sustained wiha the hihs GD pe Japia haryimpact on poverty reduction, though they certainly whics (ad cothighestt GDP per capita up to the earli
eased the impact of the 1987 drought. Rural to urban 1990s (and continue to be among the top five states m1996-7). Growth in the urbanized part of the economy
migration also seems to have played onlv a small role. w l snc i r p aI ~~~was less significant in reducing poverty across states,
(For further discussion of these issues see Datt 1997; . .c r t'i X
Ravallion and Datt 1996a and 1996b; World Bank reflecting the capital-intensive, import-substituting1997avall and Datt a and 1996bs World therein) nature of India's industrial development, its require-1997a and 1998b and works cited therein.) ments for skilled rather than unskilled labour, and
Regarding the role of growth, India's sustained de- labour market regulations that limited the growth of
line in poverty began as GDP growth picked up from formal sector employment (see Chapter 6). Thesethe 3.5 per cent rate that characterized the country in factors limited the impact of urban growth on labourthe early years. A decomposition of the changes inpoverty (in the NSS) into a growth component (of 7 Of course, there are the standard issues that (a) the Gini
coefficient is not a good measure of distribution and (b)6 In statistical work, factors (c) and (d) are sometimes proxied consumer surveys do not capture well the increases in consump-
by development spending. tion and income of the higher income population.
14 * India: Reducing Poverty, Accelerating Development
demand and kept the proportion of urban population number of households than the larger quinquennialrelatively small (around 27 per cent), so that its surveys, the most recent of which was held in 1993-4,proportionate impact was low. The human resource but are still large enough to be statistically accurateapproach to poverty reduction across Indian states is (see fn. 3 in this chapter). A more serious problemexemplified by Kerala, which exported relatively skilled is the increasingly large discrepancy between the NSSlabour internationally and benefited from remittances, and the NAS. The NSS shows not only that povertyeven though its GDP growth was not particularly did not decline much in the mid-1990s but that meanrapid. A variety of international evidence supports the per capita consumption, a key determinant of povertycontribution of human development to poverty reduc- reduction according to various analyses, did not risetion. much. Thus, according to the NSS, poverty stagnated
Finally, inflation had a negative effect on poverty. not because inequality increased, but because of slowHigher inflation in India is often associated with poor growth. However, the NSS per capita consumptionharvests and a relative rise in the price of food. The figures are an increasingly smaller fraction of estimatedpoor are doubly hit, as their consumption is largely consumption in the NAS8 -from 77 per cent in 1970-food, and their wages (and demand for labour and 1 to only 66 per cent in 1997, as shown in Box 1.1.income) rise less than prices in years of poor harvests. Applying the NSS estimate of distribution to the con-In addition, there is the traditional macroeconomic sumption figures in the NAS results in poverty fallingargument that the inflation tax hits the poor hardest in the 1990s as well as the 1980s (See Box 1.1). More-because relatively more of their assets are held in the over, the NAS consumption estimate is itself a declin-form of currency (see Chapter 8). International evi- ing fraction of total GDP: from 65 per cent in 1988-9dence supports the importance of a stable to 57 per cent in 1997-8. This fall is explained almostmacroeconomic environment for growth and poverty fully by a rise in the statistical discrepancy-the differ-reduction, for example in East Asia (World Bank 1993). ence between expenditure and production estimates
of GDP-from around zero at the end-1980s to around10 per cent nowadays (see also Box 8.1). Hence con-Reduction in Poverty in the Mid-1990s: sumption in the NAS may itself be underestimated.
A Mixed Picture The differences between the NSS and NAS inconsumption are also reflected in discrepancies with
In the mid-1990s, the decline in poverty slowed respect to food consumption. In particular, the NASsharply, particularly in rural areas, according to re- show rising per capita cereal availability, whereas thecently available NSS data for the periods July 1994 to NSS shows declining per capita cereal consumptionJune 1995, July 1995 to June 1996, and January to (Box 1.1). In theory, these two should be approxi-December 1997 (see Figure 1.1 and Annex Table 1.1). mately equal.An estimated 34 per cent of the population was still One possible explanation for the growing differencebelow the poverty line in 1997 compared to 35 per cent between consumption in the NSS and NAS might bein 1993-4. During the mid-1990s, GDP growth ex- a failure of the NSS to capture the consumptionceeded 7.5 per cent per annum and agricultural growth gains of high-income households. The NSS shows onlyseems to have remained high (see Chapter 6), while a marginal worsening of income distribution. But if thesocial sector indicators such as literacy and infant surveys are failing to capture substantial gains accruingmortality improved (see Chapter 2). to rich households, they could be underestimating
What changed in the mid-1990s to undermine the the rise in both mean consumption and inequality.strong relationship found before the 1990s between Under-reporting of rich consumers is a common prob-poverty reduction, growth, and social indicators? As lem for household surveys. However, the estimateddiscussed below, the lack of decline in poverty maywell be a statistical artefact. However, closer examina- 8 Private consumption is estimated independently in thetion of recent developments also raises concerns regard- Indian NAS, as are public and private investment, exports,ing inflation, the changing role of agricultural growth, imports, and government consumption, and an explicit estimateng inflation the changing role of agriculturalgrowth, is made of the difference between estimates of national expen-and, more fundamentally, a lack of progress in reducing diture and production, as is done in some developing countries.poverty in the poor states. See GOI (1998a) and Box 8.1. The mere existence of a substantial
Inconsistencies in statistics raise questions about how difference between the NSS and NAS is neither surnrising normuch of the slower poverty reduction is a statistical a cause for alarm; what is worrying is the growing discrepancyartefact. The recent NSS surveys cover a much smaller between the two sets of estimates.

Poverty Reduction: Progress and Challenges * 15
Box 1.1NSS versus NAS
NSS and NAS consumption estimates are getting further apart. Ratio of NSS to NAS per capita consumption:
0.75 .
0.65- ~~ N 0 C~~~~ '0 ON c'i I nf 00
N N N 00 00 OC 00 ON aO cOON O ON ON ON ON ON N ON ON
Poverty stagnated, or did it? All India headcount ratio (per cent):NAS NSS
20 45
40
15 3
lo.. NAS - 30@ NSS - 25
5 I I l - 2000 ON 0 - 0l Cl aE 'f '0 N00 00 ON ON O O O oN oN OON ON N O O
Food consumption declined, or did it? Per capita cereal consumption/availability:175
170
165
>~160
155
150 ---- Net Availability (NA)
145 -0-NSS Consumption
14000 ON - ClIt ' 0 N-00 00 ON ON ON O ON O N O
Notes: The above poverty estimates are World Bank calculations, based on NSS and NAS data. The first figure uses the NASfigures for private consumption and Bank estimates of annual India population levels. The 'NAS' poverty estimates use the NSSdistribution (and poverty lines) but adjust the survey consumption levels by the ratio of NAS to NSS mean consumption. Cerealavailability equals net production plus net imports minus changes in public stocks, and so should approximate consumption.
increase in availability of cereals (from NAS) is consis- (NCAER) Market Information Survey of Householdstent with a fairly constant income distribution and (MISH). This provides annual information on self-falling poverty-increased demand for cereals comes 'reported income from a sample of 18,000 households,mainly from rises in income among lower income slightly smaller than the NSS annual sample size. Thefamilies-and goes against the hypothesis that it is the income poverty line set by the NCAER in defining its'missing rich' which explain the difference between the 'low income group' is rather high compared to theNSS and the NAS. poverty lines used with the NSS consumption data, but
One final source of evidence in this regard is the shows a clear downward trend in poverty in both ruralNational Council of Applied Economic Research and urban areas. MISH also surveys a larger set of

16 * India: Reducing Poverty, Accelerating Development
households on possession of standard durable items have targeted lower inflation because of the negative(watches, televisions, etc.), something which the NSS impact of inflation on the poor, and have had somedoes not inquire about in its annual rounas, and MISH success. However, transitory shocks in food prices,finds consistent increases in ownership levels over such as at the end of 1998, related both to poor harveststime, even among low-income households. and the rigid, still highly regulated food distribution
In sum, the NAS data (and the NCAER data) suggest system, continue to cause transitory increases in infla-that strong growth occurred in the 1990s and that the tion.NSS data underestimates consumption growth and Differences in Agricultural Performance in the 1980sconsequently poverty reduction; while the NSS data and 1990s also support a slowdown in poverty reduc-suggest that not only did poverty stagnate but that tion in the mid-1990s. As noted above, agriculturalthe NAS overestimate data consumption growth. growth was a major factor in reducing poverty in IndiaChoosing between these two hypotheses, or variants in the 1980s. Rural growth was rapid, broad based, andinvolving changes in income distribution, is not easy, labour-intensive, leading to a reduction in poverty inand well beyond the scope of this Report. With the 1970s and 1980s. Production of oilseeds and thediscrepancies such as these, the only conclusion that dairy and poultry sectors grew remarkably, and thecan confidently be made is that India's statistical adoption of scale-neutral, high-yield technology spreadarchitecture, once a model for other developing coun- agricultural growth to the lagging, rain-fed, and highlytries, needs more consistency checks (see Box 8.1). populated eastern regions. Real wages were pushed up
by the increase in labour demand and the productivityincreases that lowered costs.
Macroeconomic Concerns: Inflation and The rate of agricultural growth in the 1990s wassimilar to the 1980s, according to the new NAS9 albeitwith continued year-to-year volatility. However, the
Although statistical issues clearly exist, differences growth of real daily wages in rural areas-a key linkbetween the 1980s and the 1990s in terms of inflation between agricultural growth and poverty reductionand agricultural performance do give some credence according to the analysis of the 1980s-slowed in theto the statistics showing a mid-1990s slowdown in 1990s (see Table 1.2), suggesting that agricultural growthpoverty reduction. Other things being equal, higher in the 1990s may have been less poverty reducing.
TABLE 1.1Annual Average Growth in Price Indices
Wholesale Price Index (1981-2 = 100) CPIAL(per cent)
WPI Foodgrains Rice Wheat Pulses (1960-1) = 100)
1980/1-1990/1 6.9 6.4 5.6 5.7 11.2 6.91990/1-1997/8 8.8 10.4 10.2 9.5 11.4 9.71993/4-1997/8 7.3 8.9 8.3 7.7 9.7 9.6
Note: WPI indices for foodgrains (but not overall WPI) from 1982 to 1983.
inflation tends to increase poverty (that is, with the 9 The new, rebased, 1993-4 NAS estimate a higher level ofsame real growth rate, higher inflation is associated GDP than the old, 1980-1 based NAS (see fn. 1, Chapter 8 for
with greater poverty), as noted above, and average a full discussion). Agricultural GDP is 8 per cent higher inwith greater poverty), as noted above, and avcrageIinflation washigerin he 99s tanin he 98s (ee 1993-4 in the new accounts than in the old. Moreover, the postinflation was higher in the 1990s than in the 1980s (see 1993-4 agricultural growth rates in the new NAS series are overTable 1.1). Research has shown the poor to be particu- 1 per cent per annum higher than in the old series.larly susceptible to increases in the relative price of The new agricultural GDP data, which are available onlyfood (Datt and Ravallion 1997), and the increase was from 1993-4 onward, include a higher estimate of many non-even larger in the 1990s as compared to the 1980s. The traditional agnrcultural products than the earlier series and tracklarge increase in foodgrain prices was a particular factor the growth of those products after 1993-4. Presumably theseand reflects large increases in procurement and issue estimates are more relevant for comparisons of recent incomeprices associated with the PDS in the early 1990s. As and consumer spending on agricultural products than the oldpriscesse in Chapter 8, recent Indian governments series. Statistically speaking, the trend growth rates of agricul-discussed in Chapter 8, recent Indian governments ture in the 1990s and the 1980s are not significantly different,

Poverty Reduction: Progress and Challenges * 17
Among the possible explanations for the slower growth Analysis also suggests that off-farm employment isin wages are: (a) slower growth of demand for agricul- an important means of escaping poverty in rural India.tural labour in the 1990s, associated with the new crops Unfortunately, India's recent high GDP growth doesthat account for the continued high agricultural growth not appear to have created more off-farm employmentin the new NAS; (b) a slowdown in productivity opportunities for the rural poor. In some regions,growth in agriculture, possibly related to environmen- employment in agriculture actually increased in thetal issues and the need for private investment, such as 1990s. Recent work (Gupta 1999) documents a rise ingeneration sets, to make up for a poorly performing the proportion of workers who are self-employed orpublic infrastructure (see Chand 1999, World Bank in casual wage cmployment in the 1990s, and a fall in1999b, and references cited therein); and (c) a less well regular, salaried employment. Two factors are respon-distributed agricultural growth, with the eastern states, sible for the sluggish response in the non-farm sector:where poverty is concentrated, experiencing a slow- not only are there distortions in the agriculture sector,down.' 0 The latter two explanations are in turn related but there remain important distortionary policies into the public sector's approach to agriculture, with its the non-farm sector, for example, small-scale reserva-continued focus on providing implicit and explicit tion and overregulation of markets and agro-industrysubsidies, which contribute to inefficiency and have (see Chapter 6 and World Bank 1999b). Removinguncertain distributional consequences, rather than on distortions and improving infrastructure, social sectorpublic investment and technological upgrading; its delivery, and the legal framework could help unleashincreasing fiscal constraints that have led to a decline a substantial round of labour-intensive growth in thein public infrastructure investment; and its continued rural non-farm economy.regulation of the agricultural sector in contrast to thederegulation of the urban sector (See the discussions in D nChapters 3 and 6, which summarize World Bank Divergence In Poverty Reduction1999b). Clearly, further analysis is needed, particularly between Statesonce the state GDP accounts are fully rebased. What-ever the conclusion, a reduction in implicit and explicit Sincedthe mid-1970s, a number of states have managedsubsidies, a refocusing of the public sector on poverty- to reduce poverty, while in some low-income states,alleviating spending, and a deregulation of agriculture notably Bihar and Uttar Pradesh, growth and povertywould all probably improve the impact of agriculture reduction have lagged behind. This differential perfor-wouldn all poverobably reucimpro ve the pactofagriculture mance appears to have increased in the 1990s. Fig. 1.3
shows a growing regional rural poverty differential
TABLE 1.2 between India's five lowest income states (Bihar, UttarAnnual Average Growth in Wage Rates of Pradesh, Madhya Pradesh, Orissa, and Rajasthan) and
Unskilled Agricultural Male Labourers the rest of India's thirteen largest states, using state-by-(per cent) state poverty figures." It is likely that urban poverty
Nominal Real shows, if anything, an even greater increase in the
1980/1-1990/1 12.0 4.6 differential. Fig. 1.3 suggests that rates of rural poverty1990/1-1997/8 12.2 2.4 reduction began to diverge in the late 1970s: while both1993/4-1997/8 12.7 2.5 groups of states evidenced a steady decline in rural1980/1-1997/8 12.1 3.2 poverty incidence, the rate of progress in the five north-
ern and eastern states was somewhat slower in the lateNote: (i) CPIAL used to deflate nominal wages; 1970s. The divergence increased in the 1990s as poverty
(ii) Exponential trend growth rates were calculated using s fOLS. stopped falhng in the low-income states. By 1997, the
l Due to limitations in sample size and data availability, thisusing regressions with the new GDP series growth rates for analysis involves poverty estimates only for India's thirteenthe years from 1993-4 onward. However, there is a significant largest states, namely, West Bengal, Punjab and Haryana,fall in the agricultural growth rate in the 1990s using the old, Maharashtra, Rajasthan, Taamil Nadu, Madhya Pradesh, Andhra1980-1 base data, which are available through 1996-7. Pradesh, Karnataka, Kerala, Gujarat, Orissa, Uttar Pradesh,
10 It should be noted that much of this analysis, particularly and Bihar. The five poorest states are selected on the basis ofthe interstate comparisons, is largely based on the old NAS 1980-1 percapita income asper Table 3.1. The differential would(1980-1 base), which as noted in fn. 9, show a much slower have been even greater if Rajasthan had been excluded. See Dattoverall growth of agricultural GDP than the new NAS (1993-4 and Ravallion (1998) for details on state-level estimation proce-base). dures.

18 * India: Reducing Poverty, Accelerating Development
Headcount index Headcount index801 80
70- 70
60 60
50 50
40]- 40
30 ---- Group I: Andhra Pradesh, Gujarat, Karnataka, Kerala, Maharashtra, Tamnil NaduW.Bna,ndPjb 30- Group 2: Bihar, Madhya Pradesh, Onissa, Rajasthan, and Uttar Pradesh
20.-. N 0 N 0 . N 20. °a 'a 'a 'a 'a IC c a ' - l -t - N- 00 00 00 m a, m' a, a, a,
a' a'a'a a' a' a' a' a'a a 'a'a a,a' a'a a ' ' a,
a a ts a a a a C: a a o a
\ fl 1.3:0 ea Rates (ral 'a N- - a a' - - - - -
FIG. 1.3: Headeount Rates (Rural India)
gvap in poverty incidence between the two groups of ally have the worst human resource indicators. Infra-
states had reached nearly 18 percentage points, and structure is recognized as a particular problem in thepoverty incidence in the low-income states was over 50 poor states. The differentials in private GDP growthper cent higher than poverty in other lar e states (the and public investment in infrastructure and human1993-4 gap, based on the quinquennial 5 0 t round, was capital partly reflect weak legal and regulatory frame-
estimated at 20 percentage points). By way of compari- works for business; and problems of governance, lawson, in the 1980s, the gap was 7-8 percentage points. and order, and weak institutional capacity more gener-
What explains this large cross-state differential in ally (see, for example, Business India 1998). Finally, thepoverty reduction? Partly it reflects lower growth in lagging states, despite allocations of central funds thatthe poor states. Most of the states that began the 1970s favoured them in per capita terms because of their lowwith relatively low per capita GDP had slower growth per capita incomes, suffered from fiscal problems. Thisin GDP and its three main components-agriculture, was particularly the case in the 1990s, because their lackindustry, and services-than the middle and higher in- of fiscal adjustment and increased debt service pay-come states, as discussed in detail in Chapter 3 and the ments coincided with a decline in overall central grantsreferences cited therein.12 The poor states also gener- and loans to the states and rise in interest costs. These
12One might argue that the NSS finding of minimal change fiscal problems led the states to reduce their capital and
in income distribution is inconsistent with the observation that human resource spending as a percentage of GDP (Seesome of the poorer states are growing more slowly than the Chapters 3 and 8 and World Bank 1998a).other states. The differences between the NSS estimates and the
NAS data also hold at the state-level, since the total state-levelGDP (production estimates) has remained a relatively constant Summaryfraction of national GDP. However, another explanation is thata minimal change in the aggregate Gini coefficient can occur, India reduced poverty substantially since the mid-even if some of the poorer states grow relatively slowly, other 1970s, as growth rose and human development indica-poor states and the middle income states grow relatively rapidly, tors improved (see Chapter 2). In the mid-1990s,and the initially high income states grow relatively slowly, growth increased sharply and human developmentwhich seems to be the case (see Chapter 3). More importantly,it has to be recognized that interstate disparities typically nindcators continued to improve. Yet poverty rates,account for only a small fraction of total inequality-about 10 even in the urban areas, declned only marginally. Theper cent-sn that even large changes in these disparities will have inconsistencies between the NAS and NSS that are usedonly a small impact on total inequality. to measure poverty suggest that this may be a statistical

Poverty Reduction: Progress and Challenges * 19
artefact. Partly the slowdown may also be explained by poor? We would argue not. First, there continues tothe higher average inflation in the 1990s compared to be some reduction in poverty, particularly in the urbanthe 1980s, especially the more rapid increase in food areas and in some states. Second, and more important,prices. There are also concerns that the pattern of the issue is not reforms and stabilization, which wereagricultural growth is producing less of a rise in labour clearly needed to correct an unsustainable situation,demand/fall in poverty than in the past. More funda- but incomplete and partial reforms. In particular, it ismentally, while some states were able to take advantage generally agreed that agriculture, which may have lostof the stabilization and reforms to speed up growth and its impetus in reducing poverty, remains the leastpoverty reduction, others increasingly lagged behind, reformed and most distorted sector. Lack of reformsdue to poor governance, infrastructure, lack of human of labour and product markets limit both the rate ofdevelopment, lack of fiscal adjustment, and compres- growth and its labour intensity (Chapter 6). Reform ofsion of development spending (see Chapter 3). The India's anti-poverty programmes is now underway, buthigher growth has brought down poverty reduction in has taken place too recently for the benefits to showsome states, but the poorer states in particular need to up in faster poverty reduction-moreover further in-undertake reforms that would lead to faster growth and stitutional and governance improvements will be neededpoverty reduction. to make the programmes fully effective (see Box 1.2).
Should the recent developments be taken as evidence Institutional and governance issues also arise in socialthat stabilization and reforms have worked against the sector services (see Chapter 2). Finally, at the state
Box 1.2REFORMS IN INDIA'S ANTI-POVERTY PROGRAMMES
India's anti-poverty programmes (APPs) are mainly run by the central government. They amount to some 6-7 per centof total GOI budgetary expenditure, or 1 per cent of GDP. Even accounting for inflation, they have been growing at10 per cent per annum since 1992-3. There are three main types of APPs: rural works, self-employment, and food subsidyprogrammes. All three have been subject to reform in recent years.
Food subsidy programmes make up about 55 per cent of total APP spending. By far the largest food subsidy programmeis the PDS, which was explicitly targeted towards the poor at the national level in 1997 and renamed the Targeted PDS(TPDS). Recent research in UP (Kriesel and Zaidi 1999) has shown impressive performance in targeting: the poor werefound to be four times as likely as the non-poor to purchase subsidized foodgrains through the TPDS.
Self-employment programmes make up only about 5 per cent of total APP spending, but have received a lot of publicity,most of it bad, on account of the poor performance of the Integrated Rural'Development Programme (IRDP). This yearthe IRDP was scrapped, along with five other small self-employment programmes, all of which were replaced by a singleprogramme-the Swarnjayanti Gram Swarozgar Yojana (SGSY). Not only is this rationalization very welcome, but the newprogramme seems better designed. It basically replaces subsidized lending to individuals under IRDP by subsidized lendingto self-help groups. Group lending has the advantage of peer-group pressure leading to higher repayment rates, and hasdemonstrated its potential for success in India as well as many other countries.
Rural works programmes account for about one-third of APP spending. There are two main schemes, the EAS(Employment Assurance Scheme) and the JRY Jawahar Rozgar Yojana), now renamed the JGSY Jawahar Gram SamridhiYojana). The EAS is continuing as an employment-generation scheme, but with better targeting to poorer states anddistricts. The JRY, which was an employment-generation scheme, has now been redesigned in two aspects. First, it willbe exclusively implemented by the gram panchayats, or village local governments. Second, its main focus now is oninfrastructure development, with employment generation relegated to a secondary objective. The thinking behind thisis that JRY was failing both to develop durable assets and, due to poor targeting and abuse, to provide employment tothe poor. While no one can argue with the need for more and better rural infrastructure, there is now a real need toreform the EAS as the burden of providing a rural safety net now falls mainly on it.
The rationalization and better targeting underlying the above reforms are both big steps forward. All the programmesare also giving a greater role to rural local government for implementation and for beneficiary selection and monitoring.The reforms also lay stress on transparency, making information about the programmes public at the village level, andon the importance of physical, financial, and social audits. While these reforms are very welcome, there is still a long wayto go on the ground. The same research in UP which showed good targeting of the TPDS also found that only 40 per centof the grain allocated to the state actually reached the intended beneficiaries: 20 per cent was simply not lifted from centralstorage facilities, and the remaining 40 per cent was unaccounted for. To reduce leakages and abuse, and to promote thenew guidelines on transparency, access to information, and accountability, the central government could make participationby state and local governments in the APPs conditional on good performance.
20 * India: Reducing Poverty, Accelerating Development
level, differences in governance and fiscal adjustment of the remainder of this Report. Successive chaptershave led to differences in human development, infra- examine: the social sectors (Chapter 2), issues of statestructure, and private investment that contribute to the performance (Chapter 3), governance (Chapter 4),differences in growth and poverty reduction across the infrastructure (Chapter 5), labour demand and relatedstates. Further analysis is clearly needed on the determi- sectoral issues (Chapter 6), the financial sector (Chapternants of poverty reduction, including issues relating to 7), and macroeconomic policies (Chapter 8). Finally,urban poverty. Chapter 9 looks at future prospects and summarizes
Against this backdrop, there is concern that poverty the key requirements for sustained poverty reductionreduction will continue to stagnate unless a second and growth.phase of reforms occurs. These concerns are the subject

2
Improving Health andEducation for the Poor
Overview health, nutrition, and population but does not focus onimportant health-related areas such as sanitation and
In India, as elsewhere, social outcomes both embody water supply). Nonetheless, indicators continue topoverty and represent a way out of poverty. Malnu- suggest surprisingly low levels of literacy and schooltrition, poor health, a lack of learning opportunities, enrolments and surprisingly high levels of infantand limited choices are defining characteristics of mortality, maternal mortality, and malnutrition, rela-poverty. Good education, health and nutrition, and tive to China and Indonesia, or even other low-incomelow fertility help reduce poverty by increasing oppor- countries. Within India, inter- and intra-state dispari-tunities to generate income. By the same token, an ties are large. The poor, rural women, disabled, andimproved standard of living leads to gains in health and people belonging to Scheduled Tribes and Castes standeducation, freeing people from the trap of ignorance out as the most vulnerable sections of society. Inand exposure to disease. There are also positive connec- particular, the indicators suggest substantial problemstions between health and education. Education em- in the same large states where poverty is high (seepowers people to use information better to make Chapter 1). It probably will be difficult to reducehealthy behavioural choices; healthy people are more poverty substantially in the future without majorlikely to attend school or go to work, and can learn improvements in spending on and delivery of healthand work more effectively. Unfortunately, the more and education services in these states.common experience is that costs of illness keep people The delivery of public services in health and educa-in poverty and poor quality education limits their tion is fraught with problems related to limited ac-opportunities to escape poverty. countability for performance, low management and
Progress in the social sectors is both a vital yardstick worker incentives, inadequate materials and equipmentof and a key element in the reduction of poverty. In for effective health care and education, demands forIndia, there are constitutional and oft-stated govern- payment for supposedly free public services, and poorment commitments to ensuring basic education and targeting of services and subsidies at the poor. Becausehealth services and it has shown substantial improve- of these problems, private delivery of health andments in education and health outcomes over the last education is expanding rapidly, to the public in generaldecade (in this Report, health is defined to include and even to the poor.

22 * India: Reducing Poverty, Accelerating Development
The sections that follow deal with these issues in alleviating poverty. Average educational attainment has
detail. First, both the health and education sectors are improved in India; however, India still lags behindexamined in terms of their outcomes. Then the infra- comparator countries in average educational attainment,structure, human and financial resources, and institu- particularly among the poor. Studies of education con-tional issues that are common to both sectors are sistently suggest large benefits from achieving a criticaldescribed. The chapter ends with ideas on how the minimum level of education across the population.problems identified can be overcome so that the This indicates that mass expansion of primary educa-government's commitment to effective health and tion to raise India's currently low educational partici-education services for everyone, especially for the pation levels (averaging about 2 years) to 4-5 years ofpoor, can be fulfilled. The main proposals are: primary education per worker would have high eco-
* spend more effectively on elementary education nomic and social pay-offs. The pay-offs would be par-and basic health systems, with better targeting at the ticularly high for the poor, less than 20 per cent ofpoor, and with more public funding to address the whom currently complete all eight primary grades.poor,fanid withda; more public fundingtoaddressthe A major indication of India's recent progress in edu-
cation is the significant rise in literacy rates within the. focus public education and health services on last decade. From 1991 to 1997 the overall literacy rate
meeting consumer needs; increased from 52 per cent to 64 per cent, rising from* realign the role of the state to focus on primary 64 per cent to 73 per cent for males, and from 39
education and health and make efforts to upgrade per cent to 50 per cent for females, according to theprivate education and health services and to use them NSS. Progress is still slow but the number of illiterateseffectively; (aged 7 and above), which had actually risen from 1981
* focus on meeting the holistic needs of children. to 1991, appears to have begun to decline in the 1990s(see Fig. 2.1). Among the states, some of the poorest,for example Uttar Pradesh, Bihar, and Rajasthan, reg-
Education and Health Outcomes In India istered significant improvements in literacy albeit from
Edu cation low bases (see Annex Table 2.1). In most of these states,female literacy rose even faster than overall literacy.
In India, as elsewhere, greater coverage and more effec- Although India has raised literacy rates, it still hastive elementary education in grades 1-8 would be the a long way to go. Many countries, including China andeducation sector's most significant contribution towards Indonesia, have overtaken India in literacy rates. For
450 Number of illiterates 70
400 Literacy rate60
35050
300
19250 1955 1960 1965 t970 1975 1980 1985 1990 1995 2 4000
250 2.1: Literacy in India, 1951-97200 30
15020
100
10
50
1950 1955 1960 1965 1970 1975 1980 1985 1990 1995 2000
FIG. 2.1: Literacy in India, 1951-97
Improving Health and Education for the Poor * 23
example, in the 1950s China had problems of illiteracy births. India no longer faces famines and severe epidem-that were similar to India's at the time. Today China ics which kept life expectancy barely over 30 years athas virtually eliminated illiteracy in the younger age Independence. On the demographic front, conditionsgroups (Dreze and Loh 1995). Indonesia has achieved prevailing at the time when the national family plan-85 per cent literacy, with a female literacy rate of 80 ning programme was launched in 1951, have radicallyper cent. If India's literacy rate continues to grow at changed. By 1992, fertility had declined to 3.6 birthsthe current rate of 2.75 per cent per annum, it will per woman compared to 6.0 about four decades ago.still take sixteen years before India catches up with There have also been some remarkable successes relatedSri Lanka's current literacy rate of 90 per cent, and to specific diseases in recent years. The number ofeven then about 120 million persons will still be leprosy cases has fallen from 1.7 million in 1992 to 0.5illiterate! million in 1999, and polio has nearly been eliminated.
Gross enrolment ratios have also improved, reach- Despite these improvements, India's health outcomesing 90 per cent at the primary stage, with girls' remain significantly below those of the East Asianenrolment reported to be 73 per cent (NCERT 1998). 'miracle' economies, even after their recent crisis; andIt is worth noting that this figure is significantly lower below many African countries (see Annex Table 4.1).than the figures reported by the Ministry of Education, Nutrition is a particular problem area; India has awhich are based on enrolment figures submitted by high percentage of malnutrition and some segments ofthe districts and which are the basis for comparing the population have among the highest levels of mal-achievements with plan targets and providing budget- nutrition in the world. Weaning children and womenary support-another example of inconsistencies are particularly affected. There have been only modestin Indian data that complicate policy making. Despite declines in the levels of severe and moderate malnutri-the improvement, 33 million children in the 6-11 age- tion in children in the last twenty years, so that overgroup are still out of school. The NSS also suggests half (53 per cent) of the children below 4 years continuethat 7.8 per cent girls and 6.9 per cent boys in the 6-11 to be moderately or severely malnourished (Indianage-group are in the workforce, mostly in rural areas Institute of Population Sciences). Only Bangladesh has(GOI 1997d). higher levels. Micronutrient deficiency is also wide-
Children of poor families are less likely to be spread. For example, a nationwide survey found thatenroled in school, which is a major factor behind the 87 per cent of pregnant women are anaemic, largely duelow enrolment rates. The poverty gap in enrolment is to iron deficiency (Indian Council of Medical Re-large; the enrolment rate is 25 percentage points lower search). The economic losses due to malnutrition arefor the poorest households (annual per capita income estimated to cost India at least $ 10 billion every yearof less than Rs 3000) than for the richest households (World Bank 1998d).(with annual per capita income of Rs 10,000 and The poor suffer particularly from health problems.above). And the drop-out rate for the poorest house- For example, in 1992-3, compared to the richest 20holds is about four times that of the richest ones. A per cent of Indians, the poorest quintile had about 2.5major deterrent to school enrolment among the poor times the infant mortality and under 5 mortality rates,is its high cost. Parents need to spend about Rs 318 per double the fertility rate, and nearly 75 per cent higheryear per child, besides the opportunity cost to the rates of child malnutrition (World Bank 1999d).family that rises with the child's age (PROBE Team The reduction in infant mortality seems to have1999). The few empirical studies of learning achieve- slowed during the 1990s (see Fig. 2.2). Infant mortalityment also suggest that primary-level learning achieve- is a gross indicator responding to many underlyingment is low, and that it varies from state to state causes, and therefore the explanation is not straightfor-and with the background of the child. Low-income ward. One possible explanation is the slowdown inchildren in the north and east are particularly worse poverty reduction (see Chapter 1); another is theoff (for example see Filmer and Prichett 1998). impact of the stubbornly high levels of disease and
malnutrition, and poor sanitation and water supply,
Health Outcomes particularly in the poorer states.In 1997, infant mortality rates were as high as 96 per
These have also improved but have a long way to go, 1000 live births in Orissa, 94 per 1000 live births inparticularly among the poor. Between 1970 and 1993, Madhya Pradesh, and 85 per 1000 live births in Uttarlife expectancy at birth increased from 50 to 61 years, Pradesh and Rajasthan (GOI 1998d). At the other endinfant mortality decreased from 137 to 74 per 1000 live of the spectrum, Kerala had a remarkably low rate of

24 * India: Reducing Poverty, Accelerating Development
120 status of the infant, but is also affected by the total,
110 synergistic impact of health and nutritional factors andthe quality of social interactions and stimulation re-
100 ceived from the environment. Children who experi-ence early growth failure are more likely to delay
90 enrolment in school. Protein energy malnutrition,
80 temporary hunger, and micronutrient deprivation ad-versely affect learning achievement. Undernutrition is
70 also found to have a greater impact on poor children'scognitive development than on development of chil-
60 ' ' ,, dren who are not poor (World Bank 1998b). Infants00 00 00 0 00 0S 0
01 o o O > > > ogrowing up in poverty, and particularly in environ-ments lacking in stimulation, therefore face problems
FIG. 2.2: Infant Mortality Rates in India of stunted physical and mental development which
Source: GOI, Registrar General 1998. set the stage for poor educational and developmental
outcomes such as low academic achievement, high
12 deaths per 1000 live births, followed by Maharashtra drop-out rate, functional illiteracy, and overall lack of
(47), Punjab (51), and Tamil Nadu and Karnataka (53) productivity in the workforce Early childhood devel-
The gaps between states are increasing, as better-off opment programmes have proved to be effective instates such as Maharashtra, Karnataka, and West Bengal compensating for these critical deficiencies (Kaul et al.
have shown the most rapid declines in infant mortality 1993). Although India has one of the largest Centrally
in the 1990s (see Annex Table 2.1). There are also large sponsored integrated child development programmes,
differences between districts within states, with the which has been in operation since 1975, its limited
worst-off districts found in states with the poorest impact on child development indicators remains a
overall mortality rates. Urban areas consistently have cause of concern.
better health outcomes than rural areas, although thesefigures probably do not fully reflect the situation of the Characteristics of Education andurban and peri-urban slums where in-out migration is Health Serviceshigh and settlements have not been legalized.
India's health programmes need to improve their India's social services are facing major challenges. A
services for females. One indicator of the problem is growing population, industrialization, and a globalizing
that India's ratio of females to males is below one- 9 2 7 economy that places a premium on information and
females to 1000 males. In the rest of the world outside technology, are stretching the capacity of India's edu-
Asia, the biological advantage of females results in a cation system to deliver relevant and effective services.
higher proportion of females to males. This gender Yet enormous tasks remain: getting 33 million children
disparity suggests a need to make India's health care, from poor families into primary schools, increasing
nutrition, and social rights of women more equitable. the retention rate so that more children finish primary
The largest gender disparities are found in the northern grades, and upgrading the average quality of the school-
states, notably Haryana and Punjab, despite their being ing received (see the discussion in World Bank 1997c).
two of the most prosperous states. Among Indian In health, the country is undergoing an epidemiological
states, only Kerala has a female to male ratio above one. transition. There continue to be high rates of commu-
The relative neglect of women's health is also reflected nicable diseases, malnutrition, and maternal and
in poor reproductive health indicators: maternal mor- perinatal illnesses, representing a large unfinished agenda
tality is estimated at over 430 deaths per 100,000 live that predominantly affects the poor. There are also
births in India, compared to an average of 350 among growing rates of non-communicable diseases, while
low- and middle-income countries. rapid urbanization is resulting in new health problems.
Health and education outcomes are related. In the New diseases, notably AIDS, are placing greater strains
context of infant growth and infant and maternal on society and the health of the poor in particular.
malnutrition, research has demonstrated that the early Even though the social sectors are changing dramati-
years of a child's life are critical for cognitive and cally, the role played by the public sector has changed
psycho-social development (Young 1996). Child devel- little. In this section, the major challenges for health
opment is determined not only by the nutritional and education services are outlined according to issues

Improving Health and Educationfor the Poor * 25
of public infrastructure, workforce, financing, institu- Some states (for example Tamil Nadu) are reorganizingtional issues, public-private partnerships, and the im- pharmaceutical supply systems to improve access,plications of these issues for the poor. Each of these can safety, costs, and rational use of drugs. Under the
build on recent positive developments in both educa- leadership of the Ministry of Health and Familytion and health. Welfare, the issue of health communications, which
Elementary education in India has seen two positive have long been fragmentary and stressing awareness-developments in the past decade. First, elementary raising over changing behaviours, is being addressededucation has been brought to the fore as a priority more strategically. Decentralization efforts are improv-issue, starting with the Jomtien Conference on Educa- ing the accountability of public sector health services
tion for All (1990). Elementary education has begun in some states (for example Kerala and West Bengal),
to get an unprecedented amount of attention and and other states are focusing on improving services to
importance both in terms of political and public under-served tribal areas (for example Orissa, Madhyadiscourse. Second, with a series of externally funded Pradesh, and Maharashtra). Governments are begin-
and Centrally sponsored projects including the District ning to recognize the existence of the private sectorPrimary Education Programme (see Box 2.1), it has (such as in Andhra Pradesh, Karnataka, Maharashtra,seen a great deal of innovation and experimentation and Rajasthan) and are collaborating with it more
aimed at qualitative improvement of the services of- effectively in, for example, contracting services, sharing
fered by the system including partnerships with some information, and developing standards for quality.ncn-governmental organizations (NGOs). Some spe-cific examples are the decentralization and empower- Institutional Arrangements and Issuesment of local government (for example Madhya Pradesh, I.n the Public SectorAndhra Pradesh, Rajasthan, and Uttar Pradesh), guar-anteed provision of education in response to local Education and health are joint responsibilities ofdemand in currently unserved or underserved areas (for the central and state governments, with funds providedexample Madhya Pradesh), use of local para-teachers by both levels of government (see below) and delivery(for example Rajasthan, Madhya Pradesh, and Andhra of services largely a state responsibility. In education,Pradesh), incentive schemes for underprivileged groups the system is changing dramatically as Panchayati Rajand the Non-formal Education Scheme, and pedagogi- institutions at district, sub-district, and village levels arecal and management innovations under the District beginning to functiol within the framework of the 73rd
Primary Education Programme. Although such ex- and 74 th Constitutional Amendments (see Chapters 3
amples of successful practices have been documented, and 4). This devolution of responsibility is expected tothe larger system continues to raise challenges and improve education by generating more communityconcerns related to quality and management. support, more school-level responsibility for effective
Box 2.1INDIA'S DISTRICT PRIMARY EDUCATION PROGRAMME
The District Primary Education Programme (DPEP) has been designed to enhance government effortsto provide basic education to all children in the age group 6 to 11 years with a focus on girls, marginalizedcommunities (Scheduled Castes and Scheduled Tribes), children with disabilities and working children.The Programme supports interventions for (i) expanding access to primary school or its equivalent forall children, (ii) increasing retention and improving student learning achievement levels, and (iii)enhancing the capacity of district and sub-district, state, and national institutions for effectivemanagement of primary education.
The Programme covers at present 149 districts (including the Uttar Pradesh Basic Education Projects)in fourteen major states of India. Initial reviews of the Programme indicate a significant reduction ingender disparity in enrolment. Also the rate of enrolment is higher in project districts as compared tonon-project districts.
There have also been a number of positive develop- instruction, and a decentralized resource support. But
ments in health. New technical paradigms are being it is also likely to lead to increased uncertainty as statesintroduced for the control of leprosy, cataract blind- decide on what responsibilities will be transferred to
ness, malaria, tuberculosis, and reproductive health, these institutions. The shifts in responsibility need to

26 * India. Reducing Poverty, Accelerating Development
be accompanied by planning and training to ensure Public Sector Financing of Health andeffective financing and management at the decentralized Education are Low by International Standardslevels. Alternatives like using para-teachers instead ofregular teachers or small alternative schools with local In education, Central and state government expendi-community involvement need careful evaluation. At tures in 1996-7 were equal to 4.0 per cent of GDP forthe same time, care will be needed to ensure that decen- all levels of education, or 13.4 per cent of totaltralization is not stifled by new regulations. Effective government revenue expenditures, which is somewhatuse of the media to educate the community on their below the average of 17.5 per cent for all low-incomerights and responsibilities emerges as a priority. countries (UNDP 1993). In the 1999-2000 budget, the
In health, the existing fiscal and administrative central government's plan expenditures on educationset-up is complex, hindering effective financing are 6.6 per cent of its total plan expenditures and itsand accountability for decentralized management of overall expenditure on education is 2.5 per cent of itshealth facilities and deterring effective coordination overall expenditures. While the central government'sacross the health, population, and nutrition sectors. share is a relatively small part of overall governmentThe Centre-state financial transfer mechanism and spending in education (14.6 per cent in 1996-7), mostthe three separate structures for the Health, Family of the expenditures are used to create and sustain newWelfare, and Women and Child Development Depart- programmes, giving the central government a greaterments are ineffective in providing essential inputs, influence over the system's evolution than its expen-correcting inequities between states, strengthening diture share might suggest. State expenditures, as adecentralized management, and monitoring programme share of gross state domestic product (GSDP), areperformance. Greater field-level coordination and inte- somewhat below peak levels and vary considerablygration of nutrition services with health and family across states. For example, in 1995-6, state educationwelfare is important to improve the health status of the spending ranged from 3-7 per cent of GSDP in themother and child. Strengthening sanitation and water major states and 16-29 per cent as a share of total statesupply interventions will also be critical. expenditure.
Public education and health involve enormous infra- In the distribution of general government expendi-structure and bureaucracies, and are thinly spread across ture among educational levels, elementary educationthe country. Day-to-day management of services of (which most benefits the poor) receives, per student,this size, not to speak of training and upgrading, is a a much smaller level of funding and subsidy comparedmajor task, even at the state level. Schools and health to secondary and tertiary education (NIPFP 1997, GOIfacilities are often in disrepair, poorly equipped (schools 1997b). The funds going to elementary educationoften lack water and sanitary facilities) and under- have been roughly constant at 1.5-1.6 per cent of GDP.supplied, reflecting poor use and low levels of health The composition of expenditures in elementary educa-and education spending (see below) and their bias tion is, however, unbalanced. Recent studies indicatetoward salaries and new construction rather than that salaries account for roughly 97 per cent of educa-maintenance (see Chapter 5). Absenteeism of teachers, tion department expenditures in lower primary school-doctors, and medical staff is common, particularly in ing and 96 per cent in upper primary schooling whilerural areas. Partly due to these conditions, the middle only 0.2 per cent of GDP is spent on the otherand lower level health facilities are often underutilized components.and actual school attendance is low, while the quality The need to broaden the coverage of elementaryof health services and education suffers. At the same education among the poor and improve its quality,time, tertiary hospitals are overcrowded and the num- including the targeted goal of universalizing it, meansbers of classrooms and teachers have not kept pace with that more funding is needed. In the past few yearsthe growth of school-age population-it is estimated the Central and state governments have indicatedthat 1 million (40 per cent) more classrooms and 0.6 their intent to increase public spending on educationmillion (33 per cent) more teachers would be needed to 6 per cent of GDP during the Ninth Plan. It is likelyto enrol the entire 6-10 age group. Currently there is that the states will have to provide most of thisan average of 49 students per teacher in India (59 per funding. Given the importance of elementary educa-teacher in Bihar and Uttar Pradesh); this is much higher tion in reducing poverty and the states' current fiscalthan, for example, Indonesia which, in 1993, had 21 problems, they will need to reduce implicit andstudents per teacher spread fairly evenly across the explicit subsidies and find new revenues (see Chapterprovinces (World Bank 1996b). 3). The Central government will also need to expand

Improving Health and Educationfor the Poor * 27
its role in elementary education in view of the low level to reduce disparities in resources among states, andof resources that many state governments devote to even within states, these mechanisms, as currentlyprimary education and the large number of children not operated, have not overcome interstate inequities, andenroled in schools. There is also a need to build, in states in some cases have even exacerbated them.and districts, the capacity to plan and manage educationmore effectively and the need for research to identify Te Private Sector's Role inmore cost-effective strategies. These options for central educati and Healthand state governments will have to be considered in Education and Healththe broader context of administrative decentralization In education, total private spending (excluding overseasand changing centre-state fiscal relationships. education) is estimated at about one-third of total
In health, India's public spending is very low: an education expenditure. Private spending on elementaryestimated 1.2 per cent of its GDP. This figure places education generally takes one of three forms: (a)India among the lowest quintile of countries and, to schools which cater to lower-income groups, chargeprovide basic services on a per capita basis, is far less very low fees, and provide students with little morethan the amount recommended by the World Develop- than basic literacy-such schools are generally notment Report 1993. In terms of maternal and child care, recognized or aided by local governments; (b) schoolsIndia's spending per capita is one-third less than the that cater to middle-income groups, charge higherrecommended amount. Public spending on preventive fees, and are aided; and (c) elite schools that charge veryand promotive primary care services has not kept up high fees and cater to an exclusive minority of thewith the growth of demand for services, particularly upper middle class and above. Private spending onfor people below the poverty line. India also lags in elementary education is expanding rapidly becauseaddressing the determinants of good health that lie of (a) the inability of the public system to deliver andoutside the health system, such as in water and sani- (b) parental ability to pay. In Uttar Pradesh, 36 per centtation, nutrition, and education. For example, at 0.5 of school-going children were enroled in private schools.per cent of GNP, India spends far less on nutrition In other northern states, the proportion ranges fromprogrammes than what is needed to reduce the high 5 per cent to 11 per cent. The recent PROBE studyrates of malnutrition. indicated that even poor families and disadvantaged
The states cover close to three-fourths of public communities are making great sacrifices to send chil-funding for the health sector (excluding central grants dren to private schools, with one-fifth coming fromto states). They mainly finance primary health-care families involved in casual labour and one-half fromfacilities, hospitals, and aspects of disease control Scheduled Caste or Backward Caste groups. Parents seeprogrammes. Central spending emphasizes family private schooling as being more accountable and dem-welfare, nutrition, and disease control programmes. onstrating higher levels of teaching activity, particu-Capital investment is shared equally by the centre and larly in terms of instruction in English.states. Within the health sector, resource allocation in Although private spending is being encouraged bythe public sector has also been skewed in the past in the central and state governments to complement theirfavour of tertiary care services relative to the needs at own efforts, private schools are unlikely to improveprimary and secondary levels, but again in a few states the education of the poor directly, because thev remainthere have been some improvements in this area. Much outside the reach of the vast majority of the poor.of health spending is absorbed by salary costs, and the Other public/private issues are the absence of adequaterecurrent budgets for operations and maintenance are information and regulations on private school qualitychronically underfunded. (PROBE Team 1999), the possible shift of the more
Despite the states' deteriorating fiscal situation, articulate/education-oriented parents to private schoolssome states have managed to increase the resources for leaving less pressure on the public system, and thehealth and have initiated systemic changes (for example possible divisive pattern of differences in schooling.Andhra Pradesh, Karnataka, and West Bengal). How- These issues are, of course, classic ones in the public/ever, much the same recommendations apply to health private school debate. Another aspect is the possibilityspending as education. In general, public sector health of greater reliance on public finance/private provisionspending is significantly lower in the poorer states, of services as discussed in the next section.where health outcomes are also poorer. Although the Although India's public spending on health is low,mechanisms used by the central government to fund overall health spending is high because of privatehealth programmes at the state level have the potential spending. Private spending on health (including out-of-

28 * India: Reducing Poverty, Accelerating Development
pocket expenditures at public facilities) is four times direct cost of education even in public schools andpublic spending, that is about 80 per cent of health even ignoring opportunity cost, is nearly prohibitivespending in India, which is one of the highest propor- for a poor family. For example, in Bihar, the statetions of private expenditure on health in the world with the lowest per capita household expenditure on(World Bank 1997d). As a result, India's overall expen- education, the percentage of total household expendi-diture on health is about 6 per cent of GDP, among ture incurred on elementary education is 7.3 per centthe highest in the region. There are large interstate for the lowest income group (less than Rs 3000 pervariations in private financing and provision. For annum). In Kerala, which has the highest householdexample the lowest proportion of private hospital care education expenditure, the figure is 21.4 per centare in rural Orissa and West Bengal (9 per cent and 18 (NCAER 1994). Of course, these costs are a lowerper cent of hospitalizations respectively), compared to fraction of higher income groups' spending. Disaggre-over 75 per cent in rural Andhra Pradesh and Bihar gation of education expenditure into components re-(GOI 1998d). veals that school uniforms, books, and stationery
Despite the high levels of spending on health, absorb a major part of the total expenditure. In somereflecting high private spending, India's health indica- states like Assam and West Bengal, private coachingtors are relatively poor. For the poor in India, health and transport also substantially contribute to theindicators are particularly dire. The private health expenditure. Thus elementary education becomes asector as currently organized is unlikely to improve the major financial burden, particularly for poor house-health and nutritional status of the poor substantially. holds with several children of school-going age. Ac-Private spending and delivery neglect 'public goods' or cording to the National Family Health Survey (NFHS)inequality-reducing characteristics of key preventive data (1993-4) the probability of children in an Indianand promotive health services such as immunization, village being in school increases by 11 per cent if theyantenatal care, infectious disease control, and hospital belong to the second rather than poorest quintile, andcare for the poor, as well as services in poor areas. The increases with each level of household wealth (Lanjouwprivate sector remains virtually unregulated and has a and Ravallion 1998). Similarly, school attendance iswidely variable quality of care. The private sector lowest in the poorest quintiles compared to the wealthi-includes highly trained allopathic specialists and ser- est quintile in all states, with the largest gaps betweenvices, and a significant number of practitioners of rich and poor found in Bihar, Punjab, and Rajasthan,Indian systems of medicine. Yet the largest group of and the lowest in Kerala and the north-eastern stateshealth practitioners are completely unqualified. De- (Filmer and Prichett 1998).spite a significant not-for-profit presence, much of the The availability of a school increases enrolmentprivate sector is dominated by profit motives, often levels but only by about 4 per cent. The mere presenceresulting in overmedication, inappropriate use of tech- of a school in a village does not guarantee qualitynology, and overcharging of patients. These problems education. Poor parents are more likely to withdraware particularly great for the poor, who lack informa- their children from school (rather than transfer themtion on the quality of care and have a hard time paying to other schools) in situations where teachers are oftenfor private care. On the other hand, as in education, absent or the quality of teaching poor. Also research inthe failings of the public sector health services are low-literacy districts in eight states demonstrates thatleading to rising demand for private services (see GOI schools catering to a larger concentration of disadvan-1999g). The public sector has an important role to plav taged and Scheduled Tribe students have much poorerin enhancing the effectiveness of and access to indi- facilities (such as pukka buildings, furniture and equip-vidual health services, and in developing and imple- ment, and instructional aids (World Bank 1997c) andmenting comprehensive policies addressing private fewer number of teachers compared to other schools.financing and delivery. Empirical estimates of community-specific effects show
that both village and district averages of parents' edu-cation and wealth are important determinants of school
A Similar Story in Health and Education attendance and achievements. Improving the quality ofServices for the Poor education is, therefore, not just a requirement for chil-
dren already in school but a powerful lever for increas-The poor are often not reaping benefits from public ing enrolments of the poor.health and education services and education and Health care also absorbs a significant portion of poorhealth costs are enormous burdens for the poor. The families' incomes but often the spending and the public

Improvinzg Health and Education for the Poor * 29
health services do not yield much benefit. On an official commitment expressed in resource allocations,average, households spend 5-7 per cent of their income parental demand that their children be educated, andon health, though rural households below the poverty civic cooperation in supporting schools (see Box 2.2).line spend 12-19 per cent of their income on health In addition, policies and strategies for developing(NCAER 1996). The poor also benefit less from health primary education need to respond to the local envi-services. Compared to the richest 20 per cent of ronment; they must be founded on a vision forIndians, the poorest quintile was half as likely to use effective and appropriate education; and they need tomodern contraception; less than a third as likely to target the most disadvantaged groups.have antenatal care during pregnancy, and a sixth as Even if there is political will and resources tolikely to have a delivery by a medically trained health support primary education, evidence suggests thatworker; poor children were a third as likely to be improvements in education must emerge from theimmunized for measles, and more than 25 per cent less community and at the school level. They cannot belikely to go to a health facility in the event of diarrhoea fully defined or directed from the state or nationalor acute respiratory infection (World Bank 1999d). The level. Current schemes-the Education Guaranteelarge number of private unqualified practitioners, mostly Scheme in Madhya Pradesh, Lok Jumbish and Shikshafound in rural areas and urban slums, are mainly Karmi in Rajasthan, the District Primary Educationconsulted by the poor. In this situation, health gaps Programme (see Box 2.1)-provide excellent examplesbetween rich and poor are likely to increase. of how cost-saving programmes like these can be
The goal of reducing poverty in India will remain organized. The current movement towards assigningelusive as long as the poor have low utilization of responsibility for elementary education to Panchayatipreventive and curative health services (immuniza- Raj institutions provides a medium for adapting thesetions, antenatal care, institutional deliveries, treatment schemes to fit the larger systemic need, if planning andfor diarrhoea and respiratory illnesses), poor hygienic management are well executed.conditions, low school enrolment and attendance, and Furthermore, successful programmes are marked bypoorer quality schools and health services. These a clearly articulated vision of a well-functioning school,problems are occurring despite the long-standing rec- which incorporates expectations about children's learn-ognition that health and education services are a public ing and the anticipated role of teachers. The visionresponsibility, as enshrined in the Indian Constitution. needs to be clear enough to allow parents and commu-
The rapid expansion of the private sector in health nities to define the objectives while remaining flexibleand education is partly a result of the public sector's enough for them to pursue local needs. The Rishiproblems in providing quality services. The consider- Valley Centre and Eklavya provide examples of suc-able spending by the poor on private services demon- cessful programmes.strates their demand for health and education. But Finally, the resources that are applied to improvingprivate sector activities in these areas are not effective primary education need to be targeted at thosein providing public goods, and are beyond the scope groups in the population that are most in need ofof many of the poor. Moreover, (a) the poor are often support. This means that programme designs need toill-informed and have low expectations from service include special provisions for girls, Scheduled Tribes,providers, (b) they have little or no recourse for poor Schedulcd Castes, childrcn with disabilities, and work-quality services, because of low accountability, and (c) ing children, and have an effective component ofthe public sector has not implemented appropriate early childhood development. These provisions needpolicies to deal with the private sector, particularly in to be followed through locally with planning andterms of providing information, licensing, and regula- implementation processes that facilitate appropriatetion to protect and empower consumers, especially low lending. Many programmes already do this, and theirincome ones. experience can be built on. Also, in six of the largest
states-Andhra Pradesh, Bihar, Madhya Pradesh,
Solutions being Found in Rajasthan, Uttar Pradesh, and West Bengal-morethan half the school-age children do not attend school.
Education and Health To redress this, these states, some of which are the
Education Sector Solutions poorest (see Chapter 3), will need to use more thanhalf of all incremental spending on education. TheHimachal Pradesh (HP) has demonstrated the key central government has an important role to play inmeasures required for improving primary education: seeing that its resources respond to these differential
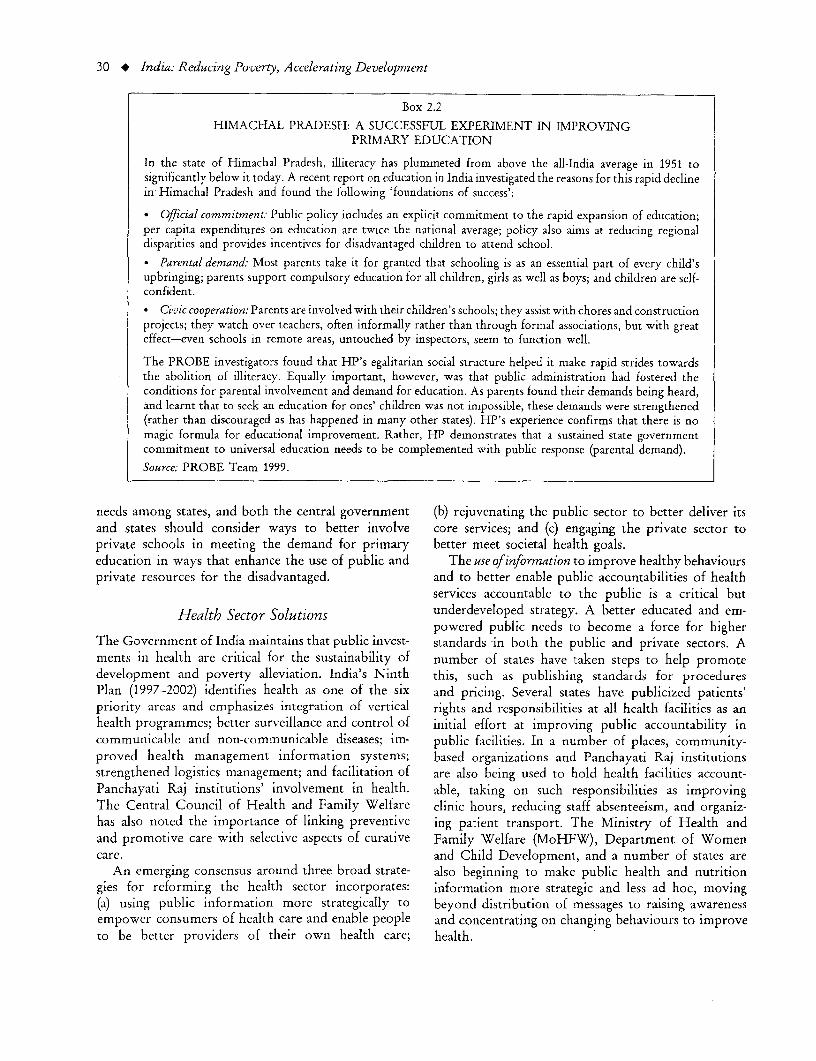
30 * India: Reducing Poverty, Accelerating Development
Box 2.2
HIMACHAL PRADESH: A SUCCESSFUL EXPERIMENT IN IMPROVINGPRIMARY EDUCATION
In the state of Himachal Pradesh, illiteracy has plummeted from above the all-India average in 1951 tosignificantly below it today. A recent report on education in India investigated the reasons for this rapid declinein Himachal Pradesh and found the following 'foundations of success':
* Official commitment: Public policy includes an explicit commitment to the rapid expansion of education;per capita expenditures on education are twice the national average; policy also aims at reducing regionaldisparities and provides incentives for disadvantaged children to attend school.
* Parental demand: Most parents take it for granted that schooling is as an essential part of every child'supbringing; parents support compulsory education for all children, girls as well as boys; and children are self-confident.
* Civic cooperation: Parents are involved with their children's schools; they assist with chores and constructionprojects; they watch over teachers, often informally rather than through formal associations, but with greateffect-even schools in remote areas, untouched by inspectors, seem to function well.
The PROBE investigators found that HP's egalitarian social structure helped it make rapid strides towardsthe abolition of illiteracy. Equally important, however, was that public administration had fostered theconditions for parental involvement and demand for education. As parents found their demands being heard,and learnt that to seek an education for ones' children was not impossible, these demands were strengthened(rather than discouraged as has happened in many other states). HP's experience confirms that there is nomagic formula for educational improvement. Rather, HP demonstrates that a sustained state governmentcommitment to universal education needs to be complemented with public response (parental demand).Source: PROBE Team 1999.
needs among states, and both the central government (b) rejuvenating the public sector to better deliver itsand states should consider ways to better involve core services; and (c) engaging the private sector toprivate schools in meeting the demand for primary better meet societal health goals.education in ways that enhance the use of public and The use ofinformation to improve healthy behavioursprivate resources for the disadvantaged. and to better enable public accountabilities of health
services accountable to the public is a critical but
Health Sector Solutions underdeveloped strategy. A better educated and em-powered public needs to become a force for higher
The Government of India maintains that public invest- standards in both the public and private sectors. Aments in health are critical for the sustainability of number of states have taken steps to help promotedevelopment and poverty alleviation. India's Ninth this, such as publishing standards for proceduresPlan (1997-2002) identifies health as one of the six and pricing. Several states have publicized patients'priority areas and emphasizes integration of vertical rights and responsibilities at all health facilities as anhealth programmes; better surveillance and control of initial effort at improving public accountability incommunicable and non-communicable diseases; im- public facilities. In a number of places, community-proved health management information systems; based organizations and Panchayati Raj institutionsstrengthened logistics management; and facilitation of are also being used to hold health facilities account-Panchayati Raj institutions' involvement in health. able, taking on such responsibilities as improvingThe Central Council of Health and Family Welfare clinic hours, reducing staff absenteeism, and organiz-has also noted the importance of linking preventive ing patient transport. The Ministry of Health andand promotive care with selective aspects of curative Family Welfare (MoHFW), Department of Womencare. and Child Development, and a number of states are
An emerging consensus around three broad strate- also beginning to make public health and nutritiongies for reforming the health sector incorporates: information more strategic and less ad hoc, moving(a) using public information more strategically to beyond distribution of messages to raising awarenessempower consumers of health care and enable people and concentrating on changing behaviours to improveto be better providers of their own health care; health.

Improving Health and Educationfor the Poor * 31
The public sector needs to find ways to focus on expensive and relatively ineffective technologies, whilebetter delivering the core functions of government and facilitating the use of new effective approaches. Ex-developing a culture of performance. Core functions amples of areas where technical shifts are being pursuedinclude not only improvements in public service pro- include new therapeutic approaches in leprosy andvision, but also in oversight of the health sector to tuberculosis control, broadening the interventions usedprotect the public interest. The functions of policy in malaria control, and integrating management ofdevelopment, information dissemination, regulation, childhood illnesses.mandating, and financing are underdeveloped. Public There are also specific steps which could directlysector health managers and workers need different reduce the scourge of malnutrition and poor healthtypes of training, supervision support, and incentives, of small children. These include: (i) refocusing thewhich are focused on achieving results and solving Integrated Child Development Services Programme onproblems. Building leadership skills and management 0-24 month-old children, concentrating on improvingsystems is vital, as is breaking down the structural the quality of services provided rather than expansionbarriers if the public sector is to function more to additional community development blocks;accountably and efficiently. Better management infor- (ii) improving targeting and monitoring of the PDS andmation, and greater testing and experimentation will be National Mid-Day Meals Programme; (iii) strengthen-needed for the government to take the lead in antici- ing health worker skills relating to nutrition; and (iv)pating and dealing with the health transition that India rebuilding India's institutional capacity to developis undergoing, and to deliver much better services to policy and undertake training, research, and advocacy.the poor. An effort to make early childhood development inter-
Some of the specific steps that could be taken ventions more effective would need to focus on inte-include: (i) reviewing the fiscal structures and proce- grating psycho-social stimulation with the reduction ofdures in the health sector, including the roles of central, malnutrition and illness in a coherent manner.state, and Panchayati Raj institutions' financing in the The private sector can no longer be ignored, but insteadprovision of basic inputs; (ii) developing budgeting needs to be engaged as an agent to meet the basic societaland management tools at facilities, district, state, and goal of good health, particularly for the poor. This can,central levels to better plan, utilize, and monitor and is starting to, happen in a variety of ways, fromresources against the progress of important health contracting private services for various uses, to trainingoutcomes; (iii) developing fiscal tools to enable greater non-governmental organizations and other private pro-experimentation with resource allocation, alternative viders to deliver public programmes, to initiatingfinancing mechanisms, and with regard to choices meaningful regulation and quality assurance measures.between provision versus financing of health care What is important now is to undertake studies andservices; and (iv) finding ways to share responsibilities open a dialogue to better understand the dynamics ofand coordinate activities between the centre and states the private sector provision and financing in differentin the areas of health, family welfare, and nutrition, areas of India. Another key step is to initiate jointespecially with regard to sectoral planning, health efforts at identifying and solving problems. In somestrategy, and policy reform. Involving the states more states, private providers and government have devel-intensively and collaboratively will help solidify their oped forums to form a common agenda for action.commitment to the overall development policy onhealth, population, and nutrition services. Involvementof Panchayati Raj institutions would also address the A Way Forward: Delivering More anddevelopment agenda for health much more broadly by Better Education and Health to the Poorfocusing on important health outcome-related issuesthat are affected by water, sanitation, and environmen- A renewed commitment to education and health ser-tal concerns. vices is required if the poor are to reap the benefits of
In strengthening the management of health systems, better education and health. Building on ideas that arethere is urgent need to focus on improving the quality currently being tested is a good basis for the wayof services. Current plans to review and redefine forward. Moreover, there is a clear need to enhance ourprocesses for quality assurance, including the establish- understanding of the factors that would improve deliveryment and use of functional standards for the delivery of basic health and education services, particularly to theof care, are positive measures. Such processes are also poor. Continuing research in these areas would be a vitalneeded as a check on the unplanned introduction of element in an effective poverty reduction strategy. While

32 * India: Reducing Poverty, Accelerating Development
more spending is needed, the framework and incentives can facilitate this process, provided that these resourceswould need to change in order to make spending more do not become 'captured' by local elites and bureau-effective. Four steps are proposed to improve educa- cracies.tion and health services that would contribute to (c) Realign the role of the state to focus on primaryreduction in poverty in all its dimensions: education and health and water and sanitation, while
(a) Spend more effectively on elementary education and making efforts to upgrade private education and healthbasic health systems, with better targeting to the poor, and services and to use them effectively. Where the govern-wit, morepublicfundingto address the unfinishedagenda.1 ment has assumed its primary role as a provider ofMore spending in the same manner is not what is education and health services it may be more effectiveneeded. The systems for resource distribution and in increasing the quality and quantity of services, andpolitical overseeing of health and education have led in making them available to the poor, if it were alsoto technically inefficient and inequitable allocations. a more capable purchaser and regulator of these ser-Common symptoms are that funds are too thinly vices from the private sector (including non-profitanddispersed, salaries are crowding-out maintenance and for-profit sub-sectors). Experience needs to be gainedoperational costs, and capital investments are fre- in India on separating the financing and provision ofquently located in sites that are inaccessible to the poor. social services. The relatively neglected functions ofExpanding the reach and quality of elementary educa- policy development, monitoring and regulation, andtion by redirecting government subsidies away from information provision will need to be developed insecondary and tertiary education towards elementary government. In any case, public sector managementeducation would ensure that the poor receive the would need to be transformed by explicitlyfocusing onmaximum benefit from government spending on edu- improved results in reaching the poor, rather than budgetcation. administration. Effective decentralization would also
(b) Focus public education and health services on meet- require states and local governments to develop plan-ing consumer needs, which will help improve the quality ning and management capacity, in the context ofof public spending. Creative and vigorous processes broader governance and civil service reforms.are needed to generate greater demand for higher (d) Meeting holistic needs of children. India's futurequality and more accountable education and health will depend on its children where the greatest returnsservices. This would necessitate finding ways to in- on its investment still lie. In view of the interdepen-crease the involvement of communities in the plan- dent nature of health and educational needs of children,ning, monitoring, financing, and oversight of social there is need to strengthen linkages among each sector,services, for which effective examples already exist, as well as to ascertain which set of interventions willnotably through women's self-help groups. It would be most effective. Since the process of human devel-also require more strategic and professional means opment is both continuous and cumulative, priorityof communicating among governments, service will need to be given to interventions in the earliestusers, and service providers about service availability, years of life which are critical to addressing the edu-quality, and costs. Carefully planned decentralization cational and health needs of the child in a more holisticof education and health resources and accountabilities and integrated manner.
For a discussion of the need for better and more spendingin primary education, see World Bank (1997c).

3
Reducing Poverty Faster:The Role of State Fiscal and
Sectoral Reforms
Overview the exception of Tamil Nadu and Rajasthan. Thisdivergent growth pattern widened the gaps in per
States in India play a key role in devising and imple- capita income among states, despite the govern-menting policies to reduce poverty, promote human ment's efforts to achieve balanced development acrossdevelopment, and stimulate growth. In addition, states.under the Indian Constitution, they are assigned 2. Since 1991, Maharashtra, Gujarat and West Ben-significant responsibilities in major sectors such as gal in the high-income states and all but one of theagriculture, industry, infrastructure, education, middle-income states accelerated their growth, makinghealth, social welfare, and tax and expenditure policy the most of the central government's reforms becauseat the state level. Finally, the states' increasingly large of their initial leads in governance, infrastructure, andfiscal deficits mean their fiscal policy is an important human resources. As a result, the gap in per capitafactor not only in their own performance but in income has widened since 1991.India's overall fiscal sustainability (see Chapter 8). 3 Growth slowed in the poorer states andImprovement in the states' economic and fiscal Ra Groth aft e d in the poorer state, andmanagement is therefore essential for rapid poverty Rajasthan after 1991. Bihar, the poorest state, actually
reduction, faster growth, and sustainable develop- experienced a decline in per capita income. Growthreductiont. faster growth, and sustainabledevelop- also slowed in Punjab and Haryana, the richestment.
This chapter reviews developments in the states and states in 1991. These states were probably less ableThi chpte reiew deelomens i th sttesand to take advantage of the new opportunities created
suggests approaches to increase their contribution to gy the centagovernew reform s c reakpoverty reduction. The main findings are summarized by the central government reforms because of weakas follows: governance, infrastructure, and human resources, or,
in the case of Punjab and Haryana, growth was1. On an average, the higher income states grew restricted by limited reforms in agriculture and issues
faster than other states from 1980-1 to 1996-7, with of sustainability (see also Chapter 1).

34 * India: Reducing Poverty, Accelerating Development
4. The slow-growing, poor states (Bihar, Orissa, average growth rate per capita (3.9 per cent per annum)UP, and Madhya Pradesh in the 1980s) constitute about was almost twice the low-income states' (2.1 per cent);40 per cent of India's population. Unless these states the middle-income states' average growth rate perimprove their performance, it will become increasingly capita (3.2 per cent) was nearly 50 per cent higher.difficult to accelerate poverty reduction and develop- Consequently, ranking of the states by per capitament in India. The states' improvement will have to income has changed only marginally since 1980-1 (seecome primarily through their own efforts, given their Table 3.1). The only significant changes that did takemajor roles in human development, infrastructure, place occurred between 1980-1 and 1990-1. Fromand governance. The poor states have already received 1980-1 to 1990-1, Rajasthan and Tamil Nadu realizedfavourable treatment in central government transfers the highest growth rates of all, 4.7 per cent per annumand loans, and further redistribution from the centre and 4.1 per cent per annum, respectively. Rajasthanis unlikely, given their lack of performance and the invested heavily in public infrastructure. Tamil Naducentre's desire to reduce its large fiscal deficit. How- had excellent initial conditions in terms of humanever, the central government could support state re- resources and the irrigation sector where most of theforms through its own reforms to improve governance, potential investment had already been completed. Theirthe civil service, and the compensation system; to rapid growth rates moved Rajasthan up from the low-further improve intergovernmental fiscal relations; and to middle-income group (from 1 3th to 9 th in ranking)to modernize the tax and industrial incentive system. and Tamil Nadu from the middle- to high-income
5. The states will need considerable improvements group (from 8th to 5th).
in governance, institutions, and the regulatory environ- After 1991, growth differentials accentuated, withment, and in their physical and social infrastructure. In growth increasing in the high-income states of Gujarat,turn, this will entail cuts in state public sector deficits Maharashtra, and West Bengal, and in the middle-through cuts in inefficient and, in many cases, inequi- income states, except Rajasthan. At the same time,table subsidies to power, irrigation, and secondary and growth slowed in most of the low-income states, astertiary education, increases in public infrastructure well as in the two highest income states in 1990-1,and human development spending, and supporting Punjab and Haryana. The policy environment changedreforms in power, irrigation, and the regulatory frame- significantly after 1991 with the central government'swork in general, in order to encourage private invest- liberalization of the trade and investment regime.ment. These reforms and other policy changes allowed the
6. Andhra Pradesh has emerged as a leading reform- states a larger role in determining their development
ing state. It has demonstrated that, with sustained paths andattracting investment. Gujarat, Maharashtra,political commitment, states can improve their policy and most of the middle-income states were able to takeenvironment, put their economies on a higher growth greater advantage of the new conditions because of
path, and narrow the disparities.. with the higher better initial conditions, governance, infrastructure,
income states regardless of their initial conditions. and human resources, than the low-pncome states,Som of th loe-icm stts .U, Ra.sta, an Moreover, the poorest states, with the exception ofSome of the lower-income states (UP, Rajasthan, and
Orissa, failed to improve their state-level policies to
ment to reforms. Successful implementation of these offset their initial disadvantage in attracting new invest-ment~~~ treom. Sucsflipeenaino.hs ment. As a result, their gyrowth has slowed and in Bihar,reforms could substantially decrease overall poverty inm s
India. l The analysis in this chapter covers 26 states (includingDelhi), except in this section and the following one, where basedon the real per capita income (1980-1 prices), the 14 major stateshave been grouped into three categories-high-income, middle-
Oifferential Growth and Widening income states, and low-income states, accounting for, respec-
Disparities among States tively, about 30 per cent, 30 per cent, and 40 per cent of the totalpopulation of the group. The states' GDP data used for the
Balanced regional growth has always been an objective analysis is the old NAS, based on 1980-1 prices and weights. The
of successive Indian governments and is supported analysis will need to be revisited once the GDP data forindividual states is rebased to the 1993-4 prices and weights and
by redistributive transfers to the states. Nonetheless, with the additions to output in some of the sectors (see Chapteron average, the middle- and high-income states grew 8, fn. 1). However, given the changes in the National Accounts,faster than the low-income states from 1980-1 to it seems unlikely that the re-based accounts would change the
1996-7 (see Table 3.1).1 The high income states' conclusions much.

Reducing Poverty Faster * 35
TABLE 3.1Real Per Capita Income of the Fourteen Largest Indian States
(Rs 1980-1 prices)
Per capita income Growth rate (per cent )1980-1 1990-1 1991-2
1980-1 Rank 1990-1 Rank 1996-7 Rank 1990-1 1996-7 1996-7
High-income states 2385 3269 4377 3.2 6.1 3.9Punjab 3020 1 4163 1 4935 2 3.3 2.8 3.1Maharashtra 2671 2 3826 3 5358 1 3.7 7.4 4.4Haryana 2647 3 3864 2 4392 3 3.9 2.6 3.2Gujarat 2200 4 3047 4 4221 4 3.3 8.6 4.2West Bengal 1912 5 2349 6 3146 6 2.1 4.9 3.2
Middle-income states 1607 2159 2676 3.0 4.2 3.2Karnataka 1690 6 2295 7 2988 7 3.1 3.4 3.6Kerala 1690 7 2106 8 2705 8 2.2 4.9 3.0Tamil Nadu 1677 8 2514 5 3297 5 4.1 5.2 4.3Andhra Pradesh 1543 9 1997 10 2432 10 2.6 3.8 2.9Madhya Pradesh 1508 10 1951 11 2205 11 2.6 4.1 2.4
Low-income states 1308 1725 1840 2.8 1.8 2.1Uttar Pradesh 1418 11 1842 12 1997 12 2.6 1.8 2.2Orissa 1415 12 1555 13 1833 13 0.9 1.5 1.6Rajasthan 1373 13 2170 9 2533 9 4.7 3.9 4.3Bihar 1062 14 1374 14 1245 14 2.6 -0.7 1.0Average of 14 states 1715 2310 2842 3.0 4.4 3.2
Note: Using the 1980-1 based GDP seriesSource: CSO; World Bank staff estimates.
the poorest state, GDP per capita has actually declined. highest state per capita income (Punjab) was 2.8Punjab and Haryana, with their dependence on agricul- times the lowest (Bihar). This ratio increased to 4.3 inture where limited reforms occurred, also experienced 1996-7. If the trend continues, the ratio would reachslower growth. 7.5 in the next fifteen years. Table 3.2 also show, that
The widening growth differential naturally trans- dispersion has increased in all three major sectorslates into a widening dispersion of state per capita (agriculture, industry, and services), and acceleratedincomes, an unusual result compared to other coun- after 1991.tries.2 As Table 3.2 shows, dispersion of average Although the share of population below the poverty
per capita real income among the fourteen major line declined and human development indicators
states, measured by standard deviation, has increased improved in all states, progress was generally faster infrom 0.29 in 1980-1 to 0.40 in 1996-7.3 In 1980-1, the the fast-growing states, which are mostly higher-in-
come states (see Table 3.3). The standard deviation of2 Widening inequality among Indian states is in sharp contrast poverty incidence worsened slightly and the disparity
with the evidence from other federal countries. Interstate in- in health indicators (birth rate and infant mortality)equality has declined in the USA, Canada, Europe, Japan, wdened noticeably, although the disparities in liAustralia, Chima (until 1992), and at a slow pace, Indonesia. fell.In addition, inter-regional inequality is significantly higher in fell.India compared to the other large federal states, with the Some states, notably Kerala and West Bengal,exception of China. The standard deviation of per capita income had the fastest rates of poverty reduction over 1978-94was estimated at 0.28 in Indonesia (1993), 0.20 in USA(late 1980s), 0.15 in Japan (1980s), 0.25 in Italy (1990), 0.10in the UK (1990), and 0.51 in China (1992) against 0.40 in distribution derived from NSS data, because the middle-incomeIndia (1996-7). For a more detailed discussion of interstate states grew faster than the highest-income states. Also, thedisparities and a literature survey on the convergence issue, see increase in the standard deviation of per capita incomes, though
Yagci (1998). an unusual result and worrisome, is not significantly different3 As noted in Chapter 1, this result need not be inconsistent from zero. And, of course, the NSS data refer to individuals, not
with a minimal worsening of the Gini coefficient of (spending) average statewide data.

36 * India: Reducing Poverty, Accelerating Development
TABLE 3.2 (see Table 3.3), faster than several more rapidly grow-Standard Deviation of States' Per Capita Output ing states. For example, in Kerala, human resource
(Logs of output of 14 major states) development enabled Keralites to emigrate internation-State GDP Agriculture Industry Services ally and generate remittances that raised income and
t reduced poverty in ways that are not captured by1980-1 0.29 0.33 0.37 0.33 Kerala's GSDP figures. However, the large poor states
1982-3 0.30 0.38 0.36 0.34 cannot adopt this strategy very well, given their poor1983-4 0.29 0.34 0.36 0.34 levels of human development, their weak fiscal situa-1984-5 0.30 0.33 0.36 0.34 tions that limit the availability of funding for human1985-6 0.31 0.36 0.39 0.35 development, and the difficulties of substantially affect-1986-7 0.31 0.36 0.39 0.33 ing the workforce in these large states by emigration,1987-8 0.31 0.39 0.37 0.34 even to other states. In the case of West Bengal, land1988-9 0.31 0.37 0.37 0.33. .X1989-0 0.33 0.37 0.37 0.34 reforms and high agricultural growth over the period1990-1 0.33 0.38 0.37 0.35 may have been important causal factors. Further ana-1991-2 0.33 0.39 0.35 0.36 lytical work on such issues (and the linkages between1992-3 0.36 0.40 0.39 0.37 growth, poverty reduction, and governance) would help1993-4 0.36 0.39 0.40 0.40 our understanding of the determinants of growth at state1994-5 0.38 0.39 0.44 0.40 level. Also, further analysis of the performance of reforrm-1995-6 0.39 0.40 0.45 0.42 ing states such as Andhra Pradesh, Gujarat, and Madhya1996-7 0.40 0.44 0.45 0.421996______7 ___0___40____0___44____ 0___45____ 0___42__ Pradesh, focusing on the links between micro reforms andSource: RBI, using real GDP with a 1980-1 base. macro outcomes, would be useful.
TABLE 3.3State Poverty and Social Indicators and Their Standard Deviations
Population below Literacyb Female literacy Birth ratec Infant mortalitydthe poverty linea
1978 1994 Rate of 1981 1991 1997 1981 1991 1997 1981 1991 1996 1981 1991 1997change
(%)
Maharashtra 67.8 43.5 2.7 53.5 64.9 74.0 39.6 52.3 63.0 29.8 25.2 23.2 79 59 47Punjab'" 26.9 21.6 1.4 46.4 58.5 67.0 38.4 50.4 62.0 30.2 26.3 23.5 81 56 51Haryana - - - 41.7 55.9 65.0 25.8 40.7 52.0 35.9 30.9 28.8 101 75 68Gujarat 39.9 33.8 1.0 49.9 61.3 68.0 36.9 48.6 57.0 34.2 28.0 25.5 116 67 62Tamil Nadu 54.9 34.9 2.8 52.6 62.3 70.0 39.4 51.3 60.0 27.9 19.5 19.2 91 58 53West Bengal 51.8 26.0 4.2 46.3 57.7 72.0 34.4 46.6 63.0 32.0 25.7 22.8 91 65 55Karnataka 52.9 37.6 2.1 43.9 56.0 58.0 31.7 44.3 50.0 29.1 25.5 23.0 69 73 53Kerala 53.2 29.2 3.7 78.9 89.8 93.0 73.4 86.2 90.0 24.9 17.4 17.8 37 17 12Rajasthan 51.6 43.5 1.1 28.4 38.6 55.0 13.4 20.4 35.0 40.1 34.0 32.3 108 90 85Andhra Pradesh 47.0 29.4 2.9 34.1 44.1 54.0 23.3 32.7 43.0 30.8 24.3 22.7 86 71 63Madhya Pradesh 63.9 44.1 2.3 32.2 44.2 56.0 18.0 28.9 41.0 38.5 34.9 32.4 142 104 94Uttar Pradesh 46.7 40.2 0.9 31.4 41.6 56.0 16.3 25.3 41.0 38.4 36.2 34.0 150 98 85Orissa 62.1 40.3 2.7 38.8 49.1 51.0 24 34.7 38.0 34.0 27.2 26.8 135 115 96Bihar 64.8 60.4 0.4 30.3 38.5 49.0 15.8 22.9 34.0 37.2 32.0 32.1 118 73 71Standard Deviation 0.24 0.26 - 0.27 0.23 0.17 0.45 0.38 0.27 0.13 0.20 0.19 0.34 0.44 0.49* Data for population below poverty line for Punjab include Haryana.a Per cent, based on World Bank India Poverty Assessment 1997.b Per cent of population of seven years and older.c Per thousand population.d Per thousand live births.Source: MoF, Economic Survey; Ministry of Human Resources Development, Annual Report 1997-8; World Bank staff estimates.

Reducing Poverty Faster * 37
State-level Reforms to Reduce Poverty and Kerala) have helped outline key fiscal and sectorreforms in more detail. These, along with fiscal decen-
Accelerated, labour-intensive development in the tralization, are discussed below.states is needed to reduce poverty, particularly in thefour poorest states (Bihar, UP, Orissa, and MadhyaPradesh). These states constitute almost 40 per cent of Cutting the States Fiscal Deficits andthe population and have been a heavy drag on the Raising their Development Spendingefforts to reduce poverty and on national economic andsocial development. Speeding up India's development The Weakening of State's Fiscalwill depend heavily on better performance in these Performance in the 1990sstates.
The states' improved performance will depend The states marginally adjusted to the crisis of 1991,largely on their own efforts, given their major roles almost exclusively by cutting their capital and humanin human development, intra-state infrastructure, and development spending between 1990-1 and 1993-4 (seethe intra-state regulatory framework. The states al- Table 3.4 and Annex Table 8.8). This pattern ofready receive large loans and transfers from the cen- adjustment raises questions about the sustainabilitytre-Bihar and Uttar Pradesh, for example, fund only of longer run development and poverty reduction.about 35 per cent of their revenue expenditures, with The states made only limited attempts to raise revenues65 per cent coming from the centre-and it is unlikely by increasing user charges and bringing untaxed in-that large increases in support will be forthcoming comes into the tax net; indeed, Kurien suggests thatgyiven the need for overall fiscal prudence and the states engaged in competitive populism and 'tax wars'problems with many states' previous use of transfers. to lure investment. The states also allowed theirThe central government can, however, provide a non-developmental spending to continue to rise as asupportive overall framework that contributes to percentage of GSDP. One element in the rise ofsustainable rapid growth in output and labour demand, revenue spending was the rise in states' interest burdenincluding improved governance, reduced international Interest costs rose, even as the deficit declined some-trade restrictions, internal deregulation, improved in- what and states' debt stock remained roughly constant,frastructure, a sound financial system, and fiscal and because India's financial liberalization made the truemonetary prudence (see also pp. 42-4, and Chapters cost of state borrowing clearer. After 1994, even this4-8). marginal improvement in the states' deficit was re-
Accelerated development in states will depend versed, as the central government, as part of its effortson greater public and private investment to speed to control its own fiscal deficit, cut its grants to thegrowth, greater efficiency in the use of investment states and the states made minimal adjustments.and improved human development. What specific By 1997-8, the deterioration in fiscal performancestate-level reforms might bring this about? In general of states would have pushed the deficit back to theterms, efforts will be needed to improve governance 1990-1 level but for the one-time injection of Volun-and institutions, for example, strengthening transpar- tary Disclosure of income Scheme (VDIS) revenues
ency,increasing accountability in service delivery, raised by the centre (see Table 3.5). In 1998-9, states'ency, fiscaladeficiaworsenedbtoi.2 per cent,celldaboverthreducing opportunities for discretion, and improving fiscal deficit worsened to 4.2 per cent, well above theexpenditure management and tax administration. Physi- 3.2 per cent in 1990-1, and is likely to remain high incal and social infrastructure needs improvements, 1999-2000 (see Table 3.5) as the central government'swhich will entail supporting reforms in state finances, excessive wage settlement continues to cascade downpower and irrigation, and the regulatory framework in to the states (see Kurien 1999 and World Bank 1998a).general. Such reforms and development spending Moreover, the composition of state public spending haswill create an investment-friendly environment to worsened even further, with a rise in revenue expen-
attract private capital that is needed for growth (see diture and the likely slowdown in development spend-Govinda Rao etal. 1999). Recent state-level economic ing (see also Chapter 8).studies, undertaken with close cooperation between 4 In Table 3.4, VDIS revenues are not incuded in the 1997-8the state governments and the World Bank (Andhra figures (revised estimates) for state revenues. However, the actualPradesh, UP, Karnataka, Orissa, and Rajasthan) and figures, which are shown in Table 3.5, include the states' sharethe National Institute ,of Public Finance and Policy of VDIS revenues, which reduces the fiscal deficit. See World(NIPFP) (Punjab, Haryana, Assam, Delhi, Tamil Nadu, Bank (1998a) for details on VDIS.

38 * India: Reducing Poverty, Accelerating Development
TABLE 3.4Main Fiscal Trends in All States
(per cent of GDP)
1990-1 1991-2 1992-3 1993-4 1994-5 1995-6 1996-7 1997-8 (RE)
Total revenue 11.5 12.1 11.9 12.0 11.8 11.2 10.8 11.3Own revenue
Tax 5.2 5.4 5.2 5.3 5.4 5.2 5.0 5.4Non-tax 1.6 1.9 1.7 1.8 2.1 1.9 1.7 1.6
Central transfers 4.6 4.8 5.0 5.0 4.3 4.1 4.1 4.3Shared taxes 2.5 2.5 2.7 2.6 2.4 2.4 2.5 2.6Grants 2.2 2.3 2.3 2.4 1.9 1.7 1.6 1.8
Total expenditure 14.7 15.0 14.7 14.4 14.4 13.8 13.5 14.6Revenue expenditure 12.4 13.0 12.6 12.5 12.4 11.9 12 12.6
Interest payments 1.5 1.6 1.7 1.8 1.9 1.8 1.8 2.0Education 2.7 2.6 2.5 2.5 2.4 2.4 2.3 2.5Health and family welfare 0.8 0.8 0.7 0.8 0.7 0.7 0.7 0.7
Capital expenditure (net) 2.3 2.0 2.1 1.9 2.0 1.9 1.5 2.0
Revenue deficit 0.9 0.9 0.7 0.4 0.6 0.7 1.1 1.3
Fiscal deficit 3.2 2.9 2.7 2.3 2.6 2.6 2.7 3.3
Debt stock 18.7 18.6 18.4 18.3 17.8 17.4 17.2 18.2
Note: New GDPmp series is used (revised base 1993-4) and for years prior to 1993-4 rebasing is done assuming a linkingfactor. Fiscal year ending is 31 March.Source: RBI States Supplement 1998, CSO.
The issue related to reform of state finances has 5.7 per cent to 6.3 per cent. Of course, fiscal deterio-assumed immense significance as the fiscal deficit of ration was not limited to the poorer states-in Keralastate governments has reached unsustainable levels. the deficit deteriorated to 7.3 per cent and in RajasthanThe gross fiscal deficit (GFD) to GDP ratio of all to 4.6 per cent.state governments touched a high of 4.2 per cent in As a result of their deficits, most poorer states1998-9-the highest recorded in Indian fiscal history have become highly indebted; in Uttar Pradesh, theso far. The fiscal performance of individual states debt-GSDP ratio rose from 26 per cent to 31 per cent;varied widely over the 1990s, with the most marked in Bihar from 35 per cent to 42 per cent; and indeterioration coming in some of the poorer states. In Orissa from 41 per cent to 43 per cent (see Annex TableUttar Pradesh, fiscal deficit rose from 4.5 per cent of 3.1 for deficit and debt ratios of individual states).GSDP in 1993-4 to 8.6 per cent in 1997-8; in Bihar, Financing these large deficits has meant increasedfrom 4.0 per cent to 6.2 per cent; and in Orissa from borrowings and guarantees (see Table 3.5 and Box 3.1).
TABLE 3.5Financing of All States Fiscal Deficit
(per cent of GDP)
1990-1 1994-5 1995-6 1996-7 1997-8 1998-9 (RE) 1999-2000 (BE)
Fiscal deficit 3.2 2.6 2.5 2.7 2.9 4.2 4.0
FinancingLoans from Centre 1.7 1.3 1.1 1.2 1.5 1.8 1.9Market term loans 0.5 0.4 0.5 0.5 0.5 0.6 0.5Others (PFs, reserves, and deposits) 1.0 0.9 0.9 1.0 0.8 1.8 1.6
Memo:Revenue deficit 0.8 0.6 0.6 1.1 1.0 2.2 2.2
Note: GDP numbers are at the 1993-4 base. For 1998-9 GDP, revised estimates (July 1999) have been used.
Source: RBI Annual Report 1998-9 (Appendix 4.5 for 1997-9 figures); Supplement to RBI Bulletin on Finances of StateGovernments, CSO; World Bank staff estimates.

Reducing Poverty Faster * 39
Box 3.1FINANCING STATE GOVERNMENTS' DEFICITS: BORROWING AND GUARANTEES
The states are limited in their domestic borrowing by the central government and 60 per cent of their debtis to the central government. The central government passes on funds that it borrows on behalf of states atits average cost of funds, which has been rising with financial liberalization. The states are constitutionallyprohibited from borrowing internationally and have reasonably tight limits on overdrafts at the Reserve Bankof India. Thus Indian states face a relatively hard budget constraint in the sense that they are unable toautomatically access central bank funding, in contrast to Argentinian states whose access was a major factorin Argentina's inflation. (Brazilian states had automatic access to their own banks and also external capital.)However, Indian states have been able to ease the budget constraint through, in some cases, temporarily easedaccess to the Reserve Bank, build up of arrears to suppliers (a technique also used by state public enterprises-(SPEs), and campaigns to stimulate relatively high cost, small savings that are largely funnelled back to thestate that mobilizes them-another factor in rising interest costs of state debts (see Box 3.3).
State government guarantees have also been used to circumvent the 'hard budget constraint'. Before1994-5, SPEs were given separate borrowing allocations for each year as part of state-specific overall ceilingsfor the statutory liquid ratio (SLR) and market borrowing. With the removal of these limits, state guaranteesgiven to the SPEs have become a convenient means for states to circumvent the cciling imposed on borrowingby the central government. This issue has assumed growing importance in recent years because of rapid increasein these liabilities. The volume of state guarantees increased from Rs 403 billion in March 1992 to Rs 796 billionin September 1997, representing a compound rate of growth of 12 per cent a year. Total outstanding guaranteesnow account for about 9-10 per cent of states' combined GSDP. Variation among states is large-as a percentageof GSDP, state guarantees range from 4 per cent in UP to 14 per cent in Punjab.
The main reasons for the substantial increase in state government guarantees in recent years include:growing need for infrastructure at state level particularly in the power, irrigation, and road sectors; and asubstantial decline in central government loans to the states from 3.4 per cent of GDP in 1995-6 to 2.2 percent in 1997-8. These, together with a sharp fall in grant transfers from the central government from 2.7per cent of GDP in 1993-4 to 1.9 per cent in 1997-8, have forced states to resort to off-budget financing ofinfrastructure through SPEs without making adequate provision for project-specific cost recovery.
A committee consisting of finance secretaries of a few state governments and RBI officials was formed inNovember 1997 to review the issues concerning state government guarantees. The committee completed itswork and published its report in February 1999 (RBI 1999b). The main recommendations include settingceilings on the use of guarantees with reference to NSDP, Consolidated Fund, or net market borrowing ofthe state. Andhra Pradesh, Gujarat, and Karnataka have already established ceilings for the volume of stateguarantees. Monitoring state government guarantees would be a critical element in an enhanced dialogue ofthe central government with the states on fiscal reforms.
These states, and the others with large deficits, are on Box 3.2), introduction of taxes on agricultural incomesunsustainable development paths given the high real and land;cost of borrowing and the crowding-out of develop- * reforming public enterprises-including privatement spending by interest costs, salaries, and subsidies. service provision, privatization, closure, retrenchment,This is also indicated by rising revenue deficits and and redeployment;their increasing share in overall fiscal deficit. The ....political environment and weak reform record in and infrastructure spending, consolidation of the nu-some states suggest that it will be an enormous chal- and infa re pending, consolidatin of theinu. , . , 1 . ............... . , , merous welfare programmes, better targeting of sociallenge to restore their fiscal health and strengthen the s , nsn development impact of their public sectors. subsa dies, downsizing and upgradmg the civil service;and
i *mproving cost recovery-particularly in powerFISCAL REFORMS and irrigation, sectors that are key to the reform
State-level fiscal reforms that would correct this dete- process (see next section).riorating situation and enhance states' development Such measures would reduce fiscal deficit to apotential would include efforts towards: sustainable level, encourage private investment, and
* improving the tax system-for example tax simpli- ensure that state public sectors contribute substan-fication, introduction of value added tax (VAT) (see tially to poverty reduction and development. In fact,

40 * India: Reducing Poverty, Accelerating Development
fiscal crisis has spurred some of the poor and most intergovernmental fiscal relations. Unless supportiveindebted state governments-such as Uttar Pradesh-to measures are taken in the poorer states, this secondembark on a path of comprehensive reforms, similar wave of reforms by the central government wouldto the economic restructuring programme launched by continue benefiting mainly the higher-income states.the Government of Andhra Pradesh. The reform Recently, the centre has been attempting to helpefforts of these states are aimed at (a) restructuring the states embark on the path to fiscal rectitude,state-level expenditure and improving governance so as in response to their plea for extraordinary financingto maximize the outcomes achieved by public spending to manage the impact of the recent hefty pay revision,and private investments in the state; and (b) enhance in line with the award of the Fifth Central Paythe revenue base through tax policy and administrative Commission for federal-level services. The centralreforms and improved cost recovery from publicly government has signed MoUs with nine states so far,provided non-merit goods and services, whereby extraordinary short-term advances have been
Box 3.2
INDIA'S EXPERIENCE WIITH STATE-LEVEL VAT
Maharashtra is the only Indian state to adopt a (partial) VAT in 1995. It was recently repealed because oftaxpayers' resistance and revenue loss. Reviews indicate that such implementation problems owed to inadequatedesign and preparation for VAT. VAI has been successfully implemented in over 100 countries includingsome federal systems with state-level VAT. The main weaknesses of the Maharashtra VAT included: (a)adopting one kind of VAT (the credit invoice method, where sellers receive a rebate on VAT paid by inputsuppliers on showing supporting invoices) up to the manufacturing gate, and another kind of VAT (thesubtraction method, under which the amount of VAT on a transaction need not be stated on the associatedinvoice) to cover wholesale and retail trade. The different kinds of documentation required for the two methodsresulted in Maharashtra losing the opportunity to have an unbroken record of the chain of sales and purchasesfrom the manufacturing to the retail stage. Yet the key to achieving effective VAT compliance rests on theability of the tax administration to cross-check records from one stage against the other; (b) adopting asubtraction VAT with more than one rate (Maharashtra had three rates), which is regarded as a fundamentaldesign flaw and can lead to anomalous VAT computations; (c) the decision not to abolish the many tax holidaysand tax deferrals when the VAT was adopted narrowed the base considerably and likely encouragedoverinvoicing; (d) introduction of VAT by grafting of VAT features on the existing laws and administrativesystem; and (e) most damaging, the lack of adequate attention to staff and taxpayer education and strengtheningthe tax administration. Andhra Pradesh and Madhya Pradesh have adopted a different approach. Utilizingtechnical assistance, they are preparing legislation for a full-fledged VAT and emphasizing administrativerenewal and staff and taxpayer education. The central government could support the more efficient taxationapproach of VAT by itself moving to a national VAT. Whlile there has been a decision to introduce VATin all states by April 2001, preparations for that event are behind schedule.
A number of reform initiatives that are the respon- made by the Central government in return for fiscalsibility of the central government would help improve reform by the states. These efforts are a welcomethe general policy environment for all states. They complement to the efforts already under way on theinclude agricultural reforms (such as reduction in part of some reforming states.distortionary subsidies, improved pattern of publicspending, deregulation of the agricultural sector andrural finance, and empowerment of the poor through Reforming Power and Irrigationparticipation); elimination of small-scale industry at the State Levelreservation; removal of barriers to interstate trade;providing leadership and incentives in politically sen- Power and irrigation sector reforms would be the centre-sitive measures such as elimination of industrial incen- piece of the reform strategy in the states. Explicit andtives by state governments, harmonization of state implicit subsidies (mainly to farmers) are the highesttaxes, improvement in cost recovery and the regulatory in these sectors-for example they amounted toframework, and introduction of civil service and com- about 5 per cent of GSDP in Andhra Pradesh in 1997.pensation reforms; and improvement in decentraliza- The subsidies are not only costly, but also inducetion (see p. 42) and rationalizing and modernizing inefficiencies, such as overpumping of aquifers, and

Reduicing Poverty Faster * 41
have unclear distributional impact. Without reforms sectoral reforms, both fiscal sustainability and acceler-
and improved cost recovery, it will be difficult to ated growth would be very difficult to achieve.
encourage private provision of power or better use Andhra Pradesh has emerged as the leading reform-
of canals. Therefore improvement in cost recovery in ing state in the past three years, gaining considerable
these sectors on a sustained basis and sector restructur- attention in India and abroad, and generating a strong
ing are essential to restore sustained growth (particu- demonstration affect amongst many other states in
larly in agriculture) and sustainable state finances. India. It has launched a comprehensive reform prog-
The power sector in almost all the states faces a twin ramme, which covers state finances (civil service
crisis: severe power shortages and heavy financial losses downsizing, subsidy reduction, re-prioritization of
to the state electricity boards (SEBs), arising mainly expenditure, and a proposed adoption of VAT), public
from theft and provision of almost free power to enterprise reform (privatization, closure of unviable
farmers. These subsidies are a major element in the companies, and employee downsizing with a support-
deterioration of state finances. Depoliticization of ing safety-net programme), power (unbundling of the
tariffs and management of the utilities, and restoration APSEB, setting up a Regulatory Authority to deter-
of creditworthiness in the sector are essential to attract mine tariffs, and privatization of distribution), and
private funds to reduce the acute power shortages in irrigation (improving cost recovery, increasing alloca-
the sector. The needed reforms would typically involve tions for O&M, establishment of over 11,000 WUAs,
separation of the generation, transmission, and distri- and transfer of O&M responsibility to the same). So
bution activities of the SEBs, setting up new indepen- far, the reforms have been implemented effectively.
dent companies operated commercially under the The fiscal deficit has been brought down from 3.8
Companies Act to carry out these activities, privatization per cent of GSDP in 1994-5 to 3.0 per cent in 1997-8.
of distribution business, setting up an autonomous The business community has reacted positively to
Electricity Regulatory Authority to establish and regu- these initiatives and Andhra Pradesh has become
late tariffs, and enacting legislation to enable implemen- one of the leading states in attracting new local and
tation of these reforms (see Chapter 5). foreign investment. Andhra Pradesh has demonstratedEffective expansion of irrigation is key to ensuring that, with sustained political commitment, states
sustained agricultural growth and reducing rural pov- can improve their policy environment, embark on a
erty. The states normally allocate substantial public path to higher growth, and narrow the disparities
funds for the development of a canal irrigation net- with higher-income states regardless of initial condi-
work. However, the benefits of these investments are tions.not fully realized, because these funds are thinly spread Orissa is the pioneering state in power sectorover too many new projects, leading to substantial reform-it has served as an example for other states, in
time and cost overrun. In addition, Operations & particular Haryana and Andhra Pradesh. It has recently
Maintenance (O&M) activities are severely underfunded. sold off 49 per cent of its thermal-power-generatingThe resulting deterioration of the network adversely company-the first privatization of its kind in India
affects the efficiency of the irrigation system. The main and the largest by a state-and has also privatized
irrigation sector reforms would include: adequate bud- majority stakes in its distribution companies (see
getary provisions for O&M expenditure, substantial Box 5.3). Orissa also has a reasonable record in public
improvement in cost recovery, greater participatory enterprise reform and private participation in the
involvement of farmers in irrigation systems manage- mining industry and infrastructure.ment through constitution of Water Users' Associa- Other states showing an increasing commitment
tions (WUAs), transfer of revenue collection and O&M to reform include Haryana (power sector) and Gujarat
responsibility to WUAs, and improvement in the (public enterprise reform, private sector participationinstitutional and legal systems. Encouraging private in infrastructure). Rajasthan, UP, and Madhya Pradesh
sector participation in infrastructure through creation are also considering fiscal and sectoral reforms to
of a supportive legal and policy environment and improve their finances and promote growth. UP has
improvement in delivery of social services by strength- also initiated work to improve governance and address
ening institutions and training staff are also priority environmental issues in the state. A worrisome devel-
reform areas. It is important for state governments to opment is the policy backtracking in Punjab and
create an enabling environment that attracts fresh Maharashtra: Punjab started providing farmers with
investments and improves private sector participation free power and water and Maharashtra promised
in the states' development process. Without these free power to farmers. These developments make it
42 * India: Reducing Poverty, Accelerating Development
politically more difficult to improve cost recovery in about 60 per cent of consolidated government expen-these sectors in other states. diture net of state interest and central transfers. The
states incur about 87 per cent of total expenditure onsocial services and 59 per cent on economic services.Decentralization: Emerging Issues and The resulting vertical fiscal gap is financed by grants
the Eleventh Finance Commission from the centre and borrowing as limited by thecentral government (see preceding pages). There is a
Given its economic, demographic, and social diversity, wide gap in the states' self-finance, ranging fromIndia has developed a three-tier structure of govern- Gujarat's 76 per cent to Uttar Pradesh and Bihar's 35-6ment (centre, states, and local authorities) to promote per cent.political involvement, accountability, effective service The Finance Commission, which is appointed everydelivery, and regional balance. States have considerable five years, recommends how the proceeds of taxesfiscal autonomy under the Constitution but, until collected by the central government should be sharedrecently, central planning and the dominance of na- with states, how this should be divided amongst states,tional parties in national politics limited the full and how to distribute grants-in-aid to the states. Inrealization of decentralization. the past, the size of these transfers has been largely
Since 1991, three developments have initiated a determined by the need to fill the gap between theprocess of further devolution of powers from the entire or non-plan 'current-account' revenues andcentre to lower levels of government. First, opening expenditures of states, based on five-year projections.of the activities previously reserved for the public The Planning Commission, in consultation withsector, elimination of industrial licensing by the central the states, determines direct central government sup-government, and weakening of central planning, have port (a mixture of loans and grants) for projectscreated an environment in which state governments in states' development plans and the distribution ofassume larger responsibilities to define their develop- development grants from centre to states. Most trans-ment policies and to attract private investment in their fers by the Planning Commission to states are blockrespective territories. Second, weakening of the na- transfers composed of loans and grants. Official devel-tional parties has led to multi-party coalition govern- opment assistance to states is passed on to states on thements at the centre, enabling smaller regional parties same terms as regular transfers, with full additionalityto participate in these coalitions and have a strong since 1992. The central government also providesinfluence on national politics. Third, the Constitution conditional matching grants for centrally sponsoredAmendment Acts (73rd and 7 4 th) in 1992 provided a schemes (CSSs) which are cost-shared programmes.strong legal basis for strengthening the local govern- Regional balance is a key consideration in determiningments. transfers under these three mechanisms.
This system has a number of positive features. ItFiscal Federalism provides a transparent rule-based framework, which
makes states' own revenue and transfers from theThe Constitution specifies the expenditure responsibil- centre predictable. As discussed above, by subjectingity of the central government and state governments state borrowings to central government approval andin three lists defining central powers, state powers, and precluding access to external finance, it also imposes aconcurrent powers where both levels of government relatively hard budget constraint on states. However,can exercise authority. Expenditures under states' re- the system also provides perverse incentives forsponsibility include public health and sanitation, water states to increase the size of their development planssupply, agriculture and irrigation, and road transport. and current expenditure without adequate regard toExpenditure on education, social security, and supply expenditure priority, debt sustainability, and resourceof electric power is under joint responsibility with the mobilization.central government. The Constitution also specifies the The main weaknesses of the system include:taxation powers of the central government and stategovernments. The states' list includes land revenue and (a) the 'gap filling' approach, traditionally adoptedagricultural income tax, state sales tax, state excise duty by the Finance Commission, in determining theon alcoholic beverages, and taxes on motor vehicles. grant awards, undermines fiscal discipline because it
While the states collect about 37 per cent of the is not guided by the fiscal capacity of states, andconsolidated government revenue, they account for encourages states to run revenue deficits;

Reducing Poverty Faster * 43
(b) the block transfers by the Planning Commission of GDP, far outstripping the financing contributionin aid of state plans have an inherent bias in favour of of market loans at 0.6 per cent of GDP (see Boxnew projects which crowd out expenditure for the 3.3);maintenance of public assets; (0 market borrowings arranged by the RBI with a
(c) provision of central financing for wage compo- single interest rate for all states constitute a barrier tonents of new programmes for the first five years from the development of a competitive market for sub-inception encourages an unsustainable 'ballooning' of national debt with state-specific risk premia leading tostate civil services; market-based fiscal discipline;
(d) proliferation of centrally sponsored schemes (g) borrowing ceilings for individual states are not(over 180 programmes equivalent to 1.3 per cent of determined with reference to state-specific debtGDP) with their high administrative overhead costs sustainability analysis; andand rigid eligibility criteria, undermines effectiveness (h) occasional central government loan forgivenessand distorts state priorities; and refinancing without conditionality creates expec-
(e) the high cost small savings mechanism, which tations of future debt relief which undermine financialhas recently grown to be equivalent to 1.2 per cent discipline amongst states.
Box 3.3THE GROWING IMPORTANCE OF SMALL SAVINGS IN STATE FINANCES
Small savings in India comprise ten financial instruments run by the post offices and public sector banksand ainount to 1.6 per cent of GDP (in 1999-2000). Prior to the Budget for 1999-2000, 75 per centof net collections from small savings used to be transferred from the Consolidated Fund of the centralgovernment to the state governments/union territories (UTs) in which the savings originate, in the formof non-plan loans. These loans are offered at a 13.5 per cent rate of interest for a tenure of twenty-five years, with state governments enjoying a five-year moratorium. Apart from the tax forgone on thesetax-saving zero-risk financial instrLments, small saving collections cost the Central government about17-18 per cent (which includes administrative/transaction costs and, commission charges to the widenetwork of agents). Despite the fact that these are high-cost funds,states have been increasingly resortingto these loans in the absence of improved efforts at raising own tax revenues. In fact, most states opposeefforts to lower interest rates on small savings, essentially due to the fear of an adverse impact onmobilization. Following interest-rate deregulation of time deposits with banks, increased risk perceptionattached to competing deposit takers and a fall in stock market returns in recent years (except 1999),there has been a substantial jump in small savings as part of the capital receipts of the government.
In the past, the non-plan loans offered to state governments in lieu of small savings collectionsused to be part of the expenditure of the central government, adding to the already high fiscal deficitof the Centre. Largely based on the recommendations of the R. V. Gupta Committee Report, 1998,the Union Budget for 1999-2000 proposed a change in the accounting framework for small savings (seeRBI 1998-9, Box IV.1). Accordingly: (i) small savings collections will be credited to the National SmallSavings Fund (NSSF) in the Public Accounts, and not the Consolidated Fund; (ii) all withdrawals ofsmall savings by the depositors would be made out of the accumulation to the NSSF; (iii) the balancein the NSSF would be utilized to make investments in 'special securities' of central and stategovernments; (iv) the interest earned on these government securitics will constitute the income of theNSSF while the servicing cost and management cost of small savings will be the expenditure of the Fund;(v) these 'special securities' thus issued will add to the respective government's internal debt.
The changes thus effected are mere changes in accounting, leaving the basic issues unchanged, andsimply shift the debt burden from central to state government books. On the other hand, the recentrise in small savings collections has increased the urgency of reform, since small savings, along withgovernment guarantees (see Box 3.1), are avenues of partial escape from the relatively hard budgetconstraint established for states by the GOI and are an increasingly important source of internal debt.The hard budget constraint could be restored by delinking small savings from going to the states whereit is collected, while continuing to permit states to have access to the savings pool. Other measures wouldneed to address the high cost of this instrument, such as freeing up the interest rate and dropping thetax concession. It would also help to make explicit or do away with the implicit GOI guarantee onthis instrument.
44 * India: Reducing Poverty, Accelerating Development
Many of these weaknesses are acknowledged by the institutions are free to reject the debt issues of finan-
central government in the Ninth Plan. Under the cially weak states, and the central government rejects
theme of cooperative federalism, the Ninth Plan pro- the implicit full guarantees against default and estab-
poses to move with the states to a more flexible lishes a transparent set of rules for highly indebted
approach to the transfer, design, and coordinatilpn of states (perhaps with an element of co-insurance or partialdevelopment strategies. Specifically, it proposes that guarantees). The states are ill-served by the still high-
the National Development Council suggest changes cost small savings system (see Box 3.3). Other policyin the grant-loan formula while also considering the options which could be considered include:question of interstate distribution of central assistance. (a) consolidating centrally sponsored schemes to reduceThe Ninth Plan also proposes to remove the bias in administrative costs and partly converting them into
favour of large plans by delinking the size of the Plan block funds; (b) clarifying the constitutional assignmentfrom the level of central assistance to states. This of indirect taxes, and the exchange or rental of taxing
proposal, if fully implemented, would make a welcome powers to permit the implementation of a dual VAT;reduction in the distinction between plan and non-plan and (c) designing new financial institutions or market
expenditures. However, there is little sign that these structures to intermediate the borrowings of state gov-proposals will soon be adopted. ernments so that they can finance their increasing in-
Fiscal decentralization needs to match the ongoing frastructure needs without creating moral hazarddevolution of powers with fiscal resources to enable problems for the central government. (A start could be
local governments to spend on public goods and made by increasing the proportion that states borrowservices they are responsible for. The central govern- directly from markets, without central guarantees).ment intends to increase its dialogue with states onfiscal reform and Plan implementation and devotemore attention to periodic fiscal surveillance and imple-mentation of agreed commitments by states. It is (See also Chapter 4). The 7 3rd and 7 4 th Constitutional
thought that a more intense dialogue within the spirit Amendments provide the local authorities with legalof cooperative federalisnm will encourage better ac- status as directly elected bodies and eliminate state
countability and commitment of state governments to governments' earlier discretion in determining the
their constituents. This new initiative, which involves tenure and structure of these lower-level bodies. This
policy conditionality by the central government for is a major step towards strengthening of local govern-their resource transfers to states, is a welcome devel- ments, improving governance at the state level, trans-
opment and a good initial step towards rationalizing ferring larger responsibilities to panchayats andand modernizing the system of intergovernmental municipalities, and making them accountable to theirtransfers. electorate. These amendments also make specific pro-
Another positive development is the terms of refer- vision for the representation of women and other
. ence of the Eleventh Finance Commission (EFC), disadvantaged groups in the elected bodies in order towhich is currently deliberating. In the past, Finance ensure greater participation of these sections of local
Commisstons were discouraged from examining trans- communities.fers other than the ones they award. But the terms of Unlike for state governments, the Constitutionreference of the EFC explicitly enjoin it to 'review the does not specify any expenditure/functional responsi-
finances of the Ujnion and the states and suggest ways bility or revenue powers to panchayats and municipali-and means to.. . restore budgetary balance and main- ties but contains indicative areas which could be
tain macroeconomic stability'. Complying with this considered appropriate for devolution. Determinationrequest will require it to take a comprehensive look at of these responsibilities and powers is left entirely
all aspects of the transfer system including those to state governments. Given the economic, demo-
overseen by the Planning Commission and particularly graphic, and social diversity, this approach allows
the debt and deficit sustainability position of highly state governments to design a structure which wouldindebted states. better fit local needs, under the guiding principles
Much scope exists for additional reform. Further set out in the 73rd and 7 4 th Amendments.liberalization of banking and financial markets would Panchayats' own revenues are small, and do not
provide an opportunity for the creation of a competi- cover more than 5-10 per cent of their expendituretive market for state government securities. But mean- (65-70 per cent in the case of municipalities). There-
ingful reform is unlikely to occur unless financial fore they rely heavily on transfers from the state

Reducing Poverty Faster * 45
government. Local governments, with the exception of order to impart enough flexibility to meet the rapidlymunicipal corporations, also have no borrowing changing local needs and responsibilities. The financepowers. The 1999 Union Budget sought to increase commissions have been constituted, and their recom-the reliance on and devolution of resources to gram mendations submitted in a number of states. However,panchayats for several key public services, including state governments have been slow to accept and imple-primary health care, primary education, and rural ment these recommendations and to take steps toemployment schemes. However, the overall weak enable local bodies to execute the newly the devolvedfinancial conditions of most states clearly complicates functions. Recent assessments show steady progress inthe devolution of resources from them to local govern- states such as Karnataka, Gujarat, Maharashtra, Westments. Recognizing the need for stability, predictabil- Bengal, Kerala, and Madhya Pradesh in the devolutionity, and transparency in state-local government fiscal of powers to local governments. In some cases, statesrelations, the 73rd and 74 th Amendments provide for are experimenting with different or additional levels ofthe setting up of a finance commission in every state rural government. In other states, progress has beento make recommendations regarding the devolution of slow-while the necessary legal framework has beenexpenditure responsibilities, tax powers, and the prin- created, clear expenditure responsibilities, adequate taxciples for determining grants-in-aid to local bodies. powers, and a transparent system of fiscal transfersThis provision provides a unique opportunity to re- from state governments to local bodies have not yetstructure the existing state-local fiscal relations in been established.

4
Good Governance:The Business of Government
Overview private investment. Concern with these issues hasmounted after the recent experience of East Asia.
Good governance is a necessity for development and Weak or arbitrary property rights and contract
poverty reduction, not a luxury. Various studies sug- enforcement are important factors in underdevelop-gest that good governance is a major contributor to ment, according to Nobel Prize winner Douglas North;development, while people living in ineffective or venal they deter, saving and investment, especially foreignstates suffer from a lack of economic and social investment that is particularly handicapped in an
development.' Key institutional and capacity elements opaque legal system.2 The poor are hurt not only byof good governance are a comprehensive legal frame- lower investmcnt and growth of labour demand, but
work defended by an impartial and competent judicial because they cannot count on speedy, low-cost enforce-system, accountable, open, and transparcnt executive ment of their contracts and protection of their prop-
decision making coupled with a capable, flexible, and erty, for example prevention of illegal evictions.efficient bureaucracy, and strong civil society partici- Excessive limits on contracts and poor enforcement are
pation. Good governance ensures effective property likely to end up hurting the poor, for example byrights and contract enforcement without excessively limiting credit access and employment growth (seerestrictive and arbitrary r egulatory structures, and the Chapter 6). Corruption weakens contract enforcementdelivery of an appropriate mix and quality of public and property rights and is anti-poor. Opportunities for
services, with the inclusion of the poor and women, corruption increase with the number and complexity
and without corruption. Good corporate governance of rules, licences, taxes, and subsidies which set up(an issue dealt with in Chapter 7) is necessary for conflicting property rights and require complicated
efficient allocation and use of resources within a more resolutions; liberalization, by decreasing the scope oftransparent framework, and so helps to promote controls, reduces the opportunity for and gains from
corruption, provided competition is strong.3
See for example, North (1981, 1990), Olson (1996), Olson
ert al. (1997), Mauro (1995), Knack and Keefer (1995), Easterly 2 Mauro (1995) finds that corruption has a significant negative
and Lev-ine (1997), Sala-i-Martin (1997), and Campos and Nugent impact on the investment rate.
(1999). 3 See Ahluwalia (1997) for a discussion.

Good Governance: The Business of Government * 47
The capacity to formulate good policies and efficient These assessments are, however, not uniformly
public service delivery are obviously critical for devel- supported by surveys of domestic business (see Annex
opment and poverty reduction. An efficient, uncorrupt Tables 4.2-4.7).4 According to the survey done in 1999,
bureaucracy is a key factor and it tends to encourage over 50 per cent of domestic business firms see the
investment (Mauro 1995). Efficiency of public services government as inefficient. Of the different areas cov-
is particularly important for the poor, who depend on ered in the survey, telephone services, which
public services, such as primary education and health, have been liberalized to some degree (see Chapters 5to improve their lot and mitigate the risks they face. and 6), have the highest efficiency rating next to
Non-transparent budgeting and spending, widespread the armed forces (see Annex Table 4.3). Health, legis-subsidies, and corruption are likely to lower the lative services, and roads are worse with 49 per cent
efficiency and equity of public spending. Lack of to 68 per cent of respondents rating services as ineffi-accountability and properly directed incentives and cient to some degree. This survey also highlightsdisincentives in the government and civil service mean business concern about the uncertainty surroundingthat such problems are likely to remain unresolved and legislation and the regulatory framework, despite itsresponses to crises will be weak. predictability having increased during the past three
years (see Annex Table 4.4). Although India's judicial
INTERNATIONAL AND and legal mnachinery ranks above the 50th percentileDOMESTIC SURVEY ASSESSMENTS in the international cross-section, and is generally
trusted by businesses, 64 per cent of domestic firms
While governance is clearly a critical development find the court system expensive and 88 per cent findissue, its evaluation is complex and methods to do so it slow (see Annex Table 4.5). Next to inflation, the
are still in their infancy. The approach taken here is surveyed domestic firms consider labour regulation,
to evaluate procedural quality by comparing countries corruption, poor infrastructure, and policy instability
* Developing countries
2.5 o Selected large countries
20l South East Asia
1.51 5 - .mSm Um INDIA | m 0 i l ea South Asia (excluding India)
10El Industrial countriesaiuriuiiri ~~~~~~~~~~~~~~(UK, US only)
Govemment Role of law & General Public Outcomeseffectiveness business public financeand stability environment administration
FIG. 4.1: India's International Ranking on Selected Governance Indicators
(unweighted averages, scaled relative to India = 1.00, i.e. worse than India is below the line)
based on various survey metrics and results by key as the most serious obstacles to operations and growthservice outcomes. Since much of the data are from (see Annex Table 4.6). An encouraging sign is that the
opinion surveys, often based on perceptions, and since survey finds an improvement in overall government
they reflect differing cultural and legal milieus, they are performance during the past three years with the
subjective in nature and cannot be taken as definitive. improvement in the availability of telephone services
In terms of such indicators from international sources, standing out.
India fares about average among developing countries 4 The discussion in this section is based on a survey of 210
on governance though it ranks well below industrial firms carried out by the CII and supported by the World Bank
countries (see Figure 4.1 and Annex Table 4.1). India's as part of its World Business Environment Survey (1998-9). An
strong democratic traditions, free press, independent earlier survey of fifty-three firms, based on an abridged version
judiciary, and high calibre civil service are key strengths of the 1999 questionnaire, was carried out by the World Bank
in governance, in 1996 for the World Development Report (1997).

48 * India: Reducing Poverty, Accelerating Development
India's 'outcomes' tend to be worse than the evalu- and financial management, institutional arrangementsations of its governance processes, particularly in to ensure accountability, and tax administration re-public service delivery, which suggests implementation forms are then examined. Finally, the prospects forproblems (see Annex Table 4.1). Over the last twenty decentralization of services as a way to improve serviceyears, India has done relatively well in achieving delivery are examined. The important area of weakgrowth, achieving higher rates than all but the high- governance at the level of states has already been dealtperforming countries in East Asia. However, this with in Chapter 3, problems of inappropriate regula-growth has not been sufficient to substantially reduce tion or over-regulation in key sectors such as banking,the number of people living below the poverty line financial markets, and corporate governance are dis-(43 per cent in 1983, 34.4 per cent in 1997, see Annex cussed in detail in Chapter 7, and international tradeTable 1.1), and also the measured reduction has slowed in Chapter 6.recently (see Chapter 1). Less widely acknowledged isIndia's limited improvement in education, health, andgender equity. While improvements have occurred, Rule of Law, Contract Enforcement,performance in these areas is still low (see Annex Table and the Business Environment4.1), such as in the case of education despite itsenshrinement in the constitution. Indeed, according to India performs reasonably well in preserving the rulethese indicators, performance has been worse than even of law and protecting property rights in a 1995 cross-some of the late starting and severely constrained country comparison (see Figure 4.1 and Annex Tablecountries in sub-Saharan Africa. Analysis is limited by 4.1). However, ratings of the business environment byweak data-for example, official enrolment figures, Business Environment and Risk Intelligence, Transpar-on which funding allocations are based, show gross ency International (for 1998), and from the Interna-enrolments of well over 100 per cent, but surveys of tional Country Risk Guide are less satisfactory. A majoreducation typically show enrolments well below 100 issue is actual contract enforceability, which presum-per cent (see Box 8.1). Also, India's share of trade in ably includes the problems in debt recovery and execut-GDP is low, compared even to other large countries ing collateral that many banking institutions cite as asuch as China (see Annex Table 4.1), which reflects not major factor in non-performing assets (see Chapter 7).only high levels of protection but red tape and weak As many reports have highlighted, there are severalinfrastructure (see Chapter 5), as well as reported key weaknesses in India's legal framework that arepayments to customs officials (see Annex Table 4.7). inhibiting the process of economic change (see DebroyThese low levels of trade reduce India's benefits from et al. 1999, World Bank 1998a, and Box 4.1). Theseinternational specialization and international competi- slow down industrial and corporate restructuring andtion, weakening the push to cut costs and improve contribute to corporate misgovernance (see Chapter 7quality for consumers and business. On the other for a detailed discussion), are onerous for small-scalehand, India's financial system is well developed for a industry (which does not have the capacity to deal withlow-income country (see Chapter 7). excessive regulatory and disclosure requirements), and
The remainder of this chapter discusses some impor- leave room for subjective interpretation and couldtant areas where improvement of governance is likely hence lead to harassment and corruption. There isto have a substantial payoff. To bring about improve- recognition of at least some of these deficiencies in thements in property rights, contract enforcement, and legislative agenda that has been put forward to succes-the business environment, key reforms include an sive Parliaments-while the Urban Land Ceiling Regu-improved legal structure, more efficient judicial manage- lation Act was repealed and some important laws suchment, and reduced corruption. Problems with the legal as the Insurance Regulatory and Development Author-structure are illustrated by drawing on important ity Bill, Foreign Exchange Management (FEMA) Bill,examples from bankruptcy and labour laws while the the Securities Contract Regulation (Amendment) Billimpact of judicial delays is illustrated by examining on derivatives trading, and Trademarks Bill were passedproblems of debt recovery. Next, the discussion turns in 1999, many others were pending, such as the Patentsto public administration, and examines how it might Bill, Prevention of Money Laundering Bill (both re-be improved through a better incentive framework for ferred to Select Committees), recovery of debts bill,the civil service. An important sectoral issue, manage- etc. Other key reform areas, especially labour laws andment of public sector enterprises (PSEs), is also dis- key aspects of company law (see Chapter 6) are,cussed here (see Box 4.2). Improvements in budgetary however, still under discussion.

Good Governance: 7he Business of Government * 49
Box. 4.1PROJECT LARGE
A research project on Legal Adjustments and Reformsfor Globalizing the Economy (LARGE) was initiatedin December 1993. This project was taken up under the Ministry of Finance/UNIDP umbrella, with initialinvolvement of the National Law School of India, Bangalore. LARGE's mandate was to examine economicand commercial legislation in India in order to make it more market friendly, with a focus on centralgovernment legislation in the first phase (December 1993-December 1997). There were around 3000 CentralActs to consider and around 450 dealt with economic and commercial decision making, directly orindirectly.
The first phase of LARGE, which brought out thirty Policy Papers (some of which incorporate draftbills) and four books, largely addressed issues relating to the relevance of particular legal provisions in thelight of reforms; any possible conflict or overlap with other legislation; resolution of such conflicts, if any;technical amendments necessary to prevent unintended loopholes; judicial interpretations running counterto the broad objectives of the law; level of transaction costs associated with any particular piece of legislation;enforceability and user friendliness of laws; comparable legislation in other countries, especially developingcountries.
Several seminars to disseminate the results of research work as well as to increase the interface betweenlawyers and economists were held. Broadly, the work covered labour and land markets, the financial sector,the environnient, direct and indirect taxation, intellectual property rights, and some assorted areas. Thesecond phase of LARGE is expected to examine critical areas not dealt with in the first stage focusingon (i) state government legislation, with emphasis on laws relating to land, labour, and the environment; (ii)administrative law reform (government orders, rules, and regulations, etc.); (iii) alternative dispute resolution;(iv) reform of the court system (Limitation Act, the Evidence Act, or the Code of Civil Procedure); and(v) competition policy for infrastructure sectors (which have historically been public sector monopolies).
Turning to judicial management proper, India's to the need for judicial clarification. Specific problemsjudiciary is respected for its integrity and sagacity, but include factors contributing to delays and adversethe issue of 'justice delayed is justice denied' is a major incentive structures.one, much worse than in the quasi-judicial Board forIndustrial and Financial Reconstruction (BIFR) pro- FACTORS CONTRIBUTING TO DELAYSceedings. As noted above, these points are borne out * Inadequate number of judges; for instance therein the survey of Indian firm's perception of the court are 10 judges per million persons in India compared tosystem's efficiency. With 28 million cases pending and between 41 and 107 judges per million persons inmounting arrears, it can take up to twenty years before Australia, Britain, Canada, and the United States.a decision is obtained and enforced, putting judgements Given the backlog of cases, an at least 50 percentbeyond the reach of the poor. Important causes of increase in the sanctioned strength of judges in thedelays are under-supply of judicial resources, under- eighteen High Courts and the Supreme Court will beequipped courts, socially underpriced court services; needed to keep abreast of the workload. Furthermore,cumbersome court procedures, perverse incentives to the large number of vacant posts will need to be filled.prolong litigation; and a vast body of non-transparent The situation in the lower courts is even worse.laws. Over 30C0 Central statutes and ten times that . Overuse of oral arguments and limited use ofmany state statutes exist, many of them archaic and written briefs and ex-parte judgements.serving no purpose. This does not take into account the Utilizationof sttingratherthanretiredjudgesbyvast volume of subsidiary and administrative laws of . Utthzatt or purose other than adjudicaibywhich no estimate is available. Nor does this the government for purposes other than adjudication,wnlcn ~ ~ ~ ~ ~ ~ ~ ~ ~~~o exa lelmt to headule Comisin ofe Enl uirIno r account the conflicting definitions and often incompre- q yhensible language in which the law is written, leading * Procedures for admission of cases and writs
which bend over backward not to deny almost anyone5 Recently, the government has begun reviewing its admin- a hearing, leading once again to excessive litigation.
istrative laws. A Commission to Review Administrative Lawssubmitted its report in September 1998. It recommended 'action' * Easy procedural avenues to delay court decisionsin respect of over 1700 statutes. A follow up Standing Commit- (such as through adjourned hearings) which entail notee submitted a report on implementation of the Commission's costs to the responsible party even though the costs torecommendations in June 1999. the opposing party (due to the delay), the court (due

50 * India: Reducing Poverty, Accelerating Development
to lost time), and society at large (due to continuing reflects insensitivity to the cost of time, and thecongestion) are considerable. distinction between sale proceeds and their distribu-
. Multiple appeals against lower courts. tion. The liquidation process is full of arcane legalities* Failure to computerize and automate routine which, among other things, include the preparation of
judicial procedures and court records to speed them audited accounts that go back several decades. A weak
up, and to reduce the opportunities for petty corrup- ega andJudicial mechanism for debt recovery has beention among court functionaries (for example in allot- a traditional source of high non-performing assets (seeting dates for hearings or in tampering with court Chapter 7 for details).tecordates). for hearings or in tampering withCDurt To reform the system, a multi-pronged strategy is
needed to ease supply bottlenecks, decrease incentives. Failures to reduce/bypass the backlog through for frivolous or prolonged cases by changes in fee
alternative dispute resolution systems: arbitration, structures, and limit admission. Such a strategy hasmediation, or conciliation techniques have not been been spelt out by the National Task Force on Judicialwell developed. Arbitration has typically led to Judicial Reforms, which submitted its report in Novemberappeal (The Arbitration and Conciliation Act, 1996 1996. A high-powered body could be constituted tomay help). Also, the implementation of The Debt oversee the time-bound implementation of the TaskTribunal Act, 1993 experienced numerous delays and Force's recommendations. These recommendationsas yet has had only minimal success. The innovative could be extended to various tribunals and not justLok Adalats have taken root only in some states and courts. In addition, internal government incentives togovernment agencies and even they have failed to bring penalize officials for filing meritless cases or appeals andabout overall decrease in j'udicial delay. speeding-up of the government programme to simplify
laws, repeal redundant laws, and replace outdated laws
ADVERSE INCENTIVE STRUCTURES with new ones, for example the new Company Law(see Chapter 7), would help.
. Limited accountability and enforcement of sanc- Corruption is another major problem weakeningtions against non-performance by iudges leading to the rule of law, particularly affecting the businessabsenteeism and short workdays in many cases. environment, and is a rising concern of the central and
* Court fee schedules which have remained un- state governments. India's Prime Minister devoted achanged for decades leading to underpricing of judicial substantial part of his address on the 50th anniversaryservices and consequent overuse. of Independence to the problem of corruption and
* Incentive systems for government servants measures to address it. Transparency International'smaking the government/the major litigator in civil 1998 survey of international businesses' perceptions
ranks India worse than China and other Asian coun-suits (being involved in over 60 per cent of suits veryoften as plaintiff or appellant) without regard to either tries, and somewhat worse than other large countriesits own or citizen's costs. In fact, cases in which the (see Annex Table 4.1), though its earlier surveys rankedgovernment is both plaintiff and defendant are far from India better than China. The 1995 Global Competitive-rare. Once admitted, there are implicit pressures for ness Report also ranked India somewhat higher thangovernment suits to be appealed, lest the original suit China (see Annex Table 4.1). In the survey of localappear meritless. businessmen, 83 per cent reported paying bribes
in transactions ranging from customs, taxes, and* Lawyer's fees based on hours spent in case prepa- licences, to infrastructure connections and government
ration and court appearances rather than results, giving concts-91 per cent of the respondents say thethem the incentive to prolong judicial proceedings. payments were less than 10 per cent of the contract
The outcome of slow judicial proceedings is ineffi- value, but 2 per cent said they paid more than 25ciency in the business environment. For example, a per cent. These results suggest that an important causestudy examining 1849 companies that were in the of unsatisfactory development outcomes and businessprocess of liquidation in the High Courts shows that dissatisfaction with government services, may be cor-in 59 per cent of these cases the procedure took more ruption.than ten years and, in 32 per cent of the cases, more Reducing corruption is not easy, particularly oncethan twenty years. The result is that the value gets it becomes 'part of the system'. A three-prongedstripped by promoters and their middlemen, leaving approach encompasses most of the recommendedlittle for unpaid workers or secured creditors. This policies:

Good Governance. The Business of Government * 51
reducing opportunities for corruption by deregu- training facilities.7 Yet India's civil services, the prin-lation and privatization, placing greater reliance cipal 'face' of the government to the public and res-on competition to ensure low prices and good quality; ponsible for implementing government programmes,
* improving incentives for good perforhiance and must shoulder some of the responsibility for dissatis-disincentives for corrupt practices in government; faction with government performance in providingdisincentives for corruptprcticesa sound business environment, curbing corruption,
* improving administrative procedures to reduce and providing public services. The problem is notthe opportunity for corruption by increasing account- initial capability but institutional deficiencies. Non-ability, transparency, and the role of the citizen's transparency, limited accountability, low salaries, andvoice. The central government has taken an initiative inadequate performance appraisal weaken the civilto get Citizen's Charters framed by various ministries/ service's administration, as do the standard problemsdepartments/organizations. The centre has framed of political interference in specific situations and61 such Charters and six states/UTs have framed government's widespread and intricate interventionsabout 93. that delay actions, create unwarranted power, and
The following sections discuss the last two parts of provide opportunities for corruption. Numerousthe above approach, and Chapter ,. discusseissues government commissions have pointed out the parti-
Of deregulation and improving competition. cular problems of the civil service and made recom-mendations to tackle them, most recently the Fifth PayCommission;9 recommendations that have largely been
Improving Public Administration: ignored.In particular the following recommendations of theStrengthening Performance Incentives Fifth Pay Commission would substantially improve
and Accountability in a Downsized civil service and public administration:i A multi-pronged approach to employment reduc-
Civil Service tion in central government targeting a 30 per centSuccessful public administratio rreduction over a ten-year period. Contrary to this
Successful public administration reform needrecommendation and despite the modest measure abol-based on a vision redefining the role of the public sector ishing four secretary-level posts announced by thein the economy (see Chapters 2, 3, 5, and 8), and a Finance Minister in his 1999 Budget speech, centralchange in the corporate culture of public administra-tion. Since the early 1980s, a number of countries, such employment is expected to grow by 1.5 per cent in thetaons Sine the early 1980str a Number ofln countr, suCaa current fiscal year, resulting in a projected increase inas the UK, US, Australia, New Zealand, and Canada staff expenditure of 10.5 per cent over 1998-9 (RE).have launched a series of innovative reforms aimed atenhancing the productivity of the public service and . Restructuring and 'rightsizing' central govern-improving its client focus and responsiveness. These nment services by decentralizing functions to states andreforms are now being pursued, in whole or in part, local government, by converting departmental under-in a variety of other nations, ranging from Chile to takings such as the Indian Railways into public under-Mongolia. 6 takings and by entrusting certain functions to NGOs,
The success of public administration will also de- cooperatives, and autonomous bodiespend on the quality of the civil service and its account- * Doing away with arbitrary and frequent transfersability. The initial capacity of India's civil service of bureaucrats, particularly those in All-India Servicesis among the highest anywhere, with meritocratic at state level by laying down minimum tenures forrecruitment, a very high level of competition in civil posts and the need to clear all premature transfersservice examinations (under 1 per cent of applicants through a Civil Services Board, to be constituted forqualified in recent years for the higher services) and this purpose. The Annual Confidential Report (ACR),a mix of technically and non-technically educated arbitrary transfers, and sale of posts are alleged byentrants (see Das 1998). Technical capability and 7 Except, in certain cases, for the generalist Indian Admin-occupational demands are reasonably matched within istrative Service; see Das (1998).the three All-India Services and fifty functionally 8 For example, see Das (1998), Yugandhar (1998), Godbolespecialized central or state services given the existing (1997).
9 For listing and discussion see the works by Das (1998) or6 For a discussion see, for example, OECD (1997). Yugandhar (1998) cited above and Khanna (1999).

52 * India: Reducing Poverty, Accelerating Development
many observers to be the principal means of subverting earmarking; (iii) expenditures are planned in a medium-or circumventing the civil service, leading to corrup- term (2-5 year) framework based on consistenttion. macroeconomic forecasts to allow forward planning;
* Restructuring performance appraisal to make the (iv) there is a hard budget constraint on expenditurecurrent ACR system more effective and open, coupled dictated by revenue availability; (v) there is a frame-with a five-yearly high-level review of 'Group A' work to reconcile actual outlays with the budget andofficers to decide whether the officer should undergo impose sanctions for overspending and (where thiscompulsory premature retirement or not. implies inadequate service delivery) underspending;
* Increased transparency by passing a Right to and (vi) the budget process is transparent, with accurateInformation Act and corresponding revision of the and timely information on the budgeted and actualOfficial Secrets Act. revenue and expenditure being published, and open to
public scrutiny.In addition, a closer link between performance and In India, not all of these requirements are met. First,
promotions or pay increases, improved procedures to future revenue and expenditure implications, even forensure individual accountability for lapses, and im- long-term capital projects are not reported or takenproved enforcement of sanctions are needed.'" More into account in the budget. Instead of revenue availabil-broadly, a simplification and liberalization of excessive ity dictating expenditure ceilings, revenue and expen-restrictions, along with privatization, would reduce diture budgets are separate exercises, with additionalred tape and the scope for corruption. In addition, it resource mobilization (ARM) measures decided on ifwould permit a downsizing of the civil services and a projected resources fail to meet expenditure projec-focus on fewer, truly public activities, where better tions. Second, the states are only engaged in short-termdelivery could be demanded. All these measures would cash management with no medium-term perspective orbe far more effective if they were conducted within the framework; unlike the central government, the statesframework of a clearly defined and articulated vision continue to depend on the CAG of India, both tofor the reform of the public sector. prepare their accounts as well as to audit them. Further-
more, instead of sanctions, additional, post-budgetexpenditures, which impact adversely on fiscal deficit,
Sound Budgetary and Financial are incorporated in three supplementary budgets, one
M\/lanagement in each parliamentary session. Last, instead of transpar-ency, published government accounts never permitIndia's ranking on its budgetary processes and effi- actual aggregate expenditures to be determined.i"ciency and equity of revenues and expenditures in Given the overall budget, the next stage is allocationinternational comparisons is fairly high. However, in of resources in accordance with strategic priorities.terms of the more general category of management of To achieve this, (i) important stakeholders shouldpublic finances, India ranks much lower, an appraisal be consulted during budget planning; (ii) allocationsthat is borne out by India's high fiscal deficit, where should reflect strategic priorities; and (iii) implement-India ranks among the worst 10 per cent of countries ing agencies or spending ministries should have thein the world; its high level of implicit and explicit capability and freedom to manage their allocationssubsidies that have negative efficiency effects and at best effectively, with little need for further consultationuncertain equity effects; and its tax system, which still with the MoF. Accountability for spending can behas a limited base, and a heavy dependence on customs ensured by (iv) the existence of a system of reportingand excises (see Annex Table 4.2 and World Bank 1996a service delivery outcomes, such as zero-base or perfor-and 1998a). mance budgeting and an evaluation of end-of-year
An institutional framework conducive to overall outputs achieved, both of which are integral to thefiscal discipline is one in which (i) there is a compre- budget formulation process. Transparency is furtherhensive annual budget of the government with few off- facilitated through (v) institutional channels throughbudget expenditures and sources of revenue; (ii) limited which stakeholder groups can voice their concerns
about budget allocations and their level of satisfaction
10 See the works by Das (1998) and Godbole (1997) cited with outcomes.above and also Wade (1985).
1 For a possible strategy to strengthen enforcement, see 12 For a description of infirmities in the Finance AccountsNarasimhan (1997). see Das-Gupta (1999a).

Good Governance: The Business of Government * 53
Box 4.2
PUBLIC ENTERPRISE GOVERNANCE-A SYSTEM THAT HAS NOT DELIVERED
Although public enterprises are part of the public sector, they are also commercial, for-profit organizations and,increasingly, are expected to operate more independently and without support from the government budget. Where privatefirms are allowed to compete with public firms, PSEs have generally come out second best. This is not surprising, sincewhile liberalization has eliminated many of the constraints on the private sector, the public sector remains shackled. PSEshave higher average costs than comparable private sector companies, arising mainly from their structure of fixed costs,particularly employee costs. Another major difference is in the corporate governance structure. Shareholders of privatecompanies are direct beneficiaries of profitable performance and, hence, their representatives have incentives to monitormanagement to maximize profit. In contrast, PSEs do not have a substantial body of informed private shareholders whoseincome depends upon the performance of these companies. PSEs are also subject to demands to carry out many 'social'activities, whose efficiency and impact on profits are not well monitored.
Government shareholding in PSEs is exercised by Members of Parliament (MPs), ministers, and civil servants. A samplesurvey of Parliamentary questions regarding PSEs shows that commercial viability, profitability, cost minimization, andoptimal investment decisions only rarely reveal themselves as concerns. Civil servants, next in the hierarchy of shareholders'representatives, are typically process oriented and risk averse, whereas firms have to be result oriented, and this creates aninconsistency between the organizational forms of governments and those of modern financial and industrial entities. Thesenon-commercial objectives of shareholders' representatives result in loss of motivation for most chief executives of PSEs,who quickly adopt the line of least resistance-loss-making plants are neither downsized nor closed, wages are not linkedto productivity, and redundant workers are not retrenched. Above all this sits Article 12 of the Constitution of India,which defines 'the State' as 'the Government and Parliament of India and the Government and Legislature of each ofthe states and all local or other authorities within the territory of India or under the control of the Government of India'.Since most PSEs have more than 50 per cent government ownership, they fall under the ambit of 'the State'. This hasaffected PSEs in several adverse ways:
* All PSEs are constitutionally expected to achieve a wide variety of non-commercial objectives which are imposedby the Ministries and Parliament.
* PSEs are subject to an annual audit by the Comptroller and Auditor General (CAG) in addition to the audit bythe statutory auditor. Owing to repeated allegations of financial impropriety by the CAG, PSE managers tend to beconservative and, for example in the case of purchases and tenders, tend to choose the lowest bid even if quality is poorer.In this case, PSE managers know that propriety dominates profitability.
. There exist constraints on appointment of senior management personnel, which can only be made through the PublicEnterprise Selection Board (PESB) and, thereafter, clearance from the Department of Personnel, the Home Ministry, and,in many instances, by the office of the Prime Minister. This has led to delays, non-appointment of Chief Executive Officers(CEOs) and executive directors, and excessive emphasis on seniority-which means very few CEOs can enjoy their fullterm.
* Since PSEs are parts of 'the State', they are subject to writ petitions to the Supreme Court under Article 32, andHigh Courts under Article 226 of the Constitution.
. Again by virtue of being considered servants of 'the State', managers of PSEs are often subjected to criminalinvestigation by the Chief Vigilance Commissioner and the Central Bureau of Investigation.
* 'State' status limits managers from downsizing plants, retrenching, or re-deploying employees.* Finally, the directors of PSEs have little autonomy in finalizing any large investment decisions (approved by the
Planning Commission).Under these circumstances, it seems unlikely that a PSE can achieve better governance standards and yet remain under
majority government control. The experiments with MoUs have by and large failed. Improving governance and thusperformance of PSEs is the most important argument for privatization of all but strategic PSEs to below 50 per cent (asthe Budget speech of 1998 stated, to 26 per cent). In fact Dr Vijay Kelkar, then Finance Secretary, declared in a recentspeech (Pune Spring Lecture, May 1999) that in his opinion 'the only strategic public sector enterprises should be thosedealing with atomic energy, space and defense' and that PSEs in other areas should be privatized. With the resultant freeingup of both human and financial resources, the government can then improve on its core business of providing basic socialand physical infrastructure.
In India, there is ex-ante rather than ex-post control and the performance budgeting system for reportingof expenditure by line agencies through the institution of outputs and outcomes is divorced from financialof Financial Advisors in each department who report reporting and budget preparation. A strength ofboth to their own departments and to the MoF; the budgetary process, however, is the extensive

54 * India: Reducing Poverty, Accelerating Development
feedback from stakeholder groups in newspapers and conversely, revised estimates overstating expenditures
television after the budget is presented for legislative (see Annex Table 4.10);scrutiny. borrowing requirements and the fiscal deficit
Given departmental allocations, operational effi- b*brolgrqieet n h icldf being grossly underestimated in the budgets (see Annex
ciency, and effectiveness crucially requires accountabil- Table 4.10);ity. This encompasses (i) fixing individual responsibilityfor delivery of defined service outputs; (ii) personnel . arbitrary across-the-board budget cuts or cuttingpolicies linked to performance, with performance be- of peripheral expenditures during budget preparationing measured by actual outputs in relation to pre- or later in the year;scribed service delivery standards and preset targets; . unrealistic development budgets with several de-(iii) independent internal and external, financial and partments failing to utilize allocations in recent years,performance auditing with mechanisms for effective leading to actual development spending falling short ofcorrective or dlsciplinary action based on audit find- targets, while, at the same time, expenditure manage-ings; and (iv) 'customer' satisfaction surveys. Transpar- ment focuses on spending of appropriations rather thanency requires (v) publication of programme performance on efficient and effective service delivery (manifested inreports and (vi) mechanisms to elicit client feedback on the 'March rush' to spend allocations);
the quality of services provided. Apart from internaland external auditing, the institutional framework for * financial outlays that are based on unrealistic or
service delivery in India meets none of these standards ortdated tarms;and, for example, sanctions linked to poor performance delivery targets;or programme modifications based on client feedback * poor maintenance in the case of capital projectsare sporadic, at best. and premature acquisition of capital goods and
The result of deficiencies in expenditure manage- consumables leading to wasteful expenditure as identi-ment in India (see Annex Tables 4.8 and 4.9) is that fied by the CAG (see Annex 4.1);aggregate fiscal discipline is severely lacking, with * fraud and misappropriation of funds that occa-inefficient allocation of budgetary resources to compet- sionally come to ight during audit which, however,ing needs; lack of incentives for efficient service deliv- h o s, ,> , , . . h~~~I as only select'v coeaea'dentified by the CAGery; and limited transparency and accountability. This (see Annex 4.1).has led to:
Tthe continued existence of implicit and explicit o improve budgetary and expenditure manage-subsidies and heads of expenditure many of which are ment it would be desirable to constitute the Expendi-not transparently identified in the budget 3 (If these are ture Reforms Commission announced by the Financeidentiftea, they are not evaluated in terms of their Minister's 1999-2000 Budget speech. To promoteidentified, they arenotw evaluated in aerms ofo their efficiency and effectiveness in government expenditure,return to society;1 and where evaluated are found toD hruhon eomo tebde n iaca
yildpor etrn;lse Ane141) thoroughgoing reform of the budget and financialmanagement process is needed at the aggregate level, at
* leakage and misuse of budgetary resources facili- sectoral allocation level, and at the level of programmetated by poor expenditure control, and lack of account- implementation and service delivery. Key principlesability and corruption, according to the Comptroller are: (i) improved transparency through reforms inand Auditor General (CAG) (see Annex 4.1); accounts and budget presentation and linking of ex-
* non-transparent budgets with budget estimates penditures to physical outcomes in the budget;understating actual expenditures, the extent of under- (ii) effective action to reduce employment and downsizcstatement having increased in recent years, and, departments that provide services outside the core
13 . he IT Act competencies of the government; (iii) increased au-For example, exemptions under Section 10 of the IT Act, tonomy for line agencies in expenditure management
value of perquisites to government servants, and intra-public and a switch from ex-ante control of expenditure tosector lItigation.
I14 Io ex-otacutbty 1 114 For example, income tax exemptions, excise and customs e-post accountability; (iv) improved incentives forduty exemptions, and export subsidies. effectiveness and efficiency through individual account-
15 For example, PDS; the Integrated Rural Development ability and also positive incentives for individual con-Programme; fertilizer subsidy; and poor cost recovery (10.3 tributionstoincreased efficiency. A reform programmeper cent) in power, irrigation, higher education, and tertiary that the Commission might consider is suggested inhealth. Annex 4.2.

Good Governance: The Business of Government * 55
Improving Accountability: Increasing the absence of effective enforcement and a long-term per-Effectiveness of the Audit Mechanism spective in accountability procedures means that,
Independent audits by the CAG are a major institu- in practice, individual accountability for lapses is sel-tiondlmepeentuitsm by thenGAGu ar accountabmar isth dom established and sanctioned, and poor expendituretional mechanism to ensure accountability of the administration persists year after year.executive. The reports of the CAG are tabled inParliament and are scrutinized by its Public AccountsCommittee (PAC). Yet this admirable institution too Improving Tax Administrationhas been unable to curb mismanagement of expendi- Broader based, efficiently administered taxes are also anture: essential part of sound financial management. Tax
* The CAG audit focuses mainly on financial reform in the 1990s has mainly focused on tax structureirregularities and while systems or performance ap- reforms and, within this, largely on rate reform.praisals are carried out, these fall short of management Though some progress has been made, most notablyaudits and do not indicate how management can be the curtailing of the power to issue exemption notifi-strengthened. Also, physical inspection is rarely under- cations in the 1999 Budget, widespread exemptionstaken. persist and new ones have been introduced in every
* There is no effective system to establish indi- budget in the 1990s (see Annex Table 4.11) with novidual accountability for lapses pointed out by the mechanism in place to evaluate their economic benefitsCAG. The problem stems, in part, from the nature of and render the cost to the exchequer of these implicitprogramme management since individual responsibil- subsidies transparent.ity is not easy to establish under existing management Progress in implementing administrative reform andprocedures. institutional restructuring, as recommended by the Tax
... Responsibilit fo lapsesandfrudisdiReforms Committee (TRC) has been neglected (seea Responsiblisty for lapses and fraud iS dlvided Annex Table 4.12). Institutional reform to broaden the
amongshre oCes: ta G, the Central Vigolance tax base, improve centre-state tax powers and tax-Commission (CVC), and the Central Bureau of Inves- sharing, and the structure and administration of statetigation (CBI). There is limited cooperation between taxes (discussed earlier in Chapter 3) would be highlythe three offices, so that a coordinated examination of desirable.errors is made difficult, and only in relatively few cases In the 1990s, though corporation tax has shownis specific accountability established and sanctioned.' 6 ru th and pronal come tax has proreReety th CB wa bruh wihi the purview of. . robust growth and personal income tax has performedRheCently theBwasbrough twh the purirdinance,as tewt o almost as well, there has been a marked decline in the
to trCy to redress the above problem. a performance of both customs and excise duties (seeAnnex Table 4.12). The performance of customs duty
* The PACs scrutinize only a few of the CAG's can largely be attributed to the lowering of customsreports and, furthermore, have a tenure of one year duties in line with the liberalization programme andonly. recently the drop in oil imports, which account for 20
* States have withdrawn over Rs 850 billion from per cent of customs revenues. The performance of thetheir Consolidated Funds above what was budgeted central excise has shown a secular decline since theover the last two decades without accounting for it. If 1970s, which the recent rationalization of excise dutyspending exceeds the budgeted amount, governments rates (continued in the Budget of 1999-2000) andare supposed to 'regularize excess spending' by the limited base broadening, via removal of exemptionsPAC . While Article 205 of the Constitution directs and the introduction of a service tax, has been unablestate governments to clear excess spending before their to reverse.legislatures, this process is being bypassed through the Regarding tax concessions, assessment of the ben-system of regularization by the PAC. efits to society from the resulting revenue sacrifice is
. Besides 'Action Taken Notes' that ministries 17 Misuse of these concessions is documented by the AG
must submit to the CAG on audit observations, there in some cases and there is anecdotal evidence of misuse, for
is no effective system of follow up to ensure corrective example of the backward area allowance (by attributing produc-
management action. Even for Action Taken Notes, tion to dummy factories in backward areas) and the concession
responses by ministries are delayed or not given. This for charitable contributions. Data to permit an assessment ofreturns in rupees of revenue sacrificed are not readily available,
16 Further discussion in Narasimhan (1997). though some studies evaluating specific concessions exist.

56 * India: Reducing Poverty, Accelerating Development
difficult as the necessary information is not readily sample basis. Reduced delays are essential for India'savailable. To enable assessment of the benefits from competitiveness in today's time-sensitive markets.revenue sacrificed the government should, as a first The most important pending reform is implement-step, begin compiling data on tax expenditures as part ing TRC recommendations for minimum tenure ofof its budget to increase transparency and to assist in Chairmen and membcrs of tax boards and autonomythe evaluation of their returns. Studies by research and control over expenditure allocations and personnelunits of tax departments, based on samples of assessees, matters within their departments. Other administra-should also be conducted to assess the benefits from tive reforms that could be considered are outlined intax concessions. The government should ensure Annex 4.4.that removal of exemptions is taken up in its nextBudget, in accordance with the recommendations of Improving Public Services throughthe committee to examine exemptions announced by Effective Decentralizationthe Finance Minister in his 1999-2000 Budget speech.
In tax (including customs) administration, while Decentralization is becoming a standard remedy forthere has been some success in simplifying procedures, improving public service delivery, especially to thedecreasing the incidence of non-filing and increasing poor. With service providers closer to recipients, it isautomation, institutional and organizational reform argued that recipient's 'voice' will be better heard andstill lag behind. The effectiveness of several procedural service adapted to local conditions, thereby improvingreforms is, however, questionable (see Annex Table delivery (see Box 4.3). Of course, inherent in this4.13 and Annex 4.3). argument are the issues of providing non-public
An important example of the adverse impact of poor goods through the market, that is by the private sectortax administration procedures is the increased transac- rather than by the public sector, and the possibility oftions costs borne by exporters and importers due providing even public services privately but financedprimarily to cumbersome customs procedures (other by the government-for example a voucher system forsources of transactions costs, albeit less serious, are private schools such as used in Chile. Another issue isreviewed in Chapter 5). Indicative evidence shows (see the extent to which 'voice', as well as efficiency ofAnnex Table 4.14) that customs clearance time for delivery/use, is reduced by delinking service provisionimports in India varies from 48-120 hours, more than from taxes and user charges-an issue that experiencefor comparable countries such as Indonesia (48-96 suggests is important in India. Finally the success ofhours), Argentina (3 hours), Mexico (12-24 hours), and decentralization depends on the enhancement of capac-considerably more than the best practice of 15-25 ity at lower levels of government and a strong institu-minutes (Singapore). Also, India insists on 100 per cent tional framework not subject to 'capture' by the localinspection, while many other countries inspect on a elite.
Box 4.3
THE EFFECTIVENESS OF VOICE
In 1993, the Public Affairs Centre, a non-governmental organization in Bangalore surveyed 807 randomly selectedhouseholds 'to obtain systematic feedback on the public's experience with different (government) service providers andon their assessment of the adequacy and quality of the services'. Among the major findings were that 'the level of publicsatisfaction with the performance of service providers in Bangalore is uniformly low...', and that 'Corruption is widespreadin most agencies and has no doubt contributed to the severity of public dissatisfaction'.
The 'report card' on public services drawn up on the basis of the survey was given wide publicity, to government serviceagencies, the press, and citizens' groups. In follow-up activity, the news media, which had given prominent coverage tothe report card ran several public service investigations. The report card was also replicated in other cities in India. Ina follow-up survey of t00 persons drawn from citizens' groups conducted in 1997:
* 69 per cent of respondents felt that public pressure had resulted in improved services;* 54 per cent felt that the public agencies were more responsive to citizen problems than three years ago;* 49 per cent felt that there was increased sharing of information by public agencies;* 47 per cent felt that the behaviour of staff in public agencies had improved as a result of public pressure;* 29 per cent felt that corruption had declined though 46 per cent felt that it had not.
Souirce: Paul 1995.

Good Governance: The Business of Government * 57
India has made a promising beginning in decentrali- functions, and economic base. Additional features in-zation following the 73rd and 74t amendments to the clude: an institutional framework in the form ofConstitution. However, decentralization is far from District Planning Committees (DPCs) and Metropoli-complete and cracks are already beginning to surface tan Planning Committees (MPCs) for purposes ofin the evolving systems of fiscal and functional decen- planning and development at local levels; rights of thetralization, although strengthening the generally weak state legislature to determine the functional and fiscalmanagement capacity of the over 220,000 local govern- powers of local bodies; incentives to states in the formments (see Annex Table 4.15) to ensure adequate of XIth and XIIth Schedules to enlarge the functionalservice delivery, and the setting up of accountability space of local bodies; and mandatory State Financeinstitutions has barely begun. Therefore, the overall Commissions (SFCs) to make recommendations forpicture is one of incomplete institutional development the finances of local bodies and state-local fiscal rela-and inadequate capacity building (see Annex Table tions. Several problems remain with the effectiveness4.16). Consequently the proposal in the 1999 Union of decentralization:Budget to increase the reliance on and devolutionof resources to gram panchayats for several key * Local government's own revenue receipts consti-public services, including primary health care, primary tute a very small proportion of total governmenteducation, and rural employment schemes needs to revenues. In 1991-2, revenue raised by municipalitiesbe accompanied by effective steps to improve the amounted to 4 6 per cent of the revenue raised bymanagement capacity of local government. Another the central government and 8.05 per cent of thearea where decentralization, along with improved revenues raised by state governments. Currently, owntransparency, can help is environmental management revenue resources of gram panchayats are extremely(see Box 4.4). weak.
Box 4.4IMPROVING ENVIRONMENTAL GOVERNANCE
In efforts to improve environmental management in India, governance and public sector institutionaldeficiencies are the fundamental weak links, not the financial cost of environmental protection. Bothinadequate environmental policies and poor enforcement prevent India from capturing the high neteconomic benefits available from environmentally friendly efficiency gains and policy reforms. For example,an important part of such policy reforms would actually be a reduced financial burden of the public sectorin environmental management-through increased user fees to be collected from the beneficiaries of cleanwater supply, sanitation, and solid waste services, and an explicit shifting of the cost of pollution controlto private polluters (see also Chapter 8). In addition, improved governance would reduce environment-related public interest litigation, hence reducing the burden on the courts.
To improve environmental governance, the priority focus areas are improved information disclosureand transparency, due judicial process, and decentralization. Both improved information and thedecentralization of the monitoring and compliance functions to the state and local levels invite theparticipation of the private sector, NGOs, and communities. This in turn improves the accountability ofthe state and local regulators-where results can be measured on the ground. More than at the central level,state-level environmental and judicial authorities operate in close proximity to managers of infrastructureand industrial investments, to land-use planners, to health officials, and to the affected urban (in the caseof pollution impacts) and rural (in the case of most natural resource use) stakeholders. Hence, a processof decentralization and transparency are highly correlated with improved governance by the variousgovernment agencies whose actions impact on the environment. Similarly, institutional strengtheningefforts in environmental management, therefore, have the greatest impact at the state level.
The constitutional and legal framework of de- * Local government's own revenues meet only acentralization in India now consists of a three-tier part of their recurrent expenditure. In the case ofstructure of government: local, state, and federal. At panchayats, for which the data base is fragmentary,the local level, there are village, block, and district it is estimated that own revenues cover no more thanpanchayats and three grades of municipalities de- 5-10 per cent of the expenditure making them almostpending on predetermined factors such as population, wholly dependent on state governments (see Annex

58 * India: Reducing Poverty, Accelerating Development
Table 4.17). For municipalities, the average proportion While widespread success of public audits has not yetof expenditure covered by own revenues ranges be- been established (the rural population may not between 65 and 70 per cent. familiar with accounting methods to detect misappro-
The administration of local taxes is unsatisfactory priation), there are a few cases where this has worked.and reflected in poor collection to demand ratios, in- The states' weak financial status clearly complicatesability of local governments to periodically adjust the devolution of resources from them to local bodies,the property valuation tax rates and user charges to and subsidies at state level reduce the resources avail-inflation, as also the high cost of administration and able to provide services in general, whether or notenforcement. In the case of property tax, which is through the panchayats. This has affected the ap-the principal source of revenue for municipalities in proaches followed by the different SFCs, which are notnon-octroi levying states, the collection to demand ratio uniform. While they have, largely, recommended con-is likely to be, on average, no more than 40-5 per cent. tinuation of the status quo in taxing powers of statesFewpanchayats and municipalities have taken steps tO and local bodies, with SFCs recommending greaterbuild property valuation records and to adjust them to local flexibility in setting tax rates, four differentmarket prices, despite legal powers being available, approaches exist for purposes of revenue-sharing: cre-Similarly, user charges (including licence fee, fines, and ation of a divisible pool of state resources; assigningpermits), which have a large potential, are barely used. predetermined shares of state taxes to local bodies;
* Local governments, by and large, do not have the fixed transfers; and allocation of a portion of sharedautonomy to choose the tax rates, these being either Central taxes to local bodies. Furthermorc, the widelaid down by state governments or approved by them. variation in recommendations concerning grants-in-
- Except for municipal corporations, local govern- aid, from maintaining the status quo to greater use ofments have no borrowing powers and are wholly various specific purpose grants, does not include in-dependent on state governments for capital loans. The creased reliance on general purpose grants. A weaknessborrowing powers of municipal governments are gov- in most SFC reports is that these have been draftederned by The Local Authorities Loans Act, 1914, without SFCs having access to clear descriptions of thewhich require them to borrow with the previous functional jurisdiction and service provision responsi-sanction of the state government. bilities of local bodies partly on account of the nature
* Many 'conformity acts' enacted by different of conformity acts.states to give effect to the constitutional amendments This situation would be improved by:seek to restrict the autonomy of local governments, * a review of legislation and SFC reports in differ-particularly panchayats, with provisions that are pes- ent states to highlight infirmities;sibly at odds with the amendments. Several state Acts * a re-examination of the scope for enhancingtreat panchayats as agents of the state government financial powers of municipal corporations and dis-instead of self-governing bodies; devolution of func- trict panchayats such as through bond issues (as intions shows wide differences and, furthermore, most Ahmedabad);states have retained the power to amend or withdraw * making available technical assistance to localfunctions, in some cases by executive order; and in government to devise sound local government systemsseveral states functions either overlap with the state based, perhaps, on promising models like the Mayor-government or there is joint control. in-Council system in West Bengal and the rural local
. Few conformity acts specify adequate audit and government system in Kerala;accountability mechanisms, a matter which has, how- * providing technical assistance to local govern-ever, been dealt with by some SFCs. The existing ment for project design, costing, and planning such asaccounting procedures and audit arrangements of the through a recent NGO initiative in Kerala;Panchayati Raj institutions are inadequate. The staff * strengthening communication between local gov-available to village panchayats is lacking in numberava I I. ernment and local self-help and civil socicty groups.and ability to maintain accounts, and the strength ofthe departmental audit staff is not enough to conduct Clearly, there are several gaps in our understandingaudit, given the large number of local bodies. The of the risks posed by decentralization. Further study of
7 3rd amendment to the constitution envisages supervi- decentralization experiences, both positive and negative,sion of the panchayats by public audit (gram sabha) would be a vital building block in improving the qualitythrough information sharing and open discussion. and effectiveness of the decentralization process.

Good Governance: The Business of Government * 59
Annex 4.1 India) from which genuine unforseen expenditure in-creases can be met.
EFFECTIVENESS AND EFFICIENCY OF . A budget circular incorporating expenditure ceilingsFINANCIAL MANAGEMENT: SELECTIONS FROM for departments.
THE REPORTS OF THE CAG FOR 1997-8 * Introduction of zero-base budgeting as announcedby the Finance Minister and eventual revision of Demands
1. Unutilized balances of grants or appropriations of for Grants by a document giving past outputs andRs 10 billion, some of which has persisted annually for realistically linking costed current and projected outputsthe past five years. to multi-year expenditure estimates. Strict zero-base bud-
2. 'Hasty purchase' of electronic voting machines geting as introduced in the United States may not becosting Rs 735 million, which were lying unutilized for appropriate in the Indian context especially for develop-the past eight years. ment programmes not directly executed by the centre.
3. No tangible improvement resulting from the Rs 4.1 However, the principal of (i) linking past outcomes tobillion spent during 1992-7 under the 'Production and current expenditure proposals and (ii) evaluating the socialdistribution of seeds and crop development scheme' due return and/or prioritization of expenditure proposals isto use of older varieties and sub-standard seeds. important.
4. 45 per cent of the Rs 23 billion under the Member * Improved cash management to permit eventualof Parliament Local Area Development Programme re- emulation of 'just in time' inventory management, throughmained unutilized. Much of the spending was on positive and negative incentives to line ministry FAs toinadmissable items or schemes, and without obtaining improve disbursement forecasts.clearance from the MPs.
5. Large unutilized balances from funds released to Regarding Strategtc Allocation of Expendituresstate and district governments and other implementingagencies including sums retained in Personal Ledger * Effective individual accountability and sanctions (orAccounts, Civil Deposits, etc., in a performance audit of rewards if merited) for overspending or overbudgetingfive schemes; large amounts diverted to other schemes and and for underspending.unauthorized items. . Development and tracking of programme-wise out-
6. 90 per cent of the Rs 18.9 billion spent from the put performance indicators in the budgets as is currentlyNational Renewal Fund was on voluntary retirement done in the annual reports of some departments andschemes, making the scheme 'a non-starter'. ministries.
7. Total spending of Rs 30.7 billion on the Main Battle * Positive incentives for efficiency improving reformsTank development project against an estimate of Rs 1.6 rather than pursuit of fortuitous savings.billion. A 14 year (and still growing) delay in the * Enhanced public involvement of stakeholder groupscompletion of the 24 year old project. earlier in the budget formulation and post-budget stages.
Annex 4.2 Regarding Effective andEfficient Service Delivery
BUDGETING AND EXPENDITURE MANAGEMENT: * Improved control of disbursements to on-spendingA SUGGESTED REFORM PROGRAMME agencies through the use of contractual positive incentivesRegarding Aggregate Fiscal Discipline and negative sanctions (rather than ex ante controls) and
a reporting system providing information on both finan-. A multi-year expenditure framework. cial expenditure and physical progress.
* A budget procedure with revenue budgeting and . Improved internal audit capabilities and strengthen-revenue policy setting before expenditure budgeting. ing the role of external oversight to enable long-term
. Removal of the Plan/Non-plan categorization as pursuit of management improvements where weaknessessuggested by several experts. are identified by external audit review.
* Clearly defined expenditure caps, if possible through * Stepped up implementation of computerization ofa Constitutional Amendment. accounts down to the programme implementation level.
* Creation of a contingency fund under the control * The introduction of client satisfaction surveys, con-of the MoF (different from the Contingency Fund of ducted by independent central and local agencies for each

60 * India: Reducing Poverty, Accelerating Development
government programme and feedback from client surveys administrative complexity of export incentives and pos-to ministry budget allocations. sible limits on export gains that result from them.
4. Export processing zones. This scheme was audited inRegarding Implementation of the 1997. Of the functioning units examined, 28 per cent
Reform Programme failed to achieve their export and value addition obliga-tions even after five years. Regarding units that had closed
Setting up of a high powered reform management down, 27 per cent failed to meet their export obligationsbody to oversee implementation and deal with teething before shutting down, but forgone customs duty was notproblems. subsequently recovered. The CAG also concluded that the
scheme was unviable and failed to achieve its objectives.While there may be debate about the method of assess-
Annex 4.3 ment the CAG used, they also pointed out that no
EFFECTIVENESS AND EFFICIENCY assessment of this scheme had yet been made by theEFFECTIVEESS AND EFICIENCYCommerce Ministry.
OF TAX ADMINISTRATION:SYSTEMS APPRAISALS BY THE CAG 5. Income tax summary assessment. All income and
corporation tax returns filed are supposed to be assessed1. Implementation of invoice based system for MOD VA T summarily by the administration and a small fraction of
credit. This system, introduced for registered dealers summarily assessed returns is then subjected to in-depthand manufacturers in 1994-5, was evaluated in 1996 for scrutiny. The summary assessment scheme was examinedtransactions up to September 1995. Among the deficien- by the CAG in 1996-7. They found that the percentagecies found in administration were: (i) issue of registration of returns remaining to be summarily assessed at year endcertificates to dealers without proper business premises in increased from 16.5 per cent in 1992-3 to 23.6 per cent12 per cent of cases checked; (ii) no tax recovery action in 1994-5 due to the sharp increase in workload perfor invoices issued by dealers whose registration had assessing officer. This situation is likely to have sincebeen cancelled; (iii) incorrect or incomplete invoices or become worse due to the increased volume of filed returnsinvoices not signed by authorized signatories in over 82 by the growing number of assessees and the wider filingper cent of cases checked; (iv) undervaluation of goods in requirements for assessees. Furthermore, the total extrainvoices in about 15 per cent of cases; (v) MODVAT revenue from assessment during these three years amountedcredit allowed against invalid documents in 15 per cent to only Rs 62.3 crore, or 0.1 per cent of total taxof cases checked. collections. The CAG also found on test checking about
2. MOD VA Tcapital goods scheme. Improper credit was 1 per cent of filed returns, that the department failed toallowed before capital goods were installed and, in other detect numerous errors resulting in a tax loss of Rs 192.3cases, on goods that did not qualify for capital goods crore from checked cases alone. Many of these errors weretreatment. In eight per cent of cases checked in 1997, due to the failure of assessing officers to follow prescribedcredit was allowed before installation; in 65 per cent of procedures. Consequently, the CAG recommended steppedcases MODVAT credit was incorrectly given; in 36 per up efforts to computerize summary assessment and acent of cases interest on collections not transferred to the review of summary assessment procedures.treasury was not charged; and the authorities failed to 6. The presumptive tax for small businesses. Under this'deface' many invoices on which duty had been claimed, scheme a tax of Rs 1000 was to be paid by specifiedopening the possibility of their being fraudulently used businesses with turnover of between Rs 300,000 anda second time. Rs 500,000. The scheme was examined in 1997 by the
3. 100 per cent export-oriented units. This customs duty Audit. The CAG found that this scheme was not beingincentive scheme, introduced in 1980, allows for 100 per implemented uniformly, with, in some cases, Commis-cent exemption of customs duties for capital goods sioners having direct responsibility for the scheme. Theimported by units achieving a minimum value addition major strategy to 'attract' taxpayers was via publicityand exporting all their output. However, the verification campaigns on which about Rs 1 crore were spent. Theof value addition and export compliance was under the result of this was, for example, about Rs 31 crore in taxMinistry of Commerce, leading to the need for coordina- in 1995-6 from 223,000 taxpayers. This number oftion between it and Customs, which, expectedly, did not taxpayers was far below the target of the scheme of 15work efficiently. Consequently a large number of cases million tax-payers. There were no enforcement actionscame to light during audit where customs exemptions taken against assessees filing returns under this scheme.were granted but where value addition and export stipu- The CAG found several cases of taxpayers using thelations were not met. This example illustrates both the scheme despite being ineligible, due to a large turnover or
Good Governance: The Business of Government * 61
their status (for example professionals). The CAG also * Legislative amendments to remove the statutoryfound discrepancies between tax figures entered by the powers of assessing officers, and instead vesting powers incomputer centre and tax payments recorded at the zonal Board Chairmen with subordinates having only delegatedaccounting office raising the possibility of misappropria- powers to facilitate further functional specialization, es-tion of taxes paid. pecially at the level of field offices.
7. Penalty, interest, and prosecution for direct taxes. Theefficiency of assessing officers in levying these extra dues Improving Performance Assessment andwas assessed by the CAG in 1996. The review found manycases of overpayment, underpayment, and non-levy orunderassessment of interest; low and declining disposal of * Improved reporting of administrative data to enablepenalties initiated; failure by assessing officers to record tax administration performance to be assessed.why they had failed to levy (discretionary) penalties in . A thoroughly revamped system of performanceseveral cases, despite being required to do so; delays in evaluation with performance-based pay linked to it andlaunching prosecutions of up to eight years; an acquittal implementation of TRC recommendations for interimrate in prosecutions of 53 per cent; and incomplete or rewards.defective maintenance of records. * Strengthening the role of the CAG by a greater
8. Functioning of internal audit in direct tax administra- focus on management improvements and strengtheningtion. Internal audits are conducted by a special wing of the existing system of legislative review to permit ongoingthe income tax department to catch and correct mistakes monitoring of administrative measures to correct weak-in assessment and improve the quality. The CAG found, nesses. Improved cooperation between audit and vigilancein 1997, that these objectives were not being achieved. It agencies and better reporting in these areas.also found an absence of audit planning (which is re- * Legislation to introduce a tax ombudsman.quired); poor manpower management and frequent staff * Strengthening the role of the public in providingtransfers contrary to instructions; an outdated audit feedback and monitoring of tax administration.manual which had not been revised since 1987; and largearrears (77 per cent) in assessing officers following up auditobjections. With respect to an earlier appraisal of the Procedural and Management Reformsinternal audit wing conducted in 1989, the CAG con- Decreasing opportunities for direct contact betweencluded that 'the current review does not show any tax officials and taxpayers and making certain procedures,improvement in the working of Internal Audit over the such as the levy of interest and penalty, non-discretionary.last review'.
l Refocusing computerization plans of tax depart-ments with external technical assistance and stepping up
Annex 4.4 the pace of introduction by setting up of a high poweredchange management unit.
A SUGGESTED REFORM PROGRAMME FOR . Improving the selection of cases for post-clearanceCENTRAL TAX ADMINISTRATION checks in customs.
* Introduction of a receipts lottery to increase com-pliance by small business.
* Minimum tenure of Chairmen and members of tax * A review and reform of appeals procedures, includ-Boards. ing the structure of fees, cost awards, and filing of appeals
* Autonomy and control over expenditure allocations by tax departments.and personnel matters within their departments. * Improved cooperation between direct and indirect
* Budgets for tax administration with revenue budgets tax administrations starting with the use of commonlinked to measured revenue and equity performance and taxpayer identification numbers.capital budgets linked to long-range strategic plans in the * Review and strengthening of regulations and codesmedium term. of conduct governing tax professionals and clearing agent.

5
Improving Infrastructure toReduce Poverty and Support Growth
Overview The poor quality of India's infrastructure services(see Box 5.1) reduces growth directly, hindering special-
improved Infrastructure would Help India's ization, continuous process industries, and firms thatPoverty Reduction and Growth Substantially depend on good quality water and power. Poor quality
Sixty-two per cent of the respondents to the 1999 CII transport facilities raise transport costs and contributesurvey rated India's infrastructure as a hindrance, with to uncertain delivery times, forcing businesses to holdroads rated the worst of all public goods and services. large inventories and reducing the attractiveness ofHowever, the overall rating of infrastructure, notably India's exports to foreign buyers. Safety problems intelephone availability and roads, seems to have im- transport (see Mohan Committee 1996, vol. III, p. 142)proved since 1996 (see Annex Tables 4.3 and 4.6). and health problems related to water availability rep-International investors also rank India's infrastructure resent major issues in the economy. Businesses in Indiavery low-the 1998 Global Competitiveness Report of routinely provide their own utility services, in thethe World Economic Forum rated India 53rd out of the form of captive power and water facilities, to offset the53 countries surveyed in the context of infrastructure. poor quality of public service. However, this duplica-Household connections to power and water are lim- tion of investment increases the capital intensity ofited, telephone-density is among the world's lowest, India's growth. Moreover the small private facilities areand transportation services do not meet the needs of less efficient than could theoretically be achieved withan increasingly mobile population. Moreover, as growth well-maintained, high quality, larger-scale works pro-proceeds, exports (and imports) increase, and urbaniza- viding service through effective transportation andtion rises from its currently low level (25 per cent), distribution networks.even larger infrastructure needs will develop for trans- Poverty reduction would benefit from increases inport networks and urban infrastructure, to transport infrastructure, as shown by the experiences of Punjabgoods and provide a livable urban environment. In and Haryana, as well as various statistical studies.i1996, the Mohan Committee estimated that a 45 Improved infrastructure will be needed to allow theper cent increase in infrastructure investment would be hinterland, such as Uttar Pradesh and Bihar, to benefitdesirable as well as feasible macroeconomically (vol. I, See for example, Ravallion and Datt (1996a), Govinda Raop. 4; vol. II, pp. 44-50). et al. (1999), and Lall (1999).

Improving Infrastructure to Reduce Poverty and Support Growth * 63
Box 5.1
PROGRESS IN INFRASTRUCTURE PROVISION
Telecommunications: The waiting list for a connection is higher now than at the start of the decade, atover 2.8 million, around 20 per cent of the present number of lines. Only 50.1 per cent of villages hadpublic telephone service by end March 1998 (GOI 1999e). India's growth in the number of mainlinesis slow compared to China. Telephone density in India (at 1.72 per cent) is below that of the neighbouringAsian countries such as Thailand (11.4 per cent), China (7.3 per cent), and Indonesia (2.9 per cent) (TRA1.
Power: India-wide, the shortfall in meeting demand is conservatively estimated at 11 per cent for regularand 18 per cent for peak energy demand (GOI 1997c), although the variation amongst states is substantial.In order to cope with irregular supply, and also in part due to the high tariffs levied on industrialconsumers to cross-subsidize agricultural and residential consumers, industry has increasingly relied oncaptive generation. The SEBs have become a chronic financial drain upon the government budget becauseof inadequate and unbalanced tariffs, high levels of power theft, non-payment and non-collection of bills,and inefficiency.
Urban Water: Of 27 Asian cities with populations over 1 million, India's four largest cities are rankedamongst the five worst cities in terms of water availability hours per day. Physical losscs are typically high,despite low pressure, ranging from 25 per cent to over 50 per cent. Low pressures and intermittent suppliesallow back-syphonage and contamination. Every year about 1.5 million children under the age of 5 yearsdie in India because of water-borne diseases. The lack of availability of water affects the urban poordisproportionately. In Delhi, for example, even though the official per capita water supply is about 200litres per day, about 30 per cent of the city's 9 million people have access to less than 25 litres per day.
Ports: By government estimates, the current capacity at the major ports is overstretched. Total tonnagehandled during 1997-8 was 251 million tonnes, as against a capacity of 217 million tonnes (Ministryof Surface Transport). India's ports have struggled to keep up with the increase in demand. The totalcosts of moving a container through a terminal are on average 70 per cent to 80 per cent higher thanthose in Japan and in the US, where labour costs are much higher. Productivity at container terminalsin the Jawaharlal Nehru Port Trust (NP') is less than half that of Colombo. External trade procedures,in particular customs, also play a part in reducing overall port productivity, with customs clearancetaking on average three or four days (see Chapter 4).
Roads: Private road projects are being constructed in India, with successful examples so far being largelylimited to toll bridges and bypasses in urban or semi-urban areas. Expansion of national highwaysthrough private funding is being pursued, with the government also considering a form of shadow-tollingwith little traffic risk to private investors/operators. However, the development of the road networkwill require public funding, for both maintenance and capital expenditures. To this end, the last twobudgets announced measures to increase resources for the roads sector through levies on fuel. The 1998budget cess of Re 1 per litre on petrol is to be used for National Highways, while 40 per cent of the1999 budget cess of Re 1 per litre on diesel is to be used for roads, mainly for highway expansion ratherthan maintenance.
from liberalization, along with the coastal areas. 2 A return. 3 Without such investment, growth could well
major expansion in the availability of safe water would slow down and become increasingly concentrated ingreatly improve health among the poor. Finally, con- coastal areas and states with good infrastructure.
struction of infrastructure would increase labour de-mand, given the labour intensity of construction. 3 Various studies suggest that the returns to infrastructure are
However, experience suggests that attempts to increase very high (see World Bank 1994, p. 15, for a summary of some
labour employment through public works programmes studies). Criticism of aggregate estimates of infrastructure'styialour ply oyenot phrovideugood quality infrastru res productivitv suggest that the historically estimated returns arewithout substanotia anov good managemfrialsinucts,e inordinately high, and there is little evidence that additional
withoutsubstantialcapital andmanageriali . investment would yield such returns. Some authors have tnredInfrastructure investment in India would thus to respond to these criticisms by noting that historical aggregate
yield large benefits, both in terms of supporting estimates are based on the initial estimates in infrastructurehigher growth, improving the lot of the poor and networks-which is what applies to developing countries like
the population generally, and yielding high rates of India. On the other hand, say, duplicating road or railroadnetworks in developing countries would not yield very great
2 See Chapter 3, and Bajpai and Sachs (1998). returns.

64 * India: Reducing Poverty, Accelerating Development
India's Public Provision of Infrastructure compared to the planned 27,728 MW. 5 Railway invest-ment has fallen by about 0.3 per cent of GDP while
India relied almost completely on public sector provi- other transport (including roads) has remained a lowsion of infrastructure until the early 1990s. For ex- 0.3 per cent of GDP. Only communications invest-ample, power (except for some auto-generation and ment has shown an increase in the 1990s, of about 0.3limited private distribution), railways, roads, and per cent of GDP.telecoms were all public sector monopolies.4 The trend Moreover, it is generally recognized that mainte-towards private sector provision of infrastructure, in nance expenditures are too low. In power, low main-particular power, telecom, ports, and airports, gained tenance partly explains plant load factors and plantmomentum worldwide in the 1980s. This trend was availability that are well below international standards,6
precipitated by the recognized failings of the public although there has been some improvement in thesesector in this area, as well as technological develop- areas. In roads, the neglect of maintenance is very costly,ments which enhanced the possibilities for competi- particularly given the deterioration caused by increasedtion, especially in telecom and power. Recognizing the traffic and heavy loads-World Bank (1988) estimatedneed to attract more investment in infrastructure, India that, in 85 countries, an erosion of $ 45 billion in roadopened that sector to private investment as part of the assets occurred that could have been avoided at a costcountry's 1991 reform programnme. The success of the of $ 12 billion in maintenance. For India, even in 1988,government in attracting private investment, and the inadequate road expenditure and maintenance is esti-evolving policy response, are assessed in the following mated to have cost the country at least Rs 30 billionsection. It has to be recognized, however, that a large per year in excess wear and tear of vehicles, accidents,part of India's infrastructure needs will continue to be fuel costs, etc.,7 and this figure can only have gone upprovided by the public sector. For example, private with the major increase in traffic volumes thereafter.investment may contribute to the expansion of the High explicit and implicit subsidies and low userroads sector, but the public sector will have to continue charges limit internally generated resources and are majorto fund this area. factors in the slowdown in public infrastructure
Public sector spending on infrastructure has fallen investment. In power, for example, average revenuesfrom about 3.5 per cent in the first half of the 1980s, are only about 80 per cent of costs,8 reflecting low
TABLE 5.1India: Investments in Infrastructure and Other Investments
(per cent of GDP)
1981-2 1985-6 1991-2 1992-3 1995-6 1996-7 1997-8
Gross domestic investment 23.1 (13.4) 23.5 (13.0) 21.0 (12.4) 22.0 (13.6) 24.0 (16.7) 21.4 (14.7) 22.4 (15.5)Infrastructure 4.8 (1.4) 4.8 (1.2) 5.4 (1.4) 5.2 (1.6) 4.2 (1.0) 4.4 (1.5) 4.6 (1.6)
Electricity, gas, water supply 2.5 (0.4) 2.6 (0.2) 2.9 (0.3) 2.6 (0.5) 2.0 (0.2) 1.8 (0.2) 2.0 (0.2)Railways 0.6 (0.0) 0.6 (0.0) 0.5 (0.0) 0.6 (0.0) 0.4 (0.0) 0.4 (0.0) 0.3 (0.0)Other transport 1.3 (1.0) 1.2 (0.9) 1.4 (1.0) 1.3 (1.0) 1.4 (1.1) 1.4 (1.2) 1.3 (1.1)Communications 0.3 (0.0) 0.4 (0.0) 0.5 (0.1) 0.7 (0.1) 0.4 (0.0) 0.7 (0.1) 0.9 (0.3)
Other 18.4 (12.0) 18.8 (11.8) 15.6 (10.9) 16.8 (12.1) 19.9 (15.7) 17.0 (13.2) 17.9 (13.9)Memo:
GDPmp (Rs billion at current prices) 1728.1 2836.6 6671.6 7635.6 12,179.6 14,098.5 15,635.52
Note: Private sector investment within parentheses.Source: National Accounts Statistics.
and 4 per cent in the later half of the 1980s, to about 5Compared to the original targets, the percentage shortfall3 per cent currently (see Table 5.1). Electricity, gas, in transmission was nearly as great; however, targets for trans-and water investments have fallen by about 0.8 per cent mission capacity were scaled down as the shortfall in generationof GDP since the late 1980s-early 1990s. For the capacity became clear (Ahiuwalia 1998).Eighth Plan covering 1992-7, actual spending on power 7 According to a road users' cost study quoted in Kathuriawas only 80 per cent of the planned, and the increase (1996), p. 375.in public capacity generation was only 14,992 MW 8 See Mohan Committee (1996), Ahluwalia (1998), and Parikh
4 See Mohan Committee (1996), vol. III, pp. 54-5, 100, 141. (1999).

Improving Infrastructure to Reduice Poverty and Support Growth * 65
collections 9 and subsidies to agriculture and small Increased public spending on infrastructzure, as well as
consumers. Agriculture and domestic consumers increasedpri vateprovision, will be needed to meet India's
pay, respectively, Rs 0.21 and Rs 0.91 per KWh on infrastructure needs well into the twenty-first century.
average, with free power or flat fees prevailing for As private spending grows in some areas, in response
agriculture in many states. The supply cost of power to improvements in the regulatory framework (see theis estimated at Rs 1.86 per KWh (Parikh 1999, p. 121); next section for a discussion of current developments
moreover, this average cost is understated because it in key sectors), public sector spending can be realigned.
reflects a low rate of return at 3 per cent, which is And public spending will be particularly needed in
substantially below the cost of capital in India. India's sectors where private interest is low, where there are
average power tariff is also very low by international substantial externalities, where difficulties exist in closely
standards, which are typically equivalent to Rs 2.5-3.0 linking charges to services, or where there are strategic
per KWh. The low user charges generate heavy losses or distributional considerations. Even in these cases,
for most SEBs-the average rate of return was esti- the problems of limiting access, and lost time and safety
mated at -4 per cent in 1996-7. Even while charging considerations of toll plazas (as demonstrated by the
industrial consumers much higher tariffs, the SEBs are problems of octroi taxes), suggest alternative approaches
unable to cover costs, let alone generate internal such as shadow tolling and payments to operators for
surpluses to finance investment. Hence they have been construction and maintenance out of a 'Road Fund',
unable to invest and have, in fact, become an enormous which the government is considering. Other examples
burden on state governments' budgets and have run up are urban infrastructure-such as roads, flyovers, storm
large arrears with the central government enterprises drains, solid waste disposal, provision of basic needs for
such as Coal India and National Thermal Power water and sanitation-rural roads, and infrastructure in
Corporation (NTPC).1° strategic areas of the country.' 2 Even in these cases, the
The situation in the other sectors is similar. The infrastructure could be constructed and maintained by
states have also allowed irrigation charges to decline the private sector, while being funded by governmentsharply in real terms. States' typical charges for water contracts that provide appropriate incentives for timely
are far less than delivery cost; in Punjab, for example, delivery and good quality services.drinking water is free. This encourages water losses in A drastic reduction of implicit and explicit subsidies,
a water-scarce country. In roads, central and state including cross-subsidies (see also Chapters 3 and 8), is
governments traditionally finance construction and a key to funding the needed increase in infrastructure,maintenance; there is no tradition of tolls even on as well as improving the efficiency and distributional
major highways (tolls are charged only for major aspects of infrastructure (see Box 5.2). For example,
bridges to recoup construction costs). While road- according to the Mohan Committee, the biggest barrier
related taxes (road tax, registration tax, taxes on fuels to efficient use of power by consumers is the SEB
and vehicles, etc.) yield 2.1 per cent of GDP, lack of pricing policy that extends unsustainable levels of
earmarking means that only 48 per cent of these are subsidies to large consumer segments (vol. III, p. 65).used for roads. Only in ports and telecommunications These subsidies include not only low prices but also flat
have user charges generated substantial internal funds fees and lack of peak load pricing. Funding for roads,
for financing investment (Ahluwalia 1998).ii public and private, could be increased by furtherincreasing the cess paid by consumers on petrol and
9 Low collections show power theft, distribution losses, and diesel fuel for road construction, a step that was begunincreasing payment delays. In UP, for example, receivables from in the last two budgets."3 Water charges could be raisedthe sale of power have been increasing from about 6 months' to remunerative levels, and could include a fee forsales in 1990-1 to nearly 12 months sales in 1996-7; of thesereceivables, nearly 40 per cent are accounted for by the public 12 In some cases, for example urban roads, particularly forsector. access to the city centre, a mixture of high tech and low tech
10 See Chapters 3 and 8, and Mohan Committee (1996), vol. II, user charges may be applied, not only to pay for constructionp. 72. and maintenance, but to relieve congestion. Parikh (1999; ch. 6),
11 Telecommunications tariffs currently contain a substantial summarizes many of these approaches.cross-subsidy from long distance to local users. However, the 13 The funds collected by the 1998 and 1999 cesses have notTRAI has taken steps to reduce the cross-subsidy through its yet flowed to the road sector-for this to happen, an executive1999 Tariff Order, taking into account the liberalization of long decision by the Ministry of Finance is needed. In this context,distance services and the impact this will have on DoT's ability suitable enabling legislation on the lines of the Maharashtra Stateto subsidize local rates from this sector. Road Fund would help.

66 * India: Reducing Poverty, Accelerating Development
sanitary disposal of water. A number of countries link risks, private providers often demand guarantees that,assessments for local taxes to improvements in, for unless carefully specified, can reduce their incentives toexample, availability of water and disposal of sewerage evaluate projects, perform effectively and take appro-networks. Irrigation operations and maintenance charges priate risks, and can therefore take away much of thecould also be raised. Any subsidies that remain should benefits associated with private service providers.be limited, clearly specified and targeted (for examplebasic water requirements), and paid for by the govern-ment rather than through cross-subsidies. The long Attracting Private Investment inhistory and political sensitivity of subsidies in India Infrastructure-Evolving Policiessuggests a need to accompany subsidy reduction witha clear linkage between use and cost (which may be Recognizing the need to attract more investment intofacilitated by privatization and decentralization), an infrastructure, as part of the 1991 reform programme,emphasis on the unsustainable nature of the current India opened the infrastructure sectors to privateapproach that leaves infrastructure funding to 'some- investment. Progress in increasing private participationone else', and an improvement in the quality of supply. in infrastructure has, however, been slow. While fiscal
Box 5.2
THE PERVERSE IMPACT OF SUBSIDIES
Subsidies as applied in India are distortionary, have hindered private provision of services, and have non-transparent distributional effects. In terms of inefficiencies, power subsidies encourage over-pumping ofaquifers, reduce the availability of aquifers for drinking water, and, in a macroeconomic sense, encourageproduction of water-intensive crops in a country where water is scarce. The implicit subsidy in the failureto distinguish between peak and non-peak tariffs increases pressures to overbuild capacity-the World Bankestimated in 1991 that various measures to reduce peak usage could reduce peak generation requirements byabout 12 per cent over a 10 year period. Since part of the power subsidy comes from not covering operationsand maintenance, outages are frequent (reducing utilization) and users that require good quality power areforced to invest in low efficiency generation sets. Since power subsidies are partly financed by higher chargesto industrial users, they are encouraged to self-generate power, which is less efficient than generation in large-scale power plants, but less costly to them because of (a) the inflation of charges to them by cross-subsidiesand (b) outages. Subsidies in canal user charges have led to lack of operations and maintenance spending, andcorrespondingly an overly rapid deterioration of the capital. In addition, lack of maintenance contributes towaterlogging and salinationl of soils.
The subsidies' distributional effects may contribute to inequalities and are far from clear. The beneficiariesof the subsidies may or may not have higher incomes than the taxpayers. Moreover, a part of many 'subsidies'(for example in power and water) reflects 'non-technical' losses, and another part reflects the abilities of firmsand individuals to define themselves as part of the subsidized group. Thus, the incidence of the subsidy isalmost impossible to define. In addition, subsidies to one group of users are partly covered by other usersin the same sector (either as a cross-subsidy or as deterioration of the service they receive). This is a politicallyeasy way to fund the subsidy but has unclear distributional consequences and little support on efficiency orequity grounds in tax theory.
In the case of power, the poorest are involuntarily paying for power supply to the richer people. SinceSEBs are not allowed to charge realistic tariffs, their accumulated deficits are at least partly serviced by deductingtheir dues from Central Plan assistance to the states. The impact of this reduced central assistance as well asdirect state subsidies to power is that the poorest in India, who typically do not have access to power, areinvoluntarily and indirectly (by not receiving adequate supply of basic services like health and primaryeducation) made to pay for the cost of power services to richer segments within society.
The linkage between reducing subsidies and in- pressures meant that public investment in infrastruc-creased public funding is clear. But reduced subsidies ture declined from 4 per cent of GDP in 1991-2 to 3are also critical to efficient private provision of services. per cent in 1997-8, the anticipated private sectorPrices that do not cover costs carry the clear implica- investment has not been realized, rising from 1.4 pertion of political interference in providers' cost recov- cent to only 1.6 per cent over the same period,ery, which generates risk for providers. To offset such so that overall infrastructure investment declined

Improving Infrastructure to Reduce Poverty and Support Growth * 67
(see Table 5.1). Indians still largely receive infrastruc- will increasingly involve competition between pub-ture services-such as electricity, telecommunications, licly-owned service providers and private companiesports, and water-through public entities, which are for the more profitable long-distance and, eventually,usually part of a government department or, relatively international services. A successful opening of theinfrequently, a corporatized entity operated on com- sector will require the development and enforcementmercial lines. of the rules of the game (for example interconnection)
The full potential of the private sector in meeting by a party which faces no conflict of interest. RecentIndia's pressing infrastructure needs is as yet largely moves by the government, including the commitmentuntapped. With relatively few exceptions, principally in the new policy to a strong and independent regula-in the power sector in Orissa, there has been little tor, have strengthened the regulator, but the overallin the way of privatization of existing companies. policy and regulatory framework still allows for ad hocBoth central and state governments have perceived policy interventions by the government in some ofthe private sector's role largely in constructing new the details of the rules of the game. In the context offacilities-for example independent power producers interconnection, it should be noted that the New(IPPs) and greenfield port sites; or in establishing new Telecom Policy states that the Telecom Regulatorycompanies competing with public operators-as in the Authority of India (TRAI) will be involved only as ancase of the telecommunications sector. However, this arbitrator in disputes between the policy maker and thelargely neglects the productivity and efficiency gains licensee, when international practice is more for thethat could be obtained via private management and policy maker to state the general principles underlyingownership, under an appropriate regulatory regime interconnection pricing, and will let the regulator,and with competition introduced wherever possible, along with the service providers, handle the detailedand which would go some way towards relieving the issues. Moreover, although the policy recognizes thepresent infrastructure constraints. principle of Universal Service Obligation (USO), it is
not clear why DoT should be refunded any cellular
Telecommunications licence fees it pays (as proposed by the policy), asopposed to being reimbursed for its USO.
This sector witnessed some of the first attempts tointroduce the private sector into service provision.Although there are over 1 million cellular subscribers, Powerand the first private basic service providers have Government attention initially focused on privatebegun a network roll-out, the impact of the private investment in generation. The fundamental sectorsector has been substantially less than anticipated. The problems-high levels of losses due to theft and heavilymain reason for the slow network roll-out is the high subsidized tariffs to agricultural and, to a lesser extent,level of licence fees payments, which are difficult to residential consumers-were unchanged. Faced withsustain under present market conditions. Most of buyers who were largely bankrupt, relatively fewthe licences were bid for by the private sector and IPP developers have been able to obtain financingrepresent a combination of genuine overestimation and for their projects. As of June 1999, 3000 MW ofdeliberate overbidding in the hope of renegotiating the privately financed IPPs, selling to the SEBs, had beenfee at a later date. commissioned, with a similar level of capacity pres-
The New Telecom Policy, released in March 1999 ently under construction. Implementation difficulties-represents a substantial move by the government related to signing bankable fuel supply and trans-to further modernize the Indian telecommunications portation contracts-have also slowed down some pro-sector. Under this, the government has now publicly jects which had received central government counter-committed to the corporatization of DoT, introduc- guarantees.tion of competition into long-distance services, and Far-reaching power sector reform is being attemptedexpansion of competition in basic and cellular services. by a number of states. This involves divestiture ofIt also addresses some of the implications of conver- existing assets to private operators in combination withgence. The government has also taken steps to permit the establishment of a regulatory framework for thethe existing licence holders in basic and cellular opera- sector which will allow the recovery of cost-basedtions to migrate to a revenue-sharing scheme which prices. Orissa has been the pioneer in these efforts.will be more compatible with the revenues that can be Legislation was enacted in 1995 to create the Orissagenerated from the sector. The next stages of reform Electricity Regulatory Commission and corporatize

68 * India: Reducing Poverty, Accelerating Development
the Orissa State Electricity Board, Gridco, which is level transmission utilities to similarly contract privateresponsible for transmission and distribution. An ex- transmission. Following the September 1999 nationalisting state-owned corporation, the Orissa Power elections, the government is reviewing and accelerat-Generation Company, has since been the subject of a ing its disinvestment plans. In the power sector,successful divestiture, with 49 per cent of equity being POWERGRID and the National Thermal Powersold to Corporation (NTPC) have been identified as possiblethe AES, the highest bidder. More significantly, the candidates. Were the state power reform process moregovernment has recently completed the privatization advanced and spread across India, the governmentof the distribution business of Gridco (see Box 5.3). could create a competitive wholesale power market andGridco will continue as the bulk transmission entity, at the same time realize high privatization proceeds byand will in the transition period also be the bulk selling off NTPC, plant by plant, through competitivepurchaser (single buyer) of power on behalf of the bidding processes.14
distribution companies operating in the state, a situa-tion which will be reviewed, at a later date, by theRegulatory Commission. The states of Haryana and WaterAndhra Pradesh have enacted and made effective re- This sector has not as yet seen any privately financedform legislation similar to that developed in Orissa. projects of substantial size reach financial closure,Under their respective reform acts, they have restruc- although the Tirrupur project, supplying water pre-tured (unbundled) their power sectors and established dominantly to industrial customers, is nearing thistheir regulatory commissions. The legislative assem- point. All projects attempted thus far have been bulkblies in the states of Uttar Pradesh, Rajasthan, and supply projects. Where these are selling to a munici-Karnataka have enacted similar reform legislation, pality or board, the main concern of potential investorsexpected to become effective by April 2000. Reform is the ability of the purchaser to pay for the servicesprogrammes in all these five states include distribution to be supplied; where these are selling to industrialprivatization, and some of them are expected to move consumers who have the ability to pay for the services,
Box 5.3PRIVATIZING DISTRIBUTION IN ORISSA
In July 1997, Gridco, the utility responsible for transmission and distribution services in Orissa, decided to offer the entiredistribution business in the state (divided into four zones) for privatization simultaneously, instead of sequentially, asenvisaged earlier. The Orissa government and Gridco decided to offer majority stake and management control to strategicinvestors. Eleven consortia, including some major international utilities and leading Indian power companies, wereprequalified to bid for 51 per cent of the shares in each of the distribution companies. Bids from three consortia-BombaySuburban Electricity Supply Ltd. (BSES), Grasim Industries/Singapore Power consortium, and Tata Electric Companies(TEC)/Vinidian Group PLC consortium-were received for three out of the four zones in January 1999. The BSES emergedas the successful bidder for all three zones; majority equity and management control in these distribution companies havebeen transferred to it, generating disinvestment proceeds of Rs 1.2 billion for 51 per cent of the equity in the threecompanies, representing a premium of 50 per cent over book value. The Government of Orissa has recently completedthe sale of 51 per cent of equity in the fourth zone to the AES.
very actively in this area during the year 2000. 4 Government disinvesting its equity in NTPC to below 50-At the national level, the government unbundled its per cent would obviously lead to NTPC becoming a private
utilities in 1993, by consolidating the transmission company, which at 18,000 MW and growing, would remain inactivities of several central and joint sector generators the foreseeable future a dominating force in the sector and, asinto a separate transmission company, the Powver Grid such, would probably make any future plans to introduce moreadvanced competitive wholesale power markets very difficult toCorporation of India Ltd. (POWERGRID). India implement successfully. While plant-by-plant privatization wouldopened the power transmission sector to private invest- avoid this potential risk, it does raise some additional caveats:ment under The Electricity Laws (Amendment) Act, (a) if private shareholders have a say, they could complicate the1998. POWERGRID is preparing the first projects for restructuring of the system; (b) unless plant-by-plant privatizationimplementation by independent power transmission sees a change in management, efficiency gains will be minimal;companies, to be contracted through competi and (c) even plant-by-plant sales to private management maybidding processes. The Act also provides competitie need some voluntary staff reduction before sale.bddiang processes. Thne act also provides for state-

Improving Infrastructure to Reduce Poverty and Support Growth * 69
additional complications arise such as the requirement 45 million tons, or around one-third of capacity, isto provide water at subsidized rates to residential expected from the private sector, in addition to 31consumers located near the project. million tons from captive schemes.1 5 In the case of
The poor operational performance of this sector airports, the government has announced that it isshows strong parallels with the power sector. The planning to lease out operations at four major airportscurrent emphasis upon bulk supply facilities financed to the private sector. The successful commissioning ofby the private sector and selling either to a public body the Cochin airport represents a landmark for privateor to industrial consumers also mirrors the initial investment in this sector.emphasis upon IPPs in the power sector. The provision Privately financed toll roads are now under opera-of urban water supply in India suffers because of the tion, with more being commissioned in India. Thuslack of a commercial orientation. The private sector far these have been relatively small facilities such ascan, under an appropriate regulatory framework, pro- bridges and bypasses, although larger projects arevide the management expertise and incentives to reduce coming on stream. However, these projects typicallylosses and expand service. However, India has yet to have extensive recourse to the public sector, with debtembark upon the introduction of private management being largely guaranteed by the concessioning publicin this area. The appropriate strategy for doing this will authority. It would be expected that a successfulhave to combine tariff increases with improvements in programme of projects would see a reduction in theservice standards and water availability-the latter in risk being borne by the public sector. Without asome cases requiring substantial investments. reduction in the liabilities being borne by the public
Management contracts may be a possible entry sector, the benefits of obtaining private investment willpoint. However, without full management control and be diluted. (Nevertheless, for the expansion of nationalthe ability to shed workers and to provide incentives highways, the government is also considering an ap-for good performance, such contracts are unlikely to proach whereby the private sector faces little demandproduce the substantial improvements in operating risk in that it would be paid shadow toll revenues thatperformance that would come from more substantial would largely be independent of the volume of trafficforms of private sector participation such as leasing or using the road). As far as the expansion and mainte-concessioning. If the private sector is to be responsible nance of the road network is concerned, it will con-for investments, then the issue of cost recovery needs tinue to be largely funded through public resources.to be addressed. If price increases have to be phased inover time so that they more closely match the improve-ments in water availability and quality, and provide a Developing Specialisttransition from the very low present levels, there may Regulatory Agenciesbe need for phased and targeted government support.The strategies adopted need to take account of two Specialist regulatory agencies now exist in three infra-additional factors: (l) provision of a policy framework structure sectors within the economy-telecommuni-where informal water providers can continue to pro- cations, power, and ports.1 6 The actions of regulatoryvide services to the poor; and (ii) addressing of water agencies, such as the TRAI and the Orissa Electricityresource and allocation issues, particularly in the water- Regulatory Commission, to date, have already intro-deficient areas of India. duced enhanced scrutiny of the performance of existing
public sector service providers, and transparency in theTransport prevailing tariff structure." 7 However, the experience
of regulatory bodies thus far provides certain lessonsAt ports, toll roads, and airports, privately financed about the political economy of regulation withinIndia,facilities are being constructed and commissioned.However, at ports and airports, thus far, the focus 15 Capacity increases are expected at the major ports ofhas largely been on the creation of new facilities rather JNPT, Kandla, Mormugao, New Mangalore, Mumbai, Chennai,
than privatizing operations at existing facilities. The and Paradip.government envisions demand growth for port services In other sectors such as gas, airports, and water economicgovearnment envmision tons withestmatd thougput regulation continues to be exercised through government depart-of around 200 million tons, with estimated throughput ments and public sector service providers.of around 415 million tons in 2001-2. It is therefore 17 The tariff nrlings issued by both of these bodies have comeplanning to add 122 million tons of port capacity over at the end of substantial interaction and discussion with thethe Ninth Plan period (1997-2002). Approximately consumers, service providers, and government.

70 * India: Reducing Poverty, Accelerating Development
and the design of regulatory bodies to ensure that they for example, enjoy greater security, as, being createdcan effectively fulfil their mandate as independent by legislation, they cannot be eliminated by de-notifi-regulators. In particular, it shows the need to have cation; they have a broad range of powers over andeffective delineation of responsibilities between regula- above tariff setting, including licensing, regulation oftor and policy maker and to place the creation of an the quality of service, and dispute resoluticn (seeindependent regulator within a broader restructuring Annexes 5.1 and 5.2). Insulating the regulator fromof the sector (see Box 5.4).
Box 5.4DESIGN OF REGULATORY AGENCY POWERS: LESSONS FROM TELECOM
The experience of the telecom sector in India shows the advantage of clearly demarcating the responsibilitiesof regulator and policy maker. Under the Act that established it, the TRAI enjovs a range of powers that iscomparable to those held by regulatory bodies in a number of dynamic telecommunications markets. Itsresponsibilities include recommending the need for and timing of the introduction of new service providers andrecommending the terms and conditions of licences. It is also charged with effective interconnection betweenservice providers and regulating revenue-sharing arrangements.
Four cases have been filed with the High Court which centre over the extent to which TRAI can intervenein issues between DoT and a service provider. In addition, DoT has moved that TRAI cannot hear any disputesinvolving DoT, given that the latter acts in a policy-making role. The High Court, on a single bench ruling,has upheld DoT's granting of a licence to MTNL to enter the Mumbai and Delhi cellular markets, arguing thatDoT is not obliged to seek TRAI's recommendation on the entry of new service providers, and that any suchrecommendations would not be binding. The High Court has also ruled that the TRAI has no role in the disputebetween the licence holder and the licensor regarding provision of Internet services. High Court rulings, whichare the subject of appeal in a higher court, thus far, suggest that TRAI has relatively limited power in disputesbetween licence holders and the licensor, and in the grant of licences. There are concerns that the former hasimplications for TRAI's role in interconnection, since these arrangements are specified as part of the licenceagreement. These tensions have anrsen largely because of DoT's multiple roles as service provider, policy makerand, on behalf of the President of India, licensor of its private sector competitors.
Controversy following TRAI's 1999 tariff order has highlighted the issue of whether, under its establishinglegislation, TRAI is adequately protected from political interference. TRAI's first tariff order of 9 March 1999mandated a substantial rebalancing of tariffs, reducing long-distance and international call charges and increasingthe cost of rentals and local calls. Subsequent to the tariff order, the Minister for Communications directed TRAIto suspend implementation of tariffs for the time being. In the final analysis, the government respected TRAI'spricing order, with DoT facing the lowered price caps on long-distance charges, and rural connections pricedat the previous, lower rates, as allowed for in TRAI order.
Although the fact that the TRAI's pricing order was respected has strengthened the regulator, the possibilityexists that in the future the government could use its powers to issue policy directives to overturn TRAI's orders.
Power-Creating Genuinely political pressures by establishing their independenceIndependent Regulators will be extremely important given that the price
regulatory mechanism grants a relatively high degreeThe Electricity Regulatory Commissions Act, 1998 of discretion to the regulator.provides for the establishment of State Electricity The Electricity Regulatory Commissions Act, 1998,Regulatory Commissions. The moves by a number of also provided for the establishment of the Centralstates, including Delhi, Madhya Pradesh, Maharashtra, Electricity Regulatory Commission (CERC), to pro-Tamil Nadu, and West Bengal, to establish regulatory mote competition, efficiency, and economy in theagencies following the Act are welcome initiatives. electricity industry. The tariffs of central generatingHowever, most of these state commissions are estab- companies, the tariffs of other generators with alished by notification of the state government, rather composite scheme for generation and sale of electricitythan through legislation, and can be eliminated via de- in more than one state, the transmission of energy bynotification. They also have a relatively limited range POWERGRID, and the interstate transmission ofof powers, although again, more can be granted by electricity, including tariffs, are within its regulatorynotification by the state government. In contrast, mandate (see Annexes 5.1 and 5.2). The CERC hasthe regulatory commissions in Orissa and Haryana, started its operations in an impressive manner. Among

Improving Infrastructure to Reduce Poverty and Support Growth * 71
its major outputs are: (a) the order on the Indian the latter can be introduced, since a government
Electricity Grid Code in October 1999, following department or board has little concern about bottom
preparations by POWERGRID and hearings by the lines and the parameters set by regulators to achieve
Commission; and (b) a consultation paper on bulk efficiency. In the power sector, this means that the
electricity tariffs in September 1999, followed by exten- privatization of distribution, where losses due to theft
sive regional consultations in September-November and mismanagement are so pronounced, is key to
1999. CERC expects to issue its order on bulk power turning the sector around and meeting consumers'
tariff principles by early 2000, including an innovative needs. In telecommunications, DoT's present status as
frequency-linked power pool for unscheduled inter- a government department handicaps it in its role as
change. The new bulk power tariffs and the pool are service provider, giving it little mobility to counter
expected to help improve the operational discipline in competition or to innovate to meet emerging demands.
the regional grids and promote power trading. Corporatization would be an essential first step in
giving it more freedom. In the ports sector, the
Regulators Alone Will Not Solve the Problem separation of operations from public statutory activi-ties at the major ports will be an essential first step. The
It is also clear that the creation of an effective and introduction of competition within ports, either from
independent regulator alone will not transform an different terminals or services such as stevedoring, will
inefficient or loss-making company or sector. Regula- be key to ensuring that consumers get better deals for
tion is an imperfect alternative to competition, where port services.

Annex 5.1FUNCTIONAL CHARACTERISTICS OF REGULATORY BODIES
Appointment and removal Funding Consultative process Appeal of decisions, relation toof commissioners government policy
Telecom Regulatory Appointment by Central Presently funded through Art. It: 'The Authority shall High Court.Authority of India government. central government Budget. ensure transparency'. Central government can issue policy
Removal: Central government, Provision to charge fees, Consultative review on directives and can decide whether an issuefollowing recommendation of establish Telecom Regulatory methodologies and proposals constitutes policy.dismissal by Supreme Court. Authority of India General (e.g. recent tariff-setting
Fund to meet expenses. exercise).
Central Electricity Selection committee Consolidated Fund of India. Central Advisory Committee. High Court.Regulatory established by Central Central government can issue policyCommission government. Art. 37: Commission shall directives and can decide whether an issue
Removal: President of India, ensure transparency. constitutes policy.following recommendation ofdismissal by Supreme Court.
Orissa Electricity Selection committee State Consolidated Fund. Commission Advisory High Court for appeal on question of law.Regulatory constituted by state Committee. State government can issueCommission government. Public tariff hearings. policy directives. Central Electricity(also Haryana and Removal: state government, Consultative paper on tariff Authority resolves dispute betweenA ndhra Pradesh following report by judge of approach. OERC and state government over what
High Court of Orissa. constitutes policy.
State Electricity Selection committee appointed State Consolidated Fund. State Advisory Committee High court.Regulatory by state government. State government can issue policyCommission, Removal: Governor, following Art. 37: Commission shall directives, and can decide whether anby notification recommendation of dismissal ensure transparency. issue constitutes policy.following by High Court.1998 Act
Tariff Authority for Appointed and removed by Central government, through Public tariff hearings, public Central government has right to requireMajor Ports central government. Ministry of Surface consultations on tariff Authority to charge certain rates.
Transport. principles (although there areno specific legislative clauses Central government has right to require
relating to this. Authority to charge certain rates.Central government can suspendAuthority on notification in OfficialGazette.

Annex 5.2RESPONSIBILITIES OF REGULATORY BODIES
Pricing Licensing Dispute resolution Other
Telecom Notify tariffs for all Recommend need, timing, and terms Settle disputes Ensure effective compliance with universal service
Regulatory telecommunications services. and conditions of new service providers. between service obligations.Authority providers, and Render advice to government on telecommunications.
of India Regulate revenue sharing Recommend revocation of licence. between them Protect consumers' interests.between service providers, Ensure compliance of terms and and consumers. Facilitate competition and efficiency in the sector.technical aspects of conditions of licence. Maintain register of interconnect agreements.interconnection. Monitor quality of service, conduct periodical
surveys of this.
Central Electricity Generation: plant owned or Interstate transmission entities (under Settle disputes Promote competition, efficiency, and economy.
Regulatory controlled by central the amendment to the 1948 Electricity between Associate with environmental agencies to developCommission government; or selling to more Supply Act passed in 1998). generators and/ environmental regulations for the sector.
than one state. or transmittersInterstate transmission. which comeFrame guidelines for tariff- under its tariffsetting by SERCs. regulation
purview.
Orissa Electricity Regulation of prices charged Licensing of entities involved in Settle disputes Promote efficiency, economy, and safety.Regulatory by licensees. transmission and distribution of between Promote competition and progressively involve the
Commission power. licensees. private sector.(also Haryana and Regulation of quality of service of Collect relevant data, forecast demand, requireAndhra Pradesh licensees. licensees to formulate required plans in coordination
with others.
State Electricity Determine rates for wholesale, By notification of state government: By notification of Promote competition, efficiency, and economy.Regulatory bulk, grid and retail; use of Issue licences. state government: By notification of state government:Commission, transmirsion facilities. Settle disputes Regulate investment approval in sector.by notification Regulate workings of licensees, and between licensees Regulate operation of power system.following 1998 Act Regulate power purchase and exit and entry into industry. Require and/or utilities. Set and enforce service and safety standards for sector.
procurement process of licensees to formulate plans for meeting Promote privatization.transmission and distribution state electricity needs, including power Coordinate with environmental agencies to developutilities, for in-state sources. purchase scheme. environmental standards.
Tariff Authority Set tariffs at all major ports,for Major Ports including for private licensees
at ports.

6
Increasing the Demand for Labour:Deregulation to Increase Export Growth,
Agricultural Growth, and LabourMarket Flexibility
Overview Indonesia in detail). The recent crisis in South EastAsia, although painful, was small relative to the long
Sustained poverty reduction depends on rapid growth history of benefits from growth, and left the vast stockin both quantity and quality of labour demand. In turn, of infrastructure and education in place. Moreover,rapid growth in labour demand depends on rapid since the crisis, growth has rebounded surprisingly fastoutput growth. There is a strong association between in most of these countries.output growth and rising real wages in agriculture and Poverty reduction also depends on the labour inten-manufacturing (see, for example, World Bank 1995c for sity of growth-a sustained increase in labour demandcross-country evidence). Economic growth has also per unit of GDP. Little additional labour demandpromoted labour shifts from low productivity self- comes from capital-intensive growth fostered by pro-and informal employment in agriculture and services tection of inefficient industries and subsidized invest-to higher productivity and higher wage, formal em- ment. Moreover such a development strategy eventuallyployment in industry and services (for cross-country slows investment and growth because of the limitedevidence, see Fig. 2.3 in World Bank 1995c). Of course, size of the domestic market and the lack of competitivebroad-based human development, inclusive of females, pressure to upgrade capital (see World Bank 1998a andis needed to maximize the impact of rapid growth in Bhagwati 1998). At the same time, such a strategyoutput and labour demand on poverty reduction, as forces consumers to buy low quality/high cost goods,well as to sustain rapid growth. These relationships are and producers of potential exports to use high costillustrated in the rapidly growing East and South East inputs. Such concerns were major factors in India'sAsian economies, where poverty fell sharply and labour reforms in the early 1990s. However (i) tariff and non-incomes rose rapidly as education became more wide- tariff barriers in India still remain very high, makingspread (World Bank 1993; World Bank 1996b discusses it one of the most protected economies in the world;

Increasing the Demand for Labour * 75
(ii) labour market flexibility in the organized sector Trade, Growth, and Employmentremains low and has discouraged the creation of formalemployment, while the dominant unorganized sector Increased trade is positively related to growth ac-remains outside the purview of labour legislation that cording to numerous studies that use a variety of
regulates work standards and social security benefits methodologies.' Moreover international trade alsoreguates workers; and(i)agiutrds e,nd sociasecuy bens 62 increases the demand for labour in areas where it is bestto workers; and (iii) agriculture, which employs 62 able to compete internationally and raises real wagesper cent of the workforce, remains the least deregulated I y gsector in the economy and subject to inefficient and in the manufacturing sector (see Fig. 8.1 in World Bank
unsustainable public spending. These factors contrib- 1995c). Increases in exports and imports shift resourcesute to constraining the growth of labour demand. into industries where productivity is higher (measured
Thus, from the standpoint of poverty reduction, a at world prices), thus generating a higher national
key issue is the combined effect of growth and its output. In addition, higher exports allow firms tolabour intensity. In that regard, labour demand is explotaeconomiesof scale. Higherexportsandimportsunlikely to be stimulated by specific policies support- encourage competition and innovation; together withing labour, such as those favouring small-scale industry FDI, they encourage technology transfer, all of which
cotrbute to sustained increase in growth. The Eastor workers in the formal sector, when the overall contrlbt to sut ine nraei rwhTeEsoriworkers ind thegulormal smecor, whentheS overall and South East Asian countries provide an example ofincentive and regulator-y framework encourages capi- the benefits associated with rapid export growth.tal-intensive growth. A more effective approach toreduce poverty and increase labour demand in general Moreover, it iS worth noting that their export growthis likely to be a deregulated, general incentive frame- reflects a massive shift in the nature of exports-fromwork that encourages economy-wide growth and makes primary products, to labour-intensive manufactures, to
the best use of India's abundant labour. high-tech and capital goods (Yeats 1999)-a steadyAlong these lines, this chapter examines how India progression up the technology ladder that was associ-
can use further deregulation to increase growth in ated with a steady rise in labour demand for anlabour demand and output in three key areas: increasingly educated labour force.
* Encouraging more exports, and imports, as a India's Limited Use of Trade Benefitspercentage of GDP, since India's exports tend tobe more labour-intensive than import-substituting The share of trade in India's GDP has been low, lessindustries; than half of South East Asia's in the 1980s,2 or even
* increasing labour market flexibility to stimulate China's (see Box 6.1).3 Between 1977 and 1986, India'sgeneral growth of labour demand, and share of world exports declined from 0.61 per cent
*increaggrowth in the agricultural and rural to 0.47 per cent, and did not recover its 1977 level untilinctreasi ng 1996. It lost market share in major products to
sector, which still provides incomes for 73 per cent of EatAincuresInom podts(cligthe population.East Asian countries. In some products (including
the population. jewellery), where its share rose, others, includingPakistan and Bangladesh, did better (Srinivasan 1998,
Deregulation to Increase Trade, and Kathuria and Taneja 1986). This performancereflected India's well-known, severe anti-trade bias in
Growth, and Labour Demand tariffs, quotas, licences, etc. Nonetheless India's main
Despite improvements, India's trade and industrial export industries-textiles, leather, metal products,policie continue to impose a heavy cost in terms of and 'other' manufactures-demonstrated the benefits
policies continue to impose a neavyr cost in terms of ofeprig vrtepros17-3ad18-3slower export growth that feeds back into slower l X
growth in labour demand, output, and productivity. 1 See, for example, Bajpai and Sachs (1998); GOI (1999e),
This sectioti discusses how increased export growth, Stiglitz (1998); and Srinivasan (1998), which summarizes recentstudies.
with its consequent benefits in terms of poverty 2In 1985, India's trade to GDP ratio was 15 per cent,
reduction and higher growth, will depend on a second compared to Indonesia's 44 per cent, Thailand's 49 per cent, andphase of reforms that includes reducing protection, Philippines' 46 per cent.reducing bureaucratic transaction costs and logistic 3 In fact, as a share of PPP GDP, India's trade was only 4.5
delays for exporters, eliminating small-scale industry per cent in 1996 (World Development Indicators), since India's
reservation, and improving the environment for For- PPP GDP is much higher than the nominal dollar value of its
eign Direct Investment (FDI). GDP.

76 * India: Reducing Poverty, Accelerating Development
these industries exhibited rising labour productivity, similar to South East Asia's (Indonesia, Malaysia,capital deepening, and falling unit labour costs which Philippines and Thailand) 15.8 per cent. These yearswere accompanied by a rise in the rate of growth of coincided with a sharp rise in total (aggregate) factoremployment and wages (Gangopadhyay and Wadhwa productivity (see Chapter 8 and Annex 8.1), as would1998). The performance of these industries suggests have been predicted by the analyses noted earlier. Inthat export markets provide the scope for rapid, 1997, India's share of world trade declined (marginally)employment-intensive industrial expansion. More for the first time in six years, and the decline continuedgenerally, India's export industries are more labour- in 1998. This decline coincided with a slowdown inintensive than its import industries (see Annex Table GDP growth and a fall in total (aggregate) factor6.1), as well as more productive (see p. 78). These facts productivity. Despite the prior major reductionssuggest that an expansion of India's exports (and in protection, in 1997 India was still one of the mostimports) would increase output and labour demand. protected countries in the world (see Box 6.2). And
India's 1990-1 balance-of-payments crisis led to in 1997 and 1998, tariff protection rose (see Fig. 6.1)-major reductions in tariffs, licensing, and trade-related tariffs were raised across the board (except for petro-bureaucratic procedures and to a substantial exchange- leum) by 3 percentage points in September 1997, andrate devaluation, all of which increased export growth the 1998 Budget imposed an additional duty ofsharply. From 1992 to 1996, India's share of world 4 percentage points (which translated into about aexports increased every year (see Figure 6.1). Export 6 percentage point increase in average tariff, sincegrowth (in dollars) averaged 15.3 per cent per annum, the duty is levied on the c.i.f. price including all tariffs;
Box 6.1
CHINA'S EXPORTS AND INDIA'S FORGONE EXPORTS
Trade has been a key element in growth even for a country as large as China. China's exports of goods andservices grew from 6.3 per cent of GDP in 1980 to 21.0 per cent of GDP in 1996 and total trade reachednearly 40 per cent of GDP, thus contributing increasingly to its very impressive GDP growth of 10 per centper annum over this period. In contrast, India's exports of goods and services grew from 6.5 per cent to only11.6 per cent of GDP over 1980-96, while average GDP growth was 5.8 per cent per annum (see also AnnexTable 6.2). India did not take advantage of long periods of world trade growth, such as in the 1970s. AlthoughIndia was one of the largest developing country exporters in the 1950s, its share of world exports steadilydeclined and it was overtaken by the fast-growing East Asian economies in export markets.
It is interesting to make a very crude assessment of India's forgone opportunities. India and China startedout at roughly the same level of exports, with competition existing between them in many exports (see Kathuriaand Taneja 1986, and Srinivasan 1998). Thus China's exports can be used as a rough proxy for India's potentialexport level. In just one labour-intensive product, garments (comprising about 14 per cent of India's exports),India's total exports were $ 4.6 billion in 1996, compared with $ 25 billion for China. If the two countrieshad maintained the same share of exports (that is India and China had split their current sales evenly), thenIndia's garment exports would be about $ 15 billion. Thus India's anti-trade polices contributed to a potentialloss of S 10 billion of exports in one product alone (equal to over 25 per cent of current exports). This translatesinto millions of lost jobs and opportunities to make a real impact on poverty. The same would be true formany other Indian exports, which are largely labour-intensive (see Annex Table 6.1).
180 - W0650160 -
0.600 ' 5- 140-
> 120 REER 0.50
7I 80 0.500
40A 0.450 P 8.
20 0.4001989 1990 1991 1992 1993 1994 1995 1996 1997 1998
FIG. 6.1: India's Share in World Trade, REER, and TariffsSource: IMF for REER, WTO for trade, and World Bank for tariffs.

Increasing the Demandfor Labour * 77
Box 6.2INDIA: ONE OF THE MOST PROTECTED COUNTRIES
Despite liberalization, India's tariff and non-tariff protection remains higher than that in almost all largecountries. Even the 1999-2000 reduction in the coverage of QRs, to 28 per cent of output, leaves India'sQRs higher than those of most countries in 1990-3.
40 Average tariff rates 199835 (countries over 20 rillion)
30
25
20
1 5
I10
5
0
4:~~~~' 1' '0 '111 C11. '0- 1- 1 - 1-1-I- 1-1
S ouce: UN CT ATRIt 0_ _tb50 -- -U ~ ~
@~~~~~~ c4 > > tU S
30 - - -
n~~~~~~~~~c
*World Bank staff estimates.Soutrce: UNCTAD TRAINS Database
see World Bank 1998a for a discussion). Quantitative Asia. With only a 0.61 per cent share in world exportsRestrictions (QRs) remained roughly constant in 1997 in 1998, Indian exports could keep growing fasterand 1998 (see Annex Table 6.3). The average annual than world trade for some time, as the East Asianreal exchange rate for 1998 was about the same as in countries have done in the past and some, such as1993, with some depreciation occurring after Julyl1997 China and KZorea, continue to do even today (see(see Fig. 6.1 and Annex Table 6.4). Annex Table 6.5). What policies would India need to
get back to a sustained high export growth thatGetting Exports Back on Track increases labour demand? The best way would be to
Radelet et al. ( 1997) conclude that with a proper policy create an overall environment for export growth. Thisenvironment, South Asian export growth and GDP will ensure that India makes best use of its abundantgrowth could increase to the rates achieved in East labour resources. Since a high export growth rate and

78 * Indiz: Reducing Poverty, Accelerating Development
share of exports in GDP also means a high import import substitution, making inputs for exports moregrowth rate and share of imports in GDP, it will also expensive and keeping the exchange rate relativelyensure that firms, including domestically-oriented firms, appreciated. Rapid export growth requires low protec-face competition from the world market, thereby tion and rapid import growth, so that more of theencouraging them to improve product quality and scarce labour, capital, and other factors of productioninnovate. Finally, it will enstlre that firms can invest can move out of import-substitution and into exports.with a view towards the export market. One-shot Moreover this policy makes imported inputs cheaplypolicy changes only induce temporary boosts in ex- available and subjects domestic producers of inputs forports. Schemes to offset the anti-export bias of high exports to the discipline of import competition. Rapidprotection, typically work poorly and fail to generate export and import growth raises output, as well asthe general benefits of competition and export-oriented labour demand, since the factors of production caninvestment because of their complexity, fears of with- produce more output, valued at world prices, indrawal on the part of investors, and potential leakages exporting industries than in import-competing ones.in the benefits. For example, the effective rate of protection on the
Moreover such schemes are susceptible to charges secondary sector (mainly industry) was 47.6 per centthat they are export subsidies-even if that is not the in 1998-9, implying that on average, the use of land,case-as has been happening over the last year, and labour, and capital in the secondary industry was 47.6invite retaliatory action. Thus the best policy is to per cent less efficient than in the production of exportscreate an envvironment where an export policy is not (NCAER 1999). Also, by allowing more imports, aneeded, as the Commerce Minister stated in his EXIM reduction in protection increases the demand for for-Policy speech on 31 March 1999 ('EXIM Policy by eign exchange and, therefore, leads to a depreciation ofitself cannot achieve a very high export growth rate.') the exchange rate, which has a positive impact onMany of the issues raised here are echoed in the exports. An exchange rate appreciated by high tariffsMinister's speech. keeps both exports and imports low, and thus sacrifices
Specifically, action along the following lines will much of the gains from trade. Apart from this, therehelp reduce the anti-export bias and thereby increase is great administrative merit in moving to relativelyexports on a more sustained basis than in the past: low and uniform protection, since it reduces incentives
for classification disputes and bribery. In addition, lowi reducing protection to low and uniform levels tariffs make duty exemption schemes redundant, which
and limiting anti-dumping-a new form of protection; would greatly reduce transaction costs for exporters.
* maintaining an exchange rate that supports ex- Simplification of duties would also call for substitutionport competitiveness; of the complex and non-transparent system of basic
* reducing the bureaucratic transaction costs borne duty, surcharge, and special additional duty by a simpleby exporters; and single rate of duty.4
* reducing logistic and infrastructural delays; The 1999 EXIM policy reduced quantitative barrierssignifcantly, and the remaining restrictions are to be
* provding a more hosptable environment for eliminated (except for 533 out of 10,220 items onFDI; environmental, security, and religious grounds) by
* eliminating product reservation for small-scale April 2001 (see Box 6.3). The 1999 reduction in importindustry; and restrictions saw the QR coverage ratio (see Annex
* increasing labour market flexibility. Table 6.3) falling to 28 per cent in 1999-2000 from 38per cent in 1998-9, and 88 per cent in 1988-9.5 Until
These issues are discussed below in more detail.4 See World Bank (1998a). The imposition of the special
Rdi Trfrei low additional duty in 1998-9 and its special exemptions have led toReducing Tariff Protection to RelativelyLoJ, greater opacity rather than transparency in the duty structure.and Uniform Levels 5 These calculations involve aggregation by simple arithmetic
mean (Method I). On the basis of value-added weights, the QRTariffs have been Increased over the last two years, coverage is 22 per cent in 1999-2000, compared to 61 per centand anti-dumping (which also protects inefficiency) IS in 1998-9. The large drop is on account of substantial declines
on the rise (see Boxes 6.3 and 6.5). High protection in sectors, such as 'other' crops, sugarcane, and milk and milk
hurts exports by making import substitution more products, which have a large weight in the 1989-90 input-output
profitable than exports, diverting scarce resources to table.

Increasing the Demandfor Labour * 79
Box 6.3
RECENT DEVELOPMENTS IN TRADE POLICY
The EXIM Policy announced on 31 March 1999, has heralded the second generation of reforms by announcingan accelerated phase-out of QRs. Of the 2714 items notified under the BOP cover by the Indian government(not including items excluded on safety, environmental, and security considerations), as many as 1285 items(892 in the 1998 Policy) have been moved to the free list of imports, as against 1146 in the phase-out scheduleagreed to in the WTO, and another 685 items (414 in the 1998 Policy) have been put on the SIL list. Onthe restricted list 1429 items now remain (685 SIL, 744 restricted/canalized). This policy move is extremelydesirable on the grounds of efficiency, revenue generation, and export promotion. Protection through QRsgives unlimited protection, unlike tariffs which define the upper limit of protection and inefficiency that acountry is willing to live with. To the extent that actual imports increase, customs revenue will also go up.As mentioned earlier, this will also depreciate the exchange rate and improve export prospects. Nonetheless,the US preferred a faster phase-out of QRs, and obtained a dispute panel ruling in the WTO in its favour.In December 1999, India and the US reached an agreement to phase-out QRs on the remaining 1429 itemsby April 2001 (714 of which will be removed by April 2000), ahead of the originally agreed date of April2003. Other steps in the EXIM Policy include recognition of service exports' potential by treating serviceexports on a par with merchandise. Steps not taken, but mentioned by the Commerce Minister as neededfor export growth, include removal of export restrictions on agricultural and processed goods.
Unlike QRs, tariff protection has not declined in the last few years. Average (unweighted) tariffs at 39.6per cent in 1999-2000 are about the same as in 1995-6 (see Annex Table 6.6). Tariffs declined quickly after the1990-1 level of 128 per cent, slowed down after 1995-6, and reversed since September 1997 (World Bank 1998a).As a result of the 1999-2000 Budget proposals, which replaced the special duty of 5 per cent with a surchargeon basic duty of 10 per cent, and retained the non-transparent special additional duty of 4 per cent, the totalduty remained almost unchanged (unweighted tariff declined from 40.2 per cent in 1998-9 to 39.6 per centin 1999-2000, but tariffs weighted by 1995-6 imports rose from 29.7 to 30.2 per cent). Positive aspects of theBudget proposals include a decline in the dispersion of tariffs (which reduces classification disputes and makesfor less distorted production incentives), and a reduction in the peak rate. But the negative consequences ofhigh tariffs remain, as outlined on p. 78. Indian tariffs remain amongst the highest in the world (World Bank1998a). Announcing a clearly articulated tariff reduction schedule as part of the second generation of reformswill reduce investor uncertainty and the tariff-hopping type FDI (which, along with domestic investors, canlater create pressure against tariff reform).
such time as the QRs are eliminated, the high level of reducing fiscal deficit is important. A high deficit leadsQRs-particularly in agricultural products, textiles, to higher interest rates, higher inflows of capital, whichand some consumer goods-provides unlimited protec- keeps the exchange rate relatively appreciated. Whiletion to investments and constrains efficient investment there has been some depreciation since July 1997, the
decisions. QRs are particularly costly because they rupee's REER in September 1999 was more appreciatedimpose no limit on cost/quality differences and, thus, than in 1993 (see Annex Table 6.7). Moreover, India'sallow even more protection to inefficiency over time exchange rate has appreciated against some of itsthan tariffs. By switching fairly quickly to tariff-based potentially strongest competitors, such as Indonesia,
protection and gradually reducing it in a predefined Malaysia, Thailand, and Korea. From a longer-runway, India could reduce the degree of domestic ineffi- standpoint, however, continuous depreciation fasterciency, ease the adjustment process, and capture some than domestic inflation is likely to feed back intoof the benefits, that currently go to producers, in terms accelerating inflation, and is therefore not a panacea toof increased revenue. sluggish exports. In the long run, only increases in
productivity can bring about sustained increases in
Exchange Rates export growth.
Previous export booms, notably during 1986-90 and1993-6, have been associated with depreciation of the Reducing the Bureaucratic, Transaction CostsREER. Roberts and Tybout (1997) indicate that sus- To reduce these costs borne by exporters is a daunting
tained export growth depends on an exchange rate that task, given the complexity of the regulations, theirmaintains export profitability, as well as a commercial multiple origins (revenue protection, foreign exchangepolicy that is not biased against exports. In this context, control), their interaction with other elements such as

80 * India: Reducing Poverty, Accelerating Development
cargo logistics and customs procedures (see Chapter 4 export performance (UNCTAD 1999, pp. 246-7). Infor evidence), and widespread entrenched vested China, foreign affiliates' share in total exports roseinterests. 6 A reduction of transaction costs would from 17 per cent in 1991 to 41 per cent in 1997. In India,need to address customs clearance procedures for foreign affiliates have played a much smaller role-inboth imports and exports, as well as duty- and tax-free 1996, FDI inflows accounted for only 2.9 per cent ofaccess to imported inputs, which could be based on a gross fixed capital formation (GFCF) in India againstmodern systems approach relying on self-compliance China's 17.0 per cent, and the FDI stock to GDP ratios(tax payers), risk analysis, and management (customs), were 2.6 per cent and 24.7 per cent, respectivelysupoorted by periodic ex-post audits of records. Elec- (UNCTAD 1999, p. 232 and UNCTAD 1998, pp. 6,tronic Document Interchange (EDI) techniques could 204, 394, 408). This has meant that India has lost outbe aggressively used to lock in simplified procedures, on potential labour-intensive and other exports, as wellautomate routine procedures, and minimize face-to- as opportunities for far greater spread of technologyface contacts. and, thus, increase in productivity. 7
FDI is also deterred by the very poor state ofReducing Logistic anzd Infrastructural Delays infrastructure (including ports, roads, phones, and
A reduction in logistic and infrastructural delays is power) where India ranked the lowest among fifty-essential for India's competitiveness in today's time- three countries in the 1998 Global Competitivenesssensitive markets. The simplification of cargo handling Report. Apart from infrastructure, post-approval imple-and customs procedures is one part of the solution. mentation in India remains slow, which deters invest-This should be accompanied by the privatization of ment and the conversion of approvals into inflows.port management, the adoption of a landlord port Other deterrents to FDI in India are its rigid labourapproach-where the port authority owns the land and laws and poor industrial relations (see the followingbasic infrastructure and leases it out to operators-and pages). India is attempting to tackle some of thesefinally the full privatization of ports. Data for contain- problems, for example, by seeking to attract FDI inerized sea freight in Mumbai suggest that dwell time infrastructure. However, the expected changes in infra-for imports could be from 10-19 days (and it is worse structure regulation have been slow in coming (seeat all other ports except for the JNCP), which is far Chapter 5), which has been a factor in the worrisomemore than the best practice of less than thirty hours. slowdown in FDI (see Annex Table 6.8).Apart from the JNCP, which is starting operations, nomajor International Container Line (ICL) has sched- Unshackling the Small-scale Sector
uled stops in India, so that container cargo has to be The small-scale industry (SSI) sector successfullyshipped via feeder lines to either Singapore or Sri produces labour-intensive export items, and providesLanka, which means further delays. the second highest employment after agriculture
(roughly 50 million in 1996-7). In 1997-8, there wereProviding a More Hospitable over 3 million SSI units in India which accounted
Environment for EDI for about 40 per cent of the total production of the
By discriminating between core and non-core FDI, manufacturing sector, 35 per cent of exports, and 80India's access to global production networks and intra- per cent of additional employment in manufacturingfirm trade was severely restricted. In 1995, for example, 7 Of course, the benefits of FDI can be fully realized onlyalmost one-third of world exports were accounted for if domestic markets are competitive, protection levels low, andby foreign affiliates. US data, if extrapolated to the quantitative restrictions non-existent, and if subsidies and ircen-rest of the world, suggest that more than a third of tives are transparent and small. In the absence of these, foreignworld exports are between affiliated firms. A recent firms may indulge in'tariff-hopping' type FDI, turn rent-seekerseconometric study of fifty-two countries suggests that (and often do a bettcr job of that), and could even join thethere is a positive and significant correlation between protectionist lobby. One instance is provided by the car firmforeign direct investment (FDI) and manufactured Maruti-Suzuki. Granted early access to the domestic market two
decades ago, Maruti quickly went on to dominate the market,6 See Maxwell and Export-Import Bank of India (1998). Both facing little domestic or import competition (imports are subject
the Commerce and Finance Ministries have voiced their concern to strict QRs). Since the mid-1990s, and especially since 1998,about the impact of hligh transaction costs on exports. The it has faced increasing domestic competition, forcing it to slashFinance Minister has set up a Coommittee headed by the Revenue prices of its largest selling model, and introduce newer modelsSecretary to suggest measures to reduce high transaction costs in at a much faster pace than hitherto, which has been highlyforeign trade licensing, tax procedures, and the banking system. beneficial for the consumer.
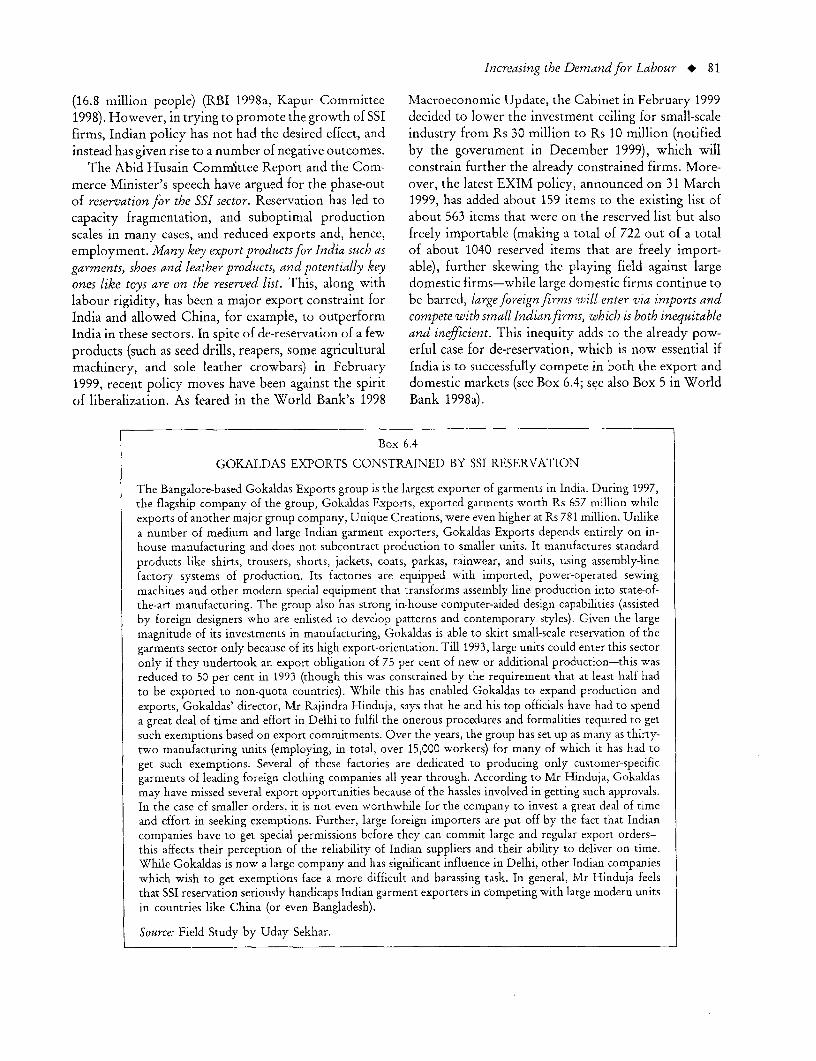
Increasing the Demandfor Labour * 81
(16.8 million people) (RBI 1998a, Kapur Committce Macroeconomic Update, the Cabinet in February 19991998). However, in trying to promote the growth of SSI decided to lower the investment ceiling for small-scalefirms, Indian policy has not had the desircd effect, and industry from Rs 30 million to Rs 10 million (notifiedinstead has given rise to a number of negative outcomes. by the government in December 1999), which will
The Abid Husain Committee Report and the Com- constrain further the already constrained firms. More-merce Minister's speech have argued for the phase-out over, the latest EXIM policy, announced on 31 Marchof reservation for the SSI sector. Reservation has led to 1999, has added about 159 items to the existing list ofcapacity fragnientation, and suboptimal production about 563 items that were on the reserved list but alsoscales in many cases, and reduced exports and, hence, freely importable (making a total of 722 out of a totalemployment. Many key export productsfor India such as of about 1040 reserved items that are freely import-garments, shoes and leather products, and potentially key able), further skewing the playing field against largeones like toys are on the reserved list. This, along with domestic firms-while large domestic firms continue tolabour rigidity, has been a major export constraint for be barred, large foreign firms will enter via imports andIndia and allowed China, for example, to outperform compete with small Indianfirms, which is both inequitableIndia in these sectors. In spite of de-reservation of a few and inefficient. This inequity adds to the already pow-products (such as seed drills, reapers, some agricultural erful case for de-reservation, which is now essential ifmachinery, and sole leather crowbars) in February India is to successfully compete in both the export and1999, recent policy moves have been against the spirit domestic markets (see Box 6.4; see also Box 5 in Worldof liberalization. As feared in the World Bank's 1998 Bank 1998a).
Box 6.4
GOKALDAS EXPORTS CONSTRAINED BY SSI RESERVATION
The Bangalore-based Gokaldas Exports group is the largest exporter of garments in India. During 1997,the flagship company of the group, Gokaldas Exports, exported garments worth Rs 657 million whileexports of another major group company, Unique Creations, were even higher at Rs 781 million. Unlikea number of medium and large Indian garment exporters, Gokaldas Exports depends entirely on in-house manufacturing and does not subcontract production to smaller units. It manufactures standardproducts like shirts, trousers, shorts, jackets, coats, parkas, rainwear, and suits, using assembly-linefactory systems of production. Its factories are equipped with imported, power-operated sewingmachines and other modern special equipment that transforms assembly line production into state-of-the-art manufacturing. The group also has strong in-house computer-aided design capabilities (assistedby foreign designers who are enlisted to develop patterns and contemporary styles). Given the largemagnitude of its investments in manufacturing, Gokaldas is able to skirt small-scale reservation of thegarments sector only because of its high export-orientation. Till 1993, large units could enter this sectoronly if they undertook an export obligation of 75 per cent of new or additional production-this wasreduced to 50 per cent in 1993 (though this was coustrained by the requirement that at least half hadto be exported to non-quota countries). While this has enabled Gokaldas to expand production andexports, Gokaldas' director, Mr Rajindra Hinduja, says that he and his top officials have had to spenda great deal of time and effort in Delhi to fulfil the onerous procedures and formalities required to getsuch exemptions based on export commitments. Over the years, the group has set up as many as thirty-two manufacturing units (employing, in total, over 15,000 workers) for many of which it has had toget such exemptions. Several of these factories are dedicated to producing only customer-specificgarmlents of leading foreign dothing companies all year through. According to Mr Hinduja, Gokaldasmay have missed several export opportunities because of the hassles involved in getting such approvals.In the case of smaller orders, it is not even worthwhile for the company to invest a great deal of timeand effort in seeking exemptions. Further, large foreign importers are put off by the fact that Indiancompanies have to get special permissions before they can commit large and regular export orders-this affects their perception of the reliability of Indian suppliers and their ability to deliver on time.While Gokaldas is now a large company and has significant influence in Delhi, other Indian companieswhich wish to get exemptions face a more difficult and harassing task. In general, Mr Hinduja feelsthat SSI reservation seriously handicaps Indian garment exporters in competing with large modern unitsin countries like China (or even Bangladesh).
Source: Field Study by Uday Sekhar.

82 * India: Reducing Poverty, Accelerating Development
Getting Indian Industry Ready for the firms have successfully lobbied for a significant increasePhase-out of QRs and the Multi-fibre in the use of anti-dumping AD (see Box 6.5).
Arrangement (MFA) More importantly, a response that deals with India'sown structural policies will yield greater dividends than
As part of its WTO commitments, India has agreed one which seeks to fine-tune the AD system. A systemto phase out all QRs on imports (except those imposed that responds to the increasing competition fromon strategic or environmental grounds) by April 2001, imports (as QRs and, presumably, tariffs decline) byand on half of these by April 2000 (see Box 6.3). The trying to create an environment for quicker and moreAgi-eement on Textiles and Clothing (as the MFA is flexible responses-by, for example, making labournow called) is scheduled to end in 2005. Is industry laws less rigid, improving bankruptcy and foreclosure,ready for the increased competitive pressure, domesti- and not bailing out industries or sectors that are incally and internationally, that this will entail? There is trouble-should in the longer run make the economya wide variety of industries that are very competitive, less vulnerable to competition. Of course, these re-and can hold their own in any market. But there are sponses will have to be accompanied by a muchmany, such as some of the capital-intensive, continuous improved system of retraining, lay-off compensationprocess industries, that may be less able to compete schemes (see following pages), and so on, to take carewith imports (Kathuria 1995). With trade liberaliza- of the sectors that will be affected. On the other hand,tion, there is bound to be some restructuring of a response that involves substantial use of protection,industry, with resources being drawn away from will, as seen above, increase the anti-export bias andimport-substituting to exporting industries. Domestic reduce exports, render related industries less competi-rigidities and policy distortions need to be phased out tive, induce retaliatory protection amongst tradingto enable domestic industry to compete more effec- partners, and eventually lead to a higher cost and moretively. As discussed earlier, these would include the vulnerable economy.need to deal with labour markets, small-scale reserva- In this context, further analytical work on optionstion, and tariff and non-tariff barriers. Unless these are before India in the next round of trade negotiations woulddealt with expeditiously, Indian firms will increasingly help India make more informed and strategic choices.have to compete with imports that are not subject to Policy making would also benefit from further analysis ofsuch constraints (as we have seen, exports are also the linkages between growth, exports and imports, laboursimilarly constrained). demand, and education.
For example, textiles and garments, one of India'smost important industries, faces several opportunitiesas well as threats. Opportunities will open up as Improving Labour Market Flexibilitydeveloping country exports will no longer be subjectto quotas after 2005. However, this also means that the Any strategy to improve the condition of the poormost competitive suppliers will ease out those who had hinges on improving the labour market, since incomesurvived only because of the quotas. India stands from work and quality of work are the main determi-to make substantial gains provided it creates the nants of the living conditions of the poor (World Bankright policy environment'-including dereservation of 1995c). India is endowed with an abundant and tech-garments for exclusive SSI production, a flexible labour nologically skilled (especially engineers and scientists)policy with safeguards, removal of policy bias against labour force, and is ranked first among fifty-threesynthetic fibres, automatic approval of EDI in gar- countries for both these criteria in the Global Competi-ments up to 51 per cent foreign equity (see pp. 77-82). tiveness Report (GCR), 1998. However, India's labourOn the other hand, slow/lack of action on these issues market is ranked forty-fifth for degree of labour marketcould mean not only a loss of export markets but also flexibility in the GCR 1998. Rigidities include rigiditiesincreasing import penetration in the textiles and gar- in the deployment of human resources, in workments industry. practices, and in wages. Various studies suggest that
The pressure is already being felt. Partly because such rigidities constrain the effective redeployment ofof having to cope with continuing domestic policy labour during the process of adjustment to changes indistortions in the face of increasing competition, Indian demand and technology, and more importantly, act as
8See Pigato et al. (1997) and references therein for the gains a disincentive towards future employment creation,from the MFA abolition, and Kathuria and Bhardwaj (1998) for that is, there appears to be a trade-off between creatingthe industry analysis. better paying, low turnover jobs and the overall
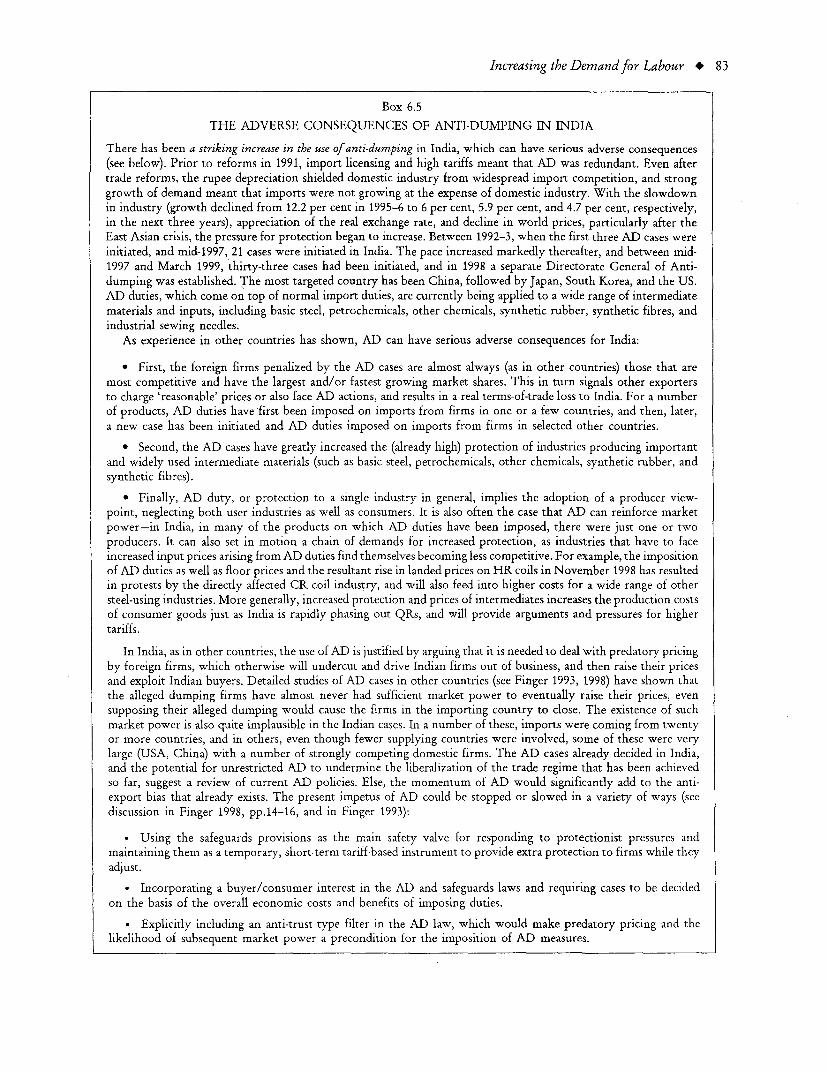
Increasing the Demandfor Labour * 83
Box 6.5
THE ADVERSE CONSEQUENCES OF ANTI-DUMPING IN INDIA
There has been a striking increase in the use of anti-dumping in India, which can have serious adverse consequences(see below). Prior to reforms in 1991, import licensing and high tariffs meant that AD was redundant. Even aftertrade reforms, the rupee depreciation shielded domestic industry from widespread import competition, and stronggrowth of demand meant that imports were not growing at the expense of domestic industry. With the slowdownin industry (growth declined from 12.2 per cent in 1995-6 to 6 per cent, 5.9 per cent, and 4.7 per cent, respectively,in the next three years), appreciation of the real exchange rate, and decline in world prices, particularly after theEast Asian crisis, the pressure for protection began to increase. Between 1992-3, when the first three AD cases wereinitiated, and mid-1997, 21 cases were initiated in India. The pace increased markedly thereafter, and between mid-1997 and March 1999, thirty-three cases had been initiated, and in 1998 a separate Directorate General of Anti-dumping was established. The most targeted country has been China, followed by Japan, South Korea, and the US.AD duties, which come on top of normal import duties, are currently being applied to a wide range of intermediatematerials and inputs, including basic steel, petrochemicals, other chemicals, synthetic rubber, synthetic fibres, andindustrial sewing needles.
As experience in other countries has shown, AD can have serious adverse consequences for India:
* First, the foreign firms penalized by the AD cases are almost always (as in other countries) those that aremost competitive and have the largest and/or fastest growing market shares. This in turn signals other exportersto charge 'reasonable' prices or also face AD actions, and results in a real terms-of-trade loss to India. For a numberof products, AD duties have first been imposed on imports from firms in one or a few countries, and then, later,a new case has been initiated and AD duties imposed on imports from firms in selected other countries.
* Second, the AD cases have greatly increased the (already high) protection of industries producing importantand widely used intermediate materials (such as basic steel, petrochemicals, other chemicals, synthetic rubber, andsynthetic fibres).
* Finally, AD duty, or protection to a single industry in general, implies the adoption of a producer view-point, neglecting both user industries as well as consumers. It is also often the case that AD can reinforce marketpower-in India, in many of the products on which AD duties have been imposed, there were just one or twoproducers. It can also set in motion a chain of demands for increased protection, as industries that have to faceincreased input prices arising from AD duties find themselves becoming less competitive. For example, the impositionof AD duties as well as floor prices and the resultant rise in landed prices on HR coils in November 1998 has resultedin protests by the directly affected CR coil industry, and will also feed into higher costs for a wide range of othersteel-using industries. More generally, increased protection and prices of intermediates increases the production costsof consumer goods just as India is rapidly phasing out QRs, and will provide arguments and pressures for highertariffs.
In India, as in other countries, the use of AD is justified by arguing that it is needed to deal with predatory pricingby foreign firms, which otherwise will undercut and drive Indian firms out of business, and then raise their pricesand exploit Indian buyers. Detailed studies of AD cases in other countries (see Finger 1993, 1998) have shown thatthe alleged dumping firms have almost never had sufficient market power to eventually raise their prices, evensupposing their alleged dumping would cause the firms in the importing country to close. The existence of suchmarket power is also quite implausible in the Indian cases. In a number of these, imports were coming from twentyor more countries, and in others, even though fewer supplying countries were involved, some of these were verylarge (USA, China) with a number of strongly competing domestic firms. The AD cases already decided in India,and the potential for unrestricted AD to undermine the liberalization of the trade regime that has been achievedso far, suggest a review of current AD policies. Else, the momentum of AD would significantly add to the anti-export bias that already exists. The present impetus of AD could be stopped or slowed in a variety of ways (seediscussion in Finger 1998, pp.l4 -16 , and in Finger 1993):
* Using the safeguards provisions as the main safety valve for responding to protectionist pressures andmaintaining them as a temporary, short-term tariff-based instrument to provide extra protection to firms while they
adjust.
. Incorporating a buyer/consumer interest in the AD and safeguards laws and requiring cases to be decidedon the basis of the overall economic costs and benefits of imposing duties.
* Explicitly including an anti-trust type filter in the AD law, which would make predatory pricing and thelikelihood of subsequent market power a precondition for the imposition of AD measures.

84 India: Reducing Poverty, Accelerating Development
creation of good jobs (see for example, Fallon and and the consequent reluctance of employers to createLucas 1993; OECD 1995; ILO 1999). The industrial formal employment. This is borne out by an industryrelations scenario, as reflected by man-days lost due to survey, which identifies labour regulation as the secondstrikes and lockouts, has been confrontational as com- highest obstacle to the operation and growth of busi-pared to international standards. However, industrial ness (Annex Table 4.6) and discussions with industri-relations have been improving significantly-man-days alists.10lost fell from an average 28.6 million per annum over The other side of the rigid, high-cost organized1989-92 to 17.1 million per annum in the post-reform labour market was a low-cost unorganized sectorperiod of 1993-8. with a flexible, unorganized labour market which
absorbed the growth of labour. Average labour inten-
Current Labour Regulations Impede the sity in unregistered manufacturing increased from anGrowtb of Formal Employment average of 59.3 per cent over 1988-9 to 1990-1 to 62.4
per cent over 1993-4 to 1995-6 (see World Bank 1998a,Only about 9 per cent of India's workforce is in the Annex Table 12). Hence, had labour markets func-organized sector. Of course, to a large extent this tioned more flexibly, pensions been more mobile, andreflects the still high share of agriculture (62 per cent legislation been more conducive, the organized sectorin 1993-4) in the workforce, owing partly to the might have occupied a more prominent share of thelow growth in manufacturing employment. However, workforce. Formal sector employees might have growneven in manufacturing, formal sector employment is more rapidly and been more mobile, and the benefitsonly at 25 per cent of the workforce. In the private of more formal employment shared across a largermanufacturing sector, formal sector employment is number of employees, including women, who haveeven lower, at 15.5 per cent of the workforce. been unable to participate fully in the labour market
This segmentation of labour can be explained by (see Box 6.6). All this means that while India's com-the pattern of growth in which domestic regulation parative advantage lies in labour-intensive products,and protection from imports encouraged increasingly labour laws and procedures militate against efficient usecapital-intensive industries (see Gangopadhyay and of that advantage.Wadhwa 1998), while labour legislation (see the follow-ing pages) and public sector employment gave employ- Labour Legislationment protection and relatively high wages to the few .emploved in the formal sector. In addition, labour The main rigidities i the labour laws iclude amobility across sectors has been hindered by the very wide scope for initiating industrial disputespension system in the formal sector-generally speak- (which can be initiated On the basis of 'interests' rathering pensions are not mobile across jobs and many years than rights'), long procedures for settlement ofof work are needed before an employee becomes industrial disputes, inflexible provisions relating toeligible for a pension. change in conditions of service (instead of being
Employment growth in the organized sector was part of the collective bargaining process), and provi-only 1.6 per cent per annum during 1981-91 and sions enabling government interventions in areas suchindustrial sickness increased even as manufacturing as lay off, retrenchment and closures."1 This legislativeoutput was rising rapidly ApMrMukeshAmbani, Vice-chairman of Reliance Industries,ment elasticity for the organized manufacturing India's largest private sector company, recently declared in asector during 1981 to 1991 was only 0.09 (0.14 for meeting with World Bank staff that Reliance could increase its1981-97) and 0.30 for the organized sector as a whole textile and garments business tenmold, from its current $ 0.5(0.23 for 1981-97). Over the period 1991-5 the growth billion to $ 5 billion-provided labour laws, which he consideredrate of formal employment dropped even lower, to 0.6 the single biggest barrier to India's industrial growth, wereper cent per annum While the most recent period eased.partly reflects the cyclical slowdown and recovery, the 11 The principal legislation covering employment security aredevelopments over the whole period are in large the Industrial Disputes Act 1947 (provides for settlement ofdevelopments over the whole period are in large disputes in cases of termination) and the Industrial Employmentpart explained by the low flexibility of labour use Act 1946 (sets rights and obligations of employees and employers
relating to service rules). industrial sickness is dealt with under9 One important reason for industrial sickness is believed to the framework provided by the IndustrialDisputesAct 1947 (and
be the poor link between wages and productivity (Anant and the 1976 Amendment), the Companies Act 1956, and the SickGoswami 1997). Industries Companies Act 1985.

Increassing the Demandfor Labour * 85
Box 6.6
WOMEN IN THE INDIAN LABOUR MARKET
Women are a particularly vulnerable segment of Indian society. While females represented 32.4 per cent ofthe labour force in 1993-4 (33.9 per cent in 1977-8), their labour force participation rate was about half thatof males (28.8 per cent for females and 55.6 per cent for males). The female labour force grew at 1.8 per centper annum between 1977-8 and 1993-4 (2.2 per cent per annum for males). Whereas the low femaleparticipation rate is partially due to the statistical invisibility of women's work (housekeeping, tending cattle,etc.), there is evidence that they face discrimination in the labour market. For example, while the recordedrate of unemployment for females (at 1.8 per cent in 1993-4) is lower than that for males (2.6 per cent), thisconceals large female underemployment (87.8 per cent of the subsidiary workers, that is, those working foronly a small part of the reference period, or 'discouraged' workers, were women in 1993-4). Furthermore,the quality of female employment is lower than that of males. A large proportion of females are employedin the agricultural sector (74.5 per cent of total females in 1993-4, compared to 56.9 per cent of total males),and as casual labour. In 1997, only 16.4 per cent of total organized labour was female (14 per cent of the publicsector and 22 per cent of the private sector). Females also earn lower wages than males in similar occupations(for example, they earned 71 per cent of the daily wage earned by males in casual agricultural labour).
The above features are partly a result of inequalities in educational attainment. The average number ofyears of schooling for females was 2.3 in 1993-4 (1.5 in 1983), about half that of males (4.3 in 1993-4 and3.3 in 1983). Inequalities are also present in the political systems (the 33 per cent women's reservation in localgovernments is not utilized), the legislative framework (for example equal rights of inheritance in propertyrights laws are not enforced; in Andhra Pradesh, legislation has been passed to enable land titles to be givensolely to women, with good results), and the credit market (women lack the collateral needed to raise loans).As a result, women are largely poorer than men in India. Any strategy targeted at poverty reduction in Indiawill necessarily have to redress the constraints faced by women in participating fully in the political, legal,and economic systems.
Sources: Ghosh 1999; GOI 1999e.
framework impedes large-scale industrial restructuring, incorporating is that it forecloses access to formal creditrelocation or exit, and even the relocation of labour markets including capital markets.within an enterprise and often even in the same city/ As many as 165 labour legislations exist in India,town. In the private sector, these rigidities are circum- including 47 Central Acts (Debroy 1997), and substan-vented by the setting up of smaller units which are tial need exists for harmonizing and rationalizing them.beyond the purview of labour legislation, or the For example, as the Acts have evolved, definitionalincreasing use of contract labour, which further in- variations have developed in concepts such as employee,creases the divergence between the organized and workman, wages, factory, and industry. The term 'wage'unorganized sectors. Future policies aimed at strength- has been defined in 11 different ways in as many labourening voluntary arbitration, conciliation, collective laws. The greater part of labour legislation is inbargaining (by allowing recognized representative the Concurrent List of the Seventh Schedule of Articletrade unions), 12 and promoting tripartite dialogue, will 246 of the Indian Constitution, giving both Central andreduce disputes and litigation. Also the implementation state governments the power to legislate for items thatof labour laws, in particular labour welfare laws, results are on this list. State-level amendments were activelyin the 'Inspector Raj' syndrome, which affects SSIs introduced, for example by West Bengal, Andhradisproportionately. For example, SSIs are constrained Pradesh, Maharashtra, Gujarat, and Madhya Pradesh."3
by excessive regulatory burdens and disclosure require-ments-80 per cent therefore operate without incorpo- 13 Special provisions have been incorporated by states in therating (World Bank 1998a). A key impact of not Trade Unions Act 1926 (for exarnple Gujarat, Madhya Pradesh,
Maharashtra, Orissa, Uttar Pradesh, and West Bengal) andInduistrial Disputes Act 1947 (for example Andhra Pradesh,
12 Under the Trade Ulnions Act 1926, a minimum of seven Karnataka, Kerala, Gujarat, Maharashtra, Madhya Pradesh, andemployees can form and register a trade union-this results in West Bengal) (Venkata Ratnam 1999). Wage protection under thea multiplicity of trade unions. In addition, though the Industrial Minimum Wages Act 1948 covers 79 job categories in Orissa,Disputes Act 1947 refers to the term 'recognized union', this is while only 8 in Manipur (Anant 1998). In addition, the rangenot defined-hence employers only recognize the majority of minimum wages varies from the highest in Maharashtra tounion for the purpose of collective bargaining. almost none in Haryana.

86 * India: Reducing Poverty, Accelerating Development
Differences among states also arise in the institutional increase the demand for labour endowed with basic
framework"4 and the industrial relations scenario.15 education, and, in turn, increase the opportunity cost
However, state governments are required to refer their of child labour. Concomitantly, the proper enforce-amendments to legislations to the Centre for the assent ment of domestic child labour laws will contribute to
of the President of the Indian Union. This procedure reducing the demand for child labour.has been slow, and proposals submitted by Tamil Naduand Andhra Pradesh a few years ago, for example, havestill not been processed. To bypass this process, some Improving Agriculture's Contributionstates have substituted the term 'appropriate govern- to Developmentment' with 'state government' in the Industrial Dis-putes Act 1947. Furthermore, it is difficult to gauge Agricultural growth has been a major factor in reducing
truly the labour situation in the states, as over half the poverty (see Chapter 1 and references therein). Over
states do not submit even the statutory returns (such the 1990s, agricultural GDP trend growth of 3.3 per cent
as number of registered unions) to the Labour Bureau. per annum was (statistically) similar to that in the1980s, according to the new National Accounts Statis-
Reducing Child Labour tics, and foodgrains production trend growth was 2.6
Reducing child labour is an area where efficient labour per cent per annum (both well in excess of (declining)
legislation must be complemented by effective eco- population growth, estimated at 1.6 per cent per annum
nomic measures. India already has well-framed child (GOI 1999b), although still subject to substantial year-
labour laws (though there is lack of harmony in the to-year volatility).' 6 Yet rural poverty declined much
definition of 'child'). However, 11 million children less in the 1990s as compared to the 1980s.
were working according to the 1991 census. Moreover, Two elements may partly explain agriculture's lim-
this figure may well be an an underestimate-a study ited impact on poverty in the 1990s, and raise questionsby the Indian Operations Research Group quotes a about the sustainability of current agricultural growth
figure four times larger. India ranks 5 2nd out of 53 unless policy changes occur. First, the overall picture
countries in relation to the perception as to whether conceals an agricultural slowdown in the northernchild labour is strictly prohibited (World Economic and eastern states, which has probably contributed
Forum, The Global Competitiveness Report 1998). to their slow reduction in poverty. Second, the pace
While income poverty reduction provides the most and pattern of technological change in agriculture
sustainable solution to eliminate child labour, policies may have changed There are some indications thatto improve the health status of working children and agricultural productivity growth has begun to slow.
broaden educational opportunities are also needed. These changes are both related to the inefficiencies in,
Improving the quality of education will help stimulate and unsustainability of, the current pattern of public
the demand for education, thus diverting children from spending in agriculture, and to the limited reform in
work. In addition, expanded production of labour- agriculture (see World Bank 1999b for a fuller discus-
intensive products based on reduction in protection, sion of these issues and what follows; note that much
increasing FDI, dereservation, etc. (see pp. 75-82) will of the analysis of regional growth and technical progressis based on the old GDP Accounts, which showed a
14 In Kerala, Industrial Relations Commissions operate in slowing of agricultural GDP growth)industries such as plantations, and various welfare funds are inplace for unorganized workers. In Maharashtra and West Bengal, 16 Both trend growth rates are calculated using time-seriesspecial employment guarantee schemes have been implemented, regressions, starting in 1978 to avoid beginning in a trough orwhile welfare schemes are available in Tamil Nadu. The Rajasthan boom year. The regressions were calculated using the new NASRoadways has a profit-sharing scheme with its employees and for 1993-4 onward, and calculating a corresponding figure forRajasthan has a renewal fund for redeployment of sick industries pre-1993-4 GDP in agriculture by applying the growth ratesemployees. from the old NAS to the new base. No statistically significant
5 For example, while politically affiliated unions are com- break exists between the 1980s and the 1990s, although growthmon in West Bengal and independent enterprise level unions are seems less variable in the 1990s than the 1980s, which includedwidespread in Maharashtra, most industries in Karnataka (par- a major drought of 1987. Both point-to-point and trend growthticularly in Bangalore) are union-free. As central legislation rate estimates are highly sensitive to starting and ending points.provides for trade union registration, but not recognition, Note that the old NAS do show a statistically significant declineAndhra Pradesh has been using the secret ballot system for in agricultural GDP growth (though not foodgrains) in therecognition, and Orissa and West Bengal have recently intro- 1990s. The difference reflects the inclusion of new agriculturalduced this system through legislation. products in the new, 1993-4 based, NAS.

Increasing the Demandfor Labour * 87
Broadly speaking, the public policy approach to (such as private investment in generating sets). At theagriculture, particularly in the 1990s, has been to same time, power capacity is underutilized because ofsubsidize power, water, and fertilizer inputs, implicitly poor distribution and maintenance, and excessive useor explicitly, in order to keep down the increases in of capital on farms encouraged by low-cost creditfood price, including the costs of the massive PDS that (Binswanger and Khandakar 1995). The Centre's andis used by many of the non-poor. The equity, effi- states' fiscal problems suggest that subsidies cannotciency, and sustainability of the current approach continue to grow and rural capital and technologicalremain open questions. The subsidies also have unclear basis for growth will be limited by the past pattern ofimpacts on income distribution and the demand for spending.labour. The boost in output from subsidy-stimulated In addition, agriculture has seen much less reformuse of fertilizer, pesticides, and water may partly be than the other sectors. While overall reforms relatedcoming at the expense of deterioration in the aquifers to the exchange rate and industrial protection haveand soil-an environmentally unsustainable approach helped, agriculture is still constrained by central andthat may partly explain the rising costs and slowing state regulations that limit price movement and intra-growth and productivity in agriculture, notably in state trade, public procurement, and canalization ofPunjab and Haryana (see, for example, Chand 1999). trade (see Table 6.1). For example, simply allowingMoreover, the limits on public finance (see Chapters greater private trade in products would help reduce3 and 8) have meant that subsidies have, in effect (a) price fluctuations; more general reforms would im-(crowded-out' public agricultural investment in roads prove the productivity of labour and land use andand irrigation and expenditure on technological up- stimulate agricultural exports. Removal of small-scalegrading, (b) limited maintenance of canals and roads, reservation would help the growth of domestic agro-and (c) contributed to the low quality of rural power. industry, which in some cases is now facing increasedThese problems are particularly severe in the poorest competition from larger size offshore producers as astates. Although private investment in agriculture has result of lower protection. Cotton and textile policiesgrown, this is partly a substitute for lower public effectively tax cotton producers by 15 per cent, andinvestment and deteriorating quality of public services, oilseed policies effectively tax oilseed producers by 30in some cases involving macroeconomic inefficiencies per cent (World Bank 1997e, 1999b).
TABLE 6.1India's Regulation of Agricultural Markets and Agro-industry
Rice Wheat Sugar Oilseeds Cotton Dairytextiles
Central government
FCI/TPDS (pan-seasonal & territorial price) III V/ V/ - _ _Dual markets ./v V/1 V/V - - -
Forced procurement (levy) VVV/ - /-Essential Commodities Act v/I/ V /V / / (V/I) -
Selective credit controls (RBI) (/s'V) (/'V) // Vi") (///)Size reservation (SSP - _/ v v vV
Barriers to entry - _ (/I) _ _ /VAdministered prices (sugarcane, ginning) - - V - (II
Ban on for-ward & futures markets IV VV V (V/) (vHealth safety legislation & enforcement - - / -
State governmentsMovement controls IV V / V-
Storage controls I/V/ I/ /V Va /VRegulated markets management V -
Control on cooperatives - - - V VNon-unitary & multi-point taxation V V I V
Note: The number of ',/' indicates the intensity of the inefficiencies imposed by the corresponding policy or regulation; '(I/)' meanseither lifted or recently repealed.Source: The World Bank.

88 * India: Reducing Poverty, Accelerating Development
Future agricultural growth could be speeded by Poverty reduction will also be enhanced by empow-policy and institutional reform in the sector, namely erment of the poor-shift from top-down, centralized(a) an improved pattern of spending and a reduction in management to bottom-up, demand-driven participa-distortionary subsidies; (b) deregulation of the sector tory processes for the provision of rural infrastructureand of rural finance, with a greater role for the private and support services. Numerous successful individualsector in credit and termination of the use of credit programmes (including World Bank financed projects)subsidy as a transfer mechanism; and (c) empowerment in rural water supply, minor irrigation, watershedof the poor by improving their access to land and development, and joint forest management are demon-common resources, increasing their control over ser- strating the benefits of such a strategic shift. A widervices and infrastructure in rural areas, and improved adoption of this principle, particularly in the numeroussafety nets. government safety net programmes (such as JRY, EAS,
The above-mentioned policy reforms would help and MWS) would help such programmes better meetreduce poverty. For example, increased public spend- their primary goal of poverty alleviation.ing on rural roads, agricultural technology improve- Another area where policy and institutional reformsment, rural education, safety nets, and irrigation would are required to better meet the needs and aspirationsall help reduce poverty (IFPRI 1998). Growth in the of the poor is in policies related to the management ofrural non-farm sector would also benefit from im- forest resources. The government needs to rethink itsproved infrastructure (roads, power, communications) role in downstream production and marketing whereand social services. More efficient and competitive the private sector, including community interest groups,markets can deliver better prices and greater market could be brought in much more effectively. Instead theopportunities to farmers, without raising consumer policy focus should be more on the management ofprices, that would help farmers offset the impact of cuts externalities and provision of public goods, the defini-in subsidies. Better markets together with futures tion and enforcement of property rights, resolution ofmarkets and eased restrictions on commodity move- conflicts, and improving the access of the poor toments and private participation in international trade natural resources of importance to them (particularlycan help reduce price fluctuations. non-timber forest products).
7
Raising and Using Capital Well:The Financial System and
Corporate Governance
Capital is scarce in India and other developing coun- government committees (see Box 7.1). India's financialtries. Mobilization of investible resources at reasonable system resisted contagion from the East Asian crisiscost, their allocation in a manner that yields the best because of limited foreign exchange exposure in thecombination of risk and return, and efficient manage- financial institutions and corporates and the financialment of these resources are critical issues in growth and institutions' large public sector debt holdings (see alsopoverty reduction. All countries' financial systems Chapter 8). Despite the improvements, the financialplay a key role in mobilizing and allocating resources system could be a constraint to renewed 7 per centfor the private sector as well as raising resources for per annum growth. India mobilizes resources very wellthe public sector. Corporate governance and informa- but much of the resources are absorbed by publiction play key roles in the allocation and efficient use sector borrowings. These borrowings increasingly fi-of resources. Finally the financial sector and corporate nance public consumption and push up the cost ofgovernance play key roles in the vulnerability of the funds to and 'crowd out' the private sector. Althougheconomy to economic crises, as evidenced by recent banks have low ratios of non-performing assets (NPAs)developments in South East Asia. This chapter looks (largely because of the high share of public debt inat ways to improve India's financial and corporate the system), the still-high NPAs on lending to thesystems' allocation and use of resources and ways to private sector (advances) push up the cost of funds andreduce vulnerability. The next chapter continues suggest the allocation of funds could be improved. Andthis discussion with regard to the public sector's use the capital markets and non-banks are unlikely toof resources and reducing macroeconomic vulnerabili- provide as much finance as they did in the recent past.ties. A second wave of reform, taking off from the recomi-
India's deep financial system has undergone signifi- mendations of the second Narasimham Committeecant reform and improvement in prudential regulation (henceforth Narasimham II; see Box 7.1 for a summaryand supervision since the early 1990s, though much of its recommendations as well as those of other recentremains to be done as indicated by various recent committees on financial reforms), would ease the

90 * India: Reducing Poverty, Accelerating Development
finance constraint and reduce the economy's potential * greater private ownership and management undervulnerability to financial sector problems. Key areas the improved regulatory framework, to increase incen-are: tives for better lending and collection, and
e a better legal and judicial framework for debt * an improved payments system.recovery, Capital markets would benefit from continuation of
* a reduced public sector deficit to reduce crowding the improvements in transactions and settlement prac-out in the financial system, tices and, especially, from a shift towards fully funded
* further tightening of regulation and supervision pensions that would provide long-term funds for devel-to reach best international practices, opment as well as good retirement incomes.
Box 7.1
THE NARASIMHAM II, KHAN, GUPTA, AND RBI REPORTS ON THE FINANCIAL SECTOR
'L'he Narasimham I Committee Report, in 1991, along with other reports issued at the time, provided an outlinefor reform of India's financial system. In 1998, the Narasimham II Committee Report on banking, the Khan
Committee Report on harmonizing banks and development finance institutions, and the Gupta Committee Reporton rural credit, along with the 1997 Tarapore Committee on capital account convertibility, suggested approachesfor broadening and deepening reforms in the financial system. In 1999, the RBI issued a report on the role of banksand development banks, which suggested that a gradual, orderly move towards universal banking might take place,as the institutions consider appropriate (RBI 1999a).
Narasimham I's recommendations followed the best practices of the period, focusing on reduced controls oninterest rate and credit allocation; tougher capital requirements, supervision, and classification of NPAs; and easingentry, including that of foreign banks. The implementation of many of these recommendations and worldwideproblems with public sector banking and bank crises mean that there is a new set of challenges. Narasimham IIbrings to bear the best current practices to these issues. Appropriately, it focuses, even more than the last Report,
on upgrading banks' performance through improved incentives for prudent behavior rather than by relying solelyon regulation and supervision.
Narasimham II's major recommendations along these lines are as follows:
* Reduce government and RBI equity stake in banks to 33 per cent, by market sales that dilute governmeint
ownership.
* Separate RBI from its role in bank boards.
* Raise bank capital to 9 per cent of risk-weighted assets by 2000 and 10 per cent by 2002; mark-to-market andgive government securities a 5 per cent 'risk weight' to begin to deal with their interest rate risk. Give open foreignexchange positions a 100 per cent risk weight (that is 8 per cent of the open position would have to be matched
by capital, up from the current, separate 5 per cent requirement).
* Reduce NPAs sharply; tighten definitions, avoid further recapitalization by the government; any 'hiving off'of NPAs to new institutions should involve major operational restructuring to prevent the problem's recurrence;closure of weak banks that cannot be revived, with safeguarding of depositors' and employees' interests. (A high-level committee has recently submitted recommendations to the government on the issue of NPAs in weak banks.)
* Give banks (that have gone to the market) more autonomy in bank management and pay-setting, lengthenterms for top managers, restructure and develop voluntary retirement schemes as appropriate, upgrade staff, andcomputerize faster; improve risk management; improve disclosure.
* Leave deposit insurance coverage as is, but move to risk-based premia.
The Khan Committee's principal recommendation was a move towards universal banking, with a progressiveelimination of the boundary between banks and development finance institutions. Narasimham II also supportedthis convergence. Both committees noted the need for harmonization of the cash reserve and statutory liquidityrequirements over time. The Khan Committee also recommended lowering the cash reserve ratio (CRR) (as did
the Tarapore Committee) and abolishing the statutory liquidity ratio (SLR). Both the Khan Committee andNarasimham II called for improvement in the legal framework for loan recovery.
The Gupta Report, and the Khan and Narasimham II Committees have recommended further deregulation ofpriority sector lending. The Gupta Report has recommended allowing banks to set interest rates on agricultural
loans and speeding up the credit process by allowing branches to approve most loans. It also recommended replacingthe priority sector lending target with a system of annual targets.

Raising and Using Capital Well * 91
Sound Financial System to Allocate (2.4 percent per annum) than in 1980 to 1987 (3.2per cent per annum). Probably, part of this slower
Credit and Reduce Vulnerability growth reflects the growth of less-regulated corpo-rate deposits3, and especially, non-banking financial
Resource Mobitization companies (NBFCs) that provided increased housingand consumler credit, a growth that slowed recentlyfollowing problems in the NBFCs. 4
India has a 'deep' financial sector (see Annex Table 7.1 g pfor the structure of the system). Broad money(M3)1 is over 50 per cent of GDP and capital markets Large Government Debt Holdingsare large (see p. 98). As early as the mid-1980s financial Crowd Out Private Creditdepth was similar to that of middle-income countries The public sector absorbs much of the funds mobilized
(World Bank 1989). This mobilization reflected high by the financial system. In 1998-9, schedule commer-private saving rates, avoidance of high inflation, and cial banks held 45 per cent of their aggregate depositsa massive bank branch network. 2 However, M3:GDP (or 39 per cent of their total liabilities) in governmentgrowth temporarily stopped after 1987. debt and the CRR. In fact, banks hold more govern-
40.0 6(0.0
M3+NBFCs per cent X
35.0 of GDP. ;_~~~~~~~~~~ 50.0 _
, 30.0 Average M3:GDP, 1987-92
M3/GDP 25.0 M3/440.025.0
20.0~~~~~~~~~~~~~~~~~~~~~~~
-~ 20.0 .30.0 s
Interest rate1, 15.0 Inflation (CPI) 1 year
deposit 20.0 z0 10.0 E
10.0 ~s5.0 H1H i0.0 0.0
\c 00 0 C' q 0 0 0 C t SD 00C'- C'- 00 00 00 00 00 Cy, 0N C, C,
oS~~ ~ a z oE az F, m ao a o on
FIG. 7.1: India M3:GDP, Deposit Rate, and Inflation
The ratio of M3 to GDP began to rise once again 3 India traditionally permitted non-financial companies to
in 1992, as stabilization and financial liberalization take deposits from the public, as a way around the high costs
(which gradually freed interest rates, reduced directed of bank borrowing. The amounts are limited to 25 per cent of
credit to the government, and tightened regulation the company's paid-up capital and free reserves and are notcredit,totegovernmen, and tighted rcovered by deposit insurance. Many large companies are, in
and supervision, see Reddy 1999, and Narasimham effect, small financial intermediaries, raising funds from the
Committee 1991, 1998, and Annex Table 7.2 for a public (and the financial system) and on-lending to suppliers.discussion) took hold. The stock market and new issues As competition heats up and bankruptcy becomes more likely,
also picked up dramatically (see p. 98). However, pressures may develop for the government to guarantee corpo-
the M3:GDP ratio has grown less rapidly since 1992 rate deposits. However, the governnient has so far refused toextend deposit guarantees to 'sick' companies and non-banking
M3 includes currency with the public and demand deposits financial companies.
with the banking system plus 'other' deposits with the RBI (Ml), 4 In 1997 a maj or NBFC failed and deposit outflows hit theplus time deposits with the banking system. sector. Appropriately the government refused to provide deposit
2 Banks' branches grew rapidly in the 1970s and early 1980s, insurance ex-post and RBI limited weak NBFCs' deposit taking
then slowed. Branches numbered about 64,000 in 1998. and required them to wind up activities. In January 1998, RBI

92 * India: Reducing Poverty, Accelerating Development
ment liabilities now than in the late 1980s (as a fraction low transactions costs, easy justification as an assetof GDP or deposits), despite the cuts in CRR and SLR; choice in case of any investigation; and lack of creditcorrespondingly, banking sector credit to the private risk-a factor that partly explains why Indian bankssector has been limited (see Annex Tables 7.2 and 7.3). were less hard hit than East Asian banks. These factorsNBFCs, regional rural banks (RRBs), development generate a 'safe lending bias' and increase the demandbanks, insurance companies, and provident funds are for government debt relative to private sector debt.also required to hold a large part of their portfolios in The demand is particularly great when there is pressuregovernment debt, and their liquidity ratios remain to reduce NPAs, as for example occurred recently inhigil. Moreover, much of the bond market consists of the case of regional rural banks (RRBs). However, itgovernment debt bought in the primary market by is important to note that this 'safe lending bias' affectsfinancial intermediaries and held to maturity. the relative terms on which financial institutions hold
The financial intermediaries' large government debt government debt voluntarily. It remains true thatholdings mostly reflect a macroeconomic constraint: 'someone' must hold the large government debt, be it'someone' must hold this debt, and absorb the increases either the public, in which case it would deposit lessgenerated by the still-high public sector deficits.5 In in financial institutions, or financial institutions, whetheraddition, financial intermediaries, including insurance because of requirements that implicitly tax financialcompanies, pension funds, and provident funds, are intermediation (as in the 1980s) or attractions describedattracted to public sector debt by a number of factors, above (as in the 1990s). Correspondingly, private sectorincluding higher interest rates on it than in the credit is crowded out (as discussed in Chapter 8 and1980s,6 low capital and priority sector requirements, 7 World Bank 1998a). If, for example, banks or provident
funds were to suddenly invest more in corporate debtand equity, then someone else would have to hold the
announced a new framework for regulating NBFCs, which re- public sector debt they sell (or do not buy). Thustams the minimum capital of Rs 2,500,000, requires NBFCs increased credit for sustained, private sector-led growthaccepting public deposits to undergo the full range of supervision, can only comlinks the maximum level of deposits to the NBFC's rating, and n c e If the government reduces ts borrow-limits the deposit rate to 16 per cent. About 9000 companies that ings/deficit.applied for NBFC status met the minimum capital requirement-of those only about 800 were considered eligible for receiving Bank Performance and NPAsdeposits, compared with about 10,000 at the end of 1996.
sAnother factor in the large holdings of public sector debt These have improved substantially since the earlyis the use of (non-marketable) government debt to recapitalize 1990s, but remain short of best practices. NPAs, atthe banks over the last few years. The stock of these securities end 1998-9, were about 6 per cent of total assets andwas equal to about 1 per cent of GDP in 1998-9 (see Chapter 3 per cent net of provisions8 for the commercial banks;8). Although provision of capital in this form spread out the th per lc nks of s th coutfr banks;fiscal cost of recapitalization over time, it also meant that the pe public banks which still account for over 80recapitalization did not increase the availability of funds for new per cent of commercial bank assets have slightly higherprivate investment. Another factor is the elimination in the figures (RBI 1999e). The public banks' NPA figures1990s of liabilities of non-government entities, mostly public reflect the limited growth of NPAs after 1993, whenenterprises, from eligibility for the Statutory Liquidity Require- the tightening of regulation revealed gross NPAs ofment, and their replacement by government debt. Such liabilities 11.8 per cent of assets, and the substantial increase inrepresented 11.2 per cent of banks' 'selected assets' in 1989-90, provisioning begun in 1993. The private and foreignbut only 4.3 per cent today (see Annex Table 7.3). Yet another banks have lower NPAs than public banks but theirfactor in the rise of banks' holdings of public debt is the sharp bdrop in the RBI's holdings (as a per cent of GDP) since the early performance has deteriorated somewhat over the last1990s, as the RBI reduced its role as financier of the government two years. The development banks' 9 portfolios have aand built up its international reserves (see Chapter 8). higher ratio of net NPAs to assets than commercial
6 Interest rates on public sector debt were raised in the latterpart of the 1980s to reduce the burden of the SLR. With 8 Settlements on and write-offs of NPAs are made difficultliberalization, the shift to auctions of government debt and the by Indian laws and public bank managers tend to avoid thesereductions in the liquidity requirement further increased rates actions to avoid any possible political problems or accusationson public sector debt. of favouritism. The result is that NPAs stay on the books while
For example, banks' investments (in government or corpo- provisions are built up, and remain on the books even after fullrate bonds) are considered investments rather than lending, and provisioning, increasing gross NPAs.so do not attract priority sector lending requirements, which are 9 As used here, the development banks include the IDBI,set at 40 per cent of lending. ICICI, and IFCI.

Raising and Using Capital Well * 93
banks (9.9 per cent on average) and their portfolios risk weight,'3 risk-weighted assets are only about
deteriorated in 1998-9, even after some restructuring half of total assets. In turn, this means that public
(RBI 1999e). The small RRBs and cooperative 'banks'"0 banks' actual capital is not much larger than their net
have much higher NPAs than commercial banks al- NPAs.
though RRBs have improved somewhat recently. Similarly, with so much government debt in the
For the banking system as a whole, reported gross portfolio, the quality of Indian banks' lending is better
NPAs are probably less than 3 per cent of GDP, a fairly measured by the ratio of NPAs to credit (advances in
low figure. Of course, in all countries NPA figures Indian terminology) rather than NPAs to assets. India's
depend on the accounting and supervisory standards public banks' gross NPAs were 15.9 per cent of credit
and are backward looking, which means they have and 8.1 per cent net of provisions in March 1999.
proved to be lower bounds when a crisis occurs. Private and foreign banks have lower ratios-NPAs to
Other standard indicators of bank performance assets was 5.8 per cent for 'old' private sector banks,
show improvements. Capital is up, with the large 2.3 per cent for 'new' private banks and 2.9 per cent
recapitalizations of public banks from 1992 to 1999, for foreign banks in March 1999. The figures for
eight public banks' raising capital in the market, and foreign and new private banks reflect the low NPAs
capital increases from retained earnings. At the end of typical of new banks. As noted above NPA ratios of
March 1999, 26 of 27 public banks and 99 of 105 private banks rose in 1998-9. Finally, RRBs' NPAs
commercial banks met or exceeded the 8 per cent Basle were 33 per cent of outstanding credits in March 1998
capital adequacy guideline; over 70 per cent of both (RBI 1999e).
public and private banks exceeded 10 per cent (RBI
1999e). Profits after provisioning are low however, and improving Credit Delivery anddeclined from about 0.8 per cent of assets in 1997-8, , .lrabilityto 0.5 per cent of assets in 1998-9, reflecting provisions Reducing Vulnerablityof nearly 1 per cent of assets (RBI 1999e). NPAs tie up substantial credit in unproductive activi-
India's ongoing industrial slowdown largely affected ties and raise the cost of credit-the current average
private banks and development banks, while public rates of provisioning alone (about 1 per cent of assets)
banks have reduced their NPA ratios slightly. Devel- can increase the cost of credit by 1-2 percentage
opment banks have grown fairly rapidly in recent years points."4 Moreover, the foregoing analysis suggests any
and they have large exposure to some of the industries increase in lending to the private sector (a) will require
that are undergoing a shake-out of excess capacity (see much more capital (as the average risk weight of the
Chapter 8). They have already restructured some loans portfolio increases) and (b) runs the risk of increased
to the steel industry in 1999.1" NPAs and macroeconomic vulnerability unless sub-
More importantly, from a long term-perspective, stantial improvements occur in lending and collection.
India's capital and NPA ratios are substantially im- Such improvements will depend on action in three
proved by the large holdings of (performing) govern- areas:
ment debt.12 Because government debt has a low i t i mproving the legal and J'udicial framework for
debt recovery,
Cooperative'banks' often operate like transfer agencies for * further reducing the burden of priority sector
government funds and have very high arrears. lending, and1 1 In March 1999, the IDBI announced loans of Rs 10.8 billion l
to 6 steel companies for completion of ongoing projects, con- 13 In its October 1998 Credit Policy, the RBI announced that
ditional on promoters' up-front infusion of new equity equal to government/approved securities will carry a risk weight of 2.5
one-third of the new loans, return of funds to the projects that per cent, with effect from the year ending 31 March 2000; an
had been diverted to other activities in the group, the right to additional weight of 20 per cent on investments in the govern-
convert the loan to equity at par, and improvements in manage- ment guaranteed securities of government undertakings which
ment, corporate governance, and auditing. The ICICI is consid- do not form a part of the market borrowing programme will
ering a new loan to some of the firms. also be introduced with effect from the financial year 2000-1.
1 Government debt is considered fully performing. How- 14 The degree to which provisions increase the cost of credit
ever, the RBI, in 1998, announced that government guaranteed depends on (a) whether banks include the provisioning costs in
debt which fails to meet income recognition standards should all decisions to buy assets (-) or only advances (+), (b) the degree
not be accrued as income and provisions on state-government- of competition from banks with low NPAs (-), and (c) the
guaranteed debt should be made over a period of four years willingness of shareholders, notably the government for the
beginning in 2000 (Reddy 1999). public banks, to accept low returns on equity (-).

94 * India: Reducing Poverty, Accelerating Development
improving incentives for sound banking, which Reduicing the Burden ofin turn will involve both a greater private sector role
and tmroved regulation and supervison,Priority Sector Lendinga second wave of reform, that build on Narasimham Priority sector lending which comprise 40 per cent
II's recommendations. of credits, has about a 35 per cent higher NPA ratethan non-priority lending.18 Direct agricultural lendingis a particular problem.' 9 Political pressures, targets
Improving the Legal and Judicial Framework for priority sector lending, use of credit to offset poor
We.ak legal and judicial support for loan recoveries is harvests, etc., have led to loans to uncreditworthyidentified by bankers and Narasimham II as a major borrowers and easing of lending standards (see
factor in NPAs. Although most loans are collateralized, Ahluwalia 1997). At the same time, the credits' use has
a judgement to 'execute' collateral may take ten years often not led to increases in the productive capacity of
and then may prove difficult to enforce (RBI 1999c)i5 the economy. 20 The burden of priority sector credits
Once a company is declared sick, it can escape legal on the banks has been reduced by the rise in interest
demands for repayment for some time and collateral rates on them and the widened eligibility of credits forcan be diverted. These difficulties in the legal frame- priority status. Nonetheless, the 'safe lending bias'
work, as well as the current recession, may explain the noted above is leading to a shift towards government
rising NPAs and weakening profits in some of the debt, safe corporate bonds, and to other investments
private and foreign banks. The setting up of specialized such as stocks (which RBI has permitted up to 5debt tribunals, as recommended by Narasimham I percent of capital) which do not carry priority sectorwas intended to speed up judgements and bypass the obligations (see p. 92, and Annex Tables 7.3 and 7.4).
logjam in the courts (see Chapter 4). However, a recent Better lending to the current priority sectors, asRBI review emphasized the need for substantial im- opposed to political transfers, could be stimulated by
provement in the tribunals; as of June 1997, only about a further reduction in political interference, improved
9 per cent of cases had been detided, and less legal remedies for recovery, and better incentives fortha pRs 2cbilio of cases had8 billin didedolved lessthan Rs 2 billion of the Rs 89 billion involved had the delays in settlement, most of the firms' workers have actuallybeen recovered (RBI 1999c)., found other activities. Another, unstated factor may be the
Setting up additional tribunals, as was done follow- unwillingness to sell off the sick firms' valuable land assets,ing the proposals in the last two Budget speeches, will because they would depress land prices.reduce some of the problems. However, action is also 18 Priority sector lending of public banks accounted for 47.8needed to clarify and streamline procedures. Even with per cent of NPAs on credit at end 1998 (RBI 1998a, p. 27) andthe new tribunals, the backlog of cases is overwhelming were about 40 per cent of credits, yielding the estimated NPA
and the possibility of filing an appeal contradicts the rate of 19; by similar calculation, the NPA rate for non-priorityobjective of quick settlements-one possibility would lendimg was 13.9 per cent.
19 For example, public sector banks recovered only 60be to reduce incentives for frivolous appeals by impos- per cent of direct agnrcultural lending (that is excluding loans toing additional penalties for the loser of the appeal. NABARD, Infrastructure Rural Development Fund, etc.), andAction is also needed to improve the process and 30 per cent of IRDP loans in 1993-5 (RBI 1996, pp. 35, 37).shorten the time during which a company can remain Partly, the better performance of private and foreign banks onsick, and to improve the implementation of procedures NPAs may reflect their lower direct agricultural lending. Be-for protecting priority creditors' rights."7 Finally, as cause of their more limited branch network they are permitted
discussed later in this chapter, bankruptcy and liquida- to satisfy more of their priority sector agricultural lendingdiscussed later in this chapter, bankruptcy and liquida- through lending to NABARD, and through loans to small-scale
tion laws need improvement, industry. Moreover, foreign banks have a 32 per cent, rather than
15 Of course, banks typically do not wish to take over 40 per cent, priority sector requirement of which export creditscollateral. However, their inability to do so as a last resort account for 10 percentage points.increases their dependence on relationships for obtaining debt 20 Studies suggest that the directed credit had little impact onservice and can pressure them to send good money after bad in agricultural growth and was a poor substitute for the physicalhopes of eventual payment. inputs needed for growth; rather much of the credit seems to
16 Implementation of the Debt Tribunal Act, 1993 was have gone to increase the capital intensity of production (see, fordelayed by legal challenges, one of which is pending in the example, Binswanger and Khandakar 1995). Regarding lendingSupreme Court, and administrative problems. to small-scale industry, as with agriculture, those firms that
17 The slow resolution partly relates to the understaffing and accessed low cost credit seem to have used it to adopt moreslow resolution in the BIFR, and the often-stated political capital-intensive technology, rather than expand and increaseproblems of dealing with the staff of sick firms, although given employment (see, for example, Sandesara 1988).

Raising and Using Capital Well * 95
sound banking, including a greater private presence. the system of incentives for sound lending and recov-This is particularly the case in the rural sector. Subsi- ery, particularly in the public banks, including thedies on priority sector lending should be made explic- regulatory and supervisory framework. Worldwideitly through the budget, not implicitly through credit. experience suggests that inappropriate incentivesCrop insurance and employment schemes, rather than make it difficult for public sector financial institutionscredit, should be the main instruments of disaster relief. to carry out good lending and collection practices.More fundamentally,-changes in the approach to agri- Public sector employees have less stake in soundcultural lending and micro-credits are needed. For lending and collection than private sector employees.small-scale agricultural and rural lending, institutions Pressures exist to lend for non-market objectives andlike the Grameen Bank, that are beginning to be to go easy on collections. Directors and the owner-formed in India can play a more important role (for the government-seem unable to obtain reasonableexample the Self-employed Womens' Association rates of return on capital or even to maintain capital.(SEWA) programme). For larger loans, the success in In addition, there is limited market discipline becauseproviding credits, as opposed to subsidies, will depend of the government's implicit guarantee.2 3 Moreover,on incentives to make sound loans and collect, as for when public banks dominate the system, regulationexample the 'credit desa' programme of Bank Rakyat and supervision often become principally aimed atIndonesia where repayment rates have remained over checking malfeasance and ensuring directives are ful-95 per cent despite the economic crisis. Either model filled, since additional profits from high-risk high-is likely to require much higher interest rates than the return lending do not recur legally to the institutionprime rate (see Yaron et al. 1994 and 1997, and World or its employees.2 4 Of course, private banking hasBank 1999b). Further investigation is needed of ways its own problems, as good accounting, auditing, andto strengthen institutions and improve the vehicles for frequent reporting are needed to increase market dis-micro-credits and agricultural loans, and ensure their cipline. Private banks may choose high-risk high-returnrepayment. loans, reflecting fractional banking, low capital, and
A particular priority sector credit issue is the explicit limited liability, and with market discipline limited byor implicit inclusion of infrastructure finance. Gener- deposit insurance and inherent limits on information.ally speaking the arguments against directed credit are Thus regulation and supervision of private banking iswell known, in terms of diverting credit from/implic- needed not only to reduce malfeasance, including non-itly taxing other sectors. In the particular case of arms length lending, but also to limit imprudentinfrastructure, neither India's banks nor development behaviour.banks have much experience in evaluating such projects Despite India's major steps in improving bankand their rapid expansion into these areas is likely to performance and regulation and supervision (see Reddyincrease NPAs, as well as expose the banks to a major 1999), the foregoing considerations, recognized byterm transformation risk.2 1 Moreover, problems with Narasimham II and the government, suggest a secondprivate sector infrastructure may relate more to the wave of reform is needed, particularly in three areas:'bankability' related to issues in the regulatory frame- dealin with the stock of NPAs and large newwork and cost recovery (see Chapter 5). Channelling * dealmg wetn thentock or PAs andolane,more credit to infrastructure would not resolve these ones withu c ifoproblems, only transfer their cost to the banks or the . going beyond international norms to reach bestguarantor of the credits, practice in regulation and supervision, and
privatization to improve incentives.
improving Incentives, Regulation, Net NPAs in public banks remain a burden and, asand Supervision noted above, are similar to capital. Moreover, in some
Priority sector lending is, however, far from the wholeexplanation of high NPAs-NPAs on non-priority Illustrating this point is the worldwide tendency forlending are estimated at about 14 per cent, well in depositors to switch from private to public banks in times ofexcess of best practices.22 Another factor in NPAs, financial crisis, despite public banks' typically inferior balanceexcess ~~~~~~~~~~~~~~~~~~shleets.suggested by experience around the world, is probably 24 It is generally agreed that the moral hazard for imprudent
21 Such risks can be transferred to the borrowers through lending increases when equity stakes drop in banks, an examplevariable rate lending; however, the possibility of bankruptcy being the US Saving and Loan Crisis. This is also a concern forlimits the transferability of the risk. public banks when they perform badly-managers may act
22 See fn. 18 in this chapter imprudently in hopes of offsetting bad performance.

96 * India: Reducing Poverty, Accelerating Development
cases, for example Indian Bank, large new NPAs have cannot prevent all failures. Moreover, some of thedeveloped. Dealing with the stock of NPAs will depend regulatory-based incentives to prudent private bankingon the government's political will to recover loans, in may even work perversely for public banks; for ex-spite of the current industrial recession, and putting ample, higher capital requirements may be treatedgreater pressure on the banks to resolve NPAs without simply as low cost funds by public banks unlessexception. The government will need to assess the the managers can be held responsible for returns onlikelihood of collection and settlement on a bank-by- capital. The standard remedy for weak public banks-bank basis, reward banks that exceed the targets, and transferring management-has some effect, but it re-put in new capital as needed. General principles for mains difficult to provide either strong incentives tosettlements will be needed, to protect management the staff or market discipline through the providers offrom accusations of favouritism. funds. One option for public banks that continually
Leaving collection of NPAs to individual banks in perform poorly is to turn them into narrow banks,this way is likely to result in greater reduction of NPAs holding only government debt, and gradually windand less cost to the government25 than transferring them down (Tarapore Committee 1997, Taraporethem to a general asset reconstruction fund. The 1998, 1999). This approach would limit new losses, andannouncement of such a general fund will itself gener- could be a non-monetary incentive to other banks toate incentives for more NPAs, as bankers try to clean avoid large NPAs, lest they too become narrow banks.their balance sheets and debtors switch to what they Regulation and supervision have improved substan-are likely to perceive to be an easier regime, based on tially, to largely reach international norms in areas liketheir experience with the BIFR. Any transfer of loans the 8 per cent capital requirement (RBI has mandatedand collateral will be subject to errors and legal 9 per cent by 2000), Basle Core Principles of Bankingchallenge. Debtors will not even have the incentive to Supervision, etc.26 Market pressure has also been in-pay for maintaining relations with their bankers. Fi- creased through competition with the licensing of 9nally, the success of such a fund will depend on taking new Indian banks and 22 new foreign banks since 1992,the best work-out specialists from the institutions. and the reduction of limits on competition such asGeneral asset reconstruction funds typically have been mandatory consortium lending and the restrictions onused only in general crises, they have only worked well switching banks and multiple banking relationships.when fairly draconian measures were taken to collect The issue now is to move to best practices, whichand execute collateral, and the fund was wound up will be especially desirable in the context of furtherquickly, for example the US Resolution Trust Corpo- privatization. Particular issues are: (1) removing theration. A further problem with a general fund, sug- various current exclusions from the 180-day rule forgested by the experience with the BIFR, would be its recognition of income27 and moving to a 90-day rule,likely long life, and the negative incentives generated as practised in countries like Argentina and Chile; (2)to bank managers for sound lending and collection by further increasing provisions, including raising thethe possibility of additional transfers of NPAs to a specific provisions that currently are lower than mostlong-lived fund.
With regard to banks that generate large new NPAs, 26 In terms of regulation, India increased the capital require-better regulation and supervision and quicker govern- ment to 9 per cent (by March 2000), moved toward recognitionment action may provide some help. For example, of NPAs after 180 days, increased provisioning, is graduallyUS regulatory authorities intervene in banks well imposing mark-to-market on securities, introduced systems ofUS regulatory authorities intervene in banks well credit, foreign exchange, and risk management, and increasedbefore all their capital is lost. However, regulation and information requirements (including data on NPAs). In super-supervision can only be a second line of defence and vision, a CAMEL system has been introduced to better identify
weak banks, on-site inspections have improved, and India fully25 The cost to the government will depend only on the success complies with 14 of the Basle Core Principles of supervision, and
of collection, and not on whether the NPAs are in the banks is implementing its compliance with the 11 others, which mainlyor a general asset reconstruction fund. By transferring the NPAs relate to procedures for licensing of banks, implementation ofto the fund at par, the true costs can be obscured and additional risk management in the banks and its evaluation, and consoli-capital for the banks will be unnecessary. However, to provide dation of accounts and the sharing of information on them, boththe banks with actual new capital, as opposed to the non- internally and internationally. See Reddy (1999) for more details.marketable securities that have been used for past recapitaliza- 27 These inclusions contain an almost automatic exception fortions, the fund will have to be actually capitalized and its losses an additional thirty days, exceptions related to agriculturalon less than par recoveries will have to be paid by writing down harvest cycles, and exceptions related to delays in projectits capital. completions that particularly benefit development banks.

Raising and Using Capital Well * 97
countries, and increasing the recently instituted general power to allocate credit under the current arrange-provision of 0.25 per cent as a cushion against general ments,29 (b) carry out the legal changes needed for evenportfolio deterioration or shocks; and (3) increasing gradual privatization through the market, and (c) usecapital to 10 per cent, as recommended by Narasimham the more effective approach of strategic sales.II. In addition, it would be desirable to use specific Currently, eight public banks have sold shares andadditional capital requirements on potentially risky further sales by them would begin to approach theactivities such as the recent imposition of a 100 per cent lower legal bound on government ownership. But lackweight on foreign exchange positions. In addition, (a) of new capital for growth, the higher new requirementsthe current high exposure limits (as percentages of mandated by the RBI, and NPAs write-offs will strapcapital)2 should be reduced substantially, including the the performance of these banks. Banks are alreadyexposure on infrastructure projects, (b) rules on lend- trying to meet their capital needs by the risky approaching to director-related activities should be tightened, of selling each other subordinated debt. Raising newand (c) the minimum capital (less than $ 25 million for capital solely through the market could easily meanbanks, $ 60,000 for non-banks) should be raised sub- more than 50 per cent of equity would be publiclystantially to encourage economies of scale (risk reduc- held, requiring changes in the Banking Companies andtion) and scope, and be in the form of cash or State Bank of India Acts that would face major parlia-government securities. Finally, the issue of quicker mentary opposition. Moreover, many factors makesanctions for non-complying banks needs to be ad- even the best banks' attractiveness to the marketdressed-public and private banks have been allowed to unclear-the partially divested banks' share prices haveoperate for some time with low capital. Best practice lagged behind the indices, representation of privatesuggests quick intervention is needed to reduce the risk shareholders on bank boards is still under implemen-of additional losses. tation, banking has become a much more competitive
In supervision, one issue is how to move from activity, and banks' actual capital is not much largeranalysis on an historic basis to a forward-looking basis, than unprovisioned NPAs. The status of bankwhich will include an evaluation of how the credit and staff (currently treated as 'de-facto' civil servants), ifrisk management systems are being used. This change the government were a large minority shareholder,will require significant upgrading of supervisory capac- would also be an issue. Finally, even if governmentity and, in the current environment, it may be difficult shareholdings were reduced to 33 per cent, as recom-to retain supervisors who can carry out such functions mended by Narasimham II, the government's positioneffectively. The licensing procedure needs to be more as dominant shareholder could allow it to run the banktransparent and include a discussion of applicants' effectively. These considerations suggest that salesintended activities and formal background checks. to strategic shareholders would not be much moreMore fundamentally, the RBI will need to continually difficult than the gradual privatization recommendedre-examine the appropriateness of its guidelines for risk by Narasimham II, and could yield more revenue frommanagement. Finally, accounting and auditing stan- the sale, as well as mnore efficiency. Whatever thedards, while much improved and moving towards method chosen, it is likely that the government willinternational standards (Reddy 1999), would require need to resolve issues of staffing through voluntarygreater improvement to reach best practices. An im- retirement packages, and to inject more capital toportant accounting issue is the consolidation of firms' write-off unprovisioned NPAs, as in the privatizationand banks' activities. Another issue is fragmentation of case of Philippines National Bank concluded recently.the accounting industry, which raises the issue of the Further analytical work exploring possible paths tofranchise value of providing sound reports. privatization of banks, while decreasing the vulnerability
Privatization, under a sound regulatory and super- of the banking system throuigh regulation and supervisionvisory system can provide incentives for better credit that approached best practices and improvements in ac-allocation and injections of much needed capital, as counting, auditing, and corporate governance, could helprecognized by Narasimham II. However, significant the privatization process in India.political will is needed to (a) induce the governmentand managers to give up their highly concentrated 29 on the bank, Chairman and Managing Director
personally approve all loans exceeding about $ 7.5 million, with28 Currently, limits are 25 per cent of capital to a single General Managers responsible for loans between $ 2.5 million
borrower, 50 per cent to a group of related borrowers, and an and $ 7.5 million and Assistant General Managers for loansadditional 10 per cent for infrastructure projects. between $ 2.5 million and about $ 600,000.
98 * India: Reducing Poverty, Accelerating Development
Payments System injecting additional funds into the UTI.3 i Although
the market has rebounded after the 1999-2000 BudgetThe payments system affects everybody-individuals, speh, it remains true that new foreign flows are
enterprises, financial institutions, and government agen- unlikely to match the increase that occurred when the
cies. While the RBI has been taking steps to improve market was first opened, and new issues are likely to
it, the system still lags behind international standards be scrutinized more carefully than in the past.as well as developments in the rest of the financial b ssector. Some of the problems include delays between The capital market would benefit from increased
sector. Smei of thyen probmsttinc e andes completion transparency in the UTI's activities, given its magni-the receipt.of payment .instronland .th tude relative to the market and the numerous private
maining unsolved for months and even years; risk placements it accepts. A critical issue is eliminating the
exposure due to delay in the finality of settlement UTI's guarantee of returns, given the government'sexposure due to delay in the finality ofsettlement, .revealed political difficulties in denying responsibility
which could lead to systemic risk; low security level f t U p F i iof the systems, which may facilitate fraud. Improve- for the UTI's performance. Further improvements in
of thesystems, whic may facilitate fraud.mprove- the settlement process, with the ultimate aim of gradu-ments in these areas would lead to a more stable ally shortening settlement to five days after transac-financial system and faster developments in financial tions, would avoid the necessity of trying to harmonize
markets, which are heavily dependent on the payments settlement dates and reduce the pressures that currently
arise from the bunching of settlements. More impor-
tantly it would improve transparency and reduce the
Capital Markets risk of non-settlement and payments crisis which have
India has one of the largest stock markets in the hit the equity markets from time to time. More
developing world, with more companies listed than fundamentally, accounting and auditing need signifi-in the US and market capitalization about 36 per cent cant improvement, as discussed below, to encourageof GDP. The market was a major source of funding Tnvestment mn the marketl
for companies in the mid-1990s and boomed with The bond market is also large; it would be large
the inflows from opening up to foreign institutional even for a middle-income country (World Bank 1995a).
investors (FIls). There were also major improvements It includes an active primary market for publicinvstos (lis. her wee aso ajr iproemets and private debt, although public debt (notably
in transparency, with the computer-based National vernment-dated securities) dominates the market.Stock Exchange (opened in 1994) now accounting for Thersendary m etis, however m he acietabout 60 per cent of trading,3 0 and the Securities and The secondary market iS, however, much less active,
Exchange Board of India (SEBI) requiring that shares reflecting financial intermediaries' tendency to hold
in the major indices be 'dematerialized' in the deposi- government bonds to meet liquidity requirements,apart from holding these instruments to maturity. The
tory, in order to ease settlement and verification bodmreculbenhcdbyteRIsakgproblems. For most of 1998 the market was in decline, bond market could be enhanced by the RBI's taking
reflecting the slowdown of industry and capital in- a less active role in setting rates in the primary market,refectng he lowownof ndutryandcaptalin- moving to the dematerialized depositor system used
flows, the major settlement/payments problem in the for g yto theandmarmonizin depository states,Bombay Stock Exchange, in June 1998, and then, in the for stocks, and harmonizing stamp t gaes across states,later part of 1998, the redemption problems of the Unit capital mare wou soccu i tea pagt an pbiTrust of India (UTI) (the government-run mutual fund) capital market would occur if the private and public
over concerns that its guarantee of high retuTns could pension system moves towards fully funding, under
not be met. Many of the new issues of the mid-1990s appropriate regulation and supervision. This wouldraise demand for longer-term debt substantially. Fully
have not only collapsed in price (a problem that also gunde pensior linked-to duantalo y. yuldoccurred in the US after its new issue boom), but are funded pensions, linked to individual employees, wouldaocurrd minimally thedUS af snd ew difluet bin meeting also reduce problems of vesting and allow pensions toalso minimally traded and ave difficulty move wth workers, mprovn labour's moblt (seethe exchanges' requirements for information. How- mol with w e i . ' '
ever, the stock market has picked up in 1999. The 1999 iapter 6). The pUbliC sector would be a major areaUnion Budget reduced taxes on equity-based mutual to implement more fully funded pensions. However,
funds, including the UTI. The Budget also proposed 31 The proposal was to invest Rs 48.1 billion in UTIsecurities, which the UTI would use to buy back government
30 of India bonds. With the market reacting positively to theThe fifteen regional stock exchanges have announced their Budget announcements, the goverment has put in a lower
intention to move to linked, computer-based trading. amount of Rs 33 billion.

Raising and Using Capital Well * 99
this would increase the measured fiscal deficit (as countries, and even many countries in continentalopposed to the implicit contingent liability that now Europe, needs strengthening. Consolidation of corpo-exists), because the government would have to contrib- rate groups' financial statements to eliminate mislead-ute to funding current workers' pensions as well as pay ing reporting of intra-group transactions, needs to bepensions to existing retirees. mandated by law. On other issues, the CII code
recommends that large listed companies have AuditCommittees to supervise the company's audit proce-
Strengthening the Framework for dures; domestic public disclosure be the same as for
Corporate Governance ADR and GDR issues; and SEBI mandate a corporategovernance compliance certificate along with the an-
Corporate Governance refers to the procedures and nual report. In addition to this, best practices suggestrules, explicit and implicit, that provide the incentive voluntary disclosures beyond those mandated by theframework for companies to attract financial and Companies Act. For example, few Indian companieshuman capital, perform efficiently, and avoid corrup- give information on debt composition, economic valuetion (World Bank 19991). The crisis in East Asia added, foreign currency management, etc. Related
has highlighted the importance of corporate and issues, noted earlier in this chapter, are improvementfinancial governance systems supportive of market of accounting and auditing, and the small size of mostprocesses and competition-and the huge costs accounting firms, which means franchise values forstemming from the weakness of such institutions. establishing a record of sound accounting and auditingMost macroeconomists failed to appreciate that the are likely to be low.devil could also be in the micro. In an era of instantly Second, oversight32 is limited in most publicly listedmobile global capital flows, East Asia has shown companies. Currently, most boards of listed companieshow macroeconomic collapse can be exacerbated by are dominated by management or 'grey outsiders',33
systemic failure of corporate governance-excessive and stockholder representation is limited. Moreover,corporate leveraging, poor financial disclosure, misal- the Companies Act allows persons to hold up to 20location of corporate funds, bad banking practices, directorships (the US average is 3.5, the CII codeunregulated capital markets, and absence of expeditious recommends no more than 10), which is far too manybankruptcy procedures. With investors in emerging if the directors are to play an informed, active role.markets becoming more cautious, good corporate Also, non-executive directors are often not given ad-governance will be critical to attracting foreign invest- equate corporate information.ment. For India, it will also be vital in bringing the 7Tird, banks and other financial intermediariessmall investor, back into the capital market, whose have not been able to exercise effective corporateconfidence has been shaken by scams and vanishing governance and assertion of their rights as major debtcompanies. and equity holders. Nominee directors of financial
Corporate governance has received some public intermediaries, who are neither rewarded for goodattention in India in recent years. The Confederation monitoring nor punished for non-performance, haveof Indian Industry (CII), published a voluntary code of little personal incentive to monitor their companies,governance (Desirable Corporate Governance: A Code, and to demand accountability, disclosure, or transpar-1998). The Working Group on the Companies Act ency. Adding to this is a long-standing practice ofincorporated more stringent disclosure and fiduciary financial intermediaries to support existing manage-standards as well as more streamlined liquidation ment except in extreme circumstances, making theprocedures in the draft Companies Bill, 1998. How- stability of existing management a virtue by itself,ever, the Bill is yet to be presented to Parliament. The which could be at odds with the objectives of greatercurrent standards of corporate governance would need transparency, cleaner practices, and higher shareholdersubstantial improvement to reach best international value. Supporting existing management implies notpractices. In what follows, five key issues/concerns 32
relatng toprivte coporae govrnanc areconsi- 32The extent to which corporate boards exercise fiduciaryrelating to private corporate governance are consid- responsibilities to maximize long-term shareholder value.
ered; governance of public enterprises is also briefly 3 'Gray outsiders' are family members of executive directors,analysed. attorneys who represent the company, investment or commer-
First, the quality of financial and non-financial cial bankers who have close financial relationship with the
disclosures mandated by law, while stronger than company, long-term consultants, or directors who have substan-
almost all East Asian countries, many developing tial business dealings with the company.

100 * India: Reducing Poverty, Accelerating Development
questioning managerial decisions, not suggesting ways appellate authority, since it is an executive wing of thein which the company can improve its profits, and government. Instead, the appeal should be heard by amore or less going along with every board resolution division bench of the High Court. In spite of manyin a way which the management desires. Although improvements, the present division of authority cannominee directors are generally becoming more asser- prove to be detrimental to takeovers as more complextive and demanding, it remains true that they are not bids become common.very vocal until a company is in trouble. Another Fifth, India's bankruptcy and liquidation laws andproblem of nominee directors, often admitted by the procedures, are inadequate, time-consuming, andchief executives of financial intermediaries, is that they contribute to corporate misgovernance. Poor protec-do not have enough senior staff who can properly tion of creditors' rights allows companies to reallocatedischarge their obligations as good corporate gover- funds to highly risky investments (since managementnors. All this means that the institutions which, in fears neither attachment nor bankruptcy), raises thetheory, could play a proactive role in corporate gov- cost of credit, debases the disciplining role of debt, andernance (as in the case of German lead banks), have risks the health of the financial sector. In India,been preoccupied with issues that are not at the bankruptcy reorganization of large industrial compa-heart of maximizing corporate and shareholder value. nies is governed by the Sick Industrial CompaniesBut the real solution needs to recognize that in the (Special Provisions) Act, 1985 (SICA), and the processlong-run it will be difficult to strengthen corporate is directed and supervised by a quasi-judicial authority,governance when banks, financial institutions, and the the BIFR. Several steps could be taken to improve themajor mutual funds remain under the control of the system:government. These institutions are not sufficientlyconcerned about adverse income and wealth conse- * Early detection. The current recognition of finan-quences arising out of wrong decisions and inaction; cial distress as erosion of net worth rather than 'mere'their poor incentive structures do not reward perfor- debt default reduces the probability of a successfulmance and punish non-performance; and, most of all, turnaround. Between July 1987 and November 1998,they remain highly susceptible to pulls and pressures only 11 per cent of the 1954 cases that BIFR hasfrom various ministries that have little to do with considered 'maintainable' are no longer sick.commercial accountability, and which often destroy * Speedier and streamlined procedures. Currently,the bottom line. Therefore, a stable environment the mean delay in arriving at a decision in the BIFRfor good corporate governance probably requires the exceeds two years. Delays are caused by tedious quasi-government to become a minority shareholder in judicial procedures that confer additional bargainingfinancial institutions. power to company management at the expense of
Fourth, although the quality, transparency, fairness, secured and senior creditors.and efficiency of the capital market and the rules thatgovern corporate takeovers have improved substan- * Reduced rights for detor in possession. Neithertially, procedural issues remain. There are no longer SICA nor the BIFR recognize that incumbent managerestrictions on transferability of shares in the Compa- ment always has a great informational advantagenies Act-barriers that were used in the 1970s and 1980s compared to outside creditors, and allow existingto entrench promoters in management despite small management to run a bankrupt company during theshareholdings. Moreover, the SEBI Takeover Code has perIod of reorganization Studies of companies undermade takeovers far more transparent and offers a much the BIFR show that, in the final reorganization deci-fairer deal to minority shareholders, while the RBI has sion, secured creditors had to make large write-offs onallowed banks to fund takeovers. These are substantial their exposure, while management and shareholdersimprovements. However, there are still a few proce- did notdural problems. The most important of these has to do * Adherence to priority creditor rule. The BIFRwith jurisdiction. On the one hand, SEBI is supposed procedures violate the principal of senior debt priorityto have jurisdiction on all capital market matters for often by rewarding incumbent management and oldlisted companies. Yet the Company Law Board and shareholders (despite net worth being negative) at theMinistry of Finance have the powers to overrule. In expense of fully secured creditors.addition, SEBI is not empowered to give legally bind-ing decisions and to impose penalties and punishment. The Sick Industrial Companies Bill, 1998, recog-Ideally, the Ministry of Finance should not be the nized these problems and proposed a more market-

Raising and Using Capital Well + 101
determined bankruptcy system. But it has not been The Draft Companies Bill, 1998, and the Report ofpassed in Parliament. the Working Group on the Companies Act suggested
Liquidation poses even more problems than bank- new liquidation procedures that were transparent, timeruptcy. As discussed in Chapter 4 most liquidation bound, and reflected the view that rapid sale of pro-cases take between one and two decades, reflecting a ductive assets is good not only to settle the dues ofcomplex and arcane legal process that results in a workers and creditors, but also for the economy.system that favours promoters at the expense of Unfortunately, as stated, the Companies Bill remainsworkers and secured creditors. outside Parliament.
8
Growth, MacroeconomicDevelopments, and Policies
Overview reducing the profitability of producing exports com-pared to import substitutes and because of the deterio-
India's trend growth of 5.8 per cent per annum since rating infrastructure. These issues raise questions about1980 is the highest outside South East and East Asia India's ability to take advantage of the next upswingamong large developing countries. However, despite in world growth, the domestic opening up underthis relatively high growth, poverty incidence is still agreements with the WTO and the end of the Multi-34 per cent (World Bank estimate, see Annex Table 1.1) fibre Arrangement. Agricultural and urban growth faceand its economic structure remains relatively unchanged. environmental problems. The general governmentBy comparison, even after the South East Asian crisis, deficit (as a percentage of GDP) deteriorated in 1998-9,Korea, Thailand, and Indonesia have substantially higher rising to about the 1990-1 level, raising concerns overper capita incomes and social indicators, and consider- macroeconomic instability that could hurt the poor.ably lower poverty than India, although the countries The deficit also limits private investment throughhad similar per capita incomes in the 1960s. The expe- crowding out keeping real intcrest rates high. Withinrience of South East Asia suggests that India needs government budgets, consumption spending, which issustained, higher, more labour-using, outward-oriented increasingly financed by borrowing, is crowding outgrowth, coupled with improved social service delivery, critically needed social and infrastructure spending (seein order to reduce poverty. also Chapter 3). Large implicit and explicit subsidies
Moreover, the sustainability and vulnerability of and inefficient public enterprises deter private-sector-India's current approach to development are a concern. led development and contribute to inequalities andSubstantial reforms in the early 1990s led to high inefficiencies, and raise questions about the sustainabilitygrowth. More recently, however, growth has declined of agricultural growth that is so critical for povertywhile reforms have slowed and in some cases reversed, reduction.for example tariffs and the fiscal deficit. The key A rapid reduction in India's poverty and increasedagricultural sector remains highly regulated (see Chap- growth will depend on a second wave of reform, aster 6). Export growth, which could provide more all recent governments have recognized. As discussedemployment, has slowed, not only because of the in the previous chapters, reducing poverty and increas-slowing world economy but also because policy is ing development will depend on a comprehensive

Growth, Macroeconomic Development, and Policies * 103
framework that improves access of the poor to educa- monsoons and harvests, albeit less than in the 1970stion and health services, improves infrastructure, and and 1980s (see Chapter 1 and Ahluwalia 1991). This
provides good governance, transparency, a sound legal dependence, coupled with the inefficiencies and un-
and judiciary system, a strong financial system, and sustainability in rural public spending, limited reformshuman and environmental sustainability. As discussed in agriculture, and potential environmental problemsin this and the previous chapter, sustained development related to water and heavy fertilizer use, raise concernswill also critically depend upon continued sound about the sustainability of current growth and poverty
macroeconomic policy, that is: reduction (see Chapters 1 and 6, and World Bank
greater openness to trade, to encourage more 1999b).efficiet greaterce opeannes tocreas labourdemand,anManufacturing growth slowed for the third consecu-
efficient resource use and increase labour demand, and tive year in 1998-9, to 5.2 per cent compared to 6.8
* sounder public finance, namely reduced subsidies per cent in 1997-8. The slowdown partly reflects a
and deficits and the realignment of government away shake-out and consolidation in capital-intensive sectors
from non-core public sector activities and consumption like autos, steel, cement, synthetic fibres, etc. Another
spending and towards more and better infrastructure factor may be the difficulties of the non-bank financial
and basic social services. sector (see Chapter 7), which had been a major source
of consumer and housing finance in the boom years.Domestically, large capacity increases have come on
Economic Growth in 1998-9 line; internationally, competition has increased, nota-
and over the Longer Run bly from East Asia in steel. In autos, these pressureshave led to lower prices and greater model choice that
In 1998-9, India's GDP grew 6 per cent, one of the have benefited consumers while putting pressure on
highest growth rates in the world and up from 5 older models like the Maruti 800. In steel, in contrast,
per cent in 1997-8, according to the new NAS.' Agri- protection has been increased for investment projectsculture accounted for all of the rise in GDP growth, that were undertaken despite worldwide excess capac-growing 7.6 per cent compared to -1.0 per cent in ity. The steel industry is now suffering from large
1997-8. Growth in all other major sectors declined in losses and many firms have already required financial1998-9 (see Table 8.1). This pattern, and other recent restructuring (see Chapter 7). Moreover, the protec-
developments, suggest that India's growth and poverty tion-induced rise in steel prices will hurt consumers andreduction continue to depend heavily on good worsen the international competitiveness of Indian
users of steel. The case of steel represents one reversion
All 1998-9 figures are revised estimates. All GDP-related to the inefficient approach of the 1980s, in which scarcefigures in this chapter from 1993-4 onward are based on the new capital was allocated to internationally uncompetitive,
NAS except, as noted, when it is necessary to make comparisons capital-intensive industries that required protectionwith pre-1993-4 data. The growth rates in the new NAS are and did not generate much employment. Similar con-somewhat higher than the old. Moreover, there is an absolute cerns exist regarding the projected expansions in pet-
difference in the new and the old (nominal) estimate in 1993-4 rochemicals and refining.
of 9.0 per cent, correspondingly reducing the ratios of most Another factor in manufacturing's slower growth
items to GDP, such as budget figures, investment, and trade, by w t f s i
about 8.0 per cent. This difference in the new NAS reflects a refle ti o l slowdown in wortr but
rebasing to 1993-4 prices and sectoral value added coefficients reflectmg not only the slowdown in world trade but
plus the inclusion of some new products; the old NAS series was also the further loss in India's share of world exports
based on 1980-1 prices and value added coefficients. The largest after 1996 (see Chapter 6). From the standpoint of
absolute sectoral differences between the old and the new series demand, without sustained higher export profitability
are in agriculture (8 per cent higher than the old NAS estimates and growth, Indian businesses are likely to invest only
in 1993-4), real estate, including owner-occupied housing (10 enough to supply a domestic market that can be
are also much larger inP percentag The fishmig and mte9mg sectors expected to grow at about the post-1980 trend rate of
series, but their small absolute size means they contribute little 5.8 per cent per annum, thereby making 5-6 per cent
to the difference in overall GDP between the old and new growthaself-fulfillingprophecy(Bhagwati1998,Worldfigures. Since the CSO has not yet revised the pre-1993-4 GDP Bank 1998a). From the supply side, a more open
figures, this Report reestimates them by applying the old growth economy-more exports and imports-is needed to
rates to the new 1993-4 figures, which leaves the pre-19 93-4 encourage better resource use, faster productivity
year-to-year growth rates unchanged. growth, and higher labour demand.

104 * India: Reducing Poverty, Accelerating Development
TABLE 8.1GDP Growth 1981-99
(per cent per year)
1981-90 Avg. 1990-1 1991-2 1992-3 1993-4 1994-5 1995-6 1996-7 1997-8a 19 98_ 9b
GDPfc 5.7 5.4 0.8 5.3 6.2 7.8 7.6 7.8 5.0 6.0Agriculture and allied 3.6 3.8 -2.3 6.0 3.7 5.4 0.2 9.4 -1.0 7.6Industry 7.1 7.6 -0.7 4.0 6.1 9.3 12.2 6.0 5.9 4.1
Mining and quarrying 8.5 10.7 3.7 1.1 1.7 9.2 7.4 1.2 2.7 -2.0Manufacturing 7.6 6.0 -3.6 4.1 8.5 10.6 15.0 7.7 6.8 5.2Electricity, gas, and water 8.8 6.5 9.6 8.4 6.3 9.3 6.7 5.7 6.6 6.3Construction 4.9 11.6 2.2 3.4 0.9 5.3 8.2 2.9 4.1 2.1
Services 6.7 5.2 4.1 5.4 8.0 8.5 9.8 8.0 8.2 6.2
a Quick estimates.b Revised estimates.Notes: 1. Based on the new series with 1993-4 as base year.
2. Figures for 1981 to 1992 are staff estimates.Source: Central Statistical Organization, National Accounts Statistics 1998, and Quick Estimates 1999.
From a longer-term perspective, India's post-19 80 trend that exports use more labour than imports (see Annexgrowth rate of 5.8 per cent per annum is the highest Table 6.1). Second, increased competition probablyoutside South East and East Asia among countries raised the firm-level efficiency of resource use. Third,with over 20 million population. During the 1990s, the rise in productivity also probably reflects better andIndia rebounded rapidly from the 1990-1 balance- more efficient use of capital, also associated with greaterof-payments crisis, returned to the post-1980 trend openness. Protection on capital goods was reduced andgrowth rate in 1992-3 and 1993-4, then, led by surging FDI rose dramatically, while domestic private sectorprivate sector production and investment, achieved an investment rose to an annual average of 16.5 per centunprecedented 7.7 per cent per annum average growth. of GDP (old series) over 1993-6, as compared to anHowever, in 1997-8 and 1998-9, average growth fell average of 14.6 per cent in the previous five years (seeback to the post-1980s trend and is below the (statis- also Annex Table 8.1). A possible indicator of India'stically) significant rise in growth that occurred from increased productivity, in the macroeconomic sense,1993-4 to 1996-7 (see Annex 8.1). was the rapid growth of exports and increased market
The years of rapid growth were associated both with share from 1992 to 1996, despite the slow growth of andgreater factor productivity in a macroeconomic sense intense competition in world markets in products that(see the discussion in Annex 8.1) and a higher invest- India exports (World Bank 1998a).ment rate, which was also encouraged by liberalization. Correspondingly, the recent slowdown in growthThe increase in productivity probably reflects three may be explained, at least partly, by exhaustion of thefactors. First, more efficient use of resources was en- benefits of the first stage of reform and the slowdown,couraged by greater openness to trade. Liberalization and in some cases reversal, of reforms (World Bankincreased incentives to export and import substantially, 19 98a, Chapter 6). In particular, as India has raisedraising the share of both exports and imports in output. protection in the last two years, it has lost market shareIn a relative sense, resources shifted out of industries in world exports (see Chapter 6), and exports andcompeting with imports and shifted into exports, imports have declined as a percentage of GDP. Privatewhere they are more productive in a macroeconomic and foreign investment remain higher than in the past.sense. Estimates suggest that on average the productiv- However, more protection encourages domestically-ity of land, labour, and capital in exports is over 47.6 oriented investment, lowers job creation and outputper cent more than in the secondary industry,2 and growth, and correspondingly makes the development
process less sustainable, as Brazil's example in the 1960s2 The effective rate of protection in secondary industry is and 1970s suggests.3
about 47.6 per cent. In other words, the average 'margin'available to pay for land, labour, and capital in the secondary 3 From 1957 to 1977, Brazil was a 'miracle' economy, withsector is 47.6 per cent more than to produce a unit of exports. growth over 7 per cent per annum. The oil price shocks and theThus switching to export production would generate 47.6 debt crisis exposed the fundamental unsustainability of thisper cent more output (valued at world prices) with the same growth. Not only was there macroeconomic instability thatresources. manifested itself in severe inflation and balance-of-payments

Growth, Macroeconomic Development, and Policies * 105
From a longer run perspective, India's 5.8 per cent informal, rural labour to formal labour in the export-per annum average growth is a relatively good perfor- oriented sector (World Bank 1996b).mance; however, it must also be recognized that The comparison with East Asia suggests that Indiatwenty years of growth at this rate has not changed needs higher, more labour-intensive growth, and im-India much. For example, 73 per cent of the population proved social sector delivery to faster reduce poverty.still live in rural areas; poverty has declined, from 43 Key elements in increasing growth and reducing pov-per cent in 1983 to 34 per cent in 1997 (see Annex Table erty will be (a) further reduction in India's still-high1.1), but the incidence of poverty remains high even protection, in order to encourage greater labour de-in the rapidly growing states. mand, more efficient use of resources, and greater
The example of the rapidly growing East Asian productivity growth through greater internationaleconomies, as well as the cross-sectional analysis of specialization and competition; (b) liberalization ofIndian states (see Chapter 3) suggests that sustained, internal markets, particularly agriculture and labourfaster, labour-using growth, along with inclusive edu- markets;4 (c) improved infrastructure to better thecation and health services, will contribute to reducing links between domestic and international markets andpoverty (see Table 8.2 and Annex Table 4.1). India, spread the impacts of liberalization throughout theIndonesia, Korea, and Thailand all had similar per country; and (d) widespread improvement of socialcapita GDPs (in $ terms) in the late 1960s (see IMF, services (see Chapters 2, 5, and 6 for discussions ofInternational Financial Statistzcs, various issues). How- policies along these lines).ever, the Asian 'miracle' economies grew faster than Moreover, even India's current growth rates mayIndia from the late 1960s to the mid-1990s, particularly be difficult to sustain without significant changes.in the 1970s. Their fast growth reduced poverty dra- One concern is the possible slowdown in total factormatically with little worsening of income distribution productivity growth in agriculture, associated with pos-(World Bank 1993). The recent crisis was serious and sible environmental problems (see Chapter 6 and An-did reduce the South and East Asian economies' lead nex 8.2). Also, environmental degradation arising fromover India, but, except for Indonesia, these countries inefficient and distortionary energy, water, and fertil-are recovering surprisingly rapidly. Even Indonesia, izer subsidies adversely affects the economy's capacitythe country hardest hit by the crisis, had a poverty to grow (see Annex 8.2 for a fuller discussion of theincidence below 20 per cent in 1998 (World Bank relationship between environment, economic growth,1999a). Generally speaking, East Asia's growth was and poverty). A second concern is the apparent slow-associated with higher investment rates and higher and down in growth in the poorer states (see Chapter 3).greater increases in the average education of the labour Continuance of these trends would slow the growth offorce than India. East Asia also had a much greater overall factor productivity and the rise in incomes, asdegree of outward-orientation than India, which, well as push up the relative price of agriculture fromthrough the gains from trade, external competition, the cost side, to the detriment of poor consumers.and access to imported technology, tended to ensure Macroeconomic stability and vulnerability to inter-more productive use of capital and greater growth of nal and external developments are also important issueslabour demand in the macroeconomic sense. Part of in sustaining India's growth. India's still-large fiscalIndonesia's growth reflects the shift of females from deficit and the increasing use of borrowing to finance
public sector consumption, notably inefficient subsides
deficits, but also Brazil's improvement in education was one of 4 In East Asia, more than elsewhere, governments resisted thethe lowest among large developing countries. Resource alloca- temptation to intervene in the labour market to counter out-tion followed an inefficient, forced import-substitution model, comes unpalatable in the short run or to particular group.with protection and subsidies shifting resources into high-cost, A relatively high level of efficiency in the allocation of labourcapital-intensive sectors (the contribution of these sectors was was achieved by allowing wages and employment to be deter-overestimated in GDP because their contribution to output was mined largely by the interaction of those supplying and thosenot adjusted downward to reflect their higher prices compared demanding labour services, rather than by the governmentto imported goods). Despite FDI in many of these sectors, legislation, public sector leadership, or union pressure.... Inproductivity growth in import-substitution was actually less East Asia, wages were pulled up by increases in the demand forthan in the economy as a whole. The limited employment labour, whereas elsewhere there was a greater tendency forproduced by these industries along with the low levels of wages to be pushed up artificially. [World Bank 1993, p. 266]primary education resulted in one of the most unequal distribu- It is also worth noting that the rapidity of growth in labourtions of income in the world. See Coes (1995) and works cited force demand reduced the impact of limits on labour forcethere. flexibility in East Asia. See also the discussion in Chapter 6.

106 * India: Reducing Poverty, Accelerating Development
TABLE 8.2India and High-growth East Asia: A Statistical Comparison
GDP per capita 1997 National GDP Openness' Investment rateb Literacy rate'
PPP $ Current $ 1996/1970 1996/1970 1997/1977 1970 1997 1970 1996 1970 1997Growth p.a. Growth p.a. (Female) (Female)
India 1510 451 3.4 4.7 5.2 7.2 17.8 14.6 22.9 33.6 62.6
(18 1) (50.0)
China 3120 745 59c 10 10.4e 11.2e 35.4 28.3k 33.8 51.7 82.9
(35.8) (74.5)Indonesia 3490 1079 5.6 6.9 6.4 22.9 44.1 13.6 31.8 56.3 85.0
(44.0) (79.5)Korea 13,580 9623 8.1 8.4 7.8 32.2 63.6 23.0 35.0 86.6 97.2
(79.8) (95.5)
Malaysia 8190 4544 6.3 7.3 7.1 77.8 159.7 17.7 42.4 58.3 85.6(46.1) (81.0)
Thailand 6690 1959 6.5 7.5 7.3 28.4 77.3 23.7 35.6 80.0 94.7
(72.7) (92.8)
a Openness equals total trade (exports + imports) as share of GDP.
b Gross fixed investment as a share of GDP.Figures in the brackets are female literacy rates
d Data pertain to 1978-96.C Data pertain to 1978-97.
D Data pertain to 1979.
Sources: IMF, International Financial Statistics, World Bank, World Development Indicators.
that often probably increase inequality, raise concerns. more importantly, rice (13 per cent) and other cookingThe rest of this chapter discusses India's commitment oils (about 30 per cent). Beginning in December 1998,to macroeconomic stability, areas of potential vulner- food prices actually fell as the good 'winter' harvestability and policies to reduce these problems. brought inflation down to low levels. Indeed, onion
prices fell so far that exports were allowed to resume.
Inflation and Monetary Policy The transitory rises in food prices hit the poor hard,particularly the urban poor. A more elastic agricultural
Recent Inflation history illustrates both India's distribution system, with greater private participation,still-high dependence on good harvests, which is better futures markets, and liberalized imports (Worldmagnified by the rigid food distribution system and Bank 1999b) would help reduce the structural problemcontrolled agricultural trade, and India's continued of temporary rises in prices from harvest shortfalls.commitment to keep inflation under double digits. In fact, price variations over the last four years haveThe wholesale price index (WPI)-based inflation (year largely reflected variations in primary articles andon year) was 4.8 per cent in March 1999, down from fuel-'core inflation', as represented by the WPI for5.3 per cent in March 1998, and dropped further to manufactured products, has been relatively steady.less than 3 per cent in October 1999. Consumer price (Between 1995-6 and 1998-9, the WPI at end Marchindices for industrial workers (CPI-IW) rose from 8.3 was 5 per cent, 4.9 per cent, 4 per cent, and 3.7 per centper cent in March 1998 to 8.9 per cent in March 1999, respectively. Similar rates for primary articles werebut dropped sharply to 0.9 per cent in October 1999. 5.4 per cent, 7 per cent, 5.5 per cent, and 7.8 per cent,These numbers do not reveal the sharp intra-year varia- and for fuel and power 3.7 per cent, 16.9 per cent, 11.4tions during 1998-9. Earlier, betweenJune and October per cent, and 1.7 per cent respectively).1998, WPI inflation exceeded 8 per cent, while CPI Over the last few years, inflation has trended down-inflation rose to as much as 18-20 per cent in October- ward, although the decline has been erratic (see Fig. 8.1)November 1998, following poor harvests and lack of because of supply shocks to food prices. It is alsoimports. Specifically, there were sharp rises in the important to note that the price data as well as other(wholesale) prices of onions (247 per cent from Novem- data, need substantial improvement (see Box 8.1). Theber 1997 to November 1998), potatoes (157 per cent), weights in the CPI are outdated, and the WPI includesmustard oil (103 per cent), chillies (70 per cent), and, numerous items whose prices have not recently changed.

Growth, Macroeconomic Development, and Policies * 107
Average CPI inflation = 8.0 per cent
.° 25 Money growth 25
c 20 Average M3 growth 1984-99 = 17.5 per cent 20
0 150, 15 CI1
lo 1
0)0)5 5WPI
0 X, Y X 0
In In ~~~O 10 r- r- oc~0 00 ON a,ON ON ONCY ON ON a, ON, a, O ON ON O
0) 0) 0)~~~~c Q) LO)c
FIG. 8.1: India: Inflation and Money (M3) Growth 1994-99
India has consistently tried to keep inflation below as residual financier of the rising government deficit,double digits, by tightening monetary policy when and (c) year-end foreign exchange inflows and the RBI'sinflation exceeded 10 per cent, most recently in 1995-6. net sales of government debt. The RIB eased credit forThe recognition of the vulnerability of the poor to the private sector, although much of the repatriationsinflation (see Chapter 1), reiterated in Prime Minister ended up in holdings of government debt throughVajpayee's Lucknow statement (3 February 1999) that reserve and liquidity requirements and banks' volun-'Inflation is the single biggest enemy of the poor', tary purchases of government debt. In 1998-9, theexplains Indian policy-makers' commendable commit- RBI's holdings of government debt rose 12.9 per cent,ment. Higher inflation increases relative price variabil- faster than 8.8 per cent in 1997-8. The growth of RBIity, as worldwide experience shows, and India's poor credit to government was particularly rapid from Junelack the resources to offset even a temporary rise in the to November 1998, representing absorption of deficit-relative prices of the necessities they consume. Expe- induced government debt that the banks and otherrience worldwide also suggests that the inflation tax is buyers were unwilling to buy at interest rates that theregressive, because the poor hold much of their assets RBI and the government considered appropriate. Moneyin currency, and currency bears the brunt of the growth was also rapid, in the 19-21 per cent range,inflation tax. Hence maintenance of low inflation is a from August 1998 to February 1999. However, creditkey anti-poverty measure. growth slowed in March 1999, when RBI claims on
Broadly speaking, monetary policy has been well- government actually declined by nearly 3 per cent,managed recently, given the increasingly complex en- which contributed to slowing down of money growth.vironment, but the continued large fiscal deficit places Also in March 1999, following the Budget Speech andlimits on central bank independence. In 1998-9, broad the Finance Minister's expression of hopes that mon-money (M3)s growth continued the rise that began in etary policy would 'do its part', the RBI cut the Bank1996-7, and reached twelve-month growth rates of Rate and repo rates and lowered the (cash) reserve19-21 per cent from August 1998 to February 1999. requirement to 10.5 per cent. This led to a smallHowever, in March 1999, the twelve-month growth of reduction in public banks' lending rates.6
money slowed to 18.4 per cent, somewhat higher than In the April 1999 monetary policy statement, thethe fifteen-year average of 17.5 per cent per annum. In RBI reaffirmed its commitment to low inflation. Effec-the first five months of 1999-2000, M3 growth re- tive 8 May 1999, the CRR was further reduced to 10mained above 18 per cent until August 1999, when it per cent, which enhanced the lendable resources ofslowed to 17 per cent. banks. In the first five months of 1999-2000 (compared
The pattern of money growth within 1998-9 re- with end March 1999), RBI credit to the governmentflected (a) the repatriation of the Resurgent India Bond actually declined by 1.2 per cent (in the same period(RIB) proceeds, (b) the resumption of the RBI's' role of 1998-9, it had increased 4.1 per cent), while banks'
5 M3 includes currency with the public and demand deposits 6 Also, small saving rates were reduced on 1 January and 20with the banking system plus'other' deposits with the RBI (Ml), March 1999, with the cuts ranging from 0.5 to 1.0 percentageplus time deposits with the banking system. points.

108 * India: Reducing Poverty, Accelerating Development
credit to the commercial sector showed a pickup of during a period when manufacturing growth was2 per cent (in the same period of 1998-9, it showed no falling;8 (b) the 1998-9 growth of money was boostedincrease). by the RIB sale and year-end capital inflows; (c)
Lending and dcposit rates drifted downward in variations in base money are increasingly linked to1998-9, but money market and government securities' variations in international reserves and, from time torates, by and large, rose over the year (see Annex Table time there has been an offsetting movement between8.2). Lending rates of major public sector banks, which reserves and the R-BI domestic claims, characteristic ofare more sensitive to the RBI's Bank Rate and govern- open economies (see Annex Table 8.3). This changedment policy, declined from 14 per cent in March 1998 empirical relationship suggests that India may increas-to about 12 per cent in April 1999, following the cut ingly face what Obstfeld calls the 'open economyin the Bank Rate from 10.5 per cent to 9 per cent in trilemma'-it is difficult to carry out an independentApril 1998, and to 8 per cent in March 1999. On the monetary policy while maintaining an exchange rateother hand, short-term rates such as the call money and target when the capital account is (even partially) open.ninety-one day treasury bill rates, sensitive to mon- Of course, India's large international reserves (overetary interventions and the foreign exchange market, $ 30 billion), low short-term debt, and limitations onmoved in a general upward direction. Also, longer- capital flows leave it with a fair degree of monetaryterm yields on government securities, both in the independence from international developments.primary and secondary markets, moved up over the Nonetheless, monetary policy is likely to be increas-year, reflecting the market sentiment and the large and ingly affected by external objectives and developments.growing volume of central government borrowing. Correspondingly, unless the authorities adopt a freeSuch large government borrowing, along with large floating regime, the RBI's ability to finance the govern-non-performing loans, crowds out the private sector ment will increasingly be reduced.and puts a floor on real interest rates that the privatesector has to pay (see Chapter 7). Since June 1999, ratesseem to have been tending upward again (see RBI Reducing the Fiscal Deficit and Realigning
Monetary policy-making is increasingly complicated Government to Speed Up Developmentby India's more open economy, as well as domestic and Reduce Vulnerabilityfinancial liberalization.7 Some examples illustrate thegrowing importance of international factors in mon- Overview of Fiscal Developmentsetary developments: (a) since August 1997, an impor-tant objective of monetary policy has been to limit Indiats genxerl government deficit (consolidated Centreexcessive pressures on the exchange rate, even though and states excluding disinvestment re?venues)9 w0orsenedthis required transitory increases in interest rates nearly 2 per cent10 of GDP in 1998-9 (see Fig. 8.2), and
it had previously been among the world's largest
7 As shown in Fig. 7.1, NBFCs grew sharply after financialliberalization, providing credit and contributing to a slower 8 To limit pressure on the exchange rate, which had depre-than usual rise in the M3:GDP ratio (the demand for M3 did ciated from Rs 36.4 per $ in August 1997 to Rs 40 per $ innot rise as fast as expected because of demand for NBFC January 1998, the RBI raised the repo rate (from 9 per cent todeposits) that made it difficult to target monetary tightness. 11 per cent) and increased the CRR (from 10 per cent to 10.5Then, in early 1997, problems began in the NBFCs, and the per cent), despite slower industrial growth. Exchange marketdemand for their deposits shifted to components of M3, at least pressures emerged again, particularly after the nuclear explosionsat the margin. This contributed to a faster rise in the ratio of in May 1998, which further depreciated the exchange rate toM3 to GDP than in the recent past. Again, monetary targeting about Rs 43 per $ by mid-August 1998. However, with thewas complicated, particularly in the context of the problems inflow of $ 4.2 billion from the RIB and a further rise in the CRRassociated with the East Asian crisis and the rising fiscal deficit. to 11 per cent in August, the rupee appreciated slightly toThus, while M3 was growing fast because of the switch-back stabilize at about Rs 42.5 per $ from end-August 1998 untilfrom the NBFC deposits, overall credit growth (including credit March 1999.from the NBFCs) was not growing as fast. In other words, the 9 Speaking broadly, capital revenues from disinvestmentvarying growth of the NBFCs contributed to instability in the reduce state assets and are not sustainable; they are more like aM3 to GDP relationship. Kannan (1999), Vasudevan (1999), and financing item than tax revenue.Mohanty and Mitra (1999) discuss problems of monetary target- I( All the figures in this section have been rounded-off anding in the Indian context (see also RBI 1999d, Boxes III.1, III.2, therefore may not match with the figures in the graphs andand 111.3). tables.

Growth, Macroeconomic Development, and Policies * 109
Box 8.1
THE NEED TO IMPROVE INDIA'S DATA
India has a long tradition of good statistics and statisticians. India was one of the first developing countries to undertakeregular household surveys, beginning in 1951, in order to track poverty reduction and household living standards. Recently,India has begun to publish much more economic and social data with a much shorter lag. For example, much of RBIand Commerce data are available on the Internet (although there is a longer lag on RBI data on trade, and this needsto be improved, see below) , the WPI is available with a minimal lag, and the various RBI reports show bankingdevelopments, including non-performing assets, in much greater detail. India is compliant with the Special DataDissemination Standards of the IMF, and has begun publishing quarterly GDP estimates, as well as monthly fiscal accountsfor the central government.
Over time, however, the usefulness of Indian statistics for policy making has declined. The economy's increasedcomplexity and liberalization have complicated data collection, as has occurred in many countries.
In many cases, however, India's data problems also reflect limited use of new methods and lack of efforts to achieveconsistency between different data-collecting agencies. The resulting data problems also complicate policy making. Forexample, in the area of poverty, the consumption (and foodgrains consumption) estimates in the NSSO sample surveysand the NAS have increasingly diverged (see Chapter 1), and consumption in the National Accounts may itself beunderestimated (see below), making it hard to say whether poverty has declined or stagnated. It is difficult to say howwell programmes to improve school enrolments are proceeding, when official figures for gross enrolment ratio are higherthan the NSS figures for gross attendance ratio, especially for classes I-V where the difference is about 20 per cent (GOI1998b). Similarly, unofficial sample surveys suggest much less participation in employment schemes than official datarelating to employment generated by such schemes.
Anti-poverty and anti-inflation policies are complicated by the lack of a good indicator of inflation. The CPI is basedon outdated weights, including those for some food items that have declined in the household's market basket (simplyshifting to more up-to-date weights makes a major difference in estimates of poverty changes; see Dubey and Gangopadhyay1998). The WPI includes a large number of goods that have shown no increase in prices for some time. Not surprisingly,there are substantial differences in inflation estimates from year to year. Some of the problems are sought to be addressedin the revised, 1993-4 base, WPI. A CPI revision exercise has also begun.
The National Accounts have been updated and rebased recently for the years 1993-4 onward. Such rebasing isappropriate to take into account the economy's changed structure and India does it every ten years or so. The new NationalAccounts appropriately reflect new types of agricultural production, and rises in owner-occupied housing and trade (seefn. 1 in this chapter). The state National Accounts now need to be rebased as well. The old National Accounts serieswas well coordinated between estimates of state GDP and national GDP-national GDP has remained a fairly constant15 per cent larger than the sum of state GDP estimates for the fourteen largest states, but until the State Accounts arerebased, that link will be broken. The rebasing of the state data is particularly important given the major difference betweenthe old and the new estimates of agricultural production, which is important in most states. Second, the pre-1993-4 GDPdata need to be 'officially' rebased. As part of that rebasing it may be possible to resolve the increasing 'residual' in theold National Accounts estimates between production and expenditure estimates of GDP (6.5 per cent of GDP in 1995-6).The direct estimates of investment by type and sector were about 2 per cent of GDP less than the estimates derived fromthe equality with saving (this divergence is part of the divergence between production and expenditure based estimatesof GDP); in the 1980s, the divergence was about the same size but of the opposite sign. Moreover, the estimates of'household' investment varied substantially from year to year. The residuals are much smaller in the new NationalAccounts, but the prior years remain a problem and efforts will be needed to ensure the gap does not widen again. Regardingspecific sectors, the estimates of GDP in the key agricultural sector are based on combining yield and acreage estimates,both of which could be subject to large errors-it might be possible to use satellite estimations at least as a check. Theindustrial production index, the responsibility of the Ministry of Planning and Programme Implementation, shows largemonth-to-month swings in individual industries that make it difficult to interpret the direction of this increasinglyimportant sector. Hopefully the new index, rebased to 1993-4, will resolve some of these problems.
Finally, in trade, RBI estimates of imports have typically exceeded customs estimates-in 1996-7 and 1997-8, theyexceeded by 23-5 per cent (around $10 billion), but in 1998-9 the gap fell to $ 5.7 billion (see Annex Table 8.4). Lessthan a third of this seems to be explainable by the shift of gold and silver imports into customs data following theliberalization of such imports in October 1997.
These examples suggest that major efforts are needed, not only to publish data quickly but to improve its quality andconsistency, both internally and with other data sets, supported by analytical work. This would make the large amountsof data being collected more useful to policy makers and the public. Another, more fundamental problem, on which thereis wide agreement, lies at the stage of primary data collection itself, and will need to be corrected in order to create alasting solution.
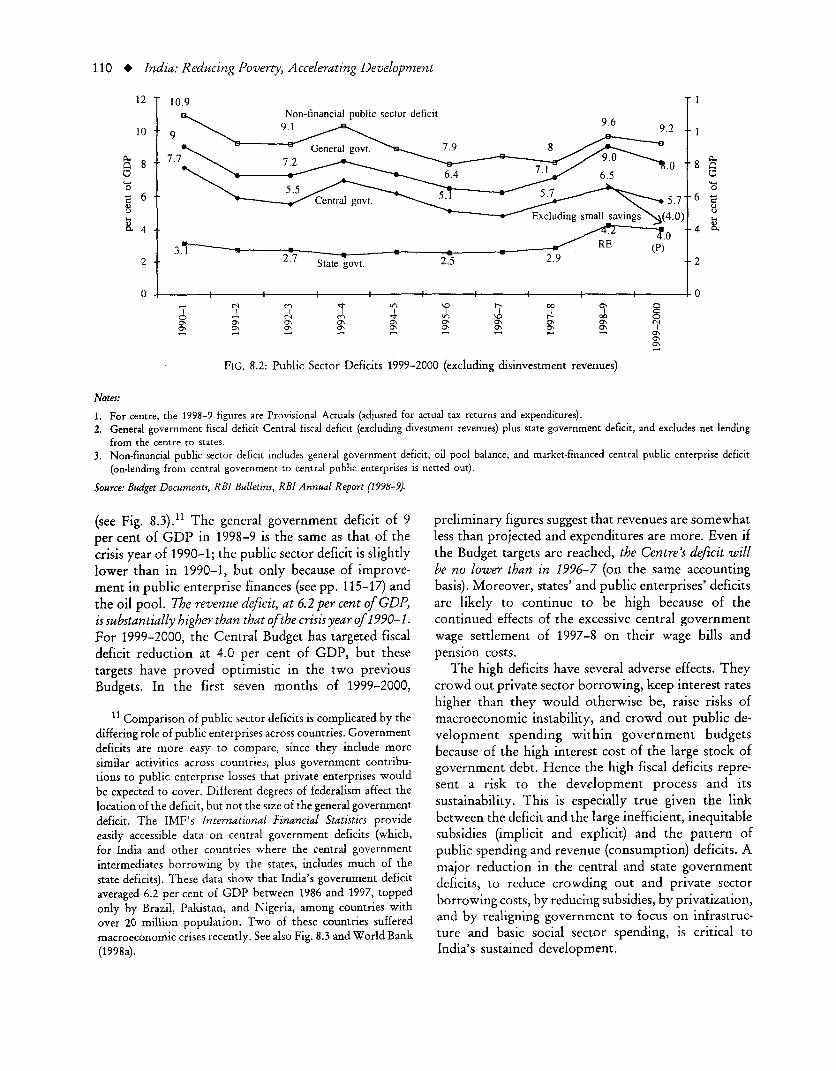
110 * India: Reducing Poverty, Accelerating Development
12 I 0.99Non-financial public sector deficit
10 9 9.2fi Gen~~~~~~eral govt. 7.98
8 7. 77< 2 = 8a0
6 6~~~~~~~~~ 6 Central govt.~~~~~~~~~~~~~~~~~~~~~~~~~~~~~~~~~~~~~~~~~~~~~~~~~~~~~~~~~~~~~~~~~~~~~~~~~~~~~~~~~~~~~~~~~~~~~~~~~~~~~~~~~~~~~~~~~~r ot .
Excluding small savings 4.0)4
2 23: RE (P)
0 I l I l l 0- r.i dx 0~~~~~~~~~~~~~~- 00O
10 00~~~o ~ ~ ~ ~ ~~d 3x CL Ox O h \ O\ CNl
FIG. 8.2: Public Sector Deficits 1999-2000 (excluding disinvestment revenues)
Notes:
1. For centre, the 1998-9 figures are Provisional Actuals (adjusted for actual tax returns and expenditures).2. General government fiscal deficit Central fiscal deficit (excluding divestment revenues) plus state government deficit, and excludes net lending
from the centre to states.3. Non-financial public sector deficit includes general government deficit, oil pool balance, and market-financed central public enterprise deficit
(on-lending from central government to central public enterprises is netted out).
Source: Budget Documents, RBI Bulletins, RBI Annual Report (1998-9).
(see Fig. 8.3).11 The general government deficit of 9 preliminary figures suggest that revenues are somewhatper cent of GDP in 1998-9 is the same as that of the less than projected and expenditures are more. Even ifcrisis year of 1990-1; the public sector deficit is slightly the Budget targets are reached, the Centre's deficit willlower than in 1990-1, but only because of improve- be no lower than in 1996-7 (on the same accountingment in public enterprise finances (see pp. 115-17) and basis). Moreover, states' and public enterprises' deficitsthe oil pool. The revenue deficit, at 6.2 per cent of GDP, are likely to continue to be high because of theis substantially higher than that of the crisis year ofl990-1. continued effects of the excessive central governmentFor 1999-2000, the Central Budget has targeted fiscal wage settlement of 1997-8 on their wage bills anddeficit reduction at 4.0 per cent of GDP, but these pension costs.targets have proved optimistic in the two previous The high deficits have several adverse effects. TheyBudgets. In the first seven months of 1999-2000, crowd out private sector borrowing, keep interest rates
higher than they would otherwise be, raise risks of1 Comparison of public sector deficits is complicated by the macroeconomic instability, and crowd out public de-
differing role of public enterprises across countries. Government velopment spending within government budgetsdeficits are more easy to compare, since they include more because of the high interest cost of the large stock ofsimilar activities across countres, plus government contribu-tr . government debt. Hence the high fiscal deficits repre-tions to public enterpnrse losses that private enterprises would sbe expected to cover. Different degrees of federalism affect the sent a risk to the development process and itslocation of the deficit, but not the size of the general government sustainability. This is especially true given the linkdeficit. The IMF's International Financial Statistics provide between the deficit and the large inefficient, inequitableeasily accessible data on central government deficits (which, subsidies (implicit and explicit) and the pattern offor India and other countries where the central government public spending and revenue (consumption) deficits. Aintermediates borrowing by the states, includes much of the major reduction in the central and state governmentstate deficits). These data show that India's government deficit deficits, to reduce crowding out and private sectoraveraged 6.2 per cent of GDP between 1986 and 1997, topped borr icts, by re ducing sut by privatizatoronly by Brazil, Pakistan, and Nigeria, among countries with orrowing costs, by reducing subsidies, by privatization,over 20 million population. Two of these countries suffered and by realigning government to focus on infrastruc-macroeconomic crises recently. See also Fig. 8.3 and World Bank ture and basic social sector spending, is critical to(1998a). India's sustained development.

Growth, Macroeconomic Development, and Policies * 111
3.0 per cent of GDP
2.0 --
1.0
-1.0
-2.0-
-3.0 -0- 7 77a
-4.0 0 ) r 0 00 0
-5.0 - -~ ~ ~ ~ a - .i0
00-6.0 - 3
S~~~~~~~~~~~
-7.0 ~-
-8.0 n Z
-9.0 .2 0
1000
FIG. 8.3: Central Government Surpluses/Deficits: Developing Countries with over 20 million Population (Average 1987-97)
Source: IMF, International Financial Statistics.
7The 1998-9 Centralgovernmentdeficit was 6.5percent imports' taxes especially reduced by the fall in inter-of GDP excluding disinvestment capital revenues (pro- national oil prices. Excise duties, corporate taxes, andvisional figure including post-budget revisions in income taxes fell short of Budget targets by about 3.3revenues and expenditures, see Table 8.3).12 This rep- per cent, reflecting the slowdown in industrial growth.resented a large slippage compared to the Budget target However, compared to 1997-8 realizations, corporateof 5.3 per cent. The deficit was also 0.8 per cent of GDP tax collections in 1998-9 rose substantially in rupeeworse than that in 1997-8, which in turn was 1.0 per cent terms, despite the ongoing recession, suggesting im-of GDP worse than that in 1996-7. For 1998-9, the provements in tax administration (see Chapter 4). Thecurrent (revenue) deficit deteriorated to 4.0 percent of main items in the expenditure overrun were smallGDP, the worst in the 1990s, continuing the long-run savings loans to states (0.5 per cent of GDP more thantrend of increased government dissaving/borrowing to budgeted), 'other' spending (0.1 per cent), and subsidiesfinance consumption. Of the slippage compared to the (0.1 per cent). Non-defence capital spending was only 0.5Budget, revenue shortfalls accounted for 0.6 percentage per cent of GDP, lower than budgeted but about thepoints of GDP while an expenditure overrun accounted same as in 1997-8.for 0.6 percentage points (see Table 8.3). From a longer-term perspective, India's deficit reduc-
Regarding revenues (see Annex Table 8.5),13 collec- tion was largely confined to the first two years aftertion of custom duties fell short of target by 11 per cent the crisis, and much of the reduction came frombecause of the slowdown in imports, with petroleum reductions in capital expenditures. The revenue deficit
12 has increased since 1990-1, from 3.2 per cent to 4.0All ratios are relative to the new GDP; the deficit was 7.2 per icrente G inc 1998-9, fmeain tha the governper cent of the old GDP in 1998-9. per cent oi GDP in 1998-9, meang ng that the govern-
13 Details of revenues and expenditures are only available as ment is increasingly borrowing to finance consump-revised estimates, not the provisional actuals. Unless otherwise tion The central government responded to the 1991stated, comparisons in this paragraph are between the 1998-9 crisis initially by cutting expenditures on non-food,Budget and the revised estimates. non-fertilizer subsidies and loans to the states and

112 * India: Reducing Poverty, Accelerating Development
TABLE 8.3Fiscal Slippage 1998-9
Budget % Revised % Actuals (P) %Rs bn GDP Rs bn GDP Rs bn GDP
Revenue 1620 (9.0) 1577 (8.7) 1505 (8.3)Tax revenue (net) 1169 (6.5) 1095 (6.1) 1051 (5.8)Non-tax revenue 451 (2.5) 481 (2.7) 454 (2.5)
Revenue expenditure 2101 (11.6) 2181 (12.1) 2162 (12.0)Interest payments 750 (4.2) 773 (4.3) 786 (4.4)Subsidies 220 (1.2) 247 (1.4) 219 (1.2)Defence 308 (1.7) 310 (1.7) 306 (1.7)
Capital expenditure 216 (1.2) 169 (0.9) 169 (0.9)Net lending 263 (1.5) 353 (2.0) 356 (2.0)Disinvestment in PEs 50 (0.3) 90 (0.5) 59 (0.3)
Gross Fiscal Deficit' 911 (5.3) 1037 (6.2) 1123 (6.5)
a World Bank definition
Note: (P)Refers to Provisional Estimates
Source: World Bank estimates based on Comptroller General and MoF data.
public enterprises1 4 (as percentages of GDP, see Annex the companies typically finance the difference and,
Tables 8.5 and 8.6). The jump in the deficit in 1993-4 from time-to-time, the government has retired its debt
was mainly corrected by further cuts in capital spend- to them. Domestic oil prices were liberalized in Sep-
ing and grants to states. In addition, wage costs were tember 1997 by moving them closer to prevailing
allowed to decline relative to GDP and the number international prices and providing for future adjust-
of central government employees declined about 4 ments in line with international prices. Following this
per cent until 1996-7 (see Annex Table 8.7). However, policy change, the oil pool ran a surplus in 1997-8 and
wage costs since then have been substantially pushed 1998-9, a development that was helped by the drop in
up by a pay settlement in 1997-8 that was well in excess world oil prices.' 6 However, beginning around the
of the Pay Commission recommendations. In addition middle of 1999, the oil pool once again began to run
the pay settlement rejected the Pay Commission's a (flow) deficit, as a result of the rise in international
recommendations to reduce staff by 30 per cent over oil prices and delays in increases in domestic prices,
ten years and eliminate positions that had remained particularly of diesel. On 5 October 1999, the govern-
unfilled for some time. Between 1991-2 and 1998-9, ment raised diesel prices sharply, in an attempt to
revenue expenditures remained unchanged around 12.0 correct for the potential deficit in the oil pool.
per cent of GDP (of which interest payments rose from The 1999-2000 central government Budget projects a
4 per cent to 4.3 per cent of GDP). Meanwhile, capital deficit reduction of 0.9 per cent of GDP, and also includes
expenditure declined from 1.7 per cent to 0.9 per cent an accounting change that switches the states' 75 per cent
of GDP over the same period. share of small saving deposits (1.2 per cent of GDP in
Over the last two years, the Oil Pool Account 1999-2000)from a loan by the Centre to a loan from a
(administered by the Oil Coordination Committee 'National Small Savings Fund' in the Public Accounts,
(OCC), and excluded from the central government thereby producing a projected central deficit of 4 per cent
accounts)'" has been a major factor in tightening of GDP (see Table 8.4). This Budget target will be
public sector fiscal accounts. The oil pool account difficult to achieve; it is based mainly on a projected
represents the government's obligation to compensate rise of nearly 0.7 percentage point of GDP in tax
oil companies for the difference between their revenues revenues over (actual) realizations in 1998-9 (see Annex
from domestic sales and the cost of oil internationally; Table 8.5). Moreover, the projected deficit reduction will
14 The public enterprises switched to borrowing on their own 16 The surplus has been used to pay down most of theaccount, albeit controlled by the central government and with accumulated deficit on the account (which confusingly is alsoan implicit central government guarantee. sometimes referred to as the deficit of the OCC). The (public)
15 In Annex Table 8.6, the central fiscal deficit has been oil companies had financed this accumulated deficit by borrow-defined both without the oil pool deficit (as the government ing until September 1997, when the central government issueddoes), and with the oil pool deficit. debt in the amount of the accumulated deficit to the companies.

Growth, Macroeconomic Development, and Policies * 113
TABLE 8.4Fiscal Deficit in the New Accounting Framework 1999-2000
(Rs billion at current prices)
1990-1 1991-2 1992-3 1993-4 1994-5 1995-6 1996-7 1997-8 1998-9 1999-2000prov. BEactuals
Centre (old definition) 446.3 363.4 401.7 602.6 583.9 612.8 667.3 889.4 1122.8 1050.8Less states' net small savings 70.3 54.8 42.6 50.0 96.8 99.9 106.7 150.6 237.9 250.0Centre (new definition) 376.1 308.6 359.1 552.6 487.2 512.9 560.6 738.8 884.9 800.8Memo: (%o GDP)Centre (old definition) 7.7 5.4 5.3 6.9 5.6 5.0 4.7 5.7 6.2 5.2Less states net small savings 1.2 0.8 0.6 0.6 0.9 0.8 0.8 1.0 1.3 1.2Centre (new definition) 6.5 4.6 4.7 6.3 4.7 4.2 4.0 4.7 4.9 4.0
Source: Budget Documents Controller General Accounts, MoF.
onlyget thecentre'sdeficit back to its 1996-71evel (defined Nominal revenue expenditures by the central gov-correspondingly, according to the new definition). And ernment were projected to rise only 9 per cent on aalthough the different accounting treatment of small sav- comparable basis. Non-defence capital expenditureings reduces the central government's deficit, it has no effect was projected to rise slightly faster than GDP, buteither on the central plus state government (general gov- would still reach only 0.6 per cent of GDP. Totalernment) deficit or the consolidated public sector deficit. defence spending (including capital spending) was pro-In the absence of improved efforts at raising own tax jected to remain a constant 2.3 per cent of GDP, whichrevenues, most state governments are likely to con- is much lower than the 3.1 per cent average for 118tinue their dependence on the high cost small savings low- and middle-income countries in 1995 (World Bankto fund their increasing deficits."7 Thus future policy 1998c). Explicit subsidies were projected to decline bytowards small savings will be a very important element 0.2 per cent of GDP, back to the 1997-8 level, as ain the evolution of states' fiscal deficits (see Box 3.3). result of the rises in PDS prices to the non-poor and
The 1999-2000 Budget rationalized customs tariffs, fertilizer prices announced in January. However, someleaving the average unweighted tariff roughly constant of this projected decline was offset by the post-budgetbut reducing the disparities in effective protection (see roll-back of some of the price increases in fertilizer,Chapter 6). It also rationalized excise taxes from 11 as is evident from the recent provisional estimates.rates to 3 rates plus 2 surcharges (which maintained Finally, it is worth noting that the reported figures forthe highest rates at 30 per cent and 40 per cent the public sector deficit do not include the recapital-respectively), and imposed 10 per cent surcharge on top ization of the public banks, which has averaged aboutof two personal income tax rates and the corporate tax 0.25 per cent of GDP each year since 1992-3, nor anyrate. It also included a Re 1 per litre cess on high speed funds for the Unit Trust of India in 1999-2000. Thisdiesel (raising Rs 50 billion), half earmarked for rural funding is treated as an exchange of assets in the capitaland social development and the other half, plus the budget, which affects the revenue and expenditureRe 1 imposed in the last fiscal year, to go to central and budget only as debt service is paid on the bonds thatstate highways and the railways. The Budget also made have been given to the institutions. Finally', an unrec-some tax changes that benefited mutual funds, housing, ognized contingent liability is the government's guar-and mergers and acquisitions, including allowing carry- antee of most of the foreign exchange risk on the 1998forward of allowances for losses. RIBs (see also fn. 27 in this chapter).
Post-Budget developments suggest that it may be17 Although in some sense, the new treatment of small savings hard to reach the deficit target. Preliminary estimates
is a decentralization measure, as recommended by the Gupta through October 1999 suggest that revenues are lessCommittee, the Budget approach does not deal with the ultimate and expenditures are sharply higher compared to theliability for the debt, or how interest rates will be set, or thedisposition of the interest differential (about 2 percentage points) same period last year. Some of the increase in expen-between the earnings of small savers and the higher on-lending ditures is due to support and lending for the statesrate charged by the Centre to the states, which will determine in the form of advances of tax revenue in return forwhether the change would be neutral, or benefit the states at fiscal reform in the states. (see Chapter 3 for detailssome cost to the Centre. on these recent MoUs signed between the centre and

114 * Inldia: Reducing Poverty, Accelerating Development
select state governments). Also, some unprogrammed waterlogging, and soil erosion. Lack of funds reducesexpenditures related to the Kargil war have been needed operations and maintenance. Because the powerincurred. tariffs are not related to peak use, they require in-
creased spending on capacity to meet demand and,Unsustainable State Finances Keep the General because the lack of such capacity and lack of mainte-Government Deficit Hligh and Reduce Social nance lead to load shedding and poor quality power,and Infrastructure Spending that is Critical they encourage purchases of generators as well. The
to Poverty Reduction fertilizer subsidies encourage use of an inefficientcombination of nitrous, potassic, and phosphatic
The states' deficit in 1998-9 widened even more than fertilizers. Moreover the subsidies have not even fulfilledthat of the centre, to 4.2 per cent of GDP (see Annex their distribution objectives and may in fact contributeTable 8.8), and is projected to be as high as the centre's to inequalities, since they are subject to capture bydeficit (under the new accounting for small savings) the better off. In higher education they go mostly toin 1999-2000 (see Fig. 8.2). The states' deficit in 1998-9 the better off (see Kurien 1999). In fertilizer, they maywas the highest in India's fiscal history. The magnitude of now go largely to the firm, not the farms (see Gulatistates'deficit indicates that states can no longer be neglected 1998). Subsidies in rural power may go to better offfrom the standpoint of macroeconomic instability. Much farmers who can then sell the water drawn by use ofof the state governments' recent and projected deterio- free power to others. Moreover, part of the subsidiesration reflects the cascading down of the Central are in the form of/ascribed to 'non-technical losses' ingovernment's excessive 1997-8 wage increase-the power and water or to those who are able to definewidening of states' deficit is largely due to the deterio- themselves as part of the subsidized group. Finally, theration in the revenue deficit. However, the wage subsidy is also partly paid through higher charges toincrease has only intensified an underlying problem. other producers, who in turn factor it into the costsBut for the one-time transfer of Voluntary Disclosure of the products they sell. Hence the incidence of theIncome Scheme (VDIS) revenues in 1997-8, the states' subsidies is in fact almost impossible to estimate (seedeficit would have been higher than in 1990-1. also Box 5.2).
States' fiscal crisis/lack of adjustment reflectstheir continuation of large, inefficiency-inducing States have also not Improved their Tax Basesubsidies, implicit and explicit, in power, water, trans-port, and secondary and tertiary education (see also Although state tax revenues have grown about as fastport, , , , ,, .as income (more buoyant than central revenues), states'Chapters 2 and 3). User charges are low, collections areweak, and costs are inflated by overstaffing and inef- approach to taxes induces inefficiency, andficiencies in the state public enterprises. In power, their revenue base is limited, in part because of theiraverage revenues are only about 80 per cent of costs unwl lngness to tax agricultural icomes, in part(Ahluwalia 1998), reflecting low collections'8 and inef- due to the difficulties of setting up a value addedficiency-inducing subsidies to agriculture and small tax that would be harmonized with the centralccir,5.umers. For example, in UP the burden of the government's MODVAT (see Box 3.2). The states have
power subsidie can be seen in anetflowoffunds to thus fallen back on sales taxes and various fees thatpower subsidies can be seen in a net flOW of funds tothe Uttar Pradesh State Electricity Board (UPSEB) of cascade into hlgher production costs and weaken India's5.6 per cent of UP's revenues in 1996-7, and loans- international competitiveness, compared to a VATloans that are in perpetuity and on which no interest system.is being paid-to the UPSEB equivalent to 42 per cent Perhaps most importantly, states' fiscal crisisof UP's debt. Regarding the other sectors, the states severely weakens the fight against poverty, by limitinghave also allowed irrigation charges to decline sharply their social and infrastructure spending. States arein real terms. States' typical charges for water are far responsible for over 9 per cent of economic infrastruc-less than the delivery cost. Secondary and university ture and social service spending under India's federaleducation charges are far less than costs (NIPFP 1997, 19 India's federal Constitution divides the country's taxingGOI 1997b). powers. Customs are a central revenue, income and indirect
Subsidies encourage inefficiency. For example, taxes were ceded to the Centre when the country was formed,with part of the proceeds reverting to states as determined by
they contribute to overexploitation of ground water, the Finance Commissions every five years. States can levy (state-
1 Low collections reflect power theft, distribution losses, and level) excise and sales taxes and have the sole constitutional rightincreasing payment delays (see fn. 9 in Chapter 5). to tax agnrculture.

Growth, Macroeconomic Development, and Policies * 115
system. They have slowed this spending, relative to Non-financial Central Public Enterprises (CPEs)GDP, as their subsidies have risen, transfers and loansfrom the centre have declined, and interest costs of Their performance has improved since the early 1990s,their rising deficits have ballooned (see Annex Table mainly reflecting developments in petroleum and8.8 and Table 8.5) in order to meet what is a relatively telecoms; other enterprises have been allowed tohard budget constraint.2 0 High cost small savings, languish. The CPEs combined deficit has declined towhich are now nearly twice the annual market borrow- about 1.3 per cent of GDP in 1998-9 and a projecteding for states, represent one way around the budget 1.5 per cent in 1999-2000, from about 3.0 per cent inconstraint; another is state guarantees, which have 1990-1 (see Table 8.6).mounted and which RBI has now proposed be limited This decline reflects two factors: (a) the steady fall(see Chapter 3, Box 3.1 and Box 3.3) of public enterprise investment as a percentage of
GDP from about 4.8 per cent in 1990-1 to about 3.4TABLE 8.5 per cent currently and (b) the growing importance
Change in Social and Economic Infrastructure and of petroleum and telecoms public enterprises thatInterest Spending 1991-2 and 1997-8 now account for 45 per cent of (Plan) investment by
(change in percentage points of GSDP) the CPEs and an even larger 68 per cent share in
States Sociala Economich Interest internal resource generation by CPEs (see Annex TablePayment 8.9). These two groups of enterprises dominate the
Andhra Pradesh -(1.4) ° ° (0.6) CPEs and, correspondingly, the CPEs are now largelyBihar 1 6c -(.0 1) (1. 1) financed with internally generated funds and go to theGujarat 41.0) -(1.2) (0.1) market for the remainder.' The declining investmentHaryana -(0.1) .(0.5) (0.2) of the other CPEs accounts for most of the declineKarnataka 0.5 -(1.5) (0.3) in CPEs' investment, and even that is increasinglyKerala 0.7 0.3 (0.5) financed through the market in one way or another-Maharashtra -(3.6) -(0.6) (0.6) central government loans to public enterprises (andMadhya Pradesh 0.8 0.1 (0.0) support for losses) have dropped sharply as a percent-Orissa 0.2 -(0.7) (0.7) age of GDP.Punjab -(0.3) -(0.9) (2.3) The CPEs had long been sheltered from competitionRajasthan 0.5 -(1.8) (1.0) by reservation of products for them and by protectionTamil Nadu -(0.6) (0.6) (0.5) from international competition. The removal of theUttar Pradesh 0.5 -(0.7) (1.0) reservation and the cuts in protection, along withWest Bengal 0.0 1.0 (0.7) increased autonomy and pressures for performance14 States Average -(0.1) -(0.4) (0.7) have led to increased efficiency in some sectors. Pricing
a Refers to total expenditure on health and education. has come closer to covering costs, notably with theb Refers to sum of capital outlay and (gross) loans to power, movements toward international prices in the petro-
irrigation, and transport. leum sector-fertilizer represents the major remainingThe positive increase reflects a strong rise in current spending CPE subsidy.22 Nonetheless, the developments in thein education in the revised estimates of 1997-8. petroleum and telecoms PSEs described earlier partly
Note: 1997-8 is revised estimate. Brackets indicate deterioration. reflect their residual regulatory advantage. In telecoms,Source: RBI Bulletin various issues. cuts in costs and more realistic pricing have increased
access to funding and allowed a substantial improve-20 States' borrowings are largely limited by the centre's loans ment in service (see the discussion in Chapter 4 of the
to them and the Centre's allocation of a share of the market survey of businessmen; and Ahluwalia 1998borrowings that qualify for the SLR. WMAs from the RBI must suvyofg bsessetn an cahiuali 1998).be cleared in ten days, although some states, notably Bihar, have g p yoften exceeded this limit. The borrowing constraint is judicious; has been pushed up to about 8 per cent before taxesin some Latin American countries, state deficits financed through (GOI, Public Enterprises Survey, various issues), it is 3-5access to the central bank were a major factor in inflation. per cent below the interest paid on government bonds,Although market discipline might provide an incentive for implying a massive implicit economic loss, includingbetter state performance, it would be difficult to exert in the a loss of taxes, to the country on the capital investedIndian context because of the central government's unwilling-ness to allow a state to go bankrupt, and the large role that public 21 These figures neglect the oil pool account discussed earlier.financial institutions would play in the purchase of any state 22 See the discussion in Gulati (1998) for an analysis of thebonds. impact of the subsidy and its incidence.

116 * India: Reducing Poverty, Accelerating Development
TABLE 8.6Finances of CPEs 1990-2000
(in billions of rupees)
1990-1 1991-2 1992-3 1993-4 1994-5 1995-6 1996-7 1997-8 1998-9 1999-2000(RE) (BE)
A. Net internal resources 107.2 120.1 161.3 188.5 241.5 290.8 252.5 279.7 335.1 386.1B. Plan expenditure 280.5 294.2 366.6 438.9 485.9 521.8 542.5 549.6 578.0 681.6C. Overall balance (B-A) 173.3 174.1 205.3 250.4 244.3 231.0 290.0 269.9 242.8 295.4Memo: % GDPmpCPE deficit 3.0 2.6 2.7 2.9 2.4 1.9 2.1 1.7 1.3 1.5CPE investment 4.8 4.4 4.8 5.0 4.7 4.3 3.8 3.5 3.2 3.4
Source: Budget Documents.
in public enterprises over the years. Moreover, the high Experience worldwide suggests that a shift from publicreturns in petroleum and telecoms boost the average to private management will raise efficiency and returnsrate of return of CPEs substantially; manufacturing on capital while reducing the burden on the govern-plants and nearly half of all public enterprises are ment by reducing transfers, debt relief, and capitalunprofitable (GOI, Public Enterprises Survey, various injections to the companies, and increasing their taxissues). Of course, public enterprises' low profitability payments (Galal et al. 1994, Megginson et al. 1995,has been attributed to their attempt to carry out non- World Bank 1995b). This holds true when domesticeconomic objectives, often at the behest of govern- and international competition exists to protect con-ment. However, the efficiency with which these social sumers and stimulate innovation, and it is also true inactivities are carried out, the contribution to public many sectors once thought to be natural monopolies,welfare, and their impact on firms' returns are neither such as power generation and distribution.transparent nor well monitored. And public enter- Both the 1998 and 1999 Budget speeches declare theprises, staffed by de facto civil servants cannot easily government's intention to move ahead on privatizationdownsize or close down when demand for their pro- of CPEs. However, progress has been slow (see Annexduction falls. 8.3), and continues to be largely motivated by capital
The need to reduce the burden of public enterprises revenue considerations, rather than reducing costs andand the possibility of realizing capital revenues from improving quality of goods and services, reflectingtheir sale have been recognized by all recent govern- political difficulties in full disinvestment. In the run-upments. Since 1991, government has been divesting to the 1999-2000 Budget, the government raisedminority stakes in CPEs through the stock market (see disinvestment revenues by encouraging the public oilAnnex Table 8.10), but that process appears to have companies to buy some of each others' capital, anslowed. The Disinvestment Commission, which was approach that simply transferred funds from the enter-set up in 1996 and whose term has now lapsed, has prises to the centre.submitted twelve reports to the government. But, as its Several key issues on privatization face the govern-reports have pointed out, most of its recommendations ment. One, the weak enterprises, which can expecthave yet to be implemented-in the first eleven reports, little loan/equity support from either the governmentstrategic sales or trade sales or partial equity sales or or the market, are unable to invest enough, and are thusclosure have been recommended in 41 cases, but only getting weaker, and hence more difficult to sell off,13 of these recommendations have even been partially over time. Delays would mean lower revenues toimplemented (see Annex 8.3 for an analysis of India's government, and more difficult restructuring decisionsprogress in privatization). by the new owners. Two, privatization issues are even
The benefits from the sales are thus far largely more serious for state-level public enterprises, sincelimited to capital revenues and improvements in trans- state governments are even less equipped to continueparency in making companies ready for disinvestment. supporting loss-making units (some states, such asGenerally speaking, the new shareholders are passive Andhra Pradesh, Gujarat, and Orissa in its powerinvestors and are not represented on the companies' distribution, have made progress in privatization,boards. Moreover, the arrangements for dealing with see Chapter 3). Three, it is unlikely that public enter-possible problems in these companies, such as the prise governance can improve much while governmenthandling of new injections of funds, are unclear. remains a majority owner-the 'Navratna' experiments

Growth, Macroeconomic Development, andPolicies * 117
have not worked (see Box 4.2). Indeed, the experience Europe considers a limit for macroeconomic stability.of firms such as Maruti (49.8 per cent government, 50.2 The ratio of total debt servicing (interest plus principalper cent Suzuki, 0.2 per cent employees)23 might make repayments) to current revenues is estimated to havethe private sector hesitant to invest in firms where risen from 116 per cent in 1997-8 to 123 per cent ingovernment has a more than 26 per cent stake (which 1998-9, as new debt on harder terms has replaced oldis enough to block key resolutions), especially when debt that was contracted on softer terms. Moreoverthe dominant financial sector institutions, which will governments are extending increasing guarantees, withalso hold shares, are government owned. state guarantees up 23 per cent in the last two years (see
RBI 1999b and Chapter 3).
Reducing Public Sector Deficit to Reduce the Investors and rating agencies, since the 1980s debteucsng of Macroeconomic Instabilir and the crisis, have a concern that governments might resort
R isk out of Macroeconomic Investait and the to inflation or unsustainableforeign borrowing to financeCrowding out of Private Investment, and to high fiscal deficits and cut the burden of large domestic
Improve the Sustainability of the Growth Rate fixed interest debt, for one reason or another. India has
The large public sector deficit raises three concerns, one of the highest fiscal deficits in the world. In 1991,One is the so-called 'debt trap-high real interest rates it suffered a run on its meagre international reserves,associated with large public borrowings will generate in the context of a high deficit and despite its closeda cumulative rise in the ratio of public debt to GDP- capital account. More recently, Brazil and Pakistan,a risk pointed out by the RBI in various Annual two of the three major countries with fiscal deficitsReports, and most recently in its 1998-9 Report on as high as India's (World Bank 1998a), suffered attacksCurrency and Finance ('the present level of government on their fixed exchange rate. As noted above, Indiasector debt is not consistent with the medium-term has traditionally maintained macro-stability, whichsustainability of fiscal policies [p. v-13]). Prior to the along with its large international reserves and limitsfinancial reforms that began in the early 1990s, increas- on capital mobility, decreases risks of such attacksing financial repression limited the interest cost of the Nonetheless investors' concerns will tend to increase
ingfinncal eprsson imtedtheineret cstof he the international risk premia and lower the bondgrowing public debt by directing increasing credit tothe public sector at low cost, crowding-out credit to the ratings that India faces," keeping real interest costs up,private sector and taxing financial intermediation. even if macro-stability is maintained.With financial liberalization, the true interest cost of~ India's large fiscal deficits and public debt stockWithehih defin cial liberamclzat hetr- e interest costs of t also crowd out private sector investment, by raisingthe high deficit became clearer-the interest costs of the yneetrtsaoe htte tews gol bncentral and state governments have risen by over 1 interest rates above what they otherwise would be andper cent of GDP since 1990-1. Nonetheless, up to reducingthe amount of funds available forthe private1996-7, there was a fall in government's debt to GDP sector." A simple regression (see Fig. 8.4) suggests thatratio, belying the debt trap worries. This reflected thelower average deficit since 1991-2 (even taking into 24 Moody's lowered India's rating from Baa3 (investmentaccount the higher interest payments), and the fall in grade) to Ba2 (speculative) in June 1998, following the Budgetthe external debt ratio, because declining external and the imposition of sanctions on multilateral lending after
India and Pakistan's nuclear explosions. Standard and Poor'sborrowing and favourable exchange rate movements lowered its rating from BB+ (speculative) to BB (speculative) inmore than offset the depreciation of the rupee. How- October 1998 (GOI 1999e, p. 90).
ever, the ratio of central government debt (including 25 As noted above, financial repression, such as prevailed insmall savings) to GDP now appears to be rising; it has India in the 1980s, crowds out private sector borrowing by fiat,already risen from 58 per cent in 1996-7 to about 60 and pushes up the interest rate to the marginal private borrower,per cent of GDP in 1997-8 and 1998-9 (see Statistical without raising the rates that the public sector pays for its funds.
Appendix Table 4.12), which the Maastricht Treaty in Moreovertheincreasinglyhighratesthatprivateborrowershaveto pay, in order to ration the increasingly limited amount ofcredit they receive, stimulate demands for protection from high
23 There have been differences in the past between the interest rates through directed credit, reducing the productivitygovernment and Suzuki Motor Company over Maruti's debt- of credit allocation to the private sector and, often, havingequity structure, the appointment of senior management, and unclear distributional effects. In addition to this crowding-outthe pace of expansion. Maruti is by far India's largest car in financial markets, public sector production, financed bymanufacturer, but its pre-eminence in the Indian market is borrowing, supplies outputs that, in many cases, could bethreatened by new and agile entrants from the private sector, provided more effectively by the private sector, thus reflectingboth domestic and multinational. a crowding out in goods and services markets.

118 * India: Reducing Poverty, Accelerating Development
10
1995-6
1997-8
8-
\ 1996-7
7 \GCF 18.8 - 1.7 DEF R2= 0.74
1994-5 *t = 5.28
6 1992-31993-4
1991-2 1986-75
1989-904 1988-9 t
1987-8 1990-1
3~~~~~~~~~~~3 i l _ l
6 7 8 9 10 11Consolidated deficit
FIG. 8.4: Gross Capital Formation by Private Corporate Sector and Consolidated Deficit ofGeneral Government (including OCC, excluding disinvestment)
the reduction in the consolidated public sector deficit which the Finance Ministry estimated at 14.4 per centin the early 1990s was accompanied by an at least one- of GDP in 1994-5. Some progress has been made,for-one increase in corporate investment (see also notably in petroleum products (a central subject), andWorld Bank 1998a, pp. 8 and 9; and RBI 1997, pp. 76 to a much lesser extent in power, irrigation, andand 86), which was the engine of the three high growth fertilizer (centre and states). However, much moreyears. Of course, these empirical results not only effort is needed, particularly in the states since mostreflect the lower central government deficit after 1992-3, of the explicit and even more of the implicit subsidieswhich reduced the ratio of public debt to GDP, but are in their domain. Without action in states to reducealso the liberalization and the large inflow of foreign subsidies (their deficit now matches that of thefunds-FlIs, GDRs, and liberalized offshore corporate centre, see p. 112), the general government deficit willborrowing in 1994-5 to 1996-7. In 1997-8, however, remain a key problem area (see later discussion). Asthe rising fiscal deficit has pushed up the debt to GDP noted, these subsidies and cross-subsidies have hadratio, while the escape valve of external flows has negative effects on efficiency, unclear distributionalbecome narrower (see Annex Table 8.11) and is likely implications, and have hindered private provision ofto remain so given external circumstances. In this services (see earlier discussion in Box 5.2; and Ahluwaliaenvironment, even a constant fiscal deficit (as a percent- 1998).age of GDP) is likely to put more upward pressures on In addition, the deficit could be lowered by furtherreal interest rates and 'crowd out' more private invest- efforts at broadening the tax base, improving tax admin-ment than in the past. istration, civil service reform (see Chapter 3), and greater
reliance on the private sector, including privatizationthat would enhance the productivity of investment,
Reducing the Deficit by Cutting Implicit and reduce the need for public transfers and guarantees toExplicit Subsidies fund investments, and generate higher tax revenues.
Gains could also be made through better expenditureMuch of the reduction in the deficit could be achieved management, which links spending to well-definedby reducing the large implicit and explicit subsidies, objectives and results (see Chapter 3).

Growth, Macroeconomic Development, and Policies * 119
Realigning Government and Creating Conditions to local (panchayat) governments to decentralize services
for Reduzcing State and Central Deficits (see Chapter 3).
India's sustained development would be furthered by Much more analysis is needed on the 'how' ofa reduction in the general government deficit similar realigning government. In this context, a study of the
to 1992-3, combined with government realignment posszble paths to fiscal adjustment, taking into account theto 1923 cobie wihgvrnetralgmn linkages betweenfiscal deficits, growth, and poverty reduc-that relies more on the private sector and focuses on . bgbasic human development services, infrastructure, and tion, and drawing on international experience, would be
maintenance of competition and legal and regulatory useful.
frameworks to make the market work better. In notdoing so as part of the reforms over the 1990s, India Balance of Paymentshas lost an opportunity to grow faster (since private n m t
. . ~~~~India managed to limit the contagion from the Eastsector investment is more efficient), reduce poverty Asian crisis, as did many countries. In India's case,
faster, and make higher growth more sustainable, much of the insulation came from the limited short-
Centre and State Reforms term external debt of its banks and corporations, andits limited capital account convertibility; portfolio
Some states, notably Andhra Pradesh, Haryana, and investment also declined much less rapidly in India
Orissa, are initiating reforms with more realistic user than in East Asia, and has rebounded in 1999. More-
charges, turning over irrigation to water-user groups, over India's banks are less exposed to losses than East
and privatizing of power distribution at various stages. Asian banks, because of their large holdings of govern-
However, others, such as Punjab and Maharashtra, are ment debt (see Chapter 7). The pressures on India's
unfortunately making unsustainable cuts in user charges exchange rate after the East Asian crisis were adeptly
and taxes in a bid for political popularity. The Centre managed by the RBI, but the rupee has become
could play a catalytic role in improving the policy somewhat appreciated with the recent decline of the
environment in states, by providing leadership in areas Euro, as well as relative to East Asian competitors in
like civil service and public sector reform and improv- third markets (see fn. 8 and Annex Table 6.7).
ing intergovernmental fiscal relations. The Centre is India's vulnerability to balance-of-payments prob-
already doing some of this and the eleventh Finance lems, thus, seems less as compared to East Asian
Commission has been given a broader-than-usual countries, or its neighbour Pakistan. Although it did
mandate to 'review the state of the Finances of the suffer a balance-of-payments crisis in 1991, when the
Union and the states, and suggest ways and means capital account was even more closed than today, it has
to restore budgetary balance and macroeconomic much less short-term exposure than East Asia did, and
stability'. This is a welcome move away from the past very large external reserves. Nonetheless, there are
gap-filling approach, which had discouraged own tax some structural concerns in the balance of payments,
collection efforts by states, to a more normative notably the dependence on remittances, the large excess
approach to tax sharing (an approach recommended by of imports over exports that will tend to increase
the ninth Finance Commission) that would reduce the current account deficit once imports resume their
disincentivesfor improved state tax collections inherent in growth, and, above all, the slowdown in exports.
gap-filling exercises. The central government has signed Generally speaking, the external environment facing
MoUs with nine states so far, whereby extraordinary India has worsened over the last two years, with the
short-term advances have been made by the central slowing of international trade and capital flows, as well
government in return for fiscal reform by the states. as the sanctions following India's nuclear tests (for a
The multiple centrally sponsored schemes could discussion of the prospects in 1999-2000, see Chapter
be consolidated to reduce bureaucracy, and be at least 9). The bright spots have been falling oil prices, until
partly converted into block grants, and the distinction recently, and rising demand for software exports. At
between plan and non-plan expenditures reduced, the same time, trade reforms, which increased India's
as has often been recommended. Also the Finance gains from international trade and investment (see
Minister's recent proposal to move towards a full VAT Annex 8.1), have slowed and in some cases even been
system would permit states to 'piggy back' on this reversed (see Chapter 6). Despite these problems,
fairly efficient tax and reduce their distortionary sales current account deficit fell to about 1.0 per cent of
taxes. Another major issue which will require substantial GDP in 1998-9, from 1.4 per cent in 1997-8, because
analysis is states'devolution of revenue and taxing powers of the fall in oil prices and the drop in non-customs

120 * India: Reducing Poverty, Accelerating Development
imports (see Annex Table 8.4), while reserves increased year maturity, 7.75 per cent in US dollars, in unitsby $ 3.9 billion, buoyed by the $ 4.2 billion proceeds of $ 1000, with the guarantee of the government)of the RIBs (see Table 8.7). to non-resident indians, which boosted reserves.
Merchandise export growth was negative (-3.9 per cent) Although the sale was intended not only to offsetin 1998-9 (although it turned positive since January the sanctions but also to generate resources for infra-1999). This continues the slowdown in export growth structure, the cash reserve and statutory liquiditythat began in 1996-7. Partly, this decline reflects the requirements absorbed about 35 per cent of it, andslow growth of world trade. However, India has lost banks temporarily invested much of the remainder inmarket share for the second consecutive year (see government debt.27
Annex Table 6.4). If India had maintained its 1996 share Other types of capital inflows slowed, continuingof world exports (0.63 per cent in April-March 1996-7), the slowdown that began in 1997-8 (in Table 8.7, RIBits exports would have been higher by 1.3 per cent proceeds are included in long-term borrowing). The($ 0.43 billion). slowdown reflected the tightening international capital
Merchandise imports declined 7.1 per cent in 1998-9, market facing developing countries, the sanctions oncompared with a 4.6 per cent growth in 1997-8. This India, the completion of investors' portfolio adjust-decline reflects (a) falling oil prices for a second ment to the partial liberalization of India's capitalconsecutive year-oil imports fell 21.2 per cent, and if account, and investors' expectations about India's pros-oil prices had not fallen, the oil import bill would have pects. Of particular concern is the decline in FDI tobeen similar to 1997-8; and (b) a massive decline in about $ 2.5 billion, down from $ 3.6 billion in 1997-8,non-customs imports (which include ships, aircraft, oil although this figure is still far higher than in the 1980srigs, and defence equipment), which fell by about $ 4 and early 1990s.billion or 41.4 per cent. Gold and silver imports, which Portfolio capital outflows occurred in May and Junewere liberalized in October 1997, grew by about $ 1.7 1998 as FlIs withdrew $ 413 million following thebillion26 or 54.6 per cent (see Annex Table 8.4). Finally sanctions, the Budget, and the downgrading bynon-oil, non-gold customs importsroseonly 1.2 per cent Moody's.28 Smaller portfolio outflows occurred for(see Annex Table 8.4), reflecting slow industrial growth, most of the rest of 1998-surprisingly, there was littlewith much of the increase coming from imports related additional outflow after either the default on Russianto projects that were moving to completion. bonds or Brazil's devaluation. However, portfolio in-
Computer service exports have been a bright spot flows turnedpositive in calendar 1999, and were as highafter 1997-8. Software exports continued to grow as $ 511 million in March 1999 alone. For 1998-9 asrapidly, although that partly reflects demands from the a whole, there was a marginal outflow of $ 68 millionY2K problem and Euro conversion-sustained growth dollars. Aid-related flows slowed as a result of thedepends on improved telecommunications and access sanctions. External commercial borrowings slowed into low cost hardware, as well as continued freedom gross terms over the year and dropped to almost zerofrom red tape. Remittances declined slightly, to about in net terms, with some firms taking advantage of the$ 10.3 billion. discount on Indian debt abroad to buy back their
Current account deficit declined to 1.0 per cent of bonds; other firms allowed their external commercialGDP ($ 4.3 billion), reflecting the trade deficit's decline borrowing authorizations to lapse because of their(to 3.0 per cent of GDP) and the continued strong potentially high cost.service exports. The government responded agilely to the pressures
7Te capital account, in 1998-9, ended up with a on the currency over the year, by allowing thesurplus much larger than current account deficit exchange rate to depreciate, selling some reservesdespite the sanctions and worldwide loss of confidence to limit the depreciation, and tightening monetaryin emerging markets. In August 1998, India mobilized$ 4.2 billion through the retail sale of RIBs (five 27 The foreign currency interest rate on the bond wasrelatively low, especially given the turmoil in world capital
26 After liberalization in October 1997, gold and silver markets at the time of sale. However, on proceeds that were usedimports were recorded as part of customs imports, as opposed to buy government debt, the government effectively paid theto earlier, when they were imported under the baggage route. rupee rate for foreign currency, because of its foreign exchangeThe Ministry of Finance's Economic Survey 1998-9 estimates guarantee.that about 90 per cent of gold was imported under the customs 28 Standard & Poor's and the Japanese Bond Researchroute in April-October 1998, as opposed to only 15 per cent in Institute also downgraded India's long-term foreign currencyApril-October 1997. rating in October 1998.

TABLE 8.7Balance of Payments 1999-2001
(UJS $ billion)
Actuals Projected
1990-1 1991-2 1992-3 1993-4 1994-5 1995-6 1996-7 1997-8 1998-9 1999-2000 2000-1 2001-2
Total exports of GNFS 23.0 23.3 23.6 27.9 33.0 39.7 41.6 45.1 47.5 50.7 5.3 60.0Merchandise (FOB) 18.5 18.3 18.9 22.7 26.9 32.3 34.1 35.7 34.3 37.0 40.8 45.0Non-factor services 4.6 5.0 4.7 5.3 6.1 7.3 7.5 9.4 13.2 13.7 14.5 15.0
Total imports of GNFS 31.5 24.9 27.9 31.5 41.4 51.2 55.7 59.3 58.6 64.9 71.5 79.0Merchandise (CIF) 27.9 21.1 24.3 26.7 35.9 43.7 48.9 51.2 47.5 53.4 59.0 65.8Oil imports 6.0 5.4 6.1 5.8 5.9 7.5 10.0 8.2 6.4 10.8 10.0 10.1Non-oil imports 21.9 15.7 18.2 21.0 30.0 36.1 38.9 43.0 41.1 42.6 49.0 55.7Non-factor services 3.6 3.8 3.6 4.7 5.5 7.5 6.7 8.1 11.0 11.5 12.5 13.2
Resource balance -8.5 -1.6 -4.3 -3.5 -8.4 -11.6 -14.1 -14.2 -11.1 -14.1 -16.2 -18.9
Net factor income -3.8 -3.8 -3.4 -3.3 -3.4 -3.2 -3.3 -3.5 -3.5 -3.1 -3.1 -3.4Factor receipts 0.4 0.2 0.4 0.4 0.9 1.4 1.1 1.6 1.9 2.2 2.3 2.4Factor payments 4.1 4.1 3.8 3.7 4.3 4.6 4.4 5.1 5.5 5.2 5.5 5.8Interest (scheduled)a 4.0 3.5 3.5 3.5 4.1 4.3 4.0 4.5 4.8 4.5 4.5 4.6
of which interest payments on NRI 1.3 1.0 0.9 0.9 1.0 1.2 1.6 1.8 1.7 1.8 1.9 2.0Other factor paymentsb 0.2 0.5 0.3 0.1 0.2 0.3 0.4 0.6 0.7 0.8 0.9 1.2
Net private current transfers 2.1 3.8 3.9 5.3 8.1 8.5 12.4 11.8 10.3 10.6 11.0 11.9Current receipts 2.1 3.8 3.9 5.3 8.1 8.5 12.4 11.9 10.3 10.6 11.1 12.0
of which workers remitances 1.7 3.5 3.4 4.4 7.5 7.2 11.7 11.7 9.4 9.7 10.0 10.9Current payments 0.0 0.0 0.0 0.0 0.0 0.0 0.1 0.0 0.1 0.1 0.1 0.1
Current account balance -10.1 -1.6 -3.9 -1.5 -3.8 -6.3 -5.0 -5.9 -4.3 -6.6 -8.4 -10.4
Official capital grants 0.5 0.5 0.4 0.4 0.4 0.3 0.4 0.4 0.3 0.3 0.3 0.3
Foreign investments 0.1 0.1 0.6 4.2 5.1 4.9 6.1 5.4 2.4 5.5 6.5 6.8Direct foreign investments 0.1 0.1 0.3 0.6 1.3 2.1 2.8 3.6 2.5 2.5 3.5 3.8Portfolio investments 0.0 0.0 0.2 3.6 3.8 2.7 3.3 1.8 -0.1 3.0 3.0 3.0
Net long-term borrowing 4.8 3.5 2.6 2.7 1.7 2.4 6.6 5.3 6.1 0.5 0.8 4.8Disbursements (net of NRI)' 7.6 7.5 4.5 6.4 7.3 7.2 10.6 10.3 10.0 8.2 7.5 9.8Repayments (scheduled)ac 4.4 4.2 3.8 4.9 5.8 5.9 7.4 6.1 5.6 9.2 8.2 6.5Other long-term inflows (net)a` 1.5 0.3 2.0 1.2 0.2 1.1 3.4 1.1 1.7 1.5 1.5 1.5
Other capital flows 1.8 0.1 0.1 2.9 3.3 -3.4 -1.9 -0.9 -0.2 2.5 1.6 -1.3Net short-term capital 1.1 -0.5 -1.1 -0.8 0.4 0.0 0.8 -0.1 -2.7 n.a. n.a. n.a.Errors and ommissions 1.9 1.9 2.0 4.7 3.9 -2.5 -2.0 -0.1 3.4 n.a. n.a. n.a.Capital flows n.e.i.d -1.2 -1.2 -0.9 -1.1 -1.0 -1.0 -0.7 -0.8 -0.8 -0.7 -0.6 -0.6
(Contd.)121

(US $ billion)
Actuals Projected
1990-1 1991-2 1992-3 1993-4 1994-5 1995-6 1996-7 1997-8 1998-9 1999-2000 2000-1 2001-2
Changes in net international reservese 3.0 -2.6 0.3 -8.5 -6.8 2.0 -6.2 -4.2 -4.3 -2.2 -0.8 -0.2IMF (net) 1.2 0.8 1.3 0.2 -1.1 -1.7 -1.0 -0.6 -0.4 -0.3 0.0 0.0Change in gross reserves 1.8 -3.4 -1.0 -8.7 -5.7 3.7 -5.2 -3.6 -3.9 -2.0 -0.8 -0.2
Memorandum items:
Current account balance/GDP -3.1 -0.6 -1.5 -0.5 -1.1 -1.7 -1.3 -1.4 -1.0 -1.4 -1.7 -1.9Gross foreign exchange reservesf 2.3 5.7 6.7 15.5 21.2 17.4 22.7 26.3 30.2 32.2 33.0 33.2
in months of imports (goods) 1.0 3.3 3.3 6.9 7.1 4.8 5.6 6.2 7.6 7.2 6.7 6.1External debt (/o of GDP) 25.9 31.4 34.2 33.8 31.0 25.9 23.5 22.4 23.0 22.0 21.0 20.2Debt service
(%/ of total current receipts) 32.1 28.8 27.6 24.8 26.1 27.3 21.7 21.2 17.3 18.3 15.4 14.9
a World Bank Debt Reporting System (DRS). Includes RIBs for 1998-9 ($ 4.2 billion).b Includes interest on military debt to the FSU, returns on foreign investments and discrepancies between DRS and RBI data.c Net flows in NRI deposit schemes, except the non-repatriable NR(NR)D Scheme.d Servicing of the Russia debt.e (-) = indicates increase in assets.f Includes foreign currency assets, SDRs, and IMF reserves.Source: Government of India; RBI; Ministry of Commerce; World Bank staff estimates.
122

Growth, Macroeconomic Development, and Policies * 123
policy.2 9 Then, in March 1999, the Budget's cuts in continued to remain a concern, but portfolio inflows,
taxes on the capital market and moves toward resolving at $ 1.35 billion, recorded a significant turnaround.
the Unit Trust's problems brought some capital in- Foreign exchange reserves (including gold, Fund re-
flows. It appears that banks also brought back substan- serves, and SDRs) rose to $ 34.5 billion by October.tial funds at the end of March.
Gross foreign exchange reserves (comprising foreign Annex 8.1currency assets, SDRs, and reserve position in the Fund)rose by $ 3.9 billion during 1998-9 to reach $ 30.2 ANALYSING INDIA'S GDP GROWTH AND
billion (nearly 7.6 months of imports) at end-March THE ROLE OF REFORM
1999; reserves reached $ 33.2 billion including gold. In One simple way to analyse India's recent GDP growth
terms of 'volatility cover', reserves were about 169 is Lucas' supply-side model (Lucas). This model of growth
per cent of potential short- term claims-recorded short- explains the current level of GDP by a trend growth rateterm debt, trade credit, and the book value of portfolio and allows for any tendency for the economy to returninvestment" (which, when translated into dollars, is to the trend rate of growth by also including a laggedworth far less than the book value of the investments, term. The statistical estimation for the period 1979-80 toowing to depreciation of the rupee; another shock 1998-91 yields:absorber is the likely decline in the stock market if Fls Log (GDP(T))l=3.7+0.581 Log (GDP(-l))-+ 0.c234 (imeTrend)
choose to liquidate their investments together). (t-statistic) (1.99) (2.7) (1.99)After peaking in 1992-3 at 34.2 per cent, India's
external debt to GDP ratio has fallen steadily to 22.4 This yields a trend growth rate of 5.75 per cent per annumper cent in 1997-8, and has increased marginally to 23 for the period 1979-80 to 1998-9
i 1998_9.32 T d s r After the 1990-1 crisis, India experienced a period of
larly declined. Careful monitoring by the government rapid growth. In the Lucas Model, growth would be higherlan changes in. hef u ond orlingb eom factrs hae after a recession, given the tendency for the economy tomeant that the soterm debth dcl f susan return to trend, so the interesting question is whether themeant that the short-term debt has declined substan- got a 'hrta ol oefo nyanratially, from over $ 8.5 billion (10 per cent of external ro hu ashgherthan would come from only anormal
. . . ~~~~~~~~~~rebound, andl whether there was a fall-back from thesedebt) in 1991 to $ 4.3 billion (4.4 per cent) in March years of growth to the old growth path. To investigate this1999. The concessional element in debt is also declin- question, a second equation is estimated using an addi-ing, and was 37.9 per cent at the end of March 1999 tional time trend for the years 1993-4 to 1996--7. This(see GOI 1999f for a fuller discussion). additional time trend allows the GDP growth rate to
exceed the basic growth path for those years and thenDevelopments In April-October 1999 allows the growth path to remain above the basic growth
Merchandise export growth turned positive in April- path, paralleling it, in 1997-8 and 1998-9:3
October 1999 (10.0 per cent dollar value increase Log(GDP(T))=5.8+0.35 Log (GDP(T-1))+0.034 (Time Trend)over the corresponding period). Merchandise import (t-statistic) ( 1.66) (3.04)growth over the same period also turned positive (7.5 + 0.012 (Trend 1993-4 to 1996-7)per cent) stemming mainly from rising international (2.47)oil prices leading to a greater than 50 per cent increasein oil imports; non-oil imports rose only marginally The GDP series with 1993-4 base is used; to estimate GDP
(0.3 per cent).3 3 Declining FDI inflows (to $ 1.09 bil- in the years before 1993-4, the old GDP figures are multiplied(0.3 ~. pe cet) by the ratio of the new to old GDP in 1993-4.lion from $ 1.43 billion in April-September 1998) by 2Th o h e oodGPi934The equation yields a logarithmic trend growth = (0.0234/
29 See fn. 8 in this chapter. (1-0.58))= 0.05587, equivalent to 5.75 per cent per annum.30 Total portfolio investment until March 1999 was $ 8.7 3 The additional time trend takes the value 1, 2, 3, and 4,
billion (RBI), not including $ 6.8 billion worth of GDRs raised respectively, for the four years 1993-4 to 1996-7; 0 for all yearsby Indian firms in foreign stock markets. GDR investment prior to 1993-4; and 4, 4 for 1997-8 and 1998-9. The year 1993-4would impact India's reserves only if it was converted into the is included in the 'reform' years to avoid biasing the resultsunderlying Indian stock, and then repatriated (in dollars). toward the impact of reform, as it is known that growth was
31 Recent data show that portfolio investment increased to high in 1994-5 to 1996-7. The reason for the use of the same$ 16.8 billion in September 1999. value for the dummy in 1996-7, 1997-8, and 1998-9 is that
32 Data are from the World Bank's Debt Reporting System, reforms slowed, and so the additional impact on the trendand the numbers are slightly different from those of the growth disappeared; hence, the new growth path parallels theGovernment of India. basic growth path, but at a higher level, that is a higher constant
33 DGCI&S data. which is modelled by a larger, constant 'time dummy'.
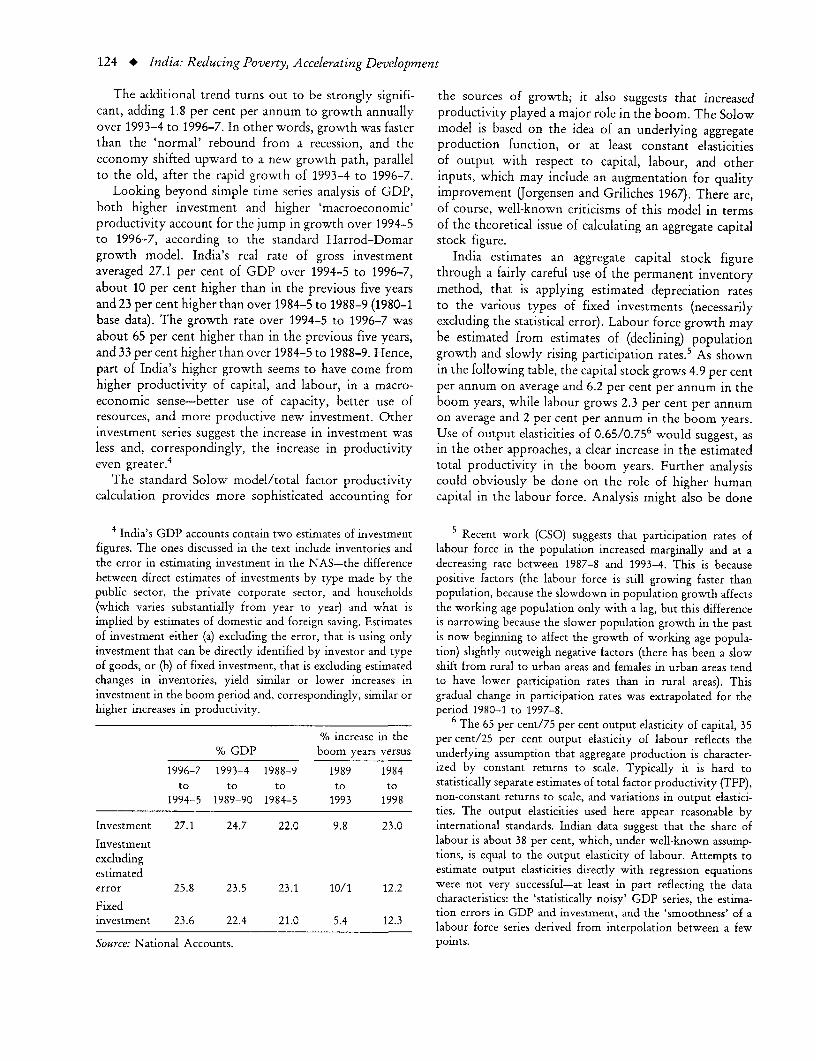
124 * India: Reducing Poverty, Accelerating Development
The additional trend turns out to be strongly signifi- the sources of growth; it also suggests that increasedcant, adding 1.8 per cent per annum to growth annually productivity played a major role in the boom. The Solowover 1993-4 to 1996-7. In other words, growth was faster model is based on the idea of an underlying aggregatethan the 'normal' rebound from a recession, and the production function, or at least constant elasticitieseconomy shifted upward to a new growth path, parallel of output with respect to capital, labour, and otherto the old, after the rapid growth of 1993-4 to 1996-7. inputs, which may include an augmentation for quality
Looking beyond simple time series analysis of GDP, improvement Jorgensen and Griliches 1967). There are,both higher investment and higher 'macroeconomic' of course, well-known criticisms of this model in termsproductivity account for the jump in growth over 1994-5 of the theoretical issue of calculating an aggregate capitalto 1996-7, according to the standard Harrod-Domar stock figure.growth model. India's real rate of gross investment India estimates an aggregate capital stock figureaveraged 27.1 per cent of GDP over 1994-5 to 1996-7, through a fairly careful use of the permanent inventoryabout 10 per cent higher than in the previous five years method, that is applying estimated depreciation ratesand 23 per cent higher than over 1984-5 to 1988-9 (1980-1 to the various types of fixed investments (necessarilybase data). The growth rate over 1994-5 to 1996-7 was excluding the statistical error). Labour force growth mayabout 65 per cent higher than in the previous five years, be estimated from estimates of (declining) populationand 33 per cent higher than over 1984-5 to 1988-9. Hence, growth and slowly rising participation rates.5 As shownpart of India's higher growth seems to have come from in the following table, the capital stock grows 4.9 per centhigher productivity of capital, and labour, in a macro- per annum on average and 6.2 per cent per annum in theeconomic sense-better use of capacity, better use of boom years, while labour grows 2.3 per cent per annumresources, and more productive new investment. Other on average and 2 per cent per annum in the boom years.investment series suggest the increase in investment was Use of output elasticities of 0.65/0.756 would suggest, asless and, correspondingly, the increase in productivity in the other approaches, a clear increase in the estimatedeven greater. total productivity in the boom years. Further analysis
The standard Solow model/total factor productivity could obviously be done on the role of higher humancalculation provides more sophisticated accounting for capital in the labour force. Analysis might also be done
4 India's GDP accounts contain two estimates of investment 5 Recent work (CSO) suggests that participation rates offigures. The ones discussed in the text include inventories and labour force in the population increased marginally and at athe error in estimating investment in the NAS-the difference decreasing rate between 1987-8 and 1993-4. This is becausebetween direct estimates of investments by type made by the positive factors (the labour force is still growing faster thanpublic sector, the private corporate sector, and households population, because the slowdown in population growth affects(which varies substantially from year to year) and what is the working age population only with a lag, but this differenceimplied by estimates of domestic and foreign saving. Estimates is narrowing because the slower population growth in the pastof investment either (a) excluding the error, that is using only is now beginning to affect the growth of working age popula-investment that can be directly identified by investor and type tion) slightly outweigh negative factors (there has been a slowof goods, or (b) of fixed investment, that is excluding estimated shift from rural to urban areas and females in urban areas tendchanges in inventories, yield similar or lower increases in to have lower participation rates than in rural areas). Thisinvestment in the boom period and, correspondingly, similar or gradual change in participation rates was extrapolated for thehigher increases in productivity. period 1980-1 to 1997-8.
6 The 65 per cent/75 per cent output elasticity of capital, 35% increase in the per cent/25 per cent output elasticity of labour reflects the
% GDP boom years versus underlying assumption that aggregate production is character-1996-7 1993-4 1988-9 1989 1984 ized by constant returns to scale. Typically it is hard to
to to to to to statistically separate estimates of total factor productivity (TFP),1994-5 1989-90 1984-5 1993 1998 non-constant returns to scale, and variations in output elastici-
ties. The output elasticities used here appear reasonable byInvestment 27.1 24.7 22.0 9.8 23.0 international standards. Indian data suggest that the share ofInvestment labour is about 38 per cent, which, under well-known assump-excluding tions, is equal to the output elasticity of labour. Attempts toestimated estimate output elasticities directly with regression equationserror 25.8 23.5 23.1 10/1 12.2 were not very successful-at least in part reflecting the dataFixed characteristics: the 'statistically noisy' GDP series, the estima-investment 23.6 22.4 21.0 5.4 12.3 tion errors in GDP and investment, and the 'smoothness' of a
labour force series derived from interpolation between a fewSource: National Accounts. points.

Growth, Macroeconomic Development, and Policies * 125
of individual sectors; for example substantial work increase in demand, but that begs the question of whyexists on agriculture (see references cited in World Bank investment rose.1999b); Ahluwalia analyses growth in some industrial The impact of reform, perhaps, provides the mostsub-sectors. consistent explanation of the increase in growth and
productivity, an endogenous explanation for the riseEstimates of Growth of Capital, Labour, and in private investment, and an explanation of why the
Total Factor Productivity (TFP) growth slowed. First, the reforms encouraged investment
1979-80 1994-5 by opening up opportunities for profitable investmentto to and reducing taxes on it. Second, rising FDI and imports
1997-8 1996-7 of capital goods, encouraged by deregulation, suggestthat not only was there an increase in new vintage capital,
Average growth of capital stock but that the new vintage was even more productive(1980-1 prices) 4.9 6.2 than usual. Third, the reforms encouraged a shift of
resources towards exports, which increases the productiv-
labour force 2.3 2.0 ity of resources. The estimated effective rates of protec-tion in industry suggest that primary inputs in exports
Average growth of GDP are on average 47.6 per cent more productive than in(1980-1 prices) 5.5 7.5 import-substituting industry (see Chapter 6). Hence a
switch of resources into exports and out of imports-aTFP (residual) with capital rise in the ratio of trade to GDP such as actually
elasticity = 0.75 1.3 2.4 occurred-can generate substantial increases in output.7
TFP (residual) with capital The reforms not only allowed India to take advantage ofelasticity = 0.65 1.5 2.8 a booming export market, they led to an increase in
India's share of world markets (see Chapter 6). Finally,Source: World Bank estimates. the reforms encouraged an increase in private construc-
tion, that provided more productive employment toThe boom of the mid-1990s thus seems to reflect a clear many workers.
upward shift using three different approaches to explain- The same set of explanations applies to the slowinging GDP growth, a much larger unexplained 'residual' in of the boom. Although investment remained fairly highSolow's terminology. What might explain this upward after 1996-7, exports slowed as cuts in protection stoppedshift? Correcting for possible underestimates of labour and world trade slowed. In 1997, India lost its share ofgrowth or increased labour quality (education) would not world markets for the first time since 1991. Withoutreduce the residual much-increased labour force utiliza- further reallocation of resources, growth in total produc-tion (an underestimate of labour participation) might tivity slowed. Added to this explanation is the slowingadd one or two percentage points to labour force growth of agriculture in 1997-8, and the development of excessover the boom period, but that would add only margin- capacity in industries like steel, cement, and autos, reflect-ally to the part of growth explained by the included ing large new investments and a slowing of finance fromfactors, given the low output elasticity of labour. The non-bank financial corporations. This excess capacitystock of education in the employed labour force changes could not be utilized to increase exports because overseasslowly; it might be increased if more educated females sales had become unprofitable.were drawn into the labour force or workers with higher This explanation suggests that a second phase ofthan average education returned to India, but again the reforms will be needed to re-stimulate growth. Of course,impact of this is likely to be small. The higher produc- from a longer-term perspective, the gains from reallocat-tivity certainly does not reflect a rise in capacity utiliza- ing resources will always be exhausted. In the longer term,tion arising from higher aggregate demand based on per capita income growth depends on investment ingovernment spending-although higher government defi- steadily improving capital goods and improvement in thecits may account for other, briefer episodes of rapid Indian capacity of the labour force. The comparative experiencegrowth, the government deficit was roughly constant and of East Asia and India suggests that competitive pressuremuch lower on average in the boom years than in the from overseas is an important factor in this process (seeprevious five years. To some extent the boom is partly Chapter 6).explained by better than average harvests, especially in1996-7; but overall this added less than 0.5 per cent perannum to output directly. Higher private investment 7 Some recent work in the US suggests that, partly, thispartly explains the higher growth in that it provided an reflects exporting firms' more efficient use of resources.

126 * India: Reducing Poverty, Accelerating Development
Annex 8.2 responsible for an estimated 673,000 deaths in India, ofwhich 589,000 were due to indoor pollution (UNDP
ENVIRONMENT, ECONOMIC GROWTHI, 1998).AND POVERTY On the resource side, soil degradation is a majorproblem: out of the total geographical area of 329 million
In India as elsewhere, there exist strong linkages between hectares, nearly half can be considered degraded (GOIeconomic growth and the environment. Growth, associ- 1999e). Forests in India are also under pressure: inated with large-scale industrialization, spread of transport 1991, only 23.4 per cent of the total geographic areaand communications, and urbanization, exerts pressure comprised recorded forest area, and only 19.5 per centon the environment in the form of pollution and deple- comprised actual forest cover (GOI 1997a), as againsttion of natural resources. Environmental degradation, in the target of 33 per cent stipulated by the Nationalturn, adversely affects the economy's capacity to grow, Forest Policy, 1988. The biodiversity of India is alsobecause growth relies on the sustainable productivity of under threat as is evident from the fact that the list ofnatural resources and the health of the population. threatened species in 1996 included 75 mammals, 73 birds,'Sustainable development' is development that does not 16 reptiles, 3 amphibians, and 1236 higher plants (Worldharm the prospects for maintaining or improving living Bank 1999c).standards in the future. The above discussion points to the urgent need to act
There exist strong linkages between poverty and in order to protect the environment. The following stepsthe environment. While the poorest segments of a popu- would help:lation generate less pollution than do the rest throughhigher levels of consumption, energy use, and vehicle * The negative link between economic growth and theownership, the poor do contribute significantly to rural environment can be weakened by encouraging efficientresource degradation (land, forestry, fisheries) because use of resources across all sectors. Energy subsidiesof their greater use of these resources to meet their need encourage excess fuel and electricity use with associatedfor food, fuel, fodder, and medicines. In addition, the pollution impacts at all stages of the energy and powerpoor bear a disproportionate burden of the costs imposed chain. Water subsidies encourage excess water use, withby environmental degradation, and this contributes resulting groundwater depletion and land waterloggingto their further impoverishment (UNDP 1998; GOI or salinity. Fertilizer and pesticide subsidies lead to excess1999e). First, the poor are more vulnerable to the health use and run-off of agricultural chemicals. Reduction ofeffects of pollution due to their inadequate nutrition, poor such explicit or implicit subsidies would help to reduceaccess to health care, and owing to where they live these negative environmental effects, while also improv-(particularly in urban slums that often have the worst air, ing the financial health of the supplying entities andwater, and solid waste problems). Second, the poor are encouraging private sector participation (see Chapter 5).more immediately affected by degradation of natural In the industrial sector, a competitive and open invest-resources because of their greater reliance on them to meet ment and trade environment encourages private investorsbasic needs. to adopt more efficient, and therefore more environmen-
India faces the full range of environmental problems, tally sound, technologies.from water pollution, air pollution, and solid and toxicwastes, to soil degradation, deforestation, wetland, and * As regards the link between poverty and the environ-biodiversity loss. It was estimated that, in 1995, the total ment, four types of measures are required to mitigate thecosts arising from such environmental problems amounted disproportionate burden of environmental degradationto $ 9.7 billion on average, or 4.5 per cent of GDP (GOI borne by the poor: first, those that allow more efficient1999a). Overall, the most significant problem, as mea- resource use by the rural poor, such as research, educa-sured by its economic impact, is that of widespread water tion, and awareness of more sustainable resource-basedpollution and lack of sanitation. According to the above- production techniques; second, measures that encouragementioned estimate of environmental damage in India, rural non-farm income reduce rural dependence on thehealth costs due to water degradation amounted to $ 5.7 resource base through higher and more inclusive growth;billion in 1995. Air pollution is serious in both urban and third, public health infrastructure investments, particu-rural India, although for different reasons. The health larly in safe drinking water and sanitation (see Chapter 2);impact of rural indoor air pollution, attributable to the and fourth, measures to increase public awareness of theheavy use of bio-fuels in poorly ventilated houses, exceeds magnitude of the indoor air pollution problem to helpeven the health impacts of high levels of urban ambient stimulate demand in rural and urban households forair pollution, attributable to transport, industry, energy, modern forms of energy and alternative stove or kitchenand refuse burning. Overall, in 1996, air pollution was designs.

Growth, Macroeconomic Development, and Policies * 127
The environmental policy framework needs to be * Environmental regulations cannot be effectivestrengthened. In most cases, environmental degradation without proper enforcement. However, as is recognizedoccurs because environmental costs are external to the by the Economic Survey 1998-9, enforcement is hamperedmarket, and policies do not exist to internalize those by the weak enforcement capabilities of environmentalcosts. Not only should environmental fines or taxes institutions and lack of accurate information on which tobeing paid by polluters (such as polluting firms and base both monitoring and compliance. Furthermore,vehicle owners) be higher, but certain commodity greater decentralization of the monitoring and complianceprices, such as diesel fuel, should be raised to internalize functions to state and local levels, along with greaterthe public health damages associated with its use (see public participation in protecting the environment, wouldBox). significantly improve both (see also Box 4.4).
PETROL AND DIESEL PRICES
Distorted relative prices of petrol and diesel have created perverse incentives to encourage diesel use,which has negative economic and environmental implications. In 1997, the ratio of the price of petrolto diesel was 2.4 in India, compared to 1.1 in Canada, 1.5 in Germany, 1.3 in Mexico, and 1.7 in Japan(see Table in this box). The justification for keeping relative diesel prices low has traditionally been thatit is used in the agricultural sector for irrigation pumps, and for public and commercial transport.However, it is now known that per litre of use, diesel is more polluting and toxic for human healththan petrol. In addition, standards for both diesel fuel and vehicle emissions (especially particulates,sulphur, and aromatics) are lax in India, but an even bigger problem is enforcement. The undesirableeffect of the fuel price distortion has been to encourage a rapid growth in urban diesel use. Fiscalmeasures, such as increasing diesel prices or a differential excise on diesel cars, can correct the bias. Forexample, in Sweden, a high annual tax on diesel cars was effective in bringing down the number ofdiesel cars to only 2 per cent of total cars. Such pricing and taxation measures, combined with animproved vehicle emissions programme, could reduce pollution and also add to the exchequer. Recentupward revisions in diesel prices (April and October 1999), maintained despite pressures for roll-backthe second time, have brought the ratio of petrol to diesel down to 1.73 (Delhi retail price), which thoughstill high, is moving in the right direction.
International Comparisons of Diesel and Petrol Prices
Country Automative dieselfor Regular leaded Ratio petrol prices!commercial use gasoline diesel prices
($ per litre) ($ per litre) (S per litre)
1987 1991 1997 1987 1991 1997 1987 1991 1997
India 0.280 0.247 0.289 0.601 0.603 0.690 2.15 2.44 2.39
Thiland 0.245 0.311 0.303 0.318 0.362 - 1.30 1.16 -
Japan'* 0.500 0.556 0.518 0.837 0.914 0.863 1.67 1.64 1.67
Mexico* 0.146 0.189 0.294 0.187 0.342 0.388 1.28 1.81 1.32
Germany* 0.454 0.574 0.622 0.536 0.767 0.935 1.18 1.34 1.50
Canada* 0.350 0.492 0.402 0.373 0.507 0.428 1.07 1.03 1.06
* gasoline prices refer to regular unleaded.
Sources: Energy Prices & Taxes, Quarterly Statistics, Third Quarter 1998, International Energy Agency
Centre for Science and Environment, New Delhi; International Energy Agency.

128 * India: Reducing Poverty, Accelerating Development
Annex 8.3 Commission was set up in August 1996. The Commission'srole was diluted in January 1998 with removal of its
INDIA'S PROGRESS IN PRIVATIZATION powers to monitor and supervise the overall disinvestment1991-9 process. The term of the Commission expired on 30
November 1999. The Commission submitted its twelfthThe New Industrial Policy announced in July 1991 Report to the government in August 1999 and, withenvisaged disinvestment of a part of government share- that, it completed examination of 58 of the 64 PSEsholding in selected PSEs with the objective of raising referred to it by the government (in the case of the otherresources, encouraging wider public participation, and 6 PSEs, there are jurisdictional problems as they wereimproving the performance of PSEs by subjecting already under reference to the BIFR before they werethem to stock market discipline. Accordingly, during the referred to the Disinvestment Commission). In its firstperiod March 1991 through March 1998, a part of eleven Reports, which contain recommendations ongovernment shareholding in 39 enterprises out of the 240 53 of the 64 PSEs referred to it, the Commission hadnon-departmental CPSEs has been divested (see Annex suggested trade sales in 8 cases, strategic sales in 24Table 8.10). As of March 1998, a total amount of cases, partial equity sales in 5 cases, closure/sale of assetsRs 112.57 billion has been realized through eleven in 4 cases, and no disinvestment/deferred disinvestmentrounds of disinvestment (GOI 1998b). However, in in 12 cases. However, these recommendations werenone of the cases has government shareholding been implemented or are being implemented in only 13 cases.reduced to less than 51 per cent through disinvestment. The Commission also recommended setting up of aIn 20 of the 39 cases disinvestment has been less than 10 'Disinvestment Fund' out of the proceeds of share sales,per cent, and in 10 cases, it has been less than 5 per cent. to restructure PSEs and fund voluntary retirements, inFurther, the process of sales seems to have slowed order to make disinvestment easier. Though such a Fundince March 1995, with sales exceeding 2 per cent of was set up in September 1996, it is not operational tillgovernment holding numbering only 5 in 1995-6, 7 in date.1996-7, and 1 in 1997-8, as opposed to 10 in 1994-5 and The Commission has also made a number of recom-a high of 26 in 1991-2. The same trend is also discernible mendations on corporate governance, notably gradedif one examines the disinvestment proceeds, which increases in autonomy for PSEs, depending on theiramounted to only Rs 3.62 billion in 1995-6, Rs 4.55 performance. Till March 1998, the government hadbillion in 1996-7, and Rs 9.06 billion in 1997-8, after a granted enhanced autonomy to 11 selected PSEs-IOC,high of Rs 50.78 billion in 1994-5 (GOI, 1999d). In IPCL, ONGC, BPCL, HPCL, NTPC, SAIL, VSNL,1998-9, however, the disinvestment proceeds seem to BHEL, GAIL, and MTNL-referred to as 'Navratnas'; ithave picked up once again with the amount realized equal had also granted operational, financial, and managerialto Rs 53.71 billion against the budget target of Rs 50 autonomy to 97 other profit-making enterprises referredbillion. But the fact is that the greater part of the 1998-9 to as 'Mini-Ratnas'. The government has also begun todisinvestment proceeds have come from an equity swap follow up on the Commission's recommendations tobetween three oil PSEs-IOC, ONGC, and GAIL-a include non-official part-time Directors in the Board ofmove which had an adverse impact on the market Directors, to modify MoUs to allow better evaluation ofcapitalization of these enterprises. The government was performance, and to grant greater autonomy in invest-able to raise only about Rs 11.87 billion through market ments. However, the government has not acted on thedisinvestment in CONCOR, GAIL, and VSNL. More- Commission's recommendations to provide for electionover the government failed to act on its Budget 1998-9 of Directors to represent minority shareholders andpromises of disinvestment in IOC (which was slated for election of employee representatives on the Board ofFebruary 1999, reportedly due to low prices of the scrip Directors in proportion to employee shareholding, toon the secondary market at that time), reducing govern- bring salaries of top management in line with industry,ment shareholding in Indian Airlines to 49 per cent over to give greater autonomy to PSEs in determiningthe next three years and to 26 per cent in non-strategic their product prices, to set up an independent institu-PSEs. Buoyed by its success in 'exceeding' the 1998-9 tion-the Pre-investigation Board-to evaluate instancestarget, the government has doubled the disinvestment of malfeasance in PSEs, to enable PSEs to set up investortarget to Rs 100 billion for 1999-2000. To that end, the relation group to deal with investor queries, and togovernment raised Rs 0.75 billion through disinvestment make the Public Enterprise Selection Board more broad-in VSNL in September, which brought down its share to based and allow it greater autonomy in selecting CEOs52.97 per cent in that enterprise. and other functional directors. Besides, as long as the
To advise the government on the extent, mode, and government continues to retain over 51 per cent of thetiming of disinvestment in PSEs, the Disinvestment capital, the PSE and its employees will remain subject to

Growth, Macroeconomic Development, and Policies * 129
the legal framework as government employees. This To address the problem of slow implementation ofentails constraints which continue to hamper the per- the recommendations of the Disinvestment Commission,formance of public enterprises even as removal of a new Department of Disinvestment, with greater execu-reservation and cuts in protection from international tive powers, was created in December 1999. The newcompetition have led to increased competition for public Department is expected to accelerate the privatizationenterprises. process.

9
India's Development Prospects
Short-run prospects continue to depend heavily on the India's BOP will continue to be comfortable inagriculture sector, both in terms of GDP growth and 1999-2000, in spite of current account deficit wideninginflation. Even if agricultural output remains high, slightly, and coverage of imports declining somewhat,agricultural growth is likely to decline relative to the to 7.2 months of goods imports from 7.6 monthsboom year of 1998-9, when record rabi and total for 1998-9. Export performance deteriorated over 1997foodgrain harvests produced a sectoral growth of 7.6 and 1998, with India losing export market share.per cent. Other sectors will probably continue trend Although export growth has picked up in 1999, exceptgrowth. Industrial growth may pick-up due to the for the 1999 EXIM policy's reduction of quantitativenormal winding down of industrial sluggishness and restrictions, little has been done to improve incentiveshigher consumption from the good agricultural har- for exports or pressures that will make India inter-vests and the state government wage increases of 1998-9. nationally competitive-labour market rigidities andOn the other hand, public investment is likely to fall, small-scale industry reservation remain a burden andespecially in the states, given their fiscal pressures. More- higher tariffs and increased anti-dumping actionsover, even if the new central government manages to have probably increased protection for the inefficient.meet its budget targets (which will be difficult owing From a longer-run perspective, India has not preparedto the unforeseen defence expenditure), crowding out itself to take advantage of an upsurge in world exportis likely to continue to dampen corporate investment. demand, nor is it ready for the increasing competitionUncertainty about the pace of reforms and limited that declining protection would engender (quantitativeprofitability of exports will also inhibit corporate in- restrictions have to be phased out by 2001), nor thevestment. And, on the supply side, lack of new reforms end of the Multi-Fibre Arrangement in 2005. Increasesover the last few years suggests that a major increase in in international oil prices have raised the oil importmacroeconomic productivity, similar to that in the bill by over 50 per cent in the first seven monthsmid-1990s (Annex 8.1), is unlikely. Hence a reasonable of 1999-2000. Any increase in growth in the non-projection is that GDP growth in 1999-2000 will be agricultural economy will eventually increase de-similar to the long-run trend (1979-98) growth of 5.8 mand for imports. And it is unlikely that there will beper cent, assuming no acceleration of reforms. The large further declines in the difference between the RBI and1998-9 harvests are also likely to limit any price in- customs imports. Hence, the likely outcome is acreases, so inflation should remain under control, that widening of the merchandise trade deficit to $16.4is under 5 per cent for the WPI as well as for the CPI. billion and current account deficit to 1.4 per cent of

India's Development Prospects * 131
GDP or $ 6.6 billion (1 per cent of GDP in 1998-9, twenty years, the poor still number over 300 million,see Table 8.6). more than in all of sub-Saharan Africa. And, despite the
On the capital account, increases in portfolio invest- growth, little has changed structurally: tradement and 'other' capital inflows (Table 8.6), which remains a much smaller percentage of GDP than inappear strong thus far in 1999, will offset a decline in East Asian countries including China, almost 73 per centnet long-term borrowings after the one-time rise from of the people still live in rural areas, and socialthe RIB. Hence reserves will continue to increase in indicators, despite improvement, are still low. India's1999-2000, although less than in 1998-9, so that the human development and per capita consumption havereserve cover, in terms of imports, is likely to decline not risen nearly as fast as in East Asia, even taking intoslightly. In 1998-9, India financed its current account account East Asia's recent crisis.deficit and increased reserves by $ 3.9 billion, largely And if changes do not occur, even current ratesthrough its $ 4.2 billion RIB issue. Other sources of of growth may slip. Current rates of investmentcapital were limited, with both public and publicly have supported an average 5.5 per cent growth inguaranteed borrowings (other than the RIB) and the last two years and should be able to do so in theprivate borrowings minimal, no major offshore future, provided productivity continues to grow at theprivatizations, and a net withdrawal of funds by FIIs. same rate in the aggregate. However, the large fiscalMore worrisome was the decline in FDI to $ 2.5 billion deficits continue to worry external investors, crowd(though this is still a large figure compared to the out private investment and, within the public sectorearly 1990s). For 1999-2000, international capital budgets, the associated interest payments displaceflows may remain low worldwide. Although there much needed public development expenditure. Thehas been a substantial pick-up in flows into India, this infrastructure gap is increasing, especially consideringmay partly reflect a response to the Budget measures the additional urban infrastructure needed to keep pacethat reduced taxes on the capital market. FDI is likely with urbanization and reduce urban environmentalto continue to remain close to last year's levels. The problems. Agricultural growth and productivity incomposition of foreign investment has also shifted agriculture may be slipping as a result of limitedtoward more volatile portfolio investment. (In 1996-7, reforms, the focus of public spending on subsidies$ 5.4 billion of foreign investment had 67 per cent rather than infrastructure, and environmental issues inFDI, while a similar amount of investment in 1999-2000 some areas. The poorest states are particularly subjectis likely to have less than 50 per cent FDI). On the to these problems, and in some cases have governancedebt side, there seems little reason to expect India's problems-unless they can resolve these problems andprivate offshore borrowing to increase. Companies, speed up their growth, their large weight in the nationon comparing the likely relative cost of funds, may pull down overall average reduction in povertyhave been allowing their approvals for external and the rate of development. Hence reforms arecommercial borrowing to lapse. Finally, the effect of particularly critical in the poorest states, where 40the sanctions on new donor projects may begin to per cent of the population live and which have laggedslow down disbursements of bilateral and multilateral behind in the upswing in growth and accompanyingfunds. poverty reduction.
Reserves will continue to be comfortable. By the A second wave of reforms will be needed to achieveend of March 1999, foreign exchange reserves were this poverty-reducing growth and banish the risk of a$ 30.2 billion, including $ 29.5 billion in foreign ex- slowdown including macroeconomic, structural policychange assets and $ 0.7 billion in SDRs and IMF reform, governance and institutional concerns, as high-reserves (equivalent to 7.6 months of imports) and lighted in previous chapters and the Overview. Thatrose further to $ 31.3 billion by end-September 1999 reforms can lead to higher growth is shown in Annex(including gold, reserves were $ 34.5 billion). The size 8.1, where post-1991 reforms supported a significantof these reserves relative to India's low short-term addition to a growth of 1.8 per cent per annum in theforeign currency obligations and foreign portfolio mid-1990s. Reforms leading to higher growth would beinvestment, along with India's capital controls, limit accompanied by more favourable BOP indicators, suchthe risk of a currency crisis. as higher growth of exports and imports, and more
The longer-term challenge is faster poverty reduction capital inflows, including FDI.and development-the Indian government's traditional The last few months of 1999 have heralded changesconcerns. Although India's growth has been among the favourable to the initiation of the second wave offastest in the world and poverty has fallen in the last reforms, both at the centre as well as the states. The

132 * India: Reducing Poverty, Accelerating Development
new Central government installed in October 1999 has governments attracted more electoral support thanpassed important economic legislation, such as opening non-reforming governments. If reforms along the linesup insurance and liberalizing foreign exchange regula- suggested in this Report as well as in official documentstion. Also, since the government enjoys a more com- and committee reports are indeed implemented, thenfortable majority than the previous one, it is better India has a real opportunity to speed up sustainableplaced to carry out subsidy cuts, government realign- growth and substantially reduce poverty in the newment, and other reform. At the state level, reforming millennium.

Bibliography
Ahluwalia, D. (1991). 'Drought Proofing in the Indian in I. J. Ahluwalia and I. M. D. Little, India's Economic
Foodgrain Economy', Indian Journal of Agricultural Reforms and Development, Oxford University Press,
Economics, vol. 46, no. 2, pp. 111-20. New Delhi.Ahluwalia, I. J. (1991). Productivity and Growth in Indian Binswanger, H., and S. Khandakar (1995). 'The Impact
Manufacturing, Oxford University Press, New Delhi. of Formal Finance on the Rural Economy of India',- (1997). 'Governance Issues in India's Economic Journal of Development Studies, vol. 32, no. 2,
Reforms', Workshop on Governance Issues in South pp. 234-65.
Asia, processed, Yale University. Business India (1998). 'Heart of Darkness', 8 February,
Ahluwalia, M. S. (1998). 'Infrastructure Development in pp. 58-68.India's Reforms', in I. Ahluwalia and I. M. D. Little Campos, N. F., and J. B. Nugent (1999). 'Development
(eds), India's Economic Reforms and Development, Performance and the Institutions of Governance:
Oxford University Press, New Delhi. Evidence from East Asia and Latin America', World
Anant, T. C. A. (1998). 'Labour Markets', in Agenda for Development, vol. 27, pp. 439-52.
Change: Action Plan for the Economy, Rajiv Gandhi Chand, R. (1999). 'The Emerging Crisis in Punjab Agri-
Institute for Contemporary Studies, New Delhi. culture', Economic and Political Weekly, vol. 34, no.
Anant, T. C. A. and 0. Goswami (1997). 'Getting Every- 13, pp. A-2-A-9.thing Wrong: India's Policies Regarding Sick Firms', Chaudhri, D. P. (1979). 'Education and Agricultural Pro-
in D. Mookherjee (ed.), Indian Industry, Oxford Uni- ductivity in India', Ph.D. Thesis, University of Delhi,
versity Press, New Delhi, pp. 236-88. New Delhi.Bajpai, N., and J. Sachs (1998). 'Strengthening India's Coes, D. V. (1995). Macroeconomic Crises, Policies, and
Strategy for Economic Growth', Development Dis- Growth in Brazil 1964-90, World Bank, Washington,
cussion Papers No. 641, Harvard Institute for Inter- DC.national Development, Harvard University. Confederation of Indian Industry (CII) (1999). 'Survey of
Barro, R. (1991). 'Economic Growth in a Cross Section Indian Business Environment', processed, CII.
of Countries', QuarterlyJournal ofEconomics, vol. 106, Das, S. K. (1998). Civil Service Reform nd Structural
pp. 407-44. Adjustment, Oxford University Press, New Delhi.
Barro, R. J., and J.W. Lee (1993). 'International Compari- Das-Gupta, A. (1999a). 'Expenditure Management and
sons of Educational Attainment', Journal of Monetary Budgeting', processed, World Bank.
Economics, vol. 32, pp. 363-94. (1999b). 'Tax Structure and Administration
Bhagwati, J. (1998). 'The Design of Indian Development', Reform', processed, World Bank.

134 * Bibliography
Datt, G. (1997). Poverty in India and Indian States: An Foster, J., J. Greer, and E. Thorbecke (1984). 'A Class ofUpdate, International Food Policy Research Institute, Decomposable Poverty Measures', Econometrica,Washington, DC. vol. 52, pp. 761-66.- (1998). 'Farm Productivity and Rural Poverty in Galal, A., L. Jones, P. Tandon, and I. Vogelsangh (1994).India', Journal ofDevelopment Studtes, vol. 34, no. 4, The Welfare Consequences ofSelling Public Enterprises:pp. 62-85. An Empirical Analysis, Oxford University Press for
(1999). 'Has Poverty in India Declined during World Bank.the Post-Reform Period', processed, World Bank. Gangopadhyay, S. and W. Wadhwa (1998). 'EconomicAlso published in Economic and Political Weekly, Reforms and Labour', Economic and Political Weekly,December, pp. 3516-18. 30 May 1998.
Datt, G. and M. Ravallion (1997). 'Macroeconomic Crises (1999). 'Civil Service Reforms in India', pro-and Poverty Monitoring: A Case Study for India', cessed, World Bank.Review of Development Economics, vol. 1, no. 2, Ghosh, A. K. (1999). 'Current Issues of Employmentpp. 135-52. Policy in India', Economic and Political Weekly, vol.
Debroy, B. (1997). 'Labour Market Reform', Project 34, no. 36, pp. 2592-608.LARGE (Legal Adjustments and Reforms for Godbole M. (1997). 'Corruption, Political InterferenceGlobalizing the Economy), Policy Paper No. 22, and the Civil Service', in S. Guhan and SamuelUNDP, New Delhi. Paul (eds), Corruption in India, Vision Books, New
Debroy, B., S. Gangopadhyay, and W. Wadhwa (1999). Delhi.'Judicial Reforms in India', processed, World Bank. Government of India (GOI) (1997a). Statistical Abstract
De Long, B., and L. Summers (1991). 'Equipment Invest- India, Central Statistical Organization, Departmentment and Economic Growth', Quarterly Journal of of Statistics, Ministry for Planning, Statistics andEconomics, vol. 106, no. 2, pp. 445-502. Programme Implementation, New Delhi.
Dreze, J. P., and J. Loh (1995). 'Literacy in India and (1997b). Government Subsidies in India, MinistryChina', Economic andPolitical Weekly, 11 November, of Finance, New Delhi.pp. 2868-78. (1997c). India's Infrastructure: Investment Oppor-
Dreze, J. P., and P. V. Srinivasan (1996). 'Poverty in India: tunities, Ministry of Power, New Delhi.Regional Estimates 1987-8', Working Paper No. 36, (1997d). Sarvekshana, vol. 21, no. 2, 7 3rd issue,Centre for Development Economics, Delhi School of National Sample Survey Organization, DepartmentEconomics, Delhi. of Statistics, Ministry for Planning, Statistics and
Dubey, A., and S. Gangopadhyay (1998). 'Counting the Programme Implementation, New Delhi.Poor', Sarvekshana Analytical Report, No. 1, Depart- (1998a). National Accounts Statistics 1998, Cen-ment of Statistics, Ministry for Planning, Statistics tral Statistical Organization, Department of Statistics,and Programme Implementation, New Delhi. Ministry for Planning, Statistics and Programme
Easterly, W., and R. Levine (1997). 'Africa's Growth Implementation, New Delhi.Tragedy: Policies and Ethnic Divisions.' Quarterly (1998b). Public Enterprises Survey 1997-8, De-Journal of Economics, vol. 112, no. 4, pp. 1203-50. partment of Public Enterprises, Ministry of Industry,
Export-Import Bank of India (1998). 'Transaction Cost New Delhi.of Indian Exports: An Analysis'. Export-Import Bank (1998c). Sample Registration System Bulletin,of India, Occasional Paper No. 64, Mumbai. Registrar General, Ministry of Home Affairs, New
Fallon, P. R., and R. E. B. Lucas (1993). 'Job Security Delhi.Regulations and the Dynamic Demand for Industrial (1998d). Morbidity and Treatment of Ailments,Labor in India and Zimbabwe', Journal of Develop- NSS Fifty-Second Round (July 1995-June 1996),ment Economics, vol. 40, pp. 241-75. National Sample Survey Organization, Department
Filmer, D., and L. Pritchett (1998). 'What Educational of Statistics, Ministry for Planning, Statistics andProduction Functions Really Show', Policy Research Programme Implementation, New Delhi.Working Paper No. 1795, World Bank, Washington, (1998e). Attending an Educational Institution inDC. India: Its Level, Nature and Cost, NSS Fifty-Second
Finger, J. Michael (ed.) (1993). Antidumping: How it Round (July 1995-June 1996), National Sample Sur-Works and Who Gets Hurt, University of Michigan vey Organization, Department of Statistics, MinistryPress, Ann Arbor, Michigan. for Planning, Statistics and Programme Implementa-
(1998). 'GATT Experience with Safeguards', tion, New Delhi.Policy Research Working Paper No. 2000, World (1999a). State of the Environment Report, Minis-Bank, Washington, DC. try of Environment and Forests, New Delhi.
Bibliography * 135
(1999b). Working Force Estimates 1993-4: A the Pacific, Technical Report, Asian Regional Consul-
Methodological Note, Central Statistical Organization, tation, Bangkok.Department of Statistics, Ministry for Planning, Sta- International Monetary Fund (IMF), International Finan-
tistics and Programme Implementation, New Delhi. cial Statistics, various issues, IMF, Washington, DC.
(1999c). Ninth Five Year Plan 1997-2002, Plan- Johnson, S., D. Kaufmann, and A. Shleifer (1997). 'The
ning Commission, New Delhi. Unofficial Economy in Transition', Brookings Papers
(1999d). Annual Report 1998-9, Ministry of on Economic Activity, Fall, pp. 159-239.
Finance, New Delhi. Jorgensen, D., and Z. Griliches (1967). 'The Explanation
(1999e). Economic Survey 1998-9, Ministry of of Productivity Change', Review of Economic Studies,
Finance, New Delhi. vol. 34, pp. 249-83.(1999f). India's External Debt-A Status Report, Kannan, R. (1999). 'Inflation Targeting: Issues and Rel-
Ministry of Finance, New Delhi. evance for India', Economic and Political Weekly, vol.
(19 99g). 'Survey on Health Care', Fifty-second 34, nos. 3 and 4, pp. 115-22.Round (July 1995-June 1996), Schedule 25, in press, Kapur Committee (1998). Report of The High Level Com-
National Sample Survey Organization, Department mittee on Credit to SSI, Chairman S. L. Kapur, Mumbai.
of Statistics, Ministry for Planning, Statistics and Kathuria, S. (1995). 'Competitiveness of Indian Industry',Programme Implementation, New Delhi. in D. Mookherjee (ed.) Indian Industry Policies
(1999h). Draft Brochure on New Series on Na- and Performance, Oxford University Press, Delhi,
tional Accounts Statistics (Base Year 1993-4), Central pp. 148-90Statistical Organization, Department of Statistics, (1996). Competing through Technology and Manu-
Ministry for Planning, Statistics and Programme facturing: A Study of the Indian Commercial Vehicles
Implementation, New Delhi. Industry, Oxford University Press, Delhi.
Govinda Rao, M., R. T. Shand, and K. P. Kalirajan (1999). Kathuria, S., and A. Bhardwaj (1998). 'Export Quotas
'Convergence of Incomes across Indian States: A and Policy Constraints in the Indian Textile andDivergent View', Economic and Political Weekly, 27 Garment Industries', Policy Research Working Paper
March, pp. 769-78. No. 2012, World Bank, Washington, DC.Gulati, A. (1998). 'The Fertilizer Subsidy: Who Gains at Kathuria, S. and N. Taneja (1986). India's Exports: The
Whose Cost?', processed, World Bank. Challengefrom China, Indian Council for Research on
Gupta, R. V. (1998). Report of the High-Level Committee International Economic Relations, New Delhi.on Agricultural Credit through Commercial Banks, Kaul, V., C. Ramachandran, and G. C. Upadhyay (1993).
Chairman R. V. Gupta. Impact of ECE on Retention in Primary Grades: A
Gupta, S. P. (1999). 'Globalization, Economic Reforms Longitudinal Study, National Council of Education
and Role of Labor', processed, International Labor Research and Training, New Delhi.Organisation, New Delhi. Khan, A. R. (1995). 'Structural Adjustment, Labor Mar-
Hanson, J., and S. Kathuria (1999). 'India's Financial ket and Employment', Asian Development Review,System: Getting Ready for the 21St Century: An vol. 13, no. 2, Bangkok.Introduction', in J. Hanson and S. Kathuria (eds), Khan, S. K. (1998). Report of the Working Group for
India's Financial System: Getting Ready for the 21st Harmonizing the Role and Operations of DFIs and
Century, Oxford University Press, New Delhi. Banks, Chairman S. K. Khan, Mumbai.
Hussain Committee (1997). Report of the Expert Commit- Khanna, S. K. (1999). Indian Administration: Problems and
tee on Small Enterprises, Chairman Abid Hussain, Attitudes, Commonwealth Publishers, New Delhi.
New Delhi. Knack, S. and P. Keefer (1995). 'Institutions and Eco-Indian Council of Medical Research (ICMR) (1989). nomic Performance: Cross-Country Tests Using
Evaluation oftheNational NutritionalAnemiaProphy- Alternative Institutional Measures', Economics and
laxis Programme, New Delhi. Politics, vol. 7, no. 3, pp. 207-27.
International Food Policy Research Institute (IFPRI) Kriesel, S., and S. Zaidi (1999). 'The Targeted Public(1998). 'Government Spending, Growth and Poverty: Distribution System (TPDS) in Uttar Pradesh: An
An Analysis of Inter-Linkages in Rural India', IFPRI, Evaluation', processed, World Bank.
Washington, DC. Kurien, N. J. (1999). 'State Government Finances: AIndian Institute of Population Sciences (1995). National Survey of Recent Trends', Economic and Political
Family Health Survey (Maternal Child Health and Weekly, 8-14 May, pp. 115-25.
Family Planning): India 1992-3, Mumbai. La Porta, R., A. Shleifer, and R. Vishny (1998). 'The
International Labor Organization (ILO) (1999). Towards Quality of Government', National Bureau of Eco-
Full Employment: Prospects and Problems in Asia and nomic Research, Working Paper No. W6727.

136 + Bibliography
Lall, S. V. (1999). 'The Role of Public Infrastructure Comparison across States and Population Groups',Investments in Regional Development: Experience processed, NCAER, New Delhi.of Indian States', Economic and Political Weekly, 20 (1996). Human Development Profile of India:March, pp. 717-25. Inter-State and Inter-Group Differentials, NCAER,
Lanjouw, P., and M. Ravallion (1998). 'Benefit Incidence New Delhi.and the Timing of Program Capture', Development (1998). India Market Demographics Report 1998,Research Group, World Bank, Washington, DC. NCAER, New Delhi.
Levine, R. (1998a). 'The Legal Environment, Banks, and (1999). 'Protection in Indian Industry', pro-Long-Run Economic Growth', World Development, cessed, NCAER, New Delhi.vol. 26, pp. 1169-83. National Council of Education Research and Training
(1998b). 'Capital Control Liberalization and (NCERT) (1998). Sixth All India Educational Survey,Stock Market Development', World Development, National Tables, vol. 4, New Delhi.vol. 26, pp. 1169-83. National Institute of Public Finance and Policy (NIPFP)
Levine, R. and D. Renelt (1992). 'A Sensitivity Analysis (1997). Government Subsidies in India, NIPFP, Newof Cross-Country Growth Regressions', American Delhi.Economic Review, vol. 82, pp. 942-63. Nautiyal, K. C. (1989). Education and Rural Poor, Com-
Loh, J. (1995). 'Education and Economic Growth monwealth, New Delhi.in India: An Aggregate Production Function Ap- North, D. C. (1981). Structure and Change in Economicproach', DPEP Bureau, Department of Education, History, Norton, New York.Ministry of Human Resource Development, New (1990). Institutions, Institutional Change andDelhi. Economic Performance, Cambridge, Cambridge Uni-
Lucas, R. E. (1973). 'Some International Evidence on versity Press, Cambridge.Output-Inflation Tradeoffs', American Economic Re- Obstfeld, M. (1998). 'The Global Capital Market: Bene-view, vol. 63, pp. 326-34. factor or Menace', Journal of Economic Perspectives,
Mauro, P. (1993). 'Essays on Country Risk, Asset Markets vol. 12, no. 4, pp. 9-30.and Growth', Ph.D. Thesis, Harvard University, Olson, M. (1996). 'Big Bill's on the Sidewalk: Why SomeCambridge, Massachusetts. Nations are Rich and Others Poor', Journal of Eco-
= (1995), 'Corruption and Growth', Quarterly nomic Perspectives, vol. 10, no. 2, pp. 3-24.Journal of Economics, vol. 10, pp. 681-712. Olson, M., N. Sarna, and A. Swamy (1997). 'Governance
Mathur, 0. P. (1999). 'Decentralization in India: A Re- and Growth: A Simple Hypothesis explainingport Card', processed, World Bank. Cross-Country Differences in Productivity Growth',
Maxwell, T. (1999). 'Making India a World-Class Ex- Center for Institutional Reform and The Informalporter', processed, World Bank. Sector, processed, University of Maryland, College
Megginson, W. L., R. C. Nash and M. van Randenborgh Park, Maryland.(1996). 'The Privatization Dividend', Public Policyfor Organization for Economic Co-operation Developmentthe Private Sector, no. 68, World Bank. (OECD) (1995). OECDJobs Study: Facts, Analysis, and
Mohan Committee (1996). TheIndia InfrastructureReport, Strategies, OECD, Paris.Chairman Rakesh Mohan, New Delhi. (1997). IssuesandDevelopments inPublicManage-
Mohanty, D. and A. K. Mitra (1999). 'Experience with ment: Survey 1996-7, OECD, Paris.Monetary Targeting in India', Economic and Political Parikh, K. S. (ed.) (1999). India Development ReportWeekly, vol. 34, nos. 3 and 4, 16-29 January, pp. 123- 1999-2000, Oxford University Press, New Delhi.32. Paul, S. (1995). 'A Report Card on Public Services in
Narasimhan, C. V. (1997). 'Prevention of Corruption: Indian Cities: A View from Below', Public AffairsTowards Effective Enforcement' in S. Guhan and Centre, Bangalore.Samuel Paul (eds), Corruption in India, Vision Books, (1998). 'Making Voice Work: The ReportNew Delhi. Card on Bangalore's Public Services', Policy Research
Narasimhan Committee (1991). Report of the Committee Working Paper No. 1921, World Bank, Washington,on Financial System, Chairman M. Narasimham, DC.Mumbai. Pigato, M., C. Farah, K. Itakura, K. Jun, W. Martin, K.
- (1998). Reportofthe Committeeon BankingSector Murrell, and T. G. Srinivasan (1997). South Asia'sReforms, Chairman M. Narasimham, Mumbai. Integration into the World Economy, World Bank,
National Council of Applied Economic Research Washington, DC.(NCAER) (1994). 'Non Enrollment, Drop-Out and PROBE Team (1999). Public Report on Basic Education inPrivate Expenditure on Elementary Education: A India, Oxford University Press, New Delhi.

Bibliography * 137
Radelet, S., J. Sachs, and J. W. Lee (1997). 'Economic Solow, R. (1957), 'Technical Progress and the AggregateGrowth in Asia', Development Discussion Paper, Production Function', Review of Economics and Sta-Harvard Institute for International Development, tistics, vol. 39, pp. 312-20.Harvard University. Srinivasan, T. N. (1998). 'India's Export Performance', in
Ravallion, M., and G. Datt (1996a). 'India's Checkered I. Ahluwalia and I. M. D. Little, India's EconomicHistory in the Fight Against Poverty: Are there Reforms and Development, Oxford University Press,Lessons for the Future?' EconomicandPolitical Weekly, New Delhi.vol. 31. Stiglitz, J. (1998). 'Towards a New Paradigm for Devel-
(1996b). 'How Important to India's Poor is the opment: Strategies, Policies, and Processes', PrebischSectoral Composition of Growth?' World Bank Eco- Lecture, U7NCTAD, Geneva.nomic Review, vol. 10, no. 1, pp. 1-26. Tarapore, S. S. (1998). 'The Need for Second Generation
Reddy, Y. V. (1999). 'Financial Reform: Review and Banking Reforms', Sir Purshottamdas ThakurdasProspects', Reserve Bank of India Bulletin, vol. LII, Memorial Lecture, Indian Institute of Bankers,no. 1, pp. 33-94. Mumbai.
Reserve Bank of India (1996). Report on Trend and Progress (1999). 'Indian Banking: Getting Ready forof Banking in India 1995-6, RBI, Mumbai. the Second Round of Reforms' in J. Hanson and S.
(1997). Annual Report 1996-7, RBI, Mumbai. Kathuria (eds), India's Financial System, Oxford(1998a). Report on Currency and Finance 1997-8, University Press, New Delhi.
RBI, Mumbai. Tarapore Committee (1997). Report of the Committee- ~ (1998b). Annual Report 1997-8, RBI, Mumbai. on Capital Account Convertibility, Chairman S. S.
(1998c).MoneySupply:AnalyticsandMethodology Tarapore, RBI, Mumbai.of Compilation: Report of the Working Group, Chair- Telecom Regulatory Authority of India (TRAI) (1998).man, Y. V. Reddy, Mumbai. Consultation Paper on Telecom Pricing, New Delhi.
(1999a). 'Harmonising the Role and Operations Tendulkar, S. D. (1998). 'Indian Economic Policy Re-of Development Financial Institutions and Banks', forms and Poverty: An Assessment', in I. AhluwaliaDiscussion Paper, RBI, Mumbai. and I. M. D. Little, India's Economic Reforms and
(1999b). Report of the Technical Committee on Development, Oxford University Press, New Delhi.State Government Guarantees, RBI, Mumbai. Tilak, J. B. G. (1987). The Economics of Inequality in
(1999c). 'Some Aspects and Issues Relating to Education, New Delhi.NPAs in Commercial Banks', Department of Bank- UNCTAD (1998). World Investment Report, UNCTAD,ing Supervision, Reserve Bank of India Bulletin, Geneva.vol. LII, no. 7, pp. 913-36, RBI, Mumbai. (1999). World Investment Report, UNCTAD,
(1999d). Annual Report 1998-9, RBI, Mumbai. Geneva.(1999e). Report on Trend and Progress of Banking United Nations Development Programme (UNDP) (1993).
in India 1998-9, RBI, Mumbai. Human Development Report, 1993, Oxford Univer-
- - (1999f). Report on Currency and Finance 1998-9, sity Press, New York.RBI, Mumbai. (1998). Human Development Report, 1998, Ox-
Roberts, M. J., and J. R. Tybout (1997). 'What Makes ford University Press, New Delhi.
Exports Boom?', Directions in Development Series, (1999). Diversity and Disparities in Human De-
World Bank, Washington, DC. velopment: Key Challenges for India, UNDP, New
Sachs, J. D., and A. M. Warner (1995). 'Economic Reform Delhi.and the Process of Global Integration'. Brookings Vasudevan, A. (1999). 'Some Practical Issues in Monetary
Papers on Economic Activity, pp. 1-95. PolicyMaking',ReserveBankoflndiaBulletin,vol. LtIU,
Sala-i-Martin, Xavier X. (1997). 'I Just Ran Four Million no. 1, pp. 121-8.Regressions', National Bureau of Economic Research, Venkata Ratnam, C. S. (1999). 'Competitive Industrial
Working Paper No. 6252. Relations Policies in Indian States', in Agenda for
Sandesara, J. C. (1988). 'Small Industry Development Change: The Needfor Law Reform, March 1999, Rajiv
Programmes in India-Efficiency Explanations and Gandhi Institute for Contemporary Studies, New
Lessons: Some Field Studies', in K. B. Surn (ed.), Small Delhi.Scale Enterprises in Industrial Development: The Indian Wade, R. (1985). 'The Market for Public Office: Why the
Experience, Sage Publications, New Delhi. Indian State is not better at Development', World
Shleifer, A. Andrei, and R. W. Vishny (1993). 'Corrup- Development, vol. 13, no. 4.
tion', Quarterly Journal of Economics, vol. 108, Wei, S. (1999). 'Corruption in Economic Development
pp. 599-617. Beneficial Grease, Minor Annoyance, or Major

138 * Bibliography
Obstacle?, Policy Research Working Paper No. 2048, Reformingfor Growth and Poverty Reduction, WorldWorld Bank, Washington, DC. Bank, Washington, DC.
Weingast, B. (1993). 'The Political Foundations of De- (1998b). Reducing Poverty in India-'-Options formocracy and the Rule of Law', Working Paper More Effective Public Services, World Bank, Washing-No. 54, Center for Institutional Reform and The ton, DC.Informal Sector, University of Maryland, College (1998c). World Developnment Indicators 1998,Park, Maryland. World Bank, Washington, DC.
Wolfensohn, J. D. (1998). Address to the World Bank- (1998d). 'India: Wasting Away: The Crisis ofIMF Annual Meetings. Malnutrition', Report No. 18667-IN, World Bank,
World Bank (1988). Road Deterioration in Developing Washington, DC.Countries: Causes and Remedies, World Bank, Wash- (1999a). Indonesia: Country Assistance Strategy,ington, DC. processed, World Bank.
(1989). World Development Report 1989, World - (1999b). 'India: Towards Rural DevelopmentBank, Washington, DC. and Poverty Reduction', vol. I (Summary) and vol. II
(1993). The EastAsian Miracle-Economic Growth (Main Report and Annexes), Report no. 18921-IN,and Public Policy, Oxford University Press for World World Bank, Washington, DC.Bank, New York. (1999c). World Development Indicators 1999,
(1994). World Development Report 1994,World World Bank, Washington, DC.Bank, Washington, DC. (1999d). 'Health and Poverty in Fact Sheets,
(1995a). TheEmergingAsian BondMarket, World India 1992-3', India Poverty Consultation Work-Bank, Washington, DC. shop, processed, World Bank.
(1995b). Bureaucrats in Business, Oxford Univer- (1999e). Global Development Finance, Worldsity Press for World Bank, Washington, DC. Bank, Washington, DC.
=- (1995c). World Development Report 1995, World (19990. 'Corporate Governance and Develop-Bank, Washington DC. ment', processed, World Bank.
(1996a). India: Five Years of Stabilization and World Economic Forum (1998). The Global Competitive-Reforms and the Challenges Ahead, World Bank, ness Report 1998, World Economic Forum, Geneva.Washington, DC. Yagci, F. (1998). 'India-Narrowing Inter-state Disparities
(1996b). 'Indonesia: Dimensions of Economic in Economic Growth and Social Development-AGrowth', Report No.15383-IND, World Bank, Wash- Reform Agenda', processed, World Bank.ington, DC. Yaron, J. (1994). 'What Makes Rural Finance Institutions
(1997a). India: Achievements and Challenges in Successful', World Bank Research Observer, vol. 9,Reducing Poverty, World Bank, Washington, DC. no. 1, pp. 49-70.
(1997b). The State in a Changing World, Oxford Yaron, J., M. P. Benjamin, and G. L. Piprek (1997). RuralUniversity Press, New York. Finance: Issues Design, and Best Practices, World Bank,
-~ (1997c). Primary Education in India, World Washington, DC.Bank, Washington, DC. Yeats, A. J. (1999). 'The East Asian Economic Crisis: Was
(1997d). 'New Directions in Health Sector the Region's Export Performance a Factor', WorldDevelopment at the State Level: An Operational Bank.Perspective', Report No. 15753-IN, World Bank, Young, M. E. (1996). Early Child Development: InvestingWashington, DC. in the Future, World Bank, Washington, DC.
(1997e). 'India: Cotton and Textile Industries: Yugandhar, B. N. (1998). 'Capacity Development in PublicReforming to Compete', Report No. 16347-IN, World Administration in India', Indian Institute of PublicBank, Washington, DC. Administration, processed, World Bank.
(1998a). India: 1998 Macroeconomic Update-

ANNEX TABLES


Annex Tables * 141
ANNEX TABLE 1.1Poverty in India 1951-97
(with correction for CPIAL)(Poverty line = Rs 49 per capita per month at Oct. 1973-Jun. 1974 rural prices)
NSS Survey period Headcount Index Poverty Gap Index Squared Poverty Gap Indexround Rural Urban National Rural Urban National Rural Urban National
3 Aug. 1951-Nov. 1952 47.37 35.46 45.31 16.05 11.14 15.20 7.53 4.82 7.064 Apr. 1952-Sep. 1952 43.87 36.71 42.63 14.64 10.91 13.99 6.71 4.41 6.315 Dec. 1952-Mar. 1953 48.21 40.14 46.80 16.29 13.25 15.76 7.56 5.96 7.286 May 1953-Sep. 1953 54.13 42.77 52.15 19.03 13.83 18.12 9.12 6.29 8.627 Oct. 1953-Mar. 1954 61.29 49.92 59.30 21.95 17.24 21.12 10.26 7.74 9.828 Jul. 1954-Mar. 1955 64.24 46.19 61.07 25.04 15.76 23.41 12.50 7.02 11.549 May 1955-Nov. 1955 51.83 43.92 50.44 18.44 14.65 17.78 8.80 6.40 8.38
10 Dec. 1955-May 1956 48.34 43.15 47.43 15.65 13.34 15.24 6.71 5.41 6.4811 Aug. 1956-Feb. 1957 58.86 51.45 57.55 19.45 18.16 19.22 8.50 8.51 8.5012 Mar. 1957-Aug. 1957 62.11 48.88 59.77 21.69 16.31 20.73 10.01 7.25 9.5213 Sep. 1957-May 1958 55.16 47.75 53.84 19.01 15.95 18.47 8.78 7.00 8.4614 Jul. 1958-Jun. 1959 53.26 44.76 51.75 17.74 13.75 17.03 7.88 5.87 7.5215 Jul. 1959-Jun. 1960 50.89 49.17 50.58 15.29 15.83 15.39 6.13 6.75 6.2416 Jul. 1960-Aug. 1961 45.40 44.65 45.27 13.60 13.84 13.64 5.53 5.83 5.5917 Sep. 1961-Jul. 1962 47.20 43.55 46.54 13.60 13.79 13.64 5.31 6.05 5.4518 Feb. 1963-Jan. 1964 48.53 44.83 47.85 13.88 13.29 13.77 5.49 5.17 5.4319 Jul. 1964-Jun. 1965 53.66 48.78 52.75 16.08 15.24 15.93 6.60 6.38 6.5620 Jul. 1965-Jun. 1966 57.60 52.90 56.71 17.97 16.82 17.75 7.60 6.98 7.4921 Jul. 1966-Jun. 1967 64.30 52.24 62.00 22.01 16.81 21.02 10.01 7.19 9.4722 Jul. 1967-Jun. 1968 63.67 52.91 61.60 21.80 16.93 20.86 9.85 7.22 9.3523 Jul. 1968-Jun. 1969 59.00 49.29 57.11 18.96 15.54 18.29 8.17 6.54 7.8524 Jul. 1969-Jun. 1970 57.61 47.16 55.56 18.24 14.32 17.47 7.73 5.86 7.3625 Jul. 1970-Jun. 1971 54.84 44.98 52.88 16.55 13.35 15.91 6.80 5.35 6.5127 Oct. 1972-Sep. 1973 55.36 45.67 53.37 17.35 13.46 16.55 7.33 5.26 6.9028 Oct. 1973-Jun. 1974 55.72 47.96 54.10 17.18 13.60 16.43 7.13 5.22 6.7332 Jul. 1977-Jun. 1978 50.60 40.50 48.36 15.03 11.69 14.28 6.06 4.53 5.7238 Jan. 1983-Dec. 1983 45.31 35.65 43.00 12.65 9.52 11.90 4.84 3.56 4.5342 Jul. 1986-Jun. 1987 38.81 34.29 37.69 10.01 9.10 9.79 3.70 3.40 3.6343 Jul. 1987-Jun. 1988 39.23 36.20 38.47 9.28 9.12 9.24 2.98 3.06 3.0044 Jul. 1988-Jun. 1989 39.06 36.60 38.44 9.50 9.54 9.51 3.29 3.29 3.2945 Jul. 1989-Jun. 1990 34.30 33.40 34.07 7.80 8.51 7.98 2.58 3.04 2.6946 Jul. 1990-Jun. 1991 36.43 32.76 35.49 8.64 8.51 8.61 2.93 3.12 2.9847 Jul. 1991-Dec. 1991 37.42 33.23 36.34 8.29 8.24 8.28 2.68 2.90 2.7448 Jan. 1992-Dec. 1992 43.47 33.73 40.93 10.88 8.82 10.35 3.81 3.19 3.6550 Jul. 1993-Jun. 1994 36.66 30.51 35.04 8.39 7.41 8.13 2.79 2.42 2.6951 Jul. 1994-Jun. 1995 39.75 33.50 38.40 8.89 8.38 - 2.90 2.80 -
52 Jul. 1995-Jun. 1996 37.46 28.04 35.00 8.31 6.78 - 2.64 2.2253 Jan. 1997-Dec. 1997 35.69 29.99 34.40 8.39 7.77 - 2.83 2.73
Note: All poverty measures are expressed as percentage.
Source: Datt (1997 and 1999)
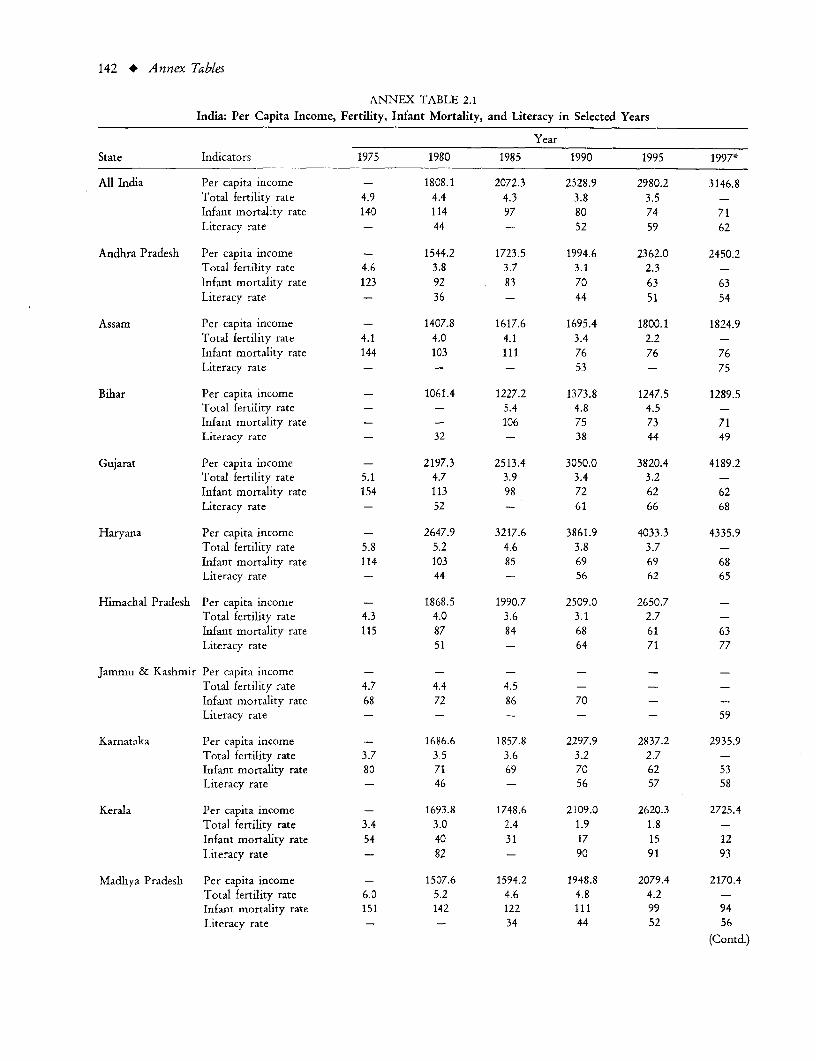
142 * Annex Tables
ANNEX TABLE 2.1
India: Per Capita Income, Fertility, Infant Mortality, and Literacy in Selected Years
Year
State Indicators 1975 1980 1985 1990 1995 1997*
All India Per capita income - 1808.1 2072.3 2528.9 2980.2 3146.8
Total fertility rate 4.9 4.4 4.3 3.8 3.5 -
Infant mortality rate 140 114 97 80 74 71Literacy rate - 44 - 52 59 62
Andhra Pradesh Per capita income - 1544.2 1723.5 1994.6 2362.0 2450.2Total fertility rate 4.6 3.8 3.7 3.1 2.3 -
Infant mortality rate 123 92 83 70 63 63Literacy rate - 36 - 44 51 54
Assam Per capita income - 1407.8 1617.6 1695.4 1800.1 1824.9Total fertility rate 4.1 4.0 4.1 3.4 2.2 -
Infant mortality rate 144 103 111 76 76 76Literacy rate - - - 53 - 75
Bihar Per capita income - 1061.4 1227.2 1373.8 1247.5 1289.5Total fertility rate - - 5.4 4.8 4.5 -
Infant mortality rate - - 106 75 73 71Literacy rate - 32 - 38 44 49
Gujarat Per capita income - 2197.3 2513.4 3050.0 3820.4 4189.2Total fertility rate 5.1 4.7 3.9 3.4 3.2 -
Infant mortality rate 154 113 98 72 62 62Litcracy rate - 52 - 61 66 68
Haryana Per capita income - 2647.9 3217.6 3861.9 4033.3 4335.9Total fertility rate 5.8 5.2 4.6 3.8 3.7 -
Infant mortality rate 114 103 85 69 69 68Literacy rate - 44 - 56 62 65
Himachal Pradesh Per capita income - 1868.5 1990.7 2509.0 2650.7 -
Total fertility rate 4.3 4.0 3.6 3.1 2.7 -
Infant mortality rate 115 87 84 68 61 63Literacy rate 51 - 64 71 77
Jammu & Kashmir Per capita income - - - - - -
Total fertility rate 4.7 4.4 4.5 - -
Infant mortality rate 68 72 86 70 - -
Literacy rate - - - - - 59
Karnataka Per capita income - 1686.6 1857.8 2297.9 2837.2 2935.9Total fertility rate 3.7 3.5 3.6 3.2 2.7 -
Infant mortality rate 80 71 69 70 62 53Literacy rate - 46 - 56 57 58
Kerala Per capita income - 1693.8 1748.6 2109.0 2620.3 2725.4Total fertility rate 3.4 3.0 2.4 1.9 1.8 -
Infant mortality rate 54 40 31 17 15 12Literacy rate - 82 - 90 91 93
Madhya Pradesh Per capita income - 1507.6 1594.2 1948.8 2079.4 2170.4Total fertility rate 6.0 5.2 4.6 4.8 4.2 -
Infant mortality rate 151 142 122 111 99 94Literacy rate - - 34 44 52 56
(Contd.)

Annex Tables * 143
YearState Indicators 1975 1980 1985 1990 1995 1997*
Maharashtra Per capita income - 2675.5 2956.0 3819.2 5101.7 5395.9Total fertility rate 4.3 3.7 3.5 3.2 2.9 -Infant mortality rate 92 75 68 58 55 47Literacy rate - 56 - 65 72 74
Orissa Per capita income - 1417.2 1566.2 1553.0 1837.3 1851.7Total fertility rate 4.6 4.1 3.8 3.5 3.3 -Infant mortality rate 149 143 132 122 103 96Literacy rate - 41 - 49 - 51
Punjab Per capita income - 3017.7 3640.3 4161.0 4695.9 4929.4Total fertility rate 4.7 4.0 3.5 3.2 2.9 -
Infant mortality rate 98 89 71 61 54 51Literacy rate - 48 - 59 66 67
Rajasthan Per capita income - 1368.2 1522.5 2172.3 2238.4 2486.5Total fertility rate 5.4 5.6 5.5 4.5 4.4 -Infant mortality rate 155 105 108 84 86 85Literacy rate - 30 - 39 48 55
Tamil Nadu Per capita income - 1679.8 2054.9 2512.6 3140.5 3249.3Total fertility rate 3.8 3.4 2.2 2.3 2.2 -Infant mortality rate 112 93 81 59 54 53Literacy rate - 54 - 63 66 70
Uttar Pradesh Per capita income - 1416.4 1541.6 1842.7 1837.8 1932.1Total fertility rate 6.6 5.9 5.6 5.2 5.0 -Infant mortality rate 198 159 142 99 86 85Literacy rate - 33 - 42 50 56
West Bengal Per capita income - 1913.4 2081.8 2345.5 2944.1 3122.4Total fertility rate - - 3.7 3.4 2.8 -Infant mortality rate - - 74 63 58 55Literacy rate - 49 - 58 66 72
* For per capita income, the data pertains to the year 1996.
Notes:1. Per capita income is in 1980-1 rupees; in 1996, per capita income for All India in current prices was Rs 12,182.7 (US $ 343.8),
and in terms of PPP (purchasing power parity) was US $ 1467.8 (calculated using a conversion factor of 8.3 from the WorldDevelopment Indicators).
2. Total fertility is the expected number of children a woman would bear in her lifetime with the prevailing age-specific fertilityrate.
3. Infant mortality is expressed per thousand live births.
4. Literacy rate is percentage of persons over 7 years of age who can read and write a simple sentence in any language withunderstanding. Data for 1980 are collected during 1981; 1990 during 1991; and 1995 during 1995-6.
Source: Registrar General of India, Sample Registration System; National Sample Survey Organization; Central StatisticalOrganization (CSO); CSO, Working Force Estimates:1993-4, A Methodological Note.

144 * Annex Tables
ANNEX TABLE 3.1Fiscal Deficit and Debt Stock: Fourteen Major States
(per cent of State GDP'*)
Average 1991-2 1992-3 1993-4 1994-5 1995-6 1996-7 1997-8 1998-9 Average1985-90 RE BE 1991-7
Maharashtra Fiscal deficit 3.2 2.2 2.8 2.1 2.3 2.8 2.9 2.4 3.3 2.5Debt 16.7 15.5 14.0 13.2 12.9 12.3 12.9 13.2 15.0 13.4
Pu'njab Fiscal deficit 5.8 4.8 4.8 4.8 5.0 3.4 3.2 4.3 4.6 4.3Debt 30.9 34.6 36.0 33.9 34.3 34.0 33.3 32.5 35.0 34.1
Haryana Fiscal deficit 3.0 2.3 2.6 2.3 2.2 3.6 3.3 2.7 5.8 2.7Debt 21.8 19.5 20.6 20.1 19.3 20.9 19.4 19.8 23.5 20.0
Gujarat Fiscal deficit 4.8 6.1 2.9 1.2 2.2 2.9 3.3 3.3 2.4 3.1Debt 21.4 23.1 19.5 19.2 16.5 18.3 17.8 17.9 17.2 18.9
West Bengal Fiscal deficit 2.8 2.8 2.3 3.4 3.3 3.9 4.3 5.6 4.3 3.7Debt 21.7 22.2 22.8 22.8 21.9 22.4 23.2 25.1 26.5 22.9
Karnataka Fiscal deficit 3.4 3.0 4.2 3.3 3.4 2.9 3.4 2.4 2.9 3.2Debt 20.7 17.7 18.6 19.1 19.6 19.4 20.0 20.1 19.8 19.2
Kerala Fiscal deficit 4.7 4.6 3.7 4.2 4.1 4.3 4.6 7.3 4.5 4.7Debt 29.3 29.6 29.6 32.0 32.7 33.7 34.2 34.8 29.8 32.4
Tamil Nadu Fiscal deficit 3.0 3.5 4.1 2.6 2.5 1.9 3.1 3.1 4.7 3.0Debt 16.8 17.7 18.0 18.0 18.4 18.6 18.2 18.8 20.0 18.2
AndhraPradesh Fiscal deficit 3.2 2.7 3.6 3.4 3.8 3.4 3.5 3.0 2.9 3.3
Debt 21.5 19.0 20.8 20.6 20.8 21.1 20.9 21.5 22.9 20.7MadhyaPradesh Fiscal deficit 3.6 3.0 2.4 2.2 2.9 3.0 3.0 3.2 4.6 2.8
Debt 23.6 23.3 22.5 21.4 21.5 22.3 22.2 22.6 25.4 22.3Uttar Pradesh Fiscal deficit 4.5 4.4 5.2 4.0 4.5 4.3 5.1 8.6 7.2 5.2
Debt 26.4 27.3 28.4 29.0 29.5 29.7 29.3 30.9 32.4 29.2Orissa Fiscal deficit 5.5 6.5 4.9 5.2 5.7 5.8 6.9 6.3 9.4 5.9
Debt 36.6 37.6 40.5 40.2 39.0 39.0 45.9 45.8 48.9 41.2Rajasthan Fiscal deficit 4.7 3.4 4.3 5.2 5.1 6.7 5.3 4.9 6.2 5.0
Debt 33.5 28.4 27.4 30.5 29.3 31.5 30.1 31.9 33.8 29.9Bihar Fiscal deficit 3.8 5.5 4.2 3.6 3.2 3.8 2.0 6.2 8.2 4.1
Debt 33.1 36.6 38.2 36.8 36.5 40.2 40.0 42.0 38.6 38.6
* In case of the states, the GSDP series pertains to the old base (1980-1) as it is not available at the new base (1993-4).Note: 'Debt' refers to the stock of outstanding debt at end-March.Source: RBI, Supplement to the RBI Bulletin on Finances of State Governments, various issues; World Bank staff estimates.

ANNEX TABLE 4.1International Comparisons of Selected Governance Indicators
India Dev. Selected large economies South East Asia South Industrial countries Full sample Dev.% % Score coun. China Brazil Mexico Poland South Indo- Thai- Asia' UK US Sample Confidence int. (95°h) Sample coun.
rank in rank in score Africa nesia land (excl. ave. lower upper size samplesample' dev. India) size
coun.b
I. GOVERNANCE INDICATORS, 1995, SCALE 0 (LOWEST)-6 (HiGHEST3
Average rank 51 65 - - - - - - - - - - -_
i) Gozvernment effectiveness
and stability - 44C 34' 37C - - - - - - - - - - - - -Socio-economicconditions (ICRG)' 54 71 2.5 2.2 3.5 3.0 2.5 2.5 2.5 2.0 2.5 2.8 5.0 4.0 2.7 2.5 2.9 130 97Institutional stability(GCR) 31 56 4.3 4.1 4.4 5.2 3.5 4.1 3.5 4.0 3.8 5.0 5.2 5.7 4.8 4.6 5.0 58 32Government stability(aCRG)2 4 5 3.5 4.8 5.5 5.0 5.0 5.0 5.5 4.5 4.5 4.8 5.5 4.5 4.9 4.8 5.0 130 97
ii) Rule of law andbusiness environment - 65' - 3.1' - - - - - - - - - - - - - - -
Law and order 58 71 4.0 3.7 5.0 2.0 3.0 5.0 2.0 3.0 5.0 3.0 6.0 6.0 4.1 3.9 4.3 130 97Property rights and rule-basedgovernance (CPIA)3 79 79 - 3.5 3.5 (avg.)* 3.3 (avg.)* 3.1 - - - - - - 135Contract enforceability(BERI)4 40 70 3.0 2.9 3.0 2.4 - 3.0 3.8 2.7 3.5 2.4 5.3 5.3 - - - - -Nationalization risk (BE.I)5 30 63 3.3 3.2 2.9 2.7 - 3.0 4.5 3.6 3.9 2.6 4.4 5.0 - - - - -Infrastructure Quality (BERI)6 40 63 2.6 2.6 2.4 2.3 - 1.5 4.7 2.3 3.0 2.3 4.1 4.8 3.2 2.9 3.4 130 97
Corruption and irregularpayments 37 43 2.4 2.8 2.5 2.9 2.7 3.6 3.7 1.4 2.0 2.9 5.3 4.6 4.4 - - - -
Corruption, 1998 (higherscale means less)(TI)7 22 22 1.7 - 2.1 2.4 2.0 2.8 3.1 1.2 1.8 2.7 5.2 4.5 4.9 4.4 5.4 85 -
Corruption (ICRG) 74 74 3.0 2.8 2.0 3.0 3.0 5.0 4.0 1.0 2.0 3.0 5.0 4.0 - - - - 97Iregular Payments (higher
scale means less)(GCR)5 16 34 2.5 2.9 3.3 3.2 3.1 2.9 3.9 2.1 2.2 - 5.6 5.3 4.0 3.6 4.3 58 32
iii) General publicadministration - 73' - 2.7' - -
Bureaucracy quality (ICRG)9 82 97 4.5 2.9 3.0 3.0 4.5 4.5 4.5 3.0 3.0 3.0 6.0 6.0 3.6 3.3 3.9 130Strength of civil service(GCR)10 59 91 4.5 3.5 3.6 4.3 3.8 3.4 3.4 4.0 4.5 - 5.5 5.3 4.4 4.1 4.6 58 32Exposure to politicalinterference (WCR) 18 30 1.3 1.5 - 1.2 1.4 1.2 1.4 1.6 1.4 - 3.0 2.4 2.0 1.9 2.5 45 17
(Contd.)
145
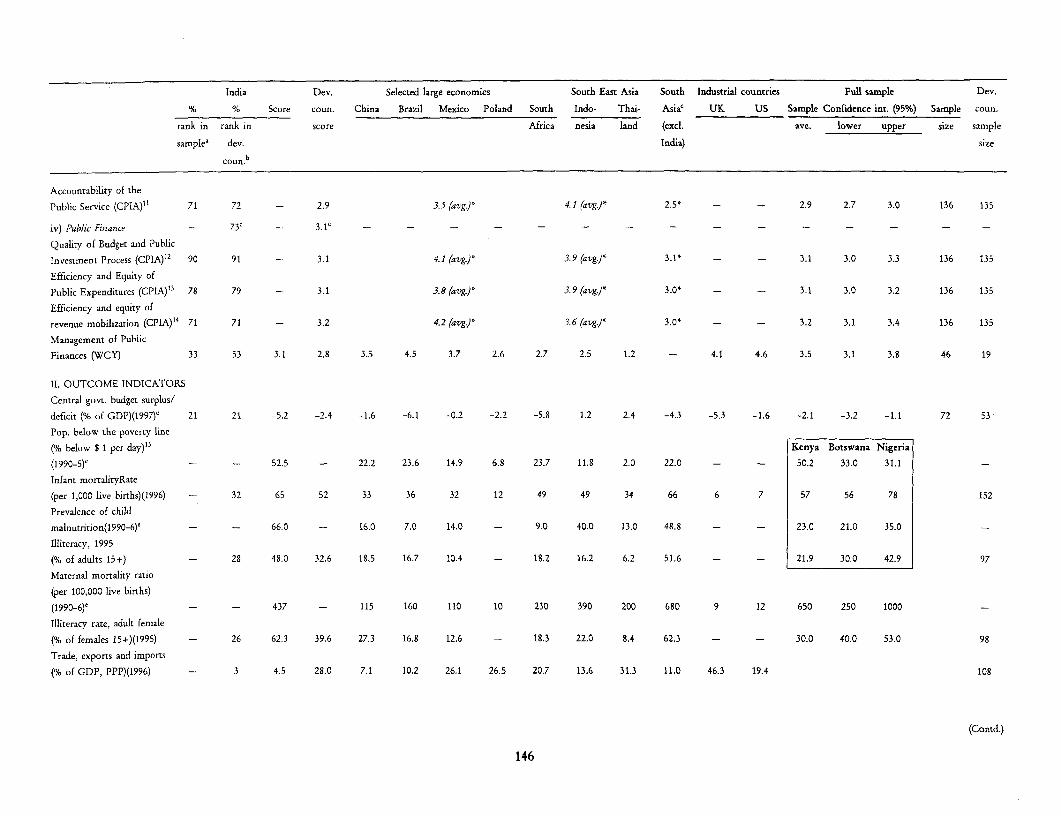
India Dev. Selected large economies South East Asia South Industrial countries Full sample Dev.
% % Score coun. China Brazil Mexico Poland South Indo- Thai- Asia' UK US Sample Conmidence int. (95%) Sample coun.
rank in rank in score Africa nesia land (excl. ave. lower upper size sample
samplea dev. India) size
Accountability of the
Public Service (CPIA)'" 71 72 - 2.9 3.5 (avg.J) 4.1 (avg.)" 2.5* - - 2.9 2.7 3.0 136 135
iv) Public Finance - 73c - 3.1c - - _ - - _ _ _ _ _ _ _
Quality of Budget and Public
Investment Process (CPIA)"2 90 91 - 3.1 4.1 (avg.)* 3.9 (avg.)' 3.1* - - 3.1 3.0 3.3 136 135
Efficiency and Equity of
Public Expenditures (CPIA)13 78 79 - 3.1 3.8 (avg.)' 3.9 (avg.)* 3.0* - - 3.1 3.0 3.2 136 135
Efficiency and equity of
revenue mobilization (CPIA)14 71 71 - 3.2 4.2 (avg.) 3.6 (avg.)J 3.0* - - 3.2 3.1 3.4 136 135
Management of Public
Finances (WCY) 33 53 3.1 2.8 3.5 4.5 3.7 2.6 2.7 2.5 1.2 - 4.1 4.6 3.5 3.1 3.8 46 19
11. OUTCOME INDICATORS
Central govt. budget surplus/
deficit (°/< of GDP)(1997)d 21 21 -5.2 -2.4 -1.6 -6.1 -0.2 -2.2 -5.8 1.2 2.4 -4.3 -5.3 -1.6 -2.1 -3.2 -1.1 72 53
Pop. below the poverty line
(% below $1 per day) 15 Kenya Botswana Nigeria
(1990-5)' - - 52.5 - 22.2 23.6 14.9 6.8 23.7 11.8 2.0 22.0 - - 50.2 33.0 31.1 _
Infant mortalityRate
(per 1,000 live births)(1996) - 32 65 52 33 36 32 12 49 49 34 66 6 7 57 56 78 152
Prevalence of child
malnutrition(1990-6)' - - 66.0 - 16.0 7.0 14.0 - 9.0 40.0 13.0 48.8 - - 23.0 21.0 35.0
Illiteracy, 1995
(% of adults 15+) - 28 48.0 32.6 18.5 16.7 10.4 - 18.2 16.2 6.2 51.6 - - 21.9 30.0 42.9 97
Maternal mortality ratio
(per 100,000 live births)
(1990-6)' - - 437 - 115 160 110 10 230 390 200 680 9 12 650 250 1000 -
Illiteracy rate, adult female
(% of females 15+)(1995) - 26 62.3 39.6 27.3 16.8 12.6 - 18.3 22.0 8.4 62.3 - - 30.0 40.0 53.0 98
Trade, exports and imports
(% of GDP, PPP)(1996) - 3 4.5 28.0 7.1 10.2 26.1 26.5 20.7 13.6 31.3 11.0 46.3 19.4 108
(C{ntd.)
146

India Dev. Selected large economies South East Asia South Industrial countries Full sample Dev.
% % Score coun. China Brazil Mexico Poland South Indo- Thai- Asia' UK US Sample Confidence int. (95%) Sample coun.
rank in rank in score Africa nesia land (excl. ave. lower upper size sample
sample' dev. India) size
coun.b
Liquid liabilities (M3)
as % of GDP(1996) - 77 49.3 37.8 112.2 27.2 27.9 37.2 57.7 52.5 79.5 40.7 - 61.4 112
Average credit rating (1997)16 - - 59.0 46.7 68.0 55.8 59.3 65.1 62.7 62.3 66.0 42.4 89.8 91.0
Memo:
GNP per capita, PPP (1995) 23 29 1580 3609 3330 6340 7660 6000 7450 3310 6700 1498 19,960 28,020 6859 5566 8049 132 106
General govt. expenditure
(%6 of GDP) 33 61 30.1 27.0 11.7 33.8 14.1 52.2 52.7 17.0 16.2 - 53.7 41.3 41.7 35.9 47.6 45.0 18
* regional averages; South East Asia includes Indonesia, Thailand, Malaysia, and Philippines; South Asia includes Bangladesh, Maldives, Nepal, Pakistan, and Sri Lanka.
a percentile rank excluding South Asia, 100 signifies best.
b low- and middle-income countries.
c unweighted average.
d re-scaled for Fig. 4.1 using the formula: 6*{[xi+absolute(min(xi...xn))]/[max(xi...xn)+absolute(min(xi...xn))])
data are for most recent year available.
I general public satisfaction/dissatisfaction with the government's economic policies; socio-economic factors are identified which have the greatest political impact for the country being assessed.
2 government's ability to carry out its declared programme(s) and its ability to stay in office.
3 extent to which private economic activity is facilitated by a rule-based governance structure.
4 degree to which contractual agreements are honoured and complications presented by language and mentality differences.
5 measures 'expropriation for no compensation' and 'preferential treatment for nationals'.
6 facilities for and ease of communication between headquarters and the operation, and within the country, and the quality of transportation, BERI.
7 perceptions of degree of corruption as seen by business people.
8 degree of irregular payments in business and official transactions.
9 mechanism for recruitment and training and autonomy of bureaucracy from political pressure.
0 the strength and expertise of the civil service to avoid'drastic interruptions in government service during political instability.
1 the degree to which accountability is ensured through audits, inspections etc., conflict of interest regulations for public servants are enforced, civil service promotion and recruitment are merit-based.
12 degree to which public expenditure and investment priorities are established by systematic and objective criteria; whether systems ensure that expenditures match budget allocations.
13 efficiency of expenditure balance between and within sectors, and between publicly and privately provided services.
14 tax structure (degree of distortionary taxes), revenue collection, tax administration.
5 at 1985 prices, adjusted for purchasing power parity.
16 average of ICRG, Institutional Investors, Euromoney ratings.
Sources: World Development Indicators 1998-9, World Bank; Yearbook of Labour Statistics 1998, International Labor Organisation; ICRG,International Country Risk Guide database; 'Structural trends in India's Manufactured. ExportPerformance: International Comparisons', S. Lall; BERI, Business Environment Risk Intelligence database; IRIS, Center for Institutional Reform and the Informal Sector database; WCY, World Competitiveness Yearbook; GCR,Global Competitiveness Report; CPIA, Country Policy Institution Indicators of the World Bank; TI, Transparency International, 1998.
147

148 * Annex Tables
ANNEX TABLE 4.2Efficiency of Government in Delivering Services
(percentage of respondents rating services under different categories)
Very Efficient Mostly Mostly Inefficient Very Average Index*efficient efficient inefficient inefficient sccre
Score 6 5 4 3 2 1 - -
Central govt now 1 10 33 33 14 9 3.24 100.0
Central govt 3 years ago 0 7 29 39 14 11 3.07 94.8
Regional govt now 6 8 27 31 17 11 3.22 99.4
Regional govt 3 years ago 2 6 25 31 19 17 2.90 89.5
General government in 1996as per 1996 survey 3.21 99.1
General government in 1986as per 1996 survey 2.35 72.5
* Average score of row as a percentage of average score for 'central government now'.
Source: World Bank-CII survey of 210 private sector firms, 1999 and World Bank Survey of 53 private sector firms, 1996.
ANNEX TABLE 4.3Quality, Integrity, and Efficiency of Public Service Delivered by Public Agencies
(percentage of respondent rating services under different categories)
Rank Very Good Slightly Slightly Bad Very Averagegood good bad bad score
Score 6 5 4 3 2 1 -
1 Armed forces 24 44 23 2 5 2 4.74
2 Telephone 3 41 30 15 9 2 4.08(a) Price 6 36 28 15 10 5 3.98 (3.64*)
(b) Availability 18 46 27 6 2 1 4.69 (2.72*)
3 Judiciary/courts 8 39 25 9 16 3 4.05
4 Income tax department 3 38 28 18 9 4 3.96
5 Water supply 4 35 31 17 8 5 3.95
6 Education services/schools 5 29 31 17 14 4 3.82
7 Customs service 3 29 28 19 16 5 3.69 (2.85)8 Electric power co. 4 32 23 17 15 9 3.66
9 Police 3 25 31 21 12 8 3.62
10 Excise dept 2 28 28 17 18 7 3.58State sales tax dept 2 28 27 19 17 7 3.58
Central govt 5 26 29 13 15 12 3.97 (3.21)
11 Public health care 3 19 29 18 18 13 3.32 (2.00)Parliament 5 16 19 21 20 19 3.08
12 Roads, PWD 1 16 15 21 31 16 2.87 (1.98)
Source: World Bank-CII survey of 210 private sector firms, 1999. Average scores in parentheses are from the World Bank Surveyof 53 firms, 1996, except for those marked with an asterisk(*).

Annex Tables * 149
ANNEX TABLE 4.4Predictability, Responsiveness, and Availability of Rules and Regulations
(percentage of respondent ratings under different categories)
Strongly Agree Slightly Slightly Disagree Strongly Average Averageagree agree disagree disagree score, score,
1999 1996
Score 6 5 4 3 2 1
Predictability of government rulesand regulations: Now 2 7 46 29 12 4 3.46 3.38
Predictability of government rulesand regulations: 3 years ago 2 4 35 33 21 5 3.18
Predictability of policy changes inthe annual central budget 2 3 45 33 9 8 3.32 NA
Advance information to firmsabout the changes affecting them 0 18 11 35 25 11 3.00 3.49
Taking into account concerns voicedby business or business associations 2 17 15 47 11 8 3.28 3.66
Easy availability of information onlaws and regulations 10 31 32 18 5 4 4.11 NA
Source: World Bank-CHI survey of 210 private sector firms, 1999 and World Bank Survey of 53 private sector firms, 1996.
ANNEX TABLE 4.5Efficiency of Court System in Resolving Business Disputes
(percentage of respondent ratings under different categories)
Strongly Mostly Tend to Tend to Mostly Strongly Averageagree agree agree disagree disagree disagree score
Score 6 5 4 3 2 1 -
Fair and Impartial 23 40 15 16 4 2 4.56
Honest/Uncorrupt 13 38 19 18 6 6 4.16
Capable of enforcing decisions 19 19 17 23 17 5 3.85
Consistent 7 26 25 21 15 6 3.71
Affordable 10 16 10 26 24 14 3.20
Quick 5 3 4 18 32 38 2.17
Confident that legal system will uphold contracts and property rights in business disputes:
Now 20 37 26 8 7 2 4.49
3 years ago 18 34 25 11 8 4 4.31
Source: World Bank-CGI survey of 210 private sector firms, 1999,

150 * Annex Tables
ANNEX TABLE 4.6Obstacles in the Operation and Growth of Business
(percentage of respondent ratings obstacles under different categories)
1999 Obstacles in the operation and None Moderate' Average, Average, 1996rank growth of business major 1999 survey 1996 survey rank
1 Inflation 7 68 4.12 3.72 6
2 Labor regulation 12 64 4.03 3.96 4
3 Corruption 7 60 3.97 4.40 3
4 Infrastructure 11 62 3.95 5.09 1
5 Policy instability/uncertainty 6 57 3.95 3.38 8
6 Financing 23 52 3.57 3.69 7
7 Customs administration 14 50 3.52 4.42* 2
8 Customs duties 16 49 3.45 4.42* 2
9 Income tax administration 20 41 3.18 4.42* 2
10 Income taxes 18 39 3.12 4.42* 2
11 Other taxes 17 38 3.12 4.42* 2
12 Environmental regulations 24 40 3.07 3.24 11
13 Foreign currency/exchange regulations 24 35 3.02 3.89 5
14 Import restrictions 33 31 2.77 3.26 10
15 Functioning of judiciary 35 29 2.67 NA NA
16 Street crime/theft/disorder 29 23 2.65 NA NA
17 Business Licensing 42 26 2.52 3.30 9
18 Organized crime 34 22 2.52 NA NA
* 1996 World bank Survey score for 'tax regulation and/or high taxes': 4.42.+Score: None =0, Minor obstacle=2, Moderate=4, Major=6.
Source: World Bank-CII survey of 210 private sector firms, 1999 and World Bank Survey of 53 private sector firms, 1996.

Annex Tables * 151
ANNEX TABLE 4.7(a) Payment of Bribes
(percentage of respondents rating services under different categories)
Always Usually Frequently Sometimes Seldom Never Average Averagescore score1999 1996
It is common to pay irregularadditional payments to getthings done 15 19 21 28 6 11 3.24 3.00
Score 1 2 3 4 5 6 - -
It is known in advance howmuch the additional payment is 2 17 16 43 16 8 3.30 3.60
Score 6 5 4 3 2 1 - -
If a firm pays the required'additional payment' the serviceis usually delivered 12 36 28 18 - 5 4.29 3.47Score 6 5 4 3 - 2 - -
(b) Extra Unofficial Payments to Public Officials
Electricity/telephone connections 16 17 12 21 10 24 3.64Licences/permits 14 15 14 28 16 13 3.56Income tax officials 18 13 14 31 10 14 3.44Customs officials 16 23 10 22 15 14 3.39Government contracts 11 24 15 24 17 9 3.39
(c) Percentage of Contract Value in Additional or Unofficial Payment to Secure Government Contracts
Percentage of contract value 0 0-1 2-9 10-17 18-25 25+ AveragePercentage of respondents 22 15 54 4 3 2 4.80
Source: World Bank-CII survey of 210 private sector firms, 1999 and World Bank Survey of 53 private sector firms, 1996.

152 * Annex Tables
ANNEX TABLE 4.8Summary Evaluation of Budget and Financial Management Practices
1-Inadequate5-Adequate10-Excellent
Budget:
Comprehensive 7
Based on reliable data and estimates 2
Has medium-term perspective 1
Linked to macroeconomic policy 2
Links planning & resource allocation 7
Capital and recurrent expenditure well integrated 2
Links between policy and resources are transparent 4
Trade-offs within spending constraints 2
Effectively controls spending aggregates 1
Is implemented as initially authorized 5
Is adopted on a timely basis 3
Controls items of expenditure 3
Provides incentives for efficiency 1
Uses performance measures 1
Financial management:
Based on accounting standards 7
Efficient cash management 5
Timely disbursement of budgeted funds 3
Accountability for expenditure 1
Internal control systems 3
Audit of expenditure (professional, timely reporting) 7
Budget/accounting is consistent 8
Procurement is transparent and competitive 7

ANNEX TABLE 4.9
Public Financial Management (PFM): Evaluation of Outputs and Outcomes'
Aggregate fiscal discipline Strategic prioritization Operational effectiveness and efficiency
PFM outputs PFM outcomes PFM outputs PFM outcomes PFM outputs PFM outcomes
Institutional * Medium-term expenditure . Revenue/ * Budgetary planning * Expenditure matched . Relative line agency Efficient service
arrangements framework? NO expenditure consultative with to strategic goals? NO autonorimy? NO delivery? NO
* Hard budget constraint? NO target achieved? stakeholders? PARTLY
* Comprehensive budget? NO . Strategic targets linked
LARGELY to allocations? PARTLY* Line agency allocation
discretion? NO
Accountability * Ex post reconciliation of * Limited agency * Outcomes reported? * Clear responsibility * Internal and external
expenditure? YES overspending? SOME mismatch? NO aucdit? YES
* Sanctions for agency over/ NO * Ex post evaluation of * Personnel policies
underspending? NO results? LIMITED performance based? NO
(INSTEAD, EX ANTE * Service delivery standards?
CONTROL) SOME
* Sanctions applied? NO * Customer satisfactionsurveys? FEW
Transparency * Publication of budget and * Adequate Stakeholder * Outcome performance * Programme performance
results? YES, PARTLY voice mechanisms? NO published? SOME publicized? SOME* Client voice mechanisms?
FEW
153

154 * Annex Tables
ANNEX TABLE 4.10Variations between Budget/Revised Estimates and Actuals
1991-2-1993-4 1994-5-1997-8
Average Variation (%) Average Variation (%)
Actuals as % of Actuals as % of Actuals as % of Actuals as % of
Budget Revised Budget Revised Budget Revised Budget Revised
Revenue receipts 93.5 97.7 7.4 2.6 100.3 98.9 9.5 2.9Tax revenue, Gross 93.8 97.8 8.4 2.8 100.8 99.6 7.4 2.6Non-tax revenue 104.4 99.3 1.8 2.5 100.7 97.6 4.5 1.2
Capital receipts 108.5 94.7 17.0 2.8 104.3 97.6 16.9 6.7Recoveries of loans 99.1 97.1 6.7 4.7 98.3 91.7 6.0 5.0Disinvestment 66.2 58.5 94.2 105.5 39.7 93.8 147.4 12.8Borrowings and other liabilities 115.1 96.6 27.1 2.8 111.4 98.4 16.3 7.5Total receipts 99.5 96.5 3.3 2.5 101.6 98.5 5.7 3.0
Non-plan expenditure 104.2 99.9 4.8 1.7 103.5 99.3 4.6 0.9On revenue account 104.8 99.5 2.5 1.4 101.4 99.4 2.4 1.1On capital account 103.0 102.5 19.0 6.8 117.1 98.4 17.9 1.4
Plan expenditure 100.5 95.5 7.6 3.8 99.3 96.8 5.6 1.1On revenue account 99.3 92.9 10.1 4.0 97.9 97.0 3.1 1.2On capital account 102.0 98.0 5.8 5.1 102.0 96.5 12.7 1.2
Total expenditure 103.1 98.5 4.7 0.2 102.2 98.6 3.0 0.9
Revenue expenditure 103.6 98.1 2.5 0.4 100.7 98.9 2.3 1.1Capital expenditure 102.2 99.8 11.4 0.9 108.1 97.5 6.2 0.4Revenue deficit 145.6 100.8 24.4 8.9 107.4 100.6 29.2 12.7Fiscal deficit 125.4 102.8 27.3 6.5 113.1 99.3 13.5 5.9
ANNEX TABLE 4.11Revenue Effect of Tax Concessions
(a) Major deductions from income tax under Chapter Vl-A and viIi of the Income Tax Act (company and non-company assessees)
1989-90 1994-5
Tax loss (%) 19.62 17.74Effective tax rate on gross income (/o) 18.94 17.86Effective tax rate loss due to Chapter VI-A and VIII deductions (percentage points) 04.62 03.85
(b) Customs exemptions1992-3 1995-6 1996-7
Exemptions Duty New Duty New Duty Newforgone notification foregone notification foregone notifications(Rs cr) (Rs cr) (Rs cr)
4 export promotion schemes NA - 8023 - 9189Other exemption notifications (total) 5081 415 2019 313 1113* 222Total (% of collections) 21.5 27.8 23.7*
Note: Data on income tax concessions for 1990-1 through 1993-4 were either incomplete or not available. Data for all assesseesinclude other categories of non-company assessees but may be biased due to non-random sampling.* Incomplete coverage
Source: All India Income Tax Statistics, various years and Reports of the CAG, 1997, 1998.

Annex Tables * 155
ANNEX TABLE 4.12Central Tax Revenue and Buoyancy
(a) Revenue as a percentage of Non-Agricultural GDP at Factor CostAverage for financial years Gross tax Corporation Personal income Customs Excise
revenue tax tax duties duties1989-90 to 1991-2 14.08 1.41 1.36 4.87 6.001994-5 to 1998-9RE 12.00 1.84 1.63 3.66 4.371999-2000BE 11.62 2.03 1.77 3.31 4.20(b) Buoyancy of Central Taxes with respect to Non-Agricultural Gross Domestic ProductAverage for financial years Gross tax Corporation Personal income Customs Excise
revenue tax tax duties duties1989-90 to 1991-2 0.926 1.346 1.050 0.743 0.8881994-5 to 1998-9RE 0.880 1.324 1.086 0.795 0.7021999-2000BE 1.313 0.995 1.724 1.260 1.384Notes: 1. To estimate NAGDP for 1998-9, the rate of real growth in agriculture is assumed to be 5.3 per cent and the rate of
real growth of NAGDP is assumed to be 5,8 per cent. Inflation rates are assumed the same.2. To estimate NAGDP for 1999-2000, the nominal rate of growth is assumed to be higher than nominal GDP growth
by the same per cent (about 1) as it was in the previous period.Source: Budget Documents and Economic Survey, GOI.

156 * Annex Tables
ANNEX TABLE 4.13Assessrnent of Tax Structure and Administration
Pre-reform Recent years Recent to pre-reformindex
(over 100 impliesimprovement inrecent years)*
I. PERFORMANCE
Tax Structure
Revenue adequacy: Level (Tax/NAGDP) 14.08 12.00 88Trend (NAGDP buoyancy) 0.93 0.88 95
Revenue stability (CV of buoyancy) 0.23 0.31 54Revenue predictability (actuals/budget ratio) 8.40 7.40 113Vertical balance: (ratio of centre's revenue adequacy to states') 1.24 1.24 100Economic neutrality 1 (rates)Personal income tax 16.80 11.71 143Corporation tax 35.43 27.34 130Excise duties 9.31 8.38 111
Import duties 41.00 27.00 143
Aggregate score
Economic neutrality 2 (concessions)Income tax: indiviudals 3.98 2.24 178
Companies 11.17 7.43 150Import duties: 21.50 27.80 77
Aggregate scoreEquity (share of direct taxes) 19.70 29.60 121Simplicity Laws are simple#Certainty (business survey; I = very good; 6 = very bad) 3.77 3.61 104Sectoral balance Exclusion of agriculture continues 100
unchanged
Tax administration':""
Administrative effectivenessIncome tax compliance 39.4 49.0 124Collection arrears (%o of collections) 36.8*'" 47.5 77
Administrative efficiencyBusiness survey (1 = very good; 6 = very bad) NA 3.1 NABusiness survey (index of ease of dealing with tax departments
in 1998-9 compared to three years ago) 100 102.2 102.2Collection cost to society per rupee of revenue#' NA NA NAAdministrative corruptionBusiness survey (% paying bribes 'sometimes', 'frequently',
,usually' or 'always' to income tax or custom officials) NA 74 NA
II. CAPACITY Comparing pre-reform and current status
External constraints Some improvement, poorCapacity of supporting institutions (appeals, courts) Some deterioration, inadequateCapacity of supporting institutions (tax professionals) Insufficient informationPolicy research capacity No change, inadequateAdministrative capacity l(training and skills) No change, adequateAdministrative capacity 2 (pay and career prospects) Some deterioration, inadequateAdministrative capacity 3 (automation) Some improvement, poor
(Contd.)

Annex Tables * 157
Pre-reform Recent years Recent to pre-reformindex
(over 100 impliesimprovement mnrecent years)*
III. INSTITUTIONS
Adequacy of external controls No change, poorParticipation No change, poorInstitutional flexibility 1 (tax policy inertia) No change, inadequateInstitutional flexibility 2 (functional and financial autonomy) No change, poorClarity of mission No change, inadequateAdequacy of internal controls No change, poorContestability No change, inadequateAdequate tax laws Some improvement, inadequateAdministrative incentives 1 (performance linked budget) No change, poorAdministrative incentives 2(performance based remuneration) Some deterioration, poorAdministrative organization l(number of tax agencies) No change, adequateAdministrative organization 2 (functional organization) No change, inadequateInternal rules No change, inadequateNon-compliance penalties No change, adequateError prevention No change, inadequate
@ Pre-reform: 1989-90 to 1991-2 where data are available; recent years 1994-5 to 1997-8/1998-9 where available. Full details arein Das-Gupta (1996).
F The index is the ratio of recent to pre-reform indicators or its inverse so that a higher value represents improvement. The ratiois calculated before rounding.While adequate quantitative data are not available, this is suggested by the number of direct tax (second) appeals and judicialreferences declining over the period for which data are available. Furthermore, while indirect tax appeals data are not alwaysreported, the number of customs and excise exemptions has been substantially reduced which should decrease appeals.
** Pertains to the period 1992-3 to 1994-5. Pre-reform figures are not readily available.; Collection costs given in the central budget amount to under 2 per cent of tax collections. However, these figures are incomplete
and underestimate true costs (as elaborated on in the background note).
ANNEX TABLE 4.14Facilitation Indicators for Import Containers, Selected Countries (1998)
Country Dwelling time in ports Custom clearance time Physical inspection (%)
India 10/25 days 48-120 hours 100
Pakistan - 48-120 hours 100Argentina 4/5 days 3 hours 30Indonesia - 48-96 hours 100Korea - 48-72 hours 100Malaysia - 8-24 hours Sample basisMexico - 12-24 hours Sample basisThailand - 48-72 hours 100Singapore - 15-25 hours Sample basis < 5Poland 7 days 24-48 hours 100

158 * Annex Tables
ANNEX TABLE 4.15Structure of Rural Local Government
State Village Panchayats Block level District level
Andhra Pradesh 20,244 1100 22Arunachal Pradesh 1158 79 12Assam 2486 199 23Bihar 11,653 589 52Goa 183 - 2Gujarat 13,256 183 19Haryana 5958 110 16Himachal Pradesh 2921 72 12Karnataka 5641 175 20Kerala 990 152 14Madhya Pradesh 30,922 459 45Maharashtra 26,894 297 29Manipur 166 9 3Punjab 11,591 136 14Rajasthan 9185 237 31Sikkim 148 - 4Tamil Nadu 12,787 387 22Tripura 525 16 3Uttar Pradesh 58,605 901 66Union Territories 177 7 7
Note: Meghalaya, Mizoram and Nagaland are not covered by the 73rd Constitutional Amendment.Legislation in conformity with the 73rd Amendment has yet to be taken up in Delhi which, accordingly,has no Panchayats.
Source: Mathur (1999).
ANNEX TABLE 4.16Decentralization to Local Government: A Report Card
Performance Capacity Institution building
Policy formulation * Largely unassessed * Inadequate * Limited autonomy* Incomplete functional and fiscal
devolution* Wide interstate differences
Accountability * Unassessed except in * Negligible - Inadequate or absent externalselected cities (Box 4.3) accountability provisions
Service delivery and * Poor where assessed * Very * Overlapping jurisdictionsrevenue collection * Some improvement in inadequate * Limiting involvement of civil society
selected cities (box 4.3) exceptin selected cities (Box 4.3) andstates
ANNEX TABLE 4.17Expenditure and Revenue Decentralization and Financial Autonomy of Rural Local Bodies, 1996-7
State Local govt. to state govt Local govt. to state govt Local revenue to localexpenditure ratio (%) own revenue ratio (%) expenditure ratio (%o)
Punjab 13.1 5.8 52.0Rajasthan 9.4 5.2 3.1
Source: Oommen (1998) quoted in Mathur (1999).

Annex Tables * 159
ANNEX TABLE 6.1Capital Employed per Worker in Domestic Industries Corresponding with
Principal Exports and Imports, 1994-5
I. Principal Exports
Economic Survey classification Corresponding ASI classification Capital/employee (Rs '000)
Average capital/employee, Exports 132
Labour intensive
1. Agricultural and allied products Food products 105Beverages 38
2. Ores and minerals (excl. coal) n.c.
3. Manufactured goods3.1. Textile fabrics and manufactures Textile products 74
Wool and silk textiles 263.1.1. Cotton yarn, fabrics, made-ups Cotton textiles 117
3.2. Coir yarn and manufactures n.c.3.3 Jute manuf. 'Mnc. yarn Jute textiles 303.4 Leather and leather manufactures Leather and leather products 763.5 Handicrafts n. c.
3.5.1. Gems and Jewellery n.c.3.6 Machinery, transport, and metal manuf. Machinery other than transport 170
Transport equipment and parts 156Metal products 137
Average capital/employee-labour intensive 93
Capital intensive
1. Manufactured Products1.1 Chemicals and allied products Chemicals and chemical products 526
2. Mineral fuels and lubricants (incl. coal) n.c.
Average Capital/employee-capital intensive 526
I. Principal Imports
Economic Survey classification Corresponding ASI classification Capital/employee (Rs '000)
Average capital/employee, Imports 362
Labour intensive
1. Capital goods1.1 Transport equipment Transport equipment and parts 1561.2 Manufactures of metals Metal products 1371.3 Non-electrical machinery Machinery other than transport 1701.4 Electrical machinery Machinery other than transport 170
Average capital/employee-labour intensive 158
Capital intensive
1. Food and live animals n.c.2. Raw materials and intermediate manuf.
2.1. Cashewnuts n. c.2.2. Crude rubber Rubber, petroleum, and coal products 4032.3. Fibres n.c.2.4. Petroleum, oil, and lubricants Rubber, petroleum, and coal products 4032.5. Animals and vegetable oils and fats n.c.2.6. Fertilizer and chemical products Chemicals and chemical products 526
(Contd.)

160 * Annex Tables
2.7. Pulp and waste paper n.c.2.8. Paper, paper board and manufactures Paper and paper products 3182.9. Non-metallic mineral manufactures Non-metallic mineral products 2762.10. Iron and steel Basic metals and alloys 7142.11. Non-ferrous metals Basic metals and alloys 714
A verage Capital/employee-capital intensive 479
n.c. = not classifiedNotes: 1. For the purpose of this exercise, labour-intensive industries have been defined as those where fixed capital per
employee < Rs 200, 000.
2. The classification of principal exports and imports is from the Economic Survey 1998-99; capital per employeefigures are from the ASI for corresponding categories (ASI categories not included in the table above are electricity,other manufacturing industries, repair of capital goods, repair services, wood and wood products, water works, gasand steam, cold storage, and non-conventional energy).
Source: Annual Survey of Industries (ASI), 1994-95; MoF, Economic Survey, 1998-9.

Annex Tables * 161
ANNEX TABLE 6.2India and China: Selected Trade Indicators, 1987-96
1987 1991 1996
India China India China India China India China
Structure of exports (VDI)Manufactured exports(% of merchandise exports) 66.42 58.25 72.04 75.72 73.55a 84.36High-technology exports(% of merchandise exports) 6.22 12.38 9.23 13.09 10.09a 21.14
Total exports (goods & services) in $ bn (WDI) 16.22 39.17 23.29 65.90 43.86 171.68
(1969, IFS) (2.03) (2.31)
(1978, IFS) (6.67) (9.96)Trade (% of GDP) (1980, WD1) 16.62 12.90 15.19 27.09 19.15 29.59 27.09 39.88Exports per capita ($ per person) (1980, WB) 16.41 12.92 20.27 33.63 26.87 53.09 44.15 141.17
Selected exports commodities,Share in world exports in percent (UNCTAD)Total exports 0.55 1.80 0.55 2.23 0.69 3.10Fish and preparations 1.69 3.02 1.71 3.47 2.55 6.49Rice 8.42 6.03 7.58 3.75 13.77 1.72Nuts, coco, brazil, cashew 48.80 0.81 39.98 0.46 40.15 0.20Coffee, tea, cocoa, spices 4.75 2.57 4.23 2.79 3.52 2.04
Coffee 2.13 0.04 1.84 0.01 3.42 0.06Tea 23.19 18.35 21.07 16.31 16.55 16.45
Spices 16.64 4.94 10.35 7.23 14.95 12.38Iron ore, etc., excl. pyrtes 12.66 0.00 7.55 0.00 6.12 0.00Iron and steel 0.13 0.59 0.34 1.64 0.76 2.94Manufactures 0.50 1.42 0.54 2.28 0.65 3.45
Chemicals 0.27 1.10 0.54 1.36 0.67 1.91Leather, dressed fur etc. 7.11 0.90 4.77 1.41 2.82 3.80
Leather etc. manufactures 13.17 0.37 8.26 1.31 5.35 7.86Textile yarn, fabric etc. 2.10 7.77 2.22 7.60 3.12 8.29Gold, silverware, jewellry 0.74 1.37 2.14 1.80 2.93 6.11Basic manufactures 1.28 2.38 1.24 2.81 1.57 3.79Machines, transport equipment 0.10 0.46 0.11 1.15 0.14 1.68Misc. manufactured goods 0.72 3.20 0.85 5.27 1.05 9.51
Clothing 2.13 7.19 2.49 11.12 3.01 16.39Real jewelery, gold, silver 0.85 1.52 2.44 1.51 3.08 5.89
Precious metal jewelery 0.99 1.09 2.84 1.15 3.41 5.66Jewelry NES 0.03 7.26 0.09 6.20 0.10 20.29
Imitation jewelery 0.23 0.65 0.22 3.78 1.22 8.61Textile fibres 0.57 8.41 0.74 5.59 1.98 2.97Petroleum and products 0.40 3.21 0.19 1.77 0.18 1.41Iron and steel scrap 0.03 0.42 0.04 0.17 0.11 0.16
Goods not classified by kind 0.44 5.51 0.35 0.99 0.44 0.17
FDI inflows (% of Gross Fixed Capital Formation) 0 .30 b 2 9 0 b 0.40c 7.40c 2.90 17.00
FDI Stock (% of GDP) 0 .5 0d 1 .5 0d 0.50e 4.80e 2.60 24.70
a Data for 1995.b Annual average, 1986-91.c Data for 1992.d Data for 1985.e Data for 1990.
Source: UNCTAD, Comtrade Database; World Bank, World Development Indicators 1998; United Nations, World InvestmentRLport 1998.

162 * Annex Tables
ANNEX TABLE 6.3Coverage Ratio for Non-Tariff Barriers on Indian Imports
(Weighted Average)
1988-9 1995-6 1997-8 1998-9 1999-2000
Method 2 Method 1 Method 2 Method I Method 2 Method 1 Method 2 Method 1 Method 2
Average all sectors 95.21 56.80 65.51 62.20 64.03 60.85 62.16 23.25 24.24
A ctvity based
1 Primar-y 99.96 64.12 74.79 76.06 76.22 73.17 74.95 56.58 57.412 Secondary 87.43 42.00 46.11 34.19 39.42 32.06 36.30 23.41 27.71
Industry based1 Food, beverages,
and tobacco 100.00 74.47 74.47 65.67 66.92 63.06 63.98 46.58 47.952 Textiles and leather 100.00 47.06 56.02 48.33 54.88 47.44 53.37 39.30 45.073 Wood, cork,
and products 100.00 41.99 41.99 24.03 34.48 20.00 26.41 2.87 5.744 Paper and printing 100.00 39.01 42.27 25.82 30.90 22.03 26.93 17.76 22.545 Chemicals, petrol,
and coal 97.54 32.29 38.09 22.52 30.74 20.77 26.24 12.57 15.456 Non-metallic minerals 98.25 76.48 76.48 46.32 50.52 40.41 47.04 19.05 36.287 Basic metal industries 53.37 13.21 13.76 14.46 15.05 11.87 15.85 9.03 11.418 Metal products and
machinery 80.11 37.93 40.70 29.73 34.55 27.93 31.57 21.17 25.039 Other manufacturing 78.48 46.44 53.61 30.56 37.28 27.39 29.76 17.19 21.53
10 Agriculture 100.00 67.10 78.43 80.07 80.23 76.93 78.87 59.00 59.8811 Mining 99.44 27.71 30.19 27.09 27.09 27.09 27.09 26.97 27.09Use based1 Consumer
non-durables 100.00 63.98 74.69 74.71 75.65 73.51 74.07 55.33 56.192 Consumer durables 84.34 52.75 58.20 40.18 46.77 37.26 41.56 27.03 32.803 Intermediate goods 98.45 44.78 47.24 39.21 42.02 37.89 39.71 28.00 33.534 Basic goods 70.34 25.17 28.65 19.28 22.72 17.63 23.23 11.56 16.095 Capital goods 74.12 22.77 23.97 16.93 20.29 15.97 18.26 12.16 13.81
Notes: 1. In Method 1, Special Import Licence (SILs) have been given a weight of 50 per cent, and all other non-tariff barriersa weight of 100 per cent.
2. In Method 2, all non-tariff barriers have been assigned an equal weight of 100 per cent.Source: NCAER.
(Contd.)

Annex Tables * 163
Coverage Ratio for Non-Tariff Barriers on Indian Imports(Simple Average)
1988-9 1995-6 1997-8 1998-9 1999-2000
Method 2 Method 1 Method 2 Method 1 Method 2 Method 1 Method 2 Method 1 Method 2
Average all sectors 91.63 44.47 50.31 39.93 44.76 38.07 41.95 28.31 32.60
Activity based1 Primary 99.79 44.63 54.32 49.52 51.19 49.07 51.00 41.64 44.072 Secondary 89.37 44.40 48.43 35.44 41.74 32.91 37.72 22.05 27.23
Industry based1 Food, beverages,
and tobacco 100.00 74.46 74.46 69.83 70.70 63.42 65.93 42.90 44.572 Textiles and leather 100.00 52.88 61.46 51.11 59.25 50.19 57.69 39.99 49.183 Wood, cork, and
products 100.00 55.81 55.81 33.54 50.84 26.64 37.04 5.42 10.854 Paper and printing 100.00 39.58 42.50 26.00 30.27 22.23 26.23 16.77 20.585 Chemicals, petrol,
and coal 95.54 35.33 42.77 22.71 33.71 20.04 26.13 11.27 14.556 Non-metallic minerals 98.81 76.35 47.03 48.94 38.27 42.47 29.80 11.16 15.337 Basic metal industries 53.74 16.13 16.55 17.07 17.52 15.73 20.86 7.79 9.238 Metal products and
machinery 80.83 35.59 37.81 26.87 31.10 24.97 28.35 18.63 23.129 Other Manufacturing 78.49 45.39 51.64 35.13 42.58 34.51 39.26 19.80 26.48
10 Agriculture 100.00 60.15 74.43 69.80 72.30 69.12 72.01 58.05 61.6211 Mining 99.38 13.60 14.10 8.97 8.97 8.97 8.97 8.84 8.97
Use based1 Consumer
non-durables 100.00 58.60 68.05 60.23 64.91 58.19 62.51 45.27 49.592 Consumer durables 88.20 45.29 56.19 39.09 47.50 36.99 43.18 26.68 34.193 Intermediate goods 96.84 38.45 35.67 28.87 29.24 26.48 24.08 14.35 18.504 Basic goods 79.44 30.52 34.88 20.22 24.39 19.63 25.88 11.41 15.315 Capital goods 75.19 26.52 28.28 19.27 22.39 18.33 20.60 13.61 16.17
Notes: 1. In Method 1, Special Import Licence (SILs) have been given a weight of 50 per cent, and all other non-tariff barriersa weight of 100 per cent.
2. In Method 2, all non-tariff barriers have been assigned an equal weight of 100 per cent.Source: NCAER.

164 * Annex Tables
ANNEX TABLE 6.4India's Share in World Trade, REER, and Tariffs
Year Merchandise exports (US $ billion) Share in world Average tariff (% )aREERb
India World merchandise exports (%) 1990= 100
1985 9.14 1872.00 0.488 60.271986 9.40 2046.40 0.459 70.901987 11.30 2401.40 0.470 75.821988 13.33 2742.00 0.486 83.881989 15.85 2981.50 0.531 92.091990 17.98 3395.30 0.529 127.7 102.331991 17.66 3489.10 0.506 127.6 124.301992 19.56 3730.20 0.524 94.0 139.851993 21.55 3877.30 0.556 71.0 139.091994 25.08 4260.00 0.589 55.0 135.651995 30.76 5122.90 0.601 40.8 142.131996 33.05 5352.30 0.618 38.6 138.391997 34.25 5534.90 0.619 34.4 130.541998 33.05 5450.00 0.606 40.2 138.13
a Data for fiscal year April-March.b Real effective exchange rate, based on the IMF's Information Notice System (INS) methodology.
Note: Tariffs before 1990 were in excess of 100 Der cent. The mean tariff for 1999-2000 is 39.6 per cent.
Source: World Bank staff estimates; IMF, IFS Yearbook 1998 and IFS Bulletins, February 1999-April 1999.
ANNEX TABLE 6.5Share in World Exports: India and Selected Countries, 1998
Value of exports (US $ billion) Share in world exports(%)
199% 1997 1998 1996 1997 1998
World 5352.30 5534.90 5450.00 100.00 100.00 100.00India 33.05 34.25 33.05 0.62 0.62 0.61China, Mainland 151.20 182.88 183.59 2.82 3.30 3.37China, Hong Kong 180.75 188.06 173.99 3.38 3.40 3.19Brazil 47.75 52.99 51.12 0.89 0.96 0.94Argentina 23.81 26.37 25.23 0.44 0.48 0.46Korea 129.72 136.16 133.22 2.42 2.46 2.44Malaysia 78.33 78.74 73.30 1.46 1.42 1.35Pakistan 9.33 8.73 8.50 0.17 0.16 0.16Tanzania 0.76 0.72 0.67 0.01 0.01 0.01Turkey 23.22 26.25 25.94 0.43 0.47 0.48Kenya 2.07 2.05 1.99US 625.07 688.70 682.50 11.68 12.44 12.52Canada 201.63 214.42 214.33 3.77 3.87 3.93
Source: IMF, IFS, various issues.

ANNEX TABLE 6.6
India-Tariff Structure, 1990-9(in per cent)
Mean Import Weighted Average
Sector 1990-1 1992-3 1993-4 1994-5 1995-6 1996-7 1997-8 1998-9 1999-2000 1990-1 1992-3 1993-4 1994-5 1995-6 1996-7 1997-8 1998-9 1999-2000
Whole economy 128 94 71 55 40.8 38.6 34.4 40.2 39.6 87 64 47 33 27.2 24.6 25.4 29.7 30.2
(41) (34) (30) (25) (19) (19) (14.8) (15.3) (14.0)
Agriculturalproducts 106 59 39 31 25.1 25.6 24.6 29.6 29.2 70 30 25 17 14.9 14.7 14.0 16.1 17.7
(48) (49) (39) (30) (24.9) (21.1) (17.7) (18.8) (16.6)
Mining - - 71 48 30 24.8 24.4 29.4 26.6 - - 33 31 27.6 22 21.9 19.5 17.7
(24) (25) (15.6) (11.9) (11.9) (12.3) (12.1)
Consumer goods 142 92 76 59 45.4 45.4 39.8 45.9 42.9 164 144 33 48 43.1 39 33.8 39.3 32.4
(33) (42) (36) (33) (26) (27.1) (20.5) (20.7) (18.9)
Intermediate goods 133 104 77 59 43.7 38.8 34.7 40.7 41.2 117 55 40 31 25.0 21.9 26.1 31.5 31.9
(42) (25) (22) (17) (13.5) (13.2) (10.3) (11.1) (10.5)
Capital goods 109 86 58 42 33.1 33.8 29.7 35.3 35.3 97 76 50 38 28.7 28.8 24.7 30.1 32.2
(32) (26) (24) (20) (12.4) (12.2) (9.4) (10.2) (8.2)
-Not Available.Notes: 1. Standard deviations are in parentheses. In 1990-1 and 1992-3, mining is included in intermediates.
2. The total customs duty is calculated as the sum of the basic customs duty, a surcharge of 10 per cent on basic customs duty, and the special additional duty. The special additional
duty is levied on the value of imports as well as the basic duty value, the surcharge value, and the additional duty value.
3. Figures for 1997-8 include the 3 per cent special duty imposed in September 1997.
Source: World Bank staff estimates; the rates are based on the 1997-8, 1998-9, 1999-2000 editions of the Easy Reference Customs Tariff, Academy of Business Studies.
165

160
140
120
100
80
60
40
20
0
1990-1 1992-3 1993-4 1994-5 1995-6 1996-7 1997-8 1998-9 1999-2000
Agricultural products =l Consumer goods -*-- Whole economy
Mean Tariff Rates (per cent) 1990-9
The Impact of the 4 per cent Special Additional Duty 1999-2000
State Customs duty (%/) Total customs duty (%) Difference(basic + surcharge) (basic + surcharge + special additional) (percentage points)
Whole economy 34.0 39.6 5.6
Agricultural products 24.6 29.2 4.6
Mining 21.7 26.6 4.9
Manufacturing 34.7 40.4 5.7
Consumer goods 37.1 42.9 5.8
Intermediate goods 35.7 41.2 5.5
Capital goods 29.4 35.3 5.9
166

ANNEX TABLE 6.7Real Exchange Rate of India's Main Trading Partners and Competitors 1981-99a
(March averages)
Export 1999
share 1981 1990 1991 1992 1993 1994 1995 1996 1997 1998 1999 Apr. May. Jun. Jul. Aug. Sep.
Indiain US $ - 0.57 1.00 1.05 1.28 1.49 1.38 1.33 1.38 1.38 1.47 1.53 1.55 1.54 1.56 1.58 1.59 1.60in SDR - 0.78 1.00 1.05 1.24 1.42 1.31 1.34 1.27 1.18 1.19 1.24 1.24 1.23 1.24 1.27 1.28 1.30REERb _ 0.58 1.00 1.10 1.45 1.50 1.40 1.48 1.48 1.37 1.38 1.43 1.43 1.42 1.42 1.44 1.47 1.48
India's main market
USA 17.2 1.00 1.00 1.00 1.00 1.00 1.00 1.00 1.00 1.00 1.00 1.00 1.00 1.00 1.00 1.00 1.00 1.00Japan 13.5 1.10 1.00 0.91 0.89 0.80 0.72 0.64 0.77 0.92 0.95 0.91 0.91 0.93 0.93 0.92 0.87 0.83Germany 12.8 1.05 1.00 0.98 0.99 0.97 0.99 0.83 0.88 1.02 1.11 1.10 1.12 1.13 1.16 1.16 1.14 1.15United Kingdom 10.8 0.84 1.00 0.86 0.91 1.08 1.06 0.98 1.03 0.98 0.93 0.95 0.96 0.96 0.97 0.99 0.97 0.96Belgium 8.3 0.98 1.00 0.95 0.99 0.98 1.01 0.85 0.89 1.04 1.13 1.11 1.14 1.15 1.18 1.19 1.16 1.17France 6.6 1.00 1.00 0.96 1.00 1.00 1.04 0.91 0.93 1.06 1.14 1.14 1.17 1.18 1.21 1.21 1.18 1.20Italy 4.6 1.24 1.00 0.94 0.95 1.20 1.24 1.23 1.12 1.21 1.28 1.27 1.30 1.31 1.34 1.35 1.31 1.33Netherlands 3.3 1.01 1.00 0.96 0.99 0.98 1.01 0.84 0.89 1.04 1.11 1.08 1.11 1.11 1.14 1.15 1.12 1.13
India's main competitors
China - 0.45 1.00 1.15 1.18 1.16 1.50 1.26 1.19 1.19 1.23 1.29 1.31 1.31 1.32 1.31 1.32 1.33Indonesia - 0.47 1.00 1.02 0.99 0.95 0.94 0.92 0.92 0.93 2.76 1.77 1.73 1.62 1.48 1.42 1.58 1.76Malaysia - 0.73 1.00 1.02 0.95 0.95 0.97 0.89 0.89 0.86 1.26 1.26 1.27 1.27 1.26 1.27 1.27 1.27Philippines - 0.70 1.00 1.08 0.94 0.88 0.90 0.82 0.76 0.75 1.05 0.98 0.97 0.96 0.96 0.97 0.99 1.01Thailand - 0.75 1.00 0.98 0.97 0.96 0.93 0.90 0.88 0.89 1.31 1.19 1.21 1.19 1.19 1.20 1.23 1.29Korea - 1.02 1.00 0.98 1.01 1.02 1.00 0.95 0.94 1.06 1.64 1.37 1.35 1.34 1.31 1.34 1.34 1.35Singapore - 0.91 1.00 0.94 0.90 0.90 0.86 0.78 0.78 0.81 0.91 1.00 0.99 0.99 0.99 0.98 0.98 0.99Hong Kong - 0.90 1.00 0.93 0.87 0.83 0.79 0.74 0.71 0.70 0.67 0.70 0.71 0.71 0.72 0.73 0.74 0.75
a Index of the country's nominal exchange rate vis-a-vis the US$ divided by the country's CPI vis-a-vis the US CPI.b Real effective exchange rate, based on the IMF's Information Notice System (INS) methodology. Trade weights are based on trade flows averaged over 1990-2.Notes: 1. Increase = depreciation.
2. All data pertain to averages of March, with the exception of data on SDRs which pertain to end-of-month.Source: IMF, IFS; World Bank staff estimates.
167

168 * Annex Tables
ANNEX TABLE 6.8Foreign Direct and Portfolio Investment
(US $ million)
April-August1991-2 1992-3 1993-4 1994-5 1995-6 1996-7 1997-8 1998-9 1998-9 1999-2000
Direct InvestmentForeign Direct Investment 129 315 586 1314 2144 2821 3557 2462 1265 993
Portfolio Investment 4 244 3567 3824 2748 3312 1828 -61 -489 1190Foreign Institutional Investment 0 1 1665 1503 2009 1926 979 -390 -558 1108Euro-issues/GDR 0 240 1520 2082 683 1366 645 270 15 0Othersa 4 3 382 239 56 20 204 59 54 82
Total Direct andPortfolio Investment 133 559 4153 5138 4892 6133 5385 2401 776 2183
Memo:Foreign Currency Convertible
Bonds (FCCB)b 0 0 914 34 - - - - - -Floating Rate Notes (FRN) 0 0 0 167 - - - - -
a Includes NRI portfolio investments, offshore funds, and others.b FCCBs is treated as commercial borrowing before conversion into equity.Source: RBI; MoF, Economic Survey, 1996-7.

Annex Tables * 169
ANNEX TABLE 7.1India: Structure of Selected Institutions of the Financial System
(end March 1998)
No. of No. of Deposits Loans, adv. Assets Assets Assetsinstitutions offices (Rs bn) & inv. (Rs bn) (Rs bn) (% total) (% GDP)
A. BANKING SYSTEM1. Reserve Bank of India 1 - - - 2623.0 13.0 16.81.1 Issue department - - - 929.46a 1485.5 7.3 9.51.2 Banking department - - 651.2 624.5 1137.5 5.6 7.32. Commercial banks 301 64,276 6662.3 6205.1 8252.9 40.8 52.82.1 Scheduled commercial banksb 300 64,267 6662.3 6205.1 8252.9 40.8 52.82.1.1 Public sector banks 27 44,958 5317.3 4870.1 6491.9 32.1 41.52.1.1.1 State Bank group 8 13,204 1736.0 1702.7 2327.5 11.5 14.92.1.1.2 Nationalized banks 19 31,754 3581.3 3167.4 4164.4 20.6 26.62.1.2 Regional rural banks 196 14,471 221.1 237.9 297.5 1.5 1.92.1.3 Private sector banks 34 4661 695.2 620.4 810.6 4.0 5.22.1.4 Foreign banks 42 177 428.7 476.7 652.9 3.2 4.22.2 Non-scheduled commercial banksc 1 9
B. NON-BANK SYSTEM - - - 3089.8 3654.0 18.1 23.41. Financial Institutions
1.1 IDBI 1 - - 483.9 599.6 3.0 3.81.2 ICICI 1 - - 366.7 459.2 2.3 2.91.3 IFCI 1 - - 190.2 214.7 1.1 1.41.4 LIC & GIC 2 - - 1085.1 1292.6 6.4 8.31.5 SFCs 1R - - 115.3 145.8 0.7 0.91.6 EXIM Bank 1 - - 45.2 52.3 0.3 0.31.7 UTI 1 - - 550.4 638.1 3.2 4.11.8 NABARD 1 - - 233.C 252.1 1.2 1.61.9 HDFCd - - 96.4 99.3 0.5 0.6
2. Non-banking corporate sector(NBC) 13,971 - 3571.5' - - -2.1 Non-financial companies
(NFC) 2376 - 2238.7e - - -2.2 Financial companies
(NBFC) 10,122 - 1166.4e - - - -2.3 Miscellaneous and
residuary (RNBC) 1473 - 166.5e- - -
C. CAPITAL MARKET' 1 - - - 5603.3 27.7 35.8Total: - - - - 20232.4 100.0 129.4
a Excludes foreign securities.b Deposits, loans etc. are based on balance sheet data, no. of offices are based on Quarterly Handout (Banking Statistics).c Balance sheet data not available for end March 1998.d Figures from HDFC balance sheet as on 31 March 1998.e End March 1997.f Stock market capitalization, BSE (higher no. of securities, but lower trading volume than NSE, with a stock market capital of
Rs 4815 bn at end March 1998).Source: RBI, Report on currency and finance 1997-8; RBI, Report on Trends and Progress in Banking 1997-8.
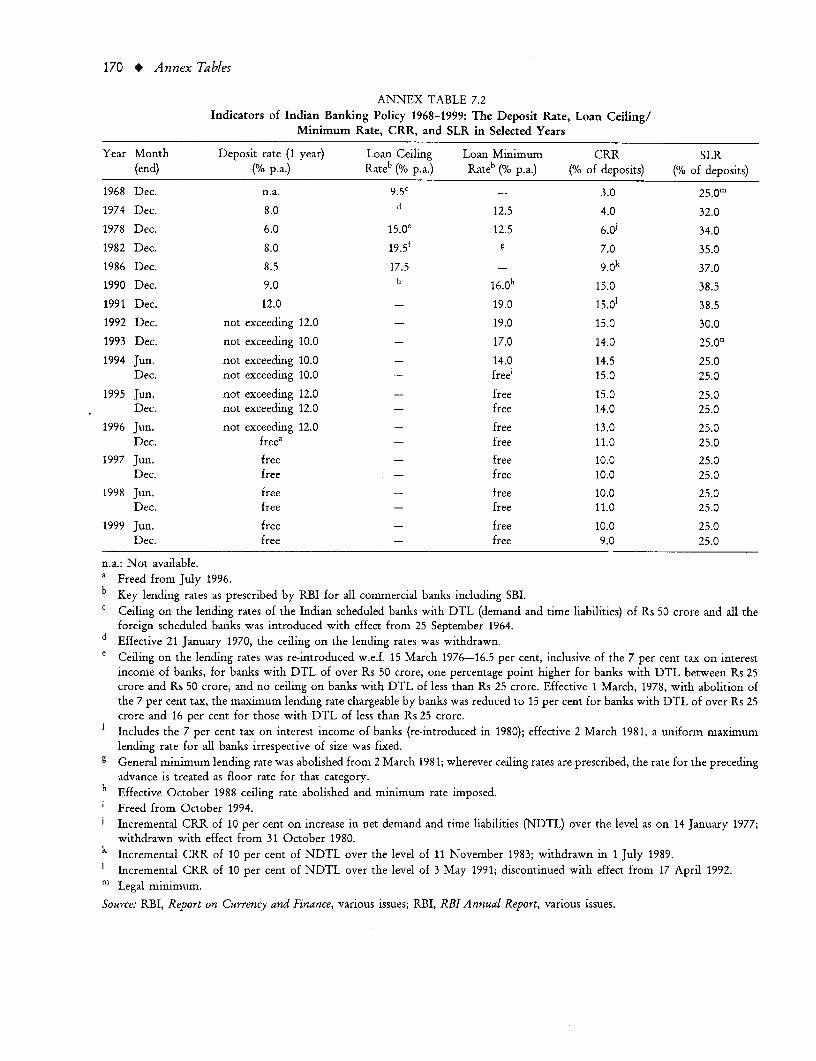
170 * Annex Tables
ANNEX TABLE 7.2Indicators of Indian Banking Policy 1968-1999: The Deposit Rate, Loan Ceiling/
Minimum Rate, CRR, and SLR in Selected Years
Year Month Deposit rate (1 year) Loan Ceiling Loan Minimum CRR SLR(end) (% p.a.) Rateb (% p.a.) Rateb (' p.a.) (% of deposits) (/o of deposits)
1968 Dec. n.a. 9.5c - 3.0 25.0m1974 Dec. 8.0 d 12.5 4.0 32.0
1978 Dec. 6.0 15.Oe 12.5 6.Oj 34.01982 Dec. 8.0 19.5f g 7.0 35.01986 Dec. 8.5 17.5 - 9 0k 37.01990 Dec. 9.0 16.0h 15.0 38.5
1991 Dec. 12.0 - 19.0 15.0' 38.51992 Dec. not exceeding 12.0 - 19.0 15.0 30.01993 Dec. not exceeding 10.0 - 17.0 14.0 25.0n1994 Jun. not exceeding 10.0 - 14.0 14.5 25.0
Dec. not exceeding 10.0 - free' 15.0 25.0
1995 Jun. not exceeding 12.0 - free 15.0 25.0Dec. not exceeding 12.0 - free 14.0 25.0
1996 Jun. not exceeding 12.0 - free 13.0 25.0Dec. freea - free 11.0 25.0
1997 Jun. free - free 10.0 25.0Dec. free - free 10.0 25.0
1998 Jun. free - free 10.0 25.0Dec. free - free 11.0 25.0
1999 Jun. free - free 10.0 25.0Dec. free - free 9.0 25.0
n.a.: Not available.a Freed from July 1996.b Key lending rates as prescribed by RBI for all commercial banks including SBI.c Ceiling on the lending rates of the Indian scheduled banks with DTL (demand and time liabilities) of Rs 50 crore and all the
foreign scheduled banks was introduced with effect from 25 September 1964.d Effective 21 January 1970, the ceiling on the lending rates was withdrawn.
Ceiling on the lending rates was re-introduced w.e.f. 15 March 1976-16.5 per cent, inclusive of the 7 per cent tax on interestincome of banks, for banks with DTL of over Rs 50 crore, one percentage point higher for banks with DTL between Rs 25crore and Rs 50 crore, and no ceiling on banks with DTL of less than Rs 25 crore. Effective 1 March, 1978, with abolition ofthe 7 per cent tax, the maximum lending rate chargeable by banks was reduced to 15 per cent for banks with DTL of over Rs 25crore and 16 per cent for those with DTL of less than Rs 25 crore.
f Includes the 7 per cent tax on interest income of banks (re-introduced in 1980); effective 2 March 1981, a uniform maximumlending rate for all banks irrespective of size was fixed.
g General minimum lending rate was abolished from 2 March 1981; wherever ceiling rates are prescribed, the rate for the precedingadvance is treated as floor rate for that category.
h Effective October 1988 ceiling rate abolished and minimum rate imposed.Freed from October 1994.Incremental CRR of 10 per cent on increase in net demand and time liabilities (NDTL) over the level as on 14 January 1977;withdrawn with effect from 31 October 1980.
k Incremental CRR of 10 per cent of NDTL over the level of 11 November 1983; withdrawn in 1 July 1989.l Incremental CRR of 10 per cent of NDTL over the level of 3 May 1991; discontinued with effect from 17 April 1992.m Legal minimum.Source: RBI, Report on Currency and Finance, various issues; RBI, RBI Annual Report, various issues.

ANNEX TABLE 7.3Scheduled Commercial Banks Investmcnts and Other Assets
(end Fiscal Year)(Rs billion)
1985-6 1986-7 1987-8 1988-9 1989-90 1990-1 1991-2 1992-3 1993-4 1994-5 1995-6 1996-7 1997-8 1998-9
Selected assets 1036.3 1225.1 1407.5 1684.8 1963.8 2226.1 2599.0 2995.1 3584.1 4380.9 5041.9 5614.1 6614.2 7216.5
Balances with RBI 110.5 143.8 176.6 213.8 234.6 238.6 341.8 285.4 477.6 600.3 506.7 498.5 577.0 635.5SLR eligible Investments 305.5 385.8 465.0 546.6 643.7 750.7 902.0 1056.6 1325.2 1492.5 1647.8 1905.1 2187.1 2541.2Government securities 190.5 248.5 305.2 358.2 422.9 500.0 627.3 759.5 1012.0 1176.9 1322.3 1588.9 1869.6 2232.2
Other approved securities 115.1 137.4 159.9 188.5 220.8 250.7 274.7 297.1 313.2 315.7 325.6 316.2 317.5 313.8Other assets 59.5 62.4 60.5 77.2 70.9 73.9 99.4 133.4 137.1 172.5 196.8 232.4 278.5 379.8Other Investments - - - - - - - - - - 150.4 194.1 330.8 -
Bank credit 560.7 633.1 705.4 847.2 1014.5 1163.0 1255.9 1519.8 1644.2 2115.6 2540.2 2784.0 3240.8 3688.4
Total liabilities 979.8 1163.9 1337.1 1601.6 1882.4 2155.7 2523.7 2993.3 3507.1 4356.7 4854.7 5625.4 6791.3 8191.5
Liabilities to others 920.3 1099.8 1269.4 1506.7 1799.9 2056.0 2447.6 2865.6 3376.1 4129.3 4629.7 5407.9 6464.4 7716.8Liabilities to the banking system 50.0 51.2 50.2 59.6 58.5 64.9 70.3 111.5 112.8 153.3 176.5 211.9 322.9 452.0Borrowings from RBI 9.5 12.9 17.5 35.3 24.0 34.9 5.8 16.2 18.1 74.2 48.5 5.6 4.0 28.9
% of Total liabilitiesBalances with RBI and
SLR eligible investments 42.5 45.5 48.0 47.5 46.7 45.9 49.3 44.8 51.4 48.0 44.4 42.7 40.7 38.8Other Investments - - - - - - - - - - 3.1 3.5 4.9 -Bank Credit 57.2 54.4 52.8 52.9 53.9 53.9 49.8 50.8 46.9 48.6 52.3 49.5 47.7 44.7Memo:
Total assets - - - - - - - - 4351.0 5146.9 5991.5 6729.8 7954.1 9509.0
-Not Available.
Source: RBI, Report on Currency and Finance, various issues; RBI, Report on Trend and Progress of Banking in India, various issues.
171

172 * Annex Tables
ANNEX TABLE 7.4Bank Resources to Small versus Medium and Large Industries
(Rupees billion)
Outsanding as on
Mar. 1993 Mar. 1994 Mar. 1995 Mar. 1996 Mar. 1997 Mar. 1998 Mar. 1999
1. Gross bank credit 1471.4 1568.6 1969.9 2318.6 2589.9 3002.8 3420.12. Credit to industry
(medium and large) 586.4 578.7 746.7 930.5 1026.0 1175.3 1305.23. Investments in bonds, etc. 0.0 0.0 0.0 149.9 194.1 330.8 469.24. Resources to industry
(medium and large)(2+3) 586.4 578.7 746.7 1080.4 1220.2 1506.1 1774.35. Credit to SSI 200.3 226.2 276.4 318.8 359.4 436.0 484.86. Investment in govt securities
in excess of SLR requirements 71.5 230.8 283.5 348.0 472.0 574.9 669.0Ratios (%6)i) Credit to industry
(medium and large/Gross bank credit 39.9 '36.9 37.9 40.1 39.6 39.1 38.2
ii) Resources to industry(medium and large)/(grossbank credit + investmentsin bonds, etc.) 39.9 36.9 37.9 43.8 43.8 45.2 45.6
iii) Credit to SSI/gross bank credit 13.6 14.4 14.0 13.8 13.9 14.5 14.2
iv) Credit to SSI/resources toindustry (medium and large) 34.2 39.1 37.0 29.5 29.5 28.9 27.3
v) Inv. in govt securities inexcess of SLR requirements/gross bank credit 4.9 14.7 14.4 15.0 18.2 19.1 19.6
vi) (Resources to industry[medium and large]+ mv. in govt securities inexcess of SLR/credit to SSI 328.5 357.9 372.8 448.0 470.8 477.3 504.0
vii) Credit/deposit ratio 56.6 52.2 54.7 58.6 55.1 53.5 51.7
Memo (%6)Actual investment"/deposit ratio 39.3 42.1 38.6 38.0 37.7 36.1 35.7SLR (effective) 35.6 32.5 29.3 28.0 26.5 25.0 25.0* Investments in Government and approved securities.Source: RBI, Report on Currency and Finance, various issues.

ANNEX TABLE 8.1Domestic Demand, 1981-97
(percent of GDPmp at 1993-4 prices)
1981-91a 1990-1 1991-2 1992-3 1993-4 1994-5 1995-6 1996-7 1997-8
Total consumption expenditure 78.3 (4.8) 76.0 (3.7) 76.7 (1.4) 75.7 (3.9) 75.7 (4.9) 75.1 (7.2) 75.0 (7.8) 75.1 (7.5) 76.17 (6.4)
Government final consumption 11.1 (7.2) 11.2 (3.3) 11.0 (-0.6) 10.8 (3.3) 11.0 (6.4) 11.0 (7.7) 11.7 (15.1) 12.1 (11.3) 13.77 (19.4)
Private final consumption (CSO) 67.2 (4.5) 64.8 (3.8) 65.7 (1.8) 64.8 (4.0) 64.7 (4.7) 64.2 (7.1) 63.3 (6.6) 63.0 (6.8) 62.40 (3.9)
Gross capital formation 23.2 (5.9) 24.1 (12.2) 21.4 (-11.0) 22.8 (12.4) 20.8 (-4.5) 23.1 (19.9) 25.5 (19.6) 23.5 (-1.3) 24.10 (7.7)
Gross fixed capital formation 21.1 (6.8) 21.5 (9.9) 20.5 (-4.0) 20.8 (7.0) 20.9 (5.5) 21.6 (11.3) 23.8 (18.9) 23.6 (6.3) 23.60 (5.2)
Public sector 10.0 (4.3) 2.6 (4.8) 2.7 (2.0) 2.3 (-7.2) 7.8 (252.6) 8.6 (18.5) 7.5 (-6.4) 6.5 (-6.0) 6.77 (8.6)
Private sector 3.8 (7.7) 3.9 (13.6) 3.5 (-8.1) 3.9 (17.5) 13.1 (247.9) 13.0 (7.0) 16.3 (35.8) 17.0 (12.0) 16.83 (3.9)
Change in stocks 2.1 2.7 0.9 2.0 -0.2 1.5 1.8 (29.0) -0.1 0.50
Domestic demand 101.5 (5.1) 100.1 (5.7) 98.1 (-1.6) 98.5 (5.8) 96.4 2.76 98.2 (9.9) 100.5 (10.6) 98.6 (5.2) 100.27 (6.7)
Memo:
Gross domestic savings 20.5 22.0 21.6 21.8 19.5 20.4 22.4 19.6 20.0
Public savings 2.7 0.9 1.8 1.4 0.5 1.5 1.9 1.5 1.0Household financial 7.6 18.0 16.9 18.1 10.8 11.6 8.2 9.8 10.3
Private corporate sector 2.1 2.6 3.0 2.6 3.4 3.4 4.8 4.1 3.8
a Average of 1981-2 through 1991-2.
Note: Real growth rate in parentheses.
Source: CSO, National Accounts Statistics 1998 and Quick Estimates 1999.
173
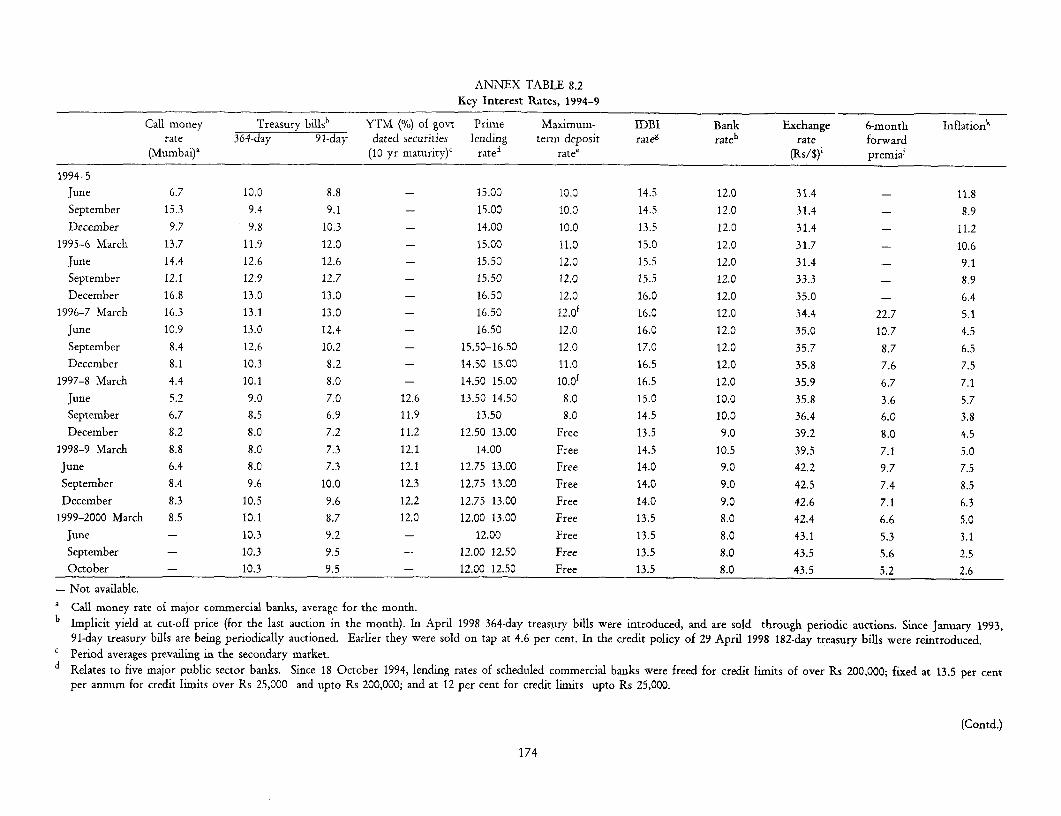
ANNEX TABLE 8.2Key Interest Rates, 1994-9
Call money Treasury billsb YTM (%/) of govt Prime Maximum- IDBI Bank Exchange 6-month Inflationkrate 364-day 91-day dated securities lending term deposit rateg rateh rate forward
(Mumbai)' (10 yr maturity)' rated ratee (Rs/$)i premiai
1994-5June 6.7 10.0 8.8 - 15.00 10.0 14.5 12.0 31.4 - 11.8September 15.3 9.4 9.1 - 15.00 10.0 14.5 12.0 31.4 - 8.9December 9.7 9.8 10.3 - 14.00 10.0 13.5 12.0 31.4 - 11.2
1995-6 March 13.7 11.9 12.0 - 15.00 11.0 15.0 12.0 31.7 - 10.6June 14.4 12.6 12.6 - 15.50 12.0 15.5 12.0 31.4 - 9.1September 12.1 12.9 12.7 - 15.50 12.0 15.5 12.0 33.3 - 8.9December 16.8 13.0 13.0 - 16.50 12.0 16.0 12.0 35.0 - 6.4
1996-7 March 16.3 13.1 13.0 - 16.50 12.0 16.0 12.0 34.4 22.7 5.1June 10.9 13.0 12.4 - 16.50 12.0 16.0 12.0 35.0 10.7 4.5September 8.4 12.6 10.2 - 15.50-16.50 12.0 17.0 12.0 35.7 8.7 6.5December 8.1 10.3 8.2 - 14.50 15.00 11.0 16.5 12.0 35.8 7.6 7.5
1997-8 March 4.4 10.1 8.0 - 14.50 15.00 10.0 16.5 12.0 35.9 6.7 7.1June 5.2 9.0 7.0 12.6 13.50 14.50 8.0 15.0 10.0 35.8 3.6 5.7September 6.7 8.5 6.9 11.9 13.50 8.0 14.5 10.0 36.4 6.0 3.8December 8.2 8.0 7.2 11.2 12.50 13.00 Free 13.5 9.0 39.2 8.0 4.5
1998-9 March 8.8 8.0 7.3 12.1 14.00 Free 14.5 10.5 39.5 7.1 5.0June 6.4 8.0 7.3 12.1 12.75 13.00 Free 14.0 9.0 42.2 9.7 7.5September 8.4 9.6 10.0 12.3 12.75 13.00 Free 14.0 9.0 42.5 7.4 8.5December 8.3 10.5 9.6 12.2 12.75 13.00 Free 14.0 9.0 42.6 7.1 6.3
1999-2000 March 8.5 10.1 8.7 12.0 12.00 13.00 Free 13.5 8.0 42.4 6.6 5.0June - 10.3 9.2 - 12.00 Free 13.5 8.0 43.1 5.3 3.1September - 10.3 9.5 - 12.00 12.50 Free 13.5 8.0 43.5 5.6 2.5October - 10.3 9.5 - 12.00 12.50 Free 13.5 8.0 43.5 5.2 2.6
-Not available.
a Call money ratc of major commercial banks, average for the month.b Implicit yield at cut-off price (for the last auction in the month). In April 1998 364-day treasury bills were introduced, and are sold through periodic auctions. Since January 1993,
91-day treasury bills are being periodically auctioned. Earlier they were sold on tap at 4.6 per cent. In the credit policy of 29 April 1998 182-day treasury bills were reintroduced.c Period averages prevailing in the secondary market.d Relates to five major public sector banks. Since 18 October 1994, lending rates of scheduled commercial banks were freed for credit limits of over Rs 200,000; fixed at 13.5 per cent
per annum for credit limits over Rs 25,000 and upto Rs 200,000; and at 12 per cent for credit limits upto Rs 25,000.
(Contd.)
174

e Interest rates on domestic term deposits with a maturity of 30 days and upto 1 year are prescribed at 'not exceeding Bank Rate minus 2 percentage points per annum'. Effective 22 October1997, banks are free to fix their own interest rates on domestic term deposits of 30 days and over. Minimum period of maturity for term deposits was reduced from thirty days to fifteendays in the credit policy of 29 April 1998.
f The deposit rate for March 1996 is the ceiling rate for maturity of 46 days and up to 2 years. Effective 2 July 1996, banks were free to determine term deposit rates for maturity periodabove one year. The rate for March 1997 is the ceiling rate for maturity of 30 days and up to 1 year.
g Medium-term lending rate.h The bank rate was reduced to 11 per cent in April 1997 and 10 per cent in June 1997. The rate was further brought down to 9% in the busy season credit policy of October 1997. On
16 January 1998, the bank rate was increased by a sharp 200 basis points to 11 per cent. The bank rate was reduced to 10.5 per cent on 18 March and to 9 per cent on 29 April 1998.Period average rate as given in the International Financial Statistics (IFS).Relates to the US $ (% per annum).
k Wholesale price index, annual increase, point-to-point.
Note: Unless otherwise specified, interest rates/yields are those prevailing at the end of the month.
Source: RBI, RBI Monthly Bulletin, various issues; RBI, RBI Weekly Bulletin, RBI Annual Report; IMF, IFS.
175

176 * Annex Tables
ANNEX TABLE 8.3Sources of Change in Base Money, 1988-9 to 1998-9
(Rupees billion)
1988-9 1989-90 1990-1 1991-2 1992-3 1993-4 1994-5 1995-6 1996-7 1997-8 1998-9
Change in base money 95 146 102 117 113 279 306 252 55 264 328Sources of change:
RBI domestic claims 113 153 177 12 82 -33 102 286 -127 130 143Net foreign exchange
assets, adj.' 6 10 46 39 2 3 61 42 105 95Currency 1 1 1 1 1 2 4 1 4 4 4Net non-mnonetaryliabilities adj.a -13 -86 59 -9 308 197 -97 136 25 86Memo:Money base at year-end 630 776 878 995 1108 1387 1693 1945 2000 2264 2592
a Adjustment refers to adjustment of the change in net foreign exchange assets by removing the impact of the change in the valueof the Rupee against foreign currencies. Specifically, the increase in the net foreign exchange assets was computed by multiplyingthe difference in the stock of net foreign exchange assets (RBI), by the exchange rate at the end of the first year. The differencebetween this figure and the RBI's figure for the change in net foreign exchange assets was added to the RBI's figure for the changein NNML.
Source: RBI, World Bank estimates.

ANNEX TABLE 8.4Imports: Customs and Non-Customs 1996-7 to 1998-9
Customs (DGCI&S) Non-Customsb Total Importsc
Total Ojia Gold and silvera Non-oil, non-gold
US $ bn Growth US $ bn Growth US $ bn Growth US $ bn Growth US $ bn Growth US $ bn Growth
1996-7 Apr.-Jun. 9.3 - 2.3 - - - - - 3.2 - 12.5 -
Jul.-Sep. 8.9 - 2.1 - - - - - 2.8 - 11.7 -
Oct.-Dec. 9.9 - 2.6 - - - - - 2.2 - 12.1
Jan.-Mar. 11.0 - 2.6 - - - - - 1.7 - 12.7 -
Apr.-Mar. 39.1 - 10.0 - 1.0 - 28.1 - 9.8 - 48.9 -
1997-8 Apr.-Jun. 10.0 7.7 2.1 -10.5 0.2 - 7.7 - 2.8 -11.4 12.8 6.7
Jul.-Sep. 9.8 9.9 1.9 -11.7 0.2 - 7.7 - 1.9 -31.9 11.7 3.7
Oct.-Dec. 10.6 7.1 2.1 -19.5 0.7 - 7.8 - 2.7 20.1 13.3 10.6
Jan.-Mar. 11.0 0.0 1.6 -37.6 1.5 - 7.9 - 2.4 44.9 13.4 6.6
Apr.-Mar. 41.5 6.0 8.2 -18.4 3.2I - 30.2 - 9 7 -1.2 51.2 6.9
1998-9 Apr.-Jun. 10.5 5.1 1.3 -35.9 1.4 604.5 7.8 0.7 2.0 -27.6 12.5 -2.2
Jul.-Sep. 10.9 11.5 1.6 -14.3 1.1 336.7 8.2 7.3 1.2 -35.9 12.1 1.9
Oct.-Dec. 10.3 -3.0 1.5 -27.6 1.3 90.9 7.5 -4.4 1.4 -48.8 11.7 -13.6
Jan.-Mar. 10.1 -8.0 1.5 -10.3 1.0 -30.9 7.6 -3.1 1.1 -54.6 11.2 -16.3
Apr.-Mar. 41.9 0.9 6.4 -21.2 4.9 54.6 30.5 1.2 5.7 -41.4 47.5 -7.1
* In addition, $ 2.7 billion worth of gold and silver was imported through the baggage route.
a The quarterly figures do not add up to the annual figures owing to the differences in the exchange rate used for the purpose of conversion, and a lag between the revision of quarterly
and annual data as reported by the RBI.b Difference between total imports and customs (DGCI&S).
c Merchandise imports.
Source: DGCI&S; RBI, RBI Monthly Bulletin, March 1999.
177

178 * Annex Tables
ANNEX TABLE 8.5Central Government Finances, 1990-2000
(per cent of GDP)
1990-1 1991-2 1992-3 1993-4 1994-5 1995-6 1996-7 1997-8 1998-9 1998-9 1999-2000RE Actuals* BE
A. Revenue 9.5 9.9 9.7 8.6 8.8 9.0 9.0 8.6 8.7 8.3 9.0Tax revenue (gross) 9.9 10.1 9.8 8.6 8.9 9.1 9.1 8.9 8.2 8.0 8.7
Corporation tax 0.9 1.2 1.2 1.1 1.3 1.4 1.3 1.3 1.5 1.4 1.5Income tax 0.9 1.0 1.0 1.0 1.2 1.3 1.3 1.3 1.2 1.1 1.3of which:VDIS - - - - - - - 0.6 - - -Excise duties 4.2 4.2 4.0 3.6 3.6 3.3 3.2 3.1 2.9 2.9 3.2Customs 3.6 3.3 3.1 2.5 2.6 2.9 3.0 2.6 2.4 2.3 2.5Other 0.3 0.4 0.4 0.3 0.2 0.3 0.3 0.7 0.2 0.2 0.2Less: states' share 2.5 2.6 2.7 2.5 2.4 2.4 2.5 2.8 2.2 2.2 2.2
Tax revenue (net) 7.4 7.5 7.1 6.1 6.5 6.7 6.6 6.1 6.1 5.8 6.5Non-tax revenue 2.1 2.4 2.6 2.5 2.3 2.3 2.3 2.4 2.7 2.5 2.5(Interest receipts) 1.5 1.6 1.6 1.7 1.5 1.5 1.6 1.6 1.7 1.5 1.6
B. Revenue expenditure 12.7 12.3 12.1 12.3 11.8 11.5 11.3 11.5 12.1 12.0 11.7Interest payments 3.7 4.0 4.1 4.2 4.2 4.1 4.2 4.2 4.3 4.4 4.4Subsidies 2.1 1.8 1.6 1.5 1.2 1.1 1.1 1.2 1.4 1.2 1.2
Food 0.4 0.4 0.4 0.6 0.5 0.4 0.4 0.5 0.5 0.5 0.4Fertilizer 0.8 0.8 0.8 0.5 0.6 0.6 0.4 0.5 0.4 0.4 0.4Others 0.9 0.6 0.4 0.3 0.2 0.1 0.3 0.3 0.5 0.3 0.3
Defence 1.9 1.7 1.6 1.7 1.6 1.5 1.5 1.7 1.7 1.7 1.7Grants to states 2.3 2.4 2.3 2.4 1.9 1.7 1.6 1.9 1.4 1.4 1.5Other 2.7 2.5 2.6 2.5 2.8 3.0 2.8 2.5 3.3 3.3 3.0
C. Capital expenditure 2.1 1.7 1.8 1.5 1.4 1.1 0.9 1.0 0.9 0.9 1.1of which:
Social services 0.0 0.0 0.0 0.0 0.1 0.0 0.0 0.G 0.1 0.1 0.1Economic services 0.8 0.9 0.6 0.6 0.6 0.4 0.3 0.4 0.4 0.4 0.5
D. Gross loans 3.6 2.8 2.3 2.5 2.3 2.0 2.1 2.3 2.6 2.5 2.5of which:
to states and UTs 2.5 2.0 1.7 1.7 1.8 2.0 2.1 1.9 2.3 2.2 2.1E. Recovery of loans 1.0 0.9 0.8 0.7 0.6 0.5 0.5 0.5 0.6 0.6 0.5F. Net lending (D-E) 2.4 1.8 1.3 1.6 1.7 1.5 1.5 1.7 2.0 2.0 1.9G. Disinvestment in PEs 0.0 0.5 0.3 0.0 0.5 0.0 0.0 0.1 0.5 0.3 0.5H. Gross fiscal deficit
(B + C + F-A-G)-GOIold def. 7.7 5.5 5.3 6.9 5.6 5.0 4.7 5.7 5.7 6.2 5.2
I. Gross Fiscal Deficit(H-K)-GOI new def. 6.5 4.6 4.7 6.3 4.7 4.2 4.0 4.7 4.4 4.9 4.0
J. Gross fiscal deficit(H+G)- WB def. 7.7 5.9 5.5 6.9 6.1 5.1 4.8 5.7 6.2 6.5 5.7
Memo:Net small savings (K+L) 1.6 1.0 0.7 1.0 1.6 1.0 1.1 1.6 1.6 1.6 1.6K. States share 1.2 0.8 0.6 0.6 0.9 0.8 0.8 1.0 1.3 1.3 1.2L. Centre's share 0.4 0.2 0.2 0.5 0.7 0.2 0.3 0.6 0.3 0.3 0.4M. Revenue deficit
(B-A+G) 3.2 2.9 2.7 3.7 3.5 2.5 2.3 3.0 3.8 4.0 3.2
' The figures are provisional actuals (adjusted for actual tax returns and expenditures). Components on taxes and expendituresare estimated.
Note: BE = Budget estimates; RE = Revised estimates; VDIS = Voluntary disclosure of income scheme; GOI = Government ofIndia; WB = World Bank.Source: GOI, Budget Documents; staff estimates.
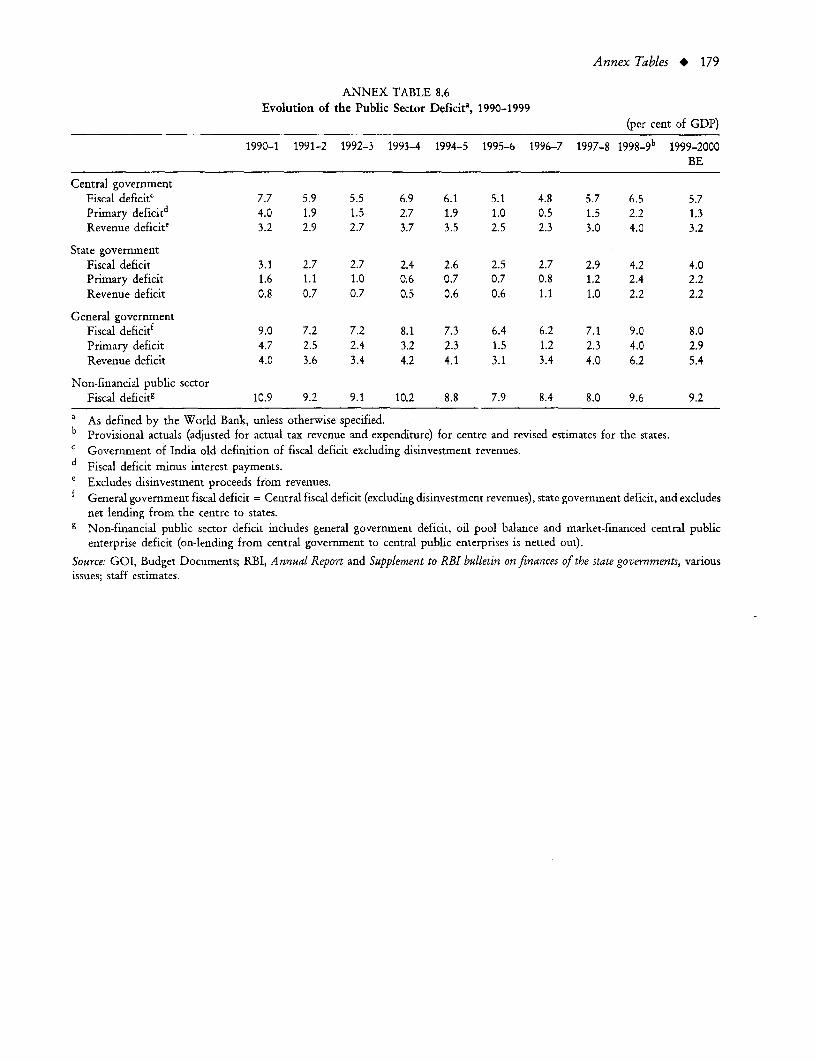
Annex Tables * 179
ANNEX TABLE 8.6Evolution of the Public Sector Deficita, 1990-1999
(per cent of GDP)
1990-1 1991-2 1992-3 1993-4 1994-5 1995-6 1996-7 1997-8 1998-9" 1999-2000BE
Central governmentFiscal deficitc 7.7 5.9 5.5 6.9 6.1 5.1 4.8 5.7 6.5 5.7Primary deficitd 4.0 1.9 1.5 2.7 1.9 1.0 0.5 1.5 2.2 1.3Revenue deficit' 3.2 2.9 2.7 3.7 3.5 2.5 2.3 3.0 4.0 3.2
State governmentFiscal deficit 3.1 2.7 2.7 2.4 2.6 2.5 2.7 2.9 4.2 4.0Primary deficit 1.6 1.1 1.0 0.6 0.7 0.7 0.8 1.2 2.4 2.2Revenue deficit 0.8 0.7 0.7 0.5 0.6 0.6 1.1 1.0 2.2 2.2
General governmentFiscal deficitf 9.0 7.2 7.2 8.1 7.3 6.4 6.2 7.1 9.0 8.0Primary deficit 4.7 2.5 2.4 3.2 2.3 1.5 1.2 2.3 4.0 2.9Revenue deficit 4.0 3.6 3.4 4.2 4.1 3.1 3.4 4.0 6.2 5.4
Non-financial public sectorFiscal deficitg 10.9 9.2 9.1 10.2 8.8 7.9 8.4 8.0 9.6 9.2
a As defined by the World Bank, unless otherwise specified.b Provisional actuals (adjusted for actual tax revenue and expenditure) for centre and revised estimates for the states.c Government of India old definition of fiscal deficit excluding disinvestment revenues.d Fiscal deficit minus interest payments.e Excludes disinvestment proceeds from revenues.f General government fiscal deficit = Central fiscal deficit (excluding disinvestment revenues), state government deficit, and excludes
net lending from the centre to states.g Non-financial public sector deficit includes general government deficit, oil pool balance and market-financed central public
enterprise deficit (on-lending from central government to central public enterprises is netted out).Source: GOI, Budget Documents; RBI, Annual Report and Supplement to RBI bulletin on finances of the state governments, variousissues; staff estimnates.

180 * Annex Tables
ANNEX TABLE 8.7Central Government Salary Bill and Establishment Strength, 1990-7
(Rs billion at current prices)
1990-1 1991-2 1992-3 1993-4 1994-5 1995-6 1996-7 1997-8
A. Civil salary and allowances(as in the Budget) 107.43 114.68 134.62 152.09 165.48 187.84 198.42 266.88Railway salaries and allowances 48.62 54.86 59.17 73.37 79.85 87.51 81.33 108.62Post and telecommunications 19.48 21.91 24.35 27.91 30.77 36.48 42.06 48.27
B. Civil salary and allowances(excl. Railways and P&T) 39.33 37.91 50.56 50.81 54.86 63.85 75.03 109.99
C. Defence salary and allowances 37.85 40.09 45.89 50.62 55.80 63.38 71.59 98.10
Total Salary Bill (A+C) 145.28 154.77 180.51 202.71 221.28 251.22 270.01 364.98
Pensions 5.00 5.52 6.85 8.12 9.34 11.09 14.25 19.50
Memo: % GDP
Civil salary and allowances(as in the Budget) 1.9 1.7 1.8 1.7 1.6 1.5 1.4 1.7
Civil salary and allowances(excl. railways and P&T) 0.7 0.6 0.7 0.6 0.5 0.5 0.5 0.7
Defence salary and allowances 0.7 0.6 0.6 0.6 0.5 0.5 0.5 0.6Total salary bill 2.5 2.3 2.4 2.3 2.1 2.1 1.9 2.3
Pensions 0.1 0.1 0.1 0.1 0.1 0.1 0.1 0.1
Establishment Strength(in millions, as on 1 March) 4.1 4.1 4.1 4.0 3.8 3.8 3.8 3.9
Note: P&T = Postal and Telegraph.
Source: Government of India, Budget Documents.

Annex Tables * 181
ANNEX TABLE 8.8State Government Finances
(per cent of GDP*)
1980-1 1990-1 1991-2 1992-3 1993-4 1994-5 1995-6 1996-7 1997-8 1998-9RE BE
Revenue receipts 11.1 11.6 12.2 11.9 12.0 11.8 11.3 10.8 11.7 10.8Tax revenue 7.1 7.7 7.9 7.9 7.8 7.8 7.6 8.9 8.2 7.7
State own taxes 4.5 5.2 5.4 5.2 5.3 5.4 5.2 5.0 5.6 5.6State share in central taxes 2.6 2.5 2.6 2.7 2.5 2.4 2.4 2.5 2.6 2.2
Non-tax revenue 4.0 3.9 4.3 4.0 4.2 4.0 3.6 3.3 3.5 3.1of which: grants from centre 1.8 2.3 2.4 2.3 2.4 1.9 1.7 1.6 1.9 1.5
Revenue expenditure [A+B+C] 10.1 12.4 12.9 12.6 12.5 12.4 11.9 12.0 12.6 12.7A. Developmental (1+2) 7.1 8.4 8.8 8.3 8.1 7.6 7.3 7.5 7.7 7.1
1. Social services 4.0 4.8 4.7 4.5 4.4 4.3 4.4 4.3 4.7 4.42. Economic services 3.1 3.6 4.1 3.8 3.6 3.3 2.9 3.3 3.1 2.7
B. Non-developmental 2.8 3.8 4.0 4.1 4.3 4.7 4.4 4.3 4.6 5.4of which: Interest payments 1.0 1.5 1.6 1.7 1.8 1.9 1.8 1.8 2.0 2.0
to centre 0.6 0.9 1.0 1.0 1.1 1.1 1.1 1.1 1.2 1.2to others 0.4 0.6 0.7 0.7 0.7 0.8 0.7 0.7 0.8 0.8
C. Transfer to local bodies 0.1 0.1 0.2 0.2 0.1 0.1 0.1 0.1 0.2 0.2Net current balance 1.0 -0.8 -0.7 -0.7 -0.5 -0.6 -0.6 -1.1 -0.9 -1.9Capital expenditure [A+B+C] 3.5 2.3 2.0 2.1 1.9 2.0 1.9 1.5 2.0 1.9A. Developmental (1+2) 2.1 1.5 1.5 1.4 1.4 1.6 1.5 1.2 1.5 1.3
1. Social services 0.2 0.2 0.2 0.2 0.2 0.2 0.2 0.2 0.3 0.32. Economic services 1.9 1.3 1.2 1.1 1.2 1.4 1.2 1.0 1.2 1.1
B. Non-developmental 0.0 0.0 0.0 0.0 0.0 0.0 0.1 0.1 0.1 0.1C. Loans and advances (net) 1.4 0.7 0.5 0.7 0.5 0.3 0.4 0.3 0.5 0.5Gross fiscal deficit 2.6 3.1 2.7 2.7 2.4 2.6 2.5 2.7 2.9 3.8Financed by instrument:
Market loans 0.2 0.4 0.5 0.5 0.5 0.4 0.5 0.5 0.5 0.5Loans from centre (Net) 0.8 1.7 1.4 1.1 1.1 1.3 1.1 1.2 1.4 1.8Small savings & provident funds 0.2 0.5 0.4 0.5 0.5 0.5 0.4 0.4 0.5 0.6
Other 1.3 0.4 0.4 0.6 0.3 0.4 0.5 0.6 0.5 0.9
Memo:
Primary deficit 1.5 1.6 1.1 1.0 0.6 0.7 0.7 0.8 0.9 1.8Total debt outstanding 17.6 20.6 20.5 20.2 19.8 17.8 17.4 17.2 18.2 18.6
per cent of GDP9 Net transfer to States as a per cent of GDP8
7 \ _o E__ II
654- 32
I
-0 r-0 00 co N0o 00 O~ 0~ C, C, C7 C, a 00 W7I I '~~~~~~~~ 0
* Tax share transfers rL Grants to states Cl Net loans to states
'FRefers to the revised GDP senies with 1993-4 as the base. The figures prior to 1993-4 have been rebased using alinking factor.Note: RE = Revised Estimate; BE = Budget Estimate.Source: RBI, Report on Currency and Finance and RBI Bulletin, various issues; World Bank staff estimnates.

182 * Annex Tables
ANNEX TABLE 8.9India: Finances of CPEs
(Rs billion)
1990-1 1991-2 1992-3 1993-4 1994-5 1995-6 1996-7 1997-8 1998-9 1999-2000RE BE
Net internal resources (NIR) 107.2 120.1 161.3 188.5 241.5 290.8 252.5 279.7 335.1 386.1of which:Petroleum 27.2 26.3 54.8 45.5 76.6 91.4 56.5 57.4 101.8 107.6Telecommunications 24.9 26.6 31.8 42.5 53.0 78.3 78.3 101.2 126.6 145.9Railways 21.6 21.3 28.1 43.4 42.4 44.2 44.0 34.2 34.8 41.6Chemicals and fertilizers 4.1 3.1 5.3 7.5 7.8 18.2 16.4 19.8 15.3 13.6Power 3.5 6.1 2.6 5.6 10.4 11.1 7.9 7.0 6.3 12.0
Plan expenditure 280.5 294.2 366.6 438.9 485.9 521.8 542.5 549.6 578.0 681.6of which:Petroleum 42.7 41.4 84.6 110.9 109.5 117.5 114.0 115.6 123.8 121.2Telecommunications 31.1 36.5 50.7 64.7 75.4 98.3 100.8 111.4 134.9 167.9
Overall Balance -173.3 -174.1 -205.3 -250.4 -244.3 -231.0 -290.0 -269.9 -242.8 -295.5
Financing: 173.3 174.1 235.3 250.4 244.3 231.0 290.0 269.9 242.8 295.5External (net) 25.5 18.5 37.5 41.4 49.8 41.9 91.8 42.8 43.7 54.5Domestic 147.8 155.6 167.9 209.0 194.6 189.1 198.2 227.1 199.1 241.0
Budget support 76.0 69.2 65.8 74.5 82.0 64.2 68.4 75.5 75.8 86.4Loans 24.8 27.4 24.0 40.7 36.1 32.2 29.6 25.5 21.6 28.8Equity 51.2 41.8 41.7 33.8 45.9 32.0 38.8 50.1 54.2 57.5
Bonds 49.3 57.2 62.9 62.4 72.3 77.9 84.4 94.9 89.2 109.8Other 22.5 29.2 39.2 72.2 40.2 47.0 45.4 56.6 34.1 44.9
Memo (%):CPE deficit/GDPa -3.0 -2.6 -2.7 -2.9 -2.4 -1.9 -2.1 -1.7 -1.3 -1.5CPE deficit/GDPb -2.6 -2.2 -2.1 -1.9 -1.8 -1.5 -1.5 -1.3 -1.2 -1.3Plan exp./GDP 4.8 4.4 4.8 5.0 4.7 4.3 3.8 3.5 3.2 3.4NIR/GDP 1.9 1.8 2.1 2.1 2.3 2.4 1.8 1.8 1.9 1.9Budget support
(Plan+Non-plan)/GDP 1.5 1.2 0.9 0.9 0.9 0.6 0.6 0.6 0.5 0.5Share of petroleum and
telecom in plan exp. 26.3 26.5 36.9 40.0 38.1 41.3 39.6 41.3 44.8 42.4Share of petroleum and
telecom in NIR 48.6 44.1 53.6 46.7 53.6 58.3 53.4 56.7 68.1 65.7Non-plan loans to
CPEs (Rs billion) 10.7 7.6 6.0 7.8 9.1 11.8 14.6 15.8 18.5 17.4
a Refers to the deficit of all CPEs.b Refers to the CPE deficit excluding Petroleum and Telecom.
Note; RE = Revised Estimate; BE = Budget Estimate.
Source: Union Budget 1999-2000.

Annex Tables * 183
ANNEX TABLE 8.10Yearwise/PSU-wise Details of Shares Disinvested since 1991-2
S. No. Name of the PSE Per cent of central government holding (end March)1991 1992 1993 1994 1995 1996 1997 1998
1 Andrew Yule 72.3 62.8 62.8 62.8 62.8 62.8 62.8" 62.8*2 Bharat Earthmovers Ltd. 100.0 80.0 80.0 80.0 75.0 75.0 60.8 60.83 Bharat Electronics Ltd. 100.0 80.0 80.0 80.0 75.9 75.9 75.9 75.94 Bharat Heavy Electricals Ltd. 100.0 80.0 79.5 79.5 68.5 67.7 67.7 67.75 Bharat Petroleum Corpn. Ltd. 100.0 80.0 70.0 70.0 70.0 66.2 66.2 66.26 Bongaigaon Refineries & Petro. Ltd. 100.0 80.0 74.6 74.6 74.6 74.5 74.5 74.57 CMC Ltd. 100.0 83.5 83.5 83.5 83.3 83.3 83.3 83.38 Cochin Refineries Ltd. 61.1 55.0 55.0 55.0 55.0 55.0 55.0* 55.0*9 Dredging Corpn. Ltd. 100.0 98.6 98.6 98.6 98.6 98.6 98.6 98.610 Fert. & Chem. (Travancore) Ltd. 100.0 98.5 98.3 98.3 98.3 98.3 97.4* 97.4"11 HMT Ltd. 100.0 95.1 90.3 90.3 90.3 90.3 91.6 91.612 Hindustan Cables Ltd. 100.0 96.4 98.0 96.4 96.4 96.0 99.0 99.013 Hindustan Copper Ltd. 100.0 100.0 98.9 98.9 98.9 98.9 99.0 98.814 Hindustan Organic Chemicals Ltd. 100.0 80.0 80.0 80.0 80.0 80.0 58.6 58.615 Hindustan Petroleum Corpn. Ltd. 100.0 80.0 69.9 69.7 63.0 60.1 51.0 51.116 Hindustan Photofilms Mfg. Co. Ltd. 100.0 87.5 87.5 87.5 87.5 87.5 90.1 90.117 Hindustan Zinc Ltd. 100.0 80.1 75.9 75.9 75.1 75.1 75.9 75.918 Indian Petrochemicals Corpn. Ltd. 100.0 80.0 80.0 80.0 80.0 80.0 60.0 60.019 Indian Railway Const. Co.Ltd. 100.0 99.7 99.7 99.7 99.7 99.7 99.7 99.720 Indian Telephone Industries Ltd. 100.0 80.1 78.2 78.2 78.1 77.0 76.7* 76.7"21 Madras Refineries Ltd. 84.6 67.7 67.7 67.7 67.7 67.7 53.8* 53.8"22 Mahanagar Telephone Nigam Ltd. 100.0 80.0 80.0 80.0 67.2 65.7 65.7 56.223 Minerals & Metals Trading Corpn. 100.0 99.4 99.4 99.4 99.3 99.3 99.3 99.324 National Aluminium Co. Ltd. 100.0 97.3 87.2 87.2 87.2 87.2 87.2 87.225 National Fertilizers Ltd. 100.0 97.7 97.7 97.7 97.7 97.7 97.7 97.726 National Minerals Dev. Corpn Ltd. 100.0 100.0 98.4 98.4 98.4 98.4 96.4* 96.4*27 Neyveli Lignite Corporation 100.0 95.4 94.0 94.0 94.0 94.0 94.0 94.028 Rashtriya Chemicals & Fertilizers 100.0 94.4 92.5 92.5 92.5 92.5 92.5 93.029 Shipping corpn. of India 100.0 81.5 81.5 81.5 80.1 80.1 80.1 80.130 State Trading Corpn. 100.0 92.0 91.0 91.0 91.0 91.0 91.0 91.031 Steel Authority of India Ltd. 100.0 95.0 89.5 89.5 89.4 88.9 85.8 85.832 Videsh Sanchar Nigam Ltd. 100.0 85.0 85.0 85.0 85.0 82.0 67.0 67.033 Container Corporation of India 100.0 100.0 100.0 100.0 80.0 76.9 76.9 76.934 Indian Oil Corporation 99.9 99.9 99.9 99.9 96.0 91.2 91.1*, 91.1*35 Oil & Natural Gas Corporation 100.0 100.0 100.0 100.0 98.0 96.1 96.1 96.136 Engineers India Ltd. 100.0 100.0 100.0 100.0 94.0 94.0 94.0 94.037 Gas Authority of India Ltd. 100.0 100.0 100.0 100.0 96.6 96.6 96.6 97.038 Indian Tourism & Dev. Corp. 100.0 100.0 100.0 100.0 90.0 90.0 90.0 90.039 Kudermukh Iron & Ore
Company Ltd. 100.0 100.0 100.0 100.0 99.0 99.0 99.0 99.0
* The balance equity is held by state governments/other collaborators.Note: 1999 not available.Source: Public Enterprises Survey, various issues.

184 * Annex Tables
ANNEX TABLE 8.11India: Estimated Capital Inflows and Debt Stocks',1991-2 to 1998-9
(US $ billion)
Average annual inflows Debt oustanding as of
1991-2 1994-5 Mar. Mar. Mar. Mar.to to 1991 1994 1998 1999
1993-4 1996-7 1997-8 1998-9P
External debtc - - - - 91.2 94.5 94.3 98.2Public & publicly guaranteedb 3.5 -1.4 0.5 1.0 60.9 71.2 71.4 72.4NRI foreign currency & RIB 0.8 -0.6 0.9 4.2 10.2 12.7 12.0 16.1NRI rupees' 0.6 1.7 1.5 1.1 3.6 5.3 11.9 13.0Private medium & long-term 0.1 1.9 1.8 -3.7 1.5 1.8 10.3 6.6Short-term -1.6 1.0 -1.7 -0.7 8.5 3.6 5.0 4.3
Non-debt flowsFDI 0.3 2.0 3.6 2.4 - - - -
Portfolio from foreign institutionalinvestors 0.6 1.8 1.8 -0.4 - - - -
GDRs & offshore 0.7 1.5 0.8 0.3 - - - -
Total debt and non-debt 5.8 7.4 4.7 5.3 - - - -
Memo:Errors and Omissions -0.1 0.2 0.2 0.3 - - - -
Current Account Deficit 1.8 5.0 5.9 4.3 - - - -
- Not available.p Projected.a Differences in stocks of public and publicly guaranteed debt are not equal to the sums of flows because of exchange rate changes.b Includes IMF; excludes NRI foreign currency deposits-beginning in 1992-3, new NRI deposits had no explicit government
guarantees.c Part of these rupee deposits, which are non-repatriable, are not included in the external debt statistics; therefore, the sub-items
may not add up to the total.Source: External Debt, World Bank; NRI deposits and non-debt flows, RBI Annual Report 1999.

Annex Tables * 185
ANNEX TABLE 8.12Details of Mobilization in the Primary Market
1994-5 1995-6 1996-7 1997-8 1998-9P
No of Amount No of Amount No of Amount No of Amount No of Amountissues (Rs bn) issues (Rs bn) issues (Rs bn) issues (Rs bn) issues (Rs bn)
Non-government publiclimited companies 1678 264.2 1670 161.2 842 104.2- 102 31.4 48 50.1
Public sector undertakings(PSU bonds) 15 30.7 22 22.9 16 33.9 19 29.8 8 9.8
Government companies(Equities + Bonds) 7 8.9 2 10.0 3 6.5 1 0.4 - -
Banking/financial institutions 2 4.3 6 34.7 6 43.5 4 14.8 3 43.5
Total 1702 308.0 1700 228.8 867 188.1 126 76.4 59 103.4
Memo:
Euro/FCCB issues 31 67.4 5 13.0 16 55.9 7 40.1 3 11.5
UTI 18 86.1 34 -63.1 40 -30.4 79 28.8* 84 1.7*
Other mutual funds 36 26.6 39 4.8 47 10.1 58 11.3 82 29.2
- Not available.
P Provisional.* Net sales value with premium under all domestic schemes, includes reinvestment sales.
Note: In case of PSU bonds, the cumulative data are based on the details as and when made available to RBI by PSUs. PSU bondsinclude private placements.
Source: RBI.


STATISTICAL APPENDIX


Statistical Appendix
l. National Accounts
A1.1(a) National Accounts Summary (Rs billion at current prices) 191A1.1(b) National Accounts Summary (Rs billion at 1993-4 prices) 192A1.2(a) Gross Domestic Product at Factor Cost by Industry or Origin
(Rs billion at current prices) 194A1.2(b) Gross Domestic Product at Factor Cost by Industry or Origin
(Rs billion at 1993-4 prices) 195A1.2(c) Implicit Price Deflators for GDP at Factor Cost 196A1.3 Gross Savings and Investment (Rs billion) 197A1.4 Disposable Income and Its Use (Rs billion at current prices) 198A1.5(a) Gross Domestic Investment by Industry of Origin
(Rs billion at current prices) 199A1.5(b) Gross Domestic Investment by Industry of Origin (Rs billion at 1993-4 prices) 200A1.5(c) Investment Deflators by Industry of Use (1993-4 = 100) 201A1.6(a) Gross Domestic Investment in Public Sector (Rs billion at current prices) 202A1.6(b) Gross Domestic Investment in Public Sector (Rs billion at 1993-4 prices) 203
II. Balance of payments-Current Accounts
A2.1 Balance of Payments (US $ million at current prices) 204A2.2(a) Merchandise Exports (US $ million at current prices) 206A2.2(b) Merchandise Exports (US $ million at 1980-1 prices) 207A2.2(c) Export Unit Value Indices (US $ terms, at 1980-1 = 100 prices) 208A2.3(a) Merchandise Exports (US $ million at current prices) 209A2.3(b) Merchandise Exports (US $ million at 1980-1 prices) 210A2.3(c) Import Unit Value Indices (US $ terms, at 1980-1 = 100 prices) 211A2.4 Invisible on Current Account (US $ million) 212A2.5 Decomposition of Recent Export Growth
(US $ million at current prices-annual averages) 213

190 * Statistical Appendix
III. Balance of payments-Capital Accounts
A3.1(a) External Debt Summary: Debt Outstanding and Disbursed(US $ million at current prices) 214
A3.1(b) External Debt Summary: Disbursements (US S million at current prices) 215A3.1(c) External Debt Summary: Principal Repayments (US $ million at current prices) 216A3.1(d) External Debt Summary: Net Flows (US $ million at current prices) 217A3.1(e) External Debt Summary: Interest Payments (US $ million at current prices) 218A3 2 External Reserves (US $ million at current prices) 219
IV. Balance of payments-Current Accounts
A4.1 Central Government Finances Summary (Rs billion at current prices) 220A4.2 Budgetary Classification of Central Government Finances (Rs billion at current prices) 222A4.3 Budgetary Classification of State Government Finances (Rs billion at current prices) 224A4.4 Budgetary Classification of General Government Finances (Rs billion at current prices) 225A4.5 Tax Revenue: Centre and States (Rs billion at current prices) 226A4.6 Non-tax Revenue: Centre and States (Rs billion at current prices) 227A4.7 Revenue Expenditure of the Central Government (Rs billion at current prices) 228A4.8 Revenue Expenditure of the State Governments (Rs billion at current prices) 230A4.9 Capital Expenditure: Centre and States (Rs billion at current prices) 231A4.10 Transfers between Centre and States (Rs billion at current prices) 233A4. 11 Explicit Subsidies in the Central Government Budget (Rs billion at current prices) 234A4.12 Outstanding Debt of Central Government (Rs billion at current prices) 235A4.13 Outstanding Debt of State Governments (Rs billion at current prices) 237A4.14 Outstanding Debt of Central and State Governments (Rs billion at current prices) 238A4.15(a) Projected and Actual Plan Outlays by Sectors (Rs billion at current prices) 239A4.15(b) Projected and Actual Plan Outlays by Sectors (annual averages at 1980-1 prices-Rs billion) 240A4.15(c) Projected and Actual Plan Outlays by Sectors
(percentage distribution and achievement rates) 241
V. Money and Credit
A5.1 Money Supply and Sources of Change (Rs billion) 242A5.2 Base Money Supply and Sources of Change 1985-6 to 1998-9 (Rs billion) 243A5.3 Selected Monetary Policy Instruments 244A5.4 Structure of Short-term and Long-term Interest Rates (per cent per annum) 245A5.5 Sectoral Deployment of Gross Bank Credit (Rs billion-change during year) 246
VI. Agriculture, Industry, Transport, Energy, and Prices
A6.1 Production of Major Crops 247A6.2 Irrigated Area under Different Crops (million hectares) 248A6.3 Yield per Hectare of Major Crops (kgs) 249A6.4 Net Availability, Procurement, and Public Distribution of Foodgrains (million tons) 250A6.5(a) New Index of Industrial Production (1993-4 = 100) 251A6.5(b) Index of Industrial Production (1980-1 = 100, old series) 252A6.6 Production, Imports and, Consumption of Fertilizers (000' nutrient tons) 253A6.7 Indian Railways: Freight and Passenger Traffic 254A6.8 Petroleum Summary: Commodity Balance of Petroleum and Products (million tons) 255A6.9 Generation, Consumption, and Capacity of Electricity (000' GWH) 256A6.10 New Index Numbers of Wholesale Prices by Years (1981-2 = 100) 258A6.11 Consumer Price Index Numbers for Industrial Workers,
Urban Non-manual Employees, and Agricultural Labourers 259

TABLE A1.1 (a)National Accounts Summary
(Rs billion at current prices)
1987-8 1988-9 1989-90 1990-1 1991-2 1992-3 1993-4 1994-5 1995-6 1996-7 1997-8
GDPfc 3214.86 3845.67 4455.78 5209.77 6027.01 6877.52 7990.77 9434.08 11,032.38 12,852.59 14,266.70Agriculture and allied 999.72 1234.62 1375.33 1602.66 1871.15 2091.67 2424.38 2840.42 3127.91 3760.91 3921.34industry 844.46 1010.05 1207.18 1411.47 1553.66 1798.12 2058.00 2475.42 2997.92 3352.69 3727.24
Mining and Quarryiing 83.00 107.87 120.76 138.06 149.98 170.91 197.02 223.94 245.88 272.09 293.77Manufacturing 523.53 623.16 764.47 883.99 955.52 1100.71 1266.97 1550.16 1920.70 2152.93 2398.63Construction 174.96 205.42 234.32 284.29 320.35 364.60 404.33 463.69 554.63 629.13 676.63Electricity 62.98 73.60 87.64 105.13 127.80 161.90 189.68 237.63 276.71 298.54 358.21
Services 1370.68 1601.00 1873.26 2195.64 2602.21 2987.73 3508.39 4118.24 4906.55 5738.99 6618.12Net indirect taxes 389.23 435.33 485.46 582.87 644.63 758.09 778.75 944.34 1147.25 1245.90 1368.82GDPmp 3604.09 4281.00 4941.23 5792.64 6671.65 7635.61 8769.52 10,378.42 12,179.63 14,098.49 15,635.52
Resource gap (M-X) 85.93 124.93 112.19 151.79 39.01 125.43 110.46 265.23 386.69 500.17 527.20Imports (g+nfs) 296.23 388.59 465.46 565.11 610.00 808.31 987.25 1301.08 1713.70 1977.25 2203.37Exports (g+nfs) 210.31 263.66 353.28 413.32 570.99 682.88 876.78 1035.85 1327.01 1477.08 1676.17
Total expenditure 3690.02 4405.93 5053.42 5944.43 6710.66 7761.04 8879.98 10,643.65 12,566.32 14,598.66 16,162.72
Consumption 2899.67 3388.35 3890.36 4517.92 5232.30 5970.39 7058.98 8263.01 9446.53 11, 334.96 12,509.17
General govt. 437.11 506.54 580.09 661.17 743.36 841.14 962.40 1071.69 1270.24 1440.49 1738.64Private 2462.56 2881.81 3310.28 3856.75 4488.94 5129.25 6096.58 7191.32 8176.29 9894.47 10,770.53
Investment 790.35 1017.58 1163.06 1426.51 1478.36 1790.65 1821.00 2380.64 3119.79 3263.70 3653.55Fixed investment 757.96 899.43 1079.03 1301.91 1433.13 1667.82 1834.18 2224.59 2901.13 3270.90 3578.36
Change in stocks 32.39 118.15 84.04 124.61 45.22 122.82 -13.18 156.05 218.66 -7.20 75.19
Domestic savings 704.42 892.65 1050.87 1274.72 1439.35 1665.22 1710.54 2115.41 2733.10 2763.53 3126.35Net factor income -8.59 -15.29 -13.29 -64.36 -81.50 -89.79 -98.35 -100.70 -97.54 -104.27 -107.91Current transfers 34.99 38.42 38.01 37.14 92.75 112.11 165.18 254.11 284.63 439.04 439.58National savings 730.82 915.78 1075.59 1247.49 1450.60 1687.54 1777.36 2268.83 2920.19 3098.30 3458.02
Foreign savings 59.53 101.79 87.47 182.00 40.16 112.43 47.88 118.75 209.31 178.53 218.45
GDP per capita (Rs) 4573.72 5318.02 6011.23 6904.22 7793.98 8756.43 9842.33 11,429.98 13,138.76 14,950.68 16,303.98Per capita private consumption 3125.08 3579.89 4027.10 4596.84 5244.09 5882.16 6842.41 7919.95 8820.16 10,492.55 11,231.00
Average exchange rates:Rupees per US $ 12.97 14.48 16.66 17.95 24.52 28.95 31.37 31.40 33.46 35.50 37.16Rupees per SDR 17.12 19.26 21.37 24.85 33.43 37.14 43.89 45.79 50.48 50.89 51.22
Memo Items:Priv. consumption (CSO) 2547.39 2944.54 3297.88 3778.71 4378.84 4949.20 5672.39 6604.60 7573.84 8862.30 9604.01Population (mill) 788.00 805.00 822.00 839.00 856.00 872.00 891.00 908.00 927.00 943.00 959.00
Notes: 1. Data prior to 1993-4 are estimated using the old series growth rates.2. Exports, Inports, Foreign savings, Net factor income and Capital transfers numbers are used from the BOP.
Source: CSO, National Accounts Statistics 1998; Quick Estimates 1999; and World Bank staff estimates.
191

TABLE A1.1 (b)National Accounts Summary
(Rs billion at 1993-4 prices)
1987-8 1988-9 1989-90 1990-1 1991-2 1992-3 1993-4 1994-5 1995-6 1996-7 1997-8
GDPfc 5691.12 6297.22 6731.33 7092.20 7150.01 7526.15 7990.77 8610.64 9264.12 9989.78 10,491.91Agriculture and allied 1837.27 2135.04 2173.45 2255.24 2204.29 2337.50 2424.38 2555.22 2560.96 2801.79 2774.18industry 1452.54 1587.93 1744.76 1877.59 1864.77 1940.14 2058.00 2249.02 2523.90 2676.09 2834.44
Mining and quarrying 135.21 155.49 166.86 184.68 191.49 193.68 197.02 215.11 231.08 233.93 240.18Manufacturing 901.84 981.59 1097.24 1163.54 1121.23 1167.49 1266.97 1400.95 1611.01 1734.43 1851.80Registered 558.89 618.36 704.19 739.51 722.59 745.31 830.77 938.40 1082.00 1168.36 1261.33Unregistered 342.95 363.23 393.05 424.03 398.64 422.18 436.20 462.55 529.01 566.07 590.47Construction 299.93 323.15 339.65 379.22 387.48 400.55 404.33 425.60 460.54 473.82 493.13Electricity 115.56 127.71 141.01 150.15 164.58 178.41 189.68 207.36 221.27 233.91 249.33
Services 2401.32 2574.25 2813.12 2959.37 3080.95 3248.51 3508.39 3806.40 4179.26 4511.90 4883.29Net indirect taxes 685.10 711.75 738.30 800.28 775.88 829.36 778.75 852.71 958.73 974.55 1018.23
GDPmp 6376.23 7008.97 7469.63 7892.48 7925.89 8355.51 8769.52 9463.35 10,222.85 10,964.33 11,510.14Terms of trade effect 9.68 40.82 32.49 -25.13 -15.50 -15.52 0.00 -23.18 -176.47 -198.41 -124.72Gross domestic income 6385.91 7049.79 7502.12 7867.36 7910.39 8339.99 8769.52 9440.17 10,046.38 10,765.92 11,385.42
Resource gap (M-X) 217.17 307.30 231.10 203.22 32.41 122.39 110.46 213.26 138.78 190.55 286.13Imports (g+nfs) 715.35 828.92 824.04 850.12 749.17 888.72 987.25 1159.88 1397.11 1537.61 1717.09Capacity to import 507.86 562.44 625.43 621.78 701.26 750.82 876.78 923.44 1081.85 1148.65 1306.24[Exports (g+nfs)] 498.18 521.62 592.94 646.90 716.76 766.33 876.78 946.62 1258.32 1347.07 1430.96
Total expenditure 6603.08 7357.09 7733.23 8070.58 7942.80 8462.38 8879.98 9653.43 10185.16 10956.47 11,671.55
Consumption 5203.11 5696.10 6035.15 6164.75 6246.44 6556.25 7058.98 7470.43 7574.43 8380.22 8897.65
General govt 765.33 806.13 851.62 880.13 875.16 904.44 962.40 1036.88 1193.05 1327.85 1585.14Private 4437.79 4889.98 5183.53 5284.62 5371.28 5651.80 6096.58 6433.55 6381.38 7052.37 7312.51
Investment 1399.97 1660.99 1698.08 1905.83 1696.37 1906.13 1821.00 2183.00 2610.73 2576.25 2773.90Fixed investment 1324.24 1417.54 1540.60 1693.32 1625.54 1738.73 1834.18 2041.52 2428.26 2582.38 2716.53Change in stocks 75.73 243.45 157.48 212.51 70.82 167.40 -13.18 141.48 182.47 -6.13 57.37
Domestic savings 1260.52 1490.56 1608.14 1730.65 1703.63 1815.70 1710.54 1918.61 2215.21 2074.06 2257.62Net factor uncome -20.75 -32.61 -23.53 -96.83 -100.09 -98.72 -98.35 -89.77 -79.52 -81.08 -84.09Current transfers 84.49 81.96 67.29 55.86 113.92 123.26 165.18 226.53 232,05 341.42 342.57National savings 1324.27 1539.91 1651.90 1689.69 1717.45 1840.24 1777.36 2055.37 2367.74 2334.40 2516.10
Foreign savings 153.43 257.96 187.35 244.18 18.59 97.84 43.64 76.50 -13.74 -69.79 27.65
GDP per capita (Rs) 8091.66 8706.80 9087.15 9407.01 9259.22 9582.01 9842.33 10,422.19 11,027.89 11,627.07 12,002.23
Per capita private consumption 5631.71 6074.51 6306.00 6298.72 6274.86 6481.43 6842.41 7085.41 6883.91 7478.65 7625.14
(Contd.)
192

1987-8 1988-9 1989-90 1990-1 1991-2 1992-3 1993-4 1994-5 1995-6 1996-7 1997-8
Rupee deflators (1993-4 = 100):GDPmp 56.52 61.08 66.15 73.39 84.18 91.38 100.00 109.67 119.14 128.59 135.84
Imports(g+nfs) 41.41 46.88 56.49 66.47 81.42 90.95 100.00 112.17 122.66 128.59 128.32
Exports(g+nfs) 42.22 50.55 59.58 63.89 79.66 89.11 100.00 109.43 105.46 109.65 117.14
Total expenditure 55.88 59.89 65.35 73.66 84.49 91.71 100.00 110.26 123.38 133.24 138.48
Govt consumption 57.11 62.84 68.12 75.12 84.94 93.00 100.00 103.36 106.47 108.48 109.68
Priv. consumption 55.49 58.93 63.86 72.98 83.57 90.75 100.00 111.78 128.13 140.30 147.29
Fixed investment 57.24 63.45 70.04 76.88 88.16 95.92 100.00 108.97 119.47 126.66 131.73
Total investment 56.45 61.26 68.49 74.85 87.15 93.94 100.00 109.05 119.50 126.68 131.71
Notes: 1. Data prior to 1993-4 are estimated using the old series growth rates.
2. Exports, Imports, Foreign savings, Net factor Income and Capital transfers numbers are used from the BOP.
Source: CSO, National Accounts Statistics 1998; Quick Estimates 1999; and World Bank staff estimates.
193

TABLE A1.2 (a)Gross Domestic Product at Factor Cost by Industry of Origin
(Rs billion at current prices)
1987-8 1988-9 1989-90 1990-1 1991-2 1992-3 1993-4 1994-5 1995-6 1996-7 1997-8
Agricultural sector 999.72 1234.62 1375.33 1602.66 1871.15 2091.67 2424.38 2840.42 3127.91 3760.91 3921.34Agriculture 903.26 1125.93 1248.62 1461.85 1722.90 1924.19 2231.48 2612.39 2876.97 3475.01 3595.86Forestry & logging 64.17 70.92 81.25 86.01 87.14 91.96 102.16 117.04 123.65 135.35 144.69Fishing 32.29 37.78 45.46 54.80 61.10 75.52 90.74 110.99 127.29 150.55 180.79
Industry sector 844.46 1010.05 1207.18 1411.47 1553.66 1798.12 2058.00 2475.42 2997.92 3352.69 3727.24
Mining & quarrying 83.00 107.87 120.76 138.06 149.98 170.91 197.02 223.94 245.88 272.09 293.77Manufacturing 523.53 623.16 764.47 883.99 955.52 1100.71 1266.97 1550.16 1920.70 2152.93 2398.63
Registered 329.40 399.38 494.69 568.17 622.27 704.60 830.77 1035.75 1281.75 1443.33 1616.74Unregistered 194.13 223.78 269.77 315.82 333.25 396.11 436.20 514.41 638.95 709.60 781.89
Electricity, gas, & water 62.98 73.60 87.64 105.13 127.80 161.90 189.68 237.63 276.i1 298.54 358.21Construction 174.96 205.42 234.32 284.29 320.35 364.60 404.33 463.69 554.63 629.13 676.63
Services sector 1370.68 1601.00 1873.26 2195.64 2602.21 2987.73 3508.39 4118.24 4906.55 5738.99 6618.12Transport, Storage, & Com. 205.72 246.53 286.31 350.20 423.53 505.21 579.90 686.39 777.93 923.67 1079.03
Railways 43.56 47.51 55.75 64.33 73.42 84.46 96.48 112.03 125.80 132.56 147.49Other transport 128.88 157.42 183.84 230.62 284.49 339.45 383.14 448.54 501.58 610.51 719.21Storage 3.39 3.57 4.15 4.76 5.10 5.59 6.08 7.38 8.45 9.28 9.95Communication 29.90 38.03 42.57 50.49 60.53 75.72 94.20 118.44 142.10 171.32 202.38
Trade, hotels etc. 435.19 512.06 599.11 700.72 801.77 937.21 1109.95 1356.12 1648.66 1970.80 2218.10Banking & insurance 106.56 128.27 163.82 201.74 282.25 298.66 416.65 500.98 658.85 770.13 879.56Real estate etc. 276.69 301.70 334.28 361.92 397.19 435.11 479.18 525.57 574.77 620.98 672.51Public admin, & defence 193.60 224.99 260.32 292.42 339.15 391.03 430.94 480.09 565.87 646.42 832.77Other services 152.91 187.46 229.42 288.64 358.32 420.49 491.77 569.09 680.47 806.99 936.15
GDP at factor cost 3214.86 3845.67 4455.78 5209.77 6027.01 6877.52 7990.77 9434.08 11032.38 12852.59 14266.70
Note: Data prior to 1993-4 are estimated using the old series growth rates.
Source: CSO, National Accounts Statistics 1998, Quick Estimates 1999; and World Bank staff estimates.
194

TABLE A1.2 (b)Gross Domestic Product at Factor Cost by Industry of Origin
(Rs billion at 1993-4 prices)
1987-B 1988-9 1989-90 1990-1 1991-2 1992-3 1993-4 1994-5 1995-6 1996-7 1997-8
Agricultural sector 1837.27 2135.04 2173.45 2255.24 2204.29 2337.50 2424.38 2555.22 2560.96 2801.79 2774.18Agriculture 1671.46 1966.06 1987.37 2069.59 2015.53 2148.85 2231.48 2350.60 2348.42 2574.78 2541.48Forestry & logging 105.88 104.25 113.29 110.10 109.32 104.61 102.16 106.52 108.08 111.83 115.71Fishing 59.93 64.73 72.79 75.55 79.43 84.04 90.74 98.10 104.46 115.18 116.99
Industry sector 1452.54 1587.93 1744.76 1877.59 1864.77 1940.14 2058.00 2249.02 2523.90 2676.09 2834.44Mining & quarrying 135.21 155.49 166.86 184.68 191.49 193.68 197.02 215.11 231.08 233.93 240.18Manufacturing 901.84 981.59 1097.24 1163.54 1121.23 1167.49 1266.97 1400.95 1611.01 1734.43 1851.80
Registered 558.89 618.36 704.19 739.51 722.59 745.31 830.77 938.40 1082.00 1168.36 1261.33Unregistered 342.95 363.23 393.05 424.03 398.64 422.18 436.20 462.55 529.01 566.07 590.47
Electricity, gas. & water 115.56 127.71 141.01 150.15 164.58 178.41 189.68 207.36 221.27 233.91 249.33Construction 299.93 323.15 339.65 379.22 387.48 400.55 404.33 425.60 460.54 473.82 493.13
Services sector 2401.32 2574.25 2813.12 2959.37 3080.95 3248.51 3508.39 3806.40 4179.26 4511.90 4883.29Transport, storage, & com. 412.91 437.23 474.35 496.53 524.50 549.65 579.90 631.18 687.88 749.56 798.19
Railways 87.09 86.20 89.68 92.67 98.25 97.14 96.48 98.46 106.47 111.89 115.21Other transport 260.18 282.24 311.71 326.33 343.87 361.70 383.14 417.06 445.13 478.95 501.44Storage 5.55 5.39 5.59 5.82 5.75 5.92 6.08 6.21 6.52 6.46 6.55Communication 60.09 63.39 67.38 71.71 76.63 84.90 94.20 109.45 129.76 152.26 174.99
Trade, hotels, etc. 782.52 839.38 905.64 954.06 962.93 1028.47 1109.95 1275.32 1438.58 1559.54 1643.55Banking & insurance 185.60 216.30 257.59 280.17 328.78 347.69 416.65 451.90 513.43 580.94 658.14Real estate etc. 391.28 404.54 418.62 435.02 448.82 463.61 479.18 494.19 510.95 524.81 540.00Public admin & defence 335.00 357.03 387.13 391.07 399.42 420.13 430.94 436.20 466.35 487.36 586.31Other services 294.01 319.77 369.78 402.53 416.50 438.95 491.77 517.61 562.07 609.69 657.10
GDP at factor cost 5691.12 6297.22 6731.33 7092.20 7150.01 7526.15 7990.77 8610.64 9264.12 9989.78 10,491.91
Note: Data prior to 1993-4 are estimated using the old series growth rates.Source: CSO, National Accounts Statistics 1998, Quick Estimates 1999; and World Bank staff estimates.
195

TABLE A1.2 (c)Implicit Price Deflators for GDP at Factor Cost
(1993-4= 100)
1987-8 1988-9 1989-90 1990-1 1991-2 1992-3 1993-4 1994-5 1995-6 1996-7 1997-8
Agricultural sector 54.41 57.83 63.28 71.06 84.89 89.48 100.00 111.16 122.14 134.23 141.35
Agriculture 54.04 57.27 62.83 70.63 85.48 89.54 100.00 111.14 122.51 134.96 141.49
Forestry & logging 60.60 68.03 71.72 78.12 79.71 87.91 100.00 109.88 114.41 121.03 125.05
Fishing 53.89 58.36 62.46 72.54 76.92 89.86 100.00 113.14 121.86 130.71 154.53
Industry sector 58.14 63.61 69.19 75.17 83.32 92.68 100.00 110.07 118.78 125.28 131.50
Mining & quarrying 61.39 69.37 72.37 74.75 78.33 88.24 100.00 104.10 106.40 116.31 122.31
Manufacturing 58.05 63.49 69.67 75.97 85.22 94.28 100.00 110.65 119.22 124.13 129.53
Registered 58.94 64.59 70.25 76.83 86.12 94.54 100.00 110.37 118.46 123.53 128.18
Unregistered 56.61 61.61 68.64 74.48 83.60 93.83 100.00 111.21 120.78 125.36 132.42
Electricity, gas, & water 54.50 57.63 62.15 70.02 77.65 90.74 100.00 114.60 125.06 127.63 143.67
Construction 58.33 63.57 68.99 74.97 82.68 91.03 100.00 108.95 120.43 132.78 137.21
Services sector 57.08 62.19 66.59 74.19 84.46 91.97 100.00 108.19 117.40 127.20 135.53Transport, storage, & com. 49.82 56.38 60.36 70.53 80.75 91.91 100.00 108.75 113.09 123.23 135.18
Railways 50.02 55.11 62.16 69.42 74.73 86.94 100.00 113.78 118.16 118.47 128.02
Other transport 49.53 55.77 58.98 70.67 82.73 93.85 100.00 107.55 112.68 127.47 143.43
Storage 60.99 66.22 74.21 81.74 88.62 94.47 100.00 118.84 129.60 143.65 151.91
Communication 49.75 59.99 63.19 70.42 78.99 89.19 100.00 108.21 109.51 112.52 115.65
Trade, hotels etc. 55.61 61.00 66.15 73.45 83.26 91.13 100.00 106.34 114.60 126.37 134.96
Banking & insurance 57.41 59.30 63.60 72.01 85.85 85.90 100.00 110.86 128.32 132.57 133.64Real estate etc. 70.72 74.58 79.85 83.20 88.50 93.85 100.00 106.35 112.49 118.32 124.54
Public admin. & defence 57.79 63.02 67.24 74.78 84.91 93.07 100.00 110.06 121.34 132.64 142.04
Other services 52.01 58.62 62.04 71.71 86.03 95.80 100.00 109.95 121.06 132.36 142.47
GDP at factor cost 56.49 61.07 66.19 73.46 84.29 91.38 100.00 109.56 119.09 128.66 135.98
Source: Derived from Tables A 1.2(a) and A 1.2(b).
196

TABLE A1.3Gross Savings and Investment
(Rs billion)
1987-8 1988-9 1989-90 1990-1 1991-2 1992-3 1993-4 1994-5 1995-6 1996-7 1997-8
(At current prices)
Gross National Savings 730.82 915.78 1075.59 1247.49 1450.60 1687.54 1777.36 2268.83 2920.19 3098.30 3458.02
Households 600.32 751.05 884.12 1042.79 1130.41 1382.29 1434.92 1759.93 2108.61 2300.94 2705.15
Private corporate sector 58.27 83.72 117.24 150.35 201.31 197.60 296.67 350.28 582.63 584.68 588.87
Public sector 72.23 81.01 74.23 54.36 118.88 107.65 45.77 158.62 228.95 212.68 164.00
Foreign savings 59.53 101.79 87.47 182.00 40.16 112.43 47.88 118.75 209.31 178.53 218.45
Gross Domestic Investment 790.35 1017.58 1163.06 1426.51 1478.36 1790.65 1821.00 2380.64 3119.79 3263.70 3653.55
Change in stocks 32.39 118.15 84.04 124.61 45.22 122.82 -13.18 156.05 218.66 -7.20 75.19
Gross Fixed Capital Formation 757.96 899.43 1079.03 1301.91 1433.13 1667.82 1834.18 2224.59 2901.13 3270.90 3578.36
By type of asset:Construction 373.67 445.11 515.21 627.57 718.42 812.79 871.92 1006.54 1214.78 1332.21 1415.01
Machinery & equipment 384.29 454.32 563.82 674.34 714.71 855.04 962.26 1218.05 1686.35 1938.69 2163.35
By sector:Public sector 352.04 405.96 446.65 510.95 598.13 612.18 687.90 887.82 912.34 923.97 1068.56
Private sector 376.23 458.03 589.13 738.28 777.66 987.40 1146.28 1336.77 1988.79 2346.93 2509.80
GDPmp at current prices 3604.09 4281.00 4941.23 5792.64 6671.65 7635.61 8769.52 10,378.42 12,179.63 14,098.49 15,635.52
(At 1993-4 prices)
Gross Domestic Investment 1399.97 1660.99 1698.08 1905.83 1696.37 1906.13 1821.00 2183.00 2610.73 2576.25 2773.90
Change in stocks 75.73 243.45 157.48 212.51 70.82 167.40 -13.18 141.48 182.47 -6.13 57.37
Gross Fixed Capital Formation 1324.24 1417.54 1540.60 1693.32 1625.54 1738.73 1834.18 2041.52 2428.26 2582.38 2716.53
By type of asset:Construction 150.45 164.23 170.69 187.57 191.91 197.49 871.92 922.81 991.26 1003.99 996.25
Machinery & equipment 1173.79 1253.31 1369.91 1505.75 1433.63 1541.24 962.26 1118.71 1437.00 1578.39 1720.28
By sector:Public sector 186.60 195.39 196.51 206.C1 210.12 195.08 687.90 815.01 762.79 717.02 778.90
Private sector 212.95 232.31 268.32 304.90 280.34 329.53 1146.28 1226.51 1665.47 1865.36 1937.63
Notes:1. Data prior to 1993-4 are estimated using the old series growth rates.2. Exports, Imports, Foreign savings, Net factor income, and Capital transfers numbers are used from the BOP.
Source: CSO, National Accounts Statistics 1998; Quick Estimates 1999; and World Bank staff estimates.
197

TABLE A1.4Disposable Income and Its Uses
(Rs billion at current prices)
1987-8 1988-9 1989-90 1990-1 1991-2 1992-3 1993-4 1994-5 1995-6 1996-7 1997-8
GDPmp 3604.09 4281.00 4941.23 5792.64 6671.65 7635.61 8769.52 10378.42 12179.63 14098.49 15635.52Net factor income from abroad -8.59 -15.29 -13.29 -64.36 -81.50 -89.79 -98.35 -100.70 -97.54 -104.27 -107.91Other current transfers 34.99 38.42 38.01 37.14 92.75 112.11 165.18 254.11 284.63 439.04 439.58
Disposable income 3630.49 4304.13 4965.95 5765.41 6682.90 7657.93 8836.34 10531.84 12366.72 14433.26 15967.19Private disposable income 3121.15 3716.58 4311.63 5049.88 5820.66 6709.14 7828.17 9301.53 10867.53 12780.09 14064.55Public disposable income 509.34 587.55 654.32 715.53 862.24 948.79 1008.17 1230.31 1499.19 1653.17 1902.64
Gross National Savings 730.82 915.78 1075.59 1247.49 1450.60 1687.54 1777.36 2268.83 2920.19 3098.30 3458.02Private savings 658.59 834.77 1001.36 1193.13 1331.72 1579.89 1731.59 2110.21 2691.24 2885.62 3294.02Public savings 72.23 81.01 74.23 54.36 118.88 107.65 45.77 158.62 228.95 212.68 164.00
Final Consumption 2899.67 3388.35 3890.36 4517.92 5232.30 5970.39 7058.98 8263.01 9446.53 11334.96 12509.17Private consumption 2462.56 2881.81 3310.28 3856.75 4488.94 5129.25 6096.58 7191.32 8176.29 9894.47 10770.53Public consumption 437.11 506.54 580.09 661.17 743.36 841.14 962.40 1071.69 1270.24 1440.49 1738.64
Notes: 1. Data prior to 1993-4 are estimated using the old series growth rates.2. Exports, Imports, Foreign savings, Net factor income and Capital transfers numbers are used from the BOP.
Source: CSO, National Accounts Statistics 1998; Quick Estimates 1999; and World Bank staff estimates.
198

TABLE A1.5 (a)Gross Domestic Investment by Industry of Origin
(Rs billion at current prices)
1987-8 1988-9 1989-90 1990-1 1991-2 1992-3 1993-4 1994-5 1995-6 1996-7 1997-8
Agricultural sector 86.19 93.77 104.41 120.77 138.79 170.01 175.71 220.29 264.06 290.44 327.14Agriculture 78.27 84.56 93.54 108.16 124.93 155.02 158.45 199.93 239.42 262.96 297.00Forestry & logging 2.56 2.95 3.81 4.56 4.43 4.51 4.74 5.02 6.26 7.06 7.33Fishing 5.36 6.26 7.06 8.05 9.43 10.48 12.52 15.34 18.38 20.42 22.81
Industry sector 333.51 475.41 459.18 549.40 580.56 773.40 851.88 1138.83 1663.95 1633.33 1952.66Mining & quarrying 42.16 47.88 63.02 66.24 63.34 65.83 65.34 158.47 116.98 69.53 79.00Manufacturing 170.86 298.59 248.62 310.95 303.02 484.38 527.68 727.61 1263.37 1256.44 1510.68
Registered 166.92 334.85 241.09 314.73 313.66 531.25 419.32 614.20 1081.04 1057.74 1293.19Unregistered 51.29 59.46 75.89 85.69 78.64 104.82 108.36 113.41 182.33 198.70 217.49
Electricity, gas, & water 107.92 117.46 128.37 149.81 196.50 197.42 230.71 223.54 237.76 260.47 309.27Construction 12.57 11.49 19.17 22.40 17.71 25.77 28.15 29.21 45.84 46.89 53.71
Services sector 338.46 396.69 495.39 620.06 680.44 736.55 747.62 954.94 999.44 1089.74 1225.55Transport, storage, & com. 82.46 109.23 131.78 147.08 165.77 203.41 248.58 306.23 268.74 360.88 403.21
Railways 21.52 26.37 26.43 30.78 33.17 4919 55.81 49.92 52.10 59.39 53.57Other transport 44.09 58.07 73.82 83.45 96.04 97.56 127.17 135.66 165.59 195.96 206.72Storage 0.79 0.77 0.89 0.70 0.46 0.50 0.99 1.28 0.92 1.04 1.12Communication 16.07 24.02 30.64 32.15 36.09 56.17 64.61 119.37 50.13 104.49 141.80
Trade, hotels, etc. 18.23 3.16 59.74 93.81 80.10 32.10 57.50 71.55 86.34 87.30 101.13Banking & insurance 15.27 21.79 24.42 31.93 51.52 48.92 71.14 121.64 151.33 119.49 124.91Real estate, etc. 85.43 96.31 111.95 139.73 159.54 184.05 205.33 225.04 242.42 261.16 281.00Public admin. & defence 55.14 62.31 55.84 75.21 82.36 95.28 106.44 148.93 159.49 166.80 202.58Other services 81.92 103.89 111.65 132.30 141.15 172.79 58.63 81.55 91.12 94.11 112.72
Gross Domestic Investment 758.17 965.88 1058.97 1290.23 1399.80 1679.95 1775.21 2314.06 2927.45 3013.51 3505.35
Memo items:Gross Domestic investment' 796.51 1010.25 1194.41 1543.88 1506.72 1761.06 1963.79 2634.15 3143.40 3616.87 3873.77Errors & omissions -6.17 7.33 -31.34 -117.37 -28.37 29.59 -142.79 -253.51 -23.61 -353.17 -220.22Gross Domestic Investment
(unadjusted)b 790.35 1017.58 1163.06 1426.51 1478.36 1790.65 1821.00 2380.64 3119.79 3263.70 3653.55
a Refers to CSO's savings-based estimate of investment.b Refers to Gross Capital Formation unadjusted for errors and omissions, which is CSO's direct estimate of investment based on physical flows.
Note: Data prior to 1993-4 are estimated using the old series growth rates.
Source: CSO, National Accounts Statistics 1998; Quick Estimates 1999; and World Bank staff estimates.
199

TABLE A1.5 (b)Gross Domestic Investment by Industry of Origin
(Rs billion at 1993-4 prices)
1987-8 1988-9 1989-90 1990-1 1991-2 1992-3 1993-4 1994-5 1995-6 1996-7 1997-8
Agricultural sector 151.15 149.72 151.71 160.78 164.83 185.51 175.71 200.38 219.52 220.52 232.72Agriculture 139.02 136.88 137.10 144.69 148.94 169.19 158.45 182.14 199.44 199.02 209.95Forestry & logging 4.82 4.90 5.87 6.53 5.44 4.90 4.74 4.51 5.05 5.04 4.76Fishing 7.31 7.95 8.74 9.57 10.45 11.42 12.52 13.73 15.03 16.46 18.01
Industry sector 459.15 581.37 558.86 629.69 622.30 789.20 851.88 1043.47 1400.37 1302.32 1504.02Mining & quarrying 79.57 83.29 97.85 93.01 77.83 72.70 65.34 145.76 98.45 51.89 55.55Manufacturing 170.86 298.59 248.62 310.95 303.02 484.38 527.68 667.11 1064.59 1010.35 1178.52
Registered 295.34 559.41 350.17 421.94 361.24 578.34 419.32 561.60 909.90 851.50 1012.21Unregistered 88.00 94.23 111.44 115.33 88.00 113.22 108.36 105.51 154.69 158.85 166.31
Electricity, gas, & water 186.86 180.54 184.21 196.31 221.23 205.27 230.71 204.24 198.71 202.38 228.02Construction 21.86 18.95 28.18 29.42 20.22 26.85 28.15 26.36 38.62 37.70 41.93
Services sector 692.81 816.93 820.24 934.80 828.58 828.20 747.62 880.11 839.16 863.56 922.20Transport, storage, & com. 140.79 166.26 180.22 185.03 182.59 211.16 248.58 283.11 233.14 296.63 318.34
Railways 35.67 39.47 34.89 37.48 35.42 51.01 55.81 46.72 45.50 49.33 42.90Other transport 75.02 87.35 99.82 103.60 105.67 100.67 127.17 126.93 144.53 163.02 165.70Storage 1.16 1.02 1.19 0.92 0.44 0.44 0.99 1.19 0.77 0.82 0.83Communication 28.95 38.41 44.32 43.04 41.06 59.03 64.61 108.27 42.34 83.46 108.91
Trade, hotels, etc. 31.22 -1.56 89.78 135.09 98.09 28.69 57.50 65.34 68.96 66.04 71.71Banking & insurance 26.45 34.11 34.44 41.35 58.62 51.06 71.14 112.10 128.03 96.38 97.72Real estate, etc. 135.69 143.11 156.76 184.55 185.55 200.62 205.33 208.03 200.52 203.53 208.25Public admin. & defence 97.39 101.86 82.06 100.76 96.22 102.78 106.44 135.90 131.94 126.69 143.30Other services 261.27 373.16 276.98 288.02 207.49 233.90 58.63 75.63 76.57 74.29 82.88
Gross Domestic Investment 1303.10 1548.03 1530.80 1725.27 1615.71 1802.91 1775.21 2123.96 2459.05 2386.40 2658.94
Memo items:Gross Domestic Investmenta 1409.98 1647.97 1741.88 2057.84 1727.78 1873.86 1963.79 2415.65 2630.49 2855.08 2941.08Errors & omissions -992.12 -1152.20 -1235.04 -1488.99 -1221.45 -1305.16 -142.79 -232.65 -19.76 -278.83 -167.18Gross Domestic Investment
(unadjusted)b 1399.97 1660.99 1698.08 1905.83 1696.37 1906.13 1821.00 2183.00 2610.73 2576.25 2773.90
a Refers to CSO's savings-based estimate of investment.b Refers to Gross Capital Formation unadjusted for errors and omissions, which is CSO's direct estimate of investment based on physical flows.Note: Data prior to 1993-4 are estimated using the old series growth rates.Source: CSO, National Accounts Statistics 1998; Quick Estimates 1999; and World Bank staff estimates.
200

TABLE Al.5 (c)Investment Deflators by Industry of Use
(1993-4 = 100)
1987-8 1988-9 1989-90 1990-1 1991-2 1992-3 1993-4 1994-5 1995-6 1996-7 1997-8
Agricultural sector 57.03 62.63 68.82 75.11 84.21 91.64 100.00 109.94 120.29 131.71 140.57Agriculture 56.30 61.78 68.23 74.75 83.88 91.62 100.00 109.77 120.05 132.13 141.46Forestry & logging 53.14 60.26 64.94 69.86 81.44 92.13 100.00 111.31 123.96 140.08 153.99Fishing 73.31 78.74 80.75 84.16 90.25 91.74 100.00 111.73 122.29 124.06 126.65
Industrv Sector 72.64 81.77 82.16 87.25 93.29 98.00 100.00 109.14 118.82 125.42 129.83Mining & quarrying 52.98 57.48 64.41 71.22 81.38 90.55 100.00 108.72 118.82 133.99 142.21Manufacturing 100.00 100.00 100.00 100.00 100.00 100.00 100.00 109.07 118.67 124.36 128.18
Registered 56.52 59.86 68.85 74.59 86.83 91.86 100.00 109.37 118.81 124.22 127.76Unregistered 58.29 63.10 68.10 74.30 89.36 92.58 100.00 107.49 117.87 125.09 130.77
Electricity, gas, & water 57.76 65.06 69.69 76.32 88.82 96.17 100.00 109.45 119.65 128.70 135.63Construction 57.50 60.63 68.01 76.12 87.57 95.99 100.00 110.81 118.69 124.38 128.09
Services sector 48.85 48.56 60.40 66.33 82.12 88.93 100.00 108.50 119.10 126.19 132.89Transport, storage, & com. 58.57 65.70 73.12 79.49 90.79 96.33 100.00 108.17 115.27 121.66 126.66
Railways 60.34 66.81 75.76 82.13 93.65 96.42 100.00 106.85 114.51 120.39 124.87Other transport 58.77 66.48 73.95 80.56 90.89 96.91 100.00 106.88 114.57 120.21 124.76Storage 67.89 74.97 74.40 75.62 104.71 111.54 100.00 107.56 119.48 126.83 134.94Communication 55.51 62.54 69,14 74.70 87.91 95.15 100.00 110.25 118.40 125.20 130.20
Trade, hotels, etc. 58.41 -202.13 66.54 69.44 81.66 111.88 100.00 109.50 125.20 132.19 141.03Banking & insurance 57.75 63.89 70.91 77.23 87.88 95.82 100.00 108.51 118.20 123.98 127.82Real estate, etc. 62.96 67.30 71.42 75.71 85.98 91.74 100.00 108.18 120.90 128.32 134.93Public admin. & defence 56.62 61.17 68.05 74.65 85.60 92.70 100.00 109.59 120.88 131.66 141.37Other services 31.35 27.84 40.31 45.93 68.02 73.87 100.00 107.83 119.00 126.68 136.00
Gross Domestic Investment 58.18 62.39 69.18 74.78 86.64 93.18 100.00 108.95 119.05 126.28 131.83
Memo items:Gross Domestic Investmenta 56.49 61.30 68.57 75.02 87.21 93.98 100.00 109.05 119.50 126.68 131.71Gross Domestic Investment
(unadjusted)b 56.45 61.26 68.49 74.85 87.15 93.94 100.00 109.05 119.50 126.68 131.71
a Refers to CSO's savings-based estimate of investment.b Refers to Gross Capital Formation unadjusted for errors and omissions, which is CSO's direct estimate of investment based on physical flows.
Source: Derived from Tables A1.5(a) and A1.5(b).
201

TABLE A1.6 (a)Gross Domestic Investment in Public Sector
(Rs billion at current prices)
1987-8 1988-9 1989-90 1990-1 1991-2 1992-3 1993-4 1994-5 1995-6 1996-7 1997-8
Agricultural sector 33.02 34.41 33.53 36.27 36.52 41.73 49.18 60.31 65.80 67.78 76.26Agriculture 30.56 31.61 29.88 31.92 32.29 37.47 44.67 55.57 59.89 61.12 69.33Forestry & logging 2.42 2.78 3.62 4.33 4.20 4.25 4.48 4.74 5.90 6.66 6.92Fishing 0.04 0.02 0.03 0.02 0.03 0.01 0.03 0.00 0.01 0.00 0.01
Industry sector 192.84 204.32 235.48 277.65 324.88 309.66 298.88 420.56 458.92 447.16 488.22Mining & quarrying 40.96 47.59 62.46 65.04 61.92 63.76 63.36 148.16 110.97 65.70 72.92Manufacturing 50.73 51.72 54.66 71.45 85.08 82.98 48.92 68.58 126.81 142.15 135.26Electricity, gas, & water 98.81 105.62 117.55 137.69 174.10 158.41 178.96 195.88 214.63 231.45 272.03Construction 2.34 -0.61 0.81 3.47 3.78 4.51 7.64 7.94 6.51 7.86 8.01
Services sector 110.62 161.93 194.76 216.87 214.03 287.40 359.54 403.28 373.19 423.04 523.21Transport, storage, & com. 46.40 61.51 75.93 79.59 92.17 123.72 159.75 159.12 172.53 179.32 195.86
Railways 21.52 26.37 26.43 30.78 33.17 49.19 55.81 49.92 52.11 59.39 53.57Other transport 10.12 13.49 21.87 19.74 26.68 24.37 45.80 37.10 33.81 32.20 40.64Storage 0.46 0.27 0.36 0.46 0.20 0.17 0.64 0.55 0.27 0.43 0.52Communication 14.30 21.38 27.27 28.61 32.12 49.99 57.50 71.55 86.34 87.30 101.13
Trade, hotels, etc. -22.61 -2.98 17.48 14.54 -16.67 12.74 34.78 21.29 -38.81 -15.35 16.81Banking & insurance 9.49 14.82 16.99 17.98 23.59 18.04 19.72 25.84 32.44 36.36 41.27Real estate, etc. 6.63 7.49 7.24 6.09 8.56 10.08 10.66 12.65 14.13 16.38 20.20Public admin. & defence 55.14 62.31 55.84 75.21 82.36 95.28 106.44 148.93 159.49 166.80 202.58Other services 15.56 18.79 21.28 23.46 24.02 27.55 15.89 20.40 21.20 23.92 30.14
Gross Domestic Investment 336.47 400.65 463.77 530.79 575.43 638.80 707.60 884.15 897.91 937.98 1087.69
Note: Data prior to 1993-4 are estimated using the old series growth rates.
Source: CSO, National Accounts Statistics 1998; Quick Estimates 1999; and World Bank staff estimates.
202
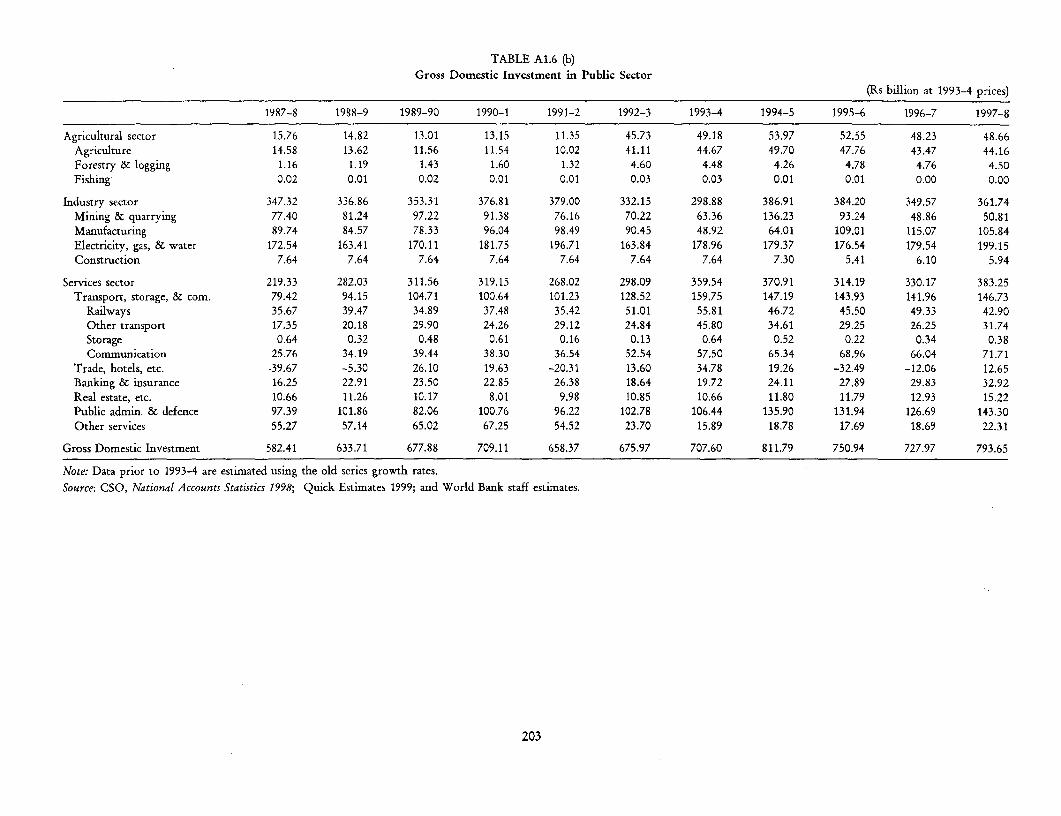
TABLE A1.6 (b)Gross Domestic Investment in Public Sector
(Rs billion at 1993-4 prices)
1987-8 1988-9 1989-90 1990-1 1991-2 1992-3 1993-4 1994-5 1995-6 1996-7 1997-8
Agricultural sector 15.76 14.82 13.01 13.15 11.35 45.73 49.18 53.97 52.55 48.23 48.66Agriculture 14.58 13.62 11.56 11.54 10.02 41.11 44.67 49.70 47.76 43.47 44.16Forestry & logging 1.16 1.19 1.43 1.60 1.32 4.60 4.48 4.26 4.78 4.76 4.50Fishing 0.02 0.01 0.02 0.01 0.01 0.03 0.03 0.01 0.01 0.00 0.00
Industry sector 347.32 336.86 353.31 376.81 379.00 332.15 298.88 386.91 384.20 349.57 361.74Mining & quarrying 77.40 81.24 97.22 91.38 76.16 70.22 63.36 136.23 93.24 48.86 50.81Manufacturing 89.74 84.57 78.33 96.04 98.49 90.45 48.92 64.01 109.01 115.07 105.84Electricity, gas, & water 172.54 163.41 170.11 181.75 196.71 163.84 178.96 179.37 176.54 179.54 199.15Construction 7.64 7.64 7.64 7.64 7.64 7.64 7.64 7.30 5.41 6.10 5.94
Services sector 219.33 282.03 311.56 319.15 268.02 298.09 359.54 370.91 314.19 330.17 383.25Transport, storage, & com. 79.42 94.15 104.71 100.64 101.23 128.52 159.75 147.19 143.93 141.96 146.73
Railways 35.67 39.47 34.89 37.48 35.42 51.01 55.81 46.72 45.50 49.33 42.90Other transport 17.35 20.18 29.90 24.26 29.12 24.84 45.80 34.61 29.25 26.25 31.74Storage 0.64 0.32 0.48 0.61 0.16 0.13 0.64 0.52 0.22 0.34 0.38Communication 25.76 34.19 39.44 38.30 36.54 52.54 57.50 65.34 68.96 66.04 71.71
Trade, hotels, etc. -39.67 -5.30 26.10 19.63 -20.31 13.60 34.78 19.26 -32.49 -12.06 12.65Banking & insurance 16.25 22.91 23.50 22.85 26.38 18.64 19.72 24.11 27.89 29.83 32.92Real estate, etc. 10.66 11.26 10.17 8.01 9.98 10.85 10.66 11.80 11.79 12.93 15.22Public admin. & defence 97.39 101.86 82.06 100.76 96.22 102.78 106.44 135.90 131.94 126.69 143.30Other services 55.27 57.14 65.02 67.25 54.52 23.70 15.89 18.78 17.69 18.69 22.31
Gross Domestic Investment 582.41 633.71 677.88 709.11 658.37 675.97 707.60 811.79 750.94 727.97 793.65
Note: Data prior to 1993-4 are estimated using the old series growth rates.Source: CSO, National Accounts Statistics 1998; Quick Estimates 1999; and World Bank staff estimates.
203

TABLE A2.1Balance of Payments
(US $ million at current prices)
1988-9 1989-90 1990-1 1991-2 1992-3 1993-4 1994-5 1995-6 1996-7 1997-8 1998-9
Exports of goods and non-factor services 18,213 21,201 23,028 23,288 23,585 27,947 32,990 39,657 41,607 45,109 47,484Merchandise (fob) 14,257 16,955 18,477 18,266 18,869 22,683 26,855 32,311 34,133 35,680 34,298Non-factor services 3956 4246 4551 5022 4716 5264 6135 7346 7474 9429 13,186
Imports of goods and non-factor services 26,843 27,934 31,485 24,879 27,917 31,468 41,437 51,213 55,696 59,297 58,565Merchandise (cia 23,618 24,411 27,914 21,064 24,316 26,739 35,904 43,670 48,948 51,187 47,544Non-factor services 3225 3523 3573 3815 3601 4729 5533 7543 6748 8110 11,021
Trade balance -9361 -7456 -9437 -2798 -5447 -4056 -9049 -11,359 -14,815 -15,507 -13,246Non-factor services balance 731 723 980 1207 1115 535 602 -197 726 1319 2165
Resource balance -8630 -6733 -8457 -1591 -4332 -3521 -8447 -11,556 -14,089 -14,188 -11,081
Net factor income -1056 -798 -3752 -3830 -3423 -3270 -3428 -3205 -3307 -3521 -3544Factor ser-vice receipts 397 936 368 221 376 395 886 1429 1073 1561 1935Factor service paymentSa 1453 1734 2120 4051 3799 3665 4314 4634 4380 5082 5479
Net current transfers 2654 2281 2069 3783 3872 5265 8093 8506 12,367 11,830 10,280Transfers receipts 2670 2297 2083 3798 3884 5287 8112 8539 12,435 11,875 10,341Transfer payments 16 16 14 15 12 22 19 33 68 45 61
Current account balance -7032 -5249 -10,140 -1638 -3883 -1526 -3782 -6255 -5029 -5879 -4345
Foreign investment 287 350 103 133 559 4153 5138 4892 6133 5385 2401Direct foreign investment 287 350 97 129 315 586 1314 2144 2821 3557 2462Portfolio investment 0 0 6 4 244 3567 3824 2748 3312 1828 -61
Official grant aid 406 500 462 460 363 368 416 345 410 379 307Net medium- & long-term capital 4976 5474 4801 3543 2642 2660 1745 2409 6580 5264 6122
Gross disbursement 3732 4273 7649 7499 4498 6389 7343 7185 10,627 10,256 9952Principal repayments 1084 1094 4384 4246 3848 4934 5770 5879 7397 6117 5572
Capital flows NEI -1374 -1992 1789 100 58 2885 3310 -3399 -1892 -940 -159Net short-term capital 941 334 1075 -515 -1079 -769 393 49 838 -96 -2714Othersb 141 167 1907 1855 2015 4707 3900 -2496 -2003 -77 3357
Capital flows n.e.i.C -2456 -2492 -1193 -1240 -878 -1053 -883 -952 -727 -767 -802
Overall balance -2737 -917 -2985 2598 -261 8540 6827 -2008 6202 4209 4326
(Contd.)
204

1988-9 1989-90 1990-1 1991-2 1992-3 1993-4 1994-5 1995-6 1996-7 1997-8 1998-9
Net IMF credit 1306 67 1214 786 1288 187 -1143 -1715 -975 -613 -393
Change in reserves (excl. gold) (- = increase) 1432 850 1771 -3384 -1027 -8727 -5684 3723 -527 -3596 -3933
Memo items:NRI deposits (net) US $ million) 2328 2295 1536 290 2001 1205 172 1103 3350 1125 1742
End of years gross reserves (excl. gold) (US $ million) 4959 4109 2338 5722 6749 15,476 21,160 17,437 22,664 26260 30,193
Reserves in months of imports 2.5 2.0 1.0 3.3 3.3 6.9 7.1 4.8 5.6 6.2 7.6
Current account balance/GDP (as percentage) -2.4 -1.8 -3.1 -0.6 -1.5 -0.5 -1.1 -1.7 -1.3 -1.4 -1.0
Debt service ratiod (as percentage) 27.9 28.5 32.1 28.8 27.6 24.8 26.1 27.3 21.7 21.2 17.3
Note: Interest payments, disbursements and external debt data are from the World Bank Debt Reporting System.
a Includes interest on military debt to FSU and returns on foreign investments.
b Residual item including reserve valuation changes, rupee trade imbalance, etc.
c Corresponds to bilateral balance or servicing of the Russia debt from 1990-1 onwards.
d As proportion of gross current receipts (GNFS exports + factor receipts + current transfer receipts).
Source: GOI; RBI; Ministry of Commerce, MoF, Economic Survey, various issues; World bank staff estimates.
205

TABLE A2.2 (a)Merchandise Exports
(US $ million at current prices)
1987-8 1988-9 1989-90 1990-1 1991-2 1992-3 1993-4 1994-5 1995-6 1996-7 1997-8 1998-9
Primary exports 3161 3243 3883 4324 4132 3874 4916 5214 7257 8035 7665 6850Fish 411 435 412 535 589 602 813 1126 1010 1129 1208 1039Rice 261 229 256 257 308 337 410 384 1365 894 907 1474Cashews 243 191 221 249 276 259 334 397 370 362 379 383Coffee 202 203 208 140 135 130 174 335 449 402 456 405Tea 463 421 550 596 494 337 338 311 350 292 505 547Spices 260 190 170 133 161 136 181 195 237 339 379 384Iron ore 427 465 557 584 585 381 438 413 514 481 476 380Other primary 893 1110 1508 1829 1584 1692 2227 2052 2961 4137 3355 2237
Manufactured exports 8928 10,727 12,730 13,821 13,733 14,663 17,322 21,417 24,538 25,434 27,348 26,817Chemicals 618 890 1287 1176 1591 1378 1813 2434 2358 2689 2649 2482Leather manufactures 964 1051 1170 1449 1276 1278 1300 1611 1730 1606 1631 1620Textiles 1407 1312 1598 2266 2164 2153 2536 3297 3829 4755 4893 4011Garments 1403 1452 1936 2235 2211 2394 2586 3282 3674 3753 3877 4446Gems & jewelery 2015 3034 3178 2923 2753 3072 3995 4500 5273 4753 5347 5906Engineering goods 1141 1558 1967 2157 2246 2458 3023 3486 4389 4052 4436 3805Petroleum products 500 349 418 522 417 476 398 439 454 482 353 89Other manufacturesa 879 1081 1176 1092 1074 1453 1672 2367 2830 3344 4161 4460
Total Exports (Commerce)b 12,089 13,970 16,613 18,145 17,865 18,537 22,238 26,631 31,795 33,469 35,013 33,667
Statistical discrepancy 557 287 342 332 401 332 445 224 516 664 667 631
Total Exports (BOP) 12,646 14,257 16,955 18,477 18,266 18,869 22,683 26,855 32,311 34,133 35,680 34,298
a Including unclassified exports.b Net of crude petroleum exports.
Source: Ministry of Commerce (DGCIS); RBI; MoF, Economic Survey, various issues; World Bank staff estimates.
206
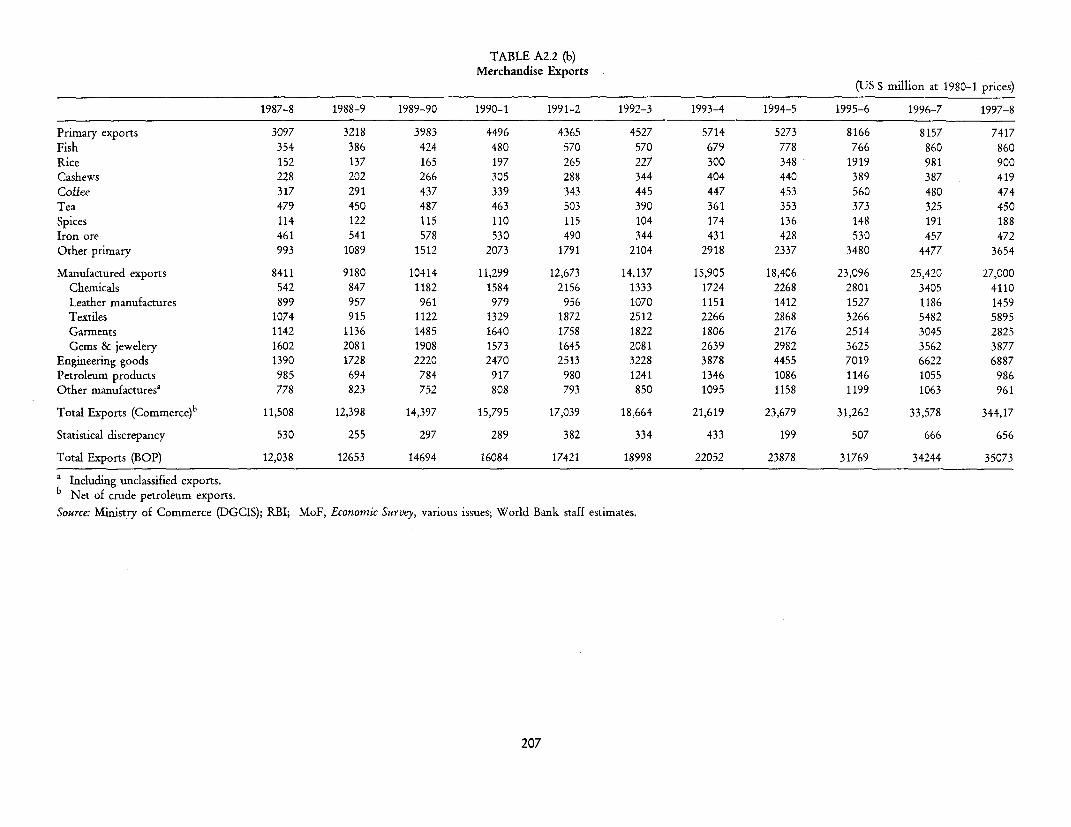
TABLE A2.2 (b)Merchandise Exports
(JS $ million at 1980-1 prices)
1987-8 1988-9 1989-90 1990-1 1991-2 1992-3 1993-4 1994-5 1995-6 1996-7 1997-8
Primary exports 3097 3218 3983 4496 4365 4527 5714 5273 8166 8157 7417
Fish 354 386 424 480 570 570 679 778 766 860 860
Rice 152 137 165 197 265 227 300 348 1919 981 900
Cashews 228 202 266 305 288 344 404 440 389 387 419
Coffee 317 291 437 339 343 445 447 453 560 480 474
Tea 479 450 487 463 503 390 361 353 373 325 450
Spices 114 122 115 110 115 104 174 136 148 191 188
Iron ore 461 541 578 530 490 344 431 428 530 457 472
Other primary 993 1089 1512 2073 1791 2104 2918 2337 3480 4477 3654
Manufactured exports 8411 9180 10414 11,299 12,673 14,137 15,905 18,406 23,096 25,420 27,000
Chemicals 542 847 1182 1584 2156 1333 1724 2268 2801 3405 4110
Leather manufactures 899 957 961 979 956 1070 1151 1412 1527 1186 1459
Textiles 1074 915 1122 1329 1872 2512 2266 2868 3266 5482 5895
Garments 1142 1136 1485 1640 1758 1822 1806 2176 2514 3045 2825
Gems & jewelery 1602 2081 1908 1573 1645 2081 2639 2982 3625 3562 3877
Engineering goods 1390 1728 2220 2470 2513 3228 3878 4455 7019 6622 6887
Petroleum products 985 694 784 917 980 1241 1346 1086 1146 1055 986
Other manufacturesa 778 823 752 808 793 850 1095 1158 1199 1063 961
Total Exports (Commerce)b 11,508 12,398 14,397 15,795 17,039 18,664 21,619 23,679 31,262 33,578 344,17
Statistical discrepancy 530 255 297 289 382 334 433 199 507 666 656
Total Exports (BOP) 12,038 12653 14694 16084 17421 18998 22052 23878 31769 34244 35073
a Including unclassified exports.b Net of crude petroleum exports.Source: Ministry of Commerce (DGCIS); RBI; MoF, Economic Survey, various issues; World Bank staff estimates.
207
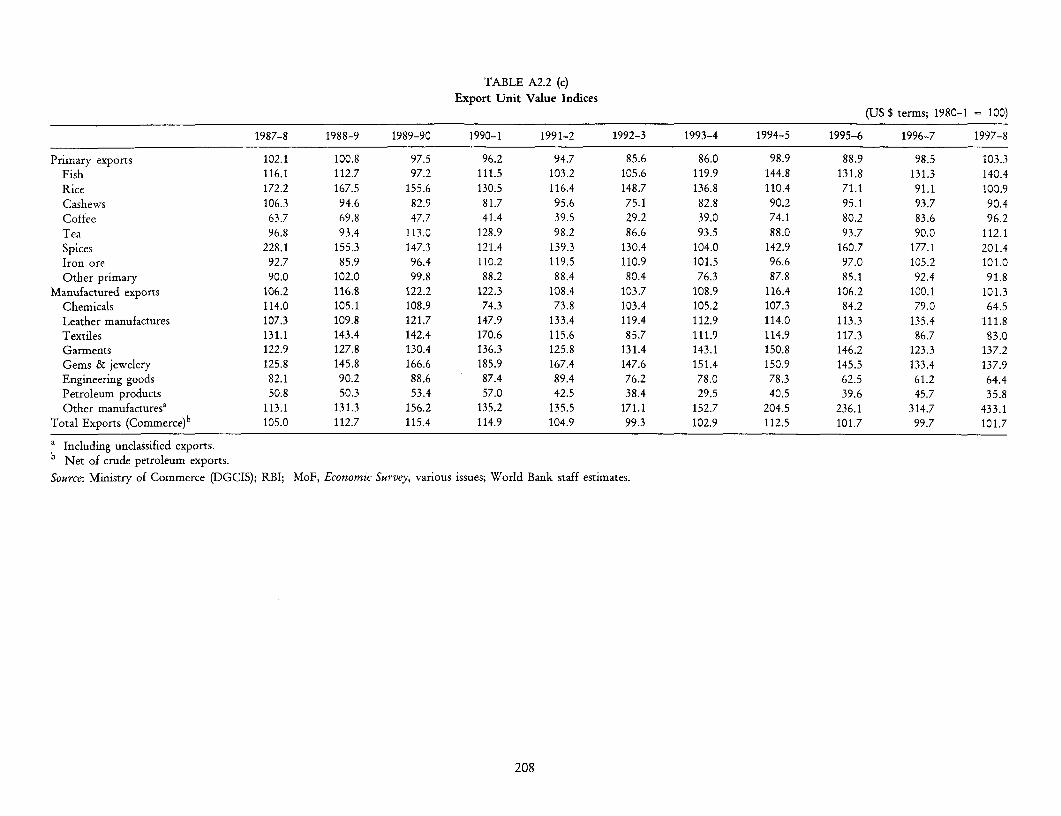
TABLE A2.2 (c)Export Unit Value Indices
(US $ terms; 1980-1 = 100)
1987-8 1988-9 1989-90 1990-1 1991-2 1992-3 1993-4 1994-5 1995-6 1996-7 1997-8
Primary exports 102.1 100.8 97.5 96.2 94.7 85.6 86.0 98.9 88.9 98.5 103.3Fish 116.1 112.7 97.2 111.5 103.2 105.6 119.9 144.8 131.8 131.3 140.4Rice 172.2 167.5 155.6 130.5 116.4 148.7 136.8 110.4 71.1 91.1 100.9Cashews 106.3 94.6 82.9 81.7 95.6 75.1 82.8 90.2 95.1 93.7 90.4Coffee 63.7 69.8 47.7 41.4 39.5 29.2 39.0 74.1 80.2 83.6 96.2Tea 96.8 93.4 113.0 128.9 98.2 86.6 93.5 88.0 93.7 90.0 112.1Spices 228.1 155.3 147.3 121.4 139.3 130.4 104.0 142.9 160.7 177.1 201.4Iron ore 92.7 85.9 96.4 110.2 119.5 110.9 101.5 96.6 97.0 105.2 101.0Other primary 90.0 102.0 99.8 88.2 88.4 80.4 76.3 87.8 85.1 92.4 91.8
Manufactured exports 106.2 116.8 122.2 122.3 108.4 103.7 108.9 116.4 106.2 100.1 101.3Chemicals 114.0 105.1 108.9 74.3 73.8 103.4 105.2 107.3 84.2 79.0 64.5Leather manufactures 107.3 109.8 121.7 147.9 133.4 119.4 112.9 114.0 113.3 135.4 111.8Textiles 131.1 143.4 142.4 170.6 115.6 85.7 111.9 114.9 117.3 86.7 83.0Garments 122.9 127.8 130.4 136.3 125.8 131.4 143.1 150.8 146.2 123.3 137.2Gems & jewelery 125.8 145.8 166.6 185.9 167.4 147.6 151.4 150.9 145.5 133.4 137.9Engineering goods 82.1 90.2 88.6 87.4 89.4 76.2 78.0 78.3 62.5 61.2 64.4Petroleum products 50.8 50.3 53.4 57.0 42.5 38.4 29.5 40.5 39.6 45.7 35.8Other manufacturesa 113.1 131.3 156.2 135.2 135.5 171.1 152.7 204.5 236.1 314.7 433.1
Total Exports (Commerce)b 105.0 112.7 115.4 114.9 104.9 99.3 102.9 112.5 101.7 99.7 101.7
a Including unclassified exports.b Net of crude petroleum exports.
Source: Ministry of Commerce (DGCIS); RBI; MoF, Economic Survey, various issues; World Bank staff estimates.
208

TABLE A2.3 (a)Merchandise Imports
(US $ million at current prices)
1987-8 1988-9 1989-90 1990-1 1991-2 1992-3 1993-4 1994-5 1995-6 1996-7 1997-8 1998-9
Food 1292 1203 714 690 426 702 550 1464 1295 1536 1845 2543
Foodgrains 25 437 227 102 71 334 93 29 24 137 292 233
Edible oils 709 503 127 182 101 58 53 199 676 825 744 1696
Others 557 263 361 407 254 311 404 1236 595 574 809 614
Other consumer goods 600 700 800 851 637 782 680 790 1075 859 1135 1157
POL 3118 3009 3768 6028 5364 6100 5754 5928 7526 10036 8217 6435
Crude petroleuma 2395 1891 2455 3409 3189 3691 3407 3285 3442 5222 4278 3350
Petroleum products 723 1047 1313 2619 2175 2409 2347 2643 4084 4814 3939 3084
Capital goodsb 5064 4803 5288 5836 4256 4532 6243 7638 10330 9923 9796 9122
Intermediate: Primary 2997 3800 4488 4653 3821 4554 4533 4296 5599 6321 6840 6720
Fertilizer raw material 243 301 329 348 311 279 194 288 301 226 273 287
Gems 1538 1984 2546 2082 1968 2443 2634 1630 2105 2925 3343 3763
Other 1217 1515 1613 2222 1543 1832 1705 2378 3193 3171 3225 2671
Intermediate: Manufactures 4085 5982 6161 6015 4907 5211 5541 8537 10,850 10,456 13,651 15,882
Fertilizer manufactures 145 340 741 636 645 698 632 764 1381 686 844 787
Iron & steel 1018 1335 1383 1178 799 779 795 1164 1446 1371 1343 1135
Non-ferrous metals 493 536 753 614 341 395 479 718 904 1106 920 671
Others 2429 3771 3284 3588 3112 3339 3635 5974 7120 7294 10,543 13,288
Total Imports (Commerce)a 17,156 19,497 2,1219 24,073 19,411 21,882 23,301 28,654 36,675 39,132 41,484 41,858
Statistical discrepancy 2660 4121 3192 3841 1653 2434 3438 7250 6995 9816 9703 5686
Total Importsa 19,816 23,618 24,411 27,914 21,064 24,316 26,739 35,904 43,670 48,948 51,187 47,544
a Net of crude oil exports.b 1987-8 onwards capital goods includes project goods.
Source: Ministry of Commerce (DGCIS); RBI; MoF, Economic Survey, various issues; World Bank staff estimates.
209

TABLE A2.3 (b)Merchandise Imports
(US $ million at 1980-1 prices)
1987-8 1988-9 1989-90 1990-1 1991-2 1992-3 1993-4 1994-5 1995-6 1996-7 1997-8
Food 1710 1968 865 807 446 1015 612 1344 1125 1550 1991Foodgrains 35 1021 310 126 77 662 165 33 27 272 574Edible oils 980 539 160 259 111 51 56 171 522 697 556Others 695 409 395 422 258 302 391 1140 576 581 861
Other consumer goods 513 555 643 647 475 559 482 535 763 639 886
POL 5944 6734 7272 8287 9409 11,757 12,131 11,679 13,483 15,319 15,277Crude petroleuma 4630 4651 5089 5405 6264 7660 8128 7825 9033 10,264 10,236Petroleum products 1314 2083 2183 2882 3145 4097 4003 3854 4449 5055 5042
Capital Goodsb 4203 3702 4142 4314 3081 3146 4304 5027 7132 7168 7432
Intermediate: Primary 2419 2841 3363 3314 2660 3076 3074 2779 3781 4463 5053Fertilizer raw material 161 178 157 174 152 147 121 177 172 117 135Gems 1262 1511 1965 1521 1408 1676 1795 1060 1437 2088 2507Other 996 1151 1242 1619 1101 1253 1158 1543 2173 2258 2411
Intermediate: Manufactures 3529 4728 5057 4792 3858 4199 4320 5982 7828 7694 10318Fertilizer manufactures 320 472 876 808 830 1116 981 904 1392 710 914Iron & steel 874 1275 1162 937 622 581 589 824 1074 1065 1096Non-ferrous metals 540 553 775 599 326 362 436 624 824 1054 922
Others 1795 2428 2244 2448 2080 2140 2314 3630 4539 4864 7385
Total Imports (Commerce)' 18,318 20,528 21,342 22,161 19,929 23,751 24,924 27,346 34,112 36,833 40,957
Statistical discrepancy 2840 4339 3210 3536 1697 2642 3678 6919 6506 9240 9580
Total Importsa 21,158 24,867 24,552 25,697 21,626 26,392 28,602 34,265 40,618 46,073 50,537
a Net of crude oil exports.b 1987-8 onwards capital goods includes project goods.Source: Ministry of Commerce (IGCIS); RBI; MoF, Economic Survey, various issues; World Bank staff estimates.
210

TABLE A2.3 (c)Import Unit Value Indices
(US $ terms; 1980-1 = 100)
1987-8 1988-9 1989-90 1990-1 1991-2 1992-3 1993-4 1994-5 1995-6 1996-7 1997-8
Food 75.5 61.1 82.6 85.5 95.5 69.2 89.9 109.0 115.1 99.1 92.7
Foodgrains 72.0 42.8 73.1 80.3 91.9 50.4 56.0 89.3 90.1 50.3 50.8Edible oils 72.4 93.4 79.3 70.2 90.9 114.0 94.5 116.5 129.4 118.4 133.8Others 80.2 64.5 91.4 96.5 98.6 102.8 103.5 108.4 103.3 98.8 94.0
Other consumer goods 117.1 126.1 124.5 131.5 134.3 140.0 141.0 147.7 140.8 134.6 128.1
POL 52.5 44.7 51.8 72.7 57.0 51.9 47.4 50.8 55.8 65.5 53.8Crude petroleum 51.7 40.7 48.2 63.1 50.9 48.2 41.9 42.0 38.1 50.9 41.8Petroleum products 55.0 50.3 60.1 90.9 69.1 58.8 58.6 68.6 91.8 95.2 78.1
Capital goods 120.5 129.7 127.7 135.3 138.1 144.1 145.0 151.9 144.8 138.4 131.8
Intermediate: Primary 123.9 133.8 133.4 140.4 143.6 148.1 147.5 154.6 148.1 141.6 135.4Fertilizer raw material 150.7 168.7 209.6 199.8 204.7 190.1 160.8 163.3 175.4 192.5 2C2.2Gems 121.9 131.3 129.6 136.9 139.8 145.8 146.8 153.7 146.5 140.1 133.4Other 122.2 131.6 129.9 137.3 140.2 146.2 147.2 154.2 147.0 140.5 133.7
Intermediate: Manufactures 115.7 126.5 121.8 125.5 127.2 124.1 128.3 142.7 138.6 135.9 132.3Fertilizer manufactures 45.3 72.0 84.6 78.6 77.7 62.5 64.4 84.5 99.2 96.5 92.3Iron & steel 116.5 104.7 119.0 125.8 128.4 133.9 134.8 141.2 134.6 128.7 122.5Non-ferrous metals 91.3 96.9 97.1 102.5 104.6 109.1 109.9 115.1 109.7 104.9 99.8Others 135.3 155.3 146.3 146.5 149.6 156.0 157.1 164.6 156.9 149.9 142.8
Total Imports (Conmmerce) 93.7 95.0 99.4 108.6 97.4 92.1 93.5 104.8 107.5 106.2 101.3
Source: Ministry of Commerce (DGCIS); RBI; MoF, Economic Survey, various issues; World Bank staff estimates.
211

TABLE A2.4Invisibles on Current Account
(US $ million)
1987-8 1988-9 1989-90 1990-1 1991-2 1992-3 1993-4 1994-5 1995-6 1996-7 1997-8 1998-9
Gross Receipts 6741 7023 7479 7002 9041 8976 10,946 15,133 17,314 20,982 22,865 25,462Non-factor services 3571 3956 4246 4551 5022 4716 5264 6135 7346 7474 9429 13,186of which:
Transport 680 898 907 983 939 982 1433 1696 2011 1953 1836 1925Travel 1431 1419 1433 1456 1977 2098 2222 2365 2713 2878 2914 2993Others 1460 1639 1906 2112 2106 1636 1609 2074 2622 2643 4679 8268
Factor income 446 397 936 368 221 376 395 886 1429 1073 1561 1935
Current transfersa 2724 2670 2297 2083 3798 3884 5287 8112 8539 12,435 11,875 10,341
Gross Payments 4161 4694 5273 7705 7881 7412 8416 9866 12,210 11,196 13,237 16,561Non-factor services 3027 3225 3523 3571 3815 3601 4729 5533 7543 6748 8110 11,021
of which:Transportb 870 1027 1115 1093 1289 1485 1765 1863 2169 2394 2522 2680Travel 376 405 403 392 465 385 497 818 1167 858 1437 1743Others 1781 1793 2005 2086 2061 1731 2467 2852 4207 3496 4151 6598
Factor income 1108 1453 1734 4120 4051 3799 3665 4314 4634 4380 5082 5479
Current transfers 26 16 16 14 15 12 22 19 33 68 45 61
Net Receipts 2580 2329 2206 -703 1160 1564 2530 5267 5104 9786 9628 8901Non-factor services 544 731 723 980 1207 1115 535 602 -197 726 1319 2165
of which:Transport -190 -129 -208 -110 -350 -503 -332 -167 -158 -441 -686 -755Travel 1055 1014 1030 1064 1512 1713 1725 1547 1546 2020 1477 1250Others -321 -154 -99 26 45 -95 -858 -778 -1585 -853 528 1670
Factor income -662 -1056 -798 -3752 -3830 -3423 -3270 -3428 -3205 -3307 -3521 -3544
Current transfers 2698 2654 2281 2069 3783 3872 5265 8093 8506 12,367 11,830 10,280
a Excluding foreign grants, and including the Bhopal settlement in 1988-9.b Excluding freight included in c.i.f value of merchandise imports.
Source: Ministry of Commerce (DGCIS); RBI; MoF, Economic Survey, various issues; World Bank staff estimates.
212

TABLE A2.5Decomposition of Recent Export Growth
(US $ million at current prices-annual averages)
1985-6 to 1991-2 to Increase Contribution1990-1 1998-9 to growth
(O/o)
Manufactured Exports 9717 21,409 11,692 82.5
Consumption goods 6227 12,689 6462 45.6Leather 997 1506 509 3.6Gems (gross) 2333 4450 2116 14.9Garments 1490 3278 1788 12.6Textiles 1406 3455 2048 14.4
Investment goodsa 1415 3487 2072 14.6
Intermediate goods 2076 5233 3158 22.3Chemicals 806 2174 1369 9.7Petroleum prod. 421 388 -33 -0.2Othersb 849 2670 1822 12.8
Primary Exports 3507 5993 2486 17.5Fish 425 939 515 3.6Rice 220 760 540 3.8Cashews 224 345 121 0.9Coffee 200 311 110 0.8Tea 499 397 -102 -0.7Spices 200 252 52 0.4Iron ore 489 459 -30 -0.2Other primary 1251 2531 1280 9.0
Total Exports (Customs)c 13,225 27,402 14,177 100.0Discrepancy 478 485 7Total Exports (BOP)c 13,703 27,887 14,184
Memo items:Gems (net)d 630 1849 1218
a Refers to engineering goods.b Including unclassified exports.C Total exports, fob, net of crude oil.d Exports less imports of gems and jewelery.
Source: Ministry of Commerce, (DGCIS); RBI.
213

TABLE A3.1(a)External Debt Summary: Debt Outstanding and Disbursed
(US $ million at current prices)
1987-8 1988-9 1989-90 1990-1 1991-2 1992-3 1993-4 1994-5 1995-6 1996-7 1997-8 1998-9
A. Public & publicly guaranteed LT 44,174 50,073 64,789 71,062 73,355 77,921 83,906 87,480 80,346 78,049 79,402 85,206
1. Official creditors 30,356 31,180 43,648 48,383 49,446 52,987 55,856 61,997 57,112 54,541 52,165 54,168a. Multilateral 16,588 18,061 19,664 21,768 23,964 26,130 27,826 31,486 30,048 29,332 29,391 30,521
aa. of which IBRD 4661 5590 6615 7685 8459 9067 9870 11,120 9849 8768 8138 7993ab.of which IDA 11,615 12,019 12,521 13,312 14,203 15,339 15,978 17,666 17,499 17,616 17,912 18,562
b. Bilateral 13,768 13,119 23,984 26,615 25,482 26,857 28,029 30,511 27,065 25,209 22,775 23,647
2. Private creditors 13,818 18,893 21,140 22,679 23,909 24,934 28,050 25,483 23,234 23,509 27,236 31,038a. Commercial banks 10,459 12,899 14,694 16,130 16,025 17,006 18,727 14,588 13,412 16,061 18,758 20,950b. Suppliers credits 715 632 539 434 455 817 1211 1017 875 1197 946 956c. Bonds (including IDB) 1214 1785 2412 2638 4102 4021 3832 3740 3257 1364 3407 6002d. Other private 1430 3576 3496 3477 3328 3090 4281 6139 5691 4887 4126 3130
B. Private non-guaranteed LT 1652 1473 1551 1488 1545 1205 1770 6427 6618 7382 9208 8409C. Total LT DOD (A+B) 45,827 51,546 66,340 72,550 74,901 79,126 85,676 93,907 86,964 85,431 88,610 93,615D. Use of IMF credit 4023 2573 1566 2623 3451 4799 5040 4312 2374 1313 664 288E. Short-term debt 5673 6358 7501 8544 7070 6340 3626 4264 5049 6726 5046 4329F. Total External Debt (C+D+E) 55,522 60,477 75,407 83,717 85,421 90,264 94,342 102,483 94,387 93,470 94,320 98,232
Memo items:Total NRI deposits 8616 10,482 12,368 13,953 12,676 14,258 14,498 14,661 13,894 14,785 14,105 14,543Rupee debt to FSU - - 11,021 12,847 10,420 10,616 10,084 9624 8233 7511 5874 4731External debt (% of GDP) 20.0 20.5 25.4 25.9 31.4 34.2 33.8 31.0 25.9 23.5 22.4 22.9
- Not available.
Source: World Bank, DRS data.
214

TABLE A3.1(b)External Debt Summary: Disbursements
(US $ million at current prices)
1987-8 1988-9 1989-90 1990-1 1991-2 1992-3 1993-4 1994-5 1995-6 1996-7 1997-8 1998-9
A. Public & publicly guaranteed LT 6921 10,155 7009 6376 6896 7105 7361 6685 5961 5897 7193 9801
1. Official creditors 3618 3635 3553 3572 4364 4160 3645 3334 2828 3040 3708 4464
a. Multilateral 2269 2625 2105 2210 2758 2424 2084 2230 1942 2234 2021 2040
aa. IBRD 1295 1716 1445 1219 1231 852 1216 741 589 686 542 534
ab. IDA 917 755 566 762 953 1186 669 966 729 906 830 866
b. Bilateral 1349 1010 1447 1361 1606 1736 1561 1104 886 806 1687 2424
2. Private creditors 3303 6520 3457 2804 2532 2945 3716 3351 3133 2857 3485 5336
a. Commercial banks 2968 3361 2623 1983 504 2145 1545 870 1719 1698 903 1961
b. Suppliers credits 5 16 3 7 78 415 466 213 71 449 2 141
c. Bonds (including IDB) 116 679 705 427 1619 0 0 0 86 275 2109 2775
d. Other private 213 2463 126 387 332 384 1705 2267 1258 436 471 459
B. Private non-guaranteed LT 348 175 240 214 309 254 1060 867 1179 785 1886 500
C. Total LT disbursements (A+B) 7269 10,330 7249 6590 7204 7358 8421 7552 7140 6682 9079 10,301
D. IMF 0 0 0 1754 1233 1623 323 0 0 0 0 0
E. Net short-term capital 727 685 1143 1043 -1474 -730 -2714 638 785 1677 838 0
F. Total disbursements (C+D+E) 7269 10,330 7249 8344 8437 8982 8744 7552 7140 6682 9079 10,301
Source: World Bank, DRS data.
215

TABLE A3.1(c)External Debt Summary: Principal Repayments
(JS $ million at current prices)
1987-8 1988-9 1989-90 1990-1 1991-2 1992-3 1993-4 1994-5 1995-6 1996-7 1997-8 1998-9
A. Public & publicly guaranteed LT 1604 1665 1569 2332 2569 2947 3538 5021 6764 6405 6645 62851. Official creditors 1120 990 1064 1238 1469 1618 1890 2365 3876 2856 4114 3487
a. Multilateral 508 397 467 609 703 838 1000 1102 1513 1218 1217 1295aa. of which IBRD 430 303 352 472 527 634 758 827 943 840 820 842ab.of which IDA 69 81 98 114 141 155 174 194 226 234 250 288
b. Bilateral 612 593 597 629 766 780 890 1263 2364 1638 2897 21922. Private creditors 485 675 505 1094 1101 1329 1647 2656 2888 3549 2531 2797
a. Commercial banks 284 363 213 250 293 438 666 1054 1796 1484 1160 836b. Suppliers credits 98 96 98 113 58 73 111 472 143 131 240 150d. Bonds (including IDB) 6 14 27 280 239 206 338 404 311 1242 2 264e. Other private 97 202 167 452 511 612 532 726 637 692 1130 1548
B. Private non-guaranteed LT 290 280 322 318 273 306 495 123 156 240 293 292C. Total LT repayments (A+B) 1894 1944 1891 2651 2842 3253 4033 5144 6920 6645 6938 6576D. IMF repayments 1082 1210 1008 726 460 334 134 1174 1719 972 613 390E. Total LT repayments (C+D) 2976 3155 2899 3376 3302 3587 4167 6318 8639 7618 7551 6966
Source: World Bank, DRS data.
216

TABLE A3.1(d)External Debt Summary: Net Flows
(US $ million at current prices)
1987-8 1988-9 1989-90 1990-1 1991-2 1992-3 1993-4 1994-5 1995-6 1996-7 1997-8 1998-9
A. Public & publicly guaranteed LT 5316 8490 5440 4044 4327 4158 3823 1664 -803 -508 548 35161. Official creditors 2498 2645 2489 2334 2895 2542 1755 969 -1048 184 -406 977
a. Multilateral 1761 2228 1638 1601 2055 1586 1084 1128 429 1016 804 745
aa. of which IBRD 865 1414 1093 747 704 218 458 -86 -354 -154 -278 -308ab. of which IDA 848 675 468 648 812 1031 495 772 503 672 580 578
b. Bilateral 737 417 850 732 840 956 671 -159 -1478 -832 -1210 232
2. Private creditors 2818 5845 2952 1710 1431 1616 2069 695 245 -692 954 2539a. Commercial banks 2684 2999 2410 1733 211 1707 879 -184 -77 214 -257 1125b. Suppliers credits -93 -80 -95 -106 20 342 355 -259 -72 318 -238 -9c. Bonds (including IDB) 110 665 678 147 1380 --206 -338 -404 -225 -967 2107 2511d. Other private 117 2261 -41 -65 -179 -228 1173 1541 621 -256 -659 -1089
B. Private non-guaranteed LT 59 -104 -82 -104 36 -52 565 744 1023 545 1593 208C. Total LT repayments (A+B) 5375 8386 5358 3939 4362 4105 4388 2408 220 37 2141 3725D. Net IMF credit -1082 -1210 -1008 1028 773 1289 189 -1174 -1719 -972 -613 -390E. Net short debt flows 727 685 1143 1043 -1474 -730 -2714 638 785 1677 838 0F. Total net flows (C+D+E) 4293 7175 4350 4968 5135 5395 4577 1234 -1499 -936 1528 3335
Memo item:Total NRI net flows 1992 2328 2295 1536 290 2001 1205 172 1103 3350 1125 1742
Source: Derived from Tables A3.1(b) and A3.1(c).
217

TABLE A3.1(e)External Debt Summary: Interest Payments
(US $ million at current prices)
1987-8 1988-9 1989-90 1990-1 1991-2 1992-3 1993-4 1994-5 1995-6 1996-7 1997-8 1998-9
A. Public & publicly guaranteed LT 1837 1993 3162 3647 3403 3317 3400 3702 3813 3584 4292 4300
1. Official creditors 810 940 1351 1497 1512 1631 1674 1846 1867 1680 1599 1553a. Multilateral 479 581 640 738 796 899 940 1014 1061 966 907 887
aa. of which IBRD 378 474 529 615 643 709 721 768 770 674 590 536ab.of which IDA 98 98 90 97 101 109 114 121 131 130 131 135
b. Bilateral 331 360 711 759 717 732 733 832 806 714 693 667
2. Private creditors 1027 1053 1811 2150 1891 1685 1727 1856 1946 1904 2692 2746a. Commercial banks 778 787 1518 1751 1426 1200 1206 1159 1263 886 2212 2297b. Suppliers credits 67 61 53 43 31 31 55 108 68 65 90 61c. Bonds (including IDB) 79 104 143 182 196 230 258 221 183 572 99 118d. Other private 103 100 96 174 238 224 208 368 432 381 291 270
B. Private non-guaranteed LT 147 127 140 135 126 123 139 391 531 426 173 467C. Total LT interest (A+B) 1985 2120 3302 3782 3529 3440 3539 4093 4344 4010 4465 4767D. IMF service charges 297 233 184 134 203 271 271 228 182 87 50 25E. Interest paid on ST debt 429 437 570 899 826 399 367 312 385 268 349 327F. Total interest paid (C+D+E) 2710 2790 4056 4815 4559 4110 4178 4633 4911 4365 4864 5118
Memo item:Total NRI interest payments 715 609 1076 1282 1036 918 905 1046 1247 1627 1807 1719
Source: World Bank, DRS data.
218

Statistical Appendix * 219
TABLE A3.2External Reserves
(US $ million at current prices)
Reserve Reserves ReservesForeign position excluding including Use of Netexchange SDRs in the fund gold Gold' gold IMF credit reserves
1980-1 5850 603 405 6858 370 7228 327 69011981-2 3582 473 405 4460 335 4795 964 38311982-3 4281 291 393 4965 324 5289 2876 24131983-4 5099 230 518 5847 320 6167 4150 20171984-5 5482 145 483 6110 325 6435 3932 25031985-6 5972 131 554 6657 417 7074 4290 27841986-7 5924 179 626 6729 471 7200 4291 29091987-8 5618 97 676 6391 508 6899 3653 32461988-9 4226 103 630 4959 473 5432 2364 30681989-90 3368 107 634 4109 487 4596 1493 3103
1990-1 2236 102 - 2338 3496 5834 2623 32111991-2 5631 90 1 5722 3499 9221 3451 57701992-3 6434 18 297 6749 3380 10,129 4798 53311993-4 15,068 108 300 15,476 4078 19,554 5040 14,5141994-5 20,809 19 332 21,160 4370 25,530 4312 21,2181995-6 17,044 82 311 17,436 4561 21,997 2374 19,6231996-7 22,367 2 295 22,664 4054 26,718 1313 25,4051997-8 25,975 1 284 26,260 3391 29,651 664 28,9871998-9 29,522 8 663 30,193 2417 32,610 563 32,047
End of the Month1995
March 20,809 19 332 21,160 3810 24,970 4312 20,658June 19,601 95 334 20,030 3778 23,808 3933 19,875September 19,064 49 320 19,433 3713 23,146 3377 19,768December 17,467 139 316 17,922 3614 21,536 2923 18,612
1996March 17,044 82 311 17,436 3810 21,246 2374 18,872June 17,526 128 307 17,961 3778 21,739 2079 19,660September 18,433 57 306 18,796 3713 22,509 1755 20,754December 19,742 122 306 20,170 3614 23,784 1560 22,224
1997March 22,367 2 295 22,664 3386 26,050 1313 24,737June 25,404 3 295 25,702 3300 29,002 1144 27,858September 25,697 30 290 26,017 3129 29,146 946 28,200December 24,324 77 287 24,688 2880 27,568 796 26,772
1998March 25,975 1 284 26,260 2497 28,757 664 28,093June 23,933 81 283 24,297 2472 26,769 563 26,206September 26,184 14 292 26,490 2405 28,895 480 28,415December 26,958 83 300 27,341 2492 29,833 401 29,432
1999March 29,522 8 663 30,193 2417 32,610 288 32,322June 30,559 8 653 31,212 2307 33,519 206 33,313
- Not available.
Note: IMF credit refers to use of IMF credit within the General Resources Account (GRA) excluding TrLst Fund, StructuralAdjustment Facility (SAF), and Enhanced Structural Adjustment Facility (ESAF) loans.a Valued at 35 SDR's per fine troy ounce.Source: IMF, IFS, various issues.
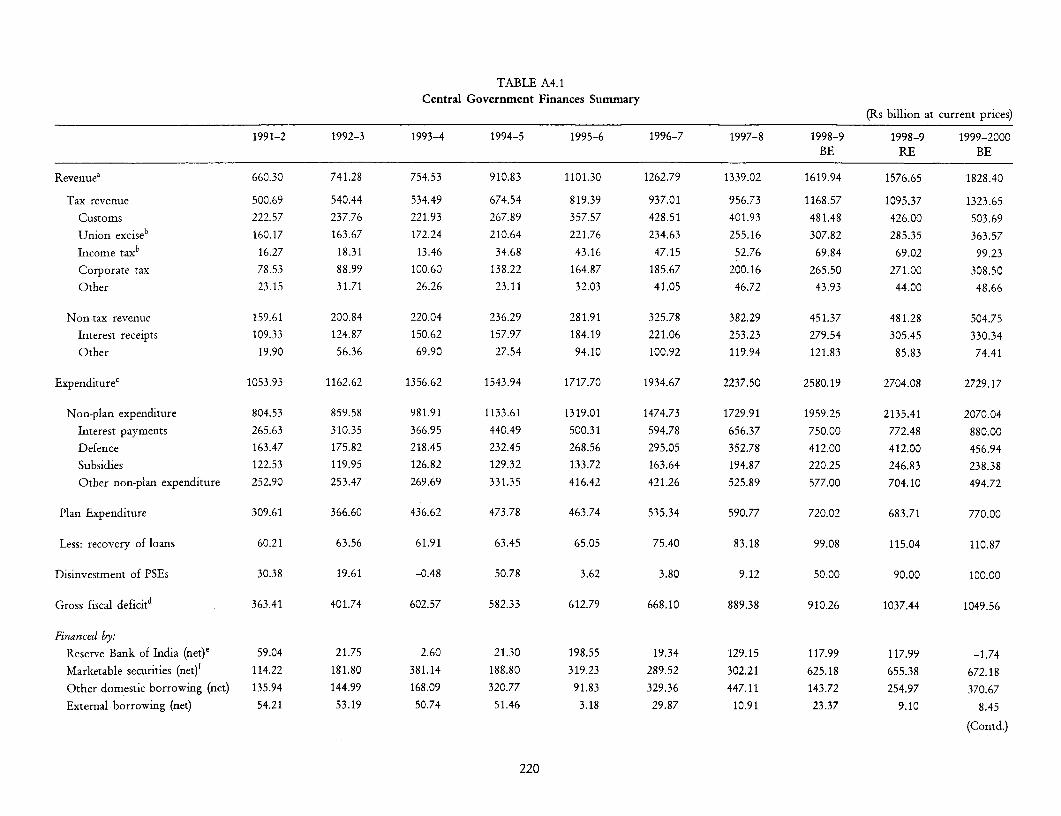
TABLE A4.1Central Government Finances Summary
(Rs billion at current prices)
1991-2 1992-3 1993-4 1994-5 1995-6 1996-7 1997-8 1998-9 1998-9 1999-2000BE RE BE
Revenuea 660.30 741.28 754.53 910.83 1101.30 1262.79 1339.02 1619.94 1576.65 1828.40
Tax revenue 500.69 540.44 534.49 674.54 819.39 937.01 956.73 1168.57 1095.37 1323.65
Customs 222.57 237.76 221.93 267.89 357.57 428.51 401.93 481.48 426.00 503.69
Union exciseb 160.17 163.67 172.24 210.64 221.76 234.63 255.16 307.82 285.35 363.57
Income taxb 16.27 18.31 13.46 34.68 43.16 47.15 52.76 69.84 69.02 99.23
Corporate tax 78.53 88.99 100.60 138.22 164.87 185.67 200.16 265.50 271.00 308.50
Other 23.15 31.71 26.26 23.11 32.03 41.05 46.72 43.93 44.00 48.66
Non-tax revenue 159.61 200.84 220.04 236.29 281.91 325.78 382.29 451.37 481.28 504.75
Interest receipts 109.33 124.87 150.62 157.97 184.19 221.06 253.23 279.54 305.45 330.34
Other 19.90 56.36 69.90 27.54 94.10 100.92 119.94 121.83 85.83 74.41
Expenditure' 1053.93 1162.62 1356.62 1543.94 1717.70 1934.67 2237.50 2580.19 2704.08 2729.17
Non-plan expenditure 804.53 859.58 981.91 1133.61 1319.01 1474.73 1729.91 1959.25 2135.41 2070.04
Interest payments 265.63 310.35 366.95 440.49 500.31 594.78 656.37 750.00 772.48 880.00
Defence 163.47 175.82 218.45 232.45 268.56 295.05 352.78 412.00 412.00 456.94
Subsidies 122.53 119.95 126.82 129.32 133.72 163.64 194.87 220.25 246.83 238.38
Other non-plan expenditure 252.90 253.47 269.69 331.35 416.42 421.26 525.89 577.00 704.10 494.72
Plan Expenditure 309.61 366.60 436.62 473.78 463.74 535.34 590.77 720.02 683.71 770.00
Less: recovery of loans 60.21 63.56 61.91 63.45 65.05 75.40 83.18 99.08 115.04 110.87
Disinvestment of PSEs 30.38 19.61 -0.48 50.78 3.62 3.80 9.12 50.00 90.00 100.00
Gross fiscal deficitd 363.41 401.74 602.57 582.33 612.79 668.10 889.38 910.26 1037.44 1049.56
Financed by:
Reserve Bank of India (net)' 59.04 21.75 2.60 21.30 198.55 19.34 129.15 117.99 117.99 -1.74
Marketable securities (net)f 114.22 181.80 381.14 188.80 319.23 289.52 302.21 625.18 655.38 672.18
Other domestic borrowing (net) 135.94 144.99 168.09 320.77 91.83 329.36 447.11 143.72 254.97 370.67
External borrowing (net) 54.21 53.19 50.74 51.46 3.18 29.87 10.91 23.37 9.10 8.45
(Contd.)
220
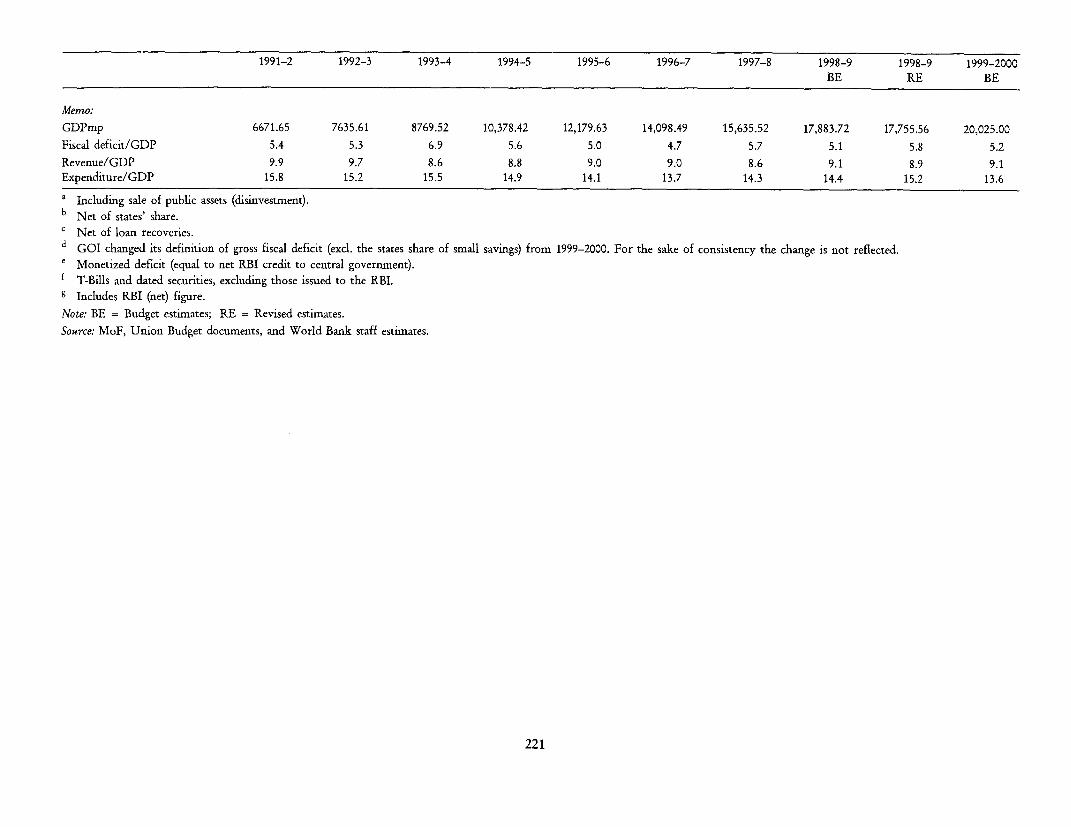
1991-2 1992-3 1993-4 1994-5 1995-6 1996-7 1997-8 1998-9 1998-9 1999-2000BE RE BE
Memo:
GDPmp 6671.65 7635.61 8769.52 10,378.42 12,179.63 14,098.49 15,635.52 17,883.72 17,755.56 20,025.00
Fiscal deficit/GDP 5.4 5.3 6.9 5.6 5.0 4.7 5.7 5.1 5.8 5.2
Revenue/GDP 9.9 9.7 8.6 8.8 9.0 9.0 8.6 9.1 8.9 9.1
Expenditure/GDP 15.8 15.2 15.5 14.9 14.1 13.7 14.3 14.4 15.2 13.6
a Including sale of public assets (disinvestment).b Net of states' share.
c Net of loan recoveries.d GOI changed its definition of gross fiscal deficit (excl. the states share of small savings) from 1999-2000. For the sake of consistency the change is not reflected.
Monetized deficit (equal to net RBI credit to central government).
f T-Bills and dated securities, excluding those issued to the RBI.
g Includes RBI (net) figure.
Note: BE = Budget estimates; RE = Revised estimates.
Source: MoF, Union Budget documents, and World Bank staff estimates.
221

TABLE A4.2Budgetary Classification of Central Government Finances
(Rs billion at current prices)
1987-8 1988-9 1989-90 1990-1 1991-2 1992-3 1993-4 1994-5 1995-6 1996-7 1997-8 1998-9 1998-9 1999-2000BE RE BE
Revenue receipts 370.37 435.91 499.96 549.54 660.30 741.28 754.53 910.83 1101.30 1262.79 1339.02 1619.94 1576.65 1828.40
Tax revenue 280.15 337.51 383.49 429.78 500.69 540.44 534.49 674.54 819.39 937.01 956.73 1168.57 1095.37 1323.65
Non-tax revenue 90.22 98.40 116.47 119.76 159.61 200.84 220.04 236.29 281.91 325.78 382.29 451.37 481.28 504.75
of which: Interest from states 31.58 37.70 44.24 51.74 65.22 77.54 95.53 111.83 130.02 151.63 180.32 183.59 212.83 0.00
Revenue expenditure(A+B+C+D) 461.75 541.06 642.07 735.15 823.08 927.02 1081.69 1221.11 1398.62 1589.34 1803.52 2100.63 2181.39 2369.88
A. Developmental 114.25 140.36 184.15 196.01 198.17 208.60 243.68 301.50 355.92 399.53 460.09 544.65 592.23 589.27
1. Social services 19.35 22.43 24.99 27.53 30.57 34.30 40.97 47.43 66.29 84.23 105.64 139.63 135.77 147.06
2. Economic services 94.90 117.93 159.17 168.48 167.60 174.30 202.71 254.07 289.63 315.30 354.45 405.03 456.45 442.21
B. Non-developmental 244.59 287.69 335.47 391.00 450.34 521.58 613.17 708.20 816.78 942.77 1100.88 1257.23 1313.68 1445.01
Defence services 88.60 95.58 101.94 108.74 114.42 121.09 149.77 164.26 188.41 209.97 261.75 308.40 310.13 334.64
Interest payments 112.36 142.61 177.57 214.71 265.63 310.35 366.95 440.49 500.31 594.78 656.37 750.00 772.48 880.00
C. Grants-in-aid andcontributions 93.49 102.08 109.36 134.39 159.53 180.54 211.11 204.83 218.28 238.17 232.27 287.84 263.11 323.23
of which: Grants to states 91.36 100.15 86.44 132.02 157.00 178.30 208.30 200.47 212.87 231.57 297.38 275.30 249.41 308.66
D. Revenue expenditure of UTs 9.43 10.92 13.09 13.75 15.05 16.30 13.73 6.59 7.63 8.86 10.28 10.91 12.37 12.37
Net current balance -91.38 -105.15 -142.11 -185.61 -162.78 -185.74 -327.16 -310.28 -297.32 -326.55 -464.50 -480.69 -604.74 -541.48
Capital expenditure (A+B+C+D) 179.07 204.08 237.18 260.88 231.01 235.60 274.93 322.82 319.09 345.35 434.00 479.57 522.69 608.08
A. Developmental 56.67 60.03 70.95 69.23 58.26 73.82 55.60 73.96 50.49 46.82 73.33 114.21 80.33 105.08
1. Social services 2.80 3.51 3.21 2.47 2.39 2.59 3.32 7.26 5.48 6.58 6.04 10.51 10.14 11.48
2. Economic services 53.86 56.52 67.74 66.77 55.87 71.23 52.28 66.70 45.01 40.24 67.28 103.71 70.19 141.70
B. Non-developmental 33.39 40.76 45.27 49.56 52.32 58.88 73.92 72.51 88.26 93.29 99.74 115.43 111.84 135.65
of which: Defence services 31.08 37.83 42.22 45.52 49.05 54.73 68.67 68.19 80.15 85.08 91.04 103.60 101.87 122.30
C. Capital expenditure of UTs 2.88 1.76 1.87 2.68 3.42 3.50 2.78 2.44 2.24 i.84 2.19 3.10 3.03 3.27
D. Loans and advances (net) 86.13 101.53 119.09 139.40 117.01 99.41 142.63 173.91 178.10 203.40 258.74 246.82 327.50 364.08
to States & UTs 58.51 67.30 79.55 98.69 94.18 86.97 100.72 143.13 148.37 175.71 233.36 212.11 301.90 326.64
to Others 27.62 34.23 39.55 40.71 22.83 12.44 41.92 30.78 29.73 27.68 25.39 34.71 25.60 37.44
Disinvestment of equity in PSEs 0.00 0.00 0.00 0.00 30.38 19.61 -0.48 50.78 3.62 3.80 9.12 50.00 90.00 100.00
Gross fiscal deficit (GOI Defn) 270.45 309.22 379.30 446.50 363.41 401.74 602.57 582.33 612.79 668.10 889.38 910.26 1037.44 1049.56
(Contd.)
222
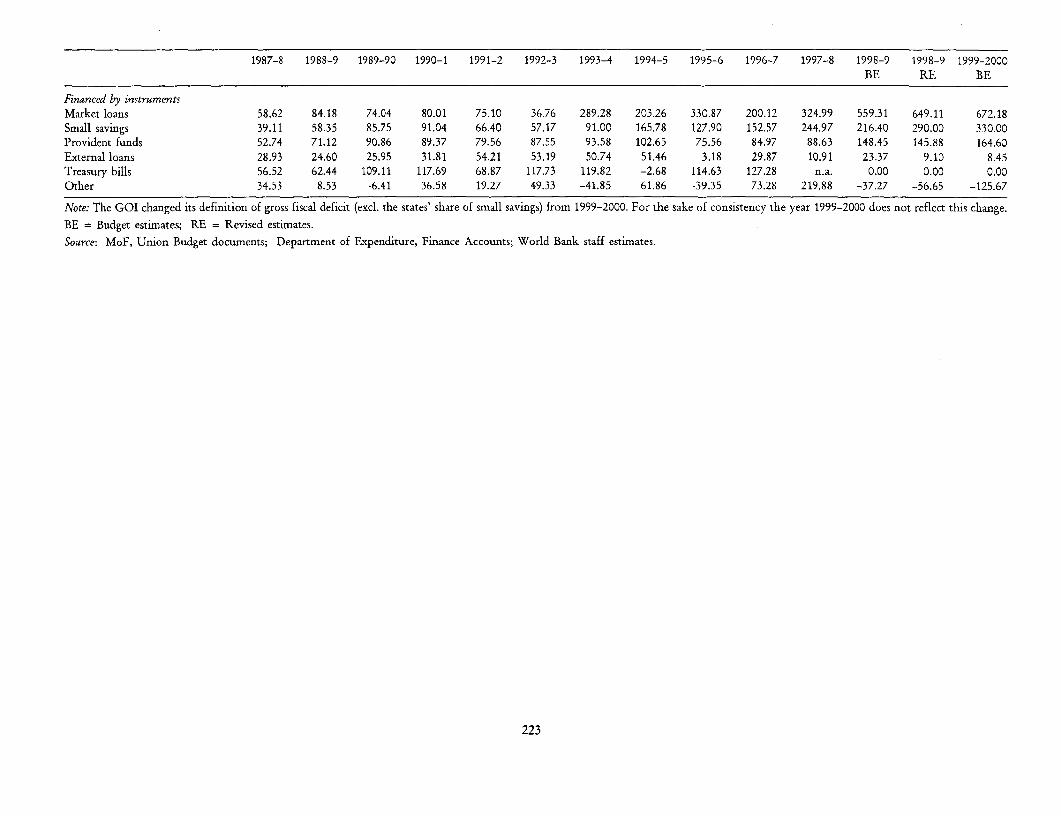
1987-8 1988-9 1989-90 1990-1 1991-2 1992-3 1993-4 1994-5 1995-6 1996-7 1997-8 1998-9 1998-9 1999-2000BE RE BE
Financed by instruments
Market loans 58.62 84.18 74.04 80.01 75.10 36.76 289.28 203.26 330.87 200.12 324.99 559.31 649.11 672.18Small savings 39.11 58.35 85.75 91.04 66.40 57.17 91.00 165.78 127.90 152.57 244.97 216.40 290.00 330.00Provident funds 52.74 71.12 90.86 89.37 79.56 87.55 93.58 102.65 75.56 84.97 88.63 148.45 145.88 164.60External loans 28.93 24.60 25.95 31.81 54.21 53.19 50.74 51.46 3.18 29.87 10.91 23.37 9.10 8.45Treasury bills 56.52 62.44 109.11 117.69 68.87 117.73 119.82 -2.68 114.63 127.28 n.a. 0.00 0.00 0.00Other 34.53 8.53 -6.41 36.58 19.27 49.33 -41.85 61.86 -39.35 73.28 219.88 -37.27 -56.65 -125.67
Note: The GOI changed its definition of gross fiscal deficit (excl. the states' share of small savings) from 1999-2000. For the sake of consistency the year 1999-2000 does not reflect this change.
BE = Budget estimates; RE = Revised estimates.
Source: MoF, Union Budget documents; Department of Expenditure, Finance Accounts; World Bank staff estimates.
223

TABLE A4.3
Budgetary Classification of State Government Finances(Rs billion at current prices)
1987-8 1988-9 1989-90 1990-1 1991-2 1992-3 1993-4 1994-5 1995-6 1996-7 1997-8 1997-8 1998-9BE RE BE
Revenue receipts 448.00 507.09 568.08 673.19 813.59 911.04 1050.65 1222.82 1373.45 1528.62 1718.35 1830.97 1947.92
Tax revenue 289.20 330.70 392.27 448.80 529.53 603.90 686.66 805.75 931.63 1061.63 1249.10 1285.21 1395.56
Direct tax 19.85 24.13 30.06 33.75 39.59 42.28 49.73 70.05 81.10 84.30 105.58 101.19 120.96
Indirect tax 173.37 199.88 229.89 269.70 317.98 356.40 414.51 487.29 557.55 626.72 740.98 748.40 882.97
State share in central taxes 95.98 106.69 132.32 145.35 171.97 205.22 222.42 248.40 292.98 350.61 435.48 408.54 391.63
Non-tax revenue 158.80 176.38 175.81 224.39 284.06 307.14 363.99 417.07 441.82 466.99 469.25 545.76 552.36
of which: Grants from centre 91.36 100.15 86.44 132.02 157.00 178.30 208.30 200.47 212.87 231.57 230.27 302.41 275.30
Revenue expenditure [A+B+C] 451.54 522.96 602.53 717.73 861.86 962.05 1093.76 1284.40 1450.04 1689.50 1915.51 1967.19 2294.95
A. Developmental (1+2) 318.20 362.37 407.81 488.55 585.05 634.65 708.38 786.37 892.76 1061.54 1112.44 1210.92 1289.85
1. Social services 177.06 205.74 240.17 279.62 310.92 345.65 389.61 449.02 536.07 603.28 682.82 729.78 800.99
2. Economic services 141.14 156.63 167.64 208.92 274.13 288.99 318.78 337.36 356.69 458.26 429.61 481.13 488.86
B. Non-developmental 128.44 155.06 188.69 221.34 266.66 315.06 373.67 484.99 541.97 608.64 775.98 724.56 968.92
Of which: Interest payments 48.98 59.33 71.86 86.55 109.44 132.10 158.00 192.02 219.32 255.76 310.89 312.35 364.17
To centre 31.58 37.70 44.24 51.74 65.22 77.54 95.53 111.83 130.02 151.63 180.32 183.59 212.83
To others 17.40 21.63 27.62 34.81 44.23 54.56 62.47 80.19 89.30 104.13 130.57 128.77 151.34
C. Other expenditurea 4.91 5.53 6.03 7.84 10.16 12.35 11.71 13.03 15.31 19.32 27.10 31.71 36.18
Net current balance -3.55 -15.87 -34.45 -44.54 -48.27 -51.01 -43.11 -61.58 -76.59 -160.88 -197.16 -136.22 -347.03
Capital expenditure [A+B+C] 101.31 98.66 117.52 134.78 132.49 157.77 167.84 206.19 232.25 213.31 303.57 314.13 339.36
A. Developmental (1+2) 64.29 68.53 77.28 89.61 98.61 103.44 120.51 169.31 178.37 168.27 216.20 229.75 235.58
1. Social services 10.74 11.28 11.71 12.57 16.47 16.64 18.31 23.04 26.21 29.73 44.63 41.52 46.04
2. Economic services 53.55 57.25 65.57 77.03 82.14 86.80 102.21 146.27 152.16 138.55 171.58 188.24 189.54
B. Non-developmental 2.26 2.25 2.36 2.63 2.34 3.10 3.99 4.20 6.57 7.12 8.80 9.83 10.59
C. Loans and advances (net) 34.77 27.88 37.88 42.55 31.54 51.22 43.33 32.68 47.30 37.91 78.56 74.55 93.20
Gross fiscal deficit 104.85 114.53 151.96 179.32 180.77 208.78 210.95 267.77 308.84 374.19 500.73 450.35 686.40
Financed by instrument:Market loans 18.01 22.46 25.95 25.60 33.10 38.50 42.28 41.05 64.04 65.19 76.15 77.27 89.36
Loans from centre (Net) 58.31 67.07 79.30 98.39 93.75 86.60 99.01 137.61 139.98 167.40 175.08 213.66 323.80
Small savings & Provident funds 16.28 20.01 23.07 30.69 29.09 36.22 43.30 47.79 49.02 53.75 73.94 77.48 111.23
Other 12.26 4.98 23.65 24.63 24.82 47.45 26.36 41.33 55.81 87.85 175.56 81.94 162.02
a Other expenditure includes compensation and assignments to local bodies and Panchayat Raj institutions and reserve with the finance department.
Note: BE = Budget estimates; RE = Revised estimates.Source: MoF, Union budget documents; RBI, RBI bulletins on state finances, World Bank staff estimates.
224

TABLE A4.4Budgetary Classification of General Government Finances
(Rs billion at current prices)
1987-8 1988-9 1989-90 1990-1 1991-2 1992-3 1993-4 1994-5 1995-6 1996-7 1997-8a 1998-9BjE
Revenue receipts 695.43 805.15 937.36 1038.97 1251.67 1396.48 1501.35 1821.35 2131.86 2408.21 2689.91 3079.73
Tax revenue 569.35 668.21 775.76 878.58 1030.22 1144.34 1221.15 1480.29 1751.02 1998.63 2241.94 2564.13
Non-tax revenue 126.08 136.94 161.60 160.39 221.45 2,52.13 280.20 341.06 380.84 409.58 447.57 515.59
Revenue expenditure [A+B+C+D] 790.35 926.17 113.92 1269.12 1462.73 1633.23 1871.62 2193.21 2505.77 2895.64 3371.20 3907.45
A. Developmental 432.44 502.73 591.96 684.56 783.22 843.24 952.06 1087.87 1248.68 1461.07 1671.01 1834.50
1. Social services 196.40 228.17 265.15 307.16 341.49 379.95 430.58 496.45 602.36 687.51 835.42 940.62
2. Economic services 236.04 274.55 326.80 377.40 441.72 463.29 521.48 591.42 646.32 773.56 835.59 893.89
B. Non-developmental 341.45 405.05 479.92 560.60 651.78 759.10 891.30 1081.36 1228.73 1399.78 1647.37 2013.33
C. Revenue disbursements of UTs 9.43 10.92 13.09 13.75 15.05 16.30 13.73 6.59 7.63 8.86 10.28 10.91
D. Other expenditureb 7.04 7.46 28.95 10.21 12.68 14.59 14.53 .17.39 20.72 25.92 42.54 48.71
Net current balance -94.93 -121.02 -176.56 -230.15 -211.05 -236.75 -370.28 -371.87 -373.91 -487.43 -681.69 -827.72
Capital expenditure [A+B+C+D] 222.07 235.66 275.40 297.27 269.76 306.77 343.76 391.40 411.37 391.26 524.19 615.67
A. Developmental (1+2) 120.95 128.56 148.23 158.84 156.87 177.26 176.11 243.28 228.86 215.09 303.08 349.79
1. Social services 13.54 14.79 14.92 15.04 18.86 19.23 21.63 30.30 31.69 36.31 47.56 56.54
2. Economic services 107.41 113.76 133.31 143.80 138.00 158.03 154.49 212.97 197.17 178.79 255.52 293.25
B. Non-developmental 35.65 43.01 47.63 52.19 54.67 61.98 77.90 76.71 94.84 100.41 109.57 126.02
C. Loans and advances (net) 62.59 62.33 77.67 83.56 54.79 64.03 86.96 68.98 85.43 73.91 109.36 136.75
D. Capital disbursements of UTs 2.88 1.76 1.87 2.68 3.42 3.50 2.78 2.44 2.24 1.84 2.19 3.10
Disinvestment of equities in PSEs 0.00 0.00 0.00 0.00 30.38 19.61 -0.48 50.78 3.62 3.80 9.12 50.00
Gross fiscal deficit 316.99 356.68 451.96 527.42 450.43 523.91 714.51 712.49 781.65 874.89 1196.76 1393.39
Financed by Instrument:Market loans 76.63 106.64 99.99 105.61 108.20 75.26 331.56 244.31 394.91 265.31 402.26 648.67
Small savings 39.11 58.35 85.75 91.04 66.40 57.17 91.00 165.78 127.90 152.57 244.97 216.40
Provident funds 69.02 91.13 113.93 120.06 108.65 123.77 136.88 150.44 124.58 138.72 166.11 259.68
External loans 28.93 24.60 25.95 31.81 54.21 53.19 50.74 51.46 3.18 29.87 10.91 23.37
Treasury bills 56.52 62.44 109.11 117.69 68.87 117.73 119.82 -2.68 114.63 127.28 n.a. 0.00
Other 46.79 13.52 17.24 61.21 44.09 96.79 -15.49 103.19 16.46 161.13 372.51 245.28
a Actuals for centre and revised estimates for states.b Other expenditure include compensation and assignments to local bodies and panchayat raj institutions and reserve with the finance department.
Notes: BE = Budget estimates; RE = Revised estimates.Source: MoF, Union Budget documents; RBI, RBI bulletins on State Finances; World Bank staff estimates.
225

TABLE A4.5Tax Revenue: Centre and States
(Rs billion at current prices)
1987-8 1988-9 1989-90 1990-1 1991-2 1992-3 1993-4 1994-5 1995-6 1996-7 1997-8a 1998-9 1998-9 1999-2000BE RE BE
Central government
A. Gross tax revenue 376.66 444.74 516.36 575.76 673.61 746.37 757.44 922.94 1112.37 1768.60 1392.21 1577.11 1487.00 1768.60
Corporation tax 34.33 44.07 47.29 53.35 78.53 88.99 100.60 138.22 164.87 185.67 200.16 265.50 271.00 308.50Taxes on income 31.92 42.41 50.04 53.71 67.31 78.88 91.15 120.25 156.03 182.31 263.78 209.30 214.00 269.10
Customs 137.02 158.05 180.36 206.44 222.57 237.76 221.93 267.89 357.57 428.51 401.93 481.48 426.00 503.69Union excise duties 164.26 188.41 224.06 245.14 281.10 308.32 316.97 373.47 401.87 450.08 479.62 576.90 532.00 638.65Other 9.13 11.80 14.61 17.12 24.10 32.42 26.79 23.11 32.03 41.05 46.72 43.93 44.00 48.66
B. States share of tax revenue 95.98 106.69 132.32 145.35 171.97 205.22 222.42 248.40 292.98 350.61 435.48 408.54 408.54 391.63Income tax 25.89 27.49 39.22 41.21 51.04 60.57 77.69 85.57 112.87 135.16 211.02 139.46 144.98 169.87
Estate duty 0.06 0.01 0.00 0.00 0.00 0.00 0.00 0.00 0.00 0.00 0.00 0.00 0.00 0.00
Union excise duties 70.03 79.19 93.10 104.14 120.93 144.65 144.73 162.83 180.11 215.45 224.46 269.08 246.65 275.08
C. Assignments of UT taxes 0.53 0.54 0.55 0.63 0.95 0.71 0.53 0.00 0.00 0.00 0.00 0.00 0.00 0.00to local bodies
Tax revenue (net) [A-B-C] 280.15 337.51 383.49 429.78 500.69 540.44 534.49 674.54 819.39 937.01 956.73 1168.57 1095.37 1323.65
State government
States own tax revenue 193.22 224.01 259.95 303.45 357.56 398.68 464.24 557.35 638.65 711.02 849.59 1003.93 - -
Direct tax 19.85 24.13 30.06 33.75 39.59 42.28 49.73 70.05 81.10 84.30 101.19 120.96 - -
Taxes on income 2.70 3.12 4.53 6.34 6.45 6.02 6.50 7.17 8.35 10.11 10.80 12.35 - -Land revenue 4.48 5.94 6.90 6.07 6.36 6.17 7.32 11.41 13.26 10.74 13.49 16.56 - -
Stamps and registration fees 12.54 14.86 18.45 21.12 26.54 29.78 35.55 50.91 58.98 62.67 76.15 91.19 - -
Other 0.13 0.21 0.19 0.22 0.24 0.31 0.36 0.56 0.52 0.79 0.75 0.86 - -
Indirect tax 173.37 199.88 229.89 269.70 317,98 35640 414.51 487.29 557.55 62672 748R40 882.97 - -
Sales tax 111.85 131.22 150.60 176.67 210.64 233.49 276.38 331.54 354.77 439.27 513.75 596.44 - -
State excise 28.67 30.81 38.64 47.95 54.39 62.65 71.06 77.47 85.16 88.05 113.38 136.29 - -
Taxes on vehicles 11.75 12.90 14.15 15.66 18.37 21.94 25.83 30.81 37.26 41.17 49.45 58.41 - -
Other 21.09 24.96 26.49 29.41 34.58 38.32 41.25 47.47 80.35 58.22 71.82 91.83 - -
State's Share of Central Taxes 95.98 106.69 132.32 145.35 171.97 205.22 222.42 248.40 292.98 350.61 435.62 391.63 - -
Tax revenue retained by states 289.20 330.70 392.27 448.80 529.53 603.90 686.,66 805.75 931.63 1061.63 1285.21 1395.56 - -
- Not available.a Actuals for central government and revised estimates for states.Source: MoF, Union Budget documents; RBI, RBI bulletins on state finances; World Bank staff estimates.
226

TABLE A4.6Non-tax Revenue: Centre and States
(Rs billion at current prices)
1987-8 1988-9 1989-90 1990-1 1991-2 1992-3 1993-4 1994-5 1995-6 1996-7 1997-8a 1998-9 1998-9 1999-2000BE RE BE
Central government
Non-tax revenue 90.22 98.40 116.47 119.76 159.61 200.84 220.04 236.29 281.91 325.78 382.29 451.37 481.28 504.75
Interest receipts 57.55 69.81 84.66 87.30 109.33 124.87 150.62 157.97 184.19 221.06 253.23 279.54 305.45 330.34
from state governments 31.58 37.70 44.24 51.74 65.22 77.54 95.53 111.83 130.02 151.63 178.07 212.83 218.70 258.99
Dividends and profits 6.05 4.75 7.16 7.74 10.58 24.93 24.48 27.16 32.48 38.54 51.81 73.73 75.37 94.83
Other general services 3.37 3.95 4.05 5.06 5.72 10.14 10.46 11.87 12.42 13.00 16.61 16.37 19.62 18.51
Social services 0.60 0.80 0.57 0.65 0.90 0.79 1.01 0.95 1.09 1.26 1.45 1.55 1.60 1.61
Economic services 12.73 8.93 5.45 8.60 21.46 17.86 13.26 18.60 32.45 33.17 43.09 63.42 65.15 45.36
Grants-in-aid and contributions 4.92 6.00 7.54 5.86 9.47 9.19 9.93 10.38 11.38 11.90 10.18 10.54 8.12 7.15
Other 5.00 4.16 7.04 4.55 2.15 13.06 10.28 9.36 7.90 6.85 5.92 6.22 5.97 6.95
State government
States own non-tax revenue 67.44 76.24 89.37 92.37 127.06 128.84 155.69 216.60 228.95 235.43 243.35 277.05 - -
Interest receipts 19.47 23.87 26.34 24.03 53.20 39.38 47.25 53.65 57.92 81.71 71.45 68.80 - -
General services 7.54 9.51 11.40 19.13 17.28 18.44 29.47 72.22 77.18 53.28 61.49 69.08 - -
Social services 5.04 5.73 6.76 5.86 7.74 8.48 9.12 9.65 10.95 12.00 14.11 15.46 - -
Economic services 35.12 36.64 44.59 43.01 48.39 61.48 69.21 80.35 81.86 86.77 95.14 122.49 - -
Forestry and wildlife 10.67 10.08 11.96 11.37 12.71 12.72 14.94 16.40 16.57 15.94 16.82 19.34 - -
Industries 9.11 12.08 14.31 12.23 15.37 23.17 25.09 30.51 35.67 37.41 41.91 52.26 - -
Other economic services 15.33 14.48 18.32 19.41 20.31 25.59 29.19 33.44 29.62 33.42 36.42 50.89 - -
Other 0.28 0.49 0.28 0.34 0.45 1.06 0.63 0.74 1.03 1.67 1.16 1.22 - -
Grants from centre 91.36 100.15 86.44 132.02 157.00 178.30 208.30 200.47 212.87 231.57 302.41 275.30 - -
Non-tax revenue retained by states 158.80 176.38 175.81 224.39 284.06 307.14 363.99 417.07 441.82 466.99 545.76 552.36 - -
- Not available.
a Actuals for central government and revised estimates for states.
Note: BE = Budget estimates; RE = Revised estimates.
Source: MoF, Union Budget documents; RBI, RBI bulletins on state finances; World Bank staff estimates.
227

TABLE A4.7Revenue Expenditure of the Central Governrnent
(Rs billion at current prices)
1987-8 1988-9 1989-90 1990-1 1991-2 1992-3 1993-4 1994-5 1995-6 1996-7 1997-8 1998-9 1998-9 1999-2000
BE RE BE
Revenue expenditure (A+B+C+D) 461.75 541.06 642.07 735.15 823.08 927.02 1081.69 1221.11 1398.62 1589.34 1803.52 2100.63 2181.39 2369.88
A. Developmental 114.25 140.36 184.15 196.01 198.17 208.60 243.68 301.50 355.92 399.53 460.09 544.65 592.23 589.27
1. Social services 19.35 22.43 24.99 27.53 30.57 34.30 40.97 47.43 66.29 84.23 105.64 139.63 135.77 147.06Education, sports, art,
and culture 10.13 11.12 11.41 12.74 13.72 14.97 18.37 22.30 29.70 33.14 44.39 56.78 60.36 61.20Health and family welfare 2.67 3.11 3.48 3.97 4.50 5.59 6.47 7.82 8.33 10.54 13.36 20.01 18.70 23.01Information and broadcasting 2.10 2.36 3.23 3.60 4.43 4.61 4.15 5.08 5.49 6.36 7.41 8.48 9.72 10.15Water supply and sanitation 0.13 0.51 0.78 0.93 0.64 0.63 0.84 0.84 3.80 3.17 4.80 6.06 5.88 6.61Labour and labour welfare 1.64 2.43 2.64 2.78 3.00 3.29 5.11 4.14 4.88 5.50 5.59 7.52 7.20 8.75Social security and welfare 1.92 1.96 2.36 2.25 2.81 3.44 3.71 4.47 8.73 10.41 10.74 17.66 13.22 15.23Other 0.76 0.94 1.09 1.27 1.47 1.77 2.33 2.77 5.36 15.10 19.35 23.12 20.69 22.11
2. Economic services 94.90 117.93 159.17 168.48 167.60 174.30 202.71 254.07 289.63 315.30 354.45 405.03 456.45 442.21
Agriculture and allied services 5.55 7.45 7.75 22.92 19.25 21.26 11.11 16.92 13.45 13.67 19.52 26.48 23.87 29.99Fertilizer subsidy 21.64 32.01 45.42 43.89 51.85 61.36 51.94 57.69 67.35 75.78 99.18 99.83 113.88 132.50Food subsidy 20.00 22.00 24.76 24.50 28.50 28.00 55.37 51.00 53.77 60.66 75.00 90.00 87.00 82.00Export subsidy 9.62 13.86 20.14 27.42 17.58 8.18 6.65 6.58 3.18 3.97 4.20 5.00 5.75 6.30
Irrigation and flood control 0.76 0.85 0.81 0.89 1.20 1.07 1.68 1.35 1.64 1.99 2.16 2.80 2.72 2.80Rural development 3.13 3.61 3.70 3.77 3.57 4.06 16.25 41.56 56.29 44.35 49.02 53.73 51.62 49.69Special areas programmes 0.06 0.05 0.07 0.12 0.19 0.17 0.20 7.92 7.87 8.13 9.42 11.27 9.72 12.64Energy 3.94 5.59 6.90 7.49 5.37 2.67 5.48 3.97 5.48 7.42 141.06 13.29 12.36 15.22
Industry and minerals 13.57 12.20 17.96 12.26 12.03 17.98 17.93 12.88 17.20 29.82 21.75 20.94 23.54 21.26Transport and
com~munications 6.06 6.79 15.62 8.05 9.19 9.68 14.45 17.80 20.44 22.59 28.85 13.07 37.63 36.60Science, technology, and
environment 7.57 9.34 10.40 11.27 12.87 13.68 15.86 17.20 18.76 21.92 26.27 30.46 30.06 33.27General economic services 2.99 4.18 5.62 5.90 6.00 6.20 5.78 19.19 24.20 25.00 -121.99 38.16 58.30 19.95
B. Non-developmental 244.59 287.69 335.47 391.00 450.34 521.58 613.17 708.20 816.78 942.77 1100.88 1257.23 1313.68 1445.01
Defence services 88.60 95.58 101.94 108.74 114.42 121.09 149.77 164.26 188.41 209.97 261.75 308.40 310.13 334.64Interest payments 112.36 142.61 177.57 214.71 265.63 310.35 366.95 440.49 500.31 594.78 656.37 750.00 772.48 880.00
on internal debt 55.14 69.13 82.73 96.22 109.09 129.89 154.83 193.91 233.64. 264.97 314.29 382.60 394.39 459.72on external debt 9.77 12.42 14.94 17.78 25.69 34.51 37.92 41.10 39.02 52.28 41.46 41.92 42.73 41.84on small savings, PFs, etc. 44.90 58.01 75.73 96.37 124.20 138.83 168.42 198.91 220.64 268.39 290.19 293.40 305.41 363.89Other 2.56 3.06 4.17 4.34 6.66 7.12 5.78 6.57 7.01 9.13 10.43 32.08 29.95 14.56
(Contd.)
228

1987-8 1988-9 1989-90 1990-1 1991-2 1992-3 1993-4 1994-5 1995-6 1996-7 1997-8 1998-9 1998-9 1999-2000BE RE BE
Administrative services 15.32 17.91 20.71 25.24 27.98 37.83 38.27 42.14 48.48 58.20 72.00 82.24 86.11 87.96
Fiscal services 10.94 11.00 12.78 12.12 17.69 20.48 21.37 23.55 25.90 25.49 33.32 35.04 35.72 32.12
Pensions and misc. services 17.37 20.60 22.46 30.19 24.63 31.84 36.80 37.76 53.67 54.34 77.44 81.55 109.24 110.29
C. Grants-in-aid and contributions 93.49 102.08 109.36 134.39 159.53 180.54 211.11 204.83 218.28 238.17 232.27 287.84 263.11 323.23
Grants to state governments 91.36 100.15 86.44 132.02 157.00 178.30 208.30 200.47 212.87 231.57 297.38 275.30 249.41 308.66
a. Non plan 19.80 24.11 2.69 42.19 45.16 31.77 27.22 24.79 58.62 60.95 89.81 63.57 40.78 76.96
b. State plan schemes 34.43 35.59 36.00 38.78 56.51 79.76 102.39 107.93 86.71 104.10 140.39 124.13 132.73 136.13
c. Central and centrallysponsored schemes 37.14 40.46 47.75 51.05 55.32 66.78 78.69 67.75 67.54 66.51 67.18 87.60 75.90 95.56
Grants to UTs. and others 2.13 1.93 22.92 2.37 2.53 2.24 2.81 4.36 5.42 6.60 10.83 12.53 13.70 14.57
D. Revenue disbursments ofUTs (net) 9.43 10.92 13.09 13.75 15.05 16.30 13.73 6.59 7.63 8.86 10.28 10.91 12.37 12.37
Memo Items:Total subsidies 59.80 77.32 104.74 121.58 122.53 119.95 126.82 129.32 133.72 163.64 194.87 220.25 246.83 238.38
Major subsidies 51.26 67.87 90.32 95.81 97.93 94.15 107.64 115.27 124.30 140.41 182.38 198.83 210.63 224.40
Other subsidies 8.54 9.45 14.42 25.77 24.60 25.80 19.18 14.05 9.42 23.23 12.49 21.42 36.20 13.98
Rural employment programme 14.10 12.44 21.00 20.00 18.17 25.46 39.06 46.75 46.42 34.95 38.58 40.85 40.50 37.95
of which:Jawahar Rojgar Yojana 0.00 0.00 20.96 20.00 18.17 25.26 33.06 35.35 28.73 16.55 19.53 20.95 20.60 20.95
Note: BE = Budget estimates; RE = Revised estimates.Source: MoF, Union Budget documents; Department of Expenditure, Finance Accounts; World Bank staff estimates.
229

TABLE A4.8Revenue Expenditure of the State Government
(Rs billion at current prices)
1987-8 1988-9 1989-90 1990-1 1991-2 1992-3 1993-4 1994-5 1995-6 1996-7 1997-8 1998-9 1998-9
BE RE BE
Revenue expenditure (A+B+C) 451.54 522.96 602.53 717.73 861.86 962.05 1093.76 1284.40 1450.04 1689.50 1915.51 1967.19 2294.95
A. Developmental (1+2) 318.20 362.37 407.81 488.55 585.05 634.65 708.38 786.37 892.76 1061.54 1112.44 1210.92 1289.85
1. Social services 177.06 205.74 240.17 279.62 310.92 345.65 389.61 449.02 536.07 603.28 682.82 729.78 800.99
Education, sports, art, and culture 90.10 109.43 135.71 155.28 170.77 192.61 215.94 249.77 289.11 330.64 370.37 389.22 441.51
Health and family welfare 30.53 34.77 39.64 45.86 50.54 56.62 66.69 74.29 84.79 94.30 108.17 112.87 126.76
Water supply and sanitation 13.22 13.94 14.77 16.38 18.45 20.95 24.24 29.80 31.41 36.68 41.78 46.79 50.15
Welfare of SCs, STs, and BCs 11.84 13.18 14.69 17.90 20.71 23.01 25.70 30.12 33.95 38.96 49.19 51.59 53.17
Social security and welfare 8.23 9.70 11.07 13.62 14.77 16.63 18.65 21.44 45.83 26.97 54.84 37.27 39.24
Other 23.13 24.72 24.29 30.59 35.68 35.83 38.38 43.60 50.98 75.72 58.48 92.05 90.17
2. Economic services 141.14 156.63 167.64 208.92 274.13 288.99 318.78 337.36 356.69 458.26 429.61 481.13 488.86
Agriculture and allied services 38.98 42.65 48.29 62.67 69.81 84.34 88.93 90.64 99.32 108.31 112.78 119.17 129.14
Crop husbandry 9.59 11.06 12.65 16.97 20.82 29.37 29.12 28.88 27.36 30.85 31.84 33.17 34.84
Food storage and warehousing 1.20 1.23 1.56 1.88 2.38 4.16 3.81 4.36 8.39 7.41 7.28 8.97 8.50
Forestry and wildlife 8.69 9.46 10.28 11.75 13.42 14.90 15.74 17.22 18.75 21.37 23.15 24.30 29.67
Other 19.50 20.90 23.80 32.06 33.19 35.91 40.25 40.19 44.82 48.68 50.51 52.73 56.13
Rural development 32.20 36.54 28.27 46.75 52.87 63.62 72.77 67.79 65.70 75.28 101.49 106.28 112.63
Special areas programmes 2.35 3.09 3.54 3.57 4.11 3.96 4.88 4.96 5.76 6.97 10.02 10.38 10.46
Irrigation and flood control 27.75 33.19 33.94 34.56 41.40 48.68 54.28 64.44 71.47 79.79 81.95 83.00 88.27
Energy 9.14 7.74 10.92 9.89 50.30 26.15 31.68 29.89 31.83 95.52 25.91 60.44 34.59
Industry and minerals 7.33 8.69 12.17 11.65 12.71 13.56 14.18 16.85 19.60 21.55 21.89 23.92 22.43
Transport and communications 16.01 17.35 19.22 23.36 27.59 31.28 35.12 37.55 44.44 49.25 50.00 51.78 58.88
Science, technology, and environment 0.24 0.23 0.26 0.29 0.36 0.39 0.53 0.53 0.54 0.75 1.16 0.96 1.68
General economic services 7.14 7.15 11.02 16.18 14.98 17.01 16.40 22.68 17.83 20.83 24.41 25.19 30.79
B. Non-developmental 128.44 155.06 188.69 221.34 266.66 315.06 373.67 484.99 541.97 608.64 775.98 724.56 968.92
Interest payments 48.98 59.33 71.86 86.55 109.44 132.10 158.00 192.02 219.32 255.76 310.89 312.35 364.17
on loans from the centre 31.58 37.70 44.24 51.74 65.22 77.54 95.53 111.83 130.02 151.63 178.07 212.83 218.70
on the internal debt 8.95 10.42 13.41 15.68 21.70 24.67 27.77 31.41 42.60 48.68 58.45 69.40 83.23
on small savings, PFs. 7.63 10.58 12.70 17.03 21.17 24.73 30.87 31.27 38.88 40.69 54.10 58.25 68.12
Other 4.51 5.41 6.34 7.76 1.36 11.71 11.28 28.86 18.49 27.95 18.02 1.12 -0.01
Administrative services 44.18 50.31 59.74 70.18 78.10 93.44 104.73 116.64 133.91 149.50 220.33 178.43 321.22
Pensions and miscellaneous services 17.58 23.92 29.31 35.93 44.79 52.72 69.99 119.27 128.34 135.15 170.18 149.51 195.13
Other 13.99 16.72 22.96 23.01 34.33 30.24 33.51 45.72 49.74 55.03 58.33 69.48 70.98
C. Other expenditurea 4.91 5.53 6.03 7.84 10.16 12.35 11.71 13.03 15.31 19.32 27.10 31.71 36.18
a Other expenditures include compensation and assignments to local bodies and Panchayat Raj institutions and reserve with the finance department.
Note: BE = Budget estimates; RE = Revised estimates.Source: RBI, RBI bulletins on state finances; World Bank staff estimates.
230

TABLE A4.9Capital Expenditure Centre and States
(Rs billion at current prices)
1987-8 1988-9 1989-90 1990-1 1991-2 1992-3 1993-4 1994-5 1995-6 1996-7 1997-8a 1998-9 1998-9 1999-2000BE RE BE
Central government
Capital expenditure (A+B+C+D) 179.07 204.08 237.18 260.88 231.01 235.60 274.93 322.82 319.09 345.35 434.00 479.57 522.69 608.08
A. Developmental (1+2) 56.67 60.03 70.95 69.23 58.26 73.82 55.60 73.96 50.49 46.82 73.33 114.21 80.33 105.08
1. Social services 2.80 3.51 3.21 2.47 2.39 2.59 3.32 7.26 5.48 6.58 6.04 10.51 10.14 11.48Education, sports, art etc. 0.05 0.13 0.08 0.06 0.04 0.05 0.06 2.25 0.14 0.13 0.13 0.22 0.14 0.23Health and family welfare 0.19 0.15 0.20 0.00 0.20 0.07 0.03 0.69 0.12 0.55 0.26 0.28 0.26 0.20Housing 0.75 0.99 0.98 1.11 1.26 1.78 1.87 1.86 2.37 2.40 2.98 4.15 4.28 6.14Information and broadcasting 1.74 1.71 1.78 1.06 0.35 0.07 0.24 0.25 0.47 0.53 0.50 0.74 0.54 0.93Other 0.08 0.52 0.18 0.24 0.53 0.62 1.12 2.23 2.39 2.97 2.18 5.11 4.91 3.99
2. Economic services 53.86 56.52 67.74 66.77 55.87 71.23 52.28 66.70 45.01 40.24 67.28 103.71 70.19 141.70Agriculture and allied 0.54 0.55 0.45 0.45 0.49 0.47 0.48 2.83 3.60 3.34 3.35 4.68 3.33 2.45Energy 18.46 19.05 26.07 27.09 19.91 16.21 17.69 22.68 20.58 11.05 19.16 21.18 21.58 21.37Industry and minerals 14.07 13.10 11.52 7.71 6.70 8.82 9.87 8.04 6.32 4.49 7.22 7.12 6.42 8.31Transport & communications 18.40 21.51 26.15 26.45 24.72 33.81 19.45 22.14 20.61 27.19 37.68 49.11 42.10 51.14General economic services 0.65 0.00 1.26 2.52 2.57 9.07 1.58 6.86 -10.68 -10.76 -2.90 16.86 -7.13 51.97Other 1.75 2.31 2.28 2.56 1.48 2.85 3.21 4.14 4.59 4.93 2.77 4.76 3.88 6.46
B. Non-developmental 33.39 40.76 45.27 49.56 52.32 58.88 73.92 72.51 88.26 93.29 99.74 115.43 111.84 135.65Defence services 31.08 37.83 42.22 45.52 49.05 54.73 68.67 68.19 80.15 85.08 91.04 103.60 101.87 122.30Other 2.32 2.93 3.05 4.04 3.27 4.14 5.24 4.32 8.11 8.20 8.71 11.84 9.97 13.35
C. Capital expenditure of UTs 2.88 1.76 1.87 2.68 3.42 3.50 2.78 2.44 2.24 1.84 2.19 3.10 3.03 3.27D. Loans and advances (net) 86.13 101.53 119.09 139.40 117.01 99.41 142.63 173.91 178.10 203.40 258.74 246.82 327.50 364.08
To state governments & UTs 58.51 67.30 79.55 98.69 94.18 86.97 100.72 143.13 148.37 175.71 233.36 212.11 301.90 326.64To others 27.62 34.23 39.55 40.71 22.83 12.44 41.92 30.78 29.73 27.68 25.39 34.71 25.60 37.44
State government
Capital expenditure (A+B+C) 101.31 98.66 117.52 134.78 132.49 157.77 167.84 206.19 232.25 213.31 314.13 339.36 - -
A. Developmental (1+2) 64.29 68.53 77.28 89.61 98.61 103.44 120.51 169.31 178.37 168.27 229.75 235.58 - -
1. Social Services 10.74 11.28 11.71 12.57 16.47 16.64 18.31 23.04 26.21 29.73 41.52 46.04 - -
Education, sports, art etc. 1.29 1.68 2.64 2.84 2.78 3.02 3.14 3.97 4.54 5.04 6.65 5.22 - -
Health and family welfare 1.88 2.04 1.84 2.37 2.76 2.63 2.80 3.24 3.68 3.99 5.89 6.79 - -
Water supply and sanitation 4.00 4.04 3.37 3.54 4.99 5.49 6.77 8.94 8.96 10.26 12.98 17.92 - -
Housing 2.11 1.90 1.99 1.82 2.09 1.88 2.01 2.65 3.59 3.07 5.12 5.06 - -
Other 1.45 1.63 1.87 2.00 3.86 3.62 3.57 4.24 5.43 7.36 10.88 11.04 - -
(Contd.)
231

1987-8 1988-9 1989-90 1990-1 1991-2 1992-3 1993-4 1994-5 1995-6 1996-7 1997-8 1998-9 1998-9 1999-2000BE RE BE
2. Economic services 53.55 57.25 65.57 77.03 82.14 86.80 102.21 146.27 152.16 138.55 188.24 189.54 - -Agriculture and allied 2.17 2.69 5.91 6.11 8.32 7.85 7.26 8.82 7.86 3.06 12.94 14.45 - -Irrigation and flood control 29.66 32.66 32.91 36.56 38.52 42.93 49.68 58.62 65.87 68.98 83.86 83.13 - -Transport 9.43 10.27 11.59 13.42 13.92 15.90 20.47 24.20 28.91 34.02 40.71 50.14 - -Other 12.28 11.63 15.16 20.94 21.38 20.13 24.80 54.64 49.53 32.50 50.72 41.81 - -
B. Non-developmental 2.26 2.25 2.36 2.63 2.34 3.10 3.99 4.20 6.57 7.12 9.83 10.59 - -C. Loans and advances (net) 34.77 27.88 37.88 42.55 31.54 51.22 43.33 32.68 47.30 37.91 74.55 93.20 - -
- Not available.
a Actuals for the centre and revised estimates for the states.Note: BE = Budget estimates; RE = Revised estimates.Source: MoF, Union Budget documents; RBI, RBI bulletins on state finances; World Bank staff estimates.
232

TABLE A4.10Transfers between Centre and States
(Rs billion at current prices)
1987-8 1988-9 1989-90 1990-1 1991-2 1992-3 1993-4 1994-5 1995-6 1996-7 1997-8 1998-9 1998-9 1999-2000BE RE BE
States' share in central taxes 95.98 106.69 132.32 145.35 171.97 205.22 222.42 248.40 292.98 350.61 435.48 408.54 391.63 444.95Union excise duties 70.03 79.19 93.10 104.14 120.93 144.65 144.73 162.83 180.11 215.45 224.46 269.08 246.65 275.08Income tax 25.89 27.49 39.22 41.21 51.04 60.57 77.69 85.57 112.87 135.16 211.02 139.46 144.98 169.87Estate duty 0.06 0.01 0.00 0.00 0.00 0.00 0.00 0.00 0.00 0.00 0.00 0.00 0.00 0.00
Grants to states 91.36 100.15 86.44 132.02 157.00 178.30 208.30 200.47 212.87 231.57 297.38 275.30 249.41 308.66Non-Plan grants 19.80 24.11 2.69 42.19 45.16 31.77 27.22 24.79 58.62 60.95 89.81 63.57 40.78 76.96State Plan schemes 34.43 35.59 36.00 38.78 56.51 79.76 102.39 107.93 86.71 104.10 140.39 124.13 132.73 136.13Central and centrally
sponsored schemes 37.14 40.46 47.75 51.05 55.32 66.78 78.69 67.75 67.54 66.51 67.18 87.60 75.90 95.56Loans to states & UTs 86.98 99.15 109.16 135.66 123.30 121.41 139.85 188.04 192.96 230.50 293.68 291.17 384.03 413.75Loan repayments by states
and UTs 28.47 31.85 29.62 36.97 29.12 34.44 39.13 44.91 44.58 54.79 60.32 79.06 82.13 87.11Interest payments by states 31.58 37.70 44.24 51.74 65.22 77.54 95.53 111.83 130.02 151.63 178.07 212.83 218.70 258.99Net transfer (centre to states) 214.28 236.43 254.07 324.32 357.93 392.94 435.91 480.17 524.20 606.26 788.15 683.12 724.24 821.26
Note: BE = Budget estimates; RE = Revised estimates.Source: MoF, Union Budget documents; RBI; RBI bulletins on state finances; Finance Accounts; World Bank staff estimates.
233

TABLE A4.11Explicit Subsidies in the Central Government Budget
(Rs billion at current prices)
1987-8 1988-9 1989-90 1990-1 1991-2 1992-3 1993-4 1994-5 1995-6 1996-7 1997-8 1998-9 1998-9 1999-2000BE RE BE
A. Major Subsidies 51.26 67.87 90.32 95.81 97.93 94.15 107.64 115.27 124.30 140.41 182.38 198.83 210.63 224.40
1. Food 20.00 22.00 24.76 24.50 28.50 28.00 55.37 51.00 53.77 60.66 75.00 90.00 87.00 82.002. Indegenious fertilizers 20.50 30.00 37.71 37.30 35.00 48.00 38.00 40.75 43.00 47.43 66.00 60.00 73.60 80.003. Imported fertilizers 1.14 2.01 7.71 6.59 13.00 9.96 7.62 11.66 19.35 11.63 7.22 9.83 2.38 7.504. Other fertilizer subsidy 0.00 0.00 0.00 0.00 3.85 3.40 6.32 0.00 0.00 0.00 0.00 0.00 0.00 0.005. Export promotion and
market development 9.62 13.86 20.14 27.42 17.58 8.18 6.65 6.58 3.18 3.97 4.20 5.00 5.75 6.306. Sale of decontrolled fertilizer - - - - - - - 5.28 5.00 16.72 25.96 30.00 37.90 45.00
with concession to farmers
B. Debt Relief to Farmers - - - 15.02 14.25 15.00 5.00 3.41 3.41 0.00 0.00 0.00 0.00 0.00
C. Other Subsidies 8.54 9.45 14.42 10.75 10.35 10.81 14.18 10.64 11.77 23.23 12.49 21.42 36.20 13.98
7. Railways 1.74 2.07 2.33 2.83 3.12 3.53 4.12 4.20 4.18 4.66 5.26 6.28 6.18 7.108. Mill-made cloth 0.23 0.27 0.10 0.10 0.15 0.15 0.16 0.00 0.01 0.00 0.00 0.00 0.00 0.009. Handloom cloth 1.24 1.46 1.81 1.85 1.87 1.61 1.74 1.48 1.43 0.98 0.64 0.46 0.42 0.40
10. Import/export of sugar, 0.05 0.40 0.00 - 0.00 0.00 0.00 0.00 1.00 0.00 0.20 0.30 1.05 0.50edible oils etc.
11. Interest subsidies 3.93 4.06 8.81 3.79 3.16 1.13 1.13 0.76 0.34 12.22 0.78 0.39 14.36 0.7312. Other subsidies 1.35 1.19 1.37 2.18 2.05 0.99 1.86 4.20 4.81 5.44 5.61 13.99 14.19 5.25
Total Subsidies 59.80 77.32 104.74 121.58 122.53 119.95 126.82 129.32 133.72 163.64 194.87 220.25 246.83 238.38
- Not available.
Note: BE = Budget estimates; RE = Revised estimates.
Source: MoF, Union Budget documents.
234

TABLE A4.12
Outstanding Debt of Central Government(Rs billion at current prices)
1990-1 1991-2 1992-3 1993-4 1994-5 1995-6 1996-7 1997-8a 1998-9a
(Rs billion at current prices)
1. To Reserve Bank of India 884.44 943.48 965.23 967.83 989.13 1187.68 1227.73 1362.95
a. Treasury bills 49.80 61.59 167.17 244.43 252.35 350.11 451.42 6.27
b. CG securities 174.50 171.47 86.43 33.11 34.47 152.24 66.66 319.77
c. Special securities 671.02 720.46 720.46 720.46 720.46 720.46 720.46 1028.65
d. Other liabilities -10.88 -10.04 -8.83 -30.17 -18.15 -35.13 -10.81 8.26
2. To commercial banks 388.13 460.46 531.12 795.85 945.88 1090.50 1314.39 1562.12
a. Treasury bills 0.10 0.11 3.06 0.72 0.00 0.00 0.00 0.00
b. CG securities 388.03 460.35 528.06 795.13 945.88 1090.50 1314.39 1562.12
To banking system (1) + (2) 1272.57 1403.94 1496.35 1763.68 1935.01 2278.18 2542.12 2925.07
3. To private sector 673.32 829.72 1134.96 1573.72 1952.69 2083.98 2444.52 2894.06
a. Small savings 501.00 557.55 601.28 672.85 817.10 917.86 1039.28 1253.61
b. Others 1056.76 1215.65 1498.91 1868.71 2124.72 2353.80 2632.97 3004.31
4. External debt (DRS) 914.26 1215.43 1553.92 1670.83 1880.87 1904.48 1940.95 2245.32 2443.29
5. Total outstanding debt 3744.59 4392.57 5150.46 5976.07 6757.70 7454.31 8155.32 9427.40 10642.94
(% of GDPmp)
Reserve Bank of India 15.3 14.1 12.6 11.0 9.5 9.8 8.7 8.7
Commercial banks 6.7 6.9 7.0 9.1 9.1 9.0 9.3 10.0
Small savings 8.6 8.4 7.9 7.7 7.9 7.5 7.4 8.0
Others 18.2 18.2 19.6 21.3 20.5 19.3 18.7 19.2
External debt (from DRS) 15.8 18.2 20.4 19.1 18.1 15.6 13.8 14.4
Total outstanding debt 64.6 65.8 67.5 68.1 65.1 61.2 57.8 60.3 59.3
(% of total outstanding debt)
Reserve Bank of India 28.1 26.6 24.0 20.3 18.4 19.6 18.2 17.6
Commercial banks 12.3 13.0 13.2 16.7 17.6 18.0 19.5 20.2
Small savings 15.9 15.7 15.0 14.1 15.2 15.1 15.4 16.2
Others 33.6 34.3 37.3 39.1 39.4 38.8 39.0 38.8
External debt (from DRS) 15.8 18.2 20.4 19.1 18.1 15.6 13.8 14.4
Total outstanding debt 100.0 100.0 100.0 100.0 100.0 100.0 100.0 100.0
(Contd.)
235

1990-1 1991-2 1992-3 1993-4 1994-5 1995-6 1996-7 1997-8a 1998_9a
Memo Items:External debt (US $ billion) from DRS 46.60 46.95 49.76 53.26 59.71 55.48 54.11 56.84 57.58External debt from DRS (Rs billion) 914.26 1215.43 1553.92 1670.83 1880.87 1904.48 1940.95 2245.32 2443.29External debt (from budget) 315.25 369.48 422.69 473.45 509.28 512.49 542.39 553.32 559.60
a Provisional.
Note: End of year stocks are used to calculated outstanding debt and external debt as shown in the central Budget.
Source: RBI, Report on Currency and Finance, various issues; MoF, Union Budget & Indian Economic Statistics (Public Finance); Ministry of Finance, Economic Survey, various issues; WorldBank staff estimates.
236

Table A4.13Outstanding Debt of State Governments
(Rs billion at current prices)
1987-8 1988-9 1989-90 1990-1 1991-2 1992-3 1993-4 1994-5 1995-6 1996-7a 1997-8a
1. To Reserve Bank of India 9.90 14.14 16.70 20.90 17.50 19.26 25.17 25.65 25.81 19.52 20.00
2. To commercial banks 75.37 89.92 100.83 125.32 182.01 246.77 250.33 263.53 273.79 330.00 392.20
a. SG securities 69.47 85.02 103.49 122.90 150.12 171.82 195.09 227.97 301.34 363.21 431.66
b. Others 5.90 4.90 -2.66 2.42 31.89 74.95 55.24 35.56 -27.55 -33.21 -39.47
To banking system (1)+(2) 85.27 104.06 117.53 146.22 199.51 266.03 275.50 289.18 299.60 349.52 412.20
3. To private sector 130.75 164.07 201.30 237.11 254.24 252.46 328.78 448.73 557.86 649.49 763.53
a. Provident fund 95.83 115.85 138.91 169.61 198.70 234.92 278.22 326.01 375.02 437.24 511.18
b. Others 34.92 48.22 62.39 67.50 55.54 17.54 50.56 122.72 182.84 212.25 252.35
4. To central govt (a-b-c) 483.69 542.06 623.41 719.56 809.63 903.29 996.49 1107.36 1264.80 1455.69 1672.20a. Loans from centre 495.34 562.22 641.39 741.17 834.90 924.12 1019.45 1167.05 1315.06 1505.69 1722.20
b. States' holding of treasury bill 8.88 17.38 15.18 18.80 24.95 20.83 22.96 59.69 50.26 50.00 50.00c. States' holding of CG sec. 2.77 2.78 2.80 2.81 0.32 0.00 0.00 0.00 0.00 0.00 0.00
5. Total outstanding debt 699.71 810.20 942.24 1102.89 1263.38 1421.78 1600.77 1845.27 2122.26 2454.70 2847.93
a Provisional.
Note: End of year stocks are used to calculate outstanding debt.
Source: RBI, Report on Currency and Finance, various issues; MoF, Union Budget & Indian Economic Statistics (Public Finance); MoF, Economic Survey, various issues; World Bank staffestimates.
237
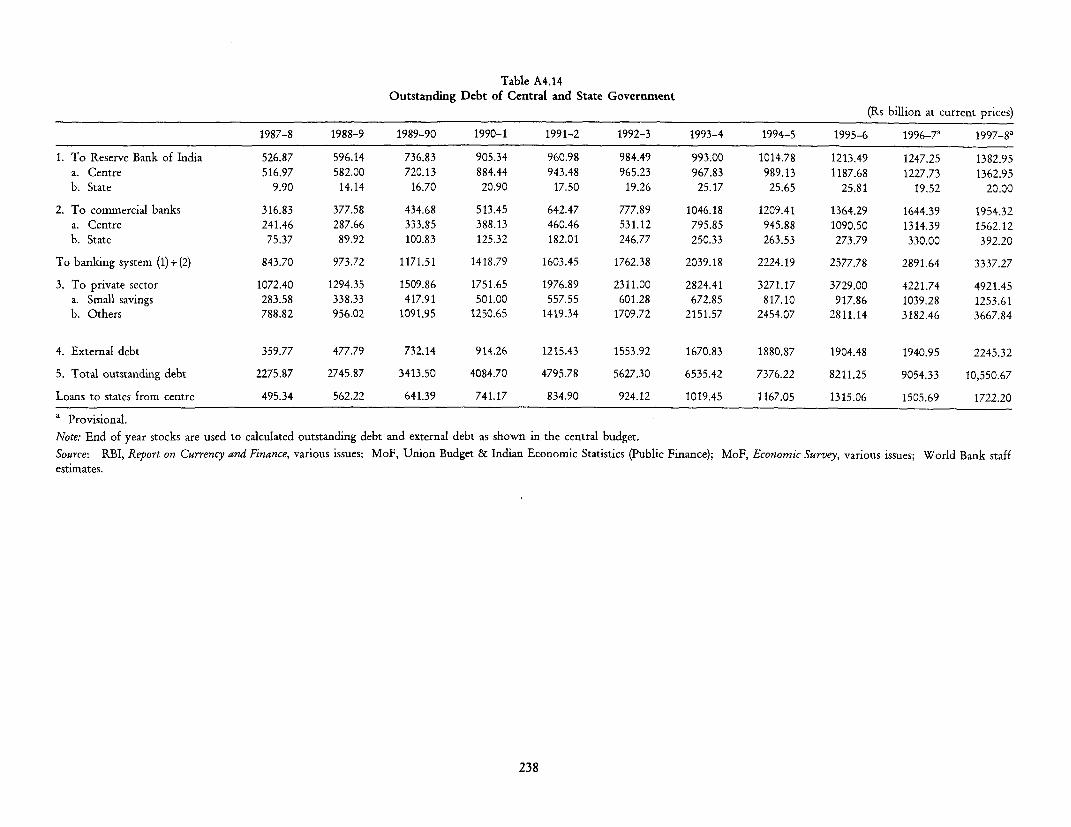
Table A4.14Outstanding Debt of Central and State Government
(Rs billion at current prices)
1987-8 1988-9 1989-90 1990-1 1991-2 1992-3 1993-4 1994-5 1995-6 1996-7a 1997-8a
1. To Reserve Bank of India 526.87 596.14 736.83 905.34 960.98 984.49 993.00 1014.78 1213.49 1247.25 1382.95
a. Centre 516.97 582.00 720.13 884.44 943.48 965.23 967.83 989.13 1187.68 1227.73 1362.95
b. State 9.90 14.14 16.70 20.90 17.50 19.26 25.17 25.65 25.81 19.52 20.00
2. To commercial banks 316.83 377.58 434.68 513.45 642.47 777.89 1046.18 1209.41 1364.29 1644.39 1954.32
a. Centre 241.46 287.66 333.85 388.13 460.46 531.12 795.85 945.88 1090.50 1314.39 1562.12
b. State 75.37 89.92 100.83 125.32 182.01 246.77 250.33 263.53 273.79 330.00 392.20
To banking system (1)+(2) 843.70 973.72 1171.51 1418.79 1603.45 1762.38 2039.18 2224.19 2577.78 2891.64 3337.27
3. To private sector 1072.40 1294.35 1509.86 1751.65 1976.89 2311.00 2824.41 3271.17 3729.00 4221.74 4921.45
a. Small savings 283.58 338.33 417.91 501.00 557.55 601.28 672.85 817.10 917.86 1039.28 1253.61
b. Others 788.82 956.02 1091.95 1250.65 1419.34 1709.72 2151.57 2454.07 2811.14 3182.46 3667.84
4. External debt 359.77 477.79 732.14 914.26 1215.43 1553.92 1670.83 1880.87 1904.48 1940.95 2245.32
5. Total outstanding debt 2275.87 2745.87 3413.50 4084.70 4795.78 5627.30 6535.42 7376.22 8211.25 9054.33 10,550.67
Loans to states from centre 495.34 562.22 641.39 741.17 834.90 924.12 1019.45 1167.05 1315.06 1505.69 1722.20
a Provisional.
Note: End of year stocks are used to calculated outstanding debt and external debt as shown in the central budget.
Source: RBI, Report on Currency and Finance, various issues; MoF, Union Budget & Indian Economic Statistics (Public Finance); MoF, Economic Survey, various issues; World Bank staff
estimates.
238

TABLE A4.15(a)Projected and Actual Plan Outlays by Sectors
(Rs billion at current prices)
Eighth Plan Annual Plan
(1992-3-1996-7) 1992-3 1993-4 1994-5 1995-6 1996-7 1997-8 1998-9Projected Actuals Actuals Actuals Actuals Revised Revised Revised
A Agriculture & allied programmes 636.43 105.91 126.60 157.12 154.60 165.41 172.24 97.46Agriculture 224.67 42.16 42.64 53.50 50.85 63.26 62.22 38.64Rural development 344.25 50.91 70.33 87.17 99.67 97.89 101.63 58.82Special area programmne 67.50 12.84 13.64 16.45 4.08 4.26 8.40 0.00
B Irrigation & flood control 325.25 47.05 53.71 61.04 72.45 85.58 106.38 3.75Minor irrigation 59.77 9.95 10.48 11.85 - - - _Major irrigation 224.15 30.47 35.71 41.59 - - _ _Flood control 16.23 3.30 3.66 3.08 - - -
Command area development 25.10 3.33 3.85 4.52 - - -
C Industry and minerals 469.22 74.44 84.81 90.88 108.08 122.80 125.22 115.51Village & small scale 63.34 9.95 11.52 15.12 17.94 16.68 17.28 9.92Large & medium industries 405.88 64.49 73.29 75.76 90.14 106.12 107.95 105.59
D Energy 1155.61 202.90 269.09 274.82 268.93 296.15 325.69 300.82Power 795.89 121.57 147.73 163.46 165.11 165.32 187.37 109.06Petroleum 240.00 56.98 95.89 86.44 81.24 105.28 109.15 147.33Coal 105.07 22.77 22.93 22.39 19.48 19.32 23.29 37.17
E Transport 559.26 106.63 119.77 120.97 137.67 188.96 186.40 161.86Railways 272.02 61.62 59.01 54.72 63.35 83.00 84.03 95.00Roads & road transport 169.52 28.48 32.49 38.44 -
Ports & shippinga 76.14 7.28 16.20 13.13Civil aviation 40.83 8.82 11.46 14.44 - - -
F Communication & broadcasting 289.66 51.51 62.02 72.74 86.26 100.77 111.44 148.78
G Science & technology 90.42 9.30 11.53 14.07 17.65 19.35 21.18 27.66
H Social services 751.55 113.23 140.16 174.09 208.48 278.65 309.39 183.10Education 196.00 26.19 31.47 35.66 53.56 73.46 82.08 45.67Health & family welfare 140.76 22.22 26.13 33.11 36.73 41.47 49.04 36.84Housing & urban development 105.50 14.42 21.47 20.81 28.92 56.16 61.21 39.05Water supply & sanitation 167.11 22.84 27.20 32.60 - - - _Other social services 142.19 27.55 33.89 51.92 -
I Others 63.60 17.56 13.11 15.94 19.68 34.21 38.34 12.94J Total 4341.00 728.52 880.81 981.67 1073.80 191.89 1396.26 1051.87
-Not available.a Covers Major and Minor ports, Shipping, Lighthouses and Inland Water.Note: The Plan totals are at base year prices for projections and at current prices for actuals.Source: Planning Commission.
239

TABLE A4.15(b)Projected and Actual Plan Outlays by Sectors
(annual averages at constant 1980-1 prices-Rs billion)
Eighth Plan
(1992-3-1996-7) 1992-3 1993-4 1994-5 1995-6 1996-7 1997-8 1997-8 1998-9Projected Actuals Actuals Actuals Actuals Revised Projected Revised Projected
A Agriculture & allied programmes 46.0 38.3 42.5 49.5 44.7 43.6 43.9 41.2 21.2Agriculture 16.2 15.2 14.3 16.9 14.7 16.7 15.9 14.9 8.4Rural development 24.9 18.4 23.6 27.5 28.8 25.8 23.7 24.3 12.8Special area programme 4.9 4.6 4.6 5.2 1.2 1.1 4.3 2.0 0.0
B Irrigation & Flood Control 23.5 17.0 18.0 19.2 20.9 22.6 17.9 25.4 0.8Minor irrigation 4.3 3.6 3.5 3.7 - - 0.0 -Major irrigation 16.2 11.0 12.0 13.1 - - 0.0 -Flood control 1.2 1.2 1.2 1.0 - - 0.0 -Command area development 1.8 1.2 1.3 1.4 - - 0.0 -
C Industry and minerals 33.9 26.9 28.4 28.6 31.2 32.4 33.2 30.0 25.1Village & small scale 4.6 3.6 3.9 4.8 5.2 4.4 4.5 4.1 2.2Large & medium industries 29.3 23.3 24.6 23.9 26.0 28.0 28.7 25.8 23.0
D Energy 83.5 73.3 90.2 86.6 77.7 78.1 84.3 77.9 65.4Power 57.5 43.9 49.5 51.5 47.7 43.6 46.9 44.8 23.7Petroleum 17.4 20.6 32.2 27.2 23.5 27.8 28.6 26.1 32.0Coal 7.6 8.2 7.7 7.1 5.6 5.1 7.7 5.6 8.1
E Transport 40.4 38.5 40.2 38.1 39.8 49.8 43.3 44.6 35.2Railways 19.7 22.3 19.8 17.2 18.3 21.9 18.4 20.1 20.7Roads & road transport 12.3 10.3 10.9 12.1 - - 0.0 -Ports & shippinga 5.5 2.6 5.4 4.1 - - 0.0Civil aviation 3.0 3.2 3.8 4.5 - - 0.0 -
F Communication & broadcasting 20.9 18.6 20.8 22.9 24.9 26.6 19.9 26.7 32.4G Science & technology 6.5 3.4 3.9 4.4 5.1 5.1 4.2 5.1 6.0H Social services 54.3 40.9 47.0 54.8 60.2 73.5 53.6 74.0 39.8
Education 14.2 9.5 10.6 11.2 15.5 19.4 12.8 19.6 9.9Health & family welfare 10.2 8.0 8.8 10.4 10.6 10.9 9.0 11.7 8.0Housing & urban development 7.6 5.2 7.2 6.6 8.4 14.8 8.7 14.6 8.5Water supply & sanitation 12.1 8.3 9.1 10.3 - - 0.0 -Other social services 10.3 10.0 11.4 16.4 - - 0.0 -
I Others 4.6 6.3 4.4 5.0 5.7 9.0 7.4 9.2 2.8J Total 313.8 263.4 295.4 309.3 310.2 340.6 307.6 334.0 228.7
Memo item: Investment deflator 276.6 276.6 298.2 317.4 346.2 379.3 418.1 418.1 459.9
-Not available.a Covers Major and Minor ports, Shipping, Lighthouses, and Inland water.Source: Planning Commission.
240
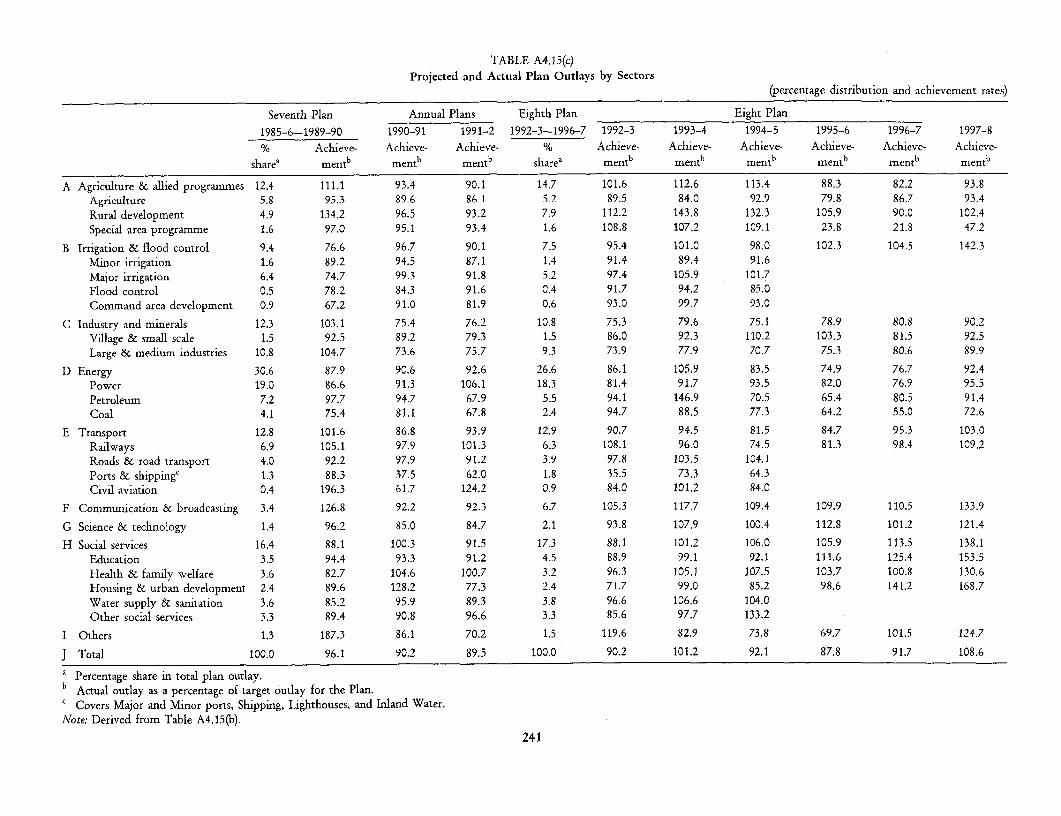
TABLE A4.15(c)Projected and Actual Plan Outlays by Sectors
(percentage distribution and achievement rates)
Seventh Plan Annual Plans Eighth Plan Eight Plan
1985-6-1989-90 1990-91 1991-2 1992-3-1996-7 1992-3 1993-4 1994-5 1995-6 1996-7 1997-8
% Achieve- Achieve- Achieve- % Achieve- Achieve- Achieve- Achieve- Achieve- Achieve-
sharea mentb mentb mentb sharea mentb mentb mentb mentb mentb mentb
A Agriculture & allied programmes 12.4 111.1 93.4 90.1 14.7 101.6 112.6 113.4 88.3 82.2 93.8Agriculture 5.8 95.3 89-6 86.1 52 89.5 84.0 92.9 79.8 86.7 93-4
Rural development 4.9 134.2 96.5 93.2 7.9 112.2 143.8 132.3 105.9 90.0 102.4
Special area programme 1.6 97.0 95.1 93.4 1.6 108.8 107.2 109.1 23.8 21.8 47.2
B Irrigation & flood control 9.4 76.6 96.7 90.1 7.5 95.4 101.0 98.0 102.3 104.5 142.3
Minor irrigation 1.6 89.2 94.5 87.1 1.4 91.4 89.4 91.6Major irrigation 6.4 74.7 99.3 91.8 5.2 97.4 105.9 101.7Flood control 0.5 78.2 84.3 91.6 0.4 91.7 94.2 85.0Command area development 0.9 67.2 91.0 81.9 0.6 93.0 99.7 93.0
C Industry and minerals 12.3 103.1 75.4 76.2 10.8 75.3 79.6 75.1 78.9 80.8 90.2Village & small scale 1.5 92.5 89.2 79.3 1.5 86.0 92.3 110.2 103.3 81.5 92.5Large & medium industries 10.8 104.7 73.6 75.7 9.3 73.9 77.9 70.7 75.3 80.6 89.9
D Energy 30.6 87.9 90.6 92.6 26.6 86.1 105.9 83.5 74.9 76.7 92.4Power 19.0 86.6 91.3 106.1 18.3 81.4 91.7 93.5 82.0 76.9 95.5Petroleum 7.2 97.7 94.7 67.9 5.5 94.1 146.9 70.5 65.4 80.5 91.4Coal 4.1 75.4 81.1 67.8 2.4 94.7 88.5 77.3 64.2 55.0 72.6
E Transport 12.8 101.6 86.8 93.9 12.9 90.7 94.5 81.5 84.7 95.3 103.0Railways 6.9 105.1 97.9 101.3 6.3 108.1 96.0 74.5 81.3 98.4 109.2Roads & road transport 4.0 92.2 97.9 91.2 3.9 97.8 103.5 104.1Ports & shippingc 1.3 88.3 37.5 62.0 1.8 35.5 73.3 64.3Civil aviation 0.4 196.3 61.7 124.2 0.9 84.0 101.2 84.0
F Communication & broadcasting 3.4 126.8 92.2 92.3 6.7 105.3 117.7 109.4 109.9 110.5 133.9
G Science & technology 1.4 96.2 85.0 84.7 2.1 93.8 107.9 100.4 112.8 101.2 121.4
H Social services 16.4 88.1 100.3 91.5 17.3 88.1 101.2 106.0 105.9 113.5 138.1
Education 3.5 94.4 93.3 91.2 4.5 88.9 99.1 92.1 111.6 125.4 153.5
Health & family welfare 3.6 82.7 104.6 100.7 3.2 96.3 105.1 107.5 103.7 100.8 130.6Housing & urban development 2.4 89.6 128.2 77.3 2.4 71.7 99.0 85.2 98.6 141.2 168.7Water supply & sanitation 3.6 85.2 95.9 89.3 3.8 96.6 106.6 104.0Other social services 3.3 89.4 90.8 96.6 3.3 85.6 97.7 133.2
I Others 1.3 187.3 86.1 70.2 1.5 119.6 82.9 73.8 69.7 101.5 124.7
J Total 100.0 96.1 90.2 89.5 100.0 90.2 101.2 92.1 87.8 91.7 108.6
a Percentage share in total plan outlay.b Actual outlay as a percentage of target outlay for the Plan.c Covers Major and Minor ports, Shipping, Lighthouses, and Inland Water.Note: Derived from Table A4.15(b).
241

TABLE A5.1
Money Supply and Sources of Change, 1988-9-1998-9
(Rs billion)
1988-9 1989-90 1990-1 1991-2 1992-3 1993-4 1994-5 1995-6 1996-7 1997-8 1998-99
Broad money supply (M3) 2002.41 2309.48 2658.28 3170.49 3668.25 4344.07 5314.26 6040.07 7018.48 8272.09 9743.28
Narrow money supply (Ml) 711.01 810.58 928.92 1144.06 1240.66 1507.78 1922.57 2148.35 2406.15 2674.81 3041.98Currency with public 380.71 463.00 530.48 610.98 682.73 823.01 1006.81 1182.58 1320.87 1460.04 1701.19Deposit money (total) 323.40 341.60 391.70 524.23 544.80 659.52 881.93 932.33 1053.34 1179.36 1302.67
Time deposits with banks 1291.40 1498.90 1729.36 2026.43 2427.59 2836.29 3391.69 3891.72 4612.33 5597.28 6701.30
Sources of change
Net bank domestic credit 2300.36 2688.57 3119.62 3462.56 3963.73 4416.92 5151.42 6024.26 6649.27 7633.30 8736.14
To government 973.73 1171.53 1401.93 1582.63 1762.38 2039.18 2224.19 2577.78 2886.20 3305.92 3866.72
From the RBI 596.15 736.83 888.48 940.16 984.49 993.00 1014.78 1213.49 1241.81 1351.60 1525.39From other Banks 377.58 434.70 513.45 642.47 777.89 1046.18 1209.41 1364.29 1644.39 1954.32 2341.33
To commercial sector 1326.63 1517.04 1717.69 1879.93 2201.35 2377.74 2927.23 3446.48 3763.07 4327.38 4869.42From RBI 55.24 63.49 63.42 72.60 62.20 64.45 65.93 68.55 62.47 81.86 122.26From other banks 1271.39 1453.55 1654.27 1807.33 2139.15 2313.29 2861.30 3377.93 3700.60 4245.52 4747.16
Net foreign exchange assetsof banking sector 68.00 66.51 105.81 212.26 244.43 546.12 790.32 821.41 1054.96 1265.69 1486.33
Government's currency liabilitiesto the public 14.75 15.55 16.21 17.04 18.24 19.90 23.79 25.03 29.18 33.52 37.05
Net non-monetary liabilities 380.70 461.15 583.36 521.37 558.15 638.87 651.27 830.63 714.93 660.42 516.24of RBI 169.36 175.36 270.22 274.15 282.46 260.37 293.58 322.96 351.83 432.82 604.64of other banks 211.34 285.79 313.14 247.22 275.69 378.50 357.69 507.67 363.10 227.60 -88.40
GDP at market prices 4281.00 4941.23 5792.64 6671.65 7635.61 8769.52 10,378.42 12,179.63 14,098.49 15,635.52 18,048.59
Note: 1998-9 figures are as of 31 March on the basis of the closure of government accounts.
Source. MoF, Economic Survey, various issues; RBI, RBI Bulletin (Weekly Statistical Supplement).
242

TABLE A5.2Base Money Supply and Sources of Change, 1985-6-1998-9
(Rs billion)
1987-8 1988-9 1989-90 1990-1 1991-2 1992-3 1993-4 1994-5 1995-6 1996-7 1997-8 1998-9
Total Base Money Supply 534.90 629.59 775.91 877.79 995.05 1107.79 1386.71 1692.82 1944.57 1999.85 2264.02 2592.20
Currency with public 335.59 380.71 463.00 530.48 610.98 682.73 823.01 1006.81 1182.58 1320.87 1460.04 1701.19
Other deposits with the RBI 3.97 6.94 5.98 6.74 8.85 13.13 25.25 33.83 33.44 31.94 35.41 38.12
Cash with banks 15.63 19.72 19.86 22.34 26.40 30.53 30.94 40.00 43.11 51.30 50.51 55.86
Bank deposits with the RBI 179.71 222.22 287.07 318.23 348.82 381.40 507.51 612.18 685.44 595.74 718.06 797.03
Sources of Change
RBI claims 609.18 722.18 875.03 1051.97 1063.78 1145.54 1112.96 1215.41 1501.59 1374.33 1504.42 1647.65
On government (net) 526.87 596.15 736.83 888.48 940.16 984.49 993.00 1014.78 1213.49 1241.81 1351.60 1525.39
On banks 44.41 70.79 74.71 100.07 51.02 98.85 55.51 134.70 219.55 70.05 70.96 0.00
On commercial sector 37.90 55.24 63.49 63.42 72.60 62.20 64.45 65.93 68.55 62.47 81.86 122.26
Net foreign exchange assetsof RBI 54.17 62.02 60.69 79.83 188.38 226.47 514.22 747.20 740.92 948.17 1158.90 1379.54
Government's currency liabilitiesto the public 13.80 14.75 15.55 16.21 17.04 18.24 19.90 23.79 25.03 29.18 33.52 37.05
Net non-monetary liabilitiesof the RBI 142.25 169.36 175.36 270.22 274.15 282.46 260.37 293.58 322.96 351.83 432.82 604.64
Note: 1998-9 figures are as of 31 March on the basis of the closure of government accounts.
Source: MoF, Economic Survey, various issues; RBI, RBI Bulletin (Weeldy Statistical Supplement).
243

244 * Statistical Tables
TABLE A5.3Selected Monetary Policy Instruments
Bank Minimum Statutoryrate cash reservea liquidity
ratio ratiob
1985 June 8 10 9.0 36.5July 6 10 9.0 37.0
1987 February 28 10 9.5 37.0April 25 10 9.5 37.5October 24 10 10.0 37.5
1988 January 2 10 10.0 38.0July 2 10 10.5 38.0July 30 10 11.0 38.0
1989 July 1 10 15.0 38.0
1990 September 22 10 15.0 38.5
1991 July 4 11 15.0 38.5October 9 12 15.0 38.5
1992 April 1 12 15.0 30.0
1993 April 17 12 14.5 30.0May 15 12 14.0 30.0September 17 12 14.0 25.0
1994 June 11 12 14.5 25.0July 9 12 14.8 25.0August 6 12 15.0 25.0
1995 November 11 12 14.5 25.0December 9 12 14.0 25.0
1996 April 27 12 13.5 25.0May 11 12 13.0 25.0July 6 12 12.0 25.0October 26 12 11.5 25.0November 9 12 11.0 25.0
1997 January 4 12 10.5 25.0January 18 12 10.0 25.0April 16 11 10.0 25.0June 26 10 10.0 25.0October 22 9 10.0 25.0October 25 9 9.8 25.0November 22 9 9.5 25.0December 6 9 10.0 25.0
1998 January 17 11 10.5 25.0March 18 11 10.5 25.0March 28 11 10.3 25.0April 2 10 10.3 25.0April 11 10 10.0 25.0April 29 9 10.0 25.0
1999 March 1 8 10.5 25.0May 8 8 10.0 25.0
a Minimum cash reserves to be deposited with the RBI as % of net demand and time liabilities (NDTL).b The ratio of liquid assets, exclusive of those under (a), to aggregate demand and time liabilities upto 28 March
1985 and net demand and time liabilities with effect from 29 March 1985.NVote: Dates given are those on which the announced measures take effect.Souirces: RBI, Report of the Committee to Review the Working of the Monetary System, 1985; RBI, AnnualReport, various issues.

TABLE A5.4Structure of Short-term and Long-term Interest Rates
(per cent per annum)
1980-1 1985-6 1988-9 1989-90 1990-1 1991-2 1992-3 1993-4 1994-5 1995-6 1996-7 1997-8 1998-9
A. Short-term rates
Reservc Bank rate 9.0 10.0 10.0 10.0 10.0 12.0 12.0 12.0 12.0 12.0 12.0 10.5 8.0Treasury bills:
91-daya 4.6 4.6 4.6 4.6 4.6 4.6 8.8-10.7 7.1-11.1 7.2-11.9 11.4-13.0 6.9- 12.97 5.7-7.3 7.16-10.05182-day 8.48-9.16 9.0-9.48 10.0-10.1 8.8-10.1 7.8-8.4364-day 9.9-10.3 10.0-11.4 9.4-11.9 12.1-13.2 10.1- 13.1 8.0-9.4 7.97-10.72
Call money rate (Bombay) 7.1 10.0 9.8 15.9 15.9 19.6 14.4 7.0 9.4 17.7 7.8 8.7 0.0Commercial bank rates:
Maximnum deposit rateb 10.0 11.0 10.0 10.0 11.0 13.0 11.0 10.0 11.0 12.0 10.0 Free FreeMinimum lending rate 13.5 n.a. 16.0 16.0 16.0 19.0 17.0 14.0 Free Free Free Free Free
B. Long-term rates
IDBI prirme lending rate 14.0 14.0 14.0 14.0 14.0-15.0 18.0-20.0 17.0-19.0 14.5-17.5 15.0 16.0-19.0 16.2 13.3 13.5Company deposit rates:'Private sector companies
(i) 1 year 9.0-13.5 10.0-15.0 10.0-14.0 10.5-14.0 10.5-14.0 10.5-15.0 12.0-15.0 12.0-14.0 13.0-14.0 12.0-15.0 13.0-15.0 9.5-15.0 11.00-15.00(ii) 2 years 10,0-14.5 12.0-15.0 12.0-14.0 12.0-14.0 12.0-14.0 12.0-15.0 13.0-15.0 13.0-14.0 14.0-15.0 13.0-15.0 14.0-15.0 10.5-15.0 12.00-15.00(iii) 3 years 13.0-15.5 13.0-15.0 13.5-14.0 13.5-140 13.5-14.0 14-0-15-0 15 0 14.0 14.0-15.0 14.0-15.0 15.0 11.5-15.0 11.50-15.00
Public sector companies
(i) 1 year 11.0 11.5-12.0 10.5-12.0 10.5-12.0 10.5-12.0 10.5-15.0 13.0 12.0-15.0 12.0-15.0 13.0-15.0 13.0-15.0 13.0-15.0 9.00-15.00
(ii) 2 years 12.0 12.0-13.0 11.5-13.0 11.5-13.0 11.5-13.0 11.5-15.0 14.0 13.0-15.0 13.0-15.0 14.0-15.0 13.0-15.0 14.0-15.0 10.00-15.00
(iii) 3 years 13.5 13.5-14.5 13.0-14.0 13.0-14.0 13.0-14.0 13.0-15.0 15.0 14.0-15.0 14.0-15.0 15.0 14.0-15.0 15.0 11.00-15.00Average yield-ordinary shares 5.9 3.2 3.8 3.2 2.6 2.1 1.7 2.2 1.8 3.1 4.2 5.2 6.5
Redemption yield-Government of India securities
(i) Short-term (1-5 years) 4.7-6.0 5.4-9.8 7.03-23.88 7.56-18.36 7.0-21.7 8.4-26.3 9.1-23.8 11.9-12.9 9.8-11.8 6.0-14.3 5.2-16.2 5.5-17.7 4.45-17.13(ii) Medium-term (5-15 years) 5.8-6.8 6.5-9.5 6.76-13.77 7.69-15.06 9.4-12.7 9.5-13.4 9.5-14.8 12.7-13.3 11.3-13.9 5.8-14.1 5.8-14.4 5.2-14.0 5.75-13.74(iii) Long-term (above 15 years) 6.4-7.5 8.4-11.5 9.36-11.73 10.05-11.80 10.9-12.0 9.9-12.4 8.8-12.5 12.9-13.4 11.8-13.5 11.8-13.0 9.0-14.2 9.0-13.2 7.00-13.04
a Effective 8 January 1993, a new auction system for 91-day Treasury Bills was introduced.b Effective 22 April 1992, a single 'maximum deposit rate' has been prescribed for deposits of various maturities. Earlier different rates were prescribed for different deposit maturities.c Deposits accepted from the public.d Well-established private sector companies.Note: Data for 1998-9 is preliminary.Source: RBI, Report on Currency and Finance, various issues.
245

Table A5.5Sectoral Deployment of Gross Bank Credit
(Rs billion-change during year)
Apr.-Oct.
1987-8 1988-9 1989-90 1990-1 1991-2 1992-3 1993-4 1994-5 1995-6 1996-7 1997-8 1997-8 1998-9
Gross bank credit 76.91 154.68 169.43 153.48 79.86 211.34 97.18 401.28 348.75 271.31 412.92 33.46 126.38
Public food procurement credit -29.14 -14.21 12.37 25.00 1.64 20.73 41.64 13.68 -24.84 -21.94 48.88 26.16 42.43
Gross non-food credit 106.05 168.89 157.06 128.48 78.22 190.61 55.54 387.60 373.59 293.25 364.04 7.30 83.95
Priority sectors 40.20 51.49 61.64 25.32 25.10 44.07 40.48 102.81 91.68 115.51 146.27 33.55 39.24Agriculture 14.39 19.41 25.76 2.24 14.07 18.06 12.45 27.75 30.61 43.98 34.27 14.76 17.50Small scale industries 17.12 23.15 24.08 16.38 9.69 18.76 25.91 50.21 42.46 40.60 75.64 3.95 5.92Other priority sectors 8.69 8.93 11.80 6.70 1.34 7.25 2.12 24.85 18.61 30.93 36.36 14.84 15.82
Industry (medium & large) 37.97 70.32 60.87 62.46 25.82 115.46 -7.71 168.07 183.81 95.51 149.26 -11.42 22.93
Wholesale Trade(other than food procurement) 5.18 11.69 7.05 4.38 2.44 8.15 3.61 24.19 22.31 3.60 8.77 -9.52 -0.61
Other sectors 22.70 35.39 27.60 36.32 24.86 22.93 19.16 92.53 75.79 78.63 59.74 -5.31 22.39
Export credit (included ingross non-food credit) 7.71 22.24 21.04 9.41 11.08 50.62 17.30 79.65 45.39 4.18 39.39 -11.66 -10.56
Priority sector advances as per centof net bank credita 44.10 43.20 42.40 39.20 38.70 35.10 35.30 33.30 32.10 0.65 0.29
a In the last month of each period, advances include Participation Certificates.
Source: MoF, Economic Survey, various issues.
246

TABLE A6.1Production of Major Crops
1980-1 1987-8 1988-9 1989-90 1990-1 1991-2 1992-3 1993-4 1994-5 1995-6 1996-7 1997-8 1998-9
Total foodgrains 129.6 140.4 169.9 171.0 176.4 168.4 179.5 184.3 191.5 180.4 199.4 192.4 202.5Kharif 77.6 74.6 95.6 101.0 99.4 91.6 101.5 100.4 101.1 95.1 103.9 101.1 102.6
Rabi 51.9 65.8 74.3 70.0 77.0 76.8 78.0 83.9 90.4 85.3 95.5 91.3 99.9
Total cereals 119.0 129.4 156.1 158.2 162.1 156.4 166.6 170.9 177.5 168.1 185.2 179.4 186.7Kharif 73.9 70.2 90.0 95.5 94.0 87.2 95.8 95.0 96.4 90.5 98.4 96.8 96.6Rabi 45.1 59.2 66.1 62.7 68.1 69.2 70.8 75.9 81.1 77.6 86.8 82.6 90.1
Rice 53.6 56.9 70.5 73.6 74.3 74.7 72.9 80.3 81.8 77.0 81.7 82.3 84.7
Kharif 50.1 49.0 63.4 65.9 66.3 66.4 65.3 70.7 72.6 67.9 71.3 71.6 71.8Rabi 3.5 7.8 7.1 7.7 8.0 8.3 7.6 9.6 9.2 9.1 10.4 10.7 12.9
Wheat 36.3 46.2 54.1 49.8 55.1 55.7 57.2 59.8 65.8 62.1 69.4 65.9 71.0Barley (jowar) 10.4 12.2 10.2 12.9 11.7 8.1 12.8 11.4 9.0 9.3 10.9 8.0 8.5
Kharif 7.5 8.6 7.1 9.2 8.3 5.7 9.4 7.3 5.9 5.6 7.0 5.0 5.3Rabi 2.9 3.6 3.1 3.7 3.4 2.4 3.4 4.1 3.1 3.7 3.9 3.0 3.2
Maize 7.0 5.7 8.2 9.7 9.0 8.1 10.0 9.6 8.9 9.5 10.8 10.9 10.8Bajra 5.3 3.3 7.8 6.6 6.9 4.7 8.9 5.0 7.2 5.4 7.9 7.7 6.9Total pulses 10.6 11.0 13.8 12.8 14.3 12.0 12.8 13.3 14.0 12.3 14.2 13.1 15.9
Kharif 3.8 4.4 5.6 5.5 5.4 4.4 5.6 5.4 4.7 4.6 5.5 4.4 6.1Rabi 6.8 6.6 8.2 7.3 8.9 7.6 7.2 7.9 9.4 7.7 8.7 8.7 9.8
Gram 4.3 3.6 5.1 4.2 5.4 4.1 4.4 5.0 6.4 5.0 5.6 6.1 6.6Tur 2.0 2.3 2.7 2.7 2.4 2.1 2.3 2.7 2.1 2.3 2.7 1.9 2.7Total oilseeedsa 9.4 12.6 18.0 16.9 18.6 18.6 20.1 21.5 21.3 22.1 24.4 22.0 25.7
Kharif 5.0 6.4 10.5 9.6 9.8 9.3 12.0 12.3 11.9 13.1 14.4 14.5 16.3Rabi 4.4 6.2 7.5 7.3 8.8 9.3 8.1 9.2 9.4 9.0 10.0 7.5 9.4
Groundnut 5.0 5.8 9.7 8.1 7.5 7.1 8.6 7.8 8.1 7.6 8.6 7.8 9.0Kharif 3.7 4.2 7.5 6.1 5.1 5.0 6.7 5.7 6.1 6.1 6.9 6.1 7.1Rabi 1.3 1.7 2.2 2.0 2.4 2.1 1.9 2.1 2.0 1.5 1.7 1.7 1.9
Rapeseed & mustard 2.3 3.4 4.4 4.1 5.2 5.9 4.8 5.3 5.8 6.0 6.7 4.7 6.1Sugarcane 154.2 196.7 203.0 225.6 241.0 254.0 228.0 229.7 275.5 281.1 277.6 276.3 290.7
Cotton 7.0 6.4 8.7 11.4 9.8 9.7 11.4 10.7 11.9 12.9 14.2 11.1 12.8Jute & mesta 8.2 6.8 7.9 8.3 9.2 10.3 8.6 8.4 9.1 8.8 11.1 11.1 9.8
Jute 6.5 5.8 6.7 7.1 7.9 8.9 7.5 7.3 8.0 7.7 10.0 10.0 8.9Mesta 1.7 1.0 1.2 1.2 1.3 1.4 1.1 1.1 1.1 1.1 1.2 1.1 0.9
Potato 9.7 14.1 14.9 14.8 15.2 16.4 15.2 17.4 17.4 18.8 24.2 17.6 22.2
a Includes groundnuts, rapeseed and mustard, sesame, linseed, castorseed, nigerseed, safflower, sunflower, and soybean.
Note: Unit of measurement of all commodities is million tonnes, except in the case of cotton, jute, and mesta where production is in terms of millions of bales. Figures for 1997-8 are provisional.
Source: MoF, Economic Survey, various issues.
247

TABLE A6.2Irrigated Area under Different Crops
(million hectares)
1980-1 1984-5 1985-6 1986-7 1987-8 1988-9 1989-90 1990-1 1991--2 1992-3 1993-4 1994-5 1995-6
Total foodgrains 37.8 40.1 40.4 41.8 40.5 43.9 44.3 44.9 45.8 46.9 48.3 49.9 49.7Total cereals 35.8 38.4 38.3 39.5 38.4 41.8 41.9 42.3 43.4 44.4 45.6 46.8 46.7
Rice 16.4 17.7 17.7 18.1 17.0 19.1 19.4 19.4 20.2 20.1 20.7 21.4 21.5Jowar 0.8 0.7 0.7 0.8 0.8 0.8 0.9 0.8 0.8 0.8 0.8 0.8 0.8Bajra 0.6 0.6 0.6 0.7 0.8 0.6 0.7 0.5 0.7 0.6 0.7 0.6 0.6Maize 1.2 1.0 1.1 1.3 1.2 1.2 1.2 1.2 1.3 1.3 1.4 1.3 1.4Wheat 15.6 17.5 17.3 17.7 17.8 19.1 18.8 19.5 19.6 20.8 21.4 22.0 21.7Barley 0.9 0.6 0.7 0.6 0.6 0.6 0.5 0.5 0.6 0.6 0.5 0.6 0.5
Total pulses 2.0 1.8 2.1 2.3 2.0 2.2 2.3 2.6 2.4 2.5 2.6 3.1 3.1
Other cropsOilseeds' 2.3 3.5 3.4 3.4 4.3 5.0 5.2 5.8 6.8 6.4 6.5 6.8 7.3Cotton 2.1 1.9 2.3 2.2 2.1 2.4 2.6 2.5 2.6 2.7 2.6 2.7 3.1Sugarcane 2.4 2.6 2.6 2.8 3.0 3.0 3.1 3.4 3.6 3.5 3.3 3.6 3.9
a Oilseeds include groundnut, rapeseed and mustard, linseed, sesame, and others.Source: MoF, Economic Survey, various issues.
248

TABLE A6.3Yield per Hectare of Major Crops
(kgs)
1980-1 1987-8 1988-9 1989-90 1990-1 1991-2 1992-3 1993-4 1994-5 1995-6 1996-7 1997-8 1998-9
Total foodgrains 1023 1173 1331 1349 1380 1382 1457 1501 1548 1491 1614 1551 1611Kharif 933 996 1166 1241 1231 1174 1302 1324 1341 1292 1379 1362 1387Rabi 1195 1468 1628 1544 1635 1751 1725 1787 1864 1799 1980 1832 1931
Total cereals 1142 1315 1493 1530 1571 1574 1654 1701 1763 1703 1831 1772 1836Kharif 1015 1082 1270 1366 1357 1305 1440 1465 1486 1428 1523 1519 1518Rabi 1434 1763 1964 1875 2010 2126 2068 2132 2260 2195 2376 2201 2365
Rice 1336 1465 1689 1745 1740 1751 1744 1888 1911 1797 1882 1895 1905Kharif 1303 1368 1627 1677 1670 1676 1676 1807 1841 1721 1793 1810 1792Rabi 2071 2640 2548 2678 2671 2720 2720 2816 2731 2678 2856 2770 2935
Wheat 1630 2002 2244 2121 2281 2394 2327 2380 2559 2483 2679 2470 2596Barley (jowar) 660 762 697 869 814 655 982 898 779 823 956 727 833
Kharif 737 892 789 1053 969 757 1230 1065 988 996 1214 933 1021Rabi 520 568 550 604 582 496 632 704 555 650 696 528 639
Maize 1159 1029 1395 1632 1518 1376 1676 1602 1448 1595 1720 1721 1785Bajra 458 378 646 610 658 465 836 521 700 577 788 792 732Total pulses 473 515 598 549 578 533 573 598 610 552 635 572 661
Kharif 361 435 504 480 471 393 495 492 351 448 512 415 586Rabi 571 587 686 616 672 672 654 701 589 640 747 706 718
Gram 657 629 753 652 712 739 684 783 853 700 813 812 790Tur 689 685 779 763 673 588 652 762 644 670 756 563 750Total oilseedsa 532 629 824 742 771 719 797 799 843 851 926 840 948
Kharif 492 559 805 691 698 604 804 759 797 835 902 '937 996Rabi 588 720 851 822 872 886 786 860 910 876 963 699 877
Groundnut 736 855 1132 930 904 818 1049 941 1027 1007 1138 1078 1176Kharif 629 737 1066 824 751 687 969 813 913 928 1076 997 1083Rabi 1444 1425 1442 1532 1611 1501 1473 1624 1650 1529 1490 1512 1471
Rapeseed & mustard 560 748 906 831 904 895 776 847 950 916 1017 667 894Sugarcane 57,844 60,000 61,000 65,000 65,000 66,000 64,000 67,000 71,000 68,000 66,000 70,000 69,288Cotton 152 168 202 252 225 216 257 249 257 242 265 213 240Jute & mesta 1130 1274 1540 1646 1634 1662 1658 1713 1760 1712 1818 1795 1730
Jute 1245 1496 1748 1879 1833 1837 1857 1907 1949 1875 1998 1960 1812Mesta 828 680 909 956 988 1019 955 1008 1023 1078 1030 1019 992
Potato 13,256 16,000 1,6000 16,000 16,000 160,00 15,000 17,000 16,000 17,000 19,000 14,600 17,800
a Includes groundnut, rapeseed and mustard, sesame, linseed, castorseed, nigerseed, safflower, sunflower, and soybean.
Note: Figures for 1997-8 are provisional.
Source: MoF, Economic Survey, various issues.
249

TABLE A6.4Net Availability, Procurement, and Public Distribution of Foodgrains
(million tonnes)
1980-1 1986-7 1987-8 1988-9 1989-90 1990-1 1991-2 1992-3 1993-4 1994-5 1995-6 1996-7 1997-8
Net production 113.4 125.5 122.8 148.7 149.7 154.3 147.3 157.5 161.2 167.6 157.9 174.5 168.0Net imports 0.7 -0.2 3.8 1.2 1.3 -0.1 -0.4 3.1 1.1 0.4 -1.2 1.0 2.2Change in government stocks -0.2 -9.5 -4.6 2.6 6.2 -4.4 -1.5 10.8 7.5 -1.8 -8.5 -1.7 6.2Net availability 114.3 134.8 130.8 147.2 144.8 158.6 148.4 149.8 154.8 169.8 165.2 177.2 164.0Procurement 13.0 15.7 14.1 18.9 24.0 19.6 17.9 28.1 26.0 22.6 19.6 22.5 25.4Public distribution 13.0 18.7 18.6 16.4 16.0 20.8 18.8 16.4 14.0 15.3 18.3 17.5 20.0
Note: Production figures relate to agricultural year. Figures for procurement and public distribution relate to calendar years.Source: MoF, Economic Survey, various issues.
250

TABLE A6.5aNew Index of Industrial Production
(1993-4 = 100)
1997-8 1998-9over over
Weight 1993-4 1994-5 1995-6 1996-7 1997-8 1998-9 1996-7 1997-8
General index 100.0 100.0 108.4 122.3 129.1 137.6 143.1 6.6 4.0
Mining & quarrying 10.5 100.0 107.6 117.9 115.6 122.4 120.3 5.9 -1.7
Electricity generated 10.2 100.0 108.5 117.3 122.0 130.0 138.4 6.6 6.5
Manufacturing index 79.4 100.0 108.5 123.5 131.8 140.6 146.7 6.7 4.3
Food products 9.1 100.0 121.6 129.8 134.3 133.8 134.6Beverages, tobacco, etc. 2.4 100.0 103.0 116.7 132.4 158.1 178.3 19.4 12.8Cotton textiles 5.5 100.0 99.1 109.5 122.7 125.6 115.9 2.4 -7.7Jute textiles 2.3 0.0 114.5 131.3 145.1 172.0 176.8 18.5 2.8Textile products 0.6 100.0 95.1 102.4 97.8 114.3 106.0 16.9 -7.3Wood & wood products 2.5 100.0 98.5 133.7 146.3 158.7 153.1 8.5 -3.5Paper & paper products 2.7 100.0 99.3 123.2 131.9 128.5 121.0 -2.6 -5.8Leather & leather products 2.7 100.0 108.6 125.5 136.9 146.4 169.7 6.9 15.9Rubber, plastic, & petroleum prod. 1.1 100.0 86.8 99.1 108.4 110.8 119.8 2.2 8.1Chemical & chemical products 5.7 100.0 107.7 116.1 118.4 124.6 138.7 5.2 11.3Non-metallic mineral products 14.0 100.0 105.3 117.2 122.7 140.5 149.4 14.5 6.3Basic metal & alloy products 4.4 100.0 108.0 131.7 141.9 161.4 174.5 13.7 8.1Metal products 7.5 100.0 113.1 131.0 139.8 143.5 140.5 2.6 -2.1Machinery & machine tools 2.8 100.0 104.7 100.6 110.9 120.2 141.4 8.4 17.6Transport equipment 9.6 100.0 112.8 134.7 141.7 149.5 151.7 5.5 1.5Miscellaneous products 4.0 100.0 113.2 132.8 149.9 153.8 177.6 2.6 15.5
Note: Figures for 1997-8 are provisional.
Source: CSO, IIP Division.
251

TABLE A6.5bIndex of Industrial Production
(1980-1 = 100, old series)
1996-7 1997-8over over
Weight 1987-8 1988-9 1989-90 1990-1 1991-2 1992-3 1993-4 1994-5 1995-6 1996-7 1997-8 1995-6 1996-7
General index 100.0 166.4 180.9 196.4 212.6 213.9 218.9 232.0 253.8 284.5 304.7 317.5 7.1 4.2
Mining & quarrying 11.5 184.6 199.1 211.6 221.2 222.5 223.7 231.5 248.9 267.3 268.1 281.2 0.3 4.9
Electricity generated 11.4 181.0 198.2 219.7 236.8 257.0 269.9 290.0 314.7 340.1 353.4 377.4 3.9 6.8
Manufacturing index 77.1 161.5 175.6 190.7 207.8 206.2 210.7 223.5 245.4 278.8 303.0 313.9 8.7 3.6
Food products 5.3 139.0 148.5 150.9 169.8 178.0 175.3 160.0 181.6 207.0 214.1 208.9Beverages, tobacco, etc. 1.6 84.9 92.1 103.0 104.8 107.3 113.7 137.8 134.8 160.9 184.6 193.4 14.7 4.8Cotton textiles 12.3 111.2 107.8 112.3 126.6 139.0 150.1 160.5 155.8 173.1 191.7 202.2 10.7 5.5Jute textiles 2.0 91.0 101.9 97.4 101.6 90.8 87.0 103.2 91.4 93.6 95.8 104.1 2.3 8.7Textile products 0.8 91.7 134.2 151.7 103.2 97.2 75.8 73.4 78.6 89.7 95.5 88.9 6.5 -6.9Wood & wood products 0.5 161.7 171.7 176.0 197.2 185.0 190.5 199.3 205.5 240.8 232.9 208.9 -3.3 -10.3Paper & paper products 3.2 166.3 171.3 181.5 198.0 203.0 210.9 224.8 258.1 286.7 311.4 335.3 8.6 7.7Leather & leather products 0.5 185.5 177.4 188.3 194.3 181.3 187.7 204.3 211.9 227.3 231.9 229.3 2.0 -1.1Rubber, plastic, & petroleum prod. 4.0 155.1 168.3 173.5 174.0 172.0 174.6 176.4 193.2 211.1 215.8 236.9 2.2 9.8Chemical & chemical products 12.5 200.9 233.4 247.6 254.1 261.2 276.9 297.9 307.4 332.3 348.0 357.0 4.7 2.6Non-metallic mineral products 3.0 158.1 184.6 189.9 193.1 205.2 208.9 218.5 236.0 264.5 286.2 320.9 8.2 12.1Basic metal & alloy products 9.8 135.6 144.9 143.7 158.8 167.8 168.4 224.2 214.6 225.7 303.6 316.0 34.5 4.1Metal products 2.3 129.6 133.5 142.6 143.1 133.1 124.6 126.5 148.8 173.8 177.1 178.7 1.9 0.9Machinery & machine tools 6.2 139.2 161.2 171.9 186.9 183.3 181.1 189.2 228.2 274.3 279.5 281.2 1.9 0.6Electrical machinery 5.8 335.2 346.0 459.2 563.6 493.7 483.6 460.1 460.1 460.1 460.1 460.1 0.0 0.0Transport equipment 6.4 151.9 171.3 181.1 192.5 191.1 200.6 211.2 239.1 297.9 354.5 329.7 19.0 -7.0Miscellaneous products 0.9 272.1 306.3 333.2 321.8 269.9 281.3 267.0 269.7 300.7 283.2 299.4 -5.8 5.7
Note: Figures for 1997-8 are provisional.
Source: CSO, HP Division.
252

TABLE A6.6Production, Imports, and Consumption of Fertilizers
(CO3' nutrient tonnes)
Nitrogenousa Phosphaticb Potassic Total
(Apr-Mar.) Production Imports Consumption Production Imports Consumption Imports Consumption Production Imports Consumption
1980-1 2163.9 1510.2 3678.1 841.5 452.1 1213.6 796.8 623.9 3005.4 2759.1 5515.6
1981-2 3143.3 1055.1 4068.7 950.0 343.2 1322.9 643.8 676.2 4093.3 2042.1 6067.8
1982-3 3429.7 424.6 4242.5 983.7 63.4 1432.7 643.7 726.3 4413.4 1131.7 6401.5
1983-4 3491.5 656.1 5204.4 1064.1 142.6 1730.3 556.4 775.4 4555.6 1355.1 710.1
1984-5 3917.3 2008.6 5486.1 1317.9 745.2 1886.4 871.0 838.5 5235.2 3624.8 8211.0
1985-6 4328.0 1680.0 5661.0 1428.0 816.0 2005.0 903.0 808.0 5756.0 3399.0 474.0
1986-7 5410.0 1103.0 5716.0 1660.0 255.0 2079.0 952.0 850.0 7070.0 2310.0 8645.0
1987-8 5466.0 175.0 5717.0 1665.0 0.0 2187.0 809.0 880.0 7131.0 984.0 8784.0
1988-9 6712.0 219.0 7251.0 2252.0 407.0 2721.0 982.0 1068.0 8964.0 1608.0 11,040.0
1989-90 6747.0 523.0 7386.0 1796.0 - 3014.0 1280.0 1168.0 8543.0 3114.0 11,568.0
1990-1 6993.0 414.0 7997.0 2052.0 1311.0 3221.0 1328.0 1328.0 9045.0 2758.0 12,546.0
1991-2 7301.0 566.0 8046.0 2562.0 1016.0 3321.0 1236.0 1361.0 9863.0 2769.0 12,728.0
1992-3 7430.0 1160.0 8426.0 2306.0 967.0 2842.0 1082.0 884.0 9736.0 2988.0 12,152.0
1993-4 7231.0 1564.0 8789.0 1816.0 687.0 2669.0 880.0 908.0 9047.0 3166.0 12,366.0
1994-5 7948.0 1476.0' 9507.0 2493.0 722.0' 2932.0 1109.0d 1125.0 10,438.0 2965.0' 13,564.0
1995-6 8777.0 1938.0 9823.0 2558.0 380.0 2898.0 1423.0 1156.0 11,335.0 3955.0 13,877.0
1996-7 8599.0 1155.0 10,302.0 2556.0 246.0 2977.0 613.0 1029.0 11,155.0 1975.0 14,308.0
1997-8c 10,086.0 1362.0 10,900.0 2976.0 672.0 3915.0 1140.0 1373.0 13,062.0 3174.0 16,188.0
1998-9C 10,426.0 549.0 12,273.0 2998.0 748.0 4411.0 832.0 1487.0 13,424.0 2165.0 18,171.0
-Not available.
a Excludes nitrogen meant for non-agricultural purposes.h Exdudes data in respect of bonemeal and rockphosphate.c Anticipated.
d Incorporates import of urea in nutrient terms, the only controlled fertilizer imported on government account.
Source: The Fertilizer Association of India, Fertilizer Statistics, various issues; MoF, Economic Survey, various issues.
253
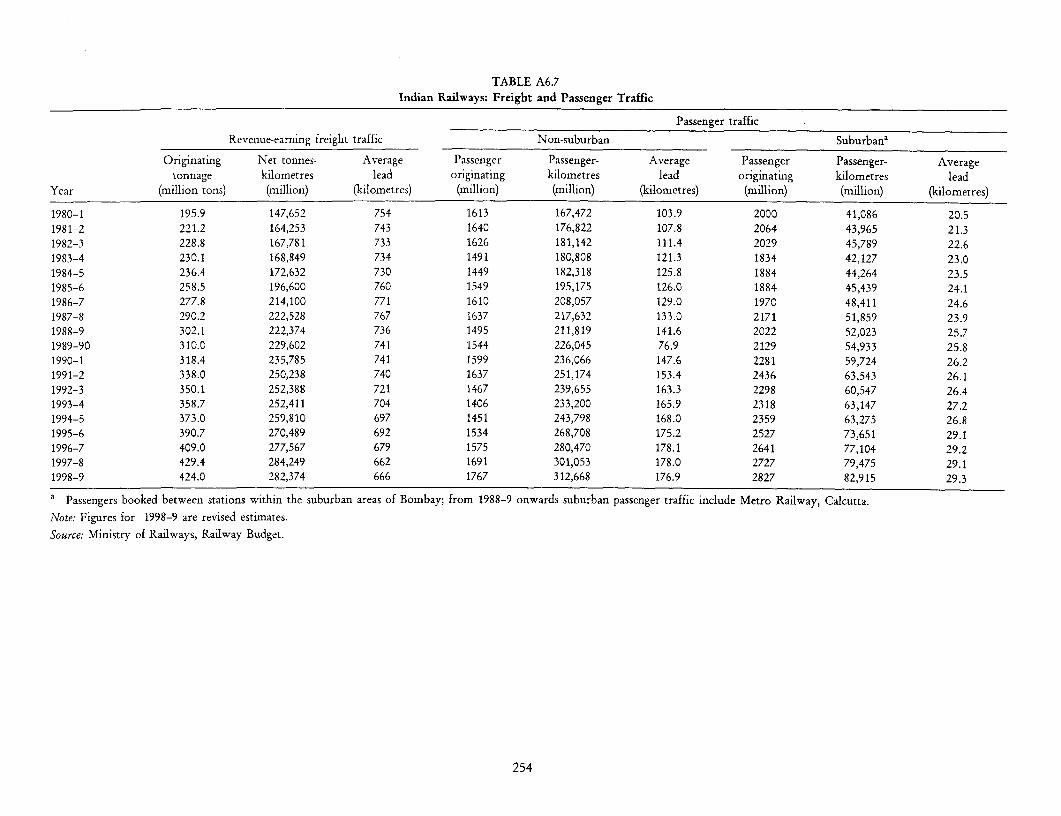
TABLE A6.7Indian Railways: Freight and Passenger Traffic
Passenger traffic
Revenue-earning freight traffic Non-suburban Suburbana
Originating Net tonnes- Average Passenger Passenger- Average Passenger Passenger- Averagetonnage kilometres lead originating kilometres lead originating kilometres lead
Year (million tons) (million) (kilometres) (million) (million) (kilometres) (million) (million) (kilometres)
1980-1 195.9 147,652 754 1613 167,472 103.9 2000 41,086 20.51981-2 221.2 164,253 743 1640 176,822 107.8 2064 43,965 21.31982-3 228.8 167,781 733 1626 181,142 111.4 2029 45,789 22.61983-4 230.1 168,849 734 1491 180,808 121.3 1834 42,127 23.01984-5 236.4 172,632 730 1449 182,318 125.8 1884 44,264 23.51985-6 258.5 196,600 760 1549 195,175 126.0 1884 45,439 24.11986-7 277.8 214,100 771 1610 208,057 129.0 1970 48,411 24.61987-8 290.2 222,528 767 1637 217,632 133.0 2171 51,859 23.91988-9 302.1 222,374 736 1495 211,819 141.6 2022 52,023 25.71989-90 310.0 229,602 741 1544 226,045 76.9 2129 54,933 25.81990-1 318.4 235,785 741 1599 236,066 147.6 2281 59,724 26.21991-2 338.0 250,238 740 1637 251,174 153.4 2436 63,543 26.11992-3 350.1 252,388 721 1467 239,655 163.3 2298 60,547 26.41993-4 358.7 252,411 704 1406 233,200 165.9 2318 63,147 27.21994-5 373.0 259,810 697 1451 243,798 168.0 2359 63,275 26.81995-6 390.7 270,489 692 1534 268,708 175.2 2527 73,651 29.11996-7 409.0 277,567 679 1575 280,470 178.1 2641 77,104 29.21997-8 429.4 284,249 662 1691 301,053 178.0 2727 79,475 29.11998-9 424.0 282,374 666 1767 312,668 176.9 2827 82,915 29.3
a Passengers booked between stations within the suburban areas of Bombay; from 1988-9 onwards suburban passenger traffic include Metro Railway, Calcutta.
Note: Figures for 1998-9 are revised estimates.
Source: Ministry of Railways, Railway Budget.
254
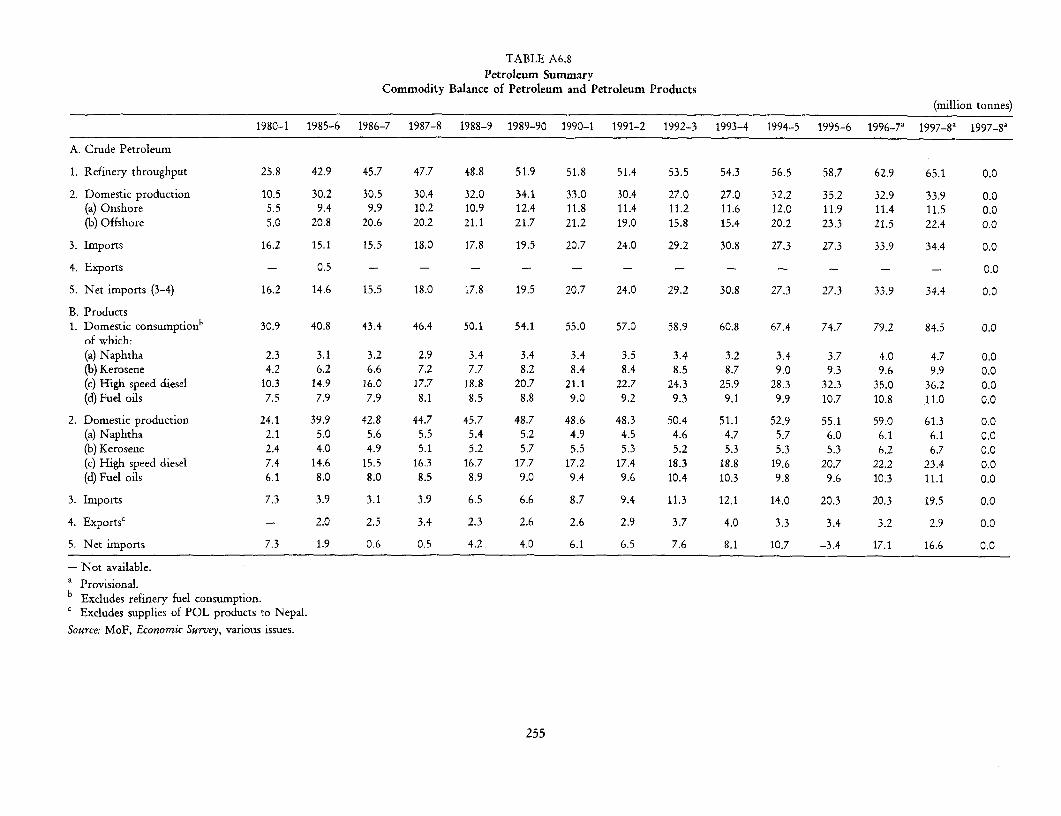
TABLE A6.8Petroleum Summary
Commodity Balance of Petroleum and Petroleum Products(million tonnes)
1980-1 1985-6 1986-7 1987-8 1988-9 1989-90 1990-1 1991-2 1992-3 1993-4 1994-5 1995-6 1996-7a 1997-8a 1997-8a
A. Crude Petroleum
1. Refinery throughput 25.8 42.9 45.7 47.7 48.8 51.9 51.8 51.4 53.5 54.3 56.5 58.7 62.9 65.1 0.0
2. Domestic production 10.5 30.2 30.5 30.4 32.0 34.1 33.0 30.4 27.0 27.0 32.2 35.2 32.9 33.9 0.0(a) Onshore 5.5 9.4 9.9 10.2 10.9 12.4 11.8 11.4 11.2 11.6 12.0 11.9 11.4 11.5 0.0(b) Offshore 5.0 20.8 20.6 20.2 21.1 21.7 21.2 19.0 15.8 15.4 20.2 23.3 21.5 22.4 0.0
3. Imports 16.2 15.1 15.5 18.0 17.8 19.5 20.7 24.0 29.2 30.8 27.3 27.3 33.9 34.4 0.0
4. Exports - 0.5 - - - - - - - - - - - - 0.0
5. Net imports (3-4) 16.2 14.6 15.5 18.0 17.8 19.5 20.7 24.0 29.2 30.8 27.3 27.3 33.9 34.4 0.0
B. Products1. Domestic consumptionb 30.9 40.8 43.4 46.4 50.1 54.1 55.0 57.0 58.9 60.8 67.4 74.7 79.2 84.5 0.0
of which:(a) Naphtha 2.3 3.1 3.2 2.9 3.4 3.4 3.4 3.5 3.4 3.2 3.4 3.7 4.0 4.7 0.0(b) Kerosene 4.2 6.2 6.6 7.2 7.7 8.2 8.4 8.4 8.5 8.7 9.0 9.3 9.6 9.9 0.0(c) High speed diesel 10.3 14.9 16.0 17.7 18.8 20.7 21.1 22.7 24.3 25.9 28.3 32.3 35.0 36.2 0.0(d) Fuel oils 7.5 7.9 7.9 8.1 8.5 8.8 9.0 9.2 9.3 9.1 9.9 10.7 10.8 11.0 0.0
2. Domestic production 24.1 39.9 42.8 44.7 45.7 48.7 48.6 48.3 50.4 51.1 52.9 55.1 59.0 61.3 0.0(a) Naphtha 2.1 5.0 5.6 5.5 5.4 5.2 4.9 4.5 4.6 4.7 5.7 6.0 6.1 6.1 0.0(b) Kerosene 2.4 4.0 4.9 5.1 5.2 5.7 5.5 5.3 5.2 5.3 5.3 5.3 6.2 6.7 0.0(c) High speed diesel 7.4 14.6 15.5 16.3 16.7 17.7 17.2 17.4 18.3 18.8 19.6 20.7 22.2 23.4 0.0(d) Fuel oils 6.1 8.0 8.0 8.5 8.9 9.0 9.4 9.6 10.4 10.3 9.8 9.6 10.3 11.1 0.0
3. Imports 7.3 3.9 3.1 3.9 6.5 6.6 8.7 9.4 11.3 12.1 14.0 20.3 20.3 19.5 0.0
4. Exportsc - 2.0 2.5 3.4 2.3 2.6 2.6 2.9 3.7 4.0 3.3 3.4 3.2 2.9 0.0
5. Net imports 7.3 1.9 0.6 0.5 4.2 4.0 6.1 6.5 7.6 8.1 10.7 -3.4 17.1 16.6 0.0
- Not available.a Provisional.
b Excludes refinery fuel consumption.c Excludes supplies of POL products to Nepal.
Source: MoF, Econornic Survey, various issues.
255
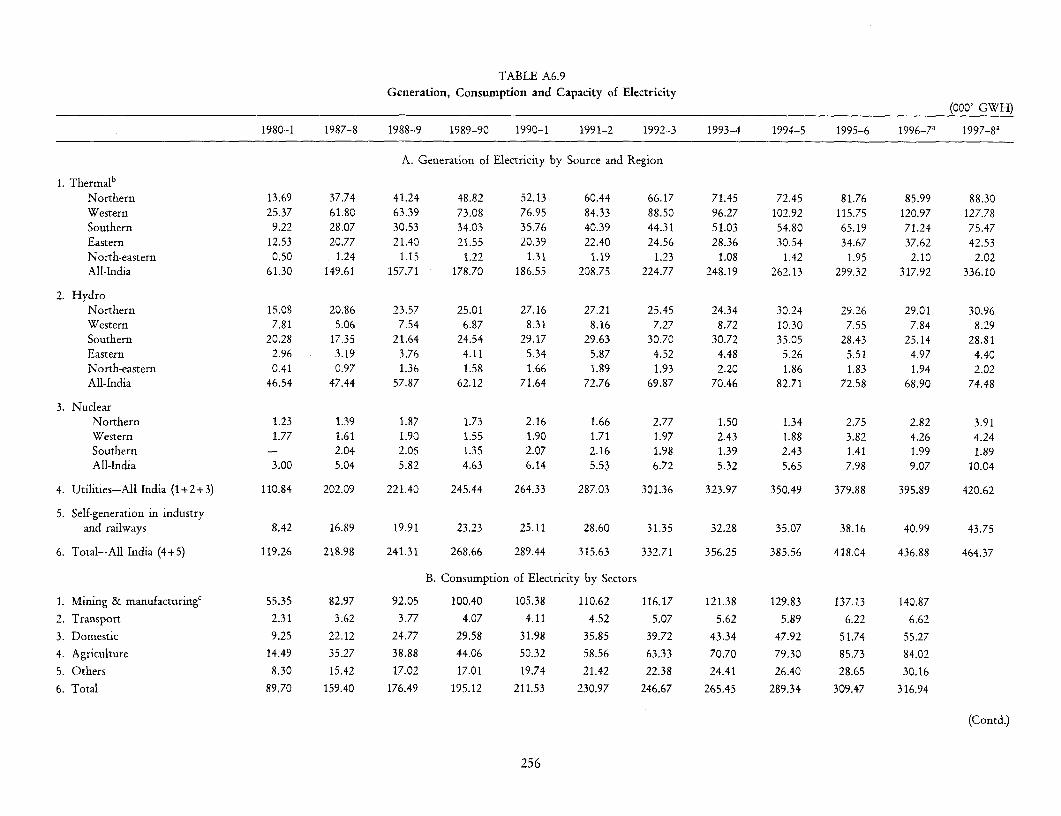
TABLE A6.9Generation, Consumption and Capacity of Electricity
(000' GWH)
1980-1 1987-8 1988-9 1989-90 1990-1 1991-2 1992-3 1993-4 1994-5 1995-6 1996-7a 1997-8a
A. Generation of Electricity by Source and Region
1. ThermalbNorthern 13.69 37.74 41.24 48.82 52.13 60.44 66.17 71.45 72.45 81.76 85.99 88.30Western 25.37 61.80 63.39 73.08 76.95 84.33 88.50 96.27 102.92 115.75 120.97 127.78Southern 9.22 28.07 30.53 34.03 35.76 40.39 44.31 51.03 54.80 65.19 71.24 75.47Eastern 12.53 20.77 21.40 21.55 20.39 22.40 24.56 28.36 30.54 34.67 37.62 42.53North-eastern 0.50 1.24 1.15 1.22 1.31 1.19 1.23 1.08 1.42 1.95 2.10 2.02All-India 61.30 149.61 157.71 178.70 186.55 208.75 224.77 248.19 262.13 299.32 317.92 336.10
2. HydroNorthern 15.08 20.86 23.57 25.01 27.16 27.21 25.45 24.34 30.24 29.26 29.01 30.96Western 7.81 5.06 7.54 6.87 8.31 8.16 7.27 8.72 10.30 7.55 7.84 8.29Southern 20.28 17.35 21.64 24.54 29.17 29.63 30.70 30.72 35.05 28.43 25.14 28.81Eastern 2.96 3.19 3.76 4.11 5.34 5.87 4.52 4.48 5.26 5.51 4.97 4.40North-eastern 0.41 0.97 1.36 1.58 1.66 1.89 1.93 2.20 1.86 1.83 1.94 2.02All-India 46.54 47.44 57.87 62.12 71.64 72.76 69.87 70.46 82.71 72.58 68.90 74.48
3. NuclearNorthern 1.23 1.39 1.87 1.73 2.16 1.66 2.77 1.50 1.34 2.75 2.82 3.91Western 1.77 1.61 1.90 1.55 1.90 1.71 1.97 2.43 1.88 3.82 4.26 4.24Southern - 2.04 2.05 1.35 2.07 2.16 1.98 1.39 2.43 1.41 1.99 1.89All-India 3.00 5.04 5.82 4.63 6.14 5.53 6.72 5.32 5.65 7.98 9.07 10.04
4. Utilities-All India (1+2+3) 110.84 202.09 221.40 245.44 264.33 287.03 301.36 323.97 350.49 379.88 395.89 420.62
5. Self-generation in industryand railways 8.42 16.89 19.91 23.23 25.11 28.60 31.35 32.28 35.07 38.16 40.99 43.75
6. Total-All India (4+5) 119.26 218.98 241.31 268.66 289.44 315.63 332.71 356.25 385.56 418.04 436.88 464.37
B. Consumption of Electricity by Sectors
1. Mining & manufacturingc 55.35 82.97 92.05 100.40 105.38 110.62 116.17 121.38 129.83 137.13 140.87
2. Transport 2.31 3.62 3.77 4.07 4.11 4.52 5.07 5.62 5.89 6.22 6.62
3. Domestic 9.25 22.12 24.77 29.58 31.98 35.85 39.72 43.34 47.92 51.74 55.27
4. Agriculture 14.49 35.27 38.88 44.06 50.32 58.56 63.33 70.70 79.30 85.73 84.02
5. Others 8.30 15.42 17.02 17.01 19.74 21.42 22.38 24.41 26.40 28.65 30.16
6. Total 89.70 159.40 176.49 195.12 211.53 230.97 246.67 265.45 289.34 309.47 316.94
(Contd.)
256

1980-1 1987-8 1988-9 1989-90 1990-1 1991-2 1992-3 1993-4 1994-5 1995-6 1996_7a 1997-8a
C. Installed Capacity (000' MW)
Utilities
Thermal 17.6 35.6 39.7 43.8 45.8 48.1 50.7 54.3 58.1 60.1 61.0 64.0
Hydro 11.8 17.3 17.8 18.3 18.8 19.2 19.6 20.4 20.8 21.0 21.7 22.0
Nuclear 0.9 1.3 1.5 1.5 1.5 1.8 2.0 2.0 2.2 2.2 2.2 2.2
Total 30.3 54.2 59.0 63.6 66.1 69.1 72.3 76.7 81.1 83.3 84.9 88.2
Non-Utilities 3.1 6.3 7.5 8.2 8.6 9.3 10.1 10.2 11.1 11.9 12.1 12.9
-Not available.
a Provisional data.
b Includes steam, diesel, wind, and gas.
c Includes industrial power from utilities plus net generation in the non-utilities.
Source: Central Electricity Authority, Power Data Bank & Information Directorate.
257

TABLE A6.10New Index Numbers of Wholesale Prices by Years
(Base 1981-2 = 100)
Weights 1987-8 1988-9 1989-90 1990-1 1991-2 1992-3 1993-4 1994-5 1995-6 1996-7 1997-8 1998-9 per cent
change'
Total Food Articles 17.386 161.1 177.1 179.3 200.6 241.1 271.0 284.4 312.7 335.7 375.1 388.0 440.9 13.6
Foodgrains 7.917 141.3 161.8 165.4 179.2 216.4 242.4 260.8 293.2 313.0 353.8 362.7 392.7 8.3Other food 9.469 177.7 189.9 190,9 218.5 261.8 294.9 304.2 329.0 354.7 392.8 409.1 481.3 17.6
Industrial Raw Material 14.909 142.8 140.3 145.3 166.6 191.7 192.2 211.8 248.7 267.3 273.9 283.0 307.0 8.5
Non-food articles 10.881 163.0 160.2 166.0 194.2 229.2 228.7 249.1 299.0 321.7 329.8 340.5 376.4 10.5Minerals 4.828 100.5 98.5 102.2 109.0 113.5 116.1 133.9 143.6 157.5 157.3 162.9 162.1 -0.5
Fuel, Power, & Lub. 10.663 143.3 151.2 156.6 175.8 199.0 227.1 262.4 280.4 285.4 324.2 365.7 381.3 4.3
Manuf. Products 57.042 138.5 151.5 168.6 182.8 203.4 225.6 243.2 268.8 293.1 305.0 317.5 332.0 4.6
Food products 10.143 140.5 147.8 165.4 181.7 206.3 223.8 246.7 270.5 278.8 297.3 321.3 344.6 7.3Beverage & tobacco 2.149 155.0 180.7 207.7 242.1 265.7 293.7 306.6 342.1 373.9 392.9 442.0 482.7 9.2Textiles 11.545 126.6 139.6 158.2 171.2 188.3 200.7 219.9 256.8 294.6 304.1 310.3 320.3 3.2
Chemicals and chemical products 7.355 131.9 135.8 140.0 147.9 168.4 192.6 207.8 232.6 249.9 259.3 269.3 281.8 4.6Basic metals and products 7.632 149.7 176.4 205.6 219.9 234.8 256.6 276.6 300.5 329.0 339.6 348.8 353.1 1.2Machinery and machine tools 6.268 132.3 150.8 166.2 180.2 208.3 230.6 237.9 262.8 282.8 295.0 299.4 304.7 1.8Transport eqpt. 2.705 135.5 148.9 166.2 181.3 202.5 218.1 223.8 238.5 254.5 265.9 274.9 285.8 4.0
All Commodities 100.0 143.5 154.2 165.7 182.7 207.8 228.7 247.8 274.7 295.8 314.6 329.8 352.4 6.9
Memo items:Administered prices:
Petroleum crude and natural gas 4.3 93.5 89.1 91.8 99.6 101.0 102.7 120.7 129.1 130.2 132.1 138.1 135.8 -1.7Petroleum products (Mineral oils) 6.7 126.3 129.2 129.7 154.7 179.6 204.1 223.6 235.0 235.2 270.1 301.0 306.8 1.9Coal mining 1.3 183.0 212.3 231.8 232.8 249.9 301.2 346.4 364.0 368.1 416.8 489.0 503.3 2.9Electricity 2.7 166.7 176.6 187.7 200.9 222.8 249.0 318.3 352.6 369.7 413.2 466.5 506.4 8.6Urea N-content 1.0 111.5 99.6 99.0 99.0 125.2 127.4 126.6 148.6 153.6 155.2 169.8 173.0 1.9
Decontrolled prices:Iron and steel 2.4 143.4 163.8 188.8 201.5 212.6 233.0 252.7 270.5 290.8 305.5 315.8 319.5 1.2Fertilizers 1.7 107.6 98.9 99.1 99.1 123.9 160.8 181.6 196.6 210.7 211.9 223.5 227.4 1.7Super phosphate 0.1 123.0 110.7 119.6 119.6 150.1 278.7 350.7 343.1 367.1 375.9 379.4 386.5 1.9Amrnmonium phosphate 0.1 100.3 96.5 96.5 96.5 121.1 232.8 304.4 304.4 304.4 304.4 304.4 344.0 13.0Lubricants 0.5 123.9 148.3 152.2 182.1 226.5 275.5 330.0 337.9 342.6 385.6 401.9 420.9 4.7
a Refers to per cent change in fiscal year 1998-9 over 1997-8.
Note: This WPI series based 1981-2 was introduced as of July 1989. Data for 1998-9 are provisional.
Source: Ministry of Industry, Office of the Economic Adviser.
258
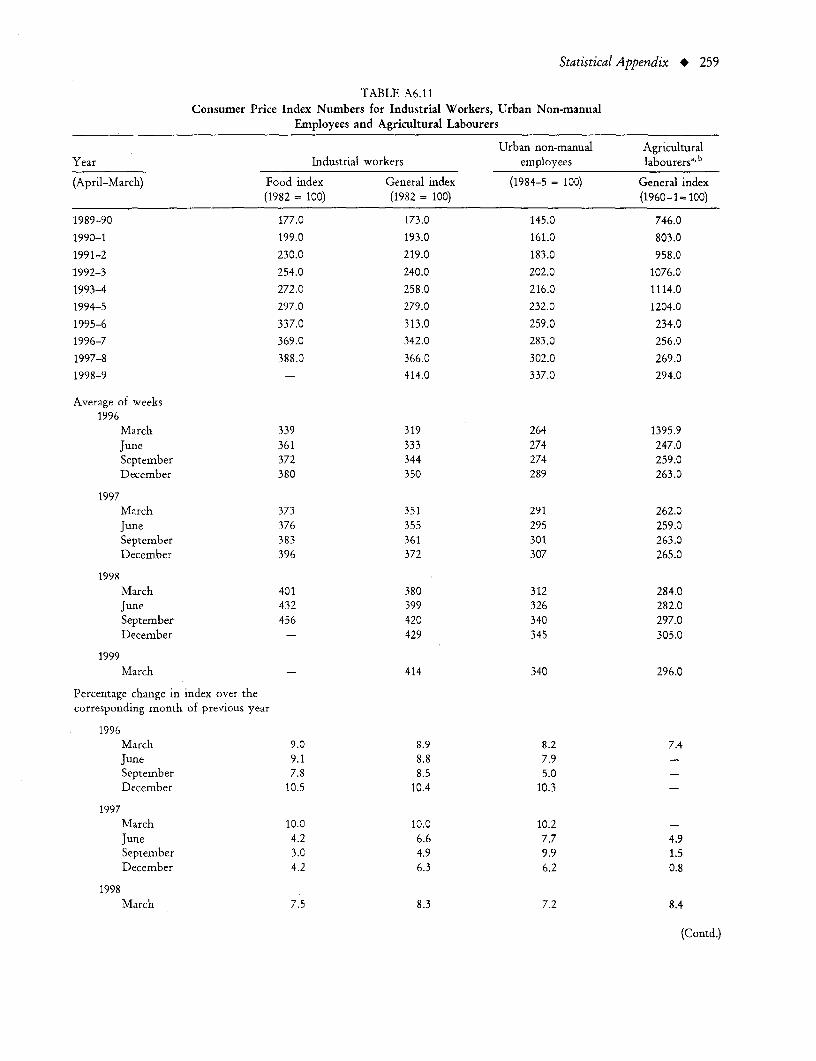
Statistical Appendix * 259
TABLE A6.11Consumer Price Index Numbers for Industrial Workers, Urban Non-manual
Employees and Agricultural Labourers
Urban non-manual AgriculturalYear Industrial workers employees labourersa b
(April-March) Food index General index (1984-5 = 100) General index(1982 = 100) (1982 = 100) (1960-1=100)
1989-90 177.0 173.0 145.0 746.01990-1 199.0 193.0 161.0 803.01991-2 230.0 219.0 183.0 958.01992-3 254.0 240.0 202.0 1076.01993-4 272.0 258.0 216.0 1114.01994-5 297.0 279.0 232.0 1204.01995-6 337.0 313.0 259.0 234.01996-7 369.0 342.0 283.0 256.01997-8 388.0 366.0 302.0 269.01998-9 - 414.0 337.0 294.0
Average of weeks1996
March 339 319 264 1395.9June 361 333 274 247.0September 372 344 274 259.0December 380 350 289 263.0
1997March 373 351 291 262.0June 376 355 295 259.0September 383 361 301 263.0December 396 372 307 265.0
1998March 401 380 312 284.0June 432 399 326 282.0September 456 420 340 297.0December - 429 345 305.0
1999March 414 340 296.0
Percentage change in index over thecorresponding month of previous year
1996March 9.0 8.9 8.2 7.4June 9.1 8.8 7.9 -September 7.8 8.5 5.0 -December 10.5 10.4 10.3 -
1997March 10.0 10.0 10.2 -June 4.2 6.6 7.7 4.9September 3.C 4.9 9.9 1.5December 4.2 6.3 6.2 0.8
1998March 7.5 8.3 7.2 8.4
(Contd.)

260 * Statistical Tables
Urban non-manual AgriculturalYear Industrial workers employees labourersa, b
(April-March) Food index General index (1984-5 = 100) General index(1982 = 100) (1982= 100) (1960-1= 100)
June 14.9 12.4 10.5 8.9September 19.1 16.3 13.0 12.9December - 15.3 12.4 15.1
1998March 8.9 9.0 4.2
- Not available.a Indices relate to agricultural years June-July).b Earlier base of 1960-1 was discontinued w.e.f. November 1987.Source: Ministry of Labour, Labour Bureau, Simla; CSO; MoF, Economic Survey, various issues; CMIE, Monthly Review of theIndian Economy.


INDIAREDUCING POVERTY, ACCELERATING DEVELOPMENT
Worldwide experience suggests that the primary conditions for sustained economicgrowth and poverty reduction are sound macroeconomic policies, open trade relations,and increases in human and physical capital. However, sustained development andpoverty reduction also hinge on a comprehensive development framework. Marketsneed to be incentive based, yet regulated. functioning alongside an adequatelysupervised financial sector. Other prerequisites include effective health. educationand social services, quality infrastructure and public services, and policies orientedto environmental and human development.
This World Bank Country Study for India is the first of its kind in the Bank's newcomprehensive approach to country reports. It argues that reforms that reduce therisk of macroeconomic instability in such a framework would also be effective inreducing poverty - by increasing the access of the poor to human development.reducing distortions and expanding the demand for labour. In this context, the report:
* reviews the performance of the Indian economy* analyses various facets of development* identifies potential vulnerabilities* emphasizes the role of these reforms to overcome initial lags and increase the
pace of development in poorer states* highlights the main areas for policy reforms as
- improvement in infrastructure, both public and private- expansion in core public activities through realignment of central and state
governments- increased expenditure on health and educatidn- deregulation of goods and factor markets- privatization of areas such as power- cuts in explicit and implicit subsidies- strengthening of the financial system, and- improvement of governance through streamlining of the legal system
Its statistical richness and analytical quality make this country report on Indiainvaluable for the government, academia, business and financial circles. Students,teachers, and researchers will find it an indispensable resource.
THE WORLD BANK
OX-FORDU:NIVEI-SITY Pl-ESS
www.oup.comr
ISBN-0-8213-4775-6