Child Poverty Profile
71
Volume 114 NATIONAL COUNCIL OF WELFARE REPORTS CHILD POVERTY PROFILE 1998 SUMMER 2001 1141 anacia
-
Upload
independent -
Category
Documents
-
view
1 -
download
0
Transcript of Child Poverty Profile

Volume 114
NATIONAL COUNCIL OF WELFARE REPORTS
CHILD POVERTY PROFILE1998
SUMMER 2001
1141
anacia
NATIONAL COUNCIL OF WELFARE REPORTS
CHILD POVERTY PROFILE1998
SUMMER 2001

Copies of this publication may be obtained from
National Council of Welfare
9th Floor 112 Kent Street
Ottawa Ontario K1A 0J9
613 957-2961
Fax 613 957-0680
E-mail ncwmagi.comWeb Site www.ncwcnbes.net
Egalement disponible en français sous le titre
Profil de Ia pauvretØ infantile 1998
Minister of Public Works and Government Services Canada 2001
Cat No H68-52/1998E
ISBN 0-662-30954-5
Canadian Publications Mail 1464418
TABLE OF CONTENTS
HIGHLIGHTS
DEFINITIONS HI
INTRODUCTION
1.0 TRENDS
1.1 NATIONAL TRENDS
1.2 PROVINCIAL TRENDS
2.0 FAMILY TYPE 10
3.0 NUMBER AND AGE OF CHILDREN 12
4.0 AGE OF THE MAJOR INCOME EARNER 14
5.0 EDUCATION OF THE MAJOR INCOME EARNER 16
6.0 NUMBER OF EARNERS AND LABOUR FORCE ACTWITY 20
7.0 ABORIGINAL CHILDREN 23
8.0 DEPTH OF POVERTY 27
8.1 INCOME TRENDS 27
8.2 INCOME DECILES 28
8.3 AVERAGE INCOME OF THE POOR COMPARED TO THE NON-POOR 30
8.4POVERTYGAP 31
8.5 INcOME CATEGORIES BASED ON PERCENTAGE OF THE POVERTY LINE 33
9.0 SOURCES OF INCOME 38
9.1 MAJOR SOURCE OF FAMILY INCOME 38
9.2 GOVERNMENT TRANSFERS 39
9.3 EARNINGS WELFARE AND EMPLOYMENT INSURANCE 41
9.4 CANADA CHILD TAX BENEFIT 43
10.0 DURATION OF POVERTY 49
10.1 ALL CHILDREN 49
10.2 YOUNG CHILDREN 50
10.3 FAMILY TYPE 51
CONCLUSION 54
APPENDIX METHODOLOGY 56
DATA SOURCES 56
MEASURE OF POVERTY 56
DECILES 57
APPENDIX COMPARISON TO THER NATIONAL COUNCILOF WELFAREPUBLICATIONS 59
MEMBERS OF THE NATIONAL COUNCIL OF WELFARE 60
NATIONAL COUNCILOF WELFARE 61
LIST OF TABLES
TABLE 1.1 POVERTY TRENDS FOR CHILDREN UNDER 18 YEARS
OFAGE 1980-1998
TABLE 1.2 POVERTY TRENDS FOR TWO-PARENT FAMILIES 1980-1998
TABLE 1.3 POVERTY TRENDS FOR SINGLE-PARENT MOTHERS 1980-1998
TABLE 1.4 POVERTY TRENDS FOR SINGLE-PARENT FATHERS 1980-1998
TABLE 1.5 POVERTY RATES FOR CHILDREN UNDER 18 YEARS OF AGEBY PROVINCE 1980-1998
TABLE 5.1 DISTRIBUTION OF CHILDREN BY HIGHEST LEVEL OF EDUCATION
OF FAMILY MAJOR INCOME EARNER 1998 19
TABLE 5.2 POVERTY RATE FOR FAMILIES WITH CHILDREN BY HIGHEST
LEVEL OF EDUCATION OF FAMILY MAJOR INCOME EARNER 1998 19
TABLE 6.1 CHILD POVERTY RATES BY NUMBER OF EARNERS IN FAMILY 1998 22
TABLE 6.2 CHILD POVERTY RATES BY LABOUR FORCE ACTIVITY OF
FAMILY MAJOR INCOME EARNER 1998 22
TABLE 8.1 AVERAGE BEFORE-TAX INCOME BY FAMILY TYPE FOR POOR
AND NON-POOR FAMILIES 1980-1998 35
TABLE 8.2 AVERAGE INCOMES OF FAMILIES 1998 36
TABLE 8.3 NUMBER AND DISTRIBUTION OF FAMILIES BY INCOME
CATEGORIES BASED ON PERCENTAGE OF THE POVERTY LINE 1998 36
TABLE 8.4 NUMBER AND DISTRIBUTION OF POOR FAMILIES WITH
INCOME LESS THAN 50% OF THE POVERTY LINE BY AGE OF FAMILY
MAJOR INCOME EARNER 1998 37
TABLE 9.1 TRANSFER PAYMENTS TO FAMILIES WITH CHILDREN 1998 46
TABLE 9.2 SOURCES OF INCOME FOR POOR FAMILIES WITH CHILDREN 1998 46
TABLE 9.3 INCOMES OF POOR FAMILIES WITH CHILDREN BY PRIMARY
SOURCES OF INCOME 1998 47
TABLE 9.4 NUMBER OF POOR FAMILIES WITH CHILDREN BY PRIMARY
SOURCES OF INCOME 1998 48
TABLE 10.1 PERCENTAGE DISTRIBUTION OF PEOPLE WITH Low INCOME
BY FAMILY TYPE 1993-1998 53
TABLE A.1 STATISTICS CANADAS Low INCOME BEFORE TAX CUTOFFS 57
LIST OF FIGURES
FIGuRE 1.1 CHILD POVERTY RATE Th CANADA 1980-1998
FIGuRE 1.2 FAMILY POVERTY RATES Th4 CANADA 1980-1998
FIGURE 2.1 DIsTRIBuTION OF CHILDREN IN CANADA BY FAMILY TYPE 1998 10
FIGuRE 2.2 NUMBER OF POOR CHILDREN BY SELECTED FAMILY TYPE 1980 1998 11
FIGURE 3.1 POVERTY RATES FOR TWO-PARENT FAMILIES BY NUMBER AND AGE OF
CHILDREN IN FAMILY 1998 12
FIGURE 3.2 POVERTY RATES FOR SINGLE-PARENT MOTHERS BY NUMBER AND AGE
OF CHILDREN IN FAMILY 1998 13
FIGURE 4.1 DISTRIBUTION OF CHILDREN BY AGE OF MAJOR INCOME EARNER 1998 14
FIGURE 5.1 DISTRIBUTION OF CHILDREN BY HIGHEST LEVEL OF EDUCATION OF
MAJOR INCOME EARNER 1998 16
FIGURE 5.2 DISTRIBUTION OF POOR TWO-PARENT FAMILIES BY HIGHEST LEVEL OF
EDUCATION OF MAJOR INCOME EARNER 1998 17
FIGuRE 5.3 DISTRIBUTION OF POOR SINGLE-PARENT MOTHERS BY HIGHEST LEVEL
OF EDUCATION OF MAJOR INCOME EARNER 1998 18
FIGURE 6.1 CHILD POVERTY RATES BY NUMBER OF EARNERS IN FAMILY 1998 20
FIGURE 6.2 DISTRIBUTION OF CHILDREN BY LABOUR FORCE ACTIVITY OF MAJORINCOME EARNER 1998 21
FIGURE 8.1 BEFORE-TAX INCOME BY FAMILY TYPE 1980-1998 27
FIGURE 8.2 INCOME SHARE BY DECILES FOR FAMILIES WITH CHILDREN 29
FIGURE 8.3 PERCENTAGE CHANGE IN AVERAGE BEFORE-TAX INCOME BY DECILES
FOR FAMILIES WITH CHILDREN 1994-1998 29
FIGURE 8.4 AVERAGE BEFORE-TAX INCOME 1998 30
FIGURE 8.5 POVERTY GAP FOR POOR SINGLE-PARENT MOTHERS BY NUMBER OF
EARNERS 1998 31
FIGURE 8.6 POVERTY GAP FOR POOR TWO-PARENT FAMILIES BY NUMBER OF
EARNERS 1998 32
FIGURE 8.7 DISTRIBUTION OF POOR FAMILIES BY INCOME CATEGORIES AS
PERCENTAGE OF POVERTY LINE 1998 33
FIGURE 9.1 DISTRIBUTION OF CHILDREN BY MAJOR SOURCE OF FAMILY INCOME 1998 39
FIGURE 9.2 AVERAGE GOVERNMENT TRANSFERS 1998 40
FIGuRE 9.3 GOVERNMENT TRANSFERS AS PERCENTAGE OF TOTAL INCOME 1998 40
FIGURE 9.4 AVERAGE INCOME OF POOR FAMILIES WITH CHILDREN FOR SELECTED
SOURCES OF INCOME 1998 41
FIGURE 9.5DISTRIBUTION OF POOR FAMILIES WITH CHILDREN FOR SELECTED
SOURCES OF INCOME 1998 42
FIGURE 10.1 PERSISTENCE OF POVERTY FOR CHILDREN IN CANADA 1993-1998 49
FIGURE 10.2 NUMBER OF YEARS IN POVERTY OF CHILDREN IN CANADA BY AGE
OF CHILD 1993-1998 50
FIGURE 10.3 DISTRIBUTION OF PERSONS BY FAMILY TYPE AND NUMBER OF YEARS
IN POVERTY 1993-1998 52
FIGURE THE BEFORE-TAX INCOME DECILE LADDER FOR FAMILIES WITH CHILDREN 1998. 58

HIGHLIGHTS
Child poverty rates declined from 1996 to 1998 The rate of 19.2 percent in 1998 was the
lowest since 1992 However this seven-year low still means that close to one in five children
lived in poverty
Single-parent mothers continue to have extremely high poverty rates In 1998 the poverty
rate for this type of family was 52.9 percent The poverty rate for two-parent families was
much lower at 10.7 percent
Just over half of poor children lived in two-parent families compared to 81 percent of non-
poor children
Forty percent of poor children lived with single-parent mothers compared to 7.3 percent
of non-poor children Less than three percent of poor children lived with single-parent
fathers similar proportion 2.1 percent of non-poor children lived with single-parent
fathers
Poverty rates for families tend to decrease once the youngest child reaches school age For
example the poverty rate for two-parent families with one child less than seven years old was
10.4 percent in 1998 If the child was between seven and 17 years old the poverty rate
dropped to 7.4 percent
Poverty rates for families tend to increase with the number of children in the family For
example the poverty rate for single-parent mothers with one child less than seven years old
was 61.3 percent in 1998 If there were two children less than seven years old the poverty
rate jumped to 82.6 percent
Poor children are more likely to have younger parents In 1998 close to three-quarters of
poor children lived in families where the major income earner was less than 35 years old
compared to 58.3 percent of non-poor children
Close to one-third of poor children in 1998 lived in families where the major income
earner had less than high school diploma Only four percent of poor children lived in
family where the major income earner had university degree
Higher levels of education do not necessarily make families immune to poverty In 1998almost half of the major income earners in poor two-parent families and 53.9 percent of poor
single-parent mothers had actually gone beyond high school
Less than quarter of poor children lived in families where the major income earner
worked full-year full-time in 1998 Three-quarters of non-poor children lived in this type of
family
Almost third of poor children lived in families where the major income earner did not
work at all during the year in 1998
Although greater proportion of poor children lived in families where the major income
earner did not work the perception that poor children live in families where the adults do not
work at all needs to be somewhat tempered Fully half of poor children lived in families
where the major income earner had worked part if not all of the year in 1998
II
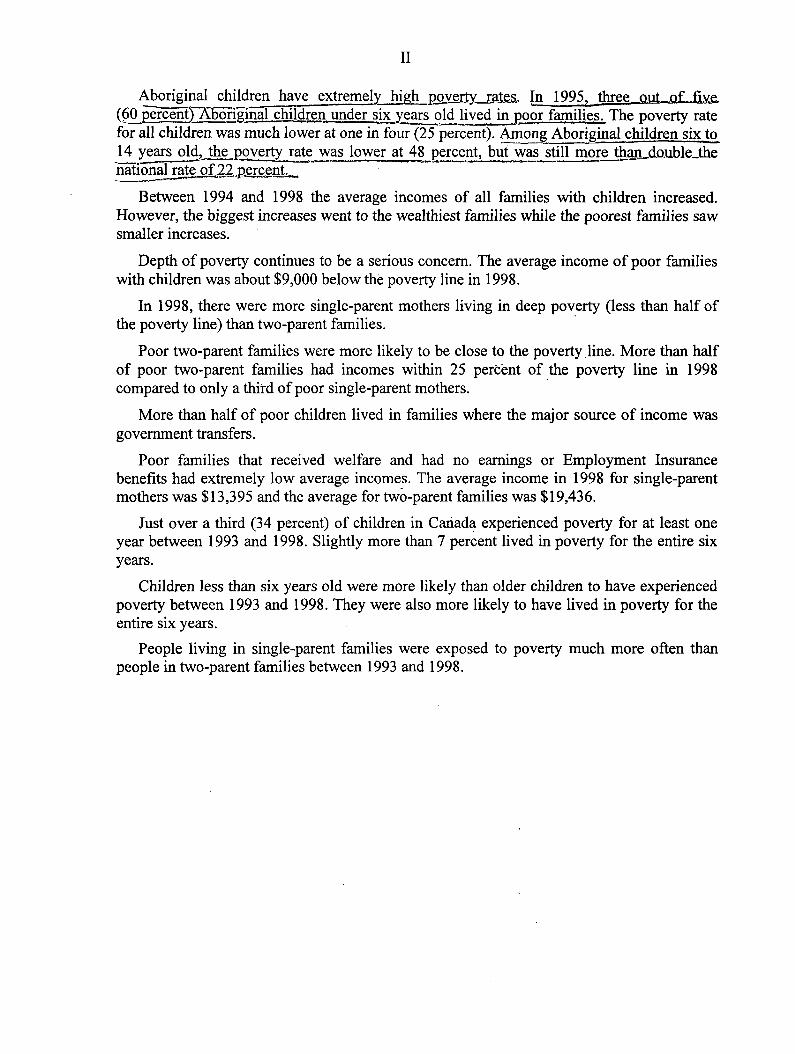
Aboriginal children have extremçyjjgh pya In 19952 tjir .Q4_of fiyears old lived in poor farnilies The poverty rate
for all children was much lower at one in four 25 percent Among Aboriginal childrei six to
14 years old the poverty rate was lower at 48 percent but was still more than donbleJhe-..-----national rate of 22 percent
Between 1994 and 1998 the average incomes of all families with children increased
However the biggest increases went to the wealthiest families while the poorest families saw
smaller increases
Depth of poverty continues to be serious concern The average income of poor families
with children was about $9000 below the poverty line in 1998
In 1998 there were more single-parent mothers living in deep poverty less than half of
the poverty line than two-parent families
Poor two-parent families were more likely to be close to the poverty.line More than half
of poor two-parent families had incomes within 25 percent of the poverty line in 1998
compared to only third of poor single-parent mothers
More than half of poor children lived in families where the major source of income was
government transfers
Poor families that received welfare and had no earnings or Employment Insurance
benefits had extremely low average incomes The average income in 1998 for single-parent
mothers was $13395 and the average for two-parent families was $19436
Just over third 34 percent of children in Cariada experienced poverty for at least one
year between 1993 and 1998 Slightly more than percent lived in poverty for the entire six
years
Children less than six years old were more likely than older children to have experienced
poverty between 1993 and 1998 They were also more likely to have lived in poverty for the
entire six years
People living in single-parent families were exposed to poverty much more often than
people in two-parent families between 1993 and 1998
III
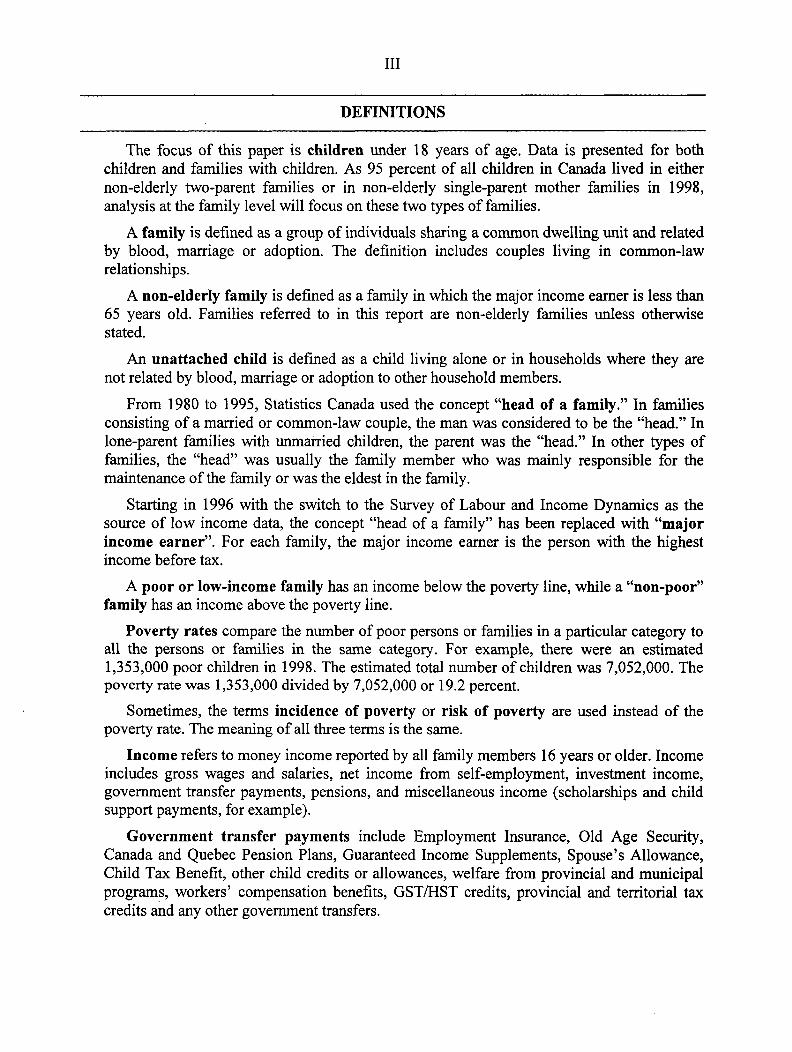
DEFINITIONS
The focus of this paper is children under 18 years of age Data is presented for both
children and families with children As 95 percent of all children in Canada lived in either
non-elderly two-parent families or in non-elderly single-parent mother families in 1998
analysis at the family level will focus on these two types of families
family is defined as group of individuals sharing common dwelling unit and related
by blood marriage or adoption The definition includes couples living in common-law
relationships
non-elderly family is defined as family in which the major income earner is less than
65 years old Families referred to in this report are non-elderly families unless otherwise
stated
An unattached child is defined as child living alone or in households where they are
not related by blood marriage or adoption to other household members
From 1980 to 1995 Statistics Canada used the concept head of family In families
consisting of married or common-law couple the man was considered to be the head In
lone-parent families with unmarried children the parent was the head In other types of
families the head was usually the family member who was mainly responsible for the
maintenance of the family or was the eldest in the family
Starting in 1996 with the switch to the Survey of Labour and Income Dynamics as the
source of low income data the concept head of family has been replaced with majorincome earner For each family the major income earner is the person with the highest
income before tax
poor or low-income family has an income below the poverty line while non-poorfamily has an income above the poverty line
Poverty rates compare the number of poor persons or families in particular category to
all the persons or families in the same category For example there were an estimated
1353000 poor children in 1998 The estimated total number of children was 7052000 The
poverty rate was 1353000 divided by 7052000 or 19.2 percent
Sometimes the terms incidence of poverty or risk of poverty are used instead of the
poverty rate The meaning of all three terms is the same
Income refers to money income reported by all family members 16 years or older Income
includes gross wages and salaries net income from self-employment investment income
government transfer payments pensions and miscellaneous income scholarships and child
support payments for example
Government transfer payments include Employment Insurance Old Age Security
Canada and Quebec Pension Plans Guaranteed Income Supplements Spouses Allowance
Child Tax Benefit other child credits or allowances welfare from provincial and municipal
programs workers compensation benefits GST/HST credits provincial and territorial tax
credits and any other government transfers

Iv
Some sections of this report refer to earnings rather than income Earnings means gross
wages and salaries and net income from self-employment
INTRODUCTION
Child poverty in Canada is subject that is much discussed and debated The National
Council of Welfare itself has reported extensively on the negative effect poverty has on
children and their families Good health and development during childhood are among the
most important factors in making sure that people grow up healthy enough to learn find
work raise families and participate fully in society for all their lives Children in low-income
families have higher risks of oor health and poor developjQtoldrenin mid e-income an gh-income families
Child Poverty Profile 1998 is special report in the National Council of Welfares annual
series Poverty Profile The report is based on data collected by Statistics Canada Like the
Poverty Profile publications the report presents statistical profile of povertyJn.....Canada
rather than blueprint for eliminating povertythe National Council of Welfare has
published many other reports over the years that recommend actions for combating child
poverty Some of these recommendations are summarized in the conclusion
We hopethis report will lead to better nditajding ofhi1py and encourage
Canadians to think about how governments and Canadians themselves can use the tools at
their disposal to ensure that every child has fair chance to share in Canadas wealth and
opportunities
The report examines child poverty by looking at children specifically and by looking at
their families Children are not poor on their own They are poor because their families are
poor
We start by examining poverty trends from 1980 to 1998 for children and their families
This is followed by snapshots of poverty in 1998 for many indicators such as family type
number and age of children in family and age education and work activity of parents There
is also section on Aboriginal children
It is one thing to measure the incidence of poverty and another to measure its severity..-Data is presented on the depth of poverty of childrens families using indicators such as
average dollars below the poverty line and family incomes as percentage of the poverty
line There is section on the sources of income of poor childrens families And fmally
information is presented on the duration of poverty
In this report the children described are zero to seventeen years old Family data focuses
on two-parent families and single-parent families that are non-elderly that is the familys
major income earner is less than 65 years old
The 1998 income data were published by Statistics Canada under the title Income in
Canada 1998 Statistics Canada also provided custom tabulations to the National Council of
Welfare The analysis and interpretation of the data however is the responsibility of the
National Council of Welfare not Statistics Canada Readers who wish to compare
information presented in this report to other National Council of Welfare publications are
advised to read the description of methodology presented in the appendix at the end of the
report
1.0 TRENDS
1.1 NATIONAL TRENDS
Overall child poverty rates tend to rise in economic downturns and fall during economic
growth As shown in Figure 1.1 in the 1980s the child poverty rate rose with the recession of
198 1-1982 peaking in 1984 at 21 percent and then declining for the rest of the 1980s
Figure 1.1 Child Poverty Rate in Canada1980-1998
-o -21.321.6
The recession of 1990-1991 drove child poverty up once again In spite of the economic
recovery following the recession the rate continued to rise until 1996 when it peaked at
21.6 percent The modest decline that began in 1997 continued in 1998 as the child poverty
rate fell to 19.2 percent
The number of poor children also peaked in 1996 at 1533000 As the poverty rate
declined in the following years so did the number of poor children In 1998 there were
1353000 poor children in Canada The number of poor children has not been lower than this
since 1992 Table 1.1
When we look at poverty rates for families that have children the importance of second
wage earner or potential second wage earner and the importance of two adults to support one
another with family responsibilities becomes obvious The poverty rates for families headed
by single-parent mothers have consistently been five to six times higher on average than the
poverty rates for two-parent families as we can see in Figure 1.2
Figure 1.2 Family Poverty Rates in Canada
1980-1998
62.3611
58.3595 60.3
59.0 58.4
.9
30932.3
27.5.42432.6iZ.197 10.2 10.3
9.1 8.79.8
0.8 10.6
1980 1982 1984 1986 1988 1990 1992 1994 1996 1998
Single-parent mothers Single-parent fathers Two-parent families
The poverty rate of two-parent families rose and fell with the overall state of the economyfrom 1980 through the early 990s Like child poverty the rate continued to increase in the
990s only starting to decline in 1997 In 1998 the poverty rate of two-parent families was
10.7 percent the lowest level since 1992 In 1998 there were 327000 poor two-parent
families The number of poor two-parent families peaked in 1996 at 421000 Table 1.2
Poverty rates for families headed by single-parent mothers have remained extremely high
over the past two decades Between 1980 and 1998 the poverty rate has fluctuated between
53 and 62 percent Even though the poverty rate in 1998 is at record low more than half
52.9 percent of these families lived in poverty In 1998 there were 307000 poor single-
parent mothers The number of poor single-parent mothers was highest in 1993 at 360000Tables 1.3
The trends for single-parent fathers are bit more difficult to follow as their numbers are
often too small for statistically reliable data to be collected about them Single-parent fathers
have consistently had poverty rates about two to three times higher than two-parent families
However their poverty rates have always been drastically lower than those of single-parent
mothers For example in 1998 the poverty rate for single-parent fathers was 23.1 percent
compared to 52.9 percent for single-parent mothers Due to the small number of single-parent
fathers in Canada the number of poor single-parent fathers is much smaller than the number
of poor two-parent families in spite of their higher poverty rate In 1998 there were
25000 poor single-parent fathers compared to 327000 poor two-parent families Table 1.4
Single-parent mothers have without fail made up disproportionate number of poorfamilies with children In 1998 for example there were five times as many two-parent
families as single-parent mothers but an almost equal number of poor families This inequity
is due to the persistently high poverty rates for single-parent mothers In almost twenty years
the poverty rate for these families has never dropped below 50 percent
1.2 PROVINCIAL TRENDS
Like the national child poverty rate provincial child poverty rates tend to rise in economic
downturns and fall during economic growth And like the national rate provincial child
poverty rates have not had sustained recovery from the high rates of the recession of 1990-
1991 Since 1992 provincial poverty rates have fluctuated up and down In 1998 the rates in
all provinces except Newfoundland went down Between 1997 and 1998 Nova Scotia had
the largest percentage point drop down 4.1 percentage points followed by Prince Edward
Island 3.7 percentage points Manitoba 3.5 percentage points and British Columbia
3.2 percentage points Table 1.5
TABLE 1.1 POVERTY TRENDS FOR CHILDREN UNDER 18 YEARS OF AGE1980-1998
YearNumber of poor
All childrenPoverty rate
children
1980 1061000 6713000 15.8
1981 1090000 6640000 16.4
1982 1258000 6575000 19.1
1983 1299000 6545000 19.8
1984 1361000 6483000 21.0
1985 1258000 6468000 19.5
1986 1148000 6518000 17.6
1987 1150000 6516000 17.7
1988 1053000 6558000 16.1
1989 1016000 6636000 15.3
1990 1195000 6732000 17.8
1991 1281000 6786000 18.9
1992 1316000 6865000 19.2
1993 1484000 6953000 21.3
1994 1362000 6997000 19.5
1995 1472000 7011000 21.0
1996 1533000 7095000 21.6
1997 1459000 7081000 20.6
1998 1353000 7052000 19.2

TABLE 1.2 POVERTY TRENDS FOR TWO-PARENT FAMILIES 1980-1998
Number of poor All two-parent Poverty rateear
two-parent families families
1980 297000 3073000 9.7
1981 313000 3059000 10.2
1982 360000 3032000 11.9
1983 385000 3054000 12.6
1984 390000 2976000 13.1
1985 353000 2995000 11.8
1986 331000 3030000 10.9
1987 308000 2989000 10.3
1988 277000 3036000 9.1
1989 264000 3048000 8.7
1990 298000 3047000 9.8
1991 328000 3044000 10.8
1992 320000 3032000 10.6
1993 373000 3063000 12.2
1994 355000 3091000 11.5
1995 402000 3134000 12.8
1996 421000 3137000 13.4
1997 390000 3125000 12.5
1998 327000 3062000 10.7

1980
1981
1982
1983
1984
1985
1986
1987
1988
1989
1990
1991
1992
1993
1994
1995
1996
1997
1998
206000
189000
231000
234000
266000
254000
233000
246000
245000
242000
289000
300000
343000
360000
312000
321000
328000
311000
307000
57.3
53.5
59.3
60.7
62.3
61.1
57.7
58.3
55.3
52.9
59.5
60.3
56.9
59.0
56.4
56.8
58.4
56.2
52.9
TABLE 1.3 POVERTY TRENDS FOR SINGLE-PARENT MOTHERS 1980-1998
360000
353000
389000
386000
427000
416000
403000
423000
444000
457000
486000
497000
604000
610000
554000
565000
563000
553000
580000

TABLE 1.4 POVERTY TRENIS FOR SINGLE-PARENT FATHERS 1980-1998
YearNumber of poor All single-parent Poverty rate
single-parent fathers fathers
1980 15000 57000 25.4
1981 Sample too small 61000
1982 17000 64000 26.1
1983 15000 53000 28.6
1984 17000 63000 27.0
1985 15000 56000 26.9
1986 17000 72000 23.4
1987 Sample too small 60000
1988 17000 70000 24.3
1989 Sample too small 61000
1990 22000 86000 25.5
1991 17000 73000 22.6
1992 16000 82000 18.9
1993 31000 101000 30.9
1994 29000 91000 32.3
1995 29000 95000 30.7
1996 26000 95000 27.5
1997 23000 101000 23.2
1998 25000 109000 23.1
TA
BLE
1.5
PO
VE
RT
YR
AT
ES
FO
RC
HIL
DR
EN
UN
DE
R18
YE
AR
SO
FA
GE
BY
PR
OV
INC
E1
98
0-1
99
8
Year
Pro
vin
ce
New
found
-land
Prince
Edw
ard
Isla
nd
Nova
Scotia
New
Bru
nsw
ick
Quebec
Onta
rio
Mam
toba
Saskatc
he
-wa
nA
lbert
aB
ritis
h
Colu
mbia
1980
28.9
14.3
15.9
20.3
19.3
14.4
18.5
11
.41
2.3
10
.6
1981
21.6
22.7
18.0
23.9
20.0
13.6
19.6
19
.71
1.9
14
.3
1982
25.7
20.1
22.1
26.2
21.0
17.5
24.5
18
.21
3.7
18
.4
1983
31.2
16.1
22.8
27.3
21.2
17.4
23.8
22
.61
9.3
16
.7
1984
28.8
17.7
20.6
27.0
24.1
16.6
21.2
23
.82
3.5
21
.1
1985
28.6
14.8
19.9
21.2
21.2
15.9
22.8
21
.22
0.2
21
.7
1986
25.7
14.1
18.4
19.2
19.8
13.1
24.2
24
.91
6.6
20
.5
1987
25.4
15.1
17.6
20.7
20.9
12.7
23.2
19
.92
0.4
18
.7
1988
21.0
13.2
14.9
18.5
19.0
12.0
22.1
21
.91
7.8
15
.4
1989
19.8
12.7
16.5
18.0
16.3
11.6
22.7
22
.01
9.1
14
.7
1990
20.8
14.0
16.8
18.6
19.5
14.8
24.0
21
.81
9.8
17
.6
1991
20.6
15.6
20.6
19.2
20.4
17.3
30.9
22
.41
9.2
14
.4
1992
26.8
12.7
19.4
15.9
19.3
16.3
24.2
24
.02
4.5
19
.3
1993
21.8
11.4
23.4
18.0
21.4
20.8
26.1
24
.82
0.6
21
.5
1994
23.4
13.3
20.5
18.3
19.8
18.1
22.8
22
.91
8.5
21
.2
1995
26.2
14.2
21.5
24.4
22.6
19.1
23.2
21
.82
1.7
20
.8
1996
24.7
16.8
22.5
18.9
23.3
19.9
27.1
22
.72
2.4
21
.0
1997
24.6
16.2
23.4
18.4
24.7
18.7
27.1
20
.31
8.3
18
.1
1998
25.3
12.5
19.3
18.1
24.0
17.7
23.6
18
.81
7.3
14
.9
10
2.0 FAMILY TYPE
The vast majority 81.0 percent of children in Canada lived in two-parent families in
1998 as shown in Figure 2.1 Another 13.6 percent of children lived with single-parent
mother families and 2.1 percent lived with single-parent fathers The remaining 3.3 percent of
children lived in other types of families such as elderly families
Figure 2.1 Distribution of Children in Canada
by Family Type 1998
87.9
52.0
All children Non-poor children
When we look at children who were not poor the distribution by family type is very
similar to that of all children with slightly higher percentage in two-parent families and
lower percentage in single-parent mother families
For poor children the picture is quite different Only half 52.0 percent of poor children
lived in two-parent families Forty percent lived with single-parent mothers This was roughly
six times the rate for non-poor children
much higher percentage of poor children lived with single-parent mothers because the
poverty rate for that family type was extremely high As noted earlier in 1998 the poverty
rate for single-parent mothers was 52.9 percent compared to 10.7 percent for two-parent
families
The number of poor children living with single-parent mothers has increased by
52 percent in the last two decades as shown in Figure 2.2 There were 538000 poor children
living with single-parent mothers in 1998 compared to 354000 in 1980 The increase has
Two parent families
Single-parent mothers
Single-parent fathers
All other families
139.8
2.13.3 2.8
Poor children
11
been driven by the rise in the number of single-parent mothers over this time period and the
persistently high poverty rate for this type of family The number of poor children living in
two-parent families also increased over the same timebut only by 7.8 percent
Figure 2.2 Number of Poor Children
by Selected Family Type 1980 and 1998
1980
J1998703000
652000
Sii0
Two parent famifies Single-parent mothers Single-parent fathers
Although poor children are more likely to live with single-parent mothers than non-poor
children the long-standing myth that most poor children live in single-parent households is
not true In 1998 703000 poor children lived in two-parent families while 538000 lived
with single-parent mothers and 38000 lived with single-parent fathers
.0
354000-1
1900038000
12
3.0 NUMBER AND AGE OF CfflLDREN
We have seen that poverty rates for two-parent families are relatively low and rates for
families led by single-parent mothers are high Within these general ranges the rates vary
noticeably with the number and age of children
Figure 3.1 shows the poverty rates for two-parent families and Figure 3.2 shows the rates
for families led by single-parent mothers The figures show that poverty rates increase with
the number of children but decrease once the youngest child reaches school age
Figure 3.1 Poverty Rates for Two-Parent
Families by Number and Age of Children in
Family 1998
20.6 183
104 1048.2
FT 12.6
7-17 MIxed 7-17 MIxed 7-17
ages ages
One child Two children Three or more children
For example look at the poverty rates in Figure 3.1 for two-parent families with two
children The poverty rate for these families when both children were under age seven was
12.2 percent in 1998 The rate drops to 10.4 percent when the two children were of mixed age
groups one under seven and one between seven and 17 The lowest rate was 8.2 percent
when both children were seven or older The same pattern exists for one child and for three or
more children However the poverty rates are lower for one child and higher for three or
more children
We can see how the ages and numbers of children are also significant for families led by
single-parent mothers However the poverty rates are much higher for single-parent mothers
than for two-parent families Figure 3.2 shows that the poverty rate for single-parent mothers
when both children were under age seven was 82.6 percent in 1998 The rate drops to
59.7 percent when the two children were of mixed age groups one under seven and one
between seven and 17 The lowest rate was 47.5 percent when both children were seven or
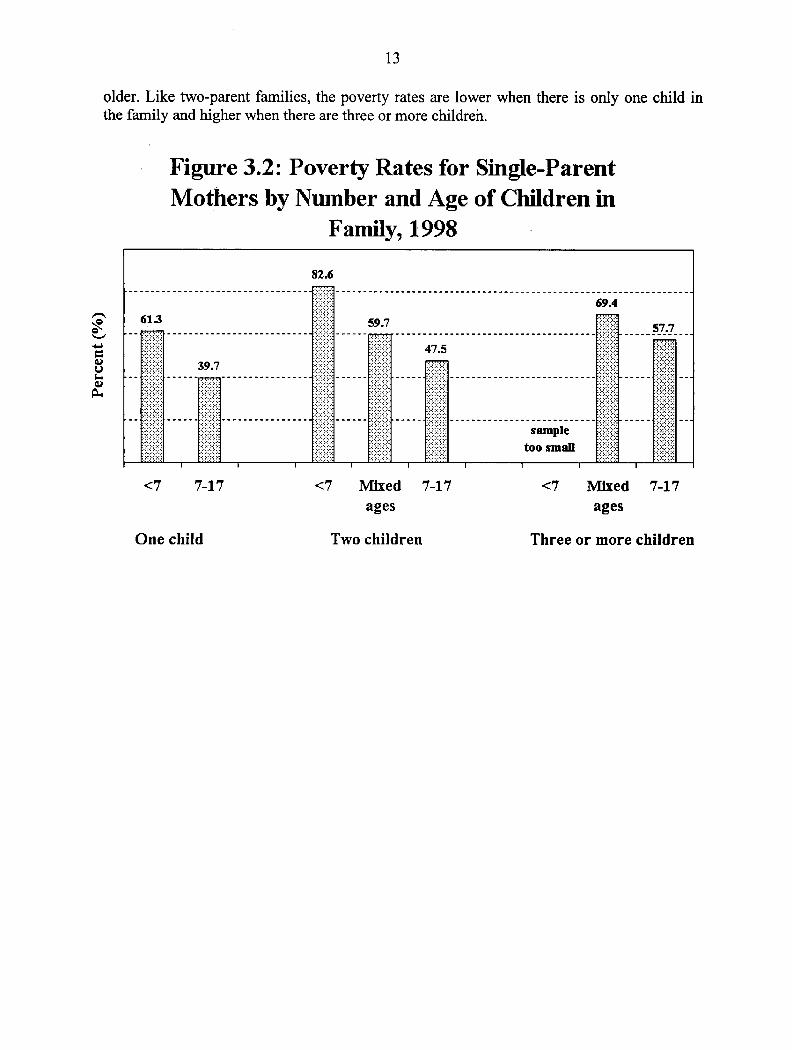
13
older Like two-parent families the poverty rates are lower when there is only one child in
the family and higher when there are three or more childreh
Figure 3.2 Poverty Rates for Single-Parent
Mothers by Number and Age of Children in
Family 1998
82.6
69.4
61.3 597LI
475
7-17 MIxed 7-17 MIxed 7-17
ages ages
One child Two children Three or more children

14
4.0 AGE OF THE MAJOR INCOME EARNER
Poor children were more likely to live with younger parents than non-poor children as
illustrated in Figure 4.1 In 1998 close to three-quarters 71 .1 percent of poor children lived
in families where the major income earner was less than 35 years old compared to
58.3 percent of non-poor children
Figure 4.1 Distribution of Children by Age of
All children
Major Income Earner 1998
Less than 35
Excludes 9000 unattached children that is children who were not living with relative
This is not surprising given that younger families have higher poverty rates than older
families For example in 1998 the poverty rate was 44.6 percent for two-parent families
where the major income earner was less than 25 years old The rate drops to 9.5 percent when
the major income earner was between 35 and 44 years old
similar pattern is observed for single-parent mothers although the poverty rates are
more extreme The poverty rate was 82.7 percent for single-parent mothers who were less
than 25 years old The rate dropped to 45.1 percent for single-parent mothers between 35 to
44 years old Although 45.1 percent is still an exceptionally high poverty rate it is almost
half that of the younger mothers
The higher poverty rate for young parents reflects number of factors The
unemployment rate for people under 25 years old is higher than for older age groups Young
working parents are more likely to have lower entry-level wages than wages for older more
experienced workers Young parents also have interrupted their education or postponed
583
05 0.4
Non-poor children Poor children
1.0

15
higher education in order to look after their children Lower levels of education often
translate into lower earnings
16
5.0 EDUCATION OF THE MAJOR INCOME EARNER
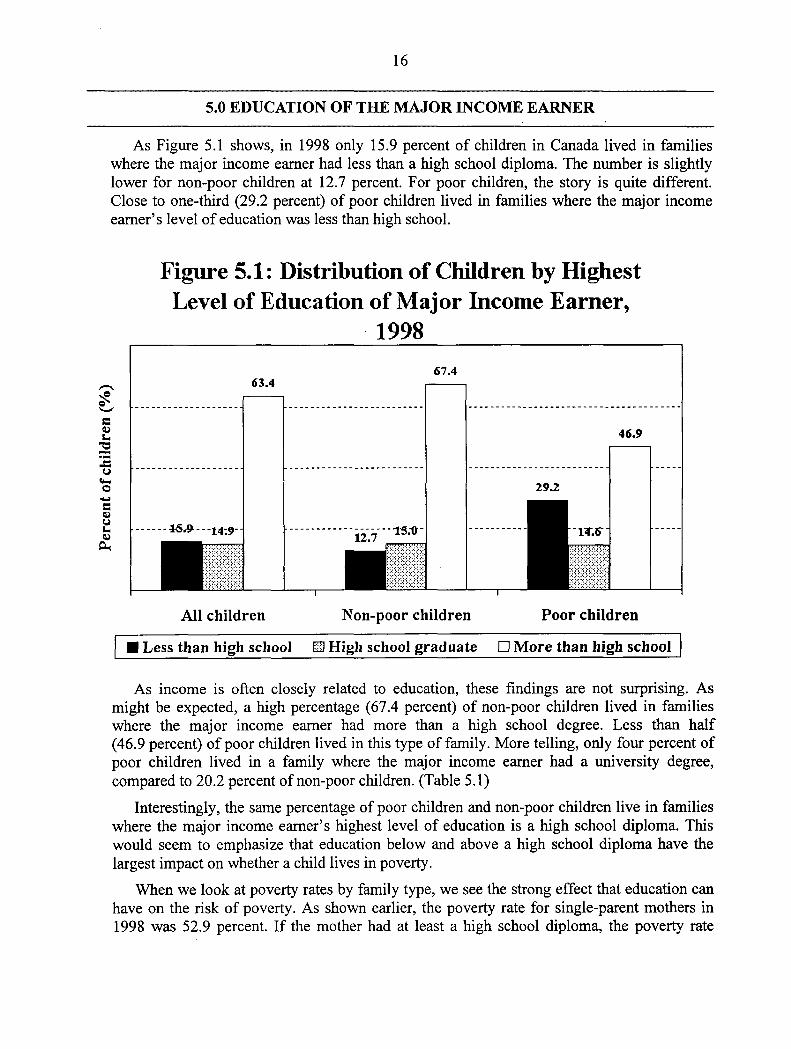
As Figure 5.1 shows in 1998 only 15.9 percent of children in Canada lived in families
where the major income earner had less than high school diploma The number is slightly
lower for non-poor children at 12.7 percent For poor children the story is quite different
Close to one-third 29.2 percent of poor children lived in families where the major income
earners level of education was less than high school
Figure 5.1 Distribution of Children by Highest
Level of Education of Major Income Earner
1998
Less than high school High school graduate More than high school
As income is often closely related to education these findings are not surprising As
might be expected high percentage 67.4 percent of non-poor children lived in families
where the major income earner had more than high school degree Less than half
46.9 percent of poor children lived in this type of family More telling only four percent of
poor children lived in family where the major income earner had university degree
compared to 20.2 percent of non-poor children Table 5.1
Interestingly the same percentage of poor children and non-poor children live in families
where the major income earners highest level of education is high school diploma This
would seem to emphasize that education below and above high school diploma have the
largest impact on whether child lives in poverty
When we look at poverty rates by family type we see the strong effect that education can
have on the risk of poverty As shown earlier the poverty rate for single-parent mothers in
1998 was 52.9 percent If the mother had at least high school diploma the poverty rate
All children Non-poor children Poor children
17
dropped slightly to 47.1 percent If the mothers highest level of education was less than high
school the poverty rate jumped to 73.8 percent Table 5.2
Poverty rates for two-parent families show the same pattern although the rates are lower
For all two-parent families the poverty rate in 1998 was 10.7 percent For families where the
major income earner had at least high school diploma the poverty rate was slightly lower at
8.5 percent When the major income earner did not have at least high school diploma the
poverty rate was double that of all families at 20.5 percent Table 5.2
Low levels of education can be either cause of poverty or an effect Young people who
drop out of school may be poor because they lack the skills needed to get good jobs On the
other hand young women who drop out of school because they are pregnant may be poor
because of the hardships associated with single parenthood The fact that they are poorly
educated is result of their family circumstances rather than an immediate cause of poverty
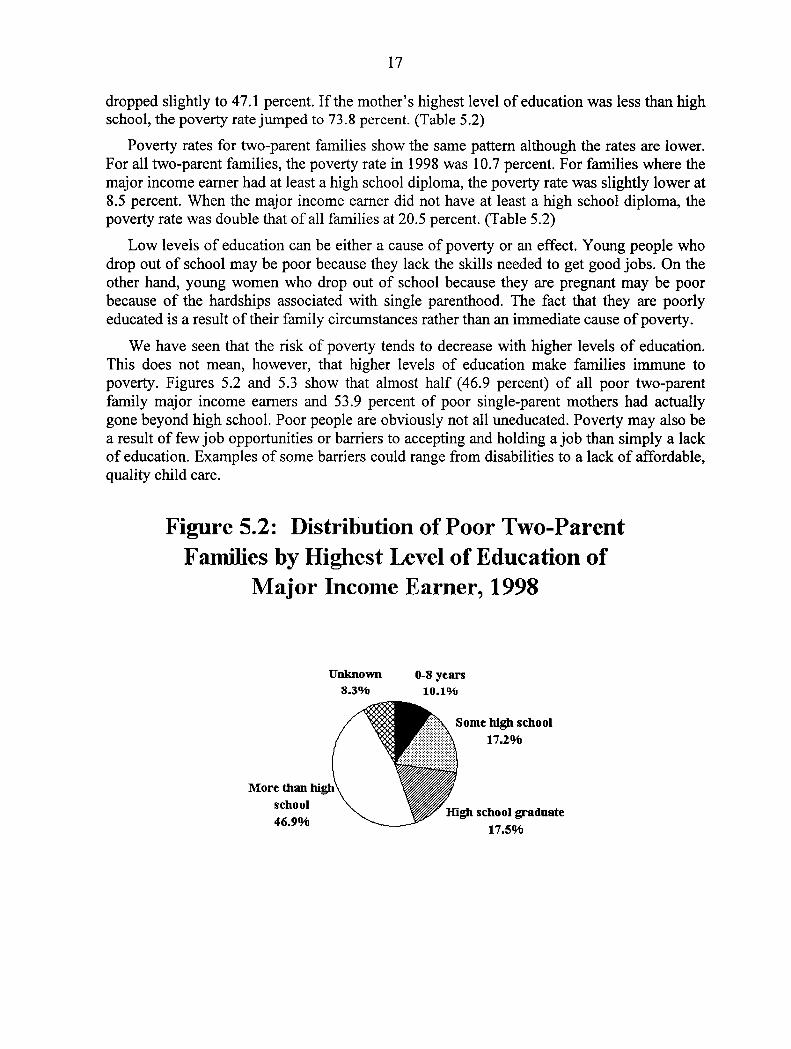
We have seen that the risk of poverty tends to decrease with higher levels of education
This does not mean however that higher levels of education make families immune to
poverty Figures 5.2 and 5.3 show that almost half 46.9 percent of all poor two-parent
family major income earners and 53.9 percent of poor single-parent mothers had actually
gone beyond high school Poor people are obviously not all uneducated Poverty may also be
result of few job opportunities or barriers to accepting and holding job than simply lack
of education Examples of some barriers could range from disabilities to lack of affordable
quality child care
Figure 5.2 Distribution of Poor Two-Parent
Families by highest Level of Education of
Major Income Earner 1998
More thschool
46.9%
Unknown 0-8 years
10.1%
Some high school
High school graduate
17.5%

18
Figure 5.3 Distribution of Poor Single-Parent
Mothers by Highest Level of Education of
Major income Earner 1998
Unknown0.-S years
8.8%8.8%
Some high school
16.2%
ll1gh school graduate
12.3%More
school
53.9%
19
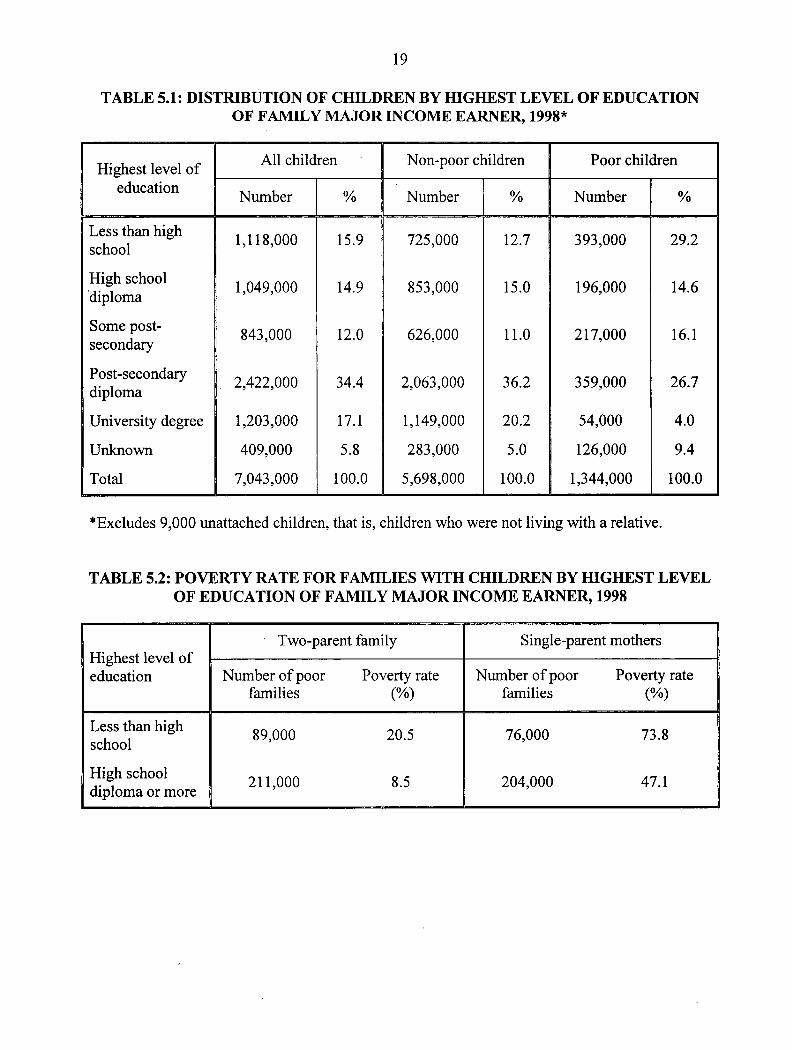
TABLE 5.1 DISTRIBUTION OF CIIILDREN BY HIGHEST LEVEL OF EDUCATIONOF FAMILY MAJOR INCOME EARNER 1998
All children Non-poor children Poor childrenHighest level of
educationNumber Number Number
Lessthanhigh1118000 15.9 725000 12.7 393000 29.2
school
High school1049000 14.9 853000 15.0 196000 14.6
diploma
Somepost-843000 12.0 626000 11.0 217000 16.1
secondary
Post-secondary2422000 34.4 2063000 36.2 359000 26.7
diploma
University degree 1203000 17.1 1149000 20.2 54000 4.0
Unknown 409000 5.8 283000 5.0 126000 9.4
Total 7043000 100.0 5698000 100.0 1344000 100.0
Excludes 9000 unattached children that is children who were not living with relative
TABLE 5.2 POVERTY RATE FOR FAMILIES WITH CHILDREN BY HIGHEST LEVELOF EDUCATION OF FAMILY MAJOR INCOME EARNER 1998
Two-parent family Single-parent mothers
Highest level of
education Number of poor Poverty rate Number of poor Poverty rate
families families
Lessthanhigh89000 20.5 76000 73.8
school
High school211000 8.5 204000 47.1
diploma or more
20
6.0 NUMBER OF EARNERS AND LABOURFORCE ACTIVITY
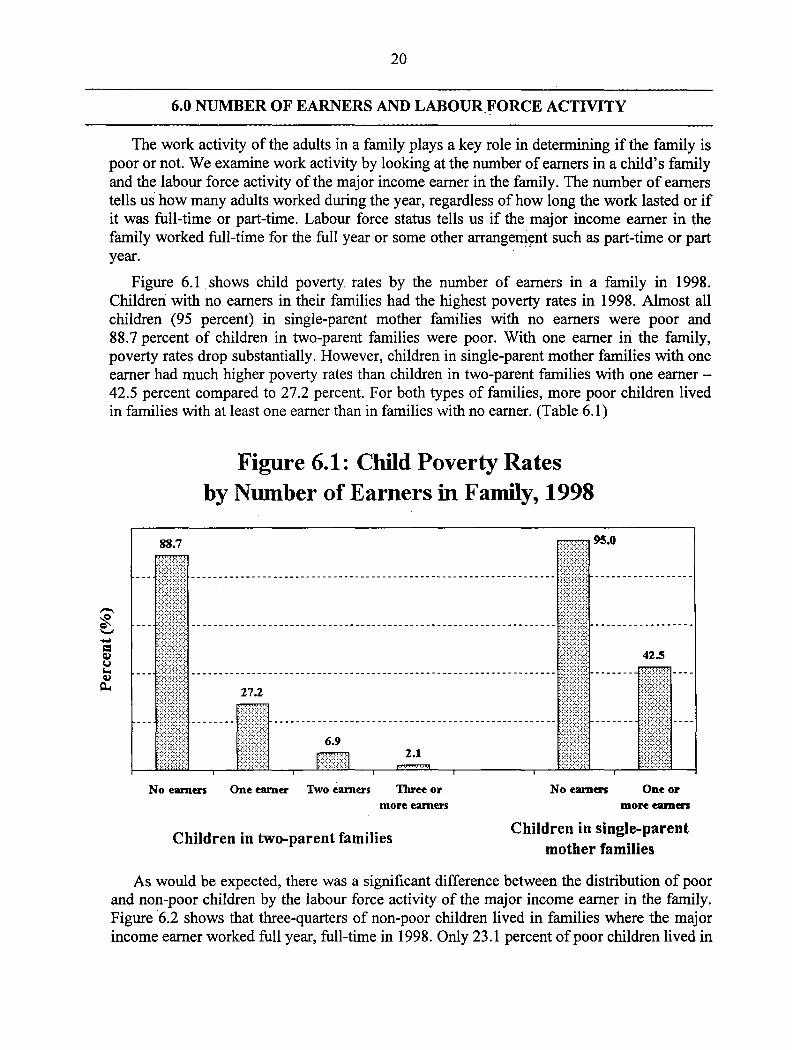
The work activity of the adults in family plays key role in determining if the family is
poor or not We examine work activity by looking at the number of earners in childs family
and the labour force activity of the major income earner in the family The number of earners
tells us how many adults worked during the year regardless of how long the work lasted or if
it was full-time or part-time Labour force status tells us if the major income earner in the
family worked full-time for the full year or some other arrangement such as part-time or part
year
Figure 6.1 shows child poverty rates by the number of earners in family in 1998
Children with no earners in their families had the highest poverty rates in 1998 Almost all
children 95 percent in single-parent mother families with no earners were poor and
88.7 percent of children in two-parent families were poor With one earner in the family
poverty rates drop substantially However children in single-parent mother families with one
earner had much higher poverty rates than children in two-parent families with one earner
42.5 percent compared to 27.2 percent For both types of families more poor children lived
in families with at least one earner than in families with no earner Table 6.1
Figure 6.1 Child Poverty Rates
by Number of Earners in Family 1998
95.0
423
272
69
No earners One earner Two earners Three or No eams One or
more earners more earni
Children in single-parentChildren in two-parent families
mother families
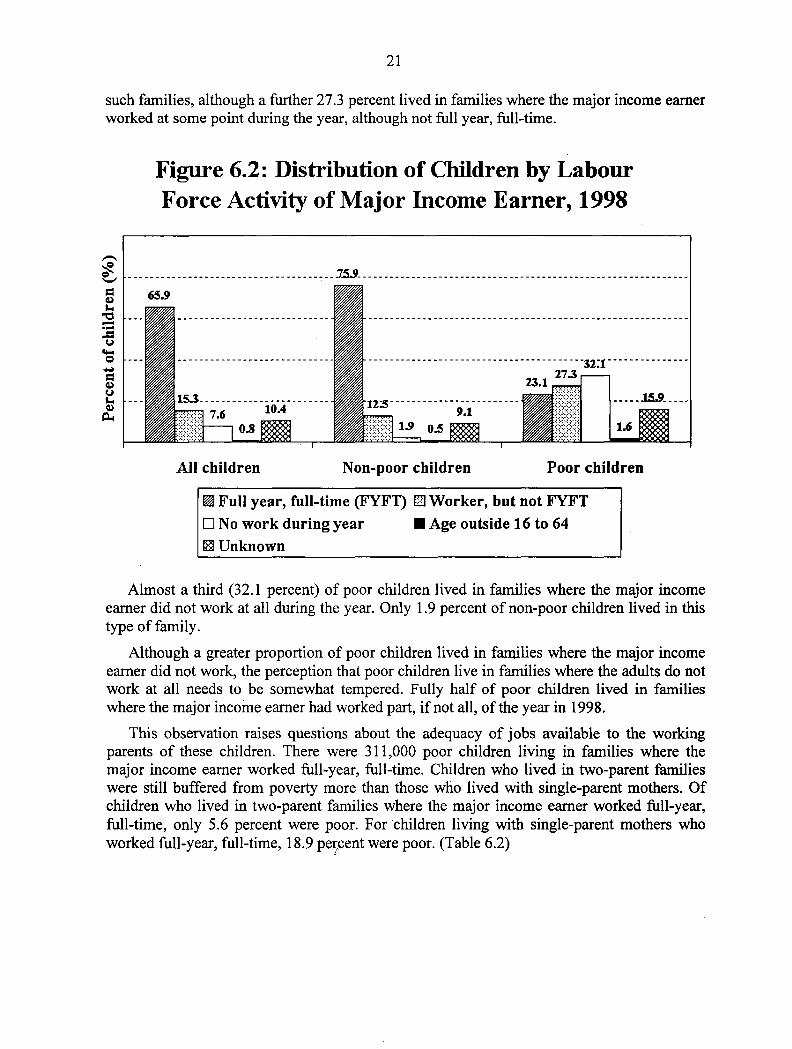
As would be expected there was significant difference between the distribution of poor
and non-poor children by the labour force activity of the major income earner in the family
Figure 6.2 shows that three-quarters of non-poor children lived in families where the major
income earner worked full year full-time in 1998 Only 23.1 percent of poor children lived in
21
such families although further 27.3 percent lived in families where the major income earner
worked at some point during the year although not full year full-time
Figure 6.2 Distribution of Children by Labour
Force Activity of Major Income Earner 1998
65.9
--- 32127.3
1012.5
91
23.1
All children Non-poor children Poor children
Full year full-time FYFI Worker but not FYFT
No work during year Age outside 16 to 64
Unknown
Almost third 32.1 percent of poor children lived in families where the major income
earner did not work at all during the year Only 1.9 percent of non-poor children lived in this
type of family
Although greater proportion of poor children lived in families where the major income
earner did not work the perception that poor children live in families where the adults do not
work at all needs to be somewhat tempered Fully half of poor children lived in families
where the major income earner had worked part if not all of the year in 1998
This observation raises questions about the adequacy of jobs available to the working
parents of these children There were 311000 poor children living in families where the
major income earner worked full-year full-time Children who lived in two-parent families
were still buffered from poverty more than those who lived with single-parent mothers Of
children who lived in two-parent families where the major income earner worked full-year
full-time only 5.6 percent were poor For children living with single-parent mothers who
worked full-year full-time 18.9 percent were poor Table 6.2
22
TABLE 6.1 CIIILD POVERTY RATES BY NUMBER OF EARNERS IN FAMELY 1998
Poor Poverty rateNumber of earners by family type All children
children
All two-parent families 5712000 703000 12.3
No earners 175000 155000 88.7
One earner 1034000 281000 27.2
Two earners 3596000 248000 6.9
Three or more earners 907000 19000 2.1
All single-parent mother families 956000 538000 56.3
No earners 252000 239000 95.0
One or more earners 704000 299000 42.5
TABLE 6.2 CHILD POVERTY RATES BY LABOUR FORCE ACTIVITY OF FAMILYMAJOR INCOME EARNER 1998
Children in two-parent Children in single-Total children
Labour force families parent mother families
activity of maj or
family income Number of Poverty Number of Poverty Number of Poverty
earner poor rate poor rate poor rate
children children children
Full year full-
311000 6.7 235000 5.6 61000 18.9time
Worker but not
full-year full- 367000 34.0 165000 22.3 178000 64.1
time
Did not work431000 80.1 197000 73.5 205000 89.8
during year
Age outside 16-22000 41.1
64
Unknown 214000 29.1 107000 19.6 95000 73.2
Total 1344000 19.1 703000 12.3 538000 56.3
Excludes 9000 unattached children that is children who were not living with relative

23
7.0 ABORIGINAL CHILDREN
We have just examined factors that
put children and their families at
higher risk of poverty We can look at
these same factors for Aboriginal
children We do not have much data
about the number of Aboriginal
children who live in families with these
risk factors but we do have
information about many of these risk
factors for the Aboriginal population in
general
Readers should keep in mind that
there are often variations within the
Aboriginal population by factors such
as Aboriginal group North American Indian MØtis or Inuit or by geographic location
province or territory urban or rural In this section we present data for all Aboriginal people
without detailed breakdowns
We have seen that children living with single-parent mothers have substantially higher
rates of poverty than children living in two-parent families do In 1996 almost one-third
32 percent of all Aboriginal children under the age of 15 living in families lived in single-
parent family mother or father This was twice the rate for children in the general
population The rate is even higher when we look at Aboriginal children living in large urban
areas About 46 percent of Aboriginal children living in families in large urban areas were in
single-parent family
As shown earlier families with more children had higher poverty rates On average
Aboriginal women ha ore children ori-Aborigina women.Tor example in 1996 an
Aboriginal single-parent mother had an average of 2.3 children compared to 1.8 children for
non-Aboriginal single-parent mothers.2
low level of education isarisk factor for_poverty While Aboriginal people have made
gains in education in past years they have experienced little improvement relative to non-
Aboriginal people In 1996 over half 54 percent of Aboriginal people aged 15 and over had
not received high school diploma compared to 35 percent of the non-Aboriginal population
For younger Aboriginal people aged 20 to 29 smaller proportion 45 percent had not
received high school diploma However this was still considerablyhiher
than the
corresponding proportion 17 percent for non-Aboriginal people aged 20 to 29
In Section 5.0 we showed that the majority of children who were not poor lived in
families where the major income earner had more than high school diploma Relatively
fewer Aboriginal people 37.9 percent aged 15 and older had this level of education in 1996
Statistics Canada The Daily Catalogue 11-OO1E January 13 1998
Statistics Canada Women in Canada 2000 Catalogue No 89-503-XPE p.251254Statistics Canada The Daily Catalogue 1-OO1E April 14 1998
Previous editions of Poverty Profile did not
include information about Aboriginal people
because data was not readily available from the
annual income survey Given the high rates of
poverty of Aboriginal people in Canada wefeel it is important to present what we can from
other sources of data For this report most data
on Aboriginal children comes from the 1996
census Children are defmed to be under 15
years old unlike the under 18 years of age
definition used in the rest of this publication

24
than non-Aboriginal people 51.3 percent Looking specifically at university degrees there is
substantial gap between Aboriginal and non-Aboriginal people very small percentage
3.3 percent of Aboriginal people aged 15 and older held university degrees in 1996
compared with 13.5 percent Qf non-Aboriginal people.4 The difference is even greater for
younger people Four percent of the Aboriginal population 20 to 29 years old had university
degree compared to 19 percent of non-Aboriginal people.5
Young Aboriginal people are less likely to attend school than young non-Aboriginal
people About two-thirds 68 percent of Aboriginal people 15 to 19 years old were in school
full-time or part-time in 1996 compared to 83 percent of their non-Aboriginal counterparts
Similarly for people aged 20 to 24 31 percent of Aboriginal people were attending school
compared to 49 percent of non-Aboriginal people.6 However it seems that Aboriginal people
are more likely than non-Aboriginal individuals to return to school as adults In 1996
12 percent of Aboriginal people aged 25 to 34 were full-time students compared to the
corresponding percent of non-Aboriginal people The same pattern can be seen in the next
oldest age group of 35 to 44 Seven percent of Aboriginal individuals in this age group were
full-time students compared to percent of non-Aboriginal people.7
There are many reasons for the _______________________________________________
challenges Aboriginal people face in
predominantly non-Aboriginal
education systems For example the
first language of many Aboriginal
people is not the language English
or French of the schools they
attend Aboriginal students may
have fewer role models to encourage
them to continue their schooling In
addition many Aboriginal
communities are geographically
remote and may have found it
difficult to recruit and keep well-
qualified teachers.8 Aboriginal
children in geographically remote
communities may also have to leave
the community to attend post-
secondary or even secondary
school
We saw that poor children are
more likely to live in families where
the major income earner does not work at all or does not work fill-time full-year Aboriginal
Statistics Canada Nation Series Aboriginal Catalogue 93F0025XDB96000 Table
Statistics Canada Education Indicators in Canada 1999 Catalogue No l-582-XIE 235
Statistics Canada Aboriginal Peoples in Canada Canadian Centre for Justice Statistics Profile Series Catalogue
No 85F0033M1E
Statistics Canada The Daily Catalogue l-OO1E April 14 1998
Statistics Canada Education Indicators in Canada 1999 Catalogue No 81-5 82-XIE 96
There are different ways to represent the Aboriginal
population of Canada The information quoted in
this section uses the Aboriginal identity concept as
the definition for the Aboriginal population
person is considered to be Aboriginal if they
reported identifying with at least one Aboriginal
group in the 1996 Census question Is this person
an Aboriginal person that is North American
Indian MØtis or Inuit Eskimo andlor who
reported being Treaty Indian or Registered Indian
as defined by the Indian Act of Canada andlor who
were members of an Indian Band or First Nation
In the 1996 Census enumeration was not permitted
or was interrupted before it could be completed on
77 Indian reserves and settlements It is estimated
that 44000 people on these reserves and
settlements were incompletely enumerated These
people are not included in the tabulations used in
this section
25
people are less likely to be part of the paid workforce For example in 1996 41 percent of
Aboriginal women and 48 percent of Aboriginal men were employed compared to 53.1
percent of non-Aboriginal women and 65.6 percent of non-Aboriginal men.9 Of those
Aboriginal people who reported employment income for 1995 just over one-third worked for
the full year on full-time basis compared with half of the total population
Those Aboriginal people who were employed tended to be concentrated in low-paying
occupations In 1996 they were over-represented in primary industries in sales and service
jobs and in trades They were underrepresented among those employed in higher paying
occupations like management positions and in professional occupations.
The incomes of Aboriginal people are substantially lower than the incomes of non-
Aboriginal people In 1995 the average income of Aboriginal people was $15700 This was
only 62 percent of the average income of non-Aboriginal people $25400 Like the non-
Aboriginal population the largest share of the income of Aboriginal people comes from
employment earnings In 1995 wages and salaries plus net self-employment income made up
70 percent of all income of Aboriginal people slightly lower than the 75 percent figure for
non-Aboriginal people However Aboriginal people receive about one-quarter of their
income from government transferpayments
This is much higher than the 14 percent share
for the non-Aboriginal population
Given these risk factors it would be expected that Aboriginal children have high poverty
rates We can first examine poverty rates using low-income cutoffs Low income cutoffs
exclude the approximately 36 percent of the Aboriginal population residing on reserves or in
the three territories Since income is generally lower for the Aboriginal population on
reserves compared to those living off-reserve their inclusion would likely increase the
incidence of low income among the Aboriginal population
Using the low income cutoffs in 1995 three out of five 60 percent Aboriginal children
under six years old lived in poor families The national rate was much lower at one in four
25 percent Among Aboriginal children six to 14 years old the poverty rate was lower at
48 percent but was still more than double the national rate of 22 percent.3 We saw earlier
that the poverty rate for single-parent mothers was extremely high It was even higher for
Aboriginal single-parent mothers Almost three-quarters 73 percent of Aboriginal single-
parent mothers were poor in 1995 The rate for non-Aboriginal single-parent mothers was
45 percent.4
To include Aboriginal people living on reserves or in the three territories we can use the
income category that falls below l0_as.a proxy for povertyjine Almost half of all
Aboriginal people 46 percent aged 15 and older had incomes below $10000 in 1995 This
is much higher than the rate of 27 percent for the non-Aboriginal population In some major
urban areas in the west the rates are higher Around half of Aboriginal people in Saskatoon
Statistics Canada Women in Canada 2000 Catalogue No 89-503-XPE 26510
Statistics Canada The Daily Catalogue 1-OO1E May 12 1998
Statistics Canada Aboriginal Peoples in Canada Canadian Centre for Justice Statistics Profile Series
Catalogue No 85F0033M1E12
Statistics Canada Aboriginal Peoples in Canada Canadian Centre for Justice Statistics Profile Series
Catalogue No 85F0033M1E13
Statistics Canada The Daily Catalogue 1-OO1E May 12 199814
Statistics Canada Women in Canada 2000 Catalogue No 89-503-XPE 259

26
51 percent Regina 48 percent and Edmonton 47 percent had incomes less than
ioooo
15Statistics Canada Aboriginal Peoples in Canada Canadian Centre for Justice Statistics Profile Series
Catalogue No 85F0033M1E
27
8.0 DEPTH OF POVERTY
Measuring the incidence of poverty does not give us clear idea of the severity of
poverty We can look at the financial plight of poor families by comparing their incomes to
the average incomes of non-poor families We can also examine the depth of poverty to see if
poor people live in abject poverty or few dollars below the poverty line Well start with an
overview of average income
Note that this section looks at families not individual children as income is calculated for
the entire family Incomes are presented in 1998 constant dollars This means that the dollar
amounts have been adjusted for the impact of price changes inflation by expressing them in
terms of their value or purchasing power in 1998
8.1 INCOME TRENDS
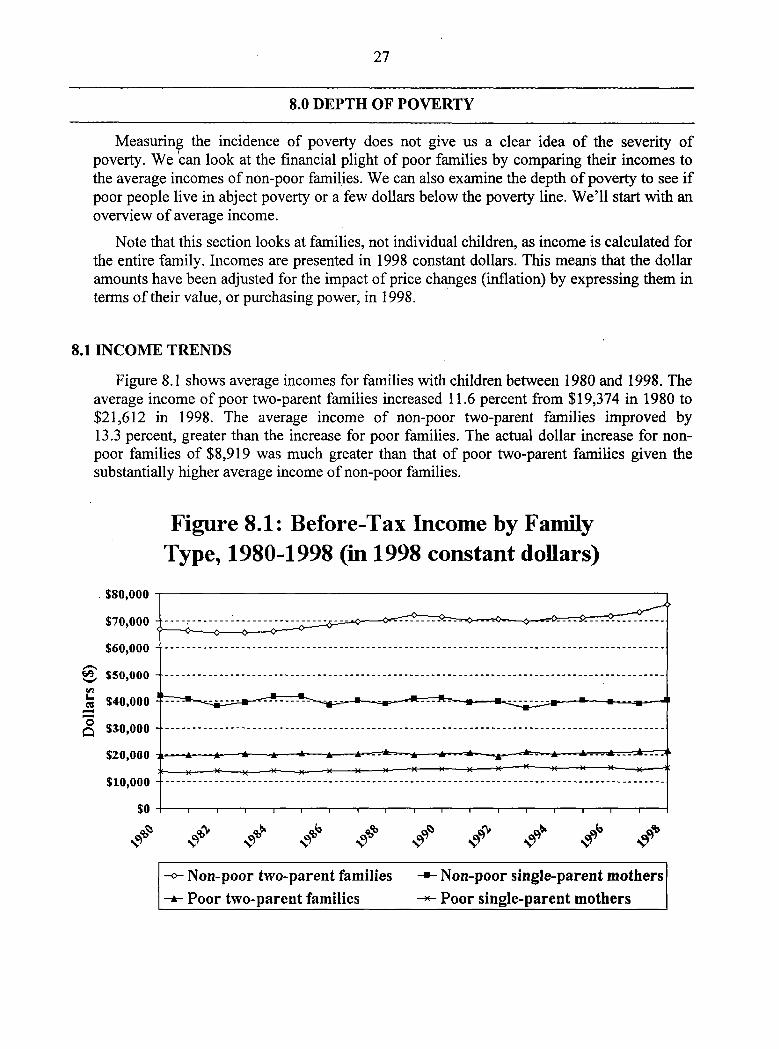
Figure 8.1 shows average incomes for families with children between 1980 and 1998 The
average income of poor two-parent families increased 11.6 percent from $19374 in 1980 to
$21612 in 1998 The average income of non-poor two-parent families improved by
13.3 percent greater than the increase for poor families The actual dollar increase for non-
poor families of $8919 was much greater than that of poor two-parent families given the
substantially higher average income of non-poor families
Figure 8.1 Before-Tax Income by Family
Type 1980-1998 in 1998 constant dollars
$80000
$70000
$60000
$50000
$40000 ---
$30000
$20000
$10000
$0
o-- Non-poor two-parent families --Non-poor single-parent mothers
A-- Poor two-parent families --Poor single-parent mothers
28
The increase in poor single-parent mothers average income was marginally lower than
that for poor two-parent families at 10.8 percent Average incomes rose from $13639 in 1980
to $15119 in 1998 The average incomes of single-parent mothers who were not poor have
fluctuated around $40000 since 1980 Their incomes dropped 3.2 percent between 1980 and
1998 The 1980 average income of $42105 was the highest income level recorded during this
time Table 8.1
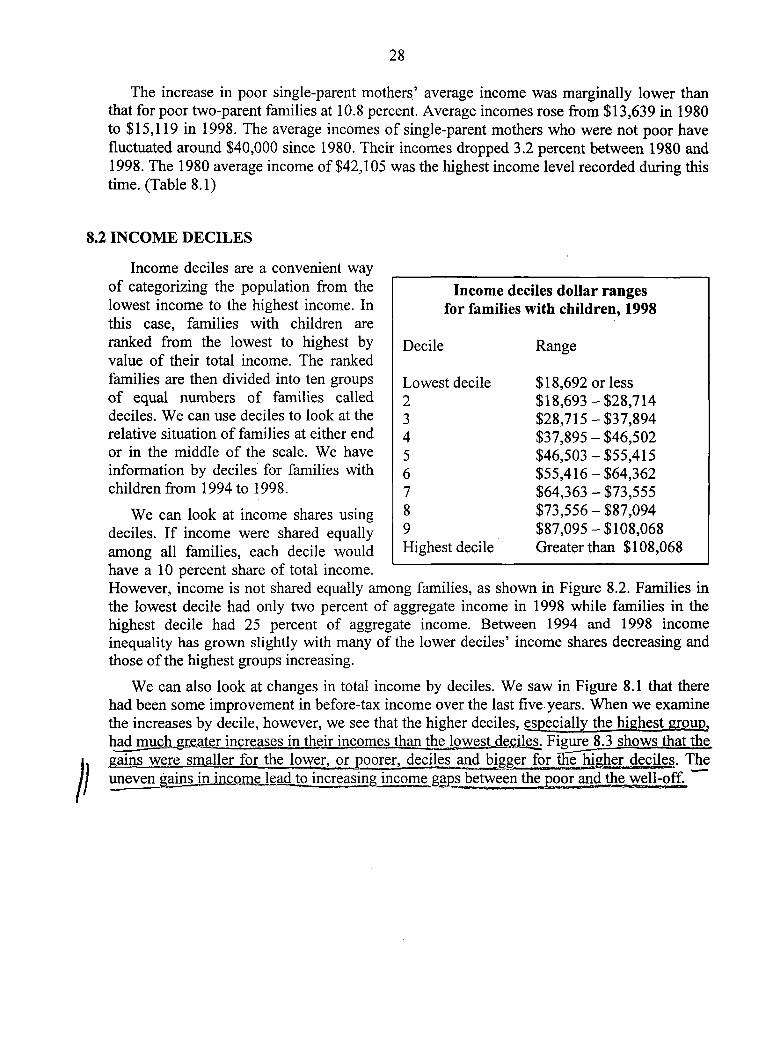
8.2 INCOME DECILES
Income deciles are convenient way __________________________________________of categorizing the population from the
lowest income to the highest income In
this case families with children are
ranked from the lowest to highest by
value of their total income The ranked
families are then divided into ten groups
of equal numbers of families called
deciles We can use deciles to look at the
relative situation of families at either end
or in the middle of the scale We have
information by deciles for families with
children from 1994 to 1998
We can look at income shares using
deciles If income were shared equally
among all families each decile would
have 10 percent share of total income
However income is not shared equally among families as shown in Figure 8.2 Families in
the lowest decile had only two percent of aggregate income in 1998 while families in the
highest decile had 25 percent of aggregate income Between 1994 and 1998 income
inequality has grown slightly with many of the lower deciles income shares decreasing and
those of the highest groups increasing
We can also look at changes in total income by deciles We saw in Figure 8.1 that there
had been some improvement in before-tax income over the last five.years When we examine
the increases by decile however we see that the higher deciles specially the highest gcupin their Figure 8.3 shows that the
gains were smaller for the lower or poorer deciles and bigger for ffifli11jTii
/1uneven to increasing income gaps betwent oo well-off
Income deciles dollar ranges
for families with children 1998
Decile Range
Lowest decile $18692 or less
$18693 $28714
$28715 $37894
$37895 $46502
$46503 $55415$55416 $64362
$64363 $73555
$73556 $87094
$87095 $108068Greater than $108068Highest decile
29
Figure 8.2 Income Shares by Dediles
for Families with Children
1994eel
1998
Lowest Dedile Dedile Dedile Dedle Dedile DeeRe Deelle DeeRe HIghest
deeRe deeRe
Figure 8.3 Percentage Change in Average
Before-Tax Income by Deciles for Families with
Children 1994-1998
12.1
576.2
4.5
--
flnRHLowest Dedle2 Dedle3 Dedlle4 DecReS Dedile6 Dedle7 DedileS DedIe9 HIghest
deeRe dedle
30
8.3 AVERAGE INCOME OF THE POOR COMPARED TO THE NON-POOR
When we look at the average 1998 incomes of two-parent families and single-parent
mothers two-parent families have higher incomes whether the families are poor or not
Figure 8.4 shows that the difference is smaller for poor families but still exists This
emphasizes the importance of having second earner or second potential earner in family
and the importance of two adults supporting one another with family responsibilities
Figure 8.4 Average Before-Tax Income 1998
$70043
$40771
All families Poor families
Two-Parent Families Single-Parent Mothers
Another important difference is that between poor and non-poor families The average
before-tax income of poor two-parent families was only 28 percent of the average for non-
poor families Table 8.2
In 1998 the difference between poor single-parent mothers and non-poor mothers was not
as marked The before-tax average income of poor single-parent mothers was 37 percent of
non-poor single mothers Table 8.2 However this seeming advantage for single-parent
mothers is more due to the much lower average income of their non-poor counterparts than to
poor single-parent mothers being better off than poor two-parent families
You might think that after-tax income would show significant reduction in the
difference between poor and non-poor families incomes since one of the goals of taxes is
income redistribution However while poor families do have higher percentage of after-tax
income than before-tax income the increase is only six to seven percentage points for both
types of families Table 8.2
-75836-
$21612
I-
Non-poor families

31
No matter whether we examine before-tax or after-tax income the average income of
poor single-parent mothers is less than half that of non-poor single mothers Poor two-parent
families average income is not even 40 percent of non-poor two-parent families average
income
8.4 POVERTY GAP
We have seen that the average incomes of poor families were significantly less than the
average incomes of non-poor families We can also examine how the average incomes of
poor people compared to the poverty line The difference between average income and the
poverty line is often called the poverty gap
On average the income of poor single-parent mothers was 63 percent of the poverty line
in 1998 The poverty gap was $8950 Poor two-parent family incomes were on average
71 percent of the poverty line While slightly higher than the percentage for single-parent
mothers the poverty gap was about the same at $8919 This means that the average incomes
for poor families with children were almost $9000 below the poverty cut-off in 1998
Figure 8.5 Poverty Gap for Poor Single-
Parent Mothers by Number of Earners 1998
24
73 7O 763.9 76247409 7347 53
1989 1990 1991 1992 1993 1994 1995 1996 1997 1998
No earner -- One earner
When we look at poverty gaps for poor families by number of earners different trends
emerge between families with earners and families without earners As shown in Figure 8.5
from 1989 to 1994 the difference in poverty gaps between poor single-parent mothers with no
earners and with one earner was steadily shrinking By 1994 there was only $1013
32
difference between the two types of families Since then single-parent mother families with
no earners have become increasingly poorer while single-parent mother families with one
earner have slowly become less poor By 1998 the average income of single-parent mother
families with no earners was $11224 below the poverty line Single-parent mother families
with one earner had poverty gap of $7253 almost $4000 closer to the poverty line than
families without earners
Figure 8.6 Poverty Gap for Poor Two-Parent
Familiesby Number of Earners 1998
15678
13812 1363314 .31
r11iiTI ITTTTTT11
9903
680670
1939 1990 1991 1992 1993 1994 1995 1996 1997 1998
No earner a-- One earner -x- Two earners
There is not as clear trend for poor two-parent families as for poor single-parent
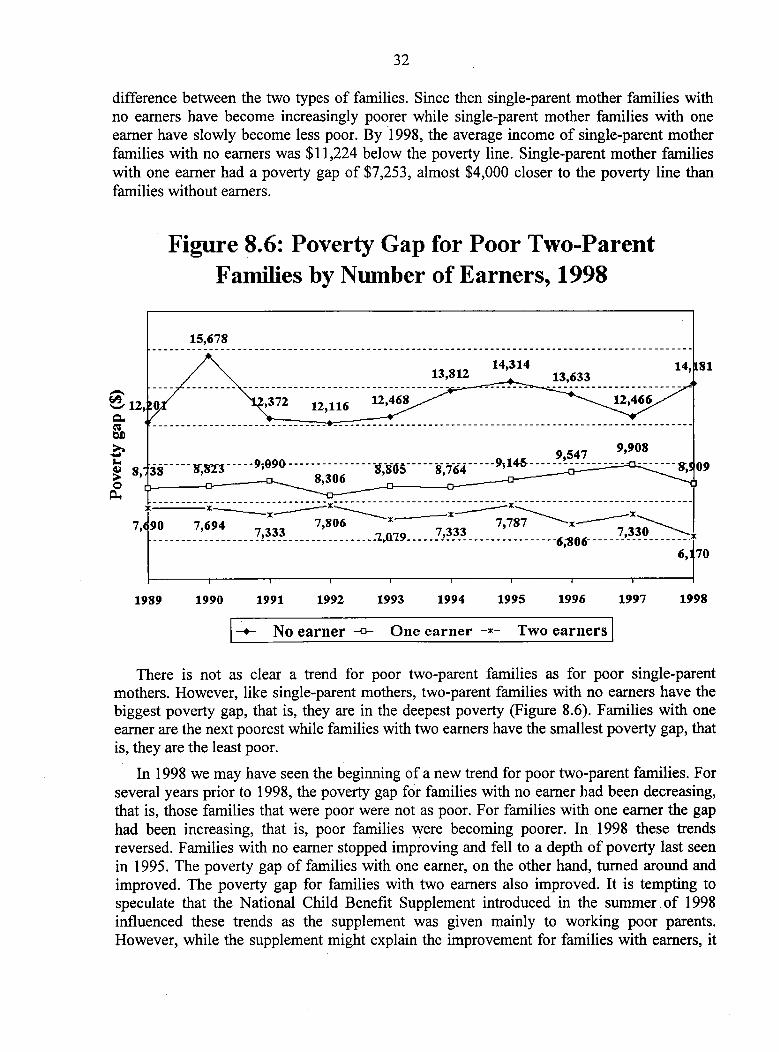
mothers However like single-parent mothers two-parent families with no earners have the
biggest poverty gap that is they are in the deepest poverty Figure 8.6 Families with one
earner are the next poorest while families with two earners have the smallest poverty gap that
is they are the least poor
In 1998 we may have seen the beginning of new trend for poor two-parent families For
several years prior to 1998 the poverty gap for families with no earner had been decreasing
that is those families that were poor were not as poor For families with one earner the gap
had been increasing that is poor families were becoming poorer In 1998 these trends
reversed Families with no earner stopped improving and fell to depth of poverty last seen
in 1995 The poverty gap of families with one earner on the other hand turned around and
improved The poverty gap for families with two earners also improved It is tempting to
speculate that the National Child Benefit Supplement introduced in the summer of 1998
influenced these trends as the supplement was given mainly to working poor parents
However while the supplement might explain the improvement for families with earners it

33
would not explain why families with no earner suddenly became much worse off We will
have to wait for more years of data to see if 1998 was merely hiccup or the start of new
trend
8.5 INCOME CATEGORIES BASED ON PERCENTAGE OF THE POVERTY LINE
We can group poor families into income categories based on percentages of the poverty
line This allows us to see how many families are close to the poverty line and how many are
far below the line
Figure 8.7 shows that more poor single-parent mothers lived in deeper poverty than poor
two-parent families One-quarter of poor single-parent mothers or 79000 had incomes that
were less than half of the poverty line in 1998 Table 8.3 This is severe poverty It means
for example that single-parent mother with two children living in large Canadian city like
Toronto or Vancouver had an income that was less than $13658
Figure 8.7 Distribution of Poor Families by
Income Categories as Percentage of Poverty
Line 1998
Two-parent families Single-parent mothers 503
iiiiiiiiiiiiiiiiiii
i11Zf17I
Less than 50.0% 50.0% to 74.9% 75.0% to 99.9%
Income as percentage of poverty line
The proportion of poor two-parent families that had incomes of less than half the poverty
line was smaller but still substantial at 17 percent or 56000 families Table 8.3 As an
example two-parent family with two children living in big Canadian city would have had
family income of less than $16532
Another 43 percent or 133000 of poor single-parent mothers had incomes between
50 percent and 74.9 percent of the poverty line smaller proportion of poor two-parent
families 32 percent or 106000 had incomes in this category Table 8.3
34
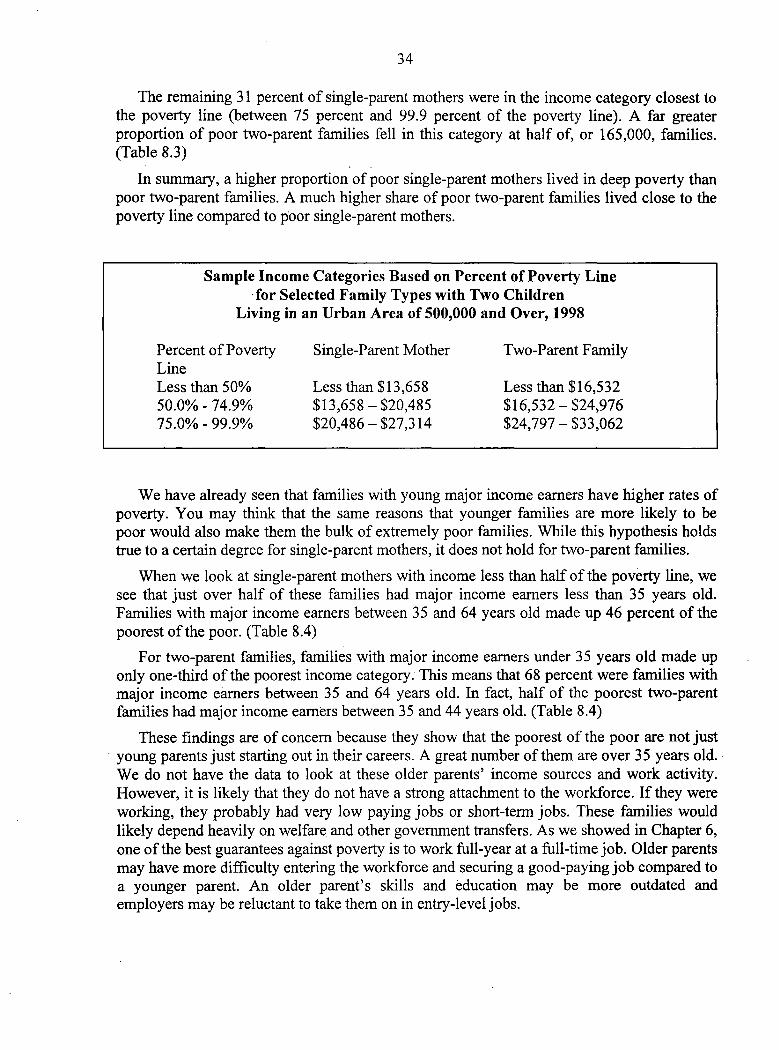
The remaining 31 percent of single-parent mothers were in the income category closest to
the poverty line between 75 percent and 99.9 percent of the poverty line far greater
proportion of poor two-parent families fell in this category at half of or 165000 families
Table 8.3
In summary higher proportion of poor single-parent mothers lived in deep poverty than
poor two-parent families much higher share of poor two-parent families lived close to the
poverty line compared to poor single-parent mothers
Sample Income Categories Based on Percent of Poverty Line
for Selected Family Types with Two Children
Living in an Urban Area of 500000 and Over 1998
Percent of Poverty Single-Parent Mother Two-Parent Family
Line
Less than 50% Less than $13658 Less than $16532
50.0% 74.9% $13658 $20485 $16532 $24976
75.0% 99.9% $20486 $27314 $24797 $33062
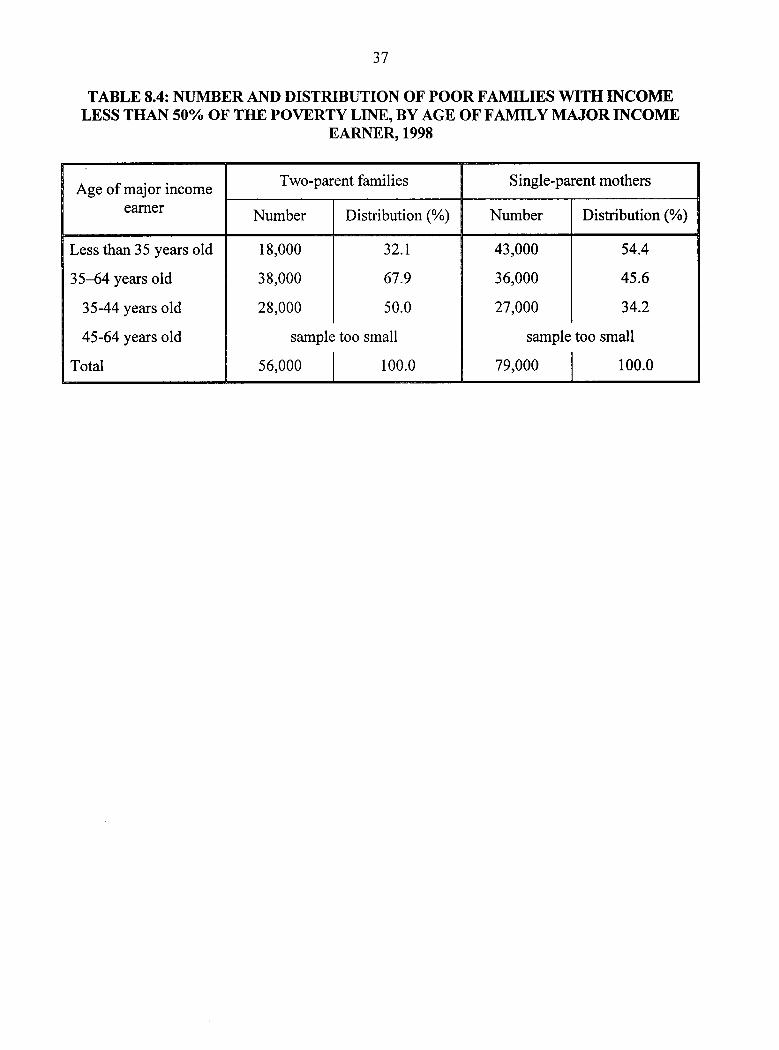
We have already seen that families with young major income earners have higher rates of
poverty You may think that the same reasons that younger families are more likely to be
poor would also make them the bulk of extremely poor families While this hypothesis holds
true to certain degree for single-parent mothers it does not hold for two-parent families
When we look at single-parent mothers with income less than half of the poverty line we
see that just over half of these families had major income earners less than 35 years old
Families with major income earners between 35 and 64 years old made up 46 percent of the
poorest of the poor Table 8.4
For two-parent families families with major income earners under 35 years old made up
only one-third of the poorest income category This means that 68 percent were families with
major income earners between 35 and 64 years old In fact half of the poorest two-parent
families had major income earners between 35 and 44 years old Table 8.4
These findings are of concern because they show that the poorest of the poor are not just
young parents just starting out in their careers great number of them are over 35 years old
We do not have the data to look at these older parents income sources and work activity
However it is likely that they do not have strong attachment to the workforce If they were
working they probably had very low paying jobs or short-term jobs These families would
likely depend heavily on welfare and other government transfers As we showed in Chapter
one of the best guarantees against poverty is to work full-year at full-time job Older parents
may have more difficulty entering the workforce and securing good-paying job compared to
younger parent An older parents skills and education may be more outdated and
employers may be reluctant to take them on in entry-level jobs

3.5
TABLE 8.1 AVERAGE BEFORE-TAX INCOME BY FAMILY TYPE FOR POOR ANDNON-POORFAMILIES 1980-1998 iN CONSTANT 1998 DOLLARS
Poor two-parent Non-poor two- Poor single-parent Non-poor single-Year
families parent families mothers parent mothers
1980 $19374 $66917 $13639 $42105
1981 $19675 $66283 $13071 $40779
1982 $19851 $65454 $13913 $38268
1983 $20137 $65537 $13261 $39586
1984 $19834 $66163 $13958 $41866
1985 $20466 $67374 $13537 $41753
1986 $19992 $68382 $13898 $38452
1987 $20363 $69619 $13922 $40313
1988 $20930 $70244 $14083 $38910
1989 $19970 $72269 $14766 $41004
1990 $20350 $71291 $14574 $41346
1991 $20728 $70104 $14458 $39449
1992 $19242 $70646 $14990 $40061
1993 $20983 $69602 $15657 $37577
1994 $20368 $70850 $15044 $39274
1995 $20865 $71156 $15229 $40485
1996 $20633 $71582 $15102 $39721
1997 $21290 $73224 $14447 $39120
1998 $21612 $75836 $15119 $40771
36
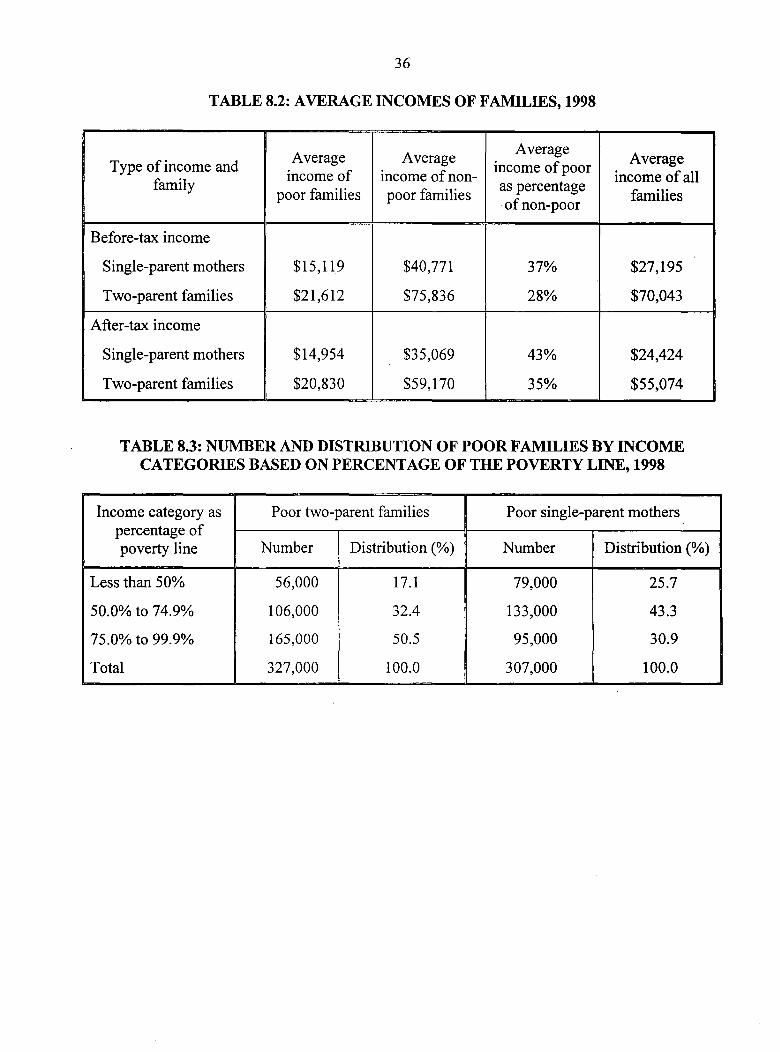
TABLE 8.2 AVERAGE INCOMES OF FAMILIES 1998
AverageAverage Average Average
Type of income and income of poorincome of income of non- income of all
family as percentagepoor families poor families families
of non-poor
Before-tax income
Single-parent mothers $15119 $40771 37% $27195
Two-parent families $21612 $75836 28% $70043
After-tax income
Single-parent mothers $14954 $35069 43% $24424
Two-parent families $20830 $59170 35% $55074
TABLE 8.3 NUMBER AN DISTRIBUTION OF POOR FAMILIES BY INCOMECATEGORIES BASED ON PERCENTAGE OF THE POVERTY LINE 1998
Income category as Poor two-parent families Poor single-parent mothers
percentage of
poverty line Number Distribution Number Distribution
Lessthan50% 56000 17.1 79000 25.7
50.0% to 74.9% 106000 32.4 133000 43.3
75.0% to 99.9% 165000 50.5 95000 30.9
Total 327000 100.0 307000 100.0
37
TABLE 8.4 NUMBER AND DISTRIBUTION OF POOR FAMILIES WITH INCOMELESS THAN 50% OF TIlE POVERTY LINE BY AGE OF FAMILY MAJOR INCOME
EARNER 1998
Two-parent families Single-parent mothersAge of major income
earnerNumber Distribution Number Distribution
Less than 35 years old 18000 32.1 43000 54.4
3564 years old 38000 67.9 36000 45.6
5-44 years old 28000 50.0 27000 34.2
45-64 years old sample too small sample too small
Total 56000 100.0 79000 100.0

38
9.0 SOURCES OF INCOME
Sources of income for the families of poor children are quite different from the sources of
incomes of families who are not poor Parents in poor families are less likely to be working
than are parents in non-poor families Still the myth that all poor families depend solely on
welfare and other government payments is not true
Like the chapter on depth of poverty this section looks at families not individual
children as income is calculated for the entire family
9.1 MAJOR SOURCE OF FAMILY INCOME
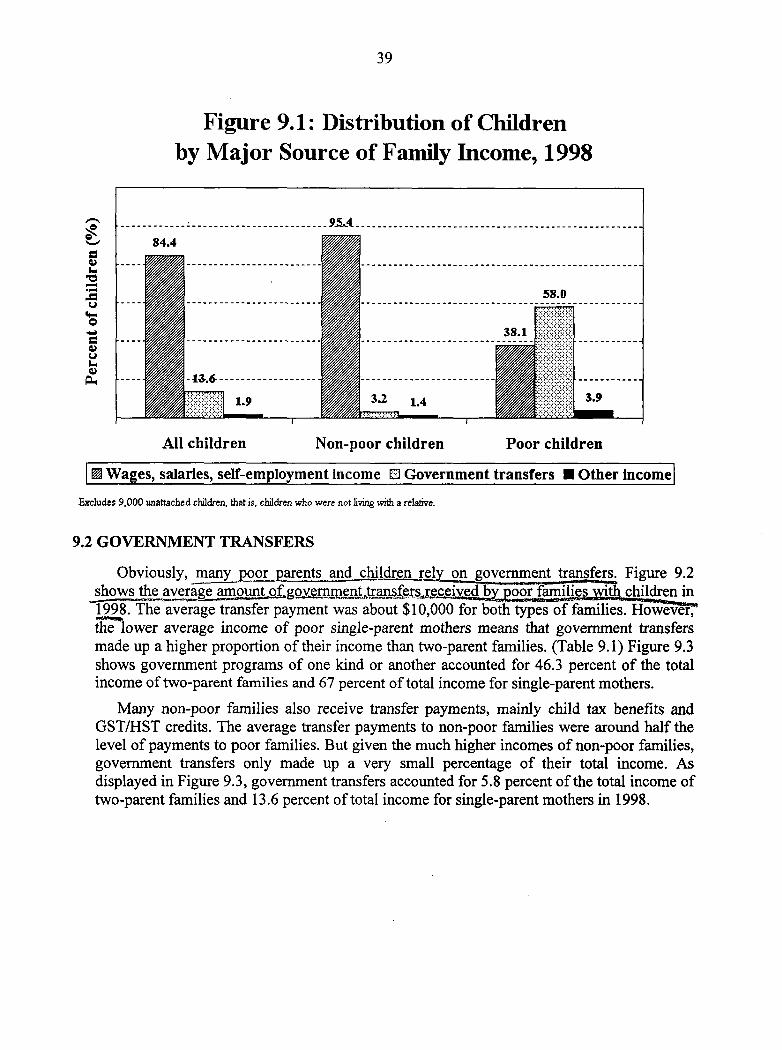
In 1998 almost all non-poor children
95.4 percent lived in families where the
major source of income was wages and
salaries or self-employment income as
shown in Figure 9.1 The importance of
earnings in keeping families out of poverty
is reinforced when we look at poor
children Only slightly more than third
38.1 percent of poor children lived in
families where the maj or source of income
was wages and salaries or self-
employment income
More than half 58 percent of poor children lived in families where the major source of
income was government transfers Only very small percent 3.2 percent of non-poor
children lived in such families
Children who lived in families where the major source of income was wages and salaries
had much lower chance of living in poverty compared to children whose family relied on
government transfers The poverty rate in 1998 was only 5.4 percent for children living in
two-parent families where the major source of income is wages and salaries The poverty rate
jumped to 74.4 percent when the major source of income was government transfers For
children living with single-parent mothers the poverty rate was 22.6 percent when the major
source of income was wages and salaries The poverty rate was 90.3 percent when the major
source of income was government transfers
In addition to the variation in poverty rates by the familys major source of income there
was also substantial difference between family types This was especially noticeable when
we looked at the poverty rates for families that relied on wages and salaries In 1998 only
5.4 percent of children in two-parent families lived in poverty This was in striking contrast to
the poverty rate of 22.6 percent for children living with single-parent mothers This again
emphasizes the difficulties single-parent mothers have without second earner in the family
or second adult to share child care responsibilities It may also be reflection of the lower
wages that women earn and the extra difficulties for single-parents of holding well-paying
and demanding job while juggling their sole responsibilities for their childrens needs
Government transfers include Employment
Insurance Old Age Security Canada and
Quebec Pension Plans Guaranteed Income
Supplements Spouses Allowance Child Tax
Benefit other child credits or allowances
welfare from provincial and municipal
programs workers compensation benefits
GST/HST credits provincial and territorial
tax credits and any other government
transfers
39
Figure 9.1 Distribution of Children
by Major Source of Family Income 1998
All children Non-poor children Poor children
Wages salaries self-employment Income Government transfers Other lncorn
Excludes 9000 unattached children that is children who were not livirg with relathe
9.2 GOVERNMENT TRANSFERS
Obviously poor parents and cjr on government transfers Figure 9.2
1998 The average transfer payment was about $10000 for both types of families However
the lower average income of poor single-parent mothers means that government transfers
made up higher proportion of their income than two-parent families Table 9.1.Figure 9.3
shows government programs of one kind or another accounted for 46.3 percent of the total
income of two-parent families and 67 percent of total income for single-parent mothers
Many non-poor families also receive transfer payments mainly child tax benefits and
GST/HST credits The average transfer payments to non-poor families were around half the
level of payments to poor families But given the much higher incomes of non-poor families
government transfers only made up very small percentage of their total income As
displayed in Figure 9.3 government transfers accounted for 5.8 percent of the total income of
two-parent families and 13.6 percent of total income for single-parent mothers in 1998
9AS4.4
L1
58.0
3Si
3.21.4
3.9

40
Figure 9.2 Average Government Transfers
1998
All families Non-poor families Poor families
Two-parent families Single-parent mothers
Figure 9.3 Government Transfersas
Percentage Of Total Income 1998
All famifies Non-poor famifies Poor families
$10003 $10132
$7970
$552
$4393
1-
aft
463--
29.3
13
73.ss
Two-parent families Single-parent mothers
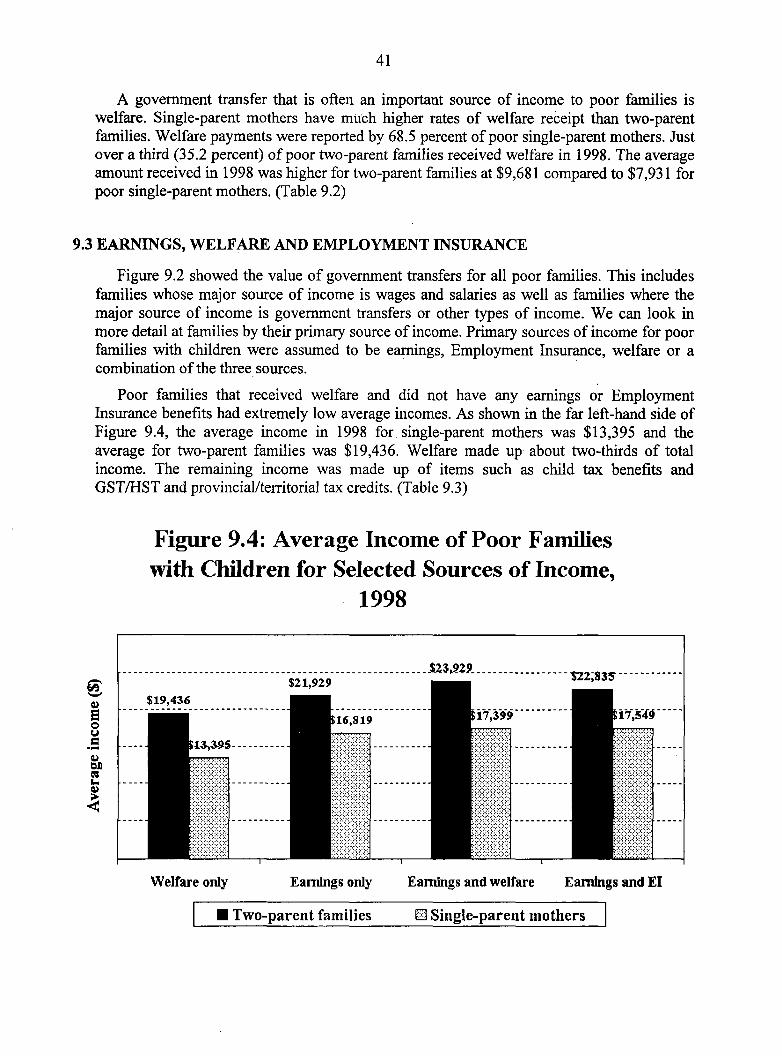
41
government transfer that is often an important source of income to poor families is
welfare Single-parent mothers have mtwh higher rates of welfare receipt than two-parent
families Welfare payments were reported by 68.5 percent of poor single-parent mothers Just
over third 35.2 percent of poor two-parent families received welfare in 1998 The average
amount received in 1998 was higher for two-parent families at $9681 compared to $7931 for
poor single-parent mothers Table 9.2
9.3 EARNINGS WELFARE AND EMPLOYMENT INSURANCE
Figure 9.2 showed the value of government transfers for all poor families This includes
families whose major source of income is wages and salaries as well as families where the
major source of income is government transfers or other types of income We can look in
more detail at families by their primary source of income Primary sources of income for poor
families with children were assumed to be earnings Employment Insurance welfare or
combination of the three sources
Poor families that received welfare and did not have any earnings or Employment
Insurance benefits had extremely low average incomes As shown in the far left-hand side of
Figure 9.4 the average income in 1998 for single-parent mothers was $13395 and the
average for two-parent families was $19436 Welfare made up about two-thirds of total
income The remaining income was made up of items such as child tax benefits and
GST/HST and provincial/territorial tax credits Table 9.3
Figure 9.4 Average Income of Poor Families
with Children for Selected Sources of Income
1998
Welfare only Earnings only Earnings and weLfare Earnings and El
$19436
L395
ç399
Two-parent families Single-parent mothers

42
There were 46000 poor two-parent families that relied on welfare alone This is far less
than the 117000 poor single-parent mothers whose only income was welfare Table 9.4 The
numbers work out to over third 38.1 percent of poor single-parent mothers depending on
welfare only in 1998 compared to 14.1 percent of poor two-parent families as shown in
Figure 9.5
Figure 9.5 Distribution of Poor Families with
Children for Selected Sources of Income 1998
____
Earnings only Earnings and
welfare
Two-parent families Single-parent mothers
Poor two-parent families are more likely to have earnings only and no Employment
Insurance benefits or welfare There were 142000 poor two-parent families in this situation
compared to 58000 single-parent mothers Table 9.4 In fact 43.4 percent of poor two-
parent families relied on earnings alone compared to 18.9 percent of poor single-parent
mothers Figure 9.5
Poor families with earnings alone had higher average incomes than poor families with
welfare alone As shown under the second category in Figure 9.4 the average income for
two-parent families was $21929 and the average for single-parent mothers was $16819 in
1998 Earnings received by two-parent families made up 68 percent of total average income
The percentage was slightly lower for single-parent mothers at 61 percent The remaining
income was made up of items such as child tax benefits investment income GST/HST and
provinciallterritorial tax credits and other income such as alimony and child support Table
9.3
Although only 18.9 percent of poor single-parent mothers depended on earnings alone
this does not mean that only those single-parent mothers had earnings Many others reported
earnings but in combination with other sources of income Including those families that had
43.4
----1
25.1
18.9
14.7
Welfare only
10.711.4
Earnings and
El
Other
43
earnings only more than half 55 percent of poor single-parent mothers had at least some
earnings during the year Table 9.2
Similarly while 43.4 percent of poor two-parent families had earnings only very high
percentage had at least some earnings during the year Including those that had earnings only
80.3 percent of poor two-parent families had received some earnings in 1998 Table 9.2
The only other sources of income that were received by higher percentage of poor
families than earnings were the Child Tax Benefit for two-parent families and welfare and
the Child Tax Benefit for single-parent mothers Table 9.2
We have enough data for 1998 to look specifically at two combinations of earnings and
other sources of income for poor families earnings with welfare and earnings with
Employment Insurance
Poor single-parent mothers were more likely than two-parent families to receive
combination of earnings and welfare than poor two-parent families Poor single-parent
mothers with these sources of income had total average income of $17399 They derived
much more of their total income from welfare than from earnings Poor two-parent families
on the other hand had similar levels of earnings and welfare Table 9.3
Two-parent families were more likely to have combination of earnings and Employment
Insurance than poor single-parent mothers were These two-parent families and single-parent
mothers derived close to 60 percent of their total income from earnings Table 9.3
Poor families that received earnings in combination with welfare or with EmploymentInsurance had the highest average incomes Poor families that had earnings only had the
second lowest average incomes and families that received welfare only had the lowest
9.4 CANADA CHILD TAX BENEFIT
An important source of income for poor families with children is the Child Tax Benefit
The Child Tax Benefit was introduced in 1993 to replace Family Allowances the refundable
Child Tax Credit and the non-refundable credit for families with children under 18 who pay
federal income tax As of July 1998 the Canada Child Tax Benefit CCTB replaced the
Child Tax Benefit The Canada Child Tax Benefit is part of the National Child Benefit
program and consists of basic benefit and supplement The basic benefit provides federal
income support to all low- and middle-income families with children The supplement often
referred to as the National Child Benefit NCB supplement provides additional federal
income support only to low-income families
The Canada Child Tax Benefit was the first major new social program in years and was
implemented with the co-operation and support of provincial and territorial governments The
initiative was made possible because of major new financial commitments by the federal
government The National Council of Welfare applauded the federal government for boosting
its financial support for families with children and commended both levels of government for
their joint efforts in this important area
At the same time the Council voiced and has continued to voice concerns about the
claw-back of federal child benefits by provincial and territorial governments The
provinces and territories were given the option of reducing poor familys welfare payments
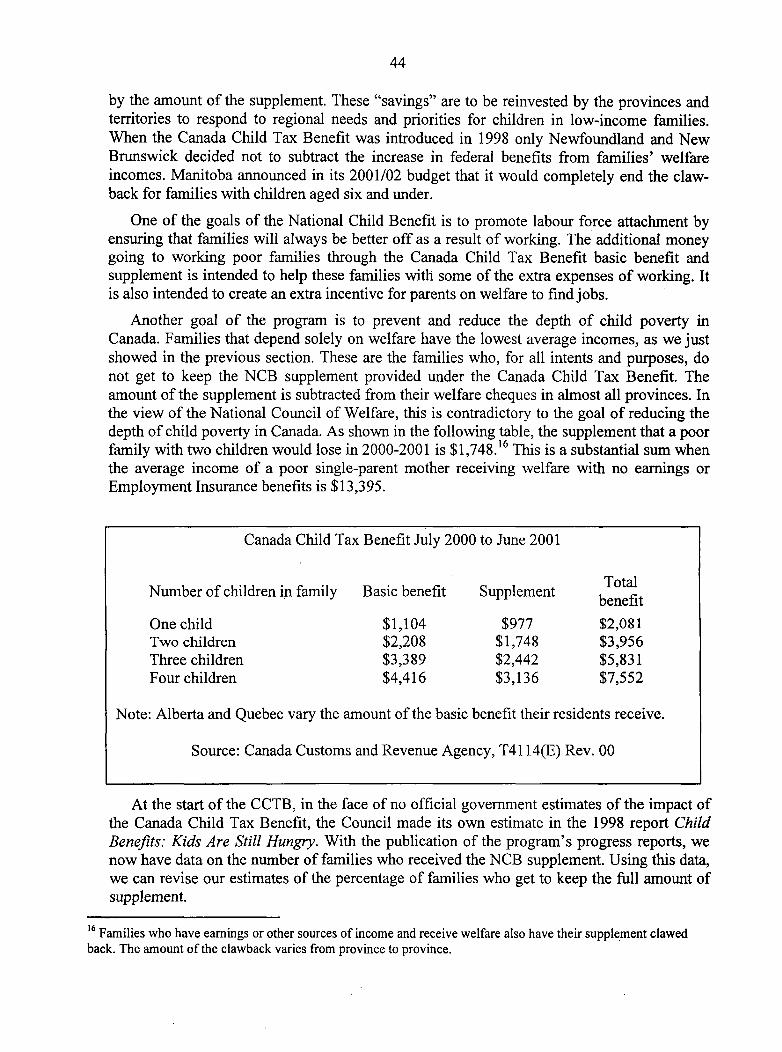
44
by the amount of the supplement These savings are to be reinvested by the provinces and
territories to respond to regional needs and priorities for children in low-income families
When the Canada Child Tax Benefit was introduced in 1998 only Newfoundland and NewBrunswick decided not to subtract the increase in federal benefits from families welfare
incomes Manitoba announced in its 200 1/02 budget that it would completely end the claw-
back for families with children aged six and under
One of the goals of the National Child Benefit is to promote labour force attachment by
ensuring that families will always be better off as result of working The additional money
going to working poor families through the Canada Child Tax Benefit basic benefit and
supplement is intended to help these families with some of the extra expenses of working It
is also intended to create an extra incentive for parents on welfare to find jobs
Another goal of the program is to prevent and reduce the depth of child poverty in
Canada Families that depend solely on welfare have the lowest average incomes as we just
showed in the previous section These are the families who for all intents and purposes do
not get to keep the NCB supplement provided under the Canada Child Tax Benefit The
amount of the supplement is subtracted from their welfare cheques in almost all provinces In
the view of the National Council of Welfare this is contradictory to the goal of reducing the
depth of child poverty in Canada As shown in the following table the supplement that poor
family with two children would lose in 2000-2001 is $1748.16 This is substantial sum when
the average income of poor single-parent mother receiving welfare with no earnings or
Employment Insurance benefits is $13395
Canada Child Tax Benefit July 2000 to June 2001
TotalNumber of children in family Basic benefit Supplement
benefit
One child $1104 $977 $2081
Two children $2208 $1748 $3956
Three children $3389 $2442 $5831
Four children $4416 $3136 $7552
Note Alberta and Quebec vary the amount of the basic benefit their residents receive
Source Canada Customs and Revenue Agency T41 14E Rev 00
At the start of the CCTB in the face of no official government estimates of the impact of
the Canada Child Tax Benefit the Council made its own estimate in the 1998 report Child
Benefits Kids Are Still Hungry With the publication of the programs progress reports we
now have data on the number of families who received the NCB supplement Using this data
we can revise our estimates of the percentage of families who get to keep the full amount of
supplement
16Families who have earnings or other sources ofincome and receive welfare also have their supplement clawed
back The amount of the clawback varies from province to province

45
The National Child Benefit Progress Report 2000 showed that 1378293 families
received the supplement from July 1998 to June 1999 The report also showed the number of
two-parent and single-parent families receiving welfare based on numbers in March of each
calendar year Using these numbers we estimate as shown in the box below that around 66
percent of families who received the supplement kept the full amount that is these families
did not have any of the supplement clawed back by provincial and territorial governments
Estimate of families keeping the full National Child Benefit Supplement NCBS
Total families Total families Families keeping the
Family typereceiving the NCBS
SUBTRACT receiving social
EQUALSfull supplement
July 1998 to June assistance
1999 March 1999 Number Percent
Single-parent 801898 347700 454198 57%
families
Two-parent 576395 121600 454795 79%
families
All families 1378293 469300 908993 66%
Note The number of families receiving social assistance was not available by province so we are unable to account
for New Brunswick and Newfoundland not clawing back the supplement Given the relatively small population of
the two provinces it is likely that this omission underestimates families receiving the full supplement by only few
percentage points
The estimates show clear bias against single-parent families While about 79 percent of
two-parent families keep the full NCB supplement only around 57 percent of single-parent
families do difference of 22 percentage points
46
TABLE 9.1 TRANSFERPAYMENTS TO FAMILIES WITH CIIILDREN 1998
Average Transfer Average Income from Transfers as Percentage
Payment All Sources of Total Income
Family TypePoor Non-poor Poor Non-poor Poor Non-poor
families families families families families families
Two-parent$10003 $4393 $21612 $75836 46.3% 5.8%
families
Single-parent$10132 $5529 $15119 $40771 67.0% 13.6%
mothers
TABLE 9.2 SOURCES OF iNCOME FOR POOR FAMILIES WITH CHILDREN 1998
Poor two-parent families Poor single-parent mothers
Source of IncomePercent who
AveragePercent who Average
amount to amount toreceive receive
recipient recipient
Earnings 80.3% $13336 55.0% $7414
Welfare 35.2% $9681 68.5% $7931
Employment Insurance 23.8% $4380 12.6% $3306
Investments 24.6% $969 7.4% $81
Child Tax Benefit 99.7% $4229 99.9% $3386
Workers Compensation 6.8% $5074 Sample size too small
IncomeFromAll Sources 100% $21612 100% $15119
47
TABLE 9.3 INCOMES OF POOR FAMILIES WITH CHILDREN BY PRIMARYSOURCES OF INCOME 1998
Poor single-parentPrimary Sources of Income Poor two-parent families
mothers
EARNINGS
no welfare or El
Total Average Income $21929 $16819
Average Earnings $15005 $10305
Child Benefits $4139 $3846
EARNINGS AND EMPLOYMENT INSURANCE
no welfare
Total Average Income $22835 $17549
Average Earnings $13525 $10022
Average El $4488 $3577
Child Benefits $3649 $3259
EARNINGS AND WELFAREno El
Total Average Income $23929 $17399
Average Earnings $8632 $4828
Average Welfare $9182 $7432
Child Benefits $4575 $3311
WELFARE
no earnings or El
Total Average Income $19436 $13395
Average Welfare $12373 $8834
Child Benefits $4751 $3320
48
TABLE 9.4 NUMBER OF POOR FAMILIES WITH CHILDREN BY PRIMARYSOURCES OF INCOME 1998
Primary Sources of IncomePoor two-parent Poor single-parent
families mothers
Earnings
no welfare or El142000 58000
Earnings and Employment Insurance nowelfare
56000 20000
Earnings and welfare
no El48000 77000
Welfare
no earnings or El46000 117000
49
10.0 DURATION OF POVERTY
When examining child poverty trends in Canada we saw that poverty rates ranged from
about 15 percent to 22 percent between 1980 and 1998 Based on this it is tempting to
conclude that only 15 percent to 22 percent of children have experienced poverty However
with the advent of longitudinal studies that follow families over time there is now data that
shows poverty touches greater number of children than may be thought from looking at
yearly poverty rates
The major Canadian longitudinal study the Survey of Labour and Income Dynamics
SLID was designed to capture changes in the economic well-being of individuals and
families over time People are followed for six consecutive years The data collected enables
researchers to see how peoples financial circumstances changed each year The first six-year
cycle of SLID has been completed It started in 1993 and ended in 1998
10.1 ALL CHILDREN7
Data from the survey showed that between 1993 and 1998 34 percent of children in
Canada experienced poverty for at least one year between 1993 and 1998 This rate is higher
than annual poverty rates because some children and their families were moving in and out of
poverty throughout the six-year period For some of these children poverty only lasted for
short period while for others poverty was persistent state over some or all of the six years
Figure 10.1 Persistence of Poveity for
Children in Canada 1993-1998
7Data for this section is taken from Statistics Canada Incomes in Canada 1998 Catalogue No 75-202-XIE
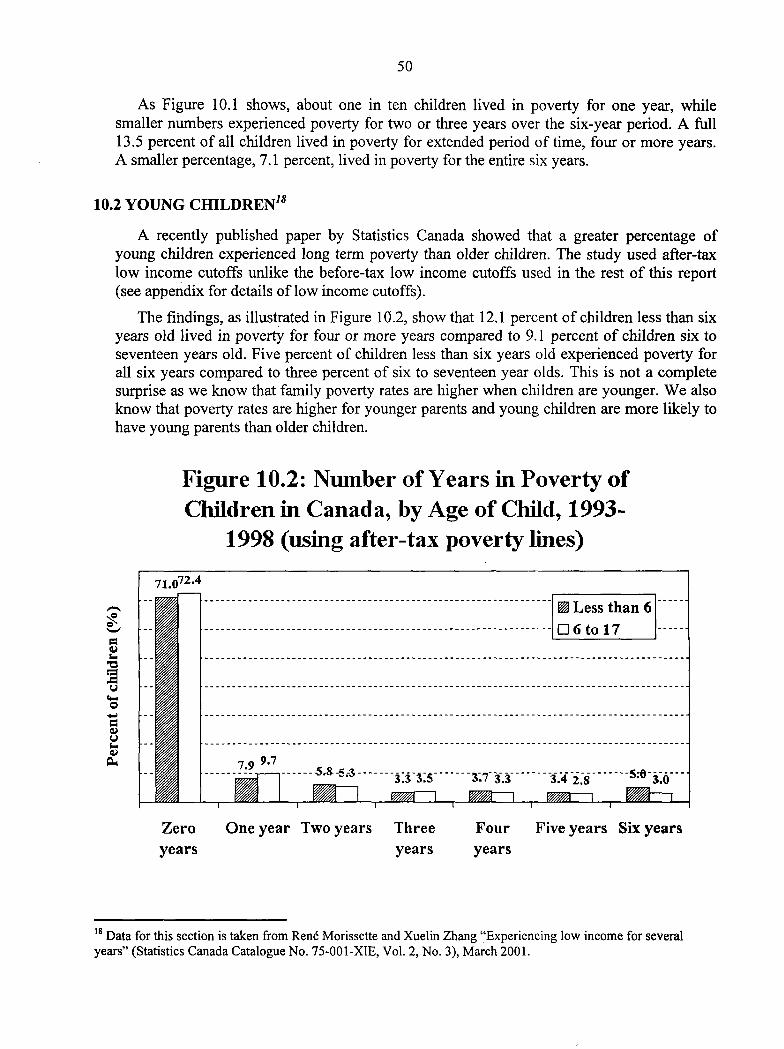
50
As Figure 10.1 shows about one in ten children lived in poverty for one year while
smaller numbers experienced poverty for two or three years over the six-year period full
13.5 percent of all children lived in poverty for extended period of time four or more years
smaller percentage 7.1 percent lived in poverty for the entire six years
10.2 YOUNG CHILDREN8
recently published paper by Statistics Canada showed that greater percentage of
young children experienced long term poverty than older children The study used after-tax
low income cutoffs unlike the before-tax low income cutoffs used in the rest of this report
see appendix for details of low income cutoffs
The fmdings as illustrated in Figure 10.2 show that 12.1 percent of children less than six
years old lived in poverty for four or more years compared to 9.1 percent of children six to
seventeen years old Five percent of children less than six years old experienced poverty for
all six years compared to three percent of six to seventeen year olds This is not complete
surprise as we know that family poverty rates are higher when children are younger We also
know that poverty rates are higher for younger parents and young children are more likely to
have young parents than older children
Figure 10.2 Number of Years in Poverty of
Children in Canada by Age of Child 1993-
1998 using after-tax poverty lines
Less than
D6to17
.5 53
18Data for this section is taken from RenØ Morissette and Xuelin Zhang Experiencing low income for several
years Statistics Canada Catalogue No 75-OO1-XIE Vol No March 2001
Zero One year Two years Three Four Five years Six years
years years years

51
The evidence of sustained periods of poverty in the early years is particularly concerning
in the light of mounting evidence pointing to the significance of this developmental period It
would seem that it is especially important to have early childhood development programs in
place to help poor preschoolers and their families overcome the difficulties they face and to
help these families move out of poverty The First Ministers announced in September 2000
that $2.2 billion has been earmarked for early childhood development over five years The
money is to be spent on four key areas for action
Promotion of healthy pregnancy birth and infancy
Improvement of parenting and family supports
Strengthening early childhood development learning and care
Strengthening community supports
The provinces and territories will each decide how the money will be spent in their
jurisdiction By the end of 2001 we should know details on provincial and territorial
programs We hope that programs developed with this money willtarget poor families with
children but the agreement does not specifically state that this is priority
10.3 FAMILY TYPE19
We can also examine duration of poverty by family type When we look at the persistence
of low income by family type we see familiar pattern People living in single-parent
families single-parent mothers and single-parent fathers were exposed to low income more
frequently than were people living in two-parent families as shown in Figure 10.3 While
84.4 percent of people living in two-parent families experienced no poverty over the six
years less than half 42.4 percent of people living in single-parent families did not
When we look at longer-term poverty of four years or more fully 38 percent of people
living in single-parent families over the entire six years experienced low income for four
years or more The corresponding rate for people who lived in two-parent families was
substantially lower at 5.6 percent Almost 20 percent of people who lived in single-parent
families lived in poverty for the entire six years Only 2.5 percent of people who lived in two-
parent families lived in poverty for the whole six years
These numbers refer to people whose family type did not change over the six years of the
study Without doubt some families change over time person who was single-parent in
1993 may marry or enter common-law relationship two-parent family may break up
through divorce or death For this reason the study also looked at the persistence of low
income for family type as defined at the start of the study in 1993 This allows us to examine
those people whose family type changed during the study in addition to those whose family
type did not change
19Data for this section is taken from RenØ Morissette and Xuelin Zhang Experiencing low income for several
years Statistics Canada Catalogue No 75-O01-XIE Vol No March 2001
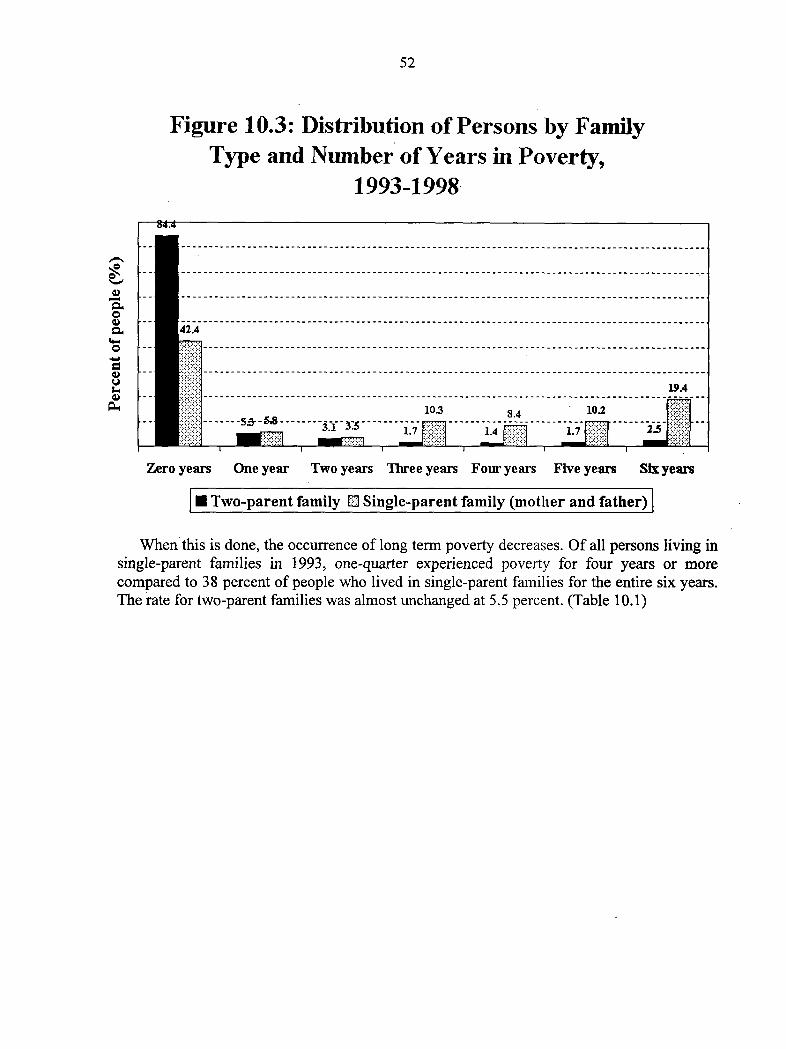
52
Figure 10.3 Distribution of Persons by Family
Type and Number of Years in Poverty
1993-1998
84.4
1424
10.3 84 10.2
Zero years One year Two years Three years Four years Five years Sli years
Two-parent family Single-parent family mother and fathj
When this is done the occurrence of long term poverty decreases Of all persons living in
single-parent families in 1993 one-quarter experienced poverty for four years or more
compared to 38 percent of people who lived in single-parent families for the entire six years
The rate for two-parent families was almost unchanged at 5.5 percent Table 10.1

53
TABLE 10.1 PERCENTAGE DISTRIBUTION OF PEOPLE WITH LOW INCOME BYFAMILY TYPE 1993-1998
Family Years of low income
composition in
1993 Total
Two-parent80.2% 7.6% 4.5% 2.3% 1.9% 1.5% 2.1% 100%
families
Single-parent
familymother 47.6% 11.5% 7.5% 8.0% 6.7% 7.6% 11.1% 100%
and father
Source RenØ Morissette and Xuelin Zhang Experiencing low income for several years
Statistics Canada Catalogue No 75-00l-XIE Vol No March 2001

54
CONCLUSION
There is no one single defining portrait of child poverty Poor children live in two-parent
families and in single-parent families great number of them have parents who work full-
time great number of them live in families that depend on welfare Some of their parents
did not finish high school some of their parents have post-secondary diploma Within this
range of experiences however some groups stand out
Children living with single-parent mothers face many difficulties They are more likely to
be poor they are more likely to be in poverty for an extended period of time and their
families are more likely to live deep in poverty They are almost three times as likely to
depend solely on welfare than two-parent families Their higher rate of reliance on welfare
means that they and their children are also less likely to see an improvement in their incomes
from the federal governments multi-billion dollar National Child Benefit supplement as most
provinces have chosen to claw back the supplement from welfare recipients
Aboriginal children have abysmally high poverty rates They are more likely to live with
single-parent mothers than children in the general population and the poverty rate for
Aboriginal single-parent mothers is substantially higher than that for all single-parent
mothers
Families with young children are more likely to be poor than are families with older
children Young children are more likely to live in poverty for longer periods of time than
older children Given the importance of the early years in childhood development this is
serious concern
Half of poor children lived in family where the major income earner worked Working
poor families struggle to meet their needs poor single-parent mother who relied on
earnings and did not receive welfare or Employment Insurance had an average income of
only $16819 in 1998 The Canadian Association of Food Banks reported that 26 percent of
food bank clients in Alberta 31 percent in Manitoba and 45 percent in Prince Edward Island
were working poor in March 2000.20
Given these statistics the National Council of Welfare was delighted to hear in the Speech
from the Throne the announcement that this government plans to ensure that no Canadian
child suffers the debilitating effects of poverty by making the elimination of child poverty
national project The National Council of Welfare strongly agrees with the federal
government that child poverty requires national project However the most important
national project for children is no single program it is the development of national family
policy encompassing both income supports and direct services
In our view this means the creation of comprehensive policies that support all parents and
their children but low-income parents and their children should be the priority national
family policy must ensure the following
Those families forced to depend on welfare must have adequate incomes nomarjthattheir work status We have seen that families that are dependent on welfare have the
20Beth Wilson with Carly Steinman HungerCount 2000 Surplus of Hunger Canadian Association of Food
Banks October 2000

55
lowest incomes We also know that income plays large role in child development
outcomes
Families rnujaietbesports they need to in tç work1
We have seen that children are much less likely to live in poverty if one or both of
their parents is working The National Child Benefit is an income support that will help
working poor families However income support is not the only type of support required
We have seen that education is risk factor for poverty Training and education programs
are important in getting parents back into the work force and keeping them there in good
jobs But we also saw that higher levels of education are not guarantee against poverty
There are other barriers to finding and keeping job Families most particularly single-
parent families cannot participate fully in the work force unless they can find high-
quality child care that they can afford High quality child care and early education
programs also provide enormous benefits to children in their early development thus
helping them get better start in life Women people from some visible minority groups
Aboriginal people and people with disabilities face serious obstacles in the labour market
that undermine their ability to support their children Strong employment equity and pay
equity laws could make difference in helping these groups enter and remain in the work
force
Parents who enter the work force must be able to rise over the poverty line Many poorhTfdren live with parents whol wifl wor 1.-ime or the entire
year Parents need jobs that allow them to support themselves and their children at
adequate levels
An integrated system of good family policy to overcome child poverty would address
labour income support employment equity and education olicies in tandem with child care
00 uca 1fl
The National Council of Welfare is cautiously optimistic about the priority accorded to
child poverty by the current government We sincerely hope that this issue remains top
priority for the rest of this governments mandate and beyond But we have heard promises
before that never came to fruition most particularly the all-party resolution of 1989 to
eliminate poverty by end of the century We wait to hear more details and see the results of
programs Child poverty affects us all both today and tomorrow As the government stated in
its most recent Speech from the Throne
Securing good start in life for children is the only way to ensure that they
are ready to learn to seize opportunity as adults and to contribute to the
building of their country
56
APPENDIX METHODOLOGY
DATA SOURCES
The data unless otherwise stated is from Statistics Canadas Survey of Consumer
Finance and Survey of Labour and Income Dynamics SLID We apply the Statistics Canada
standard of using the Survey of Consumer Finance data for years prior to 1996 and the
Survey of Labour and Income Dynamics for 1996 and onwards The latest data available is
1998
The 1998 SLID was conducted in January and May of 1999 and sampled roughly 30000
private households from all parts of the country except for Yukon the Northwest Territories
Nunavut Indian reserves and institutions such as prisons mental hospitals and homes for
the elderly The survey looked at incomes for the 1998 calendar year Close to three-quarters
of SLID respondents gave their consent to the use of their TI tax information to provide
income data
The 1998 results were published by Statistics Canada under the title Income in Canada
1998 Statistics Canada also provided custom tabulations to the National Council of Welfare
MEASURE OF POVERTY
Information about poverty is obtained by comparing the survey data with the low income
cutoffs or LICOs of Statistics Canada The LICOs represent levels of income where people
spend disproportionate amounts of money for food shelter and clothing
This publication uses the 1992 base low income cutoffs They are referred to as 1992 base
LICOs because they use data collected about spending patterns on food shelter and clothing
for 1992
To determine the level of income at which families are significantly worse off than others
Statistics Canada adds 20 percentage points to the proportion of income spent by all families
on food shelter and clothing Canadian families spent on average 34.7 percent of before-tax
income on food shelter and clothing in 1992 so it was assumed that low-income Canadians
spent 54.7 percent or more on these three items
Low income cutoffs are also available using fter-tax income After-tax income is total
income including government transfers less income taxes This publication makes use of the
more commonly used before-tax low income cutoffs unless otherwise specified
The low income cutoffs vary by the size of the family unit and the population of the area
of residence There are seven categories of family size from one person to seven or more
persons and five community sizes ranging from rural areas to cities with 500000 or more
residents The result is set of 35 cutoffs The cutoffs are updated annually by Statistics
Canada using the Consumer Price Index
The entire set of 35 cutoffs for 1998 appears in Table A.l The cutoffs range from
$12142 for family of one in rural area to $44751 for family ofseven or more in large
city
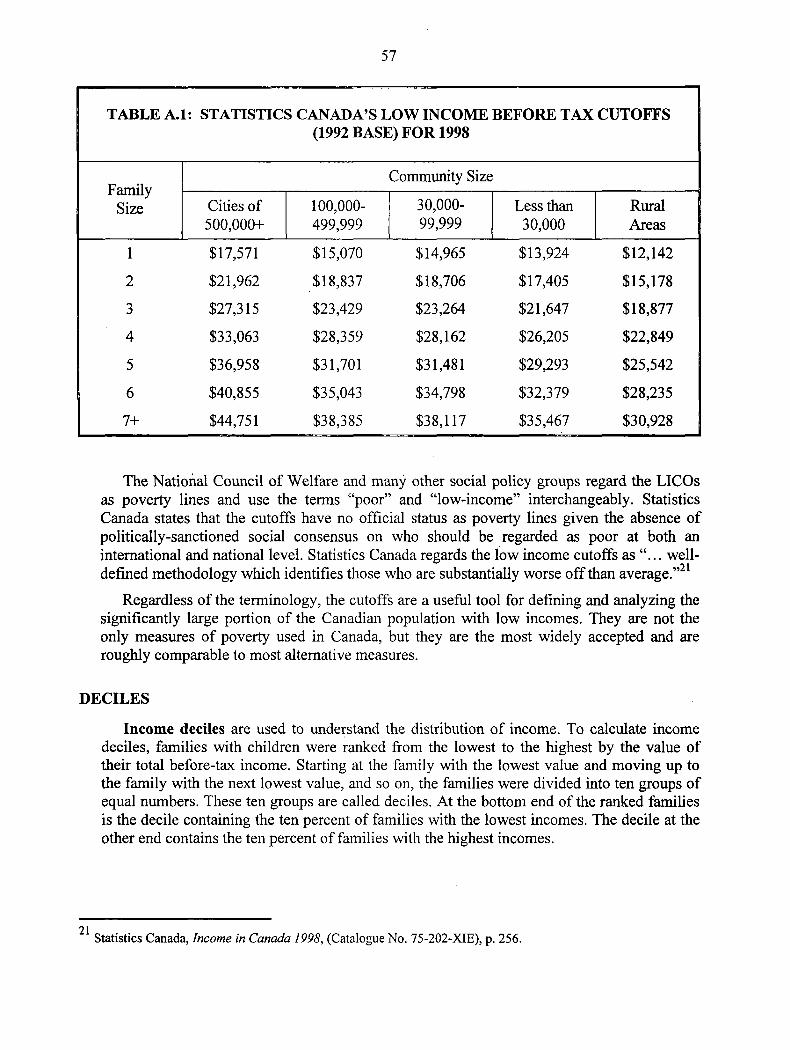
57
TABLE A.1 STATISTICS CANADAS LOW INCOME BEFORE TAX CUTOFFS
1992 BASE FOR 1998
Community Size
Family
Size Cities of 100000- 30000- Less than Rural
500000 499999 99999 30000 Areas
$17571 $15070 $14965 $13924 $12142
$21962 $18837 $18706 $17405 $15178
$27315 $23429 $23264 $21647 $18877
$33063 $28359 $28162 $26205 $22849
$36958 $31701 $31481 $29293 $25542
$40855 $35043 $34798 $32379 $28235
$44751 $38385 $38117 $35467 $30928
The National Council of Welfare and many other social policy groups regard the LICOs
as poverty lines and use the terms poor and low-income interchangeably Statistics
Canada states that the cutoffs have no official status as poverty lines given the absence of
politically-sanctioned social consensus on who should be regarded as poor at both an
international and national level Statistics Canada regards the low income cutoffs as .. well
defmed methodology which identifies those who are substantially worse off than average.2
Regardless of the terminology the cutoffs are useful tool for defining and analyzing the
significantly large portion of the Canadian population with low incomes They are not the
only measures of poverty used in Canada but they are the most widely accepted and are
roughly comparable to most alternative measures
DECILES
Income deciles are used to understand the distribution of income To calculate income
deciles families with children were ranked from the lowest to the highest by the value of
their total before-tax income Starting at the family with the lowest value and moving up to
the family with the next lowest value and so on the families were divided into ten groups of
equal numbers These ten groups are called deciles At the bottom end of the ranked families
is the decile containing the ten percent of families with the lowest incomes The decile at the
other end contains the ten percent of families with the highest incomes
21Statistics Canada Income in Canada 1998 Catalogue No 75-202-XIE 256
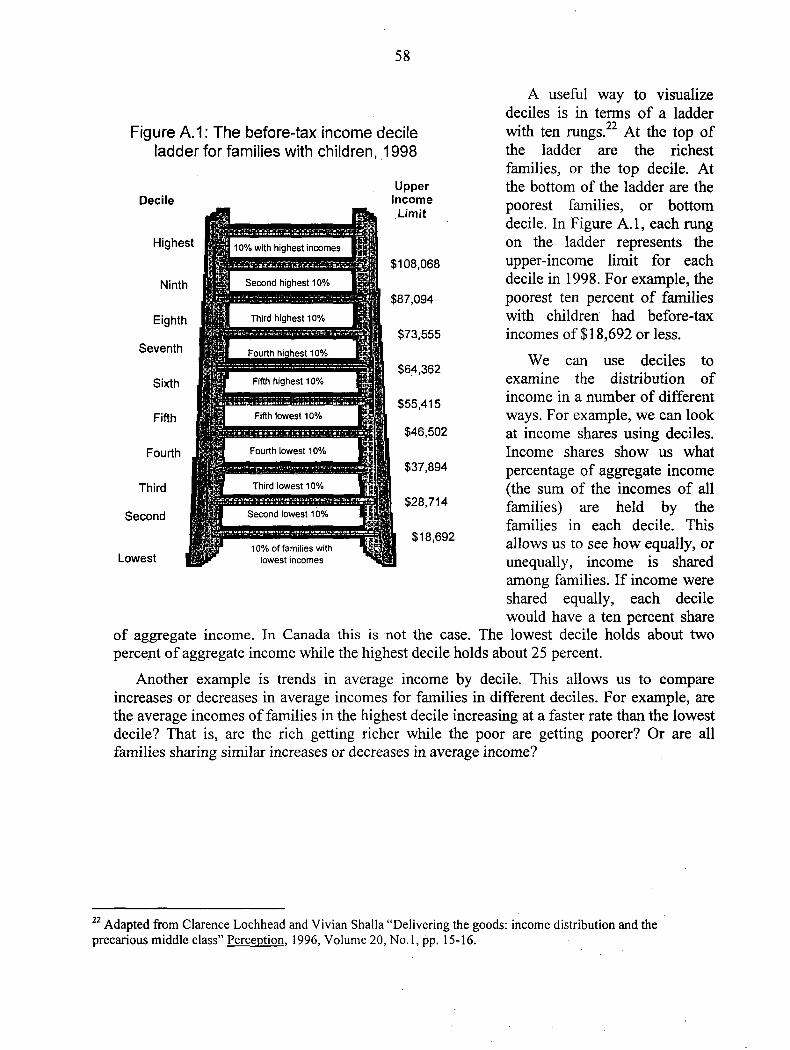
58
useful way to visualize
deciles is in terms of ladder
with ten rungs.22 At the top of
the ladder are the richest
families or the top decile At
the bottom of the ladder are the
poorest families or bottom
decile In Figure A.1 each rung
on the ladder represents the
upper-income limit for each
decile in 1998 For example the
poorest ten percent of families
with children had before-tax
incomes of $18692 or less
We can use deciles to
examine the distribution of
income in number of different
ways For example we can look
at income shares using deciles
Income shares show us what
percentage of aggregate income
the sum of the incomes of all
families are held by the
families in each decile This
allows us to see how equally or
unequally income is shared
among families If income were
shared equally each decile
Figure The before-tax income decile
ladder for families with children 1998
Upper
Decile Income
Limit
Highest
$108068
Ninth
$87094
Eighth
$73555Seventh
$64362Sixth
$55415Fifth
$46502
Fourth
$37894
Third
$28714Second
Lowest
$18692
would have ten percent share
of aggregate income In Canada this is not the case The lowest decile holds about two
percent of aggregate income while the highest decile holds about 25 percent
Another example is trends in average income by decile This allows us to compare
increases or decreases in average incomes for families in different deciles For example are
the average incomes of families in the highest decile increasing at faster rate than the lowest
decile That is are the rich getting richer while the poor are getting poorer Or are all
families sharing similar increases or decreases in average income
22
Adapted from Clarence Lochhead and Vivian Shalla Delivering the goods income distribution and the
precarious middle class Perception 1996 Volume 20 No.1 pp 15-16
59
APPENDIX COMPARISON TO OTHER NATIONAL COUNCILOF WELFAREPUBLICATIONS
The National Council of Welfare publishes an annual statistical profile of poverty in
Canada called Poverty Profile Poverty statistics in thisreport will differ slightly from those
in Poverty Profile 1998 because of two technical updates
This is the first report published by the Council that adopts the more commonly used and
published 1992 base low income cutoff Previous issues of Poverty Profile used the 1986
base LICOs The methodology used to set the 1992 base low income cutoffs is the same as
the methodology used to set the 1986 base low income cutoffs that were used in previous
Council publications However the 1986 survey data estimated average expenditures on
food shelter and clothing at 36.2 percent of total income so it was assumed that low-income
people would spend 56.2 percent or more of their income on these three necessities The 1992
base LICOs assume that low-income Canadians spent 54.7 percent or more on food shelter
and clothing
The second technical update is the incorporation of Statistics Canadas revision of low
income data for the period 1980 to 1993 Statistics Canada revised its low income data for the
period 1980 through 1993 in the 1994 version of Income Distributions by Size in Canada
The revisions included shifting population estimates to the 1991 census base adjusting the
estimates to correct under coverage and including non-permanent residents physically
present in Canada The revisions had very little effect on rates of poverty but they tended to
add slightly to the number of people living in poverty
For the 1994 to 1998 editions of Poverty Profile the National Council of Welfare decided
as general rule to continue using the data for earlier years as originally published In this
report all data has been updated to reflect the revisions made for the years 1980-1993
60
MEMBERS OF THE NATIONAL COUNCILOF WELFARE
Mr John Murphy Chairperson
Canning Nova Scotia
Mr Armand Brun Vice-Chairperson
Shediac New Brunswick
Ms Doris Bernard Radisson Quebec
Ms Judy Burgess Victoria British Columbia
Ms Olive Crane Mt Stewart Prince Edward Island
Ms Anne Gill Hay River Northwest Territories
Ms Miriam Green Montreal Quebec
Ms Alice Hanson Edmonton Alberta
Ms Allyce Herle Regina Saskatchewan
Mr David Northcott Winnipeg Manitoba
Ms Marilyn Peers Halifax Nova Scotia
Ms Shaunna Reid Mount Pearl Newfoundland
Mr Abdi Ulusso Etobicoke Ontario
Dr David Welch Ottawa Ontario
Director Joanne Roulston
Senior Researcher Cathy Oikawa
Administration and Information Officer Louise Gunville
Administrative Assistant Claudette Mann
61
NATIONAL COUNCIL OF WELFARE
The National Council of Welfare was established by the Government
Organization Act 1969 as citizens advisory body to the federal
government It advises the Minister of Human Resources Development
on matters of concern to low-income Canadians
The Council consists of members drawn from across Canada and
appointed by the Governor-in-Council All are private citizens and serve
in their personal capacities rather than as representatives of organizations
or agencies The membership of the Council has included past and
present welfare recipients public housing tenants and other low-income
people as well as educators social workers and people involved in
voluntary or charitable organizations
Reports by the National Council of Welfare deal with wide range of
issues on poverty and social policy in Canada including income security
programs welfare reform medicare poverty lines and poverty statistics
the retirement income system taxation labour market issues social
services and legal aid
On peut se procurer des exemplaires en francais de toutes les
publications du Conseil national du bien-Øtre social en sadressant
au Conseil national du bien-Œtre social 9e Øtage 112 rue Kent
Ottawa Ontario K1A 0J9 sous notre site web au
wwwncwcnbes.net ou sous forme de courrier electronique au
ncwmagi.com