THE ASSOCIATION OF POVERTY WITH CHILD WELFARE SERVICE AND CHILD AND FAMILY CLINICAL OUTCOMES
26
The Association of Poverty with Child Welfare Service and Child and Family Clinical Outcomes 1 Alan W. Leschied, Ph.D., Debbie Chiodo, M.A., Paul C. Whitehead, Ph.D., and Dermot Hurley, M.S.W. The University of Western Ontario London, Ontario CANADA October 2003 1 This research project is funded by the City of London, the County of Middlesex, an anonymous donor through United Way, and United Way of London & Middlesex.
-
Upload
independent -
Category
Documents
-
view
1 -
download
0
Transcript of THE ASSOCIATION OF POVERTY WITH CHILD WELFARE SERVICE AND CHILD AND FAMILY CLINICAL OUTCOMES

The Association of Poverty with Child Welfare Service and Child and Family Clinical Outcomes 1
Alan W. Leschied, Ph.D., Debbie Chiodo, M.A., Paul C. Whitehead, Ph.D., and
Dermot Hurley, M.S.W.
The University of Western Ontario
London, Ontario CANADA
October 2003
1 This research project is funded by the City of London, the County of Middlesex, an anonymous donor through United Way, and United Way of London & Middlesex.

Abstract The influences of poverty, family status and violence in the lives of children and families
seen at a large urban children’s aid society are investigated. Comparative rates of social
assistance dependency of child welfare families between 1995 and 2001 are reported.
While the rate of poverty of child welfare families is stable across the two time periods,
the ability of families to cope with poverty has dramatically changed, with the percentage
of children from impoverished families being admitted into care nearly doubling across
the six-year period. Violence as a mitigating factor in the relationship between poverty,
the extent of child welfare service and child and family outcomes is also reported.
Suggestions for enabling women who are caught in the complexity of choosing between
physical safety and poverty are reported.
KEYWORDS: Poverty, violence, child protection
2

Introduction Long-term disadvantage due to poverty is related to numerous poor life course outcomes.
These range from decreased academic performance and limited vocational success, to
health related concerns, violence and childhood adjustment disorders (Driscoll & Moore,
1999; Bagley & Malick, 2000). Negative life events, such as the presence of family
violence and child adjustment disorders associated with poverty can also be precipitants
to children coming to the attention of child welfare authorities. The purpose of this study
is to address the relationship of poverty to service and clinical outcomes within a sample
of children seen at a children’s aid society.
1.1 Rates of Poverty Nationally Numerous authors have noted that despite the world economic resurgence of the 1990s,
poverty rates actually increased in the majority of industrialized countries – including
Canada – during this period (Bradbury, Jenkins & Micklewright, 2001; Vleminckx &
Smeeding, 2001). In Ontario, the number of children coming to the attention of the
children’s aid society also increased dramatically during the same time period (Rivers,
Trocmé, Goodman & Marwah, 2002). The relationship of poverty and the increased
demand for child welfare services in Ontario in recent years is an obvious theme to track
as a potential contributor to this increase. This paper reviews the rates of poverty
nationally and locally. Studies reporting the link between the effects of poverty with
child outcomes and the differential contribution that poverty plays in placing children in
the child welfare system at risk in the context of family risk factors such as child
maltreatment and family violence are presented.
1.1.2 Rates of poverty in Canada, Ontario and London
Ridge (2002) indicates that based on the 1996 Canadian census, Canada ranks sixth in
child poverty rates on a list of the world’s twenty-five most industrialized countries.
Data suggests that one out of every five children in Canada resides in a home that reports
incomes below the poverty line2 (Canadian Council on Social Development, 2002). The
number of low income families, defined by Statistics Canada as families spending greater
2 The rate of poverty used in Canada is based on the Low Income Cut-off (LICO) scale.
3
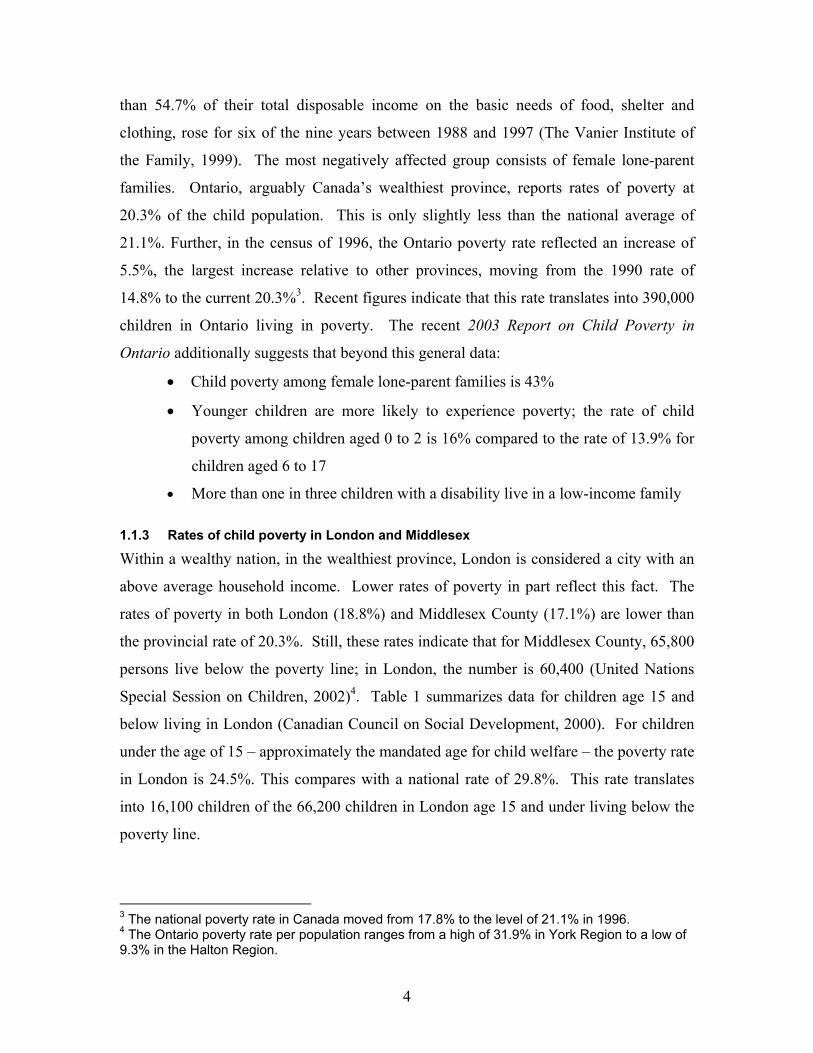
than 54.7% of their total disposable income on the basic needs of food, shelter and
clothing, rose for six of the nine years between 1988 and 1997 (The Vanier Institute of
the Family, 1999). The most negatively affected group consists of female lone-parent
families. Ontario, arguably Canada’s wealthiest province, reports rates of poverty at
20.3% of the child population. This is only slightly less than the national average of
21.1%. Further, in the census of 1996, the Ontario poverty rate reflected an increase of
5.5%, the largest increase relative to other provinces, moving from the 1990 rate of
14.8% to the current 20.3%3. Recent figures indicate that this rate translates into 390,000
children in Ontario living in poverty. The recent 2003 Report on Child Poverty in
Ontario additionally suggests that beyond this general data:
• Child poverty among female lone-parent families is 43%
• Younger children are more likely to experience poverty; the rate of child
poverty among children aged 0 to 2 is 16% compared to the rate of 13.9% for
children aged 6 to 17
• More than one in three children with a disability live in a low-income family
1.1.3 Rates of child poverty in London and Middlesex
Within a wealthy nation, in the wealthiest province, London is considered a city with an
above average household income. Lower rates of poverty in part reflect this fact. The
rates of poverty in both London (18.8%) and Middlesex County (17.1%) are lower than
the provincial rate of 20.3%. Still, these rates indicate that for Middlesex County, 65,800
persons live below the poverty line; in London, the number is 60,400 (United Nations
Special Session on Children, 2002)4. Table 1 summarizes data for children age 15 and
below living in London (Canadian Council on Social Development, 2000). For children
under the age of 15 – approximately the mandated age for child welfare – the poverty rate
in London is 24.5%. This compares with a national rate of 29.8%. This rate translates
into 16,100 children of the 66,200 children in London age 15 and under living below the
poverty line.
3 The national poverty rate in Canada moved from 17.8% to the level of 21.1% in 1996. 4 The Ontario poverty rate per population ranges from a high of 31.9% in York Region to a low of 9.3% in the Halton Region.
4

Table 1 Proportion of London Children Age 15 and Below Living in Poverty
Proportion of Children Poverty Rate (%)
In City Population
Total Poor Total Poor
All Cities 2,325,000 693,7000 19.1 23.3 29.8
London 66,200 16,100 20.6 26.6 24.3
1.2 The Relevance of Poverty with Child Welfare Why are these data relevant? Recent data reported by Trocmé and Chamberland (2003)
indicates that fluctuations in child welfare rates are sensitive to shifts in poverty rates.
Child neglect cases are particularly sensitive to poverty rates. In an Ontario child welfare
sample, 44% of neglect cases were dependant on social assistance compared with 27% of
other forms of maltreatment; neglect cases also reported higher rates of living instability
reflected in family moves – 32% – compared with 20% for other cases of child
maltreatment.
There are numerous stressors related to living in poverty that impact parenting
ability and, subsequently, a child’s development. Recent evidence suggests, however,
that the link between poverty and poor child outcomes may not be direct; that is,
additional social and family structure variables may play important roles in mediating this
link. The following section summarizes the recent literature that relates poverty and child
outcomes along with identification of the mediating variables that influence this
relationship. Finally, evidence that relates to variables associated with the likelihood of
children coming to the attention of the children’s aid society, such as family violence and
child maltreatment, and their association with socioeconomic status is presented.
1.2.1 Poverty and child outcomes
The literature relating poverty to child outcomes reflects three major themes. The first
theme relates child development directly to factors intrinsic to families living in poverty.
These studies include factors such as nutrition and brain development suggesting poverty
5

and, specifically, poor nutrition, places children at risk for later learning, behavioural and
developmental challenges (Galler, Ramsay, Solimano & Lowell, 1983; Mustard, 1999;
Tanner & Finn-Stevenson, 2002).
A second theme suggests that the instability of living arrangements and
homelessness due to poverty place children at increased risk (Bassuk, 1996; Bassuk et.
al., 1997). This may reflect the inability of children to receive consistent educational
opportunities and parent(s) to develop a social network of support to buffer parental
stress.
Thirdly, a more encompassing framework within which to view the effects of
poverty on children is provided by Avison et al. (1994). These authors suggest that the
‘pernicious’ effects of poverty are such that the financial strain results in the combined
effects of caregiver strain, lack of social support, lowered self-esteem and maternal
distress resulting in childhood vulnerabilities reflected in both internal and external
problems.
Researchers have examined the specific child outcomes associated with poverty.
Guo (1998) and Tanner, Driscoll and Moore (1999) relate socioeconomic status and child
outcomes, indicating that children in families living on welfare show poorer performance
on measures of cognitive performance and behaviour ratings. Willms (2001) noted from
the National Longitudinal Study on Children and Youth (NLSCY) that low
socioeconomic status was related to behavioural disorders in 4 to 12 year olds; poor
vocabulary development in preschoolers; and mathematics literacy in primary and
intermediate school-age students.
1.2.2 Poverty, family structure and child outcomes
What is the strength of the effect of poverty on child outcomes? To this point, the
literature might appear to suggest that poverty alone contributes the greatest variance
accounting for poor child and family outcomes. There is an additional line of research,
however, that places poverty within a broader social context. Kerr and Beujot (2001), for
example, in comparing the family structures of intact, step and lone parents note that
poverty plays a differential role as a function of family structure. With measures of
hyperactivity, emotional disorder, aggression, and property offenses, children within lone
and step families experience the greatest degree of disorder. Kerr and Beujot (2001) and
6

Kowaleski-Jones (1999) suggest that families in ‘deep poverty’5, have increasing
difficulties exiting low income due low education levels and inadequate day care that are
necessary to create a link to employment opportunities. This is of particular relevance to
families involved with the child welfare system since, as noted by Trocmé et al. (2001)
child maltreatment in Canada is particularly related to “… the major environmental
conditions of which low socio-economic status and housing conditions play a significant
role” (p. 29).
1.2.3 Poverty, family violence and child maltreatment
Not only are families involved in the child welfare system more prone to experience the
harsh conditions of poverty and poor housing, but they are also more likely to experience
violence. There are two suggested hypotheses to account for the relationship between
socioeconomic status and rates of child maltreatment. First, Gelles (1989) suggests the
“parent-absent” hypothesis reflects a lack of social support and the consequent social
isolation increases the stress on a lone parent to meet the demands of childcare. This
“economic-deprivation” hypothesis reflects the inability of parents to meet basic needs
such as housing, creating instability that can lead to increasing stress on adults resulting
in parental violence. Second, Gelles & Conte (1990) note that a change in the rate of
child maltreatment is consistent with the change in character and structure of the family
and the change in the economy. Krishnan & Morrison (1995), in testing this human
ecology theory to understand child maltreatment, situated child abuse within a broader
social context suggesting, “child abuse is not an individual or isolated family problem but
a community problem most often related to the social and economic situation of the
locale” (p. 109). These authors note that increases in poverty, typically reflected in an
increase in single parent, female-lead households, also reflects increases in social
isolation and compromised abilities to meet basic child care needs.
1.2.4 Family violence, dependency and poverty
Finally, the association of poverty and family violence also reflects the difficulty of
abused women to escape male batterers due to economic dependency. This fact has the
result of forcing women to choose to either continue to expose children to the trauma of 5 Deep poverty refers to families and adults who experience long-standing disadvantage reflected in low income and welfare dependency.
7

family violence or to a life of extreme poverty and residential instability. Related
research by the authors highlights the trauma experienced by children as a result of their
exposure to inter-adult violence within the family home (Chiodo, Leschied, Whitehead &
Hurley, 2003). Davis (1999) indicates that battered women are “often subject to
complete control and financial isolation by their batterers… few victims have the
resources necessary to begin a new life for themselves and their children” (p. 21).
Frequently the decision to leave an abusive situation destines the woman and her children
to a life of poverty, or deeper poverty than what she previously experienced (Raphael,
1999).
1.3 Purpose The purpose of this study is to examine the link between poverty and a number of child
and family outcomes within a sample of children seen at a children’s aid society.
1.4 Hypotheses The following hypotheses serve as the basis for investigation relating poverty within a
sample of children in a child welfare population. Similar to other research in the area of
child welfare, this study uses the presence of social assistance in the lives of the adults
parenting children as the operational definition of poverty.
The first set of hypotheses examines data in the years 1995 and 2001.
1. Rates of social assistance for adults in the lives of children at the CAS will
increase from 1995 to 2001.
2. Poverty will be more highly related to children presenting with neglect as
opposed to other forms of child maltreatment.
The following hypotheses focus on children seen at the Children’s Aid Society in 2001.
3. Children from families on social assistance will have poorer outcomes as
measured by diagnoses of emotional and behavioural disorders, repeating a
school grade, suspensions, and chronic truancy from school compared to
children from families not on social assistance.
4. Children from families on social assistance will have higher risk scores as
measured on the Ontario Child Welfare Risk Indicator overall and higher
8

scores in particular on the factors related to neglect compared to children from
families not on social assistance.
5. Children with single mothers who are receiving social assistance will have
higher risk scores compared to children with single mothers not on social
assistance.
6. Children with single mothers who are receiving social assistance and who also
experience inter-adult violence will have higher risk scores on the Ontario
Child Welfare Risk Indicator compared to children with single mothers not
receiving social assistance.
7. Children with single mothers who are receiving social assistance and who also
experience inter-adult violence are more likely to be on wardship status
compared to children whose mothers are neither on social assistance nor
experience inter-adult violence.
8. Finally, regression analysis will identify the proportion of variance accounted
for separately by histories of violence, social assistance, and single
motherhood as they relate to child outcomes as reported on the Ontario Child
Welfare Risk Indicator.
Method
2.1 Participants Participants in this study are 693 children from families seen at a local children’s aid
society. These cases constitute a subset of an initial sample that consists of 1,042
children randomly selected from 2,316 child protection cases from 1995 and 2001. Cases
are selected only where the family’s social assistance status was available from the case
history information (n = 693). While the sampling was random, this method of sampling
does not guarantee that the composition of the combined samples for each year is
representative of the proportion of children seen at CAS for child protection reasons. In
order to compensate for this, the data are weighted in each year such that the sample, as
analysed, contains the same proportion of children taken into care, as was the case for the
total population of cases for the years from which they were drawn.
9

To examine the relationship of poverty on child and family outcomes, poverty is
defined in two ways: 1) the child’s caregiver is unemployed; and 2) the child’s caregiver
is receiving social assistance or welfare6. The comparison group are those children
whose caregivers are employed in a professional, skilled, or unskilled professions, and
are not receiving any government financial assistance7.
For the vast majority of cases, the data collected on the caregiver’s poverty status
refers to the child’s mother as the primary caregiver (84%). For the remaining cases
(16%), the child’s caregiver refers to either the father or an extended family
member/friend.
The sub-sample of children in 1995 consists of 262 children, of whom 170 (65%)
have a caregiver receiving social assistance and 92 (35%) have a caregiver who is
employed. The sub-sample of children in 2001 consists of 431 children, of whom 275
(64%) have a caregiver receiving social assistance and 156 (36%) have a caregiver who is
employed. Inconsistent with expectations, the proportion of caregivers receiving social
assistance does not differ between 1995 and 2001 (65% vs. 64%) (x2 = .083, df = 1, ns).
Additionally, the proportion of single mothers receiving social assistance does not differ
between 1995 and 2001 (x2 = 3.67, df = 1, ns) (Table 2).
Family violence is defined as cases of substantiated abuse or maltreatment of the
child (i.e., physical abuse, sexual abuse, neglect, and children exposed to violence in the
family home), violence against the mother, or a combination of abuse/maltreatment
towards the mother and child. Consistent with expectations, single mothers experiencing
family violence are more likely receiving social assistance in 2001 (84%) than are single
mothers experiencing family violence in 1995 (63%) (x2 = 7.12, df = 1, p< .01)
The sub-sample of children with caregivers receiving social assistance in 1995
consists of 79 (47%) children admitted to CAS care. In 2001, the sub-sample of children
with caregivers receiving social assistance consists of 220 (80%) children admitted to
CAS care. Consistent with expectations, a larger proportion of children with caregivers
receiving social assistance are in the care of CAS in 2001 compared to 1995 (80% vs.
6 From herein, caregivers who are unemployed and receiving social assistance/welfare are referred to as caregivers receiving social assistance. 7 From herein, caregivers who are employed and not receiving social assistance/welfare are referred to as caregivers who are employed.
10

47%) (x2 = 52.6, df = 1, p< .001). There is a significantly larger proportion of cases of
neglect for children with caregivers receiving social assistance in 2001 (86%) compared
to cases of neglect for children with caregivers receiving social assistance in 1995 (56%)
(x2 = 8.5, df = 1, p< .01) (Table 2). Subsequent analyses on child and family outcomes
are performed on the data collected in 2001 (n = 432).
Table 2 Percentages of Caregivers Receiving Social Assistance in 1995 and 2001
Caregivers Receiving Social Assistance
1995
2001
All Caregivers (n = 693) 65% 64%
Single Mothers (n = 191)
71%
83%
Single Mothers and Experiencing Violence (n = 117)* 84% 63%
Children in Care (n = 299)** 47% 80%
Cases of Neglect (n = 62)* 56% 86%
*p< .01; **p< .001
2.2 Materials Child protection files from the CAS of London and Middlesex were reviewed. A
standardized coding instrument was created by the authors to guide the extraction of
information from each case file. Information recorded about the family included current
and historical family information, as well as the history of the family’s mental health, the
family’s history with the CAS, family violence and access to social services. Information
on children included past and present access to mental health, young offender,
educational, and developmental services, as well as outcomes related to psychological,
behavioural, developmental, and academic concerns. The sample is of cases opened in
11
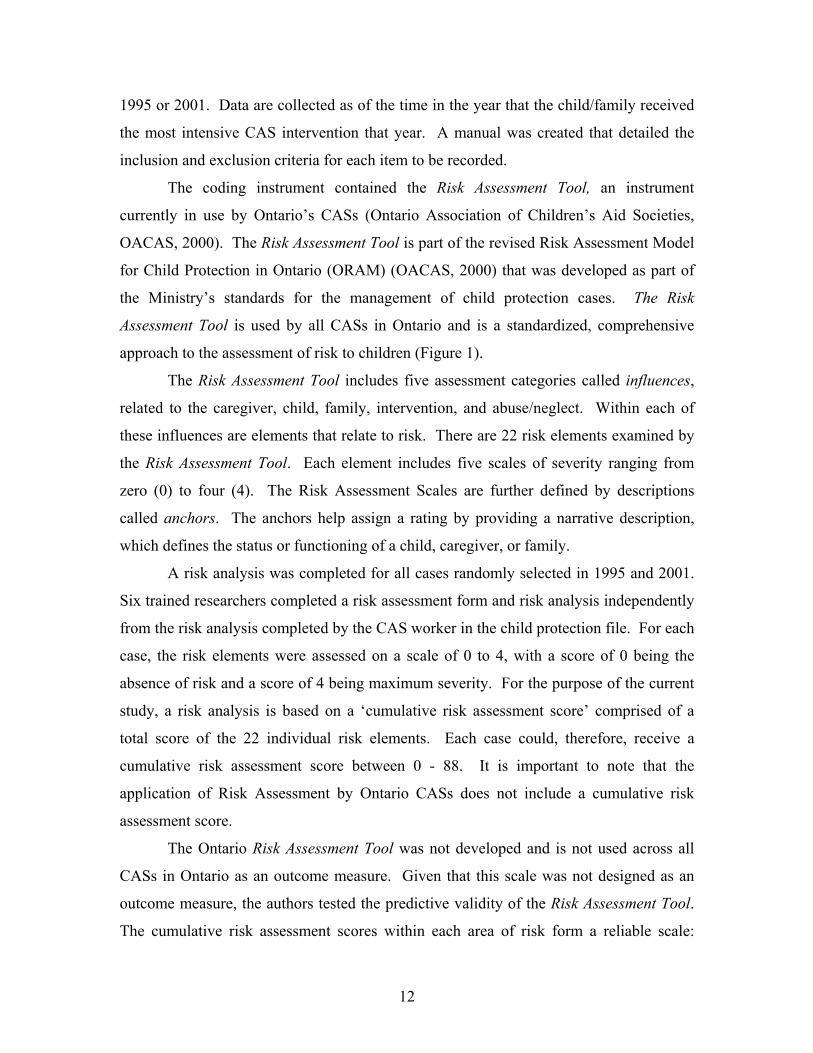
1995 or 2001. Data are collected as of the time in the year that the child/family received
the most intensive CAS intervention that year. A manual was created that detailed the
inclusion and exclusion criteria for each item to be recorded.
The coding instrument contained the Risk Assessment Tool, an instrument
currently in use by Ontario’s CASs (Ontario Association of Children’s Aid Societies,
OACAS, 2000). The Risk Assessment Tool is part of the revised Risk Assessment Model
for Child Protection in Ontario (ORAM) (OACAS, 2000) that was developed as part of
the Ministry’s standards for the management of child protection cases. The Risk
Assessment Tool is used by all CASs in Ontario and is a standardized, comprehensive
approach to the assessment of risk to children (Figure 1).
The Risk Assessment Tool includes five assessment categories called influences,
related to the caregiver, child, family, intervention, and abuse/neglect. Within each of
these influences are elements that relate to risk. There are 22 risk elements examined by
the Risk Assessment Tool. Each element includes five scales of severity ranging from
zero (0) to four (4). The Risk Assessment Scales are further defined by descriptions
called anchors. The anchors help assign a rating by providing a narrative description,
which defines the status or functioning of a child, caregiver, or family.
A risk analysis was completed for all cases randomly selected in 1995 and 2001.
Six trained researchers completed a risk assessment form and risk analysis independently
from the risk analysis completed by the CAS worker in the child protection file. For each
case, the risk elements were assessed on a scale of 0 to 4, with a score of 0 being the
absence of risk and a score of 4 being maximum severity. For the purpose of the current
study, a risk analysis is based on a ‘cumulative risk assessment score’ comprised of a
total score of the 22 individual risk elements. Each case could, therefore, receive a
cumulative risk assessment score between 0 - 88. It is important to note that the
application of Risk Assessment by Ontario CASs does not include a cumulative risk
assessment score.
The Ontario Risk Assessment Tool was not developed and is not used across all
CASs in Ontario as an outcome measure. Given that this scale was not designed as an
outcome measure, the authors tested the predictive validity of the Risk Assessment Tool.
The cumulative risk assessment scores within each area of risk form a reliable scale:
12

Cronbach’s alpha ranges from .71 - .79. The cumulative risk assessment scores were
consistent with clinical judgment (i.e., the decision to admit a child to CAS care) ranging
from 74% to 81% of all cases. A detailed review on the empirical basis of the Risk
Assessment Tool appears in Leschied, Chiodo, Whitehead, Hurley & Marshall (2003).
Figure 1 Summary of Areas for Risk Assessment
1. Caregiver Influence Abuse – Neglect
Alcohol/Drug Use Expectations of child Acceptance of child Physical capacity to care for child Mental/Emotional/Intellectual Capacity 2. Child’s Influence Child’s vulnerability Child’s response to caregiver Child’s behaviour Child’s mental health and development Physical health and development 3. Family Influence Family violence Ability to cope with stress Availability of social supports Living conditions Family identity and interactions
4. Intervention Influence Caregiver’s motivation Caregiver’s cooperation with intervention
5. Abuse/Neglect
Access to child by perpetrator Intention and acknowledgement of responsibility Severity of abuse/neglect History of abuse/neglect/Neglect committed by present caregivers
2.3 Procedure Five trained researchers working under the supervision of a project manager collected the
data. To enhance reliability, the researchers received training prior to the beginning of
13

data collection. Senior managers of the CAS of London and Middlesex and the research
team met on a weekly basis to review concerns related to the file information, risk
assessment analysis, or data collection procedures to ensure consistency in data
interpretation and collection.
The CAS workers do not compute or document a cumulative risk assessment
score based on their ratings of the 22 risk elements of the Risk Assessment Tool when
completing a Risk Analysis for child protection cases. The CAS worker’s ratings of the
individual risk elements are, however, recorded in the child protection files. Thus, it is
possible to compute a cumulative risk assessment score from the ratings of the CAS
worker. A reliability analysis of the cumulative risk assessment scores rated by the
researchers and the cumulative risk assessment scores by the CAS workers was
performed for 253 cases. Inter-rater reliability between the cumulative risk assessment
scores rated by the researchers and the cumulative risk assessment scores derived from
the ratings of CAS workers is extremely high (Cronbach’s alpha = .86).
Results
3.1 Participant Characteristics Children with caregivers receiving social assistance are significantly younger in age than
are children with caregivers who are employed [F(1, 420) = 62.36, p< .001]. The
proportion of gender does not differ between children with caregivers receiving social
assistance and children with caregivers employed (x2 = .002, df = 1, p> .1) (Table 3).
3.2 Child Psychopathology Outcomes Two behavioural outcomes and one psychological outcome are considered: identification
of an attention deficit hyperactivity disorder (ADHD), conduct disorder, and the primary
psychological (emotional) concern of the child. Information on whether the child was
currently (or previously) on medication for an adjustment-related disorder is also
reported.
The association between the caregiver’s poverty status and the child adjustment
variable is assessed using chi-square (x2) analyses. Unexpectedly, children with care-
givers receiving social assistance do not differ significantly on the proportion diagnosed
with ADHD (x2 = 1.44; df = 1; ns), compared to children with caregivers who are
14

employed. Inconsistent with predictions, children with caregivers who are employed are
more likely to be diagnosed with conduct disorder (x2 = 7.24; df = 1; p< .01), than are
children with caregivers receiving social assistance. There are no significant differences
between children with caregivers receiving social assistance and children with caregivers
employed on the proportion identified with a primary psychological (emotional) concern
(x2 = .204; df = 1; ns), or on medication for an adjustment related disorder (x2 = 1.46; df =
1; ns) (Table 3).
Table 3 Child Outcomes for Caregivers on Social Assistance and Caregivers Employed
Measure Caregivers on Social Assistance (n = 275)
Caregivers Employed (n = 156 )
Age of childa (in years)** 5.8 (4.7) 9.5 (4.6)
Males 47.6% 47.4%
Females 52.4% 52.6%
Child Psychopathology
ADHD 16% 21%
Conduct Disorder* 6% 13%
Psychological Concern 7% 6%
Medication 14% 19%
School History (n = 237)
Repeated Grade 6% 8%
Chronic Absence 25% 23%
Expelled 1.6% 0%
Risk Assessmentb
Cumulative Risk Assessment Score** 32.17 (12.4) 26.1 (12.4)
Note: a = mean age of child in years; standard deviations are in parentheses b = mean cumulative risk scores; higher scores indicates greater intensity and nature of risk standard deviations are in parentheses. *p< .01; **p < .001
15

3.3 Child Outcomes Related to Academic Concerns To determine whether the caregiver’s poverty status is related to the child’s school
history concerns, three variables are used to characterize the child’s academic experience:
1) evidence that the child has repeated a grade; 2) chronic truancy from school; and 3)
whether the child was ever expelled from school. School history was obtained from
school records in the child-protection files. Children under 6 years of age are excluded
from this analysis because they are not attending school. Analyses below reflect a sub-
sample of 237 school-aged children.
Inconsistent with expectations, children with caregivers receiving social
assistance and children with caregivers employed do not differ on the proportion having
repeated a grade (x2 = .41; df = 1; ns), having been expelled from school (x2 = 1.9; df = 1;
ns), or experiencing chronic truancy from school (x2 = .06; df = 1; ns) (Table 2).
3.4 Child Outcomes Related to the Intensity and Nature of Risk The level of risk to which the child is exposed is measured by the Risk Assessment Tool
(Ontario Association of Children’s Aid Societies, 2000), an instrument that is part of the
provincial strategy to assess and predict the level of risk of harm to the child. Each risk
element includes a five-point scale of severity ranging from zero to four. A cumulative
risk assessment score, comprised of a total score of the 22 risk elements was used as a
measure of risk to which the child is exposed.
Analysis of covariance (ANCOVA) is used to determine how the caregiver’s
poverty status relates to the child’s risk assessment scores. Age is used as a covariate
because children with caregivers receiving social assistance are significantly younger
than children with caregivers who are employed.
As expected, children with caregivers receiving social assistance score higher on
overall risk [F (1,690) = 43.4, p< .001], and higher on cumulative risk [F (1,690) = 36.6,
p< .001], compared to children with caregivers who are employed (Table 3).
To determine the relative contribution of the individual risk assessment items that
account for the higher cumulative risk scores of children with caregivers receiving social
assistance, a stepwise discriminant function analysis on the scores of the 22 risk items is
performed. When these variables are forced into a discriminant function, 11 items that
relate almost exclusively to the caregiver, family, and intervention influence scales
16

accurately classify 78% of the participants overall (Canonical correlation of .59, Wilk’s
lambda of .652; p< .001). These 11 items accurately classify 235 (85%) of the children
with caregivers receiving social assistance. The discriminant function based on these 11
items incorrectly classify 35% of the children with caregivers receiving social assistance
when, in fact, their caregivers are employed. Table 4 provides the results of this analysis
and the correlations between the risk assessment item scores and the discriminant
function.
Table 4 Discriminant Function of Risk Assessment Items Related to Caregiver’s Poverty Status Step Risk Items Wilks’
lambda df Univariate
F p r
1 Intervention Influence/ Caregiver’s Motivation
.885 1 55.6 < .001 .49
2 Child’s Influence/ Child’s Vulnerability (i.e., age of child)
.824 2 45.6 < .001 .46
3 Caregiver Influence/Physical Capacity to Care for Child
.765 3 43.8 < .001 .39
4 Family Influence/Ability to Cope with Stress
.744 4 36.7 < .001 .45
5 Caregiver Influence/ Acceptance of Child
.715 5 33.8 < .001 -.05
6 Abuse/Neglect Influence/ History of Abuse/Neglect
.702 6 30.0 < .001 .38
7 Abuse/Neglect Influence/ Access to Child by Perpetrator
.686 7 27.7 < .001 .02
8 Family Influence/ Availability of Social Supports
.676 8 25.30 < .001 .41
9 Family Influence/ Family Identity and Interactions
.668 9 23.25 < .001 .28
10 Child’s Influence/ Response to Caregiver
.659 10 21.78 < .001 -.258
11 Intervention Influence/ Caregiver’s Co-Operation with Intervention
.652 11 20.34 < .001 .19
17

3.5 Poverty and Family Structure To examine whether the caregiver’s poverty status relates to the child’s cumulative risk
assessment score when the influences of single motherhood are considered, an ANCOVA
is performed on the child’s risk assessment score and the caregiver’s poverty status
variable. Single motherhood is used as a covariate to determine whether the caregiver’s
poverty status plays a differential role as a function of family structure.
The results of this analysis find that children with caregivers receiving social
assistance score higher on cumulative risk [F (1, 420) = 32.6, p< .001], compared to
children with caregivers who are employed (Table 4).
3.6 Poverty, Family Structure and Family Violence The effects of single motherhood, family violence, and the caregiver’s poverty status on
the child’s risk assessment score are considered. The variables, family violence and
single motherhood are used as covariates. This analysis allows us to determine whether
the caregiver’s poverty status relates to the child’s cumulative risk score, while the
influences of family violence and single motherhood are statistically held constant.
The results of this analysis find that children with caregivers receiving social
assistance score higher on cumulative risk [F (1,419) = 26.35, p< .001], compared to
children with caregivers who are employed (Table 5).
Table 5 Means and Standard Deviations of the ANCOVA Results of the Children’s Risk Assessment Scores Caregivers on Social
Assistance (n = 261) Caregivers Employed (n = 162)
Cumulative Risk Assessment Score**
32.67 (11.83) 25.38 (12.32)
** p< .001
3.7 Predictors of Child Risk To identify which factors best predict the child’s cumulative risk assessment score, the
data are analyzed using a step-wise multiple regression method. The predictor variables
are: caregiver’s poverty status, single motherhood, and family violence.
18

Two key predictors of the child’s cumulative risk score are identified. The most
significant predictor of a child’s risk score is family violence, followed by the caregiver’s
poverty status variable. Together, these variables account for a modest (12.9%) of the
variance in the child’s cumulative risk score (Table 6).
Table 6 Regression Analyses
Criteria
Model
R change
R
F change
dF
Sign
Cumulative Risk
Score Family Violence .076 .076 35.3 1,429 < .001
Family Violence, Poverty Status
.053 .129 26.2 1,428 < .001
3.8 Discussion The purpose of this study is to address the role that poverty plays in the lives of families
and children referred to a large urban children’s aid society. The first part of the
investigation reflects the stable rate across years of almost two thirds of the children seen
at the children’s aid society having parents who are on some form of social assistance.
While the rate of social assistance dependency has not changed, however, there is
indication that the ability of parents to cope with poverty and child-rearing has. The
percentage of children who are in the care of the CAS increased from almost half of the
children in care coming from poor families in 1995 to eight of ten children in 2001
coming from families who are on social assistance.
Several indicators of cumulative risk noted in previous research were family
structure and the presence of violence in the lives of primary caregivers (Avison et al.,
1994; Kerr & Beojot, 2001). There is evidence that, while the number of families in the
CAS who are on social assistance has not increased, increases are noted in major indices
of cumulative risk associated with poverty across those years. The number of single
mothers on social assistance increased from a rate of 71% in 1995 to 83% in 2001.
Similarly, the rate of single mothers having children in care increased from 46% to 77%.
Further, there is evidence that increasing numbers of women who are the child’s primary
19

caregiver are coping with violence. Taken together, these findings suggest that the vast
majority of parents in poverty whose children come to the attention of the child welfare
agency are single women who cope with some form of violence and have a greater
likelihood that their child will be brought into care. Increasingly, these children are more
likely to present with neglect when compared to children seen in 1995.
Evidence from the present study also identified that children in poverty are rated
as higher risk on dimensions of particular relevance to child welfare authorities overall,
although they do not present with higher rates of general childhood psychopathology.
Specifically, the areas of risk relate to challenges in parenting as opposed to outcomes
associated with children. These include an inability of parents to protect their child(ren)
from known perpetrators, questionable caregiver motivation to pursue treatment, and a
difficulty with the family’s ability to cope with stress.
4.1 Interventions The literature that relates intervention for children and families in poverty is large and
tends to focus on either the necessity for broad structural changes at the societal level to
reduce the extent of poverty, or assisting individuals to cope at the very immediate
personal and interpersonal level. Examples from the literature on each of these targets
will be presented.
4.1.1 Structural changes
A number of commentaries exist challenging federal Canadian policy on the lack of
commitment and will to deal effectively with child poverty. The erstwhile commitment
of the federal government to end child poverty by the year 2000 (a commitment made in
the late 1980s) has been unsuccessful. Indeed the national rate of child poverty has been
unchanged since the early part of the last decade. The federal government has made
some changes to improve the circumstances of children and families who live in poverty.
One example is the National Child Benefit (2001), which aims to “prevent and reduce the
depth of child poverty in Canada, promote labour market attachment ensuring that
families will always be better off as a result of working” (p. 1). Additional changes that
have been discussed such as the need for more and higher quality day care and a
guaranteed annual income, however, has drawn more rhetoric than action.
20

4.1.2 Programs of a specific nature
What is beginning to attract increasing attention is the focus on programs targeted at the
individual level to assist individuals out of poverty or mitigate the effects of children who
experience poverty. Some of these programs are general in nature and provide
stimulation and learning at an early age to counter the effects of an under-stimulating
environment. Programs such as Better Beginnings, Better Futures (Peters et al., 2000),
and the Early Years Centres in Ontario (Mustard, 1999) would fall into this category.
Other programs fall more directly from the findings of the present study that
address issues within families rather than specific concerns within the child. Some of
these initiatives are of more specific relevance to children and families involved in the
child welfare system. These programs are linked to the evidence-based literature that
targets the dynamics that tie individuals to economic disparity thereby increasing child
risk. Raphael (2002) in addressing the relationship of domestic violence to welfare urges
plans that allow women more time and access to services before mandating work in order
to keep them and their children safe. The state of Minnesota provides for therapeutic
assistance for women who have been out of the workforce for reasons such as domestic
violence and mental health concerns as part of their welfare to work transition (Gennetian
& Miller, 2002). Rodger (2003) has recently advocated for a specific educational
intervention to assist women out of economic dependency due to domestic violence
through access to specialized curriculum resources geared to the grade nine and ten level
in order to assist them in developing academic competency and personal confidence.
4.2 Conclusion This study investigated the relationship between poverty, child welfare services and
outcomes related to children and families who come to the attention of a children’s aid
society. A comparison of poverty rates between 1995 and 2001 indicates a stable rate of
almost two-thirds of families on social assistance. Families coping with poverty,
however, have changed dramatically, reflected in the almost doubling in the rate of
children who are admitted to care in 2001 who come from welfare dependant families.
One of the major factors is related to the increasing number of welfare dependant single
mothers whose lives are characterized by violence. Indeed, while modest in the overall
variance accounted for, violence accounts for slightly more variance than does poverty in
21

predicting admissions to child welfare care. Clearly, the relationship between poverty,
violence and family structure is complex and requires further study. Overall, poverty
rates are not decreasing despite government rhetoric to the contrary. The development of
programs that relate specifically to assisting women out of their economic dependant
relationships that are also characterized by violence, that is to the detriment of both these
women and their children, is of clear necessity.
22

References Avison, W.R., Speechly, K.N., Thorpe, C.T., Gotlib, I.H., Rae Grant, N.I. & Turner, J.
(1994). Single parenthood, poverty, and the health of mothers and children: A
stress process analysis. In M.W. Rosenberg (ed.), Health and Behaviour 1994:
Papers and Proceedings. Kingston, ON: Queen’s University.
Bagley, C. & Mallick, K. (2000). Prediction of sexual, emotional, and physical
maltreatment and mental health outcomes in a longitudinal cohort of 290
adolescent women. Child Maltreatment, 5(3), 218 - 226.
Bassuk, E.L., Rubin, L. & Lauriat, A. (1996). Characteristics of sheltered homeless
families. American Journal of Public Health, 76, 1097 - 1101.
Bassuk, E.L., Buckner, J.C., Weinraub, L.F., Browen, A., Bassuk, S.S., Dawson, R. &
Perloff, J. (1997). Homelessness in female-headed families: Childhood and
adult risk and protective factors. American Journal of Public Health, 87(2), 241 -
248.
Bradbury, B., Jenkins, S.P. & Micklewright, J. (eds.) (2001). The dynamics of child
poverty in industrialized countries. Cambridge University Press: Cambridge UK.
Canadian Council on Social Development. (2000). The Canadian fact book on poverty
2000.
Canadian Council on Social Development. (2002). Child poverty rates by province,
Canada, 1990 - 1996.
Chiodo, D., Leschied, A.W., Whitehead, P. & Hurley, D. (manuscript under review).
The impact of violence on child outcomes in a child welfare population:
Implications for intervention.
Davis, M.F. (1999). The economics of abuse: How violence perpetuates women’s
poverty. (pp. 17 - 29). In R.A. Branbdwein (ed.) Battered women, children, and
welfare reform: The ties that bind. Thousand Oaks, CA: Sage Publ.
Driscoll, A.K. & Moore, K.A. (1999). The relationship of welfare receipt to child
outcomes. Journal of Family and Economic Issues, 20(1), 85 - 113.
Galler, J.R., Ramsay, F., Solimano, G. & Lowell, W. (1983). The influence of early
23

malnutrition on subsequent behavioural development: II. Classroom behavior.
Journal of the American Academy of Child Psychiatry, 22, 16 - 22.
Gelles, R.J. (1989). Child abuse and neglect in single parent families. American Journal
of Orthopsychiatry, 59(4) 492 - 500.
Gelles, R.J. & Conte, J.R. (1990). Domestic violence and sexual abuse in the family.
Journal of Marriage and the Family, 52, 1045 - 1058.
Gennetian, L.A. & Miller, C. (2002). Children and welfare reform: A view from an
experimental welfare program in Minnesota. Child Development, 73(2), 601 -
620.
Guo, G. (1998). The timing of the influences of cumulative poverty on children’s
cognitive ability and achievement. Social Forces, 77(1), 257 - 287.
Kowaleski-Jones, L. (1999). Welfare receipt and family structure: evaluating the effects
on children’s reading achievement. Sociological Focus, 32, 181 - 200.
Kerr, D. & Beajor, R. (2001). Family relations, low income and child outcomes: A
comparison of Canadian children in intact, step and lone parent families.
London ON: Population Studies Centre, The University of Western Ontario.
Krishnan, V. & Morrison, K.B. (1995). An ecological model of child maltreatment in a
Canadian province. Child Abuse and Neglect, 19(1), 101 - 113.
Mustard, F. (1999). Countering the ‘real’ brain drain. Toronto ON: Ministry of
Community and Social Services.
Pancer, S.M., Nelson, G., Dearing, B., Dearing, S., Hayward, K. & Peters, R. DeV. (In
press). Promoting wellness in children and families through community-based
interventions: The Highfield Enrichment Project (Better Beginnings, Beter
Futures). In Kufeldt, K. & McKenzie, B. (eds.). Child Welfare: Connecting
research, policy, and practice. Waterloo, Ontario: Wifrid Laurier University
Press.
Peters, R. DeV., Arnold, R., Petrunka, K., Angus, D.E., Brophy, K., Burke, S.O.,
Cameron, G., Evers, S., Herry, Y., Levesque, D., Pancer, S.M., Roberts-Fiati, G.,
Towson, S. & Warren, W.K. (2000). Developing capacity and competence in the
better beginnings, better futures communities: Short-term findings report.
24

Kingston, Ontario: Better Beginnings, Better Futures Research Coordination Unit
Technical Report.
Rapheal, J. (1999). Keeping women poor: How domestic violence prevents women
from leaving welfare and entering the world of work. (pp. 31 - 43). In R.A.
Branbdwein (ed.) Battered women, children, and welfare reform: The ties that
bind. Thousand Oaks, CA: Sage Publ.
Raphael, J. (2002). Keeping battered women safe during welfare reform: New
challenges. Journal of the American Medical Women’s Association, 57(1), 32 -
35.
Report on Child Poverty in Ontario. (2003). (author: Campaign 2000: Toronto ON.)
Ridge, T. (2002). Child poverty and social exclusion. Bristol, UK: The Policy Press.
Rivers, B., Trocmé, N., Goodman, D. & Marwah, I. (2002). Reporting and beyond:
Current trends in childhood neglect call for broader reforms. Voices for Children
Newsletter – Child Abuse and Neglect in Ontario, 5, 1 - 10. Voices for Children:
Toronto, ON.
Rodger, S. (2003). Bridges: Women’s link to learning and independence. Community
Mobilization Program. London, ON.
Tanner, E.M. & Finn-Stevenson, M. (2002). Nutrition and brain development: Social
policy implications. American Journal of Orthopsychiatry, 72(2), 182 - 193.
The Vanier Institute of the Family. (1999). Contemporary family trends: The current
state of Canadian family finances, 1999 Report.
Trocmé, N. & Chamberland, C. (2003). Re-involving the community: The need for a
differential response to rising child welfare caseloads in Canada. Paper pre-
sented at the Fourth National Child Welfare Symposium, Community
Collaboration and Differential Response. Banff Alberta, March 20 - 21.
Trocmé, N. & Wolfe, D.A. (2001). Child maltreatment in Canada: Canadian incidence
study of reported child abuse and neglect, selected results. Ottawa, ON: Health
Canada.
United Nations Special Session on Children. (2002). Putting Promises in to Action: A
report on a decade of child and family poverty in Canada. May 2002, UN: New
York, NY.
25

26
Vleminckx, K. & Smeeding, T.M. (2001). Child well-being, child poverty and child
policy in modern nations (ed). The Policy Press: Abingdon, Oxon.