Minority Disparities in Disability Between Medicare Beneficiaries
Upload
independentCategory
view
0download
0
1
Statistical Evaluation of Socio-Demographic disparities in Madhya
Pradesh – Maternal and Child Health Care and Welfare Perspectives
B.S.Kambo* and Dr.Kulwinder Kaur**
Introduction: Socio-economic development is an integrated process which requires
simultaneous progress on a number of fronts to improves the quality of life of people. Development
of social sector along with technology absorption in agriculture ,industry and services which are the
principal sectors of our economy, could be considered as the primary objective of any economic
developmental efforts. Economic backwardness and economic development always have their
meaningful co-existence. It is observed that some of the countries develop more swiftly in their socio
economic conditions compared to others. Similar is the situation for different regions within the
same country or State. The health ,education and income are three essential aspects of human
development. A well designed public policy and programme can advance human development even
without high level of income or economic growth ( UNDP,2004)1 . An indicator system understands
the linkages between economic strength and better quality of life. By deconstructing the components
of district growth into discrete measurements, we can articulate the main drivers of economic
progress, which in turn, reveal the necessary preconditions for a rising standard of living. The
indicator system also serves as a tool for decision makers in government and social sectors like
Health, Education, etc. It identifies both problems and opportunities for policymakers and business
leaders, and indicates possible initiatives for improvement. Used consistently over time, indicators
can help track changes and trends in economic performance, thereby revealing where policy might
best be employed to spur ongoing improvements in districts’ quality of life.
The 73rd and 74th amendments of constitution ushered the decentralization of planning and
as such the district of the state become the focus point of planning and implementation.
Decentralized district-based health planning is essential in India because of large inter-district
variations. In the absence of vital data at district level , the state level estimates are being used for
formulating district level plans as well as setting the milestones thereof. In the process, the hotpots
(districts requiring special attention) very often gets masked by the State average. This statistical
fallacy compounds the problems of the districts acutely. The state level figures of index has its own
limitation in the policy formulation, especially for Madhya Pradesh where socio- cultural,
demographic and economic milieus are diversified. To minimize such limitation one needs to adopt
the measures that capture disparities in respect of human well-being where appropriate policy
* B.S.Kambo, former Deputy Director, DGE&T, Ministry of Labour and Employment, New Delhi. At present,
Deputy Director on Contract in a Project “Annual Health Survey” in the Office of Registrar General and
Census Commissioner of India , New Delhi. Email: [email protected]
** Dr. Kulwinder Kaur Assistant Professor in Hindu College, University of Delhi, Delhi.

2
action are very much essential at the district level to identify of strategies to handle the
backwardness existing in health and education .
The proposed change in the system and the process warrants availability of data and
information at district level to facilitate job of district functionaries and elected representatives. More
so in the health sectors. Keeping this in view, the present study deals with the study of disparities
among districts of Madhya Pradesh regarding certain indicators relating to fertility, mortality,
maternal and child health care and welfare perspectives.
Number of authors like Dasgupta2 (1971) Rao3 (1973), Rao4 (1977), and Narian5 et.el (1991)
attempted to identify the backward states and districts by the factor analysis approach. Gulati6 (1991)
Iyengar and Sudarshan7 (1982) attempt to classify regions using multivariate data relating to the
major development basing on composite index method and using Beta distribution. During 1984-85
to 1986--87 Iyengar-Sudarshan methods was attempted to measure the overall level of district along
with its development at the sectoral level in Orissa.
Iyengar-Sudarshan method rests as follows:
(i) Transform the indicator variables to keep their values between 0 and 1.
(ii) Take weighted linear combinations of these transformed values, where the weights
are inversely proportional to standard deviations.
(iii) Compute the weighted values for the sub-regions, which obviously lie between 0 and
1.
(iv) Fit a theoretical Beta distribution, which is positively skewed distribution in the range
0 to 1, to these weighted values and classify the sub-region according to percentage
cut off points.
Swain8 (2010) has pointed has the following drawbacks in the Iyengar-Sudarshan method
(i) The method fails when the indicators of development are correlated. In that situation
the weights need to be modified.
(ii) The method uses weights, which are inversely proportional to standard deviations
which seem to be arbitrary, because the best linear combination of independent
variable uses weights which are inversely proportional to variances.
(iii) Further, the assumption that the linear combination of variables which vary between 0
and 1 follows a theoretical Beat distribution has no justification, unless theoretically or
empirically proved, although in a developing region large regional disparities give rise
to relatively more sub-regions at a lower stage of development. As the development
process moves ahead, large disparities tend to diminish and as such the skewness in
the distribution.

3
These observation on Iyengar-Sudarshan method suggest that one might search for an
alternative statistical method to classify the sub-regions according to stages of development
Mohanti9 and Ram (2001), Ram10 and Chander Sekhar (2006), have developed different ranking
techniques including Multivariate ones to rank the districts / states of the country. Prem11 et.el (2007)
have developed composite indices of developments for Statistical Evaluation of Socio-economic
Development of different States in India. Swain et.al (2010) had used the principal component
analysis approach (based on 13 indicators which are almost subset of indicators used in this study)
and classified the districts of Orissa according to the differential level of development by computing
an index of simple average of the principal components .In the present study, principal component
analysis approach has been used to identify the districts of Madhya Pradesh by computing average
index of Principal components.
Objective of study: The present study has the following objectives
I. To study the disparities among district of Madhya Pradesh regarding certain indicators
relating to maternal and child care and welfare perspectives
II. To study the spatial distribution of development in Madhya Pradesh at district level
III. To classify the district according to different levels of development by computing an index
using Principal Component analysis approach
IV. We hypothesis that vital indicators must shows down ward trend as we move from
backward districts to developed districts where as the socio economic indicators must
shows upward trend as we move from backward district to forward districts provided the
districts are correctly classified by the index.
Sources of data: The study is based on secondary data collected from publication namely
“Annual Health Survey Bulletin12 (2010-11) - Madhya Pradesh”, Population census13 2011 and
District Level Household and Facility Survey14-2007-08 Madhya Pradesh.
Annual Health Survey ( AHS): This survey was conceived at the behest of National Commission
on Population, Prime Minister Office and Planning Commission to provide bench mark basic vital
and health indicators such as Crude Birth rate ( CBR), Crude death rate ( CDR), Infant Mortality rate
( IMR) , Total fertility rate ( TFR) , Maternal Mortality Ratio , Sex Ratio at birth and hosts other
indicators on Maternal & Child care , family planning practices etc. and to map change therein on
year to year basis at district level in all the 284 districts of Empowered Action Group ( EAG) of eight
states viz. Bihar, Jharkhand, Madhya Pradesh, Chhattisgarh, Orissa ,Rajasthan, Uttar Pradesh and
Uttrakhand including Assam (Called AHS States).These nine AHS states constitute 48% of
country‘s population, 59% of birth, 70% of Infant death and 75% of mortality under five and 62 % of
maternal death . The mid reference period of base line AHS was 1.7.2008 since data collected
through this survey relates to period of three years from 1.1.2007 to 31.12.2009 and the field work
was carried out during the period from June 2010 to March 2011. AHS in Madhya Pradesh
4
surveyed 2557 sample units (villages in Rural area and block in the urban areas) comprises of 2.284
millions sample population and on an average number of 456800 households .
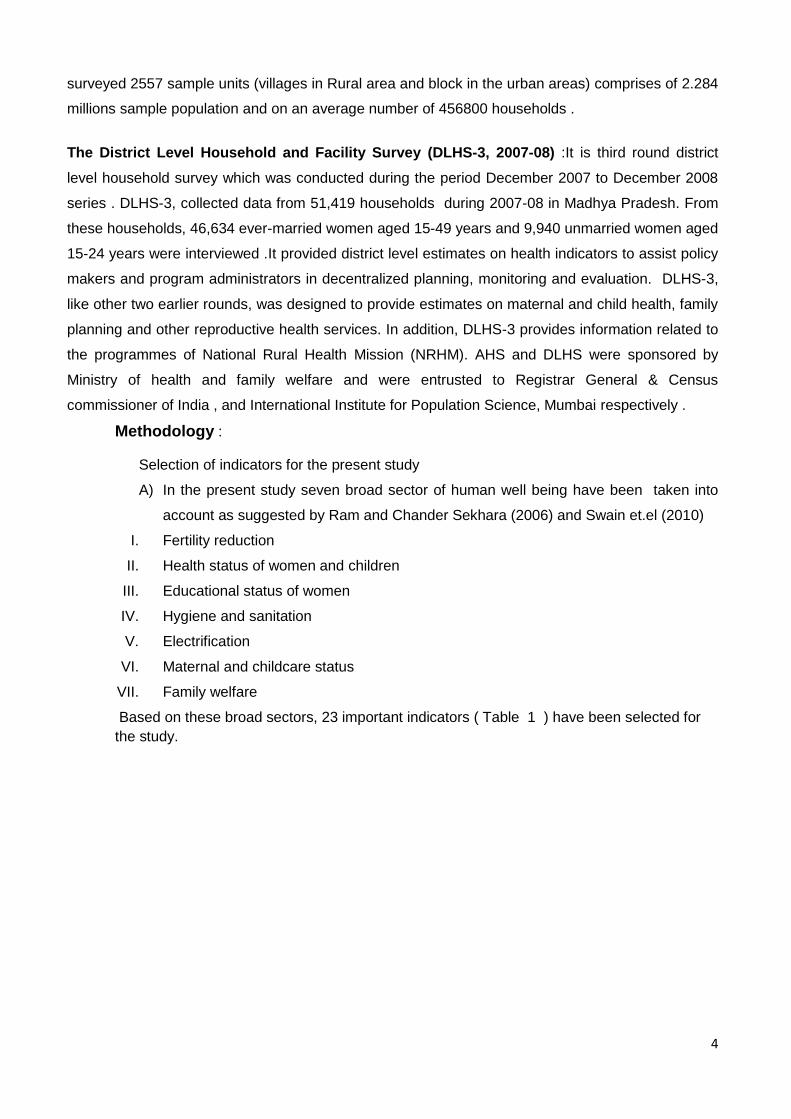
The District Level Household and Facility Survey (DLHS-3, 2007-08) :It is third round district
level household survey which was conducted during the period December 2007 to December 2008
series . DLHS-3, collected data from 51,419 households during 2007-08 in Madhya Pradesh. From
these households, 46,634 ever-married women aged 15-49 years and 9,940 unmarried women aged
15-24 years were interviewed .It provided district level estimates on health indicators to assist policy
makers and program administrators in decentralized planning, monitoring and evaluation. DLHS-3,
like other two earlier rounds, was designed to provide estimates on maternal and child health, family
planning and other reproductive health services. In addition, DLHS-3 provides information related to
the programmes of National Rural Health Mission (NRHM). AHS and DLHS were sponsored by
Ministry of health and family welfare and were entrusted to Registrar General & Census
commissioner of India , and International Institute for Population Science, Mumbai respectively .
Methodology :
Selection of indicators for the present study
A) In the present study seven broad sector of human well being have been taken into
account as suggested by Ram and Chander Sekhara (2006) and Swain et.el (2010)
I. Fertility reduction
II. Health status of women and children
III. Educational status of women
IV. Hygiene and sanitation
V. Electrification
VI. Maternal and childcare status
VII. Family welfare
Based on these broad sectors, 23 important indicators ( Table 1 ) have been selected for
the study.

5
Table1 : Showing indicators , their definitions , variable and source of data
Sl.no. Indicator Definitions Variables Source
1 Crude birth rate It measures number of live births per 1000 population in mid reference period
X1 Annual Health Survey bulletin-
Madhya Pradesh 2010-11 Registrar
General and Census Commissioner of
India (RGCC), New Delhi
2 Crude death rate It measures number of death per 1000 population in mid reference period
X2
3 Maternal mortality rate It measure maternal death per 100000 women in the age group 15-49 in the mid reference period
X3
4 Neo natal mortality rate It measures number. of infant death< 29 days per 1000 live births in the mid reference period.
X4
5 Post neo natal mortality rate
It measures number of infant deaths of 29 days to < 1 year per 1000 live birth during the mid reference year.
X5
6 Infant mortality rate It measures number of infant( < 1 year) deaths per 1000 live births in mid reference period.
X6
7 Under five mortality (U5MR)
It denotes number of children (0-4 years) who died before reaching their fifth birthday per 1000 live births
X7
8 Maternal Mortality Ratio
It measures number of women aged 15-49 years dying due to maternal causes per 1,00,000 live births.
X8
9 Sex ratio at birth No. of female at birth per 1000 males at birth
X9
10 Sex ratio(0 -4) No. of female age group 0-4 per 1000 age group 0-4 males
X10
11 Female literacy X11 Census2011(RGCC)
12 Percent of house hold with electricity X12 District Level Household and Facility Survey
( DLHS-3) -2007-08 Madhya Pradesh,
International Institute of
Population Studies , Mumbai
13 Percent of household with drinking water X13
14 Percent of household with toilet facility X14
15 Percent of household using LPG X15
16 Percent of house hold living in Pucca house X16
17 Percent of house hold having BPL Card X17
18 Percent of women received any anti natal Care X18
19 Contraceptive prevalence rate X19
20 Percentage of women having children Birth Order 4+ X20
21 Percent of women (15-49) having received three or more antenatal check-up
X21
22 Percent of women ( 15-49) received at least one tetanus toxoid injection
X22
23 Percent of children (12-23) months received full Immunization X23

6
(B) Method: In this study, Principal Analysis (PCA) has been used ( SPSS17 version 18.0) to measure district
wise development differential at various principal components levels as well as the aggregate level of
development. PCA is a multivariate statistical technique to find a few uncorrelated linear combination of
original variables which can be used to summarize the data, loosing as little information as possible. In
mathematical terms, from an initial set of n correlated variables, PCA creates uncorrelated indices or
components, where each component is a linear weighted combination of the initial variables. For example,
from a set of variables X1 through to Xn,
PC1 = a11X1 + a12X2 +_ _ _+a1nXn
PCm = am1X1 + am2X2 +_ _ _+amnXn
where amn represents the weight for the mth principle component and the nth variable. The uncorrelated
property of the components is highlighted by the fact they are orthogonal , i.e. at right angles to each other,
which mean the indices are measuring different dimensions in the data .The weights for each principal
component are given by the eigenvectors of the correlation matrix, or if the original data were standardized,
the co-variance matrix. The variance λ for each principal component is given by the eigenvalue of the
corresponding eigenvector. The components are ordered so that the first component (PC1) explains the largest
possible amount of variation in the original data, subject to the constraint that the sum of the squared weights
(a2
11 + a2
12 +_ _ _ a2
1n) is equal to one. As the sum of the eigen values equals the number of variables in the
initial data set, the proportion of the total variation in the original data set accounted by each principal
component is given by λ i / n. The second component (PC2) is completely uncorrelated with the first
component, and explains additional but less variation than the first component, subject to the same constraint.
Subsequent components are uncorrelated with previous components; therefore, each component captures an
additional dimension in the data, while explaining smaller and smaller proportions of the variation of the
original variables. Thus , it is a technique to transform the original data set of variables into smaller set of
independent linear combination so that most of the variation in the original data is explained by those linear
combination. The linear combinations so selected are called Principal Components. The objective of this
analysis is to reduce the number of variables into a few ones that can explain most of the variance of the
original data set. We have verified that our data satisfies all the criterions need for applying principal
component analysis as detailed below:
a. It requires that Measure of Sampling Adequacy ( MSA) be greater than 0.5 for each
individual variable and set of variable for retention of all the variables On iteration 1, the MSA for all
the variables included in the analysis was greater than 0.5 since the diagonal elements of anti-
image correlation matrix was found to be greater than 0.5. In addition, the overall MSA for set of 23
variables was 0.735 which exceeds the minimum requirement of 0.5 for overall MSA ,thus
supporting the retentions all the 23 indicators in the analysis initially .(see table 2)
b. Two thing with respect to correlation matrix are important one, the variable have to be
intercorrelated but should not be correlates too high ( extreme multi collinearity and singularity) It

7
requires that probability associated with Bartlet’s test of sphercity be less than level of
significance. In other words it test the null hypothesis H0 : that the original correlation matrix is an
identity against the alternative hypothesis H1 that it is not an identity matrix. The probability
associated with Bartlet’s test of sphercity was found to be 0.000, we took 001 instead of 0.000 to
be clear that the probability is not really zero, which is less than the level of significance 0.01.
Thereby rejecting the null hypothesis that correlation matrix is not an identity matrix. Since the
value of the determinant of correlation matrix is greater than 0.00001 therefore there is no
multicollnearity ( Field 2000)18 .
c. The correlation coefficients between some of the variables should be more than 0.3. Our
data shows that there are several correlation coefficients which are greater than 0.3 ( table 4)
Table 2 KMO and Bartlett's Test
Kaiser-Meyer-Olkin Measure of Sampling Adequacy.
.735
Bartlett's Test of Sphericity
Approx. Chi-Square
1418.865
df 253
Sig. .000
( C ) Data and analysis: District - wise estimates of the indicators selected for the study
are shown in the table 3 A and 3B

8
T ABLE 3A : SOCIO-DEMOGRAPHIC_ INDICATORS Sl.No. DISTRICTS X1 X2 X3 X4 X5 X6 X7 X8 X9 X10 X11
1 2 3 4 5 6 7 8 9 10 11 12 13
1 SHEOPUR 22.7 7.4 31.0 42 31 74 101 311 972 960 44.5
2 MORENA 23.6 7.9 31.0 36 28 64 87 311 857 787 57.6
3 BHIND 23.7 6.6 31.0 29 23 53 66 311 877 848 64.0
4 GWALIOR 18.5 6.2 24.0 35 17 51 69 262 807 815 68.3
5 DATIA 19.8 6.6 24.0 43 32 75 99 262 848 817 60.2
6 SHIVPURI 31.3 9.4 24.0 45 26 71 105 262 891 873 49.5
7 GUNA 28.7 8.5 24.0 48 31 79 96 262 853 864 52.5
8 TIKAMGARH 26.3 7.4 47.0 48 19 67 91 397 890 900 50.7
9 CHHATARPUR 29.8 8.0 47.0 51 21 72 89 397 885 925 54.3
10 PANNA 31.7 11.5 47.0 66 27 93 140 397 972 975 55.6
11 SAGAR 28.3 9.1 47.0 58 13 70 97 397 844 906 67.7
12 DAMOH 29.2 10.7 47.0 61 19 80 117 397 937 956 59.9
13 SATNA 28.8 10.5 37.0 63 28 90 130 336 929 910 63.4
14 REWA 26.0 8.2 37.0 48 25 73 102 336 950 945 62.5
15 UMARIA 29.9 10.7 44.0 48 20 67 110 435 946 965 56.1
16 SHAHDOL 24.5 10.1 44.0 49 28 77 92 435 967 978 58.2
17 SIDHI 26.1 7.8 37.0 54 18 72 118 336 918 928 55.2
18 NEEMUCH 22.4 6.1 23.0 38 21 59 75 268 942 913 57.3
19 MANDSAUR 19.0 7.1 23.0 37 27 64 85 268 910 907 58.3
20 RATLAM 27.3 7.8 23.0 40 26 66 96 268 886 884 56.5
21 UJJAIN 24.4 6.4 23.0 33 26 59 77 268 933 913 61.4
22 SHAJAPUR 24.9 8.3 23.0 41 20 60 86 268 886 909 56.4
23 DEWAS 21.8 5.6 23.0 34 25 59 80 268 909 935 58.3
24 JHABUA 24.0 5.8 26.0 40 29 68 92 278 942 927 34.3
25 DHAR 25.0 6.2 26.0 34 22 57 70 278 939 903 49.7
26 INDORE 19.6 5.5 26.0 25 15 40 51 278 862 882 74.9
27 WEST NIMAR 26.2 11.6 26.0 35 22 58 80 278 870 909 53.7
28 BARWANI 32.2 11.6 26.0 42 27 69 94 278 972 964 43.1
29 EAST NIMAR 23.6 8.1 26.0 45 23 68 101 278 895 913 56.5
30 RAJGARH 26.3 7.8 27.0 42 21 63 83 287 896 937 49.8
31 VIDISHA 29.9 9.6 27.0 52 19 72 101 287 885 882 61.7
32 BHOPAL 19.2 5.8 27.0 28 22 50 64 287 912 934 76.6
33 SEHORE 27.8 7.9 27.0 46 24 70 87 287 929 947 58.9
34 RAISEN 28.2 7.9 27.0 54 24 78 99 287 929 952 65.1
35 BETUL 24.3 9.0 26.0 48 20 68 79 296 845 868 61.6
36 HARDA 25.0 7.2 26.0 42 22 64 80 296 924 953 64.3
37 HOSHANGABAD 22.2 7.7 26.0 49 18 68 80 296 918 931 67.0
38 KATNI 27.6 10.3 27.0 50 20 70 93 310 977 1,010 62.5
39 JABALPUR 21.9 6.1 27.0 36 15 51 58 310 835 877 75.3
40 NARSIMHAPUR 27.5 7.6 27.0 47 22 68 77 310 894 932 67.6
41 DINDORI 30.0 10.7 44.0 47 24 72 104 435 1,006 986 53.5
42 MANDLA 26.0 8.7 27.0 48 23 71 89 310 990 989 57.2
43 CHHINDWARA 23.4 8.3 27.0 49 23 72 85 310 898 910 63.4
44 SEONI 26.4 9.6 27.0 50 23 73 92 310 924 912 64.1
45 BALAGHAT 23.2 9.2 27.0 50 16 66 78 310 968 971 69.7
MEAN 25.5 8.2 30.3 44.6 22.8 67.4 89.9 312 912 918 59.1
STANDARD DEVIATION 3.5 1.7 8.1 9.0 4.4 9.9 17.4 51 45 47 8.3
MAXIMUM 32.2 11.6 47.0 66.0 32.0 93.0 140.0 435 1006 1010 76.6
MINIMUM 18.5 5.5 23.0 25.0 13.0 40.0 51.0 262 807 787 34.3
RANGE 13.7 6.1 24.0 41.0 19.0 53.0 89.0 173 199 223 42.3
9
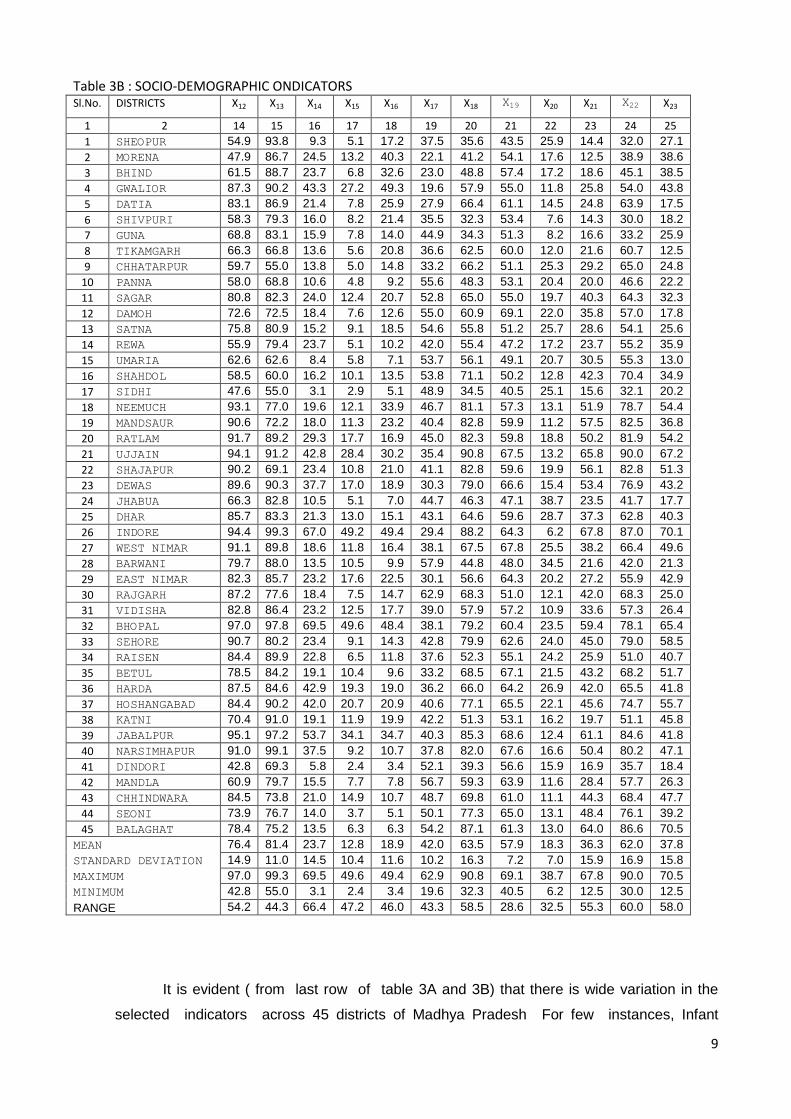
Table 3B : SOCIO-DEMOGRAPHIC ONDICATORS Sl.No. DISTRICTS X12 X13 X14 X15 X16 X17 X18 X19 X20 X21 X22 X23
1 2 14 15 16 17 18 19 20 21 22 23 24 25
1 SHEOPUR 54.9 93.8 9.3 5.1 17.2 37.5 35.6 43.5 25.9 14.4 32.0 27.1
2 MORENA 47.9 86.7 24.5 13.2 40.3 22.1 41.2 54.1 17.6 12.5 38.9 38.6
3 BHIND 61.5 88.7 23.7 6.8 32.6 23.0 48.8 57.4 17.2 18.6 45.1 38.5
4 GWALIOR 87.3 90.2 43.3 27.2 49.3 19.6 57.9 55.0 11.8 25.8 54.0 43.8
5 DATIA 83.1 86.9 21.4 7.8 25.9 27.9 66.4 61.1 14.5 24.8 63.9 17.5
6 SHIVPURI 58.3 79.3 16.0 8.2 21.4 35.5 32.3 53.4 7.6 14.3 30.0 18.2
7 GUNA 68.8 83.1 15.9 7.8 14.0 44.9 34.3 51.3 8.2 16.6 33.2 25.9
8 TIKAMGARH 66.3 66.8 13.6 5.6 20.8 36.6 62.5 60.0 12.0 21.6 60.7 12.5
9 CHHATARPUR 59.7 55.0 13.8 5.0 14.8 33.2 66.2 51.1 25.3 29.2 65.0 24.8
10 PANNA 58.0 68.8 10.6 4.8 9.2 55.6 48.3 53.1 20.4 20.0 46.6 22.2
11 SAGAR 80.8 82.3 24.0 12.4 20.7 52.8 65.0 55.0 19.7 40.3 64.3 32.3
12 DAMOH 72.6 72.5 18.4 7.6 12.6 55.0 60.9 69.1 22.0 35.8 57.0 17.8
13 SATNA 75.8 80.9 15.2 9.1 18.5 54.6 55.8 51.2 25.7 28.6 54.1 25.6
14 REWA 55.9 79.4 23.7 5.1 10.2 42.0 55.4 47.2 17.2 23.7 55.2 35.9
15 UMARIA 62.6 62.6 8.4 5.8 7.1 53.7 56.1 49.1 20.7 30.5 55.3 13.0
16 SHAHDOL 58.5 60.0 16.2 10.1 13.5 53.8 71.1 50.2 12.8 42.3 70.4 34.9
17 SIDHI 47.6 55.0 3.1 2.9 5.1 48.9 34.5 40.5 25.1 15.6 32.1 20.2
18 NEEMUCH 93.1 77.0 19.6 12.1 33.9 46.7 81.1 57.3 13.1 51.9 78.7 54.4
19 MANDSAUR 90.6 72.2 18.0 11.3 23.2 40.4 82.8 59.9 11.2 57.5 82.5 36.8
20 RATLAM 91.7 89.2 29.3 17.7 16.9 45.0 82.3 59.8 18.8 50.2 81.9 54.2
21 UJJAIN 94.1 91.2 42.8 28.4 30.2 35.4 90.8 67.5 13.2 65.8 90.0 67.2
22 SHAJAPUR 90.2 69.1 23.4 10.8 21.0 41.1 82.8 59.6 19.9 56.1 82.8 51.3
23 DEWAS 89.6 90.3 37.7 17.0 18.9 30.3 79.0 66.6 15.4 53.4 76.9 43.2
24 JHABUA 66.3 82.8 10.5 5.1 7.0 44.7 46.3 47.1 38.7 23.5 41.7 17.7
25 DHAR 85.7 83.3 21.3 13.0 15.1 43.1 64.6 59.6 28.7 37.3 62.8 40.3
26 INDORE 94.4 99.3 67.0 49.2 49.4 29.4 88.2 64.3 6.2 67.8 87.0 70.1
27 WEST NIMAR 91.1 89.8 18.6 11.8 16.4 38.1 67.5 67.8 25.5 38.2 66.4 49.6
28 BARWANI 79.7 88.0 13.5 10.5 9.9 57.9 44.8 48.0 34.5 21.6 42.0 21.3
29 EAST NIMAR 82.3 85.7 23.2 17.6 22.5 30.1 56.6 64.3 20.2 27.2 55.9 42.9
30 RAJGARH 87.2 77.6 18.4 7.5 14.7 62.9 68.3 51.0 12.1 42.0 68.3 25.0
31 VIDISHA 82.8 86.4 23.2 12.5 17.7 39.0 57.9 57.2 10.9 33.6 57.3 26.4
32 BHOPAL 97.0 97.8 69.5 49.6 48.4 38.1 79.2 60.4 23.5 59.4 78.1 65.4
33 SEHORE 90.7 80.2 23.4 9.1 14.3 42.8 79.9 62.6 24.0 45.0 79.0 58.5
34 RAISEN 84.4 89.9 22.8 6.5 11.8 37.6 52.3 55.1 24.2 25.9 51.0 40.7
35 BETUL 78.5 84.2 19.1 10.4 9.6 33.2 68.5 67.1 21.5 43.2 68.2 51.7
36 HARDA 87.5 84.6 42.9 19.3 19.0 36.2 66.0 64.2 26.9 42.0 65.5 41.8
37 HOSHANGABAD 84.4 90.2 42.0 20.7 20.9 40.6 77.1 65.5 22.1 45.6 74.7 55.7
38 KATNI 70.4 91.0 19.1 11.9 19.9 42.2 51.3 53.1 16.2 19.7 51.1 45.8
39 JABALPUR 95.1 97.2 53.7 34.1 34.7 40.3 85.3 68.6 12.4 61.1 84.6 41.8
40 NARSIMHAPUR 91.0 99.1 37.5 9.2 10.7 37.8 82.0 67.6 16.6 50.4 80.2 47.1
41 DINDORI 42.8 69.3 5.8 2.4 3.4 52.1 39.3 56.6 15.9 16.9 35.7 18.4
42 MANDLA 60.9 79.7 15.5 7.7 7.8 56.7 59.3 63.9 11.6 28.4 57.7 26.3
43 CHHINDWARA 84.5 73.8 21.0 14.9 10.7 48.7 69.8 61.0 11.1 44.3 68.4 47.7
44 SEONI 73.9 76.7 14.0 3.7 5.1 50.1 77.3 65.0 13.1 48.4 76.1 39.2
45 BALAGHAT 78.4 75.2 13.5 6.3 6.3 54.2 87.1 61.3 13.0 64.0 86.6 70.5
MEAN 76.4 81.4 23.7 12.8 18.9 42.0 63.5 57.9 18.3 36.3 62.0 37.8
STANDARD DEVIATION 14.9 11.0 14.5 10.4 11.6 10.2 16.3 7.2 7.0 15.9 16.9 15.8
MAXIMUM 97.0 99.3 69.5 49.6 49.4 62.9 90.8 69.1 38.7 67.8 90.0 70.5
MINIMUM 42.8 55.0 3.1 2.4 3.4 19.6 32.3 40.5 6.2 12.5 30.0 12.5
RANGE 54.2 44.3 66.4 47.2 46.0 43.3 58.5 28.6 32.5 55.3 60.0 58.0
It is evident ( from last row of table 3A and 3B) that there is wide variation in the
selected indicators across 45 districts of Madhya Pradesh For few instances, Infant

10
mortality Rate (IMR) ranges between 40 in Indore to 93 in Panna - a variability almost 2.3.
time. IMR for 73 percent of districts lies between 60-74 and 75-89.. Crude death rate (CDR)
varies between 5.5 in Indore to 11.6 in West Nimar & Barwani . 42 percent of the districts
have CDR between 6-7 and 29 percent of districts have CDR between 8-9. Neo – Natal
mortality rate (NNMR) was lowest in Indore ( 25) and highest in Panna (66) – a variability
almost 2.4 times NNMR for 49 percent of districts lies between 40-49 . and only 7 percent of
the district have NNMR between 20-29 and 60-69.. Under five Mortality (U5MR) ranges
between 51 in Indore to 140 in Panna – variability almost 3 times. U5MR lies between 81 to
100 & 61 to 80.for 71 percent of the districts. Crude birth rate ranges between 18.5 (Gwalior
) and ( 32.2) Barwani. Sex ratio at birth ranges between 807( Gwalior ) to 1006 (Dindori).The
percent of women ( 15-49) who received three or more anti natal check up was lowest 12.5
% in Morena and highest of 67.8 in Bhopal. The percent of women ( 15-49 ) who receives at
least one injection of Tetanus toxiod was lowest 30% in Shivpuri and highest of 90% in
Ujjain. Percent of children between age 12-23 months who had received full immunisation
varies between 12.5 % in Jhubia to 70.5 % Balaghat.

11
Table 4 CORRELATION MATRIX
X1 X2 X3 X4 X5 X6 X7 X8 X9 X10 X11 X12 X13 X14 X15 X16 X17 X18 X19 X20 X21 X22 X23
X1 1.00
X2 .82 1.00
X3 .58 .58 1.00
X4 .75 .77 .69 1.00
X5 .48 .38 .18 .36 1.00
X6 .81 .76 .61 .92 .68 1.00
X7 .75 .75 .65 .88 .61 .92 1.00
X8 .70 .66 .92 .69 .29 .68 .64 1.00
X9 .74 .55 .42 .48 .52 .65 .50 .68 1.00
X10 .76 .56 .44 .51 .46 .65 .49 .70 .99 1.00
X11 .38 .31 .29 .39 .16 .39 .24 .47 .56 .60 1.00
X12 .23 .09 -.15 .10 .19 .17 .02 .05 .42 .47 .67 1.00
X13 .41 .22 -.02 .16 .45 .33 .17 .21 .64 .64 .70 .72 1.00
X14 -.25 -.26 -.15 -.19 -.07 -.22 -.22 -.16 -.19 -.15 .50 .52 .40 1.00
X15 -.29 -.23 -.14 -.22 -.09 -.26 -.21 -.17 -.24 -.21 .40 .44 .30 .95 1.00
X16 -.31 -.30 -.11 -.27 .01 -.25 -.19 -.16 -.19 -.20 .39 .37 .34 .81 .83 1.00
X17 .63 .68 .50 .70 .30 .66 .64 .56 .45 .48 .24 .20 .10 -.12 -.08 -.28 1.00
X18 .08 .03 .01 .09 .05 .08 -.06 .17 .30 .35 .67 .82 .45 .55 .46 .34 .24 1.00
X19 .47 .34 .16 .30 .30 .39 .20 .41 .69 .71 .77 .76 .75 .28 .17 .15 .22 .70 1.00
X20 .28 .27 .27 .33 .33 .35 .42 .20 .11 .12 -.01 .13 .15 .15 .16 .04 .33 .03 .01 1.00
X21 -.10 -.08 -.13 -.05 -.09 -.10 -.18 -.03 .04 .09 .53 .71 .29 .66 .63 .40 .23 .92 .49 .04 1.00
X22 .06 .03 -.01 .08 .03 .07 -.07 .15 .27 .31 .66 .81 .42 .55 .47 .34 .24 1.00 .68 .02 .92 1.00
X23 -.13 -.08 -.26 -.11 -.02 -.12 -.22 -.15 .04 .07 .56 .62 .44 .70 .67 .53 -.01 .73 .44 .11 .78 .74 1.00

12
The eigen values (li) and the percentage of variance explained by the principal components
derived from the correlation matrix R are presented in table 5
TABLE 5 : EIGEN VALUE AND PERCENTAGE OF VARIANCE
Variance Components
Initial eigen values
Total % of Variance Cumulative %
1 10.481 45.567 45.567
2 3.415 14.848 60.415
3 2.042 8.878 69.293
4 1.402 6.094 75.386
5 1.177 5.119 80.505
6 .896 3.896 84.401
7 .775 3.369 87.769
8 .618 2.686 90.455
9 .549 2.389 92.844
10 .406 1.767 94.611
11 .272 1.184 95.795
12 .253 1.099 96.894
13 .183 .797 97.691
14 .143 .621 98.312
15 .119 .516 98.828
16 .101 .441 99.269
17 .062 .269 99.538
18 .037 .159 99.697
19 .033 .144 99.841
20 .018 .079 99.921
21 .016 .072 99.992
22 .001 .004 99.997
23 .001 .003 100.000
The reasons for computing first five principal components corresponding to the eigen value
greater than or 1, is due to the fact that they together explains 81 percent of variation in the data.
The first , second , third , fourth and fifth components respectively explains 45.6 %, 14.8%, 8.9
%.6.1 % and 5.1% of the total variation in the data.
The weight of the principal components corresponding to first five eigen values computed by
using the correlation matrix are presented in table 6.

13
Table 6 : WEIGHT OF THE PRINCIPAL COMPONENTS
Component Matrixa
Sl.no. Indicator Component
d1 d2 d3 d4 d5
1 Birth rate -.738 .192 .011 .189 .261
2 Death rate -.686 .333 -.041 .235 .274
3 Maternal mortality rate -.624 .279 -.598 -.253 .003
4 Neo natal rate -.739 .385 -.179 .358 .184
5 Post neo natal mortality rate -.336 -.448 .495 .138 -.037
6 Infant mortality rate -.820 .141 .068 .379 .152
7 Under five Mortality (U5MR) -.855 .044 -.029 .248 .172
8 Maternal Mortality Ratio -.594 .398 -.552 -.295 -.035
9 Sex ratio at birth -.517 .376 .450 -.446 .098
10 Sex ratio(0 -4) -.424 .623 .333 -.421 .184
11 Female literacy .599 .371 -.456 .124 .311
12 Percent of house hold With electricity
.775 .277 .279 .245 .087
13 Percent of household with drinking water
.634 -.268 .246 .093 .558
14 Percent of household with toilet facility
.866 .045 -.152 -.133 .353
15 Percent of household using LPG .818 .027 -.155 -.231 .336
16 Percent of house hold living in Pucca house
.735 -.355 -.343 -.146 .148
17 Percent of house hold having BPL Card
-.538 .608 .224 -.068 -.008
18 Percent of women received any ANC
.713 .605 .087 .087 -.235
19 Contraceptive prevalence rate .617 .376 .013 .345 .042
20 Percentage of women having children Birth Order 4+
-.298 -.075 .395 -.335 .279
21 Percent of women (15-49) having received three or more antenatal check-up
.726 .605 .134 .022 -.160
22 Percent of women ( 15-49) received at least one tetanus toxoid injection
.703 .617 .085 .102 -.231
23 Percent of children (12-23) months received full Immunization
.777 .293 .181 -.025 .113
Extraction Method: Principal Component Analysis.
a. 5 components extracted.
Thus the principle components d1, d2, d3, d4 and d5 are given by the matrix equation as
follows
D = WT *Z
Where D is matrix of order 5 x1 having five elements viz. principal components i.e
D =

14
and W is a matrix of order 23x5 whose elements are shown in table 6 and WT is its
transpose.
Z is matrix of order 23x1 having the 23 elements of standardized normal variables i.e
, where is the mean and standard deviation of variable . Since variables for different
developmental indicators are recorded in different units of measurement. The values of the variables
are not quite suitable for combined analysis. Hence, they are transformed to standard normal to
make them free of the units of measurements. The values of Principal components for 45 districts
are shown in the table 7.
The First Dimension (d1) is most significantly correlated with variables like percent of
women receiving any antenatal care, contraceptive prevalence rate, percent of women
receiving three of more anti natal check up, percent of women (15-49) received at least one
tetanus toxiod injection, percent of children ( 12-23) months received full immunization and
percent of households with electricity, and it was named as “developmental index of health
care of women and children”. and it explains 45.6 % of total dispersion across districts in
Madhya Pradesh.
The second Dimension (d2) is most highly correlated with variables Crude birth rate,
Crude death rate , Neo natal mortality rate, Infant mortality rate and Under five mortality
rate . It was named and “ index of mortality and explains 14.9 % of total variation across
districts in Madhya Pradesh.
The Third Dimension (d3) is most highly correlated with Female literacy, percent of
households with drinking water, percent of household with toilet facility, percent of
household using LPG and percent of house hold living in Pucca house. Thus we find that the
third factor represent the economic condition of households and it was named and “proxy
index of economic conditions of households” and it explains 8.9 % of total dispersion across
districts.
The fourth Dimension ( d4) is most highly correlated with Maternal mortality rate, Maternal
mortality ratio Thus fourth factor represent the developmental index of the health of
women in the reproductive age group and named it as “health index of women (15-49)” and
it explains 6.1 % of total variation across districts
The fifth Dimension (d5) is most highly correlated with Sex ratio at birth, Sex ratio 0-4
Percentage of women having children Birth Order 4+.Thus fifth factor represent the
developmental index of sex ratio and named it as “ index of sex ratio” and it explains 5.1
% of total variation across districts .

15
TABLE 7 : PRINCIPAL COMPONENTS VALUES FOR 45 DISTRICTS OF MADHYA PRADESH
Sl.No. DISTRICTS d1 d2 d3 d4 d5
1 SHEOPUR -10.0386 -5.6891 2.5506 -2.1912 0.5605 -2.9615
2 MORENA 0.9411 -8.6001 -2.6590 0.1587 0.0810 -2.0157
3 BHIND 4.9244 -6.2088 -2.0480 -1.0739 -0.4777 -0.9768
4 GWALIOR 15.4758 -6.3618 -3.6366 0.0266 0.2160 1.1440
5 DATIA 3.4179 -5.4241 0.0346 2.8203 -1.0693 -0.0441
6 SHIVPURI -7.9705 -5.9077 -0.4477 1.6959 0.2674 -2.4725
7 GUNA -6.9178 -5.6120 0.4019 2.5220 0.0885 -1.9034
8 TIKAMGARH -6.0160 -0.3449 -3.7537 -0.4286 -1.9307 -2.4948
9 CHHATARPUR -8.8987 0.7568 -2.9262 -1.0558 -1.5992 -2.7446
10 PANNA -20.7545 2.9936 -1.0259 0.7146 1.5316 -3.3081
11 SAGAR -3.0695 3.5169 -4.3862 0.4165 0.8784 -0.5288
12 DAMOH -11.1047 4.9616 -2.1362 0.7220 1.0044 -1.3106
13 SATNA -12.0290 1.1661 -0.0862 1.7560 1.9382 -1.4510
14 REWA -7.3450 -0.3945 -0.5105 -0.9286 0.2324 -1.7892
15 UMARIA -14.0156 2.9015 -2.0489 -1.6466 -0.5884 -3.0796
16 SHAHDOL -9.3121 4.2044 -1.3004 -1.6488 -1.4192 -1.8952
17 SIDHI -15.7265 -2.0088 -1.6639 -1.4298 -0.9693 -4.3596
18 NEEMUCH 8.4253 1.0867 1.4578 -0.6275 -1.7503 1.7184
19 MANDSAUR 6.9767 0.5050 1.5358 0.6003 -2.5632 1.4109
20 RATLAM 6.1324 0.8357 2.1031 1.4309 -0.0598 2.0885
21 UJJAIN 15.1414 1.9479 1.9012 -0.0579 -0.0482 3.7769
22 SHAJAPUR 6.0308 1.9327 1.1192 0.5730 -1.5778 1.6156
23 DEWAS 10.7973 -0.2174 1.8191 -0.1383 -0.7116 2.3098
24 JHABUA -8.1398 -5.2906 4.3536 -2.1895 -0.8701 -2.4273
25 DHAR 3.6800 -1.3640 2.5121 -1.5576 -0.8030 0.4935
26 INDORE 27.6711 0.5515 -2.6910 -1.8342 0.7554 4.8906
27 WEST NIMAR 3.9890 0.0162 1.6214 0.9302 0.4683 1.4050
28 BARWANI -11.0398 -1.3966 4.3016 -1.1458 1.8107 -1.4940
29 EAST NIMAR 2.0764 -2.0470 0.4295 0.7750 0.7102 0.3888
30 RAJGARH -1.0433 1.0835 1.2845 -0.0661 -1.5609 -0.0605
31 VIDISHA -1.5909 -0.3868 -1.1336 2.2782 0.8742 0.0082
32 BHOPAL 21.5486 0.6546 -0.3791 -3.0889 2.3884 4.2247
33 SEHORE 2.4657 2.8426 2.3157 0.5308 -0.0102 1.6289
34 RAISEN -3.7938 -0.3980 1.3330 0.8236 1.8165 -0.0437
35 BETUL 4.0770 0.2097 -0.2996 1.9956 -0.2992 1.1367
36 HARDA 5.6053 0.7990 1.0293 -0.8396 1.1454 1.5479
37 HOSHANGABAD 7.9839 2.5605 0.2080 -0.0062 1.1618 2.3816
38 KATNI -4.6550 0.9133 0.7752 -0.8919 2.0814 -0.3554
39 JABALPUR 19.3358 1.7162 -2.6452 -0.0907 0.5056 3.7643
40 NARSIMHAPUR 6.8332 2.8998 0.6987 1.4580 0.8194 2.5418
41 DINDORI -17.7123 1.3311 -1.2206 -2.0265 0.0424 -3.9172
42 MANDLA -5.9971 2.1582 1.4999 -0.4307 -0.2000 -0.5939
43 CHHINDWARA 1.7835 2.1436 0.0241 1.2381 -0.8321 0.8714
44 SEONI -1.5634 3.5930 0.6460 1.9175 -0.9355 0.7315
45 BALAGHAT 3.4212 7.3701 1.0427 0.0107 -1.10230 2.1485

16
As d1 d2, d3 ,d4, and d5 are uncorrelated and are shown to be normally distributed by
Kolmogorov test ( table 8) we use
=
which is also normally distributed to classify the district of Madhya Pradesh (
Table 9)
TABLE 8: TEST OF NORMALITY ( ONE SAMPLE KOLMOGOROV-SMIRNOV TEST
Parameters
d1 d2 d3 d4 d5
Number of observations 45 45 45 45 45 45
Normal parameter
Mean .00 .00 .00 .00 .00 .00
Std. Deviation σ
10.48 3.41 2.04 1.40 1.18 2.27
Kolmogorov-Smirnov Z .519 1.254 0.474 0.407 0.426 0.493
Asymp. Sig. (2-tailed) .952 0.086 0.978 0.926 0.993 0.968
Ranking of districts : Since some of the mean values of d’s are negative . it will be proper to
compute indices from the values of by using transformation which makes them to lie between 0
and 100. That is , the index Ii for the ith district is given by
Ii = [ (i) - Min (i))]/ [ Max (i)- Min (i))]*100 I = 1.2.3.----------,45
TABLE 9 CLASSIFICATION OF DISTRICTS OF MADHYA PRADESH
Backward Underdeveloped Developing Developed
SIDHI BARWANI EAST NIMAR HARDA
DINDORI SATNA DHAR SHAJAPUR
PANNA DAMOH SEONI SEHORE
UMARIA BHIND CHHINDWARA NEEMUCH
SHEOPUR MANDLA BETUL RATLAM
CHHATARPUR SAGAR GWALIOR BALAGHAT
TIKAMGARH KATNI WEST NIMAR DEWAS
SHIVPURI RAJGARH MANDSAUR HOSHANGABAD
JHABUA DATIA NARSIMHAPUR
MORENA RAISEN JABALPUR
GUNA VIDISHA UJJAIN
SHAHDOL BHOPAL
REWA INDORE

17
Results and discussions: Ranking of the district of Madhya Pradesh ( Table 10 ) made
using principal component analysis shows that Indore has the highest development index whereas
Sidhi having lowest.
Table 10 INDEX VALUE OF
Sl.No. DISTRICTS Index
1 SIDHI -4.3596 0.0 2 DINDORI -3.9172 4.8 3 PANNA -3.3081 11.4 4 UMARIA -3.0796 13.8 5 SHEOPUR -2.9615 15.1 6 CHHATARPUR -2.7446 17.5 7 TIKAMGARH -2.4948 20.2 8 SHIVPURI -2.4725 20.4 9 JHABUA -2.4273 20.9 10 MORENA -2.0157 25.3 11 GUNA -1.9034 26.6 12 SHAHDOL -1.8952 26.6 13 REWA -1.7892 27.8 14 BARWANI -1.4940 31.0 15 SATNA -1.4510 31.4 16 DAMOH -1.3106 33.0 17 BHIND -0.9768 36.6 18 MANDLA -0.5939 40.7 19 SAGAR -0.5288 41.4 20 KATNI -0.3554 43.3 21 RAJGARH -0.0605 46.5 22 DATIA -0.0441 46.7 23 RAISEN -0.0437 46.7 24 VIDISHA 0.0082 47.2 25 EAST NIMAR 0.3888 51.3 26 DHAR 0.4935 52.5 27 SEONI 0.7315 55.0 28 CHHINDWARA 0.8714 56.6 29 BETUL 1.1367 59.4 30 GWALIOR 1.1440 59.5 31 WEST NIMAR 1.4050 62.3 32 MANDSAUR 1.4109 62.4 33 HARDA 1.5479 63.9 34 SHAJAPUR 1.6156 64.6 35 SEHORE 1.6289 64.7 36 NEEMUCH 1.7184 65.7 37 RATLAM 2.0885 69.7 38 BALAGHAT 2.1485 70.4 39 DEWAS 2.3098 72.1 40 HOSHANGABAD 2.3816 72.9 41 NARSIMHAPUR 2.5418 74.6 42 JABALPUR 3.7643 87.8 43 UJJAIN 3.7769 88.0 44 BHOPAL 4.2247 92.8
45 INDORE 4.8906 100.0

18
Fig I Mapping of districts of Madhya Pradesh according to level of development ( Maternal ,
child health and welfare prospective).
An analysis has been made to classify all district of the state according to maternal and
childcare and welfare perspectives. Further, districts have been divided into four level of
development depending upon the values of the principal component , calculated from 23 indicators
considered in the study. This analysis shows an overview of how many districts need to be
considered to formulate the revised policy and programmes to improve those indicators which
contribute to low level development. The classification of the districts of Madhya Pradesh on the
basis of “ ” calculated from the indicators in this study is shown in table 9.

19
The percentile of normal distribution are used to classify the districts. The values of have
been categorized by the following :
1. Less than ( - 0.6745 X σ) : [ -4.36 to less than -1.53) = Backward
2. [( - 0.6745 X σ) to ) [ -1.153 to 0.0 ) = Underdeveloped
3. [ to ( + 0.6745 X σ) : [ 0.0 to 1.53 ) = Developing
4. More than ( + 0.6745 X σ): [ more than 1.53 ] = Developed
The hypothesis that vital indicators must shows down ward trend as we move from
backward districts to developed districts where as the socio economic indicators must shows
upward trend as we move from backward district to forward districts provided the districts are
correctly classified by the index, has been confirmed by the graphs, shown on pages 20 to 23.
Areas of concerns:
It has been observed beyond doubt that 13 out of 45 districts of Madhya Pradesh have come
under the category of backward districts ,11 districts underdeveloped ,8 districts developing and 13
districts in the developed category, showing thereby that large regional disparity exist with respects
to Maternal and child Health care in the level of development in the state as revealed by principal
components of various dimensions. The Eleventh Plan had drawn attention to the fact that India’s
health outcome indicators continue to be weaker than they should be, at our level of development
and noted that the total public expenditure on health in India by Centre and the States was less than
1 ( 0.93) percent of GDP in 2007–08. It has increased to about 1.04 per cent during 2011–12. It
needs to increase much more over the next decade. Human development index report released by
planning commission recently ( 21.10.2011), has pointed out that the states namely Chhattisgarh,
Orissa, Madhya Pradesh, Uttar Pradesh, Jharkhand, Rajasthan continued to lag behind in HDI and
remained below the national average of 0.467.The Infant mortality Rate (IMR) has fallen from 57 in
2006 to 47 in 2010. The percentage of deliveries in institutions has increased from 54 percent in
2006 to 73 percent in 2009, while the Maternal Mortality Ratio (MMR) has come down by 42 points
to 212 (2007‐2009) from 254 in 2004-06. These are marked improvements but their rate of decline is
lower than what is needed for achieving the relevant targets. We must accelerate the pace of
progress in this area in the Twelfth Plan by allocating additional resources to health and laid down
monitorable targets for parameters relating to infant mortality (IMR), maternal mortality (MMR),
institutionalized delivery, extent of full immunization, etc.
Even though the mortality is coming down at all India level, but infant and child mortality rates
are still very high particularly in the EAG states and is 2nd highest in MP. This enforces the couples
the need to have large families. Massive efforts to enhance child survival through programme like
Universal immunization , oral rehydration therapy , oral polio etc. are already making head way. The
present need therefore should be to induce confidence among couples about increased survival
probability/ chance of their children, To ensure this the specific action needed are

20
Compulsory immunization off all children under five (more specifically infant) should be
accelerated particularly in the backward and under developed districts of State in order to
achieve Millennium Development Goals (MDG-4 (U5MR less than equal to 42 ) and MDG-4
(IMR less than equal to 28) by 2015. None of the districts so far have achieved Millennium
Development Goals.
Comprehensive health emeScS such as “seSgvarS nnrSDgle CDgdSISC dcSargeSnI mST, “Total
Sanitation Campaign (TSC)”; g" Nnr anCg Nurn r ag P C my",g g "Nnr anCg lennrSng f ng me CDnSag "
aSSDTgr gbSg arSaT ISCyggc a r nSDgnaDgnmSCSnnrSDgon a continuous and permanent basis for
prevention and early detection of sickness among rural children .
The process of issuing smart cards cashless health insurance cover of ` 30, 000 per family
per annum to BPL families (a unit of five) through Rashtriya Swasthya Bima Yojana (RSBY)
in the unorganized sector should be speeded up .
It has been reported19 that the sex ratio at birth when the firstborn was girl fell sharply from
906 per 1000 boys in 1990 to 836 in 2005; an annual decline of 0.52 %. In order to improve
the sex ratio, Pre-Conception and Pre-Natal Diagnostic Techniques (Prohibition of Sex
Selection) Act, the PC & PNDT Act, should be strictly implemented.
The Health Management Information System ( HIMS) of the Ministry of Health and Family
Welfare has been playing a vital role in mentoring of various health programme but the
issues relating to quality of data that flows from levels needs to be addressed by imparting
training to all personnels engaged in HIMS, this will help to take timely decision and state
interventions. This would in turn ensure to achieve the goals set for NRHM viz. Reduction
in Infant Mortality Rate (IMR), Maternal Mortality Ratio (MMR), Universal access to public
health services such as Women’s health, child health, water, sanitation & hygiene,
immunization, and Nutrition, Prevention and control of communicable and non-communicable
diseases, including locally endemic diseases, access to integrated comprehensive primary
healthcare ,Population stabilization, gender and demographic balance; Revitalize of local
health traditions and mainstream AYUSH, Promotion of healthy life styles.
Shortage of health professionals at all levels has become a serious impediment to achieving
an expansion in the public provision of health services. There has been inadequate attention
to improving our education and training capacities in this area. There are also problems of
accountability of personnel even when these are recruited. These lacunae needs to be
rectified and Twelfth Plan must give a special emphasis to solve this problem.
There is need of strong coordination at the grass-root level i.e at village level between
various schemes run by the Ministry of Women and Child Development and Ministry of
Health and Family Welfare .

21
20 22 24 26 28
Backward
Underdeveloped
Developing
Developed
Birth rate
0 2 4 6 8 10
Backward
Underdeveloped
Developing
Developed
Death rate
0 10 20 30 40
Backward
Underdeveloped
Developing
Developed
Maternal mortality rate
0 100 200 300 400
Backward
Underdeveloped
Developing
Developed
Maternal Mortality Ratio
0 20 40 60
Backward
Underdeveloped
Developing
Developed
Neo natal mortality rate
0 10 20 30
Backward
Underdeveloped
Developing
Developed
Post neo natal mortality rate

22
0 20 40 60 80
Backward
Underdeveloped
Developing
Developed
Infant mortality rate
0 50 100 150
Backward
Underdeveloped
Developing
Developed
Mortality rate under five
860 880 900 920 940
Backward
Underdeveloped
Developing
Developed
Sex ratio at birth
860 880 900 920 940
Backward
Underdeveloped
Developing
Developed
Sex ratio(0 -4)
0 20 40 60 80
Backward
Underdeveloped
Developing
Developed
Female literacy
0 20 40 60 80 100
Backward
Underdeveloped
Developing
Developed
Percent of house hold With Electircity

23
65 70 75 80 85 90
Backward
Underdeveloped
Developing
Developed
Percent of household with Drinking water
0 10 20 30 40 50
Backward
Underdeveloped
Developing
Developed
Percent of household with toilet facility
0 5 10 15 20 25
Backward
Underdeveloped
Developing
Developed
Percent of household using LPG
0 10 20 30
Backward
Underdeveloped
Developing
Developed
Percent of house hold living in Pucca house
30 35 40 45 50
Backward
Underdeveloped
Developing
Developed
Percent of household having BPL Card
0 20 40 60 80
Backward
Underdeveloped
Developing
Developed
Contraceptive prevalance rate

24
15 16 17 18 19 20 21
Backward
Underdeveloped
Developing
Developed
Percentage of women having children Birth
Order 4+
0 10 20 30 40 50 60
Backward
Underdeveloped
Developing
Developed
Percent of women (15- 49) having received three or more antenatal check-up
0 10 20 30 40 50 60 70 80 90
Backward
Underdeveloped
Developing
Developed
Percent of women ( 15-49) received at least one tetanus toxoid injection
0 10 20 30 40 50 60
Backward
Underdeveloped
Developing
Developed
Percent of children (12-23) months received full Imunization

25
Reference:
1. UNDP., (2004), Human Development Report, 2004
2. Dasgupta B, (1971),Socio Classification of districts . A Statistical approach. Economic and
Political Weekly Vi( 33) 1763-74
3. Rao,S. K., (1973), A Note on measuring economic distance between Regions in India.
Economic and Political weekly, 8(17): 703-710.
4. Rao, Hamlata, (1977) Identification of backward regions and the trends in regional disparities
in India. Artha Vijnana, XIX (2);93-112.
5. Narain, P., Rai, S.C. and Sarup, Shanti, (1991), Statistical evaluation of development on
socio-economic front.J. Ind. Soc. Agril. Statist., 43: 329-345.
6. Gulati, S.C.(1991) Population growth and development : district level analysis . Demography
India 20(2): 199-208
7. Iyengar, N.S and Sudarshan, P (1982). A method of classifying regions from multivariate
data. Economic and political Weekly, Special Article: 2047-52.
8. Swain A.K.P.C and Mohanty Bigyanananda (2010) Socio-demographic Disparities in Orissa-
Maternal and Child Health and Welfare Perspectives Demography India,Vol.39, No. 1 (2010),
pp.129-139.
9. Mohanty, S. K. and Ram, F., (2001), District at a Glance: India. Mimeograph, IIPS, Mumbai-
400088.
10. Ram, F. and Chander Shekhar, (2006), Ranking and Mapping of Districts based on Socio-
Economic and Demographic Indicators. International Institute for Population Sciences (IIPS),
Mumbai-400088.
11. Narian P (2007) : Statistical Evaluation of Socio-economic Development of different States in India.J..Ind. Soc. Agril. Statist. 6/ (3), 2007: 328-335
12. Office of Registrar General and Census Commissioner (RGI&CC)( August ,2011) “Annual
Health Survey Bulletin (2010-11) - Madhya Pradesh”,
13. Office of Registrar General and Census Commissioner (RGI&CC)( March ,2011) Provisional Population Totals:Paper1:Census2011 Website http://censusindia.gov.on Population census 2011
14. International Institute for Population Science, Mumbai (2010), Report on “District Level Household and Facility Survey-(2007-08) Madhya Pradesh ”.
15. Bhuyan, K.C (2010), Multivariate Analysis and its applications . New Central Book agency(
P) Ltd , Kolkata -700009
16. Johnson, R.A. and Wichern, D. W.,( 2003), Applied Multivariate Statistical Analysis (3rd edit).
Prentice Hall of India Private Limited, New Delhi.
17. Statistical Package for Social Science ( SPSS version 18)
18 Field A ( 2000) Discovering Statistics using SPSS for windows. London – Thounds Oaks-
New Delhi : sage publication

26
19 Prabhat Jha and et.al. (2011) Trends in selective abortions of girls in India : analysis of
nationally representative birth histories from 1990 to 2005 and census data from 1991 to
2011: The Lancet , Vol. 377,issue 9781, pp 1921-1928
Copyright © 2022 FDOKUMEN