Minority Disparities in Disability Between Medicare Beneficiaries
17
Minority Disparities in Disability Between Medicare Beneficiaries Marcia A. Ciol, PhD * , Anne Shumway-Cook, PhD * , Jeanne M. Hoffman, PhD * , Kathryn M. Yorkston, PhD * , Brian J. Dudgeon, PhD * , and Leighton Chan, MD † * Department of Rehabilitation Medicine, University of Washington School of Medicine, Seattle, Washington † Rehabilitation Medicine Department, National Institutes of Health Clinical Research Center, Bethesda, Maryland Abstract OBJECTIVES—To examine racial and ethnic disparities in mobility limitation, activities of daily living (ADLs), and instrumental activities of daily living (IADLs) in older adults enrolled in Medicare. DESIGN—Longitudinal national survey. PARTICIPANTS—Community-dwelling respondents in the Medicare Current Beneficiaries Survey from 1992 to 2004 (10,180–16,788 respondents per year). MEASUREMENTS—Disability-related outcomes included mobility limitation, difficulty in six ADLs and six IADLs. Explanatory variables included age, sex, racial or ethnic group, living situation, and income level. RESULTS—From 1992 to 2004, proportions of Medicare beneficiaries with mobility limitations were stable across racial and ethnic groups, improving slightly for ADLs and IADLs. Blacks reported more limitations in all three disability-related measures. In a longitudinal analysis, the probability of developing mobility limitation was consistently higher for blacks, followed by white Hispanics, white non-Hispanics, and Asians, after adjusting for age, sex, socioeconomic status, and living situation. For ADL and IADL difficulties, the number of reported difficulties increased with age for all ethnic and racial groups. At approximately age 75, Asians and white Hispanics reported difficulties with much higher numbers of ADLs and IADLs than the other groups. CONCLUSION—Across all ethnic and racial groups, self-reported disability has declined in the past decade, but even after adjusting for age, sex, socioeconomic status, and living situation, racial and ethnic disparities in disability outcomes persist. Race and ethnicity may influence the reporting of disability, potentially affecting measures of prevalence. Further research is needed to understand whether these differences are a result of perceptions related to disablement or true differences in disability between racial and ethnic groups. © 2007, Copyright the Authors Address correspondence to Marcia A. Ciol, PhD, Department of Rehabilitation Medicine, University of Washington, Box 356490, Seattle, WA 98195. [email protected]. Author Contributions: Marcia Ciol: study concept, design, data analysis, interpretation of results, and preparation of manuscript. Anne Shumway-Cook and Leighton Chan: study concept, design, interpretation of results, and preparation of manuscript. Jeanne Hoffman, Kathyrn Yorkston, and Brian Dudgeon: interpretation of results, and preparation of manuscript. Conflict of Interest: This study was supported with funding from the Centers for Disease Control and Prevention (MM-0625-04/04) through an Extramural Project Grant with the Association of Academic Medical Centers. Additional resources were provided by the Centers for Medicare and Medicaid Services. NIH Public Access Author Manuscript J Am Geriatr Soc. Author manuscript; available in PMC 2012 August 23. Published in final edited form as: J Am Geriatr Soc. 2008 March ; 56(3): 444–453. doi:10.1111/j.1532-5415.2007.01570.x. NIH-PA Author Manuscript NIH-PA Author Manuscript NIH-PA Author Manuscript
-
Upload
ua-birmingham -
Category
Documents
-
view
4 -
download
0
Transcript of Minority Disparities in Disability Between Medicare Beneficiaries
Minority Disparities in Disability Between Medicare Beneficiaries
Marcia A. Ciol, PhD*, Anne Shumway-Cook, PhD*, Jeanne M. Hoffman, PhD*, Kathryn M.Yorkston, PhD*, Brian J. Dudgeon, PhD*, and Leighton Chan, MD†
*Department of Rehabilitation Medicine, University of Washington School of Medicine, Seattle,Washington †Rehabilitation Medicine Department, National Institutes of Health Clinical ResearchCenter, Bethesda, Maryland
AbstractOBJECTIVES—To examine racial and ethnic disparities in mobility limitation, activities of dailyliving (ADLs), and instrumental activities of daily living (IADLs) in older adults enrolled inMedicare.
DESIGN—Longitudinal national survey.
PARTICIPANTS—Community-dwelling respondents in the Medicare Current BeneficiariesSurvey from 1992 to 2004 (10,180–16,788 respondents per year).
MEASUREMENTS—Disability-related outcomes included mobility limitation, difficulty in sixADLs and six IADLs. Explanatory variables included age, sex, racial or ethnic group, livingsituation, and income level.
RESULTS—From 1992 to 2004, proportions of Medicare beneficiaries with mobility limitationswere stable across racial and ethnic groups, improving slightly for ADLs and IADLs. Blacksreported more limitations in all three disability-related measures. In a longitudinal analysis, theprobability of developing mobility limitation was consistently higher for blacks, followed by whiteHispanics, white non-Hispanics, and Asians, after adjusting for age, sex, socioeconomic status,and living situation. For ADL and IADL difficulties, the number of reported difficulties increasedwith age for all ethnic and racial groups. At approximately age 75, Asians and white Hispanicsreported difficulties with much higher numbers of ADLs and IADLs than the other groups.
CONCLUSION—Across all ethnic and racial groups, self-reported disability has declined in thepast decade, but even after adjusting for age, sex, socioeconomic status, and living situation, racialand ethnic disparities in disability outcomes persist. Race and ethnicity may influence thereporting of disability, potentially affecting measures of prevalence. Further research is needed tounderstand whether these differences are a result of perceptions related to disablement or truedifferences in disability between racial and ethnic groups.
© 2007, Copyright the Authors
Address correspondence to Marcia A. Ciol, PhD, Department of Rehabilitation Medicine, University of Washington, Box 356490,Seattle, WA 98195. [email protected].
Author Contributions: Marcia Ciol: study concept, design, data analysis, interpretation of results, and preparation of manuscript.Anne Shumway-Cook and Leighton Chan: study concept, design, interpretation of results, and preparation of manuscript. JeanneHoffman, Kathyrn Yorkston, and Brian Dudgeon: interpretation of results, and preparation of manuscript.
Conflict of Interest: This study was supported with funding from the Centers for Disease Control and Prevention (MM-0625-04/04)through an Extramural Project Grant with the Association of Academic Medical Centers. Additional resources were provided by theCenters for Medicare and Medicaid Services.
NIH Public AccessAuthor ManuscriptJ Am Geriatr Soc. Author manuscript; available in PMC 2012 August 23.
Published in final edited form as:J Am Geriatr Soc. 2008 March ; 56(3): 444–453. doi:10.1111/j.1532-5415.2007.01570.x.
NIH
-PA Author Manuscript
NIH
-PA Author Manuscript
NIH
-PA Author Manuscript
Keywordsminority disparities; disability; Medicare
The National Institutes of Health (NIH) strategic plan addressing health disparities (fiscalyears 2000–2006)1 defines health disparities as “a difference in the incidence, prevalence,mortality, and burden of disease and other adverse health conditions that exist amongspecific population groups in the United States.” Considerable evidence existsdemonstrating the prevalence of racial disparities in health and disability. Studies havesubstantiated a higher prevalence of disability in blacks than in non-Hispanic whites2–6 andin Hispanics than in whites.7–9 For these reasons, Healthy People 2010 lists the eliminationof racial disparities in health as a top priority.10 Achieving this goal requires longitudinalmonitoring of health and disability status in subgroups of the population based on age, sex,race, and socioeconomic status.5
A number of studies have reported improvements in age-specific disability over the past 20years.4,11–14 Several authors have reported a reduction in disability disparities betweenracial groups,4,13,15 whereas others did not find such a reduction.2,5,16–18 One study4
examined prevalence in chronic disability in activities of daily living (ADLs) andinstrumental activities of daily living (IADLs) in black and white adults aged 65 and older(years 1982–1999) and reported that disability prevalence was declining over time, withfaster declines in blacks than in whites. Another study5 followed 6,158 non-Hispanic blacksand whites (aged ≥65) for approximately 6 years (study duration: 1993–2002) and found noclear evidence that there was a decrease in disability disparities between blacks and whitesas the cohort aged. These researchers primarily compared racial disparities between blacks,Hispanics, or both and whites. Thus, gaps exist in understanding of racial and ethnicdisparities in health and disability because of limited research examining disability betweenvarious racial and ethnic groups in a single study. The purpose of this study was to examineracial and ethnic disparities in mobility limitation, ADLs, and IADLs in older adults enrolledin Medicare from 1992 to 2004 by addressing the following questions:
1. Have self-reported disability-related outcomes changed over time, and is the patternof change consistent across racial and ethnic groups?
2. Do self-reported disability-related outcomes measured longitudinally in Medicarebeneficiaries vary according to race or ethnicity after adjusting for age, sex, livingstatus, and socioeconomic status?
METHODSSample
The sample consisted of individuals who participated in the Medicare Current BeneficiariesSurvey (MCBS) from 1992 to 2004. The MCBS is an ongoing multistage survey that selectsa representative sample from all Medicare beneficiaries enrolled during a calendar year. Inthe first stage, the United States is divided into 107 geographic primary sampling units(PSUs), each composed of a group of counties. Within each PSU, subareas are definedaccording to ZIP codes, and systematic random samples are collected, stratifying accordingto age. To ensure large-enough samples of certain strata, beneficiaries who qualify forMedicare because of disability (regardless of age) and beneficiaries aged 85 and older areoversampled, although in this study, only participants who were aged 65 and older atbaseline were included in the analysis. For 4 years, survey participants were interviewedevery 4 months regarding many aspects of their health status (once a year during the autumnquarter interview) and healthcare utilization (during the other two interviews in the year). By
Ciol et al. Page 2
J Am Geriatr Soc. Author manuscript; available in PMC 2012 August 23.
NIH
-PA Author Manuscript
NIH
-PA Author Manuscript
NIH
-PA Author Manuscript
using weighted estimation,19,20 this sampling scheme permits generalization of the results tothe Medicare population as a whole, and following each participant for 4 years allows forlongitudinal analysis of some health indicators. Details of the MCBS interview content anddesign have been previously published11 and can be found at the MCBS Website.21
Data DescriptionData were drawn from responses of MCBS participants during 1992 to 2004. Yearly datafrom the Health Status and Functioning questionnaire were used to calculate annualproportions of three types of disability (mobility limitation, ADL, and IADL). Sample sizesfor each year varied from 10,180 to 16,788, with most years between 12,000 and 13,000.Participants were likely to contribute to the calculations for more than 1 year, because theywere followed for up to 4 years. Proxy respondents varied from 10% to 13% but wereconsistently approximately 10% in the last 7 years of the data.
While enrolled in the MCBS, participants answered questions about their health statusduring autumn interviews. Disability-related variables used for analyses were constructed asfollows: mobility limitation was defined using four walking-related questions (“Do you haveany difficulty walking one quarter of a mile?” “Do you have any difficulty walking?” “Doyou need help from a person to walk?” and “Do you use equipment to walk?”) according toan algorithm developed previously,22 resulting in five limitation categories (none, mild,moderate, severe, does not walk). Participants were asked about whether they haddifficulties (due to health or physical problems) with six ADLs (bathing, dressing, eating,getting in or out of bed and chairs, walking, and using the toilet). Similar questions wereasked for six IADLs (using telephone, doing light housework, doing heavy housework,preparing meals, shopping, and managing money). The number of ADL and IADL items forwhich the participant reported having difficulty was calculated and categorized as follows:no difficulty in any ADL or IADL, difficulty in one or two ADLs or IADLs, difficulty inthree or four ADLs or IADLs, and difficulty in five or six ADLs or IADLs. Prior researchhas demonstrated that using counts of ADL limitations accounts for the hierarchical natureof ADL dependencies.23
To estimate disability of beneficiaries as they grew older, the longitudinal data provided bythe follow-up of the MCBS participants were used. For this analysis, participants who werein the MCBS from 1999 through 2004 with at least two consecutive years of observationswere selected, for a total of 21,199 unique participants. Therefore, participants could havecontributed two to four observations in the data analysis. It was decided to start thelongitudinal data in 1999 in order to study only the most recent data that would allow forfollow-up of individuals over a period of time.
Racial or ethnic group was defined based on two questions (“What is your race?” and “Areyou of Hispanic origin?”). The classification had six categories: white non-Hispanic, whiteHispanic, black (Hispanic or not), Asian (Hispanic or not), American or Alaskan Native, andother. For American or Alaskan Natives, there was a change in the coding system over theyears, which was recoded to make it uniform through the period of the study. Additionalvariables used in the descriptive analysis and models included age, sex, education level (lessthan high school vs high school graduate or higher education), income level (<$25,000 vs ≥$25,000 per year), marital status (married vs not married), living status (living alone vs notliving alone), self-reported health status (fair or poor health vs good to excellent health),body mass index (BMI), number of comorbidities (self-reporting of presence or absence of18 medical conditions such as high blood pressure and arthritis), and smoking status (currentsmoker vs nonsmoker).
Ciol et al. Page 3
J Am Geriatr Soc. Author manuscript; available in PMC 2012 August 23.
NIH
-PA Author Manuscript
NIH
-PA Author Manuscript
NIH
-PA Author Manuscript
Statistical AnalysisWeighted estimation19,20 was used to estimate proportions of categories of mobilitylimitation and difficulties with ADLs and IADLs for each of the 13 years of MCBS data.Weighted estimation takes into account the sampling scheme, which was based on the agedistribution of the Medicare population, and therefore, the estimates are adjusted for age.Visual displays were created for each of the disability-related variables according to racialand ethnic groups. Differences in racial and ethnic groups for each outcome variable werenot tested, because it is likely that the results would be statistically significant simplybecause of the large sample sizes. Furthermore, many of these differences would be smalland not important from a clinical point of view.
American and Alaskan Natives and participants aged 96 and older were excluded from thelongitudinal analyses because of small sample sizes. The group denominated “other” wasexcluded from the longitudinal analysis because of its heterogeneity, including participantswho reported more than one race. Consequently, the conclusions can be generalized to olderadults (aged 65–95) who are Medicare beneficiaries and are of white (Hispanic or not),black, or Asian race or ethnicity. Characteristics of the participants at baseline weredescribed according to race and ethnic groups, and differences in means for age, BMI, andnumber of comorbidities were tested using analysis of variance, whereas all othercategorical variables were tested using chi-square tests.
Mobility limitation and number of ADLs and IADLs with difficulties over time weremodeled using generalized estimation equations (GEEs). This method allows for analysis ofcorrelated longitudinal data,24,25 which were generated using the multiple measurements ofdisability of the MCBS participants. In this part of the data analysis, the sample weightswere not used, because they were originally developed for the estimates of proportions ofdisability in the Medicare population in a certain year, but the GEE model had the objectiveof estimating the probability that one is in a certain category of disability given one’s age,sex, and racial or ethnic group over time. All participants with at least 2 years of follow-upwere analyzed in the longitudinal model. The GEE allows for a person to change from onedisability category to another over time, and because the person’s trajectories for mobility,ADL, and IADL disabilities were the major interest in the study, no person was excludedeven if he or she already had a disability at baseline. For each disability-related outcome, theinitial model included age, sex, racial or ethnic group, and all two-way interactions betweenthe three variables. To account for the possibility that the effect of age is much larger as aparticipant grows older, the square of age was included in the model. The model wastrimmed by eliminating interactions that were not statistically significant.
A second model was created by adding the variables income level and living status to thetrimmed model above. These two variables have been shown to correlate with race andethnic groups in other studies,5,9 and they might explain the differences in disability.Although education level and marital status have been shown to be associated withdisability,22 they were not added to the model, because they are highly correlated withsocioeconomic and living status, which were already included.
For the longitudinal analyses, the five categories of mobility limitation were recoded into abinary variable (no mobility limitation vs some limitation). The probability that a participantwould have some mobility limitation was modeled assuming a single binomial trial, a logitlink, and an autoregressive correlation matrix of order one (AR(1)).24,25 The AR(1) modelassumes that the mobility limitation status for a participant in a certain year is correlatedwith the mobility limitation status in the previous year. For each participant, a variable thatcounted the number of ADLs for which the participant had difficulties at each annualinterview was also defined. The GEE model was set to use the binomial family with six
Ciol et al. Page 4
J Am Geriatr Soc. Author manuscript; available in PMC 2012 August 23.
NIH
-PA Author Manuscript
NIH
-PA Author Manuscript
NIH
-PA Author Manuscript
trials (one for each ADL), a logit link, and AR(1). A similar variable was defined for thenumber of IADLs with difficulties, and a GEE model was fitted using the same approachused for ADLs.
Statistical significance level was set to .05. SAS version 9.1 (SAS Institute, Inc., Cary, NC)was used for data management and weighted estimation, STATA version 8.0 for Windows(STATA Corp., College Station, TX) was used for GEE modeling, and SPLUS version 7.0(Insightful, Inc., Seattle, WA) was used to create the figures.
RESULTSDisability-Related Outcomes According to Racial and Ethnic Groups
The proportion of Medicare beneficiaries in each category of disability-related outcomeswas estimated for the six racial and ethnic groups for each year of available data. Samplesizes varied from 8,597 to 13,853 for white non-Hispanic subjects, 347 to 956 for whiteHispanic subjects, 929 to 1,347 for black subjects, 100 to 290 for Asian subjects, and 54 to105 for American and Alaskan Native subjects. Participants who could not be classified intoany of the main racial or ethnic groups were classified as other, with sample sizes varyingfrom 120 to 342.
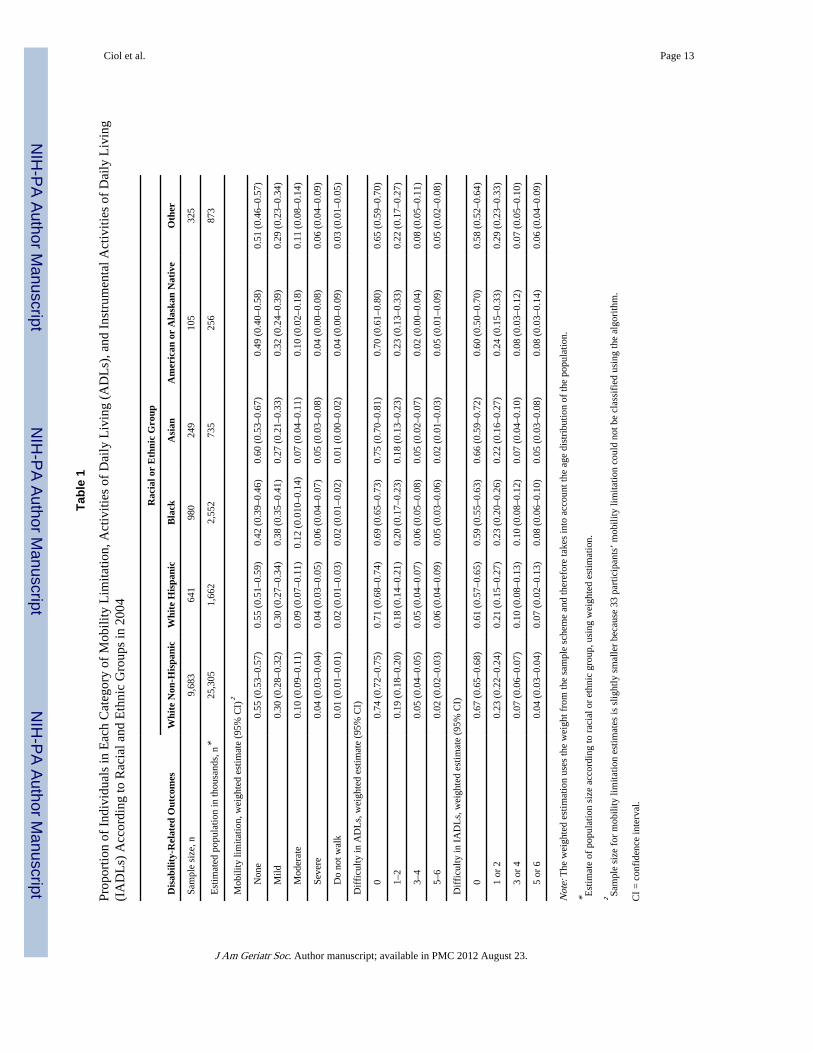
Table 1 presents the estimated population sizes and percentages of Medicare beneficiaries ineach category of the disability-related outcomes according to racial or ethnic group for themost recent year of data (2004) followed by the 95% confidence intervals for thoseestimates. Results for years 1992 to 2003 were similar (available from the authors byrequest). Blacks had the lowest proportion of no mobility limitation and no difficulties withADLs and IADLs (thus the highest proportions of some disability). Estimates for Americanand Alaskan Natives were also low for no mobility limitation and no difficulties withIADLs, but the confidence intervals were large because of the small sample size of thatgroup. Asians, followed closely by white non-Hispanics, had the largest percentages of nodisability in all three measures of function.
The effect of a disability in a certain racial or ethnic group can be estimated by multiplyingthe estimated size of the population in that group by the proportion of participants in eachdisability category. For example, in 2004, it was estimated that approximately 7.6 millionwhite non-Hispanics Medicare beneficiaries had mild mobility limitations (25,305,000 ×0.30), and approximately 967,000 black Medicare beneficiaries were estimated to have mildmobility limitation (2,552,000 × 0.38).
For a view of trends of mobility limitation from 1992 to 2004, the first panel of Figure 1shows the percentage of participants in each mobility limitation category according to racialor ethnic group (except American and Alaskan Natives and other). There were differencesbetween racial and ethnic groups regarding the distribution of mobility limitation. Whitenon-Hispanic and Asian subjects tended to have the highest proportions of people with nomobility limitation, followed by white Hispanic and Black subjects. Hispanic and non-Hispanic white subjects had similar overall proportions of people with and without mobilitylimitations, but blacks had a lower proportion than whites (Hispanic or not) of no mobilitylimitation, a similar proportion of mild mobility limitation, and a higher proportion ofmoderate limitation. It was also observed that the proportions for white non-Hispanics andblacks were fairly stable over time, whereas there was more variation in the white Hispanicand Asian groups, although this was possibly an effect of the smaller sample sizes availablefor those groups.
Ciol et al. Page 5
J Am Geriatr Soc. Author manuscript; available in PMC 2012 August 23.
NIH
-PA Author Manuscript
NIH
-PA Author Manuscript
NIH
-PA Author Manuscript
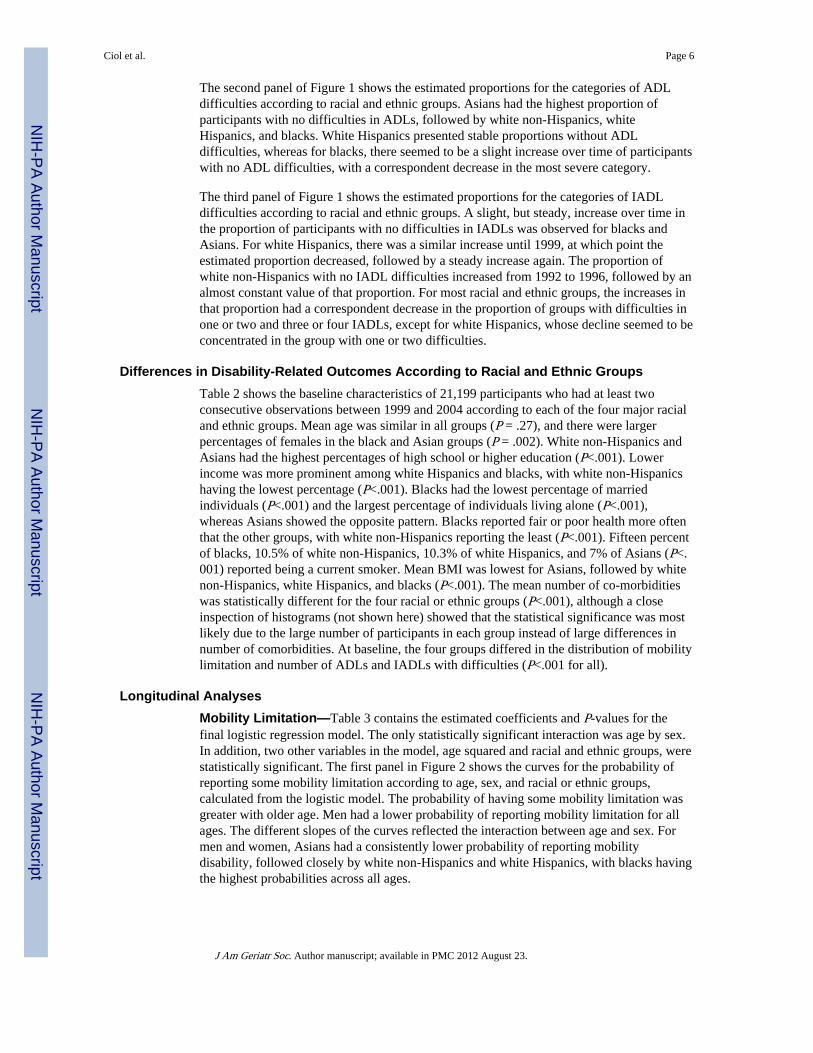
The second panel of Figure 1 shows the estimated proportions for the categories of ADLdifficulties according to racial and ethnic groups. Asians had the highest proportion ofparticipants with no difficulties in ADLs, followed by white non-Hispanics, whiteHispanics, and blacks. White Hispanics presented stable proportions without ADLdifficulties, whereas for blacks, there seemed to be a slight increase over time of participantswith no ADL difficulties, with a correspondent decrease in the most severe category.
The third panel of Figure 1 shows the estimated proportions for the categories of IADLdifficulties according to racial and ethnic groups. A slight, but steady, increase over time inthe proportion of participants with no difficulties in IADLs was observed for blacks andAsians. For white Hispanics, there was a similar increase until 1999, at which point theestimated proportion decreased, followed by a steady increase again. The proportion ofwhite non-Hispanics with no IADL difficulties increased from 1992 to 1996, followed by analmost constant value of that proportion. For most racial and ethnic groups, the increases inthat proportion had a correspondent decrease in the proportion of groups with difficulties inone or two and three or four IADLs, except for white Hispanics, whose decline seemed to beconcentrated in the group with one or two difficulties.
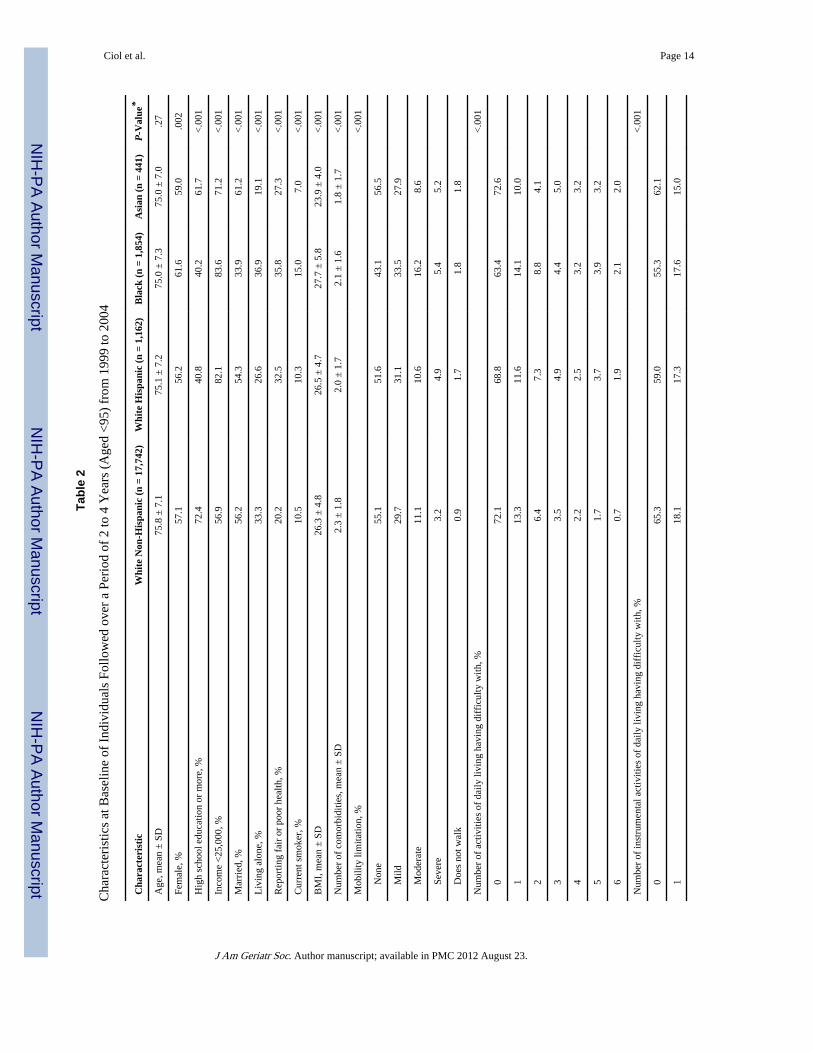
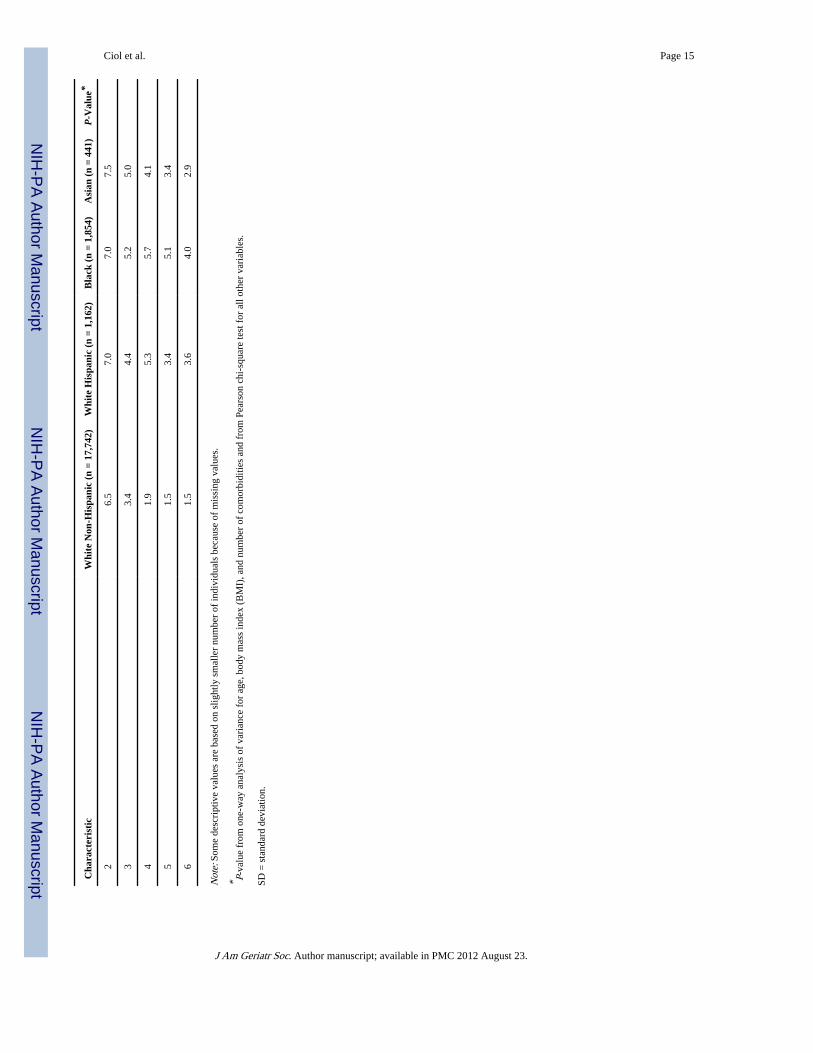
Differences in Disability-Related Outcomes According to Racial and Ethnic GroupsTable 2 shows the baseline characteristics of 21,199 participants who had at least twoconsecutive observations between 1999 and 2004 according to each of the four major racialand ethnic groups. Mean age was similar in all groups (P = .27), and there were largerpercentages of females in the black and Asian groups (P = .002). White non-Hispanics andAsians had the highest percentages of high school or higher education (P<.001). Lowerincome was more prominent among white Hispanics and blacks, with white non-Hispanicshaving the lowest percentage (P<.001). Blacks had the lowest percentage of marriedindividuals (P<.001) and the largest percentage of individuals living alone (P<.001),whereas Asians showed the opposite pattern. Blacks reported fair or poor health more oftenthat the other groups, with white non-Hispanics reporting the least (P<.001). Fifteen percentof blacks, 10.5% of white non-Hispanics, 10.3% of white Hispanics, and 7% of Asians (P<.001) reported being a current smoker. Mean BMI was lowest for Asians, followed by whitenon-Hispanics, white Hispanics, and blacks (P<.001). The mean number of co-morbiditieswas statistically different for the four racial or ethnic groups (P<.001), although a closeinspection of histograms (not shown here) showed that the statistical significance was mostlikely due to the large number of participants in each group instead of large differences innumber of comorbidities. At baseline, the four groups differed in the distribution of mobilitylimitation and number of ADLs and IADLs with difficulties (P<.001 for all).
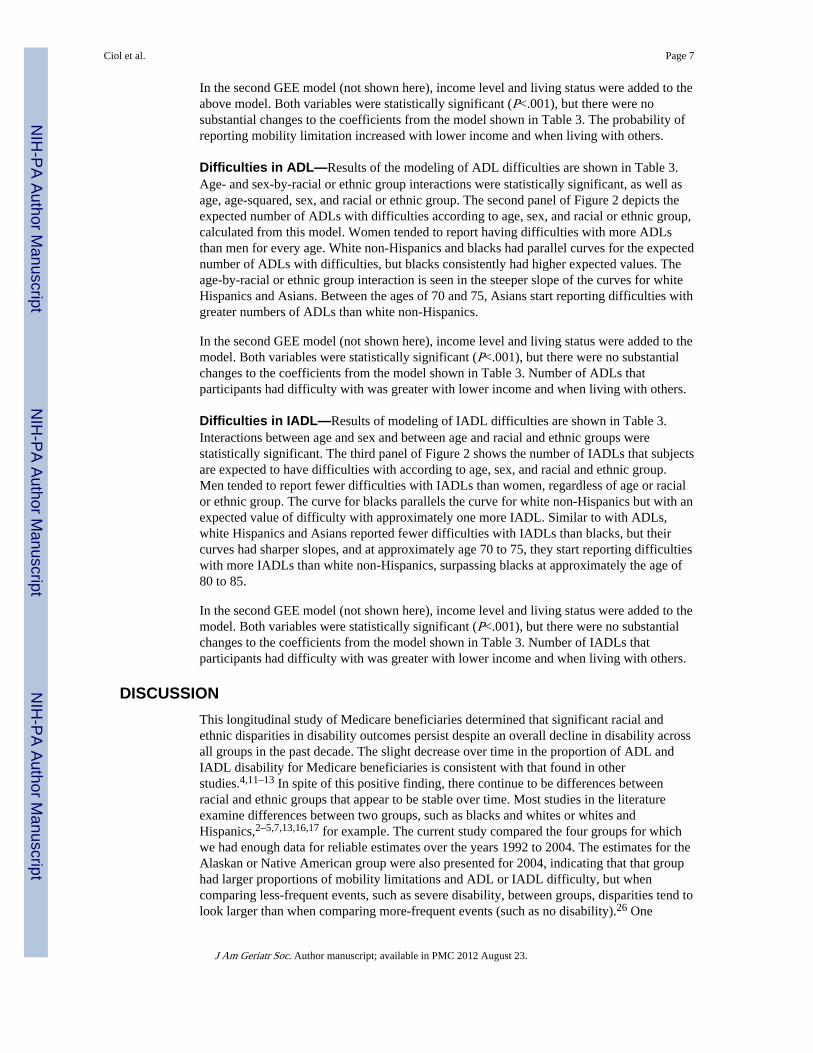
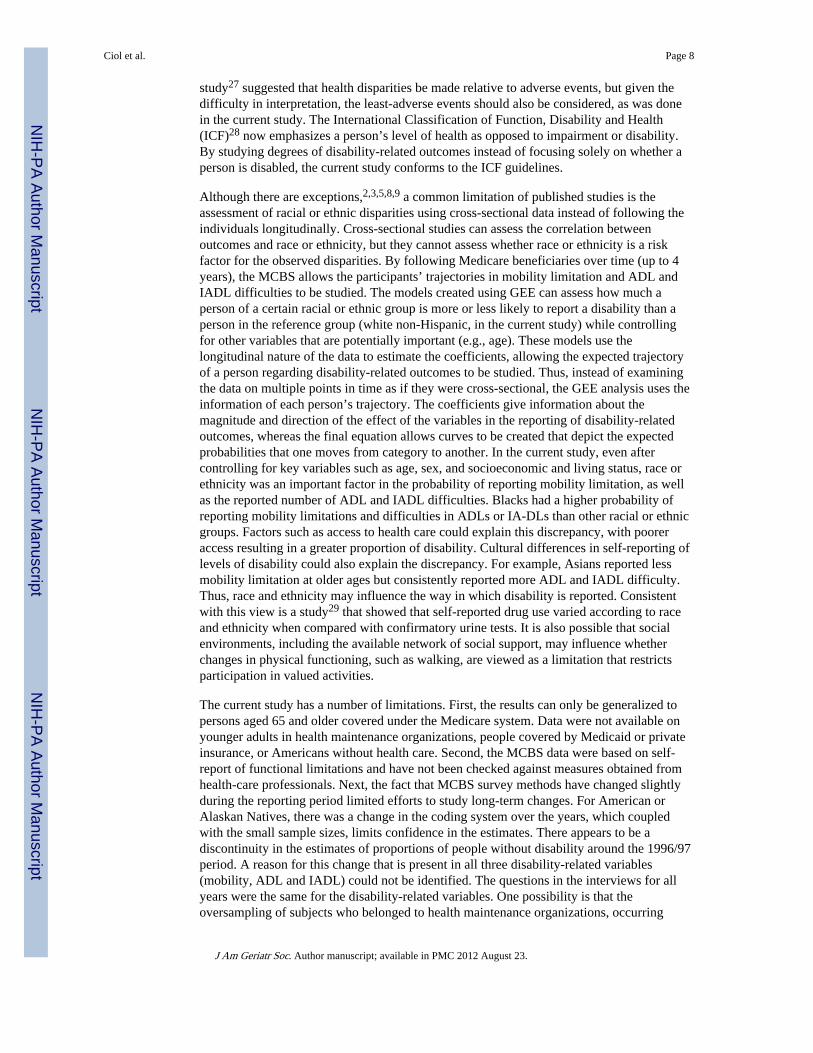
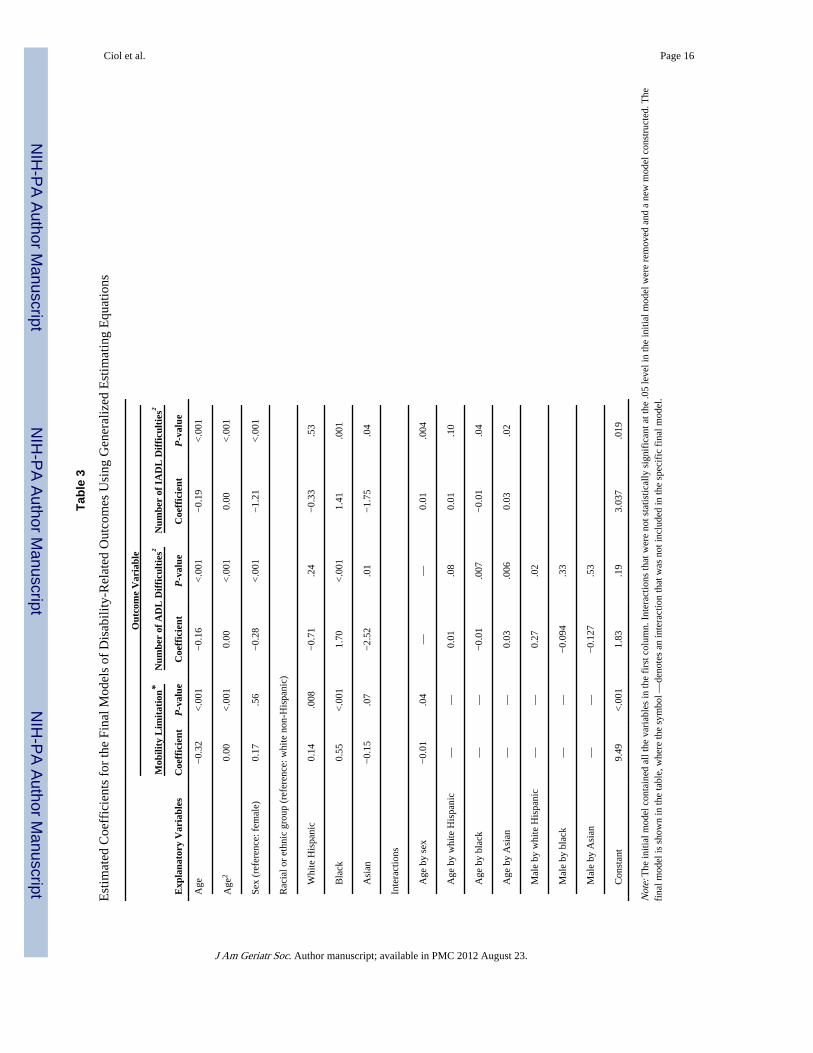
Longitudinal AnalysesMobility Limitation—Table 3 contains the estimated coefficients and P-values for thefinal logistic regression model. The only statistically significant interaction was age by sex.In addition, two other variables in the model, age squared and racial and ethnic groups, werestatistically significant. The first panel in Figure 2 shows the curves for the probability ofreporting some mobility limitation according to age, sex, and racial or ethnic groups,calculated from the logistic model. The probability of having some mobility limitation wasgreater with older age. Men had a lower probability of reporting mobility limitation for allages. The different slopes of the curves reflected the interaction between age and sex. Formen and women, Asians had a consistently lower probability of reporting mobilitydisability, followed closely by white non-Hispanics and white Hispanics, with blacks havingthe highest probabilities across all ages.
Ciol et al. Page 6
J Am Geriatr Soc. Author manuscript; available in PMC 2012 August 23.
NIH
-PA Author Manuscript
NIH
-PA Author Manuscript
NIH
-PA Author Manuscript
In the second GEE model (not shown here), income level and living status were added to theabove model. Both variables were statistically significant (P<.001), but there were nosubstantial changes to the coefficients from the model shown in Table 3. The probability ofreporting mobility limitation increased with lower income and when living with others.
Difficulties in ADL—Results of the modeling of ADL difficulties are shown in Table 3.Age- and sex-by-racial or ethnic group interactions were statistically significant, as well asage, age-squared, sex, and racial or ethnic group. The second panel of Figure 2 depicts theexpected number of ADLs with difficulties according to age, sex, and racial or ethnic group,calculated from this model. Women tended to report having difficulties with more ADLsthan men for every age. White non-Hispanics and blacks had parallel curves for the expectednumber of ADLs with difficulties, but blacks consistently had higher expected values. Theage-by-racial or ethnic group interaction is seen in the steeper slope of the curves for whiteHispanics and Asians. Between the ages of 70 and 75, Asians start reporting difficulties withgreater numbers of ADLs than white non-Hispanics.
In the second GEE model (not shown here), income level and living status were added to themodel. Both variables were statistically significant (P<.001), but there were no substantialchanges to the coefficients from the model shown in Table 3. Number of ADLs thatparticipants had difficulty with was greater with lower income and when living with others.
Difficulties in IADL—Results of modeling of IADL difficulties are shown in Table 3.Interactions between age and sex and between age and racial and ethnic groups werestatistically significant. The third panel of Figure 2 shows the number of IADLs that subjectsare expected to have difficulties with according to age, sex, and racial and ethnic group.Men tended to report fewer difficulties with IADLs than women, regardless of age or racialor ethnic group. The curve for blacks parallels the curve for white non-Hispanics but with anexpected value of difficulty with approximately one more IADL. Similar to with ADLs,white Hispanics and Asians reported fewer difficulties with IADLs than blacks, but theircurves had sharper slopes, and at approximately age 70 to 75, they start reporting difficultieswith more IADLs than white non-Hispanics, surpassing blacks at approximately the age of80 to 85.
In the second GEE model (not shown here), income level and living status were added to themodel. Both variables were statistically significant (P<.001), but there were no substantialchanges to the coefficients from the model shown in Table 3. Number of IADLs thatparticipants had difficulty with was greater with lower income and when living with others.
DISCUSSIONThis longitudinal study of Medicare beneficiaries determined that significant racial andethnic disparities in disability outcomes persist despite an overall decline in disability acrossall groups in the past decade. The slight decrease over time in the proportion of ADL andIADL disability for Medicare beneficiaries is consistent with that found in otherstudies.4,11–13 In spite of this positive finding, there continue to be differences betweenracial and ethnic groups that appear to be stable over time. Most studies in the literatureexamine differences between two groups, such as blacks and whites or whites andHispanics,2–5,7,13,16,17 for example. The current study compared the four groups for whichwe had enough data for reliable estimates over the years 1992 to 2004. The estimates for theAlaskan or Native American group were also presented for 2004, indicating that that grouphad larger proportions of mobility limitations and ADL or IADL difficulty, but whencomparing less-frequent events, such as severe disability, between groups, disparities tend tolook larger than when comparing more-frequent events (such as no disability).26 One
Ciol et al. Page 7
J Am Geriatr Soc. Author manuscript; available in PMC 2012 August 23.
NIH
-PA Author Manuscript
NIH
-PA Author Manuscript
NIH
-PA Author Manuscript
study27 suggested that health disparities be made relative to adverse events, but given thedifficulty in interpretation, the least-adverse events should also be considered, as was donein the current study. The International Classification of Function, Disability and Health(ICF)28 now emphasizes a person’s level of health as opposed to impairment or disability.By studying degrees of disability-related outcomes instead of focusing solely on whether aperson is disabled, the current study conforms to the ICF guidelines.
Although there are exceptions,2,3,5,8,9 a common limitation of published studies is theassessment of racial or ethnic disparities using cross-sectional data instead of following theindividuals longitudinally. Cross-sectional studies can assess the correlation betweenoutcomes and race or ethnicity, but they cannot assess whether race or ethnicity is a riskfactor for the observed disparities. By following Medicare beneficiaries over time (up to 4years), the MCBS allows the participants’ trajectories in mobility limitation and ADL andIADL difficulties to be studied. The models created using GEE can assess how much aperson of a certain racial or ethnic group is more or less likely to report a disability than aperson in the reference group (white non-Hispanic, in the current study) while controllingfor other variables that are potentially important (e.g., age). These models use thelongitudinal nature of the data to estimate the coefficients, allowing the expected trajectoryof a person regarding disability-related outcomes to be studied. Thus, instead of examiningthe data on multiple points in time as if they were cross-sectional, the GEE analysis uses theinformation of each person’s trajectory. The coefficients give information about themagnitude and direction of the effect of the variables in the reporting of disability-relatedoutcomes, whereas the final equation allows curves to be created that depict the expectedprobabilities that one moves from category to another. In the current study, even aftercontrolling for key variables such as age, sex, and socioeconomic and living status, race orethnicity was an important factor in the probability of reporting mobility limitation, as wellas the reported number of ADL and IADL difficulties. Blacks had a higher probability ofreporting mobility limitations and difficulties in ADLs or IA-DLs than other racial or ethnicgroups. Factors such as access to health care could explain this discrepancy, with pooreraccess resulting in a greater proportion of disability. Cultural differences in self-reporting oflevels of disability could also explain the discrepancy. For example, Asians reported lessmobility limitation at older ages but consistently reported more ADL and IADL difficulty.Thus, race and ethnicity may influence the way in which disability is reported. Consistentwith this view is a study29 that showed that self-reported drug use varied according to raceand ethnicity when compared with confirmatory urine tests. It is also possible that socialenvironments, including the available network of social support, may influence whetherchanges in physical functioning, such as walking, are viewed as a limitation that restrictsparticipation in valued activities.
The current study has a number of limitations. First, the results can only be generalized topersons aged 65 and older covered under the Medicare system. Data were not available onyounger adults in health maintenance organizations, people covered by Medicaid or privateinsurance, or Americans without health care. Second, the MCBS data were based on self-report of functional limitations and have not been checked against measures obtained fromhealth-care professionals. Next, the fact that MCBS survey methods have changed slightlyduring the reporting period limited efforts to study long-term changes. For American orAlaskan Natives, there was a change in the coding system over the years, which coupledwith the small sample sizes, limits confidence in the estimates. There appears to be adiscontinuity in the estimates of proportions of people without disability around the 1996/97period. A reason for this change that is present in all three disability-related variables(mobility, ADL and IADL) could not be identified. The questions in the interviews for allyears were the same for the disability-related variables. One possibility is that theoversampling of subjects who belonged to health maintenance organizations, occurring
Ciol et al. Page 8
J Am Geriatr Soc. Author manuscript; available in PMC 2012 August 23.
NIH
-PA Author Manuscript
NIH
-PA Author Manuscript
NIH
-PA Author Manuscript
during 1996 to 200021 would overestimate the proportion of individuals with no disabilities.These participants cannot be identified as “oversampled” and are included in the analysis.Although this could explain the sudden jumps in 1997, it does not explain why the patterncontinues after the oversampling was discontinued. Finally, despite interest in examiningdisability in individuals with many racial or ethnic backgrounds, some groups were so smalland heterogeneous that, although they were included in the descriptive analysis, nogeneralizations could be made about them.
CONCLUSIONAcross all studied ethnic and racial groups, self-reported disability has declined in the pastdecade, although even after adjusting for age, sex, and socioeconomic status, disparities indisability outcomes persisted between these racial and ethnic groups. One possibleexplanation is that race and ethnicity may influence how disability is self-reported,potentially affecting measures of prevalence, a possibility that was evidenced in certainracial and ethnic groups by self-reporting less mobility disability and higher ADL and IADLdisability. Further research is needed to understand whether the observed differences are trueor due to perceptions related to disablement.
AcknowledgmentsSponsor’s Role: None.
References1. [Accessed May 24, 2007.] NIH strategic plan to reduce and eliminate health disparities, fiscal year
2000–2006 [on-line]. Available athttp://ncmhd.nih.gov/our_programs/strategic/pubs/VolumeI_031003EDrev.pdf
2. Clark DO. US trends in disability and institutionalization among older blacks and whites. Am JPublic Health. 1997; 87:438–440. [PubMed: 9096549]
3. Ferraro KF, Kelley-Moore JA. Self-rated health and mortality among Black and White adults:Examining the dynamic evaluation thesis. J Gerontol B Psychol Sci Soc Sci. 2001; 56B:S195–S205.[PubMed: 11445612]
4. Manton KG, Gu X. Changes in the prevalence of chronic disability in the United States black andnon-black population above age 65 from 1982 to 1999. Proc Natl Assoc Soc. 2001; 98:6354–6359.
5. Mendes de Leon CF, Barnes LL, Bienias JL, et al. Racial disparities in disability: Recent evidencefrom self-reported and performance-based disability measures in a population-based study of olderadults. J Gerontol B Psychol Sci Soc Sci. 2005; 60B:S263–S271. [PubMed: 16131627]
6. Mendes de Leon CF, Beckett LA, Fillenbaum GG, et al. Black-white differences in risk ofbecoming disabled and recovering from disability in old age: A longitudinal analysis of two EPESEpopulations. Am J Epidemiol. 1997; 145:488–497. [PubMed: 9063338]
7. Hamman RF, Mulgrew CL, Baxter J, et al. Methods and prevalence of ADL limitations in Hispanicand non-Hispanic white subjects in rural Colorado: The San Luis Valley Health and Aging Study.Ann Epidemiol. 1999; 9:225–235. [PubMed: 10332928]
8. Herbert PL, Frick KD, Kane RL, et al. The causes of racial and ethnic differences in influenzavaccination rates among elderly medicare beneficiaries. Health Serv Res. 2005; 40:517–537.[PubMed: 15762905]
9. Shih VC, Song J, Chang RW, et al. Racial differences in activities of daily living limitation onset inolder adults with arthritis: A national cohort study. Arch Phys Med Rehabil. 2005; 86:1521–1526.[PubMed: 16084802]
10. U.S. Department of Health and Human Services. Healthy People 2010. 2. Washington, DC: U.S.Government Printing Office; 2000.
11. Adler GS. A profile of the medicare current beneficiary survey. Health Care Financ Rev. 1994;15:153–162. [PubMed: 10138483]
Ciol et al. Page 9
J Am Geriatr Soc. Author manuscript; available in PMC 2012 August 23.
NIH
-PA Author Manuscript
NIH
-PA Author Manuscript
NIH
-PA Author Manuscript
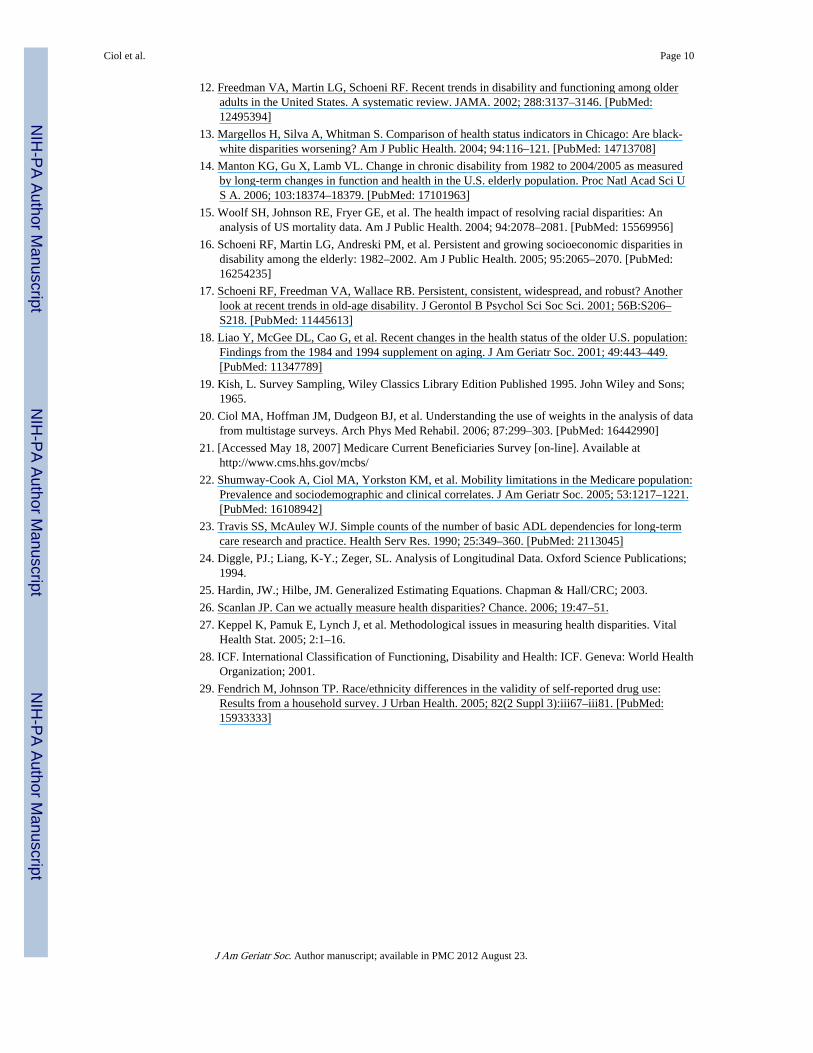
12. Freedman VA, Martin LG, Schoeni RF. Recent trends in disability and functioning among olderadults in the United States. A systematic review. JAMA. 2002; 288:3137–3146. [PubMed:12495394]
13. Margellos H, Silva A, Whitman S. Comparison of health status indicators in Chicago: Are black-white disparities worsening? Am J Public Health. 2004; 94:116–121. [PubMed: 14713708]
14. Manton KG, Gu X, Lamb VL. Change in chronic disability from 1982 to 2004/2005 as measuredby long-term changes in function and health in the U.S. elderly population. Proc Natl Acad Sci US A. 2006; 103:18374–18379. [PubMed: 17101963]
15. Woolf SH, Johnson RE, Fryer GE, et al. The health impact of resolving racial disparities: Ananalysis of US mortality data. Am J Public Health. 2004; 94:2078–2081. [PubMed: 15569956]
16. Schoeni RF, Martin LG, Andreski PM, et al. Persistent and growing socioeconomic disparities indisability among the elderly: 1982–2002. Am J Public Health. 2005; 95:2065–2070. [PubMed:16254235]
17. Schoeni RF, Freedman VA, Wallace RB. Persistent, consistent, widespread, and robust? Anotherlook at recent trends in old-age disability. J Gerontol B Psychol Sci Soc Sci. 2001; 56B:S206–S218. [PubMed: 11445613]
18. Liao Y, McGee DL, Cao G, et al. Recent changes in the health status of the older U.S. population:Findings from the 1984 and 1994 supplement on aging. J Am Geriatr Soc. 2001; 49:443–449.[PubMed: 11347789]
19. Kish, L. Survey Sampling, Wiley Classics Library Edition Published 1995. John Wiley and Sons;1965.
20. Ciol MA, Hoffman JM, Dudgeon BJ, et al. Understanding the use of weights in the analysis of datafrom multistage surveys. Arch Phys Med Rehabil. 2006; 87:299–303. [PubMed: 16442990]
21. [Accessed May 18, 2007] Medicare Current Beneficiaries Survey [on-line]. Available athttp://www.cms.hhs.gov/mcbs/
22. Shumway-Cook A, Ciol MA, Yorkston KM, et al. Mobility limitations in the Medicare population:Prevalence and sociodemographic and clinical correlates. J Am Geriatr Soc. 2005; 53:1217–1221.[PubMed: 16108942]
23. Travis SS, McAuley WJ. Simple counts of the number of basic ADL dependencies for long-termcare research and practice. Health Serv Res. 1990; 25:349–360. [PubMed: 2113045]
24. Diggle, PJ.; Liang, K-Y.; Zeger, SL. Analysis of Longitudinal Data. Oxford Science Publications;1994.
25. Hardin, JW.; Hilbe, JM. Generalized Estimating Equations. Chapman & Hall/CRC; 2003.
26. Scanlan JP. Can we actually measure health disparities? Chance. 2006; 19:47–51.
27. Keppel K, Pamuk E, Lynch J, et al. Methodological issues in measuring health disparities. VitalHealth Stat. 2005; 2:1–16.
28. ICF. International Classification of Functioning, Disability and Health: ICF. Geneva: World HealthOrganization; 2001.
29. Fendrich M, Johnson TP. Race/ethnicity differences in the validity of self-reported drug use:Results from a household survey. J Urban Health. 2005; 82(2 Suppl 3):iii67–iii81. [PubMed:15933333]
Ciol et al. Page 10
J Am Geriatr Soc. Author manuscript; available in PMC 2012 August 23.
NIH
-PA Author Manuscript
NIH
-PA Author Manuscript
NIH
-PA Author Manuscript
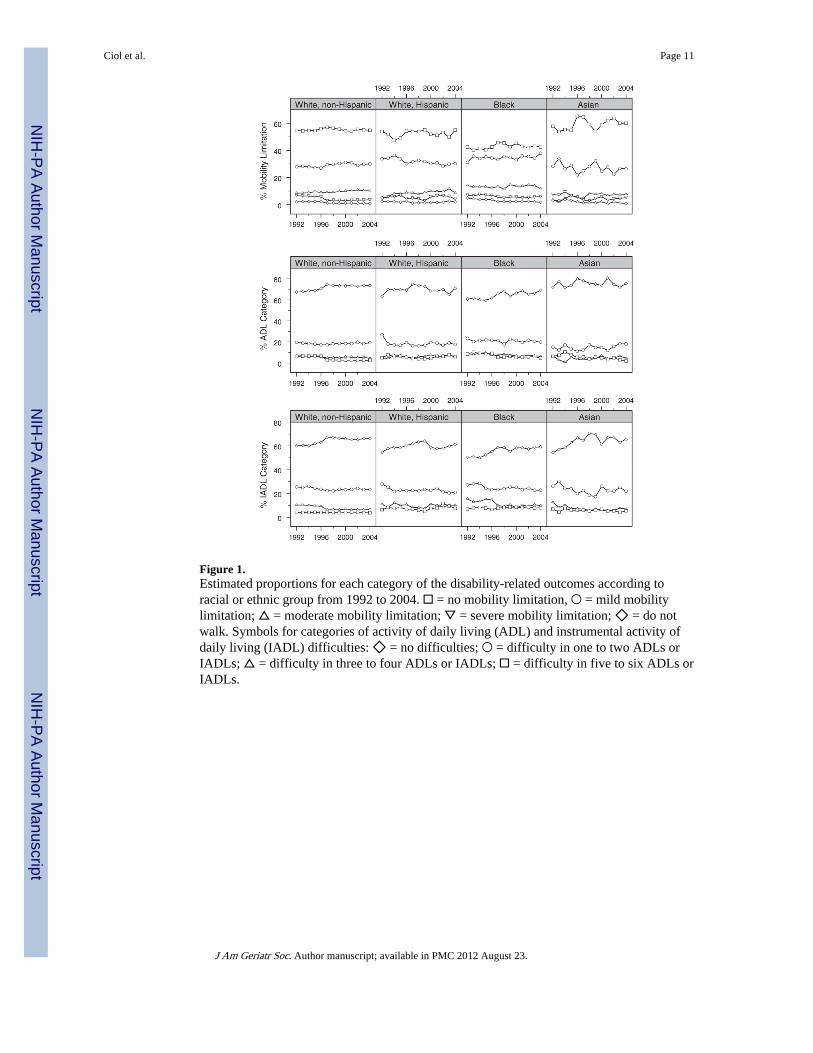
Figure 1.Estimated proportions for each category of the disability-related outcomes according toracial or ethnic group from 1992 to 2004. □ = no mobility limitation, ○ = mild mobilitylimitation; △ = moderate mobility limitation; ▽ = severe mobility limitation; ◇ = do notwalk. Symbols for categories of activity of daily living (ADL) and instrumental activity ofdaily living (IADL) difficulties: ◇ = no difficulties; ○ = difficulty in one to two ADLs orIADLs; △ = difficulty in three to four ADLs or IADLs; □ = difficulty in five to six ADLs orIADLs.
Ciol et al. Page 11
J Am Geriatr Soc. Author manuscript; available in PMC 2012 August 23.
NIH
-PA Author Manuscript
NIH
-PA Author Manuscript
NIH
-PA Author Manuscript
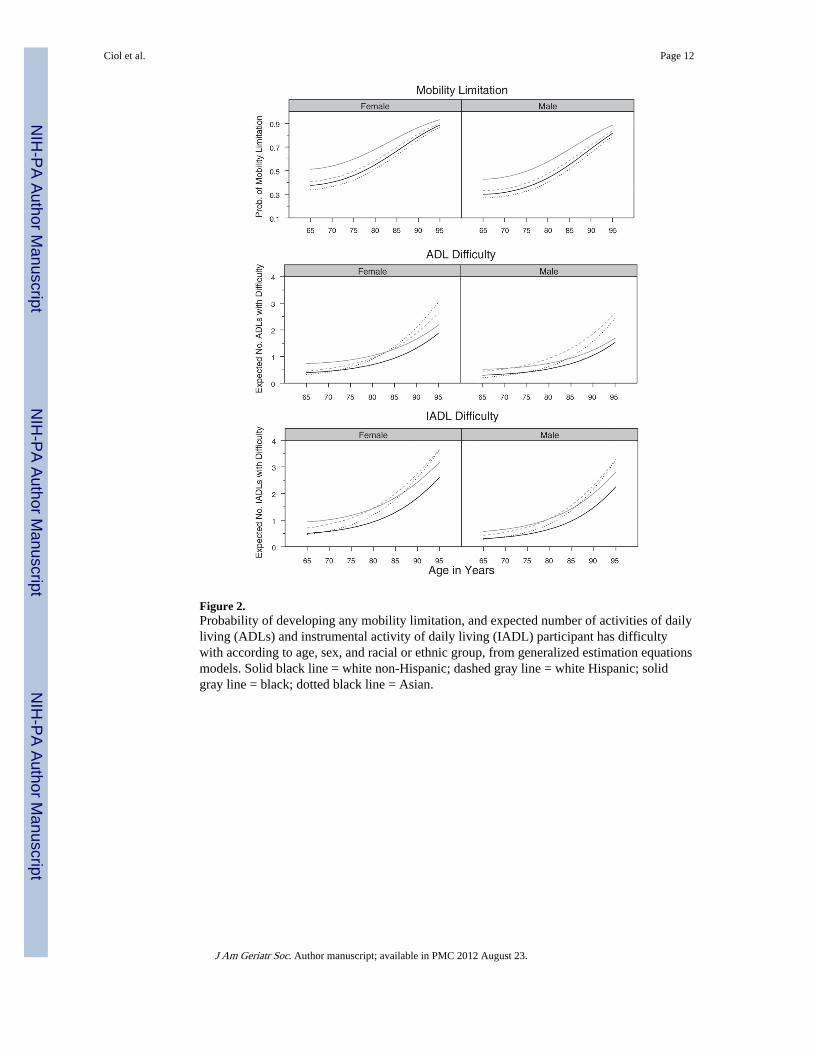
Figure 2.Probability of developing any mobility limitation, and expected number of activities of dailyliving (ADLs) and instrumental activity of daily living (IADL) participant has difficultywith according to age, sex, and racial or ethnic group, from generalized estimation equationsmodels. Solid black line = white non-Hispanic; dashed gray line = white Hispanic; solidgray line = black; dotted black line = Asian.
Ciol et al. Page 12
J Am Geriatr Soc. Author manuscript; available in PMC 2012 August 23.
NIH
-PA Author Manuscript
NIH
-PA Author Manuscript
NIH
-PA Author Manuscript
NIH
-PA Author Manuscript
NIH
-PA Author Manuscript
NIH
-PA Author Manuscript
Ciol et al. Page 13
Tabl
e 1
Prop
ortio
n of
Ind
ivid
uals
in E
ach
Cat
egor
y of
Mob
ility
Lim
itatio
n, A
ctiv
ities
of
Dai
ly L
ivin
g (A
DL
s), a
nd I
nstr
umen
tal A
ctiv
ities
of
Dai
ly L
ivin
g(I
AD
Ls)
Acc
ordi
ng to
Rac
ial a
nd E
thni
c G
roup
s in
200
4
Dis
abili
ty-R
elat
ed O
utco
mes
Rac
ial o
r E
thni
c G
roup
Whi
te N
on-H
ispa
nic
Whi
te H
ispa
nic
Bla
ckA
sian
Am
eric
an o
r A
lask
an N
ativ
eO
ther
Sam
ple
size
, n9,
683
641
980
249
105
325
Est
imat
ed p
opul
atio
n in
thou
sand
s, n
*25
,305
1,66
22,
552
735
256
873
Mob
ility
lim
itatio
n, w
eigh
ted
estim
ate
(95%
CI)
†
N
one
0.55
(0.
53–0
.57)
0.55
(0.
51–0
.59)
0.42
(0.
39–0
.46)
0.60
(0.
53–0
.67)
0.49
(0.
40–0
.58)
0.51
(0.
46–0
.57)
M
ild0.
30 (
0.28
–0.3
2)0.
30 (
0.27
–0.3
4)0.
38 (
0.35
–0.4
1)0.
27 (
0.21
–0.3
3)0.
32 (
0.24
–0.3
9)0.
29 (
0.23
–0.3
4)
M
oder
ate
0.10
(0.
09–0
.11)
0.09
(0.
07–0
.11)
0.12
(0.
010–
0.14
)0.
07 (
0.04
–0.1
1)0.
10 (
0.02
–0.1
8)0.
11 (
0.08
–0.1
4)
Se
vere
0.04
(0.
03–0
.04)
0.04
(0.
03–0
.05)
0.06
(0.
04–0
.07)
0.05
(0.
03–0
.08)
0.04
(0.
00–0
.08)
0.06
(0.
04–0
.09)
D
o no
t wal
k0.
01 (
0.01
–0.0
1)0.
02 (
0.01
–0.0
3)0.
02 (
0.01
–0.0
2)0.
01 (
0.00
–0.0
2)0.
04 (
0.00
–0.0
9)0.
03 (
0.01
–0.0
5)
Dif
ficu
lty in
AD
Ls,
wei
ghte
d es
timat
e (9
5% C
I)
0
0.74
(0.
72–0
.75)
0.71
(0.
68–0
.74)
0.69
(0.
65–0
.73)
0.75
(0.
70–0
.81)
0.70
(0.
61–0
.80)
0.65
(0.
59–0
.70)
1–
20.
19 (
0.18
–0.2
0)0.
18 (
0.14
–0.2
1)0.
20 (
0.17
–0.2
3)0.
18 (
0.13
–0.2
3)0.
23 (
0.13
–0.3
3)0.
22 (
0.17
–0.2
7)
3–
40.
05 (
0.04
–0.0
5)0.
05 (
0.04
–0.0
7)0.
06 (
0.05
–0.0
8)0.
05 (
0.02
–0.0
7)0.
02 (
0.00
–0.0
4)0.
08 (
0.05
–0.1
1)
5–
60.
02 (
0.02
–0.0
3)0.
06 (
0.04
–0.0
9)0.
05 (
0.03
–0.0
6)0.
02 (
0.01
–0.0
3)0.
05 (
0.01
–0.0
9)0.
05 (
0.02
–0.0
8)
Dif
ficu
lty in
IA
DL
s, w
eigh
ted
estim
ate
(95%
CI)
0
0.67
(0.
65–0
.68)
0.61
(0.
57–0
.65)
0.59
(0.
55–0
.63)
0.66
(0.
59–0
.72)
0.60
(0.
50–0
.70)
0.58
(0.
52–0
.64)
1
or 2
0.23
(0.
22–0
.24)
0.21
(0.
15–0
.27)
0.23
(0.
20–0
.26)
0.22
(0.
16–0
.27)
0.24
(0.
15–0
.33)
0.29
(0.
23–0
.33)
3
or 4
0.07
(0.
06–0
.07)
0.10
(0.
08–0
.13)
0.10
(0.
08–0
.12)
0.07
(0.
04–0
.10)
0.08
(0.
03–0
.12)
0.07
(0.
05–0
.10)
5
or 6
0.04
(0.
03–0
.04)
0.07
(0.
02–0
.13)
0.08
(0.
06–0
.10)
0.05
(0.
03–0
.08)
0.08
(0.
03–0
.14)
0.06
(0.
04–0
.09)
Not
e: T
he w
eigh
ted
estim
atio
n us
es th
e w
eigh
t fro
m th
e sa
mpl
e sc
hem
e an
d th
eref
ore
take
s in
to a
ccou
nt th
e ag
e di
stri
butio
n of
the
popu
latio
n.
* Est
imat
e of
pop
ulat
ion
size
acc
ordi
ng to
rac
ial o
r et
hnic
gro
up, u
sing
wei
ghte
d es
timat
ion.
† Sam
ple
size
for
mob
ility
lim
itatio
n es
timat
es is
slig
htly
sm
alle
r be
caus
e 33
par
ticip
ants
’ m
obili
ty li
mita
tion
coul
d no
t be
clas
sifi
ed u
sing
the
algo
rith
m.
CI
= c
onfi
denc
e in
terv
al.
J Am Geriatr Soc. Author manuscript; available in PMC 2012 August 23.
NIH
-PA Author Manuscript
NIH
-PA Author Manuscript
NIH
-PA Author Manuscript
Ciol et al. Page 14
Tabl
e 2
Cha
ract
eris
tics
at B
asel
ine
of I
ndiv
idua
ls F
ollo
wed
ove
r a
Peri
od o
f 2
to 4
Yea
rs (
Age
d <
95)
from
199
9 to
200
4
Cha
ract
eris
tic
Whi
te N
on-H
ispa
nic
(n =
17,
742)
Whi
te H
ispa
nic
(n =
1,1
62)
Bla
ck (
n =
1,85
4)A
sian
(n
= 44
1)P
-Val
ue*
Age
, mea
n ±
SD
75.8
± 7
.175
.1 ±
7.2
75.0
± 7
.375
.0 ±
7.0
.27
Fem
ale,
%57
.156
.261
.659
.0.0
02
Hig
h sc
hool
edu
catio
n or
mor
e, %
72.4
40.8
40.2
61.7
<.0
01
Inco
me
<25
,000
, %56
.982
.183
.671
.2<
.001
Mar
ried
, %56
.254
.333
.961
.2<
.001
Liv
ing
alon
e, %
33.3
26.6
36.9
19.1
<.0
01
Rep
ortin
g fa
ir o
r po
or h
ealth
, %20
.232
.535
.827
.3<
.001
Cur
rent
sm
oker
, %10
.510
.315
.07.
0<
.001
BM
I, m
ean
± S
D26
.3 ±
4.8
26.5
± 4
.727
.7 ±
5.8
23.9
± 4
.0<
.001
Num
ber
of c
omor
bidi
ties,
mea
n ±
SD
2.3
± 1
.82.
0 ±
1.7
2.1
± 1
.61.
8 ±
1.7
<.0
01
Mob
ility
lim
itatio
n, %
<.0
01
N
one
55.1
51.6
43.1
56.5
M
ild29
.731
.133
.527
.9
M
oder
ate
11.1
10.6
16.2
8.6
Se
vere
3.2
4.9
5.4
5.2
D
oes
not w
alk
0.9
1.7
1.8
1.8
Num
ber
of a
ctiv
ities
of
daily
livi
ng h
avin
g di
ffic
ulty
with
, %<
.001
0
72.1
68.8
63.4
72.6
1
13.3
11.6
14.1
10.0
2
6.4
7.3
8.8
4.1
3
3.5
4.9
4.4
5.0
4
2.2
2.5
3.2
3.2
5
1.7
3.7
3.9
3.2
6
0.7
1.9
2.1
2.0
Num
ber
of in
stru
men
tal a
ctiv
ities
of
daily
livi
ng h
avin
g di
ffic
ulty
with
, %<
.001
0
65.3
59.0
55.3
62.1
1
18.1
17.3
17.6
15.0
J Am Geriatr Soc. Author manuscript; available in PMC 2012 August 23.
NIH
-PA Author Manuscript
NIH
-PA Author Manuscript
NIH
-PA Author Manuscript
Ciol et al. Page 15
Cha
ract
eris
tic
Whi
te N
on-H
ispa
nic
(n =
17,
742)
Whi
te H
ispa
nic
(n =
1,1
62)
Bla
ck (
n =
1,85
4)A
sian
(n
= 44
1)P
-Val
ue*
2
6.5
7.0
7.0
7.5
3
3.4
4.4
5.2
5.0
4
1.9
5.3
5.7
4.1
5
1.5
3.4
5.1
3.4
6
1.5
3.6
4.0
2.9
Not
e: S
ome
desc
ript
ive
valu
es a
re b
ased
on
slig
htly
sm
alle
r nu
mbe
r of
indi
vidu
als
beca
use
of m
issi
ng v
alue
s.
* P-va
lue
from
one
-way
ana
lysi
s of
var
ianc
e fo
r ag
e, b
ody
mas
s in
dex
(BM
I), a
nd n
umbe
r of
com
orbi
ditie
s an
d fr
om P
ears
on c
hi-s
quar
e te
st f
or a
ll ot
her
vari
able
s.
SD =
sta
ndar
d de
viat
ion.
J Am Geriatr Soc. Author manuscript; available in PMC 2012 August 23.
NIH
-PA Author Manuscript
NIH
-PA Author Manuscript
NIH
-PA Author Manuscript
Ciol et al. Page 16
Tabl
e 3
Est
imat
ed C
oeff
icie
nts
for
the
Fina
l Mod
els
of D
isab
ility
-Rel
ated
Out
com
es U
sing
Gen
eral
ized
Est
imat
ing
Equ
atio
ns
Exp
lana
tory
Var
iabl
es
Out
com
e V
aria
ble
Mob
ility
Lim
itat
ion*
Num
ber
of A
DL
Dif
ficu
ltie
s†N
umbe
r of
IA
DL
Dif
ficu
ltie
s†
Coe
ffic
ient
P-v
alue
Coe
ffic
ient
P-v
alue
Coe
ffic
ient
P-v
alue
Age
−0.
32<
.001
−0.
16<
.001
−0.
19<
.001
Age
20.
00<
.001
0.00
<.0
010.
00<
.001
Sex
(ref
eren
ce: f
emal
e)0.
17.5
6−
0.28
<.0
01−
1.21
<.0
01
Rac
ial o
r et
hnic
gro
up (
refe
renc
e: w
hite
non
-His
pani
c)
W
hite
His
pani
c0.
14.0
08−
0.71
.24
−0.
33.5
3
B
lack
0.55
<.0
011.
70<
.001
1.41
.001
A
sian
−0.
15.0
7−
2.52
.01
−1.
75.0
4
Inte
ract
ions
A
ge b
y se
x−
0.01
.04
——
0.01
.004
A
ge b
y w
hite
His
pani
c—
—0.
01.0
80.
01.1
0
A
ge b
y bl
ack
——
−0.
01.0
07−
0.01
.04
A
ge b
y A
sian
——
0.03
.006
0.03
.02
M
ale
by w
hite
His
pani
c—
—0.
27.0
2
M
ale
by b
lack
——
−0.
094
.33
M
ale
by A
sian
——
−0.
127
.53
C
onst
ant
9.49
<.0
011.
83.1
93.
037
.019
Not
e: T
he in
itial
mod
el c
onta
ined
all
the
vari
able
s in
the
firs
t col
umn.
Int
erac
tions
that
wer
e no
t sta
tistic
ally
sig
nifi
cant
at t
he .0
5 le
vel i
n th
e in
itial
mod
el w
ere
rem
oved
and
a n
ew m
odel
con
stru
cted
. The
fina
l mod
el is
sho
wn
in th
e ta
ble,
whe
re th
e sy
mbo
l —de
note
s an
inte
ract
ion
that
was
not
incl
uded
in th
e sp
ecif
ic f
inal
mod
el.
J Am Geriatr Soc. Author manuscript; available in PMC 2012 August 23.
NIH
-PA Author Manuscript
NIH
-PA Author Manuscript
NIH
-PA Author Manuscript
Ciol et al. Page 17P-
valu
es s
how
n in
tabl
e ar
e fo
r th
e co
effi
cien
t of
each
cat
egor
y of
an
inte
ract
ion,
but
the
deci
sion
on
stat
istic
al s
igni
fica
nce
of th
at in
tera
ctio
n w
as b
ased
on
the
P-va
lue
that
test
ed a
ll co
effi
cien
ts a
t onc
e,w
hose
P-v
alue
s ar
e no
t sho
wn
here
.
Neg
ativ
e co
effi
cien
ts tr
ansl
ate
into
sm
alle
r lik
elih
ood
of r
epor
ting
mob
ility
dis
abili
ty o
r sm
alle
r lik
elih
ood
of r
epor
ting
high
er (
wor
se)
cate
gori
es o
f A
DL
s or
IA
DL
s, w
here
as p
ositi
ve c
oeff
icie
nts
tran
slat
ein
to h
ighe
r lik
elih
oods
. Int
erpr
etat
ion
of a
coe
ffic
ient
is v
alid
onl
y w
hen
the
othe
r va
riab
les
are
held
con
stan
t.
* Mob
ility
lim
itatio
n w
as m
odel
ed a
s a
dich
otom
ous
vari
able
(no
mob
ility
lim
itatio
n vs
som
e m
obili
ty li
mita
tion)
.
† Act
iviti
es o
f da
ily li
ving
(A
DL
s) a
nd in
stru
men
tal a
ctiv
ities
of
daily
livi
ng (
IAD
Ls)
wer
e m
odel
ed u
sing
a b
inom
ial d
istr
ibut
ion,
with
the
outc
ome
bein
g nu
mbe
r of
AD
Ls
or I
AD
Ls
with
rep
orte
ddi
ffic
ulty
fro
m a
mon
g si
x A
DL
s or
IA
DL
s.
J Am Geriatr Soc. Author manuscript; available in PMC 2012 August 23.